Dietary specializations and diversity in feeding ecology of the earliest stem mammals
14
LETTER doi:10.1038/nature13622 Dietary specializations and diversity in feeding ecology of the earliest stem mammals Pamela G. Gill 1 , Mark A. Purnell 2 , Nick Crumpton 1 {, Kate Robson Brown 3 , Neil J. Gostling 1 {, M. Stampanoni 4,5 & Emily J. Rayfield 6 The origin and radiation of mammals are key events in the history of life, with fossils placing the origin at 220 million years ago, in the Late Triassic period 1 . The earliest mammals, representing the first 50 million years of their evolution and including the most basal taxa, are widely considered to be generalized insectivores 1,2 . This implies that the first phase of the mammalian radiation—associated with the appearance in the fossil record of important innovations such as heterodont dentition, diphyodonty and the dentary–squamosal jaw joint 1,3 —was decoupled from ecomorphological diversification 2,4 . Finds of exceptionally complete specimens of later Mesozoic mammals have revealed greater ecomorphological diversity than previously suspected, including adaptations for swimming, burrowing, digging and even gliding 2,5,6 , but such well-preserved fossils of earlier mammals do not exist 1 , and robust analysis of their ecomorphological diversity has previously been lacking. Here we present the results of an inte- grated analysis, using synchrotron X-ray tomography and analyses of biomechanics, finite element models and tooth microwear tex- tures. We find significant differences in function and dietary ecology between two of the earliest mammaliaform taxa, Morganucodon and Kuehneotherium—taxa that are central to the debate on mammalian evolution. Morganucodon possessed comparatively more forceful and robust jaws and consumed ‘harder’ prey, comparable to extant small- bodied mammals that eat considerable amounts of coleopterans. Kuehneotherium ingested a diet comparable to extant mixed fee- ders and specialists on ‘soft’ prey such as lepidopterans. Our results reveal previously hidden trophic specialization at the base of the mam- malian radiation; hence even the earliest mammaliaforms were begin- ning to diversify—morphologically, functionally and ecologically. In contrast to the prevailing view 2,4 , this pattern suggests that lineage splitting during the earliest stages of mammalian evolution was asso- ciated with ecomorphological specialization and niche partitioning. Recently, much progress has been made in understanding the pattern and timing of the radiation of mammals 7–9 , revealing successive waves of taxonomic and ecomorphological diversification in Middle–Late Jurassic to Palaeogene stem clades and crown groups 2,10,11 . However, understand- ing of early mammaliaforms and the initial radiation of mammals has lagged behind. Here we address this problem by testing the hypothe- sis that two of the earliest and most basal mammaliaforms were eco- morphologically distinct. Morganucodon watsoni 12 and Kuehneotherium praecursoris 13 are central to the debate on mammalian origins and are of fundamental phylogenetic importance (Extended Data Fig. 1). Morga- nucodon is one of the earliest (Late Triassic to Early Jurassic) and best- known Mesozoic mammals, with a global distribution; Kuehneotherium is of a similar age and size 1,12,13 . Both taxa are thought to be generalized insectivores 1 and co-existed (see Supplementary Information for discus- sion of sympatry) on a small landmass present during the Early Jurassic marine transgression (Hettangian–Early Sinemurian, about 200 Myr ago), in what is now Glamorgan, South Wales, UK 1,12 (Extended Data Fig. 2). In addition to the apomorphic mammalian jaw joint, both taxa retain the plesiomorphic articular–quadrate jaw joint, as indicated by a well-developed postdentary trough (Fig. 1a, b), thus indicating that the postdentary bones still functioned as part of the jaw joint, rather than being incorporated into a definitive mammalian middle ear as in modern mammals 1,2,12–14 (sensu ref. 15). Curiously, Kuehneotherium possesses advanced molars, with cusps arranged in an obtuse-triangle pattern 13,16 (Extended Data Fig. 3b). We tested hypotheses of functional and dietary specialization in these early mammaliaforms by generating digital mandibular reconstructions, and applying a suite of techniques: classical mechanics, finite element modelling and quantitative textural analysis of tooth microwear. The mandible is a good choice for study of feeding adaptations as it is pri- marily adapted for biting, and is not constrained by sensory systems such as eye or brain size 17 . Our null hypothesis was that functional perfor- mance did not differ between the two taxa. Applying classical mechanics, we calculated the mechanical advan- tage for mid-molar, premolar and canine bites, reflecting the efficiency of the jaw system at transmitting force from the adductor muscles to the bite point. This revealed that Morganucodon has a notably larger mechan- ical advantage than Kuehneotherium (almost 50% greater during mid- molar biting) (Table 1), indicating that the mandible of Morganucodon had the potential to generate much larger bite forces than Kuehneotherium, and implying that Kuehneotherium bites were potentially faster but less forceful. We also determined jaw strength in bending and torsion dur- ing biting, treating the mandibular corpus as a beam 18 . The pattern of bending strength reveals a very different profile between the two taxa (Fig. 1c, d). Morganucodon shows peak resistance to bending at the rear of the tooth row as might be expected, as this region serves as a structural linkage between the tooth row and posterior functional elements of the jaw, such as the jaw joint and muscles 19 . However, Kuehneotherium shows peak resistance in the region of the anterior molars. Resistance to tor- sion (J) shows similar patterns (Fig. 1e, f). This different biomechanical profile in Kuehneotherium may reflect the importance of resisting bend- ing in the central tooth row, to maintain the sharp bladed triangulated molars in precise occlusion 16 . Finite element analysis allowed us to calculate stress, strain and defor- mation to assess the mechanical behaviour of the jaws 20 . This analysis can provide informative comparative data in the absence of known input parameters 17 and as such the two taxa were loaded with equal adductor muscle forces and constrained at the jaw joint and bite points (Extended Data Fig. 4). Finite element analysis shows that, during a simulated bite, despite similar length and surface area, the dentary of Kuehneotherium experiences greater maximum von Mises stress and maximum principal strain than Morganucodon, regardless of bite position, and higher reac- tion forces at the jaw joint, despite generating consistently less bite reac- tion force (Fig. 1g, h and Table 1). Kuehneotherium does not possess a robust condyle as in Morganucodon (Fig. 1a, b), further reducing its abil- ity to withstand high reaction forces at the jaw joint. We tested whether Morganucodon or Kuehneotherium could generate enough bite force to 1 School of Earth Sciences, University of Bristol, Wills Memorial Building, Queens Road, Bristol BS8 1RJ, UK. 2 Department of Geology, University of Leicester, University Road, Leicester LE1 7RH, UK. 3 Department of Archaeology and Anthropology, University of Bristol, Woodland Road, Bristol BS8 1UU, UK. 4 Swiss Light Source, Paul Scherrer Institute, CH-5232 Villigen, Switzerland. 5 Institute for Biomedical Engineering, University and ETH Zu ¨ rich, Gloriastrasse 35, CH-8092 Zu ¨ rich, Switzerland. 6 School of Earth Sciences, University of Bristol, Life Sciences Building, 24 Tyndall Avenue, Bristol BS8 1TQ, UK. {Present addresses: Natural History Museum, Cromwell Road, London SW7 5BD, UK (N.C.); Ocean and Earth Science, National Oceanography Centre, University of Southampton, Southampton SO14 3ZH, UK (N.J.G.). 00 MONTH 2014 | VOL 000 | NATURE | 1
Transcript of Dietary specializations and diversity in feeding ecology of the earliest stem mammals

LETTERdoi:10.1038/nature13622
Dietary specializations and diversity in feedingecology of the earliest stem mammalsPamelaG. Gill1, MarkA. Purnell2, Nick Crumpton1{, Kate RobsonBrown3, Neil J. Gostling1{, M. Stampanoni4,5 & Emily J. Rayfield6
The origin and radiation of mammals are key events in the historyof life, with fossils placing the origin at 220million years ago, in theLate Triassic period1. The earliest mammals, representing the first50million years of their evolutionand including themost basal taxa,are widely considered to be generalized insectivores1,2. This impliesthat the first phase of the mammalian radiation—associated withthe appearance in the fossil record of important innovations such asheterodont dentition, diphyodonty and thedentary–squamosal jawjoint1,3—wasdecoupled fromecomorphological diversification2,4. Findsof exceptionally complete specimensof laterMesozoicmammalshaverevealedgreater ecomorphologicaldiversity thanpreviously suspected,including adaptations for swimming, burrowing, digging and evengliding2,5,6, but such well-preserved fossils of earlier mammals donot exist1, and robust analysis of their ecomorphological diversityhas previously been lacking. Here we present the results of an inte-grated analysis, using synchrotron X-ray tomography and analysesof biomechanics, finite element models and tooth microwear tex-tures.We find significant differences in functionanddietary ecologybetween twoof the earliestmammaliaform taxa,MorganucodonandKuehneotherium—taxa that are central to the debate onmammalianevolution.Morganucodonpossessed comparativelymore forceful androbust jaws and consumed ‘harder’ prey, comparable to extant small-bodied mammals that eat considerable amounts of coleopterans.Kuehneotherium ingested a diet comparable to extant mixed fee-ders and specialists on ‘soft’ prey such as lepidopterans. Our resultsrevealpreviouslyhidden trophic specializationat thebaseof themam-malian radiation; hence even the earliestmammaliaformswere begin-ning todiversify—morphologically, functionally and ecologically. Incontrast to the prevailing view2,4, this pattern suggests that lineagesplittingduring the earliest stagesofmammalianevolutionwas asso-ciated with ecomorphological specialization and niche partitioning.Recently,much progress has beenmade in understanding the pattern
and timingof the radiationofmammals7–9, revealing successivewaves oftaxonomic andecomorphological diversification inMiddle–Late Jurassicto Palaeogene stemclades and crowngroups2,10,11.However, understand-ing of early mammaliaforms and the initial radiation of mammals haslagged behind. Here we address this problem by testing the hypothe-sis that two of the earliest and most basal mammaliaforms were eco-morphologically distinct.Morganucodonwatsoni12 andKuehneotheriumpraecursoris13 are central to the debate onmammalianorigins and are offundamental phylogenetic importance (Extended Data Fig. 1).Morga-nucodon is one of the earliest (Late Triassic to Early Jurassic) and best-knownMesozoicmammals,with a global distribution;Kuehneotheriumis of a similar age and size1,12,13. Both taxa are thought to be generalizedinsectivores1 andco-existed (see Supplementary Information fordiscus-sionof sympatry) on a small landmass present during the Early Jurassicmarine transgression (Hettangian–EarlySinemurian, about200Myrago),inwhat is nowGlamorgan, SouthWales,UK1,12 (ExtendedData Fig. 2).In addition to theapomorphicmammalian jaw joint, both taxa retain the
plesiomorphicarticular–quadrate jawjoint, as indicatedbyawell-developedpostdentary trough (Fig. 1a, b), thus indicating that thepostdentarybonesstill functioned as part of the jaw joint, rather than being incorporatedinto a definitive mammalian middle ear as in modernmammals1,2,12–14
(sensu ref. 15). Curiously,Kuehneotheriumpossesses advancedmolars,with cusps arranged in an obtuse-triangle pattern13,16 (Extended DataFig. 3b).We tested hypotheses of functional and dietary specialization in these
earlymammaliaformsby generatingdigitalmandibular reconstructions,and applying a suite of techniques: classical mechanics, finite elementmodelling and quantitative textural analysis of tooth microwear. Themandible is a good choice for study of feeding adaptations as it is pri-marily adapted forbiting, and is not constrainedbysensory systems suchas eye or brain size17. Our null hypothesis was that functional perfor-mance did not differ between the two taxa.Applying classical mechanics, we calculated the mechanical advan-
tage formid-molar, premolar and canine bites, reflecting the efficiencyof the jaw systemat transmitting force from the adductormuscles to thebitepoint.This revealed thatMorganucodonhas anotably largermechan-ical advantage than Kuehneotherium (almost 50% greater during mid-molar biting) (Table 1), indicating that themandible ofMorganucodonhad thepotential togeneratemuch largerbite forces thanKuehneotherium,and implying thatKuehneotherium biteswere potentially faster but lessforceful.We also determined jaw strength in bending and torsion dur-ing biting, treating the mandibular corpus as a beam18. The pattern ofbending strength reveals a very different profile between the two taxa(Fig. 1c, d).Morganucodon showspeak resistance to bending at the rearof the tooth rowasmight be expected, as this region serves as a structurallinkage between the tooth rowandposterior functional elements of thejaw, suchas the jaw joint andmuscles19.However,Kuehneotherium showspeak resistance in the region of the anterior molars. Resistance to tor-sion (J) shows similar patterns (Fig. 1e, f). This different biomechanicalprofile inKuehneotheriummay reflect the importance of resistingbend-ing in the central tooth row, tomaintain the sharp bladed triangulatedmolars in precise occlusion16.Finite element analysis allowedus to calculate stress, strain anddefor-
mation to assess the mechanical behaviour of the jaws20. This analysiscanprovide informative comparativedata in the absenceofknowninputparameters17 and as such the two taxawere loadedwith equal adductormuscle forces and constrained at the jaw joint andbitepoints (ExtendedData Fig. 4). Finite element analysis shows that, during a simulated bite,despite similar length and surface area, the dentary ofKuehneotheriumexperiences greatermaximumvonMises stress andmaximumprincipalstrain thanMorganucodon, regardless of bite position, and higher reac-tion forces at the jaw joint, despite generating consistently less bite reac-tion force (Fig. 1g, h and Table 1). Kuehneotherium does not possess arobust condyle as inMorganucodon (Fig. 1a, b), further reducing its abil-ity to withstand high reaction forces at the jaw joint.We testedwhetherMorganucodonorKuehneotherium could generate enoughbite force to
1School of Earth Sciences, University of Bristol, Wills Memorial Building, Queens Road, Bristol BS8 1RJ, UK. 2Department of Geology, University of Leicester, University Road, Leicester LE1 7RH, UK.3Department of Archaeology and Anthropology, University of Bristol, Woodland Road, Bristol BS8 1UU, UK. 4Swiss Light Source, Paul Scherrer Institute, CH-5232 Villigen, Switzerland. 5Institute forBiomedical Engineering, University and ETH Zurich, Gloriastrasse 35, CH-8092 Zurich, Switzerland. 6School of Earth Sciences, University of Bristol, Life Sciences Building, 24 Tyndall Avenue, Bristol BS81TQ, UK. {Present addresses: Natural History Museum, Cromwell Road, London SW7 5BD, UK (N.C.); Ocean and Earth Science, National Oceanography Centre, University of Southampton, SouthamptonSO14 3ZH, UK (N.J.G.).
0 0 M O N T H 2 0 1 4 | V O L 0 0 0 | N A T U R E | 1

pierce ‘hard’ insect cuticle (where ‘hard’ and ‘soft’ refer to the ease withwhich prey is pierced and chewed21). Estimation of bite force can cir-cumscribe the range of potential prey, providing a measure of feedingperformance and ecological partitioning22,23. Avarietyof insect preywasavailable at the time: theGlamorgan fissureshave yieldedbeetle remains24,and soft-bodied insects, such as scorpion flies, were well established inthe Early Jurassic25. (See Supplementary Information for discussion ofpotential prey.) A bite of 2N is required to pierce the cuticle of a ‘hard’insect (for example, a beetle) of appropriate prey size forMorganucodonorKuehneotherium26,27. ForMorganucodon, a simulated 2Nbite atmid-molar m2 (see Methods) did not generate excessive stress in the jaw(maximum54MPa) (Fig. 1g). ForKuehneotherium, increasingmuscleloadings (keeping the ratio ofmuscle recruitment intact), to simulate abite of 2N at mid-molar m3 (Fig. 1i), produced higher reaction forcesat thedentary condyle (5.45Ncomparedwith2.38N forMorganucodon),andmaximumvonMises stress values up to134MPa,which is 2.5 timesthat ofMorganucodon and close to the value of tensile stress failure forbone28. This suggests that Kuehneotherium was probably incapable ofprocessing ‘hard’ cuticle, and further illustrates differences in thebiomechanical performance of the jaws. Comparative biomechanicaldata therefore point tomorphofunctional and dietary specialization inthese two taxa.Thehypothesis thatMorganucodon andKuehneotherium consumed
differentpreywas independently testedbycomparingtheir toothmicrowear
textureswith those of extant insectivoreswithknowndietary preferences(specimens listed in Extended Data Table 1). Recent work on insecti-vorous bats has shown thatmicrowear textural analysis based on three-dimensional roughness parameters discriminates between insectivorespecies that consumedifferentproportionsof ‘hard’ prey (suchasbeetles)and ‘soft’ prey (such asmoths)29. Bats provide a useful comparative dataset for ourworkbecause of theirwell-studieddietary differences and sim-ilarity in size toMorganucodon andKuehneotherium. We compared thefossil taxawith four species of bats:Plecotus auritus (brown long-earedbat; a specialist on ‘soft’ insects); Pipistrellus pipistrellus (common pip-istrelle) andPipistrellus pygmaeus (sopranopipistrelle) (moremixeddiet,both specialize onDiptera (flies), butP. pipistrellus consumes insectswithawider rangeof cuticle ‘hardness’ andmore ‘hard’prey thanP.pygmaeus);and Rhinolophus ferrumequinum (greater horseshoe bat; mixed diet,but includingmore beetles—prey that is among the ‘hardest’ of insects)(seeExtendedDataTable2 fordietarydetails). In thebats,nine roughnessparameters differ significantly between species29, andprincipal compo-nent analysis (PCA) of these parameters (Fig. 2) separates bats accord-ing todietarypreferences in a spacedefinedbyprincipal component axes1 and 2 (together accounting for 88.3%of variance), with axis 1 stronglycorrelatedwithdietary preferences (rs5 0.81,P, 0.0001). Increasinglynegative values indicate higher proportionsof ‘hard’ prey,while increas-ing positive values indicate increasing proportions of ‘soft’ prey29.Projectingdata forKuehneotheriumandMorganucodononto theaxes
resulting from the analysis of bats produces clear separation of the twotaxa.Morganucodonhasnegativevalues forprincipal component1 (PC1),overlapping and extendingbeyondvalues forR. ferrumequinum. Slightlyrougher textures inMorganucodon suggest that it consumed a higherproportion of ‘hard’ prey.MostKuehneotherium specimens have pos-itive values for PC1, overlapping the range of the ‘soft’ insect specialistPl. auritus. Two specimens have negative PC1 values and plot into aspacedefinedby themixed-feedingPipistrellus. Thirteen roughnesspara-meters fromMorganucodon and Kuehneotherium are correlated withthe bat dietary axis (PC1; ExtendedData Tables 3–5), including nine ofthe ten parameters that in bats are correlatedwith diet29, and values forPC1differ significantly between the two fossil species (F5 5.67; d.f.5 6,29; P5 0.0005). Pairwise tests (Tukey’s honestly significant difference;P, 0.05) indicate thatmicrowear textures inMorganucodon andKueh-neotherium differ from one another, yetMorganucodon does not differfrom bats with mixed or ‘harder’ diets, and Kuehneotherium does notdiffer from the ‘soft’ insect specialist andmixed feeders.Kuehneotheriumspecimens fromdifferent fissure localities donot differ fromone another(see Supplementary Information for specimenand fissure details). ThatKuehneotheriumandMorganucodonare soclearly separatedbyapplicationof PCAbased on extant bats with different diets provides powerful evi-dence that the two fossil taxa haddiets that differed significantly in terms
m2 p4
0
CondylePostdentary trough
c m3 p6 c
Symphysis
0.8
0.4
1.5
1.0
0.5
m6 m1 p1 c0
a b
c d
e
g
i
h
f
Maximum stress: 54 MPa
2.38 N2.00 N
von Mises stress
054MPa
Maximum stress: 134 MPa
5.45 N 2.00 N
Maximum stress: 77 MPa
3.12 N 1.14 N
5 mm
0
0.8
0.4
m4 m1 p1 c
1.5
1.0
0.5
0
m1 p1 c m6 m1 p1 cm4
Figure 1 | Digital reconstructions and biomechanical analyses ofMorganucodon and Kuehneotherium jaws. a, b, Reconstructed leftmandibles, medial view. Missing portions in grey. a, M. watsoni.b, K. praecursoris; dentition reconstructed from ref. 30. c, d, Section moduli(dorsoventral Zx (blue) and mediolateral Zy (red), in cubic millimetres) for(c) Morganucodon and (d) Kuehneotherium. e, f, Polar moment of inertia (J)for (e) Morganucodon and (f) Kuehneotherium. g–i, Finite element vonMises stress contour plots for a unilateral molar bite (m2 forMorganucodonand m3 for Kuehneotherium) with closed jaw: g, Morganucodon andh, Kuehneotherium, with standard muscle loading; i, Kuehneotherium withmuscle loadingmultiplied to give a bite reaction force of 2N. Stress legend andcontour plot scale apply to g–i. Single vertical arrows indicate tooth constraints;three grouped arrows indicate jaw joint constraints. (See SupplementaryInformation for links to scan data and finite element model images.)
Table 1 | Biomechanical analysis resultsMorganucodon Kuehneotherium
Mechanical advantage (three-dimensional)Canine bite 0.51 0.31Premolar bite 0.42 0.24Molar bite 0.35 0.18Maximum von Mises stress (MPa)Standard loading canine bite 66 97Standard loading premolar bite 61 83Standard loading molar bite 54 77Maximum principal strain (microstrain)Standard loading canine bite 3,840 5,800Standard loading premolar bite 3,540 5,020Standard loading molar bite 3,100 4,440Reaction forces (N) Jaw joint Bite Jaw joint BiteStandard loading canine bite 2.96 1.31 3.45 0.66Standard loading premolar bite 2.69 1.62 3.30 0.87Standard loading molar bite 2.38 2.00 3.12 1.14
Comparative mechanical advantage, maximum von Mises stress values (in megapascals), maximumprincipal strain values and reaction forces (in newtons) for Morganucodon and Kuehneotheriumdentaries. See Methods section for an explanation of the standard loading for muscles. These loadsachieve a 2N reaction bite force at the molar (m2) ofMorganucodon, sufficient to pierce insect cuticle.
RESEARCH LETTER
2 | N A T U R E | V O L 0 0 0 | 0 0 M O N T H 2 0 1 4

of prey ‘hardness’, and provides independent validation of distinctivemechanical behaviour and function revealed throughour standardbeamanalysis and finite element modelling.In summary, our analyses reveal previously hidden trophic diversity
andniche partitioning at the base of themammalian radiation, support-ing ahypothesis of coupled lineage splitting and ecomorphological adap-tationof the skull and jaws, even during the earliest stages ofmammalianevolution. Our approach, combining biomechanical analyses with toothmicrotextural validation of dietary differences, does not require excep-tionally preserved specimens, and is applicable to fragmentary fossilremains. As such, it has the potential to provide direct evidence of eco-morphology and adaptation through a range of vertebrate radiations,using the most commonly preserved fossil elements: teeth and jaws.
Online Content Methods, along with any additional Extended Data display itemsandSourceData, are available in theonline versionof thepaper; referencesuniqueto these sections appear only in the online paper.
Received 8 April; accepted 27 June 2014.
1. Kielan-Jaworowska, Z., Cifelli, R. & Luo, Z.-X. Mammals from the Age of Dinosaurs.Origins, Evolution, and Structure (Columbia Univ. Press, 2004).
2. Luo, Z.-X. Transformation and diversification in early mammal evolution. Nature450, 1011–1019 (2007).
3. Kemp, T. S. The Origin and Evolution of Mammals Ch. 4 (Oxford Univ. Press, 2005).4. Bromham, L., Phillips, M. J. & Penny, D. Growing up with dinosaurs: molecular
dates and the mammalian radiation. Trends Ecol. Evol. 14, 113–118 (1999).5. Ji, Q., Luo, Z.-X., Yuan, C. X. & Tabrum, A. R. A swimming mammaliaform from the
Middle Jurassic and ecomorphological diversification of early mammals. Science311, 1123–1127 (2006).
6. Meng, J., Hu, Y., Wang, Y., Wang, X. & Li, C. A Mesozoic gliding mammal fromnortheastern China. Nature 444, 889–893 (2006).
7. Meredith, R. W. et al. Impacts of the Cretaceous terrestrial revolution and KPgextinction on mammal diversification. Science 334, 521–524 (2011).
8. dos Reis, M., Inoue, J., Asher, R. J., Donoghue, P. C. J. & Yang, Z. Phylogenomicdatasets provide both precision and accuracy in estimating the timescale ofplacental mammal phylogeny. Proc. R. Soc. B 279, 3491–3500 (2012).
9. O’Leary,M. A.et al.Theplacentalmammal ancestor and thepost–K-Pg radiation ofplacentals. Science 339, 662–667 (2013).
10. Wilson, G. P. et al. Adaptive radiation of multituberculate mammals before theextinction of dinosaurs. Nature 483, 457–460 (2012).
11. Grossnickle, D. M. & Polly, P. D. Mammal disparity decreases during theCretaceous angiosperm radiation. Proc. R. Soc. B 280, 20132110 (2013).
12. Kermack, K. A.,Mussett, F. & Rigney, H.W. Lower jawofMorganucodon. Zool. J. Linn.Soc. 53, 87–175 (1973).
13. Kermack,D.M., Kermack,K.A.&Mussett, F. TheWelshpantothereKuehneotheriumpraecursoris. Zool. J. Linn. Soc. 47, 407–423 (1968).
14. Luo, Z.-X. Developmental patterns in Mesozoic evolution of mammal ears. Annu.Rev. Ecol. Evol. Syst. 42, 355–380 (2011).
15. Allin, E. F. & Hopson, J. A. in The Evolutionary Biology of Hearing (edsWebster, D. B.,Fay, R. R. & Popper, A. N.) 587–614 (Springer, 1992).
16. Crompton, W. A. & Jenkins, F. A. American Jurassic symmetrodonts and Rhaeticpantotheres. Science 155, 1006–1009 (1967).
17. Tseng, Z. J., Mcnitt-Gray, J. L., Flashner, H., Wang, X. & Enciso, R. Model sensitivityand use of the comparative finite elementmethod inmammalian jawmechanics:mandible performance in the gray wolf. PLoS ONE 6, e19171 (2011).
18. Therrien, F. Mandibular force profiles of extant carnivorans and implications forthe feeding behaviour of extinct predators. J. Zool. 267, 249–270 (2005).
19. Freeman, P.W. & Lemen, C. A. Simple predictors of bite force in bats: the good, thebetter and the better still. J. Zool. 282, 284–290 (2010).
20. Rayfield, E. J. Finite element analysis and understanding the biomechanics andevolution of living and fossil organisms. Annu. Rev. Earth Planet. Sci. 35, 541–576(2007).
21. Evans, A. R. & Sanson, G. D. Biomechanical properties of insects in relation toinsectivory: cuticle thickness as an indicator of insect ‘hardness’ and‘intractability’. Aust. J. Zool. 53, 9–19 (2005).
22. Dumont, E. R. & Herrel, A. The effects of gape angle and bite point on bite force inbats. J. Exp. Biol. 206, 2117–2123 (2003).
23. Aguirre, L. F., Herrel, A., VanDamme, R. &Matthysen, E. Ecomorphological analysisof trophic niche partitioning in a tropical savannah bat community. Proc. R. Soc.Lond. B 269, 1271–1278 (2002).
24. Gardiner, B. G. New Rhaetic and Liassic beetles. Palaeontology 1, 87–88 (1961).25. Grimaldi,D.&Engel,M.S.Evolution of the Insects469–472 (CambridgeUniv. Press,
2005).26. Freeman, P. W. & Lemen, C. A. Using scissors to quantify hardness of insects: do
bats select or size or hardness? J. Zool. 271, 469–476 (2007).27. Aguirre, L. F., Herrel, A., van Damme, R. & Matthysen, E. The implications of food
hardness for diet in bats. Funct. Ecol. 17, 201–212 (2003).28. Currey, J. D. Bones: Structure and Mechanics 58–60 (Princeton Univ. Press, 2002).29. Purnell, M. A., Crumpton, N., Gill, P. G. & Rayfield, E. J. Within-guild dietary
discrimination from 3-D textural analysis of tooth microwear in insectivorousmammals. J. Zool. 291, 249–257 (2013).
30. Gill, P. G. Kuehneotherium from the Mesozoic Fissure Fillings of South Wales. PhDthesis, Univ. Bristol (2004).
Supplementary Information is available in the online version of the paper.
AcknowledgementsWe thank G. Armstrong, R. Asher, E. Bernard, P. Brewer, J. Bright,I. Corfe, A. Currant, A. Gill, T. Goddard, C. Hintermueller, J. Hooker, G. Jones,S. Lautenschlager, M. Lowe, F. Marone, F. Marx, C. Palmer, M. Pound, M. Ruecklin andJ. Sibbick. This work was funded byNatural Environment ResearchCouncil grants NE/E010431/1 and NE/K01496X/1 to E.J.R. and P.G.G.; M.A.P. was supported by NE/G018189/1.Useof theSwiss LightSource, PaulScherrer Institut, was supportedby theEuropean Commission 6th Framework Programme (RII3-CT-2004-506008).
Author Contributions E.J.R., P.G.G. andM.A.P. designed the study andwrote the paper;P.G.G., E.J.R., N.J.G. and M.S. collected the synchrotron radiation X-ray tomographicmicroscopy data; K.R.B. and P.G.G. collected the micro-computed tomography scandata; P.G.G. created the reconstructions and digital models, and analysed thebiomechanical results; P.G.G. and E.J.R. interpreted the biomechanical results; P.G.G.preparedandacquiredspecimens formicrowearanalysis,M.A.P. andN.C. collected themicrowear data, M.A.P. analysed and interpreted the microwear results.
Author Information Reprints and permissions information is available atwww.nature.com/reprints. The authors declare no competing financial interests.Readers are welcome to comment on the online version of the paper. Correspondenceand requests for materials should be addressed to P.G. ([email protected]) orE.R. ([email protected]).
Plecotusauritus
Pipistrelluspipistrellus
Rhinolophusferrumequinum
Morganucodon (P3)Kuehneotherium (P3)Kuehneotherium (P5)
Increasing proportion of ‘hard’ prey in diet
–6
–4
–2
0
2
4
PC
2 (4
0.1%
)
–8 –6 –4 –2 0 2 4
PC1 (48.2%)
a b
c d
e
2
0
–2
2121
12121515
30302626
1111
6
3232
1010
2424
1414
3131
2727
28282525
1313
9
1616
82222
2323
2020
3
1717
5
3434
4
7
1919
1818
2929
2
1
333336363535
21
1215
3026
11
6
32
10
24
14
31
27
2825
13
9
16
822
23
20
3
17
5
34
4
7
19
18
29
2
1
333635
PipistrellusPipistrelluspygmaeuspygmaeusPipistrelluspygmaeus
Figure 2 | Quantitative textural analysis of microwear in bats and fossilmammaliaforms. a–d, Scale-limited roughness surfaces of Morganucodon(a; specimen 34), R. ferrumequinum (b; specimen 1), Kuehneotherium(c; specimen 24) and Pl. auritus (d; specimen 12); 146mm3 110mm; contourvertical scale in micrometres. e, PCA of International Organization forStandardization (ISO) roughness parameters from bats and mammaliaforms.PCA based on data for bats only, with Morganucodon (n5 5) andKuehneotherium data (Pontalum 3 (P3) n5 5; Pant 5 fissure (P5) n5 6)projected onto the bat PCA axes. There are two anomalous specimens: a singleKuehneotherium specimen (29) has PC1 values similar to R. ferrumequinum,and one of the Morganucodon specimens (32) plots as an outlier to all otherteeth analysed.
LETTER RESEARCH
0 0 M O N T H 2 0 1 4 | V O L 0 0 0 | N A T U R E | 3

METHODSDigital models.Digital mandibular reconstructions (Fig. 1a, b) were generated bycombining synchrotronradiationX-ray tomographicmicroscopyormicro-computedtomography scans from similar sized, mature individuals of each taxon (ExtendedData Fig. 3 and Supplementary Information).Morganucodonmandibular specimenswere scanned using synchrotron radiation X-ray tomographic microscopy at theSwiss Light SourceTOMCATbeamline. Thematerial was scanned at 18 keV and apixel size of 1.85mm(NHMUKPVM85507) or 22 keV and 3.7mm(UMZCEo.D.45and UMZC Eo.D.66) to match the size of the sample with the field of view of themicroscope. The Kuehneotherium mandibular specimens and molar teeth, pro-vided to illustrate the difference in occlusion, were scanned on a Bruker Skyscan1172micro-computed tomography system in theDepartment ofArchaeology andAnthropology at theUniversity of Bristol. A lower resolutionwas adequate for thefinite elementmodels (20mm), althoughone specimen (NHMUKPVM92779)wasalso scanned at 3.1mm for internal detail.ProcessingwasperformedusingAvizo (Visualization SciencesGroup). For each
taxon, the computed tomography data for each specimen were re-oriented andscaled slightly if required, then digitallymerged andmanually rendered to producethe reconstructions. As all specimens were similar sizes, very limited scaling wasrequired. The final size of the reconstructed jawwas based on scaling all specimensto the size of themost complete specimen. Any empty alveoli were digitally infilledand tooth crowns removed to leave all tooth surfaces at an equivalent level to thetooth neck.Validation studies have shown that edentate finite elementmodels betterrepresent experimental strains than dentate models31, which obviates the need toreconstructmissing teeth in the original scan data. A two-dimensional surfacemeshgenerated inAvizo (VisualizationSciencesGroup)wasexported toHypermesh (partof the Hyperworks suite from Altair), where the digital jaws were converted intofinite element models. Two-dimensional mesh optimization was performed and athree-dimensional finite-elementmesh generated of linear four-noded tetrahedral(C3D4) elements (115,213 for Morganucodon and 68,555 for Kuehneotherium).Four-noded tetrahedra may be stiffer than ten-noded tetrahedra and may slightlyunderestimate strain32 but our models are comparative, and tetrahedral elementsare useful formodelling complex and intricatemorphologies. The dentary and toothrootswere createdas separate partswith sharedmeshboundaries. In the case of fossilmaterial, where it is impossible to validate predictions of bite force with in vivoexperimental data, it is possible to compare the relative performance of finite ele-ment models if the models are properly scaled. Scaling to equal force:surface arearatio provides a comparisonof stress–strengthperformancebased solelyon shape33.The lineardimensions (canine to condyle) of themandibles are17.5mmand20.0mmfor Morganucodon and Kuehneotherium respectively. The surface area ratio ofMorganucodon:Kuehneotherium, calculated from Avizo, is 1.02:1; as there is veryslightly more coronoid process and incisors missing from the Kuehneotheriummodel, themodels are taken to be equal in surface area for this analysis. In this caseit was therefore not necessary to scale the applied muscle forces, and the modelscould be directly compared using the same loadings. The models were convertedto SI base-unit linear dimensions (metres) when imported into Abaqus/CAE forfinite element analysis.The dentary bone was assigned isotropic and homogenous material properties:
Young’smodulus of 18GPa andPoisson’s ratio of 0.3. Properties for the tooth rootswere as for dentine: Young’smodulus of 25GPa andPoisson’s ratio of 0.3. It is pos-sible that the actual jawmaterial propertieswere not isotropic, but in the absence ofdata otherwise, we assume isotropy for the sake of this analysis. Likewise, we willnever know the elastic properties ofMesozoicmammaliaform jaws, yet recentnano-indentation studies on the jaws of rats, squirrels and guinea pigs have revealed arange of 10–30GPa for the Young’s modulus of bone, and 15–25GPa for incisordentine34; our chosen values encompass this range.The orientations (lines of action) of the mammaliaform anterior and posterior
temporalis and superficial and deepmasseter adductormuscleswere reconstructed(Extended Data Fig. 4a, b). The medial pterygoid was omitted as, if present, it wassmall35. Adductormuscle orientationwasdeduced by estimating thepositionof thepoint of origination on the skull, coupled with study of the insertion areas on themandibular fossae of the fossil specimens. The detailed description of the skull ofMorganucodon36 was used as reference for the muscle origins forMorganucodon.There is no skull material for Kuehneotherium; however, the gross morphology ofthe lower jaw of the slightly older Brazilian eucynodont Brasilitherium37,38 is verysimilar toKuehneotherium (P.G.G., unpublished observations), so the general skullshape of Brasilitherium was used, with caution, as a proxy for the position of theKuehneotheriummuscle origins (Extended Data Fig. 4c, d). The temporalis has itsorigin on the parietal bones of the skull, with development of a sagittal crest inMor-ganucodon, although this latter is not known for Kuehneotherium. The temporalisinserts bothmedially and laterally in the temporal fossae on either side of the coro-noidprocess,with themuscles divided into anterior andposterior vectors35. The ante-rior temporalis insertions on the lateral andmedial sides of the jawswere represented
by a predominantly vertical vector andwere coupled to a single point in space rep-resenting their origin on the skull. The posterior temporalis component was dealtwith by applying a posteriorly directed load, as from the posterodorsal portion ofthe coronoid process. The coronoid hook of Morganucodon12 and posterodorsalportion of the coronoid process inKuehneotherium aremissing in the reconstruc-tions, so ameans to simulate themissing portions of the coronoid processes for themuscle attachment was devised. A multi-point rigid body was created, from thebroken edge of the coronoid process to the position of the coronoid hook, in effectcompleting the coronoid process and producing a point in space for the posteriortemporalis origin (ExtendedData Fig. 4 insert). Themasseter inmammals is dividedinto superficial anddeep components, with their origins on the zygomatic arch35: thesuperficial masseter at the anterior end on the jugal and the deep masseter poster-iorly on the squamosal36. They insert laterally on the jaw behind the tooth row. InMorganucodon, the two mandibular fossae are distinct and that of the superficialmasseter is adjacent to the angular process of the jaw.There is no angular process inKuehneotherium, but the masseteric fossa is well developed. The lines of action ofmuscles definedherewere used to calculatemechanical advantage, and for the finiteelement analysis.Classicalmechanics.The digitalmodels were used to calculatemechanical advan-tage and beam theory to measure strength in bending. Mechanical advantage, as ameasure of the efficiency of the jaw system to transfer input muscle force from theadductor musculature to the point of biting, is frequently used as a metric of jawfunction39 and correlates with prey choice and feeding ecology in organisms suchas fish40,41.Mechanical advantage is calculated here as the lengthof the in-lever (themoment arm of the adductor musculature) divided by the length of the out-lever(themoment arm of the bite: the distance from the jaw joint to the bite point). Themoment armswere calculated by taking scaled screen images of the jaws inAbaqus,both in lateral and dorsal orientations to calculate the in-lever arm for each of thefour muscles (anterior temporalis, posterior temporalis, deep masseter and super-ficialmasseter).A central pointwas chosenwithin themuscle insertion area, in eachcase, to give the line of action of eachmuscle. The fourmuscle vectors were resolvedto give a single adductor muscle vector, and the in-lever arm calculated.Beamtheoryhasbeenapplied to themandibular corpus inanumberof studies18,22,42
and is related to dietary specialization in smallmammals such as bats43. Ameasureof strength in bending is estimated from the sectionmodulus Z, calculated at spe-cific intervals along the jaw. The section modulus Z is the secondmoment of area(I) divided by the distance from the neutral axis to the outer edge, in the plane ofbending, so the orientation considered affects the value of the bending strength. Inthis case the section modulus was measured in the dorsoventral (Zx) and medio-lateral planes (Zy). We follow ref. 18 in measuring Z at interdental gaps along thetooth row to the canine, plus a further section just posterior to the ultimate molar.The reconstructed hemimandibles were digitally sliced perpendicular to the longaxis of themandible toproduce cross-sectional images at the interdental gaps. Eachcross-sectional image was loaded into ImageJ44, andZx andZy calculated using theplugin MomentMacro. We measured all interdental gaps, with postcanine num-bers of 8 and 12 forMorganucodon and Kuehneotherium respectively. The polarmoment of inertia (J), the beam’s ability to resist torsion, is calculated from theaddition of the secondmoment of area, I, in the dorsoventral (Ix) andmediolateral(Iy) planes.Finite element analysis. Boundary constraints were applied to the condyle and atthree bite points: canine, final premolar and mid-molar. The anterior incisor bitepoint could not be included, as there are no specimens of this portion of the man-dible in Kuehneotherium. The ultimate premolar is the largest of the premolars inboth taxa. InMorganucodon, the largest (second)molarwas chosenas the ‘midmolar’and inKuehneotherium amid-row (third)molar was used. Both single node45 anddistributed area (stiff beamelements) constraints46 have been used to estimate biteforces (discussion in ref. 17), but we usedmultipoint constraints, withmaster andslave nodes tominimize artificial stress concentrations47. Therewere approximately22 nodes constrained for each tooth and 30 nodes constrained at the jaw joint.Boundary conditions should never restrict deformations allowedby the representedenvironment47, so the bite points were appropriately constrained in four degrees offreedom (U15U25UR25UR35 0), and the dentary condyle in four degrees offreedom (U15U25U35UR35 0). (NB U1 is the mesiodistal axis, U2 is the dor-soventral axis andU3 is the axis along the length of the jaw;U refers to translationalmovement, UR refers to rotational movement.)As the true muscle loadings for Morganucodon and Kuehneotherium are not
known, we used a comparative approach, assuming an equal muscle load appliedto each taxon48,49. Given the equivalence of surface area between the twomodels, thiswas appropriate33. For the initial models, the relative contribution of eachmuscle tooverall bite force was based onmuscle ratios assigned toMorganucodon in ref. 35.The authors of this reference assign unit values of muscle forces to the jaw ofMor-ganucodon: anterior temporalis, 10; posterior temporalis, 8; superficialmasseter, 8;deep masseter, 8. The values are arbitrary but reflect the relative proportions each
RESEARCH LETTER

muscle contributes to bite force production. The actual loading forcesweusedwereas follows: anterior temporalis, 2N; posterior temporalis, 1.6N; superficialmasseter,1.6N; deepmasseter, 1.6N.We call this the standard loading regime. Contractingtogether at 100% activation, these muscles generate a bite reaction force of 2N atthemid-molar of theMorganucodon finite elementmodel, sufficient to pierce insectcuticle (see below). The calculations in ref. 35 arebased onaunilateral bite, butwithadductors active on both sides, so allowance is made for the balancing side. BothMorganucodon andKuehneotherium have amobile symphysis12,30 and, as this cur-rent study is a comparative one of single lower jaws, it does not make assumptionsabout the forces on the balancing side, and the loads above are applied to the indi-vidual mandibular rami.The reaction forces were queried in Abaqus at the bite points and condyle and
themaximum vonMises stress patterns recorded. VonMises stress is calculated asit indicates regional deformation as a function of the three principal stresses s1, s2ands3 (ref. 50).Maximumprincipal strain valueswere also recorded (Table 1).Muscleloadings were then manipulated to obtain a bite reaction force sufficient to pierceappropriately sized beetle carapace.Myotisbats are a similar size toMorganucodonandKuehneotherium (skull length approximately 14mm), and beetles in their stom-achs range in length from1 to 10mm,with a 10mmbeetle requiring 2–3Nof forceto pierce the insect27. This is corroborated byMyotis velifer bats recorded as havinga bite force of 2.2N (ref. 26). The initialmuscle loads inMorganucodon produced abite reaction force of 2N at themolar bite, but inKuehneotherium it was necessaryto increase themuscle loadings by 1.75 times to give a 2N reaction force at the con-strained molar tooth.Microtextural analysis of tooth microwear. Recent work has shown that quant-itative microtextural analysis of tooth wear is a powerful tool for dietary discrim-ination and investigation of trophic resource exploitation in a range of extant andfossil vertebrates51–56. Our analysis compared the values for ISO 25178-2 areal tex-ture parameters57 for worn tooth surfaces inMorganucodon and Kuehneotheriumwith the results of analysis of the relationship between texture and diet in extantinsectivorous bats29. Three-dimensionalmicrotextural analysis is entirely indepen-dent of our other functional and biomechanical analyses and thus provides effec-tive validation of our results.Material used for microwear analysis is listed in Extended Data Table 1. Fossil
specimens were prepared at the School of Earth Sciences, University of Bristol, byimmersing dried blocks of matrix in hot water, with the addition of dilute hydro-gen peroxide only if required. The exception was two Pontalun 3Kuehneotheriummolars, prepared at University College London in the 1970s, with added sodiumhexametaphosphate (Calgon) to aiddissolutionof thematrix.Noacetic acidwasusedon any specimens. Bat specimens were all wild-found, acquired from UK sources(Extended Data Table 1) and assumed to be natural deaths. Specimens were fixedin either ethanol (University of Bristol and North Lancashire Bat Group) or 10%formalin solution (Veterinary LaboratoryAgencies). Taxa were selected to includeinsectivores with well-constrained differences in their diets58,59. See ExtendedDataTable 2 and ref. 29 for details.Ourmethods for captureof three-dimensionalmicrowear data follow thosedevel-
oped in ref. 60 (for full details see ref. 29). Three-dimensional surface data werecaptured from toothwear facets (distal protoconid facet ofm2 for bats, distobuccalwear facet of themain cusp ofm2 forMorganucodon and amid-rowmolar forKueh-neotherium) using anAlicona InfiniteFocusmicroscopeG4b (IFM; software version2.1.2, field of view 145mm3 110mm, lateral optical resolution 0.35–0.4mm, verticalresolution 20mm; lateral resolution factor for the IFM set at 0.3) (see ref. 29). Allthree-dimensional data were edited to delete dirt and dust particles from the sur-face (usingAlicona IFM software) and exported as .sur files. All subsequent process-ingof dataused SurfStand (version5.0.0).Datawere levelled, and a fifth-order robustpolynomial anda robustGaussianwavelength filter (lc50.025mm)applied toremovegross surface form and long-wavelength features of the tooth surface. This gener-ated a scale-limited roughness surface (Fig. 2) fromwhichwe derived ISO 25178-2standard roughness parameters57. Sample sizes used in this study are relatively small;however, as demonstrated in ref. 29, this doesnot prevent detection of dietary signalsthroughmicrotextural analysis. Datawere explored using analysis of variance, cor-relations and principal components (on correlations; PCA). All statistical analysisof microtextural data used JMP 9. The results of Shapiro–Wilk tests indicated thatsomeroughnessparameterswerenon-normallydistributed (P. 0.05), but for almostall parameters we were unable to reject the null hypothesis of normality for log-transformed data, so log-transformed data were used for analysis. Where homo-geneity of variance tests revealed evidence of unequal variances,Welch analysis ofvariance was used.
31. Marinescu, R., Daegling, D. J. & Rapoff, A. J. Finite-element modeling of theanthropoid mandible: the effects of altered boundary conditions. Anat. Rec. 283,300–309 (2005).
32. Bright, J. A. & Rayfield, E. J. The response of cranial biomechanical finiteelement models to variations in mesh density. Anat. Rec. 294, 610–620(2011).
33. Dumont, E. R., Grosse, I. R. & Slater, G. J. Requirements for comparing theperformance of finite element models of biological structures. J. Theor. Biol. 256,96–103 (2009).
34. Cox, P. G., Fagan, M. J., Rayfield, E. J. & Jeffery, N. Finite element modelling ofsquirrel, guinea pig and rat skulls: using geometric morphometrics to assesssensitivity. J. Anat. 219, 696–709 (2011).
35. Crompton, A. W. & Hylander, W. L. in The Ecology and Biology of Mammal-likeReptiles (eds Hotton, N., MacLean, P. D., Roth, J. J. & Roth, E. C.) 263–282(Smithsonian Institution, 1986).
36. Kermack, K. A., Mussett, F. & Rigney, H. W. The skull ofMorganucodon. Zool. J. Linn.Soc. 71, 1–158 (1981).
37. Bonaparte, J. F., Martinelli, A. G., Schultz, C. L. & Rubert, R. The sister group ofmammals: small cynodonts from the Late Triassic of southern Brazil. Rev. Brasil.Paleont. 5, 5–27 (2003).
38. Bonaparte, J. F., Martinelli, A. G. & Schultz, C. L. New information onBrasilodon andBrasilitherium (Cynodontia, Probainognathia) from the Late Triassic, southernBrazil. Rev. Brasil. Paleont. 8, 25–46 (2005).
39. Hiiemae, K.W.&Houston, J. B. The structureand functionof the jawmuscles in therat (Rattus norvegicus L.). Zool. J. Linn. Soc. 50, 75–99 (1971).
40. Wainwright, P. C., Bellwood, D. R., Westneat, M. W., Grubrich, J. R. & Hoey, A. S. Afunctional morphospace for the skull of labrid fishes: patterns of diversity in acomplex biomechanical system. Biol. J. Linn. Soc. 82, 1–25 (2004).
41. Bellwood, D. R., Wainwright, P. C., Fulton, C. J. & Hoey, A. S. Functional versatilitysupports coral reef biodiversity. Proc. R. Soc. B 273, 101–107 (2006).
42. Cuff, A. R. & Rayfield, E. J. Feedingmechanics in spinosaurid theropods and extantcrocodilians. PLoS ONE 8, e65295 (2013).
43. Dumont, E. R. & Nicolay, C. W. Cross-sectional geometry of the dentary in bats.Zoology 109, 66–74 (2007).
44. Rasband, W. S. ImageJ (US National Institutes of Health, Bethesda, Maryland,2012).
45. Davis, J. L., Santana, S. E., Dumont, E. R. & Grosse, I. R. Predicting bite force inmammals: two-dimensional versus three-dimensional lever models. J. Exp. Biol.213, 1844–1851 (2010).
46. McHenry, C. R., Wroe, S., Clausen, P. D., Moreno, K. & Cunningham, E.Supermodeled sabercat, predatory behavior in Smilodon fatalis revealed byhigh-resolution 3D computer simulation. Proc. Natl Acad. Sci. USA 104,16010–16015 (2007).
47. Donald, B. J. M. Practical Stress Analysis with Finite Elements Ch. 7 (Glasnevin,2007).
48. Christiansen, P. A dynamic model for the evolution of sabrecat predatory bitemechanics. Zool. J. Linn. Soc. 162, 220–242 (2011).
49. Tseng, Z. J. & Binder, W. J. Mandibular biomechanics of Crocuta crocuta, Canislupus, and the late Miocene Dinocrocuta gigantea (Carnivora, Mammalia). Zool.J. Linn. Soc. 158, 683–696 (2010).
50. Dumont, E. R., Piccirillo, J. & Grosse, I. R. Finite-element analysis of bitingbehavior and bone stress in the facial skeletons of bats.Anat. Rec. A 283,319–330(2005).
51. Scott, R. S. et al. Dental microwear texture analysis shows within-species dietvariability in fossil hominins. Nature 436, 693–695 (2005).
52. Scott, R. S. et al. Dental microwear texture analysis: technical considerations.J. Hum. Evol. 51, 339–349 (2006).
53. Ungar, P.Dentalmicrowear texture analysis of varswaterbovidsandEarlyPliocenepaleoenvironments of Langebaanweg, Western Cape Province, South Africa.J. Mamm. Evol. 14, 163–181 (2007).
54. Ungar, P. S., Grine, F. E. & Teaford, M. F. Dental microwear and diet of the Plio-Pleistocene hominin Paranthropus boisei. PLoS ONE 3, e2044 (2008).
55. Purnell, M. A., Hart, P. J. B., Baines, D. C. & Bell, M. A. Quantitative analysis of dentalmicrowear in threespine stickleback: a new approach to analysis of trophicecology in aquatic vertebrates. J. Anim. Ecol. 75, 967–977 (2006).
56. Calandra, I., Schulz, E., Pinnow, M., Krohn, S. & Kaiser, T. M. Teasing apart thecontributions of hard dietary items on 3D dental microtextures in primates.J. Hum. Evol. 63, 85–98 (2012).
57. International Organization for Standardization. ISO 25178-2:2012. GeometricalProduct Specifications (GPS) – Surface Texture: Areal – Part 2: Terms, Definitionsand Surface Texture Parameters (International Organization for Standardization,2012).
58. Vaughan, N. Thediets ofBritish bats (Chiroptera).MammalRev.27,77–94 (1997).59. Barlow, K. E. The diets of two phonic types of the bat Pipistrellus pipistrellus in
Britain. J. Zool. 243, 597–609 (1997).60. Purnell, M. A., Seehausen, O. & Galis, F. Quantitative three-dimensional
microtextural analysis of tooth wear as a tool for dietary discrimination in fishes.J. R. Soc. Interface http://dx.doi.org/10.1098/rsif.2012.0140 (4 April 2012).
61. Luo, Z.-X., Kielan-Jaworowska, Z. &Cifelli, R. L. In quest for a phylogeny ofMesozoicmammals. Acta Palaeontol. Pol. 47, 1–78 (2002).
62. Evans, S. E. & Kermack, K. A. in In the Shadow of the Dinosaurs, Early MesozoicTetrapods (eds Fraser, N. C. & Sues, H.-D.) 271–283 (Cambridge Univ. Press,1994).
63. Gill, P. G. Resorption of premolars in the early mammal Kuehneotheriumpraecursoris. Arch. Oral Biol. 19, 327–328 (1974).
LETTER RESEARCH

Extended Data Figure 1 | Phylogenetic relationships of major Mesozoicmammal lineages. Relative tree positions of Morganucodon andKuehneotherium in red. Based on figure 1 in ref. 61. The filled green circledenotes the node for the mammalian crown group.
RESEARCH LETTER

ExtendedData Figure 2 | Pontalun 3 fissure locality. a,Map to show locationof the Glamorgan quarries in South Wales, UK. The black square denotes thearea of themap shown in b. Map attribution: Jhamez84. CC-BY-SA-3.0 (http://
creativecommons.org/licenses/by-sa/3.0). b, Location of the Glamorganquarries yielding tetrapod remains, withwhite arrowmarking Pontalun quarry.Carboniferous limestone upland areas in grey. Modified from ref. 62.
LETTER RESEARCH

Extended Data Figure 3 | Molar form and specimens scanned to createthe digital reconstructions of the dentaries of Morganucodon andKuehneotherium. a, NHMUKPVM92538, an isolatedM.watsoni right lowermolar (identified as m4) in lingual view. b, NHM NHMUK PV M9277, anisolated K. praecursoris right lower molar (mid-row) in lingual view; note thetriangulation of the cusp arrangement. Both molars digitally reconstructedfrom micro-computed tomography scans and reversed to fit with views of thedentaries. c–e, Specimens used for the digital reconstruction ofM. watsoni:c, UMZC Eo.D.61 with m4 in situ; d, UMZC Eo.D.45 with p4, m1, m3 and m4in situ; e, NHMUK PVM85507 with i1–i4 (NB the only Glamorgan specimen
known with complete incisors in situ). f–i, Specimens used for the digitalreconstruction of K. praecursoris: f, NHMUK PV M19766 (paratype C865 inref. 13) with coronoid process and condylar region; g, NHMUK PV M19749(paratype C864 in ref. 13) postdentary trough region; h, UMZC Sy.97 withcomplete alveoli for m5–m6 and partial alveoli for m3–m4; i, NHMUK PVM92779 with alveoli for p1–m4 (U73 in ref. 63). All from Pontalun 3 fissure,except f and g from Pontalun 1 fissure, which ref. 30 assigned to the samehypodigm. All images show medial view. All are left dentaries, except c andd, which are reversed for ease of reference to the reconstructions in Fig. 1.
RESEARCH LETTER

Extended Data Figure 4 | Static loaded finite element models to representthe jaw at the moment of biting. Right mandible models in lateral view of(a) Morganucodon and (b) Kuehneotherium to show muscle loading,constraints and bite points. Inset in a shows modelled rigid body used tosimulate missing coronoid process, for posterior temporalis loading. AT,anterior temporalis; PT, posterior temporalis; SM, superficial masseter; DM,deep masseter. Constraints indicated at the jaw joint and three individual bite
points at the mid molar (m2 in Morganucodon and m3 in Kuehneotherium),ultimate premolar (p4 inMorganucodon and p6 in Kuehneotherium) andcanine. The muscle origin positions are shown for (c) Morganucodon and(d) Kuehneotherium. Morganucodon skull reconstruction from ref. 36 andBrasilitherium skull, used as a proxy for the unknown Kuehneotherium skull,from ref. 37. The teeth have been removed for consistency with the mandiblemodels. See Methods for explanations.
LETTER RESEARCH

Extended Data Table 1 | Specimens used for the microtextural analysis of tooth microwear
LEIUG, University of Leicester Geology collections; UOB, University of Bristol; VLA, Veterinary Laboratory Agencies; NLB, North Lancashire Bat Group.
RESEARCH LETTER

ExtendedData Table 2 | Trophic categorization and diets of British bat species used for validation ofmicrotextural analysis of earlymammalteeth
Table from ref. 29, modified from ref. 58 and references therein, and ref. 59.
LETTER RESEARCH
Extended Data Table 3 | Correlations between roughness parameters from Morganucodon and Kuehneotherium teeth and principal com-ponent axes 1 and 2 derived from analysis of the nine roughness parameters that differ between bat species
*P,0.05. See Extended Data Table 5 for definitions of parameters.
RESEARCH LETTER

ExtendedData Table 4 | Loadings (eigenvectors) for roughness para-metersontoprincipalcomponentaxes1and2for thePCAofbatspecies
From ref. 29.
LETTER RESEARCH
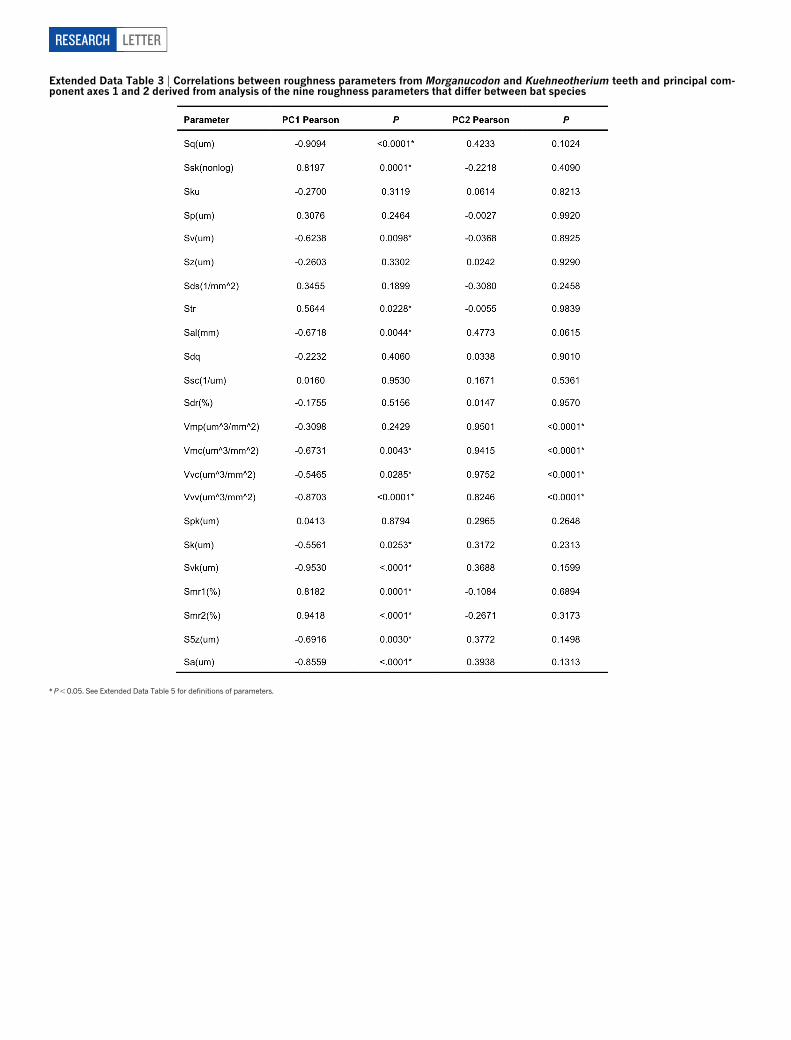
Extended Data Table 5 | Short definitions and categorization of three-dimensional areal surface texture parameters
For further explanation, see ref. 29 and Supplementary Figs 1 and 2.
RESEARCH LETTER