Council Agenda The Corporation of Norfolk County December ...
Upload
independentCategory
view
0download
0
RESEARCH ARTICLE Open Access
Dietary, lifestyle and clinicopathological factorsassociated with BRAF and K-ras mutations arisingin distinct subsets of colorectal cancers in theEPIC Norfolk studyAdam Naguib1, Panagiota N Mitrou2, Laura J Gay1, James C Cooke1, Robert N Luben2, Richard Y Ball3,Alison McTaggart2, Mark J Arends4*, Sheila A Rodwell1,2
Abstract
Background: BRAF and K-ras proto-oncogenes encode components of the ERK signalling pathway and arefrequently mutated in colorectal cancer. This study investigates the associations between BRAF and K-ras mutationsand clinicopathological, lifestyle and dietary factors in colorectal cancers.
Methods: 186 adenocarcinomas and 16 adenomas from the EPIC Norfolk study were tested for BRAF and K-rasmutations. Diet and lifestyle data were collected prospectively using seven day food diaries.
Results: BRAF V600E mutation was found in 15.6% of colorectal cancers but at higher frequencies in cancers withproximal location, poor differentiation and microsatellite instability (MSI) (all p < 0.001). K-ras mutation (mostly incodons 12 and 13) was found in 22.0% of colorectal cancers but at higher frequencies in cancers of moreadvanced Dukes’ stage (p = 0.001), microsatellite stable (MSS) status (p = 0.002) and in individuals with lowerblood high-density lipoprotein concentrations (p = 0.04). Analysis of dietary factors demonstrated no link betweenBRAF mutation and any specific dietary constituent, however, K-ras mutation was found at higher frequencies inindividuals with higher white meat consumption (p < 0.001). Further analysis of specific mutation typedemonstrated that G to A transitions in K-ras were observed at higher frequencies in individuals consuming loweramounts of fruit (p = 0.02).
Conclusion: These data support the model of BRAF and K-ras mutations arising in distinct colorectal cancersubsets associated with different clinicopathological and dietary factors, acting as mutually exclusive mechanismsof activation of the same signalling pathway.
BackgroundBRAF and K-ras genes both encode proteins that act inthe ERK signalling pathway, which mediates cellularresponses to growth factors and regulates elements ofthe cell cycle, apoptosis and differentiation [1]. Activat-ing mutations in both genes have been found in colorec-tal cancer with mutation frequencies of 4-13% for BRAF[2-9] and of 20-50% for K-ras [10-17] having beenreported. BRAF and K-ras mutations are frequentlyfound to be mutually exclusive in colorectal cancer
[5,18] and both genes harbour the majority of mutationsin distinct hotspots: BRAF at codons 463-468 [19] and600 [18,19] and K-ras at codons 12 and 13 [20] andalso, but more infrequently, at codon 61 [21].Colorectal cancer is the third most common cancer in
the world with incidence rates varying up to 25-foldbetween countries [22]; it has been postulated thatapproximately 80% of the observed differences inincidence rates between countries can be attributed todietary factors [23]. Although analysis of dietary compo-nents has been performed in relation to incidence of thiscancer in general, the exact relationship of dietary factorsto specific gene mutations and signalling pathway
* Correspondence: [email protected] of Pathology, University of Cambridge, Addenbrooke’s Hospital,Cambridge CB2 2QQ, UK
Naguib et al. BMC Cancer 2010, 10:99http://www.biomedcentral.com/1471-2407/10/99
© 2010 Naguib et al; licensee BioMed Central Ltd. This is an Open Access article distributed under the terms of the Creative CommonsAttribution License (http://creativecommons.org/licenses/by/2.0), which permits unrestricted use, distribution, and reproduction inany medium, provided the original work is properly cited.

alterations remains to be fully elucidated. To date, analy-sis of dietary factors in relation to oncogenically activatedERK pathway members in colorectal cancer has onlybeen performed in a limited number of studies andalmost exclusively with regard to K-ras mutation. Onestudy reported that low calcium intake and highmonounsaturated fat intake were associated with K-rasmutated colorectal tumours [24] but this was notconfirmed subsequently [14]. Another report linked poly-unsaturated fatty acid consumption to K-ras mutatedcolorectal tumours [25]. At present, very few data existdescribing BRAF mutations in relation to dietary factors,with only one study analysing folate, fibre and alcoholconsumption and showing no association between BRAFmutation and these dietary constituents [26].The present study aimed to investigate the relation-
ship between BRAF and K-ras mutations in 186 adeno-carcinomas from the EPIC Norfolk cohort andclinicopathological features, lifestyle and dietary factors.This study is the most comprehensive to date examiningdietary factors and BRAF mutations in colorectal cancer.Dietary factors which have not been previously testedfor association with K-ras mutations in colorectal cancerwere also explored.
MethodsStudy populationThe EPIC Norfolk cohort included 25 639 healthy menand women aged between 45 and 79 years residing inNorfolk, United Kingdom. Study participants wererecruited between 1993 to 1997, from whom informa-tion on lifestyle and diet was collected prospectively andwho were followed up for incident cancers and otherhealth endpoints. Exact cohort details, blood DNAextraction methods and data collection methods aredescribed in detail elsewhere [27-29]. Ethical approvalwas obtained from the Norwich Local Research EthicsCommittee.
Case ascertainment and tissue samplesIncident cases of colorectal cancer (International StatisticalClassification of Diseases and Related Health Problems(ICD) 9th revision, 153.0-153.9, 154.0, and 154.1) wereascertained by matching study participants to the EastAnglian Cancer Registry and Information Centre (ECRiC)in conjunction with data from the United Kingdom Officefor National Statistics. Cases of colorectal cancer whichdeveloped after the first year following recruitment wereused for analysis. As of June 2004, 291 participants in theNorfolk cohort were reported as having been diagnosedwith colorectal cancer. For individuals from whom archivaltissue was available, formalin-fixed, paraffin-embedded(FFPE) tissue blocks and histopathological reports wereobtained from the Norfolk and Norwich University
Hospital. Clinicopathological data describing tumour loca-tion, Dukes’ stage and differentiation were obtained frompathology reports and the ECRiC. Available for this studywere 186 adenocarcinoma and 16 adenoma samples from189 individuals (adenocarcinoma and separate adenomatissue was obtained from the same individual in 13 cases,adenoma tissue in isolation was resected from 3 indivi-duals and adenocarcinoma tissue in isolation was resectedfrom 173 individuals). The 16 adenomas were either tubu-lar or tubulo-villous adenomas with low grade dysplasia,none displayed significant serrated architecture, and alladenomas were considered together as a single group ofpre-malignant neoplasms.
DNA extractionFFPE sample blocks were cut into 4 μm sections. Onesection was stained with haematoxylin and eosin andwas used for histological identification of adenoma, ade-nocarcinoma and normal cell types within the sample.This section was used as a template for isolation of thedifferent cell types from a further five 4 μm sections.Following histological examination, 186 adenocarcino-mas and 16 adenomas were identified. Different tissuetypes were macrodissected and scraped into 240 μl ofBuffer PKD with 10 μl of Proteinase K (both obtainedfrom RNEasy FFPE kits, QIAGEN, Valencia, USA). Sam-ples were agitated at 150 rpm at 55.0°C for 4-6 days.Tissue digestion was checked after 3 days and sampleswhich still had visible amounts of tissue had a further10 μl of Proteinase K added for the remainder of theincubation. Samples were then incubated at 80.0°C for15 minutes in order to partially reverse formaldehydemodification of the nucleic acids and to denature anyresidual protein. DNA concentration was then checkedusing Nanodrop ND-1000 Spectrophotometer (LabtechInternational Ltd, Ringmer, UK).
Mutation detectionPCR amplification of the known mutation hotspots ofBRAF and K-ras was performed. BRAF exon 11 wasamplified using primers 11F (5’-CCT GTA TCC CTCTCA GGC ATA AGG-3’) and 11R (5’-GAA CAG TGAATA TTT CCT TTG ATG-3’). BRAF exon 15 wasamplified using primers 15F (5’-CTT CAT AAT GCTTGC TCT GAT AGG-3’) and 15R (5’-GCA TCT CAGGGC CAA AAA T-3’). PCR products were generatedusing 5 ng-2 μg of template DNA. KOD Hot Start DNAPolymerase kits (Novagen, Madison, USA) were used tomake the following reaction mixture: 2.5 μl × 10 PCRBuffer for KOD Hot Start DNA Polymerase, 1 μl pri-mers, forward and reverse (10 μM each), 1 μl MgSO4
(25 mM), 2 μl dNTPs (2 mM each), 0.25 μl KOD DNAPolymerase and made up to a total reaction volume of25 μl with water. The reactions involved a denaturation
Naguib et al. BMC Cancer 2010, 10:99http://www.biomedcentral.com/1471-2407/10/99
Page 2 of 11

step at 94.0°C for 5 minutes followed by 45 cycles of94.0°C for 15 seconds, 30 seconds at annealing tempera-tures of 58.1°C and 58.4°C for BRAF exons 11 and 15respectively and 72.0°C for 30 seconds. Final extensionwas 72°C for 5 minutes. To detect successful amplifica-tions, 5 μl of each reaction mixture was separated on a3% agarose gel containing 1 μg/ml ethidium bromide,and visualised under UV light.K-ras exon 1 was amplified using previously described
primers [30]. K-ras exon 2 was amplified using primers2F (5’-GCA CTG TAA TAA TCC AGA CTG TGTTTC-3’) and 2R (5’-GAC AGC TTA TTA TAT TCAATT TAA AC-3’). The PCR reaction mixture and reac-tion conditions were as described for BRAF except thatannealing temperatures of 60.0°C and 55.0°C were usedfor amplification of K-ras exons 1 and 2 respectively.For dideoxysequencing, the remaining PCR amplificationproduct mixture (20 μl), following visualisation on agar-ose gels, was purified using Multiscreen filter plates(Millipore, Billerica, USA) according to the manufac-turer’s instructions and subjected to direct sequencingby ABI3730xl Platform sequencer (Applied Biosystems,Warrington, UK). Forward and reverse strands wereboth sequenced. Every sample was PCR amplified andsequenced a minimum of twice on each strand.K-ras exon 1 was also analysed at codons 12 and 13
with pyrosequencing using a previously described assaywhich has been shown to be of greater sensitivity thandideoxysequencing when detecting base changes at thesepositions [31]. Both methods were used to maximise thesensitivity of mutation detection at the highly mutatedcodons 12 and 13 in exon 1. Following PCR generationof an 82 bp amplicon (reaction mixture as described forBRAF, primers and primer annealing temperatures aredescribed elsewhere [31]) reaction mixture was sub-jected directly to pyrosequencing. Pyrosequencing wasperformed on two independent PCR products at each ofthe bases analysed, such that 6 independent reactionswere undertaken for each sample (twice at bases 1 and2 of codon 12 and twice at base 2 of codon 13).
Microsatellite stability status determinationDetermination of microsatellite stability status isdescribed elsewhere (Gay L et al., submitted). In brief,six microsatellites were used for microsatellite stabilitystatus determination: BAT25, BAT26, BAT40, D2S123,D5S346 and D17S250. PCR primers for amplification ofcancer DNA were labelled with 5’6-FAM and primersfor amplification of corresponding non-cancerous DNAfrom the same individual (obtained from blood samples)were labelled with 5’HEX. PCR amplicons covering eachmarker were analysed for changes in size using anABI3730xl Platform sequencer with a Genescan 500ROX size standard (Applied Biosystems, Warrington,
UK), and ABI Peak Scanner software (version 1.0). Iftwo or more of the six markers in cancer DNA demon-strated a deviation in size from the same markers ana-lysed in corresponding non-cancerous DNA, the cancersample was classified as showing microsatellite instabil-ity (MSI). If one or none of the markers demonstratedsize deviation, the sample was classified as microsatellitestable (MSS).
Lifestyle and other exposure assessmentHeight and weight information were obtained using abaseline health examination upon recruitment between1993 and 1997 and body mass index (BMI) calculated.Health and lifestyle questionnaires administered at thesame time recorded information pertaining to hormonereplacement therapy (HRT), smoking habits includingsmoking status (current, former or never) and packyears of cigarette use (defined as 20 cigarettes a day fora year) and habitual physical activity, assessed usingquestions referring to present activity at the time ofquestionnaire administration. Those with low physicalactivity were defined as those with a sedentary job withno recreational activity, a sedentary job with less than0.5 hours of recreational activity per day, or a standingjob with no recreational activity. High physical activityincluded those with activity levels above these defini-tions. Details of the measurements and questionnairesused for attainment and assessment of these data aredescribed elsewhere [28,32,33].Dietary assessment was performed using seven day
food diaries (7dd) which were completed at recruitment.This method of dietary assessment has been previouslyvalidated and is described in detail elsewhere [27]. Dia-ries were completed at recruitment. Food descriptionsand portion size estimates were converted into weightsof foods and food group data derived. Intakes of meat,fish, fruit and vegetables were assessed as the weights offoods contributing to these food groups. Meat classifica-tions included red, processed and white meats andwhite and fatty fish types. Red meat was defined as beef,lamb, mutton, pork, veal, rabbit and venison, includingcomposite dishes and excluding offal. White meat wasdefined as chicken, turkey, duck, guinea fowl, goose,pheasant, grouse and other birds, and as all meat/jointssimply cooked or in composite dishes. Processed meatwas defined as meat that had undergone smoking, cur-ing, salting or the addition of chemical preservatives.White fish was defined as fish where fat is concentratedin the liver rather than the flesh, such as cod, haddocketc. and fatty fish was defined as fish where fat is dis-tributed throughout the flesh, such as herring andmackerel. Shellfish were not included in either fish cate-gory. Fruit consumption was defined as intake of fruitsin all forms, including fruit included in composite
Naguib et al. BMC Cancer 2010, 10:99http://www.biomedcentral.com/1471-2407/10/99
Page 3 of 11

dishes, but excluding fruit from juices, cereals and jams.Vegetable consumption was defined as intake of vegeta-bles in all forms excluding potatoes, legumes, herbs,pickles and chutneys, and tomato sauces in canned pro-ducts. Alcohol, fat, vitamin, calcium and macronutrientintakes were calculated using the Data into Nutrientsfor Epidemiological Research (DINER) program, whichis described in detail elsewhere [34].
Statistical analysisAnalysis of lifestyle and patient characteristics was per-formed using chi-squared (c2) tests for categorical dataand analysis of variance (ANOVA) tests for all continu-ous numerical data. For this analysis, all 186 adenocarci-nomas were classified as BRAF or K-ras mutated orwildtype. For additional testing, K-ras mutated adeno-carcinomas were classified by mutation type as eitherthose cancers exhibiting G to A transitions or cancersexhibiting any other mutation type. Clinicopathologicalcancer features were examined in relation to thesemutation categories. Dukes’ stage was classified as earlyDukes’ stage (A and B) and late Dukes’ stage (C and D).Tumour location was classified as proximal colonic anddistal colonic/rectal. Cancers of other origins (i.e. appen-dix or secondary metastases) were omitted from locationtesting. Differentiation was determined by a histopathol-ogist and classified as moderately/well differentiated orpoorly differentiated and microsatellite instability statusas MSS or MSI. Lifestyle factors, including smoking sta-tus (current/former/never), physical activity (high/low),alcohol consumption (g/day, continuous), low-density(mmol/l, continuous) and high-density lipoprotein bloodconcentrations (mmol/l, continuous), triglyceride bloodconcentrations (mmol/l, continuous) and plasma vitaminC concentrations (μmol/l, continuous) were also testedfor association with the defined mutation categories.Continuous dietary variables were tested for associationwith mutation including meat, fruit and vegetable, fat,vitamin, and fibre and macronutrient, including calcium,variables, in their relevant unit of consumption. A prob-ability value of less than or equal to 0.05 was consideredto be statistically significant. No adjustment was madefor multiple testing. All testing was performed usingSPSS version 16.0 (SPSS Inc, Chicago, USA).
ResultsBRAF and K-ras mutation frequencies in colorectaladenocarcinomas and adenomasThe type and distribution of the mutations observed inBRAF and K-ras in colorectal neoplasms are describedin Table 1 with examples in Figure 1. Of the 186 color-ectal adenocarcinoma samples analysed, 29 (15.6%) har-boured a mutation in BRAF. All BRAF mutations werethe V600E type due to T to A transversion in exon 15,
although a previously reported synonymous SNP(rs56101602) was detected in one adenocarcinomasample in exon 11. None of the 16 adenomas analysedharboured BRAF mutations in either exon 11 or 15.Dideoxysequencing analysis of exons 1 and 2 of K-ras
identified 30 mutations in the 16 adenoma and 186 ade-nocarcinoma samples. In addition to those mutationsidentified with dideoxysequencing, pyrosequencing ofK-ras codons 12 and 13 demonstrated the presence afurther 14 mutations in the colorectal tumour samplesanalysed, confirming the increased sensitivity of thismethod. In total, K-ras mutations in 41/186 differentadenocarcinomas (22.0%) were identified. A previouslyunreported double mutation observed using dideoxyse-quencing, at codons 19 and 20 (Figure 1) was not in theregion analysed with pyrosequencing. Only 1/30 (3.3%)mutations in codons 12 and 13 identified with dideoxy-sequencing was not identified with pyrosequencingwhen subsequently analysed. Thirty-three (78.6%) of thebase changes observed in K-ras in adenocarcinomaswere in codon 12. Seven (16.7%) were in codon 13. Twoother base changes (4.8% of total) were observed incodons 19 and 20 of the same cancer.Of the 16 colorectal adenomas analysed, 7 harboured
non-wildtype K-ras DNA sequences. Six mutations wereidentified in exon 1, one, at codon 89, in exon 2. The Cto A transversion at the second position of codon 89produced a stop codon. The remaining 6 mutations inexon 1 were observed to be oncogenically activatingbase changes in codons 12 and 13. Known oncogenicallyactivating mutations were therefore observed in 37.5%of the adenomas tested. Of the 7 adenoma sampleswhich exhibited non-wildtype K-ras sequence, 2 adeno-mas were identified without accompanying adenocarci-noma. Of the 5 adenomas which were resected fromindividuals from whom independently presenting adeno-carcinoma was also resected, two exhibited an identicalmutation in both the adenoma and adenocarcinoma.Three exhibited mutations in the adenoma tissue alonewith no evidence of a corresponding mutation in theaccompanying adenocarcinoma samples.Testing of the co-incidence of mutation in BRAF and
K-ras demonstrated that the prevalence of mutation inthese two genes were inversely associated (p = 0.009,c2). Fifty-nine adenocarcinomas presented with eitherBRAF or K-ras mutation, only one of which harbouredboth.
Lifestyle and clinicopathological factors in relation toBRAF and K-ras mutationsAnalysis of the distribution of cancers with BRAF orK-ras mutations according to clinicopathological andlifestyle variables is presented in Table 2. Proximal colo-nic location, poor differentiation and MSI were all
Naguib et al. BMC Cancer 2010, 10:99http://www.biomedcentral.com/1471-2407/10/99
Page 4 of 11
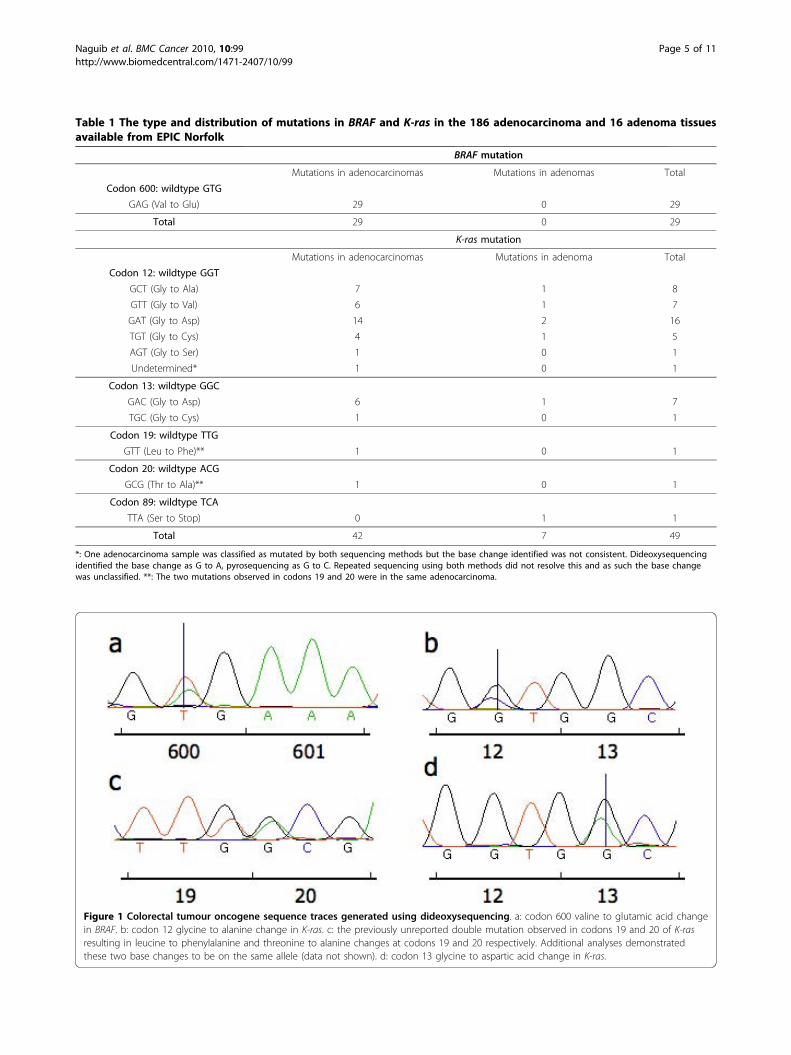
Table 1 The type and distribution of mutations in BRAF and K-ras in the 186 adenocarcinoma and 16 adenoma tissuesavailable from EPIC Norfolk
BRAF mutation
Mutations in adenocarcinomas Mutations in adenomas Total
Codon 600: wildtype GTG
GAG (Val to Glu) 29 0 29
Total 29 0 29
K-ras mutation
Mutations in adenocarcinomas Mutations in adenoma Total
Codon 12: wildtype GGT
GCT (Gly to Ala) 7 1 8
GTT (Gly to Val) 6 1 7
GAT (Gly to Asp) 14 2 16
TGT (Gly to Cys) 4 1 5
AGT (Gly to Ser) 1 0 1
Undetermined* 1 0 1
Codon 13: wildtype GGC
GAC (Gly to Asp) 6 1 7
TGC (Gly to Cys) 1 0 1
Codon 19: wildtype TTG
GTT (Leu to Phe)** 1 0 1
Codon 20: wildtype ACG
GCG (Thr to Ala)** 1 0 1
Codon 89: wildtype TCA
TTA (Ser to Stop) 0 1 1
Total 42 7 49
*: One adenocarcinoma sample was classified as mutated by both sequencing methods but the base change identified was not consistent. Dideoxysequencingidentified the base change as G to A, pyrosequencing as G to C. Repeated sequencing using both methods did not resolve this and as such the base changewas unclassified. **: The two mutations observed in codons 19 and 20 were in the same adenocarcinoma.
Figure 1 Colorectal tumour oncogene sequence traces generated using dideoxysequencing. a: codon 600 valine to glutamic acid changein BRAF. b: codon 12 glycine to alanine change in K-ras. c: the previously unreported double mutation observed in codons 19 and 20 of K-rasresulting in leucine to phenylalanine and threonine to alanine changes at codons 19 and 20 respectively. Additional analyses demonstratedthese two base changes to be on the same allele (data not shown). d: codon 13 glycine to aspartic acid change in K-ras.
Naguib et al. BMC Cancer 2010, 10:99http://www.biomedcentral.com/1471-2407/10/99
Page 5 of 11

associated with BRAF mutation (all p < 0.001). The pre-valence of cancers with BRAF mutation was higher infemales and in individuals with a later age at diagnosis,although these differences failed to reach statistical sig-nificance (both p = 0.07).A higher proportion of cancers harbouring K-ras muta-
tion was found to have later Dukes’ stage (C or D ratherthan A or B)(p = 0.001) and to be microsatellite stable(MSS)(p = 0.002). Of the 36 cancers with available micro-satellite stability data and K-ras mutation, all were MSS.Cases of cancers harbouring mutated K-ras also
demonstrated earlier age at diagnosis, although this asso-ciation failed to reach statistical significance (p = 0.06).Cases with K-ras mutation had significantly lower meanblood HDL cholesterol concentrations than thosewith wildtype K-ras (1.19 mmol/l versus 1.33 mmol/l;p = 0.04).
Dietary factors and BRAF and K-ras mutationsNone of the dietary factors tested displayed a statisticallysignificant association with BRAF mutations in colorectalcancers. Individuals harbouring K-ras mutated cancers
Table 2 Clinicopathological and lifestyle characteristics of colorectal cancer cases by BRAF or K-ras mutation statusand K-ras mutated cancers by specific K-ras mutation types
BRAF mutation K-ras mutation K-ras mutation type
Characteristic Wildtypen = 157†
Mutantn = 29†
P‡ Wildtypen = 145†
Mutantn = 41†
P‡ G to An = 22†
Othern = 17†
P‡
Sex
Male 52.9 (83) 34.5 (10) 46.9 (68) 61.0 (25) 63.6 (14) 58.8 (10)
Female 47.1 (74) 65.5 (19) 0.07 53.1 (77) 39.0 (16) 0.11 36.4 (8) 41.2(7) 0.76
Age at diagnosis (years) 70.1 (7.9) 72.9 (5.5) 0.07* 71.1 (7.1) 68.5 (8.9) 0.06* 67.2 (9.4) 69.4 (8.7) 0.46*
Tumour location
Proximal colonic 28.3 (41) 75.0 (21) 33.1 (44) 45.0 (18) 42.9 (9) 52.9 (9)
Distal colonic/Rectal 71.7 (104) 25.0 (7) <0.001 66.9 (89) 55.0 (22) 0.17 57.1 (12) 47.1 (8) 0.54
Differentiation
Well/Moderate 90.6 (125) 59.3 (16) (FET) 85.8 (109) 84.2 (32) 80.0 (16) 87.5 (14) (FET)
Poor 9.4 (13) 40.7 (11) <0.001 14.2 (18) 15.8 (6) 0.80 20.0 (4) 12.5 (2) 0.67
Dukes’ Stage
A/B 54.5 (73) 57.7 (15) 61.9 (78) 29.4 (10) 27.8 (5) 33.3 (5) (FET)
C/D 45.5 (61) 42.3 (11) 0.76 38.1 (48) 70.6 (24) 0.001 72.2 (13) 66.7 (101) 1.00
MSI status
MSS 90.8 (129) 42.9 (12) (FET) 78.4 (105) 100.0 (36) a a
MSI 9.2 (13) 57.1 (16) <0.001 21.6 (29) 0.0 (0) 0.002 a a a
BMI (kg/m2) 27.3 (4.3) 26.6 (4.3) 0.41* 27.0 (4.3) 27.9 (4.3) 0.26* 28.1 (4.3) 27.7 (4.7) 0.74*
Alcohol intake (g/d) 9.9 (15.3) 5.1 (10.4) 0.11* 8.6 (14.1) 11.1 (16.6) 0.36* 11.1 (18.0) 8.6 (11.1) 0.62*
Smoking status
Current 9.9 (15) 13.8 (4) 11.4 (16) 7.3 (3) 13.6 (3) 0.0 (0)
Former 46.1 (70) 48.3 (14) 45.7 (64) 48.8 (20) 45.5 (10) 52.9 (9)
Never 44.1 (67) 37.9 (11) 0.74 42.9 (60) 43.9 (18) 0.75 40.9 (9) 47.1 (8) 0.29
Physical activity
Low 66.7 (104) 69.0 (20) 66.0 (95) 70.7 (29) 63.6 (14) 76.5 (13)
High 33.3 (52) 31.0 (9) 0.81 34.0 (49) 29.3 (12) 0.57 36.4 (8) 23.5 (4) 0.49
HRT satatus
Current 9.6 (7) 5.3 (1) 9.2 (7) 6.2 (1) b b
Former 16.4 (12) 21.1 (4) 17.1 (13) 18.8 (3) b b
Never 74.0 (54) 73.7 (14) 0.78 73.7 (56) 75.0 (12) 0.93 b b b
LDL (mmol/l) 4.14 (1.1) 4.06 (1.1) 0.75* 4.19 (1.2) 3.91 (0.8) 0.19* 3.85 (0.7) 3.93 (1.0) 0.79*
HDL (mmol/l) 1.30 (0.4) 1.33 (0.3) 0.63* 1.33 (0.4) 1.19 (0.4) 0.04* 1.16 (0.4) 1.16 (0.4) 0.96*
Triglyceride (mmol/l) 2.11 (1.2) 1.94 (1.1) 0.48* 2.02 (1.1) 2.34 (1.3) 0.12* 2.23 (1.2) 2.59 (1.5) 0.43*
Plasma vitamin C (μmol/l) 52.0 (24.3) 48.0 (20.9) 0.44* 52.5 (24.8) 47.5 (20.0) 0.28* 45.4 (19.7) 50.0 (20.9) 0.52*‡P values determined by c2 test or Fisher’s exact test when one or more expected values were less than 5 (denoted by FET). *: ANOVA tests used to calculatep-values. Results presented as [n (%)] or [mean (± SD)]. HRT: hormone replacement therapy. MSI: Microsatellite instability. MSS: Microsatellite stable. † Not allindividuals had data for each variable, in these cases these individuals were omitted from the test. For HRT testing only females were analysed, for which 92 haddata available. a Microsatellite instability was not tested relative to different K-ras mutation types as none of the cancers harbouring K-ras mutation exhibitedmicrosatellite instability. b HRT status was not tested relative to different K-ras mutation types due to the low numbers of cases available for testing.
Naguib et al. BMC Cancer 2010, 10:99http://www.biomedcentral.com/1471-2407/10/99
Page 6 of 11

had a statistically significantly increased mean white meatconsumption: 29.5 g/d versus 17.4 g/d, p < 0.001 (Table 3).
Lifestyle, dietary and clinicopathological factors ofcolorectal cancers in relation to K-ras mutation typeOf the 42 K-ras mutations observed in colorectal can-cers, 22 were G to A transitions. In order to assess therelevance of this observation, individuals with K-rasmutated cancers exhibiting this specific G to A basechange were compared with individuals harbouring K-ras mutated cancers with all other mutation types suchthat K-ras mutations were classified as ‘G to A’ or‘other’. One sample, harbouring a double mutation atcodons 19 and 20 was omitted from the testing due tothe base changes being of both classifications. A secondsample was classified as mutated by both dideoxyse-quencing and pyrosequencing methods. However, thetwo methods described a G to A and a G to C base
change respectively, confirmed following repeated test-ing. This case was also omitted from this analysis. Ana-lysis of the distribution of cancers with different K-rasmutation types according to clinicopathological and life-style variables is summarised in Table 2: none of theclinicopathological features or lifestyle exposures testedwere associated with either classification of K-rasmutation.All dietary variables were tested for association with
either K-ras mutation classification. Cancers harbouringG to A transitions in K-ras were found in individualswith a significantly lower consumption of fruit com-pared with those individuals harbouring other K-rasmutation types (p = 0.02): 155 g/d versus 247 g/d. Areduced consumption of vegetables was also observed inthose individuals with K-ras G to A base changes intheir cancers, although this did not reach statistical sig-nificance (p = 0.07).
Table 3 Dietary intakes stratified by BRAF and K-ras mutation status
BRAF mutation K-ras mutation
Dietary factor Wildtype n = 156 Mutant n = 29 P‡ Wildtype n = 144 Mutant n = 41 P‡
Meat
Red Meat (g/d) 37 (28.9) 40 (24.5) 0.60 38 (28.4) 33 (27.2) 0.31
Processed Meat (g/d) 24 (19.7) 25 (14.3) 0.81 25 (18.7) 23 (19.8) 0.62
Red + Processed Meat (g/d) 61 (37.1) 65 (28.5) 0.59 63 (35.9) 56 (35.4) 0.29
White Meat (g/d) 21 (20.2) 17 (15.5) 0.29 17 (18.0) 30 (22.1) <0.001
White Fish (g/d) 17 (15.7) 17 (26.5) 0.98 18 (19.3) 14 (10.7) 0.28
Fatty Fish (g/d) 12 (20.0) 10 (12.1) 0.64 11 (17.5) 14 (23.4) 0.33
Fruit and vegetables
Fruit (g/d) 170 (133.1) 193 (170.9) 0.42 168 (143.0) 191 (125.8) 0.36
Vegetables (g/d) 136 (68.3) 150 (70.9) 0.29 136 (66.6) 145 (76.1) 0.43
Fat
Total Fat (g/d) 71 (22.9) 71 (23.7) 1.00 71 (22.4) 75 (25.0) 0.32
PUFA (g/d) 13 (5.3) 13 (5.7) 0.96 13 (5.1) 14 (6.2) 0.20
MUFA (g/d) 25 (8.1) 24 (7.5) 0.77 24 (7.9) 26 (8.5) 0.29
SFA (g/d) 27 (10.2) 28 (11.7) 0.84 27 (10.3) 28 (10.7) 0.59
Vitamins
B2[riboflavin] (mg/d) 2 (0.6) 2 (0.6) 0.95 2 (0.6) 2 (0.6) 0.67
B3[niacin] (mg/d) 18 (5.5) 18 (6.7) 0.69 18 (5.9) 19 (4.7) 0.40
B6[pyroxidine] (μg/d) 2 (0.6) 2 (0.6) 0.96 2 (0.6) 2 (0.6) 0.35
B9[folate] (μg/d) 259 (71.9) 257 (73.8) 0.89 258 (73.4) 260 (67.7) 0.89
B12 (μg/d) 6 (5.5) 5 (4.0) 0.40 6 (5.2) 6 (5.4) 0.96
C (mg/d) 85 (48.7) 87 (38.8) 0.82 85 (45.5) 87 (53.4) 0.78
D (μg/d) 3 (2.2) 4 (2.3) 0.69 3 (2.1) 4 (2.6) 0.53
Fibre and Macronutrients
Total Energy (MJ/d) 8 (2.1) 8 (1.8) 0.85 8 (2.1) 8 (2.0) 0.51
Carbohydrate (g/d) 235 (68.2) 250 (58.5) 0.25 238 (68.6) 236 (60.9) 0.87
Protein (g/d) 70 (15.1) 68 (14.8) 0.48 70 (15.4) 72 (13.6) 0.29
NSP (g/d) 14 (5.0) 16 (7.4) 0.15 14 (5.8) 15 (4.1) 0.53
Calcium (mg/d) 779 (235.9) 821 (220.5) 0.37 787 (239.8) 783 (212.7) 0.92‡P values determined by ANOVA. Results presented as [mean (± SD)]. PUFA: polyunsaturated fatty acid. MUFA: monounsaturated fatty acid. SFA: saturated fattyacid. NSP: non-starch polysaccharide. For one case for which mutational status had been determined no dietary data was available. Therefore, for all testing withdietary factors the number of combined cases in the wildtype and mutated groups available for analysis was 185.
Naguib et al. BMC Cancer 2010, 10:99http://www.biomedcentral.com/1471-2407/10/99
Page 7 of 11

DiscussionThe data presented herein suggest that BRAF and K-rasmutations arise in an almost mutually exclusive mannerin distinct subsets of colorectal cancer, that differ interms of clinicopathological features, dietary factors andlifestyle exposures. BRAF mutation in colorectal cancerswas observed at a frequency of 15.6% and K-ras muta-tion at 22.0%. These frequencies are at the high and lowends of the ranges previously reported for mutations inthese genes in colorectal cancer: 4-13% for BRAF [2-9]and 20-50% for K-ras [10,12-17,35]. The mutually exclu-sive nature of these two mutation types, as shown inthis and other studies [3,5,7,18,36] may explain this:increased prevalence of BRAF mutation in this sampleset may be consistent with a reduction in K-ras muta-tion frequency.BRAF mutation was strongly associated with cancer of
proximal colonic location, poor differentiation andmicrosatellite instability (all p < 0.001). BRAF mutationand proximal colonic location have been linked in pre-vious reports [5]. Microsatellite instability has beenlinked to proximal location [37] and has been consis-tently linked to BRAF mutation in colorectal cancer[3,4,6]: one review described BRAF mutation as a ‘hall-mark’ of MSI tumours [38]. Poor differentiation has alsobeen linked to BRAF mutation in previous studies[39,40] as well as microsatellite instability [41]. Takentogether, these data confirm that the clinicopathologicalsignature of BRAF mutated colorectal cancer includesproximal location, microsatellite instability and poor dif-ferentiation. This is consistent with this distinct subsetof tumours arising by a mechanism of microsatelliteinstability, which is strongly associated with BRAF muta-tion. In contrast to this, analysis of K-ras mutationsdemonstrated an association with microsatellite stability(p = 0.002); an observation reported previously [4,6,42].In this report K-ras mutation was more prevalent incancers of later Dukes’ stage (C and D). This observa-tion has been made in some previous reports [13,15]but not in others [2,11,12,17,20,35,43]. Additionally, thelargest study to date on K-ras mutations in colorectalcancer, analysing 4268 cases, reported an associationbetween K-ras mutation in colorectal cancer and poorprognosis [44], suggesting an association between K-rasmutation and more advanced colorectal cancer. Thetesting presented herein demonstrates the independentclinicopathological nature of colorectal cancers witheither BRAF or K-ras mutations.Analysis of dietary factors stratified by colorectal can-
cer gene mutation type showed that none of the dietaryfactors tested were positively or negatively associatedwith BRAF mutation. This study is the first to undertakea comprehensive analysis of BRAF mutations in
colorectal cancer and their relationship to dietary fac-tors. One previous report analysed folate, alcohol andfibre consumption and found no association with BRAFmutation [26], observations which were confirmed inthis study. The detailed analysis presented here hasdemonstrated further the independence of BRAF muta-tion relative to dietary intakes using a comprehensiveanalysis of twenty four individual dietary constituents.Analysis of K-ras mutations in colorectal cancers in
relation to dietary factors demonstrated that mutationin K-ras was associated with increased white meat con-sumption (p < 0.001). Furthermore, analysis of K-rasmutation type identified those individuals harbouring K-ras mutated cancers with G to A transitions as consum-ing less fruit (p = 0.02) and vegetables, although thereduction in vegetable consumption was of marginal sta-tistical significance (p = 0.07). Individuals harbouring K-ras mutated cancers also had lower blood HDL choles-terol concentrations than those harbouring cancers withwildtype K-ras genes (p = 0.04), an association requiringvalidation in future studies. The association betweenincreased white meat consumption and K-ras mutationsin colorectal cancer requires confirmation in larger stu-dies and in vitro mechanistic investigations. However,plausible mechanisms have been postulated which mayexplain reduced fruit and vegetable consumption andincreased prevalence of G to A transitions. Fruits andvegetables contain bioactive compounds, such as flava-nols, capable of inhibiting nitroso compound formation[45]. Nitroso compounds are capable of inducing gua-nine base alkylation which, if not repaired, can lead toG to A base transitions [46]. Therefore, low fruit andvegetable consumption is consistent with G to A transi-tions in tumours, as demonstrated in this study. Thisstudy did not confirm observations made in a previousstudy of K-ras mutated colorectal tumours being asso-ciated with low calcium and high monounsaturated fatintake [24]. These observations were also tested inanother large population based study, which also failedto detect this association [14]. Another finding linkingpolyunsaturated fatty acid types to K-ras mutatedtumours [25] was also not confirmed in the data pre-sented here.In addition to the 186 cancer samples analysed, 16
unselected adenomas were also tested for mutation inBRAF and K-ras. No BRAF mutations were observed inany of the adenomas. A previous analysis of 113 unse-lected sporadic colorectal adenomas detected BRAFmutations at a frequency of only 2.8% [8]. However, inserrated adenomas mutation frequencies for BRAF of 30to 50% of cases have been described [36,47]. Because ofthe low number of adenomas available for analysis andthe lack serrated adenomas in this sample set (none
Naguib et al. BMC Cancer 2010, 10:99http://www.biomedcentral.com/1471-2407/10/99
Page 8 of 11

were included), the observation that none of the 16 ade-nomas tested harboured BRAF mutation was expected.In contrast to BRAF, 6 (37.5%) adenomas harboured
oncogenically activating mutations in K-ras, a prevalenceconsistent with previous reports [8,48]. In addition tothis, a novel K-ras mutation was observed in a singleadenoma. This mutation was not observed in the corre-sponding cancer tissue. This point mutation in codon89 produced a stop codon towards the end of exon 2.This mutation is uncharacteristic of proto-oncogenetransformation in that it would not lead to increasedERK signalling. However, the tumour suppressor func-tion of wildtype KRAS protein has been previouslydescribed [49] and as such a putative cancer promotingeffect of such a truncating mutation in K-ras cannot bediscounted.Although the number of adenomas tested was too low
to elucidate meaningful relationships between clinico-pathological features, lifestyle exposures and dietaryintakes, it is interesting to note the lack of BRAF muta-tions observed compared to the relatively high preva-lence of oncogenically activating mutations observed inK-ras (37.5%). These observations are consistent withthe later timing of BRAF mutation in colorectal cancerdevelopment, which has been postulated previously [50],and is consistent with distinct subsets of colorectaltumours with BRAF and K-ras mutations.A strength of the current study is the use of pro-
spective dietary and lifestyle data collected before theonset of disease as well as the use of 7dd records fordietary assessment, a method that has been shown toestimate diet more accurately than food frequencyquestionnaires when validated with urinary biomarkers[51]. Furthermore, such detailed dietary analysisregarding so many variables has not been previouslyattempted in relation to mutation of these genes, andas such this report contributes new information to thecurrent knowledge of mutations in BRAF and K-ras incolorectal cancer and dietary intakes. The limitationsinherent in our study of multiple statistical testingmean that the significant associations observed in thisstudy would benefit from further validation. Adjust-ment for confounding variables in the statistical testingwas not performed in this study. It has previously beendescribed how logistic regression analyses performedon low sample sets leads to systematic bias (i.e. awayfrom null), and overestimation of odds ratios [52].Consequently, in order to prevent overestimation ofdietary risk factors, this testing was not performed onthe small sample sizes available. Further validation ofthe exploratory associations presented in this reportwould benefit from testing in studies with larger sam-ple sets upon which confounding factors could beextensively explored.
ConclusionsBRAF mutations are found in cancers with a clinico-pathological signature of proximal colonic location, poordifferentiation and microsatellite instability. Further-more, the presence of BRAF mutations in colorectalcancer is not associated with any of the dietary factorstested. Conversely, K-ras mutations are not characteris-tic of colorectal cancers with these clinicopathologicalfeatures and are found in microsatellite stable colorectalcancers and are associated with a more advanced Dukes’stage. Unlike BRAF mutations, K-ras mutations, ingeneral and specific types, appear to be associated withspecific dietary factors. These data demonstrate theindependent distribution of BRAF and K-ras mutationsin different subsets of colorectal cancer.
AcknowledgementsThanks to Dr Jenny Keen for help with DNA extraction and Dr CatherineWilson for her advice regarding K-ras mutations. Our thanks go to ProfessorKay-Tee Khaw who helped coordinate the project. EPIC Norfolk is funded byCancer Research UK and Medical Research Council.
Author details1Medical Research Council Dunn Human Nutrition Unit, Wellcome Trust/MRCBuilding, Cambridge, CB2 0XY, UK. 2Medical Research Council Centre forNutritional Epidemiology in Cancer Prevention and Survival, Department ofPublic Health and Primary Care, University of Cambridge, Cambridge CB18RN, UK. 3Norfolk and Waveney Cellular Pathology Network, Norfolk andNorwich University Hospital NHS Foundation Trust, Colney Lane, Norwich,NR4 7UY, UK. 4Department of Pathology, University of Cambridge,Addenbrooke’s Hospital, Cambridge CB2 2QQ, UK.
Authors’ contributionsAN performed the sequencing analyses, statistical testing and composed themanuscript. PNM contributed to manuscript preparation and directed thedisplay of statistical data. LJG performed the MSI analyses. RYB obtainedaccess to and distributed the human tissue samples. RNL and AM compiledand provided the dietary data. MJA contributed to study design,histopathological analysis of the samples, manuscript preparation andsupervision of the project. JCC and SAR contributed to study design andcoordination. All authors read and approved the manuscript, except SAR.Sheila Rodwell’s initial contributions were of great help and guidance duringthe concept and initiation stages of this study. With great regret, Sheila’suntimely passing in June 2009 meant that she was unable to witness theoutcome of the research described here.
Competing interestsThe authors declare that they have no competing interests.
Received: 9 October 2009 Accepted: 16 March 2010Published: 16 March 2010
References1. Marshall CJ: Small GTPases and cell cycle regulation. Biochem Soc Trans
1999, 27(4):363-370.2. Calistri D, Rengucci C, Seymour I, Lattuneddu A, Polifemo AM, Monti F,
Saragoni L, Amadori D: Mutation analysis of p53, K-ras, and BRAF genesin colorectal cancer progression. J Cell Physiol 2005, 204(2):484-488.
3. Fransen K, Klintenas M, Osterstrom A, Dimberg J, Monstein HJ, Soderkvist P:Mutation analysis of the BRAF, ARAF and RAF-1 genes in humancolorectal adenocarcinomas. Carcinogenesis 2004, 25(4):527-533.
4. Lee S, Cho NY, Choi M, Yoo EJ, Kim JH, Kang GH: Clinicopathologicalfeatures of CpG island methylator phenotype-positive colorectal cancerand its adverse prognosis in relation to KRAS/BRAF mutation. Pathol Int2008, 58(2):104-113.
Naguib et al. BMC Cancer 2010, 10:99http://www.biomedcentral.com/1471-2407/10/99
Page 9 of 11

5. Li WQ, Kawakami K, Ruszkiewicz A, Bennett G, Moore J, Iacopetta B: BRAFmutations are associated with distinctive clinical, pathological andmolecular features of colorectal cancer independently of microsatelliteinstability status. Mol Cancer 2006, 5:2.
6. Nagasaka T, Koi M, Kloor M, Gebert J, Vilkin A, Nishida N, Shin SK,Sasamoto H, Tanaka N, Matsubara N, et al: Mutations in both KRAS andBRAF may contribute to the methylator phenotype in colon cancer.Gastroenterology 2008, 134(7):1950-1960, 1960 e1951.
7. Samowitz WS, Albertsen H, Herrick J, Levin TR, Sweeney C, Murtaugh MA,Wolff RK, Slattery ML: Evaluation of a large, population-based samplesupports a CpG island methylator phenotype in colon cancer.Gastroenterology 2005, 129(3):837-845.
8. Yuen ST, Davies H, Chan TL, Ho JW, Bignell GR, Cox C, Stephens P, Edkins S,Tsui WW, Chan AS, et al: Similarity of the phenotypic patterns associatedwith BRAF and KRAS mutations in colorectal neoplasia. Cancer Res 2002,62(22):6451-6455.
9. Ogino S, Kawasaki T, Kirkner GJ, Kraft P, Loda M, Fuchs CS: Evaluation ofmarkers for CpG island methylator phenotype (CIMP) in colorectalcancer by a large population-based sample. J Mol Diagn 2007,9(3):305-314.
10. Breivik J, Lothe RA, Meling GI, Rognum TO, Borresen-Dale AL,Gaudernack G: Different genetic pathways to proximal and distalcolorectal cancer influenced by sex-related factors. Int J Cancer 1997,74(6):664-669.
11. Brink M, de Goeij AF, Weijenberg MP, Roemen GM, Lentjes MH,Pachen MM, Smits KM, de Bruine AP, Goldbohm RA, Brandt van den PA: K-ras oncogene mutations in sporadic colorectal cancer in TheNetherlands Cohort Study. Carcinogenesis 2003, 24(4):703-710.
12. Poehlmann A, Kuester D, Meyer F, Lippert H, Roessner A, Schneider-Stock R:K-ras mutation detection in colorectal cancer using the Pyrosequencingtechnique. Pathol Res Pract 2007, 203(7):489-497.
13. Samowitz WS, Curtin K, Schaffer D, Robertson M, Leppert M, Slattery ML:Relationship of Ki-ras mutations in colon cancers to tumor location,stage, and survival: a population-based study. Cancer EpidemiolBiomarkers Prev 2000, 9(11):1193-1197.
14. Slattery ML, Curtin K, Anderson K, Ma KN, Edwards S, Leppert M, Potter J,Schaffer D, Samowitz WS: Associations between dietary intake and Ki-rasmutations in colon tumors: a population-based study. Cancer Res 2000,60(24):6935-6941.
15. Smith G, Carey FA, Beattie J, Wilkie MJ, Lightfoot TJ, Coxhead J, Garner RC,Steele RJ, Wolf CR: Mutations in APC, Kirsten-ras, and p53–alternativegenetic pathways to colorectal cancer. Proc Natl Acad Sci USA 2002,99(14):9433-9438.
16. Suchy B, Zietz C, Rabes HM: K-ras point mutations in human colorectalcarcinomas: relation to aneuploidy and metastasis. Int J Cancer 1992,52(1):30-33.
17. Zhang H, Nordenskjold B, Dufmats M, Soderkvist P, Sun XF: K-ras mutationsin colorectal adenocarcinomas and neighbouring transitional mucosa.Eur J Cancer 1998, 34(13):2053-2057.
18. Rajagopalan H, Bardelli A, Lengauer C, Kinzler KW, Vogelstein B,Velculescu VE: Tumorigenesis: RAF/RAS oncogenes and mismatch-repairstatus. Nature 2002, 418(6901):934.
19. Davies H, Bignell GR, Cox C, Stephens P, Edkins S, Clegg S, Teague J,Woffendin H, Garnett MJ, Bottomley W, et al: Mutations of the BRAF genein human cancer. Nature 2002, 417(6892):949-954.
20. Vogelstein B, Fearon ER, Hamilton SR, Kern SE, Preisinger AC, Leppert M,Nakamura Y, White R, Smits AM, Bos JL: Genetic alterations duringcolorectal-tumor development. N Engl J Med 1988, 319(9):525-532.
21. Bos JL: ras oncogenes in human cancer: a review. Cancer Res 1989,49(17):4682-4689.
22. Parkin DM, Bray F, Ferlay J, Pisani P: Global cancer statistics, 2002. CACancer J Clin 2005, 55(2):74-108.
23. Cummings JH, Bingham SA: Diet and the prevention of cancer. BMJ 1998,317(7173):1636-1640.
24. Bautista D, Obrador A, Moreno V, Cabeza E, Canet R, Benito E, Bosch X,Costa J: Ki-ras mutation modifies the protective effect of dietarymonounsaturated fat and calcium on sporadic colorectal cancer. CancerEpidemiol Biomarkers Prev 1997, 6(1):57-61.
25. Weijenberg MP, Luchtenborg M, de Goeij AF, Brink M, van Muijen GN, deBruine AP, Goldbohm RA, Brandt van den PA: Dietary fat and risk of colon
and rectal cancer with aberrant MLH1 expression, APC or KRAS genes.Cancer Causes Control 2007, 18(8):865-879.
26. Slattery ML, Curtin K, Sweeney C, Levin TR, Potter J, Wolff RK, Albertsen H,Samowitz WS: Diet and lifestyle factor associations with CpG islandmethylator phenotype and BRAF mutations in colon cancer. Int J Cancer2007, 120(3):656-663.
27. Bingham SA, Welch AA, McTaggart A, Mulligan AA, Runswick SA, Luben R,Oakes S, Khaw KT, Wareham N, Day NE: Nutritional methods in theEuropean Prospective Investigation of Cancer in Norfolk. Public HealthNutr 2001, 4(3):847-858.
28. Day N, Oakes S, Luben R, Khaw KT, Bingham S, Welch A, Wareham N: EPIC-Norfolk: study design and characteristics of the cohort. EuropeanProspective Investigation of Cancer. Br J Cancer 1999, 80(Suppl 1):95-103.
29. Riboli E, Kaaks R: The EPIC Project: rationale and study design. EuropeanProspective Investigation into Cancer and Nutrition. Int J Epidemiol 1997,26(Suppl 1):S6-14.
30. Wei S, Liang Z, Gao J, Wu S, Zhu H, Liu H, Liu T: Patterns of K-ras codon12 and 13 mutations found in pancreatic adenocarcinoma of 30 Chinesepatients by microdissection, PCR and direct sequencing. J GastroenterolHepatol 2005, 20(1):67-72.
31. Ogino S, Kawasaki T, Brahmandam M, Yan L, Cantor M, Namgyal C, Mino-Kenudson M, Lauwers GY, Loda M, Fuchs CS: Sensitive sequencingmethod for KRAS mutation detection by Pyrosequencing. J Mol Diagn2005, 7(3):413-421.
32. Sargeant LA, Khaw KT, Bingham S, Day NE, Luben RN, Oakes S, Welch A,Wareham NJ: Cigarette smoking and glycaemia: the EPIC-Norfolk Study.European Prospective Investigation into Cancer. Int J Epidemiol 2001,30(3):547-554.
33. Wareham NJ, Jakes RW, Rennie KL, Schuit J, Mitchell J, Hennings S, Day NE:Validity and repeatability of a simple index derived from the shortphysical activity questionnaire used in the European ProspectiveInvestigation into Cancer and Nutrition (EPIC) study. Public Health Nutr2003, 6(4):407-413.
34. Welch AA, McTaggart A, Mulligan AA, Luben R, Walker N, Khaw KT, Day NE,Bingham SA: DINER (Data Into Nutrients for Epidemiological Research) -a new data-entry program for nutritional analysis in the EPIC-Norfolkcohort and the 7-day diary method. Public Health Nutr 2001,4(6):1253-1265.
35. Boughdady IS, Kinsella AR, Haboubi NY, Schofield PF: K-ras gene mutationsin adenomas and carcinomas of the colon. Surg Oncol 1992, 1(4):275-282.
36. Velho S, Moutinho C, Cirnes L, Albuquerque C, Hamelin R, Schmitt F,Carneiro F, Oliveira C, Seruca R: BRAF, KRAS and PIK3 CA mutations incolorectal serrated polyps and cancer: primary or secondary geneticevents in colorectal carcinogenesis? BMC Cancer 2008, 8:255.
37. Loh K, Chia JA, Greco S, Cozzi SJ, Buttenshaw RL, Bond CE, Simms LA,Pike T, Young JP, Jass JR, et al: Bone morphogenic protein 3 inactivationis an early and frequent event in colorectal cancer development. GenesChromosomes Cancer 2008, 47(6):449-460.
38. Jass JR: Colorectal cancer: a multipathway disease. Crit Rev Oncog 2006,12(3-4):273-287.
39. Ang PW, Li WQ, Soong R, Iacopetta B: BRAF mutation is associated withthe CpG island methylator phenotype in colorectal cancer from youngpatients. Cancer Lett 2009, 273(2):221-224.
40. Kambara T, Simms LA, Whitehall VL, Spring KJ, Wynter CV, Walsh MD,Barker MA, Arnold S, McGivern A, Matsubara N, et al: BRAF mutation isassociated with DNA methylation in serrated polyps and cancers of thecolorectum. Gut 2004, 53(8):1137-1144.
41. Soreide K, Slewa A, Stokkeland PJ, van Diermen B, Janssen EA, Soreide JA,Baak JP, Korner H: Microsatellite instability and DNA ploidy in colorectalcancer: potential implications for patients undergoing systematicsurveillance after resection. Cancer 2009, 115(2):271-282.
42. Deng G, Kakar S, Tanaka H, Matsuzaki K, Miura S, Sleisenger MH, Kim YS:Proximal and distal colorectal cancers show distinct gene-specificmethylation profiles and clinical and molecular characteristics. Eur JCancer 2008, 44(9):1290-1301.
43. Forrester K, Almoguera C, Han K, Grizzle WE, Perucho M: Detection of highincidence of K-ras oncogenes during human colon tumorigenesis. Nature1987, 327(6120):298-303.
44. Andreyev HJ, Norman AR, Cunningham D, Oates J, Dix BR, Iacopetta BJ,Young J, Walsh T, Ward R, Hawkins N, et al: Kirsten ras mutations in
Naguib et al. BMC Cancer 2010, 10:99http://www.biomedcentral.com/1471-2407/10/99
Page 10 of 11

patients with colorectal cancer: the ‘RASCAL II’ study. Br J Cancer 2001,85(5):692-696.
45. Lee SY, Munerol B, Pollard S, Youdim KA, Pannala AS, Kuhnle GG,Debnam ES, Rice-Evans C, Spencer JP: The reaction of flavanols withnitrous acid protects against N-nitrosamine formation and leads to theformation of nitroso derivatives which inhibit cancer cell growth. FreeRadic Biol Med 2006, 40(2):323-334.
46. Saffhill R, Margison GP, O’Connor PJ: Mechanisms of carcinogenesisinduced by alkylating agents. Biochim Biophys Acta 1985, 823(2):111-145.
47. Chan TL, Zhao W, Leung SY, Yuen ST: BRAF and KRAS mutations incolorectal hyperplastic polyps and serrated adenomas. Cancer Res 2003,63(16):4878-4881.
48. Rashid A, Zahurak M, Goodman SN, Hamilton SR: Genetic epidemiology ofmutated K-ras proto-oncogene, altered suppressor genes, andmicrosatellite instability in colorectal adenomas. Gut 1999, 44(6):826-833.
49. James RM, Arends MJ, Plowman SJ, Brooks DG, Miles CG, West JD, Patek CE:K-ras proto-oncogene exhibits tumor suppressor activity as its absencepromotes tumorigenesis in murine teratomas. Mol Cancer Res 2003,1(11):820-825.
50. Sweeney C, Boucher KM, Samowitz WS, Wolff RK, Albertsen H, Curtin K,Caan BJ, Slattery ML: Oncogenetic tree model of somatic mutations andDNA methylation in colon tumors. Genes Chromosomes Cancer 2009,48(1):1-9.
51. Day N, McKeown N, Wong M, Welch A, Bingham S: Epidemiologicalassessment of diet: a comparison of a 7-day diary with a food frequencyquestionnaire using urinary markers of nitrogen, potassium and sodium.Int J Epidemiol 2001, 30(2):309-317.
52. Nemes S, Jonasson JM, Genell A, Steineck G: Bias in odds ratios by logisticregression modelling and sample size. BMC Med Res Methodol 2009, 9:56.
Pre-publication historyThe pre-publication history for this paper can be accessed here: http://www.biomedcentral.com/1471-2407/10/99/prepub
doi:10.1186/1471-2407-10-99Cite this article as: Naguib et al.: Dietary, lifestyle andclinicopathological factors associated with BRAF and K-ras mutationsarising in distinct subsets of colorectal cancers in the EPIC Norfolkstudy. BMC Cancer 2010 10:99.
Submit your next manuscript to BioMed Centraland take full advantage of:
• Convenient online submission
• Thorough peer review
• No space constraints or color figure charges
• Immediate publication on acceptance
• Inclusion in PubMed, CAS, Scopus and Google Scholar
• Research which is freely available for redistribution
Submit your manuscript at www.biomedcentral.com/submit
Naguib et al. BMC Cancer 2010, 10:99http://www.biomedcentral.com/1471-2407/10/99
Page 11 of 11
Copyright © 2022 FDOKUMEN