Astrocyte Elevated Gene-1 as a Novel Clinicopathological and ...
Upload
independentCategory
view
0download
0
RESEARCH ARTICLE Open Access
Alterations in PTEN and PIK3CA in colorectalcancers in the EPIC Norfolk study: associationswith clinicopathological and dietary factorsAdam Naguib1, James C Cooke1, Lisa Happerfield2, Lucy Kerr2, Laura J Gay1, Robert N Luben3, Richard Y Ball4,Panagiota N Mitrou3, Alison McTaggart3 and Mark J Arends2*
Abstract
Background: The PTEN tumour suppressor gene and PIK3CA proto-oncogene encode proteins which contribute toregulation and propagation of signal transduction through the PI3K/AKT signalling pathway. This study investigatesthe prevalence of loss of PTEN expression and mutations in both PTEN and PIK3CA in colorectal cancers (CRC) andtheir associations with tumour clinicopathological features, lifestyle factors and dietary consumptions.
Methods: 186 adenocarcinomas and 16 adenomas from the EPIC Norfolk study were tested for PTEN and PIK3CAmutations by DNA sequencing and PTEN expression changes by immunohistochemistry. Dietary and lifestyle datawere collected prospectively using seven day food diaries and lifestyle questionnaires.
Results: Mutations in exons 7 and 8 of PTEN were observed in 2.2% of CRC and PTEN loss of expression wasidentified in 34.9% CRC. Negative PTEN expression was associated with lower blood low-density lipoproteinconcentrations (p = 0.05). PIK3CA mutations were observed in 7% of cancers and were more frequent in CRCs infemales (p = 0.04). Analysis of dietary intakes demonstrated no link between PTEN expression status and anyspecific dietary factor. PTEN expression negative, proximal CRC were of more advanced Dukes’ stage (p = 0.02) andpoor differentiation (p < 0.01). Testing of the prevalence of PIK3CA mutations and loss of PTEN expressiondemonstrated that these two events were independent (p = 0.55).
Conclusion: These data demonstrated the frequent occurrence (34.9%) of PTEN loss of expression in colorectalcancers, for which gene mutations do not appear to be the main cause. Furthermore, dietary factors are notassociated with loss of PTEN expression. PTEN expression negative CRC were not homogenous, as proximal cancerswere associated with a more advanced Dukes’ stage and poor differentiation, whereas distal cancers wereassociated with earlier Dukes’ stage.
BackgroundThe PI3K/AKT signalling pathway affects many cellularprocesses including cell proliferation, apoptosis and inva-sion [1]. Signal transduction through this pathway ismediated through conversion of phosphatidylinositolbisphosphate (PIP2) to phosphatidylinositol triphosphate(PIP3) by phosphatidylinositol 3 kinases (PI3K) followingtheir activation, and this reaction is antagonised by phos-phatase and tensin homolog, deleted on chromosome ten
(PTEN) activity. Of the genes which encode the enzy-matic subunit of PI3K heterodimers, the PIK3CA gene,encoding the p110∝ protein, has been found to be mostfrequently, in not exclusively, mutationally activated insome human cancers [1,2]. In colorectal cancer (CRC),PIK3CA activating mutations have been described at fre-quencies of 10-20% [3-6], with two distinct regions, thehelical and kinase domains, harbouring up to 80% ofmutations [7].The prevalence of PTEN mutations in CRC has been
reported to vary between 1% and 29% [8-13]. This varia-bility in observed PTEN mutation frequencies relates totumour genomic instability, with PTEN mutations
* Correspondence: [email protected] of Pathology, University of Cambridge, Addenbrooke’s Hospital,Cambridge CB2 0QQ, UKFull list of author information is available at the end of the article
Naguib et al. BMC Cancer 2011, 11:123http://www.biomedcentral.com/1471-2407/11/123
© 2011 Naguib et al; licensee BioMed Central Ltd. This is an Open Access article distributed under the terms of the Creative CommonsAttribution License (http://creativecommons.org/licenses/by/2.0), which permits unrestricted use, distribution, and reproduction inany medium, provided the original work is properly cited.
having been described in 14-30% of CRC with microsa-tellite instability (MSI-H) [9,14,15], but at very low fre-quencies (<5%) in unselected CRC [13]. Exons 7 and 8of PTEN have been described to acquire more muta-tions than other regions of the gene in CRC, with inser-tions and deletions of adenine bases in poly-A tractspresent in these exons being the predominant geneticchange, consistent with frequent changes in repetitivesequences in MSI-H CRC [15]. Loss of PTEN expressionhas been reported at higher frequencies than mutation[12,15] with approximately 20-40% of CRC exhibitingloss of PTEN expression [16,17].Incidence rates of colorectal cancer can vary up to 25-
fold between countries [18] and it has been postulatedthat approximately 80% of observed national differencesin incidence between can be attributed to dietary factors[19]. Although analysis of dietary components has beenperformed in relation to general colorectal cancer inci-dence, their exact relation to specific tumour suppressorgene losses and signalling pathway alterations remainsto be fully investigated. To date, analysis of dietary fac-tors in relation to PI3K/AKT pathway componentchanges in CRC has not been undertaken and little dataexists describing the type of CRC in which PIK3CAoncogenic activations and PTEN inactivation occurs.The present study aimed to investigate the relation-
ship between PTEN and PIK3CA mutations and loss ofPTEN expression in 186 colorectal adenocarcinomasfrom the EPIC Norfolk cohort and clinicopathologicalfeatures, lifestyle traits and dietary factors, as well asanalysing PTEN expression negative CRC stratified bystage and tumour location.
MethodsStudy population, microsatellite instability analysis,dietary and lifestyle assessmentExact descriptions of the study population, case ascer-tainment, methodology pertaining to dietary and lifestyledata acquisition and microsatellite instability statusassessment have been described in detail elsewhere [20].
Tissue processing and DNA extractionFormalin fixed, paraffin embedded human tissue sam-ples, biopsied from the caecum, proximal colon, distalcolon and rectum, were processed for DNA extraction.Ten, 4 μm sections were cut from each block using aMicrom HM 325 microtome (Thermo Scientific, Basing-stoke, UK). A single section of tissue from each blockwas stained and used as a template for identification ofadenocarcinoma, adenoma and normal tissue regionswithin each sample. To stain, sections underwent four,15 minute washes: two in xylene followed by 2 in 100%ethanol. Four, 5 minute sequential washes in 95%, 80%,70% and 40% ethanol, followed by rinsing in deionised
water, completed the rehydration of the section. Thesections were then immersed in Harris HaematoxylinSolution (Sigma-Aldrich, Gillingham, UK) for 30 sec-onds. Sections were then rinsed in tap water and stainedwith 1% Eosin Solution (Solmedia, Romford, UK) for 5seconds. Following a final rinse with tap water toremove excess stain, cover slips were mounted usingDePeX Mounting Medium Gurr (BDH Laboratory Sup-plies, Lutterworth, UK). Template slides were analysedby a consultant gastrointestinal histopathologist (MJA)using a light microscope and tissue regions correspond-ing to normal/tumour regions were identified andmarked on the slide. Subsequently, the remaining 9slides were dehydrated and cells from normal, adenomaor adenocarcinoma regions were carefully microdis-sected using a sterile scalpel. Tissue was collected start-ing 2 mm away from the normal/tumour tissueboundary, as indicated on the template slide, in order tominimize collection of non-tumour tissue in adenomaor adenocarcinoma samples.
DNA extractionIsolated tissue was digested in 240 μl of Buffer PKDwith 10 μl of Proteinase K (both obtained from RNEasykits, QIAGEN, Valencia, USA). Samples were agitated at150 rpm at 55°C for 4-6 days with the level of tissuedigestion checked after 3 days: those which still had visi-ble amounts of tissue had a further 10 μl of ProteinaseK added for the remainder of the incubation. Sampleswere then incubated at 80°C for 15 minutes in order topartially reverse formaldehyde modification of thenucleic acids and to denature any residual protein.These samples were then used directly, without furtherpurification, for PCR amplification.
Mutation detectionPTEN exons 7 and 8 were amplified using previouslydescribed primers [10]. PCR products were generatedusing 5 ng-2 μg of template DNA. KOD Hot Start DNAPolymerase kits (Novagen, Madison, USA) were used tomake the following reaction mixture: 2.5 μl ×10 PCRBuffer for KOD Hot Start DNA Polymerase, 1 μl pri-mers, forward and reverse (10 μM each), 1 μl MgSO4
(25 mM), 2 μl dNTPs (2 mM each), 0.25 μl KOD DNAPolymerase and made up to a total reaction volume of25 μl with nuclease free water (Promega, Madison,USA). The reactions involved a denaturation step at 94°C for 5 minutes followed by 45 cycles of 94°C for 15seconds, then 30 seconds at annealing temperatures ofeither 56°C or 54°C for PTEN exons 7 or 8 respectively,followed by extension at 72°C for 30 seconds. Lastly, afinal extension step of 72°C for 5 minutes was per-formed. PIK3CA exon 8 was amplified using primers 8F(5’-CAT AAA TTA GAT ATT TTT TAT GGC AGT
Naguib et al. BMC Cancer 2011, 11:123http://www.biomedcentral.com/1471-2407/11/123
Page 2 of 11
CAA AC-3’) and 8R (5’-GAG AAA GTA TCT ACCTAA ATC CAC AGA TTA TAA TTG-3’). PIK3CAexon 9 was amplified using primers 9F (5’-TTG CTTTTT CTG TAA ATC ATC TGT G-3’) and 9R (5’-CTGCTT TAT TTA TTC CAA TAG GTA TG-3’). PIK3CAexon 20 was amplified using previously described pri-mers [21]. The PCR was as described above for PTENexcept that annealing temperatures of 55°C were usedfor amplification of all three PIK3CA exons. To detectsuccessful amplifications, 5 μl of each reaction mixturewas separated on a 1.5% agarose gel containing 1 μg/mlethidium bromide, and visualised under UV light. Theremaining PCR amplification product mixture (20 μl)following visualisation on agarose gels was purifiedusing Multiscreen filter plates (Millipore, Billerica, USA)according to the manufacturer’s instructions and sub-jected to direct sequencing by ABI3730xl Platformsequencer (Applied Biosystems, Warrington, UK). For-ward and reverse strands were both sequenced. Everysample was PCR amplified and sequenced independentlya minimum of twice on each strand.
PTEN immunohistochemistryPTEN protein immunohistochemistry (IHC) was per-formed using the monoclonal antibody 6H2.1 (CascadeBiosciences, Winchester, USA). Blocking, addition ofsecondary antibody and washing reactions were per-formed according to the manufacturer’s instructions forthe BondMax staining system with Bond Polymer RefineDetection Reagents (Leica Microsystems, Wetzlar, Ger-many). Antigen retrieval was performed for 30 minutesat 98°C in 0.01 mol/L sodium citrate buffer at pH 6.4.Primary antibody was applied for 30 minutes at a 1:100dilution. Secondary antibody was anti-mouse IgG-HRP(8 μg/ml) and was applied for 15 minutes.PTEN protein expression was classified as negative if
over 50% of the tumour cells present demonstrated lossof expression. In order to assess PTEN expression statusin cancer cells, the PTEN expression levels in normalmucosa on the same slide were used as a reference. Dueto the difference in PTEN staining patterns betweenstromal fibroblasts, lymphoid cells and endothelial cellsin the gut, these stromal cells were used only as aninternal control to assess successful IHC staining, not asa reference for comparison with cancer cell PTENexpression levels. Instead, non-cancerous mucosa wereused to assess loss of PTEN expression in neoplasticcrypts.
Statistical analysisAnalysis of lifestyle and dietary factors, clinicopathologi-cal cancer features and patient characteristics was per-formed using chi-squared (c2) tests for categorical dataand analysis of variance (ANOVA) tests for continuous
numerical data. For these analyses, tumour sampleswere classified as PTEN expression positive or negativeand PIK3CA wildtype or mutated (in exons 8, 9 or 20).For additional testing, PTEN negative adenocarcinomaswere classified by both Dukes’ stage (early: Dukes’ stagesA or B; advanced: Dukes’ stages C or D) and indepen-dently by tumour location (proximal colonic up to thesplenic flexure, or distal colonic/rectal) and tested forassociation with dietary, lifestyle and clinicopathologicalfactors. Differentiation was determined for all cases by aconsultant histopathologist (MJA) and classified as mod-erately/well differentiated or poorly differentiated andcancers were classified as demonstrating either microsa-tellite instability (MSI) or microsatellite stable (MSS)status. Lifestyle factors, including smoking status (cur-rent/former/never), physical activity (high/low), alcoholconsumption (g/day, continuous), low-density lipopro-tein (mmol/l, continuous) and high-density lipoprotein(mmol/l, continuous) blood concentrations, triglycerideblood concentrations (mmol/l, continuous) and plasmavitamin C concentrations (μmol/l, continuous) were alsotested for association with loss of PTEN expression andPIK3CA mutations. Continuous dietary variables weretested for association with PTEN expression statusincluding meat, fruit and vegetables, fat, vitamin, fibreand macronutrients, including calcium, in their relevantunit of consumption. Additionally, PTEN expressionnegative adenocarcinomas, categorised by location andDukes’ stage, were also tested for associations with diet-ary factors. A probability value of less than or equal to0.05 was considered to be statistically significant. Noadjustment was made for multiple testing. All statisticaltesting was undertaken using SPSS version 16.0 (SPSSInc, Chicago, USA).
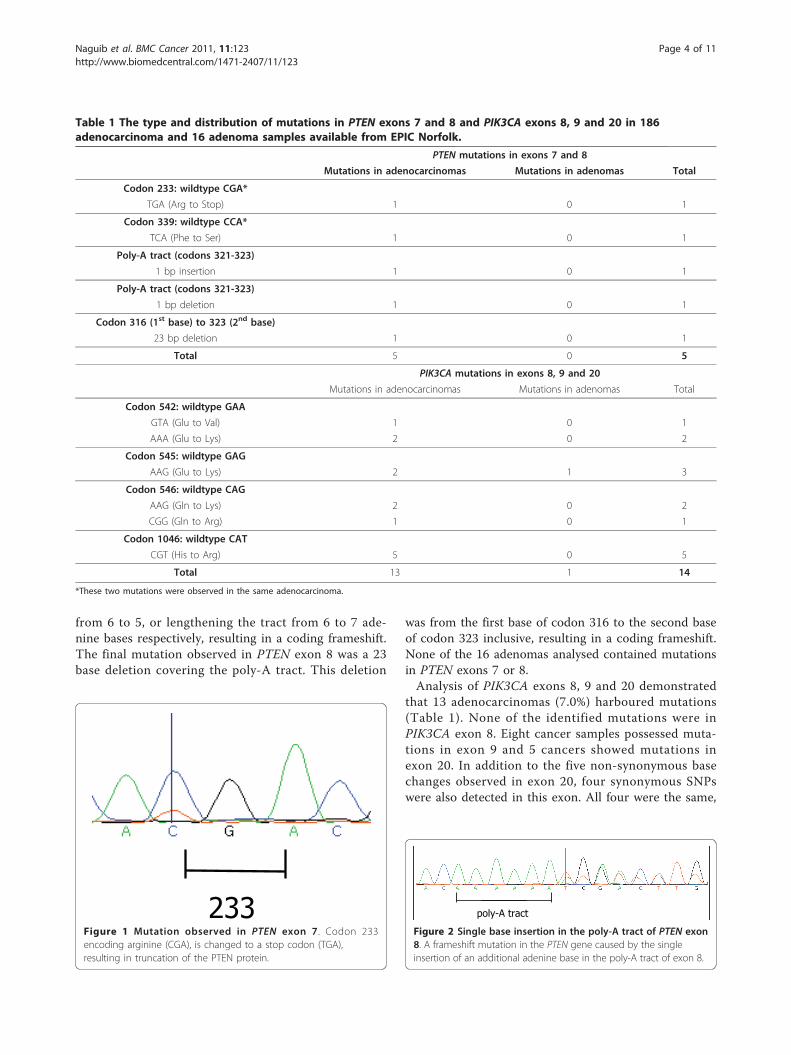
ResultsPTEN and PIK3CA mutation frequencies and PTENexpression status in colorectal adenocarcinomas andadenomasThe type and distribution of the mutations observed inPTEN and PIK3CA are described in Table 1. Of the 186adenocarcinoma samples analysed, 4 (2.2%) harbouredPTEN mutations in exons 7 or 8. One sample had muta-tions in both exons 7 and 8. Three samples showedmutations in exon 8 only. The mutation in exon 7 was aC to T transition which resulted in codon 233 of theprotein, arginine (CGA), being converted to a stopcodon (TGA) (Figure 1). This same cancer had a muta-tion in exon 8: a C to T transition changing codon 339(CCA) phenylalanine to serine (TCA). The remainingthree cancers harboured changes in PTEN exon 8, all ofwhich involved changes in the poly-A tract (codons321-323). These were either a single base deletion or asingle base insertion (Figure 2), shortening the tract
Naguib et al. BMC Cancer 2011, 11:123http://www.biomedcentral.com/1471-2407/11/123
Page 3 of 11
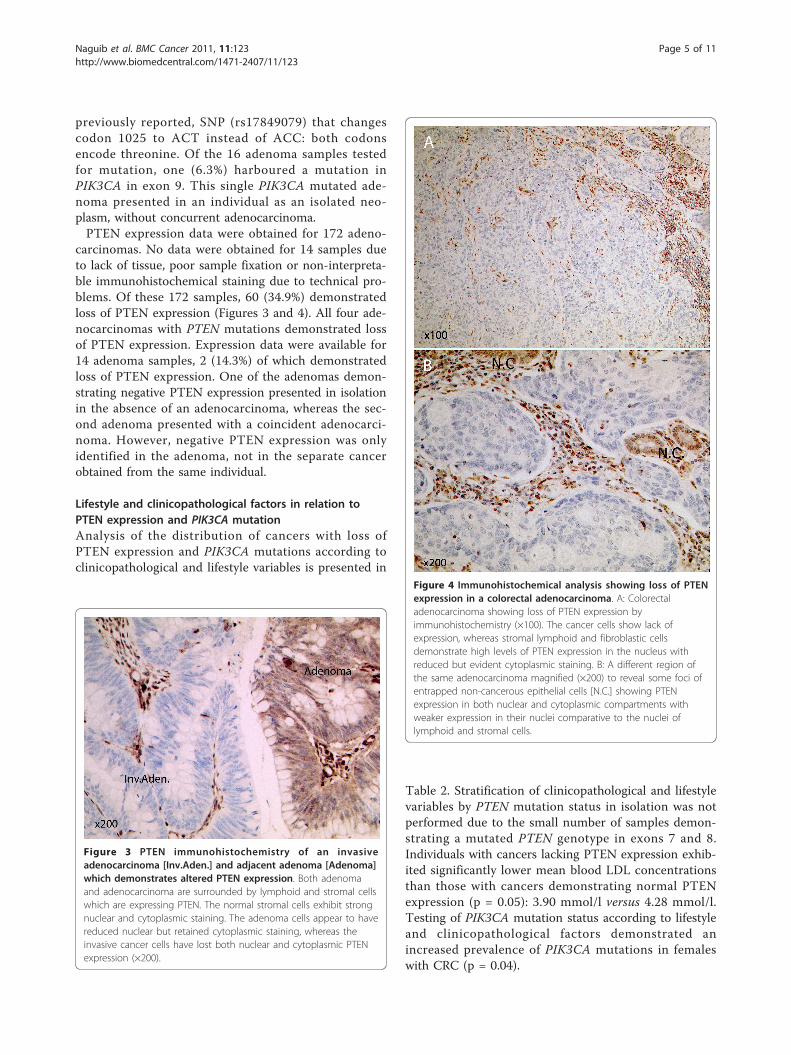
from 6 to 5, or lengthening the tract from 6 to 7 ade-nine bases respectively, resulting in a coding frameshift.The final mutation observed in PTEN exon 8 was a 23base deletion covering the poly-A tract. This deletion
was from the first base of codon 316 to the second baseof codon 323 inclusive, resulting in a coding frameshift.None of the 16 adenomas analysed contained mutationsin PTEN exons 7 or 8.Analysis of PIK3CA exons 8, 9 and 20 demonstrated
that 13 adenocarcinomas (7.0%) harboured mutations(Table 1). None of the identified mutations were inPIK3CA exon 8. Eight cancer samples possessed muta-tions in exon 9 and 5 cancers showed mutations inexon 20. In addition to the five non-synonymous basechanges observed in exon 20, four synonymous SNPswere also detected in this exon. All four were the same,
Table 1 The type and distribution of mutations in PTEN exons 7 and 8 and PIK3CA exons 8, 9 and 20 in 186adenocarcinoma and 16 adenoma samples available from EPIC Norfolk.
PTEN mutations in exons 7 and 8
Mutations in adenocarcinomas Mutations in adenomas Total
Codon 233: wildtype CGA*
TGA (Arg to Stop) 1 0 1
Codon 339: wildtype CCA*
TCA (Phe to Ser) 1 0 1
Poly-A tract (codons 321-323)
1 bp insertion 1 0 1
Poly-A tract (codons 321-323)
1 bp deletion 1 0 1
Codon 316 (1st base) to 323 (2nd base)
23 bp deletion 1 0 1
Total 5 0 5
PIK3CA mutations in exons 8, 9 and 20
Mutations in adenocarcinomas Mutations in adenomas Total
Codon 542: wildtype GAA
GTA (Glu to Val) 1 0 1
AAA (Glu to Lys) 2 0 2
Codon 545: wildtype GAG
AAG (Glu to Lys) 2 1 3
Codon 546: wildtype CAG
AAG (Gln to Lys) 2 0 2
CGG (Gln to Arg) 1 0 1
Codon 1046: wildtype CAT
CGT (His to Arg) 5 0 5
Total 13 1 14
*These two mutations were observed in the same adenocarcinoma.
233Figure 1 Mutation observed in PTEN exon 7 . Codon 233encoding arginine (CGA), is changed to a stop codon (TGA),resulting in truncation of the PTEN protein.
poly-A tract
Figure 2 Single base insertion in the poly-A tract of PTEN exon8. A frameshift mutation in the PTEN gene caused by the singleinsertion of an additional adenine base in the poly-A tract of exon 8.
Naguib et al. BMC Cancer 2011, 11:123http://www.biomedcentral.com/1471-2407/11/123
Page 4 of 11
previously reported, SNP (rs17849079) that changescodon 1025 to ACT instead of ACC: both codonsencode threonine. Of the 16 adenoma samples testedfor mutation, one (6.3%) harboured a mutation inPIK3CA in exon 9. This single PIK3CA mutated ade-noma presented in an individual as an isolated neo-plasm, without concurrent adenocarcinoma.PTEN expression data were obtained for 172 adeno-
carcinomas. No data were obtained for 14 samples dueto lack of tissue, poor sample fixation or non-interpreta-ble immunohistochemical staining due to technical pro-blems. Of these 172 samples, 60 (34.9%) demonstratedloss of PTEN expression (Figures 3 and 4). All four ade-nocarcinomas with PTEN mutations demonstrated lossof PTEN expression. Expression data were available for14 adenoma samples, 2 (14.3%) of which demonstratedloss of PTEN expression. One of the adenomas demon-strating negative PTEN expression presented in isolationin the absence of an adenocarcinoma, whereas the sec-ond adenoma presented with a coincident adenocarci-noma. However, negative PTEN expression was onlyidentified in the adenoma, not in the separate cancerobtained from the same individual.
Lifestyle and clinicopathological factors in relation toPTEN expression and PIK3CA mutationAnalysis of the distribution of cancers with loss ofPTEN expression and PIK3CA mutations according toclinicopathological and lifestyle variables is presented in
Table 2. Stratification of clinicopathological and lifestylevariables by PTEN mutation status in isolation was notperformed due to the small number of samples demon-strating a mutated PTEN genotype in exons 7 and 8.Individuals with cancers lacking PTEN expression exhib-ited significantly lower mean blood LDL concentrationsthan those with cancers demonstrating normal PTENexpression (p = 0.05): 3.90 mmol/l versus 4.28 mmol/l.Testing of PIK3CA mutation status according to lifestyleand clinicopathological factors demonstrated anincreased prevalence of PIK3CA mutations in femaleswith CRC (p = 0.04).
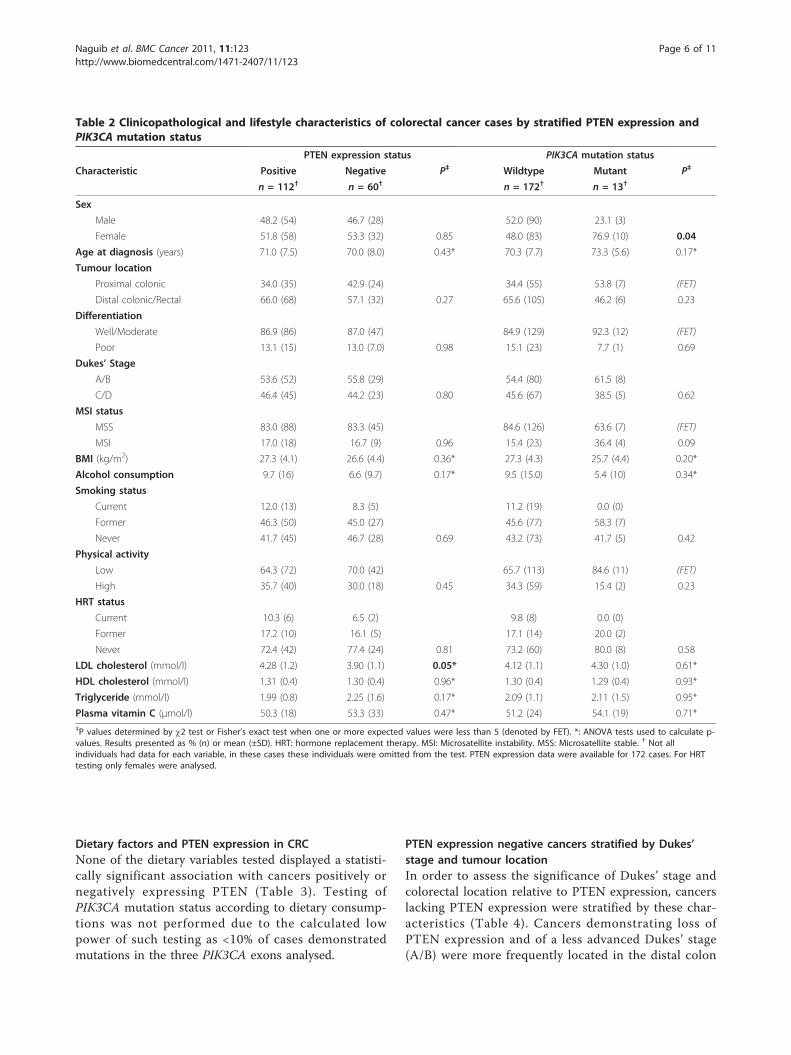
Figure 3 PTEN immunohistochemistry of an invasiveadenocarcinoma [Inv.Aden.] and adjacent adenoma [Adenoma]which demonstrates altered PTEN expression. Both adenomaand adenocarcinoma are surrounded by lymphoid and stromal cellswhich are expressing PTEN. The normal stromal cells exhibit strongnuclear and cytoplasmic staining. The adenoma cells appear to havereduced nuclear but retained cytoplasmic staining, whereas theinvasive cancer cells have lost both nuclear and cytoplasmic PTENexpression (×200).
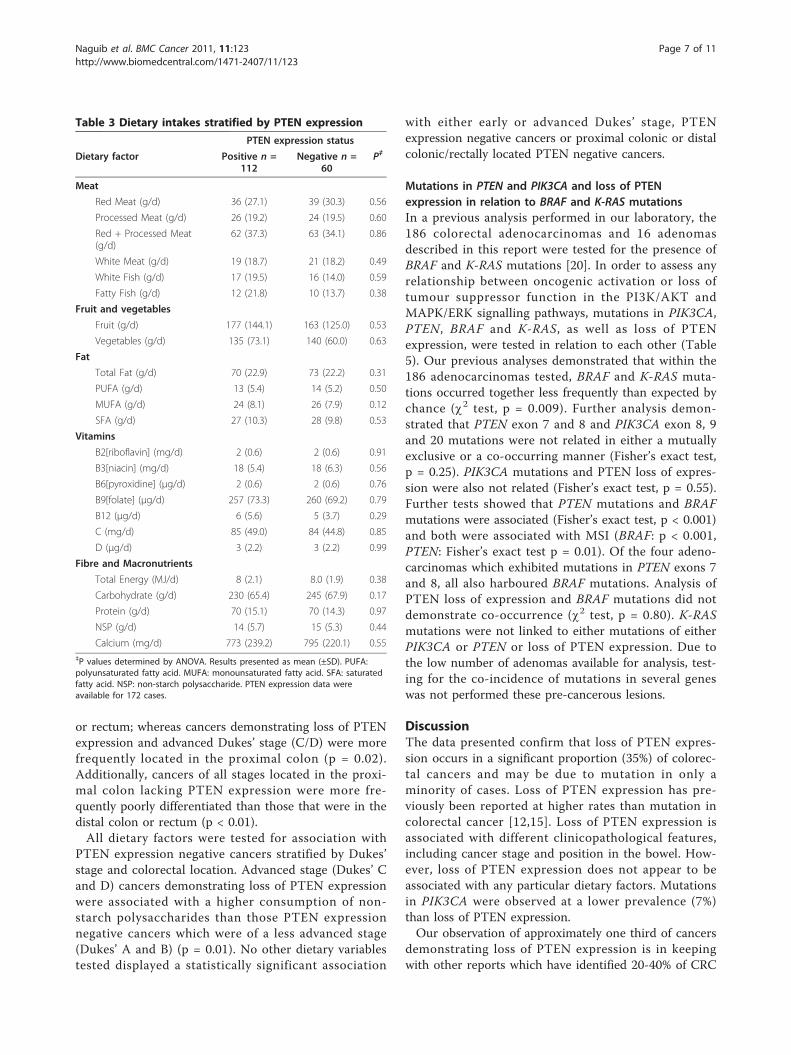
Figure 4 Immunohistochemical analysis showing loss of PTENexpression in a colorectal adenocarcinoma. A: Colorectaladenocarcinoma showing loss of PTEN expression byimmunohistochemistry (×100). The cancer cells show lack ofexpression, whereas stromal lymphoid and fibroblastic cellsdemonstrate high levels of PTEN expression in the nucleus withreduced but evident cytoplasmic staining. B: A different region ofthe same adenocarcinoma magnified (×200) to reveal some foci ofentrapped non-cancerous epithelial cells [N.C.] showing PTENexpression in both nuclear and cytoplasmic compartments withweaker expression in their nuclei comparative to the nuclei oflymphoid and stromal cells.
Naguib et al. BMC Cancer 2011, 11:123http://www.biomedcentral.com/1471-2407/11/123
Page 5 of 11
Dietary factors and PTEN expression in CRCNone of the dietary variables tested displayed a statisti-cally significant association with cancers positively ornegatively expressing PTEN (Table 3). Testing ofPIK3CA mutation status according to dietary consump-tions was not performed due to the calculated lowpower of such testing as <10% of cases demonstratedmutations in the three PIK3CA exons analysed.
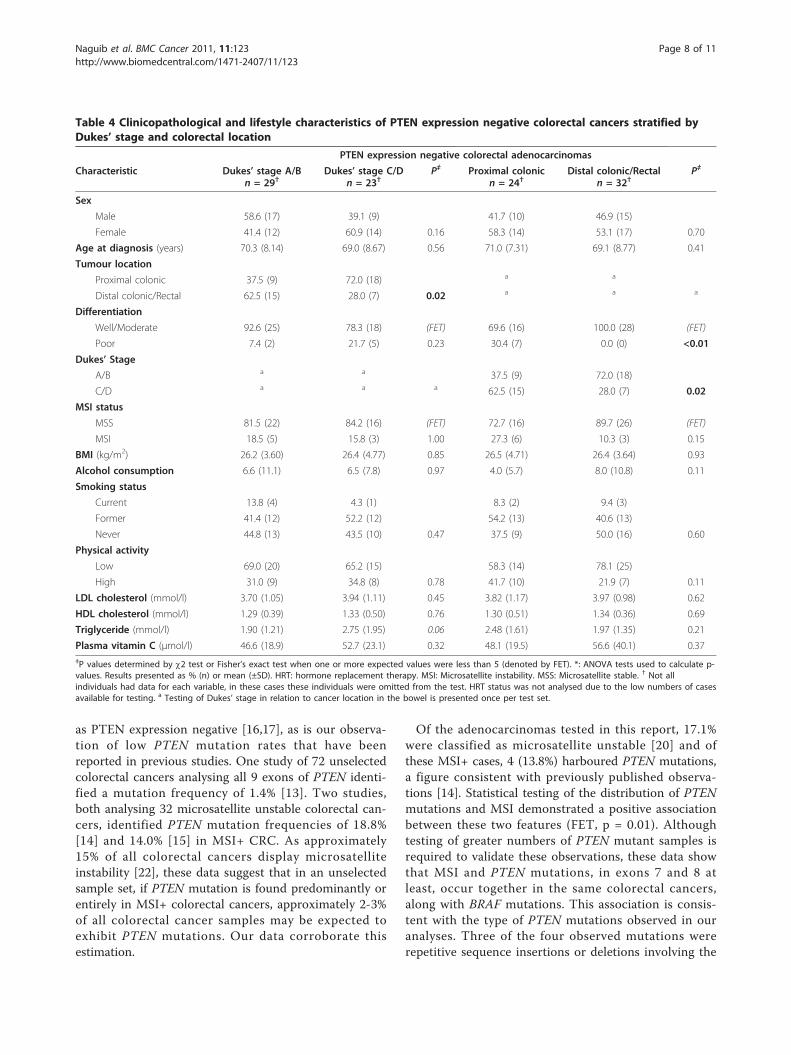
PTEN expression negative cancers stratified by Dukes’stage and tumour locationIn order to assess the significance of Dukes’ stage andcolorectal location relative to PTEN expression, cancerslacking PTEN expression were stratified by these char-acteristics (Table 4). Cancers demonstrating loss ofPTEN expression and of a less advanced Dukes’ stage(A/B) were more frequently located in the distal colon
Table 2 Clinicopathological and lifestyle characteristics of colorectal cancer cases by stratified PTEN expression andPIK3CA mutation status
PTEN expression status PIK3CA mutation status
Characteristic Positive Negative P‡ Wildtype Mutant P‡
n = 112† n = 60† n = 172† n = 13†
Sex
Male 48.2 (54) 46.7 (28) 52.0 (90) 23.1 (3)
Female 51.8 (58) 53.3 (32) 0.85 48.0 (83) 76.9 (10) 0.04
Age at diagnosis (years) 71.0 (7.5) 70.0 (8.0) 0.43* 70.3 (7.7) 73.3 (5.6) 0.17*
Tumour location
Proximal colonic 34.0 (35) 42.9 (24) 34.4 (55) 53.8 (7) (FET)
Distal colonic/Rectal 66.0 (68) 57.1 (32) 0.27 65.6 (105) 46.2 (6) 0.23
Differentiation
Well/Moderate 86.9 (86) 87.0 (47) 84.9 (129) 92.3 (12) (FET)
Poor 13.1 (15) 13.0 (7.0) 0.98 15.1 (23) 7.7 (1) 0.69
Dukes’ Stage
A/B 53.6 (52) 55.8 (29) 54.4 (80) 61.5 (8)
C/D 46.4 (45) 44.2 (23) 0.80 45.6 (67) 38.5 (5) 0.62
MSI status
MSS 83.0 (88) 83.3 (45) 84.6 (126) 63.6 (7) (FET)
MSI 17.0 (18) 16.7 (9) 0.96 15.4 (23) 36.4 (4) 0.09
BMI (kg/m2) 27.3 (4.1) 26.6 (4.4) 0.36* 27.3 (4.3) 25.7 (4.4) 0.20*
Alcohol consumption 9.7 (16) 6.6 (9.7) 0.17* 9.5 (15.0) 5.4 (10) 0.34*
Smoking status
Current 12.0 (13) 8.3 (5) 11.2 (19) 0.0 (0)
Former 46.3 (50) 45.0 (27) 45.6 (77) 58.3 (7)
Never 41.7 (45) 46.7 (28) 0.69 43.2 (73) 41.7 (5) 0.42
Physical activity
Low 64.3 (72) 70.0 (42) 65.7 (113) 84.6 (11) (FET)
High 35.7 (40) 30.0 (18) 0.45 34.3 (59) 15.4 (2) 0.23
HRT status
Current 10.3 (6) 6.5 (2) 9.8 (8) 0.0 (0)
Former 17.2 (10) 16.1 (5) 17.1 (14) 20.0 (2)
Never 72.4 (42) 77.4 (24) 0.81 73.2 (60) 80.0 (8) 0.58
LDL cholesterol (mmol/l) 4.28 (1.2) 3.90 (1.1) 0.05* 4.12 (1.1) 4.30 (1.0) 0.61*
HDL cholesterol (mmol/l) 1.31 (0.4) 1.30 (0.4) 0.96* 1.30 (0.4) 1.29 (0.4) 0.93*
Triglyceride (mmol/l) 1.99 (0.8) 2.25 (1.6) 0.17* 2.09 (1.1) 2.11 (1.5) 0.95*
Plasma vitamin C (μmol/l) 50.3 (18) 53.3 (33) 0.47* 51.2 (24) 54.1 (19) 0.71*‡P values determined by c2 test or Fisher’s exact test when one or more expected values were less than 5 (denoted by FET). *: ANOVA tests used to calculate p-values. Results presented as % (n) or mean (±SD). HRT: hormone replacement therapy. MSI: Microsatellite instability. MSS: Microsatellite stable. † Not allindividuals had data for each variable, in these cases these individuals were omitted from the test. PTEN expression data were available for 172 cases. For HRTtesting only females were analysed.
Naguib et al. BMC Cancer 2011, 11:123http://www.biomedcentral.com/1471-2407/11/123
Page 6 of 11
or rectum; whereas cancers demonstrating loss of PTENexpression and advanced Dukes’ stage (C/D) were morefrequently located in the proximal colon (p = 0.02).Additionally, cancers of all stages located in the proxi-mal colon lacking PTEN expression were more fre-quently poorly differentiated than those that were in thedistal colon or rectum (p < 0.01).All dietary factors were tested for association with
PTEN expression negative cancers stratified by Dukes’stage and colorectal location. Advanced stage (Dukes’ Cand D) cancers demonstrating loss of PTEN expressionwere associated with a higher consumption of non-starch polysaccharides than those PTEN expressionnegative cancers which were of a less advanced stage(Dukes’ A and B) (p = 0.01). No other dietary variablestested displayed a statistically significant association
with either early or advanced Dukes’ stage, PTENexpression negative cancers or proximal colonic or distalcolonic/rectally located PTEN negative cancers.
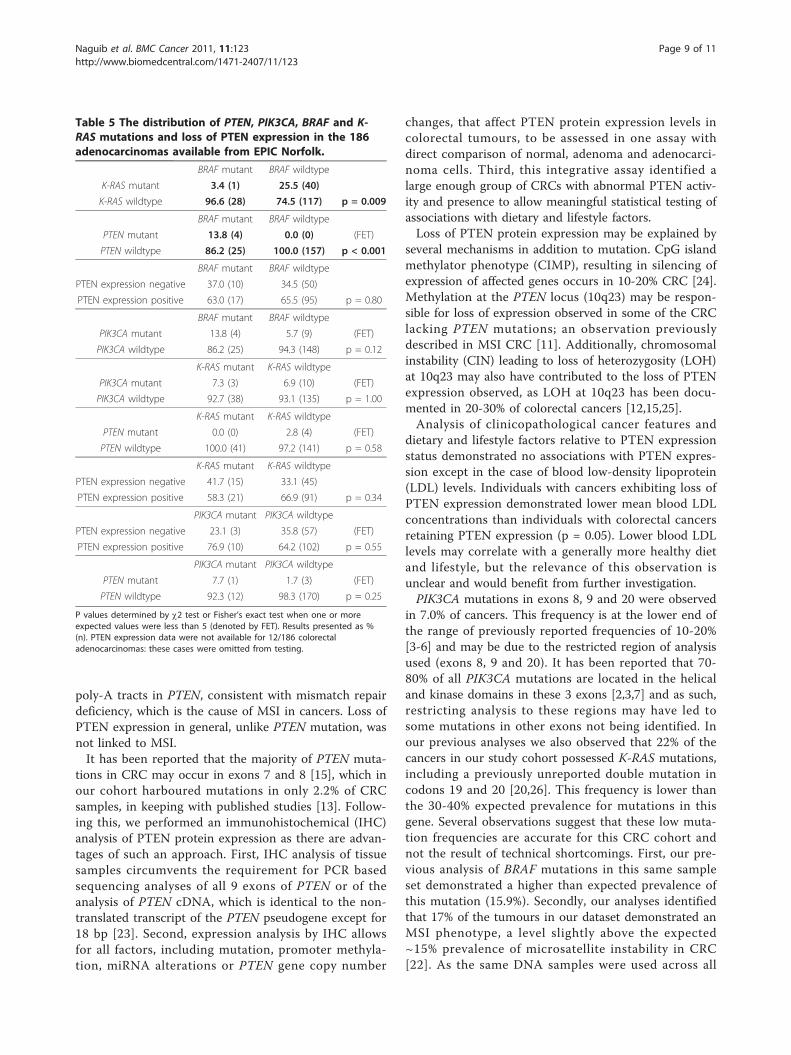
Mutations in PTEN and PIK3CA and loss of PTENexpression in relation to BRAF and K-RAS mutationsIn a previous analysis performed in our laboratory, the186 colorectal adenocarcinomas and 16 adenomasdescribed in this report were tested for the presence ofBRAF and K-RAS mutations [20]. In order to assess anyrelationship between oncogenic activation or loss oftumour suppressor function in the PI3K/AKT andMAPK/ERK signalling pathways, mutations in PIK3CA,PTEN, BRAF and K-RAS, as well as loss of PTENexpression, were tested in relation to each other (Table5). Our previous analyses demonstrated that within the186 adenocarcinomas tested, BRAF and K-RAS muta-tions occurred together less frequently than expected bychance (c2 test, p = 0.009). Further analysis demon-strated that PTEN exon 7 and 8 and PIK3CA exon 8, 9and 20 mutations were not related in either a mutuallyexclusive or a co-occurring manner (Fisher’s exact test,p = 0.25). PIK3CA mutations and PTEN loss of expres-sion were also not related (Fisher’s exact test, p = 0.55).Further tests showed that PTEN mutations and BRAFmutations were associated (Fisher’s exact test, p < 0.001)and both were associated with MSI (BRAF: p < 0.001,PTEN: Fisher’s exact test p = 0.01). Of the four adeno-carcinomas which exhibited mutations in PTEN exons 7and 8, all also harboured BRAF mutations. Analysis ofPTEN loss of expression and BRAF mutations did notdemonstrate co-occurrence (c2 test, p = 0.80). K-RASmutations were not linked to either mutations of eitherPIK3CA or PTEN or loss of PTEN expression. Due tothe low number of adenomas available for analysis, test-ing for the co-incidence of mutations in several geneswas not performed these pre-cancerous lesions.
DiscussionThe data presented confirm that loss of PTEN expres-sion occurs in a significant proportion (35%) of colorec-tal cancers and may be due to mutation in only aminority of cases. Loss of PTEN expression has pre-viously been reported at higher rates than mutation incolorectal cancer [12,15]. Loss of PTEN expression isassociated with different clinicopathological features,including cancer stage and position in the bowel. How-ever, loss of PTEN expression does not appear to beassociated with any particular dietary factors. Mutationsin PIK3CA were observed at a lower prevalence (7%)than loss of PTEN expression.Our observation of approximately one third of cancers
demonstrating loss of PTEN expression is in keepingwith other reports which have identified 20-40% of CRC
Table 3 Dietary intakes stratified by PTEN expression
PTEN expression status
Dietary factor Positive n =112
Negative n =60
P‡
Meat
Red Meat (g/d) 36 (27.1) 39 (30.3) 0.56
Processed Meat (g/d) 26 (19.2) 24 (19.5) 0.60
Red + Processed Meat(g/d)
62 (37.3) 63 (34.1) 0.86
White Meat (g/d) 19 (18.7) 21 (18.2) 0.49
White Fish (g/d) 17 (19.5) 16 (14.0) 0.59
Fatty Fish (g/d) 12 (21.8) 10 (13.7) 0.38
Fruit and vegetables
Fruit (g/d) 177 (144.1) 163 (125.0) 0.53
Vegetables (g/d) 135 (73.1) 140 (60.0) 0.63
Fat
Total Fat (g/d) 70 (22.9) 73 (22.2) 0.31
PUFA (g/d) 13 (5.4) 14 (5.2) 0.50
MUFA (g/d) 24 (8.1) 26 (7.9) 0.12
SFA (g/d) 27 (10.3) 28 (9.8) 0.53
Vitamins
B2[riboflavin] (mg/d) 2 (0.6) 2 (0.6) 0.91
B3[niacin] (mg/d) 18 (5.4) 18 (6.3) 0.56
B6[pyroxidine] (μg/d) 2 (0.6) 2 (0.6) 0.76
B9[folate] (μg/d) 257 (73.3) 260 (69.2) 0.79
B12 (μg/d) 6 (5.6) 5 (3.7) 0.29
C (mg/d) 85 (49.0) 84 (44.8) 0.85
D (μg/d) 3 (2.2) 3 (2.2) 0.99
Fibre and Macronutrients
Total Energy (MJ/d) 8 (2.1) 8.0 (1.9) 0.38
Carbohydrate (g/d) 230 (65.4) 245 (67.9) 0.17
Protein (g/d) 70 (15.1) 70 (14.3) 0.97
NSP (g/d) 14 (5.7) 15 (5.3) 0.44
Calcium (mg/d) 773 (239.2) 795 (220.1) 0.55‡P values determined by ANOVA. Results presented as mean (±SD). PUFA:polyunsaturated fatty acid. MUFA: monounsaturated fatty acid. SFA: saturatedfatty acid. NSP: non-starch polysaccharide. PTEN expression data wereavailable for 172 cases.
Naguib et al. BMC Cancer 2011, 11:123http://www.biomedcentral.com/1471-2407/11/123
Page 7 of 11
as PTEN expression negative [16,17], as is our observa-tion of low PTEN mutation rates that have beenreported in previous studies. One study of 72 unselectedcolorectal cancers analysing all 9 exons of PTEN identi-fied a mutation frequency of 1.4% [13]. Two studies,both analysing 32 microsatellite unstable colorectal can-cers, identified PTEN mutation frequencies of 18.8%[14] and 14.0% [15] in MSI+ CRC. As approximately15% of all colorectal cancers display microsatelliteinstability [22], these data suggest that in an unselectedsample set, if PTEN mutation is found predominantly orentirely in MSI+ colorectal cancers, approximately 2-3%of all colorectal cancer samples may be expected toexhibit PTEN mutations. Our data corroborate thisestimation.
Of the adenocarcinomas tested in this report, 17.1%were classified as microsatellite unstable [20] and ofthese MSI+ cases, 4 (13.8%) harboured PTEN mutations,a figure consistent with previously published observa-tions [14]. Statistical testing of the distribution of PTENmutations and MSI demonstrated a positive associationbetween these two features (FET, p = 0.01). Althoughtesting of greater numbers of PTEN mutant samples isrequired to validate these observations, these data showthat MSI and PTEN mutations, in exons 7 and 8 atleast, occur together in the same colorectal cancers,along with BRAF mutations. This association is consis-tent with the type of PTEN mutations observed in ouranalyses. Three of the four observed mutations wererepetitive sequence insertions or deletions involving the
Table 4 Clinicopathological and lifestyle characteristics of PTEN expression negative colorectal cancers stratified byDukes’ stage and colorectal location
PTEN expression negative colorectal adenocarcinomas
Characteristic Dukes’ stage A/Bn = 29†
Dukes’ stage C/Dn = 23†
P‡ Proximal colonicn = 24†
Distal colonic/Rectaln = 32†
P‡
Sex
Male 58.6 (17) 39.1 (9) 41.7 (10) 46.9 (15)
Female 41.4 (12) 60.9 (14) 0.16 58.3 (14) 53.1 (17) 0.70
Age at diagnosis (years) 70.3 (8.14) 69.0 (8.67) 0.56 71.0 (7.31) 69.1 (8.77) 0.41
Tumour location
Proximal colonic 37.5 (9) 72.0 (18) a a
Distal colonic/Rectal 62.5 (15) 28.0 (7) 0.02 a a a
Differentiation
Well/Moderate 92.6 (25) 78.3 (18) (FET) 69.6 (16) 100.0 (28) (FET)
Poor 7.4 (2) 21.7 (5) 0.23 30.4 (7) 0.0 (0) <0.01
Dukes’ Stage
A/B a a 37.5 (9) 72.0 (18)
C/D a a a 62.5 (15) 28.0 (7) 0.02
MSI status
MSS 81.5 (22) 84.2 (16) (FET) 72.7 (16) 89.7 (26) (FET)
MSI 18.5 (5) 15.8 (3) 1.00 27.3 (6) 10.3 (3) 0.15
BMI (kg/m2) 26.2 (3.60) 26.4 (4.77) 0.85 26.5 (4.71) 26.4 (3.64) 0.93
Alcohol consumption 6.6 (11.1) 6.5 (7.8) 0.97 4.0 (5.7) 8.0 (10.8) 0.11
Smoking status
Current 13.8 (4) 4.3 (1) 8.3 (2) 9.4 (3)
Former 41.4 (12) 52.2 (12) 54.2 (13) 40.6 (13)
Never 44.8 (13) 43.5 (10) 0.47 37.5 (9) 50.0 (16) 0.60
Physical activity
Low 69.0 (20) 65.2 (15) 58.3 (14) 78.1 (25)
High 31.0 (9) 34.8 (8) 0.78 41.7 (10) 21.9 (7) 0.11
LDL cholesterol (mmol/l) 3.70 (1.05) 3.94 (1.11) 0.45 3.82 (1.17) 3.97 (0.98) 0.62
HDL cholesterol (mmol/l) 1.29 (0.39) 1.33 (0.50) 0.76 1.30 (0.51) 1.34 (0.36) 0.69
Triglyceride (mmol/l) 1.90 (1.21) 2.75 (1.95) 0.06 2.48 (1.61) 1.97 (1.35) 0.21
Plasma vitamin C (μmol/l) 46.6 (18.9) 52.7 (23.1) 0.32 48.1 (19.5) 56.6 (40.1) 0.37‡P values determined by c2 test or Fisher’s exact test when one or more expected values were less than 5 (denoted by FET). *: ANOVA tests used to calculate p-values. Results presented as % (n) or mean (±SD). HRT: hormone replacement therapy. MSI: Microsatellite instability. MSS: Microsatellite stable. † Not allindividuals had data for each variable, in these cases these individuals were omitted from the test. HRT status was not analysed due to the low numbers of casesavailable for testing. a Testing of Dukes’ stage in relation to cancer location in the bowel is presented once per test set.
Naguib et al. BMC Cancer 2011, 11:123http://www.biomedcentral.com/1471-2407/11/123
Page 8 of 11
poly-A tracts in PTEN, consistent with mismatch repairdeficiency, which is the cause of MSI in cancers. Loss ofPTEN expression in general, unlike PTEN mutation, wasnot linked to MSI.It has been reported that the majority of PTEN muta-
tions in CRC may occur in exons 7 and 8 [15], which inour cohort harboured mutations in only 2.2% of CRCsamples, in keeping with published studies [13]. Follow-ing this, we performed an immunohistochemical (IHC)analysis of PTEN protein expression as there are advan-tages of such an approach. First, IHC analysis of tissuesamples circumvents the requirement for PCR basedsequencing analyses of all 9 exons of PTEN or of theanalysis of PTEN cDNA, which is identical to the non-translated transcript of the PTEN pseudogene except for18 bp [23]. Second, expression analysis by IHC allowsfor all factors, including mutation, promoter methyla-tion, miRNA alterations or PTEN gene copy number
changes, that affect PTEN protein expression levels incolorectal tumours, to be assessed in one assay withdirect comparison of normal, adenoma and adenocarci-noma cells. Third, this integrative assay identified alarge enough group of CRCs with abnormal PTEN activ-ity and presence to allow meaningful statistical testing ofassociations with dietary and lifestyle factors.Loss of PTEN protein expression may be explained by
several mechanisms in addition to mutation. CpG islandmethylator phenotype (CIMP), resulting in silencing ofexpression of affected genes occurs in 10-20% CRC [24].Methylation at the PTEN locus (10q23) may be respon-sible for loss of expression observed in some of the CRClacking PTEN mutations; an observation previouslydescribed in MSI CRC [11]. Additionally, chromosomalinstability (CIN) leading to loss of heterozygosity (LOH)at 10q23 may also have contributed to the loss of PTENexpression observed, as LOH at 10q23 has been docu-mented in 20-30% of colorectal cancers [12,15,25].Analysis of clinicopathological cancer features and
dietary and lifestyle factors relative to PTEN expressionstatus demonstrated no associations with PTEN expres-sion except in the case of blood low-density lipoprotein(LDL) levels. Individuals with cancers exhibiting loss ofPTEN expression demonstrated lower mean blood LDLconcentrations than individuals with colorectal cancersretaining PTEN expression (p = 0.05). Lower blood LDLlevels may correlate with a generally more healthy dietand lifestyle, but the relevance of this observation isunclear and would benefit from further investigation.PIK3CA mutations in exons 8, 9 and 20 were observed
in 7.0% of cancers. This frequency is at the lower end ofthe range of previously reported frequencies of 10-20%[3-6] and may be due to the restricted region of analysisused (exons 8, 9 and 20). It has been reported that 70-80% of all PIK3CA mutations are located in the helicaland kinase domains in these 3 exons [2,3,7] and as such,restricting analysis to these regions may have led tosome mutations in other exons not being identified. Inour previous analyses we also observed that 22% of thecancers in our study cohort possessed K-RAS mutations,including a previously unreported double mutation incodons 19 and 20 [20,26]. This frequency is lower thanthe 30-40% expected prevalence for mutations in thisgene. Several observations suggest that these low muta-tion frequencies are accurate for this CRC cohort andnot the result of technical shortcomings. First, our pre-vious analysis of BRAF mutations in this same sampleset demonstrated a higher than expected prevalence ofthis mutation (15.9%). Secondly, our analyses identifiedthat 17% of the tumours in our dataset demonstrated anMSI phenotype, a level slightly above the expected~15% prevalence of microsatellite instability in CRC[22]. As the same DNA samples were used across all
Table 5 The distribution of PTEN, PIK3CA, BRAF and K-RAS mutations and loss of PTEN expression in the 186adenocarcinomas available from EPIC Norfolk.
BRAF mutant BRAF wildtype
K-RAS mutant 3.4 (1) 25.5 (40)
K-RAS wildtype 96.6 (28) 74.5 (117) p = 0.009
BRAF mutant BRAF wildtype
PTEN mutant 13.8 (4) 0.0 (0) (FET)
PTEN wildtype 86.2 (25) 100.0 (157) p < 0.001
BRAF mutant BRAF wildtype
PTEN expression negative 37.0 (10) 34.5 (50)
PTEN expression positive 63.0 (17) 65.5 (95) p = 0.80
BRAF mutant BRAF wildtype
PIK3CA mutant 13.8 (4) 5.7 (9) (FET)
PIK3CA wildtype 86.2 (25) 94.3 (148) p = 0.12
K-RAS mutant K-RAS wildtype
PIK3CA mutant 7.3 (3) 6.9 (10) (FET)
PIK3CA wildtype 92.7 (38) 93.1 (135) p = 1.00
K-RAS mutant K-RAS wildtype
PTEN mutant 0.0 (0) 2.8 (4) (FET)
PTEN wildtype 100.0 (41) 97.2 (141) p = 0.58
K-RAS mutant K-RAS wildtype
PTEN expression negative 41.7 (15) 33.1 (45)
PTEN expression positive 58.3 (21) 66.9 (91) p = 0.34
PIK3CA mutant PIK3CA wildtype
PTEN expression negative 23.1 (3) 35.8 (57) (FET)
PTEN expression positive 76.9 (10) 64.2 (102) p = 0.55
PIK3CA mutant PIK3CA wildtype
PTEN mutant 7.7 (1) 1.7 (3) (FET)
PTEN wildtype 92.3 (12) 98.3 (170) p = 0.25
P values determined by c2 test or Fisher’s exact test when one or moreexpected values were less than 5 (denoted by FET). Results presented as %(n). PTEN expression data were not available for 12/186 colorectaladenocarcinomas: these cases were omitted from testing.
Naguib et al. BMC Cancer 2011, 11:123http://www.biomedcentral.com/1471-2407/11/123
Page 9 of 11
analyses, these observations suggest that the observedlow mutation frequencies in PIK3CA and K-RAS are acharacteristic of this study cohort.Fewer than 10% of samples demonstrated PIK3CA
mutations, therefore analysis of dietary factors was notperformed due to the calculated low power of the statis-tical testing. PIK3CA mutations were more frequent inCRC from females (p = 0.04). This has been demon-strated previously in another report analysing a Cauca-sian European population (Italian) [4], but not in astudy of a Middle Eastern population [3]. These discre-pancies in analyses of different population types maysuggest a correlation between local environment, dietand PIK3CA mutation.Analysis of PTEN expression negative tumours strati-
fied by location demonstrated that proximally locatedcancers were more frequently of advanced Dukes’ stageand distal colonic/rectal cancers were more frequentlyof less advanced Dukes’ stage (p = 0.02). Additionally,proximal cancers lacking PTEN expression were asso-ciated with poor differentiation (p < 0.01). Stratificationof PTEN negative cancers by stage and location alsoidentified an increased mean non-starch polysaccharideconsumption in those individuals with advanced stagecancers lacking PTEN expression (p = 0.01). This poten-tially interesting observation requires confirmation infuture larger studies. Taken together, these data demon-strate the heterogeneity in the associations of cancerslacking PTEN expression: loss of PTEN expression incolorectal cancers of different locations have distinctclinicopathological features and potential dietaryassociations.Analysis of co-occurrences of mutations in the PI3K
and MAPK signalling pathways demonstrated thatunlike BRAF and K-RAS mutations, acting as mutuallyexclusive mechanisms of activation of the same signal-ling pathway, oncogenic PIK3CA activation and PTENloss are not equivalent. These two events share limitedredundancy, indicating that both provide independentgrowth advantages for cancer cells. Mutations in BRAFand PTEN were associated: four adenocarcinomas hadPTEN mutations, mostly in poly-A tracts, and all 4 CRCwere MSI+ and proximally located, typical of defectiveDNA mismatch repair tumours.A strength of the current study is the use of prospec-
tive data collected before disease onset, as well asemployment of 7-day diaries for dietary assessment, amethod shown to estimate diet more accurately thanfood frequency questionnaires [27]. This report greatlyexpands the limited current data describing alterationsin PI3K/AKT pathway components in colorectal cancerand dietary intakes. Adjustment for confounding vari-ables in the statistical testing was not performed. Suchtesting using logistic regression methods, performed on
low sample sets has been described to lead to systematicbias (i.e. away from null), and overestimation of oddsratios [28]. In order to prevent overestimation of dietaryrisk factors, this testing was not performed on the rela-tively small sample sizes available.This report is one of the first to analyse PTEN and
PIK3CA mutation and PTEN expression in colorectaladenomas, albeit in a low number of cases. PIK3CA wasmutated in a single adenoma (6.3%). Two adenomas(14.3%) demonstrated loss of PTEN expression. Thesedata demonstrate that PIK3CA mutation and loss ofPTEN expression can occur during adenoma formation.This confirms previous data describing PIK3CA muta-tions in adenomas [2,29]. This report is one of the firstto analyse PTEN expression in colorectal adenomas.However, the small sample size indicates that the find-ings should be interpreted with caution.
ConclusionsThis study is one of the largest to date analysing PTENexpression in colorectal cancers, showing association ofthis with Dukes’ stage and colorectal location, indicatinga worse prognosis of PTEN expression negative cancersof the proximal colon that show poor differentiationand advanced Dukes’ stage. Furthermore, mutations inthe PTEN gene, although likely to be rare in unselectedcolorectal cancers, are associated with MSI+ and BRAFmutations, whereas loss of PTEN expression is not andmay be due mostly to other mechanisms. These datadescribe the assessment of associations between dietaryfactors and loss of PTEN expression in colorectal can-cers, suggesting that general loss of PTEN expression isindependent of any specific dietary influences. Further-more, increased signalling mediated by the PI3K/AKTpathway, achieved via mutations in PIK3CA or loss ofPTEN expression are not mutually exclusive, suggestingthat independent growth advantages are provided bythese two cancer promoting changes in colorectalcancer.
Acknowledgements and FundingThanks to Dr Jenny Keen for help with DNA extraction protocols. EPICNorfolk is funded by Cancer Research UK and Medical Research Council.Thanks to Stephen Foster for help with DNA sequencing and Professor Kay-Tee Khaw for her advice and guidance. Finally, the guidance and foresightof the late Sheila Rodwell (previously Sheila Bingham) were essential in theinitiation stages of this work and the study was born under her leadership.
Author details1Medical Research Council Dunn Human Nutrition Unit, Wellcome Trust/MRCBuilding, Cambridge, CB2 0XY, UK. 2Department of Pathology, University ofCambridge, Addenbrooke’s Hospital, Cambridge CB2 0QQ, UK. 3MedicalResearch Council Centre for Nutritional Epidemiology in Cancer Preventionand Survival, Department of Public Health and Primary Care, University ofCambridge, Cambridge CB1 8RN, UK. 4Norfolk and Waveney CellularPathology Network, Norfolk and Norwich University Hospital NHSFoundation Trust, Colney Lane, Norwich, NR4 7UY, UK.
Naguib et al. BMC Cancer 2011, 11:123http://www.biomedcentral.com/1471-2407/11/123
Page 10 of 11
Authors’ contributionsAN performed the sequencing analyses, statistical testing, composed themanuscript and assessed PTEN expression status. PNM contributed tomanuscript design. LJG performed the MSI analyses. RYB obtained access toand distributed the human tissue samples. RNL and AM compiled andprovided the dietary data. MJA contributed to manuscript preparation,supervision of the project, study design and assessed PTEN expressionstatus. JCC, LK and LH contributed to the PTEN immunohistochemistry. Allauthors read and approved the manuscript.
Competing interestsThe authors declare that they have no competing interests.
Received: 3 November 2010 Accepted: 7 April 2011Published: 7 April 2011
References1. Samuels Y, Velculescu VE: Oncogenic mutations of PIK3CA in human
cancers. Cell Cycle 2004, 3(10):1221-1224.2. Samuels Y, Wang Z, Bardelli A, Silliman N, Ptak J, Szabo S, Yan H, Gazdar A,
Powell SM, Riggins GJ, et al: High frequency of mutations of the PIK3CAgene in human cancers. Science 2004, 304(5670):554.
3. Abubaker J, Bavi P, Al-Harbi S, Ibrahim M, Siraj AK, Al-Sanea N,Abduljabbar A, Ashari LH, Alhomoud S, Al-Dayel F, et al:Clinicopathological analysis of colorectal cancers with PIK3CA mutationsin Middle Eastern population. Oncogene 2008, 27(25):3539-3545.
4. Benvenuti S, Frattini M, Arena S, Zanon C, Cappelletti V, Coradini D,Daidone MG, Pilotti S, Pierotti MA, Bardelli A: PIK3CA cancer mutationsdisplay gender and tissue specificity patterns. Hum Mutat 2008,29(2):284-288.
5. Campbell IG, Russell SE, Choong DY, Montgomery KG, Ciavarella ML,Hooi CS, Cristiano BE, Pearson RB, Phillips WA: Mutation of the PIK3CAgene in ovarian and breast cancer. Cancer Res 2004, 64(21):7678-7681.
6. Velho S, Oliveira C, Ferreira A, Ferreira AC, Suriano G, Schwartz S Jr, Duval A,Carneiro F, Machado JC, Hamelin R, et al: The prevalence of PIK3CAmutations in gastric and colon cancer. Eur J Cancer 2005,41(11):1649-1654.
7. Zhao L, Vogt PK: Class I PI3K in oncogenic cellular transformation.Oncogene 2008, 27(41):5486-5496.
8. Chang JG, Chen YJ, Perng LI, Wang NM, Kao MC, Yang TY, Chang CP,Tsai CH: Mutation analysis of the PTEN/MMAC1 gene in cancers of thedigestive tract. Eur J Cancer 1999, 35(4):647-651.
9. Danielsen SA, Lind GE, Bjornslett M, Meling GI, Rognum TO, Heim S,Lothe RA: Novel mutations of the suppressor gene PTEN in colorectalcarcinomas stratified by microsatellite instability- and TP53 mutation-status. Hum Mutat 2008.
10. Dicuonzo G, Angeletti S, Garcia-Foncillas J, Brugarolas A, Okrouzhnov Y,Santini D, Tonini G, Lorino G, De Cesaris M, Baldi A: Colorectal carcinomasand PTEN/MMAC1 gene mutations. Clin Cancer Res 2001, 7(12):4049-4053.
11. Goel A, Arnold CN, Niedzwiecki D, Carethers JM, Dowell JM, Wasserman L,Compton C, Mayer RJ, Bertagnolli MM, Boland CR: Frequent inactivation ofPTEN by promoter hypermethylation in microsatellite instability-highsporadic colorectal cancers. Cancer Res 2004, 64(9):3014-3021.
12. Nassif NT, Lobo GP, Wu X, Henderson CJ, Morrison CD, Eng C, Jalaludin B,Segelov E: PTEN mutations are common in sporadic microsatellite stablecolorectal cancer. Oncogene 2004, 23(2):617-628.
13. Wang ZJ, Taylor F, Churchman M, Norbury G, Tomlinson I: Geneticpathways of colorectal carcinogenesis rarely involve the PTEN and LKB1genes outside the inherited hamartoma syndromes. Am J Pathol 1998,153(2):363-366.
14. Guanti G, Resta N, Simone C, Cariola F, Demma I, Fiorente P, Gentile M:Involvement of PTEN mutations in the genetic pathways of colorectalcancerogenesis. Hum Mol Genet 2000, 9(2):283-287.
15. Zhou XP, Loukola A, Salovaara R, Nystrom-Lahti M, Peltomaki P, de laChapelle A, Aaltonen LA, Eng C: PTEN mutational spectra, expressionlevels, and subcellular localization in microsatellite stable and unstablecolorectal cancers. Am J Pathol 2002, 161(2):439-447.
16. Frattini M, Saletti P, Romagnani E, Martin V, Molinari F, Ghisletta M,Camponovo A, Etienne LL, Cavalli F, Mazzucchelli L: PTEN loss ofexpression predicts cetuximab efficacy in metastatic colorectal cancerpatients. Br J Cancer 2007, 97(8):1139-1145.
17. Molinari F, Martin V, Saletti P, De Dosso S, Spitale A, Camponovo A,Bordoni A, Crippa S, Mazzucchelli L, Frattini M: Differing deregulation ofEGFR and downstream proteins in primary colorectal cancer and relatedmetastatic sites may be clinically relevant. Br J Cancer 2009,100(7):1087-1094.
18. Parkin DM, Bray F, Ferlay J, Pisani P: Global cancer statistics, 2002. CACancer J Clin 2005, 55(2):74-108.
19. Cummings JH, Bingham SA: Diet and the prevention of cancer. BMJ 1998,317(7173):1636-1640.
20. Naguib A, Mitrou PN, Gay LJ, Cooke JC, Luben RN, Ball RY, McTaggart A,Arends MJ, Rodwell SA: Dietary, lifestyle and clinicopathological factorsassociated with BRAF and K-ras mutations arising in distinct subsets ofcolorectal cancers in the EPIC Norfolk study. BMC Cancer 2010, 10:99.
21. Li VS, Wong CW, Chan TL, Chan AS, Zhao W, Chu KM, So S, Chen X,Yuen ST, Leung SY: Mutations of PIK3CA in gastric adenocarcinoma. BMCCancer 2005, 5:29.
22. Soreide K, Janssen EA, Soiland H, Korner H, Baak JP: Microsatelliteinstability in colorectal cancer. Br J Surg 2006, 93(4):395-406.
23. Dahia PL, FitzGerald MG, Zhang X, Marsh DJ, Zheng Z, Pietsch T, vonDeimling A, Haluska FG, Haber DA, Eng C: A highly conserved processedPTEN pseudogene is located on chromosome band 9p21. Oncogene1998, 16(18):2403-2406.
24. Klose RJ, Bird AP: Genomic DNA methylation: the mark and its mediators.Trends Biochem Sci 2006, 31(2):89-97.
25. Garcia JM, Rodriguez R, Silva J, Munoz C, Dominguez G, Silva JM,Carcereny E, Provencio M, Espana P, Bonilla F: Intratumoral heterogeneityin microsatellite alterations in BRCA1 and PTEN regions in sporadiccolorectal cancer. Ann Surg Oncol 2003, 10(8):876-881.
26. Naguib A, Wilson CH, Adams DJ, Arends MJ: Activation of K-RAS by co-mutation of codons 19 and 20 is transforming. J Mol Signal 2011, 6:2.
27. Day N, McKeown N, Wong M, Welch A, Bingham S: Epidemiologicalassessment of diet: a comparison of a 7-day diary with a food frequencyquestionnaire using urinary markers of nitrogen, potassium and sodium.Int J Epidemiol 2001, 30(2):309-317.
28. Nemes S, Jonasson JM, Genell A, Steineck G: Bias in odds ratios by logisticregression modelling and sample size. BMC Med Res Methodol 2009, 9:56.
29. Velho S, Moutinho C, Cirnes L, Albuquerque C, Hamelin R, Schmitt F,Carneiro F, Oliveira C, Seruca R: BRAF, KRAS and PIK3CA mutations incolorectal serrated polyps and cancer: primary or secondary geneticevents in colorectal carcinogenesis? BMC Cancer 2008, 8:255.
Pre-publication historyThe pre-publication history for this paper can be accessed here:http://www.biomedcentral.com/1471-2407/11/123/prepub
doi:10.1186/1471-2407-11-123Cite this article as: Naguib et al.: Alterations in PTEN and PIK3CA incolorectal cancers in the EPIC Norfolk study: associations withclinicopathological and dietary factors. BMC Cancer 2011 11:123.
Submit your next manuscript to BioMed Centraland take full advantage of:
• Convenient online submission
• Thorough peer review
• No space constraints or color figure charges
• Immediate publication on acceptance
• Inclusion in PubMed, CAS, Scopus and Google Scholar
• Research which is freely available for redistribution
Submit your manuscript at www.biomedcentral.com/submit
Naguib et al. BMC Cancer 2011, 11:123http://www.biomedcentral.com/1471-2407/11/123
Page 11 of 11
Copyright © 2022 FDOKUMEN