Dietary fat and Natural Killer cell activity
7
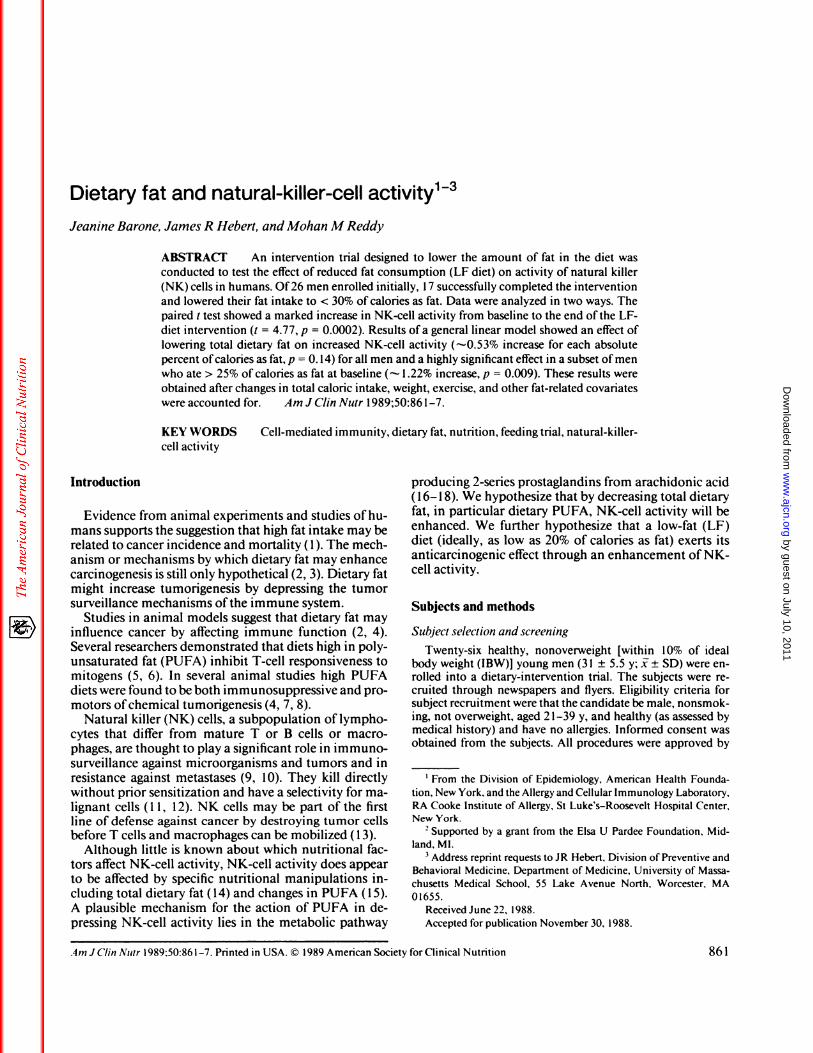
.4m J C/in Nziir 1989:50:861-7. Printed in USA. © 1989 American Society for Clinical Nutrition 861 Dietary fat and natural-killer-cell activity13 Jeanine Barone, James R Hebert, and Mohan M Reddy ABSTRACT An intervention trial designed to lower the amount of fat in the diet was conducted to test the effect of reduced fat consumption (LF diet) on activity of natural killer (NK) cells in humans. Of26 men enrolled initially, 17 successfully completed the intervention and lowered their fat intake to < 30% of calories as fat. Data were analyzed in two ways. The paired t test showed a marked increase in NK-cell activity from baseline to the end ofthe LF- diet intervention (t = 4.77, p = 0.0002). Results ofa general linear model showed an effect of lowering total dietary fat on increased NK-cell activity (“-0.53% increase for each absolute percent ofcalories as fat, p = 0. 14) for all men and a highly significant effect in a subset of men who ate > 25% of calories as fat at baseline (‘.‘ 1 .22% increase, p = 0.009). These results were obtained after changes in total caloric intake, weight, exercise, and other fat-related covanates were accounted for. Am J Clin Nuir 1989;50:86 1-7. KEY WORDS Cell-mediated immunity, dietary fat, nutrition, feeding trial, natural-killer- cell activity Introduction Evidence from animal experiments and studies of hu- mans supports the suggestion that high fat intake may be related to cancer incidence and mortality ( 1). The mech- anism or mechanisms by which dietary fat may enhance carcinogenesis is still only hypothetical (2, 3). Dietary fat might increase tumorigenesis by depressing the tumor surveillance mechanisms ofthe immune system. Studies in animal models suggest that dietary fat may influence cancer by affecting immune function (2, 4). Several researchers demonstrated that diets high in poly- unsaturated fat (PUFA) inhibit T-cell responsiveness to mitogens (5, 6). In several animal studies high PUFA diets were found to be both immunosuppressive and pro- motors ofchemical tumorigenesis (4, 7, 8). Natural killer (NK) cells, a subpopulation of lympho- cytes that differ from mature T or B cells or macro- phages, are thought to play a significant role in immuno- surveillance against microorganisms and tumors and in resistance against metastases (9, 10). They kill directly without prior sensitization and have a selectivity for ma- lignant cells (1 1 , 12). NK cells may be part of the first line of defense against cancer by destroying tumor cells before T cells and macrophages can be mobilized (13). Although little is known about which nutritional fac- tors affect NK-cell activity, NK-cell activity does appear to be affected by specific nutritional manipulations in- cluding total dietary fat (14) and changes in PUFA (15). A plausible mechanism for the action of PUFA in de- pressing NK-cell activity lies in the metabolic pathway producing 2-series prostaglandins from arachidonic acid (16-1 8). We hypothesize that by decreasing total dietary fat, in particular dietary PUFA, NK-cell activity will be enhanced. We further hypothesize that a low-fat (LF) diet (ideally, as low as 20% of calories as fat) exerts its anticarcinogenic effect through an enhancement of NK- cell activity. Subjects and methods Subject selection and screening Twenty-six healthy, nonoverweight [within 10% of ideal body weight (IBW)] young men (3 1± 5.5 y; ± SD) were en- rolled into a dietary-intervention trial. The subjects were re- cruited through newspapers and flyers. Eligibility criteria for subject recruitment were that the candidate be male, nonsmok- ing, not overweight, aged 2 1-39 y, and healthy (as assessed by medical history) and have no allergies. Informed consent was obtained from the subjects. All procedures were approved by t From the Division of Epidemiology, American Health Founda- tion, New York, and the Allergy and Cellular Immunology Laboratory, RA Cooke Institute of Allergy, St Luke’s-Roosevelt Hospital Center, New York. 2 Supported by a grant from the Elsa U Pardee Foundation, Mid- land, MI. 3 Address reprint requests to JR Hebert. Division of Preventive and Behavioral Medicine, Department of Medicine, University of Massa- chusetts Medical School, 55 Lake Avenue North, Worcester, MA 01655. Received June 22, 1988. Accepted for publication November 30, 1988. by guest on July 10, 2011 www.ajcn.org Downloaded from
-
Upload
independent -
Category
Documents
-
view
6 -
download
0
Transcript of Dietary fat and Natural Killer cell activity
.4m J C/in Nziir 1989:50:861-7. Printed in USA. © 1989 American Society for Clinical Nutrition 861
Dietary fat and natural-killer-cell activity13
Jeanine Barone, James R Hebert, and Mohan M Reddy
ABSTRACT An intervention trial designed to lower the amount of fat in the diet wasconducted to test the effect of reduced fat consumption (LF diet) on activity of natural killer
(NK) cells in humans. Of26 men enrolled initially, 1 7 successfully completed the intervention
and lowered their fat intake to < 30% of calories as fat. Data were analyzed in two ways. The
paired t test showed a marked increase in NK-cell activity from baseline to the end ofthe LF-
diet intervention (t = 4.77, p = 0.0002). Results ofa general linear model showed an effect of
lowering total dietary fat on increased NK-cell activity (“-0.53% increase for each absolute
percent ofcalories as fat, p = 0. 14) for all men and a highly significant effect in a subset of men
who ate > 25% of calories as fat at baseline (‘�.‘ 1 .22% increase, p = 0.009). These results were
obtained after changes in total caloric intake, weight, exercise, and other fat-related covanates
were accounted for. Am J Clin Nuir 1989;50:86 1-7.
KEY WORDS Cell-mediated immunity, dietary fat, nutrition, feeding trial, natural-killer-cell activity
Introduction
Evidence from animal experiments and studies of hu-mans supports the suggestion that high fat intake may berelated to cancer incidence and mortality ( 1). The mech-
anism or mechanisms by which dietary fat may enhance
carcinogenesis is still only hypothetical (2, 3). Dietary fatmight increase tumorigenesis by depressing the tumorsurveillance mechanisms ofthe immune system.
Studies in animal models suggest that dietary fat mayinfluence cancer by affecting immune function (2, 4).Several researchers demonstrated that diets high in poly-unsaturated fat (PUFA) inhibit T-cell responsiveness tomitogens (5, 6). In several animal studies high PUFAdiets were found to be both immunosuppressive and pro-motors ofchemical tumorigenesis (4, 7, 8).
Natural killer (NK) cells, a subpopulation of lympho-cytes that differ from mature T or B cells or macro-phages, are thought to play a significant role in immuno-surveillance against microorganisms and tumors and inresistance against metastases (9, 10). They kill directlywithout prior sensitization and have a selectivity for ma-lignant cells (1 1 , 12). NK cells may be part of the firstline of defense against cancer by destroying tumor cells
before T cells and macrophages can be mobilized (13).Although little is known about which nutritional fac-
tors affect NK-cell activity, NK-cell activity does appearto be affected by specific nutritional manipulations in-cluding total dietary fat (14) and changes in PUFA (15).A plausible mechanism for the action of PUFA in de-
pressing NK-cell activity lies in the metabolic pathway
producing 2-series prostaglandins from arachidonic acid
(16-1 8). We hypothesize that by decreasing total dietaryfat, in particular dietary PUFA, NK-cell activity will be
enhanced. We further hypothesize that a low-fat (LF)diet (ideally, as low as 20% of calories as fat) exerts itsanticarcinogenic effect through an enhancement of NK-cell activity.
Subjects and methods
Subject selection and screening
Twenty-six healthy, nonoverweight [within 10% of ideal
body weight (IBW)] young men (3 1 ± 5.5 y; � ± SD) were en-rolled into a dietary-intervention trial. The subjects were re-
cruited through newspapers and flyers. Eligibility criteria forsubject recruitment were that the candidate be male, nonsmok-ing, not overweight, aged 2 1-39 y, and healthy (as assessed bymedical history) and have no allergies. Informed consent wasobtained from the subjects. All procedures were approved by
t From the Division of Epidemiology, American Health Founda-
tion, New York, and the Allergy and Cellular Immunology Laboratory,RA Cooke Institute of Allergy, St Luke’s-Roosevelt Hospital Center,New York.
2 Supported by a grant from the Elsa U Pardee Foundation, Mid-land, MI.
3 Address reprint requests to JR Hebert. Division of Preventive andBehavioral Medicine, Department of Medicine, University of Massa-chusetts Medical School, 55 Lake Avenue North, Worcester, MA01655.
Received June 22, 1988.
Accepted for publication November 30, 1988.
by guest on July 10, 2011w
ww
.ajcn.orgD
ownloaded from

862 BARONE ET AL
the Institutional Review Board ofthe American Health Foun-dation.
Demographic data, medical histories, height, weight, andphysical-activity assessments were collected through an inter-viewer-administered questionnaire. Questions on smoking,drinking habits, past and present medical history, medication,and nutrition supplements were included.
Subject compliance
Subject compliance was assessed in two ways. Compliancewith LF dietary modifications (ie, < 30% ofcalories as fat) wasassessed by repeated, random 24-h food recalls and the 4-d fooddiary (FDFD). A subject who met one or both ofthe followingcriteria was considered to have poor overall compliance: 1) un-able to be contacted at least twice per month and 2) left forvacation or went out oftown without contacting us.
Seven subjects were initially dropped from the study due toextremely poor compliance with the LF diet; they were not ableto be reached by phone or they moved from New York. Twoadditional subjects were dropped at the very end because oftheir inconsistent compliance in reducing their fat intake below30% of calories.
Experimental design
The experimental period was preceeded by a 1.5-2-mo base-line period during which subjects were familiarized with the LF
eating plan. All subjects were assigned to the LF interventionfor 3 mo. Subjects were instructed not to change exercise hat>its, engage in weight-reducing regimens, or begin using nutni-tional supplements or medication. At the first symptoms of acold or other infection, subjects were to inform research staff.Because ofthe effect ofinfection on NK-cell activity (19), blooddrawing was to be postponed for 2 wk postinfection.
Nutrition intervention
A semiquantitative food-frequency questionnaire (FFQ)was administered by a trained nutritionist at the initial inter-view and again at the end of the study to assess nutritional in-take over the previous 6 mo. Food models were used to esti-mate portion sizes.
The FFQ had previously been validated for percent of cab-ries from fat (unpublished results) and was updated to include102 food items that represent �‘-87% of total calories, 97% oftotal fat, and 97% of the three classes of fatty acids [saturated(SFA), monounsaturated (MUFA) (mainly oleic acid), andPUFA (mainly linoleic acid)] in the American diet (20).Different types ofcooking oils, margarines, nuts, tofu, and veg-etable-protein analogues that would affect total fat, as well asthe ratio ofpolyunsaturated to saturated fatty acids (P:S), werealso included. This FFQ was pretested on 1 1 healthy subjects.As an internal validation each subject was instructed to keep aFDFD which would be used to correlate total calories, total fat,individual fatty acids, and percent offat with estimates derivedfrom the FFQ.
Total PUFA, MUFA, and SFA as well as percent of caloriesfrom fat obtained from FFQ were highly correlated with thevalues from the FDFD. The highest correlation was for percentofcalories from fat (r = 0.86) and the minimum was for MUFA(r = 0.58). The FFQ was considered acceptable within conven-tional limits (21-23).
After the initial interview subjects were counseled in personfor 60-90 mm (and additionally over the phone) about how to
decrease dietary fat to ‘-�-20% of calories. Sample LF menusand other nutrition-education materials were distributed and
discussed. Fat Portion Exchange Lists (24)-an educationaltool designed to help individuals become aware ofdietary fat-were explained to each subject. Foods containing one fat por-tion (FP) are approximately equal to 5 g fat. On the basis oftotal caloric intake as assessed by baseline FFQ, each subjectwas prescribed the maximum number ofFPs that would repre-sent ‘�20% of total calories. Though the aim was to reduce tothis level, an inability to achieve a level < 30% was judged asgross noncompliance (25).
Subjects were taught how to keep an FDFD both as a way tovalidate other dietary data and as a way to sensitize the subjectsto their dietary intake. Individuals were familiarized with stan-dard measuring cups and spoons and scales that were providedfor weighing foods.
For the duration ofthe study a trained nutritionist randomlycontacted subjects by phone at home or work a minimum oftwo and a maximum of four times each month to obtain 24-hfood recalls. Subjects were to record the intensity and durationofspecific exercise activities (eg, walking or cycling) performedthat day. During the last week of the intervention period, anFDFD (including 1 weekend day) was collected from each sub-ject.
The 24-h recalls and FDFD were analyzed for calories, totalfat, SFA, PUFA, MUFA, cholesterol, P:S, and percent of cab-ries from fat. Nutrient values were derived from the AmericanHealth Foundation’s computerized Diet Analysis System(DIAN). Nutrient data were obtained from the US DepartmentofAgriculture’s food composition tables (USDA Nutrient DataBase for Standard Reftrence Release 5, USDA, Hyattsville,MD) supplemented by manufacturers’ data. A second, mdc-pendent nutritionist performed reanalysis of a random sam-pling offood diaries and recalls.
Biologicaland clinicaldata collection
All blood samples were drawn between 0700 and 0900 at theinitial interview (baseline) and 20 wk later, after the subjectshad been on the LF diet for � 12 wk. For each patient periph-eral blood was drawn into two green-topped tubes containingheparin (Vacutainer system, Bectin-Dickinson, Rutherford,NJ). Blood samples were then coded and sent to the Immunol-ogy Laboratory at St Luke’s-Roosevelt Hospital Center wherethey were analyzed for NK-cell activity. All tests were con-ducted blind, ie, the technician was unaware ofthe hypothesisto be tested, the design ofthe study, or the identity ofthe study
subjects.
At the time of blood drawing, subjects were weighed andquestioned again as to whether they had had any colds, flu, orother infections during the previous 2 wk. No subject reportedinfection in that period. The FDFDs were examined for grosserrors by a trained nutritionist at this time and the FDFDs weresubsequently analyzed.
Natural-killer-cell assay
The NK-cell activity was evaluated by means ofa 4-h 5tCr-release cytotoxicity assay (26) with the highly sensitive myeloidleukemia cell line K562 as a target. These cells were culturedin suspension with RPM! 1640 medium [Grand Island Biologi-cal Co (GIBCO) Grand Island, NY], supplemented with 10%heat-inactivated fetal calf serum (GIBCO), penicillin-strepto-mycin (GIBCO), L-glutamine(GIBCO), and 10 mmol HEPES/L (GIBCO), and subsequently referred to as complete medium.To label target cells with 5tCr, 2 X 10⁶ target cells suspended in0.2 mL complete medium were incubated with 3.7 MBq 5tCrsodium chromate (New England Nuclear, Boston) at 37 #{176}Cin
by guest on July 10, 2011w
ww
.ajcn.orgD
ownloaded from
FAT AND NK-CELL ACTIVITY 863
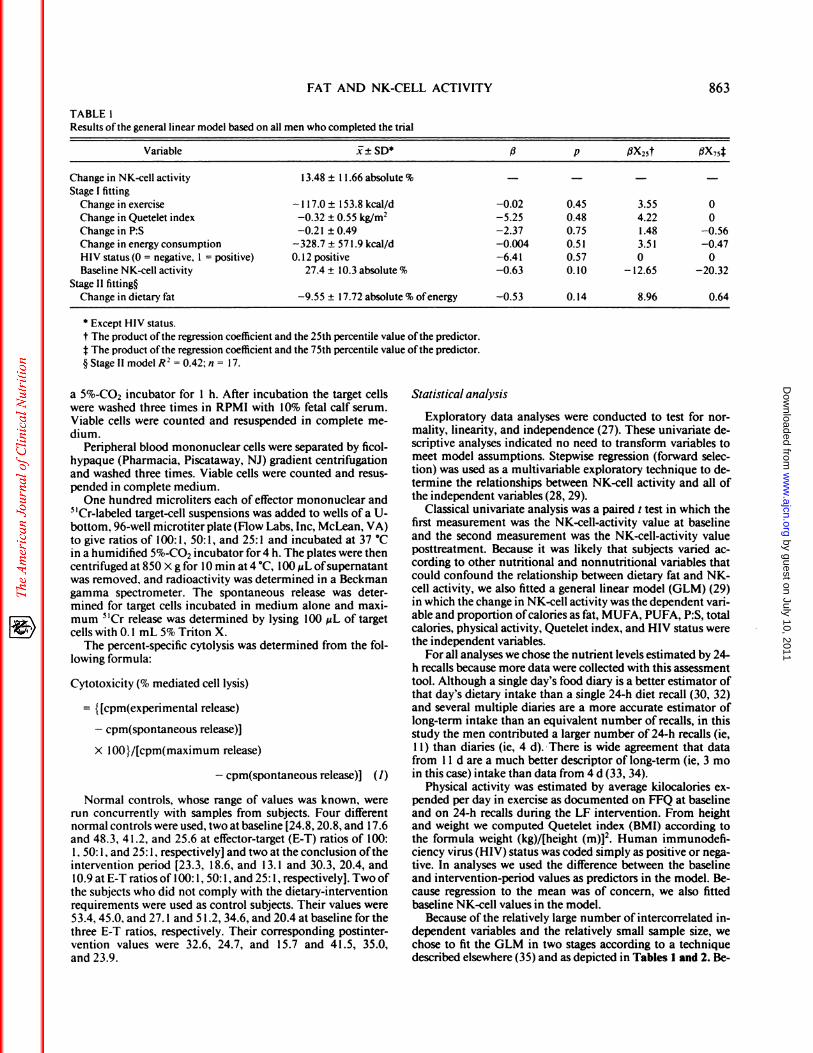
TABLE 1Results ofthe general linear model based on all men who completed the trial
Variable i± SD5 fi p flX25t �X74
Change in NK-cell activity 13.48 ± I 1.66 absolute % - - - -
Stage I fitting
Change in exercise - 1 17.0 ± I 53.8 kcal/d -0.02 0.45 3.55 0
Change in Quetelet index -0.32 ± 0.55 kg/m2 -5.25 0.48 4.22 0Change in P:S -0.2 1 ± 0.49 -2.37 0.75 1.48 -0.56Change in energy consumption -328.7 ± 57 1 .9 kcal/d -0.004 0.5 1 3.5 1 -0.47HIV status(0 = negative, 1 = positive) 0.12 positive -6.41 0.57 0 0Baseline NK-cell activity 27.4 ± 10.3 absolute % -0.63 0.10 - 12.65 -20.32
Stage II fitting�
Change in dietary fat -9.55 ± 17.72 absolute % ofenergy -0.53 0. 14 8.96 0.64
S Except HIV status.
t The product ofthe regression coefficient and the 25th percentile value ofthe predictor.j: The product ofthe regression coefficient and the 75th percentile value ofthe predictor.
§ Stage II model R2 = 0.42; n = I 7.
a 5%-CO2 incubator for 1 h. After incubation the target cellswere washed three times in RPM! with 10% fetal calf serum.Viable cells were counted and resuspended in complete me-dium.
Peripheral blood mononuclear cells were separated by ficol-hypaque (Pharmacia, Piscataway, NJ) gradient centrifugationand washed three times. Viable cells were counted and resus-pended in complete medium.
One hundred microliters each of effector mononuclear and5 ‘Cr-labeled target-cell suspensions was added to wells of a U-bottom, 96-well microtiter plate (Flow Labs, Inc, McLean, VA)to give ratios of 100: 1, 50: 1, and 25: 1 and incubated at 37 #{176}Cin a humidified 5%-CO2 incubator for 4 h. The plates were then
centrifuged at 850 X g for 10 mm at 4 #{176}C,100 �cL of supernatantwas removed, and radioactivity was determined in a Beckmangamma spectrometer. The spontaneous release was deter-mined for target cells incubated in medium alone and maxi-
mum 5tCr release was determined by lysing 100 �tL of targetcells with 0. 1 mL 5% Triton X.
The percent-specific cytolysis was determined from the fol-lowing formula:
Cytotoxicity (% mediated cell lysis)
= {[cpm(experimental release)
- cpm(spontaneous release)]
x lOO}/[cpm(maximum release)
- cpm(spontaneous release)] (1)
Normal controls, whose range of values was known, wererun concurrently with samples from subjects. Four differentnormal controls were used, two at baseline [24.8, 20.8, and 17.6and 48.3, 41.2, and 25.6 at effector-target (E-T) ratios of 100:1, 50: 1, and 25: 1 , respectively] and two at the conclusion of theintervention period [23.3, 18.6, and 1 3. 1 and 30.3, 20.4, and10.9 at E-T ratiosoflO0:l, 50:1, and 25:1, respectively]. Twoof
the subjects who did not comply with the dietary-interventionrequirements were used as control subjects. Their values were53.4, 45.0, and 27. 1 and 5 1 .2, 34.6, and 20.4 at baseline for thethree E-T ratios, respectively. Their corresponding postinter-vention values were 32.6, 24.7, and 15.7 and 41.5, 35.0,
and 23.9.
St atistical analysis
Exploratory data analyses were conducted to test for nor-mality, linearity, and independence (27). These univariate de-scriptive analyses indicated no need to transform variables tomeet model assumptions. Stepwise regression (forward selec-tion) was used as a multivariable exploratory technique to de-
termine the relationships between NK-cell activity and all ofthe independent variables (28, 29).
Classical univariate analysis was a paired t test in which thefirst measurement was the NK-cell-activity value at baselineand the second measurement was the NK-cell-activity valueposttreatment. Because it was likely that subjects varied ac-cording to other nutritional and nonnutritional variables thatcould confound the relationship between dietary fat and NK-cell activity, we also fitted a general linear model (GLM) (29)in which the change in NK-cell activity was the dependent vari-
able and proportion ofcabories as fat, MUFA, PUFA, P:S, totalcalories, physical activity, Quetelet index, and HIV status werethe independent variables.
For all analyses we chose the nutrient levels estimated by 24-h recalls because more data were collected with this assessmenttool. Although a single day’s food diary is a better estimator ofthat day’s dietary intake than a single 24-h diet recall (30, 32)and several multiple diaries are a more accurate estimator oflong-term intake than an equivalent number of recalls, in thisstudy the men contributed a larger number of 24-h recalls (ie,1 1) than diaries (ie, 4 d). There is wide agreement that data
from 1 1 d are a much better descriptor of long-term (ie, 3 moin this case) intake than data from 4 d (33, 34).
Physical activity was estimated by average kilocalories cx-pended per day in exercise as documented on FFQ at baselineand on 24-h recalls during the LF intervention. From heightand weight we computed Quetelet index (BMI) according tothe formula weight (kg)/[height (m)]2. Human immunodefi-ciency virus (HIV) status was coded simply as positive or nega-tive. In analyses we used the difference between the baselineand intervention-period values as predictors in the model. Be-cause regression to the mean was of concern, we also fitted
baseline NK-cell values in the model.Because of the relatively large number of intercorrelated in-
dependent variables and the relatively small sample size, wechose to fit the GLM in two stages according to a techniquedescribed elsewhere (35) and as depicted in Tables I and 2. Be-
by guest on July 10, 2011w
ww
.ajcn.orgD
ownloaded from

70
65
60
55
50
45
40
35
30
25
20
15
Bas&;ne L FChange Over Study Period
864 BARONE ET AL
TABLE 2Results ofthe general linear model based on 14 men whose baseline fat intake exceeded 25% of calories
Variable 1± SD5 fi p (JX�.� #{216}X�4
Change in NK-cell activity 12. 16 ± 12.47 absolute % - - - -
Stage I fitting
Change in exercise -1 14.9 ± 163.5 kcal/d -0.02 0.32 4.91 0Change in Quetelet index -0.27 ± 0.58 kg/m2 -3.03 0.69 2.55 0
Change in P:S -0.29 ± 0.49 -5.61 0.49 4.38 -0.98
Change in energy consumption -279. 1 ± 6 16.5 kcal/d -0.006 0.45 4.78 -1.02
HIV status(0 = negative, 1 = positive) 0.07 positive -24.34 0. 19 0 0
Baseline NK-cell activity 27.8 ± 10.6 absolute % -0.83 0.07 - 17.0 -25.8Stage II fittung�
Change in dietary fat - 1 1.56 ± 6.98 absolute % ofenergy - 1 .22 0.009 2 1.08 6.97
S Except HIV status.
t The product ofthe regression coeffIcient and the 25th percentile value ofthe predictor.
t The product ofthe regression coefficient and the 75th percentile value ofthe predictor.§ Stage II model R2 = 0.75: n = 14.
cause the dietary data describing intake during the period upto the end ofthe LF intervention were ofgreater quality thanthe baseline measure, which was derived from a single FFQ,and the proportion of total calories as fat at the end of the pe-riod was an indication of compliance, we were motivated toaccount for the intervention-period data in two ways. In theGLM we weighted the analysis by the number of 24-h recallscompleted by each man. In this way we gave greater weight tomen who were the most compliant and contributed the mostdata. Because ofwell-known problems with nutritional hetero-geneity (32), we also fitted a model excluding men who were
below 25% of calories as fat at baseline. We also examined therelationship between intervention-period-specific nutritionaldata and NK-cell activity at the end ofthe intervention period.
Results
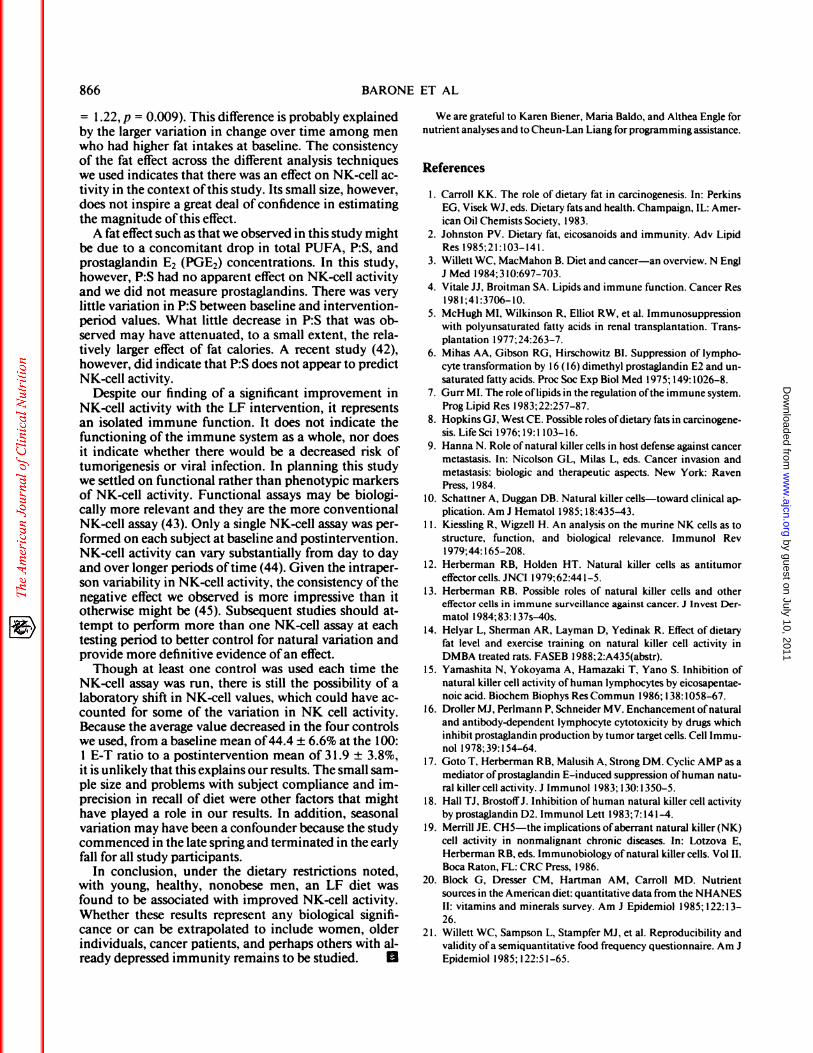
Results were based on the 1 7 male subjects who wereretained after exclusions for noncompliance. Figure 1 il-lustrates the changes from baseline values ofNK-cell ac-
tivity to the NK-cell activity after the LF intervention. Asignificant (p < 0.01) increase in NK activity was foundas measured by percent lysis at 100: 1 , 50: 1 , and 25:1E-T ratios.
In general, use ofthe three ratios produced results thatwere similar in the direction of the estimated effect andthat differed only in magnitude. Except where noted, theresults are for the 100: 1 E-T ratio of the NK-cell assay.Comparisons ofaverage baseline and intervention nutn-
tional, weight, exercise, and NK-cell activity data areshown in Table 3. The baseline nutrient values are basedon the FFQ-denved data, and the LF intervention valuesare derived from the multiple 24-h recalls. The databased on multiple 24-h recalls were apparently reliablebecause we observed a very high correlation (average r= 0.95) between total fat, SFA, and PUFA in the originalanalysis of 24-h recalls during one randomly selectedmonth and the values obtained from a second indepen-
dent analysis by another nutritionist for the same period.We also compared dietary data from the FDFD adminis-tered at the end of the LF-intervention period with the
multiple 24-h recall data and found that the correspond-ing nutrient values derived from the two methods wererelatively highly correlated. The Pearson correlation co-
efficients for total calories, percent calories as fat, andgrams ofSFA were 0.50, 0.39, and 0.59, respectively.
Results of the paired t test showed a marked increasein NK-cell activity from baseline to the end ofthe inter-vention period (Table 3). The average increase in NK-
cell activity was 13.4 at 100: 1 (t = 4.77, p = 0.0002). Thecorresponding increase was 9.98 at 50: 1 (t = 5.13,p < 0.000l)and 9.57 at 25:1 (t = 6.44,p < 0.0001).
>1
>
U
C)
x
.2#{176}% I-
‘-1--
I-
4.’
2
FIG 1 . Comparison ofNK-cell activity at an effector-target ratio (ElT) of 100: 1 in 17 subjects at baseline vs after a 3-mo low-fat (LF) inter-vention.
by guest on July 10, 2011w
ww
.ajcn.orgD
ownloaded from
FAT AND NK-CELL ACTIVITY 865
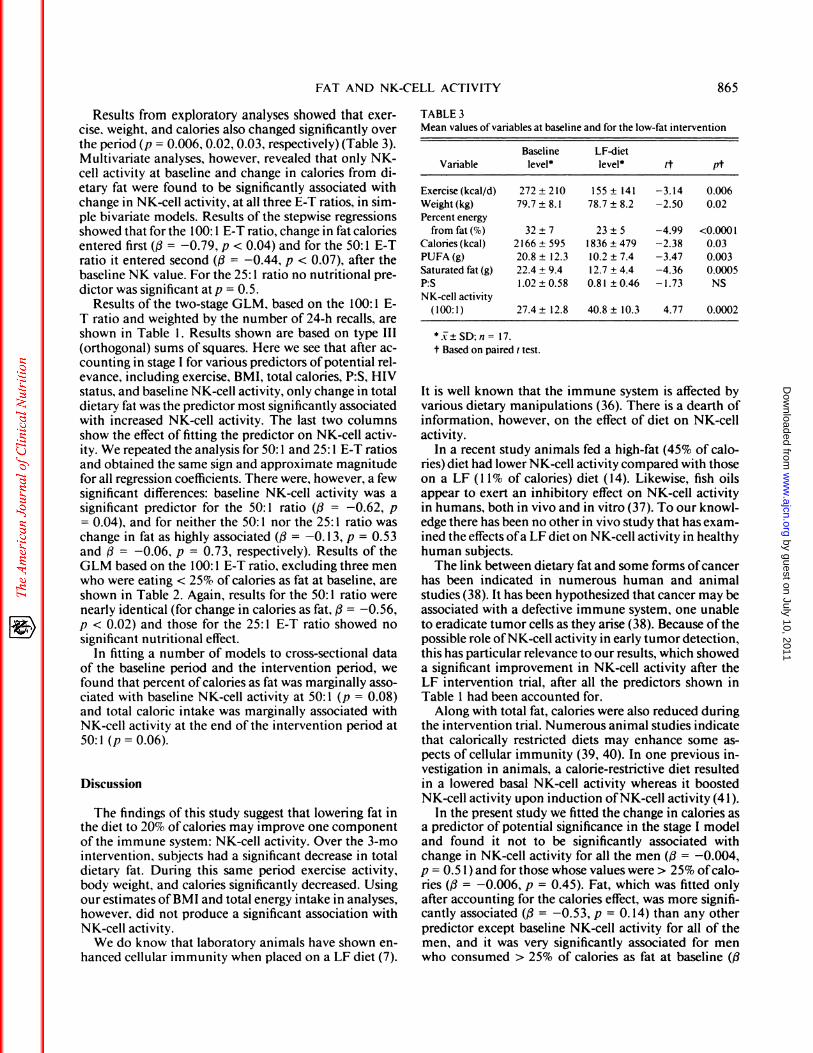
Results from exploratory analyses showed that exer-cise, weight, and calories also changed significantly overthe period (p = 0.006, 0.02, 0.03, respectively)(Table 3).Multivariate analyses, however, revealed that only NK-cell activity at baseline and change in calories from di-
etary fat were found to be significantly associated withchange in NK-cell activity, at all three E-T ratios, in sim-pie bivariate models. Results of the stepwise regressions
showed that for the 100: 1 E-T ratio, change in fat caloriesentered first ((3 = -0.79, p < 0.04) and for the 50: 1 E-Tratio it entered second (fi = -0.44, p < 0.07), after the
baseline NK value. For the 25: 1 ratio no nutritional pre-dictor was significant at p = 0.5.
Results of the two-stage GLM, based on the 100: 1 E-
T ratio and weighted by the number of 24-h recalls, areshown in Table 1 . Results shown are based on type III
(orthogonal) sums of squares. Here we see that after ac-counting in stage I for various predictors ofpotential rel-evance, including exercise, BMI, total calories, P:S, HIVstatus, and baseline NK-cell activity, only change in totaldietary fat was the predictor most significantly associatedwith increased NK-cell activity. The last two columns
show the effect of fitting the predictor on NK-cell activ-ity. We repeated the analysis for 50: 1 and 25: 1 E-T ratios
and obtained the same sign and approximate magnitudefor all regression coefficients. There were, however, a few
significant differences: baseline NK-cell activity was asignificant predictor for the 50: 1 ratio (f� = -0.62, p- 0.04), and for neither the 50: 1 nor the 25: 1 ratio waschange in fat as highly associated (� = -0.13, p = 0.53and 4� = -0.06, p = 0.73, respectively). Results of theGLM based on the 100: 1 E-T ratio, excluding three menwho were eating < 25% of calories as fat at baseline, are
shown in Table 2. Again, results for the 50: 1 ratio werenearly identical (for change in calories as fat, f3 = -0.56,p < 0.02) and those for the 25: 1 E-T ratio showed nosignificant nutritional effect.
In fitting a number of models to cross-sectional data
of the baseline period and the intervention period, wefound that percent ofcalories as fat was marginally asso-ciated with baseline NK-cell activity at 50: 1 (p = 0.08)and total caloric intake was marginally associated withNK-cell activity at the end of the intervention period at
50: 1 (p = 0.06).
Discussion
The findings ofthis study suggest that lowering fat inthe diet to 20% ofcalories may improve one componentofthe immune system: NK-cell activity. Over the 3-mo
intervention, subjects had a significant decrease in total
dietary fat. During this same period exercise activity,body weight, and calories significantly decreased. Usingour estimates ofBMI and total energy intake in analyses,however, did not produce a significant association withNK-cell activity.
We do know that laboratory animals have shown en-
hanced cellular immunity when placed on a LF diet (7).
TABLE 3
Mean values ofvariables at baseline and for the low-fat intervention
VariableBaseline
level5LF-dietlevel tt pt
Exercise(kcal/d) 272±210 155± 141 -3.14 0.006Weight (kg) 79.7 ± 8. 1 78.7 ± 8.2 -2.50 0.02
Percent energy
from fat (%) 32 ± 7 23 ± 5 -4.99 <0.0001Calories(kcal) 2166±595 1836±479 -2.38 0.03PUFA(g) 20.8 ± 12.3 10.2 ± 7.4 -3.47 0.003Saturated fat (g) 22.4 ± 9.4 12.7 ± 4.4 -4.36 0.0005
P:S 1.02±0.58 0.81±0.46 -1.73 NS
NK-cell activity(100:1) 27.4 ± 12.8 40.8 ± 10.3 4.77 0.0002
5�±SD:n= 17.
t Based on paired t test.
It is well known that the immune system is affected byvarious dietary manipulations (36). There is a dearth ofinformation, however, on the effect of diet on NK-cell
activity.
In a recent study animals fed a high-fat (45% of cab-ries) diet had lower NK-cell activity compared with thoseon a LF (1 1% of calories) diet (14). Likewise, fish oilsappear to exert an inhibitory effect on NK-cell activityin humans, both in vivo and in vitro (37). To our knowl-
edge there has been no other in vivo study that has exam-med the effects ofa LF diet on NK-cell activity in healthyhuman subjects.
The link between dietary fat and some forms of cancerhas been indicated in numerous human and animal
studies (38). It has been hypothesized that cancer may beassociated with a defective immune system, one unableto eradicate tumor cells as they arise (38). Because of thepossible role ofNK-cell activity in early tumor detection,
this has particular relevance to our results, which showeda significant improvement in NK-cell activity after theLF intervention trial, after all the predictors shown in
Table 1 had been accounted for.Along with total fat, calories were also reduced during
the intervention trial. Numerous animal studies indicatethat calorically restricted diets may enhance some as-pects ofcellular immunity (39, 40). In one previous in-vestigation in animals, a calorie-restrictive diet resulted
in a lowered basal NK-cell activity whereas it boosted
NK-cell activity upon induction ofNK-cell activity (41).In the present study we fitted the change in calories as
a predictor of potential significance in the stage I modeland found it not to be significantly associated withchange in NK-cell activity for all the men (f3 = -0.004,p = 0.5 1) and for those whose values were > 25% of cab-ries (j3 = -0.006, p = 0.45). Fat, which was fitted onlyafter accounting for the calories effect, was more signifi-cantly associated (13 = -0.53, p = 0. 14) than any other
predictor except baseline NK-cell activity for all of themen, and it was very significantly associated for menwho consumed > 25% of calories as fat at baseline (�9
by guest on July 10, 2011w
ww
.ajcn.orgD
ownloaded from
866 BARONE ET AL
= 1 .22, p = 0.009). This difference is probably explained
by the larger variation in change over time among menwho had higher fat intakes at baseline. The consistency
of the fat effect across the different analysis techniqueswe used indicates that there was an effect on NK-cell ac-
tivity in the context ofthis study. Its small size, however,does not inspire a great deal ofconfidence in estimating
the magnitude ofthis effect.A fat effect such as that we observed in this study might
be due to a concomitant drop in total PUFA, P:S, andprostaglandin E2 (POE2) concentrations. In this study,however, P:S had no apparent effect on NK-cell activityand we did not measure prostaglandins. There was very
little variation in P:S between baseline and intervention-period values. What little decrease in P:S that was ob-served may have attenuated, to a small extent, the rela-tively larger effect of fat calories. A recent study (42),however, did indicate that P:S does not appear to predict
NK-cell activity.Despite our finding of a significant improvement in
NK-cell activity with the LF intervention, it representsan isolated immune function. It does not indicate the
functioning ofthe immune system as a whole, nor doesit indicate whether there would be a decreased risk oftumorigenesis or viral infection. In planning this studywe settled on functional rather than phenotypic markersof NK-cell activity. Functional assays may be biobogi-cally more relevant and they are the more conventionalNK-cebl assay (43). Only a single NK-cell assay was per-formed on each subject at baseline and postintervention.NK-cell activity can vary substantially from day to dayand over longer periods oftime (44). Given the intraper-son variability in NK-cell activity, the consistency of the
negative effect we observed is more impressive than itotherwise might be (45). Subsequent studies should at-tempt to perform more than one NK-cell assay at eachtesting period to better control for natural variation andprovide more definitive evidence ofan effect.
Though at least one control was used each time theNK-cell assay was run, there is still the possibility of alaboratory shift in NK-cell values, which could have ac-
counted for some of the variation in NK cell activity.Because the average value decreased in the four controlswe used, from a baseline mean of44.4 ± 6.6% at the 100:1 E-T ratio to a postintervention mean of 3 1 .9 ± 3.8%,it is unlikely that this explains our results. The small sam-ple size and problems with subject compliance and im-precision in recall of diet were other factors that mighthave played a role in our results. In addition, seasonalvariation may have been a confounder because the studycommenced in the late spring and terminated in the earlyfall for all study participants.
In conclusion, under the dietary restrictions noted,with young, healthy, nonobese men, an LF diet wasfound to be associated with improved NK-cell activity.Whether these results represent any biological signifi-cance or can be extrapolated to include women, olderindividuals, cancer patients, and perhaps others with al-ready depressed immunity remains to be studied. B
We are grateful to Karen Biener, Maria Baldo, and Althea Engle for
nutrient analyses and to Cheun-Lan Liang for programming assistance.
References
I . Carroll KK. The role of dietary fat in carcinogenesis. In: PerkinsEG, Visek WJ, eds. Dietary fats and health. Champaign, IL: Amer-ican Oil Chemists Society, 1983.
2. Johnston PV. Dietary fat, eicosanoids and immunity. Adv LipidRes 1985:21:103-141.
3. Willett WC, MacMahon B. Diet and cancer-an overview. N EngI
J Med 1984;3l0:697-703.
4. Vitale JJ, Broitman SA. Lipids and immune function. Cancer Res
198 l;41:3706-l0.5. McHugh MI, Wilkinson R, Elliot RW, et al. Immunosuppression
with polyunsaturated fatty acids in renal transplantation. Trans-
plantation 1977;24:263-7.6. Mihas AA, Gibson RG, Hirschowitz BI. Suppression of lympho-
cyte transformation by 16 (16) dimethyl prostaglandin E2 and un-
saturated fatty acids. Proc Soc Exp Biol Med 1975; 149:1026-8.7. Gurr MI. The role oflipids in the regulation ofthe immune system.
Prog Lipid Res 1983; 22:257-87.
8. Hopkins GJ, West CE. Possible roles ofdietary fats in carcinogene-
sis.LifeSci l976;l9:llO3-16.
9. Hanna N. Role ofnatural killer cells in host defense against cancermetastasis. In: Nicolson GL, Milas L, eds. Cancer invasion and
metastasis: biologic and therapeutic aspects. New York: RavenPress, 1984.
10. Schattner A, Duggan DB. Natural killer cells-toward clinical ap-plication. Am J Hematol 1985; 18:435-43.
1 1. Kiessling R, Wigzell H. An analysis on the murine NK cells as to
structure, function, and biological relevance. Immunol Revl979;44: 165-208.
12. Herberman RB, Holden HT. Natural killer cells as antitumor
effectorcells. JNCI 1979;62:441-5.13. Herberman RB. Possible roles of natural killer cells and other
effector cells in immune survcillance against cancer. J Invest Der-
matol 1984;83: 137s-40s.14. Helyar L, Sherman AR, Layman D, Yedinak R. Effect of dietary
fat level and exercise training on natural killer cell activity inDMBA treated rats. FASEB l988;2:A435(abstr).
15. Yamashita N, Yokoyama A, Hamazaki T, Yano S. Inhibition ofnatural killer cell activity ofhuman lymphocytes by eicosapentae-noic acid. Biochem Biophys Res Commun 1986; 138:1058-67.
16. Droller MJ, Perlmann P. Schneider MV. Enchancement of naturaland antibody-dependent lymphocyte cytotoxicity by drugs whichinhibit prostaglandin production by tumor target cells. Cell Immu-nol l978;39: 154-64.
17. Goto T, Herberman RB, Malusih A, Strong DM. Cyclic AMP as amediator ofprostaglandin E-induced suppression ofhuman natu-ral killer cell activity. J Immunol 1983; 130:1350-5.
18. Hall TJ, BrostoffJ. Inhibition ofhuman natural killer cell activitybyprostaglandin D2. Immunol Lett 1983;7:l4l-4.
19. Merrill JE. CHS-the implications ofaberrant natural killer(NK)cell activity in nonmalignant chronic diseases. In: Lotzova E,Herberman RB, eds. Immunobiology ofnatural killer cells. Vol II.Boca Raton, FL: CRC Press, 1986.
20. Block G, Dresser CM, Hartman AM, Carroll MD. Nutrient
sources in the American diet: quantitative data from the NHANESII: vitamins and minerals survey. Am J Epidemiol 1985; 122:13-26.
21. Willett WC, Sampson L, Stampfer MJ, et al. Reproducibility andvalidity ofa semiquantitative food frequency questionnaire. Am J
Epidemiol 1985; 122:51-65.
by guest on July 10, 2011w
ww
.ajcn.orgD
ownloaded from

FAT AND NK-CELL ACTIVITY 867
22. Rohan TE, Potter JD. Retrospective assessment ofdietary intake.Am J Epidemiol 1984; 120:876-87.
23. Rasanen L, Pietinen P. A short questionnaire method of evalua-
tion ofdiets. Prey Med 1982; 1 1:669-76.24. Boyar RP, Loughridge JR. The Fat Protein Exchange List: a tool
for teaching and evaluating low-fat diets. J Am Diet Assocl985;85:589-94.
25. Wynder EL, Hebert JR. Homogeneity in nutritional exposures: anobstacle in cancer epidemiology. JNCI 1987;79:605-7.
26. Reddy MM, Pinyavat N, Grieco MH. Interleukin II augmentationof natural killer cell activity in homosexual men with acquired im-mune deficiency. Infect Immun 1984;44:339-43.
27. Tukey JW. Exploratory data analysis. Reading, MA: Addison-Wesley, 1977.
28. Draper NR, Smith H. Applied research analysis. New York: JohnWiley&Sons, 1981.
29. Statistical Analysis System Institute. SAS user’s guide: Statistics.
5th ed. Cary, NC: SAS Institute, Inc, 1985.30. Marr JW. Individual dietary surveys: purposes and methods.
World Rev Nutr Diet 197 1; 13:105-64.
31. Krantzler NJ, Mullen BJ, SchuLz GH, Grivetti LE, Holden MS.Meiselman HL. Validity oftelephoned diet recalls and records for
assessment of individual food intake. Am J Clin Nutr 1982;36:1234-42.
32. Hebert JR. Miller DR. Methodologic considerations for investigat-ing the diet-cancer link. Am J Clin Nutr 1988;47: 1068-77.
33. Liu K, Stamler J, Dyer A, McKeever J, McKeever P. Statisticalmethods to assess and minimize the role of intra-individual vari-ability in observing the relationship between dietary lipids and se-rum cholesterol. J Chronic Dis l978;3l:399-418.
34. El Lozy M. Dietary variability and its impact on nutritional epide-miology. J Chronic Dis 1983; 36:237-49.
35. Hebert JR. Relationship ofvegetarianism to child growth in South
India. Am J Clin Nutr l985;42: 1246-54.36. Chandra RK, Tejpar S. Review/commentary-diet and immuno-
competence. Int J Immunopharmacol l983;5:l75-80.
37. Hamazaki T, Yamashita N, Yokoyuma A, et al. Natural killer cellsand eicosapentaenoic acid. In: Lunds WEM, ed. Proceedings of theAmerican Oil Chemical ChemistsSociety Short Course on Polyun-
saturated Fatty Acids and Eicosanoids 1987. Champaign, IL:AOCS, 1987:127-32.
38. Carroll K�K, Khor HT. Dietary fat in relation to tumorigenesis.Prog Biochem Pharmacol 1975; 10:308-53.
39. Weindruch R, Walford RL, Fligiel 5, Guthrie D. The retardationofaging in mice by dietary restriction: longevity, cancer, immunityand lifetime energy intake. J Nutr 1986; 1 16:641-54.
40. Weindruch T, Gortesman SRS, Walford RL. Modification of age-related immune decline in mice dietarily restricted from and aftermid-adulthood. Proc Natl Acad Sci USA 1982;79:898-902.
41. Weindruch T, Devens BH, RaffHV, Walford RL. Influence of di-
etary restriction and aging on natural killer cell activity in mice.J Immunol 1983; 130:993-6.
42. Berry EM, Hirsch J, Most J, McNamara DJ, Cunningham-Run-
dles S. Dietary fat, plasma lipoproteins and immune function inmiddle-aged American men. Nutr Cancer l987;9:129-42.
43. Pross HF, Baines MG. Studies of human natural killer cells. I Invivo parameters affecting normal cytotoxic function. Int J Cancerl982;29:383-90.
44. Pross HF, Callewaert D, Rubin P. CH1-assays for NK cell cyto-
toxicity-their values and pitfalls. In: Lotzova E, Herberman RB,eds. Immunobiology ofnatural killer cells. Vol I. Boca Raton, FL:CRCPreSS, 1986.
45. Snedecor GW, Cochran WG. Statistical methods. 6th ed. Ames,IA: Iowa State University Press, 1974.
by guest on July 10, 2011w
ww
.ajcn.orgD
ownloaded from