Devolatilization-induced pressure build-up: Implications for reaction front movement and breccia...
15
Devolatilization-induced pressure build-up: Implications for reaction front movement and breccia pipe formation I. AARNES 1,2 , Y. PODLADCHIKOV 3 , H. SVENSEN 1 1 Roxar ASA, Lysaker, Norway; 2 Physics of Geological Processes, University of Oslo, Blindern, Oslo, Norway; 3 Institute of Geophysics, University of Lausanne, Lausanne, Switzerland ABSTRACT Generation of fluids during metamorphism can significantly influence the fluid overpressure, and thus the fluid flow in metamorphic terrains. There is currently a large focus on developing numerical reactive transport models, and with it follows the need for analytical solutions to ensure correct numerical implementation. In this study, we derive both analytical and numerical solutions to reaction-induced fluid overpressure, coupled to temperature and fluid flow out of the reacting front. All equations are derived from basic principles of conservation of mass, energy and momentum. We focus on contact metamorphism, where devolatilization reactions are particularly important owing to high thermal fluxes allowing large volumes of fluids to be rapidly generated. The analytical solutions reveal three key factors involved in the pressure build-up: (i) The efficiency of the devolatilizing reaction front (pressure build-up) relative to fluid flow (pressure relaxation), (ii) the reaction temperature relative to the available heat in the system and (iii) the feedback of overpressure on the reaction temperature as a function of the Clapeyron slope. Finally, we apply the model to two geological case scenarios. In the first case, we investigate the influence of fluid overpressure on the movement of the reaction front and show that it can slow down signif- icantly and may even be terminated owing to increased effective reaction temperature. In the second case, the model is applied to constrain the conditions for fracturing and inferred breccia pipe formation in organic-rich shales owing to methane generation in the contact aureole. Key words: analytical solutions, breccia pipes, contact metamorphism, devolatilization, fluid overpressure Received 8 November 2011; accepted 24 May 2012 Corresponding author: Ingrid Aarnes, Physics of Geological Processes, University of Oslo, PO Box 1048 Blindern, 0316 Oslo, Norway. Email: [email protected]. Tel: +47 22547842. Fax: +47 51818801 Geofluids (2012) INTRODUCTION Metamorphic devolatilization of sedimentary rocks is a key process during progressive metamorphism. Usually, the positive change in fluid volume upon devolatilization is lar- ger than the corresponding decrease in solid volume, caus- ing a net volume increase in the reaction. If the sudden volume increase cannot be accommodated by the host-rock, the fluid pressure will build up (Hanshaw & Bredehoeft 1968; Thompson 1987; Walther 1990). Fluid overpressure is present when the fluid pressure exceeds the background hydrostatic pressure. Understanding the pro- cesses related to the release of metamorphic carbon fluids (CH 4 and CO 2 ) is important also in a broader perspective of the global carbon cycle (e.g. Bickle 1996; Svensen et al. 2004; Aarnes et al. 2010). There has been a recent focus on volume changing reac- tions as a driving force to pressure build-up, both in the case of isochoric conditions and in the presence of fluid flow (e.g. Manning & Bird 1991; Corbet & Bethke 1992; Bred- ehoeft et al. 1994; Dutrow & Norton 1995; Labotka et al. 2002; Jamtveit et al. 2004). In this study, we systematically explore this process one step further, by deriving analytical solutions for overpressure generation coupled to a thermally driven reaction front, while at the same time, honouring pressure relaxation by fluid flow. The analytical solutions are cross-verified by similar numerical solutions. In the anal- ysis, we identify the important parameters, which allow us to estimate the magnitude of the fluid overpressure directly. Hence, the analytical solutions presented in this study are important tools that can be applied in their current state to a wide range of geological phenomena. Geofluids (2012) doi: 10.1111/j.1468-8123.2012.00368.x Ó 2012 Blackwell Publishing Ltd
-
Upload
independent -
Category
Documents
-
view
2 -
download
0
Transcript of Devolatilization-induced pressure build-up: Implications for reaction front movement and breccia...

Devolatilization-induced pressure build-up: Implications forreaction front movement and breccia pipe formation
I . AARNES1, 2 , Y. PODLADCHIKOV3, H. SVENSEN1
1Roxar ASA, Lysaker, Norway; 2Physics of Geological Processes, University of Oslo, Blindern, Oslo, Norway; 3Institute of
Geophysics, University of Lausanne, Lausanne, Switzerland
ABSTRACT
Generation of fluids during metamorphism can significantly influence the fluid overpressure, and thus the fluid
flow in metamorphic terrains. There is currently a large focus on developing numerical reactive transport models,
and with it follows the need for analytical solutions to ensure correct numerical implementation. In this study, we
derive both analytical and numerical solutions to reaction-induced fluid overpressure, coupled to temperature and
fluid flow out of the reacting front. All equations are derived from basic principles of conservation of mass,
energy and momentum. We focus on contact metamorphism, where devolatilization reactions are particularly
important owing to high thermal fluxes allowing large volumes of fluids to be rapidly generated. The analytical
solutions reveal three key factors involved in the pressure build-up: (i) The efficiency of the devolatilizing reaction
front (pressure build-up) relative to fluid flow (pressure relaxation), (ii) the reaction temperature relative to the
available heat in the system and (iii) the feedback of overpressure on the reaction temperature as a function of
the Clapeyron slope. Finally, we apply the model to two geological case scenarios. In the first case, we investigate
the influence of fluid overpressure on the movement of the reaction front and show that it can slow down signif-
icantly and may even be terminated owing to increased effective reaction temperature. In the second case, the
model is applied to constrain the conditions for fracturing and inferred breccia pipe formation in organic-rich
shales owing to methane generation in the contact aureole.
Key words: analytical solutions, breccia pipes, contact metamorphism, devolatilization, fluid overpressure
Received 8 November 2011; accepted 24 May 2012
Corresponding author: Ingrid Aarnes, Physics of Geological Processes, University of Oslo, PO Box 1048 Blindern,
0316 Oslo, Norway.
Email: [email protected]. Tel: +47 22547842. Fax: +47 51818801
Geofluids (2012)
INTRODUCTION
Metamorphic devolatilization of sedimentary rocks is a key
process during progressive metamorphism. Usually, the
positive change in fluid volume upon devolatilization is lar-
ger than the corresponding decrease in solid volume, caus-
ing a net volume increase in the reaction. If the sudden
volume increase cannot be accommodated by the
host-rock, the fluid pressure will build up (Hanshaw &
Bredehoeft 1968; Thompson 1987; Walther 1990). Fluid
overpressure is present when the fluid pressure exceeds the
background hydrostatic pressure. Understanding the pro-
cesses related to the release of metamorphic carbon fluids
(CH4 and CO2) is important also in a broader perspective
of the global carbon cycle (e.g. Bickle 1996; Svensen et al.
2004; Aarnes et al. 2010).
There has been a recent focus on volume changing reac-
tions as a driving force to pressure build-up, both in the
case of isochoric conditions and in the presence of fluid flow
(e.g. Manning & Bird 1991; Corbet & Bethke 1992; Bred-
ehoeft et al. 1994; Dutrow & Norton 1995; Labotka et al.
2002; Jamtveit et al. 2004). In this study, we systematically
explore this process one step further, by deriving analytical
solutions for overpressure generation coupled to a thermally
driven reaction front, while at the same time, honouring
pressure relaxation by fluid flow. The analytical solutions
are cross-verified by similar numerical solutions. In the anal-
ysis, we identify the important parameters, which allow us
to estimate the magnitude of the fluid overpressure directly.
Hence, the analytical solutions presented in this study are
important tools that can be applied in their current state to
a wide range of geological phenomena.
Geofluids (2012) doi: 10.1111/j.1468-8123.2012.00368.x
� 2012 Blackwell Publishing Ltd

We present two case studies to illustrate some geological
applications: (i) the feedback of overpressure on the move-
ment of the reaction front; (ii) breccia pipe formation in
contact aureoles in organic-rich shales owing to the meth-
ane generation, as suggested by Svensen et al. (2007).
The model is solved for contact metamorphism specifi-
cally, but the results are also relevant for regional prograde
metamorphism, and other areas with high heat flow, such
as crustal shear zones and zones with magmatic activity
during crustal thickening (e.g. Leloup et al. 1999; Baxter
et al. 2002; Ague & Baxter 2007; Weinberg et al. 2009).
Contact metamorphism is of particular relevance owing
to the rapid heat transfer causing efficient metamorphic
devolatilization of the intruded sediments (e.g. Simoneit
et al. 1978; Jamtveit et al. 1992; Lasaga & Rye 1993;
Bishop & Abbott 1995; Cooper et al. 2007; Nabelek
2007; Aarnes et al. 2010). Overpressure during contact
metamorphism can be generated by several volume chang-
ing processes, such as boiling and thermal expansion of
pore fluids, buoyancy effects, release of magmatic fluids
and fluid generation within the contact aureole (e.g. Fur-
long et al. 1991; Hanson 1992, 1995; Nabelek & Labotka
1993; Osborne & Swarbrick 1997). There are several stud-
ies focused on the overpressures resulting from boiling and
thermal expansion of pore fluids, especially around large
plutons (Knapp & Knight 1977; Norton & Knight 1977;
Einsele et al. 1980; Delaney 1982; Manning & Bird 1991;
Cathles et al. 1997; Cui et al. 2001; Jamtveit et al. 2004).
However, we do not include this process as incorporation
of the equation of state for fluid, solid or pore compress-
ibility into our derivations is outside the scope of this
study.
Reactive transport models in porous media coupling
mass transport, heat, fluid flow and chemical reactions in
various geological systems are well documented in the liter-
ature (e.g. Lichtner 1985, 1988; Ortoleva et al. 1987;
Baumgartner & Ferry 1991; Steefel & Lasaga 1994; Kele-
men et al. 1995; Le Gallo et al. 1998; Xu & Pruess 2001;
Gaus et al. 2005). A key topic in these models is fluid–rock
interactions, with for example coupling of fluid flow and
solute concentrations, or coupling of solute concentrations
and temperature (Steefel & Maher 2009; and references
therein). There is, however, limited focus on the hydro-
logic driving forces for the fluid flow or on the pressure
feedback on the reactions. A standard simplification in the
derivations of the fluid flux is to consider conservation of
the fluid mass in a steady-state flow regime as a response
to thermal expansion only (Furlong et al. 1991; Ferry &
Gerdes 1998). The aim of this study is to make the first
step towards a more elaborate pressure model to be uti-
lized in fully coupled reactive transport modelling.
Several studies demonstrate the importance of devolatil-
ization reactions on fluid pressure and fluid flow through
the effective volume change (e.g. Connolly 1997; Balashov
& Yardley 1998; Nabelek 2009). A potentially important
implication of increased fluid pressure is the feedback on
the reaction front propagation for pressure-dependent
reactions (Colten-Bradley 1987; Osborne & Swarbrick
1997; Miller et al. 2003; Wang & Wong 2003). Dehydra-
tion of gypsum yields a relevant example of how the high
pore pressures inhibit the reaction until fluid flow relaxes
the overpressure (Wang & Wong 2003). The importance
of the pressure dependence of the reaction is among oth-
ers documented for the dehydration conditions in the
Southern Alps, New Zealand, where reducing the pressure
is the key for triggering dehydration reactions (Vry et al.
2010).
Evidences of significant overpressure generation during
contact metamorphism come from the development of
fracture networks (e.g. Nishiyama 1989; Manning & Bird
1991; Nabelek & Labotka 1993; Aarnes et al. 2011b), flu-
idization of the host sediment (Delaney 1982; Kokelaar
1982), formation of sandstone dykes (Walton & O’Sullivan
1950; Svensen et al. 2010) and hydrothermal vent com-
plexes and breccia pipes (Jamtveit et al. 2004; Svensen
et al. 2004, 2006, 2007; Planke et al. 2005). The latter
two are both vertical, circular channels extending from
within the aureoles to the paleosurface. The difference in
terminology is that hydrothermal vent complexes are
formed as a result of boiling and expansion of pore fluids
in shallow aureoles no deeper than approximately 1 km
where boiling of H2O can be expected (Jamtveit et al.
2004). Breccia pipes, on the other hand, origin in aureoles
several kilometres down where boiling of water is no
longer expected, and their documented existence provides
spectacular evidence for fluid pressure build-up in the
metamorphic aureoles (e.g. Svensen et al. 2007). However,
their formation mechanism is still not resolved, and we
therefore use the results of this study to investigate
whether the breccia pipes can be triggered by the reaction-
induced pressure build-up from methane release in heated
shales.
THEORETICAL BACKGROUND ANDMETHODS
Temperature of a cooling sill
Conductive heat transfer
The standard equations, for example, pressure and temper-
ature diffusion given in textbooks such as Carslaw & Jaeger
(1959), are derived under the assumption that these pro-
cesses operate alone. However, when dealing with coupled
processes, care must be taken to ensure that we utilize a
thermodynamically consistent set of equations that includes
all potential feedback processes. This is properly taken care
of in this study by deriving all equations from basic princi-
ples of conservation of energy, mass and momentum,
2 I. AARNES et al.
� 2012 Blackwell Publishing Ltd

combined with a local thermodynamic equilibrium
approach. A detailed explanation of all the steps involved
in the derivation of the system of equations used in this
study can be found in Aarnes (2010). A list of all symbols
used in this study is presented in Table 1.
In our model, we represent the heat transfer between
the magma and host-rocks by a conductive heat equation
with latent heat of crystallization. The heat conduction
equation can be written
oT
ot¼ �T
o2T
oz2ð1Þ
where z is the vertical direction, t is time, T is tempera-
ture, �T ¼ �=�=Cp is the thermal diffusivity, Cp is the
specific heat capacity, q is density and k is the thermal
conductivity. We use this relation as a first-order approxi-
mation to the heat transfer, and hence do not consider
heat transport by fluid advection in this study. One key
parameter to determine the influence of advective heat is
the ratio of fluid available to carry the heat versus the
total rock volume to be heated. This was analysed in a
study of Podladchikov & Wickham (1994), who showed
that for a release of <10 wt% of fluid, heat advection is
negligible regardless of what numbers the other parame-
ters take. For our setup with the single release of no more
than approximately 10 wt.% of metamorphic fluids, the
diffusive heat transfer regime provides sufficient complex-
ity to effectively capture the bulk change in the tempera-
ture relevant for the processes involved. However, this
may be a too simplified assumption in other settings not
considered here, such as around large plutons or in aure-
oles with considerable amounts of heated pore fluids
flushing through the host-rocks (e.g. Bickle & McKenzie
1987). The model is further simplified by considering a
one-dimensional formulation, which captures the key
response in horizontally layered rocks, as well as giving
boundary conditions that allow us to solve the equations
analytically.
Latent heat of crystallization
Specific latent heat, Dh, is given in J ⁄ kg and is the amount
of energy released upon the phase transition from melt to
crystals in a cooling magma. We use two common meth-
ods to treat this reaction: (i) The sharp interface approach
used in the analytical solution, where we determine the
position of the reaction front and follow its progression
towards the centre of the intrusion with time; (ii) The dif-
fuse interface approach used in the numerical solution,
where the front is approximated over an temperature inter-
val between the liquidus (TL) and solidus (TS) tempera-
tures. The two methods are equivalent in the limit where
TS is similar to TL, which is the case, for example eutectic
crystallization. Although mafic intrusions are not eutectic,
the effect on cooling time between a linear heat capacity
model in comparison with more elaborated models is neg-
ligible for melts of mafic composition (Podladchikov &
Wickham 1994; Turcotte & Schubert 2002).
Table 1 A list of symbols used in this paper.
Symbols Descriptions Units
af Isobaric thermal expansion 1 ⁄ Kb Effective fluid compressibility 1 ⁄ Pa
Cp Heat capacity J ⁄ kg ⁄ K/ Porosity –
Dh Specific latent heat J ⁄ kg
jT Thermal diffusivity m2 ⁄ sjH Hydraulic diffusivity m2 ⁄ sL* Latent heat effect of crystallization J ⁄ kg ⁄ Kk Thermal conductivity J ⁄ s ⁄ m ⁄ Klf Fluid viscosity Pas
nT Nondimensional parameter in thermal regime –
nP Nondimensional parameter in pressure regime –
�mT Nondimensional rate of crystallization front –
�cT Nondimensional contact position –
�rT Nondimensional reaction front –
Pf Fluid pressure Pa
Pr Fluid pressure at the reaction front Pa
PV Pressure from volume change of reaction
(max overpressure)
Pa
DPf Fluid overpressure Pa
Phr Background hydrostatic pressure Pa
PC Contact pressure Pa
P* Normalized overpressure –
DPr Fluid overpressure at the reaction front Pa
P�r Normalized fluid overpressure at
the reaction front
–
dP ⁄ dT Clapeyron slope Pa ⁄ KQ total
f Source of total fluids generated at the front kg ⁄ m3
Qq,f Rate of fluid mass production per unit
volume of rock
kg ⁄ m3 ⁄ s
q Density kg ⁄ m3
Ri Nondimensional ratio of reaction
front vs. fluid flow
–
Rc Parameter describing pressure
dependence of reaction
–
Ste Stefan number -
t Time s
T Temperature K
TL Liquidus temperature of melt K
TS Solidus temperature of melt K
Thr Initial host-rock temperature K
Tm Initial melt temperature K
Tc Contact temperature between
intrusion and host-rock
K
Tr Reaction temperature isograd K
T* Normalized temperature –
Tc* Normalized contact temperature –
Tr0 Initial reaction temperature
(no pressure influence)
K
T effr Effective reaction temperature
(influenced by pressure)
K
DThp Parameter describing additional heating
for reaction to proceed
–
z Vertical direction m
zr Position of the reaction front m
Devolatilization-induced pressure buildup 3
� 2012 Blackwell Publishing Ltd

The sharp interface approach is performed by treating
the latent heat release by a heat balance at the crystalliza-
tion front (e.g. Turcotte & Schubert 2002),
�Dhdzm
dt¼ � oT
oz
� �z¼zm
ð2Þ
This equation is used to derive the position of the reac-
tion front as a function of both heat conduction and the
latent heat release, where more latent heat results in a
slower crystallization front.
The diffuse interface approach, also known as the effec-
tive heat capacity method, is frequently introduced for
numerical solutions (e.g. Lewis et al. 1996). We can treat
the latent heat release as an effective heat capacity increase
in the interval between TS and TL,
Cpeff ¼ Cpð1þ L�Þ for TS<T<TL
Cpeff ¼ Cp for T � TS and T � TL
ð3Þ
where the latent heat effect is approximated by
L� ¼ DhCp TL�TSð Þ.
Fluid pressure during prograde metamorphism
Fluid pressure evolution
The simplified hydraulic diffusion equation can be written as
oPf
ot¼ �H
o2Pf
oz2; ð4Þ
where Pf is the fluid pressure, �H ¼ k=ð’��f Þ is the
hydraulic diffusivity coefficient, k is permeability, lf is fluid
viscosity, / is porosity and b is the effective fluid compress-
ibility.
Compressibility of the porous matrix adds to the total
storage, and we make a rough approximation to this effect
by using an effective fluid compressibility. More sophisti-
cated models incorporating the effect of matrix deforma-
tion will require full coupling of the fluid flow equation to
the system of equations describing the matrix deformation
and total stress history and is not within the scope of this
study. The response of matrix to a localized fluid pressure
build-up is investigated in Rozhko et al. (2007) for a non-
reactive case.
The effect of gravitational flow owing to buoyancy is
incorporated implicitly through solving for pressures in
excess of the background hydrostatic pressures.
Reaction-induced pressure
The key unknown parameter to be solved for in this study
is the fluid pressure at the reaction front, Pr, as a result of
the fluids released from the host-rock. It is coupled to
temperature through the devolatilizing reaction front, zr,
which we assume for simplicity is coinciding with a
reaction temperature isograd, Tr (Fig. 1). The position of
this reaction front is controlled by the efficiency of heat
diffusion into the host-rock. If the generated fluids cannot
move away from the reaction front, the overpressure is
controlled by the effective volume change in the reaction,
which can be readily calculated. We refer to this process as
the isochoric pressure build-up. However, if the fluids are
flowing away from the reaction front, the overpressure at
the front is reduced by this distribution of the pressure fur-
ther out into the host-rock (Fig. 1).
By analogy with the conservation of energy for latent
heat (Eq. 2), the reaction-induced pressure source can be
incorporated into the analytical solution using the sharp
interface approach, by setting up a mass balance relation at
P
z
PrPhr
∆Pr
T
z
TmThr
Tr
TS
TL
Tc
Melt
Crystals
Reacted host-rock
Reaction front ( zr )
Crystallization front ( zm )
Melt + crystals
Ho
st-r
ock
Intr
usi
on
Temperature profileat a given time
Pressure profileat a given time
P
Fig. 1. A schematic drawing of temperature and
pressure profiles at a certain time after sill
emplacement. There are two moving fronts; the
crystallization front (zm) and the reaction front
(zr). The crystallization front (zm) marks the inter-
face between melt and crystals and moves
towards the centre of the intrusion with time.
Latent heat is released upon crystallization in the
zone where melt and crystals exist. The reaction
front follows the reaction temperature isograd
(Tr) and marks the interface between the devola-
tilization reactions and the un-reacted host-rock.
The release of fluids at the reaction front builds
up overpressure Pr relative to background hydro-
static pressure Phr.
4 I. AARNES et al.
� 2012 Blackwell Publishing Ltd

the reaction front. Conservation of mass requires that the
fluid production rate at the reaction front equals the fluid
expulsion rate away from the reaction front,
1
�f
� 1
�s
!Q total
f
dzr
dt¼ � k
�f
oDPf
oz
� �z¼zr
; ð5Þ
where Q totalf is the source term for the total amount of fluids
generated at the front (kgfluid ⁄ m3rock) and DPf = Pf - Phr is
the fluid overpressure, that is, the fluid pressure relative to
the background hydrostatic pressure (Phr) prior to any dev-
olatilization reaction. The left-hand side of Eq. (5) describes
the fluid production rate at the reaction front, and the right-
hand side of Eq. (5) describes the expulsion rate out of the
front following Darcian flux down the pressure gradient.
This balance assumes a steady-state fluid flux away from the
reaction front and further into the host-rock.
In the numerical solution of pressure, the devolatiliza-
tion reaction is more conveniently implemented as a sepa-
rate source term in Eq. (4),
oPf
ot¼ �H
o2Pf
oz2þ 1
�f
� 1
�s
!Q�;f
��; ð6Þ
where 1 ⁄ qf - 1 ⁄ qs is the net volume change in the reaction,
qf is the fluid density (kgfluid ⁄ m3fluid), qs is the solid density
(kgrock ⁄ m3rock) and Qq,f is the rate of fluid mass production
per unit volume of rock (kgfluid ⁄ m3rock ⁄ s) (e.g. Aarnes
2010). The source term (Qq,f) encompasses the combined
fluid products from all devolatilization reactions occurring
at the reaction front. Eq. (6) shows that the fluid pressure
evolves through time owing to the imbalance between the
reduction in pressure through diffusive flux and the
increase in pressure through the source term. Although we
focus on devolatilization, the source term can describe any
volume changing process such as melting or expansion of
pore fluids. For thermal expansion in an isochoric system,
the source term becomesf
��dTdt , where af is isobaric thermal
expansion of the fluid (e.g. Domenico & Palciauskas
1979). This process is not considered in this study as the
volume change from thermal expansion of existing pore
fluids is negligible compared to the volume change in a
devolatilization reaction going from solid to fluid.
FORMULATION OF ANALYTICALSOLUTIONS
Temperature
The analytical solutions presented in this paper are simpli-
fied representations of the complex nature and are focused
on reaction-induced pressure build-up with drainage, and
feedback mechanisms on the metamorphic reactions. We
need the specification of boundary conditions as well as a
few basic assumptions about our system to arrive at these
solutions. The relatively simple, yet nontrivial structure of
the final equations allows us to acquire a good understand-
ing of the key parameters involved.
We start by presenting the well-known analytical solu-
tion for temperature in a contact metamorphic setting, as
we believe that understanding this approach is the key to
recognize the similar procedure applied for the hydraulic
regime, as well as the coupling between the two.
The analytical solution to the thermal equation (e.g.
Turcotte & Schubert 2002) can be written
T �ð�T Þ ¼erfcð�T Þ
1þ erf ð�mT Þ; ð7Þ
where
�T ¼ z=2ffiffiffiffiffiffiffiffi�T tp
ð8Þ
is a nondimensional parameter combining time and space, �mT
is related to the progression of the crystallization front and
T � ¼ ðT � ThrÞ=ðTm � ThrÞ ð9Þ
is the normalized temperature. Thr is the initial host-rock
temperature and Tm is the initial melt temperature. Eq. (7)
is the classical solution to the linear second-order differen-
tial equations in a semi-infinite half-space (e.g. Carslaw &
Jaeger 1959; Crank 1979; Turcotte & Schubert 2002;
Philpotts & Ague 2009). The error function has the prop-
erties that erf ð0Þ ¼ 0 and erf ð1Þ ¼ 1; and erfcð�Þ ¼1� erf ð�Þ. The boundary conditions are the following:
T �ð�mT Þ ¼ T �m ¼ 1 at the crystallization front, and
T �ð�1T Þ ¼ T �hr ¼ 0 infinitely far into the host-rock.
The temperature at the contact between the sill and the
host-rock (Tc) and the temperature at which the reaction
occurs (Tr) are of key interest in our model. They are found
from the substitution of nT with �cT ¼ 0 (nondimensional
contact) and �rT (nondimensional front), respectively, giving
Tc ¼ Thr þðTm � ThrÞ1þ erf ð�m
T Þð10Þ
Tr ¼ Thr þðTm � ThrÞerfcð�r
T Þ1þ erf ð�m
T Þð11Þ
The reaction fronts
The parameter �mT describes how fast the crystallization
front reaches a given position. The location of this crystalli-
zation boundary in the dimensional coordinate system zm
is found by substituting for z in Eq. (8),
zm ¼ �2�mT
ffiffiffiffiffiffiffiffi�T tp
: ð12Þ
This relation shows that �mT can be interpreted as a con-
stant controlling the progression of the crystallization front
in the dimensional coordinate system. The implicit equa-
tion for calculating the constant �mT is
Devolatilization-induced pressure buildup 5
� 2012 Blackwell Publishing Ltd

Ste ¼ Dh
Cp Tm � Thrð Þ ¼exp ��m2
T
� �ffiffiffip
�mT 1þ erf �m
T
� �� � ð13Þ
where the left-hand side is the Stefan number (Ste) (e.g.
Turcotte & Schubert 2002). The equation defines a
unique correspondence between Ste and �mT . The unknown
�mT can be found by specifying the values in the left-hand
side of Eq. (13) and solve the equation iteratively. The
nondimensional contact temperature T �c is dependent on
the Stefan number, where more latent heat released upon
crystallization corresponds to a higher contact temperature.
The spatial position of the devolatilizing reaction front
zr is controlled by the temperature evolution,
zr ¼ 2�rT
ffiffiffiffiffiffiffiffi�T tp
ð14Þ
where the constant �rT is the position of the reaction front
(i.e. the isograd of the reaction temperature) in the nondi-
mensional coordinate system. �rT can be interpreted as a fac-
tor controlling the progression of the devolatilizing reaction
front in the aureole; for a large value of �rT , the reaction
front will be located further away from the contact at a cer-
tain time compared to a smaller value. It thus plays a similar
role as the �mT does for determining the movement of the
crystallization front. The way to find the proper expression
for �rT is nontrivial and will be discussed in a later section.
Pressure
The pressure equation is solved analytically analogous to
the temperature equation by three main steps: (i) transfor-
mation of the partial differential equation (Eq. 4) through
dimensional analysis, (ii) specification of the boundary con-
ditions and solving the equation with the aid of, for exam-
ple, the technical computing software Maple and (iii)
treating the pressure source at the reaction front (Eq. 5).
As boundary conditions, we set the overpressure infi-
nitely far from the reaction front to zero, DPf ð�1P Þ ¼ 0,
and the fluid overpressure at the contact to an unknown
constant, DPf ð0Þ ¼ PC . The analytical solution for over-
pressure then becomes
DPf �Pð Þ ¼ erfc �Pð ÞPC ; ð15Þ
where the nondimensional parameter nP is defined as
�P ¼ z=2ffiffiffiffiffiffiffiffiffi�H tp
: ð16Þ
In the dimensional coordinate system, Eq. (15) can be
written as
DPf z; tð Þ ¼ erfczffiffiffiffiffiffiffiffiffi�H tp� �
PC : ð17Þ
In this equation, we can see the similarity with the ana-
lytical solution of temperature. However, it is not possible
to solve this equation without the proper expression for
the contact pressure PC, which will be discussed in the fol-
lowing section.
The contact pressure
The expression for PC can be found from solving the con-
servation of mass relation (Eq. 5) at the reaction front.
Rearranging Eq. (5) with proper substitution and solving
the expression for PC yields:
PC ¼1
�f
� 1
�s
!Q total
f
’�
ffiffiffip
�rT
ffiffiffiffiffiffiffi�T
�H
r� �exp �r2
T
�T
�H
� �: ð18Þ
Time cancels out of Eq. (18), which implies that the
contact pressure is not a function of time in our analysis.
This is consistent with our assumption of a constant PC as
the boundary condition of the pressure equation. This
does not imply that contact pressure cannot vary, but that
it varies considerably less than the fluid pressures at other
locations with our model setup.
Because we have obtained an expression for the pressure
at the contact, we can substitute this into Eq. (17) to
obtain the final analytical solution for the overpressure,
DPf �Pð Þ ¼ erfc �Pð Þ1
�f
� 1
�s
!Q total
f
’�
ffiffiffip
�rT
ffiffiffiffiffiffiffi�T
�H
r� �
� exp �r2T
�T
�H
� �ð19Þ
We can more easily identify the physical meaning of this
solution by assigning a nondimensional parameter Ri to
the group:
Ri ¼ �rT
� �2�T
�H; ð20Þ
which describes the competition between the progression
of the reaction front and the efficiency of the hydraulic dif-
fusion. A large value for Ri is equivalent to a high reaction
intensity, that is, when the reaction front is faster than the
fluid flow. Furthermore, we recognize that the ratio of
constants in Eq. (19) defines the overpressure generated at
constant volume, PV, that is, at isochoric conditions,
PV ¼1
�f
� 1
�s
!Q total
f
’�: ð21Þ
Isochoric condition implies no release of overpressure by
fluid flow. PV defines the maximum overpressure that can
be generated. The source term in the pressure equation
used for the numerical solution (Eq. 6) can be recovered
by taking the rate of Eq. (21), to illustrate that the two
solutions are consistent.
6 I. AARNES et al.
� 2012 Blackwell Publishing Ltd
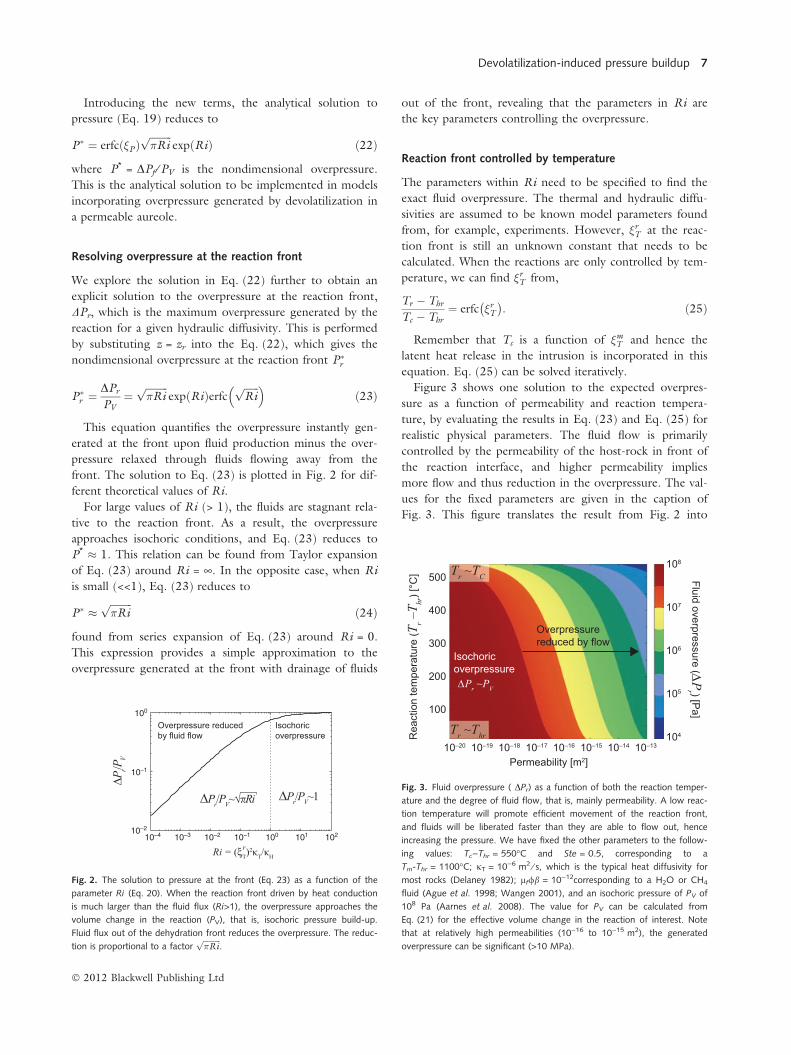
Introducing the new terms, the analytical solution to
pressure (Eq. 19) reduces to
P� ¼ erfc �Pð ÞffiffiffiffiffiffiffiffiffiRip
exp Rið Þ ð22Þ
where P* = DPf ⁄ PV is the nondimensional overpressure.
This is the analytical solution to be implemented in models
incorporating overpressure generated by devolatilization in
a permeable aureole.
Resolving overpressure at the reaction front
We explore the solution in Eq. (22) further to obtain an
explicit solution to the overpressure at the reaction front,
DPr, which is the maximum overpressure generated by the
reaction for a given hydraulic diffusivity. This is performed
by substituting z = zr into the Eq. (22), which gives the
nondimensional overpressure at the reaction front P�r
P�r ¼DPr
PV¼
ffiffiffiffiffiffiffiffiffiRip
exp Rið ÞerfcffiffiffiffiffiffiRip� �
ð23Þ
This equation quantifies the overpressure instantly gen-
erated at the front upon fluid production minus the over-
pressure relaxed through fluids flowing away from the
front. The solution to Eq. (23) is plotted in Fig. 2 for dif-
ferent theoretical values of Ri.
For large values of Ri (> 1), the fluids are stagnant rela-
tive to the reaction front. As a result, the overpressure
approaches isochoric conditions, and Eq. (23) reduces to
P* � 1. This relation can be found from Taylor expansion
of Eq. (23) around Ri = ¥. In the opposite case, when Ri
is small (<<1), Eq. (23) reduces to
P� �ffiffiffiffiffiffiffiffiffiRip
ð24Þ
found from series expansion of Eq. (23) around Ri = 0.
This expression provides a simple approximation to the
overpressure generated at the front with drainage of fluids
out of the front, revealing that the parameters in Ri are
the key parameters controlling the overpressure.
Reaction front controlled by temperature
The parameters within Ri need to be specified to find the
exact fluid overpressure. The thermal and hydraulic diffu-
sivities are assumed to be known model parameters found
from, for example, experiments. However, �rT at the reac-
tion front is still an unknown constant that needs to be
calculated. When the reactions are only controlled by tem-
perature, we can find �rT from,
Tr � Thr
Tc � Thr¼ erfc �r
T
� �: ð25Þ
Remember that Tc is a function of �mT and hence the
latent heat release in the intrusion is incorporated in this
equation. Eq. (25) can be solved iteratively.
Figure 3 shows one solution to the expected overpres-
sure as a function of permeability and reaction tempera-
ture, by evaluating the results in Eq. (23) and Eq. (25) for
realistic physical parameters. The fluid flow is primarily
controlled by the permeability of the host-rock in front of
the reaction interface, and higher permeability implies
more flow and thus reduction in the overpressure. The val-
ues for the fixed parameters are given in the caption of
Fig. 3. This figure translates the result from Fig. 2 into
∆Pr/P
V
Ri = (ξT)2κT/κHr
Isochoricoverpressure
Overpressure reducedby fluid flow
∆Pr/PV~√�Ri ∆Pr/PV~1
100
10–1
10–2
10–1 100 101 10210–210–310–4
Fig. 2. The solution to pressure at the front (Eq. 23) as a function of the
parameter Ri (Eq. 20). When the reaction front driven by heat conduction
is much larger than the fluid flux (Ri>1), the overpressure approaches the
volume change in the reaction (PV), that is, isochoric pressure build-up.
Fluid flux out of the dehydration front reduces the overpressure. The reduc-
tion is proportional to a factorffiffiffiffiffiffiffiffiffiRip
.
400
500
100
200
300
10–19 10–1510–16 10–14 10–1310–20 10–1710–18
108
104
107
106
105
Fluid overpressure (∆Pr ) [P
a]
Isochoricoverpressure∆Pr ~PV
Overpressurereduced by flow
Permeability [m2]
Rea
ctio
n te
mpe
ratu
re (T
r –T hr
) [°C
]
Tr ~Thr
Tr ~TC
Fig. 3. Fluid overpressure ( DPr) as a function of both the reaction temper-
ature and the degree of fluid flow, that is, mainly permeability. A low reac-
tion temperature will promote efficient movement of the reaction front,
and fluids will be liberated faster than they are able to flow out, hence
increasing the pressure. We have fixed the other parameters to the follow-
ing values: Tc)Thr = 550�C and Ste = 0.5, corresponding to a
Tm-Thr = 1100�C; jT = 10)6 m2 ⁄ s, which is the typical heat diffusivity for
most rocks (Delaney 1982); lf/b = 10)12corresponding to a H2O or CH4
fluid (Ague et al. 1998; Wangen 2001), and an isochoric pressure of PV of
108 Pa (Aarnes et al. 2008). The value for PV can be calculated from
Eq. (21) for the effective volume change in the reaction of interest. Note
that at relatively high permeabilities (10)16 to 10)15 m2), the generated
overpressure can be significant (>10 MPa).
Devolatilization-induced pressure buildup 7
� 2012 Blackwell Publishing Ltd

realistic geological examples and shows that overpressures
between 1 and 10 MPa are possible even at permeabilities
of 10)13 to 10)16 m2. For rocks with smaller permeability
than 10)17 m2, the overpressure approximates PV of the
reaction. For reaction temperatures higher than about
400�C above the background host-rock temperature, isoch-
oric overpressure is only expected for very tight rocks, such
as unfractured shales or siliceous carbonates (<10)18 m2).
Comparison of numerical and analytical solutions
We have compared the analytical solutions to equivalent
numerical solutions to cross-verify the solutions. The
numerical solution is performed by explicit finite difference
method in 1D with a resolution of 1 · 1001. For the
treatment of the latent heat in the numerical solution, we
use the diffuse interface approach, with an effective heat
capacity in the thermal diffusivity coefficient (Eqs. 1
and 3). The source term of the pressure is calculated
explicitly by using Eq. (6). The comparisons are made in
the dimensional coordinate system, which makes the pre-
sented solution one out of several possible contact meta-
morphic systems. As an initial setup, we use T ð�d < z < 0Þ¼ Tm � Thr for the intrusion, and T 0 < z <1ð Þ ¼Thr � Thr ¼ 0 for the host-rock in both the analytical and
the numerical solutions. The initial condition for overpres-
sure is zero throughout the domain, that is, the fluid pres-
sure equals hydrostatic pressure.
The comparison shows that the sharp interface approach to
latent heat gives the same temperature profile as the diffuse
interface approach (Fig. 4A). Because of the different ways of
treating the latent heat, the two solutions differ slightly in the
crystallization interval. When solving the analytical expres-
sion, we include a condition specifying that �T <� �mT ¼ ��m
T ,
to extend the validity range of the analytical solution from
the crystallization front to the intrusion centre.
The analytical solution to the fluid pressure in the aure-
ole (Eq. 22) with mass balance at the front (Eq. 5) coin-
cides perfectly with the numerical solution to Eq. (6)
(Fig. 4B). Hence, we demonstrate the equivalence of the
sharp interface approach and a separate source term for the
fluid pressure. The validity range of the analytical solution
is extended from the intrusive contact to the reaction front
by Pf ð0 < z < zrÞ ¼ DPr . The extent of the reaction front,
�rT , is found from solving Eq. (25) for the thermal values
given in the caption of Fig. 4.
GEOLOGICAL APPLICATIONS
Reaction closure by fluid overpressure
A pressure-sensitive reaction front
In this section, we will use the calculated overpressure at
the reaction front to evaluate the feedback on the reaction
front progress. When the fluid pressure increases as a result
of dehydration, the equilibrium conditions for the reaction
are simultaneously shifted along the reaction curve in the
P-T space. We have illustrated this with tree hypothetical
Clapeyron slopes: (i) temperature controlled, (ii) interme-
diate and (iii) pressure controlled (Fig. 5). When the reac-
tion initiates, the temperature is equal to reaction
temperature (Tr) and pressure is equal to the background
host-rock pressure (Phr). As the fluids are liberated, the
fluid pressure increases by DPr. This elevated pressure cre-
ates a new equilibrium temperature condition for the reac-
tion depending on the Clapeyron slope. The new effective
reaction temperature requires more heating before the
reaction can continue, thus slowing down the progress of
the reaction front. If the reaction is predominantly pres-
sure-sensitive (line 3 in Fig. 6), this may even terminate
the reaction front progress.
Evaluating the pressure sensitivity
To evaluate the effect of the reaction closure quantitatively,
we correct Eq. (25) for the influence of the overpressure
and Clapeyron slope of the reaction by replacing the
–50 –25 0 25 50 75 1000
20
40
60
80
100
z [m] P
f–Phr
[MP
a]
Numericalanalytical
intrusion
Reaction front z
r
host-rock
Crystallization front z
m
0
200
400
600
800
1000
1200
T–T hr
[ºC
]
Temperature and pressure after 10 years
Numericalanalytical
PV
ΔPr = Pr–Phr
Tm-Thr
Tr–Thr
(A)
(B)
Fig. 4. Model result comparing the numerical and analytical solutions to
temperature (Eqs. 1 and 8) and pressure (Eqs. 3 and 16) for a sill with a
half-thickness of 50 m after 10 years. (A) Temperature relative to host-rock
temperature, with a latent heat of 320 kJ ⁄ kg; Tm)Thr = 1100;
Tr)Thr = 300; and jT = 10)6m2 ⁄ s. At the crystallization front, it is possible
to identify a small difference in the geometry of the two approximations
treating latent heat, while the overall result of the temperature profiles is
identical. (B) Overpressure relative to background host-rock pressure, with
a PV of 108 Pa (100 MPa) and jH = 10)6 m2 ⁄ s. The pressure profiles from
the numerical and analytical solutions are identical.
8 I. AARNES et al.
� 2012 Blackwell Publishing Ltd

effective reaction temperature with the initial reaction tem-
perature Tr0. From geometrical constraints, we find that
T effr ¼ Tr0 þ ðdT =dPÞDPr . Substitution of T eff
r into Eq.
(25) gives a pressure-dependent movement of the reaction
front,
dT
dP
DPr
Tc � Thr
� �þ Tr0 � Thr
Tc � Thr
� �¼ erfc �r
T
� �: ð26Þ
Although the Clapeyron slope is commonly presented as
dP ⁄ dT, we use the inverse to be consistent with the equa-
tions.
From this equation, we are able to identify the key
dependencies of �rT : (i) the reaction front temperature, (ii)
fluid flow out of the front and (iii) the Clapeyron slope.
To make a simple 2D representation of these three depen-
dencies, we have to make �rT as an explicit function of
Clapeyron slope and the influence of overpressure by com-
bining parameters and utilize approximate relations for DPr
and �rT . The first approximation P�r �
ffiffiffip
�rT
ffiffiffiffiffiffiffiffiffiffiffiffiffiffiffi�T =�H
pis
valid for the pressure build-up in the fluid flow regime
(Fig. 2). The second approximation erfcð�rT Þ � 1 is valid
for small values of �rT (<0.1). Employing these simplifica-
tions gives the expression
�rT �
dPV
dT
Tc � Tr
DPr
ffiffiffiffiffiffiffiffiffiffi1
�H
�T
r: ð27Þ
This expression can be simplified by defining two dis-
tinct parameters
�rT �
1
DThpRcð28Þ
where the pressure dependence is quantified by
Rc ¼ dT
dPV
DPr
Tc � Thrð Þ
ffiffiffiffiffiffiffiffiffiffi�T
�H
rð29Þ
and the additional heating of the host-rock required for
the reaction to proceed is quantified by
DThp ¼Tc � Thr
Tc � Tr: ð30Þ
Figure 6 shows the approximated value for �rT as a func-
tion of Rc and DThp. Red colours represent efficient reac-
tion fronts, and blue colours represent reaction closure.
We identify two domains, one where the reaction is tem-
perature controlled (vertical lines) and one where the reac-
tion is influenced by both temperature and pressure
(inclined lines). In the temperature domain (Rc < 1), the
reaction front progress is only dependent on the degree of
heating required for the host-rock to reach the effective
reaction temperature. A large value of DThp is equivalent of
a large degree of host-rock heating before the reaction
temperature is reached ðTr � TcÞ; hence, the reaction front
is moving very slowly.
solid
Aso
lid B
+ F
luid
solid
Aso
lid B
+ F
luid
solid A
solid B + Fluid
Pr
Phr
P
Tr Tc T
1 23
Treff~Tr
Treff~(Tc + Tr)/2
Treff~Tc
ΔPr
Fig. 5. Three schematic end-member reaction lines drawn in a P-T dia-
gram for a temperature-controlled reaction (1), an intermediate (2) and
a pressure-controlled reaction (3). When the temperature has hit the
reaction curve at Tr and a background pressure of Phr, three possibilities
exist for the reaction progress: (i) The reaction curve is temperature con-
trolled, and an increase in pressure (DPr) will simply move the reaction
condition along the curve up-pressure without changing Tr. (ii) The reac-
tion curve depends both on temperature and pressure, and an increase
in pressure will shift the reaction conditions to higher temperatures. (iii)
The reaction curve is mainly pressure dependent, and a little change in
pressure will require a large change in the temperature at which reaction
takes place.
log10(ΔThp)
log 10
(Rc)
log10
(ξΤ)r
Degree of heating penalty
Tr ~Thr
Deg
ree
of fl
uid
over
pres
sure
Reaction closure by fluid overpressureFast
Closed
Rate of reaction front
Tr ~Tc
Rc < 1 1
2
3Rc >> 1
Fig. 6. The solution of Eq. (28) for �rT as a function of the nondimensional
parameter Rc (Eq. 29) and degree of thermal overheating DThp (Eq. 30).
When Rc is larger than 1, then the reaction proceeds according to the tem-
perature conditions. However, if Rc is much larger than 1, then the over-
pressure generated owing to the reaction will work to inhibit the
movement of the reaction front, and hence closing the reaction. The black
lines (1, 2 and 3) represent theoretical scenarios for reactions with different
Clapeyron slopes, that is, the curves 1, 2 and 3 from Figure 5. Steep slopes
(curve 1) have limited the influence of the generated overpressure and are
thermally controlled, while reactions with gentle slopes (curve 3) will be
strongly influenced by the reaction-induced overpressure and will require
more heating for the reaction to proceed. We have fixed the contact tem-
perature to Tc ) Thr = 680�C as an intermediate choice, and changes in this
value have negligible influence on the diagram.
Devolatilization-induced pressure buildup 9
� 2012 Blackwell Publishing Ltd

In the pressure-controlled domain, the absolute value of
the overpressure reduced by flow and variations in the Cla-
peyron slopes (dT ⁄ dP) will influence the reaction front.
Larger dT ⁄ dP of the reactions slows down the movement
of the reaction front by requiring a higher effective reac-
tion temperature. In the case of gentle Clapeyron slopes,
the overpressures created can be large enough to terminate
the reaction owing to the very high effective reaction tem-
peratures required. When this is the case, the reaction front
can only move further into the aureole if the overpressure
is reduced by drainage, for example by fracturing of the
host-rock (i.e. increasing the permeability). This is equiva-
lent of moving downwards in the diagram to the condi-
tions where a more efficient reaction front is expected.
Geological examples
Figure 7 shows the pressure dependency on the reaction
front (Eq. 27) using plausible physical parameters of per-
meability and Clapeyron slope, keeping the other parame-
ters fixed. This clearly shows that for a reaction such as
dehydration of smectite to illite with a relatively shallow
Clapeyron slope (approximately 10)5�C ⁄ Pa), the reaction
front can be 2–3 orders of magnitude slower. Indeed, it
has been shown that this reaction can terminate when the
pressure increases (Colten-Bradley 1987). A dT ⁄ dP of
approximately 10)5�C ⁄ Pa and an overpressure of 10 MPa
is equivalent of a approximately 100�C increase in the
effective reaction temperature (Eq. 26).
The decarbonation reaction of calcite + quartz to pro-
duce wollastonite and CO2 can have a dT ⁄ dP of approxi-
mately 4 · 10)6�C ⁄ Pa, depending on the CO2 content in
the fluid (Philpotts & Ague 2009). In this scenario, the
movement of the reaction front can be retarded by at least
one order of magnitude.
Breccia pipe formation and venting
We apply the analytic solution of pressure at the reaction
front (Eq. 23) to investigate whether the pressure gener-
ated from the methane generation in shales is large enough
to fracture the rocks and thus cause breccia pipe formation,
with subsequent venting of the aureole fluids to the atmo-
sphere (Fig. 8A). Figure 8B shows a schematic figure of a
breccia pipe originating in a shale aureole. The pipes are
associated with sill intrusions at depths greater than the
boiling point of pure H2O (approximately 1 km), which
implies another driving force than expansion of pore fluids
as suggested for hydrothermal vent complexes (Jamtveit
et al. 2004). Figure 8A shows the conditions where breccia
pipes can potentially form as a function of depth and per-
meability, using a tensile strength of 10 MPa above the
lithostatic pressure as a conservative fracturing condition.
The green field represents conditions for reaction-induced
fluid pressures exceeding the tensile strength for a shale of
initially approximately 5 wt.% total organic carbon (TOC).
Also indicated on Fig. 8(A) are the venting conditions for
shales with initially approximately 10 wt.% TOC, where
breccia pipes can be expected for permeabilities lower than
approximately 10)16 m2 at 2–3 km depth. At 1 km, the
permeability can be as high as approximately 10)15 m2 and
still cause venting in this high TOC case. For shales with
initially approximately 1 wt.% TOC, permeabilities lower
than 10)18 m2 are required for venting to occur. Note that
the diagram in Fig. 8(A) assumes certain properties of the
system such as reaction temperature, gas compressibility
and tensile strength of the rocks given in the caption and
must be interpreted on the basis of these assumptions.
Hence, the pressure build-up from the metamorphic
fluid generation is feasible as a driving force for breccia
pipes in aureoles with permeabilities lower than approxi-
mately 10)17 m2 at 2–3 km depth. This situation corre-
sponds well with the paleodepth of the shale formations in
the Karoo Basin, where more than thousand breccia pipes
have been mapped (Svensen et al. 2006, 2007). Further-
more, low permeabilities are expected in unfractured shale
and crystallized igneous intrusions (10)23 to 10)18 m2)
(Brace 1980), both of which are associated with the brec-
cia pipes in the Karoo Basin (Aarnes et al. 2011b).
DISCUSSION
The model
Our model of significant overpressure generation during
prograde contact metamorphism is in contrast to other
10–20 10–16 10–1410–18
10–5
10–6
10–4
10–7
10–8
10–2
10–3
10–1
Permeability (m2)
Reaction front rate (ξ
T ) rCla
peyr
on s
lope
(°C
/Pa)
Overpressure control
on reaction front rate
Thermally controlledreaction front (ξT~1) r
Fig. 7. The rate of the reaction front (�rT ) is contoured as a function of per-
meability (fluid flow) and Clapeyron slope (overpressure), using the relation
derived in Eq. (27). The grey area represents conditions where the reaction
front progress is controlled by the reaction temperature only. The
other parameters are set to PV = 5 · 108 Pa, lf/b = 10)12 Pa)1,
jT = 10)6 m2s)1, Tr = 350�C, Thr = 100�C, Tm = 1200�C, Tc = 772�C, where
the latter is calculated from Eqs. 11a and 14. For reactions with Clapeyron
slopes of 10)5 �C ⁄ Pa, the front is moving up to two orders of magnitude
slower than what is expected for the thermally controlled front.
10 I. AARNES et al .
� 2012 Blackwell Publishing Ltd

contact metamorphic models assuming no pressure varia-
tions, or minor fluid pressure gradients (Baumgartner &
Ferry 1991; Leger & Ferry 1993). The analytical solution
is an approximation to a more complex reality owing to,
for example, the required boundary conditions such as
constant pressure at the contact. The strength of the
model is that it is based on basic physical principles with
only a few assumptions about the system. The analytical
solution thus provides a good first step for further develop-
ment of such models, but can also be used in its present
form to explain a number of phenomena, among others
breccia pipe formation and reaction closure. The analytical
solutions are cross-checked with numerical modelling and
show that the solutions are not sensitive to the choice of
method used for treating the source terms (Fig. 4).
The model analyses the stresses generated from volume
changing processes after the emplacement. The stress field
can furthermore change in response to, for example, dis-
placement of sediments during sill emplacement (e.g. Pol-
lard 1973; Pollard & Johnson 1973) or crystallization (i.e.
negative volume change) within the sill (Aarnes et al.
2008; Svensen et al. 2010).
The pressure equation (Eq. 6) can easily be expanded
with several individual source terms, each defining a sepa-
rate process that affects the pressure, such as compaction
(e.g. Connolly 1997; Connolly & Podladchikov 1998),
thermal stresses or an array of different reactions involving
a net volume change. These processes are documented in
the literature and therefore not evaluated here.
To be able to implement the solution in a relatively sim-
ple way, we have considered that a major fluid release
occurs at one temperature, for example at 350�C. For the
metamorphic reaction front, the kinetics will play a role in
the fluid release. However, at a high temperatures such as
350�C, the conversion of organic matter to methane can
be approximated to instantaneous relative to the time of
the heat transfer. As an example, at laboratory conditions
of up to 365�C, 24 h is sufficient to convert all the organic
matter to gas by pyrolysis (e.g. Andresen et al. 1995).
Overstepping temperatures of dehydration reactions are
estimated from kinetic modelling to be only a few degrees,
with a maximum of 40�C (Walther & Wood 1984; Con-
nolly 1997). This is equivalent of shifting the effective
reaction temperature to that of the overstepping tempera-
ture for a discontinuous dehydration reaction and should
be considered to ensure a reaction rate that is fast relative
to the thermal pulse. In an aureole, the reaction tempera-
ture isograde comprises a variety of minerals and organic
matter that release fluids. To account for more reaction
fronts moving through the rock, more reaction terms can
be added to Eq. (6), similar to the one given. If only
sparse devolatilization reactions occur, this is equivalent of
having a smaller Q totalf source term.
We did not consider the effect of varying the heat diffu-
sivity, as this variation is within a few percent. The uncer-
tainty of this is negligible relative to the uncertainties in,
for example, permeability in our nondimensional parameter
Ri. Hence, we have assessed the various effects of varying
Pr/Plithostatic<1
Pr/Ptensile>1
P r =
P tens
ile
P r =
P litho
static
NO VENTINGNO VENTING
VENTINGVENTING
Dep
th (k
m)
Permeability (m2)
P v =
108 P
a
P V =
3×10
8 Pa
~1 w
t.% TO
C
~10
wt.%
TO
C
~5 w
t.% T
OC10–17 10–14 10–1310–1810–1910–20 10–1510–16
4.5
3.5
2.5
1.5
5
1
4
3
2
0.5
contact aureole
CH4
sill intrusion
organic–rich shale
sedimentaryrocks
(B)(A)
P v = 1
09 P
a
Fig. 8. (A) Depth of intrusion versus log of permeability by applying Eq. (23) to solve for overpressure generated as a result of organic cracking in contact
aureoles. For PV = 3 · 108 Pa corresponding to 5 wt.% TOC venting will occur when the permeability is lower than about 10)17 m2. In the region to the
right, the pressure will be reduced by fluid flow before any venting occurs. We also indicate the tensile strength curves for PV = 108 Pa and PV = 109 Pa. The
other parameters are set to Phydrostatic = qfgZ, Plithostatic = qhrgZ and Ptensile = qhrgZ + 10 MPa, where g = 9.81 m ⁄ s2, host-rock density is a linear function of
qhr = 2200–2600 kg ⁄ m3 for Z = 0.5–5 km, qf = 250 kg ⁄ m3 for 100 m (i.e. the generated CH4) and qf = 1000 kg ⁄ m3 (i.e. pore fluid H2O) for the rest of the
hydrostatic column. We use qhr = 2400 kg ⁄ m3 and /b = 10)9 Pa)1. (B) Schematic drawing of a vent complex rooted in the contact aureole. The pressure
build-up from methane generation in the low-permeable shales is larger than the tensile strength, resulting in fracturing and venting of the aureole fluids to
the atmosphere.
Devolatilization-induced pressure buildup 11
� 2012 Blackwell Publishing Ltd

permeability and kept most other parameters constant for
simplicity. A systematic evaluation of the effect of different
thermal diffusivities on the reaction aureoles can be found
in Aarnes et al. (2011a).
We did not include latent heat consumed by devolatiliza-
tion, as this only has a minor effect on the total reacted
aureole owing to the small volumes of dehydration products
relative to rock volumes (approximately 6 % smaller aureole)
(Aarnes et al. 2010). If the system of interest requires latent
heat of devolatilization, it is possible to add another source
term numerically. The treatment of such source term in the
analytical solutions is, however, highly nontrivial owing to
several feedback processes consistent with the fully coupled
system and is outside the scope of this paper.
For the reaction closure, we have assumed that the dehy-
dration reactions occur at local thermodynamic equilib-
rium. There is no conflict between this assumption and the
introduction of minor thermal overstepping of the equilib-
rium condition by simply using a higher initial reaction
temperature.
Overpressure reduction by fluid flow
Permeability is the key parameter controlling the efficiency
of fluid flow and has thus a major control on the magni-
tude of overpressure. It is unfortunately a relatively difficult
parameter to constrain for a full geological system, as it
can vary several orders of magnitudes (Ingebritsen & Man-
ning 2002). Unfractured shales, siliceous carbonates and
crystalline rocks are measured to have very low permeabili-
ties about 10)23 to 10)16 m2 (Brace 1980; Hanson 1995;
Cui et al. 2001), which makes significant overpressure gen-
eration in intruded shale systems likely. Laboratory experi-
ments show that dehydration of gypsum can generate
excess pore pressures on the scale of 150 MPa during
isochoric conditions (Wang & Wong 2003). This value
corresponds well with the results of this study.
One key result from our model is that devolatilizing sys-
tems with active fluid flow out of the reaction front can
still create significant overpressures, although reduced rela-
tive to the isochoric systems (Fig. 3). Even for relatively
high-permeable devolatilizing systems (approximately
10)15 m2), fluid overpressures of 10 MPa can be expected.
This is supported by dehydration experiments with the
hydrous mineral gypsum giving pore pressures up to
93 MPa when allowing for flow out of the dehydrating
sample (Olgaard et al. 1995; Wong et al. 1997).
Coupling of fluid flow to the system of equations
describing deformation of the rock matrix has not been
included in this study. Expansion and fracturing can
increase the storage capacity of the rock and could there-
fore act to lower the fluid overpressure. This can be
approximated in this study by using a relatively high effec-
tive compressibility for the geological examples.
Although we predict that these overpressures are gener-
ated instantly at the front, the hydraulic conductivity is of
major importance for the maintenance of the overpressure
(e.g. Bredehoeft & Hanshaw 1968; Ko et al. 1997). For
high permeabilities, the pressure build-up will only be tran-
sient and diffuse away after the devolatilization has ceased
(e.g. Wong et al. 1997).
Reaction closure by fluid overpressure
Most devolatilization reactions are mainly temperature-
dependent with typical Clapeyron slopes of approximately
10)7�C ⁄ Pa, at least at pressures above approximately 50 MPa
as calculated from thermodynamic phase equilibria (Connolly
2005, 2009) The influence of pressure on the effective reac-
tion temperature is thus on the order of 10–100�C for PV of
108–109 Pa. We can speculate that such overpressures could
occur at great depths (approximately 30–40 km) and thus be
relevant for the limited dehydration reactions at lithostatic
pressures of 800–1000 MPa, as suggested for the Southern
Alps, New Zealand (Vry et al. 2010).
There are some cases of negative dT ⁄ dP where the reac-
tion temperature decreases with increasing pressure at
higher pressures. An example of such reactions is dehydra-
tion of kaolinite at thermodynamic pressures above 109 Pa
(1 GPa) and 350�C (Chatterjee et al. 1984). This is
because the fluids at these pressures are so compressible
that they occupy less space as a fluid phase than in the
mineral phase. This gives a negative volume change in the
reaction and would result in an underpressure (e.g. Delany
& Helgeson 1978). In the case of lowering the pressure
on a negative Clapeyron slope, it would also require a shift
towards higher temperatures in the P-T diagram.
Overpressure and venting in natural systems
The magnitude of the overpressure that theoretically can
be generated by devolatilization reactions is significant
(>1 GPa). However, the rocks cannot always maintain such
pressures. Hydraulic fracturing will therefore put an upper
bound to the amount of overpressure generated (e.g. Wal-
ther & Orville 1982; Nishiyama 1989; Gueguen & Palci-
auskas 1994). The critical fluid pressure required to
fracture a rock matrix from a localized fluid overpressure
and the possible failure patterns is investigated by Rozhko
et al. (2007) for a nonreactive case.
Sill intrusions with thickness of 100 m intruding fluid-
producing rock types will ensure large-scale fluid generation
(Aarnes et al. 2011a,b). Furthermore, the intrusions can act
as a low-permeable seals themselves, thus increasing the
chance of venting and breccia pipe formation (Fig. 7). In
conclusion, we show that the new analytical solution can be
applied to infer that methane generation in organic-rich
contact aureoles can generate sufficient overpressure to
12 I. AARNES et al .
� 2012 Blackwell Publishing Ltd

trigger large-scale fracturing of the host-rock and ultimately
breccia pipe formation, thus creating efficient pathways for
the aureole gases to reach the atmosphere. This is consistent
with the occurrence of several thousand breccia pipes origi-
nating in shale formations intruded by multiple sills in the
Karoo Basin.
CONCLUSIONS
In this study, we provide new analytical solutions to reac-
tive transport involving temperature, pressure, fluid flow
and metamorphic devolatilization reactions. The main con-
clusions about reaction-induced overpressure and the
implications for reaction fronts and aureole fracturing are
summarized:
(1) The overpressure is determined by the ratio of thermal
and hydraulic diffusion to the rate of the reaction
front.
(2) When fluid flow is more efficient than the advance of
the reaction front, the isochoric overpressure can be
reduced by several orders of magnitude, depending on
the effective permeability. Still, fluid overpressures of
tens of MPa can be generated.
(3) In the case of pressure-dependent reactions, the gener-
ated overpressure will shift the equilibrium conditions
towards correspondingly higher temperatures. The
effectively higher reaction temperatures will require
more heat to proceed and thus slow down the reaction
front and may even terminate it completely.
(4) The analytical solutions to overpressure are used to find
the conditions of reaction-induced fracturing, and thus
illustrate the feasibility of breccia pipe formation as a
response to methane release in shaly contact aureoles.
Low permeabilities (<10)17 m2) and high content of
organic material in the sediments (>5 wt%) are favour-
able conditions, consistent with the observations asso-
ciated with the breccia pipes.
To conclude, this model provides a theoretical basis that
can be applied to solve several geological processes related
to prograde metamorphism, and the analytical solutions
can be used with success for the verification of numerical
reactive transport models.
ACKNOWLEDGEMENTS
This study was supported by Grant 169457 ⁄ S30 from the
Norwegian Research Council. We would like to thank V.
M. Yarushina and N. S. C. Simon for important discus-
sions and help to improve the manuscript. Great thanks go
to all the participants in the PGP Wednesday Club for
more than 6 years of derivations and discussions on the
matter. Teng-Fong Wong and one anonymous reviewer
are thanked for valuable comments that helped strengthen
the manuscript.
REFERENCES
Aarnes I (2010) Sill emplacement and contact metamorphism insedimentary basins. PhD thesis, University of Oslo, Oslo, 181
pp.
Aarnes I, Podladchikov YY, Neumann E-R (2008) Post-emplace-
ment melt flow induced by thermal stresses: implications for dif-ferentiation in sills. Earth and Planetary Science Letters, 276,
152–66.
Aarnes I, Svensen H, Connolly JAD, Podladchikov YY (2010)
How contact metamorphism can trigger global climatechanges: modeling gas generation around igneous sills in
sedimentary basins. Geochimica et Cosmochimica Acta, 74,
7179–95.Aarnes I, Fristad K, Planke S, Svensen H (2011a) The impact of
host-rock composition on devolatilization of sedimentary rocks
during contact metamorphism around mafic sheet intrusions.
Geochemistry, Geophysics, Geosystems, 12, 1–11.Aarnes I, Svensen H, Polteau S, Planke S (2011b) Contact meta-
morphic devolatilization of shales in the Karoo Basin, South
Africa, and the effects of multiple sill intrusions. Chemical Geol-ogy, 281, 181–94.
Ague JJ, Baxter EF (2007) Brief thermal pulses during mountain
building recorded by Sr diffusion in apatite and multicomponent
diffusion in garnet. Earth and Planetary Science Letters, 261,500–16.
Ague JJ, Park J, Rye DM (1998) Regional Metamorphic Dehydra-
tion and Seismic Hazard. Geophysical Research Letters, 25,
4221–4.Andresen B, Throndsen T, Raheim A, Bolstad J (1995) A compar-
ison of pyrolysis products with models for natural gas genera-
tion. Chemical Geology, 126, 261–80.
Balashov VN, Yardley BWD (1998) Modeling metamorphic fluidflow with reaction-compaction-permeability feedbacks. Ameri-can Journal of Science, 298, 441–70.
Baumgartner LP, Ferry JM (1991) A Model for Coupled Fluid-Flow and Mixed-Volatile Mineral Reactions with Applications to
Regional Metamorphism. Contributions to Mineralogy andPetrology, 106, 273–85.
Baxter EF, Ague JJ, Depaolo DJ (2002) Prograde temperature-time evolution in the Barrovian type-locality constrained by
Sm ⁄ Nd garnet ages from Glen Clova Scotland. Journal of theGeological Society of London, 159, 71–82.
Bickle MJ (1996) Metamorphic decarbonation, silicate weatheringand the long-term carbon cycle. Terra Nova, 8, 270–6.
Bickle MJ, McKenzie D (1987) The Transport of Heat and Matter
by Fluids During Metamorphism. Contributions to Mineralogyand Petrology, 95, 384–92.
Bishop AN, Abbott GD (1995) Vitrinite Reflectance and Molecu-
lar Geochemistry of Jurassic Sediments - the Influence of Heat-
ing by Tertiary Dykes (Northwest Scotland). OrganicGeochemistry, 22, 165–77.
Brace WF (1980) Permeability of crystalline and argillaceous rocks.
International Journal of Rock Mechanics and Mining Sciencesand Geomechanics Abstracts, 17, 241–51.
Bredehoeft JD, Hanshaw BB (1968) On Maintenance of Anoma-
lous Fluid Pressures: I. Thick Sedimentary Sequences. GeologicalSociety of America Bulletin, 79, 1097–106.
Bredehoeft JD, Wesley JB, Fouch TD (1994) Simulations ofthe Origin of Fluid Pressure, Fracture Generation, and the
Movement of Fluids in the Uinta Basin, Utah. Aapg Bulletin-American Association of Petroleum Geologists, 78, 1729–47.
Carslaw HS, Jaeger JC (1959) Conduction of Heat in Solids.Clarendon Press, Oxford.
Devolatilization-induced pressure buildup 13
� 2012 Blackwell Publishing Ltd

Cathles LM, Erendi AHJ, Barrie T (1997) How long can a hydro-thermal system be sustained by a single intrusive event? Eco-nomic Geology, 92, 766–71.
Chatterjee ND, Johannes W, Leistner H (1984) The System CaO-
Al2O3-SiO2-H2O - New Phase-Equilibria Data, Some Calcu-lated Phase-Relations, and Their Petrological Applications. Con-tributions to Mineralogy and Petrology, 88, 1–13.
Colten-Bradley VA (1987) Role of Pressure in Smectite Dehydra-tion - Effects on Geopressure and Smectite-to-Illite Transforma-
tion. AAPG Bulletin-American Association of PetroleumGeologists, 71, 1414–27.
Connolly JAD (1997) Devolatilization-generated fluid pressureand deformation-propagated fluid flow during prograde regional
metamorphism. Journal of Geophysical Research, 102, 18149–
73.
Connolly JAD (2005) Computation of phase equilibria by linearprogramming: a tool for geodynamic modeling and its applica-
tion to subduction zone decarbonation. Earth and PlanetaryScience Letters, 236, 524–41.
Connolly JAD (2009) The geodynamic equation of state: what and
how. Geochemistry, Geophysics, Geosystems, 10, Q10014, 19 pp.
Connolly JAD, Podladchikov YY (1998) Compaction-driven fluid
flow in viscoelastic rock. Geodinamica Acta, 11, 55–84.Cooper JR, Crelling JC, Rimmer SM, Whittington AG (2007)
Coal metamorphism by igneous intrusion in the Raton Basin,
CO and NM: implications for generation of volatiles. Interna-tional Journal of Coal Geology, 71, 15–27.
Corbet TF, Bethke CM (1992) Disequilibrium Fluid Pressures
and Groundwater Flow in the Western Canada Sedimentary
Basin. Journal of Geophysical Research, 97, 7203–17.Crank J (1979) The mathematics of diffusion. Oxford University
Press, USA, 424 pp.
Cui XJ, Nabelek PI, Liu M (2001) Heat and fluid flow in contact
metamorphic aureoles with layered and transient permeability,with application to the Notch Peak aureole, Utah. Journal ofGeophysical Research, 106, 6477–91.
Delaney PT (1982) Rapid Intrusion of Magma into Wet Rock -
Groundwater-Flow Due to Pore Pressure Increases. Journal ofGeophysical Research, 87, 7739–56.
Delany JM, Helgeson HC (1978) Calculation of the thermody-
namic consequences of dehydration in subducting oceanic crust
to 100 kb and > 800 degrees C. American Journal of Science,278, 638–86.
Domenico PA, Palciauskas VV (1979) Thermal-Expansion of Flu-
ids and Fracture Initiation in Compacting Sediments - Sum-mary. Geological Society of America Bulletin, 90, 518–20.
Dutrow B, Norton D (1995) Evolution of fluid pressure and frac-
ture propagation during contact metamorphism. Journal ofMetamorphic Geology, 13, 677–86.
Einsele G, Gieskes JM, Curray J, Moore DM, Aguayo E, Aubry
MP, Fornari D, Guerrero J, Kastner M, Kelts K, Lyle M, Mato-
ba Y, Molinacruz A, Niemitz J, Rueda J, Saunders A, Schrader
H, Simoneit B, Vacquier V (1980) Intrusion of Basaltic Sillsinto Highly Porous Sediments, and Resulting Hydrothermal
Activity. Nature, 283, 441–5.
Ferry JM, Gerdes ML (1998) Chemically reactive fluid flow duringmetamorphism. Annual Review of Earth and Planetary Sciences,26, 255–87.
Furlong KP, Hanson RB, Bowers JR (1991). Modeling thermal
regimes, Reviews in Mineralogy and Geochemistry, pp. 437.Gaus I, Azaroual M, Czernichowski-Lauriol I (2005) Reactive
transport modelling of the impact of CO2 injection on the
clayey cap rock at Sleipner (North Sea). Chemical Geology, 217,
319–37.
Gueguen Y, Palciauskas V (1994) Introduction to the Physics ofRocks. Princeton University Press, Princeton, NJ, 297 pp.
Hanshaw BB, Bredehoeft JD (1968) On the Maintenance of
Anomalous Fluid Pressures: II. Source Layer at Depth. Geologi-cal Society of America Bulletin, 79, 1107–22.
Hanson RB (1992) Effects of Fluid Production on Fluid-Flow
During Regional and Contact-Metamorphism. Journal of Meta-morphic Geology, 10, 87–97.
Hanson RB (1995) The Hydrodynamics of Contact-Metamor-
phism. Geological Society of America Bulletin, 107, 595–611.
Ingebritsen SE, Manning CE (2002) Diffuse fluid flux through
orogenic belts: implications for the world ocean. Proceedings ofthe National Academy of Sciences, USA, 99, 9113–6.
Jamtveit B, Grorud HF, Bucher-Nurminen K (1992) Contact
metamorphism of layered carbonate-shale sequences in the Oslo
Rift. II: migration of isotopic and reaction fronts aroundcooling plutons. Earth and Planetary Science Letters, 114, 131–
48.
Jamtveit B, Svensen H, Podladchikov YY (2004). Hydrothermalvent complexes associated with sill intrusions in sedimentary
basins. in: Physical Geology of High-Level Magmatic Systems (eds
Breitkreuz C, Petford N), pp. 233–41. Geological Society, Lon-
don, Special Publications.Kelemen PB, Whitehead JA, Aharonov E, Jordahl KA (1995)
Experiments on Flow Focusing in Soluble Porous-Media, with
Applications to Melt Extraction from the Mantle. Journal ofGeophysical Research, 100, 475–96.
Knapp RB, Knight JE (1977) Differential Thermal-Expansion of
Pore Fluids - Fracture Propagation and Microearthquake Pro-
duction in Hot Pluton Environments. Journal of GeophysicalResearch, 82, 2515–22.
Ko SC, Olgaard DL, Wong TF (1997) Generation and mainte-
nance of pore pressure excess in a dehydrating system. 1. Exper-
imental and microstructural observations. Journal of GeophysicalResearch, 102, 825–39.
Kokelaar BP (1982) Fluidization of Wet Sediments During the
Emplacement and Cooling of Various Igneous Bodies. Journalof the Geological Society of London, 139, 21–33.
Labotka T, Anovitz L, Blencoe J (2002) Pore pressure during
metamorphism of carbonate rock: effect of volumetric properties
of H2O-CO2 mixtures. Contributions to Mineralogy and Petrol-ogy, 144, 305–13.
Lasaga AC, Rye DM (1993) Fluid-Flow and Chemical-Reaction
Kinetics in Metamorphic Systems. American Journal of Science,293, 361–404.
Le Gallo Y, Bildstein O, Brosse E (1998) Coupled reaction-flow
modeling of diagenetic changes in reservoir permeability, poros-
ity and mineral compositions. Journal of Hydrology, 209, 366–
88.Leger A, Ferry JM (1993) Fluid Infiltration and Regional Meta-
morphism of the Waits River Formation, North-East Vermont,
USA. Journal of Metamorphic Geology, 11, 3–29.
Leloup PH, Ricard Y, Battaglia J, Lacassin R (1999) Shear heatingin continental strike-slip shear zones: model and field examples.
Geophysical Journal International, 136, 19–40.
Lewis RW, Morgan K, Thomas HR, Seetharamu KN (1996). TheFinite Element Method in Heat Transfer Analysis. John Wiley
and Sons, Chichester. 285 pp.
Lichtner PC (1985) Continuum model for simultaneous chemical
reactions and mass transport in hydrothermal systems. Geochimi-ca et Cosmochimica Acta, 49, 779–800.
Lichtner PC (1988) The quasi-stationary state approximation to
coupled mass transport and fluid-rock interaction in a porous
medium. Geochimica et Cosmochimica Acta, 52, 143–65.
14 I. AARNES et al .
� 2012 Blackwell Publishing Ltd

Manning CE, Bird DK (1991) Porosity Evolution and Fluid-Flowin the Basalts of the Skaergaard Magma-Hydrothermal System,
East Greenland. American Journal of Science, 291, 201–57.
Miller SA, van der Zee W, Olgaard DL, Connolly JAD (2003) A
fluid-pressure feedback model of dehydration reactions: experi-ments, modelling, and application to subduction zones. Tectono-physics, 370, 241–51.
Nabelek PI (2007) Fluid evolution and kinetics of metamorphicreactions in calc-silicate contact aureoles - From H2O to CO2
and back. Geology, 35, 927–30.
Nabelek PI (2009) Numerical Simulation of Kinetically-Controlled
Calc-Silicate Reactions and Fluid Flow with Transient Perme-ability around Crystallizing Plutons. American Journal of Sci-ence, 309, 517–48.
Nabelek PI, Labotka TC (1993) Implications of geochemical
fronts in the Notch Peak contact-metamorphic aureole, Utah,USA. Earth and Planetary Science Letters, 119, 539–59.
Nishiyama T (1989) Kinetics of Hydrofracturing and Metamor-
phic Veining. Geology, 17, 1068–71.Norton D, Knight JE (1977) Transport phenomena in hydrother-
mal systems; cooling plutons. American Journal of Science, 277,
937–81.
Olgaard DL, Ko SC, Wong TF (1995) Deformation and PorePressure in Dehydrating Gypsum under Transiently Drained
Conditions. Tectonophysics, 245, 237–48.
Ortoleva P, Merino E, Moore C, Chadam J (1987) Geochemical Self-
Organization .1. Reaction-Transport Feedbacks and ModelingApproach. American Journal of Science, 287, 979–1007.
Osborne MJ, Swarbrick RE (1997) Mechanisms for generating
overpressure in sedimentary basins: a reevaluation. AAPG Bulle-tin, 81, 1023–41.
Philpotts AR, Ague JJ (2009) Principles of Igneous and Metamor-phic Petrology. Cambridge University Press, Cambridge, NY.
Planke S, Rassmussen T, Rey SS, Myklebust R (2005). Seismiccharacteristics and distribution of volcanic intrusions and hydro-
thermal vent complexes in the Vøring and Møre basins. In:
Petroleum Geology: North-West Europe and Global PerspectivesProceedings of the 6th. Geology Conference (eds Dore A, ViningB), Geological Society, London.
Podladchikov YY, Wickham SM (1994) Crystallization of hydrous
magmas - calculation of associated thermal effects, volatile
fluxes, and isotopic alteration. Journal of Geology, 102, 25–45.Pollard DD (1973) Derivation and evaluation of a mechanical
model for sheet intrusions. Tectonophysics, 19, 233–69.
Pollard DD, Johnson AM (1973) Mechanics of growth of somelaccolithic intrusions in the Henry mountains, Utah, II: bending
and failure of overburden layers and sill formation. Tectonophys-ics, 18, 311–54.
Rozhko AY, Podladchikov YY, Renard F (2007) Failure patternscaused by localized rise in pore-fluid overpressure and effective
strength of rocks. Geophysical Research Letters, 34, L22304.
Simoneit BRT, Brenner S, Peters KE, Kaplan IR (1978) Thermal
Alteration of Cretaceous Black Shale by Basaltic Intrusions inEastern Atlantic. Nature, 273, 501–4.
Steefel CI, Lasaga AC (1994) A Coupled Model for Transport of Mul-
tiple Chemical-Species and Kinetic Precipitation Dissolution Reac-tions with Application to Reactive Flow in Single-Phase
Hydrothermal Systems. American Journal of Science, 294, 529–92.
Steefel CI, Maher K (2009). Fluid-Rock Interaction: a ReactiveTransport Approach. In: Thermodynamics and Kinetics of Water-Rock Interaction (eds Oelkers EH, Schott J) pp. 485–532.
Reviews in Mineralogy & Geochemistry, 70.
Svensen H, Planke S, Malthe-Sorenssen A, Jamtveit B, MyklebustR, Eidem TR, Rey SS (2004) Release of methane from a volca-
nic basin as a mechanism for initial Eocene global warming.
Nature, 429, 542–5.Svensen H, Jamtveit B, Planke S, Chevallier L (2006) Structure
and evolution of hydrothermal vent complexes in the Karoo
Basin, South Africa. Journal of the Geological Society of London,
163, 671–82.Svensen H, Planke S, Chevallier L, Malthe-Sorenssen A, Corfu F,
Jamtveit B (2007) Hydrothermal venting of greenhouse gases
triggering Early Jurassic global warming. Earth and PlanetaryScience Letters, 256, 554–66.
Svensen H, Aarnes I, Podladchikov YY, Jettestuen E, Harstad CH,
Planke S (2010) Sandstone dikes in dolerite sills: evidence for
high pressure gradients and sediment mobilization during solidi-fication of magmatic sheet intrusions in sedimentary basins. Geo-sphere, 6, 211–24.
Thompson AB (1987) Some aspects of fluid motion during meta-
morphism. Journal of the Geological Society of London, 144,309–12.
Turcotte D, Schubert G (2002) Geodynamics. Cambridge Univer-
sity Press, Cambridge, NY.
Vry J, Powell R, Golden KM, Petersen K (2010) The role ofexhumation in metamorphic dehydration and fluid production.
Nature Geoscience, 3, 31–5.
Walther JV (1990). Fluid dynamics during progressive regionalmetamorphism. In: The Role of Fluids in Crustal Processes (eds
Bredehoeft JD, Norton DL), pp. 64–71. National Academy
Press, Washington, DC.
Walther JV, Orville PM (1982) Volatile Production and Transportin Regional Metamorphism. Contributions to Mineralogy andPetrology, 79, 252–7.
Walther JV, Wood BJ (1984) Rate and Mechanism in Prograde
Metamorphism. Contributions to Mineralogy and Petrology, 88,246–59.
Walton MS, O’Sullivan RB (1950) The intrusive mechanics of a clas-
tic dike [Connecticut]. American Journal of Science, 248, 1–21.
Wang W-H, Wong T-f (2003) Effects of reaction kinetics andfluid drainage on the development of pore pressure excess in a
dehydrating system. Tectonophysics, 370, 227–39.
Wangen M (2001) A quantitative comparison of some mechanismsgenerating overpressure in sedimentary basins. Tectonophysics,334, 211–34.
Weinberg RF, Mark G, Reichardt H (2009) Magma ponding in
the Karakoram shear zone, Ladakh, NW India. Geological Societyof America Bulletin, 121, 278–85.
Wong TF, Ko SC, Olgaard DL (1997) Generation and mainte-
nance of pore pressure excess in a dehydrating system. 2. Theo-
retical analysis. Journal of Geophysical Research, 102, 841–52.Xu TF, Pruess K (2001) Modeling multiphase non-isothermal
fluid flow and reactive geochemical transport in variably satu-
rated fractured rocks: 1. Methodology. American Journal of Sci-ence, 301, 16–33.
Devolatilization-induced pressure buildup 15
� 2012 Blackwell Publishing Ltd