Design and Evaluation of Sustainable Packaging in Supply ...
Upload
khangminh22Category
view
4download
0
DEVELOPMENT OF SUSTAINABLE ENERGY SUPPLY
SOLUTIONS FOR FØNS, DENMARK
Master in European Construction Engineering 2012-2013
Group Project 2
Analyses and proposal for integrated heat and electricity supply in a 71
household community


DEVELOPMENT OF SUSTAINABLE ENERGY SUPPLY
SOLUTIONS FOR FONS, DENMARK
Analyses and proposal for integrated heat and electricity supply in a 71
household community
Master in European Construction Engineering
2012-2013
Group Project 2
Authors:
María Alberdi Pagola
Laura Álvarez Antón
Lulu Andersen
Louis Kofi Awugya
Valerio De Vivo
Guillem Ferrer Ramells
Giancarlo Gullotto
Marta Hervías Gallardo
Ali Kemal
Claudie Louet
Javier Manjón Herrero
Victor Marcos Mesón
Antoine Marie
Marta Orejas Yáñez
Mónica Oveysi Rivas
Ismael Ruiz de Temiño Alonso
Xavier Sintes Permanyer
Keisha Tyrell
Alberto Urbina Velasco
Francisco Villegas Ruiz


1
Systems for sustainable energy supply for a small village
Master in European Construction Engineering (2012-2013)
TABLE OF CONTENTS
1. INTRODUCTION ........................................................................................................... 3
1.1. INTRODUCTION ................................................................................................................. 4
1.2. LAYOUT OF THE REPORT .................................................................................................. 7
2. LOCATION OF THE PROJECT AREA ............................................................................ 9
2.1. SITUATION ......................................................................................................................... 10
3. DATA COLLECTION ABOUT HOUSES ........................................................................ 11
3.1. INTRODUCTION ............................................................................................................... 12
3.2. EXISTING BUILDING STUDY ............................................................................................. 12
3.3. BUILDING CONSTRUCTION STUDY ............................................................................... 15
3.4. CONCLUSION.................................................................................................................. 16
4. ALTERNATIVE STUDY .................................................................................................. 19
4.1 INTRODUCTION PHASE 1 ................................................................................................ 20
4.2. HEATING ALTERNATIVES FEASIBILITY STUDY ................................................................ 23 4.2.1. ALTERNATIVE 1: BIOENERGY ............................................................................................ 23 4.2.2. ALTERNATIVE 2: GROUND SOURCE ENERGY .................................................................. 37
4.3. ELECTRICITY ALTERNATIVES FEASIBILITY STUDY .......................................................... 49 4.3.1. ALTERNATIVE 1: PHOTOVOLTAIC SOLAR CELLS ............................................................. 49 4.3.2. ALTERNATIVE 2: WIND POWER ........................................................................................ 64
5. PHASE 2 SCENARIOS ................................................................................................. 81
5.1. INTRODUCTION ............................................................................................................... 82
5.2. INDIVIDUAL SOLUTIONS ................................................................................................. 84
5.2.1. HEATING SOLUTIONS................................................................................................... 87 5.2.1.1. HEATING SOLUTION 1: PELLET BOILER .......................................................................... 87 5.2.1.2. HEATING SOLUTION 2: SOLAR ASSISTED GROUND SOURCE HEAT PUMP WITH WATER
TANK SEASONAL STORAGE ....................................................................................................... 91 5.2.1.3. HEATING SOLUTION 3: GROUND SOURCE HEAT PUMP ............................................... 95
5.2.2. ELECTRICITY SOLUTIONS ............................................................................................. 99 5.2.2.1. ELECTRICITY SOLUTION 1: SMALL WIND TURBINE ......................................................... 99 5.2.2.2. SOLUTION 2: PHOTOVOLTAIC SOLAR CELLS ...............................................................104 5.3. DISTRICT HEATING NETWORK ............................................................................................108
5.4. COLLECTIVE SCENARIOS ........................................................................................... 117 5.4.1. SCENARIO 1: GROUND SOURCE HEATING AND WIND TURBINE ...................................117 5.4.2. SCENARIO 2: STRAW BOILER WITH SOLAR PV AND SWT ................................................125 5.4.3. SCENARIO 3: CHP GASIFICATION STIRLING ENGINE .....................................................136 5.4.4. SCENARIO 4: BIOGAS BOILER AND GROUND SOURCE WITH SOLAR PV AND SWT ......143 5.4.5. SCENARIO 5: BIOGAS BOILER WITH SOLAR THERMAL AND SWT ...................................155 5.4.6. SCENARIOS CONCLUSIONS ...........................................................................................166
6. CONCLUSION .......................................................................................................... 167
REFERENCES ................................................................................................................. 189
LIST OF FIGURES ........................................................................................................... 194
ACRONYMS ................................................................................................................. 199
APPENDIX .................................................................................................................... 200

2
Systems for sustainable energy supply for a small village
Master in European Construction Engineering (2012-2013)

3
Systems for sustainable energy supply for a small village
Master in European Construction Engineering (2012-2013)
1. INTRODUCTION

4
Systems for sustainable energy supply for a small village
Master in European Construction Engineering (2012-2013)
1.1. INTRODUCTION
OBJECTIVE AND BACKGROUND OF THE RESEARCH
This research work aims at recommending a suitable renewable energy supply system for
the inhabitants of a small village in Denmark called Føns. It involves studying of the
different alternatives of renewable energy supply technologies which has been
theoretically developed in the previous group project work entitled “System for
Sustainable Energy Supply for a Small Village” for the production of heat and electricity,
being the heat a priority because that is the inhabitant’s desire. It is the hope of the
research team that implementation of the output of this research work will liberalize the
people of Føns community from using unsustainable, non-renewable energy sources
such as fossil fuel as their main source of energy.
This project has arisen from the existing will of the community of Føns to be supplied of
heating from renewable sources. A neighborhood association has been created to
achieve this objective. Nowadays they are considering different alternatives and this
report aims to help them in their choice.
During the research, possible alternatives of renewable energy system which can
produce both heat and electricity will be exhaustively studied and evaluated from
economic, social and environmental point of views. A refined analysis will also be carried
out to look for the best combination of energy systems from among the plenty of
renewable energy systems that are available and flourishing nowadays. By using a
preset criteria tailored with the demand of the members of ‘Føns’ neighborhood, effort
has been exerted to select, design and estimate the price of an appropriate energy
supply system for the community to finally be independent of fossil fuels.
OVERVIEW ON BENEFITS OF RENEWABLE ENERGIES
In general, much has been said about the positive impacts of renewable energies on
the environment. Yet, apart from this, renewable energies can contribute enormously to
insure energy security. It can substitute fossil fuel at best in terms of secured and endless
supply of energy. The overall scenario on the supply of traditional sources of energy is
multifaceted in its nature presenting governments and developers with various
challenges such as extreme volatility in the oil and gas market, global oil supply
restrictions due to the dominating bargain power of the supplier and many more.
However, renewable technologies are by far devoid of such limitations and can
guarantee secured energy supply to villages and towns.
Surely these days, it is impossible to think of life without energy supply. Nevertheless, it
does not sound logical to worsen and affect the weather, cause harm to the
environment by using conventional energy sources to satisfy these demands. Unlike
conventional forms of energy which is one of the main contributors to global warming
and climate change, renewable and sustainable forms energy do not cause acid rain,
air pollution, water and soil contamination or cause to rapidly increase the temperature
of the earth and generally cause minimal harm to the environment. The energy supply
sector, which is responsible for the lion share of CO2 emission and its devastating

5
Systems for sustainable energy supply for a small village
Master in European Construction Engineering (2012-2013)
consequences could be switched to a “green sector” by using renewable energy
sources.
From the point view of job creation and strengthening of local and national economy
renewable energy can also play significant role by promoting low carbon economy.
Currently, the development of several renewable technologies in solar photovoltaic,
wind, hydropower, biomass, geothermal, etc. is attracting investments creating plenty of
jobs to the sector. The project design and development, physical construction and
installation of renewable technologies are areas which involve a number of job
opportunities,
Unlike fossil fuels, another major advantage of renewable energy sources is their ability to
replenish themselves through natural and continuous process. Making use of renewable
energies systems will not only benefit the living generation but also for the future
generations to come. Hence, the question of meeting the needs of the present without
compromising the ability of the future to meet its own need will ultimately be addressed
by using and promoting renewable and sustainable energies.
PROJECT SUMMARY AND FACTS
As mentioned in the objective, this research work focuses on recommending the most
suitable renewable energy system to produce heat and electricity for the community of
‘Føns’. ‘Føns’ is a small village located in Denmark, specifically situated in the Middelfart
municipality.
The members of this community seek to use renewable energy in place of the
conventional, non-renewable and environmentally polluting fossil fuels. Hence, the
research team designed a way to study the overall need of the society as well as the
existing realities of the community so as to propose a renewable energy supply scheme
that is technically, socially, legally and environmentally appropriate.
The research team has paid a visit to the subject site to visually inspect the insulation
capacity of the dwellings as well as the potential areas to develop the energy scheme.
Furthermore, discussion has been held with some of the representatives of the
community so as to have a clear understanding of the demands of the community.
To aid the visualization and realization of the project, numerous Maps of different kind
such as topographic showing geographical features, environmental maps, maps for
each energy supply scheme, and other aerial photographs are produced and gathered
from different sources and are attached as Appendix to this report.
PROJECT FACT SHEET
Research Title Development of Energy Supply Solution for Føns (Denmark).
Analyses and proposal for integrated heat and electricity
supply in a 71 household community.
Location Føns, Denmark.
Currency The currency in Denmark is “Danish Krone” (DKK) and its
exchange rate has been accepted as 1€ = 7,46046DKK.

6
Systems for sustainable energy supply for a small village
Master in European Construction Engineering (2012-2013)
Research Objective To propose integrated heat and electricity supply system for
Føns.
Research team Students of Master Program In European Construction
Engineering (2012/2013).
Research Duration January 07, 2013 until March 22, 2013.
End users The Community of Føns.
LIMITATIONS
This reach has suffered from several limitations:
- Lack of time to perform an accurate research.
- Professional background of research team. The team is composed by: civil
engineers, architects and building engineers. Therefore, not professionals in
energy field.
- Linguistic barriers. Most of the information was in Danish.
- Difficulty in finding data has led to the use of secondary data, even from other
countries.

7
Systems for sustainable energy supply for a small village
Master in European Construction Engineering (2012-2013)
1.2. LAYOUT OF THE REPORT
The present report is structured in four main parts:
Building study: An exhaustive analysis of the current state of the buildings has
been developed in order to obtain the energetic requirements and heat losses of
each dwelling and the total needs to be supplied.
Phase 1: Different alternatives for both heating and electricity supply are studied
either for collective or individual solutions. Feasibility studies have been
developed to make a first filtering.
Phase 2: This phase deals with different solutions combining heating and
electricity alternatives developed on Phase 1. This phase is divided in “Scenarios”
and “Individual Solutions.”
o Scenarios: This section provides five different scenarios that will supply
energy to Føns. The scenarios have been developed fixing first a heating
solution and then the best electricity choice for that heating solution.
o Individual Solutions: This section provides different individual solutions to
supply energy to Føns. These options will be useful in case some houses are
isolated and it is not feasible to apply a collective solution. The report will
provide the guidelines, for choosing the best option.
Conclusion: A benchmarking analysis of all the systems studied along the report
with the main economic aspects has been developed so as to obtain the most
suitable solutions. Besides, a multi-criteria analysis has been executed so as to
take into consideration environmental and social aspects. This all will lead into a
final chapter of advices for the users to be able to choose the best option
according to their needs.
At the outset of the project, feasibility study has been undertaken to choose the
appropriate solution from among the preliminarily suggested solutions for heating and
electricity before making a regress analysis. Thus, for heat production, biomass and CHP
and ground source energy were appraised whereas for electricity production, solar
energy and wind power were studied.
The output of the thorough feasibility study on the possible renewable energies has led
to a more refined and detailed analysis subdivided into different scenarios. The scenarios
are divided in to two major categories; these are Individual systems and collective
systems. The former, as the name implies is targeted towards devising an individual
energy supply system for each of the 71 households in the community. In this category,
the individual solutions for heat and electricity production were separately studied. Pellet
boiler and solar assisted ground source heat pump with water tank seasonal storage has
been studied as an individual heating option. Wind and solar energies were considered
and studied as an alternative electricity production for individual housing.
The other major scenarios discussed in this report are the collective energy supply system
to the community at large. In addition to supplying both heat and electricity from a
centralized plant the system has been developed in such a way to supply the required
amount of energy to the community as a whole. Under this major section, detailed
analysis has been carried out on systems such as solar assisted ground source heat
pump with boreholes seasonal storage and windmill, straw, CHP sterling woodchips,
ground source heat pump and biogas and solar thermal and biogas. As part of the
collective heating solution, this report also deals with district heating mechanism starting
from production plant, distribution network up to individual house installation.

8
Systems for sustainable energy supply for a small village
Master in European Construction Engineering (2012-2013)

9
Systems for sustainable energy supply for a small village
Master in European Construction Engineering (2012-2013)
2. LOCATION OF
THE PROJECT AREA

10
Systems for sustainable energy supply for a small village
Master in European Construction Engineering (2012-2013)
2.1. SITUATION
Føns is a small village in located in Middelfart municipality on the western Fyn located at
the base of the peninsula Fønsskov. The village belongs to the Region of Southern
Denmark.
Figure 2.1_1: Føns location within Denmark (Lonelyplanet, 2013)
On the following figure the area included in the project can be seen with dark red. For
more detail see appendix 7.2.
Figure 2.1_2: Project area location within Fønsskov peninsula [see Appendix 7.2]
South Denmark
Central Jutland
North Jutland
Sealand
Capital region

11
Systems for sustainable energy supply for a small village
Master in European Construction Engineering (2012-2013)
3. DATA
COLLECTION ABOUT HOUSES

12
Systems for sustainable energy supply for a small village
Master in European Construction Engineering (2012-2013)
3.1. INTRODUCTION
To develop a complete project, a data collection process has to be carried out in order
to obtain as much information as possible of the buildings that are going to be involved.
The more information gathered about the actual status of the buildings, insulation,
actual heating systems, position in the plot, the more accurate the calculations and the
final solution will be for these future users.
3.2. EXISTING BUILDING STUDY
Føns is composed of a main settlement area where the majority of the buildings are
close together and a peninsula. In some places along this peninsula there can be found
isolated houses.
As for this project is concerned, based on the limited time and resources, only the main
settlement area has been analysed. But as many building typologies has been analysed,
there will be no problem to extend this analysis to other houses that fit inside the
typological parameters studied.
In this specific case of supplying energy for a small community, the selection of the
buildings to integrate in the analysis was made based on the supposed boundaries of a
district heating, having into account that the district heating should have very well
defined limits not to reach an unreasonable installation cost.
Having that into account, some buildings may have fall outside the project because
their situation regarding the main installation. However, as the district heating is
supposed to be a decision of the community, is that community who has to decide if the
price of getting the installation to all the neighbours interested is affordable for the
village or not.
This project will also have into account individual solutions that would not be
conditioned by the district heating boundaries, but as a starting assumption due to time
and resources those were the buildings studied.
Within this frame, 76 buildings have been analysed. From which 71 have been chosen as
selectable. The others were rolled out due to their use or typology, e.g. church,
summerhouse or due to their actual heating system based on renewable energies.
To perform this study, there have been used several information sources, from the
existing information of the Danish government open databases, to a fieldwork (January
26th) based on visual recognition and photographic collection of the buildings.
(Energigruppen Føns og omegns lokaludvalg, 2012; Energistyrelsen, 2012; Danmarks
Miljøportal, 2013; Geodatastyrelsen matrikelinfo, 2013; Middelfart kommune, 2013;
Ministeriet for By, Bolig og Landdistrikter, 2013; SKAT, 2013; Offentlige Informationsserver ,
2013; Vedvarende Energy, 2010)
A database has been generated in order to include it in GIS maps and provide them
with this information. This database will not be included in this report by itself, because it
was a mean to complete maps in specific software.

13
Systems for sustainable energy supply for a small village
Master in European Construction Engineering (2012-2013)
Instead of this database, a series of record cards have been created with all the
relevant information to catalogue every building. (Appendix 7.4)
With this information was possible to calculate accurately the energetic demand of
each building. Also for every building the heat losses have been estimated, based on an
insulation study accompanied by the building information gathered.
To obtain the heat losses information, a process has been followed:
Starting from the data collected during the visit to Føns on January the 26th, and the
previous study to determine the composition of the closings of homes,
With regards to the design temperature, it has been established 2°C as a design outdoor
temperature and an amount of 3466 heating degree-days. The heating degree-days
indicate how winter weather affects building heating energy use. Both data have been
collected from the DMI -Danish Meteorological Institute- Technical Report 99-5 (Vaarby,
E., Sjølin, R., Cappelen, J., 1999).
Concerning to fuel type inputs, the study of the existing buildings in Føns showed us
electricity and fossil (solid and liquid) fuels as the main energy sources for heating.
Electricity has a price in Denmark of 0,41DKK/kWh and a 99% of furnace energy,
whereas fossil fuels have a price of 5,67DKK/kWh and a 59,5% of furnace energy
(Europe’s Energy Portal, 2013).
With these data as a starting point, and taking into account area and R-value inputs of
ceilings, walls, doors & windows, floors and slabs, as well as house volume and air
changes per hour, the tool developed by Built-It-Solar (Build it Solar, 2013) has been used
in order to obtain:
Design Heat Loss in kWh. The total heat loss from each house per hour when the
outside temperature is at the Design Outdoor Temperature that we established as
an input.
Total yearly heat loss in MWh. This is a rough estimate of the total heat loss from
each house for a typical year. It is based on the number of Heating Degree Days
we defined.
Total yearly cost for fuel in DKK. This is the cost of the fuel to heat each house
based on the previous total yearly heat loss, and the fuel type, fuel cost, and
furnace efficiency we defined.
Total ten year cost for fuel in DKK. This is the cost of fuel for 10 years with the
assumption that fuel costs will rise 10% each year of the 10 years.
Tonnes of CO2 gas emissions for heating each house (yearly). For electricity, we
have assumed that the electricity was generated at an average rate of 0,00075
tonnes CO2 per kWh.
Finally, in the record card of each building it is shown a graphic representing these
infiltrations, gains and heat losses for ceilings, walls, windows, floors and slabs.
Føns urban plan:
To complete the database information, the local urban plan has been studied in order
to preserve the protected buildings and points of interest. (Føns lokalplan, 1981)

14
Systems for sustainable energy supply for a small village
Master in European Construction Engineering (2012-2013)
Figure 3.2_1: Føns local urban plan
As it is shown in the map, the striped hatches indicate a protected building or a
protected tree (round hatches).
For future modifications based on this work, those protected elements have to be
respected, it is important to notice that not only buildings are protected but also trees.

15
Systems for sustainable energy supply for a small village
Master in European Construction Engineering (2012-2013)
3.3. BUILDING CONSTRUCTION STUDY
Due to the high number of houses in Føns and the impossibility of knowing the exact
materials used, the help of Professor Torben Lundberg from VIA University have been
used, and other data (Danske Bygnings Modeller, 2013) to simplify the constructive
solutions.
Thereby it has been established the three following types of housing.
Building type A: Contemporary construction (1960 – 2000)
- Roof: Asphalt Shingles + 3x100 mm Mineral Wool
- Wall: Brick layer + Air space + 2x125mm Mineral Wool + Gas concrete block
layer + Gypsum
- Slab: Insulated.
Building type B: Refurbishment / Brick walls structure (1920 – 1960)
- Roof: Asphalt Shingles + 3x100 mm Mineral Wool
- Wall: 2x100mm Exterior Insulation + Gas concrete block layer / Brick layer +
1x100mm Mineral Wool + Gypsum
- Slab: No insulated.
Building type C: Refurbishment / Wood structure (1850-1920)
- Roof: Wood Shingles + 3x100 mm Mineral Wool
- Wall: Reed/Plywood layer + 2x100mm Mineral Wool + Brick layer + Gypsum
- Slab: No insulated.
Building type A Building type B Building type C
Figure 3.3_1: Building types
Starting from these housing inputs, they have modified depending on the data provided
by the website ois.dk and the one collected by means of the visual inspection on the
fieldwork in Føns (carpentry status, exceptions, and so on).
The R-value is a measure of thermal resistance used in the construction industry. In order
to determine the R-values of the different closures, the method "Wall Assembly R-Value”
has been used (All Wall System, 2012) by adding the R-Values.
ROOF CONSTRUCTION
Dormers
19

16
Systems for sustainable energy supply for a small village
Master in European Construction Engineering (2012-2013)
3.4. CONCLUSION
The estimation of the energy needs for the town of Føns has been made from the study
of the different houses that configure the town. These data are shown in Appendix 7.4
and from these, the present report will pose and develop the different possible solutions.
Therefore, these proposals are based on the current needs of Føns.
However, it is important to note that a poorly insulated house needs more heat
production to maintain its temperature, increasing its energy consumption.
For this reason, we have considered necessary to make a detailed study, for each one
of the houses, the heat losses that take place in each of the four following building
elements: ceilings, walls, windows and doors, and foundation slabs, as well as the
infiltrations which are carried through the overall surface of the housing.
The final values of heat loss for the total numbers of studied homes in Føns are:
Total yearly heat loss 154,6 MWh 100%
Heat loss through ceilings 154,6 MWh 8%
Heat loss through walls 110,7 MWh 6%
Heat loss through windows and doors 383,8 MWh 20%
Heat loss through slab 169,2 MWh 8%
Heat loss due to infiltrations 1131,6 MWh 58% Figure 3.4_1: Heat losses
The values obtained in each of the houses have allowed us to simplify the results in the
following chart. Here, we show the total yearly heat loss in MWh of three houses with
similar surface (180 m2), but different date of construction, and therefore, with different
constructive solutions. Such differentiation corresponds to the types of insulation defined
in the previous point.
Year of construction 2008 1960 1900
Total yearly heat loss in MWh 19,3 30,8 49,4
Percentage of heat loss through
ceilings
13% 8% 7%
Percentage of heat loss through
walls
4% 6% 4%
Percentage of heat loss through
windows and doors
10% 22% 13%
Percentage of heat loss through slab <1% 9% 6%
Percentage of heat loss due to
infiltrations
73% 55% 70%
Figure 3.4_2: Houses values
In any housing in general, and those which construction is prior to 1980 in particular, small
improvements in insulation can lead to economic and energy savings of up to 30% on
heating. Since roofs are those that constitute the surface where most heat is lost in a
home, improving insulation can reduce up to 35% on heating costs.

17
Systems for sustainable energy supply for a small village
Master in European Construction Engineering (2012-2013)
The composite wood and fibreglass or polyurethane are simple solutions that require little
manpower. So too are special paints that deflect the heat to another point.
We must stress that in homes built prior to 1980, replacing the existing carpentries with
other ones more efficient thermally, would be a significant reduction in heat loss that
take place through doors and windows (to about half). The insulation of foundation slabs
would lead to a reduction of heat loss even greater, about 80%, depending of the
house.
But enhancements do not end here. A state of the art developed in appendix 7.14
about Low Temperature District Heating has shown that high-energy efficient dwellings
would allow the reduction of the circulating water temperature in the DH network from
90 to 70 degrees Celsius.
For this reason, we would like to emphasize that we understand that the data obtained
for the different housing should be considered as an additional tool to guide the Føns
inhabitants to decision making of energetic nature. This means that we believe that the
final decision of the Føns inhabitants should not be restricted to the choice of one or
another kind of electricity and heating system, but also taking constructive solutions to
improve the construction quality of housing and, in this way, reduce energy demand.

18
Systems for sustainable energy supply for a small village
Master in European Construction Engineering (2012-2013)

19
Systems for sustainable energy supply for a small village
Master in European Construction Engineering (2012-2013)
4. ALTERNATIVE STUDY

20
Systems for sustainable energy supply for a small village
Master in European Construction Engineering (2012-2013)
4.1 INTRODUCTION PHASE 1
The following information gathers the different alternatives studied to provide Føns
village of heating and electricity supply. This section includes all the relevant information
necessary to develop the collective and individual solutions on phase 2.
First of all, some common assumptions must be taken in order to be able to carry on with
the study. The information below is presented in Appendix 7.4, where it is found the
different studies developed to arrive at the following final data:
- The number of houses is set in 71
- The total need of heating is 1.965.835 kWh per year - The total need of electricity is 315.000 kWh per year
Secondly, the full covering of the heating and hot water demand for the 71 dwellings will
be studied. Different fuel solutions will be considered in three main scenarios: The
implementation of individual biomass boilers, the implementation of a district heating
net, and the implementation of a district heating net powered by a cogeneration plant.
The study that permits the use of this information is in section 5.3.
GENERAL ASSUMTIONS HEATING
- Heat supply considerations. (See Appendix 7.4)
o ANNUAL HEAT DEMAND – 1.965.835kWh/year
o ACTUAL AVERAGE ANNUAL HEATING COST – 29.721 DKK/year, +3% annual
increases. (1 house, oil boiler)
o TOTAL HEAT PEAK DEMAND – 639KW
- Annual heating period considered - 9 months, (September to March).
- District heating distribution net.
o TOTAL ESTIMATED INVESTMENT – 2.797.600 DKK
o ANNUAL MAINTENANCE COST – 51.500 DKK
Finally, as each alternative will provide estimation on the return of the investment that each user should do. There are some assumptions that must be taken into account:
- The price for selling electricity is 0,35 DKK/kWh (Plan Energi, 2012)(notice that solar
systems will apply the new energy regulation regarding price for selling and
buying electricity).
- The price for buying electricity is 2,2 DKK/kWh
- Bank loan:
o Interest rate at 3%
o Initial payment per user of 45.000 DKK
o Annual payment per user of 18.000 DKK
- VAT of 25%
- Exchange rate from DKK to Euro of 7,46046 - Electricity inflation 3%
21
Systems for sustainable energy supply for a small village
Master in European Construction Engineering (2012-2013)
The study of the different alternatives starts below. The first section is destined for heating
alternatives while the second is focussed on electricity.
HEATING ALTERNATIVES
This section defines the different alternatives in accordance to heat supply in Føns. First
of all, Biomass and Cogeneration systems and secondly Geothermal alternatives that will
work thanks to different combinations.
ALTERNATIVE 1: BIOMASS AND CHP
The following part develops the study of 6 different alternatives. These scenarios can be
divided into three groups. The first one refers to the proposal of an individual solution
based on a pellet boiler; the second one studies a district heating plant considering as
possible fuels wood-chips, straw and biogas; the third solution studies the
implementation of a cogeneration plant considering two fuels woodchips and biogas.
ALTERNATIVE 2: GEOTHERMAL
The study included in this part is compound by the development of 4 different
alternatives based on ground source heat pump solutions.
The first three ones refer to the proposal of individual heating supply solutions. The
alternative 1 and 2 focus on individual solar assisted heat pump. The former considers a
water tank seasonal storage system whereas the latter is based on boreholes seasonal
storage. The alternative 3 deals with an individual heat pump with boreholes without
being assisted by solar collectors.
To conclude, a collective solution is developed. The last alternative studies a district
heating plant considering a collective solar assisted heat pump with boreholes seasonal
storage.
ELECTRICITY ALTERNATIVES
This section defines the different alternatives in accordance to electricity supply in Føns.
First of all, Solar power and then, wind power.
ALTERNATIVE 1: SOLAR PANELS
In this part the analysis of the different options regarding solar systems will be analysed.
Both individual and collective installations will be considered, taking into account the
differences regarding the current energy regulation in Denmark, recently changed to
favour collective systems.

22
Systems for sustainable energy supply for a small village
Master in European Construction Engineering (2012-2013)
ALTERNATIVE 2: WIND POWER
The following part develops two different alternatives related to wind power. The first
alternative considers the execution of a wind turbine that will create enough energy to
supply Føns village while the second alternative considers for each house a wind turbine
located in the garden’s area. Both alternatives are going to be taken into detail below.

23
Systems for sustainable energy supply for a small village
Master in European Construction Engineering (2012-2013)
4.2. HEATING ALTERNATIVES FEASIBILITY STUDY
4.2.1. ALTERNATIVE 1: BIOENERGY
INTRODUCTION
In this part of the feasibility study, the full covering of the heating and hot water demand
for the 71 dwellings will be studied. Different fuel solutions will be considered in three
main scenarios: The implementation of individual biomass boilers, the implementation of
a district heating net, and the implementation of a district heating net powered by a
cogeneration plant.
ASSUMPTIONS
Three possible heating solutions will be considered:
o The implementation of an individual heating system.
o The implementation of a collective heating system.
o The implementation of a collective heating and electricity production
system.
The cogenerations systems proposed will be focused on fulfilling the heating
demand of the households, while the electricity surplus produced will be
considered as a secondary production.
Considering the conclusions gathered on previous reports (Alberdi Pagola,
Alvarez Anton, Andersen, Awugya, & De Vivo, 2012), a list of options will be
rejected due to economic and technical considerations.
For the options considered, the economic aspects, regulations and social
aspects, technical and environmental considerations will be studied to select the
most suitable solution.
OPTIONS REJECTED
The following solid biomass-based systems will be discarded, considering the conclusions
obtained on previous research (Alberdi Pagola, Alvarez Anton, Andersen, Awugya, & De
Vivo, 2012).
Firewood – For individual and collective systems, this solution requires a high initial
investment; while it’s low performance and high fuel cost do not compensate this
investment.
Briquettes – For individual and collective systems, this solution requires a high initial
investment; while it’s low performance and high fuel cost do not compensate this
investment.

24
Systems for sustainable energy supply for a small village
Master in European Construction Engineering (2012-2013)
Charcoal – For individual and collective systems, this solution will not be
considered due to the high fuel cost and the low efficiency of the system, on
developed countries this fuel has been rejected for new installations.
Forest Chips – For individual systems, this solution has been discarded due to the
high initial investment and complexity for the loading system and boiler, which
cannot be compensated with the actual fuel cost.
Straws – For individual systems, this solution has been discarded due to the high
initial investment and complexity for the loading system and boiler, which cannot
be compensated with the actual fuel cost.
Grain – For individual and collective systems, this solution has been discarded due
to the high initial investment and complexity for the loading system and boiler in
the case of individual boilers, which cannot be compensated with the actual fuel
cost. In the case of collective boilers, the price of grain (wheat, corn…) makes the
solution less interesting compared with other fuels (straws, woodchips…), while the
initial investment would be similar.
The following biofuel-based systems will be discarded, considering the conclusions
obtained on previous research (Alberdi Pagola, Alvarez Anton, Andersen, Awugya, &
De Vivo, 2012).
Biodiesel – For individual and collective solutions, the use of biodiesel boilers will
not be considered, as the fuel price reaches the same values as diesel fuel and
do not compensate the initial investment.
Bioethanol – For individual and collective solutions, the use of bioethanol will not
be considered, because the actual market price makes the investment not
feasible.
OPTIONS CONSIDERED
Installing an individual system for each user.
Individual pellet boiler.
The solution will consist on the installation of an individual boiler, with a nominal
power of 12,5KW. It will consist on an automatic boiler with integrated feeding
system and manual loading, including a pellet container of 150-200l. Considering
the model HPK-RA 12,5 "CLIBER-GILLES".
Installing a collective heating system.
The distribution net is based on the district heating net mentioned on heating
assumptions.
Collective heating solution
District heating with Wood-Chips boiler.
This solution will integrate a wood-chips feeding system, which will power two
300KW wood-chip boilers, considering the model HPKI-K 300 "CLIBER-GILLES". The
system will count with 4 buffer tanks of 800l.
District heating with Straw boiler.

25
Systems for sustainable energy supply for a small village
Master in European Construction Engineering (2012-2013)
This solution will integrate a straw feeding system, consisting on a conveyor belt
combined with a loader, which will power a 600KW adapted straw burners,
considering the model HTHW HHF600 "DANSTOKER”. The system will count with an
auxiliary gas-oil boiler, which will be used on peak demand days and during the
maintenance of the main boiler. The system will count with 4 buffer tanks of 800l.
The loading of the straw bales will be manual, considering the purchase of a
second hand minilader.
District heating Biogas.
This solution will integrate a biogas tank of 25m3, which will power two 310KW
biogas burners, considering the model Logano Plus SB 615 "BUDERUS". The system
will count with 4 buffer tanks of 800l.
Collective heating and electricity production system
District heating Wood-Chips + Cogeneration.
This solution will integrate a wood-chips fueled gasification boiler, which will power
5 gas burners, each one combined with a Stirling engine. This solution will be
dimensioned to reach a power of 700KW of heating production and 175Kw of
electricity output. The model selected for the 4 boilers will be: 35kW SD4 engine
“Stirling DK”. The solution will integrate four buffer-tanks of 800l.
District heating Biogas + Cogeneration.
This solution will integrate a biogas tank of 30m3, which will power 5 gas burners,
each one combined with a Stirling engine. This solution will be dimensioned to
reach a power of 700KW of heating production and 175Kw of electricity output.
The model selected for the 5 boilers will be: 35kW SD4 engine “Stirling DK”. The
solution will integrate four buffer-tanks of 800l.
Cogeneration proposed options are very innovative and there are still few producers. It
is currently being researched and improved; few projects have already been realized.
Despite what it is supposed to be the leading company in the world, located here in
Denmark, it has not been possible to get any direct and real precise budged or cost
reference. Therefore it has only been possible to do an estimating with figures from a
report (E. Podesser, 2005). Despite this lack of information this modern systems surely are
the future of Biomass cogeneration in small scale.
CONSIDERATIONS
TECHNICAL ASPECTS
For this analysis, it will be considered the technical feasibility of installing and running the
system, considering the previous proposals. An estimated budget for the installation cost
and annual maintenance will be added, in order to compare the options analytically on
the economic analysis.

26
Systems for sustainable energy supply for a small village
Master in European Construction Engineering (2012-2013)
FUEL LHV Cost
(DKK/GJ)
Cost
(DKK/MWh)
Yearly
variation
Wood Chips 13.320 KJ/Kg 38,10 137,16 +5,22%
Pellets 19.000 KJ/Kg 71,40 257,04 +1,00%
Straw 18.000 KJ/Kg 39,06 140,62 + 1,67%
Biogas 35.900 KJ/Nm3 115 414 ± 0,00%
Figure 4.2.1_1: Fuel considerations. Source: (Ea Energy Analyses, 2010) (WIP Renewable Energies,
2012)
* Yearly price variation has been estimated considering the Danish Energy Agency cost
forecast from 2010 to 2020.
* Biogas variation will be considered as ±0%, considering the establishment of a fixed
feed-in tariff by the Danish Government from 2012 to the year 2020.
* All the inflation estimations are considered up to the year 2020, before this there will be
considered a steady rate, as doing a prediction is not possible
SYSTEMS AND EQUIPMENT
Individual pellet boiler. (Gilles, 2012) (Burdeus, 2012) (Negarra, 2012)
o Power – 12,5Kw
o Temperature range
Impulsion – 70ºC
Return – 50ºC
o Performance – 85%
o Annual consumption – 30.382KWh/year
o Annual maintenance cost – 1.250 DKK/year
o Installation cost – 176.669 DKK
DESCRIPTION COST (DKK)
Pellet boiler (HPK-RA 12,5 "CLIBER-GILLES") 105.500 DKK
SHW -tank 75l (Logalux ER 75 "BUDERUS") 4.700 DKK
Extraction system (COAXIS W "NEGARRA") 1.200 DKK
Installation and connection (10%) 11.500 DKK
TOTAL INSTALLATION COST 122.900 DKK
GC+IB (9%+6%) 18.435 DKK
Total cost 141.335 DKK
VAT (25%) 35.334 DKK
TOTAL 176.669 DKK
Figure 4.2.1_2: Cost analysis of the individual pellet boiler system
* These costs refer to the estimated costs for the implementation of the solution into a
house heated by a combustion based method. The internal installations concerning
emitters will not be included.
Collective wood-chips boiler. (Gilles, 2012) (Burdeus, 2012) (Negarra, 2012)
o Power – 2X 300KW
o Temperature range
Impulsion – 95ºC
Return – 40ºC
o Performance – 90%

27
Systems for sustainable energy supply for a small village
Master in European Construction Engineering (2012-2013)
o Consumption – 2.157.213Kwh/year
o Annual maintenance cost – 35.000 DKK
o Installation cost – 4.852.684 DKK
DESCRIPTION COST (DKK)
Wood-chips boiler X2 (HPKI-W 300 "CLIBER-GILLES”) 2.107.700 DKK
Loading system(HPKI-K/R/W "CLIBER-GILLES”) 28.950 DKK
Storage silo (63m3 "CLIBER-GILLES”) 355.970 DKK
Buffer-tank 800l X4 (PSM 800 "CLIBER-AUSTRIA”) 25.200 DKK
Extraction system (GC-25 ALU PLUS "NEGARRA") 41.980 DKK
Site building (100m2, industrial) 560.000 DKK
Installation and connection (10%) 255.980 DKK
TOTAL INSTALLATION COST 3.375.780 DKK
GC+IB (9%+6%) 506.367 DKK
TOTAL COST 3.882.147 DKK
VAT (25%) 970.537 DKK
TOTAL 4.852.684 DKK
Figure 4.2.1_3: Cost analysis of the collective wood-chips boiler system
Collective straw boiler. (Danstoker, 2012) (Burdeus, 2012) (Negarra, 2012) (Gilles,
2012)
o Power – 1X 600KW + 1X125KW
o Temperature range
Impulsion – 95ºC
Return – 40ºC
o Performance – 87%
o Consumption – 2.231.600KWh/year
o Annual maintenance cost – 140.115 DKK/year
Annual maintenance cost – 85.800 DKK/year
Annual Gas-oil consumption – 33.690 DKK/year
* Considered price 11.230 DKK/l (Plan Energi, 2012)
o Installation cost – 4.928.171 DKK
DESCRIPTION COST (DKK)
Straw boiler (HTHW HHF600 "DANSTOKER”) 2.300.000 DKK BACKUP SYSTEM
Gas-oil boiler (Logano SK 645 "BUDERUS") 56.200 DKK
Gas-oil tank (3000l) 11.250 DKK
Loading system ("DANSTOKER”) 32.000 DKK
Charging machinery (CAT "216B”)(2nd hand) 90.000 DKK
Buffer-tank 800l X4 (PSM 800 "CLIBER-AUSTRIA”) 25.200 DKK
Extraction system (GC-25 ALU PLUS "NEGARRA") 41.980 DKK
Site building (200m2, industrial) 560.000 DKK
Installation and connection (10%) 255.663 DKK
TOTAL INSTALLATION COST 3.116.630 DKK
GC+IB (9%+6%) 467.495 DKK
TOTAL COST 3.593.125 DKK
VAT (25%) 898.281 DKK
TOTAL 4.491.406 DKK
Figure 4.2.1_4: Cost analysis of the collective straw boiler system

28
Systems for sustainable energy supply for a small village
Master in European Construction Engineering (2012-2013)
Collective biogas boiler. (Burdeus, 2012) (Gilles, 2012) (Negarra, 2012)
o Power – 2X 310KW
o Temperature range
Impulsion – 95ºC
Return – 40ºC
o Performance – 99%
o Consumption – 1.961.103KWh/year
o Annual maintenance cost – 12.500DKK/year
o Installation cost – 1.315.481 DKK
DESCRIPTION COST (DKK)
Biogas boiler X2 (Logano Plus SB 615 "BUDERUS") 360.200 DKK
Pressurized Biogas tank 25m3 (superficial) 150.000 DKK
Buffer-tank 800l X4 (PSM 800 "CLIBER-AUSTRIA”) 25.200 DKK
Extraction system (GC-25 ALU PLUS "NEGARRA") 41.980 DKK
Site building (100m2, industrial) 280.000 DKK
Installation and connection (10%) 57.738 DKK
TOTAL INSTALLATION COST 915.118 DKK
GC+IB (9%+6%) 137.267 DKK
TOTAL COST 1.052.385 DKK
VAT (25%) 263.096 DKK
TOTAL 1.315.481 DKK
Figure 4.2.1_5: Cost analysis of the collective biogas boiler system
- District heating Wood-Chips + Cogeneration. 4x35 kw Stirling engine wood chips*
system. (Stirling DK, 2011) (E. Podesser, 2005) (Gilles, 2012) (Burdeus, 2012)
(Negarra, 2012) (*Wood chips of Austrian Önorm classification G50: moisture content of 35-55%)
o Power – 4X 35kWe + 140kWth (Total 140kWe & 560kWth)
o Temperature range
Impulsion – 95ºC
Return – 40ºC
o Performance
Gasification – 97%
Heat – 70%
Electric – 17%
Total system – 69%
o Consumption – 2.808.335,7KWh/year
o Annual maintenance cost – 102.138DKK/year
Annual maintenance cost boilers – 35.000DKK/year
Annual maintenance cost stirling – 33.448DKK/year
Annual Gas-oil consumption – 33.690 DKK/year
* Considered price 11.230 DKK/l (Plan Energi, 2012)
o Installation cost – 8.505.156 DKK

29
Systems for sustainable energy supply for a small village
Master in European Construction Engineering (2012-2013)
DESCRIPTION COST (DKK)
4x35 kw Stirling engine wood chips*system (STIRLING DK) 5.222.000 DKK
Storage silo
Loading system
Updraft gasification and combustion system
Biogas boiler
Buffer-tank 800l X4 (PSM 800 "CLIBER-AUSTRIA”) 25.200 DKK
Extraction system (GC-25 ALU PLUS "NEGARRA") 41.980 DKK
BACKUP SYSTEM
Gas-oil boiler (Logano SK 645 "BUDERUS") 56.200 DKK
Gas-oil tank (3000l) 11.250 DKK
Site building (200m2, industrial) 560.000 DKK
TOTAL INSTALLATION COST 5.916.630 DKK
GC+IB (9%+6%) 887.495 DKK
TOTAL COST 6.804.125 DKK
VAT (25%) 1.701.031 DKK
TOTAL 8.505.156 DKK Figure 4.2.1_6: Cost analysis of the District heating Wood-Chips + Cogeneration
District heating Biogas + Cogeneration. 4x35 kw Stirling engine biogas system.
(Stirling DK, 2011) (E. Podesser, 2005) (Burdeus, 2012) (Gilles, 2012) (Negarra, 2012)
o Power – 4X 35kWe + 140kWth (Total 140kWe & 660kWth)
o Temperature range
Impulsion – 95ºC
Return – 40ºC
o Performance
Heat – 70%
Electric – 17%
Total – 87%
o Consumption –2.808.335,7KWh/year
o Annual maintenance cost – 79.638DKK/year
Annual maintenance cost stirling – 33.448DKK/year
Annual maintenance cost boilers – 12.500DKK/year
Annual Gas-oil consumption – 33.690 DKK/year
* Considered price 11.230 DKK/l (Plan Energi, 2012)
o Installation cost – 6.943.484 DKK

30
Systems for sustainable energy supply for a small village
Master in European Construction Engineering (2012-2013)
DESCRIPTION COST (DKK)
4x35 kw Stirling engine biogas system (STIRLING DK) 4.177.600 DKK
Buffer-tank 800l X4 (PSM 800 "CLIBER-AUSTRIA”) 25.200 DKK
BACKUP SYSTEM
Gas-oil boiler (Logano SK 645 "BUDERUS") 56.200 DKK
Gas-oil tank (3000l) 11.250 DKK
Site building (200m2, industrial) 560.000 DKK
TOTAL INSTALLATION COST 4.830.250 DKK
GC+IB (9%+6%) 724.538 DKK
TOTAL COST 5.554.788 DKK
VAT (25%) 1.388.697 DKK
TOTAL 6.943.484 DKK Figure 4.2.1_7: Cost analysis of the District heating Biogas + Cogeneration
ENVIRONMENTAL ASPECTS
As biomass is considered legally zero balance carbon emissions energy, the
environmental impact of this heating system is reduced to the limitation of the gaseous
emissions on protected areas and living areas. The controversy of the neutral CO2
balance will be relegated aside, considering the official European outlook as the valid
one for this analysis.
SOCIAL ASPECTS
On this section, all the actual regulations will be taken into account; in order to evaluate
if it is legally feasible to execute the project. Furthermore, the existence of grants and
government support will be studied, providing a better economic environment for the
investment.
Individual pellet boiler
The implementation of this individual system has no legal problems, and there is needed
just to ask for a work permit to the local authorities.
For heating purposes there are no grants, neither Danish nor European.
Collective systems
The implementation of this collective system requires the permission from the local legal
authorities to implement the district heating net, the situation of the plant has to be
studied according to national and local regulation (see Appendix n).
Grants:
Collective wood chips boiler.
Collective straw boiler.
Collective biogas boiler.
For heating purposes there are no Danish nor European grants, that can be applied on
the present project (see Appendix n).
District heating wood-chips + cogeneration
District heating biogas + cogeneration
For cogeneration systems there are Danish grants, that can be applied on the present
project (see Appendix n)

31
Systems for sustainable energy supply for a small village
Master in European Construction Engineering (2012-2013)
ECONOMIC ASPECT
The economic considerations will basically take into account the cost of the initial
investment, analyzing the long term-cash flow of the investment taking into account the
annual consumptions and maintenance costs, energy productions and sells in case on
the case of cogeneration systems and the financial costs of the operation. The
comparison will be carried out considering the estimated investment of one owner.
All the heating solutions will be compared with the estimate annual cost of running a
traditional heating system, which will be considered as 17.500 DKK/year, considering an
annual increase of 3% on the cost (See heating introduction).
Individual pellet boiler
Annual consumption – 32.574KWh/year
Annual maintenance cost – 1.250 DKK
Initial Investment – 176.669 DKK
Annual fuel cost – 8.373 DKK
o Yearly fuel inflation - +1,00%
Collective wood chips boiler
Annual consumption – 30.764KWh/year
Annual maintenance cost – 1.218 DKK
o Annual maintenance cost installation – 493 DKK
o Annual maintenance cost district heating – 725 DKK
Initial Investment – 107.841 DKK
o Initial Investment boiler – 68.348 DKK
o Initial Investment district heating – 39.403 DKK
Annual fuel cost – 4.220DKK
o Yearly fuel inflation - +5,22%
Collective straw boiler
Annual consumption – 31.825KWh/year
Annual maintenance cost – 2.698 DKK
o Annual maintenance cost installation – 1.973 DKK
o Annual maintenance cost district heating – 725 DKK
Initial Investment – 102.662 DKK
o Initial Investment boiler – 63.259 DKK
o Initial Investment district heating – 39.403 DKK
Annual fuel cost – 4.475 DKK
o Yearly fuel inflation - +1,67%

32
Systems for sustainable energy supply for a small village
Master in European Construction Engineering (2012-2013)
Collective biogas boiler
Annual consumption – 27.967KWh/year
Annual maintenance cost – 901 DKK
o Annual maintenance cost installation – 176 DKK
o Annual maintenance cost district heating – 725 DKK
Initial Investment – 57.931DKK
o Initial Investment boiler – 18.528 DKK
o Initial Investment district heating – 39.403 DKK
Annual fuel cost – 11.578DKK
o Yearly fuel inflation - +0,00%
District heating wood-chips + cogeneration
Annual consumption –39.554KWh/year
Annual maintenance cost –2.164 DKK
o Annual maintenance cost installation – 1.439DKK
o Annual maintenance cost district heating – 725 DKK
Initial Investment – 159.193 DKK
o Initial Investment Cogeneration System – 119.790 DKK
o Initial Investment district heating – 39.403 DKK
Annual fuel cost –4.913 DKK
o Yearly fuel inflation - +5,22%
District heating biogas + cogeneration
Annual consumption –39.554KWh/year
Annual maintenance cost –1.847DKK
o Annual maintenance cost installation – 1.122DKK/year
o Annual maintenance cost district heating – 725 DKK
Initial Investment – 137.198 DKK
o Initial Investment Cogeneration System – 97.795DKK
o Initial Investment district heating – 39.403 DKK
Annual fuel cost – 16.301 DKK
o Yearly fuel inflation - +0,00%

33
Systems for sustainable energy supply for a small village
Master in European Construction Engineering (2012-2013)
CONCLUSSIONS
INDICATORS
The following economic indicators referred to the investment have been selected in
order to compare all the scenarios proposed. For further information, check the cash-
flow tables in Appendix 7.15.
INDICATOR I. PELLET
BOILER
DH. WOODCHIPS
DH. STRAW DH. BIOGAS CHP. WOODCHIPS
CHP. BIOGAS
Initial investment 176.669 DKK 124.562 DKK 102.662 DKK 57.931 DKK 159.193 DKK 137.198 DKK
Loan period 9 years 6 years 5 years 2 years 8 years 7 years
Break-even point 8 years 4 years 4 years 4 years 2 years 2 years
Profit 10 years 42.494 DKK 150.415 DKK 157.008 DKK 157.221 DKK 274.689 DKK 274.689 DKK
Profit 20 years 398.120 DKK 550.891 DKK 537.674 DKK 490.328DKK 925.701DKK 907.627 DKK
Profitability 10 years 20% 120% 153% 271% 173% 200%
Profitability 20 years 225% 442% 524% 846% 581% 662%
Figure 4.2.1_8: Economical indicators
GRAPHICS
Figure 4.2.1_9: Compound Cash-Flow for individual pellet boiler and heating solutions

34
Systems for sustainable energy supply for a small village
Master in European Construction Engineering (2012-2013)
Figure 4.2.1_10: Compound Cash-Flow for cogeneration solutions
Figure 4.2.1_11: Compound Cash-Flow for all the solutions

35
Systems for sustainable energy supply for a small village
Master in European Construction Engineering (2012-2013)
INDIVIDUAL SYSTEMS
Once compared the economic data of the individual system with the investment on a
district heating, the following conclusions can be assessed.
- The initial investment required per each neighbor is a 72% Higher, which requires
an estimated loan period of 9 years compared to the 5 years of the most
expensive district heating solutions.
- The yearly consumption is almost the double of the district heating solutions. This
cost combined with a higher initial investment makes the investment to take 5
years to turn the cash-flow into positive numbers.
- Considering the overall balance of the investment at 10 and 20 years, there can
be assessed that: The profits of the overall investment are a 66% and a 30% lower
respectively.
Considering all these economic factors, there can be assessed that the investment on
an individual heating solution is not worthy compared with the benefits of a district
heating solution.
The implementation of this solution should be relegated just in case of impossibility of
connection to the district heating net.
Considering these two points, there has to be remarked that this investment represents
an investment with an average annual profit of 12%, with a lifespan of 20 years. And
considering a period of 10 years reaches an annual profit of 3,5%, which may turn into a
profitable investment though.
COLECTIVE HEATING SOLUTIONS
Concerning the collective solutions, depending on the interests of the investors, several
solutions can be adopted.
- The biogas district heating plant represents the solution with the lowest initial
investment required; this solution requires also the lowest loan period to be paid (2
years).
- The investment with the shortest break-even point (the one which go positive first)
is the woodchips district heating plant, with a break-even point on the 3rd year.
- The district heating solution with a woodchips plant represents the investment with
the highest benefits at 10 and 20 years, followed by the straw plant.
Having considered all these factors, and once analyzed all the solutions, there can be
assessed that the woodchips district heating plant represents the best investment.
COLECTIVE COGENERATION SOLUTIONS
Regarding the accuracy of this study, the prices taken for the installation cost of Stirling
systems has been taken from published numbers of leading company Stirling DK, maybe
the only one currently offering updraft gasifier systems for converting woodchips into
biogas. As the source referenced did not made any difference in price between
woodchips systems and biogas system, a 20% discount has been applied to biogas
system because this system is simpler.

36
Systems for sustainable energy supply for a small village
Master in European Construction Engineering (2012-2013)
Concerning the cogeneration solution, and comparing the results obtained with the
ones gathered from the district heating solutions, there can be seen that this investment
represents a higher initial investment but reaches higher profits with greater returns.
- The biogas cogeneration plant represents the solution with the lowest initial
investment required; this solution requires also the lowest loan period to be paid
(11 years).
- The wood-chips gasification plant is the investment with the greatest benefits at
10 and 20 years
Having considered all these factors, and once analyzed all the solutions, there can be
assessed that the woodchips cogeneration plant represents the most interesting
investment.

37
Systems for sustainable energy supply for a small village
Master in European Construction Engineering (2012-2013)
4.2.2. ALTERNATIVE 2: GROUND SOURCE
ENERGY
INTRODUCTION
Heat Pumps have demonstrated that can achieve high efficiencies, in other words, they
can both save money and reduce CO2 emissions.
In the case of Denmark and its hard temperatures, if the heat pump takes the heat from
the cold air, the efficiencies will not be good enough. Taking benefit of the steady and
warmer (about 9 degrees) temperature of the ground, the efficiency of the system
would be good enough to make it feasible.
These systems are not so rare in Denmark, mainly in individual houses heating. However,
new developments and improvements of these systems are in progress, introducing new
elements to the GSHP system, as solar collectors with or without heat storage, and also
considering collective solutions.
Solar collectors
The solar collectors are used in order to store heat into the soil while the sun heat is
available, mainly in summer time.
One of the reasons to include solar collectors in a ground source system is based on the
fact of achieving higher heat pump efficiencies.
With the solar collectors and storage system, the input temperature of the heat pump
can be raised, which means reaching better efficiencies in the system.
Individual / Collective system
As far as the system in general is concerned, collective systems have to be considered,
because of the improvement of the efficiency and its other advantages. However, some
houses and farms in Føns are not close to the others, so an individual system for these
houses may be necessary.
Storage systems
Taking into account the brief description of the main typologies of storage systems
gathered in the Group Project I report and in the appendix, some conclusion and
assumptions have been made.
- Water tank could be considered as the most well- disposed storage system from a
thermodynamic point of view and occupied a short space with the same heat
capacity comparing it with other storage systems.
- One of the main advantages of boreholes storage system is its modularity, which
could be a significant feature if new householders want to join to the district
heating system.

38
Systems for sustainable energy supply for a small village
Master in European Construction Engineering (2012-2013)
The main point to combine solar panel and ground source heating is the season
characteristic in north countries. Indeed, it is in summer that the reception of solar
radiance is the highest although our energy need is lower than in winter. Therefore, the
interest of that combination is to store the amount of energy collected in summer to use
it in winter. Here, the way of storage is borehole in the ground, but it is existed different
other methods detailed in Appendix 7.8.
Moreover, the point is that during the summer, the energy collected has to be used in
order to avoid the water which circulates in pipes boils and damage the system. To
prevent that problem, the owner has three solutions: paint the panels in white to reduce
their efficiency, to heat the house even if it is not necessary (heat waste) or store it in the
ground to make the water circulate by storing the energy for cooler seasons.
ALTERNATIVES TO BE STUDIED
Taking into account all the considerations gathered in the appendix, it has been made
the decision of studying the next alternatives.
Alternative 1: Individual solar assisted heat pump with water tank seasonal storage
- Individual heat pump
- Individual solar collectors
- Individual storage in a water tank
Alternative 2: Individual solar assisted heat pump with boreholes seasonal storage
- Individual heat pump
- Individual solar collectors
- Individual boreholes storage.
Alternative 3: Individual heat pump with boreholes
- Individual heat pump.
- Individual boreholes.
Alternative 4: District solar assisted heat pump with boreholes seasonal storage
- District heat pump
- District solar collectors
- District storage with boreholes.

39
Systems for sustainable energy supply for a small village
Master in European Construction Engineering (2012-2013)
JUSTIFICATION
TECHNICAL CONSIDERATIONS
Alternative 1: Individual solar assisted ground source heat pump with water tank
seasonal storage
COP of the proposed system
A normal COP for a Ground source individual heat pump in this area may be 3,3
(Sørensen, 2012).
The integration in the system of solar collectors and seasonal storage is under
development and there is no much data available. One recent study achieved a 30% of
reduction of the length of the boreholes for the same efficiency and 20% of cost
reduction (Cauret & Kummert, 2011). So a reasonable assumption may be a 20 % of
improvement of the efficiency.
Taking into account these two assumptions, it is logical to assume an average COP of 4.
Individual storage water tank
The annual heating period considered would be of 9 months (between September to
March). As it is shown in the Appendix 7.8, many studies have been conducted in order
to get the suitable amount of storage that it is needed for a domestic householder.
Considering Denmark as much colder than mid- European countries a normal size for
individual water tank could be 24 m3.
An average dimensions for our water tank that could be feasible in Føns householder’s
plots would be a water tank of 4*3*2 meters.
Individual solar collectors.
Taking into account all the solar radiation information that have been gathered on
Middelfart region (Appendix 7.5) and according the technical characteristics of the
solar collectors used, a relation between m3 of storage in a water tank and m2 of solar
collector is going to be used. (Appendix 7.8)
Assuming a water tank storage of 24 m3 and a relation around;
1, 5
It is needed a surface of 16 m2 of solar thermal collector in each household.
According to some legal restrictions in the area, in some householders in which could be
possible putting the solar thermal collectors in the plot area would be considered as well
as the usual solar collectors in the roof. It is considered that those houses which a roof
made by straw cannot install solar collector in their roof.

40
Systems for sustainable energy supply for a small village
Master in European Construction Engineering (2012-2013)
Alternative 2: Individual solar assisted ground source heat pump with borehole seasonal
storage
COP of the proposed system
In this system is going to be considered a COP of 4 due to the same consideration
explained behind in the alternative 1.
Individual boreholes
The boreholes dimension would be 100 m long. A closed loop vertical should be
considered as a possible solution for storage system in the individual ground source
heating.
The amount of heat that can be extracted per borehole could be different depending
on the different type of rock. Looking into the geological maps gathered in the
Appendix 7.8, it is considered that the main geological formation in the area is clay. In
the first instance, it can be observed that the first layers of the soil is usually compound
by saturated sand, but considering boreholes of 100 meters depth should be considered
the geological formation below as the main type of rock for the following calculations.
According to the German standard (VDI 4660), the thermal conductivity and heat
capacity of the soil can be obtained as:
Thermal conductivity W/mK 1,5 W/Mk
Heat capacity 2,000 10 6 J/m3 K.
With reference to the Energy extraction per year in W/m borehole considering 1800
hours of production and considering clay soil, the value considered should be 35-50
W/m borehole. (Bjørn, 2012).
As the boreholes will have higher losses owing to the lower amount of boreholes put in a
household plot the energy extraction per year will be considered as 30 W/m borehole.
The annual heat demand by a household is considered as 174 KWh/m2/year, in other
words, as it is considered a household average of 157, 15 m2, the annual heat demand
of each householder is 174 KWh/m2/year * 157,15 m2 = 27,34 MWh/year,
1. Calculate energy extracted per borehole
E borehole= 30 w/m *100 m* 1800 = 6300000 = 6, 3
2. Energy extracted for an individual house (adopting a COP for an individual heat
pump of 4)
COP =4=
=
I= 6,835 Mwh
ET = Output – Input = 27, 34 – 6,835 = 20,505 Mwh

41
Systems for sustainable energy supply for a small village
Master in European Construction Engineering (2012-2013)
3. Number of boreholes
We can calculate the number of boreholes that we need to put in the district lot
through this expression
Nº =
=
= 4 boreholes.
Individual solar collectors
As well as in the alternative 1 the assumption taken lead us to a total amount of solar
thermal collectors needed of 16 m2 for each individual house.
Alternative 3: Individual ground source heat pump with borehole.
COP of the proposed system
This alternative is not assisted by solar. The COP considered for this system will be 3.3
(Sørensen, 2012).
Individual boreholes
The boreholes dimension would be 100 m long. A closed loop vertical should be
considered as a possible solution for storage system as in the alternative 2. As in the other
alternatives, clay soil is considered as the type of soil in the area.
Considering the annual heat demand as 27,34 MWh/year, as it was calculated in the
alternative 2, the number of boreholes that we will needed should be:
1. Calculate energy extracted per borehole
E borehole= 35 w/m *100 m* 1800 = 6300000 = 6, 3
2. Energy extracted from an individual house (adopting a COP for an individual
heat pump of 3.3)
COP =3,3 =
=
I= 8.29 Mwh
ET = Output – Input = 27,34 – 8,55 = 19,06 Mwh
3. Number of boreholes
We can calculate the number of boreholes that we need to put in the district lot
through this expression
Nº =
=
= 4 boreholes.

42
Systems for sustainable energy supply for a small village
Master in European Construction Engineering (2012-2013)
Alternative 4: Collective solar assisted ground source heat pump with inclined boreholes
seasonal storage
COP of the proposed system
A normal COP for a Ground source District heat pump in this area may be 4 (Plan
energy, 2012).
The integration in the system of solar collectors and seasonal storage is under
development and there is no much data available. One recent study achieved a 30% of
reduction of the length of the boreholes for the same efficiency and 20% of cost
reduction (Cauret & Kummert, 2011). So a reasonable assumption may be a 20 % of
improvement of the efficiency.
Taking into account these two assumptions, it is logical to assume an average COP of
4,5.
Collective boreholes
The district is compound by 71 households as it was said in the general district
assumptions.
A closed loop vertical boreholes should be considered as a possible solution for storage
system in the ground source district heating.
The boreholes dimension would be 150 m long. The amount of heat that can be
extracted per borehole could be different depending on the different type of rock. As
we are considered clay according to the German standard (VDI 4660) we can get that
the thermal conductivity and heat capacity of the soil as;
Thermal conductivity W/mK 1,5 W/Mk
Heat capacity 2,000 10 6 J/m3K.
Energy extraction per year in W/m borehole considering 1800 hours of production will be
35-50 W/m borehole. (Bjørn, 2012).
The annual heat demand is considered as 1,941,492 Kwh/year, in other words, the heat
demand is 1942 Mwh/year,
1. Calculate energy extracted per borehole
E borehole= 35 w/m *150 m* 1800 = 9.450.000 = 9, 45
2. Energy extracted from the district (adopting a COP for the district heat pump of
4.5)
COP =4,5
=
I= 431.5 Mwh
ET = Output – Input = 1942 – 431.5 = 1510.5 Mwh

43
Systems for sustainable energy supply for a small village
Master in European Construction Engineering (2012-2013)
3. Number of boreholes
We can calculate the number of boreholes that we need to put in the district lot
through this expression
Nº =
=
= 160 boreholes.
District solar collectors
Assuming 71 households in the entire community and a minimum surface of solar
collectors in each house of 16 m2 (explain in detail in alternative 1, individual system), the
total amount of solar collector that it is needed for the district heating will be 1136 m2.
It is supposed that a district heating results in an improvement in the efficiency of the
systems, that is to say, it is considered a reduction of a 20% of the solar collector’ surface.
The central solar heating plant needs 950 m2 of solar collectors
SOCIAL ASPECTS
The main social aspect is the acceptance of the people who considered that solar
panel does not fit with the surrounding. Indeed the visual impact concerns as much the
individual alternative with panel on the roof or in the plot as the collective one.
Nevertheless, ground source heating and heat pump does not have any rejection from
people to implement them, although the government does not provide any grant.
ENVIRONMENTAL ASPECTS
The disadvantage of a ground source heating with boreholes, water tank or any other
storage system is the modification of the soil proprieties and a pollution of the
underground water. Indeed, by remove the ground and creating a pipe scheme,
animal species can be affected. Moreover the worst is in case of storage (boreholes,
water tank…).
Depending on the soil and the aquifer, the ground will keep more or less the collected
heat; an increasing of temperature in the soil can have different repercussions on flora
and fauna. The composition of the soil and the aquifer are unknown, so the temperature
lost between summer and winter cannot be determined. So to be aware of the real
consequences of such installation, a survey, drillers and tests in laboratory of Føns soil has
to be done to have an idea of the environmental impact of such increase of
temperature. Moreover the design of the loops is important in order to avoid leaking in
case of earth movement: a total knowledge of the field has to be planned.
Concerning the solar panels which only collect heat in water pipe, the environmental
impact of that system is negligible; except the fact of creating a pipe system to link them
with the borehole in the ground and the material needed for the production (plastics).
The particular point can be the land, especially concerning the collective solution.
Concerning the environmental impact of a heat pump, the heat waste in the heat sink
has to be mentioned because it affects organisms and plants around the device by
thermal contamination. Moreover this impact increases with the size of the heat pump;
therefore this parameter has to be taken into account for the collective measure.
Besides, the main pollutant of heat pump device is the refrigerant which circulates inside
the heat pump. Indeed, the common one HCFC-22 (R-22) is very harmful for the ozone

44
Systems for sustainable energy supply for a small village
Master in European Construction Engineering (2012-2013)
layer. To avoid that impact, it is advised to use one of its substitutes, even if the efficiency
is a bit lower. Finally, Føns area in Denmark is known for negative temperature, the
implementation of a heat pump will require antifreeze during the heating operation to
work in optimal conditions. Nevertheless it has to be mentioned that most of these
products are toxic, corrosive and flammable, reason for what the priority is given to
ethanol and propylene-though that one is a bit less efficient- because of their low
environmental impact.
Nevertheless, this renewable alternative is one with less impact on environment
especially with a few amount of CO2 emission. Indeed, the heat pump requires only less
than one third of the energy that it provides and the CO2 emissions is calculated as
follows:
Energy (kWh) x Carbon Factor (kgCO2/kWh) = CO2 Emissions (kgCO2)
With the CO2 Emissions per kWh Electricity Sold in Denmark kWh: 0.478 kg/kWh. (Danish
Energy Agency, 2010) and the electrical consumption of the heat pump per alternative,
the CO2 emission with each system is calculated as it is shown in the table below.
SCENARIOS
ELECTRICAL CONSUMPTION
(KWh/year)
CO2 EMISSIONS
(ton/year)
CO2
REDUCTION Old
system
New
system
IH. TANK STORAG 6.910 523 234,51 55%
IH. B.STORAGE 6.910 523 234,51 55%
IH. B.NO STORAGE 8.375 523 284,23 46%
DH. B.STORAGE 6.142 523 208,45 60%
Figure 4.2.2_1: CO2 Emissions in Føns

45
Systems for sustainable energy supply for a small village
Master in European Construction Engineering (2012-2013)
ECONOMIC ANALYSIS
First of all each alternative should be evaluated in terms of cost of the system. After that
it is gathered all the cost evaluation considering a payback period of each one of the
different system considered.
SOLUTION ANALYSIS
Alternative 1: Individual solar assisted ground source heat pump with water tank
seasonal storage
Initial Investment – 198.278 DKK
DESCRIPTION COST (DKK)
Heat pump and installations 74.604 DKK
Solar collectors 20.720 DKK
Water tank 35.810 DKK
Earth movements 67.144 DKK
TOTAL 198.278 DKK
Annual consumption – 6.910 KWh/year
Annual maintenance cost – 1.120 DKK
Annual energy cost – 15.202 DKK
o Yearly energy inflation - +3,00%
Alternative 2: Individual solar assisted ground source heat pump with borehole seasonal
storage
Initial Investment – 267.864 DKK
DESCRIPTION COST (DKK)
Heat pump and installations 67.144 DKK
Solar collectors 20.720 DKK
Boreholes 180.000 DKK
TOTAL 267.864 DKK
Annual consumption – 6.910 KWh/year
Annual maintenance cost – 1.120 DKK
Annual energy cost – 15.202 DKK
o Yearly energy inflation - +3,00%
Figure 4.2.2_2: Installation cost (alternative 1)
Figure 4.2.2_3: Installation cost (alternative 2)

46
Systems for sustainable energy supply for a small village
Master in European Construction Engineering (2012-2013)
Alternative 3: Individual ground source heat pump with borehole
Initial Investment – 224.762 DKK
DESCRIPTION COST (DKK)
Heat pump and installations 44.762 DKK
Boreholes 180.000 DKK
TOTAL 224.762 DKK
Annual consumption – 8.375 KWh/year
Annual maintenance cost – 1.120 DKK
Annual energy cost – 18.426 DKK
o Yearly energy inflation - +3,00 %
Alternative 4: Collective solar assisted ground source heat pump with inclined boreholes
seasonal storage
DESCRIPTION COST (DKK)
Heat pump 23.116 DKK
Tank and installations 3.152 DKK
Pumper and water treatment 1.050 DKK
Oil boiler and tank 5.253 DKK
Electrical installation 1.050 DKK
Solar collectors 20.070 DKK
Boreholes 152.112 DKK
Pipes 39.402 DKK
Building 3.152 DKK
TOTAL 248.362 DKK
Annual consumption – 6.142KWh/year
Annual maintenance cost – 1.120 DKK
o Annual maintenance cost installation – 395 DKK
o Annual maintenance cost district heating – 725 DKK
Initial Investment – 248.362 DKK
o Initial Investment system but distribution – 245.210 DKK
o Initial Investment district heating – 39.403 DKK
Annual energy cost – 13.512 DKK
o Yearly energy inflation - +3,00
Figure 4.2.2_4: Installation cost (alternative 3)
Figure 4.2.2_5: Installation cost (alternative 4)

47
Systems for sustainable energy supply for a small village
Master in European Construction Engineering (2012-2013)
CONCLUSIONS
INDICATORS
SCENARIOS
INITIAL
INVESTMENT
(DKK)
LOAN
PERIOD
(YEARS)
BREAK-EVEN
POINT
(YEAR n)
PROFIT
10Yr
(DKK)
PROFIT
20Yr
(DKK)
IH.TANK STORAG 198.278 10 14 -71.012 +135.435
IH. B.STORAGE 267.864 14 19 -92.214 + 41.319
IH. B.NO STORAG 224.763 11 20 -123.200 +15.201
DH. B.STORAGE 248.362 13 16 -66.603 112.248
Figure 4.2.2_7: Compound Cash-flow
The tables of the cash flow can be seen in the Appendix 7.12.
INDIVIDUAL SYSTEMS
Three individual variations of the system have been proposed. As it can be seen in the
economic study the variation of the values are up to 25% between extreme values.
The Break- even point is quite high in all alternatives (14 years the lower case) due to the
high initial costs caused. These big initial costs are caused by the complexity of the
system: storage energy from summer to winter in an effective way, and achieve good
efficiencies in so hard climate require big investments. Besides, despite the fact that the
energy consumption is reduced drastically (75% of reduction in average), heat pumps
consumes electricity, with is rather expensive compared with other types of energy
sources.
The SAGSHP with seasonal water tank storage seems to be the best solution. The lower
investment and quite good performance let the system be the one with lower break-
even point (14 years). Besides, to store heat in a water tank is more certain and reliable
than doing it in boreholes.
Figure 4.2.2_6: Cash-flow indicators of the four alternatives evaluated

48
Systems for sustainable energy supply for a small village
Master in European Construction Engineering (2012-2013)
The high requirements of a reliable SAGSHP with seasonal boreholes storage trigger high
initial investment. The clay layer in the ground provides better efficiencies in the storage,
but requires more investment as well. These considerations, combined with the similar
performance of the system make this system less suitable than the water tank system (16
years to recover the investment).
As for the system with no storage (and therefore without solar collectors), we have the
same problem than in the previous system: The cost of the boreholes increase a lot the
investment, and in this case the COP is the worst because we do not get benefit of the
heat storage capacity of the ground. In this case, and due to the cost of the boreholes,
the most simple and common system have the worst performance in the system studied.
Innovation therefore is in this case a good opportunity to improve the system.
As a conclusion, it can be said that, on one hand, these types of systems have a really
good performance, reduce drastically energy consumption and CO2 emissions, and the
cost of purchase energy is quite low. On the other hand, they require big investments
that are not recovered until 14 years at least. Besides, the cost of purchase energy is
lower than oil boilers or electricity heaters, but not than solid fuels boilers whose energy
purchase is much cheaper.
COLECTIVE HEATING SOLUTIONS
It has been studied a district heating system as well. In this case, the district heating
system has quite similar performance than the individual ones. The investment is quite
similar, because despite the fact that the cost of the boreholes is lower, the district
installation and other elements are more expensive. The operational costs are the lower
but not very different from the others.
The conclusion of this system is, therefore, the same than the individual conclusions:
Good performance, huge energy saving and CO2 emissions reduction, but quite big
investment and not enough decrease in the operational costs to make it attractive (16
years to recover the investment).

49
Systems for sustainable energy supply for a small village
Master in European Construction Engineering (2012-2013)
4.3. ELECTRICITY ALTERNATIVES FEASIBILITY STUDY
4.3.1. ALTERNATIVE 1:
PHOTOVOLTAIC SOLAR CELLS
INTRODUCTION
Aim, context and consideration
As already mentioned, this part aims to study some possibilities of renewable energy to
supply electricity to Føns area, in Denmark. In the next paragraphs, the installation of
photovoltaic solar cells will be studied as a possible solution to the electricity needs of
this Danish community of 70 houses.
The completion of this feasibility study will permit to determine the most adapted and
suitable solution, according to the Report, “Systems for sustainable energy supply for
small villages”. As mentioned in this report, Photovoltaic solar cells are one of the most
trusted, efficient and renewable installations to produce electricity. Apart from that, the
main problem is linked to the costs of these systems, which stay quite expensive
nowadays.
Nevertheless, the Danish context seems to be favourable to this kind of systems and the
environmental policy could bring some answers to the economic barrier mentioned.
Indeed, since 2010, a regulation called “net metering” intends to develop the PV market
in Denmark through interesting prices to sell extra-electricity produced. Recently
modified, this law has significantly participated in the expansion of PV systems and still
proposes attractive economic benefits. Based on those statements, this part aims to
determine which one, between common and individual installations, is the most suitable
for this legal context, taking into account different parameters as explained below.
Steps of the analysis
The following analysis will be organized following a structure divided into Technical,
Environmental, Social and Economical considerations.
Regarding Technical conditions, a brief extract from “Systems for sustainable energy
supply for small villages” will be shown in order to take into account technical aspects of
both solutions. Indeed, those aspects would directly influence the management and
procurement phases during the possible implementation of the project.

50
Systems for sustainable energy supply for a small village
Master in European Construction Engineering (2012-2013)
In the Environmental field, the focus of the analysis will be settled in the environmental
impact of the options mentioned before. In the case of common systems, land
occupation and the possible restrictions applied for protected areas will be main
concerns.
The next step will be based on Social considerations, where the current situation of the
Danish regulation regarding solar energy and its influence on the willingness of the
population to install solar systems will be explained and examined.
Finally, the gross part of the report will consist in an economic analysis in order to
determine the feasibility of the options suggested. In this section, the initial investment,
possibility of grants, payback period, legal conditions and further factors will outline the
conclusions (together with the previous concerns) of this study.
All the conclusions will be summarized in a comparison table in order to be able to
notice by a glance the differences, advantages and disadvantages of the possibilities
formulated.
Technical considerations
In our study, as mentioned before, we will consider two options regarding the possibilities
for photovoltaic systems, individual installation and common installation. The economic
benefits regarding the new regulation in Denmark have already been analysed, so the
following lines will focus on the technical aspects to be considered, which will be
obviously connected to the final profitability of the installation.
Individual installation
There are two aspects that will really determine the final convenience of carrying out an
individual photovoltaic installation, space and orientation.
Roofs
This kind of installation is normally placed in the roofs, where there is normally plenty of
space (in detached houses) and do not suppose an inconvenient for “land occupation”
in backyards. Anyway, there are several points that must be taken into account, such as
type of roof (sloped roof or horizontal roof), level of protection of the house, orientation
of the slopes (if there are) and shadow level.
In our case, the configuration of this community makes it almost impossible to generalise
with a single calculation.
Although this, general assumptions can be made in order to obtain a map with areas in
which solar photovoltaic systems could result interesting. These maps can be checked in
Appendix 7.13 Individual Solutions maps.
Backyard
The other possibility is the installation of the photovoltaic panels in the backyards of the
houses. Once again, some limitations will have to be considered, such as space

51
Systems for sustainable energy supply for a small village
Master in European Construction Engineering (2012-2013)
availability, orientation (not that much) and as main limitation, the possible shadows that
will be applied to the PV by the house itself, vegetation, etc.
In this part, it is important to mention the legal hitches that involve the protected areas in
which are included many houses, because of the proximity of the community to the sea.
This situation will need to be studied case by case.
As before, the heterogeneity of the urban distribution will reduce the individual proposal
to an average one, regarding assumptions (orientation, availability of land, etc) that will
suppose the first step before a deeply individualized analysis.
The general considerations concerning the solar requirements together with the
shadows calculation can be found in the Appendix 7.10.1 and 7.10.3.
Common installation
Regarding the common installations, the first and most complex aspect will be finding a
proper area to settle the system. This area will have to be wide enough to hold the
photovoltaic surface needed (with special attention to the shadow interaction), and
also to be close to a connection point to the grid.
In this case, in legal aspects, we find the same situation as before; being so close to the
sea will make it difficult to find a common area that will satisfy all the requirements:
economically (need to buy, rent, etc.), legally-environmentally (protected area) and
technically (shadows, distance to connection point)
The general considerations concerning the solar requirements together with the
shadows calculation can be found in the Appendix 7.10.2 and 7.10.3.
Size of the system
An electricity consumption of 4500 kWh per year and house will be the bases to be
considered. In order to dimension the size of the installation, software from the website of
the National Renewable Energy Laboratory of the United States of America, has been
used.
With this tool, several factors have been considered in the different cases to study:
locations, power of the installation, derate factor, inclination of the panels and azimuth
orientation.
For the first variable, location, the website tool has as the only option in Denmark the
data coming from Copenhagen; in our case, the data is similar enough, regarding solar
exposition and weather conditions, in order to take it as valid for the estimation.
The other variables will be analysed in the two possible scenarios, individual and
common installations, as follows.
Individual estimation:
The power of the installation will depend on the amount of demand that is going to be
covered. In this line, according to the preliminary consideration of 4500 kWh/year and
house, an installation of 5 kW will produce electricity in an amount close to that value.
52
Systems for sustainable energy supply for a small village
Master in European Construction Engineering (2012-2013)
An installation of 6,5 kW has also been considered, and will be economically analysed
and compared with the 5 kW solution afterwards.
Regarding inclination, this factor will depend on the disposition of the roof (inclination
and orientation), availability of space inside the plot, and shadow interaction. As
mentioned before, the many different possibilities inside this matter will be faced by
generalising in three main cases: 35º, 45º and 60º, accounting for ground disposition (or
flat roof), roof of 45º slope and roof of 60º slope; all of them facing south.
The different results can be checked in Appendix 7.10.5 and 7.10.7.
Common estimation:
For this estimation, two options have been considered; and installation of 5 kW of power per house, which means 5 kW x 70 houses 350 kW, and the same consideration but
using 6,5 kW per house, which means approximately 450 kW.
Regarding the inclination, only two options have been considered, as the 60º option has
just been considered in order to take into account those houses where there is space
only in the roof and it has slopes with this level of inclination (it must be clarified that
higher angles will result in higher production in winter, whereas lower angles will result in
higher production during summer).
Conclusions and comments about electricity production will be done in the “economic
considerations” point.
Solar photovoltaic cells considered
For the analysis of the different options, model “Alex-Solar” 250w monocrystaline from
Aktivesol has been used; technical specifications can be checked in Appendix 7.10.4 .
Remaining devices (inverter, wiring, connection, etc.) composing the solar system can
be found in the same document. (http://www.aktivsol.dk/)
Environmental considerations
At this point, it must be said that solar photovoltaic systems do not have a direct
environmental impact, due to the fact that they do not produce CO2 emissions in the
electricity production.
Apart from that, the only consideration could deal with the possible effects that a large
installation could cause to the wildlife of the area. Anyhow, in this case, an installation of
approximately 350 kW could suppose a land occupation of 2000 m2. Analysing the
urban distribution of the area, this surface is more or less the average area of a plot in
this village.
As final concern, in a deeper study, a Life Cycle Analysis (LCA) of the materials that
compose the system should be done in order to have a global idea of the
environmental impact of this technology from a global point of view.

53
Systems for sustainable energy supply for a small village
Master in European Construction Engineering (2012-2013)
Social considerations
The change of law and its importance
In November 2012, the Danish policy concerning energies and renewable development
has been modified. Indeed, seven of the eight Danish political parties agreed for a law
change to improve the attractiveness of solar panel investment. The intention of the
government is “to ensure uniform economic conditions affecting plant that can settle
net and common facilities, which can only settle net joint consumption” (Law amending
No. L86). To understand this common decision, it’s important to remind here that the
Danish government expects to reduce greenhouse gas emissions to approximately 0.2
million ton equivalent to 500MW by 2020, in particular with the further development of
solar cells.
To enter more into details, this change in the law concerns the prices of electricity to be
sold and to be bought. To summarize, the previous system concerning electricity
exchanges with the grid was based on an annualized net metering. Basically, at the end
of the year, the difference between energy produced and energy consumed was
calculated to determine what should be paid. This system used to permit to buy power
without fees when the installation was temporally producing less than the energy
needed. With this regulation, the settlement price was DKK 0.60 /kWh. (Seenews, Nov 7,
2012)
The new regulation changed from annual calculation to a daily one. Since the 19th
November, the consumption and the production of electricity is monitored hour by hour
and the difference between energy needed and energy produced is sold or bought
with different prices. Indeed, all the PV solar cell systems installed in 2013 will be able to
sell exceeded electricity for DKK 1.30 /kWh private installations during 10 years. This high
price will decrease constantly each year (DKK 1.16/kWh in 2014) to go back to the
previous price DKK 0.6/kWh in 5 years (2018).
This new metering system aims to be more profitable for large solar installation which will
be allowed to sell electricity for a higher price of DKK 1.45/kWh for the systems installed in
2013 for 10 years. Such as the individual installations, this price will be decreasing each
year (DKK 1.28 in 2014 for 10 years). This difference in the selling prices aims to “create
opportunities for businesses such as garden centers and farms”. (Danish Ministry of
Climate, Energy and Building, Nov 15, 2012). This official article also underline also that “It
will also become easier and more attractive for housing associations to install solar
panels”.

54
Systems for sustainable energy supply for a small village
Master in European Construction Engineering (2012-2013)
Economical considerations
The impact of the Danish law
According to the actual law (presenting in the social consideration paragraph), the
economical analysis of PV solar cells systems must be based on a model which takes into
account the variation of production along the days of the years. To be completely
precise the analysis should take into account the evolution of production and
consumption among the different hours of the day in order to evaluate precisely the
amount of energy to be sold and to be bought hour by hour. Indeed, taking into
account that the new law fixes different prices to buy or sell electricity and that the
balance is made hourly, the economic features are going to vary a lot among the year.
Hypothesis taken
In order to evaluate these economic aspects, all the calculations explained in this report
are based in a monthly comparison of production and consumption.
The annual consumption of a Foens typical house has been evaluated to 4500kWh per
year. From this value, it was necessary to get curves and tables representing the
evolution during the years.
This calculation has been made using a real Danish electricity bill of a house consuming
3308kWh per year. The table below shows the amount of electricity consumed each
month (1st column). The percentage of the total consumption each month (2nd column)
calculated from the values of the first column permitted us to simulate the evolution of
the consumption per month of our Foens house (3rd column).
Figure 4.3.1_1: Simulation of electricity consumption per month
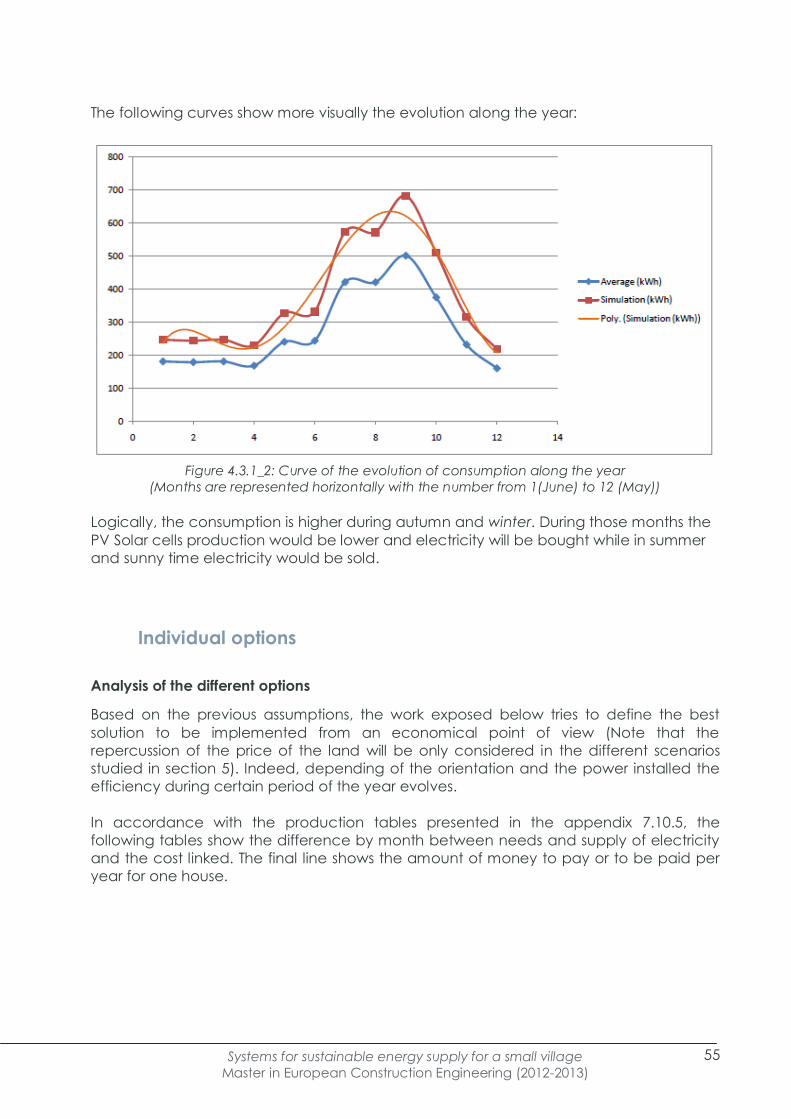
55
Systems for sustainable energy supply for a small village
Master in European Construction Engineering (2012-2013)
The following curves show more visually the evolution along the year:
Figure 4.3.1_2: Curve of the evolution of consumption along the year
(Months are represented horizontally with the number from 1(June) to 12 (May))
Logically, the consumption is higher during autumn and winter. During those months the
PV Solar cells production would be lower and electricity will be bought while in summer
and sunny time electricity would be sold.
Individual options
Analysis of the different options
Based on the previous assumptions, the work exposed below tries to define the best
solution to be implemented from an economical point of view (Note that the
repercussion of the price of the land will be only considered in the different scenarios
studied in section 5). Indeed, depending of the orientation and the power installed the
efficiency during certain period of the year evolves.
In accordance with the production tables presented in the appendix 7.10.5, the
following tables show the difference by month between needs and supply of electricity
and the cost linked. The final line shows the amount of money to pay or to be paid per
year for one house.

56
Systems for sustainable energy supply for a small village
Master in European Construction Engineering (2012-2013)
Scenario 1: 5kW 35°
Scenario 2: 5kW 45°
Scenario 3:5kW 60°

57
Systems for sustainable energy supply for a small village
Master in European Construction Engineering (2012-2013)
Scenario 4: 6.5kW 35°
Scenario 5: 6.5kW 45°
Scenario 6: 6.5kW 60°

58
Systems for sustainable energy supply for a small village
Master in European Construction Engineering (2012-2013)
With those tables it’s obvious that with a bigger installation the amount of electricity
produced (and so the money earned) is higher. It’s also interesting here to remark that
the inclination as a small influence on the final results excepting that a high angle
provides a more “constant” amount of electricity.
Finally it’s really important to notice here than even if the installation is providing more
electricity after one year (720 kWh more) you will have a negative economic balance
due to the Danish regulation and its selling and buying prices (1.3DKK to sell and 2.2DKK
to buy).
Feasibility study for individual installation
Evolution of the production cost through the years
From the previous assumptions, the feasibility study which will be lead concerns the
scenario one representing an installation of 5kWh with an inclination of 35°.
The economic analysis and the cash-flow will be lead over a 20years period. To realize
this analysis, it was necessary to evaluate precisely the evolution of the cost and the
change of regulations over the years.
The table presented in appendix 7.10.6 represents the evolution of the money earned
and invest each month during 20 years to fulfill the electricity needs of the house. This
table takes into consideration several important aspects mentioned below:
The price of electricity (buying price) increase by 3% each year due to the
inflation
The electricity is bought to the price mentioned in the previous point
The electricity is sold at 1.3DKK during the first 10years and 0.6DKK after
The system lose some efficiency after 10 year and only 80% of the initial electricity
will be produce
It is finally the last lines which are the most important for us in order to realize the cash
flow. This total (in DKK and €) represents the amount of money to pay each year for
electricity. This cost starts around 2 000DKK for the first year and reach 7 700DKK after
20years due to the parameters explained in the previous points.
Payback period
In order to define the payback period, the cash flow will be realized using the total
(annual) value of the previous table. This Cash flow table (Figure 4.3.1_4) presented in
the appendix 7.12., takes into account the following aspects:
45 000DKK are directly provided and not lend from the bank
The loan as a fixed interest rate of 3%
The annual cost to return the money loaned is considered around 12 500DKK
The money loaned will be returned after 3 years
The maintenance costs will raise through the life cycle of the panel (starting at
375DKK per year during the first five years and increasing after as presented in the
table)
The initial investment needed for this installation is 82 350DKK (As presented in the
following table 4.3.1_3)

59
Systems for sustainable energy supply for a small village
Master in European Construction Engineering (2012-2013)
DESCRIPTION COST (DKK)
20 Panelsmodel “Alex-Solar” 250W Monocristaline 45.001 DKK
1 Inverter model Danfos TLX 6000 7.077 DKK
Installation and connection (10%) 5.207 DKK
Total installation cost 57.286 DKK
GC+IB (9%+6%) 8.593 DKK
Total cost 65.880 DKK
VAT (25%) 16.470 DKK
TOTAL 82.350 DKK
Figure 4.3.1_3: Initial investment for an individual installation of 5kW
Comparing now this cash flow with the annual cost of the previous installation we are
able to determine the payback period and the amount of money saved after 20 years.
We finally estimated here a 10years payback period and a final saving of 9 706€ after
20years.
Collective options
Analysis of the different options
Based on the same method than the one used for individual installations, the work
exposed below aims to define the best option regarding to the economical aspects.
Once again considering the orientation and the power installed, this part will try to
evaluate the efficiency of the systems along the years.
In accordance with the production tables presented in the Appendix 7.10.7, the
following tables show the difference by month between needs and supply of electricity
for the all village. The final line shows the amount of money to pay or to be paid per year
by the whole community.
It is important here to remind that the community of Foens studied here is composed by
71 houses. Nevertheless only 70 houses will be taken in consideration because one
already has its own electricity supply system.
Taking this into consideration the total amount of electricity to be provided is:
70*4 500kWh = 315 000kWh/year
The monthly consumption has been calculated following the model explained in the
previous paragraph as already mentioned.
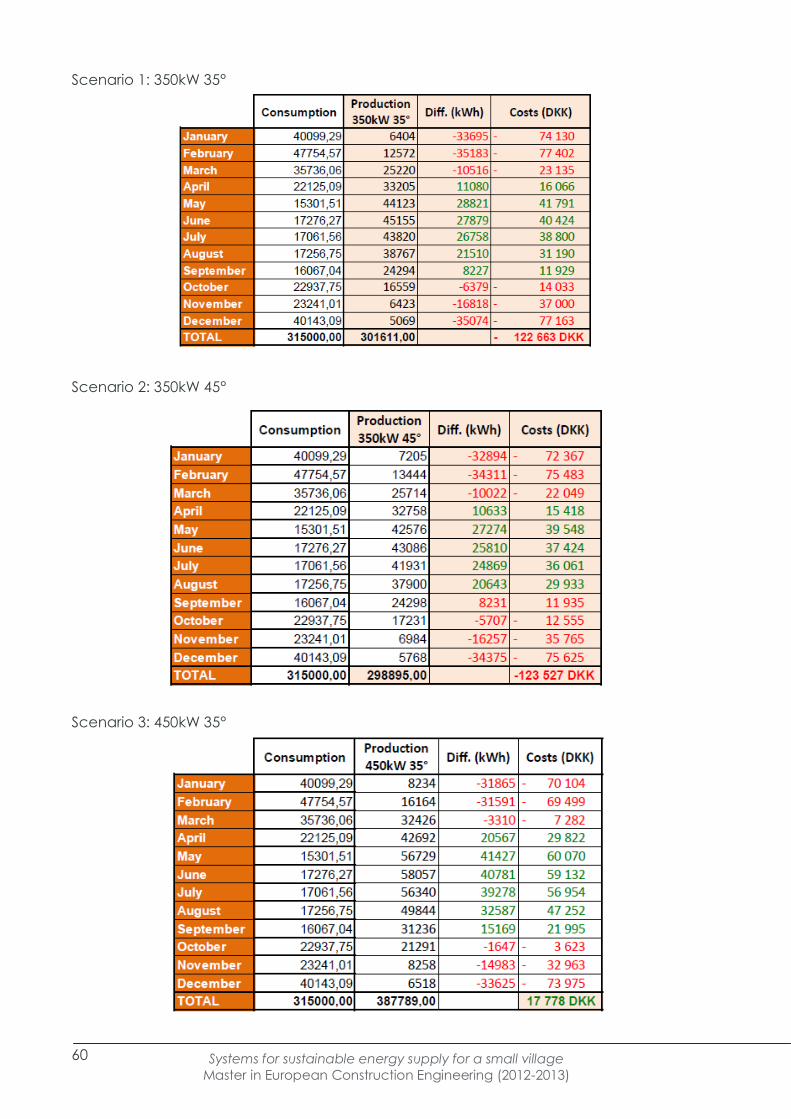
60
Systems for sustainable energy supply for a small village
Master in European Construction Engineering (2012-2013)
Scenario 1: 350kW 35°
Scenario 2: 350kW 45°
Scenario 3: 450kW 35°

61
Systems for sustainable energy supply for a small village
Master in European Construction Engineering (2012-2013)
These tables confirm the conclusions exposed for individual installations. With bigger
installations the amount of electricity produced (and so the money earned) is higher
while the inclination as a small influence on the final results excepting that a high angle
provides a more “constant” amount of electricity.
Here by over-estimating the installation we reach a positive economical balance. And a
450kW system seems (at this stage to be more profitable). To take into consideration the
initial investment, it’s important to realize a cash flow for both installations in order to get
an idea of which one is the best. This point is the aim of the following paragraph.
Collective Feasibility study
Evolution of the production cost through the years
The economic analysis and the cash-flow will be lead over a 20years period for both
350kW and 450kW installations. To realize this analysis, it was necessary to evaluate
precisely the evolution of the cost and the change of regulations over the years.
The tables presented in Appendixes 7.10.8 and 7.10.9 represents the evolution of the
money earned and invested each month during 20 years to fulfill the electricity needs of
the all community. This table takes into consideration several important aspects
mentioned below:
The price of electricity (buying price) increase by 3% each year due to the
inflation
The electricity is bought to the price mentioned in the previous point
The electricity is sold at 1.45DKK during the first 10years and 0.6DKK after
The system lose some efficiency after 10 year and only 80% of the initial electricity
will be produce
It’s finally the last lines which are the most important for us in order to realize the cash
flow. Those totals (in DKK and €) represent the amount of money to pay each year for
electricity (first by the all community and then by houses).
For the 350kW installation those cost per year start around 1 750DKK for the first year and
reach 7 800DKK after 20years due to the parameters explained in the previous points.
For the 450kW installation, the first years show a positive economic balance and permit
to earn money. During the year of the installation 792 DKK will be earned while after
20years, around 6 350DKK would be paid.
Payback period
In order to define the payback period, the cash flow will be realized using the total
(annual) value of the previous table. These Cash flow tables (Figure 4.3.1_7 and 4.3.1_8)
presented in the appendix 7.12., takes into account the following aspects:
45 000DKK are directly provided and not lend from the bank
The loan as a fixed interest rate of 3%
The annual cost to return the money loaned is considered around 17 000DKK (for
the 350kW installation) and 31 000DKK (for the 450kW installation).
The money loaned will be returned after 2 years for both installations.

62
Systems for sustainable energy supply for a small village
Master in European Construction Engineering (2012-2013)
The maintenance costs will raise through the life cycle of the panel (starting at
375DKK per year during the first five years and increasing after as presented in the
table)
The initial investments needed for this installation are presented in the following
tables (4.3.1_5 and 4.3.1_6)
DESCRIPTION COST (DKK)
1400 Panels model “Alex-Solar” 250 Monocristaline 2.322.096 DKK
1 Inverter 195.430 DKK
1 Transform station 182.525 DKK
Installation and connection 270.000 DKK
Total installation cost 2.970.056 DKK
GC+IB (9%+6%) 445.508 DKK
Total cost 3.415.565 DKK
VAT (25%) 853.891 DKK
TOTAL 4.269.456 DKK
Figure 4.3.1_4: Initial investment for a common installation of 350kW
DESCRIPTION COST (DKK)
1800 Panels model “Alex-Solar” 250 Monocristaline 2.985.553 DKK
1 Inverter 195.430 DKK
1 Transform station 182.525 DKK
Installation and connection 336.350 DKK
Total installation cost 3.699.859 DKK
GC+IB (9%+6%) 554.978 DKK
Total cost 4.254.838 DKK
VAT (25%) 1.063.709 DKK
TOTAL 5.318.548DKK
Figure 4.3.1_5:Initial investment for a common installation of 450kW
Comparing now this cash flow with the annual cost of the previous installation we are
able to determine the payback period and the amount of money saved after 20 years.
We finally estimated here a 7/8 years payback period and a final saving of 13 000€
(350kW installation) and 16 600€ (450kW installation) after 20years.

63
Systems for sustainable energy supply for a small village
Master in European Construction Engineering (2012-2013)
GENERAL CONCLUSIONS
The following table presents some indicators which will permit to analyse and make
decision regarding all the economic calculations lead below. More information and
precise analyses can be found in the individual and collective scenarios presented in
the following paragraphs.
INDICATOR Individual 5kW Collective 350kW Collective 450kW
Initial investment 82.350 DKK 62.251 DKK 75.919 DKK
Loan period 3 years 2 years 2 years
Break-even point 11 years 8 years 8 years
Profit 10 years none 21.242 DKK 35.812 DKK
Profit 20 years 72.313 DKK 96.832 DKK 123.892 DKK
Profitability 10 years -4 % 34 % 47 %
Profitability 20 years 88 % 156 % 163 %
Figure 4.3.1_6: Key indicators of individual and collective solutions

64
Systems for sustainable energy supply for a small village
Master in European Construction Engineering (2012-2013)
4.3.2. ALTERNATIVE 2: WIND POWER
ALTERNATIVE 2.1 - CONVENTIONAL WIND TURBINES
This alternative considers the execution of a unique wind turbine connected to the grid
and located on Føns surroundings in order to supply the needs of energy for the village.
The selection of the turbine is carried out in this feasibility study in order to provide the
energy requirements in terms of electricity. The document will try to cover as much as
possible in terms of environmental impact and social aspect. This study will take into
account not only the animals and vegetables species but also the damage the turbine
can cause to humans.
As the alternative will provide more energy than the necessary for supplying Føns, the
average cost of this alternative can be higher than the cost of the other systems. This is
way while assessing this solution the amount of energy produced must be taken into
account. Moreover the subsidies of the Danish government will be studied on the
document as them will reduce the final cost of the project.
The feasibility study for a wind turbine solution is detailed below.
TECHNICAL ASPECT
First of all, the study was focus on the existing wind turbines in Middelfart. All the
information gathered in the Appendix 7.9 reflects generally old wind turbines with a low
or medium capacity. Some of these types of turbines are already decommissioned what
supposed the selection of a modern high capacity wind turbine.
Finally, the wind turbine SWT-2.3-93 from Siemens Wind Turbine is the one selected for
developing the project.
This selection has been done taken into account the four wind turbines SWT-2.3-93 settle
in Keterminde, more exactly in Mundeko. After compiling all the necessary information of
those turbines, which can be found in the Appendix 7.9., this project proposal has
selected the same prototype of turbine.
Master data register for wind turbines at the end of December 2012 has provided the
necessary information for knowing that the annual output of Mundeko’s turbines is
approximately 6.500.000 to 7.000.000 kWh what means a vast output in accordance to
the energy needed to supply Føns (Danish Energy Agency, 2013). The figure is more than
the average output of a new large onshore wind turbine sited where there are good
wind conditions, that it is supposed to be around 5.000.000 kWh per year (C. Jensen &
Hartvig Jacobsen, 2009). The following map reflect the location of the turbines and the
colours the average wind speed in the area. Light blue colour in the zone supposes
winds of 7.8 to 8 m/s (SagsGIS)

65
Systems for sustainable energy supply for a small village
Master in European Construction Engineering (2012-2013)
The technical specifications of the turbine needed to develop the different points
required for the alternative project are provided (Siemens AG Energy Sector, 2009)
(Siemens AG, 2013). For further information see Appendix 7.9.
- Rotor diameter 93 m
- Hub height 63.3 - 80 m 80 m for this project proposal
- Blades length 45 m
- Annual output at 8 m/s: 9,0 GWh
ENVIRONMENTAL IMPACT
The following information must be studied in order to not to create a vast environmental
impact while setting the wind turbine. This information will provide those places that must
be discarded for placing the turbine. All the environmental maps studied are collected
into the Appendix 7.5.
Figure 4.3.2_2: Environmental Impact map. Source: (SagsGIS, n.d.)
Figure 4.3.2_1: Wind map and location for Kerteminde wind turbines. Source: (SagsGIS, n.d.)

66
Systems for sustainable energy supply for a small village
Master in European Construction Engineering (2012-2013)
SOCIAL ASPECT
The social section must take into account all the rules and requirements in order to
develop the wind turbine project. This supposes a subdivision of the section into different
points concerning to regulations, neighbours and subsidies. The following information is
developed in detail in the Appendix 7.6. Here it is shown the most relevant data:
- Rules and requirements
o Distance
Wind turbine SWT-2.3-93 that has a height of 125 m must be placed further than 500 m
from houses.
o Noise
The noise created by a modern wind turbine will vary from 96 to 101 dB. So the wind
turbine assuming the worst case will create a noise of 101 dB (Danish Wind Industry
Association). As reflect on the Appendix 7.6 the wind turbine cannot create noise above
39 dB in residential areas.
Calculating the noise in accordance to the distance of the wind turbine form a house it
is obtained a noise frequency underneath 39 dB for distance between 350 to 500 m far
from houses. The following table shows that the wind turbine SWT-2.3-93 if it is set further
than 350 m it complies with the noise restriction (Danish Wind Industry Association):
Turbine Source
dB(A)
Distance
m
Resulting
dB(A)
101 500 36,029
101 450 36,944
101 400 37,967
101 350 39,127
Figure 4.3.2_3: Environmental Impact map Føns area. Source: (SagsGIS, n.d.)
Figure 4.3.2_4: Table of noise frequency measured in dB. Source: (Danish Wind Industry Association, n.d.)

67
Systems for sustainable energy supply for a small village
Master in European Construction Engineering (2012-2013)
o Shadow casting
It is recommended that the neighbours most exposed to the phenomena cannot be
displayed more than 10 hours per year.
- Loss of value for neighbours
If after the turbine is set a neighbour lost value on its property by law they can demand
for damages.
- Subsidies
o 25 øre/kWh (0.25 DKK/kWh) for the first 22.000 full-load hours 2.512
o 2,3 øre/kWh (0.023 DKK/kWh) for the entire lifetime
o Contribution of 176.000 DKK
LOCATION OF THE TURBINE
Taking into account all the information collected in the environmental and social aspect
this section will provide the proper settlement for SWT-2.3-93 wind turbine.
First of all, the following map reflects the best places for setting wind farms in Middelfart
provide by Middelfart community discussion paper:
Figure 4.3.2_5: Proposed zone to establish wind turbines by Middelfart Community. Source:
(Middelfart Kommune)
Some of the areas proposed by Middelfart community are closed to Føns. These areas
will be of special interest for the scenario development.
Secondly, environmental and social requirements must be fulfilled. The following map will
show those placed located further than 500 m from residential areas and the areas that
will create a huge environmental impact, in accordance with the different points
studied during phase 1:
Existing wind turbines
Appointed areas for wind turbines
Proposal for potential wind turbines site

68
Systems for sustainable energy supply for a small village
Master in European Construction Engineering (2012-2013)
Figure 4.3.2_6: Environmental and social maps merge in one. Source: (SagsGIS)
Then wind speed conditions must ensure the better output for the turbine. The following
map reflects the wind average at a height of 100 m and also it merges all the plans
already shown to conclude with the final location of the turbine:
WIND TURBINE POSITION
Once the plot to set the wind turbine is found it is necessary to know the correct
direction to place it. Thanks to the wind rose we can obtain that information. The
following graph shows the wind rose in Bågø Fyr, which is an island, located less than 100
km far from Føns (Cappelen & Jørgensen, 1999).
Analysing the graph it is established that the dominant wind direction is west. The wind
turbine must be placed perpendicular to the west, perpendicular to the most favourable
direction. Therefore as Figure X reflects the wind turbine faces the wind direction
(Molinero Benitez, 2009) (Wind Energy Technology, 2013).
Legend:
Figure 4.3.2_7: Merge of maps to choose the wind turbine location area. Source: (SagsGIS, n.d.)

69
Systems for sustainable energy supply for a small village
Master in European Construction Engineering (2012-2013)
WIND TURBINE OUTPUT
Finally the output of the turbine must be calculated. The average wind speed in the
area will be as worst 7,4 m/s calculated at 100 m height. The following calculations are
done for obtaining the average wind speed at the hub height of wind turbine SWT-2.3-93
(Suisse éole)
Height above ground 100
Wind speed 7,4
Roughness 0,03
Hub height 80 Wind speed 7,2
Now and In accordance with the tables for Siemens wind turbine SWT-2.3-93 the hourly
and annual average output is shown (Siemens AG, 2013).
WIND
DIRECTION
Figure 4.3.2_10: Calculator of wind speed. Source: (Suisse éole, n.d.)
Figure 4.3.2_9: wind rose in Bågø Fyr. Source: (Cappelen & Jørgensen, 1999)
ORIENTATION
SPIN
Figure 4.3.2_8: Suitable orientation of the
turbine in regard to wind direction.
Source: (GEOLICA, n.d.)

70
Systems for sustainable energy supply for a small village
Master in European Construction Engineering (2012-2013)
ECONOMIC ASPECT
Modern wind turbines are designed to work for some 120.000 hours of operation
throughout their design lifetime of 20 years (Danish Wind Industry Association)
Thanks to VINDMOLLER KONOMI (Nielsen & et al, 2010) the average cost of a wind
turbine including O&M costs is shown below. This statistics is gathered from more than 250
operating turbines in Denmark.
The document provides prices for different wind turbines depending on their MW. The
following table reflects the turbine data:
MW ROTOR HUB W/M2
2,3 93 80 339
Figure 4.3.2_12: Wind turbine technical specification. Source: (Nielsen & et al, 2010)
ANNUAL OUTPUT 7.679,356 MWh
Figure 4.3.2_11: Annual Average wind speed. Source: (Siemens AG, 2013)

71
Systems for sustainable energy supply for a small village
Master in European Construction Engineering (2012-2013)
And the table below shows the cost split into activities:
DESCRIPTION COST m. DKK
INSTALLATION 18,9
FOUNDATION 1,4
ROAD ACCESS 0,6
INTERNAL NET 0,3
LAND 1
PROJECT DEVELOPMENT 0,9
FINANCING COST 0,6
NEARBY COMPENSATION 0,1
SCRAP 0,8
TOTAL 24,6
The final cost according to this method for SWT-2.3-93 turbine is 24.600.000 DKK VAT
included.
This final cost is similar to the figure obtain from Birger T. Madsen (BTM Consultant) and
Anders Wiisbye (Siemens Wind Power A/S). They provide a key-figure of 10,82 m.
DKK/MW. This supposed a final cost for SWT-2.3-93 turbine of 24.886.000 DKK.
Finally to this figure The O&M costs must be added. For newer machines the estimates
range around 1.5 to 2 per cent per year of the original turbine investment (Danish Wind
Industry Association). This will means 430.500 DKK VAT INCLUDED per year.
Figure 4.3.2_13: Wind turbine cost divided in targets. Source: (Nielsen & et al, 2010)

72
Systems for sustainable energy supply for a small village
Master in European Construction Engineering (2012-2013)
PAYBACK PERIOD
The following table reflects the different points that must be taken into account to
calculate the payback period, for further information check cash flow tables in
appendix 7.15:
DESCRIPTION TOTAL COST PER USER
Investment 24.600.000 DKK 346.478 DKK
O&M 430.500 DKK 6.063 DKK
Sale Of Electricity (*) 2.687.774 DKK 37.855 DKK
Cost Of Electricity (**) 702.900 DKK 9.900 DKK
Initial Investment Grant 176.000 DKK 2.478 DKK
Anual Grant (***) 395.486 DKK 5.570 DKK
Loan Period -- 18 years
Break-event point -- 2 years
Profit 10 years -- 143.461 DKK
Profit 20 years -- 540.676 DKK
Profitability 10 years -- 41,4%
Profitability 20 years -- 156,0%
(*)The electricity from the wind turbine is assumed here to be sold to the grid to 0,35
DKK/kWh (PlanEnergi, 2012). It is taken into account an annual output of 7.679.356 kWh.
(**)Electricity cost per user 2.2 DKK/kWh. Annual average consumption per house of
4.500 kWh
(***)Annual grant 0,0515 DKK/kWh. Annual output 7.679.356 kWh
-100.000 DKK
0 DKK
100.000 DKK
200.000 DKK
300.000 DKK
400.000 DKK
500.000 DKK
600.000 DKK
20
13
20
14
20
15
20
16
20
17
20
18
20
19
20
20
20
21
20
22
20
23
20
24
20
25
20
26
20
27
20
28
20
29
20
30
20
31
20
32
Wind Turbine SWT 2.3-93
COMPOUND CASH-FLOW
ANNUAL CASH-FLOW
Figure 4.3.2_14: sum up chart for the different figures and cash-flow indicators

73
Systems for sustainable energy supply for a small village
Master in European Construction Engineering (2012-2013)
ALTERNATIVE 2.2 - SMALL WIND TURBINES
Another possibility to supply electricity to Føns is installing Small Wind Turbines (SWT).
Danish Regulations (Petersen, 2011) consider Domestic Turbines all those turbines with:
A maximum height of 25 meters
A maximum power of 25 kW
A maximum diameter of 13 meters
The regulation 4/6/2010 states that for energy supply installations of no more than 6kW,
Net Metering grant system is allowed. This solution can provide real economic benefits,
reduce the time for return of investments (ROI) and improve the social acceptance of
SWT.
Technical aspects
Some preliminary calculations will be carried out, in order to understand the feasibility of
supplying Føns with SWT. First, we need to evaluate the average energy consumptions in
the village. As a common assumption, suggest a value of 4500 kWh/year has been
considered; by multiplying this time’s 70 houses involved, a value of 315000 kWh/year is
obtained.
The market of domestic wind turbines offers many possibilities; of course, not all turbines
are equal; in this phase, their performances will be analyzed taking into account only the
power curve, which relates the output to the wind speed. In Føns, the average wind
Figure 4.3.2_15 Wind profile and terrain roughness calculation; source,
http://www.wind-
data.ch/tools/profile.php?h=100&v=7.4&z0=0.03&abfrage=Aktualisieren

74
Systems for sustainable energy supply for a small village
Master in European Construction Engineering (2012-2013)
speed at 100 m height is approximately 7,8 m/s (See appendix 7.5). A preliminary
approximation of wind speed at 22 m height can be done using the logarithmic wind
profile curve, as shown in picture 4.3.2.15.
Concerning the roughness of terrain, a zo of 0,3 has been considered, as 0,2 corresponds
to a scenario with open land and many households, and 0,4 represent a small urban
scenario.
According to this calculation, the wind speed at 20 m height (the average height of a 6
kW SWT) is approximately 6 m/s.
Some wind turbines in the Danish market have been analyzed, and for the preliminary
calculation a 6 kW, 4 m diameter Bornay 6000 turbine has been chosen
(www.bornay.dk). Here is shown a chart comparing the power curve and the wind
speed distribution (with an average speed of 5,8 m/s at 22 m height and a Weibull
coefficient approximated to 2 as first instance).
Inputs:
Ave. Wind (m/s) = 6
Weibull K = 2
Site Altitude (m) = 0
Wind Shear Exp. = 0,200
Anem. Height (m) = 20
Tower Height (m) = 20
Turbulence Factor = 0,0%
Figure 4.3.2_17 wind power calculation: inputs
,000%
2,000%
4,000%
6,000%
8,000%
10,000%
12,000%
14,000%
-1,000
,000
1,000
2,000
3,000
4,000
5,000
6,000
7,000
0 5 10 15 20 25
Po
we
r k
W
windspeed m/s
Power curve
Power (kW)
windspeed distribution
Figure 4.3.2_16 Bornay 6000 power curve; source www.bornay.dk

75
Systems for sustainable energy supply for a small village
Master in European Construction Engineering (2012-2013)
Hub Average Wind Speed (m/s) = 5,80
Air Density Factor = 0%
Average Output Power (kW) = 1,98
Daily Energy Output (kWh) = 47,5
Annual Energy Output (kWh) = 17.344
Monthly Energy Output = 1.445
Percent Operating Time = 75,0%
Figure 4.3.2_18 wind power calculation: outputs
As shown in the table, the yearly production this wind turbine is approximately 17350
kWh, which means, it can cover the electricity needs of 4 households; therefore, 17
turbines have to be placed in order to supply all involved houses. This turbines are
approximately 20 m height, and the Danish regulation specify that the maximum
distance to the household should be 30 meters without a more detailed urban plan
(Petersen, Energinet.dk), but a noise limit of 42 dB at 6 m/s should be respected;
therefore, the turbine should be placed at approximately 20 – 25 meters from the
household (Cace, Aeolus Power). A 6 kW SWT should supply 4 houses, but it could be
quite difficult to place it and respecting at the same time the maximum distance.
This means that in this case, smaller turbines could be considered more indicated; let us
consider a 1,5 kW Bornay 1500 SWT, with a yearly power production, at 6 m/s, of circa
4500 kWh, enough to supply one household. Anyway, in Føns, the shape and height of
the buildings is approximately the same; therefore, in order to avoid turbulence, the
turbine should have a height around 15-18 up to 20 meters, no matter what the power of
the device is. That means that, in order to supply Føns, 18 6 kW turbines or 75 1,5 kW
micro-turbines could be placed, but the height and dimensions of the devices would not
change consistently.
Economic aspects
Investment and payback period
To consider the economical investment of a SWT, many factors have to be known:
Installation costs
O&M costs
Electricity production per year
Average cost of electricity
Forecast electricity escalation rate
Performance derating
Interest rate (loan)
Down payment percentage (loan)
Debt term (loan)
Expected lifespan of the turbine
In the case studied, some assumptions have been made, where data was missing or not
reliable. The following calculations are for a Bornay 6000 turbine, in an environment like
Føns.

76
Systems for sustainable energy supply for a small village
Master in European Construction Engineering (2012-2013)
Summary of assumptions
Financial assumptions
Downpayment 45.000 DKK
Interest Rate (%/year) 3 %
Debt Term (years) 10
Site properties
Average Wind Speed (m/s) 7,4
Anemometer Ht (m) 100
Wind Shear Exponent 0,143
Weibull k 2
Site Elevation (m) 0
Avoided energy costs
Average Cost of Electricity (DKK/kWh) 2,2
Nominal Electricity Escalation Rate (%/year) 0,03
System costs
Installation Investment + Distribution net (DKK) 260.000*
Installation running annual cost + distr net (DKK/kW) 866,67
System characteristics
Rated Power (kW) 6
Rotor Hub Height (m) 22
Availability (%) 0,98
Performance Margin 0,00%
Performance Derating 10,00%
Hub Height Average Wind Speed (m/s) 5,8
Air Density Factor 1,00
Average Annual Power Output (kWh) 16.055
Implied Capacity Factor 31% Figure 4.3.2_19 Assumptions
* (Energinet.dk, 2012; PureEnergy Centre)

77
Systems for sustainable energy supply for a small village
Master in European Construction Engineering (2012-2013)
Analyzing the economical estimation of the system the following data can be
highlighted in order to take it as a baseline for decision-making. The detailed cash-flow
can be found in Appendix 7.12.
INDICATOR Individual 5kW
Initial investment 260.000 DKK
Loan period 13 Years
Break-even point 5 Years
Profit 10 years 73.187 DKK
Profit 20 years 459.929 DKK
Profitability 10 years 28,14 %
Profitability 20 years 176,89 %
Environmental and social aspects
SWT have less impact than conventional ones, due to their reduced size; nonetheless,
noise, shadow casting and land consuming are to be considered; concerning noise and
shadows, the regulations are the same considered before for bigger turbines.
Protected sites
In the area there are protected sites, as historic buildings buffer areas, protected rivers,
Ramsar protected areas or protected shores. In the appendix 7.5 it can be found a
picture showing all the free areas for construction in Føns.
Figure 4.3.2_20 Cash flow

78
Systems for sustainable energy supply for a small village
Master in European Construction Engineering (2012-2013)
Wildlife
The impact on wildlife of SWT is certainly small, compared to the one of bigger turbines;
anyway, in the studied area there are protected zone for birds preservation. The
placement of turbines in those areas is not recommended.
Noise
A SWT has a sound emission of approximately 80 dB, which means that to stay under the
39 dB required by the law, the device should be placed at least 24 meters away from
the houses. (Danish ministry of Environment)
Shadows
It is recommended that neighbours should not be exposed to this phenomenon for more
than 10 hours per year.
Automatic controls can help in this, turning off the turbine when the limit has been
reached. Shadow flicker should be calculated before placing a turbine, in order to find
the most suitable location.
Potential loss of value in neighbors properties
In some cases wind turbines can reduce the value of a neighbour’s property; before
placing domestic wind turbines, it is useful to organize discussions with the neighbours, in
order to avoid claims.
Possible locations for the turbines
Overlaying all the critical areas, it has been possible to obtain those areas (Red line in
the following picture) suitable, in general, for SWT.
Not all areas in Føns are involved in this project; the 68 houses studied are in an area
marked with the orange line.
17 possible locations of SWT are indicated in the following picture; the criteria used for
the placement are:
Less than 30m from one of the supplied houses
More than 24 meters from all houses
4 houses should be connected to the same turbine

79
Systems for sustainable energy supply for a small village
Master in European Construction Engineering (2012-2013)
Spaces as open as possible to avoid turbulences
Figure 4.3.2_22 Visual impact of a SWT
This solution, even if technically, environmentally and economically feasible at first
glance, has many issues connected with it:
First, the morphology of the town allows the installation of turbines mainly in the
upper area; the mandatory limit of 30m in distance may imply some turbulence
phenomena, which would surely affect the performance and the power output.
To avoid turbulence, the height of the turbines should be remarkable, and this
would strongly affect the environmental and social suitability of the installations.
(See picture 4.2.3_22)
Furthermore, the social acceptability of such a solution would be extremely low,
and this has been confirmed asking directly of some of the house owners on site.
SWT have faster rotations, and this implies a more disturbing shadow flickering;
due to the location of the turbines, this would probably involve many houses near
each turbine.
The shape of the hills near the town could create a complex wind flow; it would
be probably difficult harvesting this flow without higher turbines.
For these reasons, a solution based only on SWT is not considered suitable for the
analysed area, at current conditions; further solutions that integrate SWT with other
energy supply will be considered, in order to reduce the number of turbines to be
placed and improve their suitability.
Figure 4.3.2_21 Possible SWT locations

80
Systems for sustainable energy supply for a small village
Master in European Construction Engineering (2012-2013)

81
Systems for sustainable energy supply for a small village
Master in European Construction Engineering (2012-2013)
5. PHASE 2 SCENARIOS

82
Systems for sustainable energy supply for a small village
Master in European Construction Engineering (2012-2013)
5.1. INTRODUCTION
This phase deals with different solutions combining heating and electricity alternatives
developed on phase 1. The same assumptions reflected in the introduction of the phase
1 are taken into account. The solutions have been divided in individual and collective
trying to cover all possible opportunities for Føns.
INDIVIDUAL SOLUTIONS
This section provides different individual solutions to supply energy to Føns. These options
will be useful in case some houses are isolated and it is not feasible to apply a collective
solution. The report will provide the guidelines, for choosing the best option.
HEATING
With regards to the heating needs, this section analyses the different individual solutions
to provide heat and hot domestic water for each house in Føns. Inside each analysis,
technical and economic considerations will be found in order to determine the feasibility
of the heating system proposed.
ELECTRICITY
The supply of electricity will be also analysed from an individual point of view, both for
small wind turbines and solar photovoltaic systems. In the Appendix 7.13, two maps can
be found in order to check the best areas to make these installations, depending on the
different factors studied in the feasibility study of each solution.
COLLECTIVE SOLUTIONS
This section provides five different scenarios that will supply energy to Føns. The scenarios
have been developed fixing first a heating solution and then the best electricity choice
for that heating solution.
In all the cases, the heating solution will have a common installation for the distribution, a
district heating system. The considerations about the distribution net and general
aspects will be analysed in section 5.3.

83
Systems for sustainable energy supply for a small village
Master in European Construction Engineering (2012-2013)
SCENARIO 1
In order to supply the village with a district heating system and electricity, this case will
study the implementation of a ground source heating systems aid by solar thermal
panels, all of that connected to a heat pump. For the electricity solution, a single wind
turbine with high electricity production will provide energy to the village.
SCENARIO 2
In the second scenario, the heating and electricity demand will be solved by a straw
boiler in the first case, and a combination of small wind turbines and solar photovoltaic
cells in the second.
SCENARIO 3
For the third case of study, the supply of both heating and electricity needs will be
provided by a single system. The scenario shows the technical and economical
considerations of a Stirling CHP wood chips cogeneration installation.
SCENARIO 4
Similarly to the first scenario, in relation with heat supply, the fourth scenario will deal with
a ground source heat pump installation, integrated in this case with a biogas boiler. For
the electricity supply, a combined system of solar photovoltaic cells and small wind
turbines will be optimized to produce electricity for the whole village. The difference with
scenario 2 in the electricity solution will be determined by the existence of a single
building; fact that will limit the amount of small wind turbines allowed and thus, the
conditions of the scenario.
SCENARIO 5
The last scenario proposes a trendy solution for district heating in Denmark, solar thermal
plant assisted by a biogas boiler. In this case small wind turbines will provide the
electricity demand. It must be taken into account, that in this particular case, the
conditions of this scenario limit the electricity production to a 47% of the whole demand,
as it is explained in this section.

84
Systems for sustainable energy supply for a small village
Master in European Construction Engineering (2012-2013)
5.2. INDIVIDUAL SOLUTIONS
The following chart represents the plots studied in the zone of Føns, according to the
maps and charts developed on the appendix 7.13.
The columns refer to the individual solutions proposed on this section are plotted:
- Pellet Boiler – [5.2.1.1 Heating solution 1] – Individual pellet boiler.
- SA GSH – [5.2.1.2 Heating solution 2] – Solar assisted ground source heat pump
with water tank seasonal storage.
- GSH – [5.2.1.3 Heating solution 3] – Ground source heat pump.
- Wind turbines – [5.2.2.1 Electricity solution 1] – Small wind turbines
- Solar (roof) – [5.2.2.1 Electricity solution 2] – Photovoltaic solar panels installed on
the roof.
- Solar (plot) – [5.2.2.1 Electricity solution 2] – Photovoltaic solar panels installed on
the plot.
The different rows represent the studied plots of the studied houses in Føns, the relation
between the code and the number and location of the plot is shown in the section 3.1
of this report.
The rows are marked as YES if the solution can be applied and NO if not. Further
information about these solutions can be found on the section of each individual
solution.
PLOT
CODE
PELET
OILER SA GSH GSH
WIND
TURBINES
SOLAR
(ROOF)
SOLAR
(PLOT)
27 YES YES YES YES YES YES
31 YES YES YES YES NO YES
34 YES YES YES NO NO YES
39 YES YES YES NO YES YES
10b YES NO YES NO NO NO
11a YES NO YES YES NO NO
11f YES YES YES NO YES NO
11g YES NO YES NO NO NO
11l YES YES YES NO YES YES
1a YES YES YES YES YES YES
1æ YES YES YES NO YES YES
1f YES YES YES NO YES YES
1h YES YES YES NO YES YES
1i YES YES YES YES YES YES
1l YES YES YES NO YES YES
1ø YES YES YES YES NO YES
1q YES YES YES YES YES YES
1r YES YES YES YES NO YES
1s YES YES YES YES YES NO
1t YES YES YES YES YES NO
1u YES YES YES NO YES YES

85
Systems for sustainable energy supply for a small village
Master in European Construction Engineering (2012-2013)
1y YES YES YES YES YES NO
21a YES YES YES NO YES YES
1z YES NO YES NO NO NO
23a YES YES YES NO YES YES
23b YES YES YES YES YES NO
23d YES NO YES YES NO NO
23e YES NO YES YES NO NO
23f YES NO YES NO NO NO
23k YES NO YES YES NO NO
24a YES NO YES NO NO NO
24c YES YES YES NO YES NO
24e YES YES YES NO YES NO
26a YES YES YES YES YES NO
26d YES YES YES NO YES NO
28a YES YES YES YES NO YES
29b YES NO YES YES NO NO
2a YES YES YES YES YES NO
2aa YES YES YES NO YES YES
2ac YES YES YES NO NO YES
2ae YES YES YES YES YES YES
2æ YES NO YES NO NO NO
2af YES YES YES NO NO YES
2b YES NO YES NO NO NO
2bp YES NO YES NO NO NO
2c YES NO YES NO NO NO
2e YES NO YES NO NO NO
2f YES NO YES NO NO NO
2o YES YES YES NO NO YES
2z YES YES YES NO YES YES
32b YES NO YES NO NO NO
32c YES YES YES NO NO YES
32d YES YES YES NO YES YES
32e YES YES YES NO NO YES
38a YES YES YES NO YES YES
38c YES NO YES NO NO NO
38d YES YES YES NO YES YES
3a YES NO YES NO NO NO
3c YES NO YES NO NO NO
43a YES NO YES NO YES NO
43b YES YES YES NO NO YES
4a YES YES YES NO YES YES
5a YES NO YES YES NO NO
5e YES NO YES NO NO NO
5g YES YES YES NO YES NO

86
Systems for sustainable energy supply for a small village
Master in European Construction Engineering (2012-2013)
5h YES YES YES NO YES NO
5i YES YES YES NO YES NO
5k YES YES YES NO NO YES
5l YES YES YES NO NO YES
5m YES NO YES NO NO NO
5o YES YES YES YES NO YES
6a YES YES YES NO NO YES
7a YES YES YES YES NO YES
7e YES NO YES NO NO NO
8c YES YES YES YES NO YES
9d YES YES YES NO YES YES
Figure 5.2_1: Individual solutions chart

87
Systems for sustainable energy supply for a small village
Master in European Construction Engineering (2012-2013)
5.2.1. HEATING SOLUTIONS
5.2.1.1. HEATING SOLUTION 1: PELLET BOILER
INTRODUCTION
The solution proposed in this scenario, consists on an individual heating supplying system
based on a pellet boiler.
In this analysis, the feasibility of this system will be studied in order to determine its
suitability in the case of study for Føns. As a baseline the previous analysis developed in
the alternative study section 4.2.1, will be followed.
JUSTIFICATION
TECHNICAL CONSIDERATIONS
The proposed system will be a HPK-RA 12,5 "CLIBER-GILLES or similar. It is an environmental
friendly and economical effective alternative to oil or gas boilers, being the boiler run by
means of burning wood pellets. The boiler has a store and a hopper to load the boiler.
The installation is formed by:
- Pellet boiler
- Integrated feeding system with manual loading
- Pellet container of 150- 200 l.
- Sanitary Hot Water tank of 75 l. (Logalux ER 75 "BUDERUS", or similar), designed to
accumulate the necessary hot water for one day.
- Extraction system (COAXIS W "NEGARRA", or similar)
The technical features of the boiler are: (Gilles, 2012) (Burdeus, 2012) (Negarra, 2012)
- Power – 12.5Kw
- Temperature range:
o Impulsion: 70ºC
o Return: 50 ºC
- Performance: 85%
- Self-regulation from 30% to 100%
- Annual consumption: 30.382 KWh/year
- Automatic turn-on, ashes extraction, and cleaning of the exchanger.
The main advantages of the pellets boiler are that there is no need of being connected
to the grid in order to have heat supply; it has low running costs, a long use life and it is
easy to switch and regulate. Despite the main disadvantages are the need of a space
to store the combustible and the cost of itself.

88
Systems for sustainable energy supply for a small village
Master in European Construction Engineering (2012-2013)
SOCIAL ASPECTS
Dealing with the installation of individual heating systems, there are no legal restrictions; it
is just required to obtain a work permit emitted by the local authorities.
Concerning grants award, heating installations are not given neither Danish nor
European ones.
ENVIRONMENTAL ASPECTS
As it is well known, biomass systems are considered legally zero balance carbon
emissions energies. However, the environmental impact of this heating system is reduced
to the limitation of the gaseous emissions on protected areas and living areas; the real
emissions of a pellet boiler are 25 kg CO2/ MWh (WPS, 2012).
SCHEME
HEATING SCHEME
PELLET BOILER12.5KW
HOT WATER TANK75L
HEAT EXCHANGER
FLOW MAINFOLD CIRCUIT 70 ºC
RETURN MAINFOLD CIRCUIT50 ºC
TO DHW CIRCUIT
FROM CW CIRCUIT
Figure 5.2.1.1_1: Heating scheme

89
Systems for sustainable energy supply for a small village
Master in European Construction Engineering (2012-2013)
ECONOMIC ANALYSIS
SOLUTION ANALYSIS
The data used on this economic analysis has been justified previously on the report. See
alternative study section 4.2.1 of the report.
Annual consumption costs –8.373 DKK/year (+1.00% annual variation)
Annual consumption – 32.574KWh/year
Fuel costs – 257,04 DKK/MWh (estimated yearly variation +1.00%)
Annual maintenance cost – 1.250 DKK/year
Installation cost –176.669DKK
DESCRIPTION COST (DKK)
Pellet boiler (HPK-RA 12,5 "CLIBER-GILLES") 105.500 DKK
SHW- tank 75l (Logalux ER 75 "BUDERUS") 4.700 DKK
Extraction system (COAXIS W "NEGARRA") 1.200 DKK
Installation and connection (10%) 11.500 DKK
TOTAL INSTALLATION COST 122.900 DKK
GC+IB (9%+6%) 18.435 DKK
TOTAL COST 141.335 DKK
VAT (25%) 35.334 DKK
TOTAL 176.669 DKK
Figure 5.2.1.1_2: Installation cost
* This costs refer to the estimated costs for the implementation of the solution into a
house heated by a combustion based method. The internal installations concerning
emitters will not be included.
After calculating the initial investment of the installation, as it is has been shown, an
economic analysis of the system has been developed.
CONCLUSION
Thanks to the system versatility it can be implemented in every single house of the
village.
Analyzing the economical estimation of the system the following data can be
highlighted in order to take it as a baseline for decision-making.
Initial investment 176,669 DKK
Annual fuel costs 8,873 DKK + 1% each year
First year with a positive cash flow Year 2
First year with a positive cash flow Year 6
First year without loan Year 10
Profit in 10 years 60,269 DKK
Profit in 20 years 415895,441 DKK
Figure 5.2.1.1_3: Cash-flow indicators
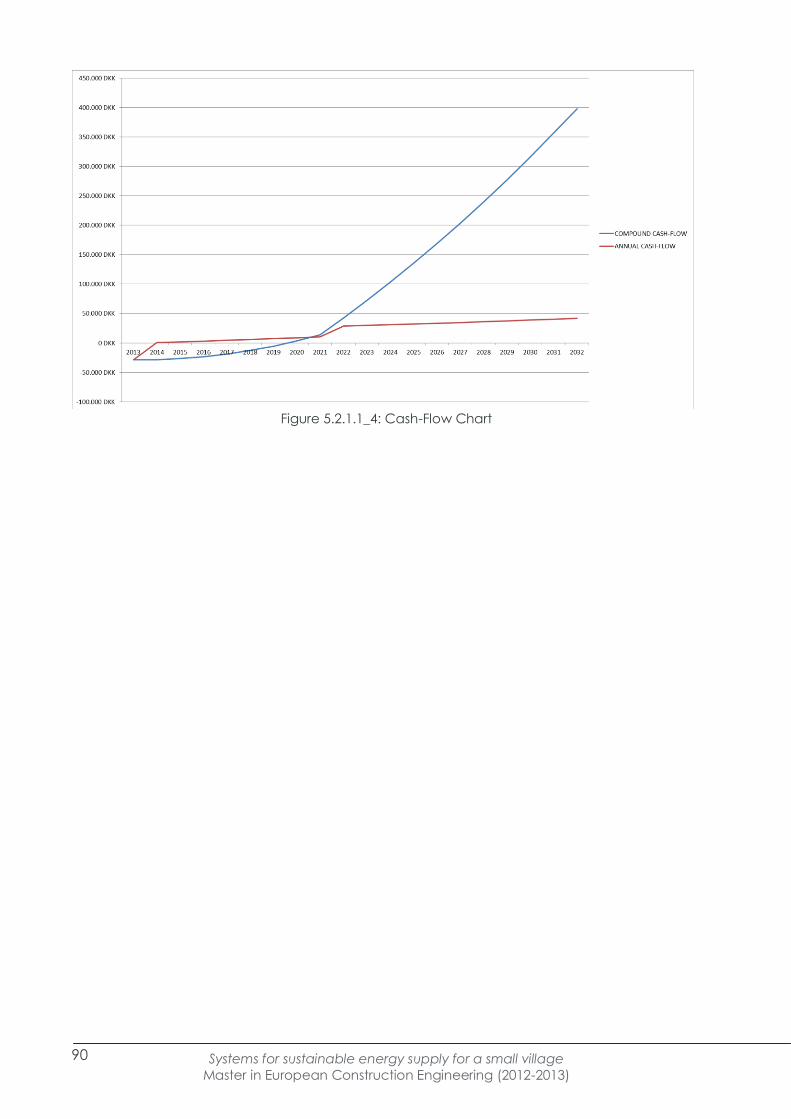
90
Systems for sustainable energy supply for a small village
Master in European Construction Engineering (2012-2013)
Figure 5.2.1.1_4: Cash-Flow Chart

91
Systems for sustainable energy supply for a small village
Master in European Construction Engineering (2012-2013)
5.2.1.2. HEATING SOLUTION 2: SOLAR
ASSISTED GROUND SOURCE HEAT PUMP WITH
WATER TANK SEASONAL STORAGE
INTRODUCTION
The solution proposed in this scenario consists on an individual heating supply system
based on an individual solar assisted heat pump with water tank seasonal storage.
In the following sections of this document the feasibility of this system will be studied
owing to its implantation as a suitable individual supply system for the small community
of Føns.
As a baseline the previous analysis developed in Feasibility Study, will be followed
(section 4.2.2.)
JUSTIFICATION
TECHNICAL CONSIDERATIONS
It is known the benefits and the better efficiencies reached by ground source heat
pump systems. Introducing new elements such as solar collectors and heating storage,
the efficiencies achieved are good enough to make this system feasible even to
individual purposes.
The fact of using solar collectors and seasonal storage systems implies an increasing of
the heat pump input temperature which means a higher coefficient of performance of
the heat pump.
This combined system is formed by:
- A Heat pump with an average COP of 4.
- A buried individual water tank of a volume around 24 m3.
- Individual solar collectors of a total surface around 16 m2. The solar collector
would be situated on the householder’s roof. In those houses which have straw
roofs the solution of locating the solar thermal collector in the plot should be
considered as well.
The heat pump will work with a Coefficient of performance of 4. The output temperature
will be around 65-70 degrees and the annual consumption 6900 KW/year on average.
The technical features of the solar thermal panel are:
- Flat solar collectors are used (www.Arcon.dk)
- The optimal inclination angle will be 38 degree (appendix, section n)
- Life time around 25 – 30 years. Little maintenance is required.
- The irradiation on optimally inclined plane is around 3050 Wh/m2/day in a sunny
day.

92
Systems for sustainable energy supply for a small village
Master in European Construction Engineering (2012-2013)
The technical features of the water tank thermal energy storage:
- Reinforced concrete tank fully buried in the ground.
- Thermally insulated in the roof and in the vertical walls.
- High density concrete materials.
- Heat capacity around 60 KWh/m3.
- Charge and discharge processes are available.
Main advantages of the system:
- Improve the efficiency of a GSHP system getting benefit of the summer solar
energy achieving really good performances (COP of 4 is expected).
- Less uncertainty than the boreholes storage system
- Easier to design the appropriate system for each case than the boreholes storage
system
Main disadvantages
- Less developed than other GSHP systems, so the real behavior is slightly uncertain
- It is a complex system with a lot of different elements
- Expensive system compared with other type of installations
- Possible problems to emplace the solar collectors
- Plot necessary to allocate the water tank
SOCIAL ASPECTS
The possible social impacts and benefits for the installation of this individual heating
supply system have been explained in section 4.2.2.
ENVIRONMENTAL ASPECTS
Concerning the environmental impact for the implantation of this individual system in the
small community of Fons, have to be considered either negative or positive aspects.
While this heating supply system is one with less CO2 emissions, remove the ground of the
household plot could affect the natural environment, which includes fauna and flora.
For further information, see section 4.2.2.

93
Systems for sustainable energy supply for a small village
Master in European Construction Engineering (2012-2013)
SCHEME
HEATING SCHEME
CONOMIC ANALYSIS
SOLUTION ANALYSIS
Initial Investment – 198.278 DKK
DESCRIPTION COST (DKK)
Heat pump and installations 74.604 DKK
Solar collectors 20.720 DKK
Water tank 35.810 DKK
Earth movements 67.144 DKK
TOTAL 198.278 DKK
Annual consumption – 6.910 KWh/year
Annual maintenance cost – 1.120 DKK
Annual energy cost – 15.202 DKK
o Yearly inflation - +3,00%
Figure 5.2.1.2_1. Heating scheme
Figure 5.2.1.2_2. Installation cost

94
Systems for sustainable energy supply for a small village
Master in European Construction Engineering (2012-2013)
CONCLUSION
This system has some advantages compared with the other GSHP system studied: the
economic data is the best, with lower investment, and the storage system is simpler and
with less uncertainty than the boreholes storage system.
Despite the fact that this system seems to be the best among the SAGSHP systems
studied, it is still little attractive because of its high initial costs and long payback period
(14 years). The system performs really well (COP of 4 is expected) and the energy
consumption is up to 4 times less than the current energy needs, triggering about 60% of
CO2 emissions reduction, but it is expensive and despite being the reduction of
consumption drastically reduced, the energy consumed is electricity, whose price is
much more expensive than solid fuels (biomass), so finally the investment is not
recovered so fast.
The economic indicators are the following:
INDICATOR VALUE
Initial investment 198.278 DKK
Loan period 10 Years
Break-even point 14 Years
Profit 10 years -71.012 DKK
Profit 20 years 135.435 DKK
Profitability 10 years -35.8 %
Profitability 10 years 68,3 %
Figure 5.2.1.2_4. Cash- Flow graph
Figure 5.2.1.2_3. Cash-flow indicators
95
Systems for sustainable energy supply for a small village
Master in European Construction Engineering (2012-2013)
5.2.1.3. HEATING SOLUTION 3: GROUND
SOURCE HEAT PUMP
INTRODUCTION
The solution proposed in this scenario consists on an individual heating supply system
based on an individual ground source heat pump with boreholes.
In the following sections of this document the feasibility of this system will be studied
owing to its implantation as a suitable individual supply system for the small community
of Føns.
As a baseline the previous analysis developed in Feasibility Study, will be followed
(section 4.2.2.)
JUSTIFICATION
TECHNICAL CONSIDERATIONS
The proposed system will be compound by a ground source heating system without
being assisted by solar thermal energy. The heat pump will heat from boreholes which
act as heat sources.
This alternative takes advantage of the moderate temperatures in the ground that are
considered around 9 degrees.
This installation is formed by:
- A Heat pump with an average COP of 3,3 (Sørensen, 2012).
- 4 Closed loop vertical boreholes of a dimension around 100 m long.
The Coefficient of performance (COP) of the heat pump expected is 3,3, with an energy
consumption of 8.375 KWh per year and house. The output temperature is from 65 to 70
degrees.
The technical features of the boreholes are:
- The type of soil considered in Føns area is mainly clay, taking into account that
there is a small superficial layer of saturated sand which is not significant in the
study.
- Energy extracted per boreholes about 6,3 Mw/year.
- Distance between boreholes around 3 meters.
- The boreholes will be filled with groundwater.
- High durability and less maintenance.
Advantages
- The system is simpler than the storage systems, and predictable
- The system is cheaper than the SAGSHP with boreholes storage
- No solar collectors are needed, so it is no problem of emplacement of them

96
Systems for sustainable energy supply for a small village
Master in European Construction Engineering (2012-2013)
Disadvantages
- The boreholes are very expensive, due partly to the high heating demand, and
the soil characteristics.
- The performance is worse than with storage systems and the difference in price is
not so much because the main costs are the boreholes construction.
- As there is no heat replacing, the temperature of the ground may decrease
yearly reducing therefore the efficiency
SOCIAL ASPECTS
Regarding to the acceptance of the implementation of this alternative there is any
rejection. Even without any grant provided by the government, people are willing to put
this system in their houses. For more information, see section 4.2.2.
ENVIRONMENTAL ASPECTS
Most of the possible environmental impacts caused by the implementation of this
alternative are related to the boreholes installation. The properties of the soil could be
changed, as well as the underground water could be contaminated. Further
information, see section 4.2.2.
SCHEME
HEATING SCHEME
Figure 5.2.1.3_1. Heating scheme.

97
Systems for sustainable energy supply for a small village
Master in European Construction Engineering (2012-2013)
ECONOMIC ANALYSIS
Initial Investment – 224.762 DKK
DESCRIPTION COST (DKK)
Heat pump and installations 44.762 DKK
Boreholes 180.000 DKK
TOTAL 224.762 DKK
Annual consumption – 8.375 KWh/year
Annual maintenance cost – 1.120 DKK
Annual energy cost – 18.426 DKK
o Yearly energy inflation - +3,00 %
Figure 5.2.1.3_2. Installation costs

98
Systems for sustainable energy supply for a small village
Master in European Construction Engineering (2012-2013)
CONCLUSION
This system is the most common among the GSHP systems studied, and even in Føns
some are already installed. However, the analysis shows that actually this system, more
developed, simpler and easier have worse economic data than the others studied. This
is due to the high costs of the boreholes. Integrating in the system solar collectors and
extra installation to storage the heat is not so expensive compared with the cost of the
boreholes (is estimated in about 20% of the total costs), and the improvement of
efficiency let the system recover the investment earlier and have better results, as it can
be seen in the feasibility study (alternative 2 vs. alternative 3).
Compared with other types of individual systems, the investment is high and the
payback period is quite long (about 20 years), and despite being the reduction of
consumption drastically reduced, the energy consumed is electricity, whose price is
much more expensive than solid fuels (biomass), so finally the investment is not
recovered so fast.
INDICATOR VALUE
Initial investment 224.762 DKK
Loan period 11 Years
Break-even point 20 Years
Profit 10 years - 127.880 DKK
Profit 20 years 15.207 DKK
Profitability 10 years -56,89 %
Profitability 20 years 6,7 %
Figure 5.2.1.3_3. Cash-flow indicators
Figure 5.2.1.3_4. Cash-Flow Graph

99
Systems for sustainable energy supply for a small village
Master in European Construction Engineering (2012-2013)
5.2.2. ELECTRICITY SOLUTIONS
5.2.2.1. ELECTRICITY SOLUTION 1: SMALL
WIND TURBINE
INTRODUCTION
One of the possible solutions to supply a single household with electricity is a Small Wind
Turbine. This can be a good solution thanks to the subsidy regime in Denmark, which
allows net-metering regulation for turbines under 6 kW, as explained in the section 4.3.2.
JUSTIFICATION
TECHNICAL CONSIDERATIONS
From the technical point of view, the installation of a domestic turbine would be almost
exactly the same as explained in section 4.3.2. The only one difference is that, in order to
supply the electricity needs of only one household, one 1,5 kW turbine.
The chosen turbine will be a Bornay 1500 turbine, coupled with a BornayAeocon inverter,
which integrates all functions necessary for wind home production (Inverter, peak limiter,
rectifier, overload safety system, filter).
Considering an average wind speed of 5,3 m/s, the power output of this turbine would
be 4570 kWh/year.
SOCIAL ASPECTS
As explained in section 4.3.2, wind turbines can reduce the value of a neighbour’s
property; before placing domestic wind turbines, it is useful to organize discussions with
the neighbours, in order to avoid claims.
ENVIRONMENTAL ASPECTS
All environmental aspects connected with such an installation have been treated in
section 4.3.2.

100
Systems for sustainable energy supply for a small village
Master in European Construction Engineering (2012-2013)
SCHEME
ECONOMIC ANALYSIS
SOLUTION ANALYSIS
To consider the economical investment of a SWT, many factors have to be known:
Installation costs
O&M costs
Electricity production per year
Average cost of electricity
Forecast electricity escalation rate
Performance derating
Interest rate (loan)
Downpayment percentage (loan)
Debt term (loan)
Expected lifespan of the turbine
In the case studied, some assumptions have been made, where data was missing or not
reliable. The following calculations are for a Bornay 1500 turbine, in an environment like
Føns.
WIND
TURBINE
6 KW
CONTROLLER
INVERTER
METER
USER
GRID
RECTIFIER
OVERLOAD
SAFERY SYSTEM
FILTER
Figure 5.2.2.1_1 Electricity scheme

101
Systems for sustainable energy supply for a small village
Master in European Construction Engineering (2012-2013)
Summary of assumptions
Financial assumptions
Downpayment 45000 DKK
Interest Rate (%/year) 3 %
DebtTerm (years) 10
Site properties
Average Wind Speed (m/s) 7,2
AnemometerHt (m) 100
Wind ShearExponent 0,143
Weibull k 2
Site Elevation (m) 0
Avoided energy costs
Average Cost of Electricity (DKK/kWh) 2,2
Nominal Electricity Escalation Rate (%/year) 0,03
System costs
Installation Investment + Distribution net (DKK) 120000
Installation running annual cost + distr net (DKK/kW) 400
System characteristics
RatedPower (kW) 1,5
RotorHubHeight (m) 18
Availability (%) 0,98
Performance Margin 0,00%
Performance Derating 10,00%
Hub Height Average Wind Speed (m/s) 5,3
Air DensityFactor 1,00
Average Annual Power Output (kWh) 4570
ImpliedCapacityFactor 31% Figure 5.2.2.2_2 Assumptions

102
Systems for sustainable energy supply for a small village
Master in European Construction Engineering (2012-2013)
Year
1Ye
ar 2
Year
3Ye
ar 4
Year
5Ye
ar 6
Year
7Ye
ar 8
Year
9
HEA
TIN
GTo
tal
An
nu
al c
ost
2013
2014
2015
2016
2017
2018
2019
2020
2021
Inst
alla
tio
n In
vest
men
t11
0.00
0 D
KK5.
254
DKK
-46.
950
DKK
-7.1
46 D
KK-6
.988
DKK
-6.8
30 D
KK-6
.673
DKK
-6.5
15 D
KK-6
.358
DKK
-6.2
00 D
KK-6
.042
DKK
Ann
ual r
unni
ng +
mai
nten
ance
co
sts
600
DKK
-600
DKK
-600
DKK
-600
DKK
-600
DKK
-600
DKK
-600
DKK
-600
DKK
-600
DKK
-600
DKK
Ann
ual e
lect
rici
ty r
even
ue10
.357
DKK
+3,0
0% p
er y
ear
10.6
68 D
KK10
.988
DKK
11.3
17 D
KK11
.657
DKK
12.0
07 D
KK12
.367
DKK
12.7
38 D
KK13
.120
DKK
13.5
14 D
KK
Init
ial i
nves
tmen
t gr
ant
3.00
0 D
KK3.
000
DKK
Ann
ual g
rant
0 D
KK0
DKK
0 D
KK0
DKK
0 D
KK0
DKK
0 D
KK0
DKK
0 D
KK0
DKK
-33.
882
DKK
3.24
2 D
KK3.
729
DKK
4.22
6 D
KK4.
734
DKK
5.25
2 D
KK5.
780
DKK
6.32
0 D
KK6.
871
DKK
-33.
882
DKK
-30.
640
DKK
-26.
911
DK
K-2
2.68
4 D
KK
-17.
951
DK
K-1
2.69
9 D
KK
-6.9
19 D
KK
-599
DK
K6.
273
DK
K
IND
IVID
UA
L TU
RB
INES
AN
NU
AL
CA
SH-F
LOW
CO
MPO
UN
D C
ASH
-FLO
W
Year
10
Year
11
Year
12
Year
13
Year
14
Year
15
Year
16
Year
17
Year
18
Year
19
Year
20
2022
2023
2024
2025
2026
2027
2028
2029
2030
2031
2032
-5.8
85 D
KK-5
.727
DKK
-5.5
69 D
KK-5
.412
DKK
-600
DKK
-600
DKK
-600
DKK
-600
DKK
-600
DKK
-600
DKK
-600
DKK
-600
DKK
-600
DKK
-600
DKK
-600
DKK
13.9
19 D
KK14
.337
DKK
14.7
67 D
KK15
.210
DKK
15.6
66 D
KK16
.136
DKK
16.6
20 D
KK17
.119
DKK
17.6
32 D
KK18
.161
DKK
18.7
06 D
KK
0 D
KK0
DKK
0 D
KK0
DKK
0 D
KK0
DKK
0 D
KK0
DKK
0 D
KK0
DKK
0 D
KK
7.43
4 D
KK8.
009
DKK
8.59
7 D
KK9.
198
DKK
15.0
66 D
KK15
.536
DKK
16.0
20 D
KK16
.519
DKK
17.0
32 D
KK17
.561
DKK
18.1
06 D
KK
13.7
07 D
KK
21.7
16 D
KK
30.3
13 D
KK
39.5
11 D
KK
54.5
77 D
KK
70.1
13 D
KK
86.1
33 D
KK
102.
652
DK
K11
9.68
4 D
KK
137.
245
DK
K15
5.35
1 D
KK
Figure 5.2.2.2_3 Cash-flow

103
Systems for sustainable energy supply for a small village
Master in European Construction Engineering (2012-2013)
CONCLUSION
Analyzing the economical estimation of the system the following data can be
highlighted in order to take it as a baseline for decision-making.
INDICATOR Small turbine 1,5kW
Initial investment 120.000 DKK
Loan period 13 years
Break-even point 9 years
Profit 10 years 13.843 DKK
Profit 20 years 154.970 DKK
Profitability 10 years 11,5%
Profitability 20 years 129,14%
Figure 5.2.2.2_4 Cash-flow indicators
OPTIMAL PLACEMENT OF SWT
The criteria for an optimal placement of SWT are shown below:
- The distance from the household hasn’t to be greater than 30m
- The distance from each house in the neighborhood should be more than 24m, in
order to keep the noise emissions under 39 dB
- The turbine should face the prevailing wind (from West) without higher obstacles;
if there are obstacles, a good distance should be ensured in order to avoid
turbulent regimes. In the map in appendix 7.13 it is possible to see the lines
representing the best wind flows, i.e. the ones coming from west and not
encountering relevant obstacles.
- The power output is increased if the turbine is placed in higher places; in
appendix 7.13 an elevation map has been presented;
- All these maps can be overlaid in order to have a general overview of the
optimal location to install SWT.

104
Systems for sustainable energy supply for a small village
Master in European Construction Engineering (2012-2013)
5.2.2.2. SOLUTION 2:
PHOTOVOLTAIC SOLAR CELLS
INTRODUCTION
One of the possible solutions to supply a single household with electricity is a
photovoltaic solar cells installation. As explained in the feasibility study, the Danish
regulation offers special conditions for the installation of this systems, with special prices
for selling and buying electricity; situation that makes this alternative an attractive one.
JUSTIFICATION
TECHNICAL CONSIDERATIONS
The basic installation for an individual solution will be based on solar photovoltaic
systems of around 5 kW installed. That means 20 solar panels with a total area of 32,6 m2.
With this technology, and depending on the place where the solar cells are located,
almost the whole average consumption of electricity per year could be covered (4.309
kWh/year from 4.500 kWh/year as average needs).
Regarding the location, the roof represents the best place to install them since is the less
exposed to shadows and avoids land occupation. As studied in the feasibility phase, the
inclination of the panels together with the orientation will determine the final energy
output of the system. In this line, after different simulations, the best option is to install the
panels at 35º with South orientation. It must be taken into account that in case the
panels are installed in the ground, a shadow study should be carried out in order to
know how to get as much benefit as possible from the space available.
SOCIAL ASPECTS
For the solar panels, as mentioned in the feasibility study, the energy regulation from
2010 in Denmark (although recently changed to worse economic conditions) made
from solar panels an attractive investment, situation corroborated with the rise in the
number of photovoltaic installation since 2010.
ENVIRONMENTAL ASPECTS
At this point, it must be said that solar photovoltaic systems do not have a direct
environmental impact, due to the fact that they do not produce CO2 emissions in the
electricity production.

105
Systems for sustainable energy supply for a small village
Master in European Construction Engineering (2012-2013)
SCHEME
DC
Solar PV Cells20 PHOTOVOLTAIC PANELS
5 KW
Inverter
Smart Meter
CA
GRID
Controller
Figure 5.2.2.2_1 Electricity scheme for 5kW individual installation
ECONOMIC ANALYSIS
SOLUTION ANALYSIS
The following results and calculations are basically based on the feasibility study
presented previously in the report (section 4.3.1).
As already mentioned in this part all the estimation are dependant from the recent
Danish regulation which aims to compare daily the production and the consumption to
estimated if electricity should be bought or sold.
In that context, the annual costs of the system (balance between energy to be sold and
energy to be bought) have been estimated and are presented in the Appendix 7.10.6.
With the solar installation the costs per year are reduced from 9900DKK to 2020DKK. Due
to the inflation of the electricity costs (3.00% each year) and the change of selling prices
after 10 years (0.6DKK per kWh instead of 1.3DKK) the costs per year reach 7712DKK after
20 years while without the installation 17360DKK would be spend to provide electricity to
a house.
The annual maintenance costs are considered increasing through their lifetime, starting
at 375DKK per year, then 750DKK/year after 5 years to finally reach 1000DKK/year after
10years.
The initial investment is, once again, based on the assumptions made in the section 4.3.1
and are presented in the table below.

106
Systems for sustainable energy supply for a small village
Master in European Construction Engineering (2012-2013)
DESCRIPTION COST (DKK)
20 Panelsmodel “Alex-Solar” 250W Monocristaline 45.001 DKK
1 Inverter model Danfos TLX 6000 7.077 DKK
Installation and connection (10%) 5.207 DKK
Total installation cost 57.286 DKK
GC+IB (9%+6%) 8.593 DKK
Total cost 65.880 DKK
VAT (25%) 16.470 DKK
TOTAL 82.350 DKK
Figure 5.2.2.2_2– Initial investment for an individual installation of 5kW
Thanks to all the data mentioned before it’s now possible to evaluate the pay-back
period and benefits from this installation. The cash flow of this solution is presented in
Appendix 7.10.10.
CONCLUSION
Analyzing the economical estimation of the system the following data can be
highlighted in order to take it as a baseline for decision-making.
INDICATOR PV individual 5kW
Initial investment 82.350 DKK
Loan period 3 years
Break-even point Year 4
Profit 10 years 0 DKK
Profit 20 years 72.313 DKK
Profitability 10 years 0%
Profitability 20 years 87,81%
Figure 5.2.2.2_3: Cash-flow indicators

107
Systems for sustainable energy supply for a small village
Master in European Construction Engineering (2012-2013)
Figure 5.2.2.2_4: Cash-Flow Chart
Those data and the information exposed before highlight some interesting point about
the installation of PV solar cells in an individual context.
First of all, it’s important to realize that the initial investment is not huge and the money
loaned can be return after 3 years paying only around 13000DKK per year (considering
45000DKK available). This amount of money represent around 140€ per month during 3
years meaning a low impact on the economical balance of a family.
From the 4th year, the cash flow starts to be positive meanwhile the cost per year per
house reaches 2.413DKK (201DKK per month).
It is here important to realize that the savings after 20 years are not huge (only 72313DKK)
but the installation permits to reduce considerably the annual (and so monthly) costs.
After 3 years, this stability permits to keep an annual bill of electricity below 8000DKK
representing less than 90€ per month even after 20 years of inflation.
From an economical point of view, this solution appears as a good compromise for all
budgets. Indeed, with a low initial investment, it is possible to reduce the annual
electricity bill during the 20 years of lifetime of the product. The money saved is not here
the main objective and the main advantage of the solution but it’s its stability through
the time that can be more interesting.

108
Systems for sustainable energy supply for a small village
Master in European Construction Engineering (2012-2013)
5.3. DISTRICT HEATING NETWORK
INTRODUCTION
In this part of the report, a feasibility study for the District Heating Network (DHN) will be
performed. The DHN will go from the plant to each of the potential consumers. The
sustainable planning of a heating plant does not make sense nowadays without the
conception of a DHN. The design and the economic analysis will involve the connection
to the grid of each of the consumers as well as the grid dimensioning regarding the
output of the designed plants studied in each of the scenarios that will be developed
later on. However, before starting, some assumptions must be done:
Figure 5.3_1: District Heating Scheme (Swedish Energy Agency, 2011).
ASSUMPTIONS
The grid will be common for the corresponding scenarios that require common
District Heating (DH).
The proposed DH will full cover all the heating and hot water demand for the 71
dwellings studied.
The location of the plant is the one shown in the map provided at the end of this
part and it respects all the environmental and Urban Planning restrictions
considered in the Urban Planning. See Appendix 7.1.
The Price of the land for the plot where the plant will be located has been
considered 9,75 DKK/m2 (Universidad de Santiago de Compostela, 2008). The
surface of the plot has been considered in each scenario since the land needed
is different from one to other. So in this chapter the price is not considered.
The location of the plant will be common for all the scenarios that require DHN:
o Ground source heating
o Straw without Cogeneration
o Cogeneration + Wood Chips / Biomass
o Ground source + Biomass (CHP)
o Solar thermal + Biomass
The plot will house the electricity generation system in case the scenario requires
it. So, it will be needed in the following scenarios:
o Scenario 2 (Biomass + Solar Energy + Wind Energy)

109
Systems for sustainable energy supply for a small village
Master in European Construction Engineering (2012-2013)
o Scenario 3 (Biomass + Cogeneration + Solar Energy + Wind Energy)
o Scenario 4 (Ground Source Heating + Biomass CHP + Solar Energy + Wind
Energy)
o Scenario 5 (Solar thermal + Biomass + Solar Energy + Wind Energy)
This makes bigger the area required for the location of the plant. It is assumed
that the selected area is big enough to house all the required installations.
As 4 scenarios with different types of System Heat Generation (Fuel) must be
considered, it has been assumed that this factor has not conditioned the choice
nor the design of the DHN. The output that comes from the plant has been
established to 639 kW (see appendix 7.4) and this will be the starting point.
In this chapter one District Heating Net will be designed:
o The implementation of a collective heating system is the aim.
o The study includes a simple design and the economic study of the
collective District Heating and the individual connection to each potential
consumer.
o The individual connection for each consumer has been considered as 4 m
length and applicable to all the cases so as to simplify the study.
While designing the grid and the cross section the following restrictions and
conditionings have been taken into account:
o Water quality assumptions: it is assumed that the water in Føns fulfills the
required parameters (Danfoss, 1995):
Conductivity max 10 µS/m
pH-value 9-10
Hardness 0,1 tHº
Appearance: clear and sediment free
O2: 0,02 mg/liter
o Water pipes assumptions:
The DHN should follow in all the length the rainwater and the sewage
pipes, because these two types of pipes should be taken into account for
the design. As just a site plan of the current status is available with no
information about the cross section and the depth, the designed grid does
not have taken into account this conditioning.
o Regarding the water supplying pipes, necessary for the connection
assumptions for the plant and for the design, no information is available,
but it is noted that as the previous point, it should be taken into account.
The same happens with the next services supplying:
Electricity grid and transformation centers and public lighting.
Gas grid, although in Føns there is not a gas grid located.
Telecommunication grid and pipes.
To make an idea about the cross section of the design, a picture is given:

110
Systems for sustainable energy supply for a small village
Master in European Construction Engineering (2012-2013)
For the proposed design, the technical aspects, the economic aspects, the
regulations and social aspects and the environmental considerations will be
studied.
The installation costs involve the labor hours.
OPTIONS CONSIDERED
As it is studied in the Appendix 7.14 about District Heating, exists the possibility for
retrofitting and implementation of Low temperature District Heating in the future,
however the proposed system is designed on the traditional district heating
systems. The reason for this is that the houses where the LTDH system would be
implemented need to meet Denmark’s low-energy house Class 1 rating. The
houses in Føns are older and would require a certain level of retrofitting to meet
the minimum efficiency levels required for the implementation of LTDH system.
In each dwelling will be located a small sub-station that will involve together the
heating installation and the domestic hot water. A very simple connection has
been considered since there are not big houses.
JUSTIFICATION
DESIGN AND TECHNICAL CONSIDERATIONS
The designed grid is a very small one, taking into account that the design guidelines
state that the DH lines lie between 40 to 60 MW (Danfoss, 1995). Besides, the local
heating plant should be connected either to a bigger CHP plant or to a supporting
electric standby boiler that would be used only at peak demands and at operational
break downs and maintenance moments of the existing plant. However, it has been
Figure 5.3_2: District Heating pre-insulated pipes cross section (Flexenergy, 2011).

111
Systems for sustainable energy supply for a small village
Master in European Construction Engineering (2012-2013)
considered that in case the plant stops working when maintenance works are needed
or damage of the system occurs a provisional supplying system will be contracted.
The following DH Distribution Net system has been proposed. The corresponding
plan is given at the end of this chapter but now a scheme is provided. Later on,
the working conditions of the grid are given:
Figure 5.3_3: Proposed District Heating floor plan. In green it is highlighted the network
o Total length – 2.435,4 m. Considering the following estimated distances:
Main branch – 1.130,5 m
Sub-branches – 83,1 m; 41,9 m; 45,4 m; 353,1 m; 54,1 m; 194,5 m; 56,8
m; 182 m.
Individual connections – 71 dwellings * 4 m = 284 m
Plant connection – 10 m
o The flow/supply temperature has been considered 80ºC (PlanEnergi, 2012).
Being the operating minimum temperature level required of 70ºC for
Denmark (IEA, 1999).
o The return temperature has been considered 40ºC (PlanEnergi, 2012)
Being the minimum operating temperature level required of 40ºC for
Denmark (IEA, 1999).
o The proposed grid establishes a heat loss in the network of about 15-16% on
an annual basis (PlanEnergi, 2012).
o The considerations about the static pressure and the dynamic one that
must be at least 150 kPa have been assumed to be achieved with the
selected type of circulating pump (Danfoss, 1995).
The DHN as a whole has three main parts: the heat generation plant, the distribution
network and the individual connection to the consumers. At this point, the projected
systems and equipment for each of those parts will be provided together with the
technical aspects and costs considered:

112
Systems for sustainable energy supply for a small village
Master in European Construction Engineering (2012-2013)
Central Source/Production Plant
o Power output – 639 kW (Appendix 7.4)
o Heat exchangers (have already been considered in the study of
alternatives).
o Accumulator/Buffer tanks (have already been considered in the study of
alternatives).
o Boiler (has already been considered in the study of each of the
alternatives).
o Peak and standby boilers
In case the plant stops working due to maintenance or damage of the
system a provisional supplying system will be contracted. Anyway, an
exhaustive maintenance system will be performed continuously in the plant
so as to avoid break downs.
o One circulation pump is needed to ensure the required flow and pressure
in the whole circuit. The main technical features are described in the
District Heating Appendix 7.14:
Annual maintenance cost – 284 DKK (Cype, 2012)
Installation cost – 111.907 DKK
Principal Distribution Network
The specifications are the ones described in Appendix 7.14 about District Heating
in the part of design guidelines and prices. Summarizing tables are provided
below:
The prices are estimated according to the Danish price level in 2013, which have
included Danish labor cost, Danish installation methods and Danish materials
(Price book 2013).
HEAT DISTRIBUTION NETWORK COST
MATERIALS 4.161.060 DKK
District heating pipes ø60,3/140 mm 2151 1780 3.828.780 DKK
District heating pipes ø60,3/140 mm 284 1170 332.280 DKK
INSTALLATION COST 743,070 DKK
District heating pipes ø60,3/140 mm 2151 290 623.790 DKK
District heating pipes ø60,3/140 mm 284 420 119.280 DKK
TOTAL COST 4,904,130 DKK
Annual maintenance cost 1% 4,904,130 DKK 49.041 DKK
Figure 5.3_4: Cost estimation for heat distribution network.
Individual System/Consumer system. In-building equipment:
The estimated cost for individual mix arrangement system with double shunts has
taken into account all the equipment, in relation to operation with district heating
and hot water supply.

113
Systems for sustainable energy supply for a small village
Master in European Construction Engineering (2012-2013)
The prices are estimated according to the Danish price level in 2013, which have
included Danish labor cost, the Danish installation methods and Danish materials
(Price book 2013).
INDIVIDUAL SYSTEMS
EQUIPMENT / MATERIALS COST 986.900 DKK
Hot water tank 200 liter incl. Valves,
pipes etc.
71 13.900 986.900 DKK
INSTALLATION COST 663.850 DKK
Hot water tank 200 liter incl. Valves,
pipes etc.
71 3.800 269.800 DKK
Electric installation 71*10 710 555 394.050 DKK
TOTAL COST 1.650.750 DKK
Annual maintenance cost 1% 16.507 DKK
Figure 5.3_5: Cost estimation for individual systems.
After studied all the elements of the DHN, an economic study is done:
ECONOMIC ASPECTS
For this analysis, it will be taken into account the technical feasibility of installing and
running the system, considering the previous proposals. An estimated budget for the
installation cost and the annual maintenance will be added. Gathering all the costs
exposed before, the following table is provided:
DESCRIPTION COST (DKK)
Circulation Pump (SE 500-70-16) 111.907
Distribution Network 4.904.100
Individual Systems 1.650.800
Total Installation Cost 6.666.807
GC+IB (9%+6%) 1.000.021
Total cost 7.666.828
VAT (25%) 1.916.707
TOTAL 9.583.535
*Some values have been round up since it is a rough analysis. Figure 5.3_6: Investment costs.

114
Systems for sustainable energy supply for a small village
Master in European Construction Engineering (2012-2013)
DESCRIPTION ANNUAL MAINTENANCE COSTS
(DKK)
Circulation Pump (SE 500-70-16) 284
Distribution Network 49.000
Individual Systems 16.500
Total Installation Cost 65.784
GC+IB (9%+6%) 9.868
Total cost 75.652
VAT (25%) 18.913
TOTAL 94.565
*Electricity consumption considered in annual maintenance costs. Figure 5.3_7: Annual maintenance costs.
Apart from those previous tables, now are provided the costs for each consumer:
DESCRIPTION COST (DKK)
Total Initial Investment per House
Installation
33.423
*The data per consumer only considers the individual installation per house, taxes
included. Figure 5.3_8: Individual Investment costs.
DESCRIPTION ANNUAL MAINTENANCE COSTS (DKK)
Maintenance per Consumer 334
*The data per consumer only considers the individual installation per house, taxes
included. Figure 5.3_9: Individual annual maintenance costs.
The economic considerations have basically taken into account the cost of the initial
investment and the maintenance costs yearly. The annual electricity consumption will be
included in the maintenance costs. This cost includes the electricity consumption to run
the circulation pumps, the individual electric systems and the accumulator.
It must be bear in mind that this solution is common to all the scenarios involving
common heating that will be developed in the following chapters of the report.
Other economic consideration could be the marginal cost for District Heating
production (DKK/MWh) which varies between seasons. This might make a change in the
tariffs with seasonal difference that some municipalities in Sweden apply. There can
appear three typical season levels (Sköldberg, 2009).
- Winter: 160 % of yearly average
- Autumn/spring: 75 % of yearly average
- Summer: 30% of yearly average
However, having a low marginal cost can have some negative consequences
(Sköldberg, 2009):

115
Systems for sustainable energy supply for a small village
Master in European Construction Engineering (2012-2013)
- Loss of economic optimization due to excessive energy savings.
- The price for the district heating could be increased so as to cover costs.
SOCIAL ASPECTS
Before following, some barriers to DHN deployment will be mentioned (Pöyry, 2009):
- Economic barriers due to Project risks and costs.
- General Institution issues.
- Carbon price that is not taken into account in the traditional heating systems.
On this section, all the actual regulations will be taken into account in order to evaluate
if it is legally feasible to execute the project. Furthermore, the existence of grants and
governmental support will be studied, providing a more favourable scenario so as to
carry on the investment.
The main problem appears with the restrictions because of the closeness to the coast
and because the project is developed on a rural area. However, it has been considered
that as the service will improve the well-being of the area and it enhances sustainability
since final environmental consequences are positive for the town, the project is feasible.
Besides, taking notice of other similar projects, this feasibility is more justified. This could
be the next case studied:
Similarities with DH in Onsbjerg (Samsø)
Taking as a close example the case of the District Heating station in Onsbjerg in the
island of Samsø that was executed for about 80 houses, there is the possibility to
extrapolate and apply the results to the present project. It was executed with biomass
plant of straw heating. The initial costs were about 8,5 million DKK and the Danish Energy
Authority gave a grant of 3 million DKK (Jørgensen, 2007).
Administratively, the plant is run of by a group of 8 people gathering members of the
company in charge of the plant, city council and consumers. Moreover, changes in the
heating price must be checked and approved by the city council (Jørgensen, 2007).
Regarding connection fee, the model introduced by NRGi was used. This model makes
inexpensive to sign up for the district heating before the plant is constructed, paying just
80 DKK as a registration fee. It is different to the traditional Danish model which applies
high registration fees. Nevertheless, a negative consequence of this model is the higher
heating price, although the payment is favourable in comparison to the elevate costs of
heating by oil or electricity (Jørgensen, 2007).
ENVIRONMENTAL ASPECTS
The District Heating deployment has several advantages for the different agents
involved in the process such as promoters, consumers and society in general, not only
regarding environmental aspects, but also economic and social, what makes a more
sustainable use of the heating resources (Esen, 2008).
- Execution time and costs are reduced since the trenches for the water supplying
pipes are used for the DHN and also because of the substitution of boilers in each
dwelling with one common plant.
- The access to grants is possible.
- Operative and maintenance costs of the installations are reduced.
- The installed capacity and the fuel consumption is reduced in each dwelling.

116
Systems for sustainable energy supply for a small village
Master in European Construction Engineering (2012-2013)
- It is not necessary storing fuel in the buildings.
- It reduces noise pollution in buildings.
- It improves global energetic efficiency.
- It reduces the emission of CO2 and GHG.
- It allows the use of Renewable Energies for the heating production at the same
time that allows the cogeneration, what improves the energetic efficiency of the
system.
CONCLUSION
Finally, it can be said that the execution of the District Heating Network is feasible after
having studied the previous points. Indeed, this values and studies are not exact, but
they are very close to reality.
The economic data values are summarized to end this part:
Summarizing the previous calculations, here are provided the initial investment costs (in
total and per consumer) and the maintenance costs (in total and per consumer):
DESCRIPTION COST (DKK)
Total Initial Investment (without land) 9.583.535
*This value has just included the installation costs and the taxes. Not land cost included. Figure 5.3_10: Investment costs.
DESCRIPTION ANNUAL MAINTENANCE COSTS (DKK)
Total Initial Investment (without land) 94.565
*This value has just included the installation costs and the taxes. Not land cost included. Figure 5.3_11: Annual maintenance costs.
DESCRIPTION COST (DKK)
Total Initial Investment per House
Installation
33.423
*The data per consumer just considers the individual installation per house, taxes
included. Figure 5.3_12: Total Initial Investment per House Installation.
DESCRIPTION ANNUAL MAINTENANCE COSTS (DKK)
Maintenance per Consumer 334
*The data per consumer just considers the individual installation per house, taxes
included. Figure 5.3_13: Annual maintenance costs per House Installation.
117
Systems for sustainable energy supply for a small village
Master in European Construction Engineering (2012-2013)
5.4. COLLECTIVE SCENARIOS
5.4.1. SCENARIO 1: GROUND SOURCE
HEATING AND WIND TURBINE
INTRODUCTION
This scenario based on collective measures, will provide Føns with heat and electricity
exclusively from natural inputs.
Concerning heat demand a collective ground source heating system has been
selected. To be able to work the heat pump of the system needs electricity and heat.
The heat is provided thanks to solar panels and deep boreholes and the electricity
necessary for the heat pump to run is supplied by the collective wind turbine. Finally, the
need of electricity for the whole village is provided by the wind turbine.
JUSTIFICATION
TECHNICAL CONSIDERATIONS
HEATING INSTALLATIONS
That scenario requires a heat pump with a COP of 4,5, 160 boreholes deep of 100 meters
with a distance of 3 meters between each, in order to limit loss in the soil during the
storage, according the following scheme. Moreover the borehole will be supplied by the
heat collected by 20 solar collectors of 48m² each, oriented in south with an inclination
of 35°. For more details see section 4.2.2.
The total area of plot required is around 2800 m2; the cost per square meter has been
calculated on section 5.3 of this report.
ELECTRICITY INSTALLATTIONS
The wind turbine SWT-2.3-93, 2.3 MW and 93 m of rotor diameter, is the one selected to
supply electricity for Scenario 1. The bases of the technical considerations are reflected
in section 4.3.2. and for further information Appendix 7.9.
The output of the turbine was established in 7.679,356 MWh for an average wind speed
of 7.2 m/s.

118
Systems for sustainable energy supply for a small village
Master in European Construction Engineering (2012-2013)
SOCIAL ASPECTS
HEATING INSTALLATION
The main problem with that scenario is the huge plot which concentrates many square
meters of solar panels and another one with the collective wind turbine. The natural
landscape can lose beauty, especially in touristic place as Føns.
Moreover, the collective measures propose by that scenario can be rejected by people
which prefer manage their own installations in order to control it. The point is a collective
solution is always cheaper, especially for a ground source heating and a collective heat
pump, referred to the different alternatives: “Group Project 1, Ground Source Heat
Pump, Economic analysis”.
ELECTRICITY INSTALLATION
Social aspects have been considered during the entire study. From the report done in
Group Project I to the section 4.3.2 developed on phase 1. It must be highlighted the
distances, noise and subsidies consideration, all the information is gathered in the
section 4.3.2. already mentioned and more in detail in Appendix 7.6.
ENVIRONMENTAL ASPECTS
HEATING INSTALLATION
Concerning the collective heating installation, the main environmental aspect is the
amount of land occupied. Indeed, 160 boreholes spaced of 3 meters between each,
and 960m² of panel solar require a field of at least 2800m², without counting the building
to place the collective heat pump which should be about 100 meters.
Moreover, the soil removed is so important (100 meters of depth on 1500m²) that the
propriety of the land will be affected as much on the flora as on the fauna.
Nevertheless, for this collective measure, the different protective areas around Føns
have been taken into account to implement the borehole, and the solar collectors.
Moreover, that scenario is by far the one which consumes less energy compared to
others. Also it has to be said that scenario is the one which requires the less energy,
especially when it is combined with wind turbine, the amount of energy collected is
even more important than the needs.
PLANT DESIGN
For the design of the site, some factors have been taken into account:
- The building of the heating plant which needs to be near the road and to the
district network.
- The solar thermal collectors which use at least 960 m2 of the total plot.
- Enough plot surface to drill 160 boreholes. The boreholes, as it was explained
before, will be 3 meters spaced among them and they will be disposed
generating a compact grid in order to achieve less heating losses.

119
Systems for sustainable energy supply for a small village
Master in European Construction Engineering (2012-2013)
The figure below shows the plant design for the plot.
Figure 5.4.1_1: Plant design Scenario 1
ELECTRICITY INSTALLATION
As for the social considerations, the environmental aspects have been considered for
the development of the wind turbine project. The location of the turbine developed in
section 4.3.2. takes into account all possible natural variables. For further information see
Appendix 7.5.
Boreholes
Communication road
Solar thermal collectors
Building

120
Systems for sustainable energy supply for a small village
Master in European Construction Engineering (2012-2013)
SCHEME
HEATING SCHEME
Concerning the heating scheme, all the collective devices have to be on the same plot,
in order to avoid the distance between the different connections which lead to loss of
heat and an increasing of price. The plot is at least 2800m², without the collective wind
turbine which will be out of Føns area. To implement the boreholes spaced of 3 meters
between each, a square of 17 boreholes per 17 boreholes has been considered to
optimize the space; nevertheless, this parameter can be modified depending on the
shape of the field.
HEAT PUMPCOP 4.5
SOLAR PANELS48m2 South
Inclination 35°
160
BOREHOLES
Føns
SUPPLY: 436.852 kW/year
ELECTRICITY SCHEME
CONTROLLER
TRANSFORMATION CENTRE
SUBSTATIONGRID
Medium voltage
High voltage
Low voltage
Figure 5.4.1_3 Scheme of the electricity flow from the wind turbine to the grid.
Figure 5.4.1_2: Scheme proposal for the ground source heating of the scenario 1.

121
Systems for sustainable energy supply for a small village
Master in European Construction Engineering (2012-2013)
Wind energy has the characteristic of not being able to store in big quantities. This is way
the energy generated must be consume and so wind turbines have to be connected to
the net/grid. It depends on the way taken to connect the turbine to the grid, design and
route change. However, every wind farm actually is composed by the following
installations (Ayuntamiento de durcal, n.d.):
- Transformation centre: the low voltage wiring is the internal installation of the
turbine to elevate the voltage from low to medium, from 690 V to 20 kV.
- Substation: It transforms the medium voltage power generated in the wind farm
to high voltage power needed for the grid connection, from 20 kV to 132 kV
The most common typology of substation is a prefabricated mix structure that will
need the refurbishment of the placed selected to locate it.
- Underground network of medium voltage: it connects wind turbine among them
and with the substation. As the project only is design for one wind turbine the
underground medium voltage network connects the wind turbine with the
substation. This section must be taken into account in case of enlargement of the
project.
The trench designed to contain the wiring has an average width of 60 cm and an
average deep of 100 cm.
- Grounding: each wind turbine must be provided of a specific trench for the
grounding. It measures 100 cm deep and 40 cm wide.
ECONOMIC ANALYSIS
COMMON INSTALLATION: DISTRICT HEATING AND BUILDING
The district heating installation has been studied in the Appendix 7.14 of this report; the
following data represents a summary of the initial investment and total annual costs.
Annual land rent – 44.850 DKK/year
Land requirements – 4.600 m2.
Land rent price – 97.500 DKK/Ha per year
Annual running costs – 94.565 DKK/year
Total investment – 9.583.535 DKK
DESCRIPTION COST (DKK)
District heating investment 9.583.535 DKK
TOTAL 9.583.535 DKK
HEATING INSTALLATION
The district heating installation has been studied in the previous sections (section 5.13
and section 7.8) of this report; the following data represents a summary of the initial
investment and total annual costs.
Figure 5.4.1_4: Initial investment for the common district heating installation
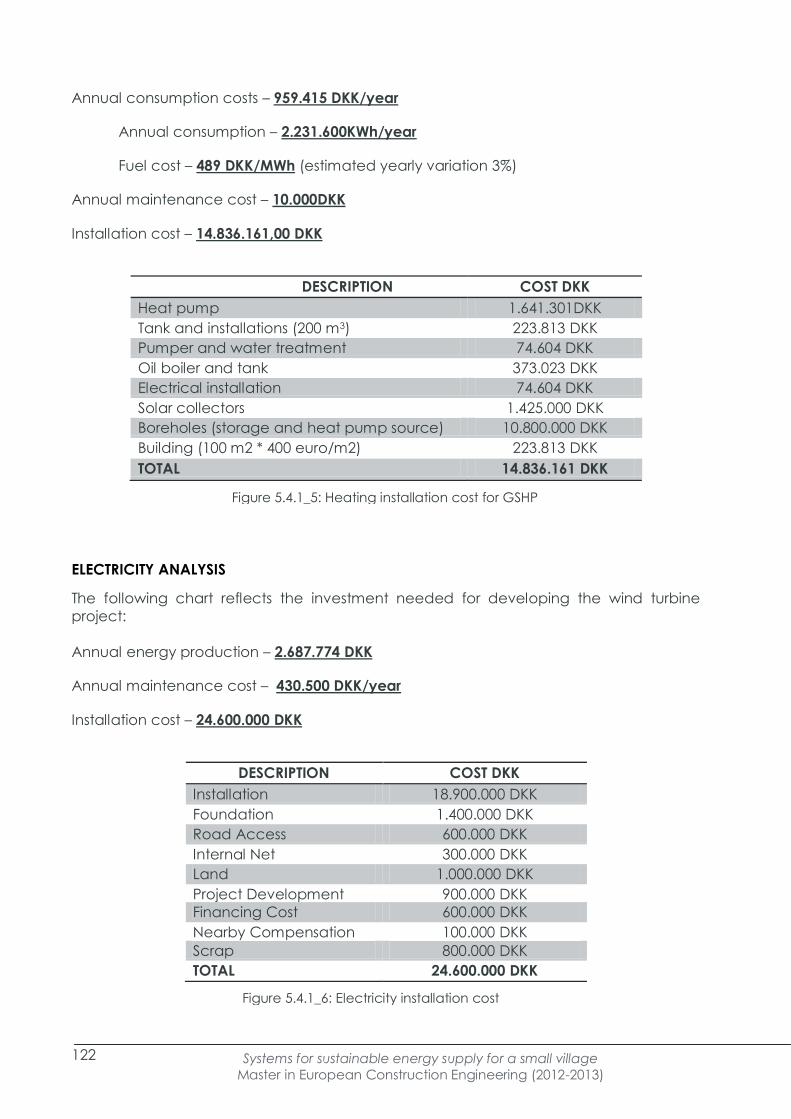
122
Systems for sustainable energy supply for a small village
Master in European Construction Engineering (2012-2013)
Annual consumption costs – 959.415 DKK/year
Annual consumption – 2.231.600KWh/year
Fuel cost – 489 DKK/MWh (estimated yearly variation 3%)
Annual maintenance cost – 10.000DKK
Installation cost – 14.836.161,00 DKK
DESCRIPTION COST DKK
Heat pump 1.641.301DKK
Tank and installations (200 m3) 223.813 DKK
Pumper and water treatment 74.604 DKK
Oil boiler and tank 373.023 DKK
Electrical installation 74.604 DKK
Solar collectors 1.425.000 DKK
Boreholes (storage and heat pump source) 10.800.000 DKK
Building (100 m2 * 400 euro/m2) 223.813 DKK
TOTAL 14.836.161 DKK
ELECTRICITY ANALYSIS
The following chart reflects the investment needed for developing the wind turbine
project:
Annual energy production – 2.687.774 DKK
Annual maintenance cost – 430.500 DKK/year
Installation cost – 24.600.000 DKK
DESCRIPTION COST DKK
Installation 18.900.000 DKK
Foundation 1.400.000 DKK
Road Access 600.000 DKK
Internal Net 300.000 DKK
Land 1.000.000 DKK
Project Development 900.000 DKK
Financing Cost 600.000 DKK
Nearby Compensation 100.000 DKK
Scrap 800.000 DKK
TOTAL 24.600.000 DKK
Figure 5.4.1_5: Heating installation cost for GSHP
Figure 5.4.1_6: Electricity installation cost

123
Systems for sustainable energy supply for a small village
Master in European Construction Engineering (2012-2013)
COMMON SOLUTION ANALYSIS
Initial investment
DESCRIPTION COST (DKK) COST PER USER(DKK)
District heating 9.583.535 DKK 134.979 DKK
Heating installation 14.836.161 DKK 208.960 DKK
Electricity installation 24.600.000 DKK 346.478,87 DKK
TOTAL 49.019.696 DKK 690.418 DKK
Annual running costs
DESCRIPTION COST (DKK) COST PER USER(DKK)
HEATING INSTALLATION
Land renting 44.850 DKK 632 DKK
HEATING INSTALLATION
Annual consumption heat pump 961.074 DKK 13.536 DKK
Maintenance costs 79.453 DKK 1.120 DKK
ELECTRICITY INSTALLATION
Annual consumption Føns 702.900 DKK 9.900 DKK
Maintenance costs 430.500 DKK 6.063 DKK
TOTAL 2.201.227 DKK 31.003 DKK
* A yearly variation for the cost of the electricity of +3% until 2020 is considered.
Annual production benefits
DESCRIPTION COST (DKK) COST PER USER(DKK)
ELECTRICITY INSTALLATION
Annual production 2.687.774 DKK 37.855 DKK
TOTAL 2.687.774 DKK 37.855 DKK
* A yearly variation for the heating costs with traditional fuels of +3.00% is considered.
Figure 5.4.1_7: Initial investment for the common solution
Figure 5.4.1_8: Annual running cost for the common solution
Figure 5.4.1_9: Annual production benefits for the common solution

124
Systems for sustainable energy supply for a small village
Master in European Construction Engineering (2012-2013)
CONCLUSION
INDICATORS
The following economic indicators referred to the investment have been selected in
order to compare all the scenarios proposed on the conclusion section of this report (see
section 6.1).
INDICATOR VALUE
Initial investment 690.418 DKK
Loan period 20 Years
Break-even point 12 Years
Profit 10 years -21.847 DKK
Profit 20 years 276.996 DKK
Profitability 10 years -3.2%
Profitability 20 years 40.1%
Figure 5.4.1_10: Cash-Flow indicators
GRAPHICS
The following graphics represent the evolution of the investment during the life period of
the system.
Figure 5.4.1_11: Cash-Flow

125
Systems for sustainable energy supply for a small village
Master in European Construction Engineering (2012-2013)
5.4.2. SCENARIO 2: STRAW BOILER WITH
SOLAR PV AND SWT
INTRODUCTION
On this scenario the feasibility of the implementation of a district heating solution
combined with a mixed electricity generation system will be studied. This solution will
consist on the following installations:
- A district heating installation for the 71 houses proposed, this installation has been
studied in the section 4.2.1 of this report.
- The heat production will be supplied by a straw boiler installation, which will
produce the 100% of the heat requirements.
- The electricity production will be supplied by a mixed system combining solar
photovoltaic cells and Small Wind Turbines; this combination will provide the 100%
of electricity requirements.
JUSTIFICATION
TECHNICAL CONSIDERATIONS
COMMON INSTALLATION
The main considerations taken on the whole installation refer to the district heating
distribution net, all these considerations have been explained previously on this report in
section 5.3.
The considerations taken respecting the design of the plant are concerning the main
volumes of building needed. As on this case the heating installation will require a
covered storage area, there will be considered two industrial constructions:
- A closed construction of 200m2 where the heating plant, district heating pumps
and communications will be installed. This area will count with a small storage
area in order to leave the necessary straw bales for a week of use.
- An opened construction of 200m2 with lower qualities, which will be used to store
the required straw bales for a period of a year of use. By having this storage, the
straw bales would be bought at a lower price as the producer does not charge
storage costs on the price.
The distribution and location of the building on the plot is explained graphically on the
following section of this scenario. The total area of plot required is 17.600m2, the cost per
square meter has been calculated on section 5.3 of this report.
All the requirements for the electricity production installation have been considered on
the design, but a further detailed study will be needed if choosing the solution.
HEATING INSTALLATION
The heating installation has been dimensioned to reach a peak power of 600KW, by the
use of a straw boiler, considering the model HTHW HHF600 "DANSTOKER”, similar models
from other suppliers can be adapted to the solution. The installation will consist on the
following elements:
- A conveyor belt with capacity for 7 straw bales, this system has enough capacity
to ensure the feeding requirements of one day, considering the most exigent

126
Systems for sustainable energy supply for a small village
Master in European Construction Engineering (2012-2013)
periods of working. The loading of this system will be done daily by the operator of
the plant, by using a minilader included in the installation investment.
- An adapted straw boiler, including the multifuel burning system. This installation will
have enough capacity for one straw bale, which will be loaded automatically by
the conveyor belt feeding system.
All the electronics and telematics of the system are included in the price. The
main computer will operate this boiler automatically.
The overall performance of the boiler has been estimated as 87%, in the section
4.2.1 of this report.
- An auxiliary gas-oil boiler with a peak power of 125KW will be installed, considering
the model Logano SK 645 "BUDERUS". This boiler will be fed by a gas-oil tank of 3
cubic meters. The purpose of this installation is to give support to the main boiler
on moments of peak demand, and during the maintenance of the main boiler.
The gas-oil tank has been sized to provide enough fuel for the operation of the
boiler in one year.
- A heat storage system composed by 4 buffer tanks of 800l, considering the model
PSM 800 "CLIBER-AUSTRIA”. The mission of these elements is to provide enough
thermal lag to the system to ensure that the straw boiler works on continuous
periods, reducing the starts and stops of the boiler and improving the efficiency.
The connection of the tanks will be done on parallel permitting the modularity of the
storage, so it will adapt easily to de demand of the different seasons (eg. During
winter all the buffer tanks will work, while during summer three of them will be closed
to reduce loses).
- A central computer will control all the installation; this device will receive data from
all the thermal sensors installed on the elements of the internal installation, the
measures of the flow in the system and the external temperature. Using this data the
software will control the boiler and pumps in order to optimize the performance of
the system.
This system has been considered into the cost of the installation of the boiler.
- All the piping system, including the valves, electro-valves, pumps and connections is
considered as a part of the installation, which has been estimated as a percentage
of the total costs.
*A performance of 87% will be considered when estimating the total consumption of the
boiler. (Plan Energi, 2012)
*The solution has been studied considering the approach of a feasibility study, further
calculations and design shall be done to reach more accurate data.
ELECTRICITY INSTALLATION
To supply the electricity needed to the town, a combination of Photovoltaic Panels and
Small Wind Turbines has been considered.
As explained in section 7.6, Danish regulation allows net metering policies for turbines
under 6kW. The chosen model is a Bornay 6kW SWT, which technical features can be
found in detail in section 7.11.
Considering the contribution of the PV panels to the total energy needed, 18 turbines
have to be placed.
The prevailing wind direction is West (see section 7.9).

127
Systems for sustainable energy supply for a small village
Master in European Construction Engineering (2012-2013)
Figure 5.4.2_1: Prevailing wind speeds
For the calculations, monthly average wind speeds have been taken into account. In
these conditions (the same reported in section 4.3.2), the power output of a single
turbine is 14730 kWh/year.
To connect the turbines to the grid, Aurora 6ke Inverter will be used.
The minimum distance of two consecutive turbines in an array should be 5 times the rotor
diameter (in this case 4m) in the direction of the prevailing wind and 3 in the
perpendicular direction; the minimum distances will therefore be 20m and 12m.
One important factor is the distance of the turbines from the two buildings; in fact, being
those buildings constructed by an association, they are part of the list of “non-
commercial buildings” mentioned by the Danish Regulation; that way, it is possible to
take profit of the net metering regulation to supply all other houses.
With regards to the solar photovoltaic system, the size of the installation has been
determined in order to get profit from the roofs of the two buildings needed. The
combined area of the two building is 400 m2; taking into account this area, and an
inclination of the roofs of 30º (technical justification of this inclination is exposed in the
feasibility study), the total area covered by the panels will be around 300m2. With these
conditions, and using panels of 250w, the total power installed in the roofs is 45kw (each
panel has an area of around 1,65 m2, which will suppose a total amount of 180 panels;
for further information about the solar cells see Appendix 7.10.
This power installed will produce an output of 38.600 kwh per year. The distribution of
energy output by months, together with the calculations can be checked in the
Appendix 7.10.11.
The strength of this solution is based on the fact that selling price for surplus electricity
produced by solar cells (1,45 DKK) is higher than the one produced with wind (0,60 DKK).
From the legal point of view, buying and selling electricity is a complex procedure, as

128
Systems for sustainable energy supply for a small village
Master in European Construction Engineering (2012-2013)
both systems are not covered by the same regulation. For wind turbines smaller than
6kw, as mentioned before, the net-metering systems is of application, whereas for solar
photovoltaic systems, net-metering is based on an hourly-consumption-production
scheme; further information will be found in the solar feasibility study.
SOCIAL ASPECTS
COMMON INSTALLATION
The plant location will generate people disagreements due to the proximity of the plant
to their house.
The plant construction will affect the surroundings and some services during the
execution phase.
HEATING INSTALLATION
The implementation of the straw boiler requires the permission of the local legal
authorities in order to integrate the district heating net.
ELECTRICITY INSTALLATION
The installation of 18 SWT of 20m height can certainly imply social non-acceptance; the
distance of the devices from the nearest households ensures a good protection from
noise, but still the visual impact of the turbines may be an issue to the neighbors. Even if
technically and economically feasible, this solution could be strongly affected by the
opinion of the inhabitants, which is very difficult to predict in this early stage.
For the solar panels, as mentioned in the feasibility study, the energy regulation from
2010 in Denmark (although recently changed to worse economic conditions) made
from solar panels an attractive investment, situation corroborated with the rise in the
number of photovoltaic installation since 2010.
ENVIRONMENTAL ASPECTS
COMMON INSTALLATION
The construction and integration of a district heating plant will imply a visual impact on
the area, considering that an industrial building would represent a strange element on a
zone dominated by traditional architecture. The placement of a storage area will
require a plant of bigger dimensions, which will increase this effect.
For this reasons, during the design phase of the plant, the integration with the
environment shall represent a critical point.
All the environmental restrictions have been followed, and are explained in depth on the
appendix 7.5 of this report.
HEATING INSTALLATION
Despite biomass systems are legally considered zero balance carbon emission, emissions
really exists during the heat generation process. Moreover different particles and dust
are emitted during straw combustion. It is recommended to include a fabric filter in order
to remove them (Midleton, CO. Cork, 210).

129
Systems for sustainable energy supply for a small village
Master in European Construction Engineering (2012-2013)
ELECTRICITY INSTALLATION
This scenario does not present any specific situation that may change the considerations
made in the solar cells feasibility study regarding environmental issues.
WIND
All environmental issues have been analyzed in section X; the area chosen for the
installation of the turbines does not overlay with protected areas, either for flora or for
wildlife. The only one impact could be the noise, but a minimum distance of 25m from
the nearest houses has been respected, in order to keep the emissions under 39 dB.
The visual impact may be a strong issue, in terms of modification of the landscape but,
thanks to the limited height of the devices, this can be limited thanks to tree planting in
the area.
PLANT DESIGN
For the design of the site, many factors have been taken into account:
- The two buildings of the biomass plant need to be near
- The building containing the heating plant needs to be near the road and to the
district heating network
- The Small Wind Turbines have been placed according to the distance criteria
explained before:
o A distance of 25m from the nearest house (South-West) has been
respected
o A maximum distance of 30m from the two buildings has been respected, in
order to take profit of the “net-metering”
- The turbines are west-oriented, to take profit of the prevailing wind direction
- The turbines have been placed in order to try to avoid turbulent wind regimes as
much as possible
- The visual impact of the turbines has been limited by planting trees. This has been
done in all sides except west, the prevailing wind direction; anyway, even the
wind of other directions can be harvested without turbulences, thanks to the
great distance between the trees and the turbines.
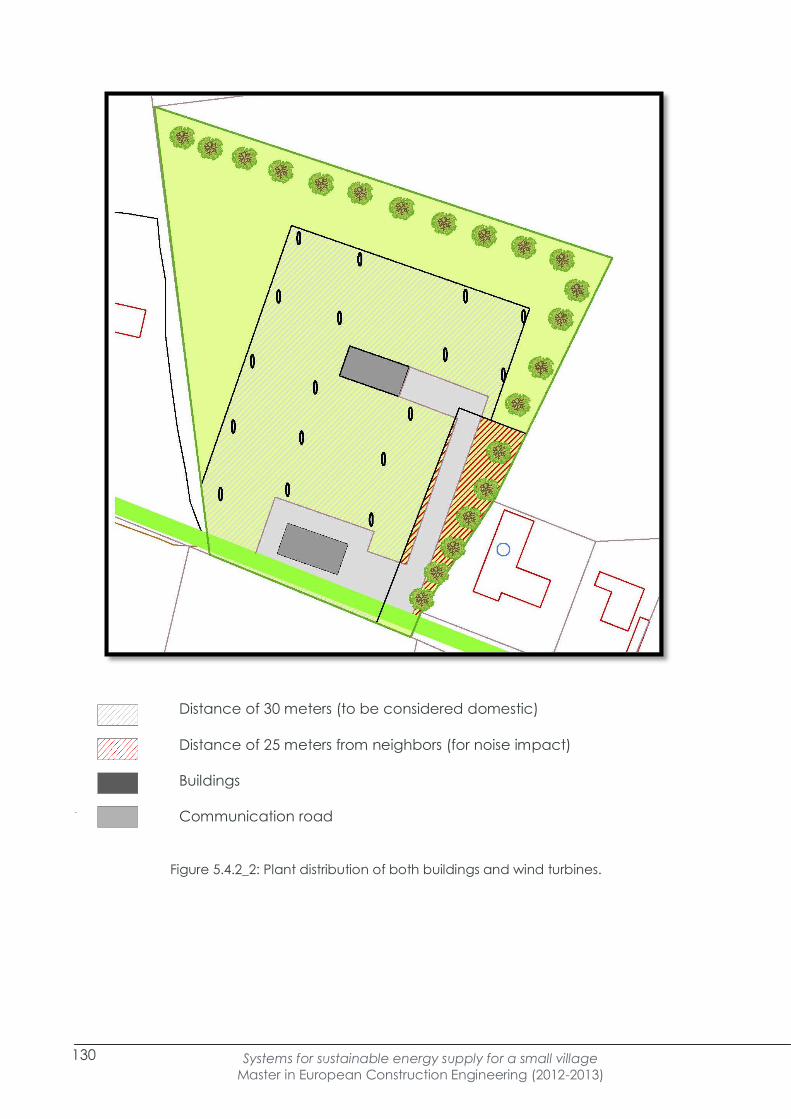
130
Systems for sustainable energy supply for a small village
Master in European Construction Engineering (2012-2013)
Distance of 30 meters (to be considered domestic)
Distance of 25 meters from neighbors (for noise impact)
Buildings
Communication road
Figure 5.4.2_2: Plant distribution of both buildings and wind turbines.

131
Systems for sustainable energy supply for a small village
Master in European Construction Engineering (2012-2013)
HEATING SCHEME
Working scheme of the heating system during autumn to spring season.
The buffer tanks will be used progressively, with all of the being used on the winter period
and two of them during spring and autumn.
The backup boiler would be used during maintenance or peak demand periods.
STRAW BOILER600 KW
LOADING SYSTEM
HOT WATER TANK800l
HOT WATER TANK800l
HOT WATER TANK800l
HOT WATER TANK800l
TO DHW CIRCUIT
RETURN FROM HW CIRCUIT
WINTER, AUTUMN & SPRING
GAS-OIL BACKUP BOILER 150KW
GAS-OIL TANK 3000L
Figure 5.4.2_3: Heating scheme working in Winter, Autumn and Spring
Working scheme of the heating system during summer season.
Just one buffer tank will be used, the back-up boiler would be used in case of
maintenance.
STRAW BOILER600 KW
LOADING SYSTEM
HOT WATER TANK800l
HOT WATER TANK800l
HOT WATER TANK800l
HOT WATER TANK800l
TO DHW CIRCUIT
RETURN FROM HW CIRCUIT
SUMMER
GAS-OIL BACKUP BOILER 150KW
GAS-OIL TANK 3000L
Figure 5.4.2_4: Heating scheme working in Summer

132
Systems for sustainable energy supply for a small village
Master in European Construction Engineering (2012-2013)
ELECTRICITY SCHEME
Controller
DC
Solar PV Cells180 Photovoltaic panels
45kw
Inverter
Windmill Farm
Smart Meter
Transform Station
CA CA
GRID
Controller
18 Wind turbines of 6kw each
Figure 5.4.2_5: Electricity scheme
ECONOMIC ANALYSIS
COMMON INSTALLATION: DISTRICT HEATING AND BUILDING
The district heating installation has been studied in the previous sections (see section 5.3)
of this report; the following data represents a summary of the initial investment and total
annual costs.
Annual land rent – 171.600 DKK/year
Land requirements – 17.600 m2
Land rent price – 97.500 DKK/Ha per year
Annual running costs – 94.565 DKK/year
Total investment - 11.113.577 DKK
DESCRIPTION COST (DKK)
Site building 1.530.042DKK
Closed building (200m2, industrial) 985.634DKK
Opened building (200m2, industrial) 238.400 DKK
VAT (25%) 306.008 DKK
District heating investment 9.583.535 DKK
TOTAL 11.113.577 DKK
Figure 5.4.2_6: Initial investment for the district heating installation
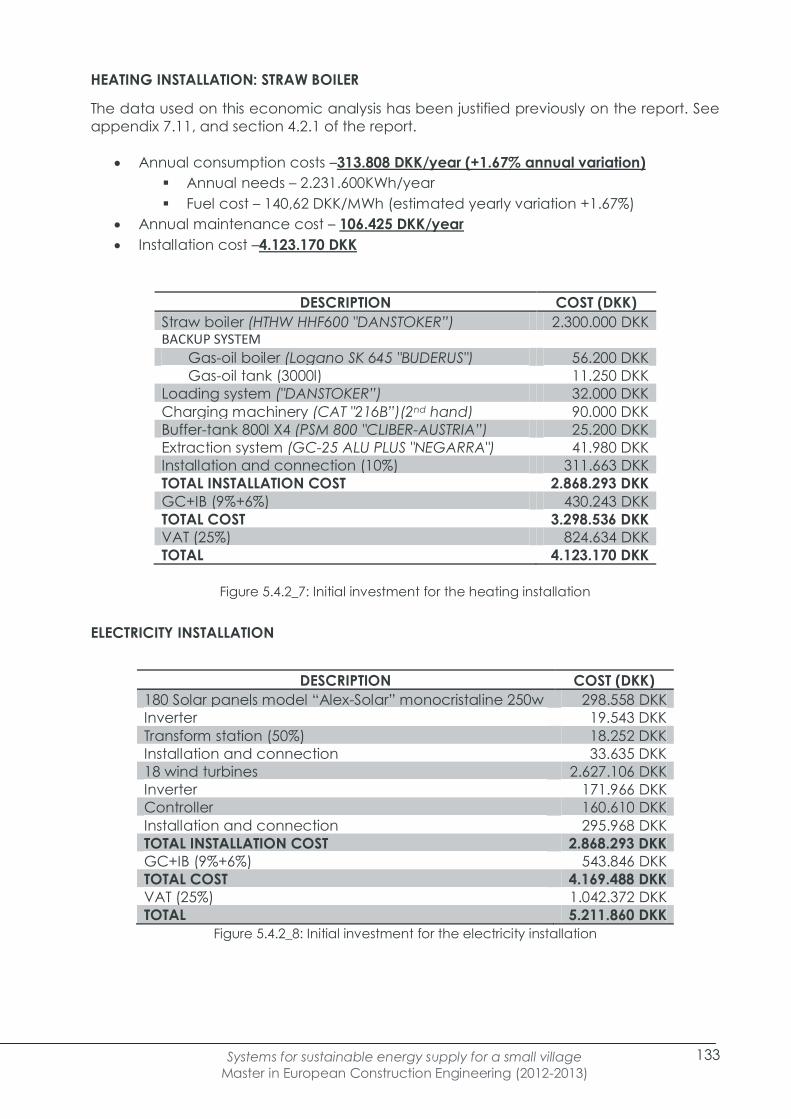
133
Systems for sustainable energy supply for a small village
Master in European Construction Engineering (2012-2013)
HEATING INSTALLATION: STRAW BOILER
The data used on this economic analysis has been justified previously on the report. See
appendix 7.11, and section 4.2.1 of the report.
Annual consumption costs –313.808 DKK/year (+1.67% annual variation)
Annual needs – 2.231.600KWh/year
Fuel cost – 140,62 DKK/MWh (estimated yearly variation +1.67%)
Annual maintenance cost – 106.425 DKK/year
Installation cost –4.123.170 DKK
DESCRIPTION COST (DKK)
Straw boiler (HTHW HHF600 "DANSTOKER”) 2.300.000 DKK BACKUP SYSTEM
Gas-oil boiler (Logano SK 645 "BUDERUS") 56.200 DKK
Gas-oil tank (3000l) 11.250 DKK
Loading system ("DANSTOKER”) 32.000 DKK
Charging machinery (CAT "216B”)(2nd hand) 90.000 DKK
Buffer-tank 800l X4 (PSM 800 "CLIBER-AUSTRIA”) 25.200 DKK
Extraction system (GC-25 ALU PLUS "NEGARRA") 41.980 DKK
Installation and connection (10%) 311.663 DKK
TOTAL INSTALLATION COST 2.868.293 DKK
GC+IB (9%+6%) 430.243 DKK
TOTAL COST 3.298.536 DKK
VAT (25%) 824.634 DKK
TOTAL 4.123.170 DKK
Figure 5.4.2_7: Initial investment for the heating installation
ELECTRICITY INSTALLATION
DESCRIPTION COST (DKK)
180 Solar panels model “Alex-Solar” monocristaline 250w 298.558 DKK
Inverter 19.543 DKK
Transform station (50%) 18.252 DKK
Installation and connection 33.635 DKK
18 wind turbines 2.627.106 DKK
Inverter 171.966 DKK
Controller 160.610 DKK
Installation and connection 295.968 DKK
TOTAL INSTALLATION COST 2.868.293 DKK
GC+IB (9%+6%) 543.846 DKK
TOTAL COST 4.169.488 DKK
VAT (25%) 1.042.372 DKK
TOTAL 5.211.860 DKK
Figure 5.4.2_8: Initial investment for the electricity installation

134
Systems for sustainable energy supply for a small village
Master in European Construction Engineering (2012-2013)
COMMON SOLUTION: SUMMARY
Initial investment
DESCRIPTION COST (DKK) COST PER USER(DKK)
District heating 11.113.577 DKK 156.529 DKK
Heating installation 4.123.170 DKK 58.073 DKK
Electricity installation
Solar PV system 531.860 DKK 7.598 DKK
Windmills 4.680.000 DKK 66.857 DKK
TOTAL 20.448.607 DKK 289.057 DKK Figure 5.4.2_9: Initial investment for the common solution
Annual running costs
DESCRIPTION COST (DKK) COST PER USER(DKK)
COMMON INSTALLATION
Land renting 171.600 DKK 2.417 DKK
DISTRICT HEATING
Annual costs 2.300.000 DKK 32.857 DKK
HEATING INSTALLATION
Annual consumption *313.808 DKK *4.420 DKK
Maintenance costs 106.425 DKK 1.499 DKK
ELECTRICITY INSTALLATION
Solar panels
Maintenance costs 22.350 DKK 320 DKK
Windmills
Maintenance costs 93.000 DKK 1.337 DKK
TOTAL 3.007.183 DKK 42.850 DKK
* A yearly variation for the cost of the straw of +1.76% until 2020 is considered.
Figure 5.4.2_10: Annual running costs for the common solution
Annual production incomes
DESCRIPTION COST (DKK) COST PER USER(DKK)
HEATING INSTALLATION
Potential savings *2.110.191 DKK *29.721 DKK
ELECTRICITY INSTALLATION
Potential savings **693.000 DKK **9.900 DKK
TOTAL 2.803.191 DKK 39.621 DKK
* A yearly variation for the heating costs with traditional fuels of +3.00% is considered.
** A yearly variation for the electricity costs of +3.00% is considered.
Figure 5.4.2_11: Annual production incomes for the common solution

135
Systems for sustainable energy supply for a small village
Master in European Construction Engineering (2012-2013)
CONCLUSION
INDICATORS
The following economic indicators referred to the investment have been selected in
order to compare all the scenarios proposed on the conclusion section of this report (see
section 6.1).
INDICATOR VALUE
Initial investment 289.057 DKK
Loan period 10 Years
Break-even point 9 Years
Profit 10 years 28.980 DKK
Profit 20 years 485.986 DKK
Profitability 10 years 10%
Profitability 20 years 168%
Figure 5.4.2_12: Cash-Flow indicators
GRAPHICS
The following graphics represent the evolution of the investment during the life period of
the system.
Figure 5.4.2_13: Cash-Flow graphic

136
Systems for sustainable energy supply for a small village
Master in European Construction Engineering (2012-2013)
5.4.3. SCENARIO 3: CHP GASIFICATION
STIRLING ENGINE
INTRODUCTION
On this scenario the feasibility of the implementation of a district heating solution
combined with a mixed electricity generation system will be studied. This solution will
consist on the following installations:
- A district heating installation for the 71 houses proposed, this installation has been
studied in the (section 5.3.) of this report.
- The heat and electricity production will be supplied by a Stirling CHP wood chips
cogeneration installation, which will produce the 100% of the heat requirements
and 100% of electricity as well.
JUSTIFICATION
TECHNICAL CONSIDERATIONS
COMMON INSTALLATION
The main considerations taken on the whole installation refer to the district heating
distribution net, all these considerations have been explained previously on this report
(see section 5.3.).
The considerations taken respecting the design of the plant are concerning the main
volumes of building needed. As on this case the heating installation will require a
covered storage area, there will be considered industrial constructions:
- A closed construction of 200m2 where the CHP plant, district heating pumps and
communications will be installed.
The distribution and location of the building on the plot is explained graphically on the
following section of this scenario. The total area of plot required is 4.100m2, the cost per
square meter has been calculated on section 5.3 of this report.
HEATING & ELECTRICITY INSTALLATION
The heating installation has been dimensioned to reach a peak power of 685KW, by the
use of 4 Stirling engines feed by woodchips gasification. The installation will consist on the
following elements:
- Feeding installation:
- Outdoor storage silo for woodchips connected to a
- Loading system which feeds the updraft gasifier.
- Updraft gasifier: 1 Updraft gasification where the fresh woodchips are slowly
combusted releasing gas which is then led into the 4 combustion chambers (one
for each engine)
- 4 modules of cogeneration system from “Stirling DK installed in parallel.
- 4 Combustion chambers
- 4 Biogas boilers boiler

137
Systems for sustainable energy supply for a small village
Master in European Construction Engineering (2012-2013)
- 4 Stirling engines: with electrical power of 35 kw and 140Kw of heating
each one. Produces electricity at the same time that water is heated.
- Electricity transformation center
- An auxiliary gas-oil boiler with a peak power of 125KW will be installed, considering
the model Logano SK 645 "BUDERUS". This boiler will be fed by a gas-oil tank of 3
cubic meters. The purpose of this installation is to give support to the main boiler on
moments of peak demand, and during the maintenance of the main boiler. The
gas-oil tank has been sized to provide enough fuel for the operation of the boiler in
one year.
- A heat storage system composed by 4 buffer tanks of 800l, considering the model
PSM 800 "CLIBER-AUSTRIA”. The mission of these elements is to provide enough
thermal lag to the system to ensure that the straw boiler works on continuous
periods, reducing the starts and stops of the boiler and improving the efficiency.
The connection of the tanks will be done on parallel permitting the modularity of the
storage, so it will adapt easily to de demand of the different seasons (eg. During
winter all the buffer tanks will work, while during summer three of them will be closed
to reduce loses).
- All the installation will be controlled by a central computer; this device will receive
data from all the thermal sensors installed on the elements of the internal installation,
the measures of the flow in the system and the external temperature. Using this data
the software will control the engines and pumps in order to optimize the
performance of the system.
This system has been considered into the cost of the installation of the CHP system.
- All the piping system, including the valves, electro-valves, pumps and connections is
considered as a part of the installation.
*A performance of 69% will be considered when estimating the total consumption of the
Stirling engine system. (Stirling DK, 2011)
*The solution has been studied considering the approach of a feasibility study, further
calculations and design shall be done to reach more accurate data.
SOCIAL ASPECTS
COMMON INSTALLATION
The plant location will generate people disagreements due to the proximity of the plant
to their house.
The plant construction will affect the surroundings and some services during the
execution phase.
HEATING & ELECTRICITY INSTALLATION
The implementation of the Stirling CHP biomass boiler requires the permission of the local
legal authorities in order to integrate the district heating net.
Stirling CHP systems offer interesting performances, high efficiency and are economically
profitable. The drawbacks might be that Stirling CHP technology is rather too innovative
and only few companies are in order to dispose these kinds of systems in which time
durability has not been certainly proved. Wood chips gasifier is an option being now
these small scale solutions the first of its generation to be commercialized.

138
Systems for sustainable energy supply for a small village
Master in European Construction Engineering (2012-2013)
ENVIRONMENTAL ASPECTS
COMMON INSTALLATION
The construction and integration of a district heating plant will imply a visual impact on
the area, considering that an industrial building would represent a strange element on a
zone dominated by traditional architecture. The placement of a storage area will
require a plant of bigger dimensions, which will increase this effect.
For this reasons, during the design phase of the plant, the integration with the
environment shall represent a critical point.
All the environmental restrictions have been followed, and are explained in depth on the
appendix 7.5 of this report.
HEATINGAND ELECTRICITY INSTALLATION
Despite biomass systems are legally considered zero balance carbon emission, emissions
really exists during the heat generation process. Moreover different particles and dust
are emitted during woodchips combustion. It is recommended to include a fabric filter in
order to remove them (Midleton, CO. Cork, 210).
HEATING AND ELECTRICITY SCHEME
HEATINGAND ELECTRICITY INSTALLATION
Working scheme of the heating system during autumn to spring season.
The buffer tanks will be used progressively, with all of the being used on the winter period
and two of them during spring and autumn.
The backup boiler would be used during maintenance or peak demand periods.
UPDRAFT GASIFIER
LOADING SYSTEM
STIRLIG MODULE
STIRLIG MODULE
STIRLIG MODULE
STIRLIG MODULE
TO DHW CIRCUIT
RETURN FROM HW CIRCUIT
WINTER, AUTUMN & SPRING
GAS-OIL BACKUP BOILER 150KW
GAS-OIL TANK 3000L TRANSFORMER
STATIONELECTRICITY TO THE GRID
Figure 5.4.3_1 CHP scheme operating in winter, autumn & spring

139
Systems for sustainable energy supply for a small village
Master in European Construction Engineering (2012-2013)
Working scheme of the heating system during summer season.
Just one buffer tank will be used, the back-up boiler would be used in case of
maintenance.
UPDRAFT GASIFIER
LOADING SYSTEM
STIRLING ENGINE
STIRLING ENGINE
STIRLING ENGINE
STIRLING ENGINE
TO DHW CIRCUIT
RETURN FROM HW CIRCUIT
SUMMER
GAS-OIL BACKUP BOILER 150KW
GAS-OIL TANK 3000L
TRANSFORMER STATION
ELECTRICITY TO THE GRID
Figure 5.4.3_2 CHP scheme operating in summer
ECONOMIC ANALYSIS
COMMON INSTALLATION: DISTRICT HEATING AND BUILDING
The district heating installation has been studied in the previous sections (section 4.2.1) of
this report; the following data represents a summary of the initial investment and total
annual costs.
Annual land rent – 39.975 DKK/year
Land requirements – 4.100 m2
Land rent price – 97.500 DKK/Ha per year
Annual running costs – 171.182 DKK/year
Total investment - 10.815.577 DKK
DESCRIPTION COST (DKK)
District heating investment 9.583.535 DKK
Site building 1.232.042 DKK
Closed building (200m2, industrial) 985.634 DKK
VAT (25%) 246.408 DKK
TOTAL 10.815.577 DKK
Figure 5.4.3_3 Initial investment for the common district heating installation

140
Systems for sustainable energy supply for a small village
Master in European Construction Engineering (2012-2013)
HEATING & ELECTRICITY INSTALLATION: WOOD CHIPS STIRLING ENGINE
The data used on this economic analysis has been justified previously on the report. See
(appendix 7.11.), (section 4.2.1.) of the report.
Annual consumption costs – 348.795,3 DKK/year (+3% annual variation)
Annual consumption – 2.808.335,7KWh/year
Fuel cost – 0,1242DKK/KWh (estimated yearly variation +3%)
Annual maintenance cost –102.138DKK/year
Installation cost – 8.505.156 DKK
DESCRIPTION COST (DKK)
4x35 kw Stirling engine wood chips system (STIRLING DK) 5.222.000 DKK
Storage silo
Loading system
Updraft gasification and combustion system
Biogas boiler
Buffer-tank 800l X4 (PSM 800 "CLIBER-AUSTRIA”) 25.200 DKK
Extraction system (GC-25 ALU PLUS "NEGARRA") 41.980 DKK
BACKUP SYSTEM
Gas-oil boiler (Logano SK 645 "BUDERUS") 56.200 DKK
Gas-oil tank (3000l) 11.250 DKK
Site building (200m2, industrial) 560.000 DKK
TOTAL INSTALLATION COST 5.916.630 DKK
GC+IB (9%+6%) 887.495 DKK
TOTAL COST 6.804.125 DKK
VAT (25%) 1.701.031 DKK
TOTAL 8.505.156 DKK Figure 5.4.3_4 CHP installation cost

141
Systems for sustainable energy supply for a small village
Master in European Construction Engineering (2012-2013)
COMMON SOLUTION: SUMMARY
Initial investment
DESCRIPTION COST (DKK) COST PER USER(DKK)
District heating 11.113.577 DKK 156.529 DKK
CHP installation 8.505.156 DKK 119.791DKK
TOTAL 19.618.733 DKK 276.320 DKK
Figure 5.4.3_5 Initial investment for the common solution
Annual running cost
DESCRIPTION COST (DKK) COST PER USER(DKK)
COMMON INSTALLATION
Land renting 39.975 DKK 563 DKK
DISTRICT HEATING
Annual costs 94.565 DKK 1.332 DKK
CHP INSTALLATION
Annual consumption *348.795 DKK *4.912 DKK
Maintenance costs 102.138DKK 1.438 DKK
TOTAL 585.473 DKK 8.245 DKK
Figure 5.4.3_6 Annual running cost for the common solution
* A yearly variation for the cost of the woodchips of +3% until 2020 is considered.
Annual production income
DESCRIPTION COST (DKK) COST PER USER(DKK)
HEATING INSTALLATION
Potential savings *2.110.191 DKK *29.721 DKK
ELECTRICITY INSTALLATION
Electricity benefits 1.157.385,4 DKK 16.301,2 DKK
TOTAL 3.267.576,4DKK 46.022,2DKK
Figure 5.4.3_7 Annual production benefits for the common solution
* A yearly variation for the heating costs with traditional fuels of +3.00% is
considered.

142
Systems for sustainable energy supply for a small village
Master in European Construction Engineering (2012-2013)
CONCLUSION
INDICATORS
The following economic indicators referred to the investment have been selected in
order to compare all the scenarios proposed on the conclusion section of this report (see
section 6.1).
INDICATOR VALUE
Initial investment 276.320 DKK
Loan period 12 Years
Break-even point 3 Years
Profit 10 years 107.817 DKK
Profit 20 years 586.884DKK
Profitability 10 years 39%
Profitability 20 years 212,4%
Figure 5.4.3_8 Cash-flow indicators
GRAPHICS
The following graphics represent the evolution of the investment during the life period of
the system.
Figure 5.4.3_9 CHP cash flow graph

143
Systems for sustainable energy supply for a small village
Master in European Construction Engineering (2012-2013)
5.4.4. SCENARIO 4: BIOGAS BOILER AND
GROUND SOURCE WITH SOLAR PV AND SWT
INTRODUCTION
On this scenario the feasibility of the implementation of a district heating solution
combined with a mixed electricity generation system will be studied. This solution will
consist on the following installations:
- A district heating installation for the 71 houses proposed, this installation has been
studied in the (section 5.3) of this report.
- The heat production will be supplied by an integrated system between a biogas
boiler and a ground source heat pump installation. The geothermal installation is
designed to supply the required demand during summer; while during the winter
the biogas boiler will act as a support system.
The GSHP system will supply heat during all the year, up to a maximum output
temperature of 73ºC, during the periods from January to April and October to
December the biogas boiler will support the system to rise up the temperatures up
to 90ºC.
- The electricity production will be supplied by a combination of small wind
turbines, providing a 23% and solar photovoltaic cells providing 77% of the total
demand.
JUSTIFICATION
TECHNICAL CONSIDERATIONS
COMMON INSTALLATION
The main considerations taken on the whole installation refer to the district heating
distribution net, all these considerations have been explained previously on this report
(section 5.3).
The considerations taken respecting the design of the plant are concerning the main
volumes of building needed. As on this case the heating installation will require:
- A closed construction of 200m2 where the heating plant, district heating pumps
and communications will be installed.
- The installation and placement of the biogas tank, this tank will be placed
horizontally on the exterior as a precaution against gas leaks. It has been located
close to the building in order to reduce the gas pipe length.
The GSHP system requires a plot of 1125 m2 in which drill the boreholes. The rest of the
installation will be placed in the common building.
The distribution and location of the building on the plot is explained graphically on the
following section of this scenario. The total area of plot required is 20.600 m2, the cost per
m2 has been calculated in section 5.3 of this report.

144
Systems for sustainable energy supply for a small village
Master in European Construction Engineering (2012-2013)
HEATING INSTALLATION
The heating installation has been dimensioned taking into account the combination of a
biogas boiler system and a geothermal system designed to work as the main system.
The following chart represents the monthly repercussion of each technology, according
to the flow temperature of the district heating net, for further information see Appendix
7.16.
Figure 5.4.4_1: Monthly distribution of the production between Biogas and Geothermal systems.
The final repercussion of each system on the overall production is represented on the
following chart, considering the annual estimated needs are 1.965.835Kwh/year (section
3.1) of this report:
SYSTEM ANNUAL PRODUCTION % ANNUAL PRODUCTION (KWH)
Geothermal heat pump 77.84% 1.530.206 KWh
Biogas boilers 22.5 % 442.313 KWh
Figure 5.4.4_2: Distribution of the overall production between the systems.
The biogas installation is composed by the following elements:
- A pressurized biogas tank of 16m3 which will be installed outdoors. The tank will be
filled by a regional supplier according to a long term contract which has to be
determined. The capacity has been pre-dimensioned in order to ensure 1 month
of supply on the most demanding period.
- One biogas boiler of 310KW of peak power, considering the model Logano Plus SB
615 "BUDERUS", the boiler will integrate a pressurized biogas burner which has
been included in the estimated cost of the boiler. All the electronics and valves
have been included on the costs of the boiler.
The overall performance of the boiler has been estimated as 99%,(Appendix 7.11),
(section 4.2.1) of this report.
The ground source heat pump installation is composed by the following elements:
- A large scale heat pump. This heat pump will provide 1.530.206 KWh of heat
yearly (450 KW of peak power), so the needs of electricity will be 340.046 KWh
yearly (peak of 100 KW).
- 120 boreholes of 150 m length, calculated for 1800 hours of production a year.
- Pumper and water treatment device, necessary in order not to damage the heat
pump
JANUARY FEBRUARY MARCH APRIL MAY JUNE JULY AUGUST SEPTEMBER OCTOBER NOVEMBER DECEMBER
Maximum temperature (ºC) 9,0 9,0 11,0 17,0 18,0 25,0 23,0 24,0 20,0 15,0 12,0 11,0
Minimum temperature (ºC) -12,0 -8,0 -8,0 0,0 5,0 8,0 11,0 11,0 7,0 -3,0 -3,0 -11,0
Average temperature (ºC) 1,0 1,4 3,2 7,0 11,7 14,7 17,3 17,5 13,8 9,7 4,6 2,0
Max. Flow temperature (ºC) 73,4 73,4 73,2 73,0 72,9 73,0 73,0 72,9 72,7 72,4 73,2 73,2
Min. Flow temperature (ºC) 99,4 89,1 89,1 77,5 73,6 73,3 73,2 73,2 73,4 81,6 81,6 94,7
Aver. Flow temperature (ºC) 76,3 75,2 74,1 73,4 73,2 72,7 72,9 72,9 73,1 73,3 73,7 74,9
Max. Return temperature (ºC) 43,2 43,2 43,4 44,8 44,6 45,4 46,6 45,7 44,9 44,5 43,6 43,4
Min. Return temperature (ºC) 56,1 52,1 52,1 46,6 43,9 43,2 43,4 43,4 43,4 48,5 48,5 55,1
Avg. Return temperature (ºC) 46,1 46,3 44,7 43,4 43,5 44,4 44,7 44,7 44,2 43,0 44,2 45,5
% Annual heating repercusion 18,77% 17,78% 8,33% 7,75% 2,90% 1,52% 1,44% 1,46% 4,10% 8,28% 11,22% 16,44%
MONTHLY REPERCUSION
Biogas 30% 25% 25% 15% 0% 0% 0% 0% 0% 20% 20% 30%
Geothermal 70% 75% 75% 85% 100% 100% 100% 100% 100% 80% 80% 70%
ANNUAL REPERCUSION
Biogas 5,63% 4,45% 2,08% 1,16% 0,00% 0,00% 0,00% 0,00% 0,00% 1,66% 2,24% 4,93%
Geothermal 13,14% 13,34% 6,25% 6,59% 2,90% 1,52% 1,44% 1,46% 4,10% 6,62% 8,98% 11,51%

145
Systems for sustainable energy supply for a small village
Master in European Construction Engineering (2012-2013)
The common installation is composed by the following elements:
- A heat storage system composed by 4 buffer tanks of 800l, considering the model
PSM 800 "CLIBER-AUSTRIA”.
The mission of these elements in this solution is to provide enough thermal lag to the
system in order to reduce start-stops on the installation improving the efficiency.
The connection of the tanks will be done on parallel permitting the modularity of the
storage, so it will adapt easily to de demand of the different seasons (eg. During
winter all the buffer tanks will work, during summer just one of the tanks will be
working in order to reduce loses, during transition periods two of the tanks will be
closed to adjust the thermal inertia to the needs).
- All the installation will be controlled by a central computer; this device will receive
data from all the thermal sensors installed on the elements of the internal installation,
the measures of the flow in the system and the external temperature. Using this data
the software will control the boiler, pumps and valves in order to optimize the
performance of the system.
This system has been considered into the cost of the installation of the boiler.
- All the piping system, including the valves, electro-valves, pumps and connections is
considered as a part of the installation, which has been estimated as a percentage
of the total costs.
ELECTRICITY INSTALLATION
The technical aspect of the electricity installation can be found in the Scenario 2, in the
section “Technical consideration-Electricity installation”. Also in this case, the electricity
will be supplied thanks to a combination between photovoltaic panels and wind
turbines.
The maximum number of turbines that can be placed in the area without a detailed
urban planning approved by the authorities is 10. Installing further turbines would require
great efforts in terms of policies, agreements and, furthermore, would be economically
less profitable, because it would be impossible to take profit of the “net-metering
policy”.
Whit this number of turbines, it is only possible to supply the 23% circa (147300 kWh/year)
of the total electricity needs.
To achieve the 100% of the electricity needs of the village a solar photovoltaic farm will
be disposed in the plot, in order to cover the 77% of the remaining electricity needs. This
means a total of 508.959 kwh per year. To cover this needs, and considering the
technical features of the installation studied in the feasibility study, a total installation of
600kw of power installed will be considered. With this, and taking into account the use of
solar cells of 250w and 1,65 m2, as the ones used in scenario 2, a total of 2400 solar
panels will be needed. Calculations can be checked in Appendix 7.10.13.
In this point, a shadows study has been developed in order to take into account the
influence of the inclination of the solar rays in the worst months of the year (specially the
21st of December). With the data collected and the calculations made (can be
checked in Appendix 7.10.3), it can be observed that a total surface of approximately
15.000 m2 will be needed if we do not want to lose electricity production. It must be
taken into account that this area could be optimized by disposing the solar cells in a
more compact layout in which some loses could appear, although in an insignificant
number.

146
Systems for sustainable energy supply for a small village
Master in European Construction Engineering (2012-2013)
This power installed will produce an output of 517.052 kwh per year. The distribution of
energy output by months, together with the calculations can be checked in the
Appendix 7.10.
The economic considerations regarding price for selling and buying electricity,
especially according to the current Danish regulation, can be checked in scenario 2.
SOCIAL ASPECTS
COMMON INSTALLATION
The plant location will generate people disagreements due to the proximity of the plant
to their house.
The plant construction will affect the surroundings and some services during the
execution phase.
All the security measures shall be taken, in order to prevent any explosions from the
biogas tank (pressurized tank).
HEATING INSTALLATION
The implementation of the district heating plant requires the permission of the local legal
authorities in order to be integrated.
The grants considered for the biogas consumption are included on the price subvention
from the Danish government, this grant ensures a steady price for the biogas on the first
10 years of the installation (see Appendix 7.6).
As far as GSHP installation is concerned, its implementation is positively accepted by the
society although without receiving any grant by the government. (see Appendix 7.6 and
Appendix 7.8)
ELECTRICITY INSTALLATION
The electricity installation regarding wind is very similar to the one in Scenario 2; all
information about social aspects can be found in that section.
For the solar panels, as mentioned in the feasibility study, the energy regulation from
2010 in Denmark (although recently changed to worse economic conditions) made
from solar panels an attractive investment, situation corroborated with the rise in the
number of photovoltaic installation since 2010.
ENVIRONMENTAL ASPECTS
COMMON INSTALLATION
The construction and integration of a district heating plant will imply a visual impact on
the area, considering that an industrial building would represent a strange element on a
zone dominated by traditional architecture.
For this reason, during the design phase of the plant, the integration with the
environment shall represent a critical point.
The placement of the biogas tank will require a specific study, in order to prevent leaks
and affection to nearby dwellings, this installation will require a specific project and
study.

147
Systems for sustainable energy supply for a small village
Master in European Construction Engineering (2012-2013)
All the environmental restrictions have been followed, and are explained in depth on the
(Appendix 7.5) of this report.
HEATING INSTALLATION
As explained in previous section of this report (see Appendix 7.11) and previous reports
(Alberdi Pagola, et al., 2012), the consumption of biofuels as biogas is considered a
neutral balance reaction.
Regarding to GSHP system, it is known that is one of the renewable alternative with less
impact on environment, generating a few amount of CO2 emissions. For further
information see (section 4.2.2)
ELECTRICITY INSTALLATION
The electricity installation regarding wind is very similar to the one in Scenario 2; all
information about environmental aspects can be found in that section.
This scenario does not present any specific situation that may change the considerations
made in the solar cells feasibility study regarding environmental issues.

148
Systems for sustainable energy supply for a small village
Master in European Construction Engineering (2012-2013)
PLANT DESIGN
For the design of the site, many factors have been taken into account:
- The building containing the heating plant needs to be near the road and to the
district heating network
- The Small Wind Turbines have been placed according to the distance criteria
explained before:
o A distance of 25m from the nearest house (South-West) has been
respected
o A maximum distance of 30m from the building has been respected, in
order to take profit of the “net-metering”
- The turbines are west-oriented, to take profit of the prevailing wind direction
- The turbines have been placed in order to try to avoid turbulent wind regimes as
much as possible
- The visual impact of the turbines has been limited by planting trees. This has been
done in all sides except west, the prevailing wind direction; anyway, even the
wind of other directions can be harvested without turbulences, thanks to the
great distance between the trees and the turbines.
Figure 5.4.4_3: Plant design.
Distance of 25 meters from wind turbines to neighbours (for noise impact)
Distance of 30 meters from the building to the turbines (to be considered domestic)
Communication road
Solar photovoltaic panels
Building
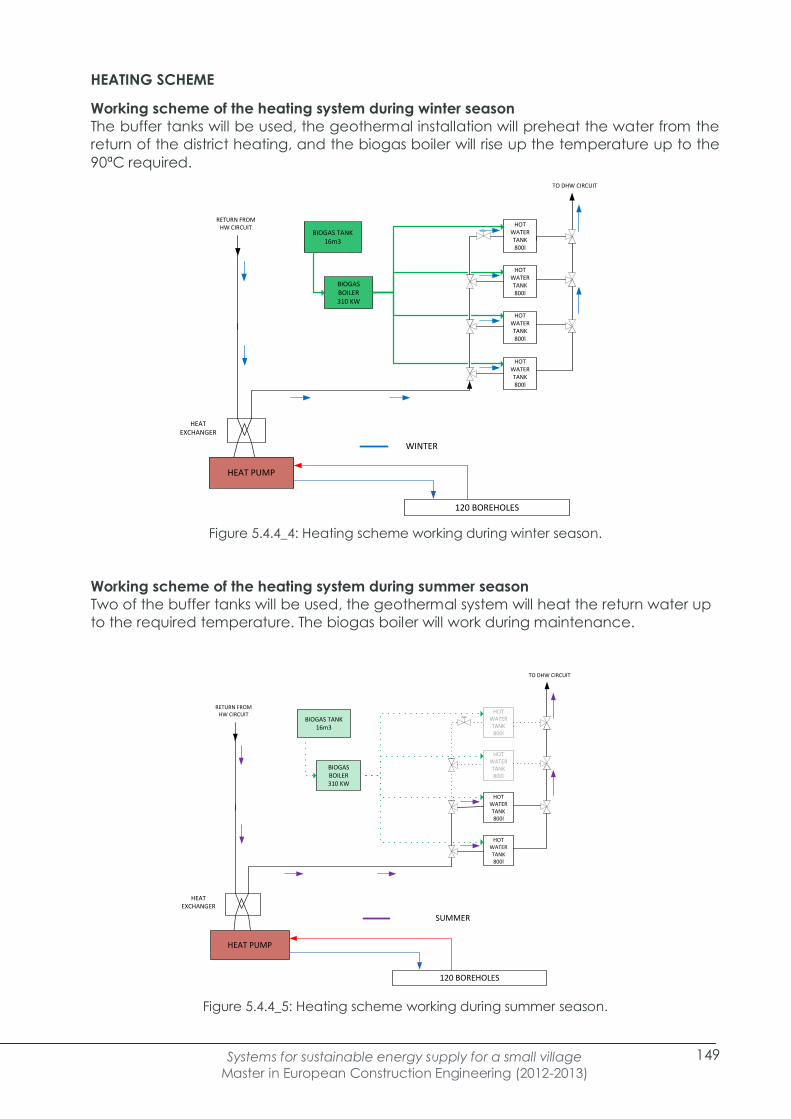
149
Systems for sustainable energy supply for a small village
Master in European Construction Engineering (2012-2013)
HEATING SCHEME
Working scheme of the heating system during winter season
The buffer tanks will be used, the geothermal installation will preheat the water from the
return of the district heating, and the biogas boiler will rise up the temperature up to the
90ªC required.
Figure 5.4.4_4: Heating scheme working during winter season.
Working scheme of the heating system during summer season
Two of the buffer tanks will be used, the geothermal system will heat the return water up
to the required temperature. The biogas boiler will work during maintenance.
Figure 5.4.4_5: Heating scheme working during summer season.
BIOGAS BOILER 310 KW
BIOGAS TANK 16m3
HOT WATER TANK800l
HOT WATER TANK800l
HOT WATER TANK800l
HOT WATER TANK800l
HEAT EXCHANGER
TO DHW CIRCUIT
RETURN FROM HW CIRCUIT
WINTER
HEAT PUMP
120 BOREHOLES
BIOGAS BOILER 310 KW
BIOGAS TANK 16m3
HOT WATER TANK800l
HOT WATER TANK800l
HOT WATER TANK800l
HOT WATER TANK800l
HEAT EXCHANGER
TO DHW CIRCUIT
RETURN FROM HW CIRCUIT
SUMMER
HEAT PUMP
120 BOREHOLES

150
Systems for sustainable energy supply for a small village
Master in European Construction Engineering (2012-2013)
Working scheme of the heating system during spring and autumn season
Two of the buffer tanks will be used, the geothermal system will heat the return water up
to the required temperature. The biogas boiler will work during maintenance and peak
demand periods.
Figure 5.4.4_6: Heating scheme working during spring and autumn season.
ELECTRICITY SCHEME
As can be seen, both systems will be connected with their correspondent controllers and
a smart meter, that will determine the amount of electricity bought and sold for both
solar and wind electricity.
Controller
DC
Solar PV Cells2400 PHOTOVOLTAIC PANELS
600KW
Inverter
Windmill Farm
Smart Meter
Transform Station
CA CA
GRID
Controller
10 WIND TURBINES OF
6KW EACH
Figure 5.4.4_7: Electric scheme.
BIOGAS BOILER 310 KW
BIOGAS TANK 16m3
HOT WATER TANK800l
HOT WATER TANK800l
HOT WATER TANK800l
HOT WATER TANK800l
HEAT EXCHANGER
TO DHW CIRCUIT
RETURN FROM HW CIRCUIT
SPRING & AUTUM
HEAT PUMP
120 BOREHOLES
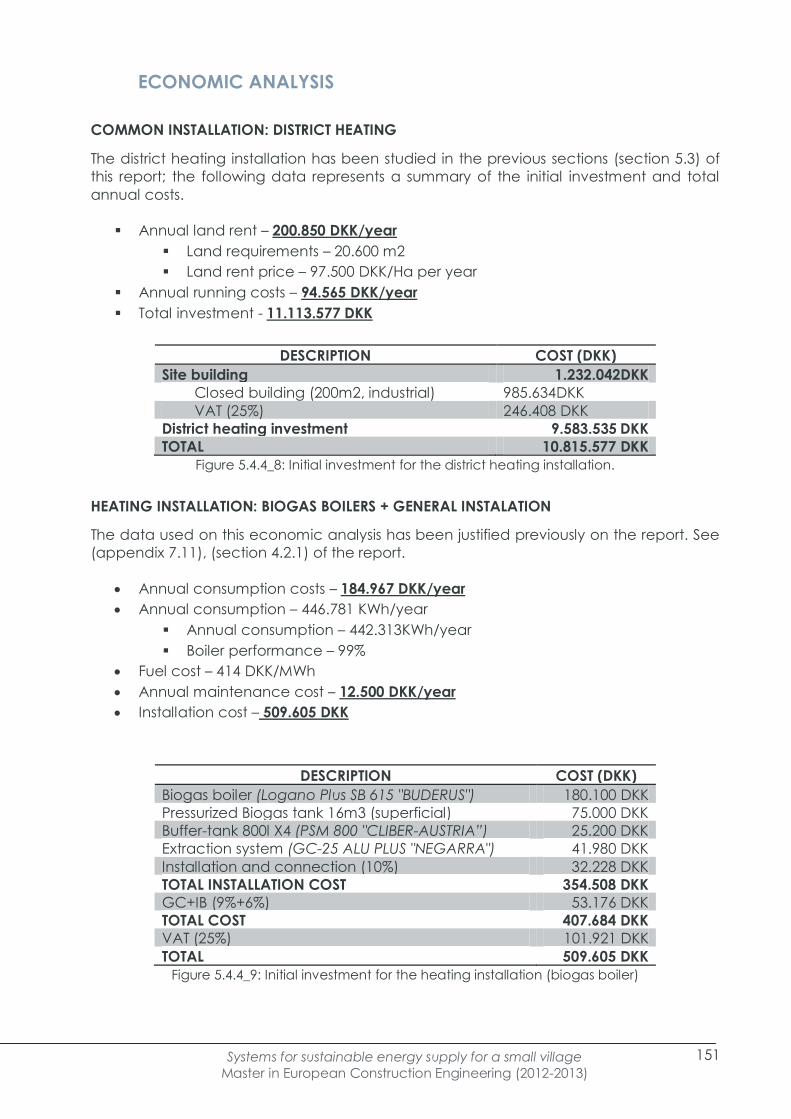
151
Systems for sustainable energy supply for a small village
Master in European Construction Engineering (2012-2013)
ECONOMIC ANALYSIS
COMMON INSTALLATION: DISTRICT HEATING
The district heating installation has been studied in the previous sections (section 5.3) of
this report; the following data represents a summary of the initial investment and total
annual costs.
Annual land rent – 200.850 DKK/year
Land requirements – 20.600 m2
Land rent price – 97.500 DKK/Ha per year
Annual running costs – 94.565 DKK/year
Total investment - 11.113.577 DKK
DESCRIPTION COST (DKK)
Site building 1.232.042DKK
Closed building (200m2, industrial) 985.634DKK
VAT (25%) 246.408 DKK
District heating investment 9.583.535 DKK
TOTAL 10.815.577 DKK
Figure 5.4.4_8: Initial investment for the district heating installation.
HEATING INSTALLATION: BIOGAS BOILERS + GENERAL INSTALATION
The data used on this economic analysis has been justified previously on the report. See
(appendix 7.11), (section 4.2.1) of the report.
Annual consumption costs – 184.967 DKK/year
Annual consumption – 446.781 KWh/year
Annual consumption – 442.313KWh/year
Boiler performance – 99%
Fuel cost – 414 DKK/MWh
Annual maintenance cost – 12.500 DKK/year
Installation cost – 509.605 DKK
DESCRIPTION COST (DKK)
Biogas boiler (Logano Plus SB 615 "BUDERUS") 180.100 DKK
Pressurized Biogas tank 16m3 (superficial) 75.000 DKK
Buffer-tank 800l X4 (PSM 800 "CLIBER-AUSTRIA”) 25.200 DKK
Extraction system (GC-25 ALU PLUS "NEGARRA") 41.980 DKK
Installation and connection (10%) 32.228 DKK
TOTAL INSTALLATION COST 354.508 DKK
GC+IB (9%+6%) 53.176 DKK
TOTAL COST 407.684 DKK
VAT (25%) 101.921 DKK
TOTAL 509.605 DKK
Figure 5.4.4_9: Initial investment for the heating installation (biogas boiler)

152
Systems for sustainable energy supply for a small village
Master in European Construction Engineering (2012-2013)
HEATING INSTALLATION: GEOTHERMAL
DESCRIPTION COST (DKK)
Heat pump 1.500.000 DKK
Boreholes (160) 8.437.500 DKK
Pump and water treatment 74.600 DKK
TOTAL 10.012.100DKK
Figure 5.4.4_10: Initial investment for the heating installation (Geothermal)
ELECTRICITY INSTALLATION
DESCRIPTION COST (DKK)
2400 Solar panels model “Alex-Solar”
monocristlaline 250w
3.980.750 DKK
Inverter 260.574 DKK
Transform station 243.367 DKK
Installation and connection 448.469 DKK
10 Bornay 6000 Turbines (6kW) 1.266.087 DKK
Aurora 6kW inverter 180.869 DKK
Installation and connection 361.739 DKK
TOTAL INSTALLATION COST 2.868.293 DKK
GC+IB (9%+6%) 543.846 DKK
TOTAL COST 4.169.488 DKK
VAT (25%) 1.042.372 DKK
TOTAL 9.691.420 DKK
Figure 5.4.4_11: Initial investment for the electricity installation.
COMMON SOLUTION SUMMARY
Initial investment
DESCRIPTION COST (DKK) COST PER USER(DKK)
DISTRICT HEATING 10.815.577 DKK 152.332 DKK
HEATING INSTALLATION
Biogas boilers + main inst. 509.605 DKK 7.178 DKK
GSHP system 10.012.100 DKK 141.015 DKK
ELECTRICITY INSTALLATION
Solar panels 7.091.420 DKK 101.306 DKK
Windmills 2.600.000 DKK 37.143 DKK
TOTAL 31.028.702 DKK 438.974 DKK
Figure 5.4.4_12: Initial investment for the common solution
Annual running costs
DESCRIPTION COST (DKK) COST PER USER(DKK)
COMMON INSTALLATION
Land renting 200.850 DKK 2.829 DKK
DISTRICT HEATING
Annual costs 94.565 DKK 1.331 DKK
HEATING INSTALLATION
Biogas boilers + main inst.
Annual consumption 184.967 DKK 2.605 DKK

153
Systems for sustainable energy supply for a small village
Master in European Construction Engineering (2012-2013)
Maintenance costs 12.500 DKK 176 DKK
Geothermal installation
Annual consumption 21.531 DKK 10.526 DKK
Maintenance costs 10.000 DKK 4.420 DKK
ELECTRICITY INSTALLATION
Solar panels
Annual costs 372.500 DKK 5.321 DKK
Windmills
Annual costs 52.000 DKK 743 DKK
TOTAL 748.063 DKK 10.536 DKK
Figure 5.4.4_13: Annual running costs for the common solution.
Annual production benefits
DESCRIPTION COST (DKK) COST PER USER(DKK)
HEATING INSTALLATION
Potential savings *2.110.191 DKK *29.721 DKK
ELECTRICITY INSTALLATION
Potential savings **693.000 DKK **9.900 DKK
TOTAL 2.803.191 DKK 39.621 DKK * A yearly variation for the heating costs with traditional fuels of +3.00% is considered.
** A yearly variation for the electricity costs of +3.00% is considered.
Figure 5.4.4_14: Annual production incomes to the common solution.

154
Systems for sustainable energy supply for a small village
Master in European Construction Engineering (2012-2013)
CONCLUSION
INDICATORS
The following economic indicators referred to the investment have been selected in
order to compare all the scenarios proposed on the conclusion section of this report (see
section 6.1).
INDICATOR VALUE
Initial investment 438.974 DKK
Loan period 16 Years
Break-even point - Years
Profit 10 years -205.114 DKK
Profit 20 years -160.418 DKK
Profitability 10 years -47.6 %
Profitability 10 years -36.5 %
Figure 5.4.4_15: Cash-Flow indicators.
GRAPHICS
The following graphics represent the evolution of the investment during the life period of
the system.
Figure 5.4.4_16: Cash-Flow graph

155
Systems for sustainable energy supply for a small village
Master in European Construction Engineering (2012-2013)
5.4.5. SCENARIO 5: BIOGAS BOILER WITH
SOLAR THERMAL AND SWT
INTRODUCTION
On this scenario the feasibility of the implementation of a district heating solution
combined with a mixed electricity generation system will be studied. This solution will
consist on the following installations:
- A district heating installation for the 71 houses proposed, this installation has been
studied in the section 5.3 of this report.
- The heat production will be supplied by an integrated system between a biogas
boiler and a solar thermal installation. The solar system is designed to provide
enough heat for the summer period, while during the winter the biogas boiler will
provide the energy to the system. During the transition periods both systems will
work together, the solar system will preheat the return flux from the district heating
and the biogas boiler will provide the rest.
The solar thermal installation will work from February to October, supplying all the
energetic requirements from April to September; the biogas boilers will backup
the system if necessary.
- The electricity production will be supplied by Small Wind Turbines; this solution will
provide the 47% circa of electricity requirements.
JUSTIFICATION
TECHNICAL CONSIDERATIONS
COMMON INSTALLATION
The main considerations taken on the whole installation refer to the district heating
distribution net, all these considerations have been explained previously on this report
section 5.3, section 4.1.
The considerations taken respecting the design of the plant are concerning the main
volumes of building needed. As on this case the heating installation will require:
- A closed construction of 200m2 where the heating plant, district heating pumps
and communications will be installed.
- The installation and placement of the biogas tank, this tank will be placed
horizontally on the exterior as a precaution against gas leaks. It has been located
close to the building in order to reduce the gas pipe length.
The requirements concerning the solar thermal installation are related to the area where
the thermal panels will be installed. The best place for this installation is the roof of the
building, as it will suppose the shortest path for the piping and thus, the least losses in
heat. Anyway, as our building has 200 m2, the installation will be divided between roof
and ground. With these conditions we will have:
- A surface of approximately 260 m2 is needed according to the calculation that
has been done. Consequently, half of it will be placed in the roof and the other
half on the ground (approximately).
- The accumulation tank for water will be placed inside the building.
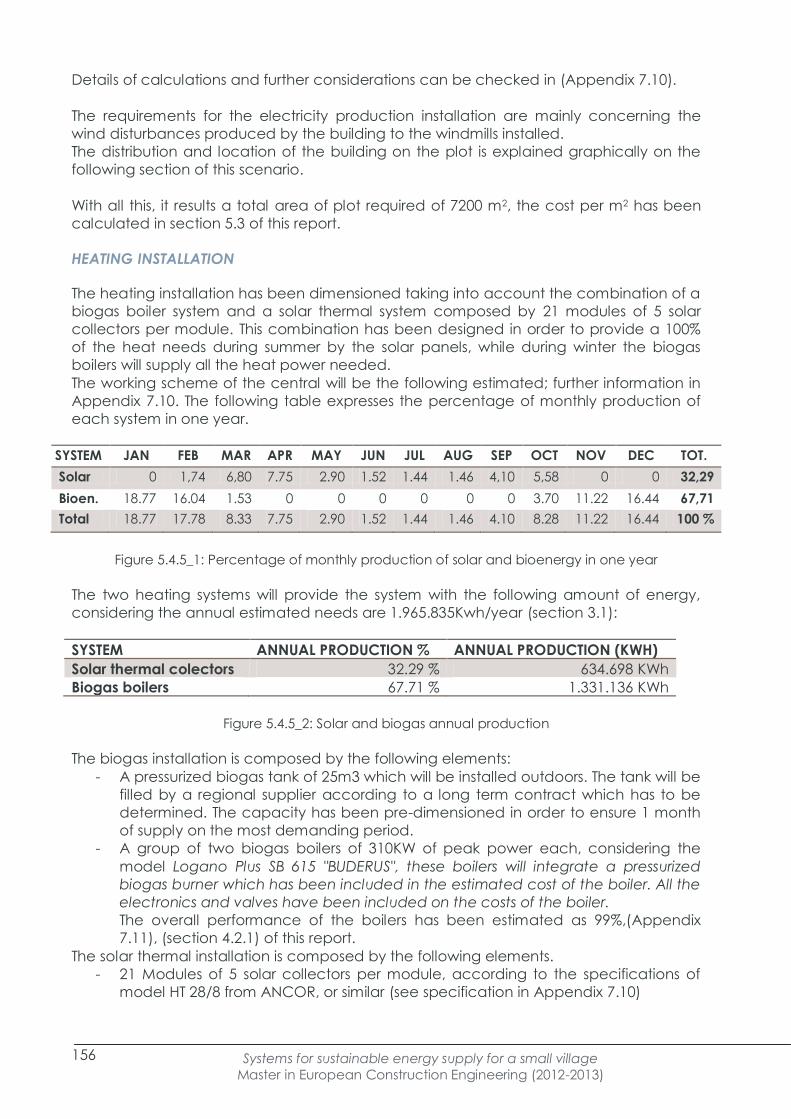
156
Systems for sustainable energy supply for a small village
Master in European Construction Engineering (2012-2013)
Details of calculations and further considerations can be checked in (Appendix 7.10).
The requirements for the electricity production installation are mainly concerning the
wind disturbances produced by the building to the windmills installed.
The distribution and location of the building on the plot is explained graphically on the
following section of this scenario.
With all this, it results a total area of plot required of 7200 m2, the cost per m2 has been
calculated in section 5.3 of this report.
HEATING INSTALLATION
The heating installation has been dimensioned taking into account the combination of a
biogas boiler system and a solar thermal system composed by 21 modules of 5 solar
collectors per module. This combination has been designed in order to provide a 100%
of the heat needs during summer by the solar panels, while during winter the biogas
boilers will supply all the heat power needed.
The working scheme of the central will be the following estimated; further information in
Appendix 7.10. The following table expresses the percentage of monthly production of
each system in one year.
SYSTEM JAN FEB MAR APR MAY JUN JUL AUG SEP OCT NOV DEC TOT.
Solar 0 1,74 6,80 7.75 2.90 1.52 1.44 1.46 4,10 5,58 0 0 32,29
Bioen. 18.77 16.04 1.53 0 0 0 0 0 0 3.70 11.22 16.44 67,71
Total 18.77 17.78 8.33 7.75 2.90 1.52 1.44 1.46 4.10 8.28 11.22 16.44 100 %
Figure 5.4.5_1: Percentage of monthly production of solar and bioenergy in one year
The two heating systems will provide the system with the following amount of energy,
considering the annual estimated needs are 1.965.835Kwh/year (section 3.1):
SYSTEM ANNUAL PRODUCTION % ANNUAL PRODUCTION (KWH)
Solar thermal colectors 32.29 % 634.698 KWh
Biogas boilers 67.71 % 1.331.136 KWh
Figure 5.4.5_2: Solar and biogas annual production
The biogas installation is composed by the following elements:
- A pressurized biogas tank of 25m3 which will be installed outdoors. The tank will be
filled by a regional supplier according to a long term contract which has to be
determined. The capacity has been pre-dimensioned in order to ensure 1 month
of supply on the most demanding period.
- A group of two biogas boilers of 310KW of peak power each, considering the
model Logano Plus SB 615 "BUDERUS", these boilers will integrate a pressurized
biogas burner which has been included in the estimated cost of the boiler. All the
electronics and valves have been included on the costs of the boiler.
The overall performance of the boilers has been estimated as 99%,(Appendix
7.11), (section 4.2.1) of this report.
The solar thermal installation is composed by the following elements.
- 21 Modules of 5 solar collectors per module, according to the specifications of
model HT 28/8 from ANCOR, or similar (see specification in Appendix 7.10)

157
Systems for sustainable energy supply for a small village
Master in European Construction Engineering (2012-2013)
- A storage tank of 800l, considering the model PSM 800 "CLIBER-AUSTRIA” that will
perform the heat exchange between the solar circuit and the district heating
circuit. It will be displayed as shown in the working scheme.
- Control systems, piping, pumps, etc.
The common installation is composed by the following elements:
- A heat storage system composed by 4 buffer tanks of 800l, considering the model
PSM 800 "CLIBER-AUSTRIA”.
The mission of these elements in this solution is to provide enough thermal lag to the
system in order to reduce start-stops on the boilers improving the efficiency. Also,
during the summer period will help to store enough heat to compensate cloudy
periods of 1-3 days without solar production preventing the starting of the boilers.
The connection of the tanks will be done on parallel permitting the modularity of the
storage, so it will adapt easily to the demand of the different seasons (eg. During
winter all the buffer tanks will work, also during summer all of them will be opened to
store the maximum amount of “free” energy, during transition periods two of the
tanks will be closed as just one of the boilers will be operating).
- All the installation will be controlled by a central computer; this device will receive
data from all the thermal sensors installed on the elements of the internal installation,
the measures of the flow in the system and the external temperature. Using this data
the software will control the boiler, pumps and valves in order to optimize the
performance of the system.
This system has been considered into the cost of the installation of the boiler.
- All the piping system, including the valves, electro-valves, pumps and connections is
considered as a part of the installation, which has been estimated as a percentage
of the total costs.
ELECTRICITY INSTALLATION
The technical aspect of the electricity installation can be found in the Scenario 2, in the
section “Technical consideration-Electricity installation”. In this case, the electricity will be
only supplied thanks to the wind turbines.
The maximum number of turbines that can be placed in the area without a detailed
urban planning approved by the authorities is 10. Installing further turbines would require
great efforts in terms of policies, agreements and, furthermore, would be economically
less profitable, because it would be impossible to take profit of the “net-metering
policy”.
Whit this number of turbines, it is only possible to supply the 47% circa (147300 kWh/year)
of the total electricity needs.
SOCIAL ASPECTS
COMMON INSTALLATION
The plant location will generate people disagreements due to the proximity of the plant
to their house.
The plant construction will affect the surroundings and some services during the
execution phase.
All the security measures shall be taken, in order to prevent any explosions from the
biogas tank (pressurized tank).

158
Systems for sustainable energy supply for a small village
Master in European Construction Engineering (2012-2013)
HEATING INSTALLATION
The implementation of the straw boiler requires the permission of the local legal
authorities in order to integrate the district heating net.
The grants considered for the biogas consumption are included on the price subvention
from the Danish government, this grant ensures a steady price for the biogas on the first
10 years of the installation (see Appendix 7.6).
Regarding solar energy, there are no grants coming from the Danish government,
although there is the possibility of applying for European funds.
ELECTRICITY INSTALLATION
The electricity installation is very similar to the one in Scenario 2; all information about
social aspects can be found in that section.
ENVIRONMENTAL ASPECTS
COMMON INSTALLATION
The construction and integration of a district heating plant will imply a visual impact on
the area, considering that an industrial building would represent a strange element on a
zone dominated by traditional architecture.
For this reason, during the design phase of the plant, the integration with the
environment shall represent a critical point.
The placement of the biogas tank will require a specific study, in order to prevent leaks
and affection to nearby dwellings; this installation will require an specific project and
study.
All the environmental restrictions have been followed, and are explained in depth on the
(Appendix 7.5) of this report.
HEATING INSTALLATION
As explained in previous section of this report (see Appendix 7.11) and the first term
report (Alberdi, et al., 2012), the consumption of biofuels as biogas is considered a
neutral balance reaction.
Similar considerations can be made to solar thermal systems, as explained in the same
report (Alberdi, et al., 2012).
ELECTRICITY INSTALLATION
The electricity installation is very similar to the one in Scenario 2; all information about
environmental aspects can be found in that section.

159
Systems for sustainable energy supply for a small village
Master in European Construction Engineering (2012-2013)
PLANT DESIGN
For the design of the site, many factors have been taken into account:
- The building containing the heating plant needs to be near the road and to the
district heating network
- The Small Wind Turbines have been placed according to the distance criteria
explained before:
o A distance of 25m from the nearest house (South-West) has been
respected
o A maximum distance of 30m from the building has been respected, in
order to take profit of the “net-metering”
- The turbines are west-oriented, to take profit of the prevailing wind direction
- The turbines have been placed in order to try to avoid turbulent wind regimes as
much as possible
- The visual impact of the turbines has been limited by planting trees. This has been
done in all sides except west, the prevailing wind direction; anyway, even the
wind of other directions can be harvested without turbulences, thanks to the
great distance between the trees and the turbines.
Figure 5.4.5_3: Plant design
Distance of 25 meters from wind turbines to neighbours (for noise impact)
Distance of 30 meters from the building to the turbines (to be considered domestic)
Communication road
Solar thermal collectors
Building

160
Systems for sustainable energy supply for a small village
Master in European Construction Engineering (2012-2013)
HEATING SCHEME
Working scheme of the heating system during winter season
The buffer tanks will be used powered by the two biogas boilers, considering the
estimations studied the solar thermal system will not work as the temperature generated
will hardly reach the 60ºC needed by the system.
BIOGAS BOILER310 KW
BIOGAS BOILER 310 KW
BIOGAS TANK 25m3
HOT WATER TANK800l
HOT WATER TANK800l
HOT WATER TANK800l
HOT WATER TANK800l
SOLAR
HEAT EXCHANGER
TO DHW CIRCUIT
RETURN FROM HW CIRCUIT
WINTER
Figure 5.4.5_4: Heating scheme operating in winter
Working scheme of the heating system during spring and autumn seasons
Two of the buffer tanks will be used, supplied by one of the biogas boilers, the solar
heating installation will preheat the return water from the circuit when the temperature
of the solar circuit reaches the necessary level. The system is studied considering the
possibility of having the boilers working, the solar installation or both together, depending
on the conditions.
BIOGAS BOILER310 KW
BIOGAS BOILER 310 KW
BIOGAS TANK 25m3
HOT WATER TANK800l
HOT WATER TANK800l
HOT WATER TANK800l
HOT WATER TANK800l
HEAT EXCHANGER
TO DHW CIRCUIT
SPRING & AUTUMN
Solar collectors260m2
Figure 5.4.5_5: Heating scheme operating in spring and autumn

161
Systems for sustainable energy supply for a small village
Master in European Construction Engineering (2012-2013)
Working scheme of the heating system during summer season
The four buffer tanks will operate simultaneously, powered by the solar panels. During this
season is estimated that considering the thermal lag gained by the buffer tanks the
installation would be able to work just using solar energy.
The biogas boilers would be used as a backup system when maintenance or if needed.
BIOGAS BOILER310 KW
BIOGAS BOILER 310 KW
BIOGAS TANK 25m3
HOT WATER TANK800l
HOT WATER TANK800l
HOT WATER TANK800l
HOT WATER TANK800l
TO DHW CIRCUIT
SUMMER
Solar collectors260m2
HEAT EXCHANGER
Figure 5.4.5_6: Heating scheme operating in summer
ELECTRICITY SCHEME
The following scheme represents the basic elements which are part of the electricity
generation installation.
Controller
Windmill Farm
Smart Meter
Transform Station
CA
GRID
CA
10 Turbines of 6kw
Figure 5.4.5_7: Electricity scheme

162
Systems for sustainable energy supply for a small village
Master in European Construction Engineering (2012-2013)
ECONOMIC ANALYSIS
COMMON INSTALLATION: DISTRICT HEATING
The district heating installation has been studied in the previous sections (section 5.3) of
this report; the following data represents a summary of the initial investment and total
annual costs.
Annual land rent – 70.200 DKK/year
Land requirements – 7.200 m2
Land rent price – 97.500 DKK/Ha per year
Annual running costs – 94.565 DKK/year
Total investment - 10.815.577 DKK
DESCRIPTION COST (DKK)
Site building 1.232.042DKK
Closed building (200m2, industrial) 985.634DKK
VAT (25%) 246.408 DKK
District heating investment 9.583.535 DKK
TOTAL 10.815.577 DKK
Figure 5.4.5_8: Initial investment for the common district heating installation
HEATING INSTALLATION: BIOGAS BOILERS + GENERAL INSTALATION
The data used on this economic analysis has been justified previously on the report. See
(appendix 7.11), (section 4.2.1) of the report.
Annual consumption costs – 556.657 DKK/year (0.00% annual variation)
Annual consumption – 1.344.582 KWh/year
Annual needs – 1.331.136 KWh/year
Boiler performance – 99%
Fuel cost – 414 DKK/MWh
Annual maintenance cost – 12.500 DKK/year
Installation cost – 912.981 DKK
DESCRIPTION COST (DKK)
Biogas boiler X2 (Logano Plus SB 615 "BUDERUS") 360.200 DKK
Pressurized Biogas tank 25m3 (superficial) 150.000 DKK
Buffer-tank 800l X4 (PSM 800 "CLIBER-AUSTRIA”) 25.200 DKK
Extraction system (GC-25 ALU PLUS "NEGARRA") 41.980 DKK
Installation and connection (10%) 57.738 DKK
TOTAL INSTALLATION COST 635.118 DKK
GC+IB (9%+6%) 95.267 DKK
TOTAL COST 730.385 DKK
VAT (25%) 182.596 DKK
TOTAL 912.981 DKK
Figure 5.4.5_9: Heating installation cost for the biogas boiler

163
Systems for sustainable energy supply for a small village
Master in European Construction Engineering (2012-2013)
HEATING INSTALLATION: SOLAR
DESCRIPTION COST (DKK)
21 modules of solar colectors “ARCON” HT 28/8 625.800 DKK
Buffer-tank 800l (PSM 800 "CLIBER-AUSTRIA”) 6.300 DKK
Installation, control system and connection (25%) 158.025 DKK
TOTAL INSTALLATION COST 790.125 DKK
GC+IB (9%+6%) 118.518 DKK
TOTAL COST 908.643 DKK
VAT (25%) 227.160 DKK
TOTAL 1.135.803 DKK
Figure 5.4.5_10: Heating installation cost for the solar thermal
ELECTRICITY INSTALLATION
DESCRIPTION COST (DKK)
10 Bornay 6000 Turbines (6 kW) 1.266.087 DKK
Aurora 6 kW inverters 180.869 DKK
Installation and connection (20%) 361.739 DKK
TOTAL INSTALLATION COST 1.808.695 DKK
GC+IB (9%+6%) 271.305 DKK
TOTAL COST 2.080.000 DKK
VAT (25%) 520.000 DKK
TOTAL 2.600.000 DKK
Figure 5.4.5_11: Electricity installation cost
COMMON SOLUTION SUMMARY
Initial investment
DESCRIPTION COST (DKK) COST PER USER(DKK)
DISTRICT HEATING 10.815.577 DKK 152.332 DKK
HEATING INSTALLATION
Biogas boilers + main inst. 912.981 DKK 12.859 DKK
Solar thermal panels 1.135.803 DKK 15.997 DKK
ELECTRICITY INSTALLATION
Windmills 2.600.000 DKK 36.620 DKK
TOTAL 15.464.361 DKK 217.808 DKK
Figure 5.4.5_12: Initial investment for the common solution

164
Systems for sustainable energy supply for a small village
Master in European Construction Engineering (2012-2013)
Annual running cost
DESCRIPTION COST (DKK) COST PER USER(DKK)
COMMON INSTALLATION
Land renting 70.200 DKK 988 DKK
DISTRICT HEATING
Annual costs 94.565 DKK 1.332 DKK
HEATING INSTALLATION
Biogas boilers + main inst.
Annual consumption 556.657 DKK 7.840 DKK
Maintenance costs 12.500 DKK 176 DKK
Solar thermal panels
Maintenance costs 22.350 DKK 315 DKK
ELECTRICITY INSTALLATION
Windmills
Annual costs 52.000 DKK 743 DKK
TOTAL 808.272 DKK 11.394 DKK
Figure 5.4.5_13: Annual running cost for the common solution
Annual production benefits
DESCRIPTION COST (DKK) COST PER USER(DKK)
HEATING INSTALLATION
Potential savings *2.110.191 DKK *29.721 DKK
ELECTRICITY INSTALLATION
Windmills
Electricity production **693.000 DKK **9.900 DKK
TOTAL 2.803.190 DKK 39.621 DKK * A yearly variation for the heating costs with traditional fuels of +3.00% is considered.
** A yearly variation for the electricity costs of +3.00% is considered.
Figure 5.4.5_14: Annual production benefits for the common solution

165
Systems for sustainable energy supply for a small village
Master in European Construction Engineering (2012-2013)
CONCLUSION
INDICATORS
The following economic indicators referred to the investment have been selected in
order to compare all the scenarios proposed on the conclusion section of this report (see
section 6.1).
INDICATOR VALUE
Initial investment 217.808 DKK
Loan period 7 Years
Break-even point 9 Years
Profit 10 years 48.916 DKK
Profit 20 years 471.598 DKK
Profitability 10 years 22.4 %
Profitability 10 years 216.5 %
Figure 5.4.5_15: Cash-flow indicators
GRAPHICS
The following graphics represent the evolution of the investment during the life period of
the system.
Figure 5.4.5_16: Cash-flow graph

166
Systems for sustainable energy supply for a small village
Master in European Construction Engineering (2012-2013)
5.4.6. SCENARIOS CONCLUSIONS
The following chart represents the indicators analyzed as a conclusion for the study if the
five scenarios proposed
INDICATOR SCENARIO 1 SCENARIO 2 SCENARIO 3 SCENARIO 4 SCENARIO 5
Initial investment 690.418 DKK 289.057 DKK 276.320 DKK 438.974 DKK 217.808 DKK
Loan period 20 Years 10 Years 12 Years 16 Years 7 Years
Break-even point 12 Years 9 Years 3,5 Years - Years 9 Years
Profit 10 years -21.847 DKK 28.980 DKK 107.817 DKK -205.114 DKK 48.916 DKK
Profit 20 years 276.996 DKK 485.986 DKK 586.884DKK -160.418 DKK 471.598 DKK
Profitability 10 years -3.2% 10% 39% -47.6 % 22.4 %
Profitability 10 years 40.1% 168% 212,4% -36.5 % 216.5 %
Figure 5.4.6_1: Indicators summary from scenarios cash-flow
The following graphic represents the curves of the compound cash-flow of all the
investments:
Figure 5.4.6_2: Compound cash-flow for all the scenarios

167
Systems for sustainable energy supply for a small village
Master in European Construction Engineering (2012-2013)
6. CONCLUSION

168
Systems for sustainable energy supply for a small village
Master in European Construction Engineering (2012-2013)
6.1 CONCLUSION
INTRODUCTION
The analysis has been done comparing on the one hand heating solutions and on the
other hand electricity solutions (taking into account individual and collective ones, and
making a brief analysis of the different solutions). Besides, the studied scenarios have
been compared between them, in order to find the most profitable option for supplying
heating and electricity for Føns commune. Moreover, a comparison between all the
studied solutions has been done. Finally, an analysis of insulation solutions has been
done, and final recommendations have been given based on the project authors’
criteria.
For the analysis the benchmarking method has been used, giving punctuation from
100% to 0%, being 100% the one with better marks in each indicator and 0% the worst
one.
The indicators used for this purpose are: initial investment (DKK), loan period (years),
break-even point (years), profit 10 years (DKK), profit 20 years (DKK), profitability 10 years
(%), profitability 20 years (%).
HEATING SOLUTIONS
In the feasibility study of the present project different heating solutions have been
studied, considering collective and individual solutions. The analyzed solutions are:
district heating woodchips, district heating straw, district biogas and district borehole
storage as collective solutions; and pellet boiler, tank storage, borehole storage and
borehole no storage as individual solutions.
INDICATORS AND BENCHMARKING
On the following chart, the summary of the indicators and benchmark of the heating
solutions studied are shown:
SOLUTION
COLLECTIVE SOLUTIONS INDIVIDUAL SOLUTIONS
D.H. Woodchips
D.H. Straw
DH. Biogas
DH. Borehole Storage
Pellet boiler
Tank storage
Borehole storage
Borehole no storage
Initial investment (DKK)
124562 102662 57931 248362 176669 198278 267864 224763
Benchmark 68% 79% 100% 9% 43% 33% 0% 21%
Loan period (years)
6 5 2 13 9 10 14 11
Benchmark 67% 75% 100% 8% 42% 33% 0% 25%
Break-even point (years)
4 4 4 16 8 14 19 20
Benchmark 100% 100% 100% 25% 75% 38% 6% 0%
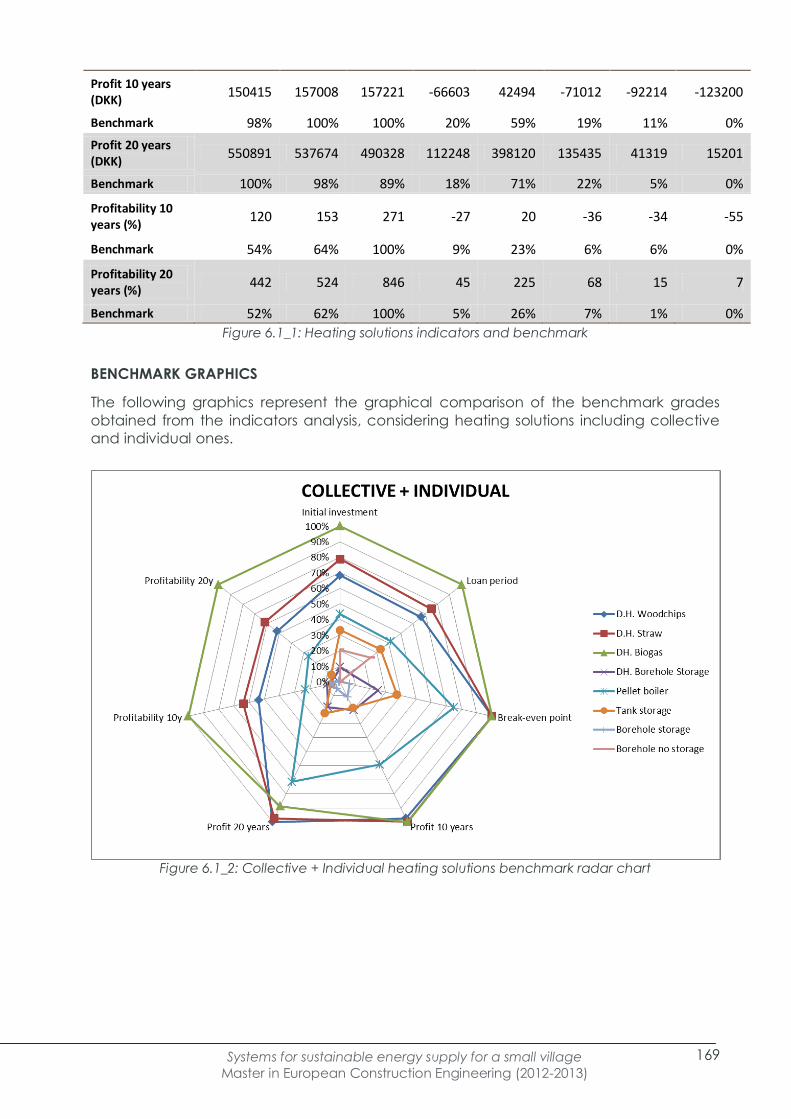
169
Systems for sustainable energy supply for a small village
Master in European Construction Engineering (2012-2013)
Profit 10 years (DKK)
150415 157008 157221 -66603 42494 -71012 -92214 -123200
Benchmark 98% 100% 100% 20% 59% 19% 11% 0%
Profit 20 years (DKK)
550891 537674 490328 112248 398120 135435 41319 15201
Benchmark 100% 98% 89% 18% 71% 22% 5% 0%
Profitability 10 years (%)
120 153 271 -27 20 -36 -34 -55
Benchmark 54% 64% 100% 9% 23% 6% 6% 0%
Profitability 20 years (%)
442 524 846 45 225 68 15 7
Benchmark 52% 62% 100% 5% 26% 7% 1% 0%
Figure 6.1_1: Heating solutions indicators and benchmark
BENCHMARK GRAPHICS
The following graphics represent the graphical comparison of the benchmark grades
obtained from the indicators analysis, considering heating solutions including collective
and individual ones.
Figure 6.1_2: Collective + Individual heating solutions benchmark radar chart
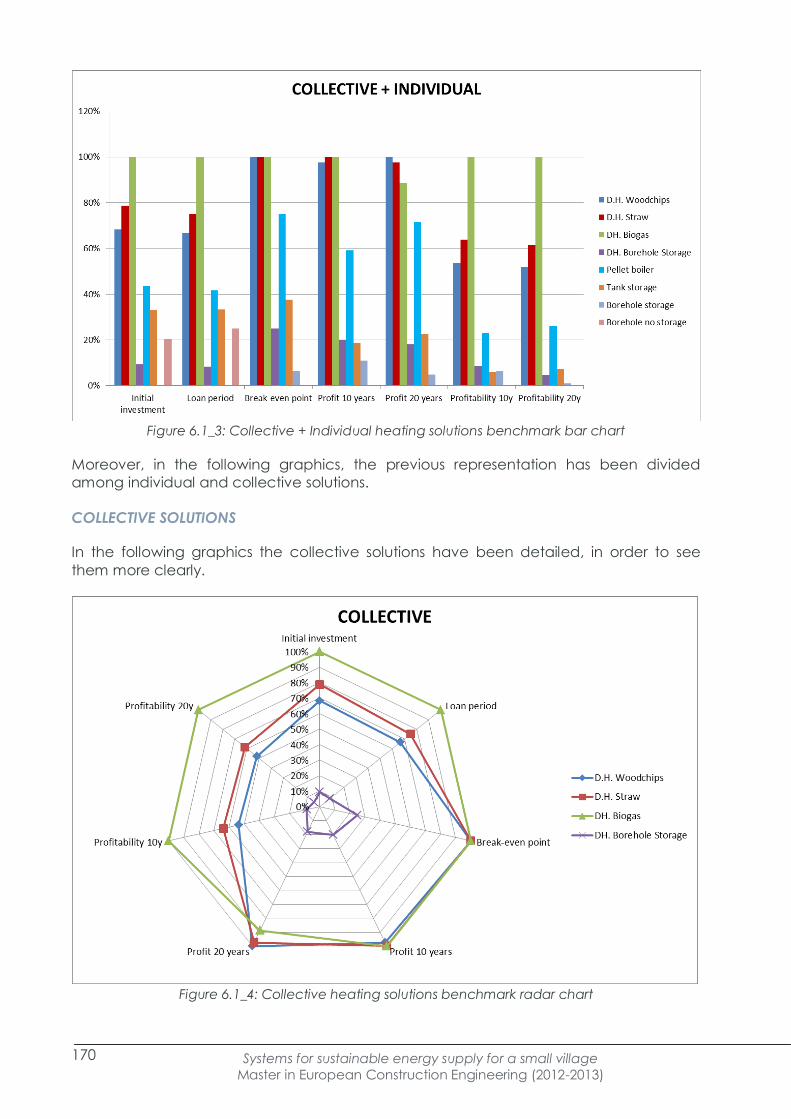
170
Systems for sustainable energy supply for a small village
Master in European Construction Engineering (2012-2013)
Figure 6.1_3: Collective + Individual heating solutions benchmark bar chart
Moreover, in the following graphics, the previous representation has been divided
among individual and collective solutions.
COLLECTIVE SOLUTIONS
In the following graphics the collective solutions have been detailed, in order to see
them more clearly.
Figure 6.1_4: Collective heating solutions benchmark radar chart

171
Systems for sustainable energy supply for a small village
Master in European Construction Engineering (2012-2013)
Figure 6.1_5: Collective heating solutions benchmark bar chart
INDIVIDUAL SOLUTIONS
In the following graphics the individual solutions have been isolated to appreciate in
more detail the differences between them.
Figure 6.1_6: Individual heating solutions benchmark radar chart

172
Systems for sustainable energy supply for a small village
Master in European Construction Engineering (2012-2013)
Figure 6.1_7: Individual heating solutions benchmark bar chart
ANALYSIS
GENERAL ANALYSIS
As it can be seen in the graphics, most of the collective solutions raise better marks than
the individual ones.
It could be said that the most feasible and profitable option is the collective district
heating by using biogas, followed by collective district heating using straw and
woodchips which have close values. Then the most suitable individual solution is the
pellet boiler followed by the tank storage.
Finally, it could be said that the less suitable solutions are collective district heating by
using borehole storage and individual borehole without storage.
CONCLUSION
As the main conclusions achieved from the study of the heating solutions it could be
asserted that:
- Collective solutions represent a better option than individual solutions. Implying a
lower initial investment per user, and providing a higher overall profitability.
- Solutions based on ground source heating reach lower marks on the overall
analysis. The main factors responsible for these results are the high initial
investment required and the high running costs of the system.
- The biogas district heating solution represents the most interesting option,
reaching the highest benchmarks in all the parameters except the profit at 20
years.
- The straw district heating option could be considered the second best solution,
followed by the woodchips plant. These two solutions gather an average initial
investment per user.

173
Systems for sustainable energy supply for a small village
Master in European Construction Engineering (2012-2013)
ELECTRICITY PRODUCTION SOLUTIONS
In the feasibility study of the present project, different solutions for supplying electricity
have been studied, considering collective and individual solutions. The analyzed
solutions are: two options of solar collective and a wind turbine as collective solutions;
and solar and small wind turbine as individual solutions.
INDICATORS AND BENCHMARKING
On the following chart, the summary of the indicators and benchmark of the heating
solutions studied are shown:
SOLUTION
COLLECTIVE SOLUTIONS INDIVIDUAL SOLUTIONS
Solar Collective 350kW
Solar Collective
450kW
Wind Turbine
Solar Individual 5kW
Small Wind turbines
Initial investment (DKK)
62251 75919 346478 82.350 260000
Benchmark 100% 95% 0% 93% 30%
Loan period (years)
2 2 18 3 13
Benchmark 100% 100% 0% 94% 31%
Break-even point (years)
8 8 2 11 4
Benchmark 33% 33% 100% 0% 78%
Profit 10 years (DKK)
21242 35812 143461 -3272 73187
Benchmark 17% 27% 100% 0% 52%
Profit 20 years (DKK)
96832 123892 540676 72313 459929
Benchmark 5% 11% 100% 0% 83%
Profitability 10 years (%)
34 47 41 -4 28
Benchmark 75% 100% 88% 0% 63%
Profitability 20 years (%)
156 163 156 88 177
Benchmark 76% 84% 76% 0% 100%
Figure 6.1_8: Electricity solutions indicators and benchmark
BENCHMARK GRAPHICS
The following graphics represent the graphical comparison of the benchmark grades
obtained from the indicators analysis.
The graphic representation has been divided among individual and collective solutions,
for electricity supply.

174
Systems for sustainable energy supply for a small village
Master in European Construction Engineering (2012-2013)
Figure 6.1_9: Collective + Individual electricity solutions benchmark radar chart
Figure 6.1_10: Collective + Individual electricity solutions benchmark bar chart
COLLECTIVE SOLUTIONS
In the following graphics the collective solutions have been detailed, in order to see
them more clearly.

175
Systems for sustainable energy supply for a small village
Master in European Construction Engineering (2012-2013)
Figure 6.1_11: Collective electricity solutions benchmark radar chart
Figure 6.1_12: Collective electricity solutions benchmark bar chart

176
Systems for sustainable energy supply for a small village
Master in European Construction Engineering (2012-2013)
INDIVIDUAL SOLUTIONS
In the following graphics the individual solutions have been isolated to appreciate in
more detail the differences between them.
Figure 6.1_13: Individual electricity solutions benchmark radar chart
Figure 6.1_14: Individual electricity solutions benchmark bar chart

177
Systems for sustainable energy supply for a small village
Master in European Construction Engineering (2012-2013)
ANALYSIS
GENERAL ANALYSIS
In contrast to the heating solutions analysis, in the case of the electricity analysis there
are no solutions which clear reach the best marks in all the indicators. In this case, there
are some solutions with high initial investments and longer loan period such as the
solutions of the wind turbines but with good break-even point, and good profit.
Whereas the solar solutions have lower initial investment and shorter loan period but their
break-even point and profit is lower than the wind ones.
On the other hand, the profitability values are more homogeneous between solar and
wind solutions because they depend on the initial investment and the profit.
CONCLUSION
- Wind turbine solution is the one with highest profit, and an acceptable profitability
(but not the best)
- The solar collective 450 kW, is the investment with the greatest long term and
medium term profitability, being also one of the ones with lowest initial investment,
and shorter loan period. So it could be said that is one of the most safeties
electricity solutions.
- The small wind turbine, which is the one with highest long term profitability and
with average medium term profitability. It could be considered the best option if
only individual solutions were considered, but not the best if collective solutions
are taken into account.
COMBINED SOLUTIONS
Based on the results of the feasibility study developed on this project, some solutions
were selected to be applied in combined scenarios. The aim of these scenarios was to
highlight the most profitable energetic solution for Føns commune.
The considered scenarios are the following:
- Scenario 1 – Ground source district heating + high capacity windmill.
- Scenario 2 – Straw boiler district heating + Photovoltaic and small wind turbines.
- Scenario 3 – CHP woodchips district heating and electric plant.
- Scenario 4 – Ground source district heating with biogas backing + Small wind
turbines and photovoltaic panels.
- Scenario 5- Biogas boiler district heating with solar thermal backing + Small wind
turbines.
INDICATORS AND BENCHMARKING
On the following chart, the summary of the indicators and benchmark of the heating
solutions studied are shown:
SOLUTION Scenario 1 Scenario 2 Scenario 3 Scenario 4 Scenario 5
Initial investment (DKK)
690418 289057 276320 438974 217808
Benchmark 0% 85% 88% 53% 100%
Loan period (years)
20 10 12 16 7

178
Systems for sustainable energy supply for a small village
Master in European Construction Engineering (2012-2013)
Benchmark 0% 77% 62% 31% 100%
Break-even point (years)
12 9 3 20 9
Benchmark 47% 65% 100% 0% 65%
Profit 10 years (DKK)
-21847 28980 107817 -205114 48916
Benchmark 59% 75% 100% 0% 81%
Profit 20 years (DKK)
276996 485986 586884 -160418 471598
Benchmark 59% 86% 100% 0% 85%
Profitability 10 years (%)
-3,2 10 39 -47,6 22,4
Benchmark 51% 67% 100% 0% 81%
Profitability 20 years (%) 40,1 168 212,4 -36,5 216,5
Benchmark 30% 81% 98% 0% 100%
Figure 6.1_15: Scenarios’ indicators and benchmark
BENCHMARK GRAPHICS
The following graphics represent the graphical comparison of the benchmark grades
obtained from the indicators analysis.
Figure 6.1_16: Scenarios’ benchmark radar chart

179
Systems for sustainable energy supply for a small village
Master in European Construction Engineering (2012-2013)
Figure 6.1_17: Scenarios’ benchmark bar chart
ANALYSIS
GENERAL ANALYSIS
As it can be seen in the graphics, the scenarios with a heating system based on a
biomass solution reach a better overall performance compared with the ones based on
a ground source heating solution.
The solution proposed on scenario 4 (Ground source heating with biogas boiler and
electricity generation based on photovoltaic solar panels), reaches the lowest marks
regarding profit and profitability, even though the solution does not have the highest
initial investment.
The scenario 1 (Ground source heating with high capacity windmill) reaches an average
profitability mark considering that is the solution with the highest initial investment.
Considering the indicators studied, scenarios 3 and 5 are the solutions with the best
benchmark grades, being scenario 3 the one with the greatest profitability grades and 5
the one with the lowest initial investment grades.
CONCLUSION
As the main conclusions achieved from the study of the heating solutions it could be
asserted that:
- Solutions based on ground source heating reach the lowest benchmark grades,
so it can be considered as a solution to discard when studying the
implementation of a combined heating and electricity system.
- The implementation of a high capacity windmill implies the greatest initial
investment, but compensates with moderate long term profitability.
- The implementation of a cogeneration solution (scenario 3) represents the option
with the greatest middle-term and long-term profitability, implying a moderate
initial investment. This solution can be considered the best option when
profitability is the main concern.

180
Systems for sustainable energy supply for a small village
Master in European Construction Engineering (2012-2013)
- The combination proposed on scenario 5 (biogas + solar thermal + windmills), can
be considered the safest investment, reaching also the greatest long-term
profitability. This solution can be considered the safest combined investment.
INSULATION IMPROVEMENT
In the section 3.2 of this report (insulation study) a rough analysis of the annual heat
losses considering the current level of insulation of the houses studied, has been
performed. From this study the following summary chart has been created in order to
compare the main sources of heat loses on the studied houses.
HEAT LOSS SOURCE TOTAL LOSS (MWh/year) PERCENTAGE
Ceiling loss 154,65 8%
Wall loss 110,78 6%
Windows loss 383,86 20%
Slabs loss 169,16 9%
Infiltrations 1.131,57 58% Figure 6.1_18: Annual heat losses by components
From this study it can be assumed that the main sources of heat losses are the air
infiltrations (58%) and the losses on windows (20%).
Comparing these losses with the average cost of the heating solutions calculated from
the scenarios proposed (section 5):
SCENARIOS HEATING CONSUMPTION
COSTS (DKK/year)
COST PER
MWh/year
SCENARIO 1 13.536 6,89
SCENARIO 2 4.420 2,25
SCENARIO 3 4.912 2,50
SCENARIO 4 13.131 6,68
SCENARIO 5 7.840 3,99
AVERAGE 8.767 4,46 Figure 6.1_19: Average heating cost per MWh
Comparing these values, it can be seen that the possible savings by improving the
windows quality and reducing the air infiltrations can result in an interesting option
compared to the increase of production required for satisfying the needs.
AIR INFILTRATIONS LOSSES WINDOWS LOSSES
REDUCTION Total loss (MWh) Savings (DKK) Total loss (MWh) Savings (DKK)
0% 1.131,57 0 DKK 383,86 0 DKK
10% 1.018,41 505 DKK 345,47 171 DKK
20% 814,73 1.413 DKK 276,38 479 DKK
30% 570,31 2.503 DKK 193,47 849 DKK
40% 342,19 3.521 DKK 116,08 1.194 DKK
50% 171,09 4.284 DKK 58,04 1.453 DKK Figure 6.1_20: Loss reduction savings for the main sources
As it can be seen from the table, a reduction of losses up to a 30% on these two specific
heat losses sources can result into important annual fuel savings, considering also the

181
Systems for sustainable energy supply for a small village
Master in European Construction Engineering (2012-2013)
reduction on the maximum power needed from the heating solution that would end up
into the reduction of the initial investment required.
Moreover, the study of the possibility of reducing the annual consumption instead of
increasing the efficiency of the heating system has to be a matter for a further specific
report getting into detailed cost analysis of both options.
FINAL RECOMMENDATION
In order to conclude this report, some recommendations are given based on the analysis
developed previously and the technical criteria of the developers of this report.
The aim is to highlight the most profitable energy supplying solutions for Føns community
based on the studied technical criteria and also the community preferences.
INDIVIDUAL VS COLLECTIVE
Comparing collective solutions versus individual ones, it can be said that collective
solutions have better performance and economical features than the individual ones.
In the case of heating solutions, the benefits of implementing a common district heating
or an individual heating solution are quite different; being the economical features of
the collective solutions much better than the individual ones. Moreover, in the case of
the heating solutions, collective solutions have less environmental impact in terms of
emissions and energy efficiency, but they reach a greater visual impact and land
occupation impact.
When comparing electricity generation alternatives, the same patterns as the ones
detected on the heating solutions can be identified, i.e. the overall performance of the
investment is better the collective solutions than in the individual ones. Also the
environmental impacts in terms of energy efficiency are greater on collective solutions,
but these common options imply greater visual impacts and land occupation impacts.
HEATING VS ELECTRICITY
The following graphics represent the graphical comparison of the benchmark grades
obtained from the indicators analysis, considering the three best heating options and
electricity options.
The aim of this analysis is to determine which of the group of investments can be
considered a better solution and see the strong and weak points of each of these
groups.
SOLUTION D.H.
Woodchips D.H. Straw DH. Biogas
E. Wind Turbine
E. Solar Collective
450kW
E. Small Wind
turbines
Initial investment (DKK)
124562 102662 57931 346478 75919 260000
Benchmark 77% 84% 100% 0% 94% 30%
Loan period (years)
6 5 2 18 2 12
Benchmark 75% 81% 100% 0% 100% 38%
Break-even point (years)
4 4 4 2 8 4
Benchmark 33% 33% 33% 0% 100% 33%

182
Systems for sustainable energy supply for a small village
Master in European Construction Engineering (2012-2013)
Profit 10 years (DKK)
150415 157008 157221 143461 35812 73187
Benchmark 94% 100% 100% 89% 0% 31%
Profit 20 years (DKK)
550891 537674 490328 540676 123892 459929
Benchmark 100% 97% 86% 98% 0% 79%
Profitability 10 years (%)
120 153 271 41 47 28
Benchmark 38% 51% 100% 5% 8% 0%
Profitability 20 years (%)
442 524 846 156 163 177
Benchmark 41% 53% 100% 0% 1% 3%
Figure 6.1_21: Heating vs Electricity indicators and benchmark
Figure 6.1_22: Heating vs Electricity benchmark radar chart

183
Systems for sustainable energy supply for a small village
Master in European Construction Engineering (2012-2013)
Figure 6.1_23: Heating vs Electricity benchmark bar chart
Once studied the graphics it can be appreciated that the heating solutions get higher
benchmarks, especially in terms of profitability, profits, and initial investments required.
While electricity production solutions compete on terms of break-even point (Solar
collective 450KW) and profits (Wind turbine).
This conclusion just considers the economic aspects of the investment, and the specific
needs of the village have to be taken into account when making a decision.
SINGLE VS COMBINED
The following graphics represent the comparison of the benchmark grades obtained
from the indicators analysis, considering the two best options from each of the groups
studied: heating solutions, electricity production solutions, and combined solutions.
The aim of this analysis is to determine which of the group of investments can be
considered a better solution and see the strong and weak points of each of these
groups.
SOLUTION DH. Biogas D.H. Straw E. Solar
Collective 450kW
E. Wind Turbine
Scenario 3 Scenario 5
Initial investment (DKK)
57931 102662 75919 346478 276320 217808
Benchmark 100% 84% 94% 0% 24% 45%
Loan period (years)
2 5 2 18 12 7
Benchmark 100% 81% 100% 0% 38% 69%
Break-even point (years)
4 4 8 2 3 9
Benchmark 71% 71% 14% 100% 86% 0%
Profit 10 years (DKK)
157221 157008 35812 143461 107817 48916

184
Systems for sustainable energy supply for a small village
Master in European Construction Engineering (2012-2013)
Benchmark 100% 100% 0% 89% 59% 11%
Profit 20 years (DKK)
490328 537674 123892 540676 586884 471598
Benchmark 79% 89% 0% 90% 100% 75%
Profitability 10 years (%)
271 153 47 41 39 22,4
Benchmark 100% 53% 10% 7% 7% 0%
Profitability 20 years (%)
846 524 163 156 212,4 216,5
Benchmark 100% 53% 1% 0% 8% 9%
Figure 6.1_24: Single vs Combined indicators and benchmark
Figure 6.1_25: Single vs Combined benchmark radar chart

185
Systems for sustainable energy supply for a small village
Master in European Construction Engineering (2012-2013)
Figure 6.1_26: Single vs Combined benchmark bar chart
As it can be appreciated on the graphics, the implementation of a combined solution
represents a less interesting investment, reaching lower benchmarks than the other
alternatives in all the indicators considered.
Nevertheless, it has to be remarked that the implementation of a combined alternative
will satisfy both demands simultaneously, so considering a scenario where the
association requires both productions, the CHP alternative can fulfil both with a
reasonable economic performance.
OTHER CONSIDERATIONS
Other considerations, such as technical complexity of the solution and adaptability
cannot be taken into account when performing a simple economic analysis. But has to
be remarked that some individual solutions proposed in this report can be considered if
these factors are the main preferences for the users.
- When considering heating solutions, the installation of an individual pellet boiler in
each house of the village can represent a reasonable solution, as this kind of
boilers can easily replace a traditional gas-oil boiler without requiring great
changes on the existing installation.
- When studying an electricity generation solution, the installation of individual solar
panels in the roof has to be remarked as a low maintenance and simple
installation solution, which also can be enlarged due to its modularity. The
electricity selling and buying process is also easier and requires less administrative
process to be installed.
- When considering mixed solutions, any of the choices implies an important
technical complexity as these alternatives are studied for a common installation.
But a combination of the previous alternatives can be applied individually.

186
Systems for sustainable energy supply for a small village
Master in European Construction Engineering (2012-2013)
MULTICRITERIA ANALYSIS
The election of one of the proposals provided in this report could be constrained by
different aspects. Of course the economic point of view is vital, but a choice could be
influenced by other important aspects, indeed, at the end the decision is totally
subjective.
So as to make another comparison between the different options, three matrixes have
been executed. In each of these matrixes five aspects there have been considered:
initial investment, break-even point, profitability in 20 years, environmental impact and
social acceptance.
The analysis of environmental and social aspects is very important from the sustainable
point of view. It is true that the analysis by giving marks is not easy in such a rough way
and, of course, a deeper analysis should be made (Environmental Impact Study) in order
to obtain more accurate results. However, the next method has been followed:
Each of the aspects has a weight assigned and a mark has been given to each of them.
For the first three criteria the previously done benchmark analysis has been used. For the
last two, the issues treated along the studies and the conclusions have been considered.
In order to make the assessment about social and environmental issues, the following
points have been taken into account:
- Land use
- Soil pollution
- Benefit for the town
- Aesthetic impact
- Noise pollution
- Distance to houses
- Impact in wildlife
In the following tables the matrixes are provided and the study has been developed
dividing heating, electricity and combined solutions as it is shown:
HEATING
SOLUTIONS
DH
Wc
*
DH
Straw
DH
Biogas
DH
Borehole
Storage
Pellet
boiler
Tank
storage
Borehole
storage
Borehole
no
storage
Initial
investment
1,6 1,8 2 0,8 1,4 1,2 0,6 1
Weighted 0,2 0,2 0,2 0,2 0,2 0,2 0,2 0,2
Break-even
point
2,7 2,7 2,7 1,8 2,4 2,1 1,5 1,2
Weighted 0,3 0,3 0,3 0,3 0,3 0,3 0,3 0,3
Profitability
in 20 years
1 0,9 0,8 0,5 0,7 0,6 0,4 0,3
Weighted 0,1 0,1 0,1 0,1 0,1 0,1 0,1 0,1
Environment
al impact
1,4 1,4 1,4 2 1,2 1,6 1,8 1,4
Weighted 0,2 0,2 0,2 0,2 0,2 0,2 0,2 0,2
Social
acceptance
1,4 1,4 1,4 1,4 1,4 1,4 1,4 1,4

187
Systems for sustainable energy supply for a small village
Master in European Construction Engineering (2012-2013)
Weighted 0,2 0,2 0,2 0,2 0,2 0,2 0,2 0,2
Total 8,1 8,2 8,3 6,5 7,1 6,9 5,7 5,3
Figure 6.1_27: Multicriteria matrix for heating solutions
*Wc: woodchips
ELECTRICITY
SOLUTIONS
Solar
Collective
350kW
Solar
Collective
450kW
Wind
Turbine
Solar
Individual
5kW
Small Wind
turbines
Initial
investment
2 1,8 1,2 1,6 1,4
Weighted 0,2 0,2 0,2 0,2 0,2
Break even
point
2,4 2,4 3 2,1 2,7
Weighted 0,3 0,3 0,3 0,3 0,3
Profitability in
20 years
0,7 0,8 1 0,6 0,9
Weighted 0,1 0,1 0,1 0,1 0,1
Environmental
impact
1,4 1,4 1,6 2 1,8
Weighted 0,2 0,2 0,2 0,2 0,2
Social
acceptance
1,8 1,8 2 1,6 1,4
Weighted 0,2 0,2 0,2 0,2 0,2
Total 8,3 8,2 8,8 7,9 8,2
Figure 6.1_28: Multicriteria matrix for electricity supplying solutions
SCENARIOS Scenario 1 Scenario 2 Scenario 3 Scenario 4 Scenario 5
Initial
investment
1,2 1,6 1,8 1,4 2
Weighted 0,2 0,2 0,2 0,2 0,2
Break-even
point
2,4 2,7 3 2,1 2,7
Weighted 0,3 0,3 0,3 0,3 0,3
Profitability in
20 years
0,7 0,9 1 0,6 0,8
Weighted 0,1 0,1 0,1 0,1 0,1
Environmental
impact
2 1,6 1,8 1,4 1,6
Weighted 0,2 0,2 0,2 0,2 0,2
Social
acceptance
1,8 1,4 2 1,2 1
Weighted 0,2 0,2 0,2 0,2 0,2
Total 6,3 6,8 7,6 5,5 7,1
Figure 6.1_29: Multicriteria matrix for combined solutions
As it is shown, the most suitable options are:

188
Systems for sustainable energy supply for a small village
Master in European Construction Engineering (2012-2013)
- For heating supply: biogas plant and district heating network installation
- For electricity supply: wind turbine installation
- Combined solution: Scenario 3 CHP woodchips district heating and electricity
plant.
Regarding the heating solutions, the collective solution consisting in Biogas plant with
district heating network is the most suitable one, coinciding with the economic criteria.
The same happens with the individual solutions, being the most adequate one the pellet
boiler. Moreover, the problem with the other individual solution could be the land use
and the modification of the soil that the geothermal solutions require.
Not in all the cases the best ones from the economic point of view are the best from the
environmental and social point of view. For instance, regarding electricity solutions,
although the initial investment for the wind turbine is very high, the other aspects
compensate it ant it becomes one of the most suitable options.
Finally, when it comes to the comparison between the scenarios the best option seems
to be the scenario 3 about CHP woodchips district heating and electric plant by
cogeneration.
In fact, after this study, the bioenergy might be the most suitable way of getting energy
to supply the requirements for this specific case in Føns.
However, many data have been provided to inform the final user and give them reliable
and clear advices in order to make a supported choice of the heating and electricity
supplying systems. Now, it is time for the inhabitants of Føns to make up their minds.

189
Systems for sustainable energy supply for a small village
Master in European Construction Engineering (2012-2013)
REFERENCES

190
Systems for sustainable energy supply for a small village
Master in European Construction Engineering (2012-2013)
3. DATA COLLECTION ABOUT HOUSES
Build it Solar, 2013. [Online] Available at: http://www.builditsolar.com/index.htm
All Wall System, 2012, Wall Assembly R-Value. [Online] Available at:
http://www.allwallsystem.com/design/RValueTable.html
Danske Bygnings Modeller, 2013, Danske Bygnings Modeller 2.0. [Online] Available at:
http://www.danskebygningsmodeller.dk/default.aspx#/home
Danmarks Miljøportal, 2013, Arealinformation. [Online] Available at:
http://www.miljoeportal.dk/Arealinformation/
Energigruppen Føns og omegns lokaludvalg, 2012, Føns nærvarme. [Online] Available at:
http://miljoe.foens.dk
Energistyrelsen, april 2012, Vejledning i kortlægningsmetoder og datafangst til brug for kommunal strategisk
energiplanlægning – Kortlægning og nøgletal
Europe’s Energy Portal, 2013. [Online] Available at: http://www.energy.eu/
Føns lokalplan, nº 13, May 1981, Nørre aaby commune
Geodatastyrelsen matrikelinfo, 2013, Miljoministeriet Geodatastyrelsen. [Online] Available at:
http://www.mingrund.dk
Ministeriet for By, Bolig og Landdistrikter, 2013, Ejendomsdata. [Online] Available at: http://www.boligejer.dk/
Middelfart kommune, 2013, Kortet er kun vejledende. [Online] Available at:
http://drift.kortinfo.net/Map.aspx?Site=Middelfart&Page=Borgerside
Offentlige Informationsserver, 2013. [Online] Available at: www.OIS.dk
SKAT, 2013, Ejendomsvurdering. [Online] Available at: http://www.vurdering.toldskat.dk
Vaarby, E., Sjølin, R., Cappelen, J., 1999. Observed Air Temperature, Humidity, Pressure, Cloud Cover and
Weather in Denmark - with Climatological Standard Normals 1961-90, Danish Meteorological Institute,
Ministry of Transport, Copenhaguen, [Online edition] Available at: http://www.dmi.dk/dmi/print/tr99-5.pdf
Vedvarende Energy, 2010, Føns by med opland svarende til den gamle sognegraense, Middelfart Kommune
4.1. INTRODUCTION PHASE 1
Ahler, K. (2005). Bygningsdele: Overslag Og Dimensionering. Erhvervsskolernes Forlag.
Alberdi Pagola, M., Alvarez Anton, L., Andersen, L., Awugya, L. K., & De Vivo, V. (2012). Systems for
sustainable energy supply for small villages. Santander: Univesity of Cantabria.
Ea Energy Analyses. (2010). Analysis of the market for bioenergy locally and internationally. Midtjylland: CMBI.
Energi Styrlesen. (2012). STRATEGISK ENERGIPLANLÆGNING I KOMMUNERNE. Energi Styrlesen.
Gonzalo, A. (2011). El mayor district heating de España se construye en Soria. BIE.
Plan Energi. (2012). Muligheder for kollektive varmeløsninger i Føns. Føns.
Wheeldon, I., Caners, C., & Karan, K. (2002). Anaerobic Digester Produced Biogas and Solid Oxide Fuel Cells:
An Alternative Energy Source for Ontario Wastewater Treatment Facilities. Fuel Cell Research Centre.
4.3.1. ALTERNATIVE 1: PHOTOVOLTAIC SOLAR CELLS
Climate, Energy and Building Minister (Martin Lidegaard) - Draft Law amending on the promotion of
renewable Energy, Electricity Supply Act, the Act on tax on electricity and Assessment Act
(Law amending No. L 86)

191
Systems for sustainable energy supply for a small village
Master in European Construction Engineering (2012-2013)
20 November 2012
SeeNews - Nov 7, 2012 - Denmark has proposed a reduction of the solar cell subsidy for private home
owners, in a draft agreement, published Tuesday on the website of the Ministry of Climate and Energy.
[Online]
Available at:
http://renewables.seenews.com/news/denmark-proposes-reduced-subsidy-for-small-solar-power-facilities-
314193
Danish Ministry of Climate, Energy and Building - Jan 16, 2013 - Broad majority support new solar power law.
[Online]
Available at:
http://www.kemin.dk/en-us/newsandpress/news/2012/sider/broadmajoritysupportnewsolarpowerlaw.aspx
Solar panel Company Website, 2012. Prices of “Alex-Solar” 250w monocristaline PV solar cells. [Online]
Available at: http://www.aktivsol.dk/
4.3.1 ALTERNATIVE 2: WIND POWER
ALTERNATIVE 2.1
C. Jensen, P. & Hartvig Jacobsen, S., 2009. Danish Energy Agency. [Online]
Available at: http://www.ens.dk
[Accessed 23 01 2013].
Cappelen, J. & Jørgensen, B., 1999. Observed Wind Speed and Direction in Denmark with Climatological
Standard Normals, 1961-90, Danish Meteorological Institute, Ministry of transport. [Online]
[Accessed 08 02 2013].
Danish Energy Agency, 2013. Danish Energy Agency. Energy Statistics. Register of Wind Turbines. [Online]
Available at: http://www.ens.dk/en-
US/Info/FactsAndFigures/Energy_statistics_and_indicators/OverviewOfTheEnergySector/RegisterOfWindTurbi
nes/Sider/Forside.aspx
[Accessed 01 20 2013].
Danish Wind Industry Association, n.d. Sound Measurement. [Online]
Available at: http://wiki.windpower.org/index.php/Sound_measurement
[Accessed 23 01 2013].
Danish Wind Industry Association, n.d. Wind Turbine Operation and Maintenance. [Online]
Available at: http://wiki.windpower.org/index.php/O_%26_M
[Accessed 23 01 2013].
Danish Wind Industry Association, n.d. Wind Turbine Sound Calculator. [Online]
Available at: http://wiki.windpower.org/index.php/Main_Page
[Accessed 23 01 2013].
GEOLICA, n.d. GEOLICA, Soluciones en generación de energía distribuida. [Online]
Available at: http://www.geolica.com/faqs/
[Accessed 25 02 2013].
Middelfart Kommune, n.d. Vindmølleplan Debatoplæg. [Online]
Available at: www.middelfart.dk/vindmolleplan
[Accessed 05 02 2013].
Molinero Benitez, A., 2009. Proyecto de un Parque Eólico. Madrid: s.n.

192
Systems for sustainable energy supply for a small village
Master in European Construction Engineering (2012-2013)
Nielsen, P. & et al, 2010. UEDP projekt 33033-0196 Vindmøllers økonomi. [Online]
Available at: http://www.emd.dk
[Accessed 27 01 2013].
PlanEnergi, 2012. Muligheder for kollektive, Føns: s.n.
SagsGIS, n.d. Miljoministeriet Naturstyrelsen. [Online]
Available at: http://miljoegis.mim.dk/cbkort?profile=miljoegis-vindmoeller
[Accessed 23 01 2013].
Siemens AG Energy Sector, 2009. Siemens. [Online]
Available at: http://wwww.siemens.com/energy
[Accessed 27 01 2013].
Siemens AG, 2013. Siemens. [Online]
Available at: http://www.siemens.com/wind
[Accessed 27 01 2013].
Suisse éole, n.d. Windprofil-Rechner, Allgemeine Windenergie- Informationen. [Online]
Available at: http://www.wind-data.ch/tools/profile.php?h=100&v=7.4&z0=0.03&abfrage=Aktualisieren
[Accessed 05 02 2013].
Wind Energy Technology, 2013. Kid Wind Project. [Online]
Available at: http://learn.kidwind.org/learn/wind_basics_technology
[Accessed 25 02 2013].
ALTERNATIVE 2.2
Aeolus Power, Noise emission report, available at http://www.aeoluspower-
windenergy.co.uk/PDF/Noise%20Emission%20Report.pdf
Cace J., ter Horst E. et al., Guidelines for small wind turbines in the built environment, 2007, available at
http://www.urban-wind.org/
Danish Ministry of Environment, Regulations of noise from wind turbines, available at
http://www.mst.dk/English/Noise/wind_turbine_noise/wind_turbine_regulations/
Domestic scale wind turbines, 1 - 6 kW, available at http://www.greenspec.co.uk/small-wind-turbines.php
EcoWind, Husstandsmøller report, 2011, available to http://www.ecowind.dk/Filer/EcoWindbrochure.pdf
Energinet.dk, VE-anlæg ≤ 6 kW (Årsbaseret nettoafregning, gruppe 6, updated February 2013, available at
http://energinet.dk/DA/El/Solceller-og-andre-VE-anlaeg/Erhverv/Sider/VE-anlaeg-6kW-Aarsbaseret-
nettoafregning-gruppe-6.aspx
Energinet.dk, Technology Data For Energy Plants, May 2012
Lussu F., Micro e mini eolico: soluzioni tecnologiche e prospettive del comparto impatti e procedure
autorizzative di impianti eolici, 2007, available at http://www.ecoappennino.it/2007/pdf/Seminari%2029-
09/Micro%20e%20mini-eolico/Presentazione%20Francesca%20Lussu.pdf
Maegaard P., The Road to Commercialization of Small Wind Power in Denmark, 2012, Nordic Folkecenter for
Renewable Energy, available at
http://www.dena.de/fileadmin/user_upload/Veranstaltungen/2012/Vortraege_Kleinwindkraft_Daenemark/
Maegaard_The_Road_to_Commerzialisation_of_Small_Wind_in_Denmark.pdf
Petersen M., Aspects of the SWT situation in Denmark, 2011, Danish Small Wind Turbine Association
Pure Energy Centre, FAQ on Small Wind Turbines, available at
http://www.pureenergycentre.com/pureenergycentre/FAQ/FAQ.php

193
Systems for sustainable energy supply for a small village
Master in European Construction Engineering (2012-2013)
5. PHASE 2 - SCENARIOS
5.3. DISTRIC HEATING
Danfoss, 1995. Instructions for designing District Heating Systems, s.l.: s.n.
Esen, 2008. Redes de Calefacción Centralizada (District Heating), s.l.: Esen. Eficiencia y Servicios Energéticos.
Euroheat, n.d. Euroheat. [Online]
Available at: http://www.euroheat.org/District-heating---cooling-4.aspx#What_is_district_cooling_
[Accessed 5 November 10 2012].
Foresa, 2006. Servicios energéticos con biomasa, Valladolid, Spain: Foresa, Servicios Energéticos.
Gonzalo, A., 2011. El mayor district heating de España se construye en Soria.. s.l., BIE.
IEA, I. E. A., 1999. District Heating and Cooling Connection Handbook, s.l.: IEA.
Jørgensen, P. J., 2007. Samsø, a Renewable Energy Island. 10 years of Development and Evaluation., s.l.:
Plan Energi.
Oklahoma State University, 2004. UK Application of Direct Cooling Ground Source Heat Pump Systems.
Edinburgh, ASHRAE-CIBSE Conference.
PlanEnergi, 2012. Føns Nærvarme. Opportunities for collective heating solutions., s.l.: Plan Energi.
Pöyry, 2009. The potential and costs of District Heating Networks, Oxford: Pöyry Energy.
Sköldberg, H., 2009. Distric Heating: the importance of cost-corrective price. An analysis based on Swedish
data., Oslo: Profu.
Swedish Energy Agency, 2011. Bo Reinerdahl. [Online] Available at:
http://energimyndigheten.se/en/Sustainability/Household/Heating-your-home/District-heating/ [Accessed 7
November 10 2012].
Task Force Customer Installations, 2008. Guidelines for District Heating Substations, s.l.: Euroheat & Power.
Universidad de Santiago de Compostela, 2008. Valor del suelo rústico para aprovechamientos energéticos
en Galicia, Lugo: Escola Politécnoca Superior, Departamento de Economía Aplicada.
V&S prisdata, 2013. Denmark Price Book 2013.
5.4.1. DISTRIC HEATING
Ayuntamiento de durcal, n.d. Proceso de un parque eolico. [Online]
Available at: http://www.adurcal.com/mancomunidad/viabilidad/57.htm [Accessed 20 02 2013].

194
Systems for sustainable energy supply for a small village
Master in European Construction Engineering (2012-2013)
LIST OF FIGURES

195
Systems for sustainable energy supply for a small village
Master in European Construction Engineering (2012-2013)
2. LOCATION OF THE PROJECT
2.1. LOCATION FO THE PROJECT AREA Figure 2.1_1: Føns location within Denmark
Figure 2.1_2: Project area location within Fønsskov peninsula
3. DATA COLLECTION ABOUT HOUSES
3.2. EXISTING BUILDING STUDY Figure 3.2_1: Føns local urban plan
3.3. BULDING CONSTRUCTION STUDY Figure 3.3_1: Building types
3.4. CONCLUSION Figure 3.4_1: Heat losses
Figure 3.4_2: Houses values
4. ALTERNATIVE STUDY
4.2. HEATING ALTERNATIVES FEASIBILITY STUDY
4.2.1. ALTERNATIVE 1: BIOENERGY Figure 4.2.1_1: Fuel considerations
Figure 4.2.1_2: Cost analysis of the individual pellet boiler system
Figure 4.2.1_3: Cost analysis of the collective wood-chips boiler system Figure 4.2.1_4: Cost analysis of the collective straw boiler system
Figure 4.2.1_5: Cost analysis of the collective biogas boiler system
Figure 4.2.1_6: Cost analysis of the District heating Wood-Chips + Cogeneration
Figure 4.2.1_7: Cost analysis of the District heating Biogas + Cogeneration
Figure 4.2.1_8: Economic indicators
Figure 4.2.1_9: Compound Cash-Flow for individual pellet boiler and heating solutions
Figure 4.2.1_10: Compound Cash-Flow for cogeneration solutions
Figure 4.2.1_11: Compound Cash-Flow for all the solutions
4.2.2. ALTERNATIVE 2: GROUND SOURCE ENERGY Figure 4.2.2_1: CO2 Emisions in Føns
Figure 4.2.2_2: Installation cost (alternative 1)
Figure 4.2.2_3: Installation cost (alternative 2)
Figure 4.2.2_4: Installation cost (alternative 3)
Figure 4.2.2_5: Installation cost (alternative 4)
Figure 4.2.2_6: Cash-flow indicators of the four alternatives evaluated
Figure 4.2.2_7: Compound Cash-flow
4.3. ELECTRICITY ALTERNATIVES FEASIBILITY STUDY
4.3.1. ALTERNATIVE 1: PHOTOVOLTAIC SOLAR CELLS Figure 4.3.1_1: Simulation of electricity consumption per month
Figure 4.3.1_2: Curve of the evolution of consumption along the year
(Months are represented horizontally with the number from 1(June) to 12 (May))
Figure 4.3.1_3: Initial investment for an individual installation of 5kW
Figure 4.3.1_4: Initial investment for a common installation of 350kW
Figure 4.3.1_5:Initial investment for a common installation of 450kW
Figure 4.3.1_6: Key indicators of individual and collective solutions
4.3.2. ALTERNATIVE 2: WIND POWER Figure 4.3.2_1: Wind map and location for Kerteminde wind turbines. Source: (SagsGIS)
Figure 4.3.2_2: Environmental Impact map
Figure 4.3.2_3: Environmental Impact map Føns area
Figure 4.3.2_4: Table of noise frequency measured in dB
Figure 4.3.2_5: Proposed zone to establish wind turbines by Middelfart Community
Figure 4.3.2_6: Environmental and social maps merge in one
Figure 4.3.2_7: Merge of maps to choose the wind turbine location area

196
Systems for sustainable energy supply for a small village
Master in European Construction Engineering (2012-2013)
Figure 4.3.2_8: Suitable orientation of the turbine in regard to wind direction
Figure 4.3.2_9: wind rose in Bågø Fyr
Figure 4.3.2_10: Calculator of wind speed
Figure 4.3.2_11: Annual Average wind speed
Figure 4.3.2_12: Wind turbine technical specification
Figure 4.3.2_13: Wind turbine cost divided in targets
Figure 4.3.2_14: sum up chart for the different figures and cash-flow indicators.
Figure 4.3.2_15 Wind profile and terrain roughness calculation
Figure 4.3.2_16 Bornay 6000 power curve
Figure 4.3.2_17 wind power calculation: inputs
Figure 4.3.2_18 wind power calculation: outputs
Figure 4.3.2_19 Assumptions
Figure 4.3.2_20 Cash flow
Figure 4.3.2_21 Possible SWT locations
Figure 4.3.2_22 Visual impact of a SWT
5. CONCLUSION
5.2. INDIVIDUAL SOLUTIONS Figure 5.2_1: Individual solutions chart
5.2.1. HEATING SOLUTIONS
5.2.1.1. HEATING SOLUTION 1: PELLET BOILER Figure 5.2.1.1_1: Heating scheme Figure 5.2.1.1_2: Installation cost
Figure 5.2.1.1_3: Cash-flow indicators
Figure 5.2.1.1_4: Cash-Flow Chart
5.2.1.2. HEATING SOLUTION 2: SOLAR ASSISTED GROUND SOURCE HEAT PUMP WITH WATER
TANK SEASONAL STORAGE Figure 5.2.1.2_1. Heating scheme
Figure 5.2.1.2_2. Installation cost
Figure 5.2.1.2_3. Cash-flow indicators
Figure 5.2.1.2_4. Cash- Flow graph
5.2.1.3. HEATING SOLUTION 3: GROUND SOURCE HEAT PUMP Figure 5.2.1.3_1. Heating scheme.
Figure 5.2.1.3_2. Installation costs
Figure 5.2.1.3_3. Cash-flow indicators
Figure 5.2.1.3_4. Cash-Flow Graph
5.2.2. ELECTRICITY SOLUTIONS
5.2.2.1. ELECTRICITY SOLUTION 1: SMALL WIND TURBINE Figure 5.2.2.1_1 Electricity scheme
Figure 5.2.2.1_2 Assumptions
Figure 5.2.2.2_3 Cash-flow
5.2.2.2. SOLUTION 2: PHOTOVOLTAIC SOLAR CELLS Figure 5.2.2.2_1 Electricity scheme for 5kW individual installation
Figure 5.2.2.2_2– Initial investment for an individual installation of 5kW
Figure 5.2.2.2_3: Cash-flow indicators
Figure 5.2.2.2_4: Cash-Flow Chart
5.3. DISTRICT HEATING NETWORK Figure 5.3_1: District Heating Scheme (Swedish Energy Agency, 2011).
Figure 5.3_2: District Heating pre-insulated pipes cross section (Flexenergy, 2011).
Figure 5.3_3: Proposed District Heating floor plan. In green it is highlighted the network
Figure 5.3_4: Cost estimation for heat distribution network.
Figure 5.3_5: Cost estimation for individual systems.
Figure 5.3_6: Investment costs.
Figure 5.3_7: Annual maintenance costs.
Figure 5.3_8: Individual Investment costs.
Figure 5.3_9: Individual annual maintenance costs.
Figure 5.3_10: Investment costs.
Figure 5.3_11: Annual maintenance costs.
Figure 5.3_12: Total Initial Investment per House Installation.
Figure 5.3_13: Annual maintenance costs per House Installation.

197
Systems for sustainable energy supply for a small village
Master in European Construction Engineering (2012-2013)
5.4. COLLECTIVE SCENARIOS
5.4.1. SCENARIO 1: GROUND SOURCE HEATING AND WIND TURBINE Figure 5.4.1_1: Plant design Scenario 1
Figure 5.4.1_2: Scheme proposal for the ground source heating of the scenario 1.
Figure 5.4.1_3 Scheme of the electricity flow from the wind turbine to the grid.
Figure 5.4.1_4: Initial investment for the common district heating installation
Figure 5.4.1_5: Heating installation cost for GSHP
Figure 5.4.1_6: Electricity installation cost
Figure 5.4.1_7: Initial investment for the common solution
Figure 5.4.1_8: Annual running cost for the common solution
Figure 5.4.1_9: Annual production benefits for the common solution
Figure 5.4.1_10: Cash-Flow indicators
Figure 5.4.1_11: Cash-Flow
5.4.2. SCENARIO 2: STRAW BOILER WITH SOLAR PV AND SWT Figure 5.4.2_1: Prevailing wind speeds
Figure 5.4.2_2: Plant distribution of both buildings and wind turbines.
Figure 5.4.2_3: Heating scheme working in Winter, Autumn and Spring
Figure 5.4.2_4: Heating scheme working in Summer
Figure 5.4.2_5: Electricity scheme
Figure 5.4.2_6: Initial investment for the district heating installation
Figure 5.4.2_7: Initial investment for the heating installation
Figure 5.4.2_8: Initial investment for the electricity installation
Figure 5.4.2_9: Initial investment for the common solution
Figure 5.4.2_10: Annual running costs for the common solution Figure 5.4.2_11: Annual production incomes for the common solution
Figure 5.4.2_12: Cash-Flow indicators
Figure 5.4.2_13: Cash-Flow graphic
5.4.3. SCENARIO 3: CHP GASIFICATION STIRLING ENGINE Figure 5.4.3_1 CHP scheme operating in winter, autumn & spring
Figure 5.4.3_2 CHP scheme operating in summer
Figure 5.4.3_3 Initial investment for the common district heating installation
Figure 5.4.3_4 CHP installation cost
Figure 5.4.3_5 Initial investment for the common solution
Figure 5.4.3_6 Annual running cost for the common solution Figure 5.4.3_7 Annual production benefits for the common solution
Figure 5.4.3_8 Cash-flow indicators
Figure 5.4.3_9 CHP cash flow graph
5.4.4. SCENARIO 4: BIOGAS BOILER AND GROUND SOURCE WITH SOLAR PV AND SWT Figure 5.4.4_1: Monthly distribution of the production between Biogas and Geothermal systems.
Figure 5.4.4_2: Distribution of the overall production between the systems.
Figure 5.4.4_3: Plant design.
Figure 5.4.4_4: Heating scheme working during winter season.
Figure 5.4.4_5: Heating scheme working during summer season.
Figure 5.4.4_6: Heating scheme working during spring and autumn season. Figure 5.4.4_7: Electric scheme.
Figure 5.4.4_8: Initial investment for the district heating installation.
Figure 5.4.4_9: Initial investment for the heating installation (biogas boiler)
Figure 5.4.4_10: Initial investment for the heating installation (Geothermal)
Figure 5.4.4_11: Initial investment for the electricity installation.
Figure 5.4.4_12: Initial investment for the common solution
Figure 5.4.4_13: Annual running costs for the common solution.
Figure 5.4.4_14: Annual production incomes to the common solution.
Figure 5.4.4_15: Cash-Flow indicators.
Figure 5.4.4_16: Cash-Flow graph
5.4.5. SCENARIO 5: BIOGAS BOILER WITH SOLAR THERMAL AND SWT Figure 5.4.5_1: Percentage of monthly production of solar and bioenergy in one year
Figure 5.4.5_2: Solar and biogas annual production
Figure 5.4.5_3: Plant design
Figure 5.4.5_4: Heating scheme operating in winter
Figure 5.4.5_5: Heating scheme operating in spring and autumn
Figure 5.4.5_6: Heating scheme operating in summer
Figure 5.4.5_7: Electricity scheme
Figure 5.4.5_8: Initial investment for the common district heating installation

198
Systems for sustainable energy supply for a small village
Master in European Construction Engineering (2012-2013)
Figure 5.4.5_9: Heating installation cost for the biogas boiler
Figure 5.4.5_10: Heating installation cost for the solar thermal
Figure 5.4.5_11: Electricity installation cost
Figure 5.4.5_12: Initial investment for the common solution
Figure 5.4.5_13: Annual running cost for the common solution
Figure 5.4.5_14: Annual production benefits for the common solution
Figure 5.4.5_15: Cash-flow indicators
Figure 5.4.5_16: Cash-flow graph
5.4.6. SCENARIOS CONCLUSIONS Figure 5.4.6_1: Indicators summary from scenarios cash-flow
Figure 5.4.6_2: Compound cash-flow for all the scenarios
6. CONCLUSION
Figure 6.1_1: Heating solutions indicators and benchmark
Figure 6.1_2: Collective + Individual heating solutions benchmark radar chart
Figure 6.1_3: Collective + Individual heating solutions benchmark bar chart
Figure 6.1_4: Collective heating solutions benchmark radar chart
Figure 6.1_5: Collective heating solutions benchmark bar chart
Figure 6.1_6: Individual heating solutions benchmark radar chart
Figure 6.1_7: Individual heating solutions benchmark bar chart
Figure 6.1_8: Electricity solutions indicators and benchmark
Figure 6.1_9: Collective + Individual electricity solutions benchmark radar chart
Figure 6.1_10: Collective + Individual electricity solutions benchmark bar chart
Figure 6.1_11: Collective electricity solutions benchmark radar chart
Figure 6.1_12: Collective electricity solutions benchmark bar chart
Figure 6.1_13: Individual electricity solutions benchmark radar chart
Figure 6.1_14: Individual electricity solutions benchmark bar chart
Figure 6.1_15: Scenarios’ indicators and benchmark
Figure 6.1_16: Scenarios’ benchmark radar chart
Figure 6.1_17: Scenarios’ benchmark bar chart
Figure 6.1_18: Annual heat losses by components
Figure 6.1_19: Average heating cost per MWh
Figure 6.1_20: Loss reduction savings for the main sources
Figure 6.1_21: Heating vs Electricity indicators and benchmark
Figure 6.1_22: Heating vs Electricity benchmark radar chart
Figure 6.1_23: Heating vs Electricity benchmark bar chart
Figure 6.1_24: Single vs Combined indicators and benchmark
Figure 6.1_25: Single vs Combined benchmark radar chart
Figure 6.1_26: Single vs Combined benchmark bar chart
Figure 6.1_27: Multicriteria matrix for heating solutions
Figure 6.1_28: Multicriteria matrix for electricity supplying solutions
Figure 6.1_29: Multicriteria matrix for combined solutions

199
Systems for sustainable energy supply for a small village
Master in European Construction Engineering (2012-2013)
ACRONYMS
CHP - Combined Heat and Power
CHP: Combined Heat and Power generation
COP - Coefficient of Performance
dB - decibels
DHN: District Heating Network
DKK - Danish Krones
GB: General Benefits
GHG: Green House Gasses
GSHP - Ground Source Heat Pump
GWh - Gigawatt hour
HTS: High Temperature System
IB: Industrial Benefit
kW - Kilowatt
kWh - Kilowatt hour
kWh/y (or kWh/year) - Kilowatt hour per year
LTDH: Low Temperature District Heating
m - meters
m/s - meters per second
MWh - Megawatt hour
O&M - Operation and Maintenance
PV - Photovoltaic
ROI - Return of investments
SAGSHP - Solar assisted Ground Source Heat Pump
SWT - Small Wind Turbine
SWT 2,3-93 - Siemens Wind Turbine 2,3 Megawatt nominal power 93 rotor diameter
VAT - Value Added Tax
VAT: Value Added Tax

200
Systems for sustainable energy supply for a small village
Master in European Construction Engineering (2012-2013)
7. APPENDIX

201
Systems for sustainable energy supply for a small village
Master in European Construction Engineering (2012-2013)
7. APPENDIX
All appendix will be found in the dedicated volume.

Master in European Construction Engineering
2012-2013
(Føns lokalplan, 1981)
Copyright © 2022 FDOKUMEN