Development of Indicators for the Measurement of the South ...
503
Development of Indicators for the Measurement of the South African Publics’ Relationship with Science By Saahier Parker March 2017 Dissertation presented for the Degree of Doctor of Philosophy in the Faculty of Arts and Social Sciences at Stellenbosch University Supervisor: Professor Johann Mouton
-
Upload
khangminh22 -
Category
Documents
-
view
0 -
download
0
Transcript of Development of Indicators for the Measurement of the South ...

Development of Indicators for the Measurement of the South African Publics’ Relationship with Science
By
Saahier Parker
March 2017
Dissertation presented for the Degree of Doctor of Philosophy in the Faculty of Arts and Social Sciences at Stellenbosch University
Supervisor: Professor Johann Mouton
i
DECLARATION
By submitting this research assignment electronically, I declare that the entirety of the work
contained therein is my own, original work, that I am the sole author thereof (save to the extent
explicitly otherwise stated), that reproduction and publication thereof by Stellenbosch University
will not infringe any third party rights and that I have not previously in its entirety or in part
submitted it for obtaining any qualification.
Date: March 2017
Copyright © 2017 Stellenbosch University
All rights reserved
Stellenbosch University https://scholar.sun.ac.za

ii
Abstract
Post-apartheid South Africa has a number of social and economic challenges to overcome toward
achieving a truly free and equal society. The South African government, in its Ten-Year Innovation
Plan (2008) and National Development Plan 2030 (2012) has committed to pursuing the goal of
eliminating poverty and reducing inequality, through identifying science and technology as having a
key role to play in overcoming the most pressing developmental areas in contemporary South Africa.
Critical to harnessing the power of science and technology is the promotion of a citizenry, skilled and
scientifically literate, toward driving economic growth, development and sustainability. In order to
achieve this, it remains important to identify the current levels of the South African public
understanding of science (PUS). Previous research in South Africa has adopted international
measurement techniques and yielded valuable insight. To date however, no indicators have been
developed specifically within the South African context toward enhancing our understanding of the
South African public-science relationship.
This study set out to develop a set of measurement indicators and adopted the following six
elements to constitute the South African public understanding of science: knowledge of science;
attitudes to science; interest and informedness about science; science information sources; and
attendance at science engagement activities. The main objectives of the study were: 1) to determine
the level of South African public understanding of science within each element; 2) to understand the
patterns of PUS in relation to background demographic variables; 3) to develop indicators for each of
the PUS elements and 4) to determine the key predictors of performance on each of the new
indicators developed.
The empirical component of the study consisted of a national survey, in both urban and rural
settings, yielding a total sample of 3 486 respondents.
Results from the survey indicate that South Africans correctly identified about 40% of the items on a
scientific knowledge index. Considerable variation was revealed within this result by science subject
area. Items dealing with medical science recorded correct response from 67.4% of respondents,
while items covering the area of astronomy were answered correctly by 28.4% of the sample.
Overall, 33.3% of respondents provided a scientifically incorrect response while 26.4% selected a
don’t know response.
Attitudes to science were assessed using three interrelated methods. South Africans displayed
moderately positive attitudes to science, with an average of 70.3% of respondents agreeing with
positively worded attitudinal items, while 58.2% offered agreement with the more critical attitudinal
Stellenbosch University https://scholar.sun.ac.za

iii
statements. This result was further confirmed within the Index of Scientific Promise and Reservation,
wherein South Africans achieved an index ratio of 1.21. An additional investigation was undertaken
to determine attitudinal ambivalence within the response to this question set. Survey outputs
indicate that 39.7% of our sample reports a degree of attitudinal ambivalence. This is of concern as it
may lead to increased malleability of attitudes to science.
Among the 3 486 respondents, 22.6% indicated high interest in science while 33.0% indicated a
moderate level of interest across the 7 areas of science included (55.6%). However, 44.4% indicated
no interest in any of the areas of science listed. Respondents reported being most interested in areas
of Technology & the Internet; followed by Climate Change; Economics and Energy. Within the same
science subject areas, respondents indicated a generally lower level of informedness. An average of
45.3% of respondents reported being informed about the 7 areas of science. Overall however, 54.7%
of respondents indicated that they were not well-informed with regards to the 7 areas of science
items. South Africans report being best informed in areas of Technology & the Internet; followed by
Politics and Economics.
This survey included 11 information sources to assess the most frequently used source of scientific
information. South Africans predominantly report Radio (69.4%) as the primary source of scientific
information. This was generally followed by free-to-air television (65.0%) and then other people
(60.0%). All online-based information sources (social media; blogs; institutional websites and news
websites) were ranked lowest across the 11 questionnaire items.
Respondents report a very low attendance at science engagement activities. Only 11.5% of
respondents report attendance at one of the five listed science engagement activities. Among those
that did attend an engagement activity the majority visited a Public Library (34.5%); followed by a
Zoo or Aquarium (22.8%); Museum (18.3%); Science Centre, Technology exhibition (12.5%) and
Science Café, Festival or similar Public Event (11.9%). A key finding from within this study is, despite
the higher reported level of interest and informedness in areas of science, the majority of South
Africans surveyed generally do not attend science engagement activities.
Through the use of multinomial logistic regression techniques, models were developed that explains
respondent outcomes on each index.
Based on the results of this study, a more structured approach to public understanding of science
measurement, with specific design considerations to the South African context now exists. The
results of this baseline, nationally representative study further adds to the sources of data and
scholarship within this domain. The findings responded to a number of hypotheses presented, which
Stellenbosch University https://scholar.sun.ac.za

iv
may provide direction for further research. The value of this research to policymakers, government,
civic society and researchers is multi-fold. Firstly the development of rigorous indicators presents the
opportunity for future iterations of this tool and monitoring of PUS trend data, toward evidence
based decision making. The development of an audience segmentation model may further aid the
development of targeted science communications strategies. The immediate benefit however rests
in the rich data resource created that will aid future researchers within this domain.
Stellenbosch University https://scholar.sun.ac.za

v
Opsomming Post-apartheid Suid-Africa het verskeie sosiale en ekonomiese uitdagings wat aangespreek moet
word voordat die samelewing werklik vry en gelyk kan wees. Die Suid-Afrikaanse regering het, deur
middel van die Tien-Jaar Innovasieplan (2008) en die Nasionale Ontwikkelingsplan 2030 (2012), hom
verbind tot die bestryding van armoede en ongelykheid, deur te beklemtoon dat wetenskap en
tegnologie ʼn sleutelrol speel in die dringendste ontwikkelingsareas in kontemporêre Suid-Afrika.
Dit is uiters belangrik om wetenskapsgeletterdheid en –vaardigheid in die samelewing te ondersteun
ten einde die potensiaal van wetenskap en tegnologie tot die bevordering van ekonomiese groei,
ontwikkeling en volhoubaarheid te benut. Ten einde dit te bereik, is dit nodig om die huidige vlak
van Suid-Afrikaners se kennis en begrip van die wetenskap te identifiseer. Vorige navorsing in Suid-
Afrika wat gebruik gemaak het van internasionale metodes het tot waardevolle insigte gelei. Tot op
hede was daar egter nog geen indikatore ontwikkel – wat fokus op die Suid-Afrikaanse konteks – wat
ons kennis van die Suid-Afrikaanse publiek se verhouding met die wetenskap kon verryk nie.
Die doel van hierdie studie was dus om ʼn stel indikatore te ontwikkel vir die Suid-Afrikaanse kennis
en begrip van die wetenskap wat die volgende ses elemente inkorporeer: kennis van die wetenskap,
houdings jeens die wetenskap, belangstelling in die wetenskap, ingeligtheid oor die wetenskap,
bronne van wetenskaplike inligting, en wetenskaplike betrokkenheid (‘engagement’). Die hoof
doelwitte van die studie was: 1) om vas te stel wat die vlak van Suid-Afrikaners se begrip en kennis
van die wetenskap is met betrekking tot elkeen van die elemente, 2) om die patrone van die kennis
en begrip van die wetenskap te verklaar met inagneming van die belangrikste demografiese
veranderlikes, 3) om indikatore te ontwikkel vir elkeen van die element van begrip en kennis van die
wetenskap, en 4) om vas te stel wat die faktore is wat meespeel in elkeen van die nuwe indikatore.
Die empiriese komponent van die studie behels ʼn nasionale opname, in beide stedelike en landelike
gebiede, wat 3 486 respondente opgelewer het.
Die opname het bevind dat Suid-Afrikaners ongeveer 40% van die items op die kennis van die
wetenskap indeks korrek kon identifiseer. Aansienlike variasie was teenwoordig in die resultate per
wetenskapsvakgebied. Vrae rondom die mediese wetenskappe behels is korrek beantwoord deur
67.4% van die respondente, terwyl items wat die vakgebied astronomie dek deur slegs 28.4% van die
steekproef korrek beantwoord is. Oor die algemeen het 33.3% van die respondente verkeerde
antwoorde verskaf, terwyl 26.4% aangedui het dat hulle nie weet wat die korrekte antwoord was
nie.
Stellenbosch University https://scholar.sun.ac.za

vi
Houdings jeens die wetenskap is geklassifiseer in drie kategorieë: Suid-Afrikaners toon ʼn matige
positiewe houding teenoor die wetenskap, met 70.3% van respondente wat saamgestem met
positief-bewoorde ehoudings stellings, terwyl 58.2% met meer krities-bewoorde houdingsstellings
saamgestem het. Hierdie bevinding is herhaal in die Indeks van Optimisme en Versigtigheid
(‘reservation’) teenoor die Wetenskap, waar Suid-Afrikaners. Verdere analise is onderneem om
diegene wat ʼn ambivalente houding jeens die wetenskap het. Die opname wys dat 39.7% van die
steekproef ambivalent is in hul houding teenoor die wetenskap. Die bevinding is veral belangrik
omdat dit ʼn aanduiding kan wees wat houdings wat meer veranderlike is.
Van die 3 486 respondente het 22.6% ʼn hoë vlak van belangstelling jeens die wetenskap, terwyl
33.0% ʼn matige belangstelling in wetenskapsaangeleenthede het ʼn Beduidende proporsie (44.4%)
het aangedui dat hulle geen belangstelling toon in enige van die wetenskapsvakgebiede nie.
Respondente blyk die grootste belangstelling te hé in die volgende onderwerpe: Tegnologie endie
Internet, gevolg deur Klimaatsverandering, Ekonomie en Energie.
Hierdie opname het 11 opname items ingesluit om te bepaal watter bronne Suid-Afrikaners oor die
wetenskap gebruik. Suid-Afrikaners het Radio (69.4%) as hulle primêre bron van inligting oor die
wetenskap aangedui. Dit is gevolg deur gratis direkte televisie (65.0%), en dan inligting verkry deur
ander mense (60.0%). Alle vorme van aanlynbronne van inligting (sosiale media, webjoernale,
institusionele webwerwe, en nuuswebwerwe) het die laagste posisie beklee van al 11 van die
opname items.
Volgens die opname blyk dit dat Suid-Afrikaners nie baie by wetenskaplike aangeleenthede betrokke
is nie Slegs 11.5% van die respondente het aangedui dat hulle aan enige van die vyf vorme van
wetenskaplike betrokkenheid Deelgeneem het Van diegene wat wel van die responsopsies gemerk
het, , was Openbare biblioteke (34.5%) die meeste besoek, gevolg deur ʼn Dieretuin of Akwarium
(22.8%); Museum (18.3%), Wetenskapsentrum, Tegnologie uitstalling (34.5%), en Wetenskapskafee,
fees of soortgelyke Openbare geleentheid (11.9%). ʼn Belangrike bevinding van die studie is dat ten
spyte van die hoë vlakke van belangstelling en ingeligtheid wat vermeld was in sekere van die
wetenskapsvakgebiede, dui hierdie studie aan dat die meerderheid van Suid-Afrikaners nie baie
betrokke is by wetenskapaktiwiteite nie.
ʼn Meer gestruktureerde benadering tot Suid-Afrikaners se kennis en begrip van die wetenskap is ʼn
hoofuitkoms van hierdie studie. Die bevindinge van hierdie nasionaal verteenwoordige studie maak
ʼn belangrike bydrae to die databronne en navorsing op hierdie terrein. Die bevindinge spreek ʼn
aantal hipoteses direk aan, wat toekomstige navorsing kan inlig. Die waarde van hierdie navorsing vir
Stellenbosch University https://scholar.sun.ac.za

vii
beleidmakers, die regering, die burgerlike samelewing en navorsers is veelvoudig. Eerstens, bied die
ontwikkeling van geldige en begtroubare indikatore die geleentheid vir toekomstige replikasies van
hierdie studie sowel as vir die gereelde monitering van die Suid-Afrikaanse publiek se kennis en
begrip van die wetenskap. Die ontwikkeling van ʼn segmentasie-klassifikasie van die Suid-Afrikaanse
publiek op grond van hule response is ook waarevold om toekomstige wetenskaps kommunikasie
strategieë te ontwikkel.
Stellenbosch University https://scholar.sun.ac.za

viii
Acknowledgements
First and foremost, I wish to thank the Almighty God, for granting me the ability and courage to
complete this project.
I wish to thank my supervisor, Professor Johann Mouton for his guidance and constructive feedback
as well as support and encouragement in completing this research endeavour. Appreciation is
extended to CREST for the financial support received in conducting the data collection for this
project. Furthermore I wish to thank the staff at CREST, particularly Marthie van Niekerk, Bernia
Drake, Nigel Jansen and Marina Joubert for their moral and technical support. I also thank Isabel
Basson for her assistance in translating the abstract into Afrikaans.
I wish to place on record a note of appreciation to my late friend, Mr. William Blankley, whose early
work introduced me to this field of study. Your encouragement and direction tremendously
influenced this project. To my colleagues and friends at the Human Sciences Research
Council (HSRC), Natalie Vlotman, Cheryl Moses, Dr Moses Sithole, Mario Clayford, Natasha Saunders
and Professor Pamela Naidoo for all the support, encouragement and assistance. Professor Demetre
Labadarios and the Centre for Science, Technology and Innovation Indicators (CeSTII) for the support
and financial assistance received. Sincere appreciation to Laetitia Louw from Information Services;
Noor Fakir for IT and software support and Valda West for administrative assistance.
I wish to offer the sincerest thanks to my parents, for the crucial role they have played in my life and
education, for always allowing me the freedom to explore my interest and supporting me in every
endeavour. To my sister in particular, thank you for standing by me in these last few difficult
months. To my brothers and their families, thank you for your unwavering support and assistance.
To all my friends, in particular: Farouq Koorowlay; Nadeem, Faatema & Hannah Mahmood; Abdul-
Aziz Omar; Salma Umerji; Shanti Irene Gylseth; Muneeb Chohan and Zahraa Moosa, for keeping me
sane and focused.
I wish to acknowledge Sameena Amien, for her meticulous editorial work on this thesis. Similarly, to
my father, Abdus Sataar Parker for the hours spent proofreading this document.
To Shakira Mahomed, for her support during the initial stages of this project.
Finally, my heartfelt appreciation goes out to the participants, who were willing to take part in this
study, may it serve to create a change within our community.
Stellenbosch University https://scholar.sun.ac.za

ix
Dedication:
To my grandparents, Hajji’s Mohamed Ameen & Habiba Parker as well as Ayesha Ebrahim Datay, you
are the giants, whose shoulders we stand on.
Stellenbosch University https://scholar.sun.ac.za

x
Table of Contents
Declaration i
Abstract Ii
Opsomming V
Acknowledgements viii
Dedication Ix
Table of Contents X
List of Figures xiv
List of Tables xvii
List of Abbreviations and Acronyms xx
CHAPTER 1 - GENERAL INTRODUCTION 1
1.1 THE HISTORY AND CONTEXT OF SCIENCE & TECHNOLOGY IN SOUTH AFRICA 1
1.2 THE MULTI-FACETED NATURE OF THE SOUTH AFRICAN PUBLIC 7
1.3 S&T AS AN ENGINE OF INNOVATION, COMPETITIVENESS AND ECONOMIC DEVELOPMENT 12
1.4 PUBLIC UNDERSTANDINGS OF SCIENCE RESEARCH IN SOUTH AFRICA 20
1.5 OPPOSING OPINIONS 22
1.6 DELINEATION OF THIS STUDY 26
1.6.1 Problem Statement and Rationale 26
1.6.2 Research Focus and Hypotheses 28
1.6.3 Structure of Thesis Document 31
1.6.4 Value of This Research 33
CHAPTER TWO - LITERATURE REVIEW: THEORETICAL EVOLUTIONS 34
Introduction 34
2.1 SCIENTIFIC LITERACY AND THE PUBLIC UNDERSTANDING OF SCIENCE - HISTORICAL OVERVIEW 35
2.2 MAIN FRAMEWORKS FOR THE STUDY OF THE PUBLIC UNDERSTANDING OF SCIENCE 39
2.2.1 Scientific Literacy 39
2.2.2 Public Understanding of Science 44
2.2.3 Science and Society 49
2.3 THE EVOLUTION OF MEANING: DEFINITIONS AND THE PUBLIC UNDERSTANDING OF SCIENCE 53
2.3.1 Interest Groups 55
2.3.2 Definitional Characteristics 56
CHAPTER THREE - LITERATURE REVIEW: GLOBAL EMPIRICAL EVIDENCE 63
Introduction: REVIEW OF EMPIRICAL STUDIES ON THE PUBLIC UNDERSTANDING OF SCIENCE 63
3.1 EMPIRICAL STUDIES FROM DEVELOPED COUNTRIES 64
3.1.1 United States of America - NSF: Science and Engineering Indicators (SEI 64
3.1.2 OECD – Canada: Programme for International Student Assessment (PISA 67
3.1.3 Europe – Multi-Country: Eurobarometer Special Module on Science and Technology 69
3.1.4 United Kingdom: Surveys of public understanding of science 2000-2011 73
3.1.5 Japan: Public understanding of science research in the Land Of The Rising Sun 82
3.1.6 Australia: large surveys of public understanding of science and scientific literacy 87
3.2 EMPIRICAL STUDIES FROM DEVELOPING COUNTRIES 93
3.2.1 Surveys of scientific literacy from the People’s Republic of China 93
3.2.2 Malaysian surveys of scientific literacy 99
3.2.3 Public Understanding and Attitudes to Science in India 103
Stellenbosch University https://scholar.sun.ac.za

xi
3.2.4 Public Understanding of Science and Scientific Literacy Research in South Africa 109
3.2.4.1 Surveys Conducted From 1990 To 2000 111
3.2.4.2 Surveys Conducted From 2000 To 2010 118
3.2.4.3 Surveys Conducted From 2010 To Present 124
Conclusion 131
CHAPTER FOUR - RESEARCH INSTRUMENT DEVELOPMENT 133
4.1 SCIENTOMETRICS AND INDICATORS FOR THE PUBLIC UNDERSTANDING OF SCIENCE 133
4.1.1 A Brief History of Science and Technology Indicators 133
4.1.2 Statistics of Scientific Literacy and Public Understanding of Science 136
4.1.3 Indicator Development for the South African Context 141
4.1.4 Toward the Production of Public Understanding of Science Indicators 145
4.1.5 The Six Elements of the South African Public Understating of Science 146
4.2 DEVELOPMENT OF THE 2015 KHAYABUS MODULE ON PUBLIC UNDERSTANDING OF SCIENCE 150
4.2.1 Why create new test items? The purpose of the Khayabus instrument module 150
4.2.2 Questionnaire Design and Item Generation 153
4.2.3 Quality Assurance: Questionnaire Testing and Pilot Procedures 160
4.2.4 Ethical Clearance Procedure 163
4.2.5 Fieldwork Procedures 164
4.3 DATA OUTPUTS AND INDICATORS OF THE SOUTH AFRICAN PUBLIC UNDERSTANDING OF SCIENCE 166
4.3.1 INDICATORS OF THE SOUTH AFRICAN PUBLIC UNDERSTANDING OF SCIENCE 166
CHAPTER FIVE - DESCRIPTIVE SURVEY RESULTS: SCIENTIFIC KNOWLEDGE ASSESSMENT 170
Introduction 170
What Is The Level of Scientific Knowledge Among the South African Public? 171
Exploratory Analysis of Variables Correlating With Knowledge Of Science 174
Science Knowledge By Race 176
Science Knowledge By Educational Attainment 180
Conclusion 184
CHAPTER SIX - DESCRIPTIVE SURVEY RESULTS: ATTITUDES TO SCIENCE 187
Introduction 187
Overall National Results For Attitudes To Science Assessment Items 188
Exploratory Analysis Of Variables Correlating With Attitudes To Science 199
Attitudes To Science By Race 200
Attitudes To Science By Geographic Location 204
Conclusion 208
CHAPTER SEVEN - DESCRIPTIVE SURVEY RESULTS: INTEREST IN SCIENCE 210
Introduction 210
Overall National Results For Interest In Science Assessment Items 210
Exploratory Analysis Of Variables Correlating With Interest In Science 214
Interest In Science By Race 216
Interest In Science By Educational Attainment 219
Conclusion 222
CHAPTER EIGHT - DESCRIPTIVE SURVEY RESULTS: INFORMEDNESS ABOUT SCIENCE 224
Introduction 224
Overall National Results For Informedness In Science Assessment Items 224
Stellenbosch University https://scholar.sun.ac.za

xii
Exploratory Analysis of Variables Correlating With Informedness About Science 228
Informedness In Science By Race 229
Informedness In Science By Geographic Location 232
Informedness In Science By Educational Attainment 234
Conclusion 237
CHAPTER NINE - DESCRIPTIVE SURVEY RESULTS: SOURCES OF INFORMATION ABOUT SCIENCE 239
Introduction 239
Overall National Results For Science Information Sources Items 239
Exploratory Analysis Of Variables Correlating With Science Information Sources 246
Science Information Sources By Race 247
Science Information Sources By Gender 254
Science Information Sources By Geographic Location 258
Science Information Sources By Educational Attainment 264
Conclusion 271
CHAPTER TEN - DESCRIPTIVE SURVEY RESULTS: SCIENCE ENGAGEMENT 273
Introduction 273
Overall National Results For Science Engagement Activities Items 273
Exploratory Analysis Of Variables Correlating With Science Engagement Activities 277
Science Engagement Activities By Geographic Location 278
Science Engagement Activities By Educational Attainment 281
Conclusion 284
CHAPTER ELEVEN - INDICATORS & PREDICTORS OF THE SOUTH AFRICAN PUBLIC UNDERSTANDING OF SCIENCE
286
Introduction 286
11.1 INDEX CONSTRUCTION AND VALIDATION 286
11.2 INDICATORS OF THE SOUTH AFRICAN PUBLIC UNDERSTANDING OF SCIENCE (SAPUS) 288
11.2.1 Science Knowledge Index 291
11.2.2 Index of Attitudes to Science 295
11.2.3 Index of Interest in Science 299
11.2.4 Index of Informedness about Science 302
11.2.5 Scientific Information Immersion Index 305
11.2.6 Index of Science Engagement 309
11.2.7 Assessment of Relationships between SAPUS Indicators 311
11.2.8 Segmenting the South African PublicS 313
11.3 PREDICTORS OF OUTCOMES ON SAPUS INDICES 317
Predictors of outcomes on the Science Knowledge Index (SKi) 321
Predictors of outcomes on the Attitudes to Science Index (ASi) 325
Predictors of outcomes on the Interest in Science Index (ISi) 327
Predictors of outcomes on the Informedness in Science Index (InSi) 330
Predictors of outcomes on the Information Immersion Science Index (InfoSI) 334
Predictors of outcomes on the Science Engagement Index (SEI) 337
Chapter Summary and Conclusions 339
CHAPTER TWELVE -SUMMARY, RECOMMENDATIONS AND CONCLUSIONS 345
12.1 Science in South Africa 345
12.2 Research Design and Data Collection 347
Stellenbosch University https://scholar.sun.ac.za

xiii
12.3 Key Outcomes and Recommendations 350
12.4 Limitations of this Study 368
12.5 Future Research Directions 370
12.6 GENERAL CONCLUSION 371
LIST OF REFERENCES 373
APPENDICES 397
Appendix 1: Description of study population 397
Appendix 2: Knowledge of science reliability analyses 410
Appendix 3: Attitudes towards science reliability analyses 419
Appendix 4: Interest in science reliability analyses 425
Appendix 5: Level of informedness about science reliability analyses 430
Appendix 6: Sources of information about science reliability analyses 435
Appendix 7: Science engagement reliability analyses 440
Appendix 8: Fieldwork material 443
Appendix 9: Codes book 447
Appendix 10: Multinomial Logistic Regression Outputs 461
Appendix 11: Letter of Acceptance and Ethics Approval 480
Stellenbosch University https://scholar.sun.ac.za

xiv
List of Figures
Chart 1.1: Highest Level of Education Attained, South Africans 20+ years old 9
Chart 1.2: South African Nominal R&D Expenditure 2001-2012 14
Figure 1.1: DST Ten Year Innovation Plan, 2008 (Figure 3, Page 9) 18
Figure 1.2: Conceptual framework for investigating the South African Public Understanding of Science 29
Figure 4.1: Graphic representation of Rip’s Triangle 134
Chart 4.1: Population 20 years and above with no formal education 143
Figure 4.2: The 6 elements of the South African Public Understating of Science (SAPUS) in the social context 147
Figure 4.3: Conceptual framework for investigating the South African Public Understanding of Science 148
Figure 4.4: The development of Knowledge categories for inclusion in current study 155
Image 4.1: Screenshot of the online pilot web form 163
Chart 5.1: Response per item in the Science Knowledge assessment (Khayabus wave 2, 2015) 173
Figure 5.1: Output of CHAID analysis: Knowledge of Science 176
Chart 5.2: Average response by race: Scientific Knowledge assessment (Khayabus Wave 2, 2015) 177
Chart 5.3: Response to Science Knowledge assessment by race groups: comparison to national average 178
Chart 5.11: Response to Science Knowledge assessment by educational attainment groups 181
Chart 5.12: Response to Science Knowledge assessment by educational attainment groups 182
Chart 6.1: Overall result: South African Attitudes to Science assessment % (Khayabus wave 2, 2015) 190
Chart 6.2: South African Attitudes to Science assessment: Promise & Reservation (Khayabus Wave 2, 2015) 191
Chart 6.3: South African Attitudes - Index of Promise & Reservation: comparison to HSRC-SASAS data 192
Chart 6.4: South African Attitudes - Index of Promise & Reservation: International comparison 193
Chart 6.5: Attitudes to Science: Measure Of Attitudinal Ambivalence 197
Figure 6.1: Output of CHAID analysis: Attitudes to Science 200
Chart 6.6: Attitudinal response to scientific promise items by race 201
Chart 6.7: Attitudinal response to scientific reservation items by race 202
Chart 6.8: Index Of Scientific Promise and Reservation by race 202
Chart 6.9: Measure of Attitudinal Ambivalence by race 204
Chart 6.13: Attitudinal response to scientific promise items by geographic location group 205
Chart 6.15: Attitudinal response to scientific reservation items by geographic location group 206
Chart 6.15b: Index of scientific promise and reservation by rural / urban location group 207
Chart 6.16: Measure of Attitudinal Ambivalence by location groups 208
Chart 7.1: Overall result: South African Interest in Science assessment (valid %) 211
Chart 7.2: Overall result: South African Interest in Science assessment (combined interest categories) 212
Chart 7.3: Interest in Science: Comparison to SASAS (2013) data (very interested responses only) 213
Figure 7.1: Output of CHAID analysis: Interest in Science 216
Chart 7.5: Average response by population group: Interest in Science assessment 217
Chart 7.6: Average response by white subsample: Interest in Science assessment 218
Chart 7.7: Average response by black subsample: Interest in Science assessment 218
Chart 7.8: Average response by Indian / Asian subsample: Interest in Science assessment 219
Chart 7.9: Average response by coloured subsample: Interest in Science assessment 219
Chart 7.16: Average response by educational attainment group: Interest in Science assessment 220
Chart 7.17: Average response by pre-matric educational attainment subsample: Interest in Science assessment 221
Chart 7.18: Average response by matric completed educational attainment subsample: Interest in Science assessment 221
Stellenbosch University https://scholar.sun.ac.za
xv
Chart 7.19: Average response by post-matric educational attainment subsample: Interest in Science assessment 222
Chart 8.1: Overall result: South African informedness in science assessment (valid %) 225
Chart 8.2: Overall result: South African informedness in science assessment (combined informedness categories) 226
Chart 8.3: Sum Interested vs Sum Informed responses (Khayabus 2015, Wave 2) 227
Figure 8.1: Output of CHAID analysis: Informedness about Science 229
Chart 8.4: Average response by race group: Informedness in Science assessment 230
Chart 8.5: Average response by white subsample: Informedness in Science assessment 231
Chart 8.6: Average response by black subsample: Informedness in Science assessment 231
Chart 8.7: Average response by Indian / Asian subsample: Informedness in Science assessment 232
Chart 8.8: Average response by coloured subsample: Informedness in Science assessment 233
Chart 8.11: Average response by rural / urban location group: informedness in science assessment 233
Chart 8.12: Average response by urban sub-sample: informedness in science assessment 234
Chart 8.13: Average response by rural sub-sample: informedness in science assessment 234
Chart 8.14: Average response by educational attainment group: informedness in science assessment 235
Chart 8.15: Average response by pre-matric educational attainment subsample: informedness in science assessment 236
Chart 8.16: Average response by matric completed educational attainment: informedness in science assessment 236
Chart 8.17: Average response by post-matric educational attainment: informedness in science assessment 237
Chart 9.1: Overall result: South African information sources on science assessment (Khayabus Wave 2, 2015) 241
Chart 9.2: Overall result: Highest ranked science information sources 241
Chart 9.3: Ranking of Broadcast science information sources 242
Chart 9.4: Ranking of Print science information sources 243
Chart 9.5: Ranking of Human science information sources 244
Chart 9.6: Ranking of Online science information sources 244
Figure 9.1: Output of CHAID analysis: Science Information sources 247
Chart 9.7: Average response by race group: science information sources 248
Chart 9.8: Highest ranked science information sources: white subsample 249
Chart 9.9: Highest ranked science information sources: black subsample 250
Chart 9.10: Highest ranked science information sources: Indian / Asian subsample 251
Chart 9.11: Highest ranked science information sources: coloured subsample 251
Chart 9.12: Ranking of Broadcast science information sources by race 252
Chart 9.13: Ranking of Print science information sources by race 253
Chart 9.14: Ranking of Human science information sources by race 254
Chart 9.15: Ranking of Online science information sources by race 254
Chart 9.16: Average response by gender group: science information sources 255
Chart 9.17: Highest ranked science information sources: male sub-sample 256
Chart 9.18: Highest ranked science information sources: female subsample 256
Chart 9.19: Ranking of Broadcast science information sources by gender group 257
Chart 9.20: Ranking of Print science information sources by gender group 258
Chart 9.21: Ranking of Human science information sources by gender group 258
Chart 9.22: Ranking of Online science information sources by gender group 259
Chart 9.23: Average response by location group: science information sources 259
Chart 9.24: SUM frequently item response selection: sources of science information 260
Chart 9.25: Highest ranked science information sources: urban sub-sample 261
Chart 9.26: Highest ranked science information sources: rural sub-sample 261
Stellenbosch University https://scholar.sun.ac.za
xvi
Chart 9.27: Ranking of Broadcast science information sources by geographic location group 262
Chart 9.28: Ranking of Print science information sources by geographic location group 263
Chart 9.29: Ranking of Human science information sources by geographic location group 264
Chart 9.30: Ranking of Online science information sources by geographic location group 264
Chart 9.31: Average response by educational attainment group: science information sources 265
Chart 9.32: SUM frequently item response selection: sources of science information question set 266
Chart 9.33: Highest ranked science information sources: pre-matric sub-sample 267
Chart 9.34: Highest ranked science information sources: matric completed sub-sample 267
Chart 9.35: Highest ranked science information sources: post-matric sub-sample 268
Chart 9.36: Ranking of Broadcast science information sources by educational attainment group 269
Chart 9.37: Ranking of Print science information sources by educational attainment group 269
Chart 9.38: Ranking of Human science information sources by educational attainment group 270
Chart 9.39: Ranking of Online science information sources by educational attainment group 271
Chart 10.1: Overall result: South African science engagement activities assessment (Khayabus wave 2, 2015) 274
Chart 10.2: South African science engagement activities assessment: YES responses (% total valid) 275
Chart 10.3: Science engagement activities: Number of activities attended 276
Chart 10.4: Science engagement result compared to Interest and Informedness in science data 276
Figure 10.1: Output of CHAID analysis: Science Engagement activities 279
Chart 10.1: Average response by location group: science engagement activities 280
Chart 10.2: Science engagement activities: Number of activities attended 281
Chart 10.3: Science engagement activities attended by location group 281
Chart 10.4: Science engagement result compared to Interest and Informedness in data by location group 282
Chart 10.5: Average response by educational attainment group: science engagement activities 283
Chart 10.6: Science engagement activities: Number of activities attended 283
Chart 10.7: Science engagement activities attended by educational attainment group 284
Chart 10.8: Science engagement result compared to Interest and Informedness data by educational grouping 284
Chart 11.1: Science Knowledge Index overall national result (2015) 295
Chart 11.2: Index of Attitudes to Science overall national result (2015) 299
Chart 11.3: Index of Interest in Science overall national result (2015) 301
Chart 11.4 Index of Informedness about Science overall national result (2015) 305
Chart 11.5: Scientific Information Immersion Index overall national result (2015) 308
Chart 11.6: Index of Science Engagement: overall national result (2015) 311
Image 11.1: Generalised multinomial logistic regression equation 318
Image 11.2: Predictors of SAPUS indicators within South Africa 343
Image 12.1: The 6 elements of the South African public understating of science (SAPUS) in the social context 347
Chart 12.1: Survey Results: Attitude to Science items (Khayabus, Wave 2, 2015) 352
Chart 12.2: Index outcome: Attitude to Science 353
Chart 12.3: Index of Attitude to Science by race 354
Chart 12.4: Survey Results: Interest in Science items (Khayabus, Wave 2, 2015) 356
Chart 12.6: Survey Results: Informedness about Science items (Khayabus, Wave 2, 2015) 358
Chart 12.7: Survey Results: Science information source items (Khayabus, Wave 2, 2015) 362
Chart 12.8: Survey Results: Science engagement items (Khayabus, Wave 2, 2015) 364
Stellenbosch University https://scholar.sun.ac.za

xvii
List of Tables
Table 1.1: Selected South African demographic and population indicators 8
Table 1.2 GROSS Domestic Expenditure on R&D (GERD) 2007/08 15
Table 2.1: Research Paradigms: Public understanding of science 39
Table 2.2: Evolution of Meaning: Scientific Literacy and Public Understanding of Science 62
Table 3.1: 2014 Science and Engineering Indicators: Public Understanding and Attitudes to Science 66
Table 3.2: Public attitudes to Science studies in the United Kingdom 74
Table 3.3: Attitudinal groups clusters (UK Office of Science and Technology & the Wellcome Trust; 2000) 76
Table 3.4: Attitudinal groups clusters - Public Attitudes to Science, 2011 79
Table 3.5: Questionnaire structure of 2007 Kawamoto et al study 86
Table 3.6: Indicator system of Public Scientific Literacy in China 96
Table 3.7: Interest in science: Blankley and Arnold, 2001 121
Table 3.8: Empirical studies of Public Understanding of Science research in South Africa 129
Table 4.1: Historical Development of Statistics on Science 134
Table 4.2: Basic Structure Of The PUS Khayabus Survey Module 153
Table 4.3: Revised list of 15 potential knowledge area assessment items 155
Table 4.4: Knowledge Assessment question from current 2015 Khayabus survey module 156
Table 4.5: Attitudinal Assessment question from current 2015 Khayabus survey module 158
Table 4.6: Interest in scientific fields question from current 2015 Khayabus survey module 159
Table 4.7 Informedness about science question from current 2015 Khayabus survey module 159
Table 4.8: Information sources about science question from current 2015 Khayabus survey module 160
Table 4.9: Science Engagement activities question from current 2015 Khayabus survey module 161
Table 4.10: Demographic characteristics of combined pilot sample (N=200) 163
Table 4.11: Final research instrument section and item counts 164
Table 4.12: Fieldwork timeline and data delivery schedule 165
Table 5.1: Results of Science Knowledge question bank in Khayabus wave 2, 2015 172
Table 5.2: Results of Science Knowledge by demographic classifications in Khayabus wave 2, 2015 174
Table 5.3: Science subject area by race classifications (to national average) in Khayabus Wave 2, 2015 178
Table 5.7: Response to science knowledge items, by educational attainment (with national average) 182
Table 5.8: Science subject area by educational attainment classifications (to national average) in Khayabus Wave 2, 2015 183
Table 6.1: South African Attitudes to Science: Calculation of Index of Promise & Reservation 192
Table 6.2: Percentage scores recorded for all valid responses to the attitudes to science question set 195
Table 6.3: Attitudinal items recoding structure 195
Table 6.4: Result of computation for the measure of attitudinal ambivalence 196
Table 6.5: Results of Attitudes to Science by demographic classifications in Khayabus wave 2, 2015 198
Table 7.4: Results of Interest in Science by demographic classifications in Khayabus wave 2, 2015 214
Table 8.1: Results of Informedness in Science questionnaire items by demographic classifications 228
Table 9.1: Abridged ranking of Science Information Sources questionnaire items by demographic classifications 245
Table 10.1: Results of Science engagement activities by demographic classifications in Khayabus wave 2, 2015 277
Table 10.1a: Provincial proportions of respondents attending science engagement activities 279
Table 11.1: Result of Factor analysis and Reliability assessment 290
Table 11.3: Science knowledge assessment SUM knowledge score distribution 293
Stellenbosch University https://scholar.sun.ac.za

xviii
Table 11.4: Science Knowledge Index scoring template: SUM knowledge score distribution 294
Table 11.5: Attitudes to science assessment question set 295
Table 11.6: Attitudinal items recoding structure 296
Table 11.7: SUM attitude score distribution 297
Table 11.8: Index of Attitudes to Science: SUM attitude score distribution 298
Table 11.9: Interest in science assessment question set 299
Table 11.10: SUM interest score distribution 300
Table 11.11: Index of Interest in Science - SUM interest score distribution 301
Table 11.12: Informedness in science assessment question set 302
Table 11.13: SUM informed score distribution 303
Table 11.14: Index of Informedness about Science: SUM informed score distribution 304
Table 11.15: Information sources about science assessment question set 305
Table 11.16: Information sources about science: SUM infosource score distribution 306
Table 11.17: Scientific Information Immersion Index 307
Table 11.18: Science engagement question set 309
Table 11.19: SUM engagement score distribution 309
Table 11.20: Index of Science Engagement 310
Table 11.21: Correlation between 6 SAPUS indicators 312
Table 11.22: Proposed South African Public Understanding of Science segmentation groups 315
Table 11.23: Six indices developed to be used as dependant (outcome) variables 319
Table 11.24: Sociodemographic variables considered for modelling of predictors 320
Table 11.25: Model fitting information, goodness-of-fit and likelihood ratio test: Science Knowledge 321
Table 11.26: Scientific Knowledge Index Parameter estimates (Reference category: Low knowledge) 323
Table 11.27: Model fitting information, goodness-of-fit and likelihood ratio test: Attitudes to Science 325
Table 11.28: Attitudes to science index: Parameter estimates (Reference category: Negative attitude) 326
Table 11.29: Model fitting information, goodness-of-fit and likelihood ratio test: Interest in Science 327
Table 11.30: Interest in science index: Parameter estimates (Reference category: Low interest) 328
Table 11.31: Model fitting information, goodness-of-fit and likelihood ratio test: Informedness about Science 330
Table 11.32: Informedness in science index: Parameter estimates (Reference category: Low informedness) 332
Table 11.33: Model fitting information, goodness-of-fit and likelihood ratio test: Information Immersion 334
Table 11.34: Information Immersion Science Index Parameter estimates (Reference category: Low information immersion) 335
Table 11.35: Model fitting information, goodness-of-fit and likelihood ratio test: Science Engagement 337
Table 11.36: Science Engagement Index Parameter estimates (Reference category: Low engagement) 338
Table 11.37: Summary of predictors on each indicator 341
Table 12.1: Basic Structure Of The PUS Khayabus Survey Module 348
Table 12.2: Survey Results: Science Knowledge items (Khayabus, Wave 2, 2015) 350
Table 12.3: Survey Results: Science Knowledge Index by selected demographics 351
Table 12.4: Multinomial logistic regression result: Predictors of outcomes on Science Knowledge Index 351
Table 12.5: Multinomial logistic regression result: Predictors of outcomes on Attitudes to science Index 354
Table 12.6: Survey Results: Interest in science Index by selected demographics 357
Table 12.7: Multinomial logistic regression result: Predictors of outcomes on interest in science Index 357
Table 12.8: Survey Results: Informedness about science Index by selected demographics 359
Stellenbosch University https://scholar.sun.ac.za

xix
Table 12.9: Multinomial logistic regression result: Predictors of outcomes on informedness about science Index 360
Table 12.10: Survey Results: Science information source by selected demographics 363
Table 12.11: Survey Results: Science engagement activities by selected demographics 365
Stellenbosch University https://scholar.sun.ac.za

xx
List of Abbreviations & Definitions
AIDS Acquired Immune Deficiency Syndrome
AMCOST African Ministerial Council on Science and Technology
ASTII African Science, Technology and Innovation Indicators Initiative
Attitude A settled way of thinking or feeling about someone or something, typically one that is reflected in a person's behaviour.
AU African Union
B.S.E Bovine Spongiform Encephalopathy
CAPI Computer-Aided Personal Interviews
CAST Chinese Association for Science and Technology
CATI Computer-Assisted Telephone Interviewing
CoPUS Committee on the Public Understanding of Science (Britain)
CPA Consolidated Plan of Action (AMCOST plan)
DDT Dichlorodiphenyltrichloroethane - pesticides banned in 1980's
DST Department of Science and Technology (South Africa)
Engagement Activities A highly inclusive approach (to science related activities). Allows people to join the public dialogue surrounding science and provides them the tools to do so productively
GDP Gross Domestic Product
GERD General Expenditure on Research and Development
GMO Genetically Modified Organisms (usually crops, but also animals)
HE Higher Education
HSRC Human Sciences Research Council – South Africa
ICT's Information and Communication Technologies
Informedness The state or quality of being informed
Interest Something that concerns, involves, draws the attention of, or arouses the curiosity of a person
KE Knowledge Economy
Knowledge Facts, information, and skills acquired by a person through experience or education; the theoretical or practical understanding of a subject
Knowledge Economy A knowledge driven economy is one which recognizes the important contribution and benefit information and technology can bring toward national productivity, and actively seeks to develop systems of deriving real progress from these benefits
Matric In South Africa, matriculation (or matric) is a term commonly used to refer to the final year of high school and the qualification received on graduating
MGD's Millennium Development Goals
NCAER National Council of Applied Economic Research (India)
NEPAD New Partnership for African Development
New Technologies Often digital, Some examples may be the Internet, websites, computer multimedia, computer games, CD-ROMS, and DVDs
NSF National Science Foundation (United States of America)
NSI National System of Innovation
OECD Organisation for Economic Cooperation and Development
Old Technologies Including: broadcast and television, radio, movie and music, newspapers, magazines, books and most print publications.
ONS Office of National Statistics - UK
Stellenbosch University https://scholar.sun.ac.za

xxi
PPP$ Purchasing power parity is a theory in economics that approximates the total adjustment that must be made on the currency exchange rate between countries that allows the exchange to be equal to the purchasing power of each country's currency.
Public All citizens of the research setting (South Africa) - unless specific publics are referred to
PUS Public understanding of Science
R&D Research and Development
RDD Random digit dialling - fieldwork method using telephone surveying techniques
S&T Science and Technology
SASAS South African Social Attitudes Survey
Science A systematically organized body of knowledge on a particular subject
SEI Science and Engineering Indicators (Biennial indicator publication of the NSF)
STI Science, Technology and Innovation
Understanding How information is processed and used - in this research it has specific reference to science
Web 2.0 relates to the emergence of more interactive and collaborative web-based interactions, rather than the earlier static web pages of the early online experience
Stellenbosch University https://scholar.sun.ac.za

1
Chapter One
GENERAL INTRODUCTION
"Science creates conditions for economic and national development, which in the near future will support the process of
social and economic transformation of the country. To reach this goal, it will be essential to link science effectively with
other areas of social and economic activity, and with education in particular."
White Paper on Science and Technology
Department of Science and Technology, South Africa (1996)
1.1 THE HISTORY AND CONTEXT OF SCIENCE & TECHNOLOGY IN SOUTH AFRICA
The history of science in Africa dates further than initially believed by Western archaeology, with
impressive civilisations, like the Kingdom of Nubia (400 AD) and Great Zimbabwe (1 100 AD),
producing startling evidence of tremendous technological know-how long before the arrival of
European explorers. These technological skills, highly advanced for the time, spanned all fields from
learning systems, astronomy, mathematics, metallurgy, medicine, agriculture, textile, maritime
engineering, architecture, communication, warfare and commerce (Pwiti; 1991). This rich history of
cultural and technological achievement has been somewhat lost in the colonial writing of African
history, but in recent times has been rediscovered and brought to the fore in the academic and
popular literature. South Africa is no stranger to this rich, lost, history, with Mapungubwe (1 000 AD)
having been situated just 65 km north of Polokwane, present day Limpopo Province. This early
African kingdom shared much with the (later) Great Zimbabwe, including the facilitation of
continental African trade with the Far-East, serving as an ivory and gold exchange and trading post,
using well established currency and being a centre of much technological advancement (Hrbek et al,
1988, Pwiti, 1991; Tiley-Nel, 2010). The advanced capabilities with respect to science and
(particularly) technology of early African societies represented a critical investment in the social
development and expansion of influence across the neighbouring regions. African technological
achievements have spanned the long history of civilisation on the continent and despite the lack of
visibility in modern science, still continue to contribute to scientific endeavours (Tiley-Nel, 2010).
In the recorded history of formal Western science in South Africa, the colonial era brought with it
many of the modern scientific disciplines we recognise today. Mouton et al (2001) present a brief
history of science in South Africa identifying five key periods in South African science that saw the
development and formalisation of many of the elements we see today in the South African National
System of Innovation. These five periods include the Colonial era (1751 – 1880) Industrial era (1880 –
1910) War Time Science in South Africa (1910 – 1948) Apartheid Era Science (1948 – 1994) and the
Post-Apartheid scientific system (1994 – present). Each of these periods is bookmarked with key
Stellenbosch University https://scholar.sun.ac.za
2
developments and societal dynamics that changed the context and direction of the scientific
enterprise moving ahead.
During the colonial era many early travellers to the Cape Colony participated in endeavours of
amateur scientific research. European scientific communities saw the new territory at the Southern
tip of Africa with keen scientific interest. Astronomy, botany, zoology, military science, geology and
engineering all benefitted the European settlers politically, commercially and in terms of developing
basic local infrastructure to support the Colony. Moreover these early scientists in the Cape also
contributed to the general stock of scientific knowledge within and across the various fields
mentioned above – much of which appeared in early European scientific journals as the collected
data travelled back to Europe with the increasing popularity of the shipping routes around the Cape
of Good Hope. By the early 1800s a growing scientific community in the Cape, often venturing inland
across central South Africa, began establishing many domestic scientific outposts, formalising their
work and soon the Cape Colony saw the establishment of some of the first scientific institutions in
South Africa. The first of these was the Royal Observatory in 1820, The Royal Society in the early
1820s and the South African Museum in 1825 (Mouton & Geevers, 2009). Many of these institutions
are still active today and continue to contribute significantly within their respective disciplines.
However within the early days, many of these institutions served in minimal ways as knowledge
producing centres and instead more as staging points for visiting academics and resident
researchers. Many of these early facilities occupied the role as a repository for the numerous
botanical and zoological samples collected by various scholars. This model of colonial science is
reflected in much of Africa, as the march of colonialism through Africa is deeply connected with
science and exploration on the continent. Many of these early scientific institutions had from the
beginning seen a certain degree of political sway, as much of South African history, even scientific
and educational history is infused with clear notes of political influence and ideology, a point that
will be revisited later in this chapter. The establishment of botanical gardens in numerous African
countries, much like the Kirstenbosch Botanical gardens in Cape Town (1913) is a hallmark of the
colonial scientific influence, many of which continue as attractions and botanical centres in African
cities today (Mouton & Boshoff, 2010).
With the discovery of mineral wealth, South Africa saw the rapid industrialisation of science
(Worden, 1994). The link between industrialisation, science, technology and development continued
in 1876 as the first telegraphic communications lines between Cape Town and Kimberly were
established, supporting the diamond mining boom of the 1860s (Perkins et al, 2005). Gold and
Stellenbosch University https://scholar.sun.ac.za

3
diamonds catapulted the arrival of many mining, geological, geographical, chemical and engineering
scientific personnel to drive these required fields of science within the growing South African
economy. Employment in the sciences was finally a reality in South Africa (Mouton et al, 2001).
As in many other countries the reality of life is often reflected in the type of scientific endeavours
invested in. However beyond the economic and engineering opportunities encountered, the rapid
industrialisation lead to increased concentration of human settlement, bringing with it the real social
and health issues that overcrowding and poor planning often do. This lead to the establishment of
the Onderstepoort Veterinary Institute in 1908 (MRC, 2001; ARC, 2011), and the South African
Institute for Medical Research in 1912 (Murrey, 1963; MRC, 2001) responding to the growing needs
of many of the fledgling cities that sprouted up in reaction to the mineral wealth that was making its
way to the surface across South Africa. The economy, still highly dependent on domestic agricultural
success, saw the growing need for agricultural research, with threats such as the tsetse fly,
rinderpest and bilharzia not only decimating cattle stocks but also proving to be serious threats to
human inhabitants of South Africa (MRC, 2011). It has furthermore been argued that one of the
foremost reasons for the establishment of the South African Institute for Medical Research (SAIMR,
later the MRC) was due to the high incidence of serious illnesses among African mine workers (MRC,
2001), this alludes to motivational reasons for the establishment of these institutions serving a
greater economic need, than the more obvious social health imperative of the time, again alluding to
the political and ideological infusion of the scientific history in South Africa.
Following the formation of the Union of South Africa (1910-1961) and the outbreak of World War 1
(1914-1918), South Africa along with its citizens and scientists were flung into the conflict supporting
allied troops, under Louis Botha, as a result of the historical ties with the British Empire in the Cape
(Byrnes, 1996). The involvement in the war led directly the first South African Science and
Technology Planning Framework in 1916 (Scerri, 2008) spurred on by the increasing levels of
technological application and mechanisation at the front lines, and more importantly the (initial)
technological dominance of the German forces against the Allies (Kennedy; 1989). This framework
served the purpose of unifying all policy directing activities for trade, industry, education as well as
science and technology and was formulated by the Scientific and Technical committee of the
Industrial Advisory Board within the South African Ministry of Mines and Industry. This government
led approach, influenced by the war-time effort, and was later abandoned in favour of a more non-
interventionist approach allowing greater private initiatives and influence in science and
technological issues. By the 1920s however, President Jan Smuts appointed HJ Van der Bijl as the
Stellenbosch University https://scholar.sun.ac.za

4
Scientific and Technical advisor to the South African government. In his career Van der Bijl had one
of the most remarkable impacts on the science and technological landscape of contemporary and
future South Africa, plotting the way toward continued state involvement in selected sectors of the
economy. Van der Bijl is recorded as being the leading figure in motivating for the development of
many parastatal’s (state owned enterprises) and science councils still in operation today (Scerri,
2008; Mouton & Geevers, 2009). These include the Electricity Supply Commission (ESKOM), The Iron
and Steel Corporation (ISCOR), the Industrial Development Corporation (IDC) and one of the
contemporary science councils – the Council for Scientific and Industrial Research (CSIR).
The early 1930’s saw the development of the first well-funded social science research project in
South Africa. Funded from the United States of America, under the Carnegie Institute, the study
investigated the causes, effects and possible steps toward curbing the growing issue of white poverty
in South Africa (Fourie 2006). The eruption of the Second World War began a new era in South
African science, with many new institutions and resources diverted toward ensuring sustainability
within the country during this time (Mouton & Geevers, 2009). With the realisation that a more
coherent assimilation of technology and development was required in South Africa, the CSIR was
tasked with an increasing number of research problems and today is still one of the major research
and development (R&D) performers in the country, accounting for nearly R 2.3 Billion in R&D
expenditure annually (HSRC, 2010). The period around World War 2 was a very fertile period for
South African science, seeing the beginnings of many of the science councils that still perform vital
roles in modern South Africa.
With the dawn of apartheid in 1948, the eventual isolation of South Africa under sanctions saw the
next era for science (1948-1994) as there had been a shift in national strategic focus, toward a more
defence dominated science industry. During this time, despite the global isolation in South Africa,
domestic scientists managed to produce promising research, particularly in the energy and nuclear
sectors. South Africa in this time successfully developed six nuclear weapons (Pike, 2011, Albright,
1994), and began successfully implementing mass industrial technology for coal-to-fuel synthesis
(Sasol, 2005). Many of these developments were successful due to not only a strong drive from
Government, but in many ways also due to the influence of a, by then, well-developed Higher
Education and Science Council sector. This was a period of dramatic growth for the South African
science system, with increasing publications and citation counts far exceeding growth of
international counterparts. However despite this growth, due to the influence of apartheid, many of
the brightest South Africans opted to leave a country under segregation and contributed significantly
Stellenbosch University https://scholar.sun.ac.za

5
to the brain drain experienced in the late 1980’s (Crush et al, 2005, Ndulu, 2004, Bhorat et al, 2002).
The brain drain together with limited access to the international scientific community further
impacted South Africa’s science and technology development, though progress still ensued during
this time. This all against the background of unequal access to Higher Education, based on racial
grounds, alienated the majority of the population from the world of science and contributed
significantly to South Africa’s immediate and future science and technology (S&T) outlook.
Christopher King notes, “South Africa’s scientific profile appeared to reflect the high cost of isolation
from the world community, as evinced by a low representation of published papers and low citation
impact compared to the rest of the world” (King, 2010).
A short discussion around apartheid era educational policies is important at this stage. Education
under apartheid, as with many other aspects of life for the majority of South Africans was severely
impacted by the policies of the National Party Government. Laugksch (1996) cites the research of
Hartshorne (1992), Molento (1984) and Kallaway (1984, 1991) in developing a picture of education
under the various apartheid laws. Prior to 1948 there had been no coherent educational policy
active in South Africa (Laugksch, 1996). However in 1948, the focus of the apartheid government
relating to black education put in motion a number of transformations that would set the tone of
African education over the next 50 years, and till today impacts the populations of South Africa
through the legacy impacts of separate educational standards for black, coloured, Indian and white
communities. During this period there was a deliberate policy toward limiting the educational
attainment standards of non-white citizens. This policy sought to ensure that these members of the
population were purposefully literate in limited areas of expertise, so as to adequately equip them
for menial positions in satisfying the demand for cheap labour in white-controlled industries.
Certainly Africans were most notably disenfranchised through these policies, however in lesser
degrees; coloured and Indians too were adversely impacted by these limited educational resources,
opportunities and general levels of educational attainment. As a result of the various educational
boards1 that existed to oversee educational standards for the various race groups in South Africa,
the educational outcomes at the pre-school-leaving year (grade 11) were varied to meet the set
standards of the apartheid era policies. However further impacting this was the national policy that
all black school leaving candidates (matriculants) wrote a national exam set by the National
Department of Education and Training (DET, previously the department of Bantu Education).
Furthermore for white, coloured and Indian candidates these school-leaving examinations were set
1 At one stage there were 18 different educational boards, racially divided within the, then, 4 South African provinces
(Laugksch, 1996)
Stellenbosch University https://scholar.sun.ac.za

6
by the various provincial departments of education overseeing the education of these groups. All
matriculation certification was awarded through a process of moderation by the, then, Joint
Matriculation Board, applying a similar standard to all candidates. These policies failed to take into
account the varying standards of educational outcomes of the numerous provincial and racially
delineated educational departments. This impacted significantly on the number of non-white
matriculants successfully completing the grade 12 examinations with a school-leaving certificate or
matriculation exemption, required for university enrolment. This directly influenced the number of
non-white learners able to enter tertiary education, and thus influenced, and continues to
demonstrate social influence on the national university entrance and graduate outputs at all major
South African universities. The historical and contemporary impact of these policies directly
influences the human resource capital of contemporary and future South African science and
technology progress, as will be further addressed later in this chapter.
With the increasing liberalisation of the early 1990s, the new democratic government (post-1994)
began driving science and educational policy initiatives, not only to encourage the return of many
South African scientists, now stationed abroad, but also to foster a new generation of young scientist
from across racial classifications, to drive the development of a more inclusive national scientific
system. The new Department of Arts, Culture, Science and Technology2 developed numerous key
policy documents to further this goal through various investment, educational, and social projects in
order to build a national system of innovation (NSI). Despite the massive efforts on the side of
Government, and the numerous stakeholders within the NSI, there is still a long way to go as many
gaps still exist toward building an effective and sustainable national science system. Ellis (2001)
notes that South Africa in the 21st Century will be part of a global science system...However it will be
unlikely that South Africa may become a great power in the global knowledge economy. This is in
particular reference to the marked shortage of a suitably qualified human resource capital within the
country to drive the growth of a knowledge economy. If this skills gap is to be effectively filled, South
Africa must ensure that a future workforce is given a strong foundation in science and technology
(S&T) education, from the primary school level in order to develop an appreciation for S&T as they
enter the workforce (Ellis, 2001). The Organisation for Economic Co-operation and Development
(OECD), in its report on South African Innovation Policy recognises the considerable efforts
government has made toward improving education policy and resources in attempting to address
the issues of human capital shortages (OECD, 2007). However further support for post-graduate
students, greater incentives toward completion of a PhD, reassessment of the university funding
2Later to split into Department of Arts and the Department of Science and Technology
Stellenbosch University https://scholar.sun.ac.za

7
systems to increase access to tertiary education, together with greater incentives to the private
sector to encourage knowledge investments, and greater focus on international competitiveness
have all been suggested toward bolstering a scientifically aware workforce in South Africa (Kaplan,
2008b)
South Africa has started developing key capabilities in measuring and understanding the National
System of Innovation. In post-apartheid South Africa, institutions like the National Advisory Council
on Innovation (NACI), Centre for Research on Science and Technology (CREST), the Centre for
Science Technology and Innovation Indicators (CeSTII) and many others all play key roles in
measuring and developing indicators for the performance of the national system of innovation.
1.2 THE MULTI-FACETED NATURE OF THE SOUTH AFRICAN PUBLIC
Perhaps the greatest paradox of human development today is that for there to be prosperity, there
almost always must be poverty (Yechury, 2008). Nowhere is this more true than in Sub-Saharan
Africa, with more than 45% of the populations being classified as poor or extremely poor (Chen &
Ravaillon, 2004). In South Africa, a country of 51.7 million people (Census, 2011), there exists a stark
contrast in the levels of inequalities among its citizens, having a definite current and future impact
on ordinary citizens. South Africa is home to an increasingly diverse population, apparent not only in
the many cultures, traditions, languages and religions, but also with regards to particular social
aspects relating to access to education, income distribution, basic services and employment (see
Table 1.1). Many of these can be traced back to the legacy impact of apartheid; however since 1994
there has been a dramatic rise in the number of wealthy black individuals, and an economically
powerful non-white middle class (van der Berg & Louw, 2003). Yet despite these changes, the vast
majority of South Africans are still in a state of poverty, closely interrelated with income and other
forms of inequalities that seem to perpetuate this cycle of social stagnation.
When exploring the public understanding of science in South Africa, these rampant and broad-based
inequalities have led to a highly stratified society (van der Berg, 2010). Reddy et al (2009) propose
that it may be analytically useful to refer to the many strata of the South African populous as the
publicS, accounting for the vast disparities that exist and reflecting the heterogeneity within the
population. When looking at selected demographic indicators, even at the highest level, these
inequalities shine through, despite limited real improvements and policy intervention during the 22
years of democracy. Since 1994 the South African population has grown by some 12.3 Million
individuals, which is an average increase of 9.52% every 5 years. This population change has further
Stellenbosch University https://scholar.sun.ac.za

8
been impacted by the outward and inward movement of individuals in South Africa through
immigration and emigration since 1994 (Polzer, 2010; CIA, 2012).
Historically (as discussed above) access to equal education, across the racial groups was severely
impacted by the pre-1990 apartheid policies. Since 1994 government have made concerted efforts
to correct the imbalances of these policies and consistently invested the larger share of the national
budget toward education in South Africa (Khumalo, 2013). The results of the 2011 National Census
indicate that a considerably higher number of non-white learners now have access to free basic
education, as well as onward higher and tertiary education than during the pre-1994 era, with an
average of 73.5% of South Africans between the ages of 5 and 24 years old now attending some
form of educational institution (StatsSA, 2012).
African Coloured Indian White RSA
Population 79.63% 8.96% 2.50% 8.91% 100.00%
Education* 73.9 67.2 71.8 77.7 73.5
Average Annual Income R 60 613 R 112 172 R 251 541 R 365 134 R 103 204
Access to running water** 32.45% 82.79% 97.02% 94.10% 43.27%
Access to Electricity*** 66.90% 89.44% 94.85% 95.05% 72.59%
Access to Flush Toilet**** 46.85% 86.88% 97.29% 92.49% 56.49%
Unemployment*+ 28.80% 23.30% 12.30% 7.20% 25.20%
* % Persons attending an educational institution amongst those aged 5–24 years by population group (PO3014 Census 2011)
** % With piped (Tap) water in dwelling (PO318 GHS 2011)
*** Electricity from mains (PO318 GHS 2011)
**** Flush toilet connected to a public sewerage system (PO318 GHS 2011)
*+ Quarterly Labour Force Survey Quarter 1, 2013 (PO211)
Table 1.1: Selected South African demographic and population indicators (Stats SA 2011)
Despite this, according to the results of the 2011 National Census, only 28.9% of the total population
completed Grade 12 schooling (see Chart 1.1, StatsSA 2012). Furthermore of these matriculants,
8.3% of Africans, 7.4% of Coloured, 21.6% of Indians and 36.5% of White learners continued on to
enrol for a tertiary qualification.
Stellenbosch University https://scholar.sun.ac.za

9
Chart 1.1: Highest Level of Education Attained, South Africans 20+ years old (Stats SA 2011)
While economic realities and related social factors do impact on access to further education, the
dismal state of education in South Africa has increasingly come under the spotlight within the recent
past (see Kumalo, 2013; Weeks, 2013) and further contributes to the poor matriculation results and
thus access to continued educational opportunities.
Despite the 22 years since the end of apartheid and the general refrain from race-based social
systems (population group) in South African society, the legacy impacts of apartheid across racial
stratifications is still apparent and thus made reference to within this section to provide some
understanding of the multifaceted nature of South African society. As with access to education, data
on income distribution (and other demographic factors) reveal these in startling contrast. In Table
1.1 (above) the average income is presented by population group, and clearly displays the
inequalities that exist with respect to income distribution in South Africa (StatsSA, 2011). On average
Black South Africans earn between 16% and 20% of the average annual salary of a White South
African, and while this is not due to blatant employment discrimination3, it does have a definite
impact on the standard of living and accessible opportunities for the majority of the South African
population. Linked to this is the high unemployment rate of 26.7% in South Africa (StatsSA, 2016),
with a higher concentration in the non-white population groups, linked to education, skills shortages
and available opportunities for unskilled individuals. All of these population indicators are
interrelated in terms of their social impacts, and is highly stratified by race when looking at the
access to basic services in Table 1.1.
3 The opposite is very clear through government transformation policies liked to Broad Based Black Economic
Empowerment, however many have questioned its success and reach in light of the limited skills base in South Africa
19
.1
16
.6
7.4
33
.6
16
.3
7.1
17
.9
16
6.4
30
.8
20
.4
8.4
8.6
12
.3
4.6
33
.9
28
.9
11
.8
0
5
10
15
20
25
30
35
40
NO SCHOOLING SOME PRIMARY COMPLETEDPRIMARY
SOMESECONDARY
GRADE 12 /MATRIC
TERTIARY
%
CENSUS 1996 CENSUS 2001 CENSUS 2011
Stellenbosch University https://scholar.sun.ac.za

10
Linked to the above it remains evident when looking at selected global economic and developmental
indices that in some ways reflect the reality of the South African public. Key here is South Africa’s
high GINI coefficient of 63.1 (income inequality), which is the second highest in the world (CIA,
2012), as well as a rising Human Development Index rating of 0.629, ranked at 121st in the world
(UNDP-HDI, 2013). However, that being said, for other indicators these realities are skewed as a
result of these inequalities. A case in point is the figures for Gross Domestic Product (GDP). South
Africa reported a total GDP of $390 Billion USD in 2012 (IMF, 2013) which placed it at a world
ranking of 25 out of 196 countries for Nominal GDP figures worldwide, considerably higher than
many developed countries for this period (CIA, 2012). However that being said much of this can be
attributed to a small group of highly profitable industries and related high-income earners that
sharply increases average incomes, thereby contributing to overall GDP figures, but simultaneously
increasing the GINI coefficient and increasing the negative impact on other social indicators. This is
evident when considering that 42.9% of South Africans live on less than R 420 per month (less than
$2 US Dollars a day) while 26.2% live on less than R 260 per month which equates to less than $1.25
US Dollars per day (UNDP-HDI, 2008). While certain sectors of the non-white South African
population have managed to attain incredible success post 1994, the vast majority of South Africans
face the poverty discussed above. These inequalities are rooted in history and manifest in the reality
many South Africans face today. The divides on income, access to services, education, employment
and education have all widened an already broad chasm of social development within the South
African public (Langa et al, 2006). Understanding this development divide is fundamentally
important to effective planning and implementation of many of the bold strategies planned by
government in both urban and rural centres. This paradox of present day South African society has a
definite impact on the present and future of social and human resource development, fundamental
to the continued growth of South Africa (Fedderke, 2001).
The 2016 Quarterly Labour Force Survey indicates that unemployment among the South African
public is increasing and is currently at 26.7% (StatSA, 2016). Contributing to the cause, and as a
result of this vast unemployment in South Africa, is the historic poor access to education, and
current poor quality of education that dramatically impact on school-leavers abilities to find suitable
employment (Prinsloo, 2008). In very many ways these cyclical cause and effect relationship
between unemployment, education and access to services perpetuates the on-going social
stratification and inequalities in South African society (Seekings, 2003). However due to the multi-
faceted nature of the South African population these inequalities vary across the many segments of
the South African publicS. Reddy et al (2009) note variation in levels of education among the general
population of South Africans. Among these, stratifications exist not only for race, as discussed above,
Stellenbosch University https://scholar.sun.ac.za

11
but also for gender and age. Interestingly, among the younger age groups, access to and completion
of high school (grade 12) is greater than for many in the older age stratifications, as a result of legacy
impacts discussed above, and the political and social changes in South Africa post-1994. This is a
promising sign for future public engagement with science, despite its minimal effect on enrolment
for tertiary education and eventual employment in knowledge industries in South Africa.
The Department of Science and Technology, in its Ten Year Innovation Plan (2008) highlights the
importance of a S&T (Science and Technology) skilled population, leading toward a highly skilled
future human resource base, in meeting the goals of establishing South Africa as a premier
knowledge economy by 2018. According to the National R&D Survey 2009/2010 (HSRC-CeSTII, 2012),
the number of researchers per 1000 of the labour workforce is 1.5. This is in stark contrast to many
developed countries like Australia (8.5), Norway (10.1), Sweden (10.5) and Japan (10.4) (OECD,
2010). The low number of skilled S&T-workers in the South African workforce has an impact not only
on a planned knowledge economy development, but also the future success of the National System
of Innovation. This secondary impact is due to the fact that people skilled in S&T areas are not only
needed to respond to the many social and developmental issues in South Africa, but also to answer
the call for experienced and effective teaching within higher and tertiary educational institutions
(Kraak, 2008). The inequalities discussed above, together with the resulting poor access to quality
education and onward tertiary opportunities place a dire bottleneck on the stock of future skilled-
human resources in knowledge industries and teaching facilities. This negatively impacts the goals of
the DST Ten-Year Innovation Plan as human capital development and knowledge generation are
intimately connected to the effective training and deployment of future science and technology
capability in any system of innovation (DST, 2008; DST, 2011).
Despite the availability of social services and funding toward continued education for top students
across population categories, the impacts of the vastly stratified socio-economic realities have in
many ways yielded a non-homogenous nature within the South African public(S). This, together with
the aforementioned cyclical links between poverty and education makes understanding the nature
of the many segments of the South African population more of an imperative today than ever
before. As the economy shifts toward more knowledge intensive approaches across the various
economic sectors, the increasing specialization of skills throughout the workforce will begin to exert
an impact on the many unemployed and under-skilled members of the South African public,
immersed in an environment requiring ever-greater scientific and technological proficiencies. This
reality exists not only for the traditional unskilled labour classification that has existed in South
Africa, but also into the skilled and highly skilled groupings. Technology permeates all areas of the
Stellenbosch University https://scholar.sun.ac.za

12
economy, bringing with it the benefit of efficiencies in process and production for those able to
engage them, yet also a challenge to those not intimately familiar with the technological changes
within these environments. Therefore the human resources requirement of the future within both
traditional high-tech and low-tech industries will have to adapt and evolve to meet the new
requirements of an economy undergoing rapid change to remain in-sync with global systems of
innovation and competitiveness. The argument as to whether, in a technologically advancing world,
science and technology must be made more accessible, in line with the abilities of the general public,
or if the education of the general public must be sufficiently augmented to deal with the demands of
modern technology is an interesting one (see Lodge, 2012, Shamos, 1995). The view within this
thesis is that while accessibility of S&T is of utmost importance, for the generation of new
knowledge producers and the future success and competitiveness of a country, knowledge and
understanding of science and technology is a far greater attribute to have within the general
population for the myriad of reasons noted above and below. While there are counter arguments to
the beneficial impact of increased scientific literacy, which will be addressed toward the end of this
chapter, the general consensus among the academic, educational and research community is that
knowledge and understanding, not only of science and technology, but in any field is an attribute
that should be desirable in all societies. A society educated and knowledgeable in fundamental
scientific understanding is best positioned to promote this culture of learning to subsequent
generations and prepare the groundwork for continued successful science and technological
endeavours toward building a stronger nation. In an age of global competitiveness, science and
technology represents the most effective tool for developing nations and communities to leap ahead
and bridge the digital and social divides. Science and technology further presents a viable economic
benefit that these nations and communities can harness toward accessing greater educational and
competitive advantages toward breaking the cycles of inequality that permeate all spheres of life
within these societies.
1.3 S&T AS AN ENGINE OF INNOVATION, COMPETITIVENESS AND ECONOMIC DEVELOPMENT
Science and technology (S&T) have considerable potential for the enhancement of quality of life and
the advancement of society, particularly in the developing world where it may have the greatest
impact in accelerating the drive to close the social divides experienced by the public as a result of
the many social inequalities discussed above (Tongia et. al., 2005). The benefits related to S&T have
an impact at a number of levels including the regional, national, community and individual level of
influence, ranging from issues of individual and national health care, social development, access to
resources as well as economic empowerment, job creation and cross-regional trade. The relationship
between S&T and the public understanding of science is multi-directional, with accessibility and
Stellenbosch University https://scholar.sun.ac.za
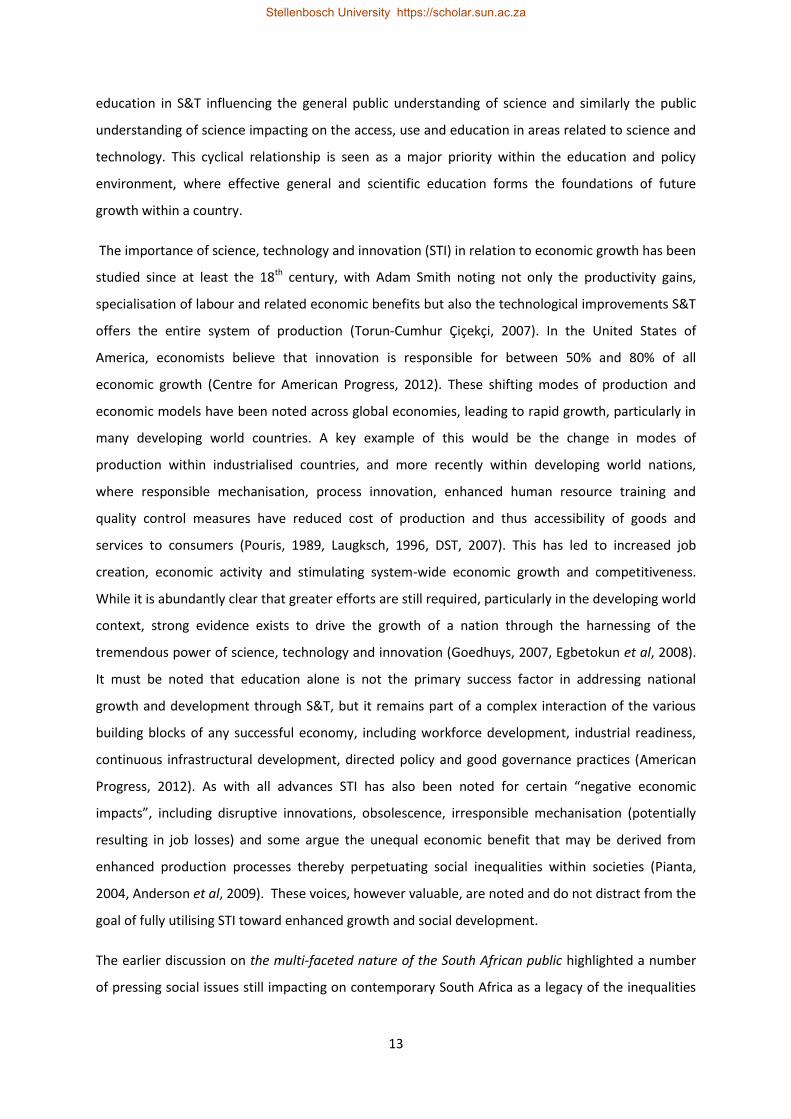
13
education in S&T influencing the general public understanding of science and similarly the public
understanding of science impacting on the access, use and education in areas related to science and
technology. This cyclical relationship is seen as a major priority within the education and policy
environment, where effective general and scientific education forms the foundations of future
growth within a country.
The importance of science, technology and innovation (STI) in relation to economic growth has been
studied since at least the 18th century, with Adam Smith noting not only the productivity gains,
specialisation of labour and related economic benefits but also the technological improvements S&T
offers the entire system of production (Torun-Cumhur Çiçekçi, 2007). In the United States of
America, economists believe that innovation is responsible for between 50% and 80% of all
economic growth (Centre for American Progress, 2012). These shifting modes of production and
economic models have been noted across global economies, leading to rapid growth, particularly in
many developing world countries. A key example of this would be the change in modes of
production within industrialised countries, and more recently within developing world nations,
where responsible mechanisation, process innovation, enhanced human resource training and
quality control measures have reduced cost of production and thus accessibility of goods and
services to consumers (Pouris, 1989, Laugksch, 1996, DST, 2007). This has led to increased job
creation, economic activity and stimulating system-wide economic growth and competitiveness.
While it is abundantly clear that greater efforts are still required, particularly in the developing world
context, strong evidence exists to drive the growth of a nation through the harnessing of the
tremendous power of science, technology and innovation (Goedhuys, 2007, Egbetokun et al, 2008).
It must be noted that education alone is not the primary success factor in addressing national
growth and development through S&T, but it remains part of a complex interaction of the various
building blocks of any successful economy, including workforce development, industrial readiness,
continuous infrastructural development, directed policy and good governance practices (American
Progress, 2012). As with all advances STI has also been noted for certain “negative economic
impacts”, including disruptive innovations, obsolescence, irresponsible mechanisation (potentially
resulting in job losses) and some argue the unequal economic benefit that may be derived from
enhanced production processes thereby perpetuating social inequalities within societies (Pianta,
2004, Anderson et al, 2009). These voices, however valuable, are noted and do not distract from the
goal of fully utilising STI toward enhanced growth and social development.
The earlier discussion on the multi-faceted nature of the South African public highlighted a number
of pressing social issues still impacting on contemporary South Africa as a legacy of the inequalities
Stellenbosch University https://scholar.sun.ac.za
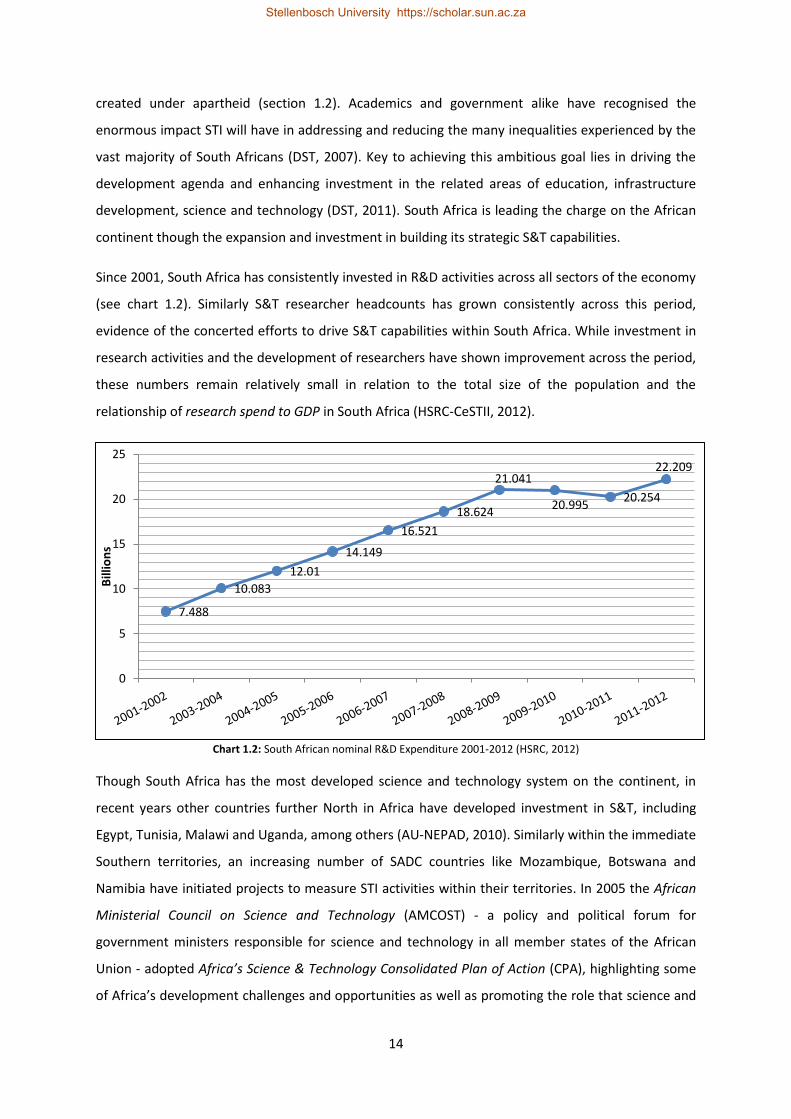
14
created under apartheid (section 1.2). Academics and government alike have recognised the
enormous impact STI will have in addressing and reducing the many inequalities experienced by the
vast majority of South Africans (DST, 2007). Key to achieving this ambitious goal lies in driving the
development agenda and enhancing investment in the related areas of education, infrastructure
development, science and technology (DST, 2011). South Africa is leading the charge on the African
continent though the expansion and investment in building its strategic S&T capabilities.
Since 2001, South Africa has consistently invested in R&D activities across all sectors of the economy
(see chart 1.2). Similarly S&T researcher headcounts has grown consistently across this period,
evidence of the concerted efforts to drive S&T capabilities within South Africa. While investment in
research activities and the development of researchers have shown improvement across the period,
these numbers remain relatively small in relation to the total size of the population and the
relationship of research spend to GDP in South Africa (HSRC-CeSTII, 2012).
Chart 1.2: South African nominal R&D Expenditure 2001-2012 (HSRC, 2012)
Though South Africa has the most developed science and technology system on the continent, in
recent years other countries further North in Africa have developed investment in S&T, including
Egypt, Tunisia, Malawi and Uganda, among others (AU-NEPAD, 2010). Similarly within the immediate
Southern territories, an increasing number of SADC countries like Mozambique, Botswana and
Namibia have initiated projects to measure STI activities within their territories. In 2005 the African
Ministerial Council on Science and Technology (AMCOST) - a policy and political forum for
government ministers responsible for science and technology in all member states of the African
Union - adopted Africa’s Science & Technology Consolidated Plan of Action (CPA), highlighting some
of Africa’s development challenges and opportunities as well as promoting the role that science and
7.488
10.083
12.01
14.149
16.521
18.624
21.041
20.995 20.254
22.209
0
5
10
15
20
25
Bill
ion
s
Stellenbosch University https://scholar.sun.ac.za

15
technology can play in social and economic transformation (NEPAD, 2006). Among the key
challenges has been the continent’s reliance on external financial support and failure to invest
effectively in science, technology and innovation. The STI systems on the continent also had to
contend with issues such as weak linkages between industry and STI institutions, low investment in
science and technology, low numbers of researchers, declining quality of science and engineering
education and the loss of scientific and technological expertise through brain drain. The CPA
provided a framework as to how the improvement of STI infrastructure could respond to socio-
economic challenges facing the continent as well as drive future economic growth. In December
2009 representatives of various African countries met in Ethiopia to discuss a strategic partnership
under the African Science, Technology and Innovation Indicators (ASTII) initiative toward building
shared knowledge and learning surrounding S&T indicator production and the tremendous value of
STI for African development into the 21st century.
Historic datasets exist for regions across Africa, although many of these datasets are not part of a
reliable data series and most, if not all of the data are not based on survey data (Frascati or
otherwise) but are instead data generated as a result of partial datasets or based on estimation by
national experts from within those regions. Table 1.3, below presents selected findings from the first
African innovation Outlook publication that distinctively offered OECD guided surveys of STI
indicators within participating African countries.
Country GERD million PPP$ GERD as % of GDP
Gabon 78.7 0.47
Ghana 120.1 0.38
Kenya 277.8 0.48
Malawi 180.1 1.7
Mali † 37.4 0.28
Mozambique *‡ 42.9 0.25
Nigeria *† 583.2 0.2
Senegal 99 0.48
South Africa 4976.6 1.05
Tanzania* 234.6 0.48
Uganda † 359.8 1.1
Zambia 55.3 0.37
Source: ASTII R&D surveys 2010
Notes: * Data do not include the business enterprise sector, † Data
do not include private non-profit institutions/organizations
‡ Data do not include the higher education sector
Table 1.3 GROSS Domestic Expenditure on R&D (GERD) 2007/08
Despite the dominance of South Africa within the African STI landscape, the above table illustrates
the notable progress in S&T initiatives as well as measurement capabilities throughout the region.
Stellenbosch University https://scholar.sun.ac.za

16
This trend within the African and developing world context reflects global tendencies to shift the
balance from resource, agricultural and manufacturing driven economies to more knowledge driven
economies, and also demonstrates the awareness of the developmental leap that STI may offer
emerging economies (Aubert & Reiffers; 2003, Blankley & Booyens, 2010).
A knowledge driven economy is one which recognizes the important contribution and benefit
information and technology can bring toward national productivity, and actively seeks to develop
systems of deriving real progress from these benefits (OECD, 1996). New Growth Theory seeks to
understand and explain the complex interactions between knowledge and technology as a driver of
productivity and competitiveness (Salvadori, 2003). This theory holds that through directed policy
measures consistent long-term growth and economic benefits can be derived by stimulating
innovative activities and developing the required infrastructure and human resources to extract
growth from these investments (Howitt, 2007). This is emphasized by Peter Howitt in his
commentary on a knowledge economy, saying that “…economies that cease to transform themselves
are destined to fall off the path of economic growth” (Howitt, 2007). Productivity within high-
technology sectors of OECD member countries has developed at increasing rates within the recent
past, with the OECD estimating that more than 50% of GDP within these economies is now
knowledge based (OECD, 1996). The economic and related social benefits of knowledge economies,
its relation to STI, human resource development and the public understanding of science are
interrelated and present a crucial roadmap toward rapid development within the developing world
context. The United Nations Millennium Development Goals (MDG’s) present a global plan toward
addressing issues of underdevelopment and inequality. These goals cover 8 critical areas ranging
from poverty reduction, education, health care, gender rights, environmental sustainability and
global economic partnerships. Significant attention has been directed toward the use of S&T and
specifically information and communication technologies (ICT’s) in achieving and addressing many of
the related issues across the 8 MDG’s.
In the South African context, the lived realities of many citizens are also highly impacted by these
MDG’s and related socio-economic issues described in section 1.2. The South African National
Planning Commission produced the National Development Plan 2030, outlining the strategic vision of
the government toward addressing the many South African socio-economic and developmental
issues as well as opportunities to be addressed by the target year 2030. This document provides a
crucial link between the Millennium Development Goals, S&T, ICT, development and growth for
South Africa as well as its responsibilities across the African continent (National Planning
Commission, 2012).
Stellenbosch University https://scholar.sun.ac.za

17
The DST Ten-Year Innovation Plan (2008) presents many of the grand challenges that lay ahead
within the current decade toward achieving set knowledge economy goals by 2018. The key focus of
the plan is to play a driving role in enhancing national productivity, economic growth and
socioeconomic development within South Africa (DST, 2008). The South African Ministry of Science
and Technology has highlighted four key areas of attention toward achieving these goals. These
include intensifying knowledge generation (R&D and STI activities), improvements in knowledge
infrastructure, measures to address the distance between research outputs and social impacts for
societal benefit and increased investment in human capital development (DST, 2008). The thread
linking each of these goals is based in educational enhancement toward producing a sustainable
pool of suitably qualified and capable human resources. The current state of South African S&T
workers has been noted as a direct barrier to future knowledge economy performance (Kaplan,
2008a and 2008b), and addressing these would be the key toward achieving the ambitious goals of
the DST Ten-Year Innovation Plan as well as the National Development Plan. The ultimate goal of
these policy directed initiatives is to enhance and secure the role played by science and technology
in improving productivity, competitiveness, economic growth and address inequalities by delivering
broad based socio-economic benefits to all South Africans.
South Africa has set its trajectory toward knowledge economy investment, and has made some
progress toward meeting the goals set out in this ten-year plan. Within the post-apartheid period
South Africa has made some progress toward advancing the development ideals in meeting the
social and technological goals of the government. However many have also highlighted the
shortcomings within this period toward recognition and future action within the S&T sector. Noted
in both domestic and OECD reviews of the South African National System of Innovation (NSI), the
change in focus for the South African science system, strained funding systems, lack of government
leadership for S&T as well as a lack of effective policy implementation strategies are just a few of the
hurdles that would need to be overcome for the effective harnessing of S&T for development in
South Africa (OECD, 2007; Kaplan 2008 a & b; Marais and Pienaar, 2010). However there have also
been many successes in training, development infrastructure and successful international S&T
project bids during this period that cannot be overlooked. Among the other goals of the DST within
the Ten Year Innovation Plan, include human capital development, which further recognizes the
need for a public adequately aware of science and technology use and development (Blankley and
Booyens, 2010). This would require a citizenry adequately skilled to a minimum level in areas of
science and technology, in order to meet the demands of various roles within an S&T driven
economy. Though this reality is still some time into the future, the DST recognises the long term
requirement to effectively implement the required changes within any population and has made
Stellenbosch University https://scholar.sun.ac.za

18
human capital development central to the grand challenges within the Ten Year Innovation Plan.
Within this plan, the NSI dependencies are noted and the key areas of attention have been defined
along with the enablers of development toward the set goals. Along with technology investment,
human capital investment and retention is a key aspect of the Ten-Year-Plan. The implementation of
the various strategies toward meeting this challenge is under debate however is slowly making
progress toward achieving the set goals.
Figure 1.1: DST Ten Year Innovation Plan, 2008 (Figure 3, Page 9)
The immediate benefits of S&T, as described previously are highly valued; however it is the long-
term benefits of developing S&T skills within the human capital base that will ultimately be the
critical success factor for knowledge economy development (Harrison & Kessels, 2003; Moon Hee,
2005, Blankley and Booyens, 2010). A citizenry familiar with and able to engage on issues relating to
science and technology is a prerequisite in order to build a healthy democracy and a strong human
resources required to support the development of an effective knowledge economy (OECD, 1996,
Bauer, 2000, Allum, Sturgis & Tabourazi, 2008)
Young people in Africa represent a significant portion of the population, in some regions as many as
60% (Aiwuyor, 2011, Ighobor, 2013). Historically this has been a negative feature within African
demographic profiles, however as these youth populations mature and enter the workforce, it is
expected that the growing economies, and increasing supply of labour within many African countries
will accelerate development and productivity across the region. The median age within the Chinese
population is 34.5 years old however the median age for African populations is 19.1 years old.
Similarly as the populations of the current industrialised nations like China and Japan age, the
demand for labour will inevitably shift toward African economies (Indiwe, 2012). The growth in
Stellenbosch University https://scholar.sun.ac.za

19
technology sectors, such as wireless ICT and mobile telephone services has tremendously impacted
the development space within the African region, with over 950 million mobile subscribers across
the continent. Linked to this is the vast number of young people capitalising on this technological
leap beyond land-line infrastructure and developing promising careers and entrepreneurial ventures
based on this technological revolution (Gedye, 2012). Positive as this image is, these opportunities
are still only accessible to a limited number of young people due to the current constraints that exist
across the African continent, including South Africa. However as investment grows across the region
employment prospects will increase for the many unemployed, though adequate training and skills
would be paramount to capitalise on these on-going opportunities.
As seen with the advancement of many post-fordist technologies and production processes, science,
technology and innovation has tremendous power to generate increased economic prosperity,
create employment and drive growth within a country (Laugksch, 2001). Moreover, particularly
within the developing world context, STI has the potential to uplift communities and sustain
opportunities where previous underdevelopment has been a long-established limiting factor toward
social change (Tongia et. al., 2005). However to meet this challenge, and the many developmental
opportunities presented in its wake, developing countries and in particular South Africa must invest
increasingly in the enhancement of a population able to engage with new and fast-changing
technological environments. South Africa is in a unique position, being among the most developed
economies, and boasting the most advanced communications and infrastructural capacity on the
continent to drive the revolution of African development into the new century. Its relative position
within the BRICs collective and constant learning from OECD nations offers it some developed-
economy advantage within a developing world context. The internal drive to increase educational
and scientific output is notable, however still greater efforts are required toward meeting the above
goals. While it is abundantly clear that not learners and citizens have a desire to enter into a
scientific or technological profession, a basic minimum proficiency in STI is a prerequisite to engage a
new economic model, particularly in economies attempting to catch up to more developed Western
economies. Having outlined the importance of science & technology as an engine of innovation,
competitiveness and economic growth, it thus become imperative to develop a system for the
generation of a key understandings related to the South African public(s) understanding of science as
a non-negotiable toward effectively meeting the goals of future sustainable growth and prolonged
knowledge economy success.
Stellenbosch University https://scholar.sun.ac.za

20
1.4 PUBLIC UNDERSTANDINGS OF SCIENCE RESEARCH IN SOUTH AFRICA
Laugksch (1996) has noted the general introduction of the term “scientific literacy” into the South
African research arena, following a workshop by the South African Association of Teachers of
Physical Science (SAATPS), addressing science education improvements, held in 1978. The definitions
adopted by the SAATPS congress members’ take into account Millers three consecutive dimensions
of scientific literacy, and is likely the entry point of this term into the general discourse among
researchers aligned to the education community in South Africa. In the earlier discussions related to
the history and multidimensionality of South African culture, politics and public life, the period since
1978 has seen a multitude of political changes in South Africa. However these changes have not
yet permeated through all socioeconomic strata in South Africa, with many still not having equal
access to education, social services and adequate employment.
Adopting the concept and purpose of scientific literacy toward social advancement and economic
development Laugksch notes three aims of perusing an enhanced level scientific literacy in South
Africa, including an economic argument, decision making argument and a democratic argument.
Within the economic argument Laugksch notes the requirement of a competent human resource
pool required to develop and sustain a national system of innovation, a key driver of which remains
effective and continuing education beyond the formal primary, secondary and tertiary levels.
Moreover, beyond the theoretical scientific domains, manufacturing and technical areas also require
capable human resource capital to operate evolving technically-demanding production facilities in
areas such as biotechnology, nanotechnology, hi-tech manufacturing and service based industries in
order to promote competitiveness and drive economic growth. Secondly, Laugksch notes the
decision making argument toward promoting scientific literacy in South Africa. This argument string
contends that at a civic and individual level, citizens are required to have a certain level of
proficiency in areas involving science and technology so that effective decision making may follow
from with knowledge driven evaluation processes. This is particularly important in purchasing
decisions, selection of appropriate health related interventions as well as civic responsibilities and its
impact on public policy. This has tremendous implications for both rural and urban development,
particularly for those among the most economically marginalised. Furthermore the implications for
enhanced decision making capabilities, based on increased scientific literacy also have an impact on
environmental factors and planning, with increasing urban populations (Laugksch, 1996). The third
argument Laugksch proposes for advancing scientific literacy relates to its importance in terms of
democracy building and social development of the diverse population in South Africa. This relates to
the previous point on planning and environmental factors, as well as all other areas of interaction
between the public and areas of government. Public knowledge and literacy are key to enabling
Stellenbosch University https://scholar.sun.ac.za

21
individuals to make effective decisions related to public policy and the overall democratic climate
within a country. The competing and, at times, contradictory “scientific evidence” in numerous
public debates requires a background competency in the various disciplines relating to the debates
of the day. In the absence of this background competency the general public is easily influenced by
the position of selected scientific actors and this reliance on “mediators of science” may result in
distorted messages and decisions based on incomplete evidence relating to socially salient areas.
The importance of these three key arguments for advancing scientific literacy is valid in
contemporary South Africa as it was in 1996, and remains the foundational arguments around which
the present study is based.
As in many other countries around the world there have been some studies conducted in South
Africa investigating various aspects of public understandings of science and scientific literacy. Many
of these studies have been survey based, in order to understand current public perceptions about
general and specific science and technology issues. While the detailed literature review (Chapter
Three) will cover a number of empirical studies, both in South Africa and in other regions of the
world, the below paragraphs provides a brief synopsis of empirical work completed in South Africa.
Studies by, among others, the Foundation for Education, Science and Technology (FEST), the Human
Sciences Research Council (HSRC) and the Department of Science and Technology (DST) have been
conducted in order to measure public understanding and attitudes toward science and technology.
Many of these studies employed the scientific literacy and public understandings of science
frameworks in adopting survey instruments to measure public knowledge, attitudes and interest.
Pouris (FEST: 1991, 1993, 2001) looked to study public understandings and perceptions among the
South African public. He studied various segments of the population based on age, race and gender
stratification, and in his later work (2001) studied the various information sources and attitudes
toward science in South Africa. Adopting established measurement instruments, not dissimilar to
those used in the NSF (USA) and Eurobarometer surveys, Pouris attempted to measure South
Africans’ civic scientific literacy and attitudes toward S&T. Despite the value of these studies and its
contribution to the (then) non-existent body of knowledge within this domain of research, many,
methodological questions have been raised relating to these studies (see Reddy et al, 2009). Key
here is issues relating to the instrument validity within the developing world context, as many of the
test items may not have been suitable for the South African public (as explained above). Further to
this sample selection and generalisability of the results were also questioned as these surveys were
administered to small subsets of the population4. Despite this, the use of existing tools and measures
4 Limited geographical coverage, racial representivity and instrument validity are all points of concern in this research
Stellenbosch University https://scholar.sun.ac.za

22
of public understanding of science provides a valuable foundation to conduct further work within
this area.
The HSRC conducted numerous studies on public understanding of science, along general and
specific subject areas. These were administered through the various omnibus surveys of the HSRC,
including the Evaluation of Public Opinion Program (EPOP), South African Social Attitudes Survey
(SASAS) and a number of other client driven surveys. EPOP and later SASAS (1995, 1999) were run
based on a nationally representative sample, administered to individuals 16 years and older in both
rural and urban centres. These surveys collected and reported on public attitudes toward math and
science, attitudes toward science and technology (using the index of promise and reservation) and
assessed public opinion on societal benefits of scientific research. In addition to these, surveys were
also conducted looking at specific issues related to public understanding of climate change (2007)
and public understandings of biotechnology (2004) in South Africa.
Reddy et al (2009) present a summary of South African and international studies on the public
understanding of science and technology and reports generally poor public literacy of science and
technology in both the developed and developing world context, including for South Africa. That
being said, confidence and positive attitudes regarding science and technology appear to be high,
despite poor scores among South Africans on scientific literacy measures. Blankley and Arnold (2001)
report that scientific interventions in South Africa need to take note of the limited scientific
knowledge of the average South African. The root causes of these, particularly in the older
generations can be explained through previous limited access to educational opportunities as
discussed above. However that being said, Blankley and Arnold note that this should be considered
when constructing instruments to measure public understanding of science in South Africa as local
issues and understanding of the social and cultural context of South Africa may be attributing to
poor scores using many of these imported measurement instruments and methodologies.
1.5 OPPOSING OPINIONS
The evidence and support for the concept of scientific literacy and public understanding of science
has been well documented in the literature (see Chapter Two). However despite this there is a small
community of researchers that have expressed various degrees of opposition and reservation as to
the value and benefit of measurement methodologies, educational interventions and the stated
goals of those advocating for increased scientific literacy and an enhanced public understanding of
science. This section will briefly address some of the opposing opinions with respect to scientific
literacy and the public understanding of science, in an effort to present as complete a rationale for
the aims and scope of this study.
Stellenbosch University https://scholar.sun.ac.za

23
Chapter Two presents a detailed literature review of the theoretical evolutions in the study of the
public understanding of science. Within this section various aspects related to the concept and
definition of scientific literacy and the public understanding of science are presented. Paramount to
understanding the concepts under discussion, as well as opposing views thereto, is an understanding
of the definitional characteristics of scientific literacy. Laugksch (1996, 1999) proposes that views for
and against the pursuit of the stated goals of scientific literacy relies on an understanding of the
particular actors and interest groups concerned. Laugksch proposes five factors that influence the
various interpretations of the concept, namely: interest groups, definitional properties, the nature of
the concept, benefits of scientific literacy and measurement approaches. These five factors each
bring multiple facets of perspective to the discussion on scientific literacy and the particular interest
group concerned provides varying interpretations of what is implied in its study. These interest
groups include the educational community, social scientists & researchers, sociologists of science and
informal science communicators (Laugksch, 1996). Assessing the various critical views relating to the
study of scientific literacy and the public understanding of science broad alignment to these interest
groups can be noted, and is discussed in the following paragraphs.
Many of the earliest criticisms of the scientific literacy movement arrived from within the
educational community. As literacy, and in the case of this discussion, scientific literacy is seen as a
key output of the educational community a number of criticisms have emerged from researchers
within in this community. Laetsch (1987, cited in Laugksch, 1996) argues the point that the goal of
education, should not be overly focused on scientific literacy, but should rather be to promote
generic literacy as a goal of education. While Laetsch acknowledges the value of all forms of literacy,
and recognises that not all students will go onto scientific careers, an ample knowledge of science
should be acquired, along with other competencies in order to best prepare learners for post formal
schooling engagements. Addressing a similar pattern of logic, Chapman (1991, cited in Reddy et al,
2009) argues that as the modes of production globally are shifting away from agrarian and industrial
sectors, toward more management and service oriented sectors, science based education will
become of little relevance to learners. In these evolving environments, Chapman asserts knowledge
of science will be superseded by knowledge of technology, where in the workplace will be
dominated by those that suitably adapt to the technological advances that occur. This related
specifically to a capacity to adapt to changing means of doing work, rather than an understanding of
how the technology works (Reddy et al, 2009). Unlike Laetsch, who recognises the value of science
literacy and its relevance to contemporary and future students, in his argument Chapman questions
the value and relevance of compulsory science education at schools. He asserts that as technology
advances it broadens the gap between the rich and the poor, implying that the greater the ability to
Stellenbosch University https://scholar.sun.ac.za

24
capitalise on advances in science and technology the greater the risk of exploitation on those that
are not as scientifically literate.
Morris Shamos delivered his acclaimed book, The Myth of Scientific Literacy in 1995. As an educator
and scientist, Shamos too approaches the discussions on scientific literacy from an educational
paradigm, addressing key issues in science education and the field of scientific literacy. His position
departs by addressing the perception of a crisis in education that emerged in the United States of
America following the Sputnik 1 launch in 1957 (see Chapter Two). The crisis Shamos refers to is the
multiple periods of curriculum reform within the USA educational community leading into the early
1960s, the space race and eventually the cold war. The argument is constructed to challenge the
notion of a crisis in education and through discussing scientific literacy, the nature and culture of
science as well as the required scientific literacy prerequisite on the general public, Shamos suggests
that the goal of universal scientific literacy is unattainable and should not be the driver of curriculum
reform. Shamos believes that the goal of scientific literacy, through formal education is futile, as
becoming scientifically literacy through formal education creates little guarantee that students will
remain scientifically literate into adulthood (1995). Similarly, as global economies had evolved,
Shamos stressed that an appreciation of science and an understanding of technology, at functional
levels and as a practical imperative would become more important toward enabling effective access
and opportunity beyond the oversimplified notions of scientific literacy. It is important to remember
that Shamos is not anti-scientific literacy, but rather challenges the hyper-importance attributed to it
in curriculum reform initiatives in the USA. He calls for a reformulation of curriculum approaches
toward building science as an important cultural and practical knowledge that leads to a required
level of awareness, producing more effective and productive students and adults. Emphasising this
point, the author notes that the goals should be to emphasise the process and value of science
rather than school-learned scientific content. This would empower and enable citizens to engage
appropriately at all levels, and to correctly interpret science communication and expert evidence in
both their personal and civic responsibilities (Shamos, 1995).
Social science researchers and sociologists of science have also weighed in their concern and
opposition to the over importance of scientific literacy and public understanding of science. Turney
(2003) engages Greenfield (2003) on issues relating to the definition of scientific literacy as well as
the structure of the enterprise. Turney asserts that as science has historically, and continues to be a
top down information filtering process, wherein issues of power and knowledge become currency
toward creating segmenting tools, based on as yet undefined criteria of what scientific literacy
should be. Turney believes that the disenfranchisement of the general public with respect to science,
Stellenbosch University https://scholar.sun.ac.za

25
limits their direct agency to influence the direction and speed to scientific advancement, removing
social relevance and as a result influences the publics’ derive to develop an increased scientific
literacy. Similarly, Liu (2009) calls for a similar life-long public participation in science as a means to
increase public influence and thus scientific literacy. In her paper, Liu reconceptualises the concept,
as a result of what she had identified as three-key flaws in the contemporary understanding of
scientific literacy. The first of these is the fact that science has been associated with a public deficit
that must be corrected in the accepted top-down approach. She asserts that this approach negates
the importance of a public already fairly knowledgeable, positive and capable of accusing
information about science when it is situationally required or in increasingly automatic functional
ways. Lui agrees with Laetsch (1987), that this attribution of a deficit, limits what and when the
public will display these learned competencies and too often will moderate the internal motivation
for learning science as a result. The second flaw identified by Lui is the notion of science as a
commodity, something that is acquired and static, rather than a lifelong accumulation of knowledge.
Lui highlights the publication by the American Association for the Advancement of Science,
Benchmarks for Science Literacy (1993) as a key indicator of this flawed approach, noting the false
relationship between the stated competencies in Benchmarks for Science Literacy and an actual
attainment of these competencies in terms of scientific literacy. Thirdly, Lui addresses the idea of
science as a static model and the single directionality of communication within the modern scientific
culture, highlighting the flaws of the adopted top down approach. Lui endorses Roberts (2007)
notions of two visions of scientific literacy by encouraging community participation and a value free
notion of science communication. While this may be seen to be idealistic, as any communication
may be value laden, as a result of language, culture and context, however the notion of a single
direction flow of information encourages the continuation of the accepted practices of science and
science communication and will do little to change scientific literacy (Liu, 2009).
The above opposing opinions on scientific literacy are predominantly based on its relative value to
individuals as well as the over-importance attributed to it within the educational arena. Many of
these oppositions are also located in predominantly developed economy social contexts rather than
developing world communities. The benefits of scientific literacy and an enhanced public
understanding of science, particularly in the developing world context is immense, where technology
and science has a direct impact on quality of life, health, economic productivity and social progress.
South Africa is uniquely positioned as having both developed and developing economy
characteristics, and is ideally suited to responding to its many developmental and social challenged
through the adoption of appropriate science and technology based solutions to leapfrog
developmental stages toward economic and social development (Laugksch, 1996). Within this
Stellenbosch University https://scholar.sun.ac.za

26
developmental context, the value of science, technology and indeed the promotion of literacy on
these fronts present an indispensable opportunity toward rapidly addressing many of these legacy
issues as a result of the previous apartheid policies. While the above views are noted, and their
lessons incorporated into the approach of the current study, the value and opportunity that an
enhanced public understanding of science and scientific literacy presents to South Africa must not be
ignored and urges the research community to expand and enhance the discussion toward
responding to these varied challenges in this young democracy.
1.6 DELINEATION OF THIS STUDY
1.6.1 PROBLEM STATEMENT AND RATIONALE
Having described in detail the uniqueness of the South African context, history and current social
and scientific landscape it is evident that South Africa is at a cross roads. Future social and economic
success will largely be influenced by a citizenry familiar with and informed about pertinent scientific
developments. Within the current knowledge economy context and changing modes of economic
production, there remains a looming crisis of a lack of adequately skilled S&T workforce. Moreover,
the importance of a suitably skilled citizenry able to meaningfully engage within this changing
domestic and increasingly globalised productive landscape remains key toward driving economic and
social progress.
The majority of research has focused on knowledge and attitudinal measurement to varying degrees
of contestation as academic consensus as to definition and meaning of key terms are yet to be
achieved. Greater effort is required to understand elements influencing the public understanding of
science to include public interest, informedness, sources of information and involvement in
engagement activities.
With specific reference to South Africa, there remains a greater need to more fully understand the
many segments of the South African public – as a national effort – in order to best respond to the
multitude of issues impacted by the general public understanding and engagement with science. The
National Development Plan notes the requirement of a highly skilled knowledge producing work
force as well as the ever increasing technological proficiency requirement within evolving labour
markets. A critical issue addressed within the literature is where this highly skilled pool of knowledge
workers will develop from (HSRC-CeSTII, 2010; Blankley and Arnold, 2001, Laugksch, 2000; FRD,
1996). As indicated above, South Africa has displayed, though increasing, relatively poorly equipped
number of high school graduates (Motshekga, 2011, Vavi, 2010), poor skills in mathematics and
science education (IEA-TIMSS, 2007), and even fewer young people going on to S&T based tertiary
Stellenbosch University https://scholar.sun.ac.za

27
education and post graduate programmes (Motshekga, 2011). However the literature also agrees
that an appropriate and meticulously crafted science education policy, that is consistent with the
national skills development objectives, remains a key requirement toward effectively addressing this
issue. Furthermore the importance of effective science communication mediums directed at the
general citizenry is a prerequisite in addressing the socioeconomic development goals as well as the
human resources skills shortage in South Africa within the short to medium term (du Plessis, 2011;
Blankley and Arnold, 2001; Laugksch, 1996). By understanding the social envelope of the many
segments of the South African public this research aims to understand the numerous interrelated
factors that influence the general public understanding and engagement with science.
The development of Indicators remains an imperative toward creating accessible, interpretable and
information driven policy directions for the enhancement of the national system of innovation,
through greater understanding of the interactive space shared by the general public and the
scientific community. A contextual understanding of public perception, civic scientific value,
knowledge and engagement with the scientific enterprise is a required precursor toward effective
evidence based policy formulation that would enhance the current and future social landscape of
the South African people.
This study seeks to measure public understandings of science in South Africa through a public
relationship with science framework suggested by Reddy et al (2009) that takes into account science
literacy, attitudes, interest, information sources and engagement activities through the diverse
social context of the of the South African public. In some ways this framework is a combination of
the frameworks discussed in the theoretical literature review (Chapter Three), and seeks to
understand South African society within the developing world context. As Bauer et al (2007) notes,
“in order to grow and expand the agenda for public understanding of science research, it is important
to view the various frameworks within the study of PUS not as superseding the previous frameworks,
but as evolving from the preceding framework”. This evolution and progression within the
understanding of the publics’ relationship with science should be inclusive of the preceding research
frameworks. Further the reframing of the research agenda to include the development of public
understanding of science indicators highlights the requirement of a performance measurement for
the national system of innovation and would be a valuable and logical next step toward expanding
this area of research.
Stellenbosch University https://scholar.sun.ac.za

28
1.6.2 RESEARCH FOCUS AND HYPOTHESES
This research proposes the first systematic, demographically representative and culturally-aware
survey of the South African publics’ understanding of science. The research seeks to develop a
baseline dataset accessing a nationally representative sample to provide greater understanding of
the challenge that lay ahead as a country, determined to meet the current social and developmental
challenges, with an eye toward strategic future goals. The analysis further seeks to produce a set of
reliable, appropriate and accurate indicators of the South African public understanding of science.
The value and contribution of this research would not only lie in the baseline data collection and
development of indicators, but also in the periodic replication of this research in order to monitor
public understanding of science for evaluative and policy information purposes.
The primary research question for this study is two-fold:
1. To identify a set of indicators to measure the South African public understanding of science
2. Which demographic variables may best serve as predictors to the performance of South
Africans on each of the indicators developed
While the extensive literature review will in many way guide and respond to question one, later
analytic work within the empirical findings of this research will inform the development of six indices
to be used to measure the South African Public Understanding of Science (SAPUS). In responding to
each of the main research questions two sub-question sets will guide the analysis and reporting of
the results in this study
a) What is the Current South African Public understanding of Science (SAPUS)?
a. What is the level of scientific knowledge?
b. What attitudes are held by South Africans regarding science?
c. How interested are South Africans in science?
d. How informed are South Africans about science?
e. What are the main information Sources regarding science?
f. Which are the most frequented Science engagement activities in South Africa?
b) What predictor variables best explain SAPUS scores?
a. How do SAPUS scores vary according to various demographic segments?
b. Which demographic variables show predictive value in explaining SAPUS scores?
Stellenbosch University https://scholar.sun.ac.za

29
Figure 1.2: Conceptual framework for investigating the South African Public Understanding of Science
Figure 1.2 presents the conceptual framework for this study indicating the six elements under
investigation. The study employs a survey research methodology using a quantitative questionnaire.
The questionnaire contains six parts, each relating to an individual element represented in Figure
1.2. Each element has a number of items within the survey instrument that is used toward
developing each of the six indices. In total the questionnaire contains 43 items each accessing
particular facets of the SAPUS elements under investigation. It further includes a number of
demographic classification items that are at times in the analysis considered to be independent
variables influencing the respondent score on each index. The method employed provides an
assessment of a large number of individuals, from across the nine South African provinces and yields
a significant amount of data. The data is useful toward understanding the distribution of knowledge,
attitudes, interest, informedness, information sources and attendance at science engagement
activities. Moreover the data and its related demographic variables allows for greater analytical
possibilities within and across various socioeconomic classifications. The data yield is massive and as
such the analytical framework for this study is deliberately limited in scope to allow for a more
detailed investigation of indicator production, however does reveal the potential for future research
possibilities.
Research Hypotheses
A number of research hypotheses are tested in this study. These hypotheses (listed below) were
generated based on our review of (mostly) South African studies over the past three decades. The
review is presented in Chapter Three (Section 3.2.4).
Stellenbosch University https://scholar.sun.ac.za

30
The hypotheses are listed below according to the six main research themes of the study:
Knowledge of Science
Hypothesis 1a: South Africans are likely to record low scores on an index of scientific knowledge
Hypothesis 1b: South Africans of different demographic categories (race, education, income) are
likely to record different levels of knowledgeability about science
Attitudes to Science
Hypothesis 2a: South Africans are more likely to hold positive than negative attitudes towards
science
Hypothesis 2b: South Africans of different demographic categories are likely to differ in their
attitudes towards science
Interest in Science
Hypothesis 3a: South Africans are more likely to record low than high levels of interest in science
Hypothesis 3b: South Africans of different demographic categories are likely to differ in their
levels of interest in science
Informedness about Science
Hypothesis 4a: South Africans are more likely to record low than high levels of informedness
about science
Hypothesis 4b: South Africans of different demographic classifications are likely to differ in their
levels of informedness about science
Science Information Sources
Hypothesis 5a: South Africans overall are more likely to favour “old technologies” (Radio, TV and
Print) compared to “new technology” (online) information sources
Stellenbosch University https://scholar.sun.ac.za

31
Hypothesis 5b: South Africans of different demographic classifications are likely to differ as far as
their preferred sources of science information are concerned
Science Engagement
Hypothesis 6a: South Africans are more likely to record low than high levels of attendance at
science engagement activities
Hypothesis 6b: South Africans of different demographic classifications are likely to differ in the
frequency of attendance at science engagement activities
1.6.3 STRUCTURE OF THESIS DOCUMENT
This document is comprised of 12 chapters, each covering a particular aspect of the line of reasoning
for the development of indicators to measure the South African public understanding of science.
Chapter Two presents the first part of the extensive literature review. This chapter covers aspects
relating to the theoretical development of scientific literacy and the study of the public
understanding of science. Specifically this chapter addresses the historical development of the field,
the main frameworks as well as a discussion on definitions and the establishment of consensus as to
what should be measured.
Chapter Three continues the literature review by presenting a broad review of empirical work
undertaken within the last 50 years. The review considers the global developmental divide that
exists across countries and begins with studies conducted in the developed world followed by
studies undertaken within the developing world context. Beyond the major OECD, National Science
Foundation and EuroBarometer surveys, this section also presents some of the varied analysis
performed within these surveys. The review of empirical work from within the developing world
includes China, Malaysia, and India and concludes with a review of key South African studies within
this field. The last section, Chapter Three particularly highlights the dearth of empirical and
theoretical work specific to the South African context and highlights the contribution this thesis
hopes to make.
Chapter Four introduces the methodological considerations employed within the conceptualisation,
design, development and implementation of this study. It initially revisits the discussions on science
indicators and indicators of scientific literacy and the public understanding of science. Taking the
Stellenbosch University https://scholar.sun.ac.za

32
content of section 1.2 (above) into account this chapter then establishes the link between the South
African social context and the value of nuanced PUS indicator production, rooted within the
multidimensional South African context. Chapter Four further discusses the development of the
research instrument employed in this research as well as the implementation requirements and
schedule. The chapter concludes by presenting selected data outputs and data requirements for
indicator development.
Chapter Five through to Chapter Ten presents the results and analysis of the fieldwork phase. Each
results chapter is complemented by a related Appendix chapter containing additional analysis and
background information. This section of the thesis presents a summary of the demographic
characteristics of the survey sample and population description. It continues to build the
demographic profile of the sample, defining some of the data reduction strategies employed within
the analysis. It goes further to present the analysis and the findings for each of the hypotheses
discussed above and the result presented at the appropriate point.
Chapter Eleven, following from the analysis in chapter five though ten, presents each of the six
indices created by discussing the item selection; an examination of the empirical relationships
between the items and selected other variables; Index construction and scoring as well as index
validation. The results by selected demographic variables are also presented for each of the 6
indices. Chapter Eleven concludes with the presentation of the multinomial logistic regression
analysis investigating which demographic variables could be considered predictors to the outcomes
of South Africans on each of the six indicators developed.
Chapter Twelve presents the summary and conclusion of this research. It specifically discusses
the results of the analysis in chapters five through to chapter eleven, with a focus on the key
demographic variables that predict performance on each of the six indices produced within this
study. The chapter continues by revisiting each of the hypotheses proposed within Chapter One
and concludes by proposing recommendations for future research within this area in South
Africa. A closing recommendation is proposed that highlights some of the key requirements
toward the development of a composite indicator measuring the South African Public
Understanding of Science.
Stellenbosch University https://scholar.sun.ac.za

33
1.6.4 VALUE OF THIS RESEARCH
The research resources and outputs developed from this study will be of increasing value to
researchers, policy makers and science communicators (in both the private and public sector),
as South Africa continues its shift toward a knowledge-based economy. The results are also
aimed at serving the more immediate need of policy makers and science communicators in
addressing the crucial gaps in particular demographic clusters regarding certain domains of S&T
research (DST, 2008). Further understanding and the development of tools to further study the
public(s) relationship with science and technology will go a long way toward not only building a
more inclusive S&T system, but also address the crucial social, human and democracy building
potential that lies in understanding this, often complex, interaction between science &
technology and the general public(S) (Reddy et al, 2009).
Stellenbosch University https://scholar.sun.ac.za

34
Chapter Two
Literature Review: Theoretical Evolutions
Like other relationships, science and society is not just a matter of distance, but also one of quality. We need to explore in some detail how the different groups, maybe in equidistance from science, relate to its achievements and
propositions.
Martin Bauer (2009)
INTRODUCTION
As described in Chapter One, science and technology influences the daily lives of most every human
in direct and, increasingly, in indirect ways (Reddy, et al, 2009). All technologies, products, public
records, access to information, healthcare and learning are in some implicit or explicit way grounded
within a science and technology derived solution. As already discussed, the pervasive nature of
science and technology impacts at all levels, stimulating social and economic growth, and is
therefore salient for academic enquiry (Royal Society, 1985). Though most people might not be
aware of this daily upstream link with the world of science and technology, understanding and
advancing the study of the relationship between science and the public is vital for the ambitions of
South Africa and its people (DST, 2007).
Science has considerable potential to contribute to national growth, yet much of this potential
remains latent due to the current relationship between science and the public (Burns et al, 2006).
However, there remains great value in understanding and enhancing the relationship between the
public and the scientific community toward harnessing the inherent social and developmental
benefits of science and technology for growth and development. South African society, as discussed
in Chapter One, is highly stratified. It is this stratification - in terms of science and technology
knowledge, attitudes and access to information - that makes understanding the levels of scientific
literacy particularly difficult to measure within the social context of contemporary South Africa
(HSRC, 2004).
Despite the apparent difficulties with regard to measurement, understanding the nature of the
relationship between science and the public is extremely important, particularly for a developing
economy like South Africa. A positive relationship between science and the South African public will
promote the goals of the knowledge economy. As a more informed and educated public acquaints
itself in the domain of science and technology, it will be more open and best adapted to the
changing modes of production within a modern knowledge economy context (DST, 2008). Further to
this, a public more informed and interested in science and technology issues will be in a better
position to provide the crucial human resource base required to build this knowledge economy,
Stellenbosch University https://scholar.sun.ac.za

35
thereby enhancing employment and social development in the long term (Reddy et al, 2009). The
value of this relationship between science and the public is further strengthened by the notion that a
society more informed is thereby more able to be actively involved in decision-making and policy
formulation and is therefore a democratically active society, thus furthering the ideals of democracy
and nation-building through developing understandings of this relationship (Laugksch, 1996).
The field of Public Understanding of Science (PUS) is still evolving, and since the 1960s has attracted
much debate as to the relevance of its impact on society. Studies of this nature aim to explore the
measurement and measurable impact on development, as well as the many constructs within the
public understanding of science research domain (Nowotny, 2001; Bora & Heiko, 2006; Reddy et al,
2009). Despite this, as an emerging field of study in South Africa, with valuable research having been
conducted - which at times led to intense debate regarding methodology and practice - its relevance
and importance within the developing world context cannot be overstated (Pouris, 1991, 1993,
2001; Blankley and Arnold, 2001; HSRC, 2004; StatSA, 2005).
2.1 SCIENTIFIC LITERACY AND THE PUBLIC UNDERSTANDING OF SCIENCE5 - HISTORICAL OVERVIEW
The cultural roots of scientific literacy go back to the introduction of modern science into Western
civilisation, approximately during the 16th century. Sir Francis Bacon, Thomas Jefferson, Benjamin
Franklin and many preceding them noted the pervasive contribution science and its study may offer
society and humanity as a whole (Hurd, 1998). Much of the modern history of public understanding
of science leading to the scientific literacy movement in the early 1980s was and continues to be
linked to educational curricula reforms in relation to national priorities and the competencies
expected of school leavers. A brief synopsis of the period predating the 1980s is presented below to
provide some historical context for the discussion on the three paradigms of research on
scientific literacy.
Despite the extensive and at times controversial history of science itself, much of the history of
contemporary Western science education is centred within the European and American social
envelope. As a direct impact of colonialism in South Africa, large elements of this history and
subsequent structures were inherited and incorporated into the South African science and education
system, and further racially impacted due to the influence of the government and the apartheid
system. Much of the historical context described below is directly due to the evolution and study of
European and American science policy, political and social events in those countries, and their
influence on educational policy. The result of these policies, political and social evolutions directed
5 In this sections public understanding of science is referred to by its earlier umbrella term scientific literacy
Stellenbosch University https://scholar.sun.ac.za

36
much research and theory development in education in general, but also in science and technology
policy, and has served not only to guide research in the United States and Europe but been adopted
and critically assessed by the global research community active within this field.
Before the mid-19th century, due to early opposition to science entering the school curriculum,
much of early, colonial-styled scientific learning was centred on museums, universities and
academies of science, as specialist areas of study and inquiry. Formal science instruction only
became part of the school curriculum in Europe and the USA during the latter part of the 19th
century. William Sharp, the noted British surgeon and physician is credited in 1850 as being the first
formal science teacher in British public schools after developing a model for the instruction of
science in the school curriculum (Power, 1897).
Despite the initial insufficiency of science education within the school curriculum, it was recognised
by practicing scientists that, notwithstanding the dominant influence of the humanities in
educational syllabi of the time, an incorporation of the sciences into curriculum may have a
profound impact on the future effectiveness of the learner as a productive member of society
(DeBoer, 2000). Shamos (1995) notes the influence of Herbert Spencer (1855) and Thomas Huxley
(1880), among others, in igniting public interest around the issue of this dominant view of 19th
century education, which was primarily concerned with literature and the humanities. Their classic
essays note the potential value of science education for the long-term benefit to the individual
learner and to society. Though their view was not widely adopted at the time, its value has come full
circle and is acknowledged in contemporary education, where scientific subjects occupy an
important role in modern educational curricula.
In the late 1890s, a critical theme emerged in educational philosophy as a direct result of the impact
of science and technology on contemporary society of the time. The influence of science in
imparting the essential intellectual training beyond deduction and toward more induction-centred
reasoning fostered a more independent approach to education and inquiry. It was further postulated
that this revised philosophical approach and its impact on education would develop the empowered-
student and the resultant outcome of educational attainment (DeBoer, 2000).
The dawn of the 20th century saw the emergence of the first of three major education reform
movements in the United States (Shamos, 1995); the first of which appeared in 1916 with John
Dewey’s legitimisation of the study of science in the school curriculum and the proposal of the
promise of independence of thought, learning and action it presented students. Dewey referred to
the evolution of this ‘independence’ as the development of habits of the mind (Dewey, 1916).
Stellenbosch University https://scholar.sun.ac.za

37
Dewey’s work influenced much of the early 20th century thinking about education, and particularly
science education, with its many references to life experiences, independent investigation and the
advancement of society.
Between 1916 and the late 1940s, the second period of reform began with a number of United
States commissions established by the National Education Association (USA) with the mandate to
develop educational curricula with an extended theme of making education relevant to activities of
daily life, rather than purely as a study of specific scientific subject matter, of value to both future
scientists and non-scientists (DeBoer, 2000). The focus of the relevance to daily life criterion for
science education related specifically to the goal of science teaching and the impact on social
progress, cultural patterns and the life of the individual within society (Hurd, 1998). With the war
years (1939-1945), the period following 1942 saw massive progress in many scientific fields, notably
nuclear energy, space exploration, technology, communication and human biology (Laugksch, 2000).
This scientific progress was driven for the most part by the need, particularly in the USA and Europe,
for reindustrialisation, and the desire to remain globally significant both militarily and economically
through harnessing of science for the purpose of accelerating progress and national growth (DeBoer,
2000). A major theme that emerged in this period was the challenge to ensure that science
education reforms keep pace with the progress achieved in these scientific areas (Shamos, 1995).
These challenges and reforms within education were aimed at ensuring that, along with harnessing
the brightest scientists within research and industry, society also developed a highly educated
citizenry that understood the scientific process in this period of great progress and public investment
in the scientific enterprise (DeBoer, 2000). In October 1958, Hurd proposed that the new goal of
science education should be to increase scientific literacy6 within society through enhanced
educational approaches to teaching science in schools. Hurd noted the requirement of a balance
between the drive to develop the critical scientifically competent workforce while simultaneously
inculcating an appreciation for the cultural value and intellectual process of scientific discovery
(1958, 1998). Hurd’s ideas about scientific literacy had gained significant traction by the early 1960s,
with Waterman proposing that ‘Progress in science [depended] to a considerable extent on public
understanding and support of a sustained program of science education and research’ (1960).
By the time US president John F Kennedy delivered his famous “We choose to go to the moon”
speech, launching the USA’s goal of landing a man on the moon, the Russians had already launched
the satellite Sputnik-1 in 1957 and Vostok-1 in 1961, successfully placing a human being in orbit
around the earth for the first time in history (NASA, 2013). Despite the generally positive public
6 Defining Scientific Literacy is a theme that will be discussed in the next section of this chapter
Stellenbosch University https://scholar.sun.ac.za
38
support for the United States space program, increasing concern emerged about the ability of
science education to maintain pace with scientific advancement and a changing technology
landscape being imposed on society during that time (Laugksch, 2000). This concern from within
American society sparked significant reform in science education to address perceived low levels of
scientific literacy within that society. Similarly, in Europe and particularly in the United Kingdom, the
late 1960s saw a period of increased public investment in science and education in response to many
reforms in policy (see Edgerton, 1996). This was yet another catalyst period in the history of scientific
literacy, initiating the third science education reform period in the 20th century (Shamos, 1995).
Laugksch (1996), drawing extensively on the work of Roberts (1983), cites the period between 1960
and 1980 as a particularly important time in the history of scientific literacy. He notes that within this
period, understanding of what the meaning and definition of scientific literacy is and should be,
attracted much debate. The work of this period gave rise to an array of definitions, to a point where
Roberts concluded, ‘…scientific literacy virtually came to be an umbrella concept to signify
comprehensiveness in the purpose of science teaching in schools’ (Laugksch, 2000 p. 73).
The economic conditions in the Western nations in the 1970s and early 1980s juxtaposed the
emergence of economic and industrial powers in the Far East, which again brought American (and
British) economic competitiveness to the fore (see Japanese post-war economic miracle). With
science and technology recognised as a key driver of economic development and growth, American
science policy highlighted the decline in research output and thus correlated this with a declining
economic performance during this time. The focus on American research capacity and
competitiveness highlighted what Shamos (1995) calls a ‘perceived crisis in science education’. This
encompassed what was seen to be ‘an inevitable’ education and human resource shortage in the
near future, as well as its implications for development, competitiveness and economic prosperity.
The ‘crisis’ reignited interest in scientific literacy research in the early 1980s in both the United
States and Europe. On their Project 2061, including the publication of ‘Science for All Americans’
(1989), the US National Science Foundation and the American Association for the Advancement of
Science (AAAS) collated leading multi-disciplinary thinking on the inputs required to improve public
understanding of science for the next generation of school leavers. In addition, the publication of the
Royal Society Report, The Public Understanding of Science (1985) further intensified European
interest and research within this field. This period is the focal point of what is now commonly
referred to as the three (3) paradigms used in public understanding of science research. These
research paradigms are also referred to as the deficit models of public understanding of science
Stellenbosch University https://scholar.sun.ac.za

39
research, as each ascribes a deficit of particular traits to a particular actor or groups of actors within
the research sphere (Bauer et al, 2007).
Period and Research Paradigm Attribution deficit Research Areas
Science Literacy
1960s onward Public deficit of knowledge
Measures of literacy,
Educational policy
Public Understanding of Science
After 1985
Public deficit of attitudes
Education
Knowledge and Attitudes
Attitude formation and change
Science and Society Trust deficit, Expert deficit, Public
confidence
Public participation, Mediators of
science, Evaluations of impact
Table 2.1: Chronological Period and Research Paradigm: Adapted from Bauer, Allum, & Miller; 2007 page 80
Each of these paradigms will be briefly explored in the following section, highlighting its
development, key points, criticisms and relative contribution to the contemporary consideration of
the public understanding / relationship with 7 science.
The study of the public’s understanding / relationship with science has changed over time; as a
result the methods and frameworks employed in furthering the development of this field have
transformed with the debates of the day. The various research frameworks within this discipline
have all proposed methodological improvements and wide-ranging epistemological critiques on the
preceding approach. However, Bauer et al (2007) have presented the argument that rather than
assume each of these paradigms supersede each other, they should be seen on a continuum of
theoretical evolution, complementing each other, each building the understanding and expanding
the agenda of public understanding of science research into the future.
2.2 MAIN FRAMEWORKS FOR THE STUDY OF THE PUBLIC UNDERSTANDING OF SCIENCE
2.2.1 SCIENTIFIC LITERACY
Despite the extended history of interest in science education and its influence on the study of the
public understanding of science (PUS), the main stimulus of the modern PUS movement reached
critical mass after the 1960s and particularly in the 1980s. The epicentres of theoretical and research
progress in this domain were primarily within the United States and the United Kingdom, though
during that time a number of scholars from further afield had also contributed to the foundations of
this research area (see Roberts, 1983). As discussed previously in this chapter, during the mid-1950’s
and early 1960s there was a crisis of legitimacy for science in the United States, where the scientific
community had to rally support from the public for science and technology projects, particularly
7 Relationship is included here as a result of the changing focus in the field of scientific literacy / public understanding of
science
Stellenbosch University https://scholar.sun.ac.za

40
those of national importance (Laugksch, 1996; DeBoer, 2000; Wolf & Barton, 2004; Bauer et al,
2007). Public support would ensure government support for these projects and therefore continued
or enhanced funding flows as a result. Public support is however dependent on a citizenry equipped
and empowered to see the value and engage in debates pertinent to the scientific enterprise and its
influence on society. The corollary, from the perspective of the scientific community, was the
required citizenry, knowledgeable and supportive of the work of the scientific community (Miller,
1983). In the 1983 special issue of Daedalus, the journal of the American Academy of Arts and
Sciences, a number of academics, teachers and scientists noted the deplorably low levels of scientific
literacy among American citizens, and forewarned of the impact this may have on the economic and
political future of the country. The concern raised, and the ensuing questions posed to the academic
and educational institutions, launched the scientific literacy movement in the United States of
America, giving rise to renewed efforts to address scientific literacy within that country’s population
(Lewenstein, 1992, in Turner, 2008).
Similarly, in the United Kingdom, the publication of the Royal Society Report on The Public
Understanding of Science (1985), while sharing certain points in common with the American
movement, noted with grave concern another dimension of the science/public relationship. The
report committee, chaired by Dr W. F. Bodmer, highlighted the traditional relationship between the
scientific community and the general population, in particular, the diminishing public support for the
scientific enterprise within the United Kingdom (Turner, 2008). This social pressure on the political
climate naturally led to funding constraints and, ultimately, reduced scientific output during this
time (Noble, 2013). Among other recommendations, the committee called for increased
communication between the scientific community and the general public, highlighting the role to be
played by both industry and the media toward meeting this goal. The scholastic fraternity were also
encouraged to reform science education, encouraging mandatory science instruction to all learners
at the primary school level (Royal Society, 1985). With the advances in society, and the increasing
human interaction with science and technology during this period, it was deemed necessary to
develop an understanding and facilitation of the relationship between science and the public, which
led to the development of the scientific literacy framework for conducting research during this time.
During the initial period (1960-1983), research on scientific literacy remained relatively
uncoordinated, and the development of precise measures didn’t emerge until the mid-1980’s. Jon D.
Miller referenced the 1979 National Science Foundation’s Science and Engineering Indicators Survey
in his 1983 paper, and from his analysis, reported relatively low levels of scientific literacy in the
American population. A tenuous agreement resonated within the research fraternity with respect to
Stellenbosch University https://scholar.sun.ac.za

41
the perceived low levels of scientific literacy within general populations as well as the need to
develop an understanding on how to accurately define, measure and address public scientific
literacy. Regardless, the scientific communities on both sides of the Atlantic faced the challenge of
locating agreement on the precise definitional aspects that surrounded scientific literacy and its
relationship to measurement (Miller, 1983; Shamos, 1995; DeBoer, 2000; Laugksch, 2000; Bauer,
2007; Holbrook & Rannikmae, 2009). Prior to this stage, extensive work had been published in the
area of scientific literacy, as previously discussed. Much of those discussions related to education
curriculum reform as well as areas of definition related to scientific literacy8. Miller contends that
the most salient point of misunderstanding was in relation to the meaning of literacy: what it meant
to be literate; whether it was having received formal education in a specific subject matter or having
the basic knowledge to read and write (Miller, 1983). While much of the historical debate related
specifically to the relevance of science instruction within the increasingly specialised education
domain (see Huxley, 1880; Arnold, 1882; Snow, 1959; Wollheim, 1959; Trilling, 1962 and Green,
1962), Miller puts forward the view that all of these, whilst discussing the meaning of being literate
and (or) learned, fail to efficiently discuss the effective communication and learning of science within
a contemporary social context. In his 1983 landmark paper, Miller explores the historical debate
surrounding the definition of scientific literacy, noting Gabel’s (1976) assertion that scientific literacy
by that time had come to mean so many things that it defined everything in relation to the assumed
value of science education, but at the same time could not be of any use theoretically or practically
(Laugksch, 1999). Though a constant definition of scientific literacy is not agreed upon universally
within the academic community, noted scholars within this field do agree that the work of Miller
offers the most consistent definitional characteristics over time (Bauer et al, 2000, Burns, 2003, du
Plessis, 2011).
Miller (1983, 1987, 1998) defined scientific literacy to include three (3) key dimensions to be met at
a minimal level: a) Knowledge of scientific facts, b) an understanding of scientific methods and c) an
understanding of the relationship between science and society. The main thrust of this research
approach is that a scientifically literate person should be able to understand basic scientific and
technological terms, facts and methods. It goes further to highlight the importance of an
appreciation of the outcomes of scientific activities and the value this extends to society. Miller went
on to note the importance of a public capable of identifying valid scientific fact, and the rejection of
superstitious and pseudo-scientific beliefs not derived from scientific methods (e.g. astrology,
numerology). Bauer, et al (2007) notes the double analogy when understanding scientific literacy as
both the drive for basic literacy through education as well as the requirement of that literacy toward
8 Will be revisited at a later point in this chapter
Stellenbosch University https://scholar.sun.ac.za

42
becoming a democratically active citizen. Laugksch (1996) further emphasised these analogies under
his three (3) arguments for the acquisition of scientific literacy, namely, the economic benefit, the
decision-making capabilities as citizen and consumer as well as the democratic and social application
of the skills acquired in the pursuit of both basic and scientific literacy.
The key research focus in the scientific literacy paradigm is the psychometric testing of factual
scientific knowledge (Bauer et al, 2007). This is achieved through the use of quantitative, usually
survey-based, methodologies. More recently qualitative methods have also been applied to
introduce a greater degree of reflexivity (Wynne, 1991; Bauer, 2009). Applying the three (3)
dimensions of scientific literacy, Miller used the 1979 National Science Foundation survey, which
included the required test items to develop the first estimates of national scientific literacy in the
United States under a single measure (Miller, 1983). Laugksch identified three (3) distinct
measurement traditions in scientific literacy/public understanding of science research, including the
sociological approach, science educator’s approach and the social scientific approach (Laugksch
2000). The last of these is predominantly concerned with understanding and describing trends
within a given population with respect to - in the case of scientific literacy - acquisition of scientific
knowledge, specific attitudes toward science and its impact on society as well as societal support for
science and issues of scientific significance (Laugksch, 1996). Researchers invested in this tradition
of scientific literacy measurement have historically adopted these quantitative approaches to
measurement using large scale surveys, standardised questions and produced composite measures
as indicators of scientific literacy within a given population (Laugksch, 2000).
Miller constructed research items and instruments that isolate the basic elements of scientific
literacy for the given population. The United States National Science Foundation (NSF), initially, and
later, the Eurobarometer surveys, employed these measures of scientific literacy in order to develop
early indicators in the area of scientific literacy research, and they have subsequently been adopted
by many countries in Europe and the Far-East (Bauer, 2009). These measures have been revised over
time and distilled to its essential components: knowledge of scientific facts and methods, though it is
still debated to what degree these measures have been adapted from Miller’s original definition
(Beveridge & Rudell, 1988). Millers’ measures of scientific literacy continue to be used today and
provide useful measures as to the level of scientific literacy, despite the various critiques regarding
the international comparability and cross-cultural compatibility of these measures in different
settings (Bauer et al, 2007, Raza et al, 2002).
This Scientific Literacy model presents the argument that the public is by default deficient regarding
knowledge of science and technology facts, methods and policy issues, when compared to the
Stellenbosch University https://scholar.sun.ac.za

43
scientific community. Assessments of scientific literacy under this model, employing quiz-like test
items to produce composite measures of scientific literacy, usually highlight these deficiencies within
given populations. It was therefore concluded from this that a scientifically illiterate public would
not be able to fully participate in effective decision making and policy decisions, nor adequately
appreciate, nor derive benefit from science and technology due to these measured deficiencies in
scientific literacy (Burns et al, 2003). Miller proposed that it is the responsibility of the scientific
community to correct this deficit, as lack of knowledge may lead to negative appreciation for the
value of science and thereby negatively impact on the progress of the scientific community in the
long term (Miller, 1983).
Scientific literacy became known as a deficit model(s) of public understanding of science research,
attributing this deficit on the public, as a means to attract attention to the education agenda
(deBoer, 2000). However, others have argued that these measures only consider formal scientific
knowledge, excluding informal, indigenous or practical scientific knowledge, thereby not accounting
for cultural variables that may impact on measured scientific literacy (Bauer & Durrant, 1997, Raza et
al, 2002). This lack of cultural reflexivity highlights an inadequacy within the scientific literacy
paradigm, particularly when it is considered in a differing cultural context, as the constructs may be
seen as not sufficiently sensitive to accurately measure scientific literacy particularly in the
developing world context, given variances in education and cultural distance (Raza et al, 2002).
These issues have been addressed through the use of item analysis and item response theory to
ensure validity and appropriateness of test items within scientific literacy assessments (see Miller
and Pardo, 2000).
A further criticism of the scientific literacy paradigm is that as a framework for conducting research it
assumes a positive relationship between public knowledge and the public relationship with science,
and also does not make allowances for a negative relationship between the public and science
following knowledge acquisition (Reddy et al, 2009). This is further endorsed by Raza, Singh and
Dutt’s statement (2002) that individuals may have ‘conflicting and coexisting beliefs about the same
subject matter simultaneously’, and that this, together with the exclusionary nature relating to the
belief in superstitions may potentially render a large portion of the religious / alternative beliefs
population as scientifically illiterate according to Miller’s definition. The deficit adopted under the
scientific literacy framework presupposes a power relationship between science and the public and
in many ways it soap-boxes the scientific community, where it appears to be public-focused but
instead serves an education agenda through one-way communication channels. This places the
Stellenbosch University https://scholar.sun.ac.za
44
scientific enterprise at risk of alienating the public from science, which is counter to the ideals of the
public understanding of science research community (Sturgis & Allum, 2004).
The scientific literacy framework was created to develop a baseline measure regarding the extent of
public knowledge of science and technology subject areas (Miller, 1998). This remains valuable
today, within the context of the education and national policy agenda that calls for more directed
educational interventions to combat this imposed ‘scientific literacy deficit’. Naturally, this will have
the related socio-economic and democratic implications for a given population and, through
effective research and action, when interpreted within a specified social context, may deliver a
tremendous positive benefit to both the research community and all members of society.
2.2.2 PUBLIC UNDERSTANDING OF SCIENCE
The period following the early 1980s and the landmark work of Jon Miller (and others), stimulated
many debates, and as a result considerably advanced the body of knowledge generated in that time
(Evans and Durant, 1989; Bauer et al, 1994; Laugksch, 1996; Durant, 1999; Miller, 2001; Bauer,
2007). While Miller and his counterparts were popularising and exploring the many research
dimensions of scientific literacy in the United States of America, in the United Kingdom the political,
social and institutional aspects of science were under increasing scrutiny (Gregory, 2001). By the
early 1980s, Britain under Margret Thatcher was experiencing many economic challenges. Key
among these were an initial slowing of economic growth, civil unrest related to high unemployment,
privatisation of state owned companies as well as a general reduction in public spending (Osbourne,
2013). This was of particular concern to the scientific community as these political and social
challenges all had direct consequences for the advancement of science within then contemporary
Britain. By the middle of the 1980s, science and technology-related R&D (Research and
Development) had developed an industrious private sector component, responsible for a
considerable number of projects. With a significant component of public-funded R&D projects under
private control, public participation and information on state-spending regarding science and
technology was generally low (Gregory & Lock, 2008, in Reddy et al, 2009). Similarly, following the
immediate post-World War 2 period, British public attitudes toward science had dramatically shifted
from a sense of ‘promise and optimism’ to one of ‘disappointment and hostility’, and by the 1980s
there was a general sense of ambiguity within the British population related to perceptions of
science (Miller, 2001). Scientists themselves began to operate increasingly in a ‘cocoon mentality’,
predominantly communicating within their own circles of specialisation, maintaining the medium of
the highly specialised scientific journals and symposiums as the preferred transmitters of scientific
discoveries and discussions - further alienating the public from developments within the scientific
Stellenbosch University https://scholar.sun.ac.za
45
community (Ziman, 1991). This, allied to the socio-political climate of the day, raised many public
concerns regarding science and technology spending under Thatcherism. The scientific community
almost immediately responded by trying to understand the general public’s views related to science
and technology issues and to find ways of improving the relationship between science and the
public.
In 1985 the British Royal Society, under the chairmanship of Dr W. Bodmer, published a report
entitled The Public Understanding of Science, wherein it described what the committee of eminent
experts distilled to be the essential elements of the relationship between the scientific community
and the public (Royal Society, 1985). In the Royal Society report, Bodmer and his colleagues had put
forward the opinion that the contemporary public-science relationship had left the scientific
community increasingly vulnerable to critique from the public. This placed future support and
scientific advancement at risk of stagnation due to changing public opinion of the perceived value
and contribution science - in particular, publically financed science - delivered to society (Royal
Society, 1985; Miller, 2001; Bauer, 2007). Following the Royal Society report, the Committee on the
Public Understanding of Science (CoPUS) was established in the United Kingdom to facilitate and
develop schemes to understand public attitudes to science and enhance the flow of knowledge and
communication of science toward the general public.
Following the Royal Society report in 1985, Public understanding of science (PUS) emerged as a
research paradigm. Though it shares many concerns with the scientific literacy framework, its main
focus is on understanding public attitudes to and interest in science, and how this relates to scientific
literacy and its overall impact on the science/public relationship. The public understanding of science
framework holds that the public is not positive enough about science, and this (presumed) negativity
had become a point of concern for science institutions and the scientific community, particularly in
the United Kingdom, but also in other parts of the world (Durant, 1999). For researchers working
within the public understandings of science research paradigm, this new focus expanded the
research agenda from more than just measuring literacy, to one that also included understanding
public attitudes and interests relating to science and technology (Ziman, 1991). Hence, science
communication became of increasing focus as the quality of communication was seen to be highly
influential in developing positive attitudes toward science and technology.
The research agenda became increasingly concerned with the development of reliable measures to
assess attitudes toward science. Daamen & Van der Lans (1995), in particular, noted the scientific
Stellenbosch University https://scholar.sun.ac.za

46
interest in understanding the relationship between general and specific attitudes9. Others too have
noted the relationship between general and specific attitudes and the complexity it brings to the
science-public relationship, its measurement and effective means of developing enhanced outcomes
for public involvement (Pardo and Calvo; 2002). With the advent of the public understanding of
science framework, the multi-dimensionality of the public’s relationship with science is
acknowledged in some degree, as it takes into account not only knowledge, but also attitudes
toward and interest in science and technology as key elements in the public-science relationship
(Laugksch, 1996; Bauer, 2000; Bauer 2007). Both the National Science Foundation (Science and
Engineering Indicators) and the European Commission (Eurobarometer) studies now include
attitudinal measures and interest-in-science evaluation elements from the public understanding of
science framework in their large scientific literacy surveys in the United States and Europe,
respectively.
The major shift away from research under the scientific literacy paradigm is that - where scientific
literacy is a qualifying measure - where one is either ‘scientifically literate or not’, within the public
understanding of science paradigm a continuum is established where the results are expressed as a
public being ‘more or less knowledgeable’. This was seen as a more constructive and less offensive
research output than previous measures (Evans & Durant, 1989, in Bauer 2009). Ziman (1991)
outlines the early period of the public understanding of science research framework, noting in
particular that the preceding scientific literacy framework offered little interpretative value to
researchers interested in understanding the complex nature of the public-science relationship.
Where the scientific literacy framework adopted the simple axiom, the more people know, the more
they would be supportive of science, the public understanding of science framework questions this
simple linearity and highlight the multi-dimensionality of the public relationship with science. Bauer,
Durant and Evans (1994) present an examination of varied international research studies to
challenge the assumption of a simple linearity in understanding the science-public relationship. They
conclude that the simple linearity, assuming that more knowledge leads to more interest and
ultimately more positive attitudes toward science, is inadequate in light of the research findings
suggesting that greater information acquisition may have multi-dimensional influences on attitudes
related to various scientific areas (Bauer, Durant & Evans; 1994, Allum, Sturgis & Tabourazi; 2008).
These considerations advance the study of the public understanding of science toward a more
contextual approach, understanding the multifaceted elements active in attitude development and
how this influences public perceptions of scientific investigations and outputs (Miller, 1991).
9 General attitudes refer to attitudes toward science in general, while specific attitudes refer to specific scientific issues
(climate change, biotechnology etc.).
Stellenbosch University https://scholar.sun.ac.za

47
The period following the Bodmer report (between 1985 and 1990), had dramatically influenced the
science-public relationship in Britain (Durant, Evens & Thomas, 1989). With the establishment of the
Committee on the Public Understanding of Science (CoPUS), changing low levels of scientific literacy
and developing positive attitudes toward science were among the primary aims of PUS researchers
(Miller, 1991). In certain aspects the ideals of CoPUS was self-serving in that the intended outcome
of interventions for an enhanced public-science relationship ensured a more positive view of
scientific activities. Moreover, what CoPUS achieved was a mobilisation of the scientific workforce
toward a more public-focused communication and knowledge dissemination approach.
The major criticism of this research framework is that, like its predecessor, it imposes a deficit on the
public. Under the public understanding of science framework the deficiency imposed on the public is
not only related to knowledge, but also in relation to positive attitudes of the public toward science
(Miller, 2001; Bauer, 2007). The proposed solution to this deficit is through enhanced
communication of information to the public, as lack of information is seen as the driver of negative
attitudes to science and, by increasing public access to information, the impact of this negativity can
be mitigated. The key component for the science community here is the notion that a
knowledgeable public would be more inclined to support scientific endeavours rather than hold
biases and negative opinions relating to science initiatives and research (Miller, 2004). This approach
has attracted some criticism as it automatically assumes that a public is deficient in positive attitudes
and that there exists a desire to learn about science and technology issues, which is counter to much
of the contemporary theories about learning and attitude development (Stocklmayer & Gilbert;
2002). Furthermore it is claimed that this research framework does not take into account the
literature on attitude formation and impact of knowledge and resistance to attitudinal change (Eagly
& Chaiken, 1993).
As with the scientific literacy framework, the public understanding of science research paradigm
continues to engage the public with a single-direction flow of information, despite the enhanced
focus on science communication (Bauer et al, 2007; du Plessis, 2011). This unidirectional flow of
information perpetuates the scientific communities’ relative position of power as the disseminators
and moderators of knowledge flows toward the general public (Miller, 1991). Battrawi et al (2013)
discusses the impact social media and the emergence of the Web 2.010 has had on changing the
influence of these power relations. Through enhanced bidirectional information flows and greater
collaboration with respect to direct information through web-based tools (websites, apps etc.)
networks consisting of generally interested members of the public and public-focused researchers
10 Web 2.0 relates to the emergence of more interactive and collaborative web-based interactions, rather than the former static web pages of the early online experience.
Stellenbosch University https://scholar.sun.ac.za

48
work in collaborative virtual communities to enhance information sharing and learning. Their
findings relay the success of case studies in viable scientific communication through web-based
platforms, offering collaborative opportunities via social media interfaces. The penetration of these
services and multi-platform accessibility options represent viable new research and communication
channels as the World Wide Web continues to evolve. However, particularly in the developing world,
internet access remains relatively low, despite slow recorded infrastructure growth.
Much debate has surrounded public understanding of science as a research framework, including
deliberations regarding methodological protocol (survey research or qualitative research), whether
this framework truly serves the public and whether public involvement is, in fact, a stimulating or a
moderating influence on science - as seen in the case of genetically modified foods (GMO) foods and
early stem cell research (Pardo &Calvo, 2002; Critchley & Turney, 2004; McCarthy, 2010). Despite
these debates, the public understanding of science research framework lends itself to understanding
the science–public relationship in clearer terms. As Einsiedel et al (2001) argue, public participation
in science in the early phases of research, rather than just as an impact assessment, is increasingly
valuable, though not without criticism and caution.
Building on the scientific literacy framework, the public understanding of science paradigm seeks to
understand the public-science relationship with greater definition than before, through the inclusion
of public attitudes and interests in science measures. The increased public participation, and ongoing
debates can be seen as highly constructive, facilitating increased communication and information
flows between the public and the scientific community (Locke, 2002). What is clear from numerous
research reports is that the general public has a declining interest in science and technology
activities, despite increasing factual knowledge and access to information (Pouris, 2001/2006; Japan
Science Report, 2001; India Science Report, 2005; Eurobarometer, 2010; NSF, 2010). This may be
due to a trend of information fatigue where the increased availability and access to information has
the opposite impact on interest in the subject matter (Darzentas et al, 2007). Despite the concern
about the public understanding of science research paradigm with regard to issues relating to its
incompatibility with contemporary theories about learning, outside of the education agenda and
within the measurement domain there remains definite value for the research community under this
research framework for ongoing study of the public-science relationship (Stocklmayer and Gilbert,
2002).
Stellenbosch University https://scholar.sun.ac.za

49
2.2.3 SCIENCE and SOCIETY
The European BSE11or ‘mad cow disease’ crisis, which started in the mid-1980s, and the public panic
that ensued, saw an awakening within the scientific community, which began to take many of the
critiques of the preceding two research paradigms into account (Jasanoff, 1997). The lack of effective
public communication during the BSE crisis resulted in information being misinterpreted, leading to
a sense of panic among consumers and hastening a European Union ban on British beef exports in
1996 (Stastny, 2005). Similarly the early discussions around GMO foods and stem cell research
altered the public-science-policy edifice as much nuclear research was altered after Hiroshima in the
late 1940s and early 1950s. While the interest in scientific literacy and public understanding of
science didn’t diminish, in the late 1990s a new research paradigm dawned, one that realised the
direct value and importance of the public-science relationship and did not view the public simply as
incidental to the scientific enterprise (Pardo &Calvo, 2002).
Following the critiques of the preceding two approaches, the 1990s ushered in changes to the study
of the public understanding of science. This awakening within the scientific community reframed
scientific advancement as more of a dialogue with the public. This saw the emergence of a more
‘contextual approach’ to the technological and research work of scientists, wherein knowledge flows
were to become bi-directional and, in addition to the scientific enterprises’ monopoly of scientific
fact, the value of public opinion, local knowledge and social realities were increasingly being
included to direct and promote scientific work (Miller, 2001). By the late 1990s, survey results
emerging from the numerous studies within the scientific literacy and public understanding of
science paradigms in the UK and elsewhere had revealed high general levels of interest in science.
These surveys however indicated low levels of general public understanding of scientific
developments and scientific fact (Burns, et al; 2003). Within this climate of low measured scientific
illiteracy, Sturgis and Allum note the appearance of a rising ‘public scepticism about the benefits of
science’ as well as an increase in negative attitudes in relation to technological advancements
(Sturgis & Allum, 2004).
In 2000, the British House of Lords Special Committee on Science and Technology published a report
entitled Science and Society, declaring a ‘crisis of public confidence in science’ (House of Lords
report, 2000). The report highlights the obvious reality that science is a socially constructed
enterprise that operates within a social context but that had in some respects come to be seen as
insulated from the broader public (Bauer et al, 2007; Miller, 1998). Conducting scientific activity
within a space devoid of social considerations and influences had, within the British context, invited
11 Bovine Spongiform Encephalopathy (BSE), commonly known as Mad Cow Disease
Stellenbosch University https://scholar.sun.ac.za
50
a degree of public ‘hostility’ toward science (House of Lords report, 2000). The challenge faced by
the research community, and highlighted in the Science and Society report was revised to include the
understanding that public attitudes are informed by a variety of values, and the inclusion of this into
research and policy was to be the critical task of the paradigm in order to increase public support for
the enterprise. Sturgis and Allum (2004) note further evidence of public unease in relation to the
real and potential risks associated with scientific advancements, from the concern related to DDT
use in the 1960s to more contemporary public concerns, particularly in the United Kingdom. The
impact of public opinion, particularly in relation to risk assessment of scientific work, had been
highlighted as a powerful tool to swing the direction and progress of research (Miller et al; 1997
cited in Sturgis and Allum, 2004). The realisation of the enormous influence the public had on the
direction and funding of (particularly public-financed) scientific work was highlighted by Lord
Sainsbury, lead author of the House of Lords report, when he claimed ‘the demise of the deficit
model, instead calling for an increase in public-science communication under what he termed the 3
D’s – Dialogue, Discussion and Debate (Miller, 2001).
The idea of a public deficit attributed by the scientific literacy and public understanding of science
frameworks has been reversed in the Science and Society paradigm (Bauer et al, 2007). Within this
new framework it is not only scientific literacy, attitudes and interest that impact on the public-
science relationship, but also the social context in which the public is located as well as the social,
cultural and political influences that impact on the manner in which citizens interact with the world
and the interpretation of information received. Bauer et al (2000) notes that the deficit within the
Science and Society framework, is not attributed to public knowledge or public attitudes, but rather
to the deficit of public engagement on the part of scientific actors and institutions that protract the
belief of a public deficit on those fronts (Bauer, Petkova & Boyadjieva, 2000). Science and Society
holds that the manner in which the public is perceived by the scientific community, and the various
deficits imposed upon them, contribute to the communications approach employed, which
discounts the impact of political, social and cultural influences on public perceptions of science.
Furthermore, the attitudes and perceptions within the scientific community are highlighted,
illustrating the misconceptions that perpetuated this perceived public deficit notion under the public
understanding of science and scientific literacy paradigms (Reddy et al, 2009). Thus the public deficit
notion was now reframed to include a deficit of positive attitudes and meaningful public interaction
by scientists themselves toward the public’s perceptions of science (Bauer et al, 2007).
The heterogeneity of the public is more fully appreciated when the multiple segments of society are
acknowledged and the variability of communication approaches that would need to be mobilised
Stellenbosch University https://scholar.sun.ac.za

51
under this approach are brought to the fore. The mobilisation of the scientific community toward a
more public-centred approach was now popularised under this paradigm (Bauer, 2009). This feeds
into public science policy and its subsequent impacts on public perception and apparent limitations
on public participation in science (Felt & Fochler, 2008). The reframing of science as a product of
social enquiry, technological and ideological accomplishment and human cultural heritage
enveloped within the various societal and cultural milieus highlights the central concern of
contextualisation within this research paradigm (Mansur, 2009). The traditional view of delineated
public science interaction areas had been one of skewed power and authority relations. Within this
understanding, scientists and researchers, as practitioners and custodians of science, had been
perceived as being at the top of the knowledge pyramid, sharing ad-hoc information with a less-
knowledgeable public. This view discounted the influence public and civic institutions had on the
direction and evolution of the scientific enterprise and was seen to generate negative public opinion,
which led to an essential lack of trust between the public and scientists that had to be corrected
through public involvement and consultation (Stilgoe, et al, 2005 cited in Bauer et al, 2007).
The proposed ‘new approach’ highlighted in the House of Lords report under the science and society
framework calls for the earlier inclusion of public participation in scientific endeavours toward
resolving the ‘crisis of trust’ that had emerged between the public and the scientific community
(House of Lords Report, 2000; Miller, 2001; Bauer et al, 2007). The ‘crisis’ referred to was seen as a
two-directional one where on the one hand the abovementioned lack of public trust in the scientific
enterprise, and on the other the mistrust of the public by the scientific community on the grounds
that due to low knowledge and an apparent lack in positive attitudes, public involvement in science
may be counterproductive12. The focus of attention then is in relation to the deficit of technical
experts who are publically accessible to more effectively interact with public groups and therefore
foster a more secure connection between the public and the work of the scientific community. The
report recommended many ways in which the public could be brought earlier into the consultation
process with the research community - including public talks, citizen juries, review mechanisms,
science centres and public communication training for scientists - toward bridging the gap between
the two communities and rebuilding public trust in science (House of Lords, 2000). As a result, the
perceived mistrust between the public and scientific community could be addressed through early
inclusion of public input. Furthermore this addresses the lack in bi-directionality of information flows
between science and the public at an early stage, rather than having a one dimensional flow of
information toward the public on a post-hoc basis (Raza, 2002).
12 Some have argued that because of the “deficit” approach employed by preceding measures of scientific literacy and public understanding of science (attitudes and beliefs) frameworks, the study of the public is in itself tainted with bias toward the public from within the research community as a result of these earlier measures (see Bauer et al, 2009).
Stellenbosch University https://scholar.sun.ac.za

52
To achieve this, Rose (1999) argues that a ‘mediator’ act between the scientific community, policy
makers and the public in order to facilitate information exchange, education and communication.
These mediators [sometimes called angels] (Bauer et al, 2007), are tasked with rebuilding trust -
both public trust towards scientific disciplines and vice versa. These often take the form of pressure
groups, NGOs or politicians who serve the needs of both parties, toward enhancing interaction and
greater understanding across the board. However, the House of Lords Report (2000) also notes that
various approaches other than these mediators may play this role, including public opinion hearings,
public conferences, national debates or citizen juries. These activities extend beyond just research
projects and research outputs, but also include issues related to research policy, communication and
national scientific productivity profiles as important points of influence in the science-public
interaction space. Within this milieu, the media also has an enhanced role as communicators of
scientific advances with the aim of promoting access to information, awareness, interest and
positive attitudes toward science and technology-related areas (Rose, 1999). In South Africa, the
media, with respect to public communication of science, has been shown to contribute a
disproportionate share of editorial space to science-focused articles in media reporting (Van Rooyen,
2004; Claasen 2009, 2010). This is of particular relevance to the ongoing advancement of the South
African science and technology system, in a country of many languages, cultures, beliefs and access
to educational opportunities (see chapter 1.2). The importance of cultural relativity and indigenous
knowledge systems extends into the science and society research framework as it decentralises the
attention from “formal” scientific activities to include more informal or everyday scientific activities
(Wynne, 1992; Miller, 1998; Raza et al, 2002; Du Plessis, 2011). Ziman and Wayne (cited in Miller,
1998) propose the notion that scientific meaning as a basis for a public understanding of science, is
socially negotiated and the presumption that formal science supersedes ‘local and informal
knowledge’ only promotes a deficit attribution. The Science and Society approach empowers the
public to become active contributors to the scientific discipline, thereby enhancing their educational,
employment and participatory prospects within a system that rewards the highly-skilled. Gauchat
(2010), however, notes the risks associated with this approach as it could create an overemphasis on
certain aspects within research, yet agrees with Wynne, Raza et al and Du Plessis in relation to the
importance on local knowledge within the scientific domain.
The shift in research approaches and deficit attribution under the science and society paradigm does
not however mean that there is no public knowledge or attitude deficit. What it does, however, is
reframe the responsibility toward addressing that deficit to the scientific community (Miller, 2001,
Raza et al, 2002). The case for literacy and the creation of positive attitudes remains a concern, yet
the call has evolved toward a more interactive space wherein shared learning can be used to
Stellenbosch University https://scholar.sun.ac.za

53
overcome these perceived obstacles. The recent increase in interest in scientific media across
various platforms, from journal publications to social media platforms and blogs by both scientists
and non-scientists has offered a new avenue to share ideas and information on scientific work for
both the scientific community and the general public (Blik & Goldstein, 2013). While this does not
always have the intended reach due to issues related to access and technical skill, particularly in the
developing world context, it does present an important technological evolution that may in the
longer term aid the scientific literacy agenda beyond the measurement domain.
This evolution of the study of public understandings of science has been described by Fuller (2000)
as a ‘new deal with society’, bringing together both sides of the public-science chasm toward a
better working relationship. This improved public involvement and upstream information-sharing
approach, rather than the one-dimensional information filtering provides the space for
empowerment of both parties while ensuring effective and accurate information sharing. Within the
science and society framework, research and intervention are often blurred, leading to little
agreement on how to accurately apply measurement techniques under this framework (Bauer, et al,
2007). Despite the notable conceptual alterations from scientific literacy and the advantage of
cultural sensitivity it exhibits over the public understanding of science paradigm as a research
framework, measurement for the purposes of developing indicators remains an ongoing challenge
(Reddy et al, 2007). Bauer et al note, however, that the contemporary approach to evaluating the 3
D’s approach of public consultation reprises the earlier methodology of public understanding of
science and scientific literacy with respect to its application of survey protocol, albeit in relation to
public participatory activities (Bauer et al; 2009).
2.3 THE EVOLUTION OF MEANING: DEFINITIONS AND THE PUBLIC UNDERSTANDING OF SCIENCE13
The three frameworks discussed above and the historical context underpinning their development,
evolution and impact on the study of the public understanding of science all converge when trying to
assimilate a sense of meaning toward the development of an actionable definition for research
application. Within the context of this study the view has been adopted that despite the three (3)
research paradigms being conceptually dissimilar, when distilled to their essential elements, they
present a far richer and more complementary view toward effective research in this domain (Bauer
et al, 2007). The underlying interest within each paradigm relates to levels of public knowledge,
public attitudes and public participation and, when integrated, represents a viable model for the
13
Here the terms “public understanding of science” and “scientific literacy” do not refer to the specific research frameworks described above, with their varying focus on knowledge or attitude acquisition, but are instead used to describe the body of knowledge within this research domain, as a means to simplify and forward the discussion of this concept within this paper, and may be used interchangeably or simultaneously. Where otherwise intended, this will be denoted.
Stellenbosch University https://scholar.sun.ac.za

54
construction of a scientific knowledge ecosystem within which the individual, as the basic unit of the
‘general public’ exists. Despite the understanding that an absolute measurement of the public
understanding of science is both complex and particularly challenging to fully achieve,
epistemological work continually informs evolutions in research approaches (Wenning, 2011).
The traditional approach to studies of this nature has located itself within the boundaries of one of
the abovementioned research paradigms, each exhibiting the complementary and critical response
attributed to the specific framework within the academic literature. Much of this critique is related
to the varied interpretations of what it means to be ‘scientifically literate’ and what the study of the
public understanding of science’ in reality should entail. However, as previously noted, definitional
aspects have played a crucial role in developing ever-expanding notions of the nature of this at times
controversial concept. Laugksch (1996) likens the concept of scientific literacy to terms such as
liberty, justice and happiness (p. 23); highlighting their simple, socially understood properties, and
also similarly present highly complex definitional characteristics. Due to the multi and inter-
disciplinary nature of the study of scientific literacy (or the public understanding of science),
research from diverse theoretical branches of academia have made significant contributions to the
modern conceptions within this domain and as a result has confounded cross-interpretability
between the various interest groups actively involved within this domain. Laugksch has proposed
five (5) factors that influence the various interpretations of the concept, namely: interest groups,
definitional properties, the nature of the concept, the benefits of scientific literacy and
measurement approaches. These five factors each bring multiple facets of perspective to the
discussion on scientific literacy and within that, provide varying interpretations of what is implied in
its study (Laugksch, 1996). The review of definitions below adopts the five elements within
Laugksch’s conceptual overview. It further asserts that the most salient of these facets is located
within the interest groups promoting the study of scientific literacy. This departure from Laugksch is
related to the notion that the remaining four factors within Laugksch’s conceptual model are all
dependent and resultant from the general approach and perspective of the interest group
concerned. Consequently, the influence of the interest group promotes a particular notion of the
public understanding of science, the nature of the concept, its benefits, measurement approaches
and definitional properties and is all then directed within the particular world-view of that interest
group. The review below will therefore focus primarily on the impact of interest groups in focusing
the study and definitional properties of the varying notions of scientific literacy and the public
understanding of science.
Stellenbosch University https://scholar.sun.ac.za

55
2.3.1 INTEREST GROUPS
Interest groups represent a variety of ideological positions and may differ significantly on a common
point of interest. Jeffery Berry defines an interest group as ‘an organised body of individuals who
share some goals and who try to influence public policy’ (Hays, 2001). These may have an alignment
to business, labour unions, public health issues or educational initiatives (Chari et al, 2010). Scientific
literacy has commonly operated within the educational agenda, and has been positioned as
important for ongoing and effective educational attainment (deBoer, 2000). However, despite the
shared educational importance within scientific literacy, Laugksch (1996) identifies four (4) main
interest groups operating within the research community that influence the interpretation of public
understanding of science and scientific literacy research beyond the educational sphere.
The first of these is the science education community, who are primarily concerned with the goals of
science education, educational reform, quality of education and assessment of educational
outcomes with a primary focus on the formal educational setting, assessment and curriculum
reform. Laugksch then highlights the social scientists and researchers as a second interest group
actively involved in this research area. The main concern for this interest group is in understanding
public support for science, the attitudes associated with it and the sources of scientific information
within a given population. The focus of this interest group is in relation to measurement and
indicator development, and is primarily concerned with the school leaving, post-schooling and adult
members of the population. The third interest group is the sociologists of science, who are
principally focused on the authority of information, how information is disseminated and received
by the general adult population and the impact this has on the public support for science. Lastly,
Laugksch (1996) identifies the informal science communicators’ interest group, usually working
within the journalistic or museum and auxiliary science educational environments. The key focus for
these individuals centres on the effective communication of science and the public interaction with
scientific information among all age and population groups.
The core focus and community of concern for each of these interest groups directly influences the
operationalisation of key aspects within the study of the public understanding of science. These may
directly influence the understanding of the nature of the concept, proposed benefits of scientific
literacy and measurement approaches within Laugksch’s conceptual view of scientific literacy. It
further is directed toward specific public and policy action areas as a result of the particular world-
view adopted by researchers advocating public understanding of science and scientific literacy
research (see Lewenstein, 1992). These interest groups and the researchers that emerge from within
them, influence the operationalisation of the concept of scientific literacy and the public
Stellenbosch University https://scholar.sun.ac.za
56
understanding of science through the formulation and adoption of definitional characteristics suited
to the ideals of the various research traditions informing those groups.
2.3.2 Definitional characteristics
As a basic foundation of the measurement of the public understanding of science, the precise
definition of scientific literacy has been the objective of many researchers since the 19th century
(Millar, 2007; Osborne, 2007; Hodson, 2008; Wenning & Wenning-Vieyra, 2009; McGregor &
Kearton, 2010). The above discussion on interest groups outlines the discussion on the definitional
characteristics of scientific literacy through the influence of interest groups and the many
researchers that have attempted a mutually agreeable definition since at least the mid-20th century
(e.g. Snow, 1969; Shen, 1975; Miller, 1983; Hazen & Trefil, 1990; Burns et al, 2003; Holbrook, 2009).
Layton et al (1994), in their publication on behalf of UNESCO, document a list of scholarship
dedicated to the area of scientific literacy, highlighting one hundred and ninety five (195) definitions
of scientific and technological literacy , to varying degrees of agreement.
The works of Laugksch (1996), Zuzovsky (1997), DeBoer (2000), Roberts (2007) and Hodson (2009) all
offer comprehensive reviews of the evolution of the definitions of scientific literacy and the public
understanding of science. Whilst many of the earlier debates of the 19th and 20th century related to
the discussions around the ‘two cultures of science’ (see Huxley, 1880; Arnold, 1882- cited in Miller
1983; Snow, 1959 and Leavis, 1962), the latter part of the 20th century altered the discussion toward
a greater focus on the contextualisation of science and its application to lived human experience
(Feinstein, 2010).
Despite the ongoing definitional conversations and discussions, what early advocates like Huxley
(1880), Dewey (1934) and Davis (1935) call the concept of ‘scientific attitudes’ or ‘habits of the mind’
remain central to the study of the public understanding of science (Zuzovsky, 1997). These concepts
relate specifically to the notion that open-mindedness, fact-based intellectual integrity and the
interest in testing opinions and beliefs are important for the advancement of the individual and
society as a whole (Anelli, 2011). While acknowledging the foundational work of the early
contributors to the field, it is clear that the watershed period for the epistemological advancement
in this discipline dawned post-World War 2, with the many scientific and technological
advancements that were made then, as discussed earlier.
In 1958, Paul Hurd, a member of the educational interest group, proposed that the goal of formal
science education should be the development of a ‘scientific literacy’ in students. The term, under
Hurd, implied the development of an understanding of science and its implications for the
Stellenbosch University https://scholar.sun.ac.za

57
development of the individual as a socially, politically and economically active citizen (Hurd, 1958).
Much of this was related to the post-Sputnik socio-political period in the USA discussed previously,
as Hurd emphatically states the importance of a scientific literacy for the continued special progress
and security of the American people (Hurd, 1958 – p.52). Following Hurd, a number of scientific
literacy advocates emerged from within the education agenda during the 1960s, advocating
curriculum reform toward a scientific literacy focus - what Laugksch calls ‘the period of legitimation’
(Laugksch, 1996; Baybee, 1997). Many of these advocates rallied behind Hurd’s (1963) definition of
scientific literacy, which included the knowledge of scientific concepts, an understanding of the
relationship between scientific concepts and an awareness of the limitations of science. Shamos, in
this same period, highlighted a form of social scientific literacy, in which the outcome of scientific
education is a scientific literacy where an individual feels comfortable talking with others about
science in non-technical terms (Wenning & Wenning-Vieyra, 2009, p.28). Koelsche (1965) raised yet
another definition of scientific literacy, seeing it as an accumulation of knowledge and skills required
to understand science as presented by the media (Hazen &Trefil, 1991; Goolam, 2001). In his
research, Koelsche proposed one hundred and seventy-five (175) scientific principles and six
hundred and ninety-three (693) scientific words that regularly appeared in the media and should
form the foundations of scientific teaching in the educational curriculum in order to foster a greater
degree of scientific literacy – under his definition (Koelsche, 1965 - cited Wenning & Wenning-
Vieyra, 2009). Pella et al (1966) performed an analysis, in studying 100 journal articles identifying six
(6) characteristics of a scientifically literate person (Laugksch, 1996). These characteristics include an
understanding of a) the interactions between science and society b) the ethics of science c) the
nature of science d) the basic concepts of science e) the relationship between science and the
humanities, and f) the difference between science and technology (Layton et al, 1994; Goolam,
2001). Showalter (1974) continued the work of Pella et al (1966) and defined scientific literacy as
having seven (7) dimensions, and providing a specified list indicating a continuum of characteristics
developed within the scientifically literate person that was not seen in the contemporary definitions
of the time (Wenning & Wenning-Vieyra, 2009).
The role of the demand for access to science-focused knowledge since the late 1950s in shaping and
focusing the democratic development of public policy in relation to scientific developments and
funding was explored by Benjamin Shen in 1975 (Zuzovsky, 1997). Shen proposed three (3)
categories of scientific literacy: cultural scientific literacy, practical scientific literacy and civic
scientific literacy in describing a need to teach science in a real world context (Wenning & Wenning-
Vieyra, 2009). Cultural scientific literacy included the appreciation of science as a major human
achievement, practical scientific literacy included an understanding of the basic concepts in, and
Stellenbosch University https://scholar.sun.ac.za

58
applications of, science in order to improve everyday living standards, while the third category, civic
scientific literacy, included the knowledge and understanding required of a democratically active
citizen able to engage in contemporary scientific debates (Anelli, 2011). Laugksch (1996) notes that
these categories of scientific literacy are not mutually exclusive and an individual may have varying
degrees of each kind of literacy and further denotes the importance of these in relation to
democratic development, particularly in the developing world context. Similarly, Hazen & Trefil
(1991) and Miller (1983, 1998) also explore civic scientific literacy and continued from the work of
Shen, claiming civic scientific literacy as critical for citizens in modern society (Anelli, 2011).
Branscomb (1981 – cited in Laugksch, 2000) defined scientific literacy to include the ability to ‘read,
write and understand systematised human knowledge’ (p.77). Like Shen, in her analysis, Branscomb
(1981) identified eight (8) classes of scientific literacy important to effective human engagement
with science and society, and related to a particular context of human engagement (see Laugksch,
2000, p. 77). The classes of scientific literacy proposed by Branscomb operated within the science
policy paradigm, offering multidimensional approaches to the study of scientific literacy and the
public understanding of science applicable to various practical application contexts (Goolam, 2001).
This idea of functional literacy is further shared by Dewey (1934) and Miller (1983) in the
development of the three (3) consecutive dimensions of scientific literacy that have become the
basis of contemporary measurement indices (Bauer 2007, 2009; DeBoer, 2000). Miller’s multi-
dimensional approach to measurement focused on three dimensions of scientific literacy, namely a)
an understanding of the methods of science, b) an understanding of the facts and concepts of
science and c) an appreciation of the impact of science on society (Miller, 1983; p. 33-35). Miller’s
definition proposes an outcome whereby, for a citizen to be scientifically literate, they would
essentially need to possess the skills to read, write and engage meaningfully in daily activities and
interact with scientific material in the media or vocational settings (Miller, 1983, 1998, 2004). In
Miller’s definition, scientific literacy became a threshold measure, relative to the standard set by
knowledgeable members of society, and thus may vary depending on the context of
operationalisation (Anelli, 2011). Miller contends that in a democratic society, the level of scientific
literacy in the population has important implications for the democratic, economic and decision-
making capabilities of individuals, who constitute the basic unit of the ‘public’. Many of these ideas
have been incorporated into Arons (1983) 12 attributes of scientific literacy and its importance in
application to everyday life and Baarah & Volk (1994) on the influence and application of science
(cited in Goolam, 2001).
Stellenbosch University https://scholar.sun.ac.za

59
Hazen and Trefil (2009) defined scientific literacy or the public understanding of science as “the
knowledge you need in order to understand public issues”. This refers to the knowledge assumed to
be known by the audience that need not be explained in order to fully grasp the topic under
discussion. Laugksch (1996) likens this to the concept as seen by Hirsch (1987 – in Laugksch, 1996) as
the de facto sine qua non of social interaction, and of particular importance to science
communication. To Hazen & Trefil, as it was with Dewey, Miller and Arons, scientific literacy implied
grounding in the fundamentals of science in order to fully participate as a citizen in a democracy.
Hazen and Trefil (2009) note in their introductory chapter that, ‘one needs to know some facts, be
familiar with some general concepts, to know a little about how science works and how it comes to
its conclusions, and to know a little about scientists as people’ (page XXI). They propose 18 key
concepts, which they call great ideas and believe ‘frame virtually all scientific advancements’, that
all citizens need to be familiar with in order to be scientifically literate (Hazen and Trefil, 2009).
Gabel (1976) differed from the abovementioned scholars in that he proposed a two-dimensional
model of scientific literacy (Liu, 2009). The first dimension dealt with the types of content involved in
scientific literacy, such as the facts, process and methods of science. The second dimension involves
the types of reasoning involved in assimilating scientific knowledge and the manner in which this
impacts the varying forms and levels of scientific literacy. Likewise, Shamos (1995), most commonly
associated with the opposing the dominant views on scientific literacy in the modern educational
interest group, identifies three (3) types of scientific literacy: cultural scientific literacy, functional
scientific literacy and true scientific literacy (Shamos, 1995; Liu, 2009). Under Shamos, cultural
scientific literacy requires that the individual has a basic familiarity with scientific concepts and
terms, while functional scientific literacy demands that, in addition to the individual being familiar
with the concepts, they are also able to apply them meaningfully. The distinguishing factor between
these two typologies is that where cultural scientific literacy is passive, functional scientific literacy is
active and transforms the individual from a mere recipient of information toward interrogating and
communicating scientific information (Laugksch, 1996). The third level, under Shamos (1995), is true
scientific literacy, which includes an understanding of the overall scientific enterprise as well as the
major theories and contributions to science advancement. Shamos adopts the view that these levels
of scientific literacy are evolutionary, and as an individual continues to engage ever-more closely
with the scientific discipline, the scientific mind-set evolves. While it is noted that the first two levels
are fairly common in contemporary society, Shamos does acknowledge that the third level of
scientific literacy is exceedingly difficult to attain due to increasing specialisation within the varying
knowledge areas in the scientific discipline (Shamos, 1995; Laugksch, 1996; Liu, 2009).
Stellenbosch University https://scholar.sun.ac.za

60
Baybee (1997) similarly identifies a continuum of five types of scientific literacy, from nominal,
functional, conceptual, procedural and multi-dimensional scientific literacy. These five types of
scientific literacy share much with the model offered by Shamos (1995), but differs in that multi-
dimensional scientific literacy is not as stringent as Shamos’ true scientific literacy and is therefore
more attainable by a greater portion of the population. More recently, Norris & Phillips (2003)
proposed that scientific literacy or the public understanding of science would involve varying
degrees of influence from a list of eleven (11) components they identified as most relevant. These
are: content knowledge, understanding of the applications of science, the nature of science, the
independence of science, scientific habits of mind, applying scientific processes to problem solving,
participation in scientific issues, recognising sciences’ relation to culture, appreciating the outputs of
science, knowledge of the risks and benefits of science and the ability to think critically about
science. Feinstein (2011) continues from the concept of functional scientific literacy introduced by
Miller in 1996, by proposing useful scientific literacy in arguing the meaningful social and personal
application of science to daily living.
The definitions of scientific literacy and the public understanding of science have evolved over time
and as a result of the various researchers and interest groups seeking to find a common point of
departure for measurement. Hurd (1998) notes that the contemporary trend toward hybridisation
across scientific investigations, including the public understanding of science, adds to the ongoing
dilemma in arriving at a point of common definition. Lewenstein (1992) notes that the influence of
post-World War 2 developments in the United States, in particular, not only accelerated the amount
of science information directed toward the general public, but also highlights the increasing public
appetite for science following the many wartime technological developments that held promise for
increased quality of life. Despite the lack of agreement in definition, Lewenstein notes the overall
agreement among researchers of the intent of the scientific literacy and public understanding of
science movements as one embracing the ideal of developing a greater public appreciation, interest
and awareness of the benefits, developments and value science offers society (Lewenstein, 1992).
The respected historian of science Michael Shortland notes, ‘…to become scientifically literate is to
become an active and effective citizen’ (cited in Sapp, 1992). What has emerged in the above
analysis of the changing meanings of ‘scientific literacy’ and the ‘public understanding of science’ is
that the initial work of Dewey (1934), Davis (1935) and later Shen (1975) and Miller (1983) have
given rise to common definitional threads that are visible in the very essence of the work that has
followed them. Holbrook and Rannikmae (2009) note this and highlight two major streams in public
understanding of science research with regard to definitions: the first stream advocating a pivotal
Stellenbosch University https://scholar.sun.ac.za

61
role for knowledge and attitudes, and the alternative stream highlighting societal usefulness in
defining scientific literacy.
What is most important in the above review of the various definitions of the public understanding of
science is the evolutionary nature of the concept, and the changes the definitions undergo as
science evolves and changes its relevance to society. These scientific and technological advances
provide a framework within society from which to constantly review and revise the definitions of
scientific literacy and the public understanding of science (Hurd, 1998). The common characteristics
presented in the table below represent viable dimensions as a point of departure from which to
embark toward developing a definition for measurement in the current study.
Period Main Contributor Proposed working definition
1930 Dewey The main outcome of general education
1952 Conant A broad social understanding of science for practical application
1958 Hurd An understanding of science and its application such that the outcome results in social benefit (economic, political and personal)
1960's Various Used as a major educational aim toward bolstering the educational agenda
1960's Shamos Having a practical understanding of science such that daily applicability becomes a reality
1963 Hurd Knowledge of key scientific concepts and being apple to apply them in a socially coherent manner
1963 Koelsche The knowledge and skill of science required to engage with subject matter as reported in popular media
1966 Pella, O'Hearn and Gale The interrelations between science and society and the relative impacts
1971 NSTA The ability to use scientific concepts in everyday life and social interactions, as well as an understanding of technology
1970's Shen Practical scientific literacy valuable to daily lived situations
1970's Shen Civic scientific literacy- knowledge that enables active civic participation and democratically supports processes in society and in public policy issues
1981 Branscomb The ability to read, write and understand systematised scientific knowledge
1983 Arons Correctly being able to apply scientific knowledge toward daily problem solving in personal, professional and civic settings
1983 Miller
Three dimensions of scientific literacy, namely a) an understanding of the methods of science, b) an understanding of the facts and concepts of science and c) an appreciation of the impact of science on society
1987 Hirsch Cultural literacy entails a grasp of the contribution science makes to the cultural stock of humanity
Stellenbosch University https://scholar.sun.ac.za

62
1986 Scribner Knowledge that is simultaneously adaptive, socially empowering and self-enhancing
1990 Hazen and Trefil Should empower people to develop meaningful context for science news as reported.
1992 Lewenstein Developing a greater public appreciation, interest and awareness of the benefits, developments and value science offers society
1994 Baarah and Volk An understanding of how science, technology and society influence each other
1995 Shamos
(a) cultural science literacy: a grasp of certain background information underlying basic communication, (b) functional science literacy: not only know the science terms, but also to be able to converse, read, and write coherently using these terms in non-technical contexts, and (c) true science literacy: understand the overall scientific enterprise and the major conceptual schemes of science, in addition to specific elements of scientific investigation
1995 Fensham Conceptual learning contextualised in real world situations and reasoning
1996 Eisenhart, Finkel and Marion Multidimensionality of scientific literacy - an understanding of science within a social system, with many dimensions impacting the individual and society
1997 Beybee Functional literacy, conceptual literacy and procedural literacy
1999 Jenkins Citizen Science - reflexive approach to understanding science, taking public concerns, interests and activities into account
2004 Miller Public would essentially need to possess the skills to read, write and engage meaningfully in daily activities and interaction with scientific material in the media or vocational settings
2009 Hazen and Trefil The knowledge needed in order to understand public issues
2011 Feinstein Functional scientific literacy (introduced by Miller) – Useful Scientific Literacy in arguing the meaningful social and personal application of science to daily living.
Table 2.2: Evolution of Meaning: Public Understanding of Science (Adapted and expanded from Goolam, 2001)
Stellenbosch University https://scholar.sun.ac.za

63
Chapter Three
Literature Review: Global Empirical Evidence
The whole premise of democracy is that it is safe to leave important questions to the court of public opinion—but is it safe to leave them to the court of public ignorance?
Isaac Asimov (1989)
3. REVIEW OF EMPIRICAL STUDIES ON THE PUBLIC UNDERSTANDING OF SCIENCE
As noted in Chapter Two, empirical studies of scientific literacy and the public understanding of
science have been conducted since at least the mid-1950s. Many of these have been replicated in a
number of settings around the world, giving rise to ongoing debate about cultural sensitivity and the
cross-national applicability of measures within this domain14. Whilst numerous authors have
commented on the applicability and value of public understanding of science research for a variety
of developmental, educational and democratic ideals, the socio-cultural setting and design of the
vast majority of studies conducted do tend to draw on the social context wherein the research is
located (see Laugksch, 1996; Raza, Singh & Dutt, 2002; Shukla & Bauer, 2009).
Although many scholars have replicated internationally benchmarked studies by using similar
measurement instruments and approaches, content, subject selection and test construction have
differed as a result of the studies’ geographic location. Furthermore, the notion of relative
development and its influence on education and other socio-demographic factors have further
influenced the directed aims of public understanding of science research across varying geo-social
landscapes. For this reason, the review below will cover the most influential studies of public
understanding of science conducted in both developing and developed world settings. While some
have argued that the distinctions between these country-labels require revision (see Hasan, 2013),
these broad categories do offer some structure toward categorising research within this domain
from distinct geographic regions (United Nations Statistical Services Branch, 2006).
The below review offers some insights into scientific literacy and public understanding of science
research from diverse global regions; it is by no means exhaustive nor does it cover the entire body
of research within this domain. What is however achieved is a broad impression of the state and
direction of global research and the approaches adopted within the selected studies. While some
studies relate to national indicators of scientific literacy and public understanding of science in terms
of general science focus areas, others have concentrated on issues relating to biotechnology, climate
change, nuclear power or similar specific subject matter. The review below highlights large and
14
These issues will be addressed in this chapter under the discussions around instrument development
Stellenbosch University https://scholar.sun.ac.za

64
smaller studies from the USA, Canada, the United Kingdom, Germany, Japan and Australia under a
broad category of more economically developed nations, while studies from China, Malaysia, India,
and South Africa represent studies emanating from a diffuse cohort of newly industrialised or
developing countries.
3.1 EMPIRICAL STUDIES FROM DEVELOPED COUNTRIES
3.1.1 United States of America - NSF: Science and Engineering Indicators (SEI)
The National Science Foundation (NSF) Biennial Science and Engineering Indicators (SEI is considered
the most well-known compendium of science and technology indicators. While the focus of this
publication is on the full scope of the science and engineering enterprise in the United States of
America, more recent editions have presented international data reflecting comparisons with
comparable data from other geographic regions. The SEI presents a volume of science and
technology indicators across eight (8) themes, providing an overview of the scope and environment
of the science and engineering system of the USA (NSF, 2014). These themes include indicators for
Mathematics & Science Education; Higher Education in Science & Engineering; Human Resources for
Science & Engineering; Research & Development Indicators; Academic Research; Industry,
Technology & the Global Marketplace, State Indicators as well as indicators for Public Understanding
and Attitudes toward Science & Technology. Whilst it is important to understand the contents of the
entire document in order to extract the most value out of its findings, this section will focus
specifically on the chapter related to the public understanding of science outputs from the NSF-SEI
2014.
The NSF Science and Engineering Indicators publication uses multiple data sources and amalgamates
data from varying studies toward producing the different themed chapters (NSF, 2014). The NSF
study has included a module on the public understanding of science since 1979 (Reddy et al, 2009).
This chapter was in the past composed from data sourced from a specialised NSF survey of between
1500 and 2100 adult individuals using telephonic interviews to access a nationally representative
sample of United States citizens. The survey requested information on sources of public information
about science, visits to science institutions, general attitudes toward science, animal research and
government science spending as well as information on science and mathematics education (NSF,
2014). However, since 2006, the NSF has used data for this module using the General Social Survey
conducted by the National Opinion Research Centre at the University of Chicago. The GSS is a multi-
module sociological survey accessing data on a core set of behavioural and attitudinal questions as
well as special interest topics from a nationally representative sample of adults across the USA
(NORC, 2013). Despite the change in data source, the same information points are accessed under
Stellenbosch University https://scholar.sun.ac.za

65
the GSS, using face-to-face interviews (supplemented by telephone interviews) however, with a
sample of between 1800 and 2200 respondents. The most recent release of the NSF Science and
Engineering Indicators: public understanding of science data was in 2014, reflecting data from the
2012 GSS survey.
The chapter on public understanding of science is divided into four (4) main sections, reflecting the
design and wording of the survey questionnaire. Under these are included assessments of public
interest, information sources, involvement in science; public knowledge about science, public
attitudes about science (in general, and public attitudes about specific science-related issues. All
sections were assessed by providing the respondent with a series of question and answer choices.
Public interest in science was measured by presenting respondents with a list of topical news items
related to science issues and respondents were asked to rate their level of interest on a 4-point scale
ranging from very interested to not at all interested, with the fourth category being a don’t know
option. The science issues presented included new medical discoveries, schooling, economic,
political, environmental and business issues, application of new technologies, military, space
exploration and agricultural aspects of scientific advancement. Information was also collected on
major sources of science information along four (4) information streams: television, internet,
newspapers, other (a don’t know option was also included here). Also identified here was American
involvement in informal scientific spaces such as science centres, museums and zoological and
botanical gardens.
Public scientific knowledge was assessed by presenting respondents with a 9-question index of
factual scientific knowledge and measuring answers to these questions through four (4) response
categories. Examples of these questions from the 2014 data are: the centre of the earth is very hot or
electrons are smaller than atoms and, in addition to the true or false response options, respondents
could also indicate a don’t know or refusal response. Understanding scientific processes as opposed
to just measuring scientific facts was also measured using a series of questions requiring the
understanding and application of three (3) scientific principles: probability, experimental design, and
an understanding of what it means to study something scientifically (NSF, 2014). The results of these
three question sets were calculated to derive the components of understanding scientific inquiry
scale toward presenting a composite measure of understanding scientific processes. Also included
under this section was a single question that aimed to measure respondents’ ability to distinguish
science from pseudoscience by asking if they believed astrology to be scientific in method
and practice.
Stellenbosch University https://scholar.sun.ac.za

66
General attitudes toward science were measured using the index of promise and reservation, which
employs questions assessing perceptions of benefit and risk associated with scientific advances in
general. Promise and reservation indices generally include items that present results of scientific
study as beneficial, items that present results of scientific study as equal in benefit and risk as well as
items that present results of scientific study as presenting more risk than benefit. The number of
items in the scale may vary; however these consistently include the above-mentioned attitudinal
response options for respondents to choose from in an index of promise and reservation. In addition
to measuring general attitudes toward science, influence of scientific experts, relevant scientific
research fields, attitudes about scientific careers, confidence in scientists and government funding of
scientific research were also assessed under this section. The study also presented findings in public
attitudes to specific scientific issues including environmental, climate change, nuclear power,
genetically modified food, stem cell research, as well other areas of scientific research.
The results are presented as trend data to indicate change over the biennial period, as well as
historic data plots of previous editions of SEI data and, wherever possible, international comparisons
are offered to further contextualise the results relative to other populations.
Assessment area Specific measures Examples of NSF – SEI 2014 findings
Information / Interest Information sources
Interest in science
Americans are mostly interested in “new medical discoveries”
The internet is the main source of scientific information
Television remains the main source of news information
Public knowledge
Factual knowledge
Scientific processes
Superstitious beliefs
65% correctly answered factual knowledge questions
Lower scores on indicators of understanding scientific processes
More Americans now believe astrology is scientific than in 1983
General attitudes
Benefits & Risks
Influence of experts
Research fields
Scientific careers
Government funding
Americans continue to value the benefits of science over risks
Government should continue to fund basic research
Scientific and medical researchers are held in high confidence
Americans rate applied research fields as more scientific
Fewer identified social science as being scientific
Specific attitudes
Environmental
Climate change
Nuclear power
GMO foods
Stem cell research
37% of Americans expressed concern over environmental issues
42% believe human activity has increased global warming
More Americans favour nuclear energy
76% believe renewables could address America’s energy needs
Americans are more concerned about GM animals than plants
60% see stem cell research as ‘morally acceptable’
Human cloning still remains a particular concern to many
Table 3.1: Abridged results - 2014 Science & Engineering Indicators: Public Understanding & Attitudes to Science
(Table structure adapted from Reddy et al; 2009, data updated to reflect 2014 NSF release)
Stellenbosch University https://scholar.sun.ac.za

67
All results are analysed and presented along a number of demographic factors measured in the NSF
publications and provide further insight into the findings of this important publication. Table 3.1
above presents a highly abridged view of overall results of the 2014 science and engineering
indicators: public understanding and attitudes to science along the four (4) dimensions discussed
above.
3.1.2 OECD – Canada: Programme for International Student Assessment (PISA)
Another large study of public understanding of science as well as related areas of mathematics and
reading literacy is the project of the Organisation for Economic Co-operation and Development
(OECD), called the Programme for International Student Assessment (PISA). The programme was
initiated in 2000 and has since been conducted on a three-year cycle with its primary aim being to
evaluate skills and knowledge in key areas of mathematics, reading and scientific literacy among 15-
year-old learners (OECD, 2013). The OECD is a key international institution founded in 1961, and has
thirty-four (34) member states and a number of non-member or observer states that partner with
the OECD on matters pertaining to international cooperation, trade and developmental issues (Clark
& Thomson, 2011).
The PISA project has been active since 2000 and, as part of its methodology, run surveys every three
years, along one of the three subject areas of interest. The project has amassed a major database of
information on learner literacy in mathematics, reading and scientific literacy and holds data on
more than seventy (70) countries from both the developing and more developed economies
participating in its work. The 2012 iteration of PISA focused on mathematics literacy and measured
510 000 learners from 65 countries. PISA compares well with other, similar, large international
studies such as TIMSS (Trends in International Math and Science Study) and the Progress in
International Reading Literacy Study (PIRLS), showing high positive correlations across measures in
the different questionnaires (Wu, 2009). The PISA assessment is conducted in a number of different
geographic and cultural settings and is thus not the identical test in every location, accounting for
language, socio-cultural and educational variances between locations. The test construction is a
combination of open-ended and multiple choice questions. Learners are required to apply the
pertinent subject matter (math, reading or science literacy) to solve everyday problems presented in
the questions. Raw scores from each participant country are scaled to allow meaningful comparison
of cross-national data based on different question combinations (Stanatet al, 2009). PISA offers a
unique advantage over other assessments as it does not rely on mastery of school curricula, which is
vastly diverse in different geo-social locations. It focused on the extent to which learners would be
able to cope with daily challenges post-formal schooling years (OECD, 2013).
Stellenbosch University https://scholar.sun.ac.za

68
PISA 2012 maintained a focus on mathematics literacy assessment among learners; however had
also investigated reading and scientific literacy in the course of its data collection. The 2009 iteration
of PISA had its focus on science literacy, and in the interests of obtaining a view of different
empirical studies from varying locations, data from Canada was selected on which to focus the
remainder of the discussion on PISA below. In 2012, 21 000 Canadian students from 900 schools
participated in PISA, tests were administered during school hours in the second quarter of 2012.
The PISA assessment explores scientific literacy along three dimensions: a) an understanding of
science concepts, b) an understating of the scientific process and c) the application of these in lived
situations (OECD, 2009). Due to the fact that PISA focuses on one of the major domains of science
literacy, mathematics literacy or reading skills in each 3-yearly iteration of the study, major and
minor domains receive a slightly different attention depending on the focus within the specific
survey cycle. In cycles that have a focus on science literacy, students’ general attitudes toward
science as well as their cognitive capabilities and application of scientific knowledge are assessed. In
a cycle where science literacy is a minor focus, only questions relating to the testing of cognitive and
application of scientific knowledge capabilities are assessed (OECD, 2006). As a basic question in the
public understanding of science domain, PISA asks why it is important for citizens to be
knowledgeable and capable in situations involving science and technology issues. The analysis of
data from the groups of 15-year-old learners provides insight as to how this may impact them later
in life as well as how to best educate for a changing world.
The assessment of an understanding of science concepts is achieved through asking a series of
questions applying scientific concepts to human experiences under broad themes, including science
in life and health; science of the earth and the environment and science in technology. The questions
here focus more on the relevance of the concept for lived-experience and its relation to scientific
areas as a means to test concept recognition within context rather than simple fact recalling
capabilities (Knighton et al, 2010). The second assessment category focuses on an understanding of
scientific process, and looks at the capabilities of learners to identify, interpret and act upon
evidence presented within stimulus material preceding the question sets (OECD, 2006). In the 2006
PISA study, an example is used of a newspaper article describing how DNA evidence was used to
identify a criminal (OECD, 2006). The questions that follow this stimulus material relate to its content
as well as the application of the information so as to identify evidence and make inferences. The
questions are carefully constructed to ensure that the learners would not require a pre-existing body
of scientific knowledge to answer the questions, but instead focuses on the learners’ ability to
identify and follow a scientific argument when provided with the given evidence (Stats Canada,
Stellenbosch University https://scholar.sun.ac.za

69
2013). The last category in the public understanding of science assessment framework measures the
learners’ capabilities in recognising scientific aspects in an everyday context as well as the ability to
apply these to the personal, social and global context (OECD, 2006).
Key to the development of the PISA scientific literacy assessment of 15-year-old learners is the
interaction of scientific concepts, processes and application based on evidence toward fostering
effective citizenship (Knighton et al, 2010). The Canadian results of the 2012 OECD/PISA study
indicate that overall, Canada has performed above the OECD average in all three categories of the
study. However, these results also indicate that, relative to previous iterations of the PISA study of
the Canadian adolescent population over the last nine (9) years, there has been a decline of scores
(Brochu et al, 2013). In terms of the scientific literacy measures, Canadian learners again performed
above the OECD average, attaining a score of 525, 24 points higher than the OECD average of 501. In
many OECD countries, males outperformed females in measures of scientific literacy; however, in
Canada there was no significant variation between male and female scientific literacy scores. As with
the overall performance among the Canadian participants, scores for scientific literacy do indicate a
statistically significant decrease between the 2006, 2009 and 2012 iterations of PISA study (Brochu
et al, 2013). During the same period the OECD average for science literacy scores remained relatively
unchanged, though fluctuations in performance on science literacy elements for individual country
scores were observed.
3.1.3 Europe – Multi-Country: Eurobarometer Special Module on Science and Technology
The European Commission was first established in 1951, with nine (9) member states (CVCE; 2012).
Today the European Commission has twenty-eight (28) member states, with the inclusion of Croatia
in 2013 (European Commission; 2013b). Since 1974, the European Commission has regularly
conducted public opinion research toward the annual Eurobarometer Survey report. The Survey was
developed to be a cross-national longitudinal study of the EU-27 nations, designed to measure public
opinion and highlight trends on a variety of social and public issues in an annual survey of adults, 15
years and older. While the first Eurobarometer surveys focused on social issues related to the then
current economic climate of the early 1970s, later iterations of the multi-national poll expanded its
focus to include questions on democracy and governance, health, employment, education and many
other thematic areas of interest (Reddy et al, 2009). In addition to the standard Eurobarometer
survey, since 1990 the European Commission has also been conducting regular modules on special
issues of interest, mostly on a biennial basis. In 1990 the first survey of Europeans’ Attitudes toward
Science and Technology was conducted, and it has since been repeated in each wave of the
Eurobarometer (European Commission, 2013a). The most recent iteration of the Attitudes toward
Stellenbosch University https://scholar.sun.ac.za
70
Science and Technology module was published in 2013 and the results of this survey wave are
discussed below.
The public understanding of science module in the Eurobarometer survey adopts the established
dimensions of public understanding of science and scientific literacy research in identifying
exploratory areas of its questionnaire design. The survey investigates six (6) key areas in the public-
science domain, namely: engagement with S&T, impact of S&T on society, attitudes toward S&T,
ethics in science, young people and science as well as gender issues in science. These thematic areas
have appeared in a number of Eurobarometer survey waves and allow for both a national and cross-
national comparison of longitudinal trends in science and technology issues across Europe (European
Commission, 2013a). In addition to these broad areas of investigation in the main S&T questionnaire,
selected waves also included special questions on specific science-public issues (see the 2001 report
for special questions on GMO crops and the 2010 wave for issues related to value and effectiveness
of European public science investment). The 2013 Special Eurobarometer Survey on Science and
Technology (401, EB 79.2) was conducted in twenty-eight (28) European countries and yielded a final
sample of 27 563 interviews that were conducted using computer-aided personal interview (CAPI)
tools. The survey assessed general attitudes toward science and technology using a questionnaire
comprising 17 questions associated with the specific science and technology themes under
investigation (European Commission, 2013a). All questions were structured to be multiple-choice
and respondents were presented with five (5) response options: four (4) response options ranging
from extreme positive to extreme negative, as well as a don’t know option. Where required,
responses were designed to be multi-dimensional and these selected questions asked a number of
question related to a specific measurement area (European Commission, 13a page Q1-Q7).
The results of the 2013 special Eurobarometer survey on Science and Technology (2013) indicate
that Europeans are generally well informed and positive about the impact of science on society and
scientific advancements. On questions related to issues of engagement with science and technology,
respondents were asked a series of questions about their level of information about science, their
interest in science and interaction with areas of science and technology. Most respondents across
the EU-27 countries reported a higher interest in science developments, but simultaneously
reported not feeling very informed about scientific developments. This was particularly evident in
Hungary, Bulgaria and Romania, with 70% or more of the respondents indicating a lower sense of
informedness and interest in science and technology issues. When asked about formal scientific
education, 47% of total respondents in EU-27) indicated a positive response, with 71% of United
Kingdom and 75% of Romanian respondents indicating secondary or tertiary education in a scientific
Stellenbosch University https://scholar.sun.ac.za

71
field. When asked about sources of scientific information, as in the United States (NSF – SEI 2014),
television still remains the main source of science information across Europe, with other traditional
information sources following close behind (newspapers, radio, books and magazines). Newer
technologies such as websites and blogs as well as social media platforms interestingly accounted for
a smaller proportion of reported information sources. Countries such as Sweden and Denmark
reported the highest proportion of responses attributed to these newer information sources, despite
television remaining the primary source of science information in these countries (European
Commission, 2013a).
The report further details trends in issues relating to the impact of science and technology on
society, revealing that 77% of Europeans surveyed (EU-28) related a general sense of positive
science impact in the 2013 survey. However, the survey also reports a general sense of ambivalence
on questions relating to the level of civic involvement in science matters (European Commission,
2013a). The ambivalent viewpoint shares the idea that citizens should be informed about science,
but differs on the level of involvement and consultation that should be employed in advancing
scientific work across Europe. This indicator appears to be influenced by the level of educational
attainment of the respondent. Denmark reported the strongest proportion of respondents (51%)
calling for increased civic participation in scientific decision making, while similarly reporting the
highest number of respondents with tertiary level science education.
General attitudes toward science and technology is a common measure in public understanding of
science research and a series of questions were devoted to this in the Special Eurobarometer (401)
Science and Technology Survey 2013. In a battery of questions resembling an index of promise and
reservation on science and technology, Europeans generally reported a greater sense of promise and
positive attitudes about the impacts of science on society. This is particularly noted under questions
that relate to quality of life and issues of health and wellbeing. With respect to questions on the
negative or unintended outcomes or applications of science, there was concern about science being
used for terrorist activities (77%) and its environmental impact (74%) and impact on human rights
(54%). Further analysis of the responses to the promise and reservation questions reveals a greater
sense of promise among the respondents to this survey, with comparisons to the 2010
Eurobarometer indicating a shift toward more positive attitudes among Europeans. Among the
respondents, 54% of generally agreed that ethical practices are vital to the continued success and
safe application of science, particularly with emerging technologies such as biotechnology.
Young people in science received special attention along three (3) key areas, including governments’
involvement in stimulating interest in science among youth populations, the question of whether
Stellenbosch University https://scholar.sun.ac.za

72
young people’s involvement in science better prepares them to secure employment, and the impact
of science education on youth creativity. Most respondents (65%) reported that governments were
doing too little to stimulate youth involvement in science. This was highest among respondents in
Spain (83%) and Greece (78%). Both these countries also reported the highest increase in this
negative opinion of government’s role in promoting youth science involvement, whilst countries like
Malta (+21%) and Lithuania (+13%) reported the greatest change toward a more positive opinion of
government impact on youth science involvement (European Commission, 2013a). Questions
relating to youth involvement in science and employment prospects reported a 59% agreement that
youth interest in science may lead to better employment prospects. This opinion was particularly
prevalent among Irish and Maltese respondents, both indicating 78% agreement with the statement
and reporting significant increases in positive responses to this question compared to the results of
the 2010 survey (European Commission, 2013a). Related questions about employment, youth
interest in science and effective citizenship similarly received positive responses, with 68% of
respondents indicating agreement with these statements. These attitudes were particularly high in
Bulgaria (88%), Finland (84%), Latvia (80%) and Hungary (73%). The majority of Europeans (84%)
further reported agreement with the statement that scientific education is important in stimulating
young people’s creative thinking (European Commission, 2013a). Gender issues in science were also
addressed in the Eurobarometer 2013 study and indicated a high sense of agreement (86%) that
scientific advancements should be gender neutral and address the needs of both men and women
equally. Furthermore, this section also revealed that men are more likely (64%) to feel more
informed about developments and more frequently report increased formal education in science
and technology areas (51%).
The Eurobarometer Special Survey on Science and Technology 2013 represents a snapshot of
European public attitudes to science as well as public opinions on selected scientific issues. It
represents the latest investment in a rich, multi-year and cross-national data set. Proceeding from
similar theoretical foundations to comparable surveys from elsewhere in the world, the
Eurobarometer provides trend data within the European context and allows for meaningful
comparison to other developed nations’ outputs. While there have been some concerns and
criticisms relating to methodological protocols employed in the Eurobarometer Survey, including the
makeup of the sample, language use across the regions, and potential political and economic
agendas of the European Commission, the general public and academic reception of the reports
have been positive (Nissen, 2012 cited in Eden, 2014). The survey yields a large dataset, and
particularly in the developed world context, provides valuable insights not only in the results of
Stellenbosch University https://scholar.sun.ac.za

73
survey questions, but also into method protocol and public understanding of science research design
characteristics (Eden, 2014).
3.1.4 United Kingdom: Surveys of public understanding of science 2000-2011
The United Kingdom has historically been one of the global epicentres of scientific literacy and public
understanding of science research (Hurley, 1998). Following the developments of the Royal society
report (1985) and the House of Lords Report (2000), discussed earlier, there have been many
research studies conducted in Europe and the United Kingdom in particular. Many of these were
based on large national samples within the UK or were part of sizeable multi-national studies such as
the Eurobarometer and similar surveys (discussed above). Table 3.2 highlights some of the most
recently conducted surveys in the areas of scientific literacy and the public understanding of science
among UK based respondents since the beginning of the 21st century (BIS, 2011). While some of the
surveys conducted were not specifically targeting scientific literacy, or had its focus on specific
scientific areas (e.g. Cardiff University, 2010: views on climate change; European Commission, 2008:
attitudes towards radioactive waste), all of these projects contained within them measures of
knowledge and attitudes related to areas of public understanding of, and engagement with, science.
This has yielded a robust multi-national and longitudinal series of data sets on UK and European
public attitudes to various scientific areas that has proved a fertile foundation for ongoing research
within this domain.
Publisher Year Sample size Countries covered
World Values Survey 2000 1 000-4 000 interviews per country 97 countries including UK
Nestlé Social Research Monitor 2004 704 young people in the United Kingdom aged 11-21
United Kingdom
Office of Science and Technology (OST) 2004 1 831 UK adults aged 16+ United Kingdom
European Commission 2005 32 897 Europeans aged 15+; 1 307 in United Kingdom aged 15+
34 European countries including the UK
European Commission 2005 32 897 Europeans aged 15+; 1 307 in United Kingdom aged 15+
34 European countries including the UK
Institute of Physics 2005 1 023 adults in the United Kingdom aged 18+
United Kingdom
Organisation for Economic Cooperation and Development (PISA)
2006 400 000 students aged 15; 13 152 United Kingdom students aged 15
57 countries including the United Kingdom
Research Councils UK (RCUK) and the Department for Innovation, Universities and Skills (DIUS)
2007 2 137 United Kingdom adults aged 16+ United Kingdom
Stellenbosch University https://scholar.sun.ac.za

74
Royal Academy of Engineering and the Engineering and Technology Board (ETB)
2007 1 000 adults in United Kingdom aged 16+ United Kingdom
European Commission 2008 26 746 Europeans aged 15+; 1 306 in United Kingdom aged 15+
EU-27
University of York 2008 804 young people in England aged 13-14
England
Wellcome Trust 2009 1 179 UK adults aged 18+; 374 young people aged 14-18
United Kingdom
Cardiff University 2010 1 822 adults in United Kingdom aged 15+ United Kingdom
Department for Business, Innovation and Skills (BIS)
2010 988 adults in United Kingdom aged 15+ United Kingdom
Engineering UK 2010 5 789 respondents aged 7+ United Kingdom
European Commission 2010 26 671 Europeans aged 15+; 1 311 in United Kingdom aged 15+
32 European countries
European Commission 2010 26 671 Europeans aged 15+; 1 311 in United Kingdom aged 15+
32 European countries
Department for Business, Innovation and Skills (PAS 2011)
2011 2 103 United Kingdom Adults aged 16+ United Kingdom
European Commission 2014 26 671 Europeans aged 15+; 1 311 in United Kingdom aged 15+
33 European countries
Table 3.2: Recent International Studies (adapted from BIS, 2011)
Notable surveys include the World Values Survey (2000), the Eurobarometer surveys on public
understanding of science, The OECD-PISA surveys, the Wellcome Trust survey as well as the
Department for Business, Innovation and Skills / IPSOS-MORI surveys on public attitudes to science
in the United Kingdom. For the purpose of brevity and in the interests of reviewing the most recently
available empirical work, not all the above surveys will be discussed in detail. The below review will
therefore only briefly cover the results of the latest Eurobarometer Survey on Science and
Technology (401, EB 79.2) as they relate to the UK public, and then go on to discuss the
methodology and results of two (2) large surveys of the UK public understanding of science: The
OST-Wellcome Trust survey (2000) as well as the BIS-IPSOS/MORI study (2011).
Within the total of 27 563 participants in the 2013 Eurobarometer survey on Science and Technology
(401, EB 79.2), the United Kingdom surveyed 1 306 respondents, 15 years and older. On measures of
informedness on science and technology issues, 56% of UK participants reported being well
informed or fairly well informed, higher than the EU-27 average of 40%. Similarly, on measures of
interest in science, scores for the UK respondents were 11 percentage points higher than the EU-27
average. Comparisons on levels of science education indicate that 71% of UK participants had some
Stellenbosch University https://scholar.sun.ac.za

75
form of formal science education (at secondary, tertiary or some other level) compared to the EU-27
average of 47%. United Kingdom participants reported a positive result with respect to the influence
of science on society, with 76% indicating a positive influence, one percentage point lower than the
EU-27 average. The attitudinal Index of Promise and Reservation reveals that UK participants appear
to be more positive about the influence and value of science, although they expressed a greater
concern about the unintended consequences of science within society. Likewise, many UK
respondents also expressed a high level of agreement about the ethical standards in practice by the
scientific community compared to average scores across all other countries measured. Interestingly,
on questions relating to the influence of science and science education on young people,
respondents in the UK reported consistently lower scores than the EU-27 averages. This has further
revealed a downward trend from the 2010 survey for UK participants with respect to the benefits of
science education on young people (European Commission, 2013a). Despite the understanding that
trend data will fluctuate between measurement waves and across surveys of related subject matter,
careful review has been mooted in order to ensure the UK maintains standards and performance on
these key science and technology indicators (Coughlan; 2013). Whilst the results of the
Eurobarometer have been discussed previously, the United Kingdom country analysis data reveals
important trends in public opinion and attitude with respect to science and technology. This will
however, not be discussed in greater detail in this section15.
In 2000 the Wellcome Trust and the UK Office of Science and Technology jointly sponsored a study
investigating the public understanding of science in an effort to best tailor science communication
aimed toward public consumption (Office of Science and Technology & The Wellcome Trust; 2000).
In the foreword to the report, Lord Sainsbury and Dr Dexter highlight the importance of the report
together with the House of Lords Report (2000) and the White Paper on Science and Technology
(2000) as key foundations toward a period of consultation between the various British science and
technology actors. The Wellcome Trust – OST study was designed to include two components – the
first looked at input mediums for science communication toward the general public, and a second
survey of outcome-competencies related to public understanding of science among the British
public. While the initial input survey on science communication methodologies is noted, it will not be
discussed as it relates only indirectly to the outputs being reviewed here. The survey on public
attitudes to, and understanding of, science and technology in the UK yielded a total response of
1 839 responses from a nationally representative sample. The initial phase of this research was
based on qualitative interviews that informed the larger quantitative study. The results of the survey
15
Detailed discussion of country specific results are outside of the scope of this chapter and will not venture beyond these summary results.
Stellenbosch University https://scholar.sun.ac.za

76
were analysed using factor and cluster analysis that revealed six (6) attitudinal clusters informing the
thematic areas on which the report is based (Office of Science and Technology & the Wellcome
Trust; 2000). These attitudinal groups are presented below in table 3.3 to further the discussion to
follow:
Attitudinal groups Definitions and characteristics
Confident Believers
Positive, self-confident and outward looking, the Confident Believers (n=17 %) are interested in science because of the benefits it brings; their interest in politics relates to a tendency to have faith in the regulatory system. They tend to be well off, well-educated and middle aged.
Technophiles
This is the largest group (n=20%). They are confident, Pro-science and well educated in science, but sceptical of politicians. They tend to be confident that they know how to get information when they need to; although they need reassuring that the regulatory system exists and works effectively.
Supporters
This relatively young group (n=17%) tends to be ‘amazed’ by science, engineering and technology and feels confident enough to cope with rapid change. They also tend to believe that the Government has things under control. They express the most interest in the medical Sciences and tend to be slightly more interested in the physical sciences – especially engineering – than others.
Concerned
This is the smallest group (n=13%) and mostly female (60%).They have a realistic and positive attitude to life but are sceptical of those in authority. Their social grade, household income and education levels tend to mirror the population as a whole. They are interested in a whole range of topical issues, and they know that science is an important part of life, especially for their children.
Not Sure
This group (n=17%) tends to have the lowest household incomes, the lowest level of education, and generally form part of the semi- and unskilled labour force or are unemployed. They are neither ‘anti-science’ nor ‘pro-science’ largely because the benefits of science are not always apparent in their daily lives.
Not for Me
This group (n=16%) mainly comprises those aged 65 and over and is predominantly made up of women but also includes slightly younger men. Like the ‘Not Sure’ group, they are not particularly interested in political and topical issues or in science. However, their lack of interest in science does not stop them appreciating its benefits for the future and its importance to young people.
Table 3.3: Attitudinal group clusters (Table adapted from Office of Science & Technology and the Wellcome Trust report; 2000)
The quantitative study yielded a nationally representative sample of UK adults by interviewing 1 200
people, and conducted additional booster samples of 200 members of minority groups and 400
individuals in Scotland (Office of Science and Technology & the Wellcome Trust; 2000). The
questionnaire was constructed to assess three (3) attitudinal aspects: issues of personal confidence
and coping with change; attitudes, interest and perceived benefits of science as well as attitudes
Stellenbosch University https://scholar.sun.ac.za

77
toward authority, the government and the regulatory environment surrounding science. Results of
the survey indicate that respondents’ interest in scientific fields do not vary considerably with those
of other developed nations. The majority of respondents reported a higher interest in health issues
and new medical discoveries (52% & 46% respectively). As in the United States (NSF-SEI survey,
2012), respondents did not report high interest in new inventions and technologies or new scientific
discoveries (24%, 22% respectively), instead reporting higher interest in issues of Sport, Welfare and
Education, in increasing order of interest. Interest in science and the perceived benefits of science
was found to be correlated, as increased perceived benefit of scientific fields usually followed
increased interest in those same areas of scientific achievement.
Among the sample of the United Kingdom population there was a high reported appreciation for the
personal and social benefits of science. Using a 16-item index of scientific promise and reservation,
the Wellcome Trust study revealed a positive appreciation for the benefits of science among
respondents. However, there also appears to be some degree of reservation relating to the ability of
the general public to understand science, the level of conflicting information about science as well as
the rate of scientific advancement. This uncertainty regarding the value of science is further
reinforced by a high number of respondents indicating I am not interested in science and don’t see
why I should be, and that the achievements of science are overrated and (20% and 22% respectively).
The majority of respondents (80%) however believe in the importance of science in growing the UK’s
economic prospects into the future and 70% of respondents reported support for basic scientific
research. A similar quantum of respondents further agreed with statements reflecting the positive
role science will play in future employment and human benefits. Concerns were highlighted about
the government’s ability to influence the direction and progress of scientific advancement (40%) as
well as the perception that scientists do not fully appreciate the risks inherent in their work (56%).
The influence of the private sector on scientific advancement and funding was further illustrated;
with 61% agreeing with the statement science is driven by business interests.
The Wellcome Trust OST study (2000) reflected an overall increased public understanding of science
and an increased positive appreciation for scientific work when compared to previous research
conducted among the UK public. The study revealed that attitudes to science are in some part driven
by basic personal attitudes. These highlighted 6 (six) attitudinal cluster groups from which to begin
to understand the segmentation within the UK public in relation to scientific attitudes, interest,
knowledge and awareness. The authors do however point out that whilst the six (6) attitudinal
groups do show different demographic and social characteristics, communication approaches and
the content of scientific communication do not necessarily need to be varied for each cluster group.
Stellenbosch University https://scholar.sun.ac.za

78
The notion then of many publics, rather than one homogenous public, is also encountered within the
UK population, just as it has been highlighted among the South African population (Reddy et al,
2009).
Since the 2000 Wellcome Trust study, there have been other studies in the UK with a focus on
varying aspects of the public/science relationship. However a more recent study, Public Attitudes to
Science (PAS) 2011, conducted jointly by the UK Department for Business, Innovation & Skills,
IPSOS/MORI and the British Science Association continues a series of research studies on the public
understanding of science in the United Kingdom. This study is uniquely positioned among the many
others conducted in the UK as its series is related to the original Wellcome Trust study and trends
across the intermediary decade can be observed when the results of the two studies are juxtaposed.
The PAS 2011 study adopted a mixed methodology approach in its research, consisting of an
international literature review study, general public workshops and discussions as well as a national
quantitative survey of UK public attitudes and engagement with science (BIS, 2011). The survey
yielded a sample of 2 103 respondents from across the UK, aged 16 years and older. Within the
sample, 1 798 interviews were conducted with adults of all ages and 305 interviews were conducted
with young people aged between 16 and 24 years of age using computer aided personal interview
techniques (CAPI). The aims of the research were multi-fold, but focused on general public
definitions of science, the public-scientific community relationship, impacts of science on daily life,
scientific information sources, public confidence in science, awareness of scientific methods and
public perceptions of science policy (BIS, 2011). As this study is the fourth product in a series of
research studies, the questionnaire used many of the previously used measures and added a limited
number of new questions to the 2011 questionnaire. The interviews lasted between 35 and 40
minutes and, while limited respondent information was recorded, all personal information was
declared confidential. The questionnaire, despite being asked using CAPI tools, consisted of 38
questions; some were open-ended, with probing toward the data capturer being able to make a
selection(s) while other questions relied on multiple-choice options presented to the respondent on
stimulus cards.
Similar to the Wellcome Trust study (above), the BIS (2011) study also produced a public
segmentation in relation to perceptions of science among the general population using cluster
analysis. The analysis revealed six (6) attitudinal clusters from within the 2011 study, presented in
Table 3.4 below:
Stellenbosch University https://scholar.sun.ac.za
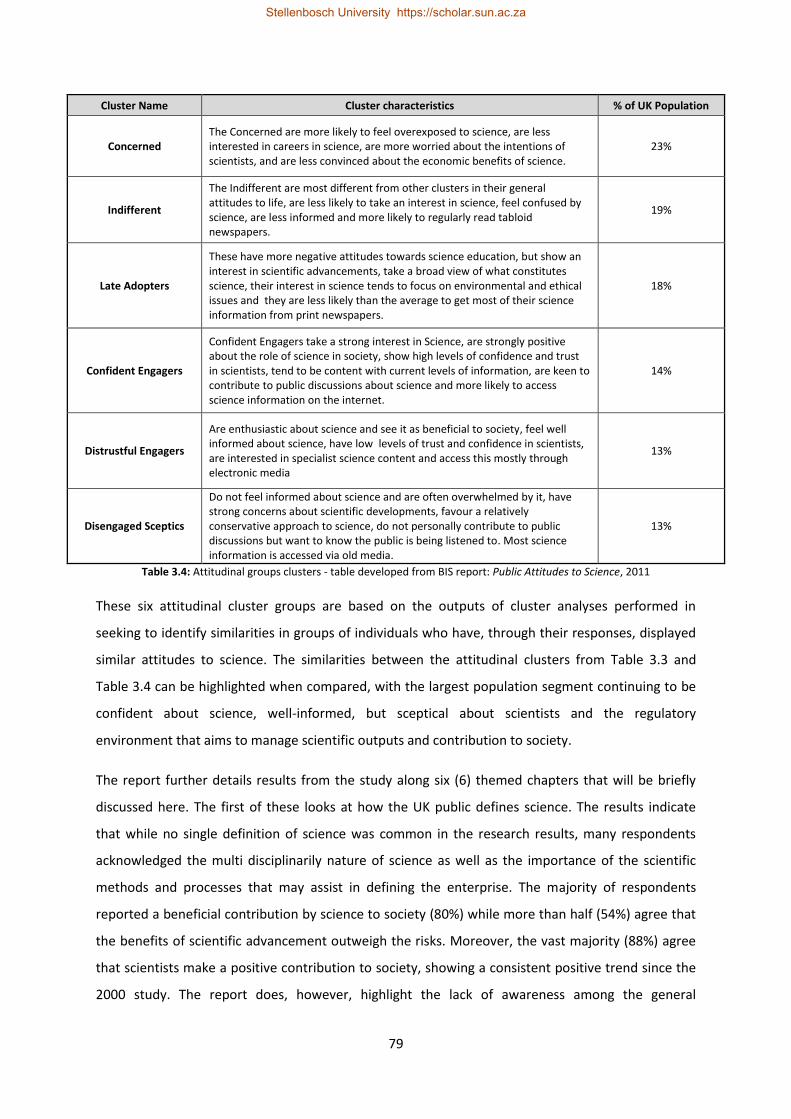
79
Cluster Name Cluster characteristics % of UK Population
Concerned The Concerned are more likely to feel overexposed to science, are less interested in careers in science, are more worried about the intentions of scientists, and are less convinced about the economic benefits of science.
23%
Indifferent
The Indifferent are most different from other clusters in their general attitudes to life, are less likely to take an interest in science, feel confused by science, are less informed and more likely to regularly read tabloid newspapers.
19%
Late Adopters
These have more negative attitudes towards science education, but show an interest in scientific advancements, take a broad view of what constitutes science, their interest in science tends to focus on environmental and ethical issues and they are less likely than the average to get most of their science information from print newspapers.
18%
Confident Engagers
Confident Engagers take a strong interest in Science, are strongly positive about the role of science in society, show high levels of confidence and trust in scientists, tend to be content with current levels of information, are keen to contribute to public discussions about science and more likely to access science information on the internet.
14%
Distrustful Engagers
Are enthusiastic about science and see it as beneficial to society, feel well informed about science, have low levels of trust and confidence in scientists, are interested in specialist science content and access this mostly through electronic media
13%
Disengaged Sceptics
Do not feel informed about science and are often overwhelmed by it, have strong concerns about scientific developments, favour a relatively conservative approach to science, do not personally contribute to public discussions but want to know the public is being listened to. Most science information is accessed via old media.
13%
Table 3.4: Attitudinal groups clusters - table developed from BIS report: Public Attitudes to Science, 2011
These six attitudinal cluster groups are based on the outputs of cluster analyses performed in
seeking to identify similarities in groups of individuals who have, through their responses, displayed
similar attitudes to science. The similarities between the attitudinal clusters from Table 3.3 and
Table 3.4 can be highlighted when compared, with the largest population segment continuing to be
confident about science, well-informed, but sceptical about scientists and the regulatory
environment that aims to manage scientific outputs and contribution to society.
The report further details results from the study along six (6) themed chapters that will be briefly
discussed here. The first of these looks at how the UK public defines science. The results indicate
that while no single definition of science was common in the research results, many respondents
acknowledged the multi disciplinarily nature of science as well as the importance of the scientific
methods and processes that may assist in defining the enterprise. The majority of respondents
reported a beneficial contribution by science to society (80%) while more than half (54%) agree that
the benefits of scientific advancement outweigh the risks. Moreover, the vast majority (88%) agree
that scientists make a positive contribution to society, showing a consistent positive trend since the
2000 study. The report does, however, highlight the lack of awareness among the general
Stellenbosch University https://scholar.sun.ac.za

80
population about the methods and processes employed by scientists in the execution of their work.
Concerns were also raised about the funding of scientific work, as well as the implications for public
policy and future advancements within the various fields (BIS, 2011).
Scientific information sources is a common question globally, and one that has been maintained
within the series of studies within the UK. Eighty-two percent (82%) of respondents indicated an
interest in science and scientific advancements, while 68% of respondents indicate that it is useful in
their daily lives. However, 51% reported that they feel less informed about science and would like to
see increased scientific coverage in the media. Among the sample it was evident that informedness
depended significantly on whether the specific topics were topical in daily discourse (like global
warming and GMO foods) while conversely it was found that topics that dealt with frontier science
were less likely to be common knowledge among the vast majority of respondents (56%). Since
2008, the number of respondents reporting a general informedness about science has decreased,
despite greater reported access to scientific information. Many respondents (62%) reported that this
may be due to the rate of scientific advancements as well as the increased degree of specialisation
across the varying scientific disciplines. The BIS survey also looked at most regular sources of
scientific information among the UK population and indicated that traditional media (television -
53%; print newspapers-33%; radio -14%) still account for the largest share of information sources.
New media sources such as internet websites and microblogging sites only account for 19% of
regular information sources, with men (24%) reporting a greater online science appetite than
women (16%) (BIS, 2011). Similarly, age also plays a role in determining most common source of
scientific information, with younger groups reporting greater online scientific content consumption
compared to those older than 24 years old, with those aged 55+ reporting more frequent use of
print newspapers as a source of science content. However, despite these age-related disparities,
traditional media sources still overwhelmingly remained the most frequent information source
across the sample (BIS, 2011).
Trust in the scientific community and scientists was also assessed in the study and results indicate
that trust may be related to the institutional or scientific community affiliations wherein which the
information originates. Within the sample group, 47% indicated that they generally find scientific
information true, while 34% disagree and adopt a more sceptical view. However, 52% of the
respondent’s further report that information received would be more readily assimilated if it had in
fact passed through a peer review or similar mechanism to verify the findings presented. Results
further indicate that respondents generally feel the most credible source of scientific information is
within scientific journals; however, the study also notes that access to these materials by the general
Stellenbosch University https://scholar.sun.ac.za

81
public is limited and thus mainstream traditional media and online sources remain the core access
point for scientific information.
With regard to public involvement and consultation, many Britons report a degree of cynicism
regarding the impact of public-science consultations. There is general agreement that research
should be directed toward serving the public interest (73%), and many respondents report that
public consultation would aid in fast-tracking any potential social advances that may be derived from
scientific work in the UK. Barriers to effective public participation have been recorded as mostly
associated with lack of general public understanding of scientific issues (26%) as well as lack of public
interest in scientific issues (19%). However, 50% of respondents report that while they applaud the
fact that the public is being consulted, they would personally prefer not to be part of the public-
consultative process.
Looking at the influence of science on the daily life of UK respondents reveals that 50% had visited a
non-formal science learning centre such as a museum, botanical garden or zoo in the preceding 12
months (BIS, 2011). One-quarter of respondents (25%) indicated that their experiences of learning
science during formal schooling had ‘put them off science’ and had led them to question the
applicability of school science in their daily lives. A large majority (70%) of the total sample (n=2 103)
believe that a career in science would be very interesting, however, this figure does decrease among
the 16-24 year old cohort of respondents where only 651%<?> agree with the statement. The impact
of science and scientific developments on economic growth is loosely understood, with 75% of
respondents agreeing that it makes a positive contribution to the economy. A similar percentage
agrees that public funding for scientific activities should continue toward advancing the general body
of knowledge. This is of particular importance as many Britons are in favour of overall reductions in
government spending, despite the abovementioned support for publically financed research
activities.
While the results of the Public Attitudes to Science (BIS, 2011) reveal a UK public that appears to be
supportive of the scientific enterprise, it is clear that it maintains certain long-standing reservations
about the activities of scientist and scientific institutions with respect to potential impact on society.
The interest in scientific activities among respondents in this study appears to have increased since
the previous release of the study in 2000 and 2008, as well as the public perceptions about its ability
to understand and assimilate scientific information. Access to information remains via traditional
media types, though there is evidence emerging that among the youngest segments of the
population this is advancing toward a more electronically based access protocol. There is
furthermore evidence strengthening the public perception of the benefits of science over the
Stellenbosch University https://scholar.sun.ac.za

82
potential risks associated with certain advances, both in terms of knowledge advancement as well as
social and economic impact of science on society. Attitudes to science appear to be fluid and may
shift between positive and negative depending on the specific scientific topic being addressed, the
institution presenting the information and the perceived credibility of the information received. The
study similarly presented six (6) attitudinal groups within the UK general population (see Table 3.3
above) within which targeted communication modalities and messages may prove useful for
developing more positive attitudes toward science among the specific demographic groups in the
least positive segments.
3.1.5 Japan: Public understanding of science research in the Land Of The Rising Sun
Following World War 2, Japan recorded a period of unprecedented economic growth, becoming the
second largest economy in the world, just behind the USA. While much of this success related to the
geo-political situation during the period between World War 2 and the end of the Cold War, the
economic, social and political progress of Japan accelerated tremendously during this time.
However, by the end of the Cold War, Japan began to experience the impact of overinflated real-
estate and stock market prices and entered a period of gradual economic decline during the early
1990s (Otsubo, 2007). Despite this Japan has maintained a high human development index (HDI),
ranking 10th globally, just behind Switzerland and Sweden (UNDP-HDI, 2013). Linked to this, Japan
has an extended history of scientific development, learning and teaching which has accelerated
progress, which despite recent economic deflation, has continued to influence Japanese society.
Early efforts by the Meiji Government (1860-1912) toward enforcing compulsory education across
Japan from as early as 1872 led to a highly educated population as well as a higher proportion of
tertiary education, vocational training and educated women than in many other developed countries
during this period (Nagahama, H, 1994). Much of this effort was directed toward leveraging a literate
and capable workforce and positioning Japan favourably in terms of economic and military
capabilities with respect to its Western counterparts.
As the study of scientific literacy and public understanding of science advanced across Europe and
the United States of America, so too did interest in these metrics reach the Far East and attracted
the interest of researchers working within the rapidly developing economies in this region. As Japan
altered its science policy from a position of ‘catching up to the west’ to a more contemporary policy
of ‘leading technological advancements’, so too was it important to understand Japanese
perceptions of domestic excellence. As much of this related to areas of scientific and technological
progress and advances, researchers’ interest evolved into the study of scientific literacy and public
perceptions and understandings of science in Japan since the late 1980s (Nagahama, H, 1994).
Stellenbosch University https://scholar.sun.ac.za
83
The first survey of scientific literacy and the public understanding of science in Japan were
conducted by the National Institute of Science and Technology Policy (NISTEP) in 1991. The survey
was designed to assess the levels of scientific literacy and public attitudes to science in the Japanese
population, as well as to provide a baseline international comparison (NISTEP, 2002). Due to the
need for international comparison, many of the measures and questions used in the Japanese
questionnaire were adopted from the United States NSF-SEI and the European Commission
Eurobarometer Surveys, which conform to the models of scientific literacy proposed by Miller (1983)
and Shen (1975), (Kawamoto et al, 2013). The survey was repeated by NISTEP in 2001, and it is this
latter survey that this review will focus its attention on. The 2001 Survey of Public Attitudes Toward
and Understanding of Science & Technology in Japan yielded a nationally representative sample of
2 146 respondents of both women and men, aged 18 years and older. The survey employed a 2-
stage random-stratified sampling technique and conducted face-to-face interviews between
February and March 2001 (Ishii, 2002). Due to the requirement for international comparability, the
surveys adopted many of the themes from the NSF and Eurobarometer surveys. This included items
on level of interest; sources of information; public attentiveness to science; basic science knowledge
assessments; measures of attitude to science; risk/benefit awareness of science and government
support for science (NISTEP, 2002). These themes allowed the authors to make meaningful
comparisons with similar questions in the American and European surveys. Some of these results are
discussed below.
Results from the 1991 and the 2001 NISTEP surveys indicate generally lower scores for the Japanese
population when compared to responses to similar questions in both the USA and European
populations, likely as a result of cultural distance between the Western and Eastern approach to
basic learning and scientific literacy. On questions related to levels of interest and informedness on a
number of issues, Japanese respondents rated science and technology issues very low, between
defence and atomic energy issues. The highest rated issues on this scale were environmental
pollution, economic issues, medical discoveries and issues of schooling and education. Interestingly,
for science and technology, 44% indicated a level of interest in these issues, but only 28% reported
being well informed about recent developments within this domain. Comparing the Japanese scores
to their international counterparts’, in the 1991 survey 50% of Japanese respondents indicated an
interest in scientific issues, 11% lower than both the USA and European (average) scores of 61%. In
the 2001 survey, the Japanese scores fell further, to 44%, and while both the US and the European
scores recorded a similar decreased during this period, Japanese scores were still significantly lower
(NISTEP, 2002).
Stellenbosch University https://scholar.sun.ac.za

84
Level of understanding of basic scientific concepts has been employed in scientific literacy surveys
since the earliest measures were developed (Miller, 1998; Roberts, 2007). Both the 1991 and the
2001 NISTEP surveys employed a 15-item battery of statements relating to scientific concepts and
respondents were asked to indicate whether the statements were true or false, with a don’t know
option also provided. Japanese respondents’ average score for reporting correct answers to this
battery of questions was 54% in the 2001 survey. While this compared favourably with selected
countries, it was still lower than a number of European countries and the USA (NISTEP, 2002). It
must be noted, however, that the majority of scores in the international comparison tables were
below 70%, indicating a generally lower performance on questions of this nature across national
surveys. Furthermore, only 11 of the 15 items in the Japanese survey were comparable with similar
international surveys. Using cluster analysis, it was revealed that among the 15 questions in the
Japanese survey 4 cluster groups were identified, depending on the level of difficulty associated with
answering the specific questions.
Results from the 2001 NISTEP study reveal generally positive attitudes relating to areas of science
and technology (NISTEP, 2002). Questions on whether a) science has made the world better b) life
more comfortable c)provided more opportunities for future generations, and d) if science has made
vocational environments more interesting, attracted positive responses from more than 50% of the
sample group. However, on questions relating to the risks and benefits of scientific advancement,
the Japanese appeared more ambivalent and, while reporting a general sense of support for
scientific enterprises, showed a sense of risk awareness hovering between the potential harmful
impacts of science and an area of indecision, where risks are about equal to the benefits. This was
particularly apparent when it came to questions relating to genetically modified (GMO) food
products. Most respondents reported that the harmful impacts may outweigh the benefits of GMO
food products, with 16.3% indicating a don’t know response to this question (NISTEP, 2002).
Similar to the NSF-SEI in the USA and the European Eurobarometer surveys, in the NISTEP survey
data was also collected on the most popular sources of scientific information used by the general
Japanese public. As in the USA and Europe (and almost all PUS surveys globally) older media
channels continue to be the most important source of scientific information. Japanese, like many
others, rate television as the most important information source of scientific information (91%),
followed by newspapers (70%), magazines/ journals (35%) and books (13%). This survey was
conducted in 2001, when internet penetration was not as common as it is in 2016, and this media
accounted for 12% of most frequently accessed information sources in 2001. However, when asked
which information source would you prefer to use in the future, 31% of respondents indicated that
Stellenbosch University https://scholar.sun.ac.za

85
the internet would become a major information source of science and technology information
(NISTEP, 2002). On questions related to public opinion, as to who should be responsible for
promoting public understanding of science among the Japanese population, 43% of respondents
indicated that the primary responsibility should rest with the government; 38% felt scientist and
researchers should play a greater role; and 34% indicated that educators should make greater
efforts toward science popularisation. Interestingly, only 29% and 27% of respondents indicated that
the mass media and the general public, respectively, should play leading roles in promoting an
enhanced public understanding of science in Japan.
In 2007, Kawamoto et al conducted an empirical research study entitled Survey of current status of
scientific literacy and development of educational program by tendencies in social activities. The
study was conducted by the Research Institute of Science and Technology for Society of the Japanese
Science and Technology Agency programme, Scientific Literacy of the 21st Century. Under this
programme, the broad aim of the study was to investigate the principal requirements of practical
science communication activities of the Japanese public by understanding scientific literacy in terms
of its importance in society. The outcome of the study was the development of a 3-factor/4-cluster
model by which to understand Japanese public’s scientific literacy, which was similar to the
Wellcome Trust and Department for Business, Innovation & Skills, IPSOS / MORI study in the UK
(2000 and 2011). Similar to the NISTEP (2002) study, Kawamoto et al surveyed 1 286 adults aged 18
years and older using a two-stage random stratified sample from the Basic Residents Register16 to
yield a nationally representative sample. However, instead of conducting face-to-face interviews,
Kawamoto et al employed a postal survey method, whereby 4 000 questionnaires were dispatched,
with an eventual response rate of 32.15%, compared to the 71.5% response rate in the NISTEP
(2002) survey which used face-to-face interviews. Adopting learnings from studies in the UK, the
Eurobarometer, PISA and the NSF studies, Kawamoto et al adopted a definition of scientific literacy
that included all three aspects of the Miller – Shen model which included measures of knowledge,
attitudes and the impact of science on society. The definition adopted within the study was:
‘Scientific literacy is the capability of making a social judgment and taking action on issues involving
science and technology by linking basic scientific knowledge and methodologies to interests and
attitudes, including those related to science.’ (Kawamoto et al, 2011).
16
Similar to Census data
Stellenbosch University https://scholar.sun.ac.za

86
Table 3.5: Questionnaire structure of 2007 Kawamoto et al study
The questionnaire consisted of five (5) parts, each containing a series of questions related to a
particular dimension within the scientific literacy definition. Table 3.5 below summarises the
questionnaire structure as well as the specific focus of the questions. In addition to the questions
listed in Table 3.5, basic demographic information was also collected at the end of the questionnaire
that aided in developing the clusters within the results. Using factor analysis techniques, factors
were extracted from the 65 questions in the initial three (3) question groups and respondents were
then classified into ‘scientific literacy clusters’ based on the scores attained in each of the extracted
factor groups. The three factor groups used were based on the question groups in the questionnaire;
including a ‘scientific knowledge’ factor, a ‘social factor – related to interest and social involvement
in science, and the third factor of ‘science appreciation’, related to appreciation of science as well as
attitudes to scientists (Kawamoto et al, 2011). These factor groups were then constructed into a 3-
factor/4-cluster model of scientific literacy within the Japanese population, similar to the UK studies
discussed above.
The results of this study were intended to provide the basis for future communication strategies
relating to science, to improve scientific literacy among the Japanese population. Results indicate
that though Japanese participants have a high knowledge of science concepts, they however might
not be particularly active in the support of science matters and public involvement (Kawamoto et al,
2011). A second finding in the study was that science-appreciating factors greatly influenced the
science knowledge and social factor among Japanese, indicating that attitudes and knowledge may
be related to how science and scientists are perceived by the general public.
Stellenbosch University https://scholar.sun.ac.za

87
Beyond the above-mentioned studies, since 2000 there have been a limited number of other
empirical studies conducted in Japan dealing with scientific literacy, public understanding of science
as well as science communication areas of interest. NISTEP has, since 2009, launched an internet
survey monitoring various aspects of science communication in Japan, beyond scientific literacy.
These include attentiveness to scientific issues - particularly those of significant social importance
such as the impact of the Japanese tsunami of 2011 - impact of science on society, and expectations
of science’s impact on society. The Trends in International Mathematics and Science Study (TIMMS)
survey, which collects information on students at grade 4 and grade 8 every four (4) years toward
assessing math and science achievement among primary and secondary school learners, has also
been implemented in Japan since 1995, with the most recent survey completed in 20117. In addition
to these, public perception surveys had also been conducted by the Office of the Japanese Prime
Minister in 1976, 1981, 1986, 1987, 1990, 1995 and 1998. The Japan Science and Technology Agency
(JSTA) has also been active within public understanding and promotion of science activities since its
inception in 1996, and since 2011, to date, has been highly active in promoting the Japanese Science
and Technology Basic Plan toward fostering an increased public understanding of science and
promoting scientific careers, science communication and awareness in Japan.
What is however apparent, and relevant to many countries in the Far East, including Japan, is that a
number of these studies are exclusively published in Japanese, with no English versions available for
review. While this does present a minor limitation, the above review of empirical work from within
Japan does present a cursory view of the status of public understanding of science and scientific
literacy research in the island nation as well as its comparability in terms of method protocol and
outputs of empirical studies relative to other developing countries discussed above.
3.1.6 Australia: large surveys of public understanding of science and scientific literacy
As a result of its colonial past and being part of the Commonwealth, Australia enjoyed many benefits
of its ties to the United Kingdom and Europe through trade and political relations that has shaped
modern Australia in numerous ways. A country of 23 million people, Australia has developed into a
formidable global entity, with a stable and successful economy and ranking 2nd on the Human
development index (UNDP-HDI, 2013). Since the 1970s, Australia has undergone a number of
changes domestically, endeavouring to reinvent itself and its institutions toward adapting to a
changing world (Gascoigne & Metcalse, 1994). Science and scientific institutions have also adapted
under these changes and have impacted on science communications practices as well as science
education, the public understanding of science and scientific literacy. Early surveys of public opinion
17
TIMMS surveys will be discussed later in this chapter as it pertains to the South African context
Stellenbosch University https://scholar.sun.ac.za
88
toward science in Australia revealed that a large portion of the population failed to appreciate
science and technology adequately and did not view careers in science to be attractive toward
gainful employment prospects (NBEET, 1993). Much of this anxiety was found to be linked to a
limited public understanding of science, and following this, a number of projects were established in
Australia that set out to develop a more positive public understanding and appreciation of science
and technology among Australians (Gascoigne & Metcalse, 1994). While much of this work was
related to science popularisation efforts in conjunction with the mass media services, education was
also seen as a key driver of these goals, and the majority of efforts to promote scientific literacy in
Australia were focused within the education domain. Among the earliest efforts to measure the
general public understanding of science in Australia were some conducted by the Australian
National Board of Employment, Education and Training, who commissioned a study entitled “What
do they know? : The understanding of science and technology by children in their last year of primary
school in Australia”. This report assessed educational outcomes of primary school education in
Australia as it related to the general understanding of science and technology, and set a baseline for
measurement of learner scientific achievement in Australia.
Similar to a number of other developed economies, Australia participates in the PISA surveys and,
since its inception in 2000, has performed consistently well in every wave of the survey. In the most
recent wave, Australian students on average, scored significantly higher than their peers in other
OECD countries, having been outperformed by only four territories - Finland, Hong Kong, China and
Canada (PISA, 2012). On measures of scientific literacy and scientific proficiency, 3% of Australia´s
students achieved the highest scientific literacy proficiency level in PISA, which was above the OECD
average of 1%. At Level 6, students can consistently identify, explain and apply scientific knowledge
and knowledge about science in a variety of complex life situations. The majority of students in
Australia ranked at proficiency level 4 or level 5, indicating generally higher scientific literacy
proficiency among Australian learners. Another large international survey frequently administered in
Australia is the TIMMS survey, wherein 6 146 learners were surveyed in the 2011 round of this
survey’s 4-yearly cycle. Australian learners scored significantly higher than 23 other participating
countries, and were ranked 19 overall out of the total 43 countries which has been a fairly consistent
performance over the last 4 waves of the TIMMS survey (Thomson et al, 2011). A further initiative in
Australia has been the Progressive achievement test in science testing system that seeks to identify
students in the lower schooling grade’s abilities in relation to expected science educational
outcomes. While this is not a large survey of scientific literacy, it is a unique feature within the
Australian science education system and public science literacy initiative not seen in other countries.
These tests are based on multiple choice questions that require various skills to be applied to
Stellenbosch University https://scholar.sun.ac.za

89
stimulus material related to required science educational competencies that are very similar to the
PISA questionnaires. The results of these tests are focused on the individual participant rather than a
population of young people (as in PISA or TIMMS) and directed interventions are then identified
toward addressing particular strengths or weaknesses of particular individuals.
In 2010, the Australian Academy of Science commissioned a survey, conducted by AusPoll and
entitled Science Literacy in Australia 2013. The survey presented the results of a survey similarly
conducted in 2010, and provides comparisons across the two surveys on basic questions of science
literacy. Important to note is that this survey only collected information on science knowledge
factors, and not attitudinal, information sources or other related data points found in other surveys
of the public understanding of science. The questionnaire used was adapted from a similar survey
carried out by the California Academy of Science in 2009. The Australians adopted an online design
in implementing their survey methodology, which, unlike South Africa, has an internet penetration
rate of 82.3% among both rural and urban populations, and this was deemed feasible for a reliable
survey design (Wyatt & Stolper; 2013 ). The sample was weighted to reflect the national
demography, taking into account age, gender and domicile location (rural or urban). The total
sample achieved was 1 515 and was representative of the Australian population. Results of the
survey indicate that while most Australians have a basic grasp on scientific facts and may possess a
degree of scientific literacy, approximately 30% of respondents still were not able to provide the
correct answers to many of the knowledge questions in the questionnaire. In comparing the 2013
results to the 2010 survey, a statistically significant decrease in overall scores was observed,
indicating a declining scientific literacy rate in Australia between 2010 and 2013. As with many other
surveys of basic scientific literacy (as opposed to surveys of public understanding of science)
generally younger participants who are male and better educated achieved higher scores compared
to their counterparts within and across those demographic groups (Wyatt & Stolper; 2013).
However, despite this general finding, the authors also report that the younger age groups within
the study, and particularly the 18-24 age groups displayed a higher proportional drop in scientific
literacy compared to the same demographic group in the 2010 survey (from 74% in 2010 to 62% in
2013). Despite this, Australians generally appear to have a high sense of scientific literacy as
reported in 2010 and 2013, and indicate an acute awareness of the value and contribution science
makes to the Australian economy and modern way of life (Wyatt & Stolper, 2013). However, the
detailed results of this survey will not be discussed in this review as it provides limited value to the
current project due to its exclusive focus on scientific knowledge areas rather than the extended
social and attitudinal spheres of this research arena.
Stellenbosch University https://scholar.sun.ac.za

90
During June and July of 2010, the Australian National University, in conjunction with its College of
Physical and Mathematical Sciences and the College of Arts and Social Sciences, ran the 8th ANUpoll,
a quarterly public opinion survey conducted since 2008. The ANUpoll is a nationally representative
survey of Australians 18 years and older, with a focus on public opinion in relation to the many policy
issues facing Australian society. The 2010 wave, with its focus on what the Australian public views as
important in relation to science, scientists and climate science, surveyed 1 200 adults via telephone
interviews and yielded a response rate of 43.2% (Lamberts, Grant & Martin, 2010). The survey team
employed a random digit dialling (RDD) approach in conducting the fieldwork as it presented more
accurate and reliable coverage and representation in relation to the overall sample design and
national demography. In Australia, this approach is widely accepted due to the high penetration of
fixed and mobile telephones, and overcomes the problems associated with unlisted and private
numbers by not being dependent on a telephone listing but rather on random digit dialling within a
defined exchange area (Cummings, 1979).
The survey presented its findings as well as comparisons to similar international opinion surveys
toward understanding the implications of the results within the specified policy context. The
questionnaire consisted of forty-six (46) questions, with multiple response options either requiring
single selections or multi-selections depending of the question context. While conducting telephone
interviews, fieldworkers used computer aided personal interview (CATI) software to record
respondents answers to the questions. The first section covered the political situation in Australia,
and asked questions dealing with public satisfaction in relation to the current Australian leadership,
and problems facing the country – from housing, employment, youth issues, education etc. These
were presented as multiple choice-type questions. The second section made up the major focus of
the questionnaire, assessing public opinion in relation to science and specifically science knowledge,
interest and attitude, consisting of 34 of the total 46 questions (74%). Questions in this section were
again multiple-choice. However, response options were limited to single selections on appropriate
scales ranging from scales of agreement/disagreement to predefined response categories, as well as
refusal and don’t know options. The third section of the questionnaire asked questions relating
specifically to issues of science and climate change as well as issues related to public policy and
science. This section had two (2) questions relating to climate change issues and seven (7) questions
relating to public policy issues, having similar response options to the preceding section in the
questionnaire.
On questions relating to knowledge and interest in science, Australians indicated a general interest in
areas of science including medical science and discoveries, environmental issues, issues of crime and
Stellenbosch University https://scholar.sun.ac.za

91
general scientific discoveries, 50-70% of respondents indicating interest in these fields. This was
significantly higher than reported interest in film, politics, music or sports issues, which all scored
well below 40% in terms of public interest ratings (Lamberts, Grant & Martin, 2010). In a series of
questions that appraised public opinion about the relative contributions various professions made to
Australian society, scientists, doctors, teachers and engineers were rated considerably higher than
the police force, politicians, members of the various religious fraternities and artists. However,
despite the abovementioned support for science in Australia, a significant proportion of the
reporting population indicated that they do not feel very well-informed about science and scientific
developments (45%); only 10% indicated that they do feel well informed. These results compared
favourably with Eurobarometer Surveys and indicated that Australians are marginally more
interested in the array of topics and felt similarly under-informed about scientific advancements
compared to their European counterparts (Lamberts, Grant & Martin, 2010).
Questions relating to the value and contribution of science as well as questions assessing attitudinal
aspects of the science-public relationship were also included in this section of the questionnaire, and
here Australians generally indicated positive attitudes and appraisal of the contribution of scientists
to society. A series of eight (8) separate questions were used to construct a scale resembling an
index of promise and reservation. Individual questions used seven (7) response options, included a
5-point agreement scale, ranging from strongly agree to strongly disagree, including a neutral option
as well as a don’t know and refusal option. In the final construction of the index of promise and
reservation, six (6) questions contained statements of general promise of science while two (2)
questions contained statements of general reservation to areas of scientific advancement.
Australians generally responded more frequently in agreement to statements of scientific promise,
than they did to statements of scientific reservation, indicating a high sense of promise and general
positive attitudes relating to science’s impact on society. However, the majority of the respondents
indicated ambivalence about the impact science may have on eradicating poverty as well as the
ability of science to resolve any or all problems facing society. The above compared favourably with
European results to similar questions. However, as before, Australians generally report more
optimistically about the promise of science to society, compared with results of the Eurobarometer
surveys (European Commission, 2013a; Lamberts, Grant & Martin, 2010).
The Australian 2010 survey also asked questions relating to the interaction of scientific advances and
theory on the personal religious beliefs of respondents. While similar questions have been asked in
other surveys, this topic has not received the attention in any other empirical work as that devoted
to in the ANUpoll survey. Results from the survey does indicate that 30% of the sampled individuals
Stellenbosch University https://scholar.sun.ac.za

92
reported belonging to no particular religious group; 69% of the total sample did however indicate
that scientific views are often in conflict with their religious practices, while 26% indicated that their
religious views are compatible with the scope and theory of current scientific work. On this measure,
Australians presented a slightly different picture compared to results coming out of a similar series
of questions from the United States of America, wherein only 55% of respondents indicated a
conflict between their personal religious and scientific worldviews. However, there were minor
differences in the manner in which the questions were presented in the two surveys. The ANUpoll
also investigated areas of public understanding of policy as it relates to science and social issues. The
majority of Australians (60%) indicated that the domestic science was on par with world scientific
developments and achievements. However, in this section, Australians also indicated a less positive
picture about government involvement in areas of science, public science policy and regulation
associated with private sector scientific work in Australia. While Australians overwhelmingly agree
that governments should rely more on scientific evidence in decision making (80%), a similar
proportion further indicated that politicians should rely on ‘sound’ scientific advice and not
information that has been interpreted by the media (Lamberts, Grant & Martin, 2010). While 31% of
respondents agreed that private sector research is well regulated, 47% indicated a disagreement
with the statement, but offered no further insight as to what regulations are required and to which
end regulation would be beneficial. Yet in spite of those views, 77% of Australian respondents
support continued government investment into scientific work to drive the progress of science in the
country, which is higher than the percentage of Americans and Europeans who agreed with a similar
statement in surveys of those territories (Lamberts, Grant & Martin, 2010).
The series of questions on science and climate change revealed that generally Australians remain
divided and uncertain about climate research, with over 40% agreeing that there is limited
consensus among scientists about climate and issues of global warming (Lamberts, Grant & Martin,
2010). Moreover, 34% of Australians further agree that there is a lot of disagreement between
scientists with respect to the actual human influence on climate change since the mid-20th century.
Results here again compared well to results from a similar American survey conducted by the
Princeton Survey Research Centre, wherein a similar proportion of respondents agreed about the
fact that the earth is warming, but differed by about 11 % with respect to their perception of
agreement within the scientific fraternity on the actual impact human activities have had on climate
change (47% USA, 59% Australia). In 2010, Griffith University Schools of Applied Psychology,
Behavioural Basis of Health, Griffith Climate Change Response Program in conjunction with the
National Climate Change Adaptation Research Facility conducted a dedicated survey entitled Public
Perceptions, Understanding and Response to Climate Change and Natural Disasters in Australia
Stellenbosch University https://scholar.sun.ac.za

93
(Reser et al, 2012). This survey sampled 4 347 respondents on various issues of public
understanding, perceptions and risk assessment of climate change. Respondents generally
considered climate change and human impact on the environment to be a very serious problem,
with 74% of respondents agreeing that climate change is currently happening in Australia. Further to
this, 50% of respondents also reported that Australia is already dealing the impacts of climate
change. The survey found that Australians knowledge of climate change was generally correlated
with their associated concerns for the impacts of any potential climate shift (Reser et al, 2012). The
study also found that belief / acceptance, risk appraisal, perceived responsibility, psychological
adaptation to climate change, self-efficacy, climate change distress, trust, behavioural engagement,
and perceived direct experience with climate change were also positively correlated with objective
knowledge of climate change, illustrating the broad categories that may influence public
understanding and engagement with general or specific issues that border the science-social
spheres. While the survey results will not be discussed in great detail here as it only relates indirectly
to the current chapter, the survey design will be revisited in the following chapter.
The above review of selected studies of public understanding of science and scientific literacy from
more developed countries illustrates the approaches adopted in different countries. It also
demonstrates the application of cross-national survey instruments in larger surveys such as PISA,
TIMSS and ROSE. While some of these large cross-national surveys have been adopted in developing
countries as well, they have been discussed here to allow greater focus on the distinctiveness that
exists in some developing countries’ studies of public understanding of science. In the next section
we begin to discuss a selection of public understanding of science and scientific literacy studies from
the developing world. Countries selected represent a mix of socio-geographical factors as well as
studies of interest due to methodological uniqueness’s that have proven valuable to the current
study. The countries represented include China, Malaysia, India, Brazil and South Africa.
3.2 EMPIRICAL STUDIES FROM DEVELOPING COUNTRIES
3.2.1 Surveys of scientific literacy from the People’s Republic of China
The People’s Republic of China has, for the largest part of recorded human history, been the largest
and most advanced trading and financial centre on earth (Dahlman, 2001). However, due to its
protectionist strategies under both imperial and socialist rule, during the last 200 years China closed
its doors to the outside world and, as a result, its economy stagnated due to under-industrialisation.
Since the late 1970s, and following the opening of the Chinese economy to the global marketplace
and the internal privatisation of former state-controlled industries, China has seen economic reform
Stellenbosch University https://scholar.sun.ac.za

94
that in 2013 saw it become the largest Asian economy, with forecasts that it will become the largest
economy in the world by 2020, overtaking the United States (World Bank, 2011).
At the turn of the 21st century, China again faced the challenge of adapting to a changing world as it
had when it closed its doors to the industrial revolution. The emerging global knowledge economy
represents the next chapter in the evolution of economic production, and to ensure that China
meets the demands of this new challenge, the country began an internal process of gearing up
toward meeting this challenge (Dahlman, 2001). In June 2002 the Chinese government ratified the
law on the popularisation of science and technology in China, aimed at improving Chinese scientific
literacy by 2020. The aim of this law, unique in the world at the time, was to ensure that science
popularisation and scientific literacy efforts were directed toward national development, economic
growth and long-term social progress for the Chinese state. In 2006 the Chinese government issued
the Outline of The Action Plan for Improving Scientific Literacy for All, followed by The Guiding
Principles for Science Popularisation Capacity Building and Strengthening in 2007 and the Science
Popularisation Infrastructure Plan in 2008. The centralised approach in much of Chinese political
reform strategies remains a legacy of the country’s imperial and socialist history. However, the
above milestone documents and laws, with their aim of promoting and developing scientific literacy,
educational and socio-economic reform, have displayed some success in the immediate short-term
as a direct result of targeted government focus on these issues (Sun, 2010). These various
documents, under the Chinese Law for The Popularisation of Science and Technology take into
account the varied demographic profile of its 1.4 billion citizens. These laws developed targeted
actions for improving scientific literacy in four (4) main population groups, Youth, Farmers, Urban
Middle Classes and the Political Elite/Public Servants. The targeted actions shared themes of
enhanced educational approaches, supplementary science education and activities, access to
scientific material and media sources as well as various training programs and scientific outreach
initiatives. The aims of these various initiatives were to improve China’s scientific literacy and equip
Chinese citizens with the necessary skills to meaningfully participate socially, civically and
economically in an evolving Chinese economy (Dahlman, 2001).
An important part of the Chinese science popularisation effort has been the Chinese Association for
Science and Technology (CAST). Founded in 1958, following the amalgamation of two earlier
organisations, CAST today represents 167 national academies of science and professional societies in
China, with over 4 million members (Sun, 2010). As with many other countries in the world,
sustained efforts and investment in scientific literacy projects have seen some improvement in
overall levels of scientific literacy in China, with varying results within the different demographic
Stellenbosch University https://scholar.sun.ac.za

95
clusters. China has participated in international surveys such as PISA and TIMSS (discussed above)
and has displayed exceptional performance, with school learners achieving top scores in all
measurement categories. It is however to be noted that results like these are not common for the
broader Chinese population. While efforts by CAST and its partner organisations have shown some
promising results, the rate of change is still very slow and China has made efforts to begin to
accelerate change in the future (Hu & Peng, 2010). China is now in the second phase of the Outline
of The Action Plan for Improving Scientific Literacy for All, wherein Phase 1, from 2006-2010, was
designed to increase Chinese scientific literacy to that of developed countries in the 1980s. The
second phase of the plan seeks to further increase Chinese public understanding of science and
scientific literacy to match, by 2020, the goals set by developed countries at the beginning of the 21st
century (Chen et al, 2009).
Interestingly, the concept of scientific literacy is defined slightly differently in China compared to the
definitions encountered above. ‘…he or she possesses the ability to understand the necessary
knowledge of science and technology, to know basic scientific methods, to keep thinking
scientifically, to advocate scientific spirit, to use the above in making decisions in personal life and to
participate in public affairs involving science and technology’ (State Council of the People’s Republic
of China, 2006). Drawing on the earlier works of Shen (1975), Miller (1983), Shamos (1995) and The
OECD-PISA (2000) definitions, a Chinese citizen is defined as being scientifically literate. While
knowledge, attitude and application of scientific principles are important to the Chinese, they have
also included elements that speak to a scientific spirit, a concept similarly shared in India that alludes
to a general ideological position which binds all the elements of the previously mentioned attributes
of scientific literacy (Wang, 2007 in Chen et al, 2009). Furthermore, the Chinese definition also takes
into account the ‘…necessary knowledge of science…’, which alludes to a social and situational
context for knowledge, attitude, ideology and behaviours by different segments of the population,
as not all citizens require all forms of scientific literacy in every social context (Chen et al, 2009).
CAST has conducted six (6) surveys of scientific literacy in China, in 1990, 1994, 1996, 2001, 2003 and
2005. Those surveys employed methodologies applied elsewhere in the world and were based on
the indicators previously established by Miller. Critics, like Li (2006, in Chen et al, 2009) argue that
many of these indicators may not be suitable to the Chinese social context and have advocated for
the development of socially applicable and relevant indicators for that country’s context. Starting
from the definition of scientific literacy adopted by CAST, appropriate measurement indicators,
research instruments and research approaches were developed toward meaningful measurement.
Scientific indicators were thus developed to measure the three (3) principle dimensions in the
Stellenbosch University https://scholar.sun.ac.za

96
Chinese definition: a) Scientific knowledge, b) Scientific awareness and c) scientific abilities (Chen et
al, 2009). In conducting the research, each of these primary indicators is further broken down to
sub-indicators that provide additional insight into primary indicator elements.
Primary Indicator Secondary Indicator Interpretation
Scientific Knowledge
Scientific concepts Knowing and understanding basic science terms
Scientific theories Understanding basic scientific facts and principles
Scientific processes Understanding basic processes of science research and basic scientific methods
Scientific Awareness
Attitudes to science and technology Appreciation of science
Consciousness of using scientific knowledge and methods
Explaining observable phenomena using scientific rationales rather than supernatural or superstitious ideas
Consciousness of testability Insisting on testing ideas before believing them to be true
Awareness of the impact of science on daily lives
The agreement or disagreement to socially impacting issues on the basis of some understanding of the issues at hand, rather than on prejudice
Scientific abilities General abilities Ability to use scientific knowledge in decision making and action
Special abilities Ability to conduct innovation activities
Table 3.6: Indicator system of Public Scientific Literacy in China, adapted from Chen et al, 2009
Table 3.6 above outlines the main and secondary indicators that were used to produce the 81
questionnaire items piloted for use in the revised survey series at CAST, and subsequently refined
further within the larger project life cycle. Whilst the above indicators are incredibly valuable toward
understanding Chinese scientific literacy profiles, opportunities and focus areas, the results of these
initial pilot surveys have not been made public due to the metrics still being in a stage of
development (Chen et al, 2009).
The first survey of Chinese public understanding of science and scientific literacy was conducted by
CAST in 199018 (Zhang et al, 1993). Due to the large coverage area of mainland China as well as the
size of the population, the survey employed a large number of fieldworkers to ensure that interviews
were effectively and accurately completed. The sample design aimed at surveying 5 000 Chinese
individuals, however yielded a final survey response of 4 523 responses from face-to-face interviews.
The sample was designed to include a subset of all Chinese adults aged 18 years and older. As China
consists of two major ethnic groups, both were included at the appropriate ratio so as to be
representative of the population. The questionnaire developed for the survey adopted certain
elements from the USA-NSF, the European Eurobarometer, the United Kingdom ONS surveys and
the Japanese survey questionnaire items to ensure some degree of international comparison within
the results. Significant alterations had to be implemented with respect to the language and item
18
Despite more recent survey having been conducted, availability of full research reports in English is very limited; therefore the review focuses on the 1990 survey.
Stellenbosch University https://scholar.sun.ac.za

97
construction to account for the Chinese languages, culture and social contexts where fieldwork was
conducted. Demographically, China differs considerably from developed world nations in that
smaller proportions of the population have received middle and higher education and still fewer
have any tertiary education. Furthermore 74% of the Chinese population still live in rural areas and
are mostly involved in agricultural subsistence, thus removing them mostly from daily contact with
science and technology. However, this is why China aimed to spread its influence through research,
and thus the importance of these baseline measures.
China has a number of science information channels, from major investments in museum and
science learning centres in the cities, to a large number of domestically published journals,
magazines and news articles. National television and radio services have dedicated science
programming aimed at a variety of demographic groups in China. The survey was thus conducted in
a social climate of science prioritisation and generalised accessibility to material and science-related
media, particularly for Chinese people in urban areas. The results of the survey indicate that
television, radio and print material respectively remain the major sources of scientific information
for Chinese nationals. The three least selected options for sources of scientific information - public
libraries, science centres and museums - were rated as not being very popular information sources
for the majority of respondents in the survey. In comparisons with data from the USA NSF survey of
the same year, more Chinese (36%) than Americans (20%) reported television as the primary source
of scientific information. Interestingly, however, with respect to the aforementioned three least-
popular information sources in China, significantly more Americans reported these as more
important information sources, particularly public library resources, where 51% of Americans visited
public libraries three or more times a week, compared to only 7% of Chinese.
Results of questions relating to understandings of scientific terms and methods were assessed
through a battery of questions that asked both general questions and questions on specific fields of
science or rooted in specific scientific concepts (Zhang et al, 1993). Questions seeking to probe the
understanding of scientific terms asked respondents their level of understanding with regard to
three (3) terms: Molecule, DNA and Computer software. The majority of Chinese citizens either did
not respond to each of the three questions or provided an incorrect answer, and only 7% provided
correct answers to demonstrate an accurate understanding of these terms. In general, male
respondents showed a better understating of the three scientific concepts compared to female
respondents, while similarly, younger respondents also reported more frequent correct answers
compared to older respondents. With respect to international comparisons, American and British
surveys report similarly poor understandings of scientific concepts; however the rate of response is
Stellenbosch University https://scholar.sun.ac.za

98
not as low as demonstrated within the Chinese survey. The understanding of scientific methods and
processes were also investigated in this survey and the results indicate that generally Chinese
respondents do not have a clear understanding of what it means to study something scientifically.
The results indicate that only 7% have a clear understanding, while 39% demonstrate a general
sense of what it means to study something scientifically (Zhang et al, 1993).
Questions relating to specific fields of science investigated public knowledge of Physics, Astronomy,
Human Origins and Health with a series of true / false / don’t know questions. Consequently only 4%
of respondents answered all questions about physics correctly, 50% of respondents answered all or
most of the questions relating to Astronomy correctly. The majority of respondents answered the
questions correctly relating to human origins and evolution, while only 2% were able to answer all
questions relating to areas of Health (Zhang et al, 1993). For all the questions relating to specific
fields of science and public understanding, results indicate that males generally perform better than
females, younger people better than older respondents and Chinese generally answered fewer
questions correctly compared to their counterparts in the USA and the UK (Zhang et al, 1993). The
1990 survey furthermore contained an index of promise and reservation assessing attitudes in
relation to the social impact of science and technology on Chinese society. In the Chinese survey,
78% of respondents report that the positive impacts of science on society have outweighed any
negative impacts that may result from science and technological work, while only 1% indicated the
reverse sentiment. Furthermore, 82%, 71% and 41% respectively agree with the statements science
is making life healthier, science will make work more interesting and government should support
basic research UK (Zhang et al, 1993). These positive appraisals of the impacts of science and
technology on society is shared by the majority of respondents in the survey, many of whom see
much future promise in the contribution of science to society.
While these data points relate to the 1990 CAST survey, more recent surveys similarly report low
levels of scientific literacy in China, and in certain cases some sub-indicators are today reporting
even lower levels of scientific literacy than in the 1990 survey (Sun, 2010). In the 2009 survey,
though detailed reports are not available, media reports from the survey launch at the 12th CAST
annual meeting in 2010 report that recorded only 3.27% of those surveyed could be considered
scientifically literate - a significant increase from 2.25 % in 2007 and 1.98% in 2003 (Hu and Peng,
2010). China has begun emerging as an economic force and has proven that the might of its growing
economy can exert influence far beyond its borders (Pronina, 2013). Growing the human resource
capabilities and outputs in the region will become increasingly important as the society relies more
on science and technology solutions for economic production, social services and effective
Stellenbosch University https://scholar.sun.ac.za

99
governance. Through the prioritisation of science and technology in its national system of
innovation, China has already started a process of long-term social, financial and developmental
investment to ensure the goals and targets of the Outline of The Action Plan for Improving Scientific
Literacy for All are met. Change has arrived very slowly, however, and Chinese researchers have
begun challenging the status quo with respect to scientific literacy and public understanding of
science measurement in China. The imported measures of scientific literacy used elsewhere in the
world have proven not to be useful for measurement in the Chinese context, and work has begun in
redeveloping more appropriate measures. By redefining scientific literacy within the varied Chinese
contexts and developing measurement techniques that meet the different social and cultural milieu
extant in those contexts, China has provided key lessons to be gleaned that hold promise for the
application of these approaches in other developing world settings.
3.2.2 Malaysian surveys of scientific literacy
Malaysia is a South East Asian nation, consisting of 13 states on two (2) land masses: Peninsular
Malaysia and East-Malaysia separated by the South China Sea. A multi-ethnic nation with a
population of just over 30 million citizens, like so many countries in this region, it has a colonial
history as a British protectorate until 1957. As a result of this, much of the political, legal and
educational spheres of service in Malaysia are modelled on the British system. Consequently,
Malaysia boasts among the best educational systems in the region (Hock, 2007, MASTIC, 1998).
Malaysia has built a formidable economy since independence, demonstrating strong positive
economic growth, traditionally fuelled by its natural resources, but more recently sectors such as
space technology, tourism, medicine, science & technology and particularly biotechnology has seen
tremendous growth (MABIC, 2014). The country has a well-established schooling system, offering
multilingual and free compulsory primary school, and secondary as well as tertiary schooling. With a
major focus on education, Malaysia has 37 private universities, 20 university colleges, 7 foreign
universities as well as 414 private colleges (Maierbrugger, 2013). Having recognised the impact of
science and technology on society, the Malaysian government has invested considerably in
education toward boosting economic productivity, competitiveness and standards of living (MASTIC,
1998).
Since 1973 Malaysia has had a government ministry of science and technology, under various
names; however in 2004 this ministry was officially renamed to the Ministry of Science, Technology
and Innovation (MOSTI) toward leading the national policies for S&T, ICT, biotechnology, industrial
innovation and sea & space science (MOSTI, 2014). MOSTI operates under a mission statement of
nine (9) strategic thrusts relating to science technology and innovation, human resources, R&D
Stellenbosch University https://scholar.sun.ac.za

100
investment, social transformation, collaboration, and public involvement in STI initiatives. In 1992,
MOSTI established the Malaysian Science and Technology Information Centre (MASTIC) as a result of
the Industrial Technology Development Plan to coordinate a strategic STI research, information and
support to government, the private sector and the general public on matters of science, technology
and innovation. As part of its science, technology and innovation indicator development initiatives,
MASTIC conducts a number of research projects toward the development of an STI indicators report.
These indicators draw information from various surveys that include R&D surveys, Innovation
surveys, Bibliometric studies, STI facility audits as well as surveys of public awareness of science and
technology in Malaysia.
Malaysia has in the past participated in a number of international surveys of public understanding of
science and scientific literacy. More recently Malaysia has participated in the OECD-PISA surveys
since 2009 and again in 2012. On average, Malaysian learners scored lower than the OECD average
on almost every category of the PISA assessment. Scores on scientific literacy, in particular, were
lower than the OECD average of 501, with Malaysians scoring 420 points on average (OECD, 2014).
Interestingly in Malaysia, female learners performed better on scientific literacy measures compared
to male learners, contrary, though not exclusively so, to what had previously been observed in other
countries participating in the PISA assessment. In the 2012 PISA assessment, Malaysia ranked 52nd
on the 64 countries participating in the 2012 survey, outperforming only Indonesia within the Asian
region (OECD, 2014).
The first nationally representative survey of public awareness of science and technology in Malaysia
was conducted in 1996 and has since been conducted biennially with the most recently available
report being for the 2008 survey. To enable international comparison, Malaysia adopted definitional
characteristics and questionnaire items similar to that of the NSF in the USA Science and Engineering
Indicators surveys, assessing public knowledge and interest in science, attitudes toward science,
understanding of scientific concepts and procedures as well as data about scientific information
sources among Malaysians. The survey sample is designed to survey 5000 respondents, taking into
account demographic profiles from across Malaysia’s many states and the multi-ethnicities within
the population. The questionnaire consisted of both open- and closed-ended questions, using similar
questionnaires from the USA, the UK and Europe as reference. The final questionnaire consisted of
forty-three (43) questions and was divided into eight (8) sections: issues of science and technology,
media, science exhibitions, S&T knowledge, benefits of S&T research, general understanding toward
S&T, involvement with public policy issue regarding S&T and demographic profile of respondents. The
Stellenbosch University https://scholar.sun.ac.za

101
survey used face-to-face interviews by groups of fieldworkers within six (6) demarcated fieldwork
zones, while ensuring national representivity in the end sample (MASTIC, 1998).
In general, Malaysian citizens were moderately interested in S&T issues, indicating the highest
interest in ICT innovations, new technologies and, despite waning interest since the 1998 survey,
environmental issues were still highly rated by respondents. As expected, urban respondents
expressed higher interest in issues of science and technology (S&T) compared to rural residents.
However, the 2008 report clearly notes the trend of increasing interest in issues of S&T among the
rural population, demonstrating a positive change in the profile of the population interested in S&T
issues (MASTIC, 2008). Compared to the 1998 and the 2006 survey, the results of the 2008 survey
indicates a general decrease in Malaysians self-reported knowledge of S&T. While this was not
universal to all aspects of science, it did have a specific commonality of natural science focus,
including nuclear power, the latest scientific breakthroughs and research (MASTIC, 2008). While
many responses from Malaysians seem to be affected by highest educational achievement level
unlike in more developed countries, the influence of location (rural or urban) and gender is not as
noticeable as a direct result of efforts toward improving the outcomes within this indicator in
Malaysia.
The 2008 questionnaire contained eight (8) items that looked at attitudinal aspects of the science/
public relationship (MASTIC, 2008). Attitudes toward S&T in Malaysia have changed significantly over
the period 1996 to 2008. In 1998, 43.8% of respondents agreed that science delivers a more positive
influence to society than negative; however, in the 2008 survey this number increased to 73.8% of
the population, indicating an upward trend in certain aspects of the Malaysian public’s attitudes to
science. In a follow-up question, seven (7) aspects of life were isolated and assessed in relation to
the perceived impact science and technology had on each one. The majority of respondents
reported that science and technology in Malaysia had a positive effect on standards of living (77%),
public health (71.1%), cost of living (56.0%), working conditions (67%), individual enjoyment of life
(59.9%) and the environment (54.1%). These results were echoed in trend data from previous
surveys where similar response patterns were observed, indicating a consistent and increasing
positive reception by the Malaysian public. As with developed countries, correlations between
education and age in relation to attitudes toward science were found to be positive between
education and age in relation to attitudes toward science (MASTIC, 2008). Similarly, more urban
respondents were inclined to agree with positive statements about science than their rural
counterparts; however the difference was very minor and observed to be decreasing annually within
Malaysian society. Unlike the case in developed countries, gender differences were not pronounced
Stellenbosch University https://scholar.sun.ac.za

102
in terms of public understanding of science and no differences were reported across the varying
ethnic groups in Malaysia.
As in other surveys of this nature, scientific understanding of particular issues was dependent on the
subject matter being discussed. By asking a series of 15 true/false/don’t know questions,
respondents were assessed with respect to their level of understanding of scientific concepts. On
the more basic scientific concepts (e.g.: smoking causes lung cancer or the earth revolves around the
sun), generally respondents scored very well. However, when it came to more complex questions
that required some special knowledge rather than general school-level science education (e.g.:
Antibiotics kill viruses as well as bacteria or all radioactivity is man-made), many respondents were
unable to provide the correct response to the question (MASTIC, 2008). The questionnaire also
included two similarly designed items; however, with subject matter relating to more publically
disputed scientific theories (e.g. the universe began with a huge explosion and Human beings as we
know them today developed from earlier species of animals). Results indicate that since much of the
information relating to these questions are socially questioned in Malaysia; there was a fair degree
of ambivalence in responses, with just over 50% agreeing to the statements posed to respondents.
Data on the most popular sources of scientific information was also collected in the survey; as in
other nations, television (82.4%) and newspapers (62.1%) were the most important sources of public
science information for Malaysians in 2008. The internet was cited by only 24.8% of respondents and
recorded the least number of positive responses. Furthermore, for all of the above categories -
television, newspapers, internet and radio - a decline in reported sources of science information was
recorded, which researchers have attributed to questionnaire changes between the current and
previous round of surveys (MASTIC, 2008). Whilst a smaller segment of the respondents report visits
to science parks, museums and similar facilities, the most popular of these were zoos (30%),
museums (29.9%) and science parks (29.7%).
Malaysia performs well compared to other developing countries, and has ranked above India in
scientific literacy and public understanding of science measurement rankings (MASTIC, 2008).
However, when compared to many developed world countries, Malaysia remains below the levels
recorded in the USA, Europe and the UK, mostly linked to social and cultural differences in the
various regions in Malaysia. While basic scientific knowledge appears to be well understood among
respondents, more complex or debated scientific theories (e.g. human evolution) continue to
demonstrate lower levels of general public understanding from within the Malaysian public (17%).
Stellenbosch University https://scholar.sun.ac.za

103
3.2.3 Public Understanding and Attitudes to Science in India
India is a country steeped in history, with the earliest civilisations dating back some 55 000 years
(Petraglia and Allchin, 2007). Since before the Christian era (BCE reference period) the region has
played host to varied cultural, religious and military revolutions that have influenced and shaped
Indian society into the dynamic democracy it is today. Throughout this long, and at times brutal
history, India has constantly been involved in innovation, having developed drainage and sewerage
systems, early crop cultivation and agrarian technologies, technical standardisation for
measurement, transportation hubs, hydrology , metallurgy, astronomy, construction, healthcare,
mathematics and military strategy (Petraglia and Allchin, 2007). Following the Mughal Period (1526–
1857) and the colonialist period under the British Raj (1858–1947) India achieved independence in
1947 and set its sights toward building its national image, as well as its economy, educational
institutions and healthcare system. Even before Independence, the Indian liberation movement
spearheaded the movement for social and political empowerment through calling for the
advancement of education and industrialisation (Raza and Singh, 2008). The beginning of the 19th
century India saw the birth of the Association for the Advancement of Scientific and Industrial
Education of Indians, which had, among its goals a strategy of sending talented young Indians to
industrialised nations to receive their education in various fields of science and technology (NPTEL,
2013). Similarly, under the leadership of Jawaharlal Nehru - the first prime minister of an
independent India - the ideals of the Indian liberation movement were clearly understood to rely on
the acceptance of scientific ideas toward industrialisation and modernisation of the new nation state
(Raza and Singh, 2008). Nehru understood that the growth of a scientific temper in India would be
indicated by the extent to which the population started incorporating scientific principles into their
daily lives and work, toward problem solving and increased productivity. Venkateswaran (2013)
records Nehru’s words on science: ‘It is science alone, that can solve the problems of hunger and
poverty, of insanitation and illiteracy, of superstition and deadening of custom and tradition, of vast
resources running to waste, or a rich country inhabited by starving poor... Who indeed could afford to
ignore science today? At every turn we have to seek its aid... The future belongs to science and those
who make friends with it.’
Nehru realised that this required the technical human resources to drive the modernisation of India,
which heralded the notion of science communication in India (Venkateswaran, 2013). In 1953, Nehru
initiated the Vigyan Mandir projects (translation: Knowledge Temples) wherein community centres
were set up to facilitate learning and the dissemination of scientific ideas directed at agriculture,
health, sanitation and related issues in 125 regions across India.
Stellenbosch University https://scholar.sun.ac.za

104
During the latter part of the 1950s and the early 1960s, various new books and science-related radio
broadcasts started appearing in India, driving the notions of a scientific temperament and a broad
scientific outlook in a bid to communicate modern scientific ideas to the population. However, this
highlighted a peculiarity within the Indian population, as many of the scientific terms and concepts
did not find a natural translation into the many dialects and languages on the subcontinent (Raza
and Singh, 2008). This started a process whereby scientific terms were being coined in the various
languages and dialects. Another common feature of the time was the incorporation of several
anglicised terms into the teaching and learning strategies of the time. At this very early stage, the
State recognised that nation building relied heavily on the adoption of science and technology which
would facilitate modernisation of the economy, the people, productivity and ultimately the
international competitiveness of the nation. Science and technology were also seen as valuable
political tools for raising the Indian population’s awareness and consciousness during a politically
unstable time for the new nation (NPTEL, 2013). By the 1970s, efforts to organise science
communicators led to the formation of the Kerala Sastra Sahitya Parishad (KSSP) in an bid to
popularise and disseminate scientific beliefs and awareness in the many rural parts of India. The
KSSP was instrumental in organising the All India Peoples Science Movement, which was influential in
developing the grassroots science popularisation efforts called Science Jhatas (translation:
processions). These science processions visited many towns and villages in India, hosting lectures in
local languages and dialects as an early effort to create a scientific temper within the population.
Due to the fact that much of the more than one billion Indians (at the time) had not received high
levels of formal education, these Science Jhatas proved to be invaluable educational resources for
the many to aid them in their productive, personal and social lives. The value of these were to be
tested following the 1984 Bhopal Gas Tragedy where, after a gas leak at a chemical factory, 3 000
people died instantly and more than 16 000 lives were ultimately lost due to this industrial accident
(BMHRC, 2008). Public outrage in India was tremendous at the time, with many violent protests
unfolding in response to people demanding accountability for the tragedy. During this time these
Science Jhatas exposed millions of people to the scientific and technological processes as well as the
risks of having chemical plants in densely populated areas, and provided perspective as well as
greater understanding, thereby assisting in minimising the general sense of fear within the
immediate populations (Raza and Singh, 2008).
In 1989, the Indian National Institute of Science, Technology & Development Studies (NISTaDS)
initiated the first projects devoted to studying the public attitudes and understanding of science
(PAUS) in India. Many of the existing studies and measurement indices of the time relied on the
established Western notions of scientific literacy and the public understanding of science
Stellenbosch University https://scholar.sun.ac.za
105
measurement techniques. The NISTaDS experts believed this to be inadequate to study the Indian
population’s understanding of science as a result of the cultural and linguistic variations within the
population as well as its contrast in relation to modern industrialised countries where these indices
and measurement approaches were developed (Rose, 1991 in Raza and Singh, 2008). The
researchers from NISTaDS formulated a study that was to be conducted in 1989 at the Kumbh Mela
festival, which attracted almost 50 million religious devotees to the town of Allahabad. The reason
for selecting this festival was clearly to survey as many people as possible from all over India, given
the limited resources at the disposal of the research team.
As an exploratory effort to establish a reliable measurement technique that would be applicable to
the Indian context, the initial Kumbh Mela studies aimed to achieve four goals: 1) identifying the
areas of knowledge that were relevant, 2) selecting questions for use in the research, 3) identifying
the model answers for the questions and 4) identifying the factors that influence people’s
understanding of science (Singh and Raza, 2012). In identifying the primary knowledge areas for the
development of a survey of Indian public attitudes and understanding of science, the surveys
focused on areas of most importance to the majority of Indian citizens, namely a) astronomy and
cosmology, geography and climate, agriculture as well as health and hygiene. These areas provided
the required local relevance of knowledge areas as well as a fair degree of international
comparability, as areas of hygiene; health; cosmology and astronomy have all been included in
Western surveys of scientific literacy and the public understanding of science. Thus the question sets
were developed within these four (4) areas. The final questionnaires contained, on average, twenty-
six (26) questions covering the above-mentioned knowledge areas, and elicited nearly 16 000
responses (Raza and Singh, 2008). Response options were divided into four (4) possible types,
including 1) scientifically correct answers, 2) naturalist/or secular responses – but scientifically
incorrect, 3) turning to the divine for the explanation and 4) don’t know responses. In particular,
Raza and Singh (2008) note that the don’t know responses provide an indication of the cultural
distance between the respondents’ lived experience and knowledge and, the construct being
investigated.
The Kumbh Mela studies administered during the Kumbh and Ardh Kumbh Mela festivals at
Allahabad in 1995, 2001 and 2007 were used to develop a cultural distance model to explain
respondents’ responses to various questions about science and technology. The data indicated that
as the complexity of the subject matter increased, so too did the number of scientifically correct
responses decrease among the sample group. Questions regarding the shape of the earth yielded
many more correct answers compared to more complex questions relating to evolution and other
Stellenbosch University https://scholar.sun.ac.za

106
similar complex knowledge areas (Raza and Singh, 2008). Cultural distance did appear to vary
between rural and urban respondents and was also impacted by educational level, employment
status and profession. The Kumbh Mela studies indicate that between the years 1989, 2001 and
2007 - across all knowledge areas - the number of scientifically correct responses has been
increasing, while the number of scientifically incorrect responses has generally been decreasing.
Similarly, the number of don’t know responses have also decreased across the period. Although in
the agricultural knowledge area it did show some increase during the 2007 round of the survey (Raza
and Singh, 2008). The use of the ‘don’t know’ response option was significantly higher among the
urban respondents than among rural ones. This highlighted the finding that the migratory patterns
of the Indian population, from the rural villages to more urbanised areas, as well as the rapid
urbanisation of areas previously on the rural-urban fringe, has led to a loss of traditional knowledge
factors while at the same time being sensitive to cultural and education factors. This suggests that
the migratory patterns and urbanisation in India, leading to urbanised socialisation and education
might not be sufficient to increase scientific literacy and scientific temper in this developing world
context (Raza, Singh & Dutt; 1995). The authors of this study also believe that the cultural transition
from the rural to the urban centres has left younger generations in ‘a state of transition’ that has not
yet yielded adequate exposure to have generated a suitable cultural assimilation for the
development of a unified public understanding of science (Raza, Singh & Dutt; 1995).
Whilst the concept of the public attitude and understating of science in India has been highlighted as
culturally different from that of Western constructions, requiring different measurement techniques,
it will inevitably have to be related to previously discussed notions of scientific literacy. Due to a lack
of reliable and internationally comparable data, in 2004 the Indian National Council of Applied
Economic Research (NCAER) conducted the National Science Survey. Investigating three (3) major
areas of the public-science edifice, the study explored the status of science and engineering
education, the utilisation pattern of human resource and public attitude towards science and
technology in India. The survey covered both urban and rural centres, yielding a final sample 30 000
respondents in face-to-face interviews (Shukla, 2005). While the report details results from all three
sections, the review below will only cover results pertaining to the chapter on Public Attitude
towards Science and Technology.
Results from the 2004 survey demonstrate an evolving system of science and educational exposure,
with many positive indicators for public understanding of science research and policy. Public
understanding of scientific concepts was assessed through a series (twelve) 12 questions that
covered a range of scientific concepts and required varying levels of background knowledge and
Stellenbosch University https://scholar.sun.ac.za

107
levels of conceptual complexity. These questions were accompanied by three response options: true,
false and don’t know, in order to best facilitate answers and data capture. Questions ranged from
elementary concepts such as ‘the centre of the earth is very hot’ and ‘the oxygen we breathe comes
from plants’ to more complex subjects dealing with human evolution & genetics, agricultural
sciences and health. Overall, 57% of respondents answered these questions correctly. However
variances were noted for the level of education as well as the domicile location of the respondent.
Similarly, with more complex concepts, a higher incidence of incorrect or don’t know answers were
selected, which is particularly notable when viewed against prior educational achievement and
income group (Shukla, 2005). What was interesting was that locally relevant knowledge that relied
on traditional knowledge systems relating to the environment and natural phenomena were better
understood among the rural samples, as a result of daily relevance to living conditions. Similar
relationships to those in industrialised countries were highlighted, where younger participants and
males generally answered more questions correctly compared to their senior and or female
counterparts.
Public interest in an array of social issues was assessed by using a 3-point scale of reported interest
in issues (Interested, not interested, no opinion). Respondents were presented with fourteen (14)
broad areas of public policy issues and were asked to select a level of interest for each of the
categories. Despite low income and education levels in India, the majority of respondents reported
high interest in many of the issues listed. Shukla (2005) reports that in certain knowledge areas, the
levels of scientific interest among Indians surveyed are higher than that of developed countries such
as the USA. This is particularly related to health and environmental issues that are greatly influenced
by traditional knowledge systems that continue to make these knowledge areas relevant on a daily
basis. As expected, the level of interest in particular public issues was also related to the location,
age and the relevance of the issues to the daily activities of the individuals. Highlighted again in this
question series is the idea of cultural distance, where issues that are more relevant attract a greater
indication of interest (poverty and gender issues) than issues that are not as relevant, such as space
exploration. Juxtaposed to the reported level of interest in scientific and public issues, the level of
‘informedness’ was also assessed for the same set of 14 interest areas, using a similar 3-point scale
of ‘informedness’. Generally the data indicates that the people who reported interest in particular
issues similarly reported ‘informedness’ related to those issues - albeit at a slightly lower level
(Shukla, 2005). As a departure from the previous correlations between age, gender and domicile
location, levels of informedness were more complex in their nature and tended to differ by subject
area.
Stellenbosch University https://scholar.sun.ac.za

108
The questionnaire included 12 questions relating to Indians’ attitudes toward natural phenomena,
eliciting responses that differed in terms of their content. These could be categorised into four (4)
types: a) scientifically incorrect, b) scientifically incorrect, but based in scientific methods, c)
attribution to the Divine and d) don’t know. Here it was found that levels of income and education
exhibited particular influence on the responses selected. Whilst the majority of both rural and urban,
male and female as well as old and young individuals reported correct answers to questions relating
to the rotundity of the earth, gravitation and natural phenomenon, differences were observed with
respect to education and income levels (Shukla, 2005). Similarly, an average of 10% of respondents
in both rural and urban centres continue to attribute many natural phenomena to the Divine, which,
in a traditional population, where the lines between natural and the divine often are blurred and
inseparable is to be expected (see accounts of Hindu Goddess, Saraswati19). Knowledge and
informedness of technologies were assessed along four (4) technology categories: Agriculture,
Household/Domestic, Communications and Health. Questions were constructed around the
technologies prevalent within in each technology class, and a level of informedness per technology
class was derived (Shukla, 2005). With the exception of communications technologies (due to low
penetration), the majority of respondents indicated a moderate or high level of informedness in
each technology class. Actual usage of technologies in each technology class was also reported, but
this will not be discussed further in this section.
The sources of scientific information for Indians were assessed by providing seven (7) information
sources as well as a category grouped as other. As in many developed and developing countries,
television remains the primary source of scientific information for the Indian population, with 57%
reporting this as the primary category. This was almost five (5) times higher than the next categories
of radio and newspapers, which were reported approximately 10% of the time. This remained true
for rural populations, where almost 50% of respondents indicated television over radio and
newspapers, likely due to the higher rates of illiteracy in rural areas. Interestingly, new media, such
as the internet and social media information sources were not assessed in this question, which may
be as a result of the limited internet penetration across rural India. The majority of respondents
indicated that scientific information is most often accessed at home or at a neighbour’s house, while
public access and workplace information access was reported in only a small minority of cases
(Shukla, 2005). There were no significant variations in these patterns of information access location
when correlated to other individual factors such as age, gender, income, education or domicile
location, except with relation to internet access. As a result of limited private internet infrastructure
19
Hindu goddess of knowledge, music, arts, wisdom and nature which in some parts of India, both rural and urban, make
separating scientifically correct explanations of natural phenomena from divine explanations difficult.
Stellenbosch University https://scholar.sun.ac.za

109
in certain Indian areas, the majority of respondents report public spaces and work as the primary
internet access point, with over 70% of rural and 40% of urban respondents indicating poor or no
internet access (Shukla, 2005). The majority of respondents indicated a higher level of confidence in
television and radio based scientific information, compared to the very low levels of confidence
reported in local/political leaders. However, with the exception of television, between 25% and 30%
of respondents did select the do not know category. Using the various responses to the questions
discussed above, Shukla and colleagues continued to categorise respondents into categories of
attentiveness to science communication. Attentiveness was categorised through a combination of
interest, informedness and active information-seeking behaviour (discussed above). The 2004 India
Science report classifies approximately 19% of Indians as attentive to science communication, with a
further 11% classified as interested (Shukla, 2005). This varied with the earlier mentioned factors,
including domicile location, education as well as income levels of respondents. In addition to this, a
large number of respondents were neither categorised into attentive or interested categories and
instead were included in a residual classification (Shukla, 2005).
Ever since its independence from its colonial rulers, India has a large and active community of
scientists working on issues of the public understanding of science and scientific literacy. Many
science councils have dedicated communication sections and concerted efforts have been made in
recent years to use all traditional and modern communications approaches in a more synchronised
manner in its efforts to reach its 1.3 billion people. The recognition that imported measurement and
educational techniques in this particular area is less than ideal for the Indian, and indeed the
developing world context, continues to drive renewed research efforts within the Indian research
community. Work continues toward understanding the concepts of cultural distance as well as the
development of measures and indicators to best measure the Indian public understanding and
attitudes toward science and technology.
3.2.4 Public Understanding of Science and Scientific Literacy Research in South Africa
South Africa as a country has seen a number of social, political and economic changes in its recorded
history. As discussed in chapter 1, with the arrival of the various colonial powers in the Cape during
the mid-1600s, the face of South African society was forever changed by institutionalised inequality
and on numerous occasions resulted in violent conflict between the various powers that sought to
claim control of this southernmost tip of Africa. Whilst separate development and minority control
were not new concepts to South Africa and its population, the institutionalisation of apartheid in
1948 and the numerous state laws that enforced this ideology following that period steered South
Africa further in the direction of separate development and the eventual resistance to the brutality
Stellenbosch University https://scholar.sun.ac.za

110
of the apartheid regime. However, as a result of more than 50 years of oppression and separate
development, the vast majority of the South African population was denied access to basic services,
adequate healthcare and quality education, resulting in a large portion of the population lacking in
the skills required for developing industry and growing the South Africa economy20.
With the dawn of democracy in South Africa in 1994, key focus areas for the new government
included improved service delivery, access to housing, job creation, economic development and
education for all South Africans - particularly those under-serviced by the apartheid government
(Noble et al, 2008). In the 20 years since the end of apartheid, there have been a number of
government initiatives and policy revisions aimed at redressing the inequalities created by the
apartheid system as well as its legacy impacts that have persisted to the present day. Despite these,
many efforts by government and non-governmental-organisations toward social change, economic
reform and industrial development have not reached expected levels in post-apartheid South Africa
(Noble et al, 2008). While there have been improvements in selected areas, a large proportion of the
population still live in situations of dire poverty, access to essential health and social services remain
constrained and economic performance has been slow with respect to the evolving continental and
global macro-economic environments. Public scientific literacy and an enhanced public
understanding of science have been heralded as key toward long-term social and economic change
in South Africa (Pouris, 1991, 1993; Blankley and Arnold, 2001; Reddy et al, 2009).
A critical element required toward developing scientific literacy and a better public understanding of
science in South Africa has been the promotion of increased quality of both formal and informal
education structures (Laugksch, 1996). The ultimate goal of enhanced educational and social
learning programmes have been aimed at developing the South African labour force toward
enhanced and increased industrialisation, economic development and effective citizenship (Pouris,
1991). Laugksch outlines the three (3) key arguments for the promotion of scientific literacy in South
Africa: 1) economic benefit, 2) personal decision making applications and 3) the promotion of
effective democracy and citizenship toward nation building (Laugksch, 2000). It is without doubt that
South Africa has made some progress in the 20 years since the end of apartheid; however many
have contended that progress has been too slow; and much of the legacy impacts are still being
perpetuated, despite the first generation of ‘born-frees21’ now entering the workforce. For South
Africa to realise its developmental, social and economic goals, concerted efforts must be made in a
20
It must be noted that there were a number of outstanding academics, social and business leaders emerging from the non-white populations in South Africa during this time. However relative to the general population these were still, and currently remain the minority in South Africa. 21
Referring to South African citizens born in and following 1994
Stellenbosch University https://scholar.sun.ac.za

111
number of areas, and certainly a human resource base, equipped with the requisite knowledge and
skills for facing those challenges, is paramount to any envisaged future success in this regard.
The genesis of the study of the public understanding of science and scientific literacy in South Africa
started later than many of the countries previously discussed. Laugksch (1996) claims that the first
mention of scientific literacy in South African academia was following the 1978 South African
Association of Teachers of Physical Science (SAATPS) workshop discussing how science education in
South Africa could be improved. However, it was not until the mid-1980s that dedicated research in
the area of scientific literacy was conducted. Laugksch outlines two major areas of focus for scientific
literacy research in South Africa. The first focus was aimed at enhancing teaching and learning
through the study of informal science education and its impacts on formal science classes and how
this combination impacted the scientific literacy of learners (see Maarschalk and Strauss, 1992 in
Laugksch, 1996). The second focus area for scientific literacy research in South Africa emerged in the
latter part of the 1980s where surveys of scientific literacy and public understanding of science
began to emerge on the research landscape. Many of these early surveys adopted the approaches of
Miller, Durant, Evans and the contemporary vanguards of the scientific literacy and public
understanding movement in Europe and the USA. However, it must be noted that under apartheid,
and at the height of the democratic struggle in South Africa, access by research teams to townships,
and non-white populations was difficult at the best of times and due to this, many of these early
studies focused on a single or limited number of demographic groups. While a nationally
representative sample of South African’s public understandings of science has yet to be conducted22,
Table 3.8 outlines a number of surveys on public understanding of science and scientific literacy in
South Africa, since 1991. In order to develop an appreciation of public understanding of science
research in South Africa, a selection of these studies will be presented in this section in order to
understand the areas previously researched as well as the instruments used and approaches
followed. As some of these surveys had a specific scientific focus or limited demographic inclusion, it
becomes difficult to meaningfully compare their results. However, where possible, domestic and
international comparisons will be presented as opportunities arise, and in chronological order.
3.2.4.1 Surveys conducted from 1990 to 2000
Early attempts at replicating scientific literacy surveys using imported survey questions and
approaches from the USA-NSF and Eurobarometer surveys were conducted by the Foundation for
Education, Science and Technology (FEST) by Pouris in 1991 and again in 1993. In the 1991 study,
22
I note the work of Blankley and Arnold, 2001 and that of the HSRC surveys that have attempted this. However, many of these had limited areas of focus for scientific literacy or limited applicability in contemporary post-apartheid South Africa.
Stellenbosch University https://scholar.sun.ac.za

112
Pouris examined public understanding and appreciation of science among [a selected group of]
South Africans. The study surveyed 1 300 respondents, 800 white female and 500 white male in six
(6) urban suburbs in cities across South Africa. The fieldwork was conducted by a research company
during January 1991, using face-to face interviews and a national field force of trained interviewers.
Survey questionnaires resembling NSF and Eurobarometer-type questions, were developed asking
respondents about areas relating to physical science, earth science, human evolution, attitudes
toward astrology, public perceptions relating the impacts of science in everyday life as well as
respondent demographic information (Pouris, 1991). Seven questions assessing scientific factual
knowledge were asked, with topics ranging in complexity from hot air rises and the centre of the
earth is very hot to more complex questions relating to the scale of matter and laser technology. On
knowledge measures, generally, South Africans in 1991 compared favourably to UK and USA
respondents on a similar question set. A notable difference emerged with respect to more complex
questions relating to lasers and the scale of matter where South Africans displayed less factual
awareness relating to those areas. Within the South African results, males generally performed
better than female respondents, but only marginally. In addition, a very small number of
respondents reported under the don’t know response option, with the exception of the earlier
mentioned, more complex categories wherein a marked increase in don’t know responses were
recorded. Language was found to differentiate the sample, with English speakers performing better
than their Afrikaans counterparts. However, it is not stated if the questionnaire was available in both
languages and if this may have impacted these finding. Similarly, and counter to expectations, older
respondents generally performed better than younger respondents. Questions relating to the public
beliefs about areas such as human evolution and astrology indicated that South Africans in 1991 held
a limited understanding of these concepts compared to their foreign counterparts in the USA and
the UK. However, on a question relating to humanity’s dependence on science rather than faith,
more South Africans agreed with this statement (71%) than did Americans (44%) or British (51%)
(Pouris, 1991). On question-set assessing public attitudes toward science, South African respondents
report a general positive attitude and understanding of science. However they also express some
reservation about the impact of scientific advances on daily life. Interestingly, more South Africans
report an appreciation of the benefits of science over any potential harmful effects (59%) compared
to similar results for the USA (44%).
As an interesting finding from his 1991 work, Pouris noted the higher rates of scientific literacy in
older respondents compared to those of younger participants and, in his 1993 study, shifted his
focus to South African teenagers’ understanding and appreciation of science. A total sample of 800
teenagers were accessed in the 1993 study, with respondents selected from the major urban centres
Stellenbosch University https://scholar.sun.ac.za

113
across South Africa, as in the 1991 study. Face-to-face interviews were conducted with 400 Black23
and 400 White respondents of both genders between 13 and 20 years old (Pouris, 1993). In addition
to the collection of demographic detail, many of the questions from the 1991 study informed the
development of the 1993 questionnaire. The 1993 study found that white teenagers (of both
genders) performed better than their black contemporaries on measures of factual scientific
knowledge. As in the 1991 study, English speaking respondents outperformed any other language
group in the study. Among black respondents, results were also stratified according to language,
where it was found that Sotho speakers generally performed better than those speaking Zulu,
Tswana, and Xhosa24 (Pouris, 1993). Across racial and language groups, males performed better than
female respondents, however the difference between the genders was greater among the white
groups than among non-white groups. With respect to questions about beliefs and attitudes toward
science, Afrikaans respondents generally provided a greater number of negative responses than
both other white and non-white respondents. Conversely English speaking respondents most
frequently expressed a lower positive attitude toward scientific advances and its impact on daily life
(Pouris, 1993). Despite the impacts of apartheid on access to resources and education in 1993, black
respondents reported being more optimistic about science and the advances that impact on daily
life.
The Human Sciences Research Council (HSRC) has since 1968 been involved in South African human
and social policy-orientated research and has conducted numerous studies in the different focus
areas, from democracy and governance, social determinants of health, social cohesion and science
and technology-focused research activities. In 1995, the Foundation for Research Development
(FRD) and the HSRC jointly undertook surveys on scientific literacy and attitudes toward science as
part of a larger project toward the publication of the first South African Science and Technology
Indicators Report in 1996. The publication presented various indicators on the overall performance
of the South African science system, similar to the biennial USA-NSF Science and Engineering
Indicators. The chapter on public understanding of science included the results from three (3)
surveys run concurrently within the same sample population. Using the HSRC Omnibus survey, data
was collected between 4 September and 6 October 1995 and fieldwork was conducted by a research
company using a national field force and trained interviewers. The questionnaire was jointly
developed by the FRD and the HSRC based on similar questions in international surveys. Where
23
Terminology related to Black racial groups are used as in the original pre-1994 study, often used interchangeably with the term ‘African’, however remains relevant today in terms of illustrating the impacts of apartheid and racially segregated education systems on non-white South Africans. 24
It is important to note that at this time South Africa had 18 different education departments, based on geo-political areas and racial classifications. Each department offered a different quality of education to its respective population group, resulting in variations across a national comparison- See Laugksch, 1996 Chapter 1.
Stellenbosch University https://scholar.sun.ac.za

114
required, questionnaires were translated into the various home languages of respondents, based on
location within the sampling design (FRD, 1996). The sample was designed to reflect the population
of South Africa in terms of race, gender and age in accordance with the 199125 population Census
figures. Based on the sample characteristics and upon completion of fieldwork and data validation
operations, a total sample of 2 163 respondents were included in the final study (FRD, 1996). The
survey used three question sets, assessing differing dimensions of scientific literacy among the
target population. The first question set included 12 items related to natural and environmental
factual knowledge. The second question set included five (5) statements assessing respondents’
attitudes toward science and the third question set covered aspects related to human sciences
literacy using 13 agree / disagree / don’t know statements.
Results of the survey on natural and environmental science literacy indicate that South Africans
generally fared poorly compared to similar items on international studies. On average, South
Africans in 1995 answered 5.11 questions correctly out of the 12 questions in this set. On a ranking
of 20 international studies employing a similar question set, South Africa is ranked 18th out of the 20
countries, performing better than Russia (4.77) and Poland (4.33). The top scoring countries in this
ranking were Canada (7.58), New Zealand (7.52) and the UK (7.49) while the USA ranked 7th with a
score of 5.57 (FRD, 1996). Three of the questions in this set were related to radioactivity, and on
average, South Africa provided the least number of correct responses (38%) to knowledge questions
out of the 20 international countries compared in the report. A further two questions were related
to issues of greenhouse gases and the environment; here South Africans performed better than in
the previous three (3) questions, attaining a score of 52% and placing in 16th position. A notable
result on these questions, in contrast to results from Pouris (1991 and 1993) was that African26
respondents scored the highest number of correct answers (32%), followed by white (28%), coloured
(22%) and Indian (12%) respondents. As with Pouris (1991 and 1993), questions relating to human
evolution were included in this question set and results did not differ from those earlier results, with
many South Africans showing limited knowledge about theories of evolution. However, the FRD
study did represent a better racial profile of South Africans responses to this question compared to
Pouris, who only surveyed black and white respondents. Corresponding to the results of the Pouris
study in 1993, more Black (46%) than White (31%) respondents provided correct answers to
questions on evolution, but in the FRD study, 36% of Coloured and 65% of Indian respondents
provided correct answers.
25
As mentioned earlier, these demographic profiles lacked sufficient population coverage and relied on a higher degree of estimation, thereby presenting little research relevance to studies in contemporary South Africa, 20 years later. 26
See footnote 9
Stellenbosch University https://scholar.sun.ac.za

115
The survey on attitudes toward science and technology tested the same sample of South Africans
using five (5) attitudinal statements requiring dichotomous, mutually exclusive agree/disagree
responses. These results were then compared to those of 15 international countries where similar
questions were asked. In this survey comparison, South Africa ranked 14th, with an average score of
54% (FRD, 1996). The statements used were classified as either positive or negative toward science.
On statements where agreement indicates a positive attitude toward science, South Africa scored
particularly low (42%), second only to Japan; however the Japanese score was based on only one of
the two questions. South Africans’ responses to statements where agreement indicates a negative
attitude toward science show a far more negatively skewed attitude toward science, scoring 49.5%
and ranking 9th compared to the 15 other comparable countries. On specific items South Africans
generally indicated a low appreciation of science and technology compared to other nations. Among
South Africans, males (68%) generally indicated a marginally higher appreciation of science
compared to females (64%), while Indians showed more positive attitudes toward science (94%)
compared to Whites (93%), Coloureds (61%) and Africans (59%).
Human science literacy was assessed using thirteen (13) agree/disagree /don’t know statements.
The questions were subdivided into categories ranging from behavioural and social sciences, to
economics, languages, political science and the arts. The average score achieved in this test was 4.51
out of 13 (34.7%). While overall scores were generally low, respondents did fare better at certain
human science areas than in others. Males generally scored higher than females in this survey;
however it was noted that a relationship between age, highest education level and access to media
sources increased scores in these questions. The authors of the 1996 study had noted with concern
the generally low levels of scientific literacy as measured by the three tests in this study. They also
lamented the generally poor comparison with many of the countries featured in the report,
indicating future impacts on trade and competitiveness if measures related to education and
training within the population and workforce were not implemented toward changing these
indicators (FRD, 1996).
In 1996, as part of his doctoral work, Laugksch conducted a survey among first-time, first-year
students at universities in the Western Cape, South Africa. The aims of his research were threefold:
1) to ascertain the levels of scientific literacy of the selected first-year students, 2) to understand the
influence of demographic characteristics on measured scientific literacy and 3) to determine the
most important variables as predictors of students’ levels of scientific literacy (Laugksch, 1999). With
a background in education, Laugksch was most interested in assessing “the products” of the South
African education system, and thereby scientific literacy as the output. The questionnaire was
Stellenbosch University https://scholar.sun.ac.za

116
developed by Laugksch through a detailed process of defining the input material from which a pool
of 472 questionnaire items was developed. These test items were then validated through a rigorous
process of item validation involving 41 Fellows of the Royal Society of South Africa. Following the
validation process, the test items were put through four (4) concurrent pilot tests administered to
966 students and, in the end, the final Test for Basic Scientific Literacy (TBSL) was constructed,
which included 110 test items (Laugksch, 1996).
The fieldwork was conducted at the five (5) major tertiary institutions in the Western Cape (in 1995),
namely: the University of the Western Cape, University of Cape Town, University of Stellenbosch,
Cape Technikon and Peninsula Technikon27. The test was administered to 6 801 students. However,
after sample cleaning and validation, the final result was based on a sample of 4 223 first-time
first-year students. The sample was made up of 14% African, 26% Coloured, 2% Indian and 58%
White students, across the five (5) institutions, with subject specialisations ranging from human
sciences to engineering and commerce. Where possible, Laugksch tried to control sampling to be an
accurate reflection of students in the Western Cape, however he does note an under-representation
of African and an over-representation of White students, as is to be expected with respect to access
to tertiary education in South Africa in 1995 (Laugksch, 1999).
The questionnaire was designed to have two (2) parts. Part A collected demographic, background
and personal information of each student to be used later in the analysis with respect to aims (b)
and (c) mentioned above. Part B of the questionnaire was the actual TBSL, which consisted of 110
test items assessing scientific literacy of the cohort of students. Laugksch adopted Miller’s (1989)
three consecutive dimensions of scientific literacy in designing the TBSL, wherein part B of the
questionnaire was divided into three (3) subtests. Subtest 1 was the Nature of Science Subtest
comprising 22 test items relating to understanding of scientific concepts. Subtest 2 was the Science
Content Knowledge Subtest that included a further 72 items assessing factual knowledge in scientific
areas, while the Science and Technology in Society Subtest included 16 items, evaluating
respondents’ understanding of the impact of science on society and daily life. Respondents asked to
take the TBSL during regular class times and were given 45 minutes to complete the test.
Laugksch reported that the overall scientific literacy rate as measured by his Test for Basic Scientific
Literacy was 36% in 1995 (Laugksch, 1996). Laugksch used the Part A information in the
questionnaire to assess students’ performance on his scientific literacy measure with respect to their
school-leaving results. It was found that students with the highest matric pass results (A or B
27
Subsequent changes to the South African Higher Education environment has resulted in the merger of the two technikons in Cape Town.
Stellenbosch University https://scholar.sun.ac.za
117
aggregate) similarly displayed the highest levels of scientific literacy in the TBSL (68% and 51%
respectively). Also noted was the finding that only 10% of the learners who attained the lowest
matric aggregate result (E, F and G) were classified as scientifically literate - again demonstrating the
relationship between education and scientific literacy (Laugksch, 2000). Comparing the results of
University students to those of Technikon28 students, Laugksch reported that 26% of Technikon and
42% of University students were classified as scientifically literate, with the results for the University
students found to be statistically significant. With respect to population group and subject
specialisation, the study reported a statistically significant difference between scientific literacy
scores for members of different population groups. Approximately 50% of White and Indian students
were classified as scientifically literate, while 25% of Coloured students and 10% of African students
were classified as scientifically literate. Laugksch however cautions that Indians made up only 2% of
the sample and therefore this higher scientific literacy result must be interpreted with caution
(Laugksch 1999, 2000). With regard to subject specialisation, Laugksch reported no significant
difference among the sample. As with similar South African and international studies, gender
difference did emerge, with males generally achieving higher scientific literacy scores than their
female counterparts. Analysis with respect to gender and population group reported a statistically
significant result only between African and White respondents in relation to gender, but none for
Coloured and Indian respondents.
An important consideration in relation to scientific literacy is the level of exposure to science
material, and specifically the number of science subjects taken at high school level. Laugksch
reported that the number of science subjects taken in matric29 did influence scientific literacy scores,
with those taking science subjects in school achieving higher scientific literacy scores than those that
took none. These results were stratified according to population group and the number of science
subjects taken, with White students showing a statistically significant relationship between the
number of high school science subjects and scientific literacy, however for Indian, African and
Coloured students, this influence was less significant.
The work of Laugksch represents an important contribution in understanding and developing new
tools to measure scientific literacy in South Africa. The rigorous steps taken in identifying and
developing a new pool of scientific literacy test items and the expert reviews by Fellows of the Royal
Society aided in the reliability and validity of the TBSL. Laugksch however points out that the sample
for his initial work (1996) was not large enough and had some issues with respect to representivity,
particularly for African and Indian populations. The work attempts to assess the output of the South
28
Now classified as Universities of Technology 29
At this time science subjects were limited to Physical Science, Chemistry, Biology, Geography and Computer Science
Stellenbosch University https://scholar.sun.ac.za
118
African school system by targeting students at the secondary-tertiary education juncture but also
neglects that the vast majority of South African learners that do not continue onto tertiary
education. However as a baseline measure, this does serve as a useful tool for continued research in
this area.
3.2.4.2 Surveys conducted from 2000 to 2010
Public understanding of science research evolved in South Africa as it did in foreign settings - to
include not only scientific literacy measures, but later also included measures of public
understanding, attitudes and sources of scientific information measures. In 2001 Pouris conducted a
survey on Public Attitudes and Sources of Scientific Information among South Africans, among a
sample of 1000 households across the major metropolitan areas. The survey methodology replicated
the design and collection methods previously discussed of his 1991 and 1993 work. The
questionnaire was developed to include test items from the Eurobarometer and USA-NSF surveys as
well as record information about access to scientific information and media choices. The survey used
face-to-face interviews that lasted approximately 20 minutes.
Pouris assessed levels of interest in eight (8) scientific areas30 by asking respondents to indicate
interest on a 3-point scale – from very interested, moderately interested and not at all interested.
Responses were scored out of 100, with a very interested response attaining a score of 100, a
moderately interested response attaining a score of 50 and not at all interested attaining a score of
0. The highest rated issues of interest among the sample of 1 000 was Medical Discoveries (73%),
Environmental Issues (69%), New Technologies (63%) and Economic Policy (62%). Similarly, the level
of Informedness was measured using the same eight (8) focus areas, and respondents were asked to
rate their perceived level of informedness along a similar 3-point scale to the interest scale discussed
above. The highest rated areas with regards to informedness were similar to those recorded for
Interest and included Environmental Issues (52%), Medical Discoveries (49%), Economic Policy (46%)
and New Technologies (42%).
Measures related to assessing the attitudes of participants included the Index of Promise and
Reservation that uses seven (7) statements (4 positive and 3 negative) about science. Respondents’
level of agreement or disagreement with these statements here indicates a general positive or
general negative attitude in relation to science. Respondents generally indicated strong agreement
30
Areas include new scientific discoveries, new technology, space exploration, nuclear energy, medical discoveries, and environmental issues, foreign policy, economic policy.
Stellenbosch University https://scholar.sun.ac.za

119
to statements of scientific promise, with top-2 box31 scores greater than 70%. However, with the
reservation statements, 58% of respondents indicated a top 2 box response on the statement we
depend too much on science and not enough on faith and 69% indicated strong agreement with the
statement science makes our way of life change too fast (Pouris, 2001). The reservation statement it
is not important for me to know about science in my daily life received the highest proportion of
bottom-2 box responses (59%), however - with the high levels of interest and informedness as well
as positive attitudes as measured by the promise index, this is to be expected within this sample
group. Lastly, sources of scientific information were assessed, with the most important source of
scientific information being magazines (77%), television (66%), newspapers (57%), public libraries
(41%) / other public access facilities made up the remainder of the access to information scores. The
use of the Internet was not highly rated and received 19% of scores, which was similar to Zoo and
Museum visits.
In 1999 – 2001 William Blankley and Robyn Arnold conducted a study to assess scientific literacy
among a nationally representative sample of 2 207 individuals of both genders and across all race
groups. The purpose of the study was to collect information on public civic scientific literacy, with
the aim of understanding the current level of literacy in the South African population and to aid in
defining the relevant target audience(s) as well as the development of enhanced intervention
strategies. The questionnaire adopted many international measures, as in Pouris and the previously
mentioned HSRC studies, but some locally developed test items were also included to adapt the
questionnaire to local conditions for increased relevance in South Africa (Blankley and Arnold, 2001).
The sample was constructed to include adults aged 18 years and older, and was matched to
population census figures32. Blankley and Arnold investigated scientific literacy but also looked at
other demographic factors that may influence scientific literacy scores, as did Laugksch (1996).
Blankley and Arnold found that the relationship between mathematics and science subjects taken at
school was positively related to scientific literacy scores. In their 2001 paper they report that within
the sample, 30% of adults had never studied mathematics at school, 50% had never studied biology
and 55% had never studied physical science or chemistry. They also reported that the number of
adults reporting having taken (or currently attending) science related subjects decreased as
educational level increased – at matric level only 20% passed mathematics, 14% physics and 18%
biology, while at tertiary level this decreased to below 5%. It was interesting to note that these
results were skewed to more older people, as in 1999 – 2001 post-apartheid era schooling was
changing these patters for younger people, while older respondents were still reporting their
31
Top-2 box is the summation of the scores for Agree and Strongly Agree. Bottom-2 box is the summation of Strongly Disagree and Disagree 32
Appropriate weighting was applied in accordance with the demographics of the South African adult population.
Stellenbosch University https://scholar.sun.ac.za

120
educational history from before 1994. As in previous studies, more males report having taken and
passed science subjects than females. Similarly, Blankley and Arnold also found that qualifications
and educational background in science not only led to enhanced scientific literacy results, but also
better employment and reported income (Blankley and Arnold, 2001). Further segmentation by
population group revealed similar results to earlier studies with African and Coloured respondents
reporting lowest exposure to scientific education and consequently, lowest scientific literacy scores.
Attitudes toward science and technology questions were also included in this study and used the
index of promise and reservation in order to appraise public attitudes toward science. South Africans
generally reported agreement with more positive (promise – 76%) than negative (reservation – 60%)
items. Blankley and Arnold also report on the ratio of these indices (promise score: reservation
score) and compare the results to 13 other countries reporting Promise and Reservation index scores
for the same (or a similar) year. South Africa reported an index score of 1.28, that compared
favourably with the 13 other countries and ranked 4th, between Italy and Ireland, scoring higher than
Great Britain, France, Germany and the Netherlands. This indicated that in 1991-2001 South Africans
were generally optimistic about science; however Blankley and Arnold do assert that this may in fact
be due to the lower levels of factual knowledge and understanding about science that allows for this
greater optimism (Blankley and Arnold, 2001). This is emphasised when the results of the index of
promise and reservation is analysed by respondents’ highest educational level, wherein we see that
for the lowest educated groups the correlation is +0.28; while for the highest educated group this
correlation is +0.09. This contrasted to the USA where the correlation for the entire population is -
0.66, indicating greater reservation about science which appears to be further negatively impacted
by higher educational attainment. Questions relating to public understanding of scientific terms and
concepts were also included. A general global trend emerged here wherein simple concepts (The
oxygen we breathe comes from plants) were generally answered correctly (80% answered correctly)
while more complex concepts (antibiotics do not kill viruses) were generally not answered correctly
(14% answered correctly). Levels of interest in scientific areas were also assessed and revealed the
following results (table 3.7):
African Coloured Indian White Total sample
Level of interest : New Scientific Discoveries
Very interested 47.7 42 36.9 37.5 45.5
Moderately interested 32.1 31.4 45.6 49.8 34.8
Not at all interested 20.2 26.6 17.5 12.7 19.7
Total 100.00 100.00 100.00 100.00 100.00
Level of interest : New inventions
Very interested 46 36.2 39.3 44.8 44.7
Moderately interested 34.3 34.1 43.7 43.7 35.9
Not at all interested 19.7 29.7 17.0 11.5 19.4
Total 100.00 100.00 100.00 100.00 100.00
Stellenbosch University https://scholar.sun.ac.za

121
Level of interest : Medical discoveries
Very interested 54.3 51.3 47.6 57.3 54.3
Moderately interested 27.1 28.7 42.5 32.5 28.4
Not at all interested 18.6 20 9.9 10.2 17.3
Total 100.00 100.00 100.00 100.00 100.00
Level of interest : Environmental issues
Very interested 49.2 38.5 37.4 51.8 48.2
Moderately interested 33.4 36.0 47.7 41.5 35.2
Not at all interested 17.4 25.5 14.9 6.7 16.6
Total 100.00 100.00 100.00 100.00 100.00
Table 3.7: Interest in science, all races. Adapted from Blankley and Arnold, 2001
As in Pouris 2001, interest in Medical Discoveries remained the most widely reported area of
scientific interest, followed by environmental issues, new scientific discoveries and new inventions.
This is promising, as interest would be key toward ensuring that intervention strategies aimed
toward promoting scientific literacy would be successful (Blankley and Arnold, 2001). Analysis of this
data by population group revealed that there was a high level of interest among the lowest income
groups - historically also the poorest performers on measures of scientific literacy - and thus further
highlights the importance of developing strategies to rapidly effect change among these groups.
Blankley and Arnold note in their conclusion that any intervention strategy that is developed to
target specific audiences in South Africa must take into account the ‘limited scientific knowledge and
vocabulary’ among the general population. This would likely be a dual approach, heavily dependent
on government policy shifts, to lay better foundations for younger people at school level while
simultaneously ensuring that adults are provided with similar learning opportunities in order to raise
their scientific literacy and thereby prospects for a more prosperous future.
The study of the public understanding of science evolved between 2000 and 2010 with two studies
highlighting the importance of science communication and its relationship to scientific literacy and
public attitudes and understanding. This reflects the similar evolution in Europe much earlier toward
a more science and society focus within the research paradigm. Goolam in 2001 investigated the
levels of scientific and technological literacy of first-year physics students at the University of
Pretoria. The study employed both qualitative and quantitative research approaches using a survey
questionnaire as well as focus group discussions. The questionnaire was divided into questions
assessing scientific literacy as well as a section asking questions on technological literacy. The
differentiation between scientific literacy and technological literacy is important as not all citizens
will find scientific principles and concepts useful in daily life. However, in a modern urban
environment, technology and thereby technological literacy becomes valuable in navigating the
many solutions based in recent technological advances (Goolam, 2001). The focus groups explored
the understandings of selected survey respondents’ understanding of scientific literacy and
technological literacy as well as how the public determines competency in each of these literacy
Stellenbosch University https://scholar.sun.ac.za

122
areas. Goolam identified four (4) scientific literacy levels in his study: Scientifically Illiterate,
Mediocre Scientific Literacy, Good Scientific Literacy and Excellent Scientific Literacy. Goolam scores
his questionnaire out of 2033 possible points, and of the total sample of 171 students, 17% were
found to have excellent scientific literacy, 47.3% to demonstrate good scientific literacy, 28.1%
displayed mediocre scientific literacy, while 13 % of students were found to be scientifically illiterate.
A similar tabulation was performed for technological literacy, wherein it was revealed that 75.5% of
students surveyed demonstrated a good to mediocre level of technological literacy.
Similarly in 2004, Conradie conducted a study as part of her doctoral work that investigated the role
of key role players in science communication at South African higher education institutions. The study
held as its focus the understanding of the key role of science communicators in disseminating
science messages in South Africa. Conradie highlights 4 categories of communicators of science
including: scientists, communications specialists at universities, journalists and executive
management at universities. In doing so, she identified six aims of this research: 1) to determine the
importance of science communication among role players, 2) to determine if a relationship of trust
exists between these role players, 3) to understand the role of a communications specialist, 4) to
understand the extent of communications training provided to scientists, 5) to assess scientific
media coverage in South Africa, and 6) to perform a media analysis on science coverage in major
media between March and May 2004. Key findings delineated by the six aims of the study included:
1) science communication is important to all role players in the scientific community; however more
needs to be done to communicate science to the general public to increase scientific literacy, 2)
greater effort needs to be invested in developing trust relationships between key role players in the
South African S&T system, 3) communication specialists are regarded as managers, but lack effective
power to perform their jobs to an effective degree, 4) results indicate that adequate training for
communicators, journalists and scientists is still lacking, 5) for aims 5 and 6, the study concluded that
media coverage related to science news still remains very low compared to other interest areas.
Conradie notes that science communication and its role players play a crucial role in building an
enhanced public understanding of science toward developing a more scientifically literate
population. She contends that a pro-science environment needs to be developed in areas where the
public and science interact toward fostering better relationships and a greater sense of
understanding and knowledge transfer. However, she continues to stress the importance of up-
stream changes that must evolve as both the public and scientific development evolve, wherein key
role players in the system are empowered and have the capacity to meaningfully engage and attract
33
Where less than or equal to 8 = Scientifically Illiterate, 9 to 11 = Scientifically Illiterate, 15 to 15 = Scientifically Illiterate and 16 to 20 points = Scientifically Illiterate
Stellenbosch University https://scholar.sun.ac.za

123
the interest of the public toward the stated goals of the public understanding of science and science
communication community.
Van Rooyen (2004) conducted a similar study on public understanding of science through media
analysis and in her work revealed that science coverage in the media is not at a sufficient level and
quality that would make it a priority in society and government policy. Her report, based on an
analysis of 15 major South African publications34 over a period of three (3) months between March
and June 2002, revealed that only 2% of editorial space was devoted in some way to science
coverage. On a positive note, van Rooyen reports that of the news articles reviewed in this period,
70% adopted a positive reporting stance with respect to scientific issues, while 30% expressed a
more ‘negative’ perspective. The review of media coverage revealed nineteen (19) categories of
science reporting, with the most popular being biomedicine (18%) followed closely by astronomy35
(14%). Van Rooyen also found that in addition to the above, a fair amount of coverage was given to
issues related to HIV/Aids research (12%) and high-tech issues (12%), while a higher proportion of
coverage dealt with topics of pseudo-science (5%), such as astrology, and only a very small
percentage of articles covered mathematics (0,2%) and physics (0,4%) (Van Rooyen, 2004). In a
similar media analysis study in 2010, Gastrow, as part of a report for the National Advisory Council
on Innovation and the National Biotechnology Advisory Committee, reported results which concur
with that of Van Rooyen’s earlier study. Gastrow did expand on the work of Van Rooyen
methodologically; however, essentially the results had not differed greatly from the earlier work and
will not be discussed further.
In addition to evolutions in research approaches, the subject focus area of public understanding of
science work also began to pay attention to specific scientific fields. Whilst as a field of science,
Biotechnology is in its infancy, climate change and climate research has been ongoing for at least the
last 60 years. However with the recent politicisation and media coverage in relation to both areas of
science, increased public awareness, public opinion and public interest have resulted in surveys
appearing toward studying this branch of discourse. In 2004 the HSRC conducted a Public
Understanding of Biotechnology Survey on behalf of the Department of Science and Technology
(DST). Their survey used items from the USA-NSF and Eurobarometer surveys in assessing attitudes,
interests and understanding related to biotechnology among the general public. The sample was
selected from within the HSRC Master Sample using 500 enumeration areas and selecting 7 000
34
Daily newspapers included: Die Burger, Beeld, Cape Argus, The Star and the Sowetan. Weekly newspapers included: City Press, Mail & Guardian, Sunday Independent, Sunday Times, Rapport and Business Day. Non-Science magazines included: Financial Mail and Finance Week. Community newspapers included: Eikestadnuus and Sasolburg Bulletin 35
This may have been influenced by the much publicised “First African in space”, Mark Shuttleworth's visit to the Mir International Space Station.
Stellenbosch University https://scholar.sun.ac.za

124
adults, 16 years and older. The demographic representation was scaled to be relative to population
Census data. Results indicate people are generally supportive of technologies that will ensure food
security and quality, but remain conservative in their support with respect to the health and
environmental implications of biotechnologically engineered foodstuffs. This reveals a general sense
of ambivalence within the sample group, indicating the public is not absolutely certain about the fair
and ethical application of biotechnology. A similar pattern is exposed in the 2007 HSRC–SASAS
(South African Social Attitudes Surveys) survey of Public Understandings of Climate Change.
Completed in the SASAS survey, it had similar sample design, makeup and operational specifications.
The questionnaire was developed by the HSRC and the final sample used from which the results
were obtained comprised 3 164 respondents (Reddy et al, 2009). In results similar to that of the
Understanding of Biotechnology Survey, the climate change survey revealed that the South African
public still has not taken up the concerns relating to issues of climate change as the numerous and
often conflicting ‘evidence-based discussions” generally leave the public more confused than
concerned. Results indicate that 27% of respondents had not heard of ‘climate change’, while at the
same time 25% indicate that they are ‘fairly dissatisfied’ by the government response to issues of
climate change. There was little variation in these results when contrasted along varying
demographic variables, indicating that especially for age and education, the consistency in the result
may be attributed to an external learning environment from school or work. Reddy et al (2009)
attributes this to patterns of media coverage in South Africa in relation to climate change. In the
total sample of 3 164, 46% indicated that they had become more aware of issues related to climate
change in the recent past as a result of increased media coverage and available information sources,
yet indications are that concern related to issues of climate change in South Africa remain low.
3.2.4.3 Surveys conducted from 2010 to present
The period from 2010 to the present has not seen as many studies being published. However,
concerted efforts by the HSRC and its research partners have delivered some interesting research
products, albeit as a return to survey orientated research. Much, though not all, of the empirical
work conducted by the HSRC since 2010 has been conducted using the South African Social Attitudes
Surveys (SASAS). The survey is designed to collect information from a large representative sample of
South African adults aged 16 years and older. The sample size is usually made up of between 6 000
and 7 000 adults representing all races, genders and age groups from across South Africa, both rural
and urban. In 2010 the Education and Skills Development research programme of the HSRC
conducted a survey using a module in the SASAS survey designed to assess public attitudes to
Stellenbosch University https://scholar.sun.ac.za

125
science in South Africa. This is was the first time36 that a general public attitude to science survey
had been conducted since Blankley and Arnold (2001). The survey yielded a total of 3 183
respondents, with 48% male, 52% female, 77% African, 9% Coloured, 3% Indian and 11% White
participants. Both rural and urban respondents were surveyed and where required, questionnaires
were translated and interviewers were fluent in local languages of research areas (Reddy et al,
2009). In addition to responses on public understanding of science items, the questionnaire
collected data on geographic, cultural, economic, social and demographic data points. The survey
adapted the Scientific Literacy, Public Understanding of Science and Science and Society research
paradigms into the Publics Relationship with Science research paradigm (Reddy et al, 2009; 2010).
The questionnaire included questions that related to the specific social and cultural dimensions of
the South African social context, but questionnaire elements continued to include an index of
promise and reservation, scales to measure attitudes toward science as well as levels of interest and
information sources. As selected items were adapted from the USA- NSF and the Eurobarometer
surveys, this study was able to present some international comparisons for more recent South
African public understanding of science data as well as trend analysis with previous comparable
surveys conducted domestically.
Results from the Index of promise and reservation illustrating the general attitudes of the public with
respect to selected issues in scientific areas indicate a generally more negative public attitude with
regard to science in South Africa. Specifically on the statement, we depend too much on science and
not enough on faith, results from the 2010 survey show a 17-point increase in general public
agreement with this statement; similarly, with the 5-point increase in agreement with, science
makes our lives change too fast. Promise and reservation index data analysis for age, gender and
population group was not presented in their finding. Comparisons were however presented with
international surveys with comparative datasets. South Africa obtained a Promise/Reservation Index
score of 1.20, followed by India (0.80), while the USA (1.70) and European (1.40) scores all ranked
higher. Reddy et al (2010) have further presented a positive correlation between GDP and Promise /
Reservation Index score changes across this same period. They reported that South Africa had a
similar response pattern to that of Europeans on certain test items, while on others reflected a
pattern closer to that of respondents from India (Reddy et al, 2010). Attitudes to science were
disaggregated by educational level, age and gender in an effort to best understand the varying strata
of the South African public. There were no striking variations for attitudes to science with respect to
gender; however, age was shown to demonstrate a significant effect on attitudes toward science.
Younger participants (16-19 years old) showed a greater sense of scientific promise and
36
Rather than surveys related to specific focus areas or exploring other methodological approaches – media analysis.
Stellenbosch University https://scholar.sun.ac.za

126
consequently more positive attitudes toward science compared to older age groups. Similarly, as
educational level increased, so too did positive attitudes to science and a greater sense of scientific
promise, compared to respondents reporting lower academic attainment levels. These results are
echoed in the data for the comparable surveys from India and the USA. The authors note, in general,
that avenues for further research within selected ‘publics’ could be identified through more detailed
analysis of these survey results. Further areas also carry implications for science communication and
public science policy in general.
Public understanding of Nuclear Technology/Energy was investigated by the HSRC in 2011, again
using the SASAS survey. Results in the survey indicate that 23% of respondents report being in
favour of nuclear energy, however SASAS further reports that a similar number was ambivalent in
their attitude toward nuclear energy, while 42% responded with the “don’t know” option.
Comparisons to similar European surveys indicate that this level of ambivalence is four (4) times
higher in South Africa, with the British survey revealing 11% responding with the ‘don’t know’ option
(Struwig and Roberts, 2011). Respondents in the survey were asked to identify benefits and
disadvantages of nuclear power as a source of electricity in South Africa and many expressed
support and positive attitudes toward nuclear power. The study reports that 23% of respondents
would consider nuclear a reliable energy source, 16% felt that it could assist in alleviating climate
change while 14% indicated that nuclear energy represents a more cost-effective energy source.
With respect to the disadvantages of nuclear power, respondents were most concerned about the
risk of nuclear accidents (34%) and the ethical disposal of waste by-products (20%), and 19%
expressed a concern related to the risk of radiation contamination. Responses in the ‘don’t know’
category were equal for both the advantage and disadvantage statements (50%). Despite the safety
concerns, 40% of respondents agree that the South African nuclear energy programmes should
continue to operate, while a further 44% were not sure (reported the ‘don’t know’ response option).
A further 38% of respondents agreed that South Africa should build new nuclear power generation
points, adding to the current capacity. However, again, 42% responded with the ‘Don’t know’
response option (Struwig and Roberts, 2011). The authors note the generally lower levels of public
understanding of nuclear technology, attitudes toward nuclear safety and risk perception as key
areas to be addressed by appropriately nuanced communications channels. Government and the
nuclear industry as well as academic and other related role players have all been identified as key to
increasing the general public understanding of nuclear power as well as highlighting the importance
of appropriate public support for future expansion of the domestic nuclear power programme.
Stellenbosch University https://scholar.sun.ac.za

127
The International Trends in Mathematics and Science Survey (TIMSS) has been conducted since
1995. Though TIMSS is designed to assess the performance of grade 4 and 8 learners, it did in certain
year’s survey other grades. The survey is designed to reflect the school curriculum and asks learners
to use information presented in the questionnaire to solve problems posed, as a means of assessing
the degree to which learners have developed competencies and assimilated concepts in maths and
science as well as the degree to which this can be applied to presented scenarios. South Africa had
participated in TIMSS since 1995 and again in 1999, 2002 as well as the most recent survey in 2011
(HSRC, 2011). As key areas of higher and tertiary education as well as employment competency,
mathematics and science performance is of paramount importance to assessing the literacy rates
within these areas at an early stage. Further to this, it provides valuable international comparison for
youth populations as a useful future indicator as well identifier of areas for additional focus and
planning.
In comparing TIMSS performance between 1995 and 2002, results indicate that the average national
score remained unchanged; however, within provinces, increases were noted (HSRC, 2011). Scores
increased by 63 points at private schools and by 60 points at public schools, indicating a 1.5 grade
level improvement in the 2011 round of the survey. Similarly, the 1995 to 2002 results indicate a
wider range of scores between the 5th and 95th percentile. However in the 2011 iteration of the
survey, this decreased substantially, indicating a possible improvement in providing more equitable
education, particularly at schools in lower income communities (HSRC, 2011). Scores for
mathematics increased in all provinces except for the Western Cape, but this was not found to be
statistically significant. Similarly, for science scores, all provinces recorded increases, with Gauteng
recording the highest increase in both maths and science scores. While here were differences in
performance between the provinces, comparison to provincial results from the 2002 survey indicate
an 80 point decrease in the difference of scores between the highest performing province (Western
Cape - 421) and the lowest performing province (Eastern Cape - 282). Nationally, and for both
mathematics and science scores, girls outperformed boys, though this difference was not found to
be statistically significant. There were, however, age differences recorded within these scores,
where girls younger than the grade average outperformed boys. At age-grade appropriate levels
boys however outperformed girls, and where learners were older than the grade average, no
statistically significant difference was observed (HSRC, 2011). With regard to attitudes toward
science and future careers, learners generally value science and mathematics education; however,
they reported a lower confidence in the quality of education in these subjects. This result indicated a
decrease in learner confidence between 2002 and 2002, from 10% reporting low confidence in 2002
to 24% reporting this in 2011. The majority of learners (54%) reported a desire to continue on to
Stellenbosch University https://scholar.sun.ac.za

128
tertiary education, only 2% lower than similar scores for their international counterparts in the 2011
survey. While TIMSS presents a useful snapshot of future adults in a country, and for South Africa
illustrates a promising positive trend for science and mathematics educational outcomes, its
methods fundamentally present limited applicability to public understanding of science research due
to its targeting younger learners as well as its specific focus on school curriculum competency areas.
The above review of selected studies represents the major empirical works in South Africa since the
early 1990s. Table 3.8 below presents a summary of work reviewed as well additional works not
discussed above37. From a detailed reading of the number of empirical research reports on the
public understanding of science and scientific literacy in South Africa, it is clear that as a country in
transition, a number of improvements have been recorded, though many authors (see above) have
stressed the importance of an increased and more focused effort toward enhancing educational
inputs and outputs as a means to generally impact measured public scientific literacy and general
understandings of science. The earlier noted evolution in methodology and paradigmatic approaches
- from measures of scientific literacy to public attitudes and understanding of science as well as the
social approach under the science and society paradigm that included research with media analysis
and science communication actors - reveals a field of study that is increasingly valuable to South
Africa’s developmental aspirations and stated economic, political and social goals. The numerous
changes that the South African social structure has seen since 1994 appear to be influenced by social
and cultural assimilation to a more democratic and globalised notion of human–science– technology
interaction. While South Africa is still considered a developing economy, it simultaneously displays a
number of characteristics of more developed nations, thereby making a detailed understanding of
the public’s interactions, attitudes, knowledge, risk perceptions and general competency with
respect to areas of science even more important.
uthor Title Year Survey Description
Pouris Public understanding and appreciation of science among the public in South Africa
1991 Face-to-face interviews, Major Metros, random suburb sampling - 1 300 "White" respondents
Pouris Public understanding and Appreciation of Science among South African Teenagers
1993 Face-o-face interviews, Major Metros - 800 "African" and "White" respondents
37
Where studies were sufficiently similar in design, results and relevance, these were not included in the review in table 3.8
Stellenbosch University https://scholar.sun.ac.za

129
HSRC Omnibus Survey 1995 Face-to-face interviews
IEA Trends in International Mathematics and Science Study (TIMSS)
1995 Paper and pencil test administered to grade 8 learners in schools
FRD-HSRC SA Science and Technology Indicators - Public Understanding of Science chapter
1995
3 surveys measuring scientific knowledge, Attitudes to Science and a survey on Human Science Literacy - 2 163 respondents
Laugksch
Test for Scientific Literacy and its application in assessing scientific literacy of matriculants entering universities and technikons
1996
Survey of 1st time entering university students at Western Cape Universities - 4 227 respondents
HSRC EPOP 1999 Household survey using face to face interviews
IEA Trends in International Mathematics and Science Study (TIMSS)
1999 Paper and pencil test administered to grade 8 learners in schools
Pouris Interests, Public Attitudes and Sources of Scientific information in South Africa
2001 Face-to-face interviews, Major Metros, Representative Cluster sampling - 1 000 households
Blankley and Arnold (FRD)
Public Understand of Science in South Africa – aiming for better intervention strategies
2001 Face-to-face interviews, Major Metros - 2 207 randomly selected (18+ years old) respondents
Goolam The scientific and technological literacy of first year physics students: the effects of a traditional school curriculum
2001
Mixed methodology survey - 171 students in 1st year of physics programme at University of Pretoria
HSRC SASAS: Biotechnology survey 2004 Household survey using face to face interviews - 7 000 respondents aged 16+ years
Stellenbosch University https://scholar.sun.ac.za

130
IEA Trends in International Mathematics and Science Study (TIMSS)
2003 Paper and pencil test administered to grade 8 and grade 9 learners in schools - 8 952 respondents
Pouris Assessing Public Support for biotechnology in South Africa
2004 Face to face interviews in consumer survey - 1 000 households
Conradie
The role of key role players in science communication at South African higher education institutions: an exploratory study
2004
2-phase study at South African Universities: Phase 1: Survey interviews with 102 science communicators. Phase 2: Content analysis in 16 South African publications
World Values Survey World Values Survey 1990-2005
Household survey using face to face interviews - 2 988 respondents
HSRC SASAS: Climate change 2007 Household survey using face to face interviews - 3 164 respondents
Reddy et al Public Understanding of Science in South Africa
2010 Face –to-face interviews, rural and urban, 3 183 respondents aged 16+ years
HSRC The Public Understanding of Biotechnology in the Media
2010 Content analysis of 4 major news publications in South Africa - 50 articles
HSRC Trends in International Mathematics and Science Study (TIMSS)
2011 Paper and pencil test administered to grade 8 and grade 9 learners in 285 schools - 11 969 respondents
HSRC SASAS module: Public Attitudes Toward Nuclear Technology and Energy in South Africa
2011 Household survey using face-to-face interviews - 3 057 respondents aged 16+ years
Table 3.8: Empirical studies of Public Understanding of Science research in South Africa. Adapted from Reddy et al, 2009
Stellenbosch University https://scholar.sun.ac.za

131
Conclusion
This chapter reviewed the historical overview of public understanding of science and scientific
literacy research. It presented a comprehensive literature review of the major theoretical and
methodological approaches to the study of scientific literacy and the public understanding of
science. The historical development of this field in the United States of America as well as the
European and wider context has led to numerous methodological and empirical advances in
understanding of the public-science rendezvous points. As a result of the dynamic and changing
environment within which this multidisciplinary area of research is located, the evolving definitions
and debates that ensued in the late 1980s internationally has left the domain far richer, though no
closer to a consensus within which to advance in a single direction. This is by no means a negative
outcome; on the contrary, it has opened and expanded the agenda for research as well as the
development of the next phase of evolution toward the development of reliable indicators of the
public understanding of science.
The section reviewing empirical studies presented research from 10 countries delineated by broad
development-status identification. It had become clear that within the developed world, a number
of large international surveys (PISA, TIMSS) have been conducted and results presented reveal
emerging trends that appear consistent across geographical regions. Similarly within the developing
world context, cultural and social conditions may vary internally and between countries, thereby
fundamentally challenging accepted approaches to the study of scientific literacy and the public
understand of science. Though initial research within the developing world adopted western survey
instruments and approaches, empirical studies have found these methods inadequate, and continual
revisions as well as development of locally relevant test items are ongoing, while consistently
requiring a comparison point to other international findings to maintain relevance.
A detailed review of studies conducted in South Africa was presented to illustrate the influence of
social and cultural context. South Africa is uniquely positioned to do this due to its demographically,
economically, socially and culturally diverse population; leading Reddy et al to refer to these as the
South African publicS (2009). While a demographically representative survey of South Africa’s public
understanding of science had been conducted in 2010, test items and the questionnaire design of
that survey have identified broader areas of interest for investigation toward the development of a
more focused and appropriate instrument for the measurement of these important metrics. Lessons
from the review of Chinese studies have stressed the importance of definition and the reliance on an
appropriate design for the particular social context. This is in agreement with Shamos, Shen and
Stellenbosch University https://scholar.sun.ac.za
132
Popli, and furthermore seems most applicable to the future of South African empirical research
within the public understanding of science domain.
The next chapter adopts this challenge by first reviewing the history and development of scientific
literacy and public understanding of science indicators as well as the debates they engendered then
and still do today. Following this, the empirical approaches to this research will be presented within
the context of indicator development toward the identification of appropriate indicators for the
South African context. The outcomes of the discussions in the following chapter will result in the
development of an appropriate research instrument for the empirical part of this study that will
inform a set of indicators of the South African public understanding of science.
Stellenbosch University https://scholar.sun.ac.za

133
Chapter Four
Research Instrument Development
Now it is time to be ambitious again, let researchers come together with new efforts…
(Bauer et al. 2007)
The development of the research instrument within this study required detailed reading of the
literature and related resources toward gaining an in-depth understanding of the history and
development of measurement in the area of scientific literacy and the public understanding of
science. This chapter introduces into these discussions the history of science and technology
indicators and specifically, statistics of scientific literacy and the measurement of public
understanding. Having to take into account the uniqueness of the South African context while
simultaneously remaining aware of the shared global context within a knowledge economy means
the production of science indicators in the developing world can be likened to walking a tightrope. It
requires a fine balance between localisation and international comparability to ensure the
effectiveness of indicators and, ultimately, the accuracy of the research findings.
This chapter introduces the elements considered salient within the measurement of the South
African public understanding of science. These elements are then operationalised within the
research instrument toward the measurement outcomes. Within the research instrument
discussion, the rationale, design, development, quality assurance procedures and implementation of
the survey are discussed. The chapter concludes with a discussion of the data outputs and indicators
produced within this study.
4.1 SCIENTOMETRICS and INDICATORS for the PUBLIC UNDERSTANDING of SCIENCE
4.1.1 A BRIEF HISTORY OF SCIENCE and TECHNOLOGY INDICATORS38
The history of formal institutional science and technology measurement can be traced back to 1962,
with the OECD producing the early Frascati Manual for the measurement of research and
development activities (Goudin, 2001). However, historians of the sociology of science note the
earlier quantification of smaller scientific communities. These activities included recording numbers
of individuals actively involved in professional or semi-professional scientific activities as well as
related audits of instruments and capabilities in the interest of strengthening and preserving the
scientific enterprise. The statistics output during this initial period (mid-19th century) spoke to the
38
While much has been written on the history of STI indicators, this section presents a highly abridged account – for greater detail see Goudin 2000, 2001 and 2010
Stellenbosch University https://scholar.sun.ac.za

134
early culture of science which in many domains still continue relating the socio-political context and
its imperative to produce increasing numbers of scientists as an early indicator of social-scientific
advancement and development (Goudin, 2010).
The measurement of key inputs into the science system, including financial, human resources,
infrastructure investment and societal support have advanced along three periods of development.
Goudin (2010) highlights these three periods in the historical development of science statistics
chronologically in Table 4.1 below.
Stages Source Main statistics
Emergence
(1869-circa 1930) Scientists Number of scientists
Institutionalization
(1920-circa 1970)
Governments and national monetary
expenditures statistical offices Monetary expenditures
Internationalisation
(1960 and after)
International organizations (UNESCO,
OECD, European Commission)
Technological innovation (indicators
and international comparisons)
Table 4.1: Historical Development of Statistics on Science (from Goudin, 2010, page 8)
These periods in the development of science measurement evolved within two communities of
practice. The first of these is the academic tradition, including economists and sociologists of science
who were primarily interested in the production of models to explain linkages across the scientific
system. The second tradition emerges within Institutionalised organisations such as the Organisation
for Economic Co-operation and Development (OECD) and the National Science Foundation (NSF),
and collates, among other data, indicators on national science systems (Goudin, 2010). The type of
statistics produced within these two traditions could in many ways be related to the influence of
interest groups discussed in Chapter Two, wherein the outputs of research reflect the intended use
and application of data consumers within their particular worldview. Arie Rip (1997) developed a
graphical representation of the varying views different role players may have of the scientific
enterprise, based on the traditions and worldview from which they emerge. Figure 4.1 displays this
varying perspective that may in some respects offer a differing interpretation of the same data, as a
result of these interpretative disparities.
Figure 4.1: Graphic representation of Rip’s Triangle (image from Feller & Gamota, 2007)
Stellenbosch University https://scholar.sun.ac.za

135
Similarly, Fred Gault (2011) notes that, ‘… indicators, of any kind, are developed as a result of a
perceived need of a community that wants to use them; both the development process and the
eventual use of the indicators have social impacts.’ Gault clearly identifies that beyond the
scientometric development of indicators, the social and cultural environment within which
indicators are developed and applied are of equal importance and value. He further notes the
iterative nature of indicator development wherein input from data users and producers further
refines the development of indicators.
The Linear Model of Innovation generically represents the stages of scientific research and
development inputs, activities, outputs and impacts along a linear process. Since the 1960s the
traditions and operationalisation of science measurement has seen increasing contributions in the
form of new methods as well as additional measurement manuals relating to Technological Balance
of Payments (1990), measurement of innovation activities - Oslo Manual (1992) as well as manuals
describing methods of measuring patent indicators (1994), human resources – Canberra Manual
(1995) and productivity (2001). While the advancement in science, technology and innovation (STI)
measurement is generally appreciated and the large volumes of global measurement databases now
span almost 60 years of data, numerous elements within the scientific processes are poorly (if at all)
measured. Freeman and Soete (2007) note the focus on input measurement (financial, human
resources etc.), due to the convenient nature of inputs toward measurement; compared to more
abstract constructions of outputs and impacts. Godin (1996, in Godin, 2000) notes that the further
one moves on the linear model, away from inputs and toward impacts, the fewer scientific measures
and indicators are available. More recent models of science & society have remedied the linear
models’ propensity to unduly attribute scientific research as the only area of innovative activities,
opening up the discussion to the many social and culturally inter-looped structures at play
throughout the innovation life cycle (Edgerton, 2004).
The aforementioned ‘measurement accessibility’ of input flows, compared to the more abstract
constructs within output and impact measures, emerged as a result of the drive within governments
and institutions to promote administrative efficiency and effectiveness of investments with respect
to defined research objectives (Godin, 2000). This is of particular importance for measures of output
and even more so for impact measures, of which very few (if any) widely accepted metrics exist.
Within the area of public understanding of science (PUS) measurement, this represents a particularly
important juncture, as PUS data reflects both an impact of the science system and as a driver of
human resource development. Similarly, PUS data acts as a type of pre-input into the science
system, providing the much-needed human-resource capital and a suitably scientifically-skilled
Stellenbosch University https://scholar.sun.ac.za

136
public more receptive to scientific innovations. The importance of human capital within a scientific
context provides the gravity around which the varying stakeholders within the system must align
toward building greater capabilities and efficiencies and increasing outputs and impacts of a national
system of innovation. Similarly, additional social factors such as education, infrastructure and
government support remain important to ensure a competent downstream supply of human
resources, both within the science system, and as supporting actors in the form of a scientifically-
attentive public.
South Africa has yet to develop a routine assessment of the public-science milieu as the country
moves ahead in its various expansion initiatives driven by an ICT39-based environment, the
understanding of science and technology within society will become increasingly important. The
following sections explore the potential for the development of public understanding of science
research, indicators and the relevant social and contextual elements paramount to the success of
such initiatives.
4.1.2 STATISTICS of SCIENTIFIC LITERACY and PUBLIC UNDERSTANDING of SCIENCE
The earliest surveys of scientific literacy and public understanding of science research emerged
around the mid-1950’s. Since then a formidable time series of data has been (disparately) amassed,
particularly in the United States of America and Europe, with limited Asian and developing countries
similarly producing multiple contemporary datasets40 (Bauer and Falade, 2014). However, related to
this is the long-standing debate within the research community with respect to a universally
accepted definition of public understanding of science and scientific literacy. Chapter Two discusses
in detail the many historical debates related to the evolution of meaning chronologically across the
preceding 70-years of research contributions within this domain. These debates relate specifically to
what exactly scientific literacy (and later public understanding of science) should entail, to whom it is
applicable, which publics should be measured, how it benefits society and the concept of deficit
attribution (see: Bauer, Petkova, & Boyadjieva, 2000; Bauer, Allum and Miller, 2007).
However, what has transpired across this period is a general agreement relating to the value of
Miller’s (1983) 3-consecutive dimensions of scientific literacy, which has formed the foundations of
the early NSF surveys, and continues to inform these flagship products on a regular basis. Through
this evolution, the concepts under the umbrella of the public understanding of science paradigm
added the dimension of attitudinal measurement to the area of scientific literacy measurement.
Similarly as the Science and Society paradigm emerged in the early 1990s, despite the rejection of
39
Information and communications technologies 40
Previously discussed in Chapter 3
Stellenbosch University https://scholar.sun.ac.za

137
public deficit attribution and the questioning of surveying methods, measurement instruments
under this movement returned (albeit from a different vantage) to public surveys, in the absence of
more advanced measurement techniques. Despite these many debates and the continuing evolution
of meaning and definition, Bauer (2014) maintains that ‘…none of the new discourses made the
previous ones obsolete, as research continues to enhance and expand the agenda’. While the
definitions, survey methods and statistics have not attracted a complete sense of harmonisation
across the field, broad agreement exists relating to the acceptability of current measures, in the
absence of a more refined battery of measurement techniques and definitions (Barre, 2010).
With the release of the first NSF Science Indicators report to include a chapter on indicators of
scientific literacy in the early 1990s, similar products began to appear via the European Commission
and related statistical and governmental organisations (Godin, 2010). While in many respects, early
NSF attempts sought to measure scientific literacy, the initial EuroBarometer series included a
dimension related to public attitudes and interest in science, expanding on the NSF product
offerings. Despite the fact that there are related methodological and theoretical variations between
the early NSF and Eurobarometer approaches to the study of the public understanding of science
and scientific literacy, a point of congruence emerged toward the end of the 20th century, wherein
products produced in wider geographic settings adopted similar ‘standardised’ approaches to
measurement within this field. As a result, studies discussed in chapter 3 from the United Kingdom
(Wellcome Trust, OST), Japan (NISTEP), China (CAST), Australia (Australian Academy of Science),
Malaysia (MOSTI) and developing nations such as India (NISTaDS) and South Africa (HSRC, Pouris,
Blankley & Arnold) have all produced similar datasets. While many of these studies have introduced
incremental variations and refinements to the measurement of the public understanding of science,
the drive toward international comparability of data and (an ill-defined) drive toward
standardisation of definition, method and reporting has yielded a number of internationally
comparable datasets. Discussions within the developing world particularly have highlighted the need
for greater cultural reflexivity within the measurement of the public understanding of science, which
has provided much of the impetus within the current global research agenda (see chapter 3). The
discussed methodological debates, relating specifically to item selection; the equating of knowledge
of scientific facts with understanding or ‘literacy’; the relationship between knowledge, attitudes
and understanding as well as the long-standing matters relating to the applicability of the deficit
model and the related questions around its application in various settings have attracted enough
consensus toward providing continued advances within the field.
Stellenbosch University https://scholar.sun.ac.za
138
As a result of the above, few indicators of scientific literacy and the public understanding of science
(PUS) have successfully been developed and implemented. The above does not imply these metrics
do not exist or have not been proposed, however as a result of ongoing debates, (addressed
previously) general consensus does not exist as to the applicability of many PUS indicators. Elkana et
al discuss the various definitions of science indicators and propose the following definition: science
indicators are measures of changes in aspects of science [over time] (Elkana et al, 1978 - page
3).They propose this definition as an opening to the discussion on science indicators rather than a
definitive demarcation of the practice, as many different types of science indicators exist. The focus
on theory-laden normative measures is considered limiting by Elkana et al who propose that science
as a cultural model of society should recognise the social embeddedness of the enterprise and aim
toward further study of these interrelations. The proposal then is one of “disciplined eclecticism, one
in which the various opinions, views and value of the known elements within science indicator studies
are adapted and absorbed toward greater understanding, in the absence of an overarching theory of
scientific change in the foreseeable future’ (Elkana et al, 1978). Barre adopts a similar position,
stating that [indicators] being debatable is not a limitation to the study and production of S&T
indicators, but the very essence of the contribution of indicators to decision-making processes
(Barre, 2010). He goes further to state that indicators can be developed to measure activities at
varying levels within the system (micro, meso and macro) as well as dealing with varying objects and
contexts of STI policy and decision-making processes.
In this light, results from surveys of public understanding of science generally produce a limited
number of statistics and indicators (Bauer and Falade, 2014). Measures of scientific knowledge
usually include statistics of knowledge of basic scientific facts, processes and contextual or
application of scientific learnings to daily life. Results of scientific knowledge measures are most
often disaggregated by age, gender, education level and geographic location (or similar demographic
segmentation). These knowledge measures provide some insight into the level of scientific
knowledge within the public41 under investigation, and stem from the often quoted axiom, ‘the more
they know the more they will love it [science]’.
Measurements of attitude to science had emerged under the public understanding of science
paradigm, with questions (among others) related to the impact of scientific knowledge on attitudes
to science (Bauer, 2009). The most commonly used metric to measure attitudes in these surveys is
the Index of Promise and Reservation (Blankley and Arnold, 2001; Reddy et al, 2009). The index is
constructed using seven (7) statements, split by 4 statements of scientific promise and three (3)
41 While these generally refer to the general public, at times surveys have investigated specific publics and limited findings to the community in question.
Stellenbosch University https://scholar.sun.ac.za
139
statements of scientific reservation. Promise statements are generally positive and related to
perceived benefits of science, while reservation items assess attitudes to science that involve risk,
public concerns and fear (Reddy et al, 2013). The index is constructed by tabulating the results for
each of the indices such that an overall ratio is obtained for the scores achieved on each of the
scientific promise and the scientific reservation indices. Within this ratio scores range between -1.0
and +1.0 - wherein a higher positive score indicates a generally more positive attitude to science
(Reddy et al, 2013).
Additional statistics of PUS data include items identifying the key sources of scientific information
within the public sphere. These generally comprise of lists of information sources, including
television, radio, newspapers, libraries, scientific publications, and more recently (various elements
of) the internet42. Data on information sources are descriptive, presented in tabular form and often
undergoing minimal statistical manipulation, limited to sums and averages and at times stratification
along selected demographic and related criteria. Similarly, levels of interest in science is another
descriptive measure that (most often) is self-reported by respondents using a list of scientific
research areas and asking respondents to indicate a level of interest for each area on a 5-point scale
ranging from very interested to not at all interested. Results are reported in tabular form or with the
use of a bar-chart indicating scales of interest per research field. Selected surveys have also included
questions on public engagement in science dialogue (NSF, 2014). These questions look at the level of
public participation in science learning areas such as exhibitions, lectures, museums, science parks,
zoo’s and botanical gardens. Many of these questions are used to develop basic statistics on public-
science interaction points, however very few venture to produce (publically available) detailed
results based on demographic stratification and related analysis that would prove beneficial to the
public and inform more effective science policy. The most recent survey conducted in South Africa
(see Reddy et al, 2013) limited its analysis to attitudinal areas (Index of Promise and Reservation) and
international comparison, and have yet to conduct detailed demographic and related analysis43.
More recently research into the development of indicators and indicator systems for the
measurement of public understanding of science began to emerge (Shukla and Bauer, 2009). The
practice of science culture research generally includes elements of the scientific literacy and public
understanding of science paradigms. However in addition to these, a defined focus on science in a
social context is established as a foundational element. This includes the values and support for
science, science as part of culture and the process and products of linking science with society and
the public (Song et al, 2011). Science Culture is, as Scientific Literacy and Public Understanding of
42
Including news websites, blogs, social media (Twitter, Facebook), institutional / corporate websites etc. 43
Planned work on this dataset is noted, however detailed analysis has not yet been made publically available
Stellenbosch University https://scholar.sun.ac.za
140
Science, ill-defined, but has attracted much interest in numerous geopolitical settings due to its
multiple level indicator systems as well as its capability to account for institutional science as well as
public understanding and scientific literacy areas within society (Song et al, 2008). Song and
colleagues devised an indicator system (Science Culture Indicator for Individuals - SCI-I) that includes
both the Individual and the Social dimensions of science measurement. Each dimension is then
further divided into the potential and practiced dimensions. The sub-divisions thereby produce
indicators for Individual-Potential, Individual-Practice, Social-Potential and Social-Practice
measurement areas. These areas include public scientific literacy as well as the infrastructural
environment of the national scientific system, and are again subdivided to individual indicator
elements (in Korea). The research team later developed a similar indicator system (Science Culture
Indicator for Society - SCI-S) to measure science culture in different cities and municipalities in Korea
(Song et al, 2011).
Research by Grupp and Mogee (2004) has also demonstrated the application of a new index and the
development of composite indicators for the measurement of S&T policy with a particular emphasis
on the European region. Testing of these indicator models in various European countries, applying
minor variations in methodology (adjustment of weights, indicator selection), reflect inconsistencies
and reveals room for manipulation and misuse. The authors conclude that refinement is required,
but furthermore a multi-dimensional approach must be adopted to produce the required level of
data the research requires to forge ahead .Likewise, Archibugi (2004) published work on the
development of a new indicator for technological capabilities (ArCo) in developing and developed
countries. While this related more to a measurement of technology, than to scientific literacy/public
understanding of science, it remains valuable toward the development of indicators within the
current research project domain area. The ArCo indicator system adopts a multi-dimensional
approach toward measurement of technological capabilities, with eight (8) sub-indices related to
research & technological infrastructure as well as output measures (journals and patents). While it
takes into account national tertiary science and engineering enrolment as well as literacy and similar
STI indicators, it does not specify science literacy, but rather, general literacy that also involves
applied technological competencies (Archibugi, 2004). The ArCo indicator system delivers a means
to measure and compare national systems across territories with greater ease of comparability, but
with its limited focus on science culture and the public understanding of science, its direct value and
applicability to this research project is limited.
The recognition that the current and future momentum of scientific progress remains as a result of
social construction, relying on a diverse community of direct and indirect role players, underpins the
Stellenbosch University https://scholar.sun.ac.za

141
social elements within which the scientific enterprise is seated (Snow, 1959). Historically, the
objectivity of all fields of science has been its preferred output format; however the failure to
recognise the social envelope within which much of this objectivity is derived must be understood
toward effective planning, funding and applicability of technologies and advances that are derived
within the scientific community. While it is apparent that the social milieu greatly influences the
environment within which effective science may be practiced, a more inclusive appreciation of the
subjective human influence must become a requirement as each is complementary to the other– a
sine qua non for social and knowledge development within a society. As Shukla and Bauer put it, PUS
indicators and traditional science indicators “are two sides of the same coin of science culture…”
(2009, p. 37). As such, Shukla and Bauer (2009) developed a cultural indicator called the Science
Culture Index, which combines the influence and value of two (2) data streams to produce a
composite indicator of Science Culture. The Science Culture Index (SCI) uses traditional science,
technology and innovation indicators (STI) such as R&D expenditure, publications, researcher
headcounts, graduates, and local infrastructure and combines them with traditional PUS statistics to
produce a composite indicator of Science Culture. Shukla and Bauer (2009) note the importance of
science culture44 as an essential asset within the science system, alongside other objective factors
such as funding, infrastructure and human resources, however remains less tangible in its
manifestation.
These new measures of science and the advances they bring to the study of the public
understanding of science by de-emphasising the importance of rank ordering people by knowledge
gradients and instead focusing on science as the oxygen of society, infiltrates every aspect and
dimension of the social world (Bauer and Falade, 2014). The next section will unpack the socio-
cultural dimensions of science in the South African context.
4.1.3 INDICATOR DEVELOPMENT for the SOUTH AFRICAN CONTEXT
South Africa is a multi-dimensional society in most every aspect of consideration (Goolam, 2001;
Aiwuyor, 2011). Nine (9) provinces, 11 official languages, numerous cultural and religious groups,
and the many legacy impacts of apartheid have stratified the South Africa population into multiple
and often non-mutually-exclusive publicS (see discussion in chapter 1). The multiplicity of public
classifications could be explained within the varying stratification means used, through race, class,
religion, financial resources, location, language, education and or other social classifications. Further
to this, individuals may simultaneously be segmented into varying notions of the publicS, deepening
the critical difficulties experienced in developing applicable and appropriate indicators within areas
44
The social envelope of the scientific enterprise
Stellenbosch University https://scholar.sun.ac.za

142
of measurement. With respect to areas of research and measurement, this multidimensionality
further emphasises the difficulty in trying to develop measures that also take into account the
variability related to income inequality, access to education, social and health services as well as
other interrelated and co-dependent variables at play in the contemporary South African general
public (Laugksch, 1996).
South Africa’s three major economic hubs remain Gauteng, the Western Cape and KwaZulu-Natal.
However, within these provinces, the major metros (Cape Town, Johannesburg-Pretoria and Durban)
offer the strongest economic performance and employment opportunities to individuals suitably
experienced and qualified. Outside of these geographical areas, economic production, service
delivery and opportunities for gainful employment, while present, decreases as one moves further
away from the major metropolitan settlements. This produces a non-urban population that is
predominantly employed in production, agriculture and unskilled-manufacturing. As younger
populations leave school45, and begin to enter the workforce, many do not have the opportunities of
further education and this, combined with increasing unemployment and the related social
concerns, further polarises the population at various levels. Similarly, as populations start to migrate
toward urban areas, the size of the rural population is decreasing, constituting closer to one-third of
South Africa’s population where in the past it was significantly higher (48% in 1990). As many of
these unskilled or inexperienced newly-urbanised populations continue to move to the major cities,
attention must be focused on growing the absorptive capacity as the numbers of job seekers and
graduates continue to exert pressure on the social and economic systems. Increasing economic
activity, promoting entrepreneurship, employment, training opportunities, infrastructure and
services are all key elements that must be championed in creating a favourable socio-economic
environment for future growth and development across South Africa. Many of these interrelated
activities share an unparalleled link with advances in science and technology-derived solutions that
must be converged toward enhancing the social and environmental realities in this country. It
follows, then, that to address many of these matters, effective measurement and the adoption of an
integrated, multi-level approach toward measurement and policy implementation is required within
South Africa.
In developing an understanding of the many South African publicS, salient elements to consider
include the impact of socio-demographic variables; public knowledge, application and social value
invested in S&T areas; the availability of data streams towards developing statistics and indicators as
45
At grade 12 or earlier, as is common
Stellenbosch University https://scholar.sun.ac.za
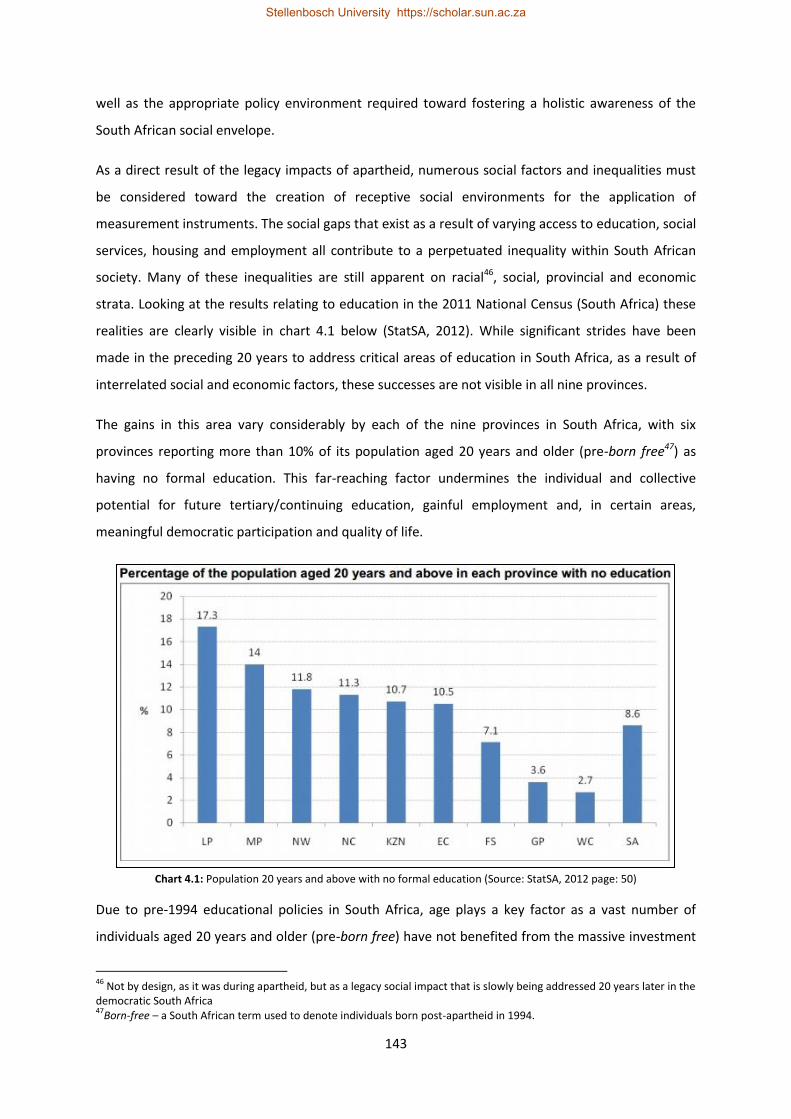
143
well as the appropriate policy environment required toward fostering a holistic awareness of the
South African social envelope.
As a direct result of the legacy impacts of apartheid, numerous social factors and inequalities must
be considered toward the creation of receptive social environments for the application of
measurement instruments. The social gaps that exist as a result of varying access to education, social
services, housing and employment all contribute to a perpetuated inequality within South African
society. Many of these inequalities are still apparent on racial46, social, provincial and economic
strata. Looking at the results relating to education in the 2011 National Census (South Africa) these
realities are clearly visible in chart 4.1 below (StatSA, 2012). While significant strides have been
made in the preceding 20 years to address critical areas of education in South Africa, as a result of
interrelated social and economic factors, these successes are not visible in all nine provinces.
The gains in this area vary considerably by each of the nine provinces in South Africa, with six
provinces reporting more than 10% of its population aged 20 years and older (pre-born free47) as
having no formal education. This far-reaching factor undermines the individual and collective
potential for future tertiary/continuing education, gainful employment and, in certain areas,
meaningful democratic participation and quality of life.
Chart 4.1: Population 20 years and above with no formal education (Source: StatSA, 2012 page: 50)
Due to pre-1994 educational policies in South Africa, age plays a key factor as a vast number of
individuals aged 20 years and older (pre-born free) have not benefited from the massive investment
46
Not by design, as it was during apartheid, but as a legacy social impact that is slowly being addressed 20 years later in the democratic South Africa 47
Born-free – a South African term used to denote individuals born post-apartheid in 1994.
Stellenbosch University https://scholar.sun.ac.za

144
in basic and higher education over the last 20 years. While adult and continuing education is
available, few individuals benefit as a result of the associated costs or inaccessibility of these services
for a variety of reasons48. In an economy of ever-increasing reliance on S&T derived solutions, this
creates another polarising factor, wherein younger people are at a significant advantage compared
to their senior community members as a result of a knowledge gap within society. Related to this,
but as a broader concept that permeates all segments of society, is the social value attributed to
science and technology within South Africa’s publicS. The appreciation by the collective public49 of
the contribution of science to the economy and society must be shared and valued by all citizens.
This would ensure effective knowledge seeking and educational outcomes, which would in turn build
stronger economic systems and produce better products. Moreover this would lead to the
development of the essential human capital (beyond those already in science careers) to build the
required social trust and support needed for greater investment and value of science in society.
A further consideration is the fact that, as in many developing nations, South Africa has a valuable
traditional/indigenous knowledge system that supports societies and development in avenues
different50 from traditional S&T systems. The value and contribution of these systems must be taken
into account, beyond the “accepted textbook” notions of English-dominated-western scientific
culture presenting a discussion that is particularly complex and has developed a specialised area of
research within the scientific literacy and PUS domain (see: Zhang & Zhang, 1993). Similar concerns
have been raised across many non-English speaking nations, where language and culture all play
major roles in the different populations’ notions of science as well as levels of understanding;
communication and support for science across the developing world (see Lee, 2001).
The production of statistics and indicators requires the development and access to various data
streams. While the production of nationally representative research data is costly and time
consuming and requires specialised skills to produce high quality datasets, very few of these national
datasets are available in South Africa for a variety of reasons. In South Africa, data is produced by a
number of stakeholders including government departments and agencies, universities, research
institutes, centres of excellence, science councils, industry and private sector research. In the area of
science measurement, a number of nationally representative and official surveys have been
produced for some time, including the numerous outputs by StatSA, the DST, the HSRC, the
Universities (CREST, IERI etc.) and the private sector. Many of these datasets are not publically
available and none have been harmonised in meaningful ways so as to derive extended insight into
48
As a result of a lack of basic literacy, foundational learnings or time / cost / employment factors 49
Scientists and science and technology graduates / employees being members of this general citizenry 50
Though not entirely dissimilar
Stellenbosch University https://scholar.sun.ac.za

145
trends and emerging areas of public understanding of science. Within ambitious long-term, multi-
dimensional projects, such as the measurement of public understanding of science, significant
access, integration and the establishment of new data streams must be put on the policy agenda
toward efficient research design. This is ultimately directed at effective, culturally sensitive and
inclusive intervention strategies within specifically identified segments of the general public. Much
of this idealised research environment is not yet a reality in the area of science policy research in
South Africa. A greater sustained effort must be directed toward understanding the social context of
science, its communication, understanding and promotion; to develop a broader South African
public that is attentive to matters relating to science and technology.
4.1.4 TOWARD THE PRODUCTION of PUBLIC UNDERSTANDING of SCIENCE INDICATORS
The previous section on statistics of scientific literacy and the public understanding of science (PUS)
explored the evolution of measurement and the development of statistics and indicators within the
area of scientific literacy and PUS. The question design and areas of focus demonstrated initially by
the NSF and the Eurobarometer surveys have been adopted in a number of settings over the last 30
years (Bauer et al, 2007), allowing far greater international comparison than in the past. Recent
interest, particularly in the developing world, related to measurement modalities convergent with
the domestic science culture context have developed a series of models and indicator systems that
may, in the long term, inform measurement techniques going forward (Chan, 2009; Sun, 2010).
The OECD defines a science indicator as ‘…a series of data which measures and reflects the science
and technology endeavours of a country, demonstrates its strengths and weaknesses, and follows its
changing character notably with the aim of providing early warning of events and trends which
might impair its capability to meet the country’s needs’ (OECD, 1976; Godin, 2001). Similar to the
earlier discussed definition employed by Elkana et al (1978), the key element represented in both
definitions is that of observation of changes in the data over time. This time element necessitates a
baseline measure, followed by regular measurements; which will position the data to be seated in
time, and the indicators as tracking the changes in these data over multiple iterations with a suitably
representative sample of survey participants.
In South Africa however, too few appropriately designed surveys51, both in terms of size and scope,
are conducted (see Pouris, 1991 & 1993; Laugksch, 1996). Furthermore, within the surveys
conducted in South Africa over the last 25 years, taking the previous point into account, surveys of
the general public understanding of science are irregularly conducted in South Africa (see: HSRC,
51
In terms of both the size and scope of the surveys completed relating to the design of the survey, sample size and coverage as well as limited population of measurement (students or particular race groups only)
Stellenbosch University https://scholar.sun.ac.za

146
1995, 1999; Blankley and Arnold, 2001; Reddy et al, 2009). While there have been more than 20
empirical52 studies conducted in South Africa since 1991, only six (6) of these studies sufficiently
produced data from a nationally representative sample relating to the general public understanding
of science, rather than surveys investigating specific interest areas (see TIMSS, 1995,1999,2003;
SASAS, 2004 – Biotechnology; SASAS, 2007 – Climate Change). As a result, detailed awareness on the
contemporary South African public understanding of science is inadequate within these discussions.
While the recent work of the HSRC has since 2009 intermittently undertaken studies on the public
understanding of science, a more frequent series of measurements needs to be established, to
complement existing products and datasets under the various STI role players in South Africa.
As a consequence of the lack of baseline data, the development of more complex data outputs
discussed in this chapter would be inappropriate under the current dearth of information relating to
the South African public understanding of science. The current research therefore aims to develop a
question set that provides an assessment of the overall South African public understanding of
science. An additional aim of this study is the production of a set of indicators to allow for repeated
measures of these factors over time. The multidimensional nature of the South African public with
respect to demographic classification and its varying degrees of influence within the measurement
domain (discussed earlier) will furthermore be investigated. This noted socio-cultural complexity
must first be understood prior to exploring the development of cultural models of the South African
public understanding of science. While it is noted that the multiple levels of the South African
publicS will at a future point be viewed from within a multidimensional model, this initial research
attempt aims to produce a baseline measure and predictive model to ascertain the general South
African public understanding of science.
The study includes questions previously adopted and further adapted to be more suitable to the
local context. These questions aim to assess scientific knowledge, interest, sources of information,
public attitude and public engagement with science activities. Key here is the identification and
adaptation of suitable questions which include appropriate science subject areas that are of most
value to the South African general public within a particular social context.
4.1.5 THE SIX ELEMENTS of the SOUTH AFRICAN PUBLIC UNDERSTANDING of SCIENCE
Miller’s dimensions of scientific literacy (1987, 2004) have formed the foundation of many surveys
and, particularly in the USA, continue to inform the large NSF indicator-producing series. Having
been adapted and expanded upon by later scholars, it has been applied beyond scientific literacy,
52
See table 3.8 in Chapter 3 for list of empirical works conducted in South Africa
Stellenbosch University https://scholar.sun.ac.za

147
and also within surveys of the public understanding of science research paradigm (see:
Eurobarometer series). The underlying concerns within each research paradigm relates to public
knowledge, level of interests, access to information, public attitudes and public participation. These
elements of the South African public understanding of science, when viewed concurrently,
represents a viable model for the construction of a scientific knowledge ecosystem within which the
individual, as the basic unit of the ‘general public’ exists (see: Bronfenbrenner’s’ Ecological Systems
Theory).
Within this theoretical framework, personal development within a specific area is influenced by all
factors in the surrounding environment, at five (5) levels of varying interaction. These levels include
microsystem, mesosystem, exosystem, macrosystem and chronosystem. Each of these levels has
varying degrees of direct interaction with the individual and with each respective system element,
which influences holistic development over time (see figure 4.2).
Figure 4.2: The 6 elements of the South African Public Understanding of Science (SAPUS) in the social context
With respect to the public understanding of science, such an ecological systems approach seats the
individual, as the basic unit of the public, within a social context. This view directs the focus of
individual, and at the aggregate level, the public understanding of science as a direct consequence of
the social and environmental landscape within which individuals encounter this domain. In a country
like South Africa, with its eclectic mix of demographic sub-populations, languages, cultural and
Stellenbosch University https://scholar.sun.ac.za

148
religious influences, the impact of emerging from a segregated past cannot be under-evaluated with
respect to its impact, in turn, on the public relationship with science.
The influence of sociocultural stimuli within these demographic stratifications remains a key aspect
toward building the exploration of the South African public understanding of science from the
baseline. Ultimately, the impact the major demographic variables on the general South African
public understanding will inform the development of future models and intervention strategies (see
figure 4.3).
Figure 4.3: Conceptual framework for investigating the South African Public Understanding of Science
Each of these six elements have been operationalised using question designs reflective of the large
surveys of PUS and scientific literacy (see: NSF / EuroBarometer), however specifically adapted53 to
the South African context. Scientific knowledge questions were based on a combination of general
knowledge54 science concepts and issues identified as specifically important within contemporary
South African life. The Science Knowledge assessment includes 9 statements requiring a True, False
or Don’t Know response (e.g. Lightning never strikes the same place twice).
Attitudes to science are measured using two indices: Index of Scientific Promise and the Index of
Scientific Reservation (Shukla and Bauer, 2009). The indices combined consisted of four (4) questions
53
Where required, specific content, scientific subjects and information sources that are most relevant to the South African context will be integrated. 54
It is recognised that a higher illiteracy rate and a higher number school dropouts in SA may challenge the assumptions of adopting general knowledge science concepts – however as a competency assessment it should be acceptable for use.
Stellenbosch University https://scholar.sun.ac.za

149
relating to specific positive or negative attitudes toward science wherein respondents are provided
Agree, Disagree or Don’t Know response options. The calculation procedure of the Index of Promise
and Reservation will be discussed in a later section, however will not deviate from the accepted
practices (see: Blankley and Arnold, 1999; Reddy et al, 2009; 2013).
Interest in science was operationalised assessing 7 self-reported levels of interest in topical areas of
science. The levels of interest ranged from Interested to Not Interested and included a Don’t Know
response option. These science areas were determined through appropriate study of information
sources in South Africa (e.g.: media analysis etc.) with the same focus on localisation as with the
knowledge measures. The dimension related to Informedness in science was gauged in similar ways
to the interest items, with related design, construction, response options and analysis methodology.
An assessment of the most frequently accessed science information sources among the South
African public was designed adopting 11 key information channels and requesting respondents to
indicate the frequency of encountering science information within each of the items listed. The last
element was designed to assess the level of involvement in science engagement activities within the
preceding 12 months. This included a list of the key science engagement activities and locations in
South Africa where individuals may encounter information and dialogue within any branch of
science. These engagement activities included visits to public libraries, zoos, museums, science
centres, public talks and festivals.
These six elements of the South African public understanding of science were cross-analysed with
the corresponding demographic data toward the development of indicators of the South African
public understanding of science. As a result of its design and implementation, the survey yielded a
nationally representative sample, ensuring that these indicators could be generated at both national
and provincial level and according to gender, age, location and other socio-economic stratification
variables. The value of this proposal lies within its repeatability and, ultimately, its capability to
produce indicators at multiple levels toward providing locally relevant information that could
enhance intervention strategies.
The methods described above are discussed in greater detail below, where specific design, testing,
quality assurance and reliability assessment procedures are presented.
Stellenbosch University https://scholar.sun.ac.za

150
4.2 DEVELOPMENT of the 2015 KHAYABUS MODULE on PUBLIC UNDERSTANDING of SCIENCE
The research procedures of this study are described in this subsection and will detail the purpose,
design, development, quality assurance and fieldwork practices employed in the data collection
phase. This section covers all operational aspects of the project relating to the fieldwork
preparations, procedures and implementation of the survey module in the Khayabus survey wave 2
of 2015. The following chapter subsection will briefly discuss the data analysis procedures applied in
the application of the Khayabus survey results toward the development of indicators related analysis
to be presented in chapters five and six.
4.2.1 Why create new test items? The purpose of the Khayabus instrument module
To date, most all of the surveys on scientific literacy and the public understanding of science in South
Africa have been operationalised through the adoption of instruments, in full or in part stemming from
international studies such as the NSF or the Eurobarometer survey series. In other developing world
settings, surveys of this type have similarly incorporated well established test items to retain a sense of
international comparability and standardisation (see chapter 3). As previously discussed, many of these
test items, while considered generic and acceptable in terms of their scientific and factual accuracy,
have been discussed in multiple settings with particular reference to the concept of cultural distance of
knowledge constructs (Raza et al, 2002), language and related social factors (Zhang and Zhang, 1993).
Linked to this is the broad content area of the scientific enterprise and its relevance to the daily lives of
ordinary citizens. As a result, items historically selected have been rooted in selected scientific areas,
such as physical science or human biology (the earth revolves around the sun or antibiotics do not kill
viruses), rather than emerging fields of scientific knowledge or broader reference areas.
Within the South African setting, among the locally developed test items, Laugksch (1996) developed
472 scientific literacy test items that covered Miller’s three consecutive dimensions of scientific
literacy. With a focus on educational outcomes and scientific literacy, Laugksch generated his items
using the expected levels of knowledge high school-leaving learners are required to display upon
entering tertiary education institutions. The methods employed by Laugksch (see chapter 3)
reviewed the Project 2061 publication – Science for All Americans – and adopted selected text from
this publication to develop a pool of test items (Laugksch, 1996, 2000). These items were then
assessed by experts within the scientific domain in South Africa and a final pool of 240 key items was
produced. Following rigorous linguistic and technical quality assurance procedures, a final Test of
Basic Scientific Literacy (TBSL) was produced. The TBSL contained 110-items across three (3)
sections: the nature of science, science content knowledge and impact of science on society. The pool
of 472 test items developed by Laugksch provides a valuable base toward the development of new
Stellenbosch University https://scholar.sun.ac.za

151
survey instruments. As a result of the methods employed in their development, the meticulous
quality and technical language assurance procedures as well as the foundational grounding of the
items within the theoretical literature, this pool of test items opens a wider stream of science
subject focus areas, specific to the South African setting. However, the Laugksch test items were
developed specifically to measure scientific literacy of first-time entering university students in South
Africa based on the expected outcomes of an American education system and as a result were not
considered suitable for complete adoption in the present study. Laugkschs’ pool of test items was
however used to inform the selection and development of included test items (discussed in a later
section).
The development of the survey module for this research adopted as its base requirement an
instrument that is able to access the six identified elements of the public understanding of science.
The instrument maintained the requirement to remain linguistically-relative and appropriate to the
South African setting as well as retaining a degree of international comparability. Noting the earlier
discussed social and multicultural nature of the South African publicS, the items selected were
refined toward the development of an instrument that was applicable to a broad cross-section of the
South African publicS. The instrument was developed to measure the public understanding and
engagement with science in South Africa and includes six question-sets all relating to each of the
elements of the public understanding of science. These elements are operationalised through the
use of a questionnaire informed by previous question banks55, however selected items or item-text
were suitably adapted or replaced toward an appropriate localisation of the survey-item content.
The IPSOS Khayabus Survey56
To accurately and cost-effectively measure large numbers of individuals with respect to the subject
matter, the approach of this study was to design a module for inclusion in an omnibus survey
intended to produce a nationally representative sample of South Africans aged 18 years and older.
The specific survey identified for the operationalisation of this module was the 2015 wave 2 of the
Khayabus survey product from international research provider IPSOS57 under their Public Affairs:
Social Research division. The survey runs in 2 waves annually, covering a total of approximately58
4 000 respondents in each wave from all geographical areas, provinces, race groups, genders as well
as religious and economic population groups across South Africa.
55 See Bauer, Allum& Miller, 2007; Shukla & Bauer, 2009; Laugksch, 1996 56
The initial proposal planned to use a different omnibus survey, however as a result of cost considerations, The IPSOS Khayabus Survey was considered a more suitable product to use. 57 See http://www.ipsos.co.za/_layouts/15/start.aspx#/SitePages/Our%20Omnibus.aspx for more information 58 Exact numbers do differ slightly across survey waves and survey years.
Stellenbosch University https://scholar.sun.ac.za

152
IPSOS retains a national team of in-house, dedicated, full-time professional fieldworkers that are
entrusted to carry out the fieldwork on the Khayabus survey series. All fieldworkers attended
mandatory briefing sessions and a dedicated training session on this specific survey module, to
ensure accurate operationalisation of the survey instrument. Weekly telephonic contact sessions
with the accounts manager at IPSOS as well as with the field force team leaders ensured consistency
in the application of this module during the data collection period.
The Khayabus survey is conducted as a face-to-face survey at the respondent’s home using
Computer Assisted Personal Interviewing technology (CAPI). The CAPI system uses mobile
technology to capture results of fieldwork directly to a tablet or laptop and remotely upload the data
to a database managed by the IPSOS team. This data is then cleaned and processed toward
producing the final dataset. Overall, the survey is designed to yield a nationally representative
sample of South Africans 15 years and older59, with a margin of error of 1.63%60. The sample is
designed to include both urban and rural respondents. The metropolitan sample covered the major
metros in Johannesburg; Pretoria; Durban; Pietermaritzburg; Bloemfontein; Port Elizabeth; East
London and Cape Town. The non-metropolitan sample included areas from all nine provinces,
including deep-rural areas. The survey is designed to ensure that local customs negotiated access,
language and related key success factors are in place prior to fieldwork commencement.
All questionnaires are translated from English into Afrikaans, Zulu, Xhosa, Setswana, Northern Sotho,
and Southern Sotho by professional translators and are available in the field as per the respondent’s
preference. Fieldworkers proficient within regional language groupings were dispatched to ensure
that the data collection was consistent with the language of the instrument used. During the data
cleaning, the random iterative method (RIM) weighting was applied to account for parameters
within the South African national population and ensure proportionality across the many variables.
In order to measure the six elements discussed earlier, questions were developed for each element,
measuring scientific knowledge, attitude, interest, informedness and involvement in engagement
activities. Caution was applied to ensure the balance between a degree of international
comparability while simultaneously localising the questionnaire content sufficiently so as to
accurately measure the public understanding within the social context of science in South Africa.
Traditional questionnaire conceptualisation, construction, design and item selection procedures as
described by Blankley & Arnold (2001), Bauer & Shukla (2009) and Reddy et al, (2010) were adopted
59 For the Public Understanding of Science module, minors younger than 18 years old were excluded. 60 This will be discussed in greater detail in the next section
Stellenbosch University https://scholar.sun.ac.za
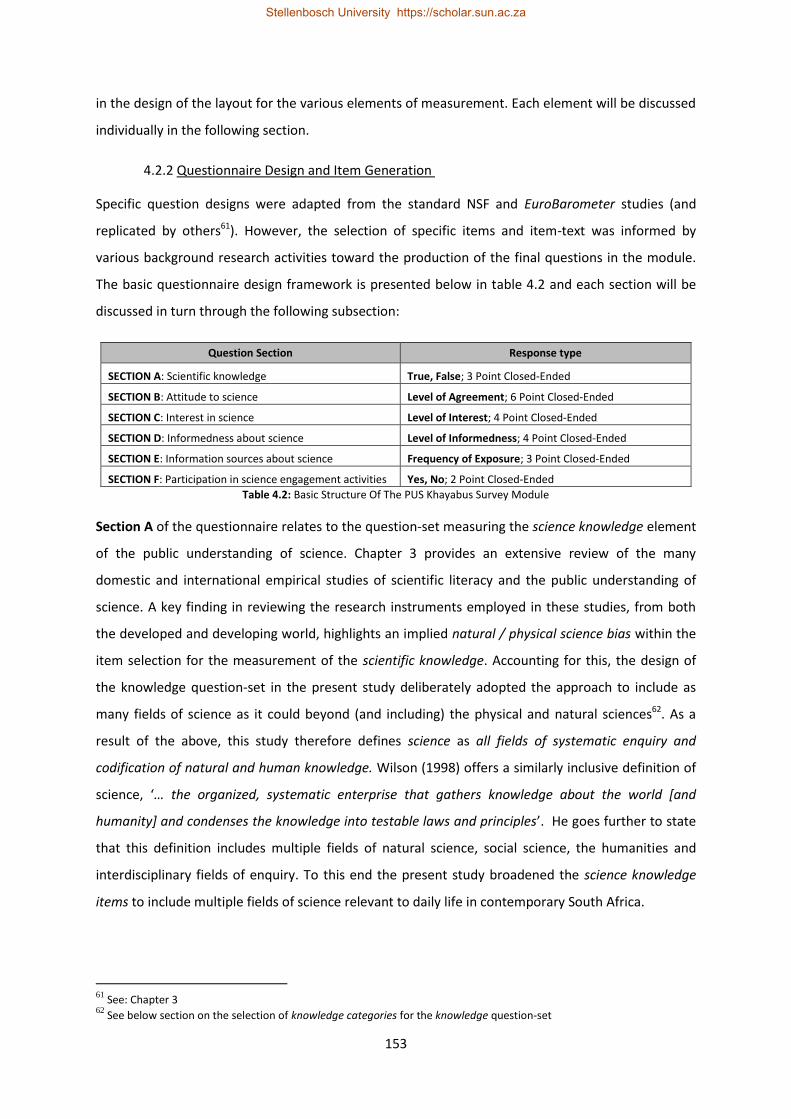
153
in the design of the layout for the various elements of measurement. Each element will be discussed
individually in the following section.
4.2.2 Questionnaire Design and Item Generation
Specific question designs were adapted from the standard NSF and EuroBarometer studies (and
replicated by others61). However, the selection of specific items and item-text was informed by
various background research activities toward the production of the final questions in the module.
The basic questionnaire design framework is presented below in table 4.2 and each section will be
discussed in turn through the following subsection:
Question Section Response type
SECTION A: Scientific knowledge True, False; 3 Point Closed-Ended
SECTION B: Attitude to science Level of Agreement; 6 Point Closed-Ended
SECTION C: Interest in science Level of Interest; 4 Point Closed-Ended
SECTION D: Informedness about science Level of Informedness; 4 Point Closed-Ended
SECTION E: Information sources about science Frequency of Exposure; 3 Point Closed-Ended
SECTION F: Participation in science engagement activities Yes, No; 2 Point Closed-Ended
Table 4.2: Basic Structure Of The PUS Khayabus Survey Module
Section A of the questionnaire relates to the question-set measuring the science knowledge element
of the public understanding of science. Chapter 3 provides an extensive review of the many
domestic and international empirical studies of scientific literacy and the public understanding of
science. A key finding in reviewing the research instruments employed in these studies, from both
the developed and developing world, highlights an implied natural / physical science bias within the
item selection for the measurement of the scientific knowledge. Accounting for this, the design of
the knowledge question-set in the present study deliberately adopted the approach to include as
many fields of science as it could beyond (and including) the physical and natural sciences62. As a
result of the above, this study therefore defines science as all fields of systematic enquiry and
codification of natural and human knowledge. Wilson (1998) offers a similarly inclusive definition of
science, ‘… the organized, systematic enterprise that gathers knowledge about the world [and
humanity] and condenses the knowledge into testable laws and principles’. He goes further to state
that this definition includes multiple fields of natural science, social science, the humanities and
interdisciplinary fields of enquiry. To this end the present study broadened the science knowledge
items to include multiple fields of science relevant to daily life in contemporary South Africa.
61
See: Chapter 3 62
See below section on the selection of knowledge categories for the knowledge question-set
Stellenbosch University https://scholar.sun.ac.za

154
The question-set investigating scientific knowledge comprises nine (9) statements requiring
respondents to indicate a single True or False response. While a third, Don’t Know option is
provided, it is not read out to respondents63.
The number of statements in these knowledge assessment tests has differed in various studies;
more interestingly, the subject areas covered similarly adopt a general pattern of science subject
areas. As an example, in South Africa, Blankley & Arnold in 2001 included five items in this question,
with subjects ranging from biology, physics, astronomy, anthropology and medical science. Shukla &
Bauer (2009), in comparing Indian and European data, included items from varied science subject
areas: medical (x 2), astronomy (x 2), geology (x 2), biology, physics and anthropology. Similarly,
Reddy et al (2010) have, in their SASAS (South African Social Attitudes Survey) module, adopted six
knowledge items that included subject area categories from: medical science, astronomy, geology,
biology, physics and anthropology. In reviewing these subject areas, and comparing these against
data for South Africans’ self-reported interests in scientific areas64 a disconnect emerged between
the assessment of knowledge areas, and the actual self-reported scientific interest areas of the
South African public.
In order to align the knowledge assessment with actual South African self-reported science interest
areas, item-subject categories65 were constructed to match these interest areas. In reviewing
responses to questions on interest in science from earlier SASAS studies, item-subject categories
were identified for the knowledge question. This approach was adopted in order to ensure that
knowledge assessment is in line with actual South African public interest in science, toward a more
representative assessment of scientific knowledge within the South African publics. Interest areas
and item-subject categories were then assessed for selected surveys of public understanding of
science for the period 2001 – 2010. The frequency of item-subject categories and interest areas in
these studies informed the final selection of the subject categories to be used in the present study.
The subject categories were then later populated with item-text relevant to each of the science
subjects areas selected (see figure 4.4).
63
Dolnicar & Rossiter (2009) note the importance of the don’t know option in opinion surveys, particularly the non- verbalised D/K options produces more reliable data than excluding the D/K option from the response group entirely. 64
Most recent see Reddy et al (2010) 65
Actual items will be discussed later – here the author refers only to science knowledge subject categories
Stellenbosch University https://scholar.sun.ac.za

155
Figure 4.4: The development of Knowledge categories for inclusion in current study
The science knowledge subject area categories selected includes physical science – astronomy &
earth science; biology - medical science; social science – economics, psychology & history as well as a
multidisciplinary area of information & communication technology. These areas were selected to
ensure coverage of the major fields of science as well as broadening the conceptual definition of
science knowledge assessment within this research.
Actual survey item texts were then adopted adapted or developed specifically toward populating
each of the previously identified knowledge subject areas. Key sources of item text were Pouris
(1991, 1993), Blankley and Arnold (2001), the Laugksch (1996) pool of test items (discussed earlier),
surveys by Shukla & Bauer (2009) as well as Reddy et al (2010) in addition to the NSF and
EuroBarometer survey series items.
# Source Knowledge Area Science Subject Area Category
1 RL Social and economic factors influence technological development within countries SOCIAL SCIENCE - ECONOMICS
2 RL The continents which we live on are continually moving due to forces deep within the Earth
PHYSICS - GEOLOGY
3 RL Ideas about good mental health vary across different cultures SOCIAL SCIENCE - PSYCHOLOGY
4 RL The earth's climate has not changed over millions of years EARTH SCIENCE - CLIMATE CHANGE
5 SP The Internet is a global system of interconnected devices sharing information and content
MULTIDISCIPLINARY - ICT
6 SP In the majority of cases, HIV causes AIDS in humans BIOLOGY - MEDICAL
7 SP The Square Kilometre Array Radio Telescope will be jointly hosted by South Africa and Australia
ASTRONOMY - SKA
8 SP South Africa was the first nation in the world to voluntarily dismantle its nuclear weapons
SOCIAL SCIENCE - HISTORY
9 SP Schizophrenia is the same thing as Multiple Personality disorder SOCIAL SCIENCE - PSYCHOLOGY
10
SP Lightning never strikes the same place twice PHYSICS - ELECTRICITY
11
SP The main purpose of the Square Kilometre Array (SKA) radio telescopes is to search for extra-terrestrial life
ASTRONOMY - SKA
12
SP The price of petrol in South Africa is not influenced by the price of crude oil SOCIAL SCIENCE - ECONOMICS
13
SP/S&B The father carries the genetic material that will determine if a baby is a boy or a girl BIOLOGY - MEDICAL
14
SP/RL Mobile technology has no influence on the nature of human society MULTIDISCIPLINARY - ICT
15
SP/RL Human activity has no impact on the Earth's land, oceans and atmosphere EARTH SCIENCE - CLIMATE CHANGE
Table 4.3: Revised list of 15 potential knowledge area assessment items
Stellenbosch University https://scholar.sun.ac.za

156
A selection of 25 items from across all of the identified subject knowledge areas was then identified.
After consultation with the project supervisor and other subject area experts66, the list of potential
items was reduced to 15 items (see table 4.3). From the above list of 15 potential test items, items 1-
4 were adopted without edits from the previous work of Professor Laugksch (1996). Items 13-15
were adapted from those used in earlier studies; in particular, item 13 was adapted from Shukla and
Bauer (2009), while items 14 and 15 are edited forms of items from Laugksch (1996). Items 5-12
were specifically developed for this study based on the particular knowledge subject area. Experts
within relevant fields were consulted who verified the factual foundation of the statements
created67.
The revised list in table 4.4 was then further refined through a series of revisions68 and field tests,
while the reduced item selection emerged following the completion of the pilot testing phase69 to
yield a final selection of nine (9) items to be included in this section of the survey instrument. The
science knowledge question-set in the current study is presented below:
Source Knowledge Area TRUE FALSE D/K
SP In the majority of cases, HIV causes AIDS in humans 1 2 8
SP Lightning never strikes the same place twice 1 2 8
SP South Africa was the first nation in the world to voluntarily dismantle its nuclear weapons 1 2 8
RL The continents which we live on are continually moving due to forces deep within the Earth 1 2 8
SP The price of petrol in South Africa is NOT influenced by the price of crude oil 1 2 8
SP Schizophrenia is the same as Multiple Personality Disorder 1 2 8
SP / S&B The father carries the genetic material that will determine if a baby is a boy or a girl 1 2 8
RL The earth's climate has NOT changed over millions of years 1 2 8
SP The main purpose of the Square Kilometre Array (SKA) radio telescopes is to search for extra-terrestrial life 1 2 8
Table 4.4: Knowledge Assessment question from current 2015 Khayabus survey module
The above question contains nine (9) statements with reference to basic science knowledge areas
that have been developed, adopted and (or) adapted into the identified subject-interest categories
discussed previously. Of the nine (9) items, two (2) are adopted directly from the Laugksch pool of
test items, while a single item was edited70 from the question-set used by Shukla and Bauer (2009).
The rest of the questions in the final selection were developed for this study by the author71. All the
items were configured to be as simple as possible while addressing basic-science concepts applicable
to daily life in South Africa. Many of these items have a high visibility in the media and have been
66
Dr Moses Sithole at the HSRC and the written work of Professor Rudiger Laugksch at UCT 67
Example: Item 11 was developed and confirmed by Mr Angus Flowers - Science Communications Officer at the SKA.
Similarly Item 12 was developed and confirmed by a team of economists at the head office of a major fuel retailer 68
With the research supervisor – Professor Mouton 69
To be discussed in later section 70
Original text: the newborn baby is a boy or a girl depends on his / her father. Revision by author for current study 71
It must however be noted that the development may have been influenced partially by questions in earlier studies
Stellenbosch University https://scholar.sun.ac.za

157
carefully constructed to still allow for some international comparability while providing a more
accurate assessment of South African public science knowledge in an expanded selection of science
areas.
Section B includes questions investigating the element of attitudes to science. The Index of Promise
and Reservation is a measurement that studies attitudes toward science. Respondents who have a
strong belief in the promise of science are less likely to be wary about any potential adverse impacts
of science. Conversely, respondents who report a greater association with the reservation
statements are less likely to acknowledge potential benefits from scientific advances (Nisbetet al,
2002).
An assessment of empirical work conducted in South Africa and internationally over the last 20 years
(see Chapter 3) has revealed that the basic design and layout of the index of Promise and
Reservation have remained relatively unchanged within this time. To this end the questions adopted
in the present study were minimally edited to conform to the statistical procedures required in later
applications as well as to allow for international comparability.
# Attitudinal Statement STRONGLY
AGREE AGREE
NEITHER AGREE OR DISAGREE
DISAGREE STRONGLY DISAGREE
D/K
P 1 Science and technology are making our lives healthier, easier and more comfortable
1 2 3 4 5 8
R 2 It is not important for me to know about science in my daily life
1 2 3 4 5 8
P 3 Thanks to science and technology, there will be more opportunities for the future generation
1 2 3 4 5 8
R 4 The application of science and new technology makes our way of life change too fast
1 2 3 4 5 8
Table 4.5: Attitudinal Assessment question from current 2015 Khayabus survey module
While some attitude scales measuring scientific Promise and Reservation use seven (7) or more
statements72, the current study employs a version developed by Shukla and Bauer (2009) wherein
attitudes to science are measured using four (4) items along a 5-point scale (and an unread Don’t
Know option). Bann and Schwerin (2004) developed short forms for the measurement of the public
understanding of science, and in particular, the assessment of scientific promise and reservation. In
their analysis73 they compared the results from their investigations and report that traditional long
forms (a 7-item version) do not differ significantly from the results achieved using the short forms (a
72
See Reddy et al, 2010 73
Using exploratory factor analysis, stepwise regression and correlation analysis
Stellenbosch University https://scholar.sun.ac.za

158
4- item version). As a result, the final Items and design of Section B: attitude to science question was
adopted based on their finding (2004).
Among the four (4) questionnaire items selected, item 1 and item 3 each carry a message of
scientific promise while item 2 and item 4 carry messages of scientific reservation. It is important to
note that item 2 was replaced on the current item list as a result of the findings74 during the review
session as well as the pilot process. Attitudes were assessed using a 5-point scale of relative
agreement to the statement, per question row. A don’t know (D/K) option was provided, but not
read out to the respondent.
Items 1 and Item 3 have been adopted directly from Shukla & Bauer’s 2009 work, while item 2 was
adapted from the findings of Bann and Schwerin (2004). The last question in the attitude section
was adapted and edited from the original work of Shukla & Bauer (2009).
Section C of the survey module covers aspects related to specific interest in science. Section D
(Informedness) adopts a parallel question construction and item text and will be addressed
simultaneously. Items for the Interest (table 4.6) and Informedness (table 4.7) questions were
derived from reviewing results from the most recent SASAS series data (Reddy et al, 2013). Of the
total of seven (7) items, four (4) were included following a review of actual reported interest in
science in earlier studies, while three (3) were developed by the author after reviewing subject area
categories of science in the South African social context75.
INTEREST AREA VERY
interested MODERATELY
interested NO
interest D/K
Medical Science 1 2 3 8
Climate Change 1 2 3 8
Technology and the Internet 1 2 3 8
Politics 1 2 3 8
Economics 1 2 3 8
Astronomy 1 2 3 8
Energy 1 2 3 8
Table 4.6: Interest in scientific fields question from current 2015 Khayabus survey module
INFORMEDNESS AREA VERY well informed
MODERATELY well informed
NOT well informed
D/K
Medical Science 1 2 3 8
Climate Change 1 2 3 8
Technology and the Internet 1 2 3 8
Politics 1 2 3 8
Economics 1 2 3 8
Astronomy 1 2 3 8
Energy 1 2 3 8
Table 4.7 Informedness about science question from current 2015 Khayabus survey module
74
The original item “Science is constantly changing and information is always updated” was considered too neutral 75
Areas of notable social interest and relevance from media review and review of previous empirical work
Stellenbosch University https://scholar.sun.ac.za

159
The questions above, that are related to the measurement elements of Interest and Informedness,
have been constructed as a 7-item, 3-option, close-ended single-response question. Further to
establishing the interest in science for a South African sample, it will then be possible to compare the
self-reported Informedness76 measures toward gaining further understanding of the conceptual
distance between interest and Informedness in South Africa. The scientific categories selected
represent a view of science in the widest possible frame. These include the physical, natural and the
social sciences, including politics and economics. The categories by no means represent the most
comprehensive list of scientific fields, but are related to the subject knowledge areas following a
review of empirical work discussed earlier. Within this list, astronomy and medical science include
elements related to space and medical innovation, while climate change relates to multiple fields of
science studying climate change, human and natural processes. The category for technology and the
internet includes all aspects of ICT advancement as well as technological innovation related to
mobile technology, while energy includes all aspects related to the energy mix in contemporary
South Africa. Respondents were asked to indicate their level of interest or informedness (in
Section D) in each of the seven categories, using the 3-point scale.
Section E of the questionnaire focuses attention on the sources of scientific information among the
South African population. Whilst data of this type is available within large market research surveys
such as the All Media and Products Survey (South African Audience Research Foundation – AMPS) –
relating it back to specific attitudes to science as well as the measures of scientific knowledge –
interest and Informedness remains impossible with AMPS data77.
INFORMATION SOURCE Most
Frequently Frequently
Least Frequently
Satellite Pay Television (DsTV, TopTv) 1 2 3
Free-to-Air Television (SABC / e.tv) 1 2 3
Radio 1 2 3
Newspapers 1 2 3
News Websites 1 2 3
Institutional Websites (University / Research Lab) 1 2 3
Government Announcements 1 2 3
Blogs 1 2 3
Social media (Facebook, Twitter) 1 2 3
Other people (Family, Friends, Colleagues) 1 2 3
Books / Magazines 1 2 3 Table 4.8: Information sources about science question from current 2015 Khayabus survey module
The items in the above list represent the 11 most commonly used science information channels
accessed in South Africa. While this list contains fewer information formats, the information channel
76
Informedness refers to how informed a respondent feels in relation to particular fields of science 77
Largely due to the limitation of SAARF-AMPS data that does not investigate science engagement activities
Stellenbosch University https://scholar.sun.ac.za

160
is of most interest within this question as it differentiates the various information sources to best
understand scientific information acquisition beyond technological penetration. The differentiation
between pay-television and free-to-air broadcasters as well as the distinction made between
institutional, news, government, blog websites and social media is of primary importance in the
construction of this question. This is a notable advancement on previous studies on the public
understanding of science in South Africa, as earlier studies had amalgamated all online media
content into a category called ‘the internet’ and television as an information source had not
previously been segmented into pay tv and free-to-air stations. The selected items provide a high-
definition view of South Africans’ science media consumption habits as well as the potential for
targeted segmentation of the many publicS in South Africa. Similar to Section D, in Section E
respondents are asked to indicate how frequently they encounter information about science for
each of the 11 information channel categories, using a 3-point scale related to frequency.
Section F requests information from respondents relating to how frequently they may have
encountered or attended science engagement activities, within the preceding 12-month period.
While many of these would ordinarily not be considered science engagement activities by general
members of the public, the questions allow for an assessment of attentiveness to science within the
reference period by participating respondents.
SCIENCE ENGAGEMENT ACTIVITIES YES NO
Public Library 1 2
Zoo or Aquarium 1 2
Museum (any) 1 2
Science Centre, Technology exhibition 1 2
Science Fair, Festival or similar Public Event 1 2
Table 4.9: Science Engagement activities question from current 2015 Khayabus survey module
4.2.3 Quality Assurance: Questionnaire Testing and Pilot Procedures
Chapter 3 outlines an extensive review of the literature stemming from the study of scientific
literacy and the public understanding of science. Reviewing the research instruments employed in
those studies, the design and construction of the present research instrument is greatly influenced
on those foundations. As such, the quality assurance methods employed in the initial development
of specific item-text within the current research instrument borrows from the processes employed
by the authors of the source material78. Throughout the development of the research instrument as
well as its constituent parts and items, considerations of validity and reliability informed each step of
the formulation process. In the review of the literature as well as the development of the six
78 See specifically: Pouris : 1991, 1993; Laugksch, 1996; Blankley & Arnold, 2001; Shukla & Bauer, 2009; Reddy et al, 2010, among others NSF (USA); EuroBarometer (EU); CAST (China); HSRC (South Africa); MOSTI (Malaysia)
Stellenbosch University https://scholar.sun.ac.za

161
elements of PUS and the construction of the research instrument, the inclusion of all the elements
that are understood to influence the South African public understanding of science was considered
of paramount importance. While limitations such as the length of the questionnaire and the
associated cost considerations of running a nationally representative survey were present, all six
elements have been included within the 6-part research instrument. All the items adopted or edited
from previous surveys have been validated and shown empirically to possess a high-degree of
reliability and validity 24. Similarly, items developed for this study have been based on the design
and structure of items that have appeared in previously mentioned studies79.
The research instrument underwent an iterative 4-stage quality assurance process. The initial phase
was in the development of the questionnaire sections and items, built on the foundations of
previously undertaken rigorous research within this domain, adopted the same or structurally
equivalent questionnaire items. The questionnaire items in their pre-final format were quality
checked by the research supervisor prior to the instrument entering phase 2. Professional colleagues
28 in the domain of STI studies were consulted and requested to further review and assist in refining
the items to be included in the research instrument. Feedback from this initial review was collated
and incorporated (where appropriate80). Phase 3 involved preliminary field trials and later pilot
testing the questionnaire, while Phase 4 involves the iterative step of review by the research
supervisor and final approval of the research instrument.
Field trials were conducted with individual question-sections and not the entire questionnaire. This
was done to obtain feedback on each question-section and section items prior to incorporating all
sections in the final research instrument. Each section of the questionnaire underwent five field
trials with randomly selected respondents within the City of Cape Town. Feedback from the field
trials were recorded and later incorporated into the instrument (where appropriate26). Following the
initial field trials, Version 0.1 of the research instrument was produced and reviewed by the research
supervisor.
The design of the questionnaire includes six (6) sections; Section B, C, D, E and F received a positive
response in field trials and were approved for inclusion by the research supervisor. Section A (science
knowledge areas) initially included 25 items which, through a collaborative review process with the
research supervisor81, was reduced to include 15 items. These items were then to be considered
79 While the specific item text may vary, the design, structure, validation and testing methods have been replicated on a smaller scale in the present study 80 Where suggested edits included elements that lengthened or structurally changed the questionnaire these could not be accommodated because of cost considerations. 81
Mostly due to suitability and quality reasons. As an example the item: “The use of mobile telephones could be hazardous to human health” was removed for quality reasons.
Stellenbosch University https://scholar.sun.ac.za

162
during a pilot, in order to select the most appropriate items for the final research instrument. The
pilot study for this research was conducted using both online and face-to-face methods to increase
the number of responses toward making the final item selections and refining the research
instrument.
The face-to-face pilot was conducted in Cape Town, during June 2015, with the support of colleagues
at the HSRC82. The face-to-face pilot yielded 100 responses from interviews conducted in
respondents’ homes, and lasted, on average, 25 minutes. The longest of these pilot interviews lasted
35 minutes and the shortest was 19 minutes. Respondents were from all population groups,
genders, age cohorts and a variety of socio-economic/geographical locations in Cape Town83. The
online pilot was run simultaneously (during June 2015) by developing a web-based form that
replicated the research instrument (see image 4.1). The form was launched and its URL link was
shared on the author’s personal social media platforms84.
Image 4.1: Screenshot of the online pilot web form
As is the nature of social media, the URL links were retweeted and reposted multiple times over a
short period and as the survey had an automated close-off at 120 responses, the pilot was
completed in two (2) days following the launch. The data was cleaned and all invalid responses85
82
See acknowledgements section for individual names 83
The selection of the respondents in the pilot was convenience-based or of those within social media networks and thus was not representative. 84
Social media platforms used included Facebook, Twitter, Whatsap and Linked in 85
Here I include responses from outside the borders of South Africa, incomplete and spoilt responses – 2 respondents clicked multiple age and population groups.
Stellenbosch University https://scholar.sun.ac.za

163
were removed prior to analysing the results separately – for each online and face-to-face –
producing a dataset of 200 pilot responses.
GENDER POPULATION GROUP AGE GROUP
FEMALE 53.0% AFRICAN 12.5% 18-30 46.5%
COLOURED 40.0% 31-50 45.0%
MALE 47.0% INDIAN 43.5% 51-60 4.5%
WHITE 4.0% 60+ 4.0%
Table 4.10: Demographic characteristics of combined pilot sample (N=200)
While it was known that both pilots would not produce representative data, the results nonetheless
influenced the final item selection for Section A of the research instrument. Following review of the
data and the identification of the items offering the greatest discriminatory value within the 15 test
items piloted, a 9-item list (Table 4.4) was selected for inclusion in the questionnaire. The research
instrument (Version 1.0) was then checked for consistency, and the language edited and tested by
senior researchers at the Centre for Science, Technology and Innovation Indicators (CeSTII) at the
Human Sciences Research Council. The final version of the instrument was then approved by the
research supervisor and is presented appendix A. The final instrument composition and number of
items is presented in Table 4.11 below.
Question Number of Items
SECTION A: Knowledge 9
SECTION B: Attitude 4
SECTION C: Interest 7
SECTION D: Informedness 7
SECTION E: Information sources 11
SECTION F: Engagement Activities 5
TOTAL NUMBER OF ITEMS 43
Table 4.11: Final research instrument section and item counts
4.2.4 Ethical Clearance Procedure
The proposal for this research project was completed on 22 September 2011 and an application for
PhD project acceptance was made to the University of Stellenbosch Senate Committee. In formal
communication dated 25 November 2011, the Senate Committee advised that it had accepted the
research proposal and that work on the development and implementation could proceed (see
appendix A).
In addition to the Senate Committee approval, prior to fieldwork operations, the University of
Stellenbosch required that all research involving human subjects undergo ethical review to ensure
that the procedures employed in any research associated with the University was within the
regulations of the University as well as internationally accepted ethical guidelines and practices. The
Stellenbosch University https://scholar.sun.ac.za

164
application process was completed online, with all supporting documentation, and is not dissimilar
to any other ethics clearance procedure86.
Following review, and a single round of feedback from the committee, upon receiving the author’s
response to questions raised by the Committee, all matters were finalised and final approval for
fieldwork to commence was issued by the Committee on 18 August 2015 (see appendix A).
4.2.5 Fieldwork Procedures
As a result of the size and scope of this project, requiring the rollout of a nationally representative
survey covering all nine (9) provinces, 11 language and cultural groups; logistical assistance was
required toward implementing the fieldwork component of the research project. It must be noted
that all conceptualisation, design, planning as well as data analysis and reporting was completed by
the author87, while the implementation of the fieldwork, only, was commissioned to the fieldwork
company. Through the generous support of the research supervisor and the Centre for Research on
Evaluation, Science and Technology (CREST-University of Stellenbosch), the enormous costs of
commissioning the fieldwork component of this study were covered88.
Following the completion of the research instrument; endorsement by the research supervisor and
the approval by the University of Stellenbosch Ethics Committee, the clearance to commence
fieldwork was communicated to the fieldwork team. Fieldwork operations were then planned and
clearance was provided to IPSOS to proceed with data collection. The timelines and major
deliverables for this project are detailed below (Table 4.12).
SIGN OFF ON SURVEY QUESTIONNAIRE FINALISED FIELDWORK START FIELDWORK ENDS DELIVERY OF RESULTS
23 August 2015 6 September 2015 22 September 2015 1 November 2015 22 November 2015
Table 4.12: Fieldwork timeline and data delivery schedule
The research instrument was dispatched to IPSOS, wherein minor formatting changes were made to
ensure that the questionnaire module is compatible with the CAPI system. These minor changes did
not impact the questionnaire items, but are related to aesthetic and technical fieldwork notes so as
to conform to the Khayabus survey format89. Following review of the questionnaire updates90, the
questionnaire was considered final for the implementation of the fieldwork phase within the
Khayabus survey Wave 2 of 2015. The questionnaire was then translated from English into Afrikaans,
86
Full procedure, application forms and evidence of approval outcome are available in appendix A 87
With support from the research supervisor 88
Detailed timelines, costing and funding support information is found in appendix A 89
Included inserting interviewer notes, pronunciation of selected words and related fieldworker notes – see appendix A 90
by the author
Stellenbosch University https://scholar.sun.ac.za

165
Zulu, Xhosa, Setswana, Northern Sotho, and Southern Sotho by professional translators and loaded
onto the CAPI system.
Fieldwork for the Khayabus survey was scheduled to last five (5) weeks, from 22 September 2015 to
01 November 2015. A compulsory national fieldworker briefing was held at the Cape Town offices of
IPSOS and broadcast nationally to other venues via video conference to ensure attendance by all
fieldworkers working on the project. During the briefing all fieldworkers were provided with an
introduction to the purpose, value and importance of the planned research by the author. Following
this the fieldworkers were led through each question-set and response items in the public
understanding of science questionnaire module. This was done to ensure that all fieldworkers were
familiar with all concepts and pronunciation of items as well as making them aware of the intended
use of the data to encourage reliable and accurate fieldwork data recording. Fieldworkers further
had an opportunity to raise any questions about the module, its components or questionnaire items,
with no significant matters raised by the group. The contact details of both the account manager at
IPSOS and the author were made available to all fieldworkers to address any questions received
from the field.
The Khayabus survey operates as an omnibus survey and six (6) confidential modules were run
simultaneously in field. IPSOS ran its own pilot process in which the entire questionnaire and all
modules were tested together in order to ensure that no negative impacts were recorded as a result
of all modules being combined in a single questionnaire, and to confirm that the translated versions
were suitable for the fieldwork phase. This was completed with a satisfactory result and fieldwork
was commenced on 22 September 2015.
Sampling for the Khayabus survey was completed concurrently by IPSOS, using stratified probability
sampling techniques and weighting methods91. All adults in South Africa (aged 15 years and older92)
were considered to be part of the sample selection process. A final sample of 4 123 was identified
and later weighted to reflect a national population profile totalling to 37 800 00093. Sampling
followed a 3-stage selection process starting with the selection of the primary sampling units (PSU’s)
from within the 2011 South African National Census data. Primary sampling units were selected
through a process of stratification and only residential dwellings were considered during the initial
sampling step. Step 2 involved the sampling of households within the PSU’s using GIS tools and aerial
photography to identify the housing units to visit in the fieldwork period. Fieldworkers selected the
91
As this was an omnibus the author was not involved in the sampling, but did received a detailed briefing on the methods employed for reporting purposes 92
Though this age cut off was set to 18 years and older for the present module on Public Understanding of Science 93
Total national population above 15 years old (see StatsSA population statistics 2014-2015)
Stellenbosch University https://scholar.sun.ac.za

166
interview home unit location through the inclusion of every third home within the PSU walking plan
for interviewers. All fieldworkers were suitably experienced and trained in the methodologies and
appropriate sampling processes for different measurement-locations within the survey (metro,
villages, and rural settlements). The third stage of the sample selection process involved using a grid-
based system to identify the living unit and the individual that will be invited to complete the
survey94.
The fieldwork interview process involves welcoming and advising the respondent as to the purpose
of the interview as well as the intended use of the survey data. They are further advised of the
approximate duration of the interview followed by the recording of select personal information of
the respondent. All respondents were further advised that participation was voluntary and all
responses would remain anonymous and confidential. The personal contact information is not
associated with a particular CAPI response in the survey, but is retained as a separate record for the
quality assurance practice of back-checks95. Following the initial demographic questions,
fieldworkers then proceeded to facilitate the respondents through the various questions and
modules of the Khayabus survey questionnaire. Upon completion of the survey questionnaire
requirements, respondents were offered a non-cash token of appreciation for their time and
willingness to participate in the study96.
After completing the interview, the fieldworker completes control questions, such as the time of day
and related quality assurance measures following which the data would be synchronised with a
remote database and transmitted via a mobile data connection to the IPSOS network. Data is
constantly quality checked and where required updated to the fieldwork team leaders for quality
enhancement. Once fieldwork closed off, the data was then cleaned and issued to this research
project for analysis and reporting.
4.3 DATA OUTPUTS and INDICATORS of the SOUTH AFRICAN PUBLIC UNDERSTANDING OF SCIENCE
4.3.1 INDICATORS of THE SOUTH AFRICAN PUBLIC UNDERSTANDING of SCIENCE
A key output from this research is the development and presentation of a new set of indicators to
further understand the various elements contributing to the overall South African public
understanding of science (SAPUS).
94
Where contact with the identified person was unsuccessful after 3 attempts, a substitution process could be followed. 95
20% of responses are confirmed through telephonic back-checks to the field, but not shared with the client (the author) 96
The specific non-cash token was a nylon sling bag – approximate bulk order value $0.60 (USA) per unit
Stellenbosch University https://scholar.sun.ac.za

167
Chapter five presents the results delineated in response to each of the primary research questions
discussed in Chapter One:
1) What is the Current South African Public understanding of Science (SAPUS)?
c. What is the level of Scientific Knowledge?
d. What attitudes are held by South Africans regarding Science?
e. How interested and informed are South Africans about Science?
f. What are the main information Sources regarding Science?
g. Which are the most frequented Science Engagement activities in South Africa?
Each of the sub questions will in turn then be cross-analysed with various demographic categories in
an effort to understand the key drivers within each PUS element within the contemporary South
African publicS.
As such, Chapter Six responds to the secondary research question presented below:
2) What predictor variables best explain SAPUS scores?
i. How do SAPUS scores vary according to various demographic segments?
ii. Which demographic variables show predictive value in explaining SAPUS scores?
In Chapter Six results from the Khayabus survey are used to present the set of six (6) indicators
developed from within the data outputs from each question set. These results are further
disaggregated by various demographic classifications demonstrating its value and application to this
research area within the South African landscape.
The science knowledge index produced an indicator consisting of three (3) points, classifying
respondents’ as demonstrating a level of knowledge ranging from low scientific knowledge,
moderate scientific knowledge or high scientific knowledge. This index adopts the sum knowledge
score achieved across all nine (9) items by each respondent and through an empirically driven
classification system (to be discussed in chapter six), to categorise respondents within one of the
index levels.
The index of attitudes to science adopts the respondents’ scores obtained through a recoding
process to classify respondents within one of three (3) attitudinal classifications (to be discussed in
Chapter Six). This index has been designed to classify respondents as possessing either a negative
attitude to science, ambivalent attitude to science or a positive attitude to science. This indicator
similarly adopts the sum attitudinal score achieved by individual respondents across all four (4)
Stellenbosch University https://scholar.sun.ac.za

168
attitudinal items, and classifies respondents accordingly, based on score realised. The result for each
respondent is then aggregated to obtain an overall national result within the index of attitudes to
science.
The individual result for each respondent on the interest and informedness question set will be
recoded and a score obtained for each valid response97. These scores will be used within the
development of an Index of Interest in Science as well as Index of Informedness about Science. These
two indices share much in their development, validation and outputs and are addressed collectively
despite their independent outputs and contribution to this work. Both indices will output three (3)
levels within each respective indicator. The Index of Interest in Science will classify respondents
based on their individual sum interest score as either possessing a low interest in science;
a moderate interest in science or as having a high interest in science. Similarly, the Index of
Informedness about Science will classify respondents based on their individual sum informedness
score as either possessing a low informedness in science; a moderate informedness in science or a
high informedness in science. Each index, its development and validation will be presented
independently in Chapter Six.
The responses within the science information source items in the questionnaire will be used in the
development of a (scientific) information immersion Index. This index will present the results of
respondent selection within the questionnaire categories98 to produce a sum information immersion
score for each respondent. This sum information immersion score is constituted by the respondent
selections of both count and frequency of exposure to varying science information sources. This
score will then be used within a classification system (to be discussed in Chapter Six), to classify
respondents within one of the index levels. The information immersion Index will classify
respondents as either possessing a low (scientific) information immersion; a moderate (scientific)
information immersion or as having a high (scientific) information immersion. As with the other
indices, the results produced herein will be presented for the national sample as well as for selected
demographic cohorts.
The index of science engagement adopts an average sum engagement score comprised of the
respondent selections across the five questionnaire items99. The sum engagement score represents a
count of engagement activities attended by individual respondents within the preceding 12-month
period. The sum engagement score is then used to classify respondents as either demonstrating a
low level of science engagement; a moderate level of science engagement or a high level of science
97
This will exclude no interest selections 98
On a recoded response variable – highest code (3) = most frequent, lowest code (1) = least frequent. D/K = 0 99
This index presents attendance selections only and does not take NO selections into account.
Stellenbosch University https://scholar.sun.ac.za

169
engagement. The specific development and validation of this index will be addressed within the later
chapters along with the results for overall and various sub-samples.
Chapter 6 will further include the result of the multinomial logistic regression analysis that will
highlight the influence of the various demographic variables on respondents’ performance within
each index. The contribution of this analysis will result in the development of models to explain the
influence of selected demographic variables as predictors of performance within each index result.
The relative goodness of fit as well as related assessment measures of the models produced will be
presented and discussed within the concluding sections of chapter six. The results of this research
are now presented in the following chapters.
Stellenbosch University https://scholar.sun.ac.za

170
Chapter Five
Descriptive Survey Results:
Scientific Knowledge Assessment
We live in a society exquisitely dependent on science and technology, in which hardly anyone knows anything about science and technology.
Carl Sagan (1990)
Introduction
The next six chapters present the results and key findings on the six areas included in the survey.
These six areas address the following research questions:
1) What is the level of scientific knowledge among the South African public?
2) What attitudes are held by South Africans regarding science?
3) How interested are South Africans about science?
4) How informed are South Africans about science?
5) What are the main science information sources for South Africans?
6) Which are the most frequented science engagement activities among South Africans?
Further to these headline results, data on various demographic classifications was also collected
within the Khayabus Survey which will provide further insight into the results by allowing the data to
be viewed through various socially constructed lenses. These demographic classifications do not
always demonstrate an independent relationship between variables, but display multiple levels of
interactions between demographic variables. Further to this, these demographic variables continue
to display the many legacy impacts of apartheid and this impact does manifest within the data
analysis100. The most salient demographic classifications were selected, including race101, age,
gender, language, educational attainment, household income as well as geographic location.
The following six chapters present the main results and findings per area. In order to ensure the
reliability and validity of these results, a set of rigorous reliability analyses were conducted for each
set of items. The results of the reliability analyses are found in Appendices 2 to 7 (Page 410 - 442).
100
This is particularly visible for Race, Gender, Employment status, Income and Education 101
While the term “population group” and “race” are at times used interchangeably in South Africa, within this document,
the term “race” is adopted as it is consistent with the official terminology used by Statistics South Africa (StatsSA)
Stellenbosch University https://scholar.sun.ac.za
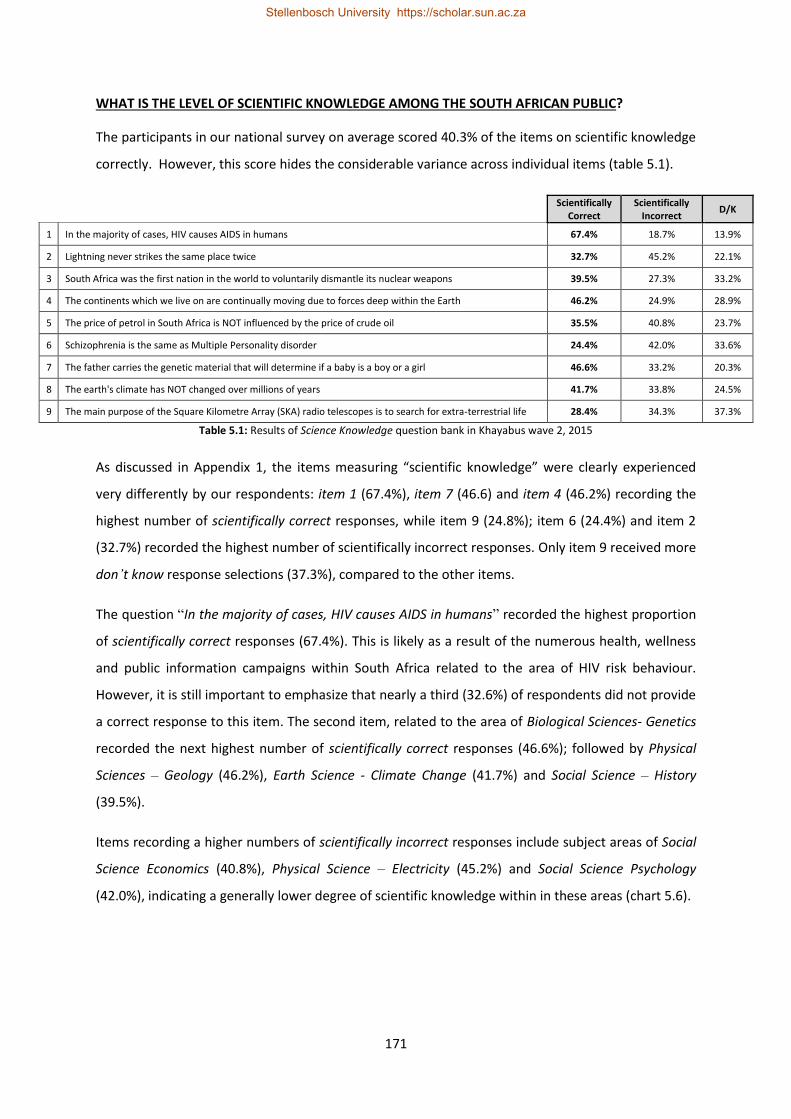
171
WHAT IS THE LEVEL OF SCIENTIFIC KNOWLEDGE AMONG THE SOUTH AFRICAN PUBLIC?
The participants in our national survey on average scored 40.3% of the items on scientific knowledge
correctly. However, this score hides the considerable variance across individual items (table 5.1).
Scientifically Correct
Scientifically Incorrect
D/K
1 In the majority of cases, HIV causes AIDS in humans 67.4% 18.7% 13.9%
2 Lightning never strikes the same place twice 32.7% 45.2% 22.1%
3 South Africa was the first nation in the world to voluntarily dismantle its nuclear weapons 39.5% 27.3% 33.2%
4 The continents which we live on are continually moving due to forces deep within the Earth 46.2% 24.9% 28.9%
5 The price of petrol in South Africa is NOT influenced by the price of crude oil 35.5% 40.8% 23.7%
6 Schizophrenia is the same as Multiple Personality disorder 24.4% 42.0% 33.6%
7 The father carries the genetic material that will determine if a baby is a boy or a girl 46.6% 33.2% 20.3%
8 The earth's climate has NOT changed over millions of years 41.7% 33.8% 24.5%
9 The main purpose of the Square Kilometre Array (SKA) radio telescopes is to search for extra-terrestrial life 28.4% 34.3% 37.3%
Table 5.1: Results of Science Knowledge question bank in Khayabus wave 2, 2015
As discussed in Appendix 1, the items measuring “scientific knowledge” were clearly experienced
very differently by our respondents: item 1 (67.4%), item 7 (46.6) and item 4 (46.2%) recording the
highest number of scientifically correct responses, while item 9 (24.8%); item 6 (24.4%) and item 2
(32.7%) recorded the highest number of scientifically incorrect responses. Only item 9 received more
don’t know response selections (37.3%), compared to the other items.
The question “In the majority of cases, HIV causes AIDS in humans” recorded the highest proportion
of scientifically correct responses (67.4%). This is likely as a result of the numerous health, wellness
and public information campaigns within South Africa related to the area of HIV risk behaviour.
However, it is still important to emphasize that nearly a third (32.6%) of respondents did not provide
a correct response to this item. The second item, related to the area of Biological Sciences- Genetics
recorded the next highest number of scientifically correct responses (46.6%); followed by Physical
Sciences – Geology (46.2%), Earth Science - Climate Change (41.7%) and Social Science – History
(39.5%).
Items recording a higher numbers of scientifically incorrect responses include subject areas of Social
Science Economics (40.8%), Physical Science – Electricity (45.2%) and Social Science Psychology
(42.0%), indicating a generally lower degree of scientific knowledge within in these areas (chart 5.6).
Stellenbosch University https://scholar.sun.ac.za

172
Chart 5.1: Response per item in the Science Knowledge assessment (Khayabus wave 2, 2015)
The item dealing with the area of Astronomy: “The main purpose of the Square Kilometre Array
(SKA) radio telescopes is to search for extra-terrestrial life”, recorded the highest proportion of don’t
know responses (37.3%). This may indicate that despite large investments in public engagement and
marketing activities surrounding the SKA project, public knowledge about its intended purpose and
planned projects remain low. Overall these results indicate a generally low level of knowledge about
science among the general South African population.
Levels of scientific knowledge with respect to major demographic variables are briefly presented
below. Table 5.2 presents the summary data and is followed by a detailed appraisal of each
demographic variable.
33.6%
37.3%
22.1%
23.7%
33.2%
24.5%
28.9%
20.3%
13.9%
42.0%
34.3%
45.2%
40.8%
27.3%
33.8%
24.9%
33.2%
18.7%
24.4%
28.4%
32.7%
35.5%
39.5%
41.7%
46.2%
46.6%
67.4%
0.0% 10.0% 20.0% 30.0% 40.0% 50.0% 60.0% 70.0%
Schizophrenia is the same as Multiple Personalitydisorder
The main purpose of the Square Kilometre Array (SKA)radio telescopes is to search for extra-terrestrial life
Lightning never strikes the same place twice
The price of petrol in South Africa is NOT influenced bythe price of crude oil
South Africa was the first nation in the world tovoluntarily dismantle its nuclear weapons
The earth's climate has NOT changed over millions ofyears
The continents which we live on are continually movingdue to forces deep within the Earth
The father carries the genetic material that willdetermine if a baby is a boy or a girl
In the majority of cases, HIV causes AIDS in humans
Scientifically Correct Scientifically Incorrect D/K
Stellenbosch University https://scholar.sun.ac.za

173
SCIENTIFICALLY
CORRECT SCIENTIFICALLY
INCORRECT D/K N
NATIONAL 40.3% 33.3% 26.4% 3 486
RACE N = 3 486
BLACK 38.3% 32.2% 29.5% 2 523
WHITE 49.9% 37.7% 12.4% 408
INDIAN / ASIAN 44.1% 40.9% 15.1% 121
COLOURED 41.3% 34.0% 24.7% 434
GENDER N = 3 486
FEMALE 39.3% 32.4% 28.3% 1 747
MALE 41.3% 34.2% 24.5% 1 739
GEOGRAPHIC LOCATION N = 3486
URBAN 41.7% 34.1% 24.2% 2 297
RURAL 37.5% 31.8% 30.7% 1 189
EDUCATION N = 3486
PRE-MATRIC 36.1% 29.5% 34.4% 1 369
MATRIC COMPLETED 41.7% 35.7% 22.6% 1 578
POST-MATRIC 46.8% 36.3% 16.9% 539
AGE N = 3 472
<20 YEARS 38.1% 30.0% 31.9% 170
20-29 YEARS 39.3% 33.6% 27.1% 1 101
30-39 YEARS 40.8% 34.0% 25.2% 956
40-49 YEARS 41.4% 34.5% 24.1% 598
50-59 YEARS 41.5% 32.8% 25.7% 372
60+ YEARS 39.2% 30.1% 30.7% 275
Table 5.2: Results of Science Knowledge by demographic classifications in Khayabus wave 2, 2015
There is a significant difference in the level of scientific knowledge of respondents from different
race classifications (X2=161.841, p < 0.001). White respondents provided more scientifically correct
responses (49.9%) followed by Indian / Asian (44.1%) and coloured (41.3%) respondents. Black
respondents presented the lowest overall proportions correct response (38.3%), a result not entirely
unexpected considering the multiple sociodemographic challenges across South African race groups.
Gender demonstrated a statistically significant relationship to the overall population response on the
9-item science knowledge assessment (X2=18.783, p < 0.05). The average proportion of females
providing a correct response was 39.3% compared to 41.3% among males (n = 3 486). This is in
agreement with international and domestic evidence of the role of gender with respect to the
overall level of scientific knowledge (European Commission, 2013a). However, it is worth
emphasizing that the differences between male and female responses remain small.
At the aggregate level, geographic location was assessed by each of the 9 South African provincial
demarcations as well as by the rural / urban classification. Analysis of the overall response to
scientific knowledge items by province demonstrated a statistically significant difference in the
Stellenbosch University https://scholar.sun.ac.za

174
recorded scores (X2=327.519, p < 0.001). The recorded outcome on scientific knowledge measures
for urban respondents was significantly higher (41.7%) than for rural (37.5%) respondents
(X2=45.888, p < 0.001).
Educational attainment is known to be associated with performance on scientific knowledge
measures (Blankley and Arnold, 2001; Reddy et al, 2009). As per the earlier noted expectation,
educational attainment was found to be a highly significant factor within the recorded outcomes on
the 9 questionnaire items (X2=152.279, p < 0.001). Respondents with pre-matric educational
attainment demonstrated lower scores on the scientific knowledge assessment (36.1%) compared to
those with post-matric educational qualifications (46.8%). Among respondents able to provide
correct responses to 6 or more (of the 9) questions, 12.5% had a pre-matric education, compared to
23.9% of respondents with a post-matric education.
Age of respondents was not found to show a statistically significant association with measures of
scientific knowledge (X2=61.175, p > 0.05). While there was a pattern of higher recorded response
for those aged between 20 and 59 years old, this was likely related more to employment and
educational attainment and was not found to carry a statistically significant association to the age of
respondents.
EXPLORATORY ANALYSIS OF VARIABLES CORRELATING WITH KNOWLEDGE OF SCIENCE
The aim of the following discussion is to disaggregate the data by looking at the bivariate
relationships between a number of key demographics and the responses to the scientific knowledge
items. In Chapter 11 we present the results of a rigorous multinomial logistic regression for each of
the outcome variables. In the remainder of this chapter, however, we will focus on how gender;
race; household income; educational attainment; geographic location (rural-urban); employment
and age are related to respondent’s knowledge of science. CHAID is a statistical technique that
allows one to explore these relationships interactively. It identifies which, in a set of demographic
variables are most likely to correlate with the “dependent” variable. By itself it is not adequate to
generate strong conclusions about these relationships, but it is a very useful technique to identify
such key variable toward further more rigorous analysis (hence the regression analysis in Chapter
11).
In Figure 5.1 we present (in graphic form) the results of the CHAID analysis for the knowledge of
science items within this data set. The analysis was completed adopting the composite score across
all seven knowledge of science items. The following categorical variables were entered into the
Stellenbosch University https://scholar.sun.ac.za

175
analysis: gender; race; household income; educational attainment; geographic location (rural-urban);
employment and age.
Figure 5.1: Output of CHAID analysis: Knowledge of Science
The result of the CHAID analysis shows that three demographic variables are the best predictors of
respondent level of scientific knowledge. These predictor variables are household income, race and
educational attainment level. To illustrate: white and coloured respondents who were categorized
as falling in the moderate and high household income brackets, recorded the highest percentage of
correct responses (59.3%) on the scientific knowledge index. At the other extreme, respondents with
pre-matric educational attainment and lower levels of household income recorded much lower
levels of scientific knowledge.
Each of these predictors will be addressed in some detail across the next sub-section of this chapter.
The three predictors, along with additional variables of conceptual and statistical significance will be
included in the multinomial logistic regression modelling toward the output of a predictive model of
scientific knowledge measures in South Africa.
41.3
39.2
43.2
48.0
35.3
32.6
37.0
30.5
22.6
25.4
18.5
27.1
11.0
30.0
29.1
24.9
19.9
29.7
32.4
27.3
26.5
32.1
28.5
31.3
21.5
29.7
28.7
31.7
31.9
32.2
35.0
35.0
35.7
43.0
45.2
46.1
50.2
51.4
59.3
0% 10% 20% 30% 40% 50% 60% 70% 80% 90% 100%
MISSING INCOME - PRE MATRIC
LOW INCOME - MATRIC COMPLETED / POST MATRIC
LOW INCOME
LOW INCOME PRE MATRIC
MISSING INCOME
MISSING INCOME - MATRIC COMPLETED
ALL
MOD-HIGH INCOME BLACK/INDIAN
MOD-HIGH INCOME COLOURED / WHITE - MODERATE…
MOD - HIGH INCOME
MOD-HIGH INCOME COLOURED / WHITE
MISSING INCOME- POST MATRIC
MOD-HIGH INCOME COLOURED / WHITE
LOW MODERATE HIGH
Stellenbosch University https://scholar.sun.ac.za

176
SCIENCE KNOWLEDGE BY RACE
The classifications adopted within this research reflect the racial categories used in general
administrative data streams within contemporary South Africa. The 4 primary race classifications
which have been transposed into the nomenclature of democratic South Africa are not without
contestation. However, in the interest of highlighting some of these legacy impact challenges of the
apartheid system, this research employs these categories, toward emphasizing the many social
inequalities still prominent in contemporary South Africa.
The previous section highlighted the statically significant relationship between assessed scientific
knowledge and race classifications within the general South African population (X2=161.841, p <
0.001). On average, white, Indian / Asian and coloured respondents reported more correct
responses compared to black participants. Despite this, the Indian / Asian cohort of respondents
provided a greater proportion of incorrect responses (40.9%) compared to white (37.7%), coloured
(34.0%) and black (32.2%) respondents. A similar pattern is reflected in the selection of the don’t
know response category, where black (29.5%) and coloured (24.7%) respondents provided more
frequent don’t know responses compared to Indian / Asian (15.1%) and white (12.4%) respondents.
This indicates that overall, black and coloured respondents are more likely to acknowledge a
knowledge gap, than hazard an incorrect response, compared to white and Indian / Asian
respondents. However, black respondents provided the lowest levels of scientifically correct
response across the question set, 2.0% below the overall national average (see chart 5.2).
* Scientifically incorrect includes Incorrect and D/K responses
Chart 5.2: Average response by race: Scientific Knowledge assessment (Khayabus Wave 2, 2015)
The role of race on measures of scientific knowledge can further be explored by science subject area,
per questionnaire item. Table 5.3 illustrates the comparison to the national average response, by
race, for each of the questionnaire items. White respondents generally responded above the
49.9% 44.1% 41.3% 38.3%
40.3%
50.1% 55.9% 58.7% 61.7%
59.7%
12.4% 15.1% 24.7% 29.5% 26.4%
-80%
-60%
-40%
-20%
0%
20%
40%
60%
White Indian / Asian Coloured Black National Average
Scientifically Valid Scientifically Invalid* Of which D/K
Stellenbosch University https://scholar.sun.ac.za

177
national average for all questions, except for the item related to Social Science - Psychology (-2.6%).
White respondents demonstrated a significantly better understanding of climate change, scoring
20.3% above the national average for this item (X2= 151.650; p < 0.001). Black respondents generally
scored below the national average across all items, except for Social Science – History (+0.1%); Social
Science – Psychology (+0.3%) and Biological Science – Genetics (+0.4%). Indian / Asian respondents
reported scores higher than the national average for 8 of the 9 items, however did produce
significantly higher result for the item related to Social Science – Psychology (+12.0%; X2= 202.654; p
< 0.001). Coloured respondents responded higher than the national average for 5 of the 9 items,
however did display a significantly lower result within the item: Social Science – History (-6.8%; X2=
47.374; p < 0.001).
SCIENTIFICALLY CORRECT RESPONSES
White Black Indian / Asian Coloured
National Average
2015
BIOLOGICAL SCIENCE - MEDICAL 8.1% -1.5% 0.4% 1.3% 67.4%
PHYSICAL SCIENCE - ELECTRICITY 11.9% -1.7% 0.3% -1.6% 32.7%
SOCIAL SCIENCE - HISTORY 6.8% 0.1% -1.5% -6.8% 39.5%
PHYSICAL SCIENCE - GEOLOGY 17.8% -3.6% 4.3% 2.9% 46.2%
SOCIAL SCIENCE - ECONOMICS 17.2% -4.0% 9.9% 4.1% 35.5%
SOCIAL SCIENCE - PSYCHOLOGY -2.6% 0.3% 12.0% -2.5% 24.4%
BIOLOGICAL SCIENCE - GENETICS 0.7% 0.4% 3.0% -3.7% 46.6%
EARTH SCIENCE - CLIMATE CHANGE 20.3% -4.6% 2.1% 6.9% 41.7%
ASTRONOMY - SKA 6.6% -2.8% 3.8% 9.2% 28.4%
Table 5.3: Science subject area by race classifications (to national average) in Khayabus Wave 2, 2015
Chart 5.3 reveals that white and Indian respondents respond above the level of the national average
for most questions, while black and coloured respondents generally respond lower than the national
average.
Chart 5.3: Response to Science Knowledge assessment by race groups: comparison to national average
8.1
%
11
.9%
6.8
%
17
.8%
17
.2%
-2.6
%
0.7
%
20
.3%
6.6
%
-1.5
%
-1.7
%
0.1
%
-3.6
%
-4.0
%
0.3
%
0.4
%
-4.6
%
-2.8
%
0.4
%
0.3
%
-1.5
%
4.3
%
9.9
%
12
.0%
3.0
%
2.1
%
3.8
%
1.3
%
-1.6
%
-6.8
%
2.9
%
4.1
%
-2.5
%
-3.7
%
6.9
%
9.2
%
-9.0%
-4.0%
1.0%
6.0%
11.0%
16.0%
21.0%
BIOLOGICALSCIENCE -MEDICAL
PHYSICALSCIENCE -
ELECTRICITY
SOCIALSCIENCE -HISTORY
PHYSICALSCIENCE -GEOLOGY
SOCIALSCIENCE -
ECONOMICS
SOCIALSCIENCE -
PSYCHOLOGY
BIOLOGICALSCIENCE -GENETICS
EARTHSCIENCE -CLIMATECHANGE
ASTRONOMY -SKA
White Black Indian / Asian Coloured
Stellenbosch University https://scholar.sun.ac.za

178
Within the cross tabulation for race and scores on the scientific knowledge assessment, a further
layer variable was included to create 3-way contingency tables. This analysis was completed to
assess the role of a further variable in this analysis to better understand the results within this study.
The below section briefly discusses the results of this analysis for the additional layers of: gender;
rural / urban location; educational attainment; age; employment status and household income.
Within race there are variations between the scores of male and female respondents, yet there was
no significant association as a result of gender on knowledge assessment scores (White: X2=0.395, p
> 0.05; Black: X2=1.845, p > 0.05; Indian: X2=0.042, p > 0.05; Coloured: X2=0.527, p > 0.05). When
comparing the variations that exist between males and females of different race groups, for both
genders there was a significant association between the variables gender and race (Male: X2=24.371,
p < 0.001; Female: X2=39.087, p < 0.001). White males and white females tend to score significantly
higher than members of their respective gender grouping within other race groups. This does not
discount the important role of gender dynamics within the South African context, but implies that
within the envelope of socioeconomic dynamics, race may exert a statistically significant greater
effect than gender; within the contemporary South African context.
Rural and urban respondents do show a statistically significant difference in their science knowledge
assessment scores. Within race categories there was no statistically significant association between
rural / urban populations and scientific knowledge for white (X2=24.371, p > 0.05), coloured
(X2=0.001, p > 0.05) and Indian / Asian (X2=1.384, p > 0.05) respondents. However, among black
respondents there was a statistically significant association recorded for these variables, likely as a
result of the larger black rural population in South Africa (X2=8.227, p < 0.01). Irrespective of rural /
urban geographic location, white respondents provided more correct responses, compared to other
race categories, highlighting a significant association between race and knowledge assessment
scores, (Urban: X2=44.069, p < 0.001; Rural: X2=12.019, p < 0.05).
Analysis of the scores for the science knowledge assessment by race and educational attainment
level reveals varying degrees of association between these variables. Despite the overall
contribution of increased educational attainment on response to the knowledge assessment items,
two distinct outcomes emerged. White and Indian respondents did not display a statistically
significant association between these variables (White: X2= 4.00, p > 0.05; Indian: X2= 3.107, p >
0.05). However, for black and coloured respondents there was a statistically significant association
between scores on the scientific knowledge assessment and educational attainment categories
(Black: X2= 45.031, p < 0.001; Coloured: X2= 11.839, p < 0.05). The role of educational attainment
across race classifications reveals similarly interesting findings.
Stellenbosch University https://scholar.sun.ac.za

179
Among individuals with pre-matric and post-matric education, irrespective of race, there is very
strong evidence that the variables race and score on science knowledge assessment are associated
within the population (Pre-Matric: X2= 14.317, p < 0.05; Post-Matric: X2= 25.575, p < 0.001).
However, irrespective of race, individuals with a completed matric qualification this association is
not as well supported by the evidence (Matric Completed: X2= 7.435, p > 0.05).
Within all race classifications, age did not demonstrate a significant association to race and scores on
the science knowledge assessment. However, across race groups, age classification showed some
association to race and scientific knowledge scores, particularly for the older members of the
sample. Age groups <20 years; 20-29 years and 50-59 years did not show a significant association
with these variables. However, age groups 30-39 years (X2= 20.721, p < 0.001); 40-49 years (X2=
14.472, p < 0.05) and 60+ years (X2= 22.957, p < 0.001) were found to be significantly associated with
race and knowledge assessment scores. This is likely due to the race-based differential influence of
apartheid on older South Africans compared to those within the born-free generation102. This is
evident when examining the higher scores achieved by white South Africans across all age groups,
compared to those achieved by similarly aged black South Africans.
Race classifications exhibited minimal variation in achieved knowledge assessment scores by
employment categories for white and black respondents. While there was some variation within the
Indian group between scores achieved by those Employed and those achieved by Unemployed or
Other (Not Working) respondents, none of these were found to be statistically significant. Among
coloured respondents however, the association between employment status and scores on the
knowledge assessment was found to be statistically significant (X2= 13.940, p < 0.01). The role of
employment status, across all race groups did not highlight a significant association between the
scores achieved for unemployed individuals within black, white, coloured or Indian respondents
(Unemployed: X2= 7.454, p > 0.05). Conversely, for individuals within the employed or Other (Not
Working) category, a highly significant association was found between race classification and scores
on the knowledge assessment items (Employed: X2= 37.280, p < 0.001; Other (Not Working): X2=
19.266, p < 0.001).
Household Income levels have an overall highly significant association with race classifications in
South Africa (X2= 630.170, p < 0.001). Within the black, white and coloured sub-samples, higher
income was similarly associated with higher levels of scientific knowledge (Black: X2= 26.386, p <
0.001; White: X2= 15.364, p < 0.001; Coloured: X2= 24.206, p < 0.001). This association was not found
for respondents within the Indian / Asian classification, where science knowledge scores increased
102
South Africans born post-1994
Stellenbosch University https://scholar.sun.ac.za
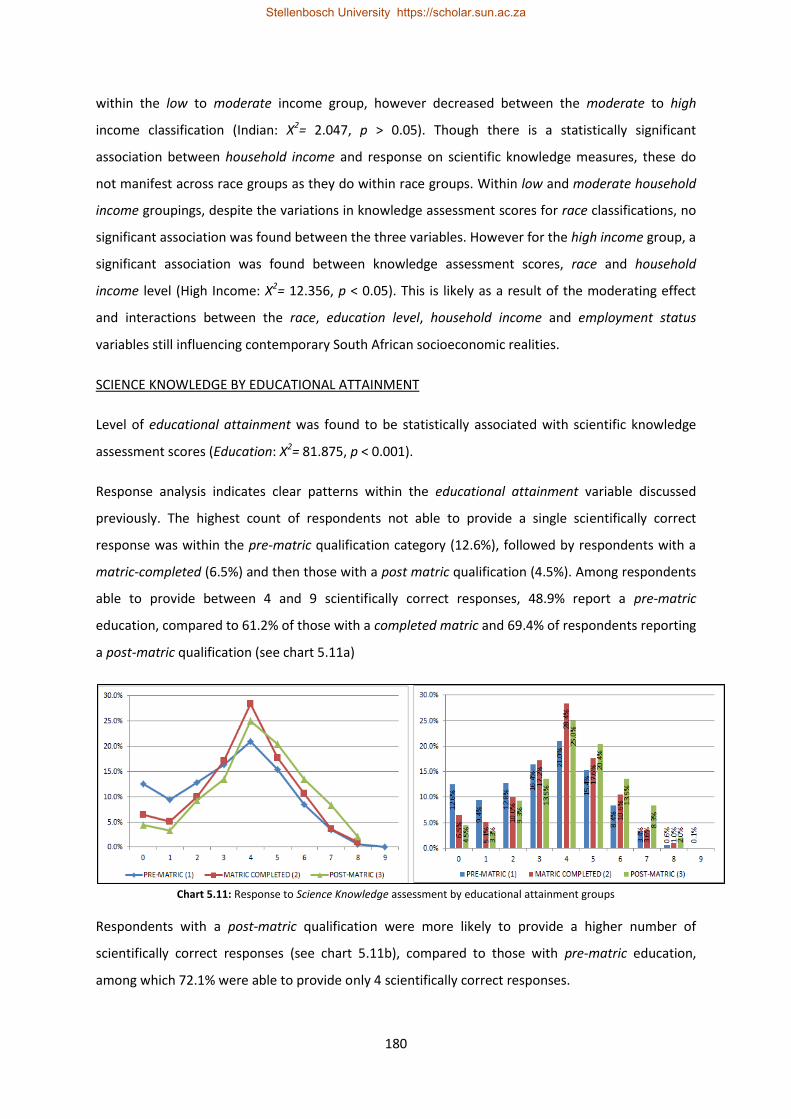
180
within the low to moderate income group, however decreased between the moderate to high
income classification (Indian: X2= 2.047, p > 0.05). Though there is a statistically significant
association between household income and response on scientific knowledge measures, these do
not manifest across race groups as they do within race groups. Within low and moderate household
income groupings, despite the variations in knowledge assessment scores for race classifications, no
significant association was found between the three variables. However for the high income group, a
significant association was found between knowledge assessment scores, race and household
income level (High Income: X2= 12.356, p < 0.05). This is likely as a result of the moderating effect
and interactions between the race, education level, household income and employment status
variables still influencing contemporary South African socioeconomic realities.
SCIENCE KNOWLEDGE BY EDUCATIONAL ATTAINMENT
Level of educational attainment was found to be statistically associated with scientific knowledge
assessment scores (Education: X2= 81.875, p < 0.001).
Response analysis indicates clear patterns within the educational attainment variable discussed
previously. The highest count of respondents not able to provide a single scientifically correct
response was within the pre-matric qualification category (12.6%), followed by respondents with a
matric-completed (6.5%) and then those with a post matric qualification (4.5%). Among respondents
able to provide between 4 and 9 scientifically correct responses, 48.9% report a pre-matric
education, compared to 61.2% of those with a completed matric and 69.4% of respondents reporting
a post-matric qualification (see chart 5.11a)
Chart 5.11: Response to Science Knowledge assessment by educational attainment groups
Respondents with a post-matric qualification were more likely to provide a higher number of
scientifically correct responses (see chart 5.11b), compared to those with pre-matric education,
among which 72.1% were able to provide only 4 scientifically correct responses.
Stellenbosch University https://scholar.sun.ac.za

181
PRE-MATRIC
MATRIC COMPLETED
POST-MATRIC
NATIONAL AVERAGE
Average SCIENTIFICALLY CORRECT response 36.1% 41.7% 46.8% 40.3%
Average SCIENTIFICALLY INCORRECT response 29.5% 35.7% 36.3% 33.3%
Average DON’T KNOW response 34.4% 22.6% 16.9% 26.4%
100% 100% 100% 100%
Table 5.7: Response to science knowledge items, by educational attainment (with national average)
Results reflected in table 5.7 confirm that respondents with higher educational achievement are able
to provide a greater proportion of correct response compared to those with lower educational
achievement. Respondents with a post-matric qualification perform 6.5% above the national average
compared to those with pre-matric educational achievement (4.2% below the national average).
Chart 5.12 demonstrates this relationship, wherein those with higher educational attainment are
able to provide more correct responses, while at the same time selecting the Don’t Know response
option least frequently.
Chart 5.12: Response to Science Knowledge assessment by educational attainment groups
Respondents with a pre-matric education tend to provide fewer incorrect responses, but
simultaneously present the highest proportion of don’t know response selections (34.4%).
Respondents with a completed matric, while achieving higher proportions of correct responses, also
present greater levels of incorrect response. Within both the matric completed and post-matric
categories the use of the don’t know option is significantly lower than for the pre-matric group
36.1%
41.7%
46.8%
29.5%
35.7% 36.3% 34.4%
22.6%
16.9%
15%
20%
25%
30%
35%
40%
45%
50%
PRE-MATRIC MATRIC COMPLETED POST-MATRIC
AVERAGE CORRECT AVERAGE INCORRECT AVERAGE D/K
Stellenbosch University https://scholar.sun.ac.za

182
indicating a greater confidence in their scientific knowledge, even if in some cases the response
provided may be incorrect.
The results of the knowledge assessment by subject area are explored below using the 3 categories
of educational attainment as well as the overall national average (table 5.8).
PRE-MATRIC
MATRIC COMPLETED
POST-MATRIC
NATIONAL AVERAGE
BIOLOGICAL SCIENCE - MEDICAL 62.5% 68.6% 76.4% 67.4%
PHYSICAL SCIENCE - ELECTRICITY 30.4% 32.7% 38.8% 32.7%
SOCIAL SCIENCE - HISTORY 34.5% 41.4% 46.9% 39.5%
PHYSICAL SCIENCE - GEOLOGY 37.9% 48.8% 59.4% 46.2%
SOCIAL SCIENCE - ECONOMICS 30.1% 38.2% 41.4% 35.5%
SOCIAL SCIENCE - PSYCHOLOGY 22.6% 25.9% 24.7% 24.4%
BIOLOGICAL SCIENCE - MEDICAL 43.7% 47.3% 51.8% 46.6%
EARTH SCIENCE - CLIMATE CHANGE 37.4% 42.5% 50.3% 41.7%
ASTRONOMY - SKA 25.7% 29.8% 31.2% 28.4%
Table 5.8: Science subject area by educational attainment classifications (to national average) in Khayabus Wave 2, 2015
Response within the pre-matric sub-sample was generally below the level of the national average
response, while those with a completed matric or post-matric responded at a level above that of the
national average. Among the pre-matric group, notable results (compared to the national average)
include Physical Science – Geology (-8.2%); Social Science – Economics (-5.4%) and Social Science –
History (-5.1%). Among those with a post-matric qualification, notable mentions are: Physical Science
– Geology (+13.2%); Biological Science – Medical (+9.0%) and Earth Science - Climate Change
(+8.6%). The role of a post-matric education is highly evident when comparing results from the latter
group to those from the pre-matric category. Within the items mentioned previously, the variance in
scores achieved between the post-matric and pre-matric groups are as follows: Physical Science –
Geology (+21.5%); Biological Science – Medical (+13.9%) and Earth Science - Climate Change
(+12.9%). The above results have all been found to be statistically significant with respect to the
association between scientific knowledge assessment scores and educational attainment (for all
items p < 0.001).
Analyses on educational attainment and scores within science knowledge assessments have similarly
been extended to include a 3rd variable as in preceding sections103. These layers will include age;
employment status as well as household income level as additional variables to the analysis.
103
Third layered variable analyses have already been presented in earlier sections for Location, Gender and Race and will not be presented within this section.
Stellenbosch University https://scholar.sun.ac.za
183
Educational attainment is significantly associated with scores on the knowledge assessment
(Education: X2= 81.875, p < 0.001). This analysis was expanded to include the age variable and the
results are discussed below. Within the pre-matric and matric completed groups, no evidence of a
significant association was found between the age of respondent, educational attainment and the
science knowledge assessment variables (Pre-Matric: X2= 6.919, p > 0.05; Matric Completed: X2=
1.189, p > 0.05). However among those with post-matric qualifications (Post-Matric: X2= 20.598, p <
0.01) a statistically significant association was identified. The reported level of educational
attainment was found to be significantly associated with all age classification groups, except the <20
years group (X2= 1.916, p > 0.05). This is likely as a result of the fact that 94.7% of participants
younger than 20 years old report having pre-matric or a completed matric qualification and only a
very small minority report having any post-matric education. Within every other age category older
than 20 years old, a statistically significant association was demonstrated for the variables: age,
educational attainment and scores on the knowledge assessment questions (20-29 years: X2=
20.745, p < 0.001; 30-39 years: X2= 18.061, p < 0.001; 40-49 years: X2= 7.096, p < 0.05; 50-59 years:
X2= 25.736, p < 0.001; 60+ years: X2= 27.034, p < 0.001).
Analysis investigating the relationship between scores on the knowledge assessment, educational
attainment and employment status may indicate a hierarchical association with respect to the
influence of these variables. Within each of the three educational attainment categories no
statistically significant association was reported between employment status and knowledge
assessment scores (Pre-Matric: X2= 0.679, p > 0.05; Matric Completed: X2= 1.701, p > 0.05; Post
Matric: X2= 0.199, p > 0.05). This may indicate a greater influence as a result of increased
educational attainment level when compared to respondent employment status. Conversely, within
employment status categories the influence of educational attainment was found to be highly
significant within all 3 employment categories (Employed: X2= 30.735, p < 0.001; Unemployed: X2=
17.442, p < 0.001; Other (Not Working): X2= 19.597, p < 0.001). This finding confirms the earlier
suggestion that educational attainment classification may have a greater overall role on response to
science knowledge assessments, compared to the known association of employment status on these
scores.
Household income levels are known to be correlated to variables such as employment, education
and race classification. The significant association between household income and knowledge
assessment scores has been demonstrated earlier in this chapter (Household Income: X2= 89.397, p <
0.001). When considering the association of educational attainment and science knowledge
assessment scores within household income groups, it becomes apparent that the role of
Stellenbosch University https://scholar.sun.ac.za
184
educational attainment does not show a significant association with knowledge assessment scores at
the upper income bands. Among the moderate and high household income groups, the association
between educational attainment and scientific knowledge assessment scores was not found to be
significant (Moderate Income: X2= 0.119, p > 0.05; High Income: X2= 5.748, p > 0.05). However,
within the low household income group, the association between educational attainment and
knowledge assessment scores was found to be highly significant (Low Income: X2= 21.711, p < 0.001).
This implies that while educational attainment has been shown to be significantly associated with
response on knowledge assessment scores, when considered with household income level, its
influence is only significant at the lower end of the income scale.
Conclusion
Survey results for the scientific knowledge assessment indicates that an average of 40.3% of South
Africans were able to provide scientifically correct responses. This result implies that the overall level
of scientific literacy among the sample was generally low. Within the 3 486 respondents, an average
of 59.7% of respondents provided a scientifically incorrect or don’t know response. This low level of
scientific literacy is indicative of a general lack of knowledge with respect to the 9 science-subject
areas included within this research.
At the aggregate level, South Africans appear to be more knowledgeable in areas related to medical
science (HIV and genetics) as well as physical science (geology) having attained the highest
proportion of scientifically correct response within these items. The areas demonstrating the lowest
overall correct response were related to the subject areas of psychology and astronomy. The
majority of respondents were not able to correctly identify the main purpose of the Square
Kilometre Array Telescope (SKA) or relate the difference between two distinct psychological
disorders within these questionnaire items. These items similarly produced the highest difficulty
index rating, indicating the majority of respondents were not able to respond to these items
correctly (see appendix 2).
Demographic classifications revealed some notable outcomes within the science knowledge
assessment items. Race demonstrated a highly significant impact on overall results to this question
set. A greater proportion of white and Indian / Asian respondents were able to provide correct
responses compared to coloured and black respondents. Respondents within the black sub-sample
provided the lowest overall proportion of correct response. This was particularly notable among
respondents within the senior age classifications. Related to this, black and coloured respondents
were more likely to acknowledge a knowledge gap by selecting a don’t know response, rather than
provide a scientifically incorrect response, when compared to white and Indian / Asian respondents.
Stellenbosch University https://scholar.sun.ac.za

185
White respondents performed significantly better within the item related to climate change (+20.3%
above the national average), while Indian / Asian respondents performed best at items related to
psychology (12.0% above the national average).
Gender was found to be statistically significant within response to individual items in the question
set. However, despite this, the proportions of scientifically correct response for females (39.3%) and
males (41.3%) did not demonstrate large variation. Within race classifications, males and females did
not display statistically significant variations in their response proportions, however across race
groups the expected variations were observed. Similar patterns were revealed within employment,
income, education and other socioeconomic variables, indicating the interacting influences these
variables may have on the scientific knowledge assessment scores with respect to gender. While
there remain valid concerns around the role of gender with regards to the overall levels of scientific
literacy within the South African population, response patterns for females and males, in isolation
from other demographic variables, indicates a closing gap between gendered outcomes on
assessments of scientific knowledge.
The geographic location of respondents demonstrated a profound influence on science knowledge
assessment scores. Urban respondents revealed higher proportions of correct response compared to
rural respondents. Black respondents within rural areas were significantly more likely to provide
fewer correct responses compared to their urban counterparts. Among both males and females, no
significant difference was reported within urban / rural location groups. However, across location
categories, urban respondents generally perform better than rural participants, irrespective of
gender classification. Location group classification showed a significant association with knowledge
assessment scores for respondents with low and moderate income; however this was not the case
within the high income group. Educational attainment reflected a comparable pattern, wherein rural
respondents with a lower level of education were shown to report significantly fewer correct
responses on the knowledge items, compared to those within urban areas. The level of respondent
educational attainment and household income was found to be significantly associated to scientific
knowledge assessment scores when compared to the rural / urban location of respondents.
Respondents with increased education similarly presented more frequent correct responses
compared to those with lower educational attainment. Interestingly, for white and Indian / Asian
respondents no statistically significant association was shown between educational attainment and
response to the knowledge assessment items. However, among black and coloured respondents, a
significant association was demonstrated for those with increased educational attainment levels.
Males and females with similar educational attainment did not exhibit a statistically significant
Stellenbosch University https://scholar.sun.ac.za

186
variation on the knowledge assessment outcomes. However, across gender groups, the influence of
educational attainment level displayed a highly significant association with knowledge assessment
scores. Respondent level of education was found to be particularly significant within the low income
group; however this influence is not as significant within moderate and high income households.
The influence of respondent employment and levels of household income demonstrated similarly
significant associations to the scientific knowledge assessment score. Respondents indicating
employment, similarly report higher knowledge assessment outcomes. This was particularly notable
within the black and coloured respondents, for those employed compared to those within the
remaining two employment classifications. Employed men generally provide more correct
responses, compared to other men. However, the association between gender and employment
status was not recorded among the female sub-sample. Rural respondents reporting employment
achieved higher knowledge assessment scores compared to other rural respondents; however, no
notable variation in scores was recorded within the urban sub-sample for employment status.
Household income level revealed a significant association with knowledge assessment scores, where
respondents within higher household income groups generally provided a greater proportion of
correct response. Within the black, white and coloured sub-samples, the association between
household income and scientific knowledge assessment scores was found to be statistically
significant. However within the Indian / Asian sub-sample no such association was statistically
substantiated. Gender groups showed similar patterns of increased scientific knowledge within
increased household income. This was particularly notable within the high income group, where a
statistically significant association was identified, with males generally providing a higher proportion
of correct response compared to females.
Stellenbosch University https://scholar.sun.ac.za

187
Chapter Six
Descriptive Survey Results:
Attitudes to Science
The scientific attitude of mind involves a sweeping away of all other desires in the interest of the desire to know.
Bertrand Russell (1919)
Introduction
The study of attitudes to science has not been without contestation over the preceding 50 years of
research (Bauer, Durant & Evans; 1994, Allum, Sturgis & Tabourazi; 2008). Much debate has centred
on definitional issues as well as discussions relating to which aspects of attitudes should be
measured – be it the structure of attitudes, attitude formation, attitudinal change or the attitude-
behaviour relationship. A key point that has emerged within reviewing the literature on attitudinal
measurement and specifically the measurement of attitudes to science is the distinction between
“scientific attitudes” and “attitudes to science” (Gardner, 1995). The initial idea relates to a complex
series of innate beliefs and behavioural interactions within an individual and society that promotes a
healthy scepticism, enquiring approach to information received and an ability to distinguish between
appropriateness of research questions and suitability of data supporting any findings (see Gauld &
Hukins, 1980 - In Osborne, 2003). Shukla (2005) has often quoted Nehru’s ideas of scientific temper
in discussing scientific attitude within the Indian context. The value of this concept cannot be
emphasised enough and certainly adds a tremendous value to the broader objectives of research
within this field of study.
However, as important as the concept of “scientific attitudes” are to this research and the broader
discussion within the South African context, within the current research, the concept under
consideration relates specifically and exclusively to “attitudes to science”. In its simplest, an attitude
is "a relatively enduring organization of beliefs, feelings, and behavioural tendencies towards socially
significant objects, groups, events or symbols" (Eagly, & Chaiken, 1993). The measurement of
attitudes to science (within this context) relies on being able to efficiently access these beliefs and
feelings with respect to science, and quantify them in an accessible yet transparent manner. Here
the strength (how enduring the attitude is) and the direction (positive or negative attitudes) are
important considerations and will continue to be the focus within this investigation.
Within this research, the question being considered is, do South Africans demonstrate positive or
negative attitudes to science within a social context? This includes gaining an understanding of the
Stellenbosch University https://scholar.sun.ac.za

188
value South Africans attach to science in daily activities, the role of science in shaping a future
society as well as an indication of public risk perception associated with scientific advancement.
These questions do not target any branch of science or any specific scientific concepts, but rather
seeks to understand the public perception and contribution of science to ordinary South Africans. As
a broad research project, non-specific to attitudes, this study is only focusing on the cognitive
component of attitudes. This cognitive aspect focuses on the personal knowledge and belief people
associate with particular attitude objects (Ostrom, 1969). While this will not illuminate attitudes to
science in every detail it will provide valuable insight into the direction and strength of attitudes held
by the general South African public, with regards to the contribution of science within the social
landscape.
OVERALL NATIONAL RESULTS FOR ATTITUDES TO SCIENCE ASSESSMENT ITEMS104
Items that were designed to convey a positive scientific sentiment (item 1 and 3) attracted the
highest proportions of agree response. These are items designed to access public attitudes of
support; belief in the promise of science and its value to society. The majority of respondents
(68.7%) agreed with Item 1 (science and technology are making our lives healthier, easier and more
comfortable); while 10.8% expressed disagreement and 20.5% selected the neutral (neither agree
nor disagree) response option. Within Item 3, a larger share of respondents (71.9%) agreed that
thanks to science and technology, there will be more opportunities for the future generation, while
9.8% disagreed and 18.3% selected the neutral option.
Items that are considered critical with regards to science may provide insights into the level of
perceived public risk; general reservation; lack of public trust, support or related value-driven
influences within the public mind-set. Among these items, item 2 and item 4 were responded to as
follows. The majority of respondents (47.5%) agree with the attitudinal statement it is not important
for me to know about science in my daily life, while 30.2% disagreed and 22.3% opted to select the
neutral option. Results for item 4, despite being phrased with a sentiment critical to science,
reflected a significantly higher proportion of agreement (68.8%) compared to item 2, while 11.7%
disagreed and 19.5% indicated that they neither agree or disagree with the statement (see chart
6.1).
104
The results of the reliability analyses are found in Appendices 2 to 7 (Page 410 - 442).
Stellenbosch University https://scholar.sun.ac.za

189
Chart 6.1: Overall result: South African Attitudes to Science assessment % (Khayabus wave 2, 2015)
Discussing the results of the attitudes to science assessment, it would be conceptually valuable to
begin to refer to the four items within groups that would reduce the complexity of the discussions to
follow. As such, items 1 and 3, as they are imbedded with a positive scientific outlook will be
considered scientific promise items, while item 2 and 4, having a more critical position would be
considered items of scientific reservation.
Within this updated classification of the four questionnaire items, one is able to make an assessment
of the general attitudes held by South Africans with regards to science in a social context. There
appears to be a general agreement to scientific promise items, with an average of 70.3%105 of the
sample selecting an agree or strongly agree response at both promise items. The majority of
respondents within this survey have an affinity to a belief in the positive contribution of science to
daily life, while also adopting a common confidence in the future value of science within South
African society. Juxtaposed to these general positive views of science, is a common sense of concern
wherein an average of 58.2%106 of respondents expressed a level of apprehension in providing
agreement with the scientific reservation items.
A commonly used index, adopted by many studies on the public understanding of science is called
the Index of Scientific Promise and Reservation (see chapter 3). Through the use of attitudinal
statements, similar to the ones adopted in this study, two indices are created, one for the
measurement of scientific promise and the other for the measurement of scientific reservation. The
scores for each index are then used to calculate a ratio between the two indices, producing the Index
105
Average across agree responses to Item 1 and Item 3 106
Average across agree response to Items 2 and Item 4
Stellenbosch University https://scholar.sun.ac.za

190
of Scientific Promise and Reservation. Within these indices higher scores indicate agreement with the
attitudinal statements while lower scores indicate disagreement with the statement.
The promise and reservation indices are calculated by aggregating all responses of ‘strongly agree’
or ‘agree’ and dividing this by the number of items constituting the respective index107. According to
Reddy et al (2013), “the average promise score is divided by the average reservation score to provide
a single promise-reservation ratio of attitudes towards science – in which a higher score indicates a
generally more positive attitude [to science]” (pp 3). This ratio ranges between 0.00 till +2.00,
wherein scores below a 1.00 value indicates general negative attitudes to science and values above
1.00 general positive attitudes to science. Scores from each question were extracted using IBM SPSS
24.0 and Microsoft Excel employing frequency distributions toward developing the individual scores
for each of the indices. The individual scores were then incorporated into the calculation of the total
score for this Index of Scientific Promise and Reservation.
Chart 6.2: South African Attitudes to Science assessment: Promise & Reservation (Khayabus Wave 2, 2015)
Results from the four items are presented in chart 6.2 (above) as promise and reservation scores.
Scores for each promise and reservation index are arrived at through calculating the proportion of
those presenting an agree response (strongly agree and agree) to the total number of responses
within that item. The calculation of the index of promise and reservation is demonstrated in below.
107 A methodological point should be noted here as the present study adopted a 4-item question set, as per Bann &
Schwerin (2004) and Shukla & Bauer (2009). This deviates from the traditional 7-item index used by Reddy et al and others
(see chapter 3). This was adopted as a result of methodological equivalency of the 4-item question format demonstrated
by Bann & Schwerin (2004) as well as the cost considerations when implementing a nationally representative survey
sample.
Stellenbosch University https://scholar.sun.ac.za

191
Table 6.1: South African Attitudes to Science: Calculation of Index of Promise & Reservation
Within the 2015 Khayabus survey module data, the average Promise Index score was calculated to
be 0.70, while the average Reservation Index score was slightly lower, at 0.58, yielding a Promise-
Reservation Index ratio of 1.21 (table 6.1). This leads to the finding that, despite some reservations,
in general, the South African public demonstrates a positive attitude toward science and its
contribution to society.
Comparison of the present Khayabus survey module data with the most recently available data from
the HSRC – SASAS series is presented in chart 6.3.
Chart 6.3: South African Attitudes - Index of Promise & Reservation: comparison to HSRC-SASAS data
Noting the previously mentioned methodological variations between the research instruments; all
four items were common to each of the above mentioned surveys. Despite the lower scores within
the Khayabus survey data (2015), the general result is comparable across all 3 data sets and survey
years. In the Khayabus survey, while positive in their attitudes to science, respondent reported a
lower general agreement within the scientific promise items. This appears to be consistent with the
decreasing level of scientific promise among the South African public since 1999. As an example, in
the 1999 the Evaluation of Public Opinion survey108 respondents reported 82% agreement with the
statement “Science and technology are making our lives healthier, easier and more comfortable”.
108 Precursor to the current South African Social Attitudes Survey (SASAS)
81.0
71.0 73.0
35.0
77.0
70.0 73.0
36.0
68.7 71.9 68.8
45.7
0
10
20
30
40
50
60
70
80
90
Science and technology aremaking our lives healthier,
easier and morecomfortable
Thanks to science andtechnology, there will be
more opportunities for thefuture generation
The application of scienceand new technology makesour way of life change too
fast
It is not important for me toknow about science in my
daily life
SASAS 2010 SASAS 2013 Kayabus 2015
Scientific Reservation Items Scientific Promise Items
Stellenbosch University https://scholar.sun.ac.za

192
Since then, in the 2010 SASAS survey, this dropped to 81% while in the 2013 SASAS survey the
reported figure was 77% (Reddy et al, 2015). Similarly for the scientific reservation items, while
these values appear consistent with reported values in the previous SASAS surveys, the Khayabus
results do indicate a decrease compared to previous results. The item, “The application of science
and new technology makes our way of life change too fast” received an agreement value of 68.8% in
the Khayabus 2015 survey, while in the 2 preceding SASAS surveys this item attracted marginally
higher reservation score in both 2010 and 2013. Results for the reservation item, “It is not
important for me to know about science in my daily life”, within the Khayabus survey yielded a 45.7%
agreement, however, in the 2 preceding SASAS surveys this result was much lower (see chart 6.3).
The recorded increases in negative attitudes since 1999, concerning self-reported overall
appreciation of science is noted and remains of concern.
In reviewing comparison across multi-national data109, South Africa’s general positive attitudes to
science (1.21) compares favourably with our international counterparts (see chart 6.4). The
comparison includes results from European surveys (1.41) as well as the United States of America
(1.72). India as a developing country, and a member of the BRICS collective, scored 0.80 on the index
of promise and reservation, however it should be noted that this result is from the 2005 Indian
survey, prior to a major economic upswing within India during the interim period. The results from
the 2015 Khayabus survey compare favourably to the SASAS 2013 survey results, despite the slight
decline in the ratio since the 2001 measurement by Blankley and Arnold.
Chart 6.4: South African Attitudes - Index of Promise & Reservation: International comparison
109
Periodicity of data availability for multi-national comparison remains a challenge to comparative analysis
0.80
1.41
1.72
1.28 1.20 1.21
0.00
0.20
0.40
0.60
0.80
1.00
1.20
1.40
1.60
1.80
2.00
India (2005) Europe (2012) USA (2013) South Africa(Blankley &
Arnold - 2001)
South Africa(SASAS -
2013)
South Africa(Khayabus -
2015)
Stellenbosch University https://scholar.sun.ac.za

193
An additional method of understanding attitudinal scales was developed for this study and takes a
further factor into account when trying to understand this attitudinal data. The attitudinal scales
developed for questions of this nature have traditionally included five response selection points -
from strongly agree to strongly disagree. Within a conventional index of promise and reservation
(see above), scores for the agree categories are taken into account, while the scores for the neutral
and disagree categories are not operationalised within this measure. This produces a snapshot of
agreement to selected attitudinal statements, both positive and negative and offers research a ratio
between these levels of agreement.
This approach does not take into account the potential influence of attitudinal ambivalence among
the sample, across the attitudinal statements in the questionnaire. Attitudinal ambivalence relates
to the idea that individuals or groups of individuals may have simultaneous, yet conflicting attitudes
toward the same subject or attitude object. While attitudes generally have an influence on
behaviour (positive or negative), attitudinal ambivalence often moderates this influence on
behaviour and weakens the attitudes propensity to direct behaviour. An example of this is physical
exercise – most people would agree that a daily workout routine is beneficial to the body and mind.
However many people, despite this generally positive attitude to exercise, still do not maintain a
regular training schedule. Further to this, ambivalent attitudes are also more malleable when
individuals encounter additional information on a subject matter and are likely to undergo short-
term behaviour changes as a result, which may not be sustainable or beneficial in the long term
(crash-diets or “home work-outs” are some examples).
The above relates well to the study of attitudes to science within the developing world. In bridging
the developmental divide (discussed in chapter 1) science and technology has a massive role to play
toward accelerating social and economic development. However, if attitudes to science (and
technology) are not conducive toward fostering positive behavioural and social outcomes, this may
impact any potential benefits to society. As a result, ambivalent attitudes to science are not
desirable as these are often susceptible to rapid changes upon encountering additional information
(even if non-factual) due to the relative low resilience of ambivalent attitudes. Within the evolving
South African social and knowledge economy context, the influence of ambivalent attitudes to
science may be an important consideration from a policy and planning perspective and offers a novel
way of approaching many questions surrounding attitudes to science.
Within the current dataset, it is noted that individuals may be supportive of positive scientific
advancements while simultaneously averse to any potential risks that it may pose. It should be
noted that a reasonable level of risk aversion is required toward more stable and grounded attitude
Stellenbosch University https://scholar.sun.ac.za

194
formation, be it a supportive or critical attitude. However attitudinal ambivalence is highlighted as a
particular threat toward forming meaningful and healthy altitudes to science. This crossroad
however, concurrently presents an opportunity to identify any indication of attitudinal ambivalence,
with particular reference to how the public values and engages with science. The result from within
the Khayabus survey is again presented in table 6.2 below.
Attitudinal Statement STRONGLY
AGREE AGREE
NEITHER AGREE
OR DISAGREE
DISAGREE STRONGLY DISAGREE
Item 1 (Promise 1) 31.0% 37.7% 20.5% 7.1% 3.7%
Item 2 (Reservation 1) 18.6% 29.0% 22.3% 18.6% 11.6%
Item 3 (Promise 2) 30.9% 41.0% 18.3% 6.1% 3.7%
Item 4 (Reservation 2) 30.1% 38.7% 19.5% 7.6% 4.1%
Table 6.2: Percentage scores recorded for all valid responses to the attitudes to science question set
The response data indicates an average of 20% of respondents adopted the neutral (Neither Agree
or Disagree) response option within all four survey items. In order to assess the level of ambivalence
within the sample a measure of attitudinal ambivalence was developed and applied to the
attitudinal dataset. The measure of attitudinal ambivalence was designed as an indirect measure to
examine global ambivalence and not necessarily the difference between the cognitive and
behavioural evaluations of attitudes – due to the type of data available within this study.
The approach adopted in producing the measure of attitudinal ambivalence adapted a data structure
using the 5-point coding option discussed in table 6.3. Within this coding option, the five response
options in the promise items are coded from +1 to -1 (strongly agree to strongly disagree) and this
coding is reversed for the reservation items. Don’t know responses are regarded as invalid.
PROMISE ITEMS (1 & 3)
STRONGLY AGREE AGREE NEUTRAL DISAGREE STRONGLY DISAGREE DK
1 0.5 0 -0.5 -1 8
RESERVATION ITEMS (2 & 4)
STRONGLY AGREE AGREE NEUTRAL DISAGREE STRONGLY DISAGREE DK
-1 -0.5 0 0.5 1 8
Table 6.3: Attitudinal items recoding structure
The revised coding structure was then applied to the dataset and a new variable was created to sum
the scores across all four recoded attitudinal items. A SUM_ATTITUDE score was produced for each
respondent as a result of the net-sum of the positive and negative scores attained across all four
items. The sum score range is between -4.0 to +4.0 as a result of the coding structure applied and
the number of items in the attitude scale. Within this score, a positive value reveals a greater
Stellenbosch University https://scholar.sun.ac.za

195
positive attitude, while a negative value is indicative of a more negative attitude across the four
questionnaire items. A resultant net-sum-score of zero (0) is indicative of a degree of attitudinal
ambivalence, implying that across both the promise and reservation items, respondents report
conflicting attitudes (agree / disagree with promise and reservation items). This sum attitude score
was then used to create the measure of attitudinal ambivalence by observing the score frequencies
across all items for each respondent. The result of this analysis is presented in table 6.4 below.
SCORE N % of N
mo
re C
riti
cal a
ttit
ud
es -4.0 0 0.00%
18.
40%
-3.5 0 0.00%
-3.0 2 0.10%
-2.5 9 0.30%
-2.0 19 0.50%
-1.5 48 1.40%
-1.0 177 5.10%
-0.5 386 11.10%
0 1 384 39.70% 39.70%
mo
re P
osi
tive
att
itu
de
s 0.5 548 15.70%
41.
90%
1.0 420 12.00%
1.5 232 6.70%
2.0 204 5.90%
2.5 39 1.10%
3.0 12 0.30%
3.5 2 0.10%
4.0 4 0.10%
3 486 100.00%
Table 6.4: Result of computation for the measure of attitudinal ambivalence
At an aggregate level, for scores across all questionnaire items, taking agreement, disagreement and
neutral responses into account, the majority of South Africans appear to be more positive in their
general attitudes to science. The data reveals that 18.40% of respondents reported a greater critical
attitude toward science, while 41.90% of respondents achieved a positive sum attitude score
indicative of greater positive attitudes to science (see table 6.4). Between these results however is a
large group of individuals (39.70%) that across both the scientific promise and reservations items
report a degree of attitudinal ambivalence. This is indicative of these respondents demonstrating
little differentiation between responses to promise and reservation items.
Stellenbosch University https://scholar.sun.ac.za
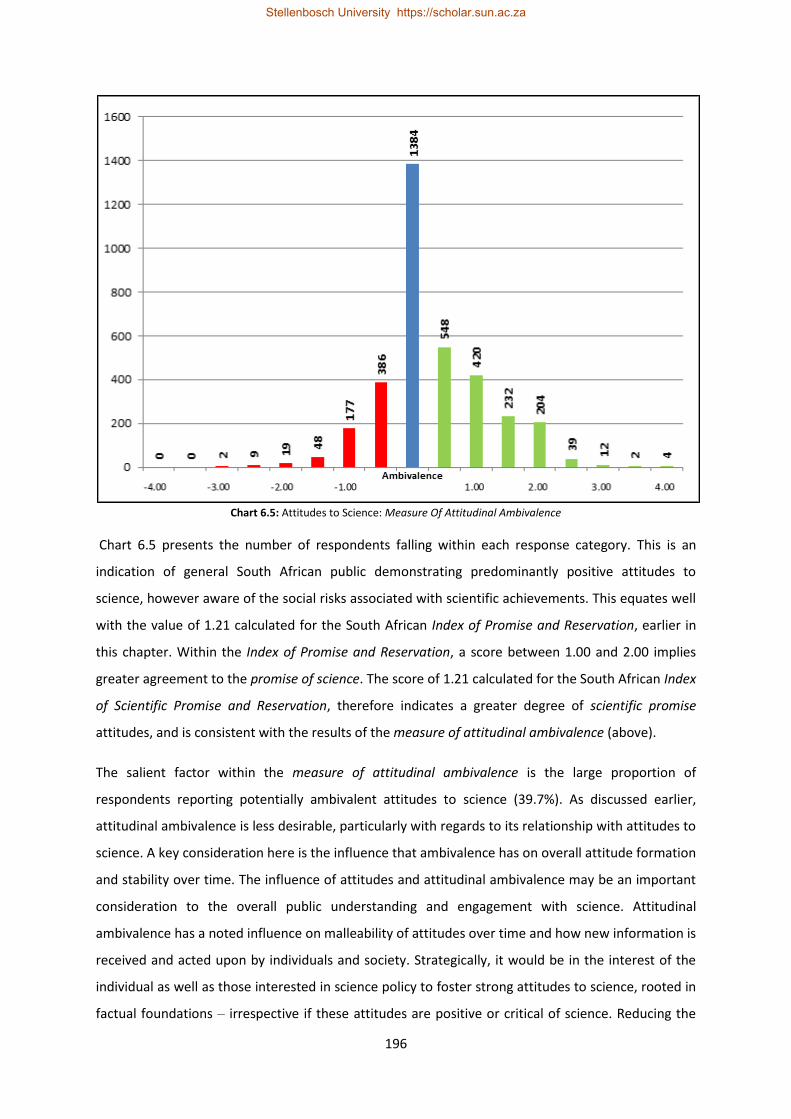
196
Chart 6.5: Attitudes to Science: Measure Of Attitudinal Ambivalence
Chart 6.5 presents the number of respondents falling within each response category. This is an
indication of general South African public demonstrating predominantly positive attitudes to
science, however aware of the social risks associated with scientific achievements. This equates well
with the value of 1.21 calculated for the South African Index of Promise and Reservation, earlier in
this chapter. Within the Index of Promise and Reservation, a score between 1.00 and 2.00 implies
greater agreement to the promise of science. The score of 1.21 calculated for the South African Index
of Scientific Promise and Reservation, therefore indicates a greater degree of scientific promise
attitudes, and is consistent with the results of the measure of attitudinal ambivalence (above).
The salient factor within the measure of attitudinal ambivalence is the large proportion of
respondents reporting potentially ambivalent attitudes to science (39.7%). As discussed earlier,
attitudinal ambivalence is less desirable, particularly with regards to its relationship with attitudes to
science. A key consideration here is the influence that ambivalence has on overall attitude formation
and stability over time. The influence of attitudes and attitudinal ambivalence may be an important
consideration to the overall public understanding and engagement with science. Attitudinal
ambivalence has a noted influence on malleability of attitudes over time and how new information is
received and acted upon by individuals and society. Strategically, it would be in the interest of the
individual as well as those interested in science policy to foster strong attitudes to science, rooted in
factual foundations – irrespective if these attitudes are positive or critical of science. Reducing the
Stellenbosch University https://scholar.sun.ac.za

197
level of attitudinal ambivalence would be particularly important within the South African setting, in
light of the strategic importance of science and technology to current and planned socio-economic
transformation programs.
Overall levels of attitudes to science are presented in table 6.5 and will be followed by a detailed
assessment of each demographic variable.
*Average VALID response Scientific Promise Items Scientific Reservations Items
AGREE NEUTRAL DISAGREE AGREE NEUTRAL DISAGREE N
NATIONAL 65.9% 18.2% 9.7% 54.6% 19.6% 19.7% 3 486
RACE N = 3 486
BLACK 64.8% 18.2% 9.8% 55.5% 19.4% 18.2% 2 523
WHITE 72.3% 17.4% 9.4% 54.8% 19.1% 25.2% 408
INDIAN / ASIAN 58.3% 19.8% 19.0% 47.9% 22.3% 27.3% 121
COLOURED 68.4% 18.4% 6.3% 51.2% 20.3% 21.1% 434
GENDER N = 3 486
FEMALE 65.5% 18.1% 9.0% 54.8% 18.9% 19.0% 1 747
MALE 66.3% 18.3% 10.3% 54.4% 20.3% 20.4% 1 739
GEOGRAPHIC LOCATION N = 3 486
URBAN 68.4% 17.9% 8.9% 55.8% 19.5% 20.1% 2 297
RURAL 61.2% 18.8% 11.1% 52.4% 19.8% 18.8% 1 189
EDUCATION N = 3 486
PRE-MATRIC 60.3% 19.4% 9.4% 50.5% 19.9% 18.9% 1 369
MATRIC COMPLETED 68.8% 17.5% 10.4% 57.2% 19.5% 20.0% 1 578
POST-MATRIC 71.8% 17.3% 8.0% 57.3% 19.3% 20.7% 539
AGE N = 3 472
<20 YEARS 72.1% 16.8% 8.8% 60.9% 19.1% 17.9% 170
20-29 YEARS 67.3% 18.0% 10.5% 55.2% 19.1% 21.3% 1 101
30-39 YEARS 67.9% 17.5% 9.4% 55.5% 19.8% 19.8% 956
40-49 YEARS 66.2% 18.0% 9.5% 55.6% 20.4% 17.6% 598
50-59 YEARS 64.1% 18.0% 7.8% 52.4% 19.0% 18.8% 372
60+ YEARS 51.3% 23.8% 10.2% 45.5% 20.9% 19.1% 275
Table 6.5: Results of Attitudes to Science by demographic classifications in Khayabus wave 2, 2015
There was a significant difference in the attitudinal response patterns of respondents from different
race-based sub-samples (X2=19.666, p < 0.01). White respondents (72.3%) more often agreed with
scientific promise items compared to coloured (68.4%); black (64.8%) and Indian / Asian (58.3%)
respondents. The variation among race groups is not as large within the items of scientific
reservation. White respondents displayed a higher propensity to agree with scientific reservation
items (54.8%) compared to black (55.5%), coloured (51.2%) and Indian / Asian (47.9%) participants.
Compared to the proportion of agree responses, the neutral and disagree options were selected
more often within the scientific reservation items (item 2 and item 4). Further to the above, within
the scientific promise items, respondents were more inclined to select the neutral response over the
disagree response, compared to the response patterns in the scientific reservation items.
Stellenbosch University https://scholar.sun.ac.za

198
Overall response, by gender groupings did not demonstrate a statistically significant association with
the overall population performance within the attitudes to science items (X2=16.121, p > 0.05). The
average proportion of females agreeing with the scientific promise items was 65.5% compared to
66.3% recorded for male participants (n = 3 486). Response to scientific reservation items yielded a
similar pattern, where male (54.4%) and female respondents (54.8%) offered comparable levels of
agreement. Within both promise and reservation items, females and males did not reveal any
significant variation in neutral and disagree responses. Despite this, within the scientific reservation
items the selection of the neutral and disagree responses were higher than among the items of
scientific promise for both genders. This may be indicative of the likelihood that attitudes to science
in South Africa may not be directed exclusively by gendered variance as much as other aspects of the
general public understanding of science.
The role of geographic location was assessed within each of the South African provincial
demarcations as well as by the rural / urban classification. Analysis of the overall response to
attitudinal items by province showed a statistically significant difference in the recorded scores
(X2=301.952, p < 0.001). This outcome may not be as a direct result of the influence of provincial
location, however may be due to the influence of interrelated socio-demographic variables
moderating this recorded response. The response variation on the attitudes to science measure by
rural / urban classification was not found to be statistically significant (X2=14.147, p > 0.05). Details
of these variations within geographic location classifications will be addressed in greater details in
the following sub-section.
Respondent educational attainment was found to be a significantly associated with attitudinal item
response (X2=44.541, p < 0.05). Respondents with pre-matric educational attainment demonstrated
a lower propensity to offer agreement to items of scientific promise (60.3%) compared to those with
post-matric educational qualifications (71.8%). Response within the scientific reservation items did
not deviate from the established pattern when considered with educational attainment. A greater
proportion of respondents were inclined to disagree with items of scientific reservation, than within
the items of scientific promise, though this was not entirely unexpected.
At an aggregate level, age of respondents did not demonstrate a statistically significant association
to performance on the four attitudinal items in the questionnaire (X2=81.761, p > 0.05).
Stellenbosch University https://scholar.sun.ac.za

199
EXPLORATORY ANALYSIS OF VARIABLES CORRELATING WITH ATTITUDES TO SCIENCE
CHAID analysis was again employed to identify relationships between demographic variables within
this research. The analysis was completed adopting the composite score across all four attitudinal
items, and used the following variables within this analysis: household income; employment; gender;
race; educational attainment; geographic location (rural-urban); and age.
Figure 6.1: Output of CHAID analysis: Attitudes to Science
CHAID outputs revealed that only the race variable was found to be a suitable predictor of
respondent attitude to science. Accounting for the known influence that race dynamics exert in
South Africa, a step-wise elimination process was undertaken, removing variables from the CHAID
analysis and observing the outcomes. After removing the race variable, the next most important
predictor was found to be geographic location; however this was not the case with the
reintroduction of the race variable. Each of these variables will be explored in some detail across the
next sub-section of this chapter as well as informing the selection of the variables included within
the multinomial logistic regression models, in a later chapter.
The following subsection of this chapter will address the above demographic variations in greater
detail. The variables to be explored include: race and geographic location.
Stellenbosch University https://scholar.sun.ac.za

200
ATTITUDES TO SCIENCE BY RACE
A statistically significant difference was observed within the attitudinal response patterns of
respondents from different race classifications (X2=19.666, p < 0.01). Among all attitudinal items, a
statistically significant association was observed for responses to attitudinal items and race group
affiliation (Item 1 (P): X2=54.942, p < 0.001; Item 3 (P): X2=39.244, p < 0.001; Item 2 (R): X2=41.320, p
< 0.001; Item 4 (R): X2=49.962, p < 0.001).
Chart 6.6: Attitudinal response to scientific promise items by race
Within the scientific promise items; a greater proportion of white, black and coloured respondents
offered a higher agreement with the attitudinal statements. However, among Indian / Asian
respondents, despite demonstrating the lowest level of agreement within these items, similarly
reported the largest proportion of disagree response compared to their counterparts (see chart 6.6).
Reviewing the results for the scientific reservation items; the vast majority of respondents agree that
the scientific advancement introduces rapid change to their way of life110. Similarly, a larger share of
the sample across all race groups agreed that it is important for them [me] to know about science in
their [my] daily life. However it is essential to note that the overall level of agreement within this
item (Item 2) is lower than the previous scientific reservation item, yet in most cases was higher than
the level of disagreement (see chart 6.7). This is not reflected among the Indian / Asian sub-sample,
wherein a greater share of response (39.7%) recorded disagreement with this scientific reservation
item (Item 2) compared to those offering agreement (35.5%).
110
Item text: The application of science and new technology makes our way of life change too fast
9.6%
71.6%
9.3%
73.0%
10.4%
63.3%
9.2%
66.4%
21.5%
57.9%
16.5%
58.7%
6.0%
66.1%
6.7%
70.7%
0% 10% 20% 30% 40% 50% 60% 70% 80% 90% 100%
DISAGREE
AGREE
DISAGREE
AGREE
Scie
nce
an
d t
ech
no
logy
are
mak
ing
ou
r liv
esh
eal
thie
r, e
asie
r an
d m
ore
com
fort
able
Than
ks t
o s
cien
ce a
nd
tech
no
logy
, th
ere
will
be
mo
re o
pp
ort
un
itie
s fo
rth
e fu
ture
ge
ne
rati
on
PR
OM
ISE
White Black Indian / Asian Coloured
Stellenbosch University https://scholar.sun.ac.za

201
Chart 6.7: Attitudinal response to scientific reservation items by race
The proportion of respondents selecting a neutral response did not differ for black, coloured and
white respondents; however the Indian / Asian sub-sample did select this option more frequently
(see chart 6.7).
The earlier discussed index of scientific promise and reservation was produced for individual race
group classifications and is discussed below in conjunction with chart 6.8. Within all race groups
there remains an overall attitude of scientific promise; however there were noted variations across
race groups for this index.
Chart 6.8: Index Of Scientific Promise and Reservation by race
White; coloured and Indian / Asian respondents presented a higher ratio of scientific promise to
scientific reservation scores, all of which were above the value recorded for the national population
(1.21). Coloured respondents achieved the highest promise-reservation index ratio of 1.34; followed
by white (1.32) and Indian / Asian respondents (1.22). Among black participants this ratio was 1.17.
Overall, coloured respondents achieved a promise-reservation ratio score 10.7% higher than the
17.2%
63.7%
33.3%
45.8%
9.4%
65.5%
26.9%
45.5%
14.9%
60.3%
39.7%
35.5%
12.9%
60.1%
29.3%
42.2%
0% 10% 20% 30% 40% 50% 60% 70% 80% 90% 100%
DISAGREE
AGREE
DISAGREE
AGREETh
e ap
plic
atio
n o
fsc
ien
ce a
nd
new
tech
no
logy
mak
es
ou
rw
ay o
f lif
e ch
ange
to
ofa
st
It is
no
t im
po
rtan
t fo
rm
e to
kn
ow
ab
ou
tsc
ien
ce in
my
dai
ly li
fe
RES
ERV
ATI
ON
White Black Indian / Asian Coloured
0.7
0
0.7
2
0.6
5
0.5
8
0.6
8
0.5
8
0.5
5
0.5
5
0.4
8
0.5
1
1.21 1.32
1.17 1.22 1.34
0.00
0.50
1.00
1.50
South Africa White Black Indian - Asian Coloured
Promise Index Score (2015) Reservation Index Score (2015) Promise - Reservation Ratio (2015)
Stellenbosch University https://scholar.sun.ac.za

202
national average (1.21), followed by white (+9.4%) and Indian / Asian respondents (+0.7%). At the
overall level, black respondents scored -3.2% compared to the national average. While this remains
indicative of a greater sense of scientific promise within the black sub-sample, the lower result on
this index does identify an opportunity to investigate the reasons for this attitudinal position among
this sub-sample.
The degree of ambivalence within attitudes to science for the four race groups were assessed using
the measure of attitudinal ambivalence. By race classification, coloured respondents were found to
display a greater degree of positive attitudes toward science, compared to white, Indian / Asian and
black respondents. Results for the measure of attitudinal ambivalence reflect a similar pattern of
response within race groups.
Across all attitudinal items, respondents self-identifying with the coloured race group demonstrated
the highest net-positive attitudinal score (48.8%); while 14.1% of respondents within this sub-sample
achieved an attitudinal net-score within the negative range. However, among the 434 individual
respondents comprising this sub-sample, 37.1% achieved an attitudinal net-score equal to zero (0),
indicating a degree of altitudinal ambivalence within this cohort of the total sample (see chart 6.9).
Among the sub-sample of 408 white respondents, 48.3% achieved a net-sum attitudinal score within
the positive range while 19.4% produced a score within the negative range. This share represents
the largest proportion of net-sum negative attitudinal scores among all race groups. Members of the
white race group attained the lowest score on the measure of attitudinal ambivalence, with 32.4%
(132) of respondents achieving a net-sum score equal to zero (0).
Stellenbosch University https://scholar.sun.ac.za
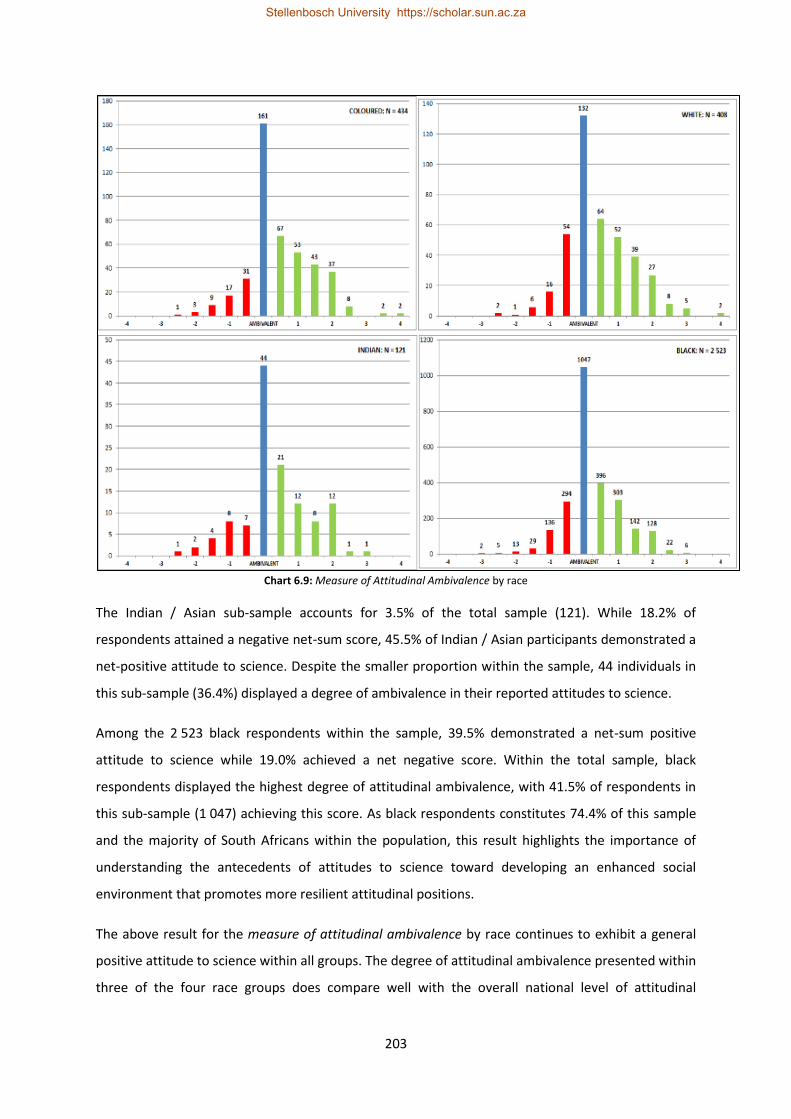
203
Chart 6.9: Measure of Attitudinal Ambivalence by race
The Indian / Asian sub-sample accounts for 3.5% of the total sample (121). While 18.2% of
respondents attained a negative net-sum score, 45.5% of Indian / Asian participants demonstrated a
net-positive attitude to science. Despite the smaller proportion within the sample, 44 individuals in
this sub-sample (36.4%) displayed a degree of ambivalence in their reported attitudes to science.
Among the 2 523 black respondents within the sample, 39.5% demonstrated a net-sum positive
attitude to science while 19.0% achieved a net negative score. Within the total sample, black
respondents displayed the highest degree of attitudinal ambivalence, with 41.5% of respondents in
this sub-sample (1 047) achieving this score. As black respondents constitutes 74.4% of this sample
and the majority of South Africans within the population, this result highlights the importance of
understanding the antecedents of attitudes to science toward developing an enhanced social
environment that promotes more resilient attitudinal positions.
The above result for the measure of attitudinal ambivalence by race continues to exhibit a general
positive attitude to science within all groups. The degree of attitudinal ambivalence presented within
three of the four race groups does compare well with the overall national level of attitudinal
Stellenbosch University https://scholar.sun.ac.za
204
ambivalence (39.7%). Within the race group sub-samples, white (-7.3%), Indian / Asian (-3.3%) and
coloured (-2.6%) respondents all achieved attitudinal ambivalence scores below the level recorded in
the national average. Respondents within the black sub-sample displayed a degree of attitudinal
ambivalence +1.8% above the recorded national average for this survey. In the absence of any
acceptable benchmarking values, it remains challenging to ascertain if this is indeed an area of
immediate concern. Regardless of this dearth of comparative information, there remains a
longitudinal concern around the influence of attitudes to science on overall public understanding
and engagement activities. Furthermore the above result, across race groups remains clear evidence
of the impact of race dynamics in South Africa on attitudes to science. This should receive ongoing
research focus to better understand the complex of interacting variables influencing these results.
ATTITUDES TO SCIENCE BY GEOGRAPHIC LOCATION
National results indicate no significant association between rural / urban geographic location and
attitudes to science (X2=4.923, p > 0.05). However among each of the four attitudinal items in the
questionnaire a significant association was shown between the response to the items and the rural /
urban geographic location classification of respondents.
At an aggregate level, a greater proportion of urban respondents expressed agreement toward
scientific promise items (68.4%), compared to rural respondents (61.2%). Similarly, fewer urban
respondents elected to use the neutral and disagree response options. Scientific reservation Items
were more frequently agreed to by urban respondents (55.8%) compared to rural participants
(52.4%). There was a minimal proportional variance between rural and urban response to the
neutral and disagree options (see table 6.5).
Significantly more urban respondents reported agreement to scientific promise items compared to
respondents within the rural sub-sample. Within promise item 1111, urban respondents selected the
agree response 7.4% more frequently than rural respondents. Within the results for promise item
2112 urban respondents selected the agree option 6.9% more than individuals from rural locations
(Item 1 (P): X2=31.727, p < 0.001; Item 3 (P): X2=29.603, p < 0.001). A greater proportion of rural
respondents were inclined to select the disagree option, compared to urban respondents. While
overall, both rural and urban respondents provided a higher proportion of agree response to all
promise items, the variations in response patterns are noted (see chart 6.13).
111
Item text: Science and technology are making our lives healthier, easier and more comfortable 112
Item text: Thanks to science and technology, there will be more opportunities for the future generation
Stellenbosch University https://scholar.sun.ac.za

205
Chart 6.13: Attitudinal response to scientific promise items by geographic location group
Results for the two scientific reservation items are presented in chart 6.14. Responses for
questionnaire item 4113 reveals a statistically significant higher proportion of urban respondents
(66.3%) indicate agreement with this statement compared to rural respondents (60.8%). A higher
proportion of rural respondents indicate disagreement with this statement (11.9%) compared to
urban participants (10.5%). More urban respondents (45.2%) agreed with questionnaire item 2114
than rural respondents (43.9%). Disagreement with this item was aggregated to 25.8% of the rural
population while 29.7% of urban respondents disagreed with this statement (Item 2 (R): X2=29.995,
p < 0.001; Item 4 (R): X2=29.225, p < 0.001).
Chart 6.15: Attitudinal response to scientific reservation items by geographic location group
113
Item text: The application of science and new technology makes our way of life change too fast 114
Item text: It is not important for me to know about science in my daily life
9.4%
67.0%
8.4%
69.8%
11.5%
59.5%
10.7%
62.9%
0% 10% 20% 30% 40% 50% 60% 70% 80% 90% 100%
DISAGREE
AGREE
DISAGREE
AGREESc
ien
ce a
nd
tec
hn
olo
gyar
e m
akin
g o
ur
lives
he
alth
ier,
eas
ier
and
mo
re c
om
fort
able
Than
ks t
o s
cien
ce a
nd
tech
no
logy
, th
ere
will
be
mo
re o
pp
ort
un
itie
s fo
rth
e fu
ture
ge
ne
rati
on
PR
OM
ISE
URBAN RURAL
29.7%
45.2%
10.5%
66.3%
25.8%
43.9%
11.9%
60.8%
0% 10% 20% 30% 40% 50% 60% 70% 80% 90% 100%
DISAGREE
AGREE
DISAGREE
AGREE
It is
no
t im
po
rtan
t fo
rm
e to
kn
ow
ab
ou
tsc
ien
ce in
my
dai
ly li
fe
The
app
licat
ion
of
scie
nce
an
d n
ewte
chn
olo
gy m
ake
s o
ur
way
of
life
chan
ge t
oo
fast
RES
ERV
ATI
ON
URBAN RURAL
Stellenbosch University https://scholar.sun.ac.za

206
Across all attitudinal items, responses within the neutral115 category averaged to 19.0%. Item 2
attracted the highest proportion of neutral responses among all the items in the question set, with
20.7% of urban respondents and 21.5% of rural respondents providing this response. Rural
respondents were more likely to select the don’t know response option, with average selection
being 2.8% higher than for the urban sub-sample.
The overall level of scientific attitudes was assessed for the rural / urban geographic location groups
using the index of scientific promise and reservation. Chart 6.15 illustrates the general attitudes to
science within both urban and rural sub-samples alongside the national average.
The outputs for the indices of scientific promise and reservation among both the urban and rural
sub-samples indicate a lower level of scientific promise among rural respondents, while a higher
level of scientific reservation within the urban sample. This resulted in the urban sample achieving a
ratio of scientific promise to scientific reservation of 1.23, while rural respondents achieved a ratio
of 1.17. This indicates that urban respondents within this study are more likely to demonstrate
stronger attitudes of scientific promise compared to their rural counterparts. It should however be
noted that the value for the rural index of 1.17 is still indicative of greater overall attitudes of
scientific promise, however it remains lower than the value among the urban sub-sample and that of
the national average (1.21).
Chart 6.15: Index of scientific promise and reservation by rural / urban location group
The results of this analysis by rural / urban classifications may be indicative of related developmental
disparities between rural and urban locations that may influence access to services, education,
technology and related areas influencing overall attitude formation. Furthermore, South Africa’s
115
Response category text: Neither Agree Or Disagree
0.70
0.68 0.61
0.58
0.56 0.52
1.21 1.23 1.17
0.00
0.20
0.40
0.60
0.80
1.00
1.20
1.40
South Africa URBAN RURAL
Promise Index Score (2015) Reservation Index Score (2015) Promise - Reservation Ratio (2015)
Stellenbosch University https://scholar.sun.ac.za

207
rural population is predominantly made up of members of the black race group (84.8% in this
sample), which related to the aforementioned developmental context and the lower result within
the race group analysis may further be influencing this output.
The above discussion on the index of scientific promise and reservation has drawn attention to the
existence of greater overall attitudes of scientific promise within both rural and urban sub-samples.
Data outputs from the measure of attitudinal ambivalence confirms that among urban respondents
a greater proportion of participants achieved a net-positive attitudinal score (43.8%) compared to
rural respondents (38.2%). This remains consistent with the above finding indicating a higher
likelihood of urban respondents exhibiting more positive attitudes toward science compared to rural
respondents, despite the overall general positive attitudes across both location groups. Within the
rural sub-sample, 18.9% of respondents achieved a net- negative attitudinal score compared to
18.1% among the urban sub-sample.
Chart 6.16: Measure of Attitudinal Ambivalence by location groups
Within the urban sample, 38.0% of respondents reported a degree of attitudinal ambivalence,
compared to 42.9% of rural respondents. This proportion was lower than the overall national result
on the measure of attitudinal ambivalence (39.7%) among the urban sub-sample, however was 3.2%
higher than the national average among the rural sub-sample. As discussed under the results of the
index of promise and reservation the factors explaining this variance may be many fold, however
almost certainly these would be as a result of interactions between the geographic location and
related demographic variables within the sample.
Stellenbosch University https://scholar.sun.ac.za

208
Conclusion
South Africans display an overall positive attitude toward science within the results presented in this
chapter. In general 70.3% of South Africans agreed with scientific promise items, while there was a
moderate level of agreement (58.1%) within the scientific reservation items. The general positive
attitudinal position with regards to science is an encouraging output from within this research and
highlights a strategic benefit toward science communication and the general public understanding of
science in South Africa.
This positive view toward the contribution of science to everyday life among South Africans is shared
across all race groups. While a generally higher positive agreement was attained within all groups,
among the Indian / Asian sub-sample the proportion of agreement to promise and reservation items
was lowest compared to their counterparts. Males and females did not differ significantly within
their positive attitudinal response regarding science. Within location classifications, rural
respondents appeared to hold less positive attitudes with regards to the contribution of science to
daily life, compared to urban respondents. Participants with a higher level of educational attainment
were significantly more positive, compared to respondents within the lower educational attainment
categories. South Africans between the age of 20-39 and 50-59 years old displayed similarly strong
positive scientific attitudes. Individuals younger than 20 and those older than 60 years displayed
weaker positive attitudes within their response to these questionnaire items.
The index of scientific promise and reservation presents a ratio of scores attained within the
scientific promise and those obtained within the scientific reservation items. The ratio obtained by
the entire South African population was 1.21. This result is in confirms to the outcome of the
attitudinal measurement items, wherein a larger agreement with the positive attitudinal items is
presented in this chapter. Further to the above, this result compares favourably to previous studies
conducted in South Africa producing this index, while demonstrating some variation to international
counterparts. Within race groups, coloured respondents achieved the highest ratio for this index
(1.34) while white respondents produced a result of 1.32. Both these race groups therefore achieved
a higher index score than the national average and indicated stronger positive attitudes to science.
Among Indian / Asian respondents (1.22) and black respondents (1.17), a lower ratio was achieved,
indicating weaker positive attitudes in these demographic groups. Males demonstrated a slightly
stronger positive attitude to science within this index (1.22) compared to females (1.20), however
this was not found to be statistically significant. As per the expectation, urban respondents displayed
generally stronger positive attitudes to science (1.23) compared to rural respondents (1.17).
Similarly, respondents with increased educational attainment presented the strongest positive
Stellenbosch University https://scholar.sun.ac.za

209
attitudes. Respondents in all age groups displayed positive attitudinal response, though there were
variations in the strength of these positive attitudes across classifications.
Within these attitudinal responses there were high levels of agreement with both scientific promise
and scientific reservation items. Simultaneous positive and negative positions lead to a degree of
attitudinal ambivalence. Within the overall South African population, a larger share of respondents
indicated a positive attitudinal position, however 39.7% of respondents (n=3 486) indicated an
overall attitudinal ambivalence with regards to science. This is of concern as it may lead to increased
malleability of attitudes to science, particularly within demographic segments with weaker positive
promise-reservation ratios tending closer to 1.00. These results also reflected some degree of
variability with respect to race group classification. White (32.4%) respondents reported the lowest
degree of ambivalence compared to Indian / Asian (36.4%) and coloured (37.1%) respondents. The
level of attitudinal ambivalence within the black race group was measured at 41.5%.
As a result of this race group accounting for the largest share of the national population, changes in
attitudinal positions within this group due to this ambivalence would have significant impacts on the
overall South African public understanding of science. Similarly, female respondents demonstrated a
higher degree of attitudinal ambivalence (40.4%) compared to males. This result is further echoed
within the location variable, wherein 38.0% of urban respondents report a degree of attitudinal
ambivalence, while 42.9% of rural respondents reflect this attitudinal position. Within the
educational attainment categories respondents with pre-matric education demonstrate a degree of
ambivalence measured at 41.9%, while 37.8% report this position within the completed matric sub-
sample. Interestingly, respondents with a post-matric education report a higher degree of attitudinal
ambivalence, 1.9% higher than those with a completed matric, which does indicate a greater critical
attitudinal position within this cohort. Younger respondents generally displayed a lower degree of
attitudinal ambivalence compared to those in older age groups. Respondents older than 60 years
demonstrated the highest degree of attitudinal ambivalence (45.8%). This highlights the important
influence of age with respect to the legacy impacts of apartheid and the influence this may have on
attitudes to science among older South Africans.
Stellenbosch University https://scholar.sun.ac.za

210
Chapter Seven
Descriptive Survey Results:
Interest in Science
Science is simply the word we use to describe the method of organizing our curiosity and interest in the world around us.
Tim Minchin (2013)
Introduction
Insight into the level of interest in areas of scientific advancement is a necessary precursor to the
measurement of general public understanding and engagement activities. Interest in science would
moderate information seeking behaviour, knowledge and ultimately participation in scientific
discussions and engagement activities.
Based on this foundation, this research adopted interest in science as an important element of the
overall South African public understanding of science.
OVERALL NATIONAL RESULTS FOR INTEREST IN SCIENCE ASSESSMENT ITEMS116
Chart 7.1: Overall result: South African Interest in Science assessment (valid %)
The response category attracting the highest proportion of valid response was consistently the no
interest option (see chart 7.1). Overall response patterns at each item then reveal that respondents’
116
The results of the reliability analyses are found in Appendices 2 to 7 (Page 410 - 442).
31
.3%
24
.0%
24
.2%
23
.0%
24
.7%
17
.7%
13
.2%
33
.3%
35
.9%
35
.0%
33
.8%
31
.7%
34
.3%
26
.9%
35
.5%
40
.1%
40
.8%
43
.2%
43
.6%
48
.0%
59
.9%
0.0%
10.0%
20.0%
30.0%
40.0%
50.0%
60.0%
70.0%
Technologyand theInternet
Climate Change Economics Energy MedicalScience
Politics Astronomy
Very Interested Moderately Interested No Interest
Stellenbosch University https://scholar.sun.ac.za

211
next most frequent selection was within the moderately interested category, and the lowest
proportion of response was within the very interested option.
It remains important to note that among the three response categories, a two-level expression of
interest is recorded within the very interested and moderately interested categories, while no
interest is recorded within a single response option. Within this assessment of respondents’ interest
in science, it then became valuable to combine the response options for the very interested and
moderately interested options into a single SUM Interested response reporting format. Wherever
possible the SUM Interested responses will be disaggregated to ensure that the reporting is still able
to convey a sense of the interest intensity within the original data.
Chart 7.2 presents the revised SUM interest reporting option. The category attracting the highest
level of overall interest was technology and the internet (64.5% - 31.3%*117). This was followed by
the interest areas for climate change (59.9% - 24.0%*); economics (59.2% - 24.2%*); energy (56.8% -
23.0*) and medical science (56.4% - 24.7%*).
Chart 7.2: Overall result: South African Interest in Science assessment (combined interest categories)
The interest area for astronomy was the only item that attracted a higher proportion of no interest
responses (59.9%). Data from within the scientific knowledge assessment, revealed a similar
response pattern, where South Africans in general were less knowledgeable on aspects related to
astronomy - with only 28.4% of respondents able to provide a scientifically correct response to the
astronomy related item (see chapter five).
117
* will denote the proportion within the reported SUM interested value that reported into the very interested response
option
Stellenbosch University https://scholar.sun.ac.za

212
Response within the very interested response category for this survey was compared to response
within the same category from the HSRC-SASAS (2013) data. The HSRC questionnaire for the 2013
iteration of the SASAS survey had 5 of the 7 items in common with the current research
instrument118. The highest ranked interest item in the HSRC-SASAS (2013) data was the medical
sciences (52.0%) followed by climate change (31.0%) then technology and the internet (28.0%). Items
related to economics (15.0%) and astronomy (13.0%) attracted the lowest interest scores (see chart
7.3).
Chart 7.3: Interest in Science: Comparison to SASAS (2013) data (very interested responses only)
Comparing the HSRC-SASAS (2013) data and the data from within the current study, large variations
were recorded with the medical science (Khayabus: -28.9%) as well as the climate change (Khayabus:
-8.6%) interest areas. Technology and the internet recorded similar values to those reported in the
2013 SASAS study, while the area of economics demonstrated a 7.9% increase on the value reported
in 2013. In both studies the area of astronomy achieved the lowest proportional expression of
interest, with a marginally higher level recorded in 2013.
Result from the interest in science measure will be further explored by the various demographic
classifications within the next part of this chapter.
The data will be presented thematically by the following classifications: population group; gender;
geographic location; educational attainment and age.
There was a significant difference in the level of interest in science for respondents from different
race groups (X2=68.117, p < 0.001). White respondents demonstrated a higher likelihood of being
118
Both this survey and the HSRC-SASAS survey included items for: technology and the internet; climate change; economics; medical science and astronomy. The SASAS 2013 questionnaire did not feature items for energy or politics
29
.5%
22
.4%
22
.9%
23
.1%
21
.4%
16
.9%
11
.9%
28
.0%
31
.0%
15
.0%
52
.0%
13
.0%
0%
10%
20%
30%
40%
50%
60%
Technology andthe Internet
Climate Change Economics Medical Science Energy Politics Astronomy
Very Interested only SASAS 2013 (Reddy et al)
Stellenbosch University https://scholar.sun.ac.za

213
interested (SUM interest) in any of the 7 questionnaire items (60.0%); followed by black respondents
(53.3%) and then Indian / Asian respondents (44.5%). Coloured respondents presented the lowest
SUM interest in science proportion, with only 39.6% indicating a level of interest across the any of
the 7 items.
Gender did not demonstrate a statistically significant influence for the overall population level of
interest in science across the items (X2=2.041, p > 0.05). The average proportion of female
respondents expressing SUM interest across the 7 items was 49.6% compared to 54.6% recorded for
male participants (n = 3 486). This remains consistent with research indicating greater male interest
in science; however, within this study it was not found to be statistically significant at an aggregate
level.
*Average across 7 interest areas
Very Interested
Moderately Interested
No Interest
D/K N
NATIONAL 21.2% 30.9% 41.5% 6.4% 3 486
RACE N = 3 486
BLACK 22.3% 31.0% 39.1% 7.6% 2 523
WHITE 25.2% 34.8% 38.9% 1.1% 408
INDIAN / ASIAN 20.5% 24.0% 53.2% 2.3% 121
COLOURED 11.2% 28.4% 54.5% 5.9% 434
GENDER N = 3 486
FEMALE 20.0% 29.6% 43.4% 7.0% 1 747
MALE 22.4% 32.2% 39.6% 5.8% 1 739
GEOGRAPHIC LOCATION N = 3486
URBAN 23.2% 32.0% 40.0% 4.8% 2 297
RURAL 17.3% 28.8% 44.5% 9.4% 1 189
EDUCATION N = 3486
PRE-MATRIC 15.5% 27.5% 46.8% 10.2% 1 369
MATRIC COMPLETED 22.8% 32.7% 40.2% 4.3% 1 578
POST-MATRIC 30.7% 34.2% 31.9% 3.2% 539
AGE N = 3 472
<20 YEARS 26.6% 28.6% 38.2% 6.6% 170
20-29 YEARS 23.7% 31.4% 39.8% 5.0% 1 101
30-39 YEARS 20.8% 32.2% 40.4% 6.5% 956
40-49 YEARS 18.8% 32.1% 43.0% 6.1% 598
50-59 YEARS 19.4% 30.1% 42.2% 8.2% 372
60+ YEARS 15.2% 25.0% 50.2% 9.7% 275
Table 7.4: Results of Interest in Science by demographic classifications in Khayabus wave 2, 2015
The association of geographic location with interest in science was assessed by each of the 9 South
African provinces as well as by the rural / urban classification. Both location classification categories
were found to be significantly associated with the measure of interest in science (Province:
X2=214.270, p < 0.001; Rural / Urban: X2=18.334, p < 0.001). Within the rural / urban classification
significantly more urban respondents (55.2%) reported interest across the question set, compared to
Stellenbosch University https://scholar.sun.ac.za

214
rural respondents (46.1%). Provincial location revealed that the province reporting the highest
(SUM) interest in science across the 7-items was Gauteng (61.6%); Mpumalanga (58.9%) followed by
KwaZulu Natal (52.1%) and the Limpopo province (51.3%). The remaining five provincial areas
achieved a SUM interest result below 50%.
Educational attainment was found to be a highly significant factor on overall interest in science
(X2=65.349, p < 0.001). Respondents with pre-matric educational attainment demonstrated a
significantly lower reported level of (SUM) interest in science (43.0%) compared to respondents with
post-matric education (64.9%).
At the national aggregate level, respondent age classifications did not demonstrate a statistically
significant association with interest in science measures (X2=15.904, p > 0.05). Respondents younger
than 50 years generally reported higher interest in science, while those older than 50 years report
interest levels below 50%. Those older than 60 years reported the lowest interest in science (40.2%)
among all age classifications.
EXPLORATORY ANALYSIS OF VARIABLES CORRELATING WITH INTEREST IN SCIENCE
CHAID analysis was employed to ascertain the relationships between the various demographic
variables discussed above. The demographic variables included within the analysis included gender;
race; household income; educational attainment; geographic location (rural-urban); employment
and age. The CHAID outputs will be valuable in understanding the relationships between the
variables listed as well as how they best combine to explain respondent interest in science.
The output of the CHAID analysis is presented graphically in figure 7.1 below. Results indicate that
the variables best predicting respondent interest in science are educational attainment; race and
geographic location. Respondents with a post-matric education record the highest interest in
science, 12% percentage points higher than the sample average (All: 32.4%). Respondents self-
reporting into the black, white and Indian / Asian sub-samples, having completed matric, similarly
report higher levels of interest in science.
Stellenbosch University https://scholar.sun.ac.za
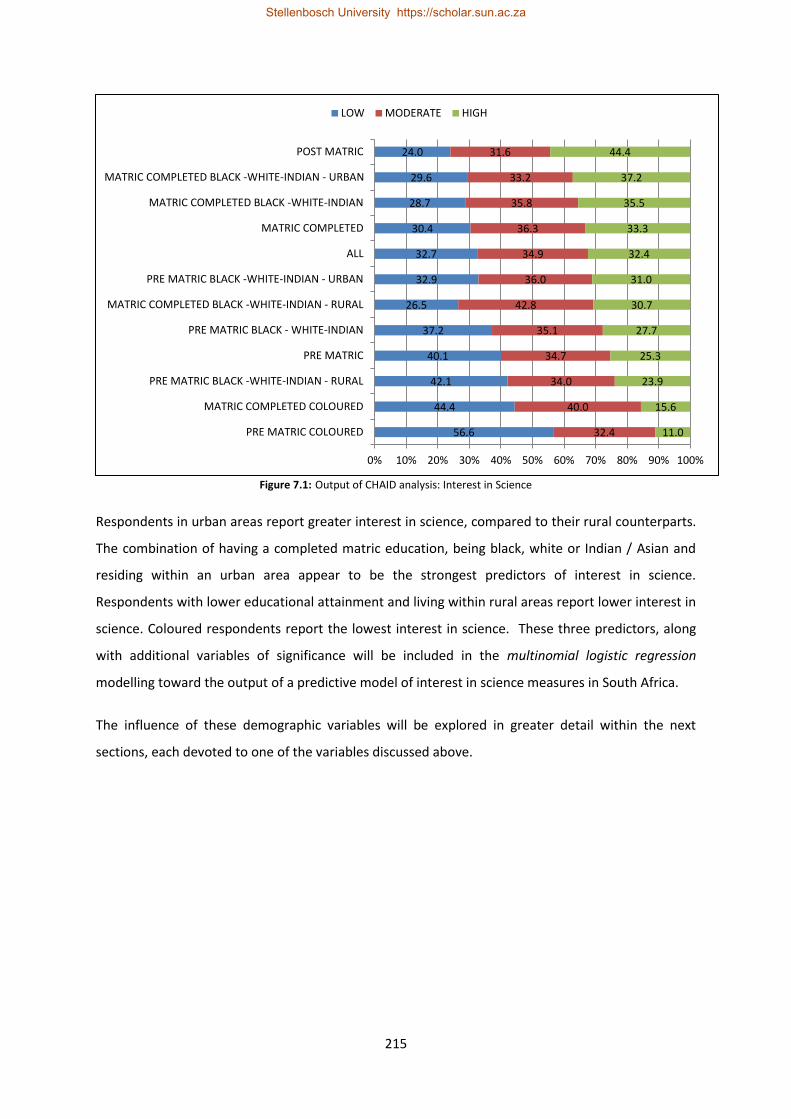
215
Figure 7.1: Output of CHAID analysis: Interest in Science
Respondents in urban areas report greater interest in science, compared to their rural counterparts.
The combination of having a completed matric education, being black, white or Indian / Asian and
residing within an urban area appear to be the strongest predictors of interest in science.
Respondents with lower educational attainment and living within rural areas report lower interest in
science. Coloured respondents report the lowest interest in science. These three predictors, along
with additional variables of significance will be included in the multinomial logistic regression
modelling toward the output of a predictive model of interest in science measures in South Africa.
The influence of these demographic variables will be explored in greater detail within the next
sections, each devoted to one of the variables discussed above.
56.6
44.4
42.1
40.1
37.2
26.5
32.9
32.7
30.4
28.7
29.6
24.0
32.4
40.0
34.0
34.7
35.1
42.8
36.0
34.9
36.3
35.8
33.2
31.6
11.0
15.6
23.9
25.3
27.7
30.7
31.0
32.4
33.3
35.5
37.2
44.4
0% 10% 20% 30% 40% 50% 60% 70% 80% 90% 100%
PRE MATRIC COLOURED
MATRIC COMPLETED COLOURED
PRE MATRIC BLACK -WHITE-INDIAN - RURAL
PRE MATRIC
PRE MATRIC BLACK - WHITE-INDIAN
MATRIC COMPLETED BLACK -WHITE-INDIAN - RURAL
PRE MATRIC BLACK -WHITE-INDIAN - URBAN
ALL
MATRIC COMPLETED
MATRIC COMPLETED BLACK -WHITE-INDIAN
MATRIC COMPLETED BLACK -WHITE-INDIAN - URBAN
POST MATRIC
LOW MODERATE HIGH
Stellenbosch University https://scholar.sun.ac.za

216
INTEREST IN SCIENCE BY RACE
The overall national result for interest in science by race yielded a statistically significant association
between these variables (X2=68.117, p < 0.001). White respondents reported a higher interest in
science (60.0% - *25.2%119) compared to other race groups. Black respondents reported the second
highest interest in science (53.3%) wherein 22.3% indicated that they were very interested across the
7-items in the question set. Indian / Asian respondents reported lower interest in science (44.5% - *
20.5%), while coloured respondents reported the lowest overall interest across all questionnaire
items (39.6% - *11.2%).
Chart 7.5: Average response by population group: Interest in Science assessment
Black and white respondents reported proportionally similar values within the no interest response
category while Indian / Asian and coloured respondents demonstrated similar response patterns.
White (1.1) and Indian / Asian (2.2%) participants reported the lowest overall response within the
don’t know option while coloured (5.9%) and black (7.6%) respondents selected this option
significantly more frequently.
Within race classifications there were variations in the ranking of the 7 scientific-interest areas.
White respondents report the highest interest proportion within the technology and the internet
(71.3%) item; followed by climate change (66.9%); economics (65.9%); energy (62.0%) and issues
related to medical science (61.3%). Respondents within this demographic classification did not
demonstrate high interest in politics (47.5%) while similarly reporting the lowest level of interest
119
As above, * will denote the proportion within the reported SUM interested value that reported into the Very Interested response option
25.2% 22.3% 20.5% 11.2%
21.2%
34.8% 31.0%
24.0%
28.4%
30.9%
38.9%
39.1% 53.2% 54.5%
41.5%
1.1% 7.6%
2.2% 5.9% 6.4%
0%
10%
20%
30%
40%
50%
60%
70%
80%
90%
100%
White Black Indian / Asian Coloured National Average
VERY INTERESTED MODERATELY INTERESTED NO INTEREST DON’T KNOW
Stellenbosch University https://scholar.sun.ac.za

217
toward astronomy (45.1%). The items politics and astronomy further received the highest level of no
interest responses within the white sub-sample (see chart 7.6).
Chart 7.6: Average response by white subsample: Interest in Science assessment
Black respondents reported the highest interest within the technology and the internet (61.7%) item;
followed by economics (57.5%); climate change (56.2%) and energy (54.0%). Politics (53.3%), among
this sub-sample was ranked equally high to medical science (53.3%), while astronomy was the lowest
ranked interest area (37.1%). The proportion of black respondents selecting the don’t know response
option was significantly higher than in other race groups (overall – 7.6%). The items receiving the
highest proportion of don’t know response within this sub-sample were astronomy (11.7%); energy
(8.3%); climate change (7.5%) and medical science (7.5%). As within the white sub-sample, the item
for astronomy attracted a higher proportion of no interest responses (51.1%) compared to the
remaining 6 items within this question set (see chart 7.7).
Chart 7.7: Average response by black subsample: Interest in Science assessment
71.3% 66.9% 65.9% 62.0% 61.3% 47.5% 45.1%
27.9% 31.9% 33.3% 36.8% 37.5% 51.7% 52.9%
0.7% 1.2% 0.7% 1.2% 1.2% 0.7% 2.0%
0%
10%
20%
30%
40%
50%
60%
70%
80%
90%
100%
Technology andthe Internet
Climate Change Economics Energy Medical Science Politics Astronomy
SUM INTERESTED NO INTEREST DON’T KNOW
61.7% 57.5% 56.2% 54.0% 53.3% 53.3%
37.1%
31.8% 36.1% 36.3% 37.7% 41.7% 39.2%
51.1%
6.5% 6.4% 7.5% 8.3% 5.0% 7.5% 11.7%
0%
10%
20%
30%
40%
50%
60%
70%
80%
90%
100%
Technology andthe Internet
Economics Climate Change Energy Politics Medical Science Astronomy
SUM INTERESTED NO INTEREST DON’T KNOW
Stellenbosch University https://scholar.sun.ac.za

218
Reported interest in science among the Indian / Asian sub-sample is reflected in chart 7.8 below.
Technology and the internet (52.9%) received largest proportion of SUM interest selections, as with
the black and white population groups. This sub-sample then ranked medical science (52.1%)
followed by economics (49.6%); climate change (47.9%) and energy (42.1%) as the next highest
interest areas. The Indian / Asian cohort did not report astronomy (36.4%) as the lowest ranked
interest area, but instead politics received the lowest level of proportional SUM interest selections
(30.6%). A significantly larger proportion of Indian / Asian respondents indicated no interest in
politics (67.8%).
Chart 7.8: Average response by Indian / Asian subsample: Interest in Science assessment
The race group attracting the lowest overall level of interest across all seven questionnaire items
was within the coloured sub-sample (39.6%).
Chart 7.9: Average response by coloured subsample: Interest in Science assessment
The highest ranked area of scientific interest within this cohort was within the technology and the
internet (49.5%) item; followed by climate change (47.0%); medical science (42.4%) and energy
52.9% 52.1% 49.6% 47.9% 42.1% 36.4% 30.6%
45.5% 46.3% 47.9% 49.6% 55.4% 60.3% 67.8%
1.7% 1.7% 2.5% 2.5% 2.5% 3.3% 1.7%
0%
10%
20%
30%
40%
50%
60%
70%
80%
90%
100%
Technology andthe Internet
Medical Science Economics Climate Change Energy Astronomy Politics
SUM INTERESTED NO INTEREST DON’T KNOW
49.5% 47.0% 42.4% 40.6% 39.6% 35.7% 22.4%
45.4% 47.2% 51.6% 53.2% 54.8% 58.5% 71.0%
5.1% 5.8% 6.0% 6.2% 5.5% 5.8% 6.7%
0%
10%
20%
30%
40%
50%
60%
70%
80%
90%
100%
Technology andthe Internet
Climate Change Medical Science Energy Economics Politics Astronomy
SUM INTERESTED NO INTEREST DON’T KNOW
Stellenbosch University https://scholar.sun.ac.za

219
(40.6%). Interest among the coloured sub-sample for economics and politics were both below 40%
(see chart 7.9). The lowest overall SUM interest for any of the questionnaire items, across all
population groups was measured for coloured respondents within the astronomy item (22.4%).
Response within the don’t know option were highest for the items astronomy (6.7%); Energy (6.2%)
and medical science (6.0%).
INTEREST IN SCIENCE BY EDUCATIONAL ATTAINMENT
The level of respondent educational attainment has been shown to demonstrate a statistically
significant association with level of interest in science (X2=65.349, p < 0.001). Respondents with
higher levels of educational attainment report increased levels of interest across all 7 areas of
science within the question set.
Respondents with pre-matric educational attainment report lower overall interest in science (43.0%
- *15.5%) compared to respondents with a completed matric (55.5% - *22.8%) and those with post-
matric education (64.9% - *30.7%).
Chart 7.16: Average response by educational attainment group: Interest in Science assessment
Similarly, responses within the no interest option declines as respondent education level increases
(see chart 7.16). Significantly, respondents within the pre-matric educational attainment category
responded below the level of the national average for SUM interested responses, while yielding
significantly higher frequencies of response within the no interest and don’t know response options.
Respondents with pre-matric educational attainment did not differ considerably in the overall
ranking of scientific interest areas. As discussed above, respondents within this group did
demonstrate statistically significant lower levels of interest compared to other groups. The most
15.5% 22.8%
30.7% 18.2%
27.5%
32.7%
34.2%
29.2%
46.8%
40.2% 31.9%
42.8%
10.1% 4.3% 3.2%
9.8%
0%
10%
20%
30%
40%
50%
60%
70%
80%
90%
100%
PRE-MATRIC (1) MATRIC COMPLETED (2) POST-MATRIC (3) NATIONAL AVERAGE
VERY INTERESTED MODERATELY INTERESTED NO INTEREST DON’T KNOW
Stellenbosch University https://scholar.sun.ac.za

220
frequently selected interest area remains technology and the internet (48.3%); followed by climate
change (47.8%); economics (45.4%); medical science (44.1%) and energy (43.9%). Respondents
within the pre-matric group selected politics (43.7%) and astronomy (28.2%) least frequently as
areas of scientific interest. Within all of the interest in science items, respondent reported levels of
no interest was above 40.0%; ranging from 41.9% for climate change to 58.4% for the interest area
of astronomy. The pre-matric sub-sample were significantly more inclined to make use of the don’t
know response option, with an average response in this category being 10.2% - however this did
range between 7.5% for politics and 13.4% for astronomy (see chart 7.17).
Chart 7.17: Average response by pre-matric educational attainment subsample: Interest in Science assessment
Within the sub-sample of respondents reporting a completed matric educational attainment level,
the pattern of response was relatively similar to those within the pre-matric group. Respondents
most frequently reported technology and the internet (67.1%) as the area of greatest interest,
followed by economics (59.9%); climate change (58.8%); medical science (56.2%) and energy (55.8%).
48
.3%
47
.8%
45
.4%
44
.1%
43
.9%
43
.7%
28
.2%
42
.4%
41
.9%
45
.3%
45
.8%
45
.1%
48
.9%
58
.4%
9.3% 10.3% 9.3% 10.1% 11.0% 7.5% 13.4%
0%
10%
20%
30%
40%
50%
60%
70%
80%
90%
100%
Technologyand theInternet
ClimateChange
Economics MedicalScience
Energy Politics Astronomy
SUM INTERESTED NO INTEREST DON’T KNOW
Stellenbosch University https://scholar.sun.ac.za
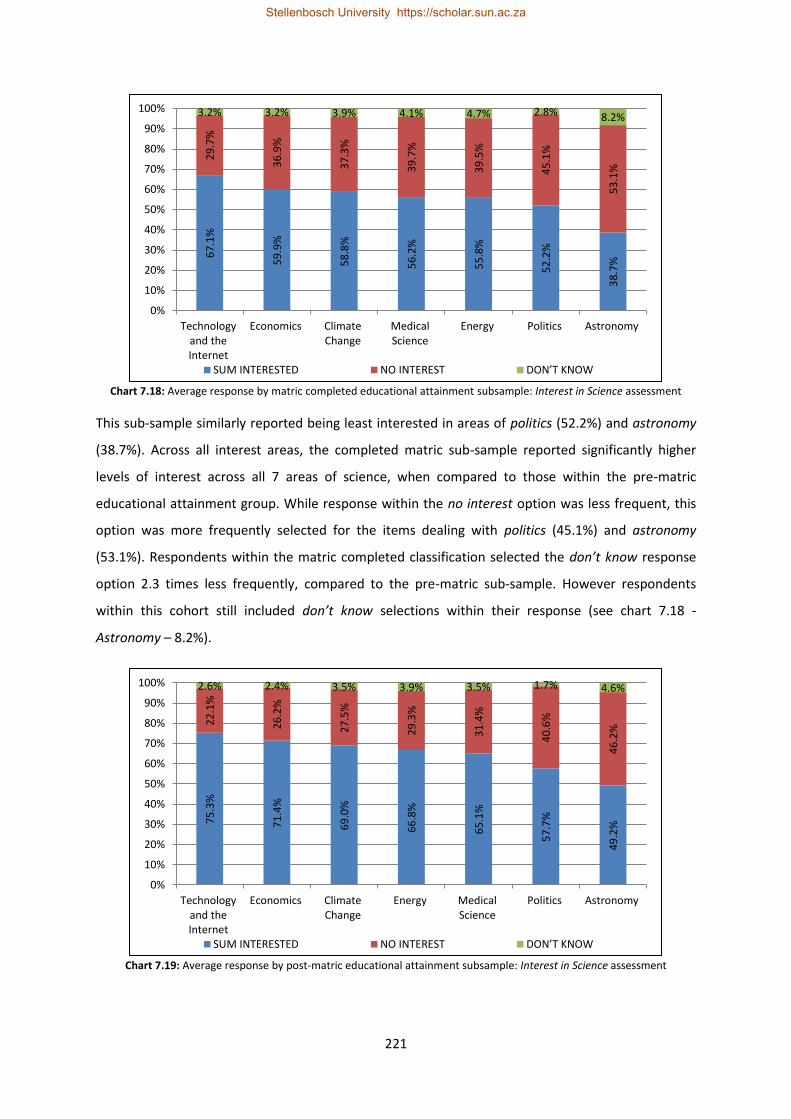
221
Chart 7.18: Average response by matric completed educational attainment subsample: Interest in Science assessment
This sub-sample similarly reported being least interested in areas of politics (52.2%) and astronomy
(38.7%). Across all interest areas, the completed matric sub-sample reported significantly higher
levels of interest across all 7 areas of science, when compared to those within the pre-matric
educational attainment group. While response within the no interest option was less frequent, this
option was more frequently selected for the items dealing with politics (45.1%) and astronomy
(53.1%). Respondents within the matric completed classification selected the don’t know response
option 2.3 times less frequently, compared to the pre-matric sub-sample. However respondents
within this cohort still included don’t know selections within their response (see chart 7.18 -
Astronomy – 8.2%).
Chart 7.19: Average response by post-matric educational attainment subsample: Interest in Science assessment
67
.1%
59
.9%
58
.8%
56
.2%
55
.8%
52
.2%
38
.7%
29
.7%
36
.9%
37
.3%
39
.7%
39
.5%
45
.1%
53
.1%
3.2% 3.2% 3.9% 4.1% 4.7% 2.8% 8.2%
0%
10%
20%
30%
40%
50%
60%
70%
80%
90%
100%
Technologyand theInternet
Economics ClimateChange
MedicalScience
Energy Politics Astronomy
SUM INTERESTED NO INTEREST DON’T KNOW
75
.3%
71
.4%
69
.0%
66
.8%
65
.1%
57
.7%
49
.2%
22
.1%
26
.2%
27
.5%
29
.3%
31
.4%
40
.6%
46
.2%
2.6% 2.4% 3.5% 3.9% 3.5% 1.7% 4.6%
0%
10%
20%
30%
40%
50%
60%
70%
80%
90%
100%
Technologyand theInternet
Economics ClimateChange
Energy MedicalScience
Politics Astronomy
SUM INTERESTED NO INTEREST DON’T KNOW
Stellenbosch University https://scholar.sun.ac.za

222
Respondents with a post matric education accounted for 15.5% of the total survey sample (n =
3 486). Within this classification, the most frequently selected interest area was technology and the
internet (75.3%); followed by economics (71.4%); climate change (69.0%); Energy (66.8%) and
medical science (65.1%).
Similar to the other educational attainment groups, politics (57.7%) and astronomy (49.2%) were the
categories of least interest for respondents with post-matric education. All SUM agreement
responses within this category were significantly higher than responses recorded within the matric
completed and the pre-matric groups. Response patterns within the no interest option reflect lower
proportions, ranging from 22.1% (technology and the internet) to 46.2% (astronomy). Respondents
with a post matric education selected the don’t know response 3.2 times less frequently compared
to those with pre-matric education and 1.3 times less frequently compared to respondents with a
completed matric education.
Conclusion
Within the survey results, 55.6% of respondents declared a higher level of interest across the 7
scientific areas. This included 22.6% that indicated they were very interested while 33.0% provided a
moderately interested response. Overall 44.4% of the sample declared no interest across all
questionnaire items. This average level of interest among South Africans is a very positive outcome
as it indicates a greater curiosity about scientific areas within the general population. A greater level
of interest was declared for areas related to technology and the internet followed by climate change
and economics. Across the sample the areas attracting the lowest level of reported interest were
politics and astronomy.
Across all race classifications, white respondents reported the highest level of interest. This group
was following by black; Indian / Asian and then coloured respondents. White and black respondents
generally demonstrated interest levels above that of the national average while coloured and Indian
/ Asian respondents generally expressed interest levels below that of the national average. All race
groups expressed interest in areas related to technology and the internet and climate change.
Among white and black respondents this also included economics, while within coloured and Indian /
Asian groups the top interest areas included medical science. While it is clear that the patterns of
interest in science do vary within race classifications, the general selection of interest areas remains
relatively similar across groups. However it remains important to note that the proportionality of
interest response did demonstrate significant variability.
Stellenbosch University https://scholar.sun.ac.za

223
Males expressed a generally greater proportional interest in scientific areas compared to females in
this study. Areas presenting a statistically significant variation in patterns of response by gender
groups include: climate change; technology and the internet; politics; economics and areas related to
energy. Interest areas between gender classifications did not deviate from the above mentioned
overall result; however there were variations in the response proportions for interest in each area.
A larger proportion of urban respondents declared interest across the 7 items, compared to rural
respondents. Both rural and urban respondents were most interested in areas of climate change;
technology and the internet and economics; however in significantly different proportions. Rural
respondents were more likely to indicate no interest, when compared to the urban sub-sample.
Rural respondents, however, reported a greater interest in politics compared to urban respondents.
A statistically significant association was found between educational attainment level and interest in
science. Respondents with higher educational attainment declared higher interest across all interest
in science measurement areas. Respondents with post-matric education were less likely to select the
no interest option compared to those with less educational attainment. Reported interest was
highest within the technology and the internet; climate change and economics areas where
respondents with pre-matric education would generally demonstrate lower levels of interest.
Respondents’ age group classification did not show any significant association with the interest in
science variable. Despite this, younger respondent’s showed greater interest across all 7 areas of
science compared to older respondents. This would likely be due to younger participants still being
engaged in personal or family educational activities or employment requiring increased exposure to
the questionnaire item categories. Respondents older than 60 years reported the lowest level of
interest across all areas of science and were more likely to select the don’t know response option
compared to the younger age classifications.
Stellenbosch University https://scholar.sun.ac.za

224
Chapter Eight
Descriptive Survey Results:
Informedness in Science
Information is not knowledge, knowledge is not wisdom, and wisdom is not foresight. Each grows out of the other, and we need them all.
Arthur C. Clarke (1993)
Introduction
The overall level of informedness, with respect to science would be highly related to the overall level
of interest in science. As noted within the previous section, awareness of the general level of interest
in science would be a necessary requirement toward developing a robust assessment of the South
African public understanding of science. Similarly so, the development of an assessment of the
general level of informedness about science would complement the established understanding of
overall interest in science. This assessment would contribute immensely to an understanding of the
interrelatedness of general interest, information seeking outcomes and measured levels of scientific
knowledge among the South African population.
OVERALL NATIONAL RESULTS FOR INFORMEDNESS IN SCIENCE ASSESSMENT ITEMS120
The response patterns within the informedness items reflect that of the results presented within the
interest in science items.
Chart 8.1: Overall result: South African informedness in science assessment (valid %)
120
The results of the reliability analyses are found in Appendices 2 to 7 (Page 410 - 442).
14
.5%
13
.8%
20
.2%
15
.1%
15
.9%
9.5
%
14
.6%
28
.5%
33
.0%
33
.4%
36
.9%
31
.4%
21
.4%
28
.6%
57
.0%
53
.2%
46
.4%
48
.0%
52
.7%
69
.1%
56
.8%
0%
10%
20%
30%
40%
50%
60%
70%
80%
MedicalScience
Climate Change Technology andthe Internet
Politics Economics Astronomy Energy
VERY WELL INFORMED MODERATELY WELL INFORMED NOT WELL INFORMED
Stellenbosch University https://scholar.sun.ac.za

225
The largest proportion of response achieved was within the not well informed option; which was
followed by moderately well informed and the smallest proportion of response was within the very
well informed selection.
Informedness in science response categories for very well informed and moderately well informed
will be collapsed into a single SUM informed category for ease of data presentation. However where
appropriate, the proportion of respondents within the SUM informed category reporting a very well
informed response will be highlighted.
The data in chart 8.1 is presented again in chart 8.2, however within the revised SUM informedness
format. It is apparent that the overall level of informedness among South Africans is lower than the
earlier reported level of interest across the 7 scientific areas. Within 5 of the 7 items, the proportion
of South Africans reporting informedness is lower than those that report being not well informed.
Within the categories for technology and the internet (53.6% - *20.2%) and politics (52.0% - *15.1%)
a larger proportion of respondents indicated a SUM informedness compared to the remaining 5
items in the question set. Within the informedness areas of medical science (57%); energy (56.8%)
and astronomy (69.1%) a larger proportion of respondents indicated being not well informed
compared to those reporting any level of informedness.
Chart 8.2: Overall result: South African informedness in science assessment (combined informedness categories)
The response proportions within the informedness area of astronomy correlates to the lower
proportions of respondents that earlier indicated a low interest within this subject area. Within chart
43
.0%
46
.8%
53
.6%
52
.0%
47
.3%
30
.9%
43
.2%
57
.0%
53
.2%
46
.4%
48
.0%
52
.7%
69
.1%
56
.8%
0%
10%
20%
30%
40%
50%
60%
70%
80%
Medical Science Climate Change Technology andthe Internet
Politics Economics Astronomy Energy
SUM INFORMED NOT INFORMED
Stellenbosch University https://scholar.sun.ac.za
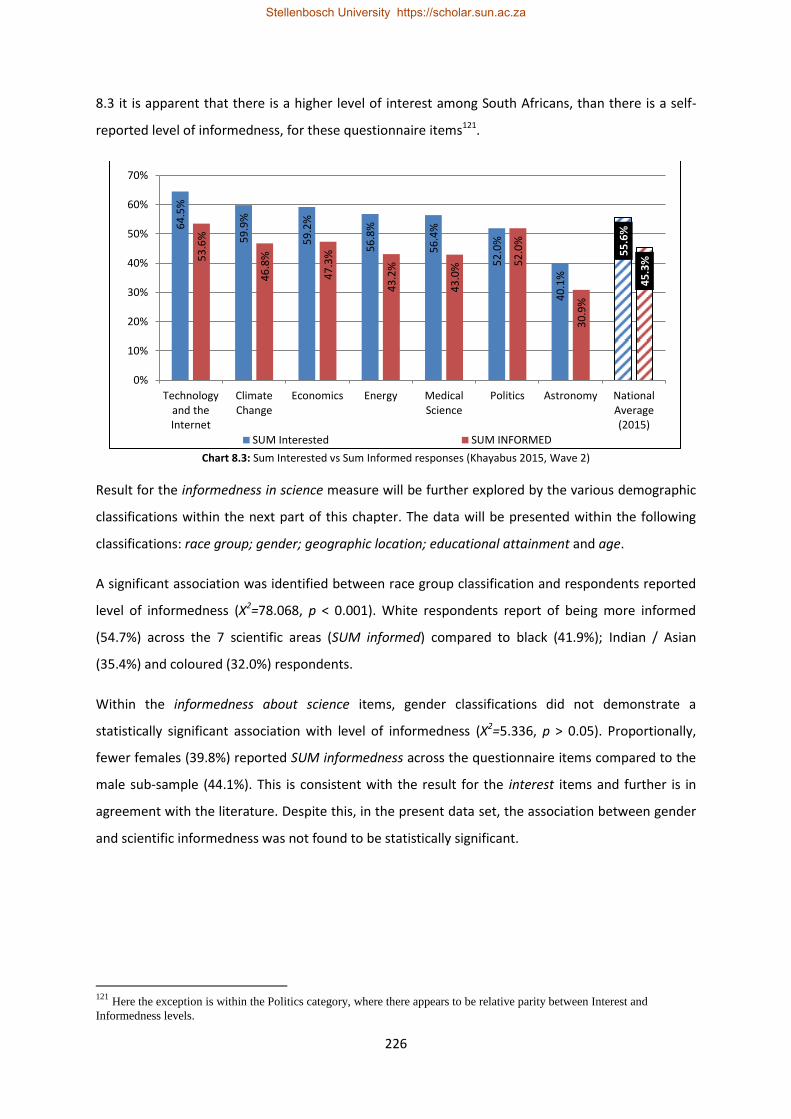
226
8.3 it is apparent that there is a higher level of interest among South Africans, than there is a self-
reported level of informedness, for these questionnaire items121.
Chart 8.3: Sum Interested vs Sum Informed responses (Khayabus 2015, Wave 2)
Result for the informedness in science measure will be further explored by the various demographic
classifications within the next part of this chapter. The data will be presented within the following
classifications: race group; gender; geographic location; educational attainment and age.
A significant association was identified between race group classification and respondents reported
level of informedness (X2=78.068, p < 0.001). White respondents report of being more informed
(54.7%) across the 7 scientific areas (SUM informed) compared to black (41.9%); Indian / Asian
(35.4%) and coloured (32.0%) respondents.
Within the informedness about science items, gender classifications did not demonstrate a
statistically significant association with level of informedness (X2=5.336, p > 0.05). Proportionally,
fewer females (39.8%) reported SUM informedness across the questionnaire items compared to the
male sub-sample (44.1%). This is consistent with the result for the interest items and further is in
agreement with the literature. Despite this, in the present data set, the association between gender
and scientific informedness was not found to be statistically significant.
121
Here the exception is within the Politics category, where there appears to be relative parity between Interest and
Informedness levels.
64
.5%
59
.9%
59
.2%
56
.8%
56
.4%
52
.0%
40
.1%
55
.6%
53
.6%
46
.8%
47
.3%
43
.2%
43
.0%
52
.0%
30
.9%
45
.3%
0%
10%
20%
30%
40%
50%
60%
70%
Technologyand theInternet
ClimateChange
Economics Energy MedicalScience
Politics Astronomy NationalAverage(2015)
SUM Interested SUM INFORMED
Stellenbosch University https://scholar.sun.ac.za

227
VERY WELL INFORMED
MODERATELY WELL INFORMED
NOT WELL INFORMED
D/K N
NATIONAL 13.7% 28.2% 50.5% 7.6% 3 486
RACE N = 3 486
BLACK 14.1% 27.8% 49.3% 8.8% 2 523
WHITE 19.9% 34.8% 41.9% 3.4% 408
INDIAN / ASIAN 12.0% 23.4% 62.1% 2.5% 121
COLOURED 6.1% 25.9% 62.1% 5.9% 434
GENDER N = 3 486
FEMALE 13.2% 26.6% 52.1% 8.1% 1 747
MALE 14.3% 29.8% 48.9% 7.0% 1 739
GEOGRAPHIC LOCATION N = 3486
URBAN 15.5% 30.6% 47.9% 5.9% 2 297
RURAL 10.2% 23.5% 55.5% 10.9% 1 189
EDUCATION N = 3486
PRE-MATRIC 8.7% 22.7% 57.4% 11.2% 1 369
MATRIC COMPLETED 14.7% 30.4% 49.9% 5.0% 1 578
POST-MATRIC 23.4% 35.7% 35.0% 5.9% 539
AGE N = 3 472
<20 YEARS 14.8% 28.3% 50.2% 6.7% 170
20-29 YEARS 15.0% 28.1% 51.1% 5.8% 1 101
30-39 YEARS 13.2% 29.3% 49.3% 8.2% 956
40-49 YEARS 13.3% 30.4% 49.1% 7.2% 598
50-59 YEARS 14.4% 27.0% 48.9% 9.7% 372
60+ YEARS 9.1% 21.1% 58.4% 11.4% 275
Table 8.1: Results of Informedness in Science questionnaire items by demographic classifications
Within provincial boundaries as well as rural / urban location categories, a significant association
was found with the level of respondent-reported scientific informedness (Provincial: X2=304.679, p <
0.001; Rural / Urban: X2=77.312, p < 0.001). At the provincial level, the highest proportion of
respondents reporting SUM informedness was within the Gauteng province (55.4%) followed by
Mpumalanga (49.2%) and the North West (47.3%). The provincial areas reporting the lowest
proportion of SUM informedness was the Eastern Cape (34.5%) and the Northern Cape (27.0%).
Within rural / urban classifications, rural respondents reported a lower proportion of SUM informed
response (33.7%) compared to respondents within the urban sub-sample (46.1%).
The role of educational attainment level was again noted have a statistically significant association
with reported levels of informedness (X2=180.875, p < 0.001). Respondents with higher educational
attainment levels report being significantly more informed compared to respondents within the
lower educational attainment categories. Those with post-matric educational attainment report a
SUM informedness proportion of 59.1%, compared to those with pre-matric education (31.4%).
Within the informedness items, respondent age classification was found to be statistically significant
in relation to the reported level of informedness (X2=26.954, p < 0.01). Across all age group
Stellenbosch University https://scholar.sun.ac.za

228
classification a general decrease in the reported SUM informed response is observed wherein
respondents younger than 20 years report among the highest122 level of informedness (43.1%) while
those older than 60 years report the lowest level of informedness (30.2%).
EXPLORATORY ANALYSIS OF VARIABLES CORRELATING WITH INFORMEDNESS ABOUT SCIENCE
As in the preceding chapters, CHAID was employed in further understanding the relationships
between the demographic variables contributing to respondent reported informedness about
science. The variables included within the analysis included gender; race; household income;
educational attainment; geographic location (rural-urban); employment and age.
Figure 8.1 below presents a graphical output of the CHAID analysis, and is discussed below.
Figure 8.1: Output of CHAID analysis: Informedness about Science
Results from this statistical procedure indicates that four variables best explain increased
informedness about science within this sample of South Africans. These variables include
educational attainment; geographic location; race and employment status. Respondents with
employment and a post matric education report the highest interest in any of the 7 scientific areas,
22.7% higher than the average across the sample (33.7%). Similarly urban respondents, that are
white or black also report informedness levels 5.6% higher than the sample average. Respondents
that are unemployed, living in rural areas, with lower educational attainment or within the coloured
122
The age classification group 40-49 years reported the highest SUM informedness proportion (43.7%)
43.9
50.0
43.3
36.6
43.2
37.6
36.5
32.8
29.6
26.3
26.0
24.2
16.5
13.5
43.0
29.1
32.3
38.2
29.8
31.2
30.5
33.4
35.1
36.8
35.0
36.5
31.2
30.1
13.1
20.9
24.3
25.3
27.0
31.2
33.0
33.7
35.3
36.9
39.0
39.3
52.3
56.4
0% 10% 20% 30% 40% 50% 60% 70% 80% 90% 100%
PRE-MATRIC - COLOURED / INDIAN
PRE-MATRIC - BLACK / WHITE - RURAL
PRE-MATRIC
MATRIC COMPLETED - URBAN - COLOURED / INDIAN
PRE-MATRIC - BLACK / WHITE
MATRIC COMPLETED - RURAL
PRE-MATRIC - BLACK / WHITE - URBAN
ALL
MATRIC COMPLETED
MATRIC COMPLETED - URBAN
POST MATRIC - UNEMPLOYED / OTHER
MATRIC COMPLETED - URBAN - BLACK / WHITE
POST MATRIC
POST MATRIC - EMPLOYED
LOW MODERATE HIGH
Stellenbosch University https://scholar.sun.ac.za

229
or Indian / Asian sub-samples report substantially lower informedness in science, 20.6% below the
sample average. The variables for gender and age of respondent do not correlate significantly with
the responses to this question. These predictors, along with additional variables will be included in
the multinomial logistic regression modelling toward the output of a predictive model of interest in
science measures in South Africa
These demographic variables will be explored in greater detail in terms of respondent response
patterns within the next sections.
INFORMEDNESS IN SCIENCE BY RACE
A statistically significant association was reported between the race variable and respondent
reported level of informedness (X2=78.068, p < 0.001). White respondents generally reported higher
informedness (54.7% - *19.9%) compared to black (41.9% - *14.1%); Indian / Asian (35.4% - *12.0%)
and coloured respondents (32.0% - *6.1%). The response within the very well informed category was
lowest within the coloured sub-sample, half that of the next highest race group (Indian / Asian).
Chart 8.4: Average response by race group: Informedness in Science assessment
White respondents were significantly less likely to select a not well informed response compared to
all other race classifications. Indian / Asian and coloured respondents were significantly more
inclined to select a response within the not well informed option, compared to black and white
respondents (see chart 8.4). Across all race classifications, black respondents provided the highest
proportional response within the don’t know category (8.8%).
The relative ranking of informedness by scientific area did show some variation by race classification.
White respondents report the highest informedness proportion within the technology and the
19.9% 14.1% 12.0%
6.1% 13.7%
34.8%
27.8% 23.4%
25.9%
28.2%
41.9%
49.3% 62.1% 62.1%
50.5%
3.4% 8.8%
2.5% 5.9% 7.6%
0%
10%
20%
30%
40%
50%
60%
70%
80%
90%
100%
White Black Indian / Asian Coloured National Average
VERY WELL INFORMED MODERATELY WELL INFORMED NOT WELL INFORMED DON’T KNOW
Stellenbosch University https://scholar.sun.ac.za

230
internet item (66.2% - *31.5%); followed by climate change (64.3% - *19.3%); economics (62.5% -
*21.3%) and energy (55.9% - *20.7%).
Chart 8.5: Average response by white subsample: Informedness in Science assessment
Within the white sub-sample, the response patterns for informedness in science generally reflect the
ranking within the interest items. Politics (55.0%) was ranked proportionally higher than medical
science (54.0%), however, the lowest informedness area was astronomy (38.1% - *13.8%).
Within the black sub-sample, the ranking of informedness items deviated from that of white
respondents (see chart 8.6). Politics received the highest informedness response (54.4% - *17.2%);
followed by technology and the internet (53.3% - *19.9%); economics (48.0% - *16.9%) and climate
change (46.3% - *14.2%).
Chart 8.6: Average response by black subsample: Informedness in Science assessment
Medical science (43.1% - *14.7%) and astronomy (31.7% - *9.8%) were reported less frequently
within the well informed categories. The items for informedness areas economics; climate change;
31.5% 19.3% 21.3% 20.7% 15.2%
22.1% 13.8%
34.8% 45.0% 41.3%
35.2% 39.8%
31.9%
24.3%
33.8% 35.7% 37.5% 44.1% 45.0% 46.0%
61.9%
0%
10%
20%
30%
40%
50%
60%
70%
80%
90%
100%
Technology andthe Internet
Climate Change Economics Energy Politics Medical Science Astronomy
VERY WELL INFORMED MODERATELY WELL INFORMED NOT WELL INFORMED
17.2% 19.9% 16.9% 14.2% 15.2% 14.7% 9.8%
37.3% 33.3% 31.2% 32.1% 28.4% 28.4%
21.9%
45.6% 46.7% 52.0% 53.7% 56.4% 56.9% 68.3%
0%
10%
20%
30%
40%
50%
60%
70%
80%
90%
100%
Politics Technology andthe Internet
Economics Climate Change Energy Medical Science Astronomy
VERY WELL INFORMED MODERATELY WELL INFORMED NOT WELL INFORMED
Stellenbosch University https://scholar.sun.ac.za

231
energy; medical science and astronomy similarly received the higher proportion of responses within
the not well informed response option (see chart 8.6).
Indian / Asian respondents reported a different order of informedness item ranking (see chart 8.7).
Economics received the highest informedness response (40.7% - *16.1%); followed by technology
and the internet (40.3% - *16.0%); medical science (39.5% - *14.3%) and then politics (35.9% -
*7.7%). This is somewhat of a deviation from reported interest within this sub-sample, wherein
politics attracted the lowest reported interest (30.6%), despite the reported higher level of
informedness. Among all race classifications, Indian / Asians report being least informed about issues
related to climate change (34.7% - *12.7%). Overall, among this race group the area of lowest
reported informedness remained astronomy (27.4% - *8.5%).
Chart 8.7: Average response by Indian / Asian subsample: Informedness in Science assessment
Respondents within the coloured race group recorded the lowest overall informedness across the
questionnaire items. The largest proportion of SUM informedness selections was within the
technology and the internet (47.1% - *12.1%) item; followed by politics (39.7% - *5.4%), climate
change (36.3% - *6.3%) and medical science (32.7% - *6.1%).
16.1% 16.0% 14.3% 7.7% 11.0% 12.7% 8.5%
24.6% 24.4% 25.2% 28.2% 24.6% 22.0%
18.8%
59.3% 59.7% 60.5% 64.1% 64.4% 65.3% 72.6%
0%
10%
20%
30%
40%
50%
60%
70%
80%
90%
100%
Economics Technology andthe Internet
Medical Science Politics Energy Climate Change Astronomy
VERY WELL INFORMED MODERATELY WELL INFORMED NOT WELL INFORMED
Stellenbosch University https://scholar.sun.ac.za

232
Chart 8.8: Average response by coloured subsample: Informedness in Science assessment
Respondents within the coloured sub-sample selected the not well informed option more frequently
(see chart 8.8). Within 6 of the 7 items, coloured respondents selected this option in proportions
exceeding 60%, with the highest being for astronomy (79.3%).
INFORMEDNESS IN SCIENCE BY GEOGRAPHIC LOCATION
Informedness in science was significantly associated with the geographical location variable
(X2=77.312, p < 0.001). Urban respondents reported significantly greater interest (46.1% - *15.5%)
across all interest areas compared to members of the rural sub-sample (33.7% - *10.2%).
Chart 8.11: Average response by rural / urban location group: informedness in science assessment
12.1% 5.4% 6.3% 6.1% 5.4% 6.2% 3.7%
35.0% 34.3% 30.0% 26.6% 25.2% 24.4%
17.0%
52.9% 60.3% 63.7% 67.3% 69.4% 69.5%
79.3%
0%
10%
20%
30%
40%
50%
60%
70%
80%
90%
100%
Technology andthe Internet
Politics Climate Change Medical Science Economics Energy Astronomy
VERY WELL INFORMED MODERATELY WELL INFORMED NOT WELL INFORMED
15.5% 10.2% 13.7%
30.6%
23.5% 28.2%
47.9%
55.5% 50.5%
5.9% 10.8% 7.6%
0%
10%
20%
30%
40%
50%
60%
70%
80%
90%
100%
URBAN RURAL NATIONAL AVERAGE
VERY WELL INFORMED MODERATELY WELL INFORMED NOT WELL INFORMED DON’T KNOW
Stellenbosch University https://scholar.sun.ac.za
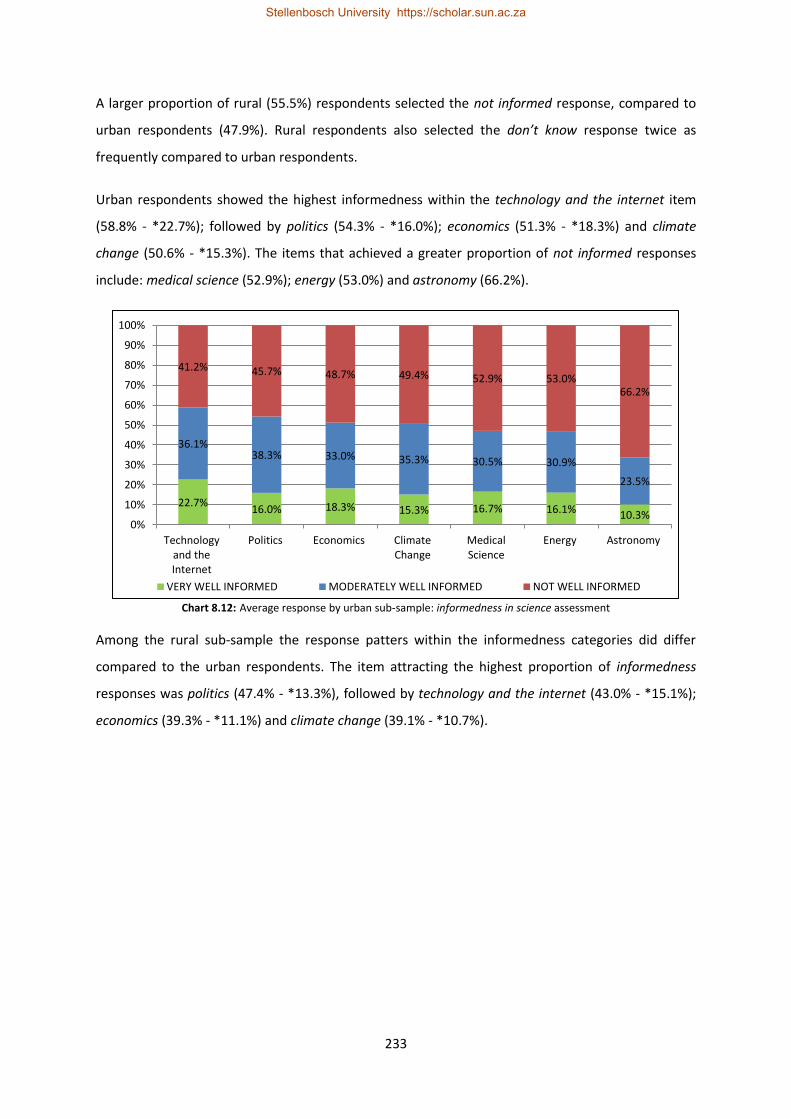
233
A larger proportion of rural (55.5%) respondents selected the not informed response, compared to
urban respondents (47.9%). Rural respondents also selected the don’t know response twice as
frequently compared to urban respondents.
Urban respondents showed the highest informedness within the technology and the internet item
(58.8% - *22.7%); followed by politics (54.3% - *16.0%); economics (51.3% - *18.3%) and climate
change (50.6% - *15.3%). The items that achieved a greater proportion of not informed responses
include: medical science (52.9%); energy (53.0%) and astronomy (66.2%).
Chart 8.12: Average response by urban sub-sample: informedness in science assessment
Among the rural sub-sample the response patters within the informedness categories did differ
compared to the urban respondents. The item attracting the highest proportion of informedness
responses was politics (47.4% - *13.3%), followed by technology and the internet (43.0% - *15.1%);
economics (39.3% - *11.1%) and climate change (39.1% - *10.7%).
22.7% 16.0% 18.3% 15.3% 16.7% 16.1% 10.3%
36.1% 38.3% 33.0% 35.3% 30.5% 30.9%
23.5%
41.2% 45.7% 48.7% 49.4% 52.9% 53.0% 66.2%
0%
10%
20%
30%
40%
50%
60%
70%
80%
90%
100%
Technologyand theInternet
Politics Economics ClimateChange
MedicalScience
Energy Astronomy
VERY WELL INFORMED MODERATELY WELL INFORMED NOT WELL INFORMED
Stellenbosch University https://scholar.sun.ac.za

234
Chart 8.13: Average response by rural sub-sample: informedness in science assessment
The recorded response for medical science (64.8%) and energy (65.5%) attracted a larger proportion
of not well informed responses. However astronomy (74.9%) remained the scientific area within
which rural respondents selected a larger proportion of not well informed responses (see chart 8.13).
INFORMEDNESS IN SCIENCE BY EDUCATIONAL ATTAINMENT
Chart 8.14: Average response by educational attainment group: informedness in science assessment
The level of respondent educational attainment has been shown to demonstrate a statistically
significant association with level of informedness in science (X2=180.875, p < 0.001). Respondent
reported levels of informedness across the 7 items show a distinct pattern of increase with
respondent educational attainment level (see chart 8.14). Respondents within the pre-matric (31.5%
- *8.7%) educational attainment category demonstrated significantly lower levels of informedness
compared to those within the post-matric (59.1% - *23.4%) group. Among the pre-matric group, the
13.3% 15.1% 11.1% 10.7% 11.5% 10.1% 7.9%
34.1% 28.0% 28.2% 28.4% 23.7% 24.4%
17.2%
52.6% 57.0% 60.7% 60.9% 64.8% 65.5% 74.9%
0%
10%
20%
30%
40%
50%
60%
70%
80%
90%
100%
Politics Technologyand theInternet
Economics ClimateChange
Energy MedicalScience
Astronomy
VERY WELL INFORMED MODERATELY WELL INFORMED NOT WELL INFORMED
8.7% 14.7%
23.4% 13.7%
22.7%
30.4%
35.7%
28.2%
57.4%
49.9% 35.0%
50.5%
11.2% 5.0% 5.9% 7.6%
0%
10%
20%
30%
40%
50%
60%
70%
80%
90%
100%
PRE-MATRIC (1) MATRIC COMPLETED (2) POST-MATRIC (3) NATIONAL AVERAGE
VERY WELL INFORMED MODERATELY WELL INFORMED NOT WELL INFORMED DON’T KNOW
Stellenbosch University https://scholar.sun.ac.za

235
aggregate level of informedness was 10.5% below the SUM informed level of the national average
reported earlier (41.9%). Among respondents within the post-matric category, average informedness
was reported at 17.2% above this national average informedness (across all 7 items). Those within
the pre-matric educational group selected the don’t know response option twice as frequently,
compared to those with a completed matric and those with post-matric educational attainment.
Respondents with a pre-matric education showed the greatest informedness proportion within the
area of politics (41.9% - *9.5%); followed by technology and the internet (35.4% - *10.8%); climate
change (32.6% - *8.7%) and economics (32.0% - *8.5%). Within this sub-sample, 6 of the 7 items
attracted a larger proportion of response within the not well informed category. This response
proportion ranged from 54.1% (technology and the internet) to 65.7% (astronomy).
Chart 8.15: Average response by pre-matric educational attainment subsample: informedness in science assessment
Respondents within this educational group more often selected the don’t know response, compared
to the matric complete and post-matric group. All items within the question set attracted greater
than 8.0% response within the don’t know response, while the astronomy item attracted a response
proportion of 14.5% within the don’t know option.
Respondents with a completed matric educational attainment level reported a larger share of
response within one of the informed options.
9.5% 10.8% 8.7% 8.5% 8.3% 9.6% 5.6%
32.4% 24.6% 23.9% 23.4% 21.6% 18.9% 14.3%
49.3% 54.1% 57.1% 57.6% 58.4% 59.3%
65.7%
8.8% 10.5% 10.3% 10.4% 11.7% 12.1% 14.5%
0%
10%
20%
30%
40%
50%
60%
70%
80%
90%
100%
Politics Technologyand theInternet
ClimateChange
Economics MedicalScience
Energy Astronomy
VERY WELL INFORMED MODERATELY WELL INFORMED NOT WELL INFORMED DON’T KNOW
Stellenbosch University https://scholar.sun.ac.za
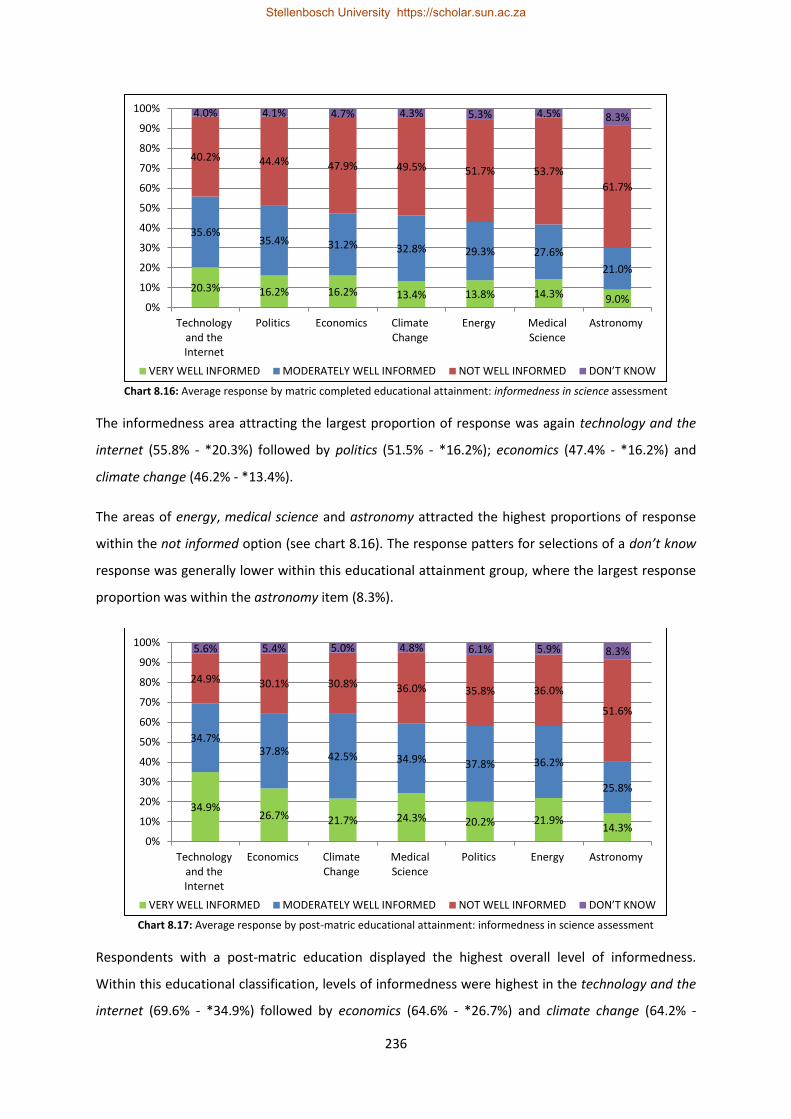
236
Chart 8.16: Average response by matric completed educational attainment: informedness in science assessment
The informedness area attracting the largest proportion of response was again technology and the
internet (55.8% - *20.3%) followed by politics (51.5% - *16.2%); economics (47.4% - *16.2%) and
climate change (46.2% - *13.4%).
The areas of energy, medical science and astronomy attracted the highest proportions of response
within the not informed option (see chart 8.16). The response patters for selections of a don’t know
response was generally lower within this educational attainment group, where the largest response
proportion was within the astronomy item (8.3%).
Chart 8.17: Average response by post-matric educational attainment: informedness in science assessment
Respondents with a post-matric education displayed the highest overall level of informedness.
Within this educational classification, levels of informedness were highest in the technology and the
internet (69.6% - *34.9%) followed by economics (64.6% - *26.7%) and climate change (64.2% -
20.3% 16.2% 16.2% 13.4% 13.8% 14.3% 9.0%
35.6% 35.4% 31.2% 32.8% 29.3% 27.6%
21.0%
40.2% 44.4% 47.9% 49.5% 51.7% 53.7%
61.7%
4.0% 4.1% 4.7% 4.3% 5.3% 4.5% 8.3%
0%
10%
20%
30%
40%
50%
60%
70%
80%
90%
100%
Technologyand theInternet
Politics Economics ClimateChange
Energy MedicalScience
Astronomy
VERY WELL INFORMED MODERATELY WELL INFORMED NOT WELL INFORMED DON’T KNOW
34.9% 26.7% 21.7% 24.3% 20.2% 21.9%
14.3%
34.7% 37.8% 42.5% 34.9% 37.8% 36.2%
25.8%
24.9% 30.1% 30.8% 36.0% 35.8% 36.0%
51.6%
5.6% 5.4% 5.0% 4.8% 6.1% 5.9% 8.3%
0%
10%
20%
30%
40%
50%
60%
70%
80%
90%
100%
Technologyand theInternet
Economics ClimateChange
MedicalScience
Politics Energy Astronomy
VERY WELL INFORMED MODERATELY WELL INFORMED NOT WELL INFORMED DON’T KNOW
Stellenbosch University https://scholar.sun.ac.za

237
*21.7%). Interest areas for medical science, politics and energy attracted a similarly high SUM
informedness level. The item attracting the lowest overall proportion of informedness selections was
astronomy, wherein 51.6% of respondents indicated a not well informed or don’t know (8.3%)
response.
Conclusion
Within the national sample, fewer respondents report being adequately informed within the seven
areas of science included. This is particularly important when compared to the reported level of
interest (chapter seven). Across all 7 items, an average of 45.3% of the sample report being
adequately informed within all the scientific areas. This includes 14.3% that indicate they are very
well informed while 30.5% indicate a moderate level of informedness. This is not an unexpected
result as informedness usually lags interest in numerous studies of this nature. The areas of greatest
informedness include technology and the internet; politics and economics. Across the entire sample,
the areas of least informedness were reported to be medical science and astronomy.
Race classification was a significant factor within reported informedness about science. White
respondents reported greater informedness compared to all other race groups, while coloured
respondents report the lowest average informedness across the all questionnaire items. Within the
coloured sub-sample, respondents were 3.2 times less likely to indicate a very well informed
response compared to the white sub-sample. Reported informedness areas were also differentiated
by race classifications. All race groups reported a higher proportion of informedness with regards to
technology and the internet. Among the white sub-sample this was followed by climate change and
economics, while coloured respondents reported politics then climate change. Black respondents
reported greater informedness in the area of politics then technology and the internet followed by
economics. Within the Indian / Asian sub-sample the highest ranked informedness area was
economics then technology and the internet followed by medical science. Across all race groups
astronomy remained the area of lowest informedness.
Gender was not found to be significantly associated with informedness about science. Overall level
of informedness for males was 44.1% while for females this was 39.8%. Both males and females
reported technology and the internet and politics as scientific areas they are most informed about.
Males and females differed significantly in terms of reported informedness in the areas of politics
and economics.
Urban respondents indicated a greater level of informedness across all items, compared to rural
respondents. The scientific areas of technology and the internet, politics and economics represented
Stellenbosch University https://scholar.sun.ac.za

238
the highest informedness area for urban respondents while within the rural sub-sample
informedness in politics was greater than for technology and the internet. Astronomy continued to
be the area of least informedness within both rural and urban location groups.
Informedness in science increased with similar increases in educational attainment across all
demographic classifications. Respondents with a completed matric and post matric education
reported technology and the internet as the area of greatest informedness. Within the pre-matric
sub-sample however, politics was the area respondents felt most informed about. The next most
frequent selections for all educational attainment groups were within the areas of economics and
climate change, however proportionality varied across groups.
The age group of respondents was found to be significantly associated with reported informedness
about science. Informedness was higher within the younger age classifications and decreased
significantly for respondents older than 59 years. The overall highest level of informedness was
within the 40-49 years age category. The area of greatest informedness for respondents younger
than 39 years was consistently technology and the internet; however for those older, the area of
highest informedness did show some variation. As within other demographic classification,
astronomy was reported as the area of lowest informedness.
The levels of interest and informedness did demonstrate some lag, wherein 6 items reflected a
higher proportion of respondents reporting interest compared to respondents reporting
informedness. The notable exception here is the item for politics, where overall the national sample
indicated the same level of interest and informedness within the questionnaire items. The largest
gap between reported interest and informedness was recorded within the energy item.
Stellenbosch University https://scholar.sun.ac.za

239
Chapter Nine
Descriptive Survey Results:
Sources of Information about Science
The better educated we are and the more acquired information we have, the better prepared shall we find our minds for making great and fruitful discoveries.
Claude Bernard (1865)
Introduction
The general level of access to sources of information relating to science is a key area of investigation
toward fostering a more holistic appreciation of the overall South African public understanding of
science. Beyond formal education, informal sources of science education have become increasingly
important toward the development of a citizenry appropriately skilled to meet the challenges of the
21st century (The Wellcome Trust; 2000). Sources of scientific information, via the media, public and
private information streams are critical in expanding and solidifying the public understanding and
application of scientific concepts across a broad range of fields. However within the developing
world context, access to information sources may be limited due to interrelated sociodemographic
factors that may limit accessibility. Beyond accessibility, related concepts of preference, trust in
information sources as well as language and general literacy further contribute to the patterns of
active science information seeking behaviour within the general public(s).
OVERALL NATIONAL RESULTS FOR SCIENCE INFORMATION SOURCES ITEMS123
Overall results are presented for all responses within the most frequently and occasionally response
categories in chart 9.1. The most frequently selected response as the information source where
respondents encountered scientific information most often was Radio (69.4%).
This was followed by free-to-air television services (65.0%) and then other people (60.0%). The
selections, across the entire sample resulted in newspapers (60.2%) and satellite television (50.2%)
appearing above social media (43.2%). The response options for books / magazines (49.2%) as well
as government announcements (38.4%) received lower proportions of response sections. The items
receiving the lowest response as a source of scientific information were online based services: blogs
(33.0%); institutional websites (28.9%) and news websites (28.2%).
123
The results of the reliability analyses are found in Appendices 2 to 7 (Page 410 - 442).
Stellenbosch University https://scholar.sun.ac.za

240
Chart 9.1: Overall result: South African information sources on science assessment (Khayabus Wave 2, 2015)
Taking all response frequencies into account124 a ranking of information sources for the overall
sample within this study could be developed (see chart 9.2). Minor variations to the response
presented in chart 9.1 above are evident within the ranking of scientific information sources. The
information sources most frequently reported by South Africans to access scientific information was
radio (86.3%) followed by newspapers (82.8%) and free-to-air television (82.5%).
Chart 9.2: Overall result: Highest ranked science information sources
A higher than expected ranking was realised by “human” sources of information, with the other
people category being selected by 78.8% of respondents, as the 4th most frequently accessed source
of scientific information. Government announcements featured 7th on the ranking list, below books /
124
Responses for Most Frequently, Occasionally and Least Frequently – however excluding all Don’t Know responses.
8.2%
9.9%
11.2%
11.6%
17.3%
19.0%
26.5%
27.6%
29.5%
37.7%
39.5%
20.0%
19.1%
21.8%
26.9%
31.9%
24.3%
23.7%
32.6%
30.5%
27.3%
29.9%
71.8%
71.1%
67.0%
61.6%
50.8%
56.8%
49.8%
39.8%
40.0%
35.0%
30.6%
Blogs
Institutional Websites (University /…
News Websites
Government Announcements
Books / Magazines
Social media (Facebook, Twitter)
Satellite Pay Television (DSTV, TopTv)
Newspapers
Other people (Family, Friends, Colleagues)
Free-to-Air Television (SABC / E-Tv)
Radio
Most Frequently Frequently Least Frequently
63.6%
64.3%
65.6%
68.2%
69.9%
71.6%
75.3%
78.8%
82.5%
82.8%
86.3%
0% 20% 40% 60% 80% 100%
Blogs
Institutional Websites (University / Research…
News Websites
Social media (Facebook, Twitter)
Government Announcements
Satellite Pay Television (DSTV, TopTv)
Books / Magazines
Other people (Family, Friends, Colleagues)
Free-to-Air Television (SABC / E-Tv)
Newspapers
Radio
Stellenbosch University https://scholar.sun.ac.za

241
magazines (75.3%) and satellite television (71.6%). All online information source categories featured
at the bottom of the ranking order, with blogs being selected as the least accessed scientific
information source. The relatively low ranking of online information sources may be influenced by
issues relating to access and affordability, to be discussed later.
Four categories of information channels have been identified as particularly important. These
include Broadcast (Television and Radio); Print (Books/ Magazines and Newspapers); Human (Other
People and Government announcements) as well as Online (News Websites, Institutional Websites,
Blogs and Social Media)125.
Chart 9.3: Ranking of Broadcast science information sources
The broadcast group consisted of both free-to-air television as well as satellite pay television services
and included radio. As noted previously radio was the most frequently selected overall source of
scientific information, receiving 4.4% more frequency selections than free-to-air television (see chart
9.3). Within this information source group, free-to-air television (65.0%) was ranked higher than
satellite pay television (50.2%). These patterns may be associated to sociodemographic and access
factors as there are significant cost variations between the three types of broadcast information
sources. Due to its relative low cost, wide coverage and greater variation of listening options (radio
stations, languages and talk / music formats) radio has consistently been reported as the most
important source of information across many similar international studies.
The print information source group included newspapers as well as books / magazines. Within the
overall national result, newspapers featured more frequently as a science information source
compared to books or magazines (see chart 9.4). This result was highly consistent across all
125
Values in charts in this section are proportional values from overall rankings and will not sum to 100%
65.0% 50.2%
69.4%
Free-to-Air Television (SABC / E-Tv) Satellite Pay Television (DSTV, TopTv) Radio
Stellenbosch University https://scholar.sun.ac.za

242
demographic classifications, wherein newspapers were reported with increased frequency as a
source of science information compared to books and magazines. While in selected age and
educational attainment classification groups the proportional variation between newspapers and
books / magazines was smaller, overall the pattern presents across all demographic classifications.
This may in part be due to accessibility and cost associated with books / magazines, while
newspapers remain widely available and carries a relatively low associated cost factor.
Chart 9.4: Ranking of Print science information sources
Human Sources of information was made up of the category other people and included information
received from family, friends or colleagues. The other response item making up this information
source category is government announcements, which includes interactions with office bearers and
information received via civic meetings and announcements. Within this category, other people was
more frequently selected as an important source of scientific information, compared to government
announcements (see chart 9.5).
60.2% 49.2%
Newspapers Books / Magazines
Stellenbosch University https://scholar.sun.ac.za

243
Chart 9.5: Ranking of Human science information sources
Within the ranking this results is evident (chart 9.2) as the other people item was ranked much
higher (78.8%) in the overall national ranking of science information sources, compared to
government announcements (69.9%).
The final channel for science information is the online group. This group consists of news websites;
institutional websites; blogs and social media. At the national level all four items within this group
were ranked the lowest within the most frequent source of science information, however within this
group there are some variations in the proportional frequencies realised.
Chart 9.6: Ranking of Online science information sources
Online sources of scientific information have been classified into 2 sub-groups: websites and social
media platforms. Within the website sub-group, institutional websites (research labs, university
websites) was ranked lower than news websites as a source of scientific information. This is likely
60.0%
38.4%
Other people (Family, Friends, Colleagues) Government Announcements
33.0%
28.9%
28.2%
43.2% 71.4%
News Websites Institutional Websites (University / Research Lab)
Blogs Social media (Facebook, Twitter)
Stellenbosch University https://scholar.sun.ac.za

244
due to the highly specialised audience and appeal of institutional websites and the relatively larger
online presence of news websites (see chart 9.6).
Within the social media sub-group, blogs received the lower proportion of response compared to
social media platforms. Social media, due to its mobile platforms and wider reach and information
sharing capabilities have over the last few years become an increasingly important source of news
and information, which is echoed within this result.
Results for the science information sources measure will be further explored by the various
demographic classifications within the next part of this chapter. The data will be presented within
the following classifications: race group; gender; geographic location; educational attainment and
age. Table 9.1 presents the results for the ranking of the top four overall national most frequently
reported science information sources. This is further disaggregated by demographic classification
groups; however it is important to note that these top four national ranking positions are not
reflected in all demographic classifications.
OVERALL NATIONAL RANKING ORDER
Radio Newspapers
Free-to-Air TV
Other people
Lowest Ranked Source N
NATIONAL 86.3% 82.8% 82.5% 78.8% Blogs (63.6%) 3 486
RANKING VARY WITHIN DEMOGRAPHIC CLASSIFICATIONS
RACE N = 3 486
BLACK 85.9% 81.4% 81.0% 75.9% Blogs (60.4%) 2 523
WHITE 92.2% 92.9% 91.2% 93.6% Blogs (79.4%) 408
INDIAN / ASIAN 94.2% 93.4% 93.4% 91.7% Blogs (72.7%) 121
COLOURED 81.3% 78.6% 80.2% 77.9% Blogs (64.7%) 434
GENDER N = 3 486
FEMALE 85.0% 82.1% 81.9% 78.6% Blogs (62.4%) 1 747
MALE 88.0% 83.9% 83.5% 79.4% Blogs (65.0%) 1 739
GEOGRAPHIC LOCATION N = 3486
URBAN 88.6% 86.3% 85.2% 82.4% Blogs (66.0%) 2 297
RURAL 82.0% 76.1% 77.3% 71.8% Blogs (59.0%) 1 189
EDUCATION N = 3486
PRE-MATRIC 81.7% 74.4% 75.8% 70.9% Blogs (53.5%) 1 369
MATRIC COMPLETED 88.5% 86.9% 85.6% 82.4% Blogs (66.7%) 1 578
POST-MATRIC 91.8% 92.4% 90.5% 88.1% Blogs (77.4%) 539
AGE N = 3 472
<20 YEARS 86.5% 80.0% 84.7% 78.2% Institutional Websites (77.4%) 170
20-29 YEARS 86.6% 84.1% 84.0% 80.7% Blogs (66.8%) 1 101
30-39 YEARS 85.7% 82.8% 81.6% 78.1% Blogs (63.0%) 956
40-49 YEARS 88.0% 84.8% 84.1% 79.8% Blogs (63.2%) 598
50-59 YEARS 84.9% 81.5% 79.8% 78.5% Blogs (62.1%) 372
60+ YEARS 85.1% 76.4% 77.8% 71.3% Blogs (52.7%) 275
Table 9.1: Abridged ranking of Science Information Sources questionnaire items by demographic classifications
Stellenbosch University https://scholar.sun.ac.za

245
Among the national sample of 3 486 respondents, the race group classification variable was found to
be significantly associated with type and frequency of access to varied science information channels
(X2=95.812, p < 0.001). The frequency of encountering science information across the 11 science
information sources displayed similar patterns for the different race group classifications.
Respondents within the white sub-sample reported an average SUM Frequently126 proportion equal
to 59.5%, compared to Indian / Asian (51.6%); black (46.8%) and coloured (38.2%) respondents,
across all 11 items. There were, however, noted variations in the ranking order of science
information sources among race group classifications.
Gender group classification did not demonstrate a statistically significant association to the type and
frequency of science information channels encountered within this sample (X2=4.774, p > 0.05).
There were no significant variations in the ranking order of science information sources between
gender groups. Similarly, while female (48.5%) respondents did offer a greater proportion of SUM
Frequently response across the 11 items, compared to males (47.1%), this difference was however
not found to be statistically significant.
The rural / urban classification was found to be statistically associated with the responses to the
science information source items (X2=71.268, p < 0.001). A similarly high level of statistical
significance was demonstrated within the Province location variable (X2=289.807, p < 0.001). Within
the Provincial location variable the highest proportion of respondents reporting a SUM frequently
response was in the Gauteng province (57.0%). The lowest proportional response within the SUM
frequently options, across, was recorded for the Northern Cape (26.8%). Similarly, urban
respondents (51.8%) reported accessing a higher count and frequency of science information
sources, compared to rural respondents (39.0%).
The level of respondents’ educational attainment was significantly associated to respondent
selections on the science information sources items (X2=283.615, p < 0.001). Respondents with
increased educational attainment reported higher frequencies of encountering science information
across the 11 items in this question set. Individuals with post-matric educational attainment more
often (62.8%) reported a SUM Frequently response across the 11 science information source items,
compared to respondents within the pre-matric education group (36.2%).
Age group classification of respondents was similarly found to be significantly associated with the
sources of science information items (X2=31.517, p < 0.001). Across all 11 questionnaire items, SUM
frequently responses show a general pattern of increasing proportionality for respondents younger
126
SUM Frequently = the sum of the Most Frequently and Occasionally responses. Excludes Least Frequently and Don’t Know response selections.
Stellenbosch University https://scholar.sun.ac.za

246
than 50 years old. Among respondents older than 50 years old there appears to be a decline in SUM
frequently response, with respondents 60+ years reporting the lowest overall response average for
all science information source items (39.2%).
EXPLORATORY ANALYSIS OF VARIABLES CORRELATING WITH SCIENCE INFORMATION SOURCES
In computing the CHAID analysis on the sources of science information data, the analysis adopted
the composite score across all science information source items, toward completing this statistical
procedure. The following categorical variables were entered into the computation: gender; race;
household income; educational attainment; geographic location (rural-urban); employment and age.
Figure 9.1: Output of CHAID analysis: Science Information sources
The output of the analysis highlights four key variables that may serve as predictors of response on
sources of science information questions. These include: race; educational attainment level;
geographic location as well as gender. Figure 9.1 details the output for the CHAID analysis and
illustrates that respondents with a completed matric education (or higher), living in urban areas and
within the white race group encounter more scientific information sources than others. The
strongest predictor however remains educational attainment, where respondents with a post-matric
education achieve a score 23.2% above that of the sample average (All). Conversely, respondents
with pre-matric education (58.2%), within rural areas achieve a score 43.9% lower than those with a
post-matric education (14.3%).
50.7
44.7
45.4
41.3
40.2
38.6
30.2
33.4
36.4
36.4
30.1
27.5
28.6
34.1
17.8
14.9
35.0
40.2
34.6
34.3
32.2
31.4
39.7
31.6
28.1
28.1
30.7
31.7
30.6
24.8
31.0
26.9
14.3
15.1
20.0
24.3
27.6
30.0
30.1
35.0
35.5
35.5
39.2
40.8
40.8
41.1
51.2
58.2
0% 20% 40% 60% 80% 100%
PRE-MATRIC - RURAL
PRE-MATRIC - URBAN - COLOURED / ASIAN
PRE-MATRIC
PRE-MATRIC - URBAN
PRE-MATRIC - URBAN - BLACK / WHITE
MATRIC COMPLETED - RURAL - MALE
MATRIC COMPLETED - URBAN - COLOURED
ALL
MATRIC COMLETED - RURAL
MATRIC COMPLETED - RURAL
MATRIC COMPLETED
MATRIC COMPLETED - URBAN
MATRIC COMPLETED - URBAN - BLACK / INDIAN
MATRIC COMPLETED - RURAL - FEMALE
MATRIC COMPLETED - URBAN - WHITE
POST MATRIC
LOW MODERATE HIGH
Stellenbosch University https://scholar.sun.ac.za

247
These demographic variables will be explored in greater detail in terms of respondent response
patterns within the next sub-sections.
SCIENCE INFORMATION SOURCES BY RACE
Race classification was shown earlier to have a significant association with respondent selections
within the science information sources question (X2=95.812, p < 0.001). Within the three response
categories, the options for most frequently and occasionally have been summed into a combined
Sum Frequently response with the discussions of these results (questionnaire response categories -
see chart 9.7) . White respondents reported the highest proportion of SUM frequently responses
(59.5%), compared to Indian / Asian (51.6%); black (46.8%) and coloured respondents (38.2%). The
highest proportion of least frequently responses was selected by members of the coloured sub-
sample (61.8%).
Chart 9.7: Average response by race group: science information sources
White (40.5%) and Indian (48.4%) respondents were less likely to select a not frequently response
compared to black (53.2%) and coloured (61.8%) respondents. Similarly, black and coloured
respondents were more likely to respond below the level of the national average compared to
Indian / Asian and white respondents.
Within the white sub-sample, the most selected source of science information was other people and
newspapers, both achieving a SUM frequently proportion of 74.9%. However despite this more white
respondents selected the most frequently response within the other people (36.6%) option
compared to Newspapers (34.6%). Among this demographic, the next three highest proportional
response was within the satellite pay television (74.7%); radio (69.7%) and books / magazines
(69.1%) categories.
25.8% 21.8% 22.2% 14.9%
21.6%
33.7%
25.0% 29.4%
23.3%
26.2%
40.5% 53.2% 48.4%
61.8% 52.2%
0%
10%
20%
30%
40%
50%
60%
70%
80%
90%
100%
White Black Indian / Asian Coloured National Average
Most Frequently Occasionally Least Frequently
Stellenbosch University https://scholar.sun.ac.za

248
Among black respondents, the profile of selections within the 11 questionnaire items was different
to that of the white sub-sample. The most frequently selected response within this sub-sample was
radio, receiving a proportional SUM frequently response of 72.1%. This selection was followed by
free-to-air television (68.5%); newspapers (58.9%) and other people (58.3%).
The selection frequencies for the Indian / Asian sub-sample reflected that radio (67.5%) was the
most often selected science information source, with 37.7% selecting the most frequently response
while 29.8% of the sub-sample selected the occasionally option. Indian / Asian respondents then
most often selected other people (64.0%); satellite pay television (63.9%) and newspapers (62.8%).
The coloured sub-sample most frequently selected the free-to-air television option, with a SUM
frequently response of 54.6%. The next 3 highest selections among coloured respondents included:
radio (53.5%); other people (51.8%) and newspapers (50.7%). Among all race groups, coloured
respondents demonstrated the lowest overall frequency in encountering science information across
the 11 questionnaire items included.
Adopting the sum frequency of all valid responses a ranking order of information sources was
achieved. Across all four race classifications there were variations within the ranking order of the
most frequent source of scientific information.
Chart 9.8: Highest ranked science information sources: white subsample
Among white respondents the most frequently selected source of science information was other
people (93.6%); followed by newspapers (92.9%); radio (92.2%) and satellite pay television (92.2%).
Despite the similar ranking of radio and satellite television services, more white respondents
reported satellite pay TV (46.3%) within the most frequently response category than was selected for
radio (33.2%). Books / magazines and free-to-air television were ranked with similar frequency, while
79.4%
79.7%
82.1%
83.6%
84.8%
91.2%
91.2%
92.2%
92.2%
92.9%
93.6%
70% 75% 80% 85% 90% 95%
Blogs
Institutional Websites (University / Research…
Government Announcements
News Websites
Social media (Facebook, Twitter)
Free-to-Air Television (SABC / E-Tv)
Books / Magazines
Satellite Pay Television (DSTV, TopTv)
Radio
Newspapers
Other people (Family, Friends, Colleagues)
White N = 408
Stellenbosch University https://scholar.sun.ac.za

249
social media was ranked 7th overall within this demographic (see chart 9.8). The science information
sources receiving the lowest overall ranking within this demographic was institutional websites
(79.7%) and blogs (79.4%).
The ranking order among black respondents is different from that of white respondents. Within this
sub-sample, the highest sum frequency was recorded within the radio (85.9%) option followed by
newspapers (81.4%); free-to-air TV (81.0%) and other people (75.9%).
Chart 9.9: Highest ranked science information sources: black subsample
Social media sources of scientific information was ranked 8th among the black sub-sample (64.9%),
followed by all other online information sources (see chart 9.9). Blogs received the lowest overall
ranking within this demographic, with 60.4% of black respondents indicating any frequency of
information encountered via this information sources.
Within the Indian / Asian sub-sample radio (94.2%) was the highest ranked science information
source (see chart 9.10). This was followed by newspapers (93.4%); free-to-air TV (93.4%) and other
people (91.7%). There was some distinction to be made between the ranking of newspapers and
free-to-air TV, where a larger proportion of respondents selected newspapers (32.7%) within the
most frequently response category, compared to selections under free-to-air TV (22.1%).
60.4%
61.3%
62.1%
64.9%
67.4%
67.8%
72.3%
75.9%
81.0%
81.4%
85.9%
0% 20% 40% 60% 80% 100%
Blogs
Institutional Websites (University / Research…
News Websites
Social media (Facebook, Twitter)
Satellite Pay Television (DSTV, TopTv)
Government Announcements
Books / Magazines
Other people (Family, Friends, Colleagues)
Free-to-Air Television (SABC / E-Tv)
Newspapers
Radio
Black N = 2 523
Stellenbosch University https://scholar.sun.ac.za

250
Chart 9.10: Highest ranked science information sources: Indian / Asian subsample
Similar to the black sub-sample, Indian / Asian respondents ranked social media as the 8th most
frequent source of scientific information (76.9%), which was followed by decreasing proportional
selection for all other online information sources.
Respondents within the coloured sub-sample similarly ranked radio (81.3%) as the most frequently
accessed science information source. This was again followed by free-to-air TV (80.2%) newspapers
(78.6%); and other people (77.9%).
Chart 9.11: Highest ranked science information sources: coloured subsample
As within the other race classifications, all online sources of science information were placed within
the bottom of the ranking. Social media was ranked 7th (69.6%), while institutional websites (65.4%)
and blogs (64.7%) were the lowest ranked information sources among this race-based sub-sample.
72.7%
72.7%
74.4%
76.9%
80.2%
89.3%
90.1%
91.7%
93.4%
93.4%
94.2%
0% 20% 40% 60% 80% 100%
Blogs
Institutional Websites (University / Research…
News Websites
Social media (Facebook, Twitter)
Government Announcements
Satellite Pay Television (DSTV, TopTv)
Books / Magazines
Other people (Family, Friends, Colleagues)
Free-to-Air Television (SABC / E-Tv)
Newspapers
Radio
Indian / Asian N = 121
64.7%
65.4%
66.6%
67.5%
69.6%
71.7%
73.7%
77.9%
78.6%
80.2%
81.3%
0% 20% 40% 60% 80% 100%
Blogs
Institutional Websites (University / Research…
News Websites
Government Announcements
Social media (Facebook, Twitter)
Satellite Pay Television (DSTV, TopTv)
Books / Magazines
Other people (Family, Friends, Colleagues)
Newspapers
Free-to-Air Television (SABC / E-Tv)
Radio
Coloured N = 434
Stellenbosch University https://scholar.sun.ac.za

251
Within the four categories of information channels127 identified earlier, significant variations have
been noted across race classifications.
Radio was the overall most frequently selected source of scientific information, achieving a national
proportional frequency of 69.4%. Black respondents reported the highest frequency of selections
within this item, followed by white respondents. Among coloured and Indian / Asian respondents
the selection of radio, despite their relative ranking within these race groups (above) were lower
than the recorded national average and those value reported within the black and white
classifications (see chart 9.12).
Chart 9.12: Ranking of Broadcast science information sources by race
The highest proportion of respondents reporting free-to-air television services was within the black
(68.5%) sub-sample. Respondents with the Indian / Asian (58.4%); white (57.3%) and coloured
(54.6%) sub-samples all reported significantly lower proportions within this category, all of which fell
below the level of the national average (65.0%). Not surprisingly, across all race groups, white
(74.7%) and Indian / Asian (63.9%) respondents reported the highest frequency of responses within
satellite pay television item. Among black (45.3%) and coloured (44.2%) sub-samples this proportion
was much lower for this questionnaire item, below the recorded national average of 50.2%. This
outcome is likely related to the costs associated with satellite pay television as well as related to
technology penetration and access factors. There may also be important interrelations beyond
income, to include employment and location that may further drive this result under race
classifications.
127
These include: Broadcast (Television and Radio); Print (Books/ Magazines and Newspapers); Human (Other People and Government announcements) as well as Online (News Websites, Institutional Websites, Blogs and Social Media)
74
.7%
45
.3%
63
.9%
42
.4%
50
.2%
57
.3%
68
.5%
58
.4%
54
.6%
65
.0%
69
.7%
72
.1%
67
.5%
53
.5%
69
.4%
0%
10%
20%
30%
40%
50%
60%
70%
80%
White Black Indian / Asian Coloured NATIONAL
Satellite Pay Television (DSTV, TopTv) Free-to-Air Television (SABC / E-Tv) Radio
Stellenbosch University https://scholar.sun.ac.za

252
Within the print information sources, newspapers and books / magazines were included. Across all
race groups, more respondents selected newspaper as a more frequent source of science
information compared to books / magazines.
Chart 9.13: Ranking of Print science information sources by race
A greater proportion of white respondents selected both newspapers (74.9%) and books / magazines
(69.1%) compared to all other race groups. Similarly among this race group, the variance between
the selections of newspapers and books / magazines was overall the lowest (5.8%). Indian / Asian
respondents more often selected newspapers (62.8%) over books / magazines (56.0%) and
presented a correspondingly low variance between these sections (6.9%). Within the black sub-
sample, newspapers (58.9%) were selected 12.3% more frequently than books / magazines (46.6%).
A comparable result was achieved by the coloured sub-sample wherein newspapers (50.7%) and
books / magazines (38.8%) differed in selection frequency by 12.0% and were significantly below the
frequency recorded in the national average (see chart 9.13).
Among the white (74.9%) as well as the Indian / Asian (64.0%) sub-samples, human sources were
selected by a proportionally greater number of respondents. Within the white sub-sample in
particular, this item was the leading science information sources in terms of the overall ranking,
while all other race groups ranked these response options lower. The Indian / Asian sub-sample
reported a high response frequency, with 64.0% of this sub-sample selecting other people as an
important source of science information. Coloured (51.8%) and black (58.3%) respondents reported
this selection less frequently than within the white and Indian / Asian sub-sample, at values below
the national average (see chart 9.14).
74
.9%
58
.9%
62
.8%
50
.7%
60
.2%
69
.1%
46
.6%
56
.0%
38
.8%
49
.2%
0%
10%
20%
30%
40%
50%
60%
70%
80%
White Black Indian / Asian Coloured NATIONAL
Newspapers Books / Magazines
Stellenbosch University https://scholar.sun.ac.za
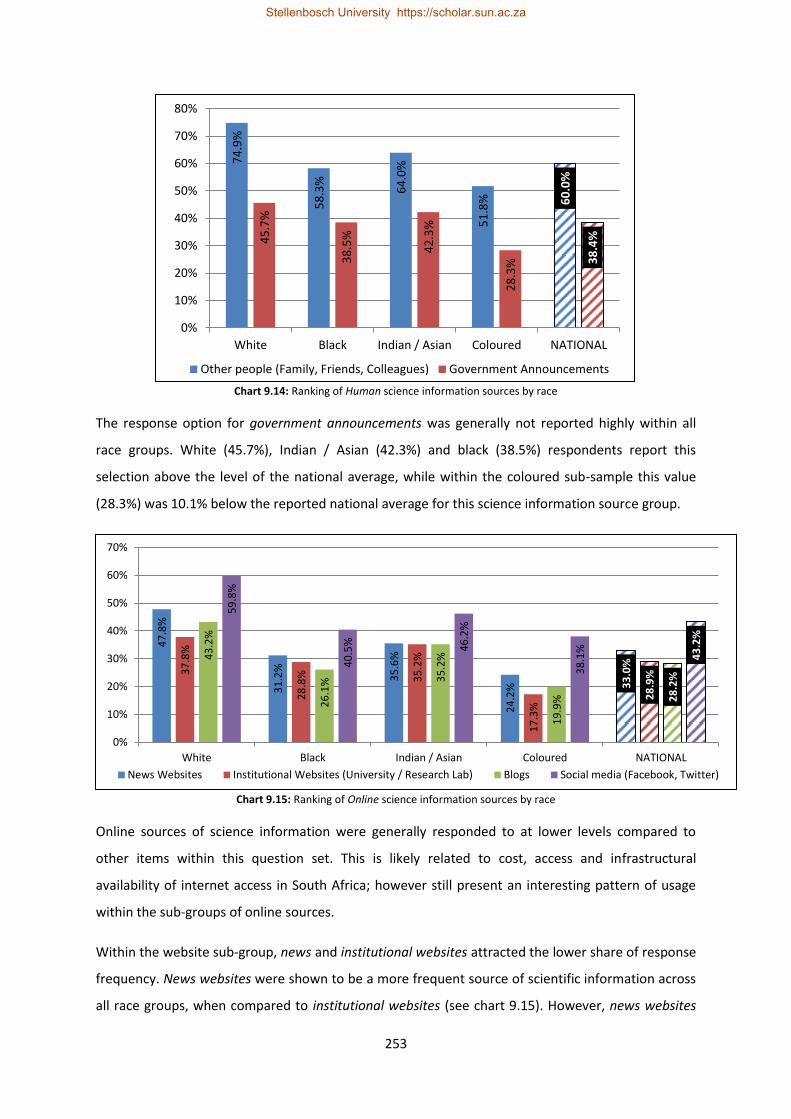
253
Chart 9.14: Ranking of Human science information sources by race
The response option for government announcements was generally not reported highly within all
race groups. White (45.7%), Indian / Asian (42.3%) and black (38.5%) respondents report this
selection above the level of the national average, while within the coloured sub-sample this value
(28.3%) was 10.1% below the reported national average for this science information source group.
Chart 9.15: Ranking of Online science information sources by race
Online sources of science information were generally responded to at lower levels compared to
other items within this question set. This is likely related to cost, access and infrastructural
availability of internet access in South Africa; however still present an interesting pattern of usage
within the sub-groups of online sources.
Within the website sub-group, news and institutional websites attracted the lower share of response
frequency. News websites were shown to be a more frequent source of scientific information across
all race groups, when compared to institutional websites (see chart 9.15). However, news websites
74
.9%
58
.3%
64
.0%
51
.8%
60
.0%
45
.7%
38
.5%
42
.3%
28
.3%
38
.4%
0%
10%
20%
30%
40%
50%
60%
70%
80%
White Black Indian / Asian Coloured NATIONAL
Other people (Family, Friends, Colleagues) Government Announcements
47
.8%
31
.2%
35
.6%
24
.2%
33
.0%
37
.8%
28
.8%
35
.2%
17
.3%
28
.9%
43
.2%
26
.1%
35
.2%
19
.9%
28
.2%
59
.8%
40
.5%
46
.2%
38
.1%
43
.2%
0%
10%
20%
30%
40%
50%
60%
70%
White Black Indian / Asian Coloured NATIONAL
News Websites Institutional Websites (University / Research Lab) Blogs Social media (Facebook, Twitter)
Stellenbosch University https://scholar.sun.ac.za

254
were selected significantly more frequently within the white sub-sample (47.8%) compared to the
levels reported within the other race classifications.
Social media was overall the most frequently selected option within the online information sources.
However, white (59.8%) respondents reported this significantly more frequently compared to Indian
/ Asian (46.2%); black (40.5%) and coloured (38.1%) respondents. The national average for the online
item was 43.2%, indicating that both the black and coloured sub-samples report this information
source less frequently, than the national average for this sample.
SCIENCE INFORMATION SOURCES BY GENDER
The gender variable did not demonstrate a statistically significant association within the respondent
selection of science information sources (X2=4.774, p > 0.05). Despite this, at the item level, radio
(X2=8.442, p < 0.001) and books / magazines (X2=14.654, p < 0.01) yielded statistically significant
association. Male respondents provided a proportionally lower SUM frequently response (47.1% -
*21.1%), compared to female respondents (48.5% - *22.1%). Respondents within the male sub-
sample were more inclined to select the least frequently response option (52.9%) compared to
female respondents (51.5%).
Chart 9.16: Average response by gender group: science information sources
Both male (69.9%) and female (69.0%) respondents presented the highest SUM frequently
proportion within the questionnaire item for radio. The second most frequent selection, among both
males (64.0%) and females (65.9%) was for the item free-to-air television. Males and females
differed in their selection frequency related to newspapers and other people. Males selected
newspapers more frequently (60.5%), while females (61.0%) reflected a higher SUM frequently
proportion within the other people item. Males and females did differ in their selection of blogs,
21
.1%
22
.1%
21
.6%
26
.0%
26
.4%
26
.2%
52
.9%
51
.5%
52
.2%
0%
10%
20%
30%
40%
50%
60%
MALE FEMALE National Average
Most Frequently Frequently Least Frequently
Stellenbosch University https://scholar.sun.ac.za
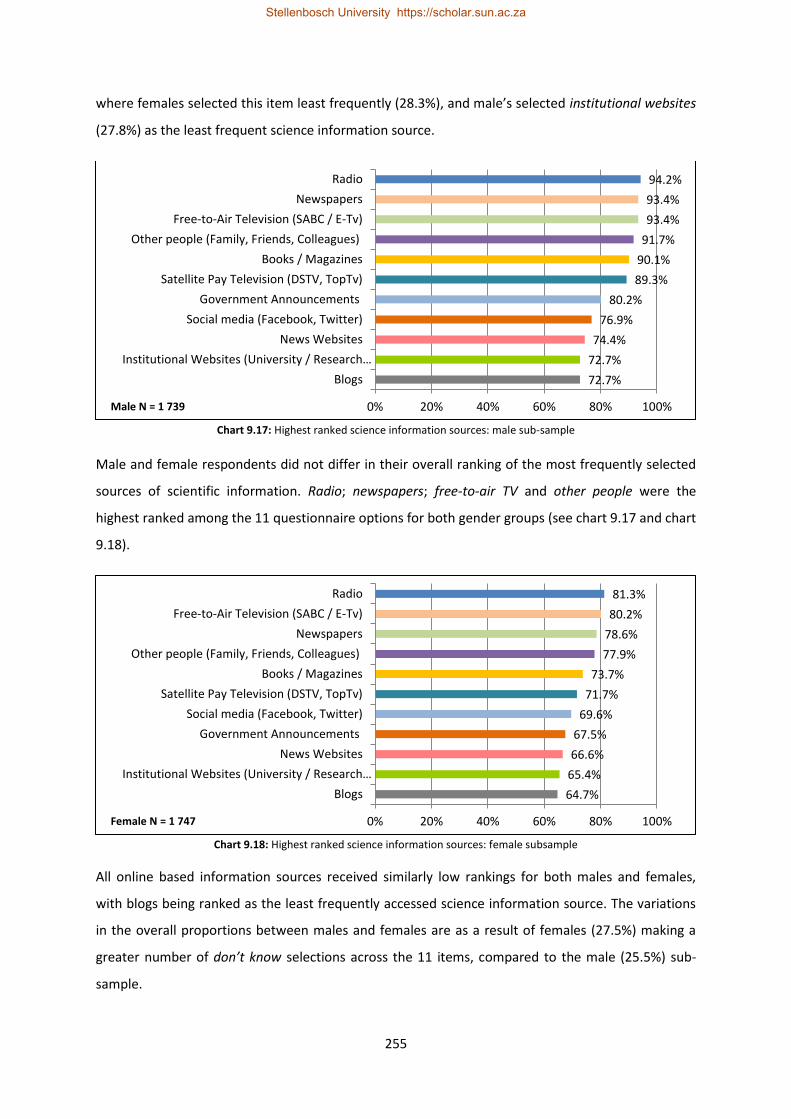
255
where females selected this item least frequently (28.3%), and male’s selected institutional websites
(27.8%) as the least frequent science information source.
Chart 9.17: Highest ranked science information sources: male sub-sample
Male and female respondents did not differ in their overall ranking of the most frequently selected
sources of scientific information. Radio; newspapers; free-to-air TV and other people were the
highest ranked among the 11 questionnaire options for both gender groups (see chart 9.17 and chart
9.18).
Chart 9.18: Highest ranked science information sources: female subsample
All online based information sources received similarly low rankings for both males and females,
with blogs being ranked as the least frequently accessed science information source. The variations
in the overall proportions between males and females are as a result of females (27.5%) making a
greater number of don’t know selections across the 11 items, compared to the male (25.5%) sub-
sample.
72.7%
72.7%
74.4%
76.9%
80.2%
89.3%
90.1%
91.7%
93.4%
93.4%
94.2%
0% 20% 40% 60% 80% 100%
Blogs
Institutional Websites (University / Research…
News Websites
Social media (Facebook, Twitter)
Government Announcements
Satellite Pay Television (DSTV, TopTv)
Books / Magazines
Other people (Family, Friends, Colleagues)
Free-to-Air Television (SABC / E-Tv)
Newspapers
Radio
Male N = 1 739
64.7%
65.4%
66.6%
67.5%
69.6%
71.7%
73.7%
77.9%
78.6%
80.2%
81.3%
0% 20% 40% 60% 80% 100%
Blogs
Institutional Websites (University / Research…
News Websites
Government Announcements
Social media (Facebook, Twitter)
Satellite Pay Television (DSTV, TopTv)
Books / Magazines
Other people (Family, Friends, Colleagues)
Newspapers
Free-to-Air Television (SABC / E-Tv)
Radio
Female N = 1 747
Stellenbosch University https://scholar.sun.ac.za

256
Chart 9.19: Ranking of Broadcast science information sources by gender group
Within the four categories of information channels there were no large variations between gender
groups and their SUM frequently selections for each of the information channels.
Female respondents showed higher response proportions within satellite TV and free-to-air TV,
however slightly lower proportions within their selections of the radio item. The variation on the
radio item, between males (69.9%) and females (69.0%), though very small, was shown to be
statistically significant at the item level.
Bothe males and females made greater selections within the newspaper option compared to the
books / magazines source of science information (see chart 9.20). Male respondents presented a
proportionally higher response (60.5%) to the newspaper compared to members of the female sub-
sample (59.9%), though this was not found to be a statistically significant variance. However,
significantly more females (52.9%) than males (45.5%) reported books / magazines as a frequent
source of science information (X2=14.654, p < 0.01).
49
.7%
50
.7%
50.2%
64
.0%
65
.9%
65.0% 69
.9%
69
.0%
69.4%
0%
10%
20%
30%
40%
50%
60%
70%
80%
MALE FEMALE NATIONAL
Satellite Pay Television (DSTV, TopTv) Free-to-Air Television (SABC / E-Tv) Radio
Stellenbosch University https://scholar.sun.ac.za

257
Chart 9.20: Ranking of Print science information sources by gender group
Human information sources similarly did not highlight any statistically significant gendered
variations. Female respondents reported other people more frequently than male respondents.
While similarly, females reported a higher proportion of SUM frequently responses within the
government announcements science information source category (see chart 9.21).
Chart 9.21: Ranking of Human science information sources by gender group
Online sources of scientific information were infrequently selected by both male and female
respondents. Within the website sub-category, a greater proportion of males (33.7%) selected a
SUM frequently response within the news website option compared to female (32.2%) respondents.
Conversely, a greater proportion of females (30.1%) report institutional websites as a source of
science information compared to the male (27.8%) sub-sample (see chart 9.22). However these
results were not found to be statistically significant.
60.5% 59.9% 60.2%
45.5%
52.9% 49.2%
0%
10%
20%
30%
40%
50%
60%
70%
MALE FEMALE NATIONAL
Newspapers Books / Magazines
59.1% 61.0% 60.0%
37.6% 39.4% 38.4%
0%
10%
20%
30%
40%
50%
60%
70%
MALE FEMALE NATIONAL
Other people (Family, Friends, Colleagues) Government Announcements
Stellenbosch University https://scholar.sun.ac.za

258
Chart 9.22: Ranking of Online science information sources by gender group
The social media sub-group achieved the greatest proportion of response from both males and
females (see chart 9.22). Within both gender groups, blogs achieved the lowest proportion of SUM
frequently responses and consequently was the least common source of science information for
these sub-samples.
SCIENCE INFORMATION SOURCES BY GEOGRAPHIC LOCATION
Respondent geographic location is significantly associated with response selections within the
sources of science information question set (X2=71.268, p < 0.001). Across all items, urban (51.8% -
*23.3%) respondents reported a significantly higher response proportion within the SUM frequently
categories, compared to rural respondents (39.0% - *17.9%). Rural respondents were more inclined
to select a least frequently response compared urban respondents (see chart 9.23).
Chart 9.23: Average response by location group: science information sources
33.7% 32.2% 33.0%
27.8% 30.1% 28.9% 28.1% 28.3% 28.2%
42.2% 44.3% 43.2%
0%
5%
10%
15%
20%
25%
30%
35%
40%
45%
50%
MALE FEMALE NATIONALNews Websites Institutional Websites (University / Research Lab) Blogs Social media (Facebook, Twitter)
23
.3%
17
.9%
21
.6%
28
.5%
21
.1%
26
.2%
48
.2%
61
.0%
52
.2%
0%
10%
20%
30%
40%
50%
60%
70%
URBAN RURAL National Average
Most Frequently Frequently Least Frequently
Stellenbosch University https://scholar.sun.ac.za

259
Among both the rural (65.3% - *41.0%) and urban (71.4% - *38.8%) sub-samples, radio was most
often selected as the information source within the most frequently and occasionally response
options (SUM frequently). Rural respondents selected a higher proportion of response on radio
within the most frequently response option compared to urban respondents; however this was not
entirely unexpected. Both sub-samples selected free-to-air TV as the second most frequent science
information source (rural: 59.4% - *36.8%; urban: 67.6% - *38.1%). The next four most selected
response options appear within both rural and urban sub-samples, however, in slightly differing
proportions (see chart 9.24). The category for other people was selected more frequently within the
urban sub-sample, followed by newspapers; while this order was reversed within the rural sub-
sample. Likewise, books / magazines was more frequently selected by rural respondents, followed
by satellite pay TV; while this response order was reversed within the results for the urban sub-
sample.
Chart 9.4: SUM frequently item response selection: sources of science information
The options reporting the lowest SUM frequently response was institutional websites and blogs,
though rural respondents reported blogs less frequently compared to urban respondents.
Based on the above selections (excluding don’t know responses), the ranking of information sources
for both urban and rural sub-populations are presented within charts 9.25 and 9.26 below.
30.7%
31.0%
36.1%
42.6%
47.9%
54.5%
57.3%
65.1%
65.7%
67.6%
71.4%
25.1%
22.1%
26.1%
29.4%
33.0%
37.3%
34.0%
49.3%
47.5%
59.4%
65.3%
0% 10% 20% 30% 40% 50% 60% 70% 80%
Institutional Websites (University / Research Lab)
Blogs
News Websites
Government Announcements
Social media (Facebook, Twitter)
Books / Magazines
Satellite Pay Television (DSTV, TopTv)
Newspapers
Other people (Family, Friends, Colleagues)
Free-to-Air Television (SABC / E-Tv)
Radio
RURAL URBAN
Stellenbosch University https://scholar.sun.ac.za
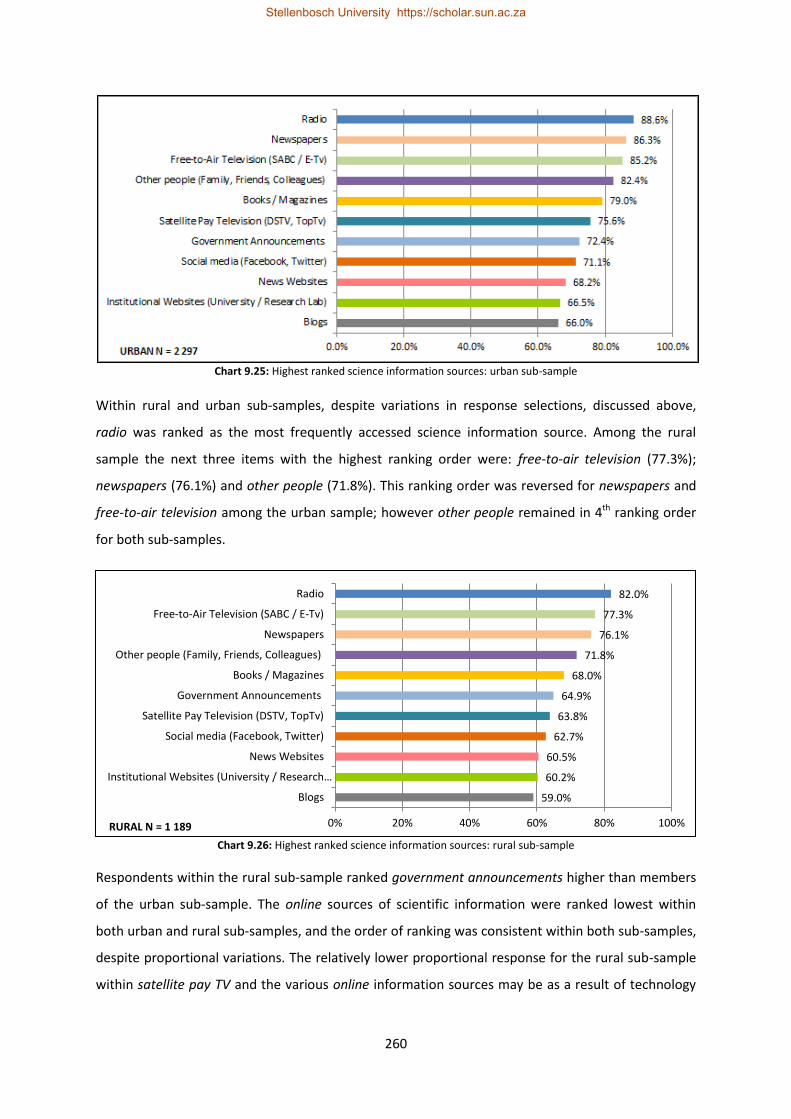
260
Chart 9.25: Highest ranked science information sources: urban sub-sample
Within rural and urban sub-samples, despite variations in response selections, discussed above,
radio was ranked as the most frequently accessed science information source. Among the rural
sample the next three items with the highest ranking order were: free-to-air television (77.3%);
newspapers (76.1%) and other people (71.8%). This ranking order was reversed for newspapers and
free-to-air television among the urban sample; however other people remained in 4th ranking order
for both sub-samples.
Chart 9.26: Highest ranked science information sources: rural sub-sample
Respondents within the rural sub-sample ranked government announcements higher than members
of the urban sub-sample. The online sources of scientific information were ranked lowest within
both urban and rural sub-samples, and the order of ranking was consistent within both sub-samples,
despite proportional variations. The relatively lower proportional response for the rural sub-sample
within satellite pay TV and the various online information sources may be as a result of technology
59.0%
60.2%
60.5%
62.7%
63.8%
64.9%
68.0%
71.8%
76.1%
77.3%
82.0%
0% 20% 40% 60% 80% 100%
Blogs
Institutional Websites (University / Research…
News Websites
Social media (Facebook, Twitter)
Satellite Pay Television (DSTV, TopTv)
Government Announcements
Books / Magazines
Other people (Family, Friends, Colleagues)
Newspapers
Free-to-Air Television (SABC / E-Tv)
Radio
RURAL N = 1 189
Stellenbosch University https://scholar.sun.ac.za

261
penetration, higher costs associated with these services as well as access and infrastructural factors
within the rural setting.
The four categories of information channels presented some significant variations within the
response across geographic location classifications.
Radio was the most widely accessed science information source among both urban and rural
respondents. However, significantly higher proportions of urban (63.2%) respondents reported radio
as a science information source, compared to rural (53.6%) respondents. Similarly, free-to-air TV
attained a higher SUM frequently response among urban respondents compared to rural
respondents (see chart 9.27).
Chart 9.27: Ranking of Broadcast science information sources by geographic location group
The selections for satellite pay TV were higher among urban respondents (43.3%), compared to rural
respondents (21.7%), however this was not unexpected and relates to the earlier discussed
accessibility and cost considerations.
It remains important to note that the above result is not a holistic reflection of media pattern usage
between rural and urban sub-samples, however is reflective only of these channels as most frequent
sources of science information among each location group classification.
Reviewing the proportionality of response between urban and rural sub-samples, it becomes
immediately apparent that a greater proportion or urban respondents access science information via
one of the 11 information channels, when compared to the proportions among the rural subsample.
43.3%
21.7%
50.2%
57.6%
45.9%
65.0% 63.2%
53.6%
69.4%
0%
10%
20%
30%
40%
50%
60%
70%
80%
URBAN RURAL NATIONAL
Satellite Pay Television (DSTV, TopTv) Free-to-Air Television (SABC / E-Tv) Radio
Stellenbosch University https://scholar.sun.ac.za
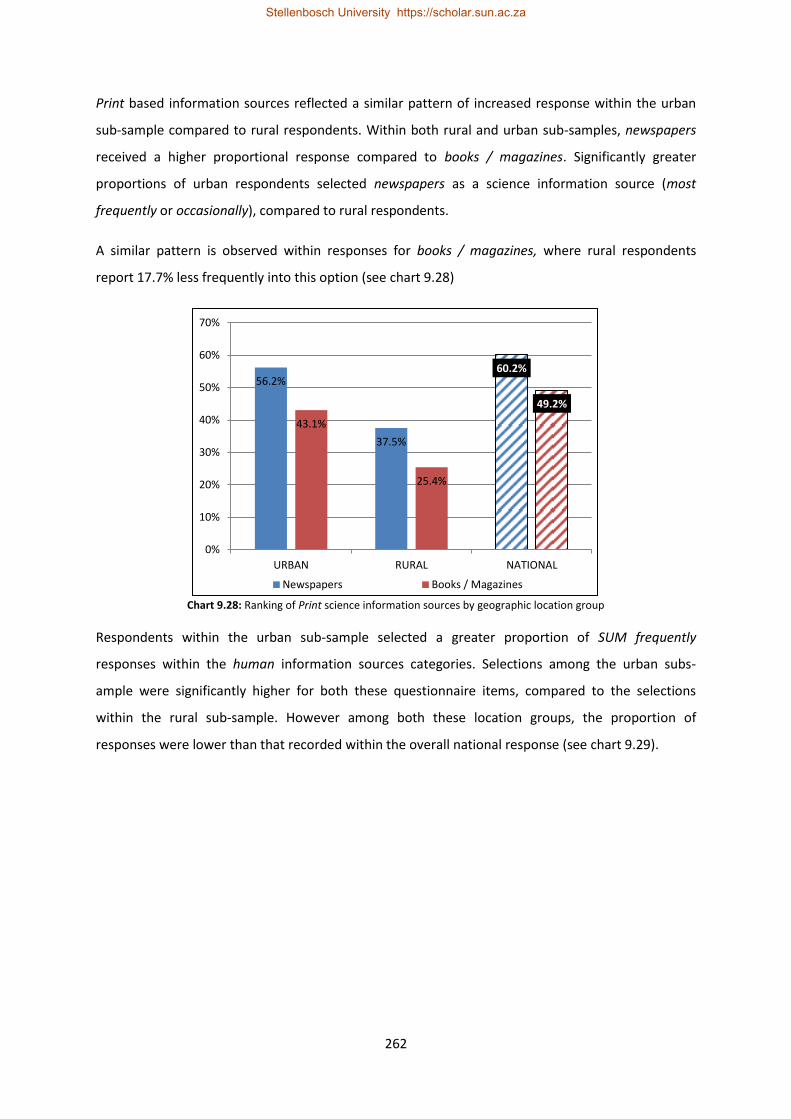
262
Print based information sources reflected a similar pattern of increased response within the urban
sub-sample compared to rural respondents. Within both rural and urban sub-samples, newspapers
received a higher proportional response compared to books / magazines. Significantly greater
proportions of urban respondents selected newspapers as a science information source (most
frequently or occasionally), compared to rural respondents.
A similar pattern is observed within responses for books / magazines, where rural respondents
report 17.7% less frequently into this option (see chart 9.28)
Chart 9.28: Ranking of Print science information sources by geographic location group
Respondents within the urban sub-sample selected a greater proportion of SUM frequently
responses within the human information sources categories. Selections among the urban subs-
ample were significantly higher for both these questionnaire items, compared to the selections
within the rural sub-sample. However among both these location groups, the proportion of
responses were lower than that recorded within the overall national response (see chart 9.29).
56.2%
37.5%
60.2%
43.1%
25.4%
49.2%
0%
10%
20%
30%
40%
50%
60%
70%
URBAN RURAL NATIONAL
Newspapers Books / Magazines
Stellenbosch University https://scholar.sun.ac.za

263
Chart 9.29: Ranking of Human science information sources by geographic location group
Online sources of scientific information were ranked similarly low by both urban and rural
respondents. However despite this urban respondents provided a significantly higher proportion of
responses within all four online information source categories (see chart 9.30).
Chart 9.30: Ranking of Online science information sources by geographic location group
Within the websites sub-group, the urban sub-sample reported higher proportions within news
websites compared to institutional websites, while there was little variation in the proportionality of
these response options for the rural sub-sample. Within the social media sub-group, urban
respondents reported a greater proportion of responses within social network information sources,
compared to selections within the blog option. Urban populations reported within these categories
more frequently than the rural sub-sample.
54
.1%
34
.1%
60
.0%
30
.9%
19
.1%
38
.4%
0%
10%
20%
30%
40%
50%
60%
70%
URBAN RURAL NATIONAL
Other people (Family, Friends, Colleagues) Government Announcements
24
.6%
15
.8%
33
.0%
20
.4%
15
.1%
28
.9%
20
.5%
13
.0%
28
.2%
34
.0%
20
.7%
43
.2%
0%
5%
10%
15%
20%
25%
30%
35%
40%
45%
50%
URBAN RURAL NATIONAL
News Websites Institutional Websites (University / Research Lab) Blogs Social media (Facebook, Twitter)
Stellenbosch University https://scholar.sun.ac.za
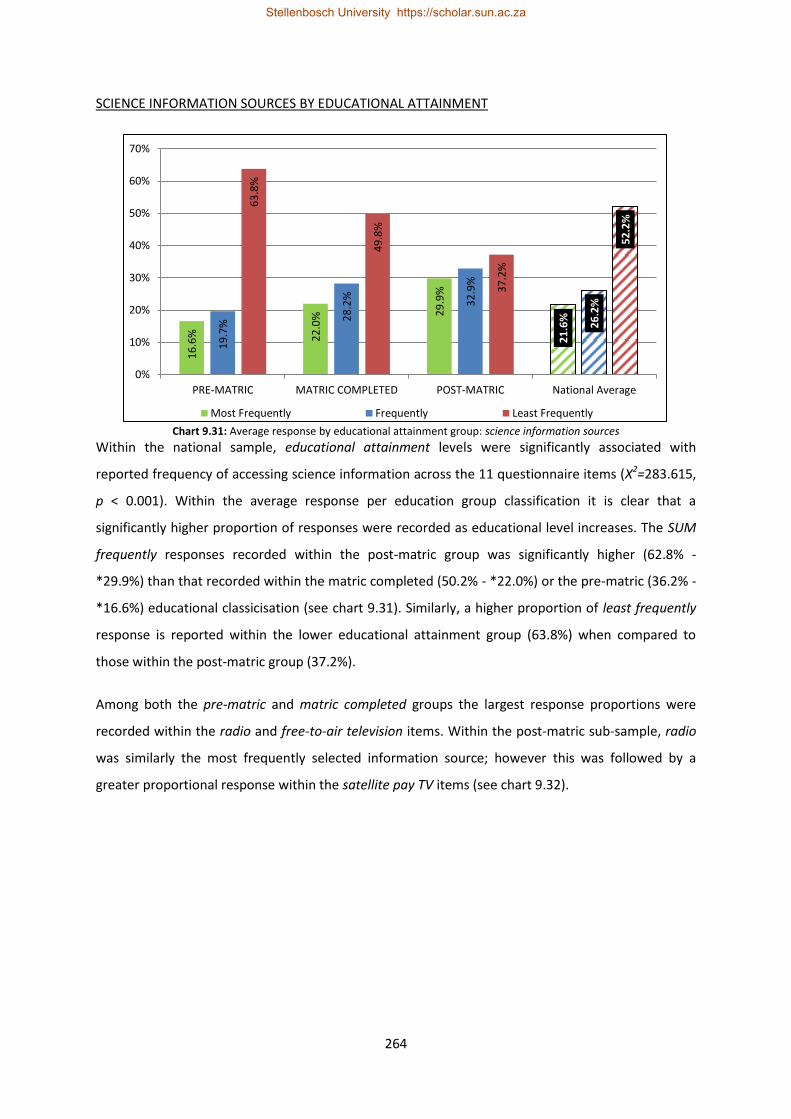
264
SCIENCE INFORMATION SOURCES BY EDUCATIONAL ATTAINMENT
Chart 9.31: Average response by educational attainment group: science information sources
Within the national sample, educational attainment levels were significantly associated with
reported frequency of accessing science information across the 11 questionnaire items (X2=283.615,
p < 0.001). Within the average response per education group classification it is clear that a
significantly higher proportion of responses were recorded as educational level increases. The SUM
frequently responses recorded within the post-matric group was significantly higher (62.8% -
*29.9%) than that recorded within the matric completed (50.2% - *22.0%) or the pre-matric (36.2% -
*16.6%) educational classicisation (see chart 9.31). Similarly, a higher proportion of least frequently
response is reported within the lower educational attainment group (63.8%) when compared to
those within the post-matric group (37.2%).
Among both the pre-matric and matric completed groups the largest response proportions were
recorded within the radio and free-to-air television items. Within the post-matric sub-sample, radio
was similarly the most frequently selected information source; however this was followed by a
greater proportional response within the satellite pay TV items (see chart 9.32).
16
.6%
22
.0%
29
.9%
21
.6%
19
.7%
28
.2%
32
.9%
26
.2%
63
.8%
49
.8%
37
.2%
52
.2%
0%
10%
20%
30%
40%
50%
60%
70%
PRE-MATRIC MATRIC COMPLETED POST-MATRIC National Average
Most Frequently Frequently Least Frequently
Stellenbosch University https://scholar.sun.ac.za

265
Chart 9.32: SUM frequently item response selection: sources of science information question set
Within all educational attainment groupings the questionnaire items for news websites; blogs and
institutional websites achieved the lowest proportional SUM frequently response. Though despite
this, the post-matric sub-sample selected blogs more frequently than institutional websites when
compared to respondents within the matric completed and pre-matric groups.
The combination of all valid responses within the question set, allowed for the development of a
ranking order of science information sources by educational attainment group.
17.6%
14.5%
17.8%
27.7%
26.6%
34.3%
60.3%
50.1%
50.6%
31.8%
67.3%
32.4%
31.1%
37.8%
41.5%
47.6%
52.0%
66.5%
62.2%
61.3%
52.0%
68.2%
40.5%
44.8%
47.0%
50.6%
60.4%
70.0%
70.7%
74.5%
76.5%
77.5%
77.8%
0% 10% 20% 30% 40% 50% 60% 70% 80% 90%
Institutional Websites (University / Research Lab)
Blogs
News Websites
Government Announcements
Social media (Facebook, Twitter)
Books / Magazines
Free-to-Air Television (SABC / E-Tv)
Other people (Family, Friends, Colleagues)
Newspapers
Satellite Pay Television (DSTV, TopTv)
Radio
POST-MATRIC MATRIC COMPLETED PRE-MATRIC
Stellenbosch University https://scholar.sun.ac.za

266
Chart 9.33: Highest ranked science information sources: pre-matric sub-sample
Chart 9.34: Highest ranked science information sources: matric completed sub-sample
Chart 9.35: Highest ranked science information sources: post-matric sub-sample
53.5%
54.9%
54.9%
56.0%
60.0%
60.7%
65.3%
70.9%
74.4%
75.8%
81.7%
0% 20% 40% 60% 80% 100%
Blogs
News Websites
Institutional Websites (University / Research Lab)
Social media (Facebook, Twitter)
Satellite Pay Television (DSTV, TopTv)
Government Announcements
Books / Magazines
Other people (Family, Friends, Colleagues)
Newspapers
Free-to-Air Television (SABC / E-Tv)
Radio
67.6%
67.9%
69.6%
73.7%
74.0%
76.0%
80.0%
82.4%
85.6%
86.9%
88.5%
0% 20% 40% 60% 80% 100%
Blogs
Institutional Websites (University / Research Lab)
News Websites
Government Announcements
Social media (Facebook, Twitter)
Satellite Pay Television (DSTV, TopTv)
Books / Magazines
Other people (Family, Friends, Colleagues)
Free-to-Air Television (SABC / E-Tv)
Newspapers
Radio
77.4%
77.9%
80.9%
81.8%
82.6%
86.6%
88.1%
88.1%
90.5%
91.8%
92.4%
65% 70% 75% 80% 85% 90% 95%
Blogs
Institutional Websites (University / Research…
News Websites
Government Announcements
Social media (Facebook, Twitter)
Books / Magazines
Other people (Family, Friends, Colleagues)
Satellite Pay Television (DSTV, TopTv)
Free-to-Air Television (SABC / E-Tv)
Radio
Newspapers
Stellenbosch University https://scholar.sun.ac.za
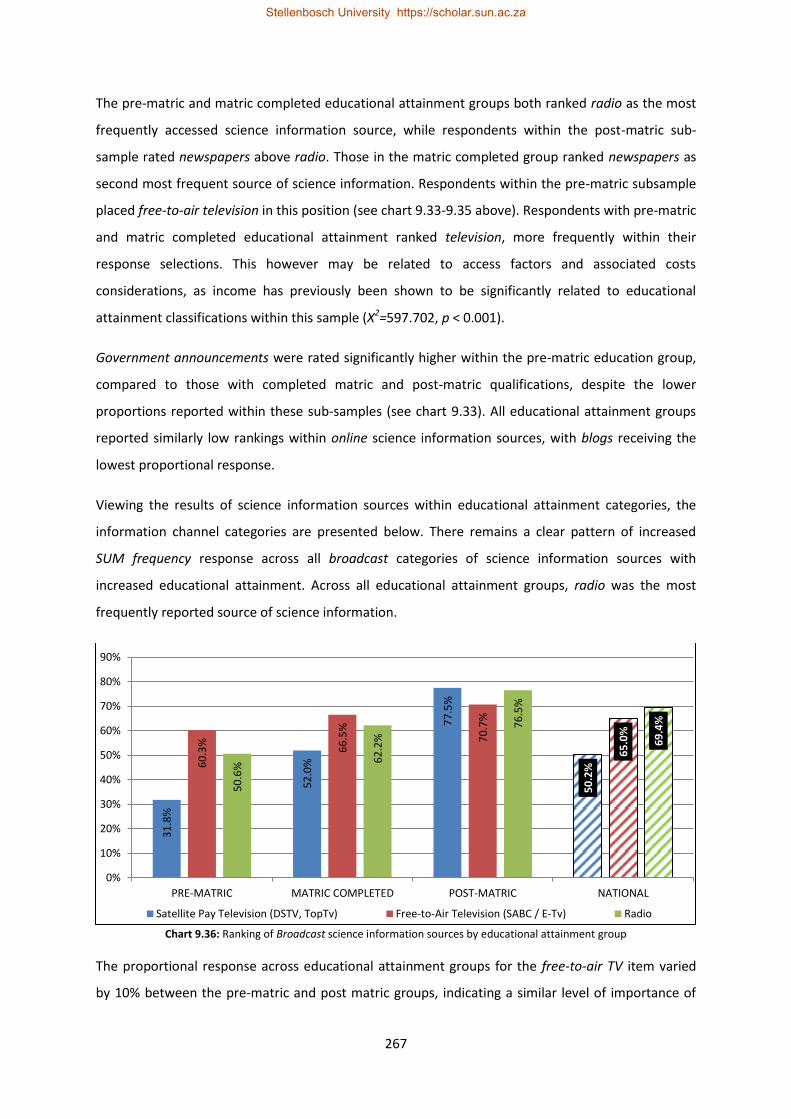
267
The pre-matric and matric completed educational attainment groups both ranked radio as the most
frequently accessed science information source, while respondents within the post-matric sub-
sample rated newspapers above radio. Those in the matric completed group ranked newspapers as
second most frequent source of science information. Respondents within the pre-matric subsample
placed free-to-air television in this position (see chart 9.33-9.35 above). Respondents with pre-matric
and matric completed educational attainment ranked television, more frequently within their
response selections. This however may be related to access factors and associated costs
considerations, as income has previously been shown to be significantly related to educational
attainment classifications within this sample (X2=597.702, p < 0.001).
Government announcements were rated significantly higher within the pre-matric education group,
compared to those with completed matric and post-matric qualifications, despite the lower
proportions reported within these sub-samples (see chart 9.33). All educational attainment groups
reported similarly low rankings within online science information sources, with blogs receiving the
lowest proportional response.
Viewing the results of science information sources within educational attainment categories, the
information channel categories are presented below. There remains a clear pattern of increased
SUM frequency response across all broadcast categories of science information sources with
increased educational attainment. Across all educational attainment groups, radio was the most
frequently reported source of science information.
Chart 9.36: Ranking of Broadcast science information sources by educational attainment group
The proportional response across educational attainment groups for the free-to-air TV item varied
by 10% between the pre-matric and post matric groups, indicating a similar level of importance of
31
.8%
52
.0%
77
.5%
50
.2%
60
.3%
66
.5%
70
.7%
65
.0%
50
.6%
62
.2%
76
.5%
69
.4%
0%
10%
20%
30%
40%
50%
60%
70%
80%
90%
PRE-MATRIC MATRIC COMPLETED POST-MATRIC NATIONAL
Satellite Pay Television (DSTV, TopTv) Free-to-Air Television (SABC / E-Tv) Radio
Stellenbosch University https://scholar.sun.ac.za

268
this information channel among respondents. By contrast, the selections for satellite pay TV varied
significantly by educational attainment group, with 77.5% of post-matric respondents indicating this
while within the pre-matric group the proportional selections was 31.8%. Possible reasons for this
disparity may have little to do with the actual information channel preference but more so to do
within cost and access factors discussed previously.
Chart 9.37: Ranking of Print science information sources by educational attainment group
Newspapers were selected more frequently than books / magazines across all educational
attainment groups. Within selections for books / magazines and newspapers, there is a higher
response frequency within the post-matric grouping when compared to those with a completed
matric or pre-matric education (see chart 9.37). Within the post-matric group, the variance between
the proportion of respondents selecting books / magazines and those selecting newspapers is lower
when compared to the variance in selections within the other educational attainment groups. The
higher proportions for respondents within the post-matric educational is not unexpected as a result
of these individuals having to seek scientific information more frequently due employment or post
schooling educational requirements, when compared to pre-matric or matric completed educational
categories.
50.6%
61.3%
76.5%
60.2%
34.3%
52.0%
70.0%
49.2%
0%
10%
20%
30%
40%
50%
60%
70%
80%
90%
PRE-MATRIC MATRIC COMPLETED POST-MATRIC NATIONAL
Newspapers Books / Magazines
Stellenbosch University https://scholar.sun.ac.za
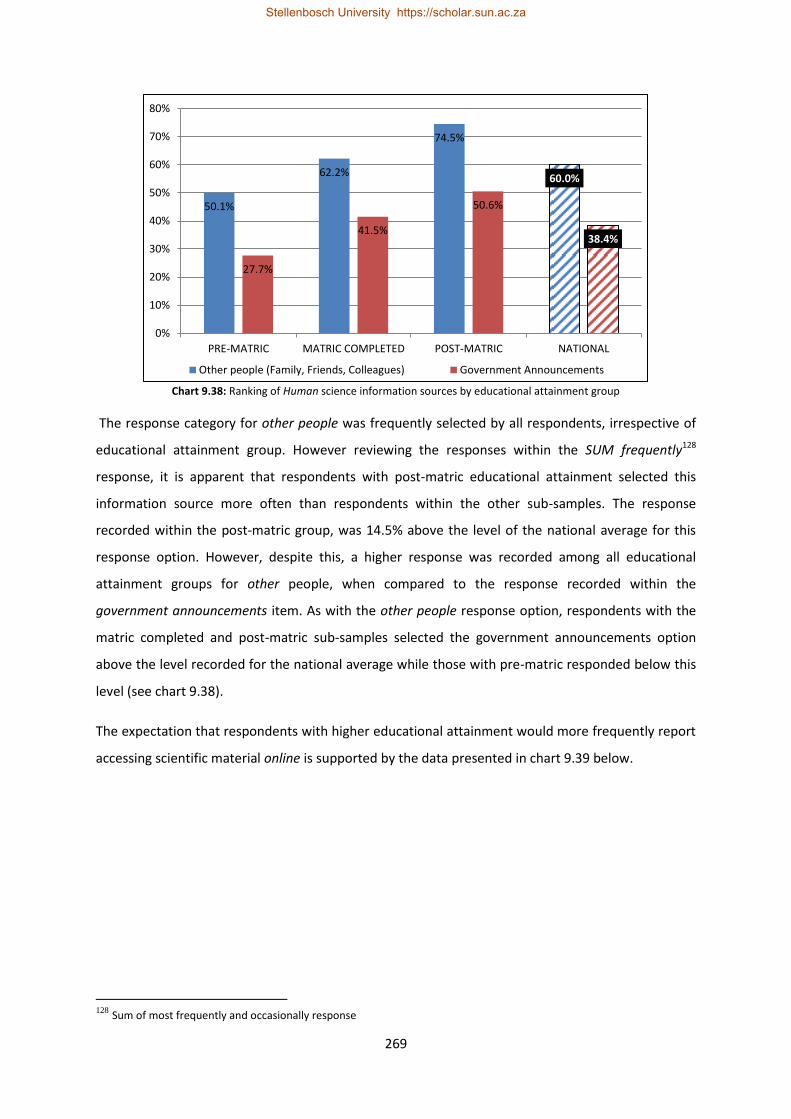
269
Chart 9.38: Ranking of Human science information sources by educational attainment group
The response category for other people was frequently selected by all respondents, irrespective of
educational attainment group. However reviewing the responses within the SUM frequently128
response, it is apparent that respondents with post-matric educational attainment selected this
information source more often than respondents within the other sub-samples. The response
recorded within the post-matric group, was 14.5% above the level of the national average for this
response option. However, despite this, a higher response was recorded among all educational
attainment groups for other people, when compared to the response recorded within the
government announcements item. As with the other people response option, respondents with the
matric completed and post-matric sub-samples selected the government announcements option
above the level recorded for the national average while those with pre-matric responded below this
level (see chart 9.38).
The expectation that respondents with higher educational attainment would more frequently report
accessing scientific material online is supported by the data presented in chart 9.39 below.
128
Sum of most frequently and occasionally response
50.1%
62.2%
74.5%
60.0%
27.7%
41.5%
50.6%
38.4%
0%
10%
20%
30%
40%
50%
60%
70%
80%
PRE-MATRIC MATRIC COMPLETED POST-MATRIC NATIONAL
Other people (Family, Friends, Colleagues) Government Announcements
Stellenbosch University https://scholar.sun.ac.za

270
Chart 9.39: Ranking of Online science information sources by educational attainment group
Within the pre-matric group, both news websites and institutional websites received a similar
proportional response of SUM frequently selections. Blogs received a particularly low response
within this group as a source of science information; however, social network websites did receive
the highest proportional response among respondents with pre-matric education. Respondents
within the matric completed sub-sample provided more frequent selections of online information
sources, compared to those with pre-matric education. Similarly, this sub-sample showed more SUM
frequently selections within news websites, compared to institutional websites as an information
source. However, the response for the latter was still higher than the proportion of response under
the blogs item (see chart 9.39).
Respondents within the post-matric education group selected all online information sources more
frequently than respondents within the other education sub-samples. News websites received a
higher proportional response compared to institutional websites as a frequently used science
information source. Compared to other educational attainment groups, the post-matric sub-sample
reported blogs as a source of science information more often compared to institutional websites. In
line with the expectation, this group rated social media more frequently as a source of scientific
information, 17.2% above the level recorded within the overall national result. Despite this, all
educational attainment groups ranked online sources of science information, except social media,
very low within their respective selections.
17
.8%
37
.8%
47
.0%
33
.0%
17
.6%
32
.4%
40
.5%
28
.9%
14
.5%
31
.1%
44
.8%
28
.2%
26
.6%
47
.6%
60
.4%
43
.2%
0%
10%
20%
30%
40%
50%
60%
70%
PRE-MATRIC MATRIC COMPLETED POST-MATRIC NATIONAL
News Websites Institutional Websites (University / Research Lab) Blogs Social media (Facebook, Twitter)
Stellenbosch University https://scholar.sun.ac.za

271
Conclusion
Sources of scientific information were assessed using an 11-item question set containing various
channels of information. Response within this assessment reveals that overall, South Africans
encounter scientific information most frequently via the radio (86.3%); followed by newspapers
(82.8%), free-to-air television (82.5%) and through contact with other people (78.8%). The media
sources least frequently selected as sources of science information were all within the online
channels. These were ranked as follows: social media (68.2%); news websites (65.6%); institutional
websites (64.3%) and blogs (63.6%).
It remains important to note that the rankings of information source presented in this chapter relate
specifically to channels of science information most frequently encountered within the general South
African public. This may differ from established media consumption pattern, however in general the
results reveal some degree of overlap in this regard.
While all race groups selected radio, newspapers and free-to-air television, overall ranking of
information sources did show some variation within race classifications. White respondents
indicated that the most frequently accessed source of science information was other people (74.9%),
followed by newspapers and then radio. Within the black, Indian / Asian sub-samples, radio was the
most frequently selected information source, with newspapers and free-to-air television being the
next three most frequent selections. Within these two race classifications, the selection proportions
were significantly higher within the Indian / Asian sub-sample compared to the black sub-sample,
however the ranking remains the same. Respondents within the coloured race group selected radio
most frequently, followed by free-to-air television and then newspapers.
A similar response pattern emerged within gender groups, where the selections remained within
radio, newspapers and free-to-air television. Across all 11 questionnaire items, males provided a
higher proportional response in all items, compared to females. This may be indicative of males
more frequently accessing scientific information, which relates well to the previously discussed
gender variations under informedness and interest in science. Both males and females ranked radio
as the most frequent source of scientific information. Within the female sub-sample this was
followed by free-to-air television and then newspapers, while among the male sub-sample
newspapers was ranked above television. Within the male response patterns, all online information
sources attained the lowest frequency as sources of scientific information. While among females,
social media was ranked slightly higher, just above government announcements, with the remaining
three online channels of information still selected least frequently.
Stellenbosch University https://scholar.sun.ac.za

272
As per the expectation a greater proportion of urban respondents reported encountering science
information more frequently across all 11 questionnaire items compared to rural respondents.
Respondents within the urban sub-sample continued to display the overall national pattern of
ranking science information sources, with radio, newspapers and free-to-air television being most
frequently selected. Rural respondents similarly selected radio more often, followed by free-to-air
television and then newspapers. The ranking of online media sources, despite response
proportionality variations between the urban and rural sample, did not differ between the two
geographic location sub-samples.
Respondents with higher educational attainment demonstrate a higher likelihood of accessing a
greater number of science information sources. All educational attainment groups selected radio,
newspapers and free-to-air television as the most frequent source of scientific information; however
the relative ranking of these items did differ within groups. Respondents with pre-matric and
completed matric education both selected radio as the most frequent source of science information.
These selections were followed by free-to-air television and newspapers within the pre-matric group,
while within the matric completed sub-sample, the order of these selections was reversed. Among
the sub-sample with post-matric qualifications the selection order differed as newspapers was
preferred over radio and followed by free-to-air television. Similarly, within this group the selection
of satellite pay television and social media was higher than within all other groups, likely as a result
of income differentials and associated costs of this technology. However, among all educational
attainment groups, online media sources were least frequently selected as science information
sources.
Within age classifications the response selection similarly reflected that of the overall national
ranking order. These included radio, newspapers and free-to-air television as the most frequent
selection options. All age classifications selected radio as the most frequent science information
source, with free-to-air television following within those less than 20 years and those older than 60
years. Among respondents aged 20 to 59 years old newspapers was the next most frequent selection
followed by free-to-air television. Respondents older than 60 years did demonstrate the lowest
response proportions across all 11 items, particularly within the online media channels.
Stellenbosch University https://scholar.sun.ac.za

273
Chapter Ten
Descriptive Survey Results:
Science Engagement
“Scientists need to engage with society routinely, during periods of calm, not just during crises.”
Dr Tolu Oni (2016)
Introduction
The development of a citizenry, appropriately skilled and aware of the enormous contribution
science and technology makes to daily life and productivity remains essential to the continued
development agenda. Toward enabling this, an understanding of the type and frequency of science
engagement activities South Africans attend would be a sine qua non. However upon reviewing data
availability it is strikingly apparent that there remains a dearth of domestic information in this
respect. This chapter presents the findings from the science engagement assessment within the
2015 wave 2 of the Khayabus survey.
OVERALL NATIONAL RESULTS FOR SCIENCE ENGAGEMENT ACTIVITIES ITEMS129
Overall results within the science engagement question set are presented within the questionnaire
categories and have undergone no recoding. Among the total sample, 4.0% of respondents selected
the don’t know response option and were therefore considered invalid. Results for the entire valid
response (n = 3 345) is presented in chart 10.1.
Chart 10.1: Overall result: South African science engagement activities assessment (Khayabus wave 2, 2015)
129
The results of the reliability analyses are found in Appendices 2 to 7 (Page 410 - 442).
11.5% 88.5%
YES NO
valid N = 3 345
Stellenbosch University https://scholar.sun.ac.za

274
Across all 5 questionnaire items, it is apparent that the majority of South Africans have not recorded
participation in any of the science engagement activities listed. While an average of 11.5% of the
sample did report a visit to one of the science engagement locations, the majority (88.5%) reported
that they had not attended one of the activities within the preceding 12 month period.
Within the valid sample (3 345), 950 unique respondents indicated that they had visited (at least)
one of the five science engagement locations listed in the questionnaire. Among these 950
respondents, the majority indicated that they had attended a public library (34.5%); followed by a
zoo or aquarium (22.8%) and any category of museum (18.3%). General public attendance at science
centres, technology exhibition, science café, festival or similar public events was not expected to be
very high as these do not inherently have a broad appeal beyond those with increased interest in
scientific areas. Despite this, within the 950 respondents indicating a visit to any of the 5 science
engagement activities listed, 12.5% had attended a science centre or technology exhibition while
11.9% indicated that attendance at a science café, festival or similar public event in the preceding 12
month period (see chart 5.132).
Chart 10.2: South African science engagement activities assessment: YES responses (% total valid)
Among the respondents that indicated attendance at one of the 5 activities listed, an assessment
was done to ascertain how many of these respondents attended more than one type of science
engagement activity130. The majority (48.2%) of respondents indicated that they had only visited one
type of science engagement activity during the reference period. This proportion decreased by 50%
for those visiting 2 and similarly again for those visiting 3 of the listed activities (see chart 10.3).
130
To note this only represents the number of different types of science activities visited, and not the quantum of visits during the 12 month period.
19.8%
13.1%
10.5%
7.2% 6.9%
11.5%
0%
5%
10%
15%
20%
25%
Public Library Zoo or Aquarium Museum (any) Science Centre,Technologyexhibition
Science Café,Festival or
similar PublicEvent
NATIONALAVERAGE
N = 3 345 YES
Stellenbosch University https://scholar.sun.ac.za

275
Chart 10.3: Science engagement activities: Number of activities attended
Very few respondents visited more than 3 science engagement activities, with only a very small
proportion visiting 4 or 5 engagement locations.
Within the above overall results, it is clear that the majority of South Africans surveyed, did not
attend any of the 5 science engagement activities listed. This is a particularly important finding
within these results, as it is counter to the earlier presented evidence that a large share of South
Africans report higher interest and informedness levels with regards to science.
Chart 10.4: Science engagement result compared to Interest and Informedness in science data
Despite the fact that 55.6% of respondents reported an interest in science, and 45.3% reported a
higher informedness across the 7 areas of science in the questionnaire, the vast majority of
respondents (88.5%) do not attend engagement activities.
Result for the attendance at science engagement activities question will be further explored by the
various demographic classifications within the next part of this chapter. The data will be presented
within the following classifications: race group; gender; geographic location; educational attainment
48.2%
23.6%
13.3%
7.4% 7.6% 0%
10%
20%
30%
40%
50%
60%
1 2 3 4 5
Stellenbosch University https://scholar.sun.ac.za

276
and age. Table 10.1 presents the average results across the 5 engagement items in the questionnaire
and is further disaggregated by demographic classification groups.
YES NO D/K N
NATIONAL 11.0% 84.9% 4.0% 3 486
RACE N = 3 486
BLACK 9.6% 86.1% 4.4% 2 523
WHITE 21.0% 77.5% 1.5% 408
INDIAN / ASIAN 8.9% 88.4% 2.6% 121
COLOURED 10.7% 84.3% 5.0% 434
GENDER N = 3 486
FEMALE 10.7% 85.3% 4.0% 1 747
MALE 11.4% 84.5% 4.1% 1 739
GEOGRAPHIC LOCATION N = 3486
URBAN 13.6% 83.0% 3.4% 2 297
RURAL 6.1% 88.6% 5.3% 1 189
EDUCATION N = 3486
PRE-MATRIC 4.9% 90.1% 5.0% 1 369
MATRIC COMPLETED 12.6% 84.1% 3.3% 1 578
POST-MATRIC 22.0% 74.2% 3.8% 539
AGE N = 3 472
<20 YEARS 17.8% 79.2% 3.0% 170
20-29 YEARS 11.0% 84.4% 4.6% 1 101
30-39 YEARS 11.4% 85.2% 3.4% 956
40-49 YEARS 11.0% 85.1% 3.9% 598
50-59 YEARS 9.7% 86.3% 4.0% 372
60+ YEARS 7.2% 87.3% 5.5% 275
Table 10.1: Results of Science engagement activities by demographic classifications in Khayabus wave 2, 2015
Across the national sample of 3 486 respondents, race group classification was found to be
significantly associated with attendance at science engagement activities (X2=137.864, p < 0.001).
White and coloured respondents demonstrated a greater attendance at science engagement
activities compared to black and Indian / Asian respondents.
Within each of the 5 items, gender group classifications did not demonstrate a statistically significant
association with reported respondent attendance at science engagement activities (X2=17.521, p >
0.05). Male respondents did report a slightly higher proportional attendance at engagement
activities, compared to females at the item level; this was not found to be significant.
Respondent location classification was found to be statistically associated with the responses to the
science engagement activity items (rural / urban: X2=91.949, p < 0.001; Province: X2=219.723, p <
0.001). The provincial data indicates that the province with the highest proportion of individuals that
attended science engagement activities was the Western Cape (41.6%). The Limpopo province
attracted the lowest science engagement attendance scores (15.2%); however this may be related to
Stellenbosch University https://scholar.sun.ac.za
277
the availability of these activities in that province. Location classification at the level of rural / urban
demonstrated a similarly a significant variation in the results achieved within each of the location
sub-samples (see table 10.1).
The level of respondent educational attainment demonstrated a significant association with
reported attendance at science engagement activities (X2=284.199, p < 0.001). A larger proportion of
respondents with post-matric educational attainment attended science engagement activities within
the preceding 12 month period, compared to those with a completed matric or pre-matric
education.
Respondent age group classification was similarly found to display a statistically significant
association with respondent reported attendance at science engagement activities (X2=89.109, p <
0.001). National average results indicate a decreasing attendance at science engagement activities
with increased age. Respondents within the 60+ year’s age group report the lowest attendance at
science engagement activities.
These demographic variables will be explored in greater detail in terms of respondent response
patterns within the next sections.
EXPLORATORY ANALYSIS OF VARIABLES CORRELATING WITH SCIENCE ENGAGEMENT ACTIVITIES
The variables included in the CHAID analysis for the science engagement question set included:
gender; race; household income; educational attainment; geographic location (rural-urban);
employment and age. The composite score across all engagement activities was used in the
computation of the output from within this analysis. The output of the CHAID procedure was
imported into Microsoft Excel and is presented graphically in Figure 10.1 below.
Stellenbosch University https://scholar.sun.ac.za

278
Figure 10.1: Output of CHAID analysis: Science Engagement activities
The results of the analysis reveal that among the seven variables considered, two are considered to
be the best predictors of South African respondent attendance at science engagement activities.
These variables include educational attainment level and geographic location (rural-urban).
Compared to the average across ALL respondents, individuals with a completed matric or higher
educational level and reside in urban areas are 15.5% more likely to attend any of the five listed
science engagement activities. At the other end, respondents not living within urban areas, and
possessing lower educational attainment are less likely to attend science engagement activities.
These demographic variables will be explored in greater detail in terms of respondent response
patterns within the next sub-sections. They will be further used, in conjunction with other
conceptually and statistically significant variables within the multinomial logistic regression
modelling, in a later chapter.
SCIENCE ENGAGEMENT ACTIVITIES BY GEOGRAPHIC LOCATION
Geographic location was shown to have a statistically significant influence on respondent science
engagement activities (rural / urban: X2=91.949, p < 0.001; Province: X2=219.723, p < 0.001). Though
these results will not be examined in great detail by provincial boundaries, table 10.1 lists the
proportions of each provincial sample in terms of attendance at science engagement activities.
71.7
66.4
49.4
61.2
59.3
50.8
49.2
48.2
45.5
36.6
23.3
23.5
29.4
26.4
26
29.5
24.4
23.6
23.8
19.7
5
10.1
10.1
12.4
14.7
19.7
26.4
28.2
30.7
43.7
0% 20% 40% 60% 80% 100%
RURAL FEMALE MATRICCOMPLETED
FEMALE PRE-MATRIC
MALE PRE-MATRIC
RURAL MATRIC COMPLETED
PRE-MATRIC
RURAL MALE MATRIC COMPLETED
MATRIC COMPLETED
ALL
URBAN MATRIC COMPLETED
POST MATRIC
LOW MODERATE HIGH
Stellenbosch University https://scholar.sun.ac.za

279
Western Cape 41.6%
Gauteng 33.1%
Mpumalanga 29.7%
Eastern Cape 23.3%
North West 21.0%
KwaZulu Natal 19.1%
Free State 16.8%
Northern Cape 15.3%
Limpopo 15.2%
Table 10.1: Provincial proportions of respondents attending science engagement activities
Within the provincial results, the Western Cape (41.6%) and Gauteng (33.1%) province reported the
highest frequency of respondents attending science engagement activities within the reference
period. This was followed by Mpumalanga (29.7%); the Eastern Cape (23.3%) and the North West
(21.0%) province. All other provincial areas reported science engagement attendance less than 20%.
This may in many ways be related to the availability of 4 of these activities within all the provincial
areas.
Significantly lower proportions of rural (6.4%) respondents report attending science engagement
activities, compared to respondents within the urban (14.1%) sub-sample. Rural respondents report
an average attendance across the five science engagement activities just above half that of the
national average (see chart 10.1).
Chart 10.1: Average response by location group: science engagement activities
This variation in the reported proportions of rural and urban respondents attending these activities
may be as a result of the previously discussed location and frequency of these activities outside of
major metropolitan areas; however that cannot be shown within this data set.
14.1%
6.4%
11.5%
0%
2%
4%
6%
8%
10%
12%
14%
16%
URBAN RURAL National Average
Stellenbosch University https://scholar.sun.ac.za

280
The above is again demonstrated when looking at the number of science engagement activities
attended within each of the rural and urban sub-samples (see chart 10.2). Across all items, urban
respondents report increased attendance at science engagement activities, compared to rural
respondents. While rural respondents do indicate higher attendance at between one and two
science engagement activities, the proportions within this sub-sample are all below 1.5% for more
than two science engagement activities.
Chart 10.2: Science engagement activities: Number of activities attended
Urban respondents report the highest proportions for between one and three activities, however
similarly low proportions are reported for four or more science engagement activities attended
within the reference period.
Chart 10.3: Science engagement activities attended by location group
14
.1%
7.3
%
4.8
%
2.7
%
2.9
%
11
.4%
4.7
%
1.3
%
0.8
%
0.5
%
0%
2%
4%
6%
8%
10%
12%
14%
16%
1 2 3 4 5
URBAN RURAL
22
.9%
16
.8%
13
.1%
9.0
%
8.5
%
13
.6%
5.7
%
5.5
%
3.7
%
3.7
%
19
.8%
13
.1%
10
.5%
7.2
%
6.9
%
0%
5%
10%
15%
20%
25%
Public Library Zoo or Aquarium Museum (any) Science Centre, Techexhibition
Science Café, Festivalor similar
URBAN RURAL National
Stellenbosch University https://scholar.sun.ac.za

281
The majority of respondents indicate attending a public library, aquarium or museum. Urban
respondents report the highest proportions within each item. Within the rural sub-sample, the
highest proportion was similarly reported within the item for public library, however responses in
each of the four remaining categories was significantly lower for this sub-sample. Response for both
sub-samples was lowest under science centre, tech exhibition and science café, festival or similar
event.
Within the preceding sections of this chapter location group has been identified as demonstrating a
significant association to response at the various survey items. Similarly within interest,
informedness and science engagement this pattern continues and is presented within chart 10.4.
Chart 10.4: Science engagement result compared to Interest and Informedness in data by location group
Urban respondents generally achieved higher interest and informedness proportions compared to
their rural counterparts. Similarly, urban respondents’ attendance at science engagement activities,
while significantly lower than the levels of interest and informedness, is proportionally higher than
the level recorded within the rural sub-sample. Within each data element in chart 10.4, the rural
response is below that of the national average.
SCIENCE ENGAGEMENT ACTIVITIES BY EDUCATIONAL ATTAINMENT
Educational attainment level was shown earlier to be significantly associated with attendance at
science engagement activities (X2=284.199, p < 0.001). Respondents with a post-matric education
demonstrated a consistently higher outcome on the measures within this survey. Similarly within the
science engagement questions, a significantly higher proportion of the post-matric (22.9%)
participants reported attending any of the five science engagement activities, when compared to the
matric competed (13.0%) and the pre-matric (5.1%) sub-samples (see chart 10.5).
55.2%
46.1%
55.6%
49.0%
37.7%
45.3%
14.1%
6.4%
11.5%
0%
10%
20%
30%
40%
50%
60%
URBAN RURAL National Average
SUM INTERESTED SUM INFORMED SUM ENGAGED
Stellenbosch University https://scholar.sun.ac.za

282
Chart 10.5: Average response by educational attainment group: science engagement activities
Respondents with post-matric education displayed significantly different science engagement
attendance compared to respondents within the remaining educational attainment sub-samples.
Respondents with pre-matric educational attainment present a higher proportion of attendance
within one or two engagement activities; however do not demonstrate a similar pattern for more
than three engagement activities. Within the categories for one and two activities attended, both
matric completed and post-matric respondents demonstrate higher proportions of attendance,
however this decreases for those with a completed matric, beyond three engagement activities.
Chart 10.6: Science engagement activities: Number of activities attended
Those with post-matric educational attainment, report the highest attendance at science
engagement activities across all educational attainment groupings. Across all items, respondents
5.1%
13.0%
22.9%
11.5%
0%
5%
10%
15%
20%
25%
PRE-MATRIC (1) MATRIC COMPLETED (2) POST-MATRIC (3) National Average
8.8
%
3.9
%
1.4
%
0.4
%
0.4
%
15
.8%
7.9
%
4.6
%
1.8
%
2.2
%
16
.1%
8.7
%
6.5
%
6.9
%
5.9
%
0%
2%
4%
6%
8%
10%
12%
14%
16%
18%
1 2 3 4 5
PRE-MATRIC (1) MATRIC COMPLETED (2) POST-MATRIC (3)
Stellenbosch University https://scholar.sun.ac.za

283
with post-matric education report the highest attendance frequency. However, this was highest for
the public library and zoo or aquarium items (see chart 10.7).
Chart 10.7: Science engagement activities attended by educational attainment group
The item for museums continued to attract a higher proportion of response compared to science
centre, tech exhibition and science café, festival or similar event, wherein those with a pre-matric
education have a particularly low proportional response. Across all three data items in chart 10.8,
increases in educational attainment demonstrate similar increase in response on each data item.
Chart 10.8: Science engagement result compared to Interest and Informedness data by educational grouping
Respondents with post-matric education demonstrate higher proportional interest and informedness
outcomes. Similarly the variance between interest and informedness is lower for respondents within
this higher educational attainment grouping, compared to those with matric completed of pre-
matric education. Despite this, even those within the post-matric group still demonstrate a low
10
.8%
5.6
%
4.8
%
2.4
%
2.0
%
23
.4%
14
.7%
11
.6%
7.5
%
8.0
%
31
.5%
27
.2%
21
.8%
18
.5%
15
.5%
19
.8%
13
.1%
10
.5%
7.2
%
6.9
%
0%
5%
10%
15%
20%
25%
30%
35%
Public Library Zoo or Aquarium Museum (any) Science Centre, Techexhibition
Science Café, Festivalor similar
PRE-MATRIC (1) MATRIC COMPLETED (2) POST-MATRIC (3) National
43
.0%
55
.5%
64
.9%
55
.6%
35
.3%
47
.4%
62
.7%
45
.3%
5.1%
13.0%
22.9%
11.5%
0%
10%
20%
30%
40%
50%
60%
70%
PRE-MATRIC (1) MATRIC COMPLETED (2) POST-MATRIC (3) National Average
SUM INTERESTED SUM INFORMED SUM ENGAGED
Stellenbosch University https://scholar.sun.ac.za

284
engagement frequency, despite being significantly interested and informed than for respondents in
lower educational attainment groups.
Conclusion
Among the most important findings within the results of this chapter is the level of science
engagement activities attended by the general South African population. At the national level, only
11.5% of the survey sample (n = 3 486) report having visited any of the five science engagement
locations listed in the questionnaire. The vast majority of respondents (88.5%) report not having
attended a science engagement activity within the preceding 12 months. The most frequently visited
science engagement activity within the total sample was public libraries followed by a zoo or
aquarium and a museum. The selection options for science centres, technology exhibitions and
science café’s; festivals or similar public event received the lowest proportional response across all
demographic classifications. The largest proportion of yes responders report having attended one
type of engagement activity, with fewer respondents having visited two or three science
engagement locations within the preceding 12 months.
Among race classifications, more white (21.3%) respondents report having visited a science
engagement activity location within the preceding 12 months; followed by coloured (11.2%) and
black (10.0%) respondents. Indian / Asian respondents report the lowest level of science
engagement, with only 9.2% of respondents within this sub-sample indicating a yes response at any
of the questionnaire items. Across all five engagement activity locations, white respondents report
the highest proportions across all groups. However, compared to black and coloured respondents,
Indian / Asian respondents reported a greater frequency of attendance at science centres,
technology exhibitions and science café’s, festivals or similar public event.
Male respondents report a higher proportion of attendance at science engagement activities,
however this result was not found to be statistically significant. Both males and females report
visiting a public library followed by a zoo or aquarium and a museum; with response proportions
being fairly equal between gender groups. More males report attendance at science centres,
technology exhibitions and science café’s, festivals or similar public event compared to females.
Within provincial boundaries, respondents within the Western Cape, Gauteng and Mpumalanga
report the highest overall attendance at science engagement locations. The lowest proportion
response was received within the Northern Cape and Limpopo provinces. Within rural / urban
classifications, a greater proportion of urban respondents report attendance at science engagement
locations compared to rural respondents. Attendance was more frequent at a public library followed
Stellenbosch University https://scholar.sun.ac.za
285
by a zoo or aquarium or a museum for both location sub-samples. Rural respondents however report
significantly lower proportions within the four categories following public library.
Validating the expectation, a higher proportion of respondents with increased educational
attainment attended more science engagement activities within the reference period. Respondents
with post-matric education were found to be 4.5 times as likely to visit one of the listed science
engagement locations compared to those with pre-matric educational attainment. Individuals with
pre-matric educational attainment report the highest proportional response within the
questionnaire category for public library. However, this decreases significantly in the remaining four
science engagement response options. Respondents with a completed matric report higher
proportions within public library followed by visits to a zoo / aquarium or a museum. Within the
post-matric educational attainment category, respondents report the largest proportional response
across all five questionnaire categories.
Younger respondents attend a significantly higher number of science engagement activities,
compared to older respondents. Respondents between the age of 20 and 49 years report a
consistent level of attendance at any of the five engagement activities, however among those older
than 50 years, reported attendance at these activities decreases. As within other demographic
classifications attendance was highest at public libraries, followed by zoo / aquarium or a museum,
with younger respondent’s representing the majority of attendance selections. Reported attendance
at science centres, technology exhibitions and science café’s, festivals or similar public was generally
low across the sample; however as with the highest educational groupings, younger respondents
attended these events more frequently than their counterparts.
Stellenbosch University https://scholar.sun.ac.za

286
Chapter Eleven
Indicators & Predictors of the South African Public Understanding of Science
The critique of the public deficit model as a common sense prejudice among experts is valid, for certain, but its identification with the protocol of survey research is dysfunctional. Breaking this unfortunate mind frame of linking
model and protocol will help to liberate and expand the research agenda.
Bauer, Allum and Miller (2007)
Introduction
Chapter Eleven continues as an extension to Chapter Ten, presenting the set of indicators produced
within this research as well as the demographic predictors of outcomes within each indicator. The
chapter presents these elements within two sections. The initial section describes the process of
index construction, validation and reliability assessment; followed by the data outputs for each
indicator. This is complimented by a section highlighting the statistical interactions between the six
indicators. This sub-section concludes with a general public understanding of science audience
segmentation, based on the outcomes of the survey findings.
The second section of this chapter is devoted to a discussion of the techniques and results from the
analysis examining predictors of outcomes on each indicator to be presented. The significant
predictors of outcomes are then presented within a predictive model for each indicator.
11.1 INDEX CONSTRUCTION and VALIDATION
An indicator is a composite measure that aggregates the response on multiple questionnaire items
to provide summary information and rank-order on observations that represents the general
dimension under investigation (Hawken and Munck, 2013). Within social research, and particularly
quantitative studies, indicators are extensively used to arrive at more efficient data analysis and
presentation methods. Composite data measures have three key advantages within research.
Specific data of interest is often not accessible or too multifaceted to adequately understand within
a single questionnaire item. This is particularly relevant for more complex research constructs such
as job satisfaction or as is the case in the current research, public understanding of science. In these
cases, it often requires data inputs from a number of questionnaire items to adequately address the
research area of interest in a meaningful way. Secondly, indicators offer research the ability to score
and rank-order data from multiple items into more distinct categories of response. Lastly, indicators
enable data reduction of a variety of response variables into a smaller number of outputs (or a single
output) in a manner that makes the result more accessible to a wider audience. The efficiency that
this characteristic of indices introduces provides the researcher with the ability to relay the required
Stellenbosch University https://scholar.sun.ac.za
287
level and detail of information, while ensuring the volume of data is minimised (Babbie, 2007). The
power and precision that indicators offer research outputs is of particular importance within the
field of science communication and the public understanding of science as it enables greater
accessibility of data and information, requiring little background technical experience to interpret
index outcomes.
This does however necessitate that indices are correctly constructed and validated prior to being
implemented within research studies (Castro-Martínez et al, 2009). Babbie (2007) provides among
the few comprehensive guides to effectively produce reliable indices. He notes the following four
steps involved in index construction: item selection; examination of empirical relationships, devising
a scoring method and validation of the index.
Item selection involves the inclusion of appropriate variables to measure the construct under
consideration. This requires that all items carry a high degree of face validity, implying that all items
should have a direct link to the subject area being measured. Within this step, the second
requirement is that of unidimensionality. This implies that each item within the index should only
measure a single dimension of the concept under investigation. Further to the unidimensionality
aspect, the items selected should conform to a level of assessment that is predetermined. This
relates to the generality or specificity of the items within the index and would ensure that the index
remains focussed to the specific dimension of interest. The last consideration under this step
requires that items offer a degree of variance within the data that allows for adequate
discrimination of response across all the selected items.
The second step requires an examination of empirical relationships between the selected items in
the index. Where items are found to be related to each other these items remain good candidates
for inclusion in the index. The determination of empirical relationships often relies on the outputs of
cross-tabulation procedures and an examination of inter-item correlation matrices. Everit (2002) and
Field (2005) independently note that items with correlation values lower than 0.300 should be
considered inappropriate for inclusion within an index. Many of these inter-item correlations and
cross-tabulation results have been reported in chapters five through ten; however, selected
empirical evidence of importance will be presented within the following sections.
The scoring of the items included allows for the composite measure to output a single variable that
describes all of the items making up in index. Babbie (2007) notes the important consideration of the
range of the index. This requires some trade-off between the range of measurement and the
number of cases within each scoring point in the index. A maximum range of measurement would
Stellenbosch University https://scholar.sun.ac.za

288
ensure that the extreme scores at both the positive and negative ends of the index are included;
however, the distribution of response at either extreme may be insufficient for meaningful analysis.
This was duly considered and applied within the development of the indicator set. An additional
consideration within item scoring is the application of weighted or unweighted scores. It remains
common practice to weight scores equally (or not weight) scores unless there remains conceptual or
theoretical reasons to apply differential weighting to index scores.
The final step in index construction requires validation of the index. The initial process in index
validation is item analysis. This provides an assessment of each items’ independent contribution to
the total index score. Two characteristics of item analysis are item difficulty and item discrimination.
Item difficulty relates to the proportion of respondents who provided a correct response to the item.
While item discrimination is a measure of response variation - on specific items - between known
high performers and low performers. If high performers provided valid or correct responses more
frequently than low performers then the item is considered to have an acceptable discriminatory
property. The item discrimination index is presented as a ratio ranging between -1.0 and +1.0, where
values above (or below) zero are preferable to a zero value131. Values above 0.20 are generally
considered an acceptable discriminatory index ratio (Tredoux and Durrhiem, 2002). The next
validation step involves external validation of the index. External validation requires that the entire
index be tested for validity and reliability. Validity testing includes content validity, criterion validity
and construct validity. Content validity refers to appropriateness and coverage of all aspects of the
area of interest. Criterion validity is a measure of the predictive power of the measure compared to
other measures presumed to be related. An example of this would be questions measuring the
importance of education, which should be empirically predictive of response on questions relating to
educational achievement. While construct validity refers to the degree to which the test measures
what it is supposed to measure. Types of construct validity include convergent and discriminant
validity. The final consideration under validation refers to the reliability of the items within the
index. This is assessed using the split-half reliability assessment adopting the Cronbach’s Alpha
procedure.
11.2 INDICATORS of the SOUTH AFRICAN PUBLIC UNDERSTANDING of SCIENCE (SAPUS)
Many of the index construction criteria discussed above have already been presented within
chapters five through ten (and the linked appendices) but will briefly be revisited. Requirements
under item selection as well as an examination of empirical relationships have already been
131
However positive values are usually more acceptable as negative values indicate that the item is questionable despite its negative discriminatory value.
Stellenbosch University https://scholar.sun.ac.za

289
discussed within this thesis and will be highlighted before addressing the process of index scoring
and index construction in greater detail under each indicator.
Within item selection, Chapter Four presents the detailed procedures applied in adopting, adapting
and selecting the final items to be included within each question set. Comprehensive literature
reviews and comparisons of questionnaire items from a variety of empirical studies had been
considered prior to making the final item selections for inclusion in the survey instrument. Within
each index, all items carry a high degree of face validity within their respective question-set domains
and have been included on this basis.
Unidimensionality implies that all items within a question set have a latent variable in common.
Dimensionality of the items included was assessed adopting two approaches. The initial approach
involved using factor analysis to ascertain the number of factor-components present within each
question set. All questionnaire items within each question-set underwent factor analysis and the
results are presented in table 11.1 below together with the reliability assessment output.
Factor Analysis Cronbach's Alpha
Question set KMO Bartlett's Test of
Sphericity Eigenvalue
% of variance explained
Alpha
Science knowledge 0.934 p < 0.001 5.271 53.486 0.911
Attitudes to Science 0.838 p < 0.001 3.114 71.214 0.939
Interest in Science 0.938 p < 0.001 5.080 68.118 0.936
Informedness in Science 0.940 p < 0.001 5.371 73.022 0.949
Science Information Sources 0.947 p < 0.001 7.156 69.398 0.946
Science Engagement 0.899 p < 0.001 4.080 77.047 0.943
Table 11.1: Result of factor analysis and reliability assessment
All questionnaire items, within their specific question set were found to contain a single factor-
component with an eigenvalue greater than 1, as suggested by Slocum-Gori et al (2011). Each
demonstrated a significant value for KMO and the Bartlett's test of sphericity (see table 11.1). These
results point to the existence of a single latent variable within each question set. Further to the
factor analysis, reliability analysis was performed adopting the Cronbach’s Alpha (discussed in
Chapter Five / Appendix 2). All items within each of the six question-sets achieved high inter-item-
correlation values and similarly high values for Alpha (see table 11.1). With the large proportions of
variance being explained within single factor-components as well as the high inter-item-correlation
recorded within each question-set, it was concluded that each of the six indices are based on
question-sets that reflect a single dimension of measurement. Therefore it remains reasonable to
conclude that the measures adopted within this study demonstrate reasonable evidence of
unidimensionality as a result of the factor analysis and reliability assessment outputs. However,
research has indicated that no single method for demonstrating unidimensionality within a question-
Stellenbosch University https://scholar.sun.ac.za

290
set is universally accepted (Hattie, 1985) and therefore this outcome remains an assumption within
the present study.
Chapter Five (and Appendix 2) presented the questionnaire items and explores the relationships
between variables across the data set. Numerous variables were found to be significantly associated
within question sets and have further been found to be related across the questionnaire through the
presented cross-tabulations. This chapter will not repeat what has been presented within the results
of chapter five. However within the presentation of the indices (to follow) where appropriate
significant empirical relationships within the data will be presented for each index and further
describe evidence within this requirement of index construction.
The index scoring and construction procedures will be discussed for each indicator within the
following sections of this chapter. All scores applied within each index were unweighted as no
reasonable theoretical prescription could be found to deviate from this accepted practice. Greater
detail of these procedures, per index, will be discussed within the appropriate sub-section.
Item difficulty and item discrimination assessments have previously been presented in Appendix 2132,
along with reliability assessments for each question set. Similarly, within Chapter Four and chapters
five through ten, areas relating to face, content and criterion validity have previously been discussed
and will not be repeated here. However, an assessment of construct validity was performed for each
of the question sets to test both convergent and discriminant validity. In brief, convergent validity
provides confirmation that measures theoretically related do in fact demonstrate such a
relationship, while conversely, discriminant validity provides confirmation that measures that are
not theoretically related do not show such a relationship (Campbell and Fiske, 1959). The method
employed in assessing both convergent and discriminant validity was adopted from Henseler, et al
(2015).
To test these sub-types of construct validity, the individual question sets as well as unrelated
question sets were tested from within the survey data. As attitudinal questions share very little
theoretical or empirical relatedness to the remaining question sets, these were used within the
testing procedures to ensure that the various indices present an acceptable level of construct
validity.
Within this procedure, each of the question sets was run within a SPSS factor analysis together with
the attitudinal items. All required statistical test outputs were examined and found to be within the
132
Where appropriate to the data, alternative reliability measures were presented elsewhere
Stellenbosch University https://scholar.sun.ac.za

291
acceptable range, and further analysis was completed133. Within the factor analysis each of the items
within their respective question-sets loaded within its own component, further confirming the
presence of two separate constructs for each question set. The pattern matrix output from the
factor analysis was used to obtain the factor loadings for each of the items used to test validity.
Within each question set, the average loading for each component was calculated and verified to be
above 0.700. Each of the six question sets revealed an average factor loading across all constituent
items within the question-set to be above the stated threshold value (0.700), suggesting a high
degree of convergent validity across all question sets. Further to this, for each of the question-sets,
the variance was extracted and an average variance across each comparison-pair134 was calculated.
The value of the calculated average variance was then compared to the square of the correlation
value, for each question-set pair, and an assessment of discriminant validity was made. Where the
value of the calculated average variance was greater than the square of the correlation value for
each comparison pair, this would establish discriminant validity (Henseler, et al; 2015). Among all
comparison-pairs each question set was found to demonstrate both convergent and discriminant
validity, further adding to the overall reliability and validity measures of the indices to be presented.
The above sections have outlined the process of indicator development as well as the statistical
quality assurance procedures required toward validating the production of new indicators. Similarly,
the processes that have been completed within this research have been relayed within section 11.2,
setting the foundations for the presentation of the final indicator series. Within the next sub-section,
details relating to the development, construction and scoring of the six indices produced within this
research will be presented. This will be followed by the presentation of the overall national result for
each indicator as well as specific comparisons of results within selected demographic sub-samples.
11.2.1 Science Knowledge Index
The Science Knowledge Index was developed from the 9-item science knowledge assessment
questions. These questions (described in chapters four and five) covered 7 scientific disciplines and
were designed to cover general aspects of scientific information. Furthermore all nine items within
the question set were developed with a social application context as the foundation that minimised
the requirement of higher technical knowledge proficiency within any of the disciplines included. As
a result all questions should be answerable by respondents with a minimum of grade 11135
133
Specifically KMO and Bartlett's Test of Sphericity were examined as well as observing the correlation values. 134
Knowledge-Attitude; Attitude-Interest; Informedness–Attitude etc. 135
In South Africa, this is a senior high school level, though not the high school exit year (grade 12)
Stellenbosch University https://scholar.sun.ac.za

292
educational attainment – which includes approximately 60% of the total sample136. The items
making up the science knowledge question set are again presented in table 11.2 below.
Knowledge Area TRUE FALSE D/K
In the majority of cases, HIV causes AIDS in humans 1 2 8
Lightning never strikes the same place twice 1 2 8
South Africa was the first nation in the world to voluntarily dismantle its nuclear weapons 1 2 8
The continents which we live on are continually moving due to forces deep within the Earth 1 2 8
The price of petrol in South Africa is NOT influenced by the price of crude oil 1 2 8
Schizophrenia is the same as Multiple Personality disorder 1 2 8
The father carries the genetic material that will determine if a baby is a boy or a girl 1 2 8
The earth's climate has NOT changed over millions of years 1 2 8
The main purpose of the Square Kilometre Array (SKA) radio telescope is to search for extra-terrestrial life 1 2 8
Table 11.2: Science knowledge assessment question set
The results for the science knowledge question-set were recoded for the development of the Science
Knowledge Index to best facilitate the most appropriate scoring option. A correct response was
coded as 1, while an incorrect (including don’t know) response was coded as 0 (zero). This enabled a
SUM knowledge score to be developed for each respondent within the sample. The SUM knowledge
score variable was computed within SPSS and ranged from 0 to 9, representing the count of correct
responses for each respondent. Within the total response, 298 respondents did not provide a single
correct response and these were considered invalid within the index construction. The remaining
3 188 (91.5%) responses constituted the valid response and table 11.3 presents the response
frequency as well as the sample proportion within each scoring category.
SUM Knowledge Score (across 9
items) Frequency Percent
Valid Percent
Invalid 0 298 8.5
Valid
1 228 6.5 7.2%
2 383 11.0 12.0%
3 568 16.3 17.8%
4 870 25.0 27.3%
5 599 17.2 18.8%
6 355 10.2 11.1%
7 149 4.3 4.7%
8 35 1.0 1.1%
9 1 0.0 0.0%
Total 3486 100.0 100.0
Table 11.3: Science knowledge assessment SUM knowledge score distribution
As there is a pronounced gap within the literature providing grounding for the creation of knowledge
response categories to facilitate scoring of response, two options were considered toward
converting the SUM knowledge score into an index classification system. The initial scoring option
considered three equal divisions, as a theoretically driven solution within the possible maximum
score of 9. This resulted in the creation of 3 response levels, within the SUM knowledge score
136
Educational attainment categories do not reflect individual grade but only categories for some high school and matric
completed
Stellenbosch University https://scholar.sun.ac.za

293
distribution. Those scoring between 1 and 3 were considered to be a low knowledge group; those
scoring between 4 and 6 were considered to be a moderate knowledge group while those scoring
between 7 and 9 were considered to be a high knowledge group. Upon review137 this resulted in an
unsustainable distribution within the index, as the high end of the index contained too small a
proportion of response (5.3%) compared to the low scoring group (33.6%). Following this initial
review, an empirically driven scoring option was considered, wherein the distribution of scores was
firstly considered and then classification cut-off points were computed within SPSS. The computed
response percentile groupings were similarly developed at 33% response intervals. This led to a final
Science Knowledge Index scoring template, based on the SUM knowledge score wherein respondents
attaining a score of between 1 and 3 remained within the low knowledge group; those scoring 4
were considered in a moderate knowledge group while those scoring between 5 and 9 were
considered in a high knowledge group.
SUM Knowledge Score
(across 9 items) Frequency
Classification Group
% Per Group
Count Per Group
Invalid 0 298 Invalid 8.5 298
Valid
1 228
LOW 33.8 1179 2 383
3 568
4 870 MODERATE 25.0 870
5 599
HIGH 32.7 1139
6 355
7 149
8 35
9 1
Table 11.4: Science Knowledge Index scoring template: SUM knowledge score distribution
A new variable was created in SPSS called Knowledge Index that recoded response based on the
empirically driven scoring solution and the results based on this are presented in the next section
137
With the research supervisor
Stellenbosch University https://scholar.sun.ac.za

294
Index Data Output and Analysis
The overall national result for the Science Knowledge Index is presented in chart 11.1 below. Results
within the Science Knowledge Index indicate that 37.0% of the sample was classified as being within
the low scientific knowledge category; 27.3% were classified as having moderate scientific
knowledge; while 35.7% were classified within the high scientific knowledge classification.
Chart 11.1: Science Knowledge Index overall national result (2015)
These results indicate that the marginally larger proportion of the total sample was found to have a
low level of scientific knowledge, compared to those classified within the high knowledge category.
While this was not entirely unexpected as a result of the level of inequality still within the many
facets of contemporary South Africa, the result is none-the-less positive. A combined 63.0% of
respondents were either classified as possessing a moderate to high level of scientific knowledge,
based on results of the 9-item knowledge assessment question, which remains an encouraging
indicator of the South African public understanding of science.
37.0
27.3
35.7
0
5
10
15
20
25
30
35
40
LOW (1) MODERATE (2) HIGH (3)
LOW (1) MODERATE (2) HIGH (3)
Stellenbosch University https://scholar.sun.ac.za
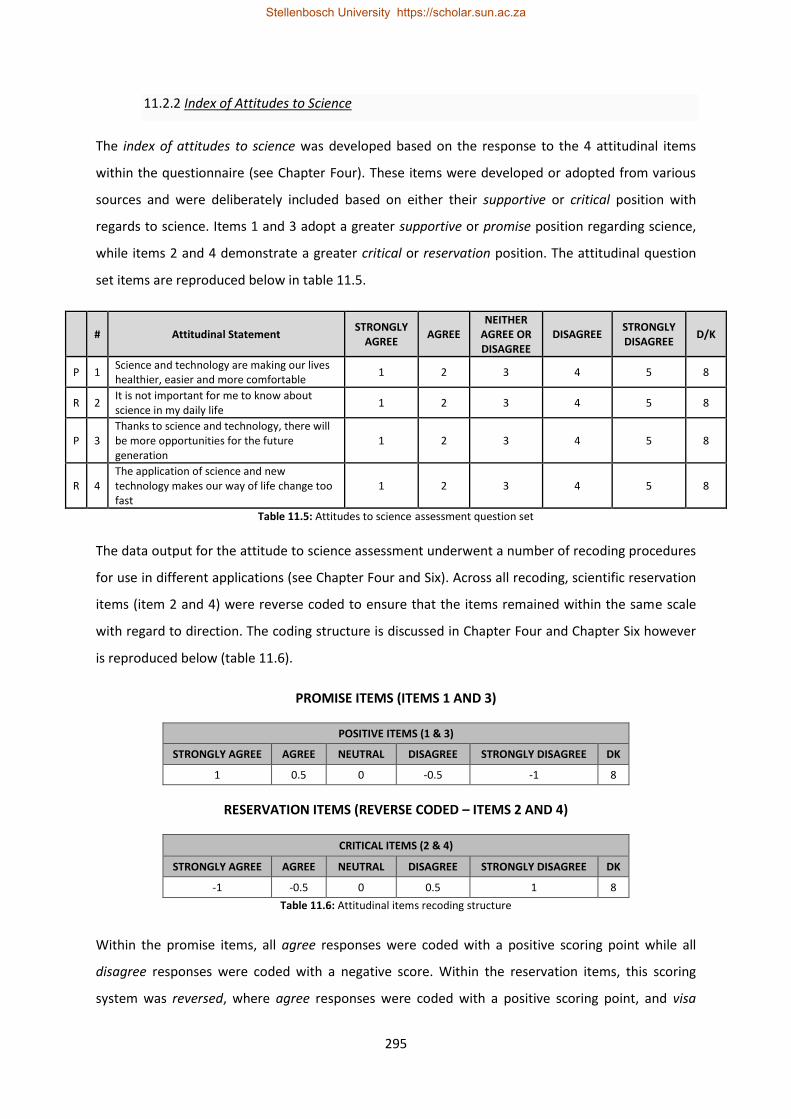
295
11.2.2 Index of Attitudes to Science
The index of attitudes to science was developed based on the response to the 4 attitudinal items
within the questionnaire (see Chapter Four). These items were developed or adopted from various
sources and were deliberately included based on either their supportive or critical position with
regards to science. Items 1 and 3 adopt a greater supportive or promise position regarding science,
while items 2 and 4 demonstrate a greater critical or reservation position. The attitudinal question
set items are reproduced below in table 11.5.
# Attitudinal Statement STRONGLY
AGREE AGREE
NEITHER AGREE OR DISAGREE
DISAGREE STRONGLY DISAGREE
D/K
P 1 Science and technology are making our lives healthier, easier and more comfortable
1 2 3 4 5 8
R 2 It is not important for me to know about science in my daily life
1 2 3 4 5 8
P 3 Thanks to science and technology, there will be more opportunities for the future generation
1 2 3 4 5 8
R 4 The application of science and new technology makes our way of life change too fast
1 2 3 4 5 8
Table 11.5: Attitudes to science assessment question set
The data output for the attitude to science assessment underwent a number of recoding procedures
for use in different applications (see Chapter Four and Six). Across all recoding, scientific reservation
items (item 2 and 4) were reverse coded to ensure that the items remained within the same scale
with regard to direction. The coding structure is discussed in Chapter Four and Chapter Six however
is reproduced below (table 11.6).
PROMISE ITEMS (ITEMS 1 AND 3)
POSITIVE ITEMS (1 & 3)
STRONGLY AGREE AGREE NEUTRAL DISAGREE STRONGLY DISAGREE DK
1 0.5 0 -0.5 -1 8
RESERVATION ITEMS (REVERSE CODED – ITEMS 2 AND 4)
CRITICAL ITEMS (2 & 4)
STRONGLY AGREE AGREE NEUTRAL DISAGREE STRONGLY DISAGREE DK
-1 -0.5 0 0.5 1 8
Table 11.6: Attitudinal items recoding structure
Within the promise items, all agree responses were coded with a positive scoring point while all
disagree responses were coded with a negative score. Within the reservation items, this scoring
system was reversed, where agree responses were coded with a positive scoring point, and visa
Stellenbosch University https://scholar.sun.ac.za

296
versa for the disagree items. This scoring system allowed for the development of a SUM attitude
score variable within the data set that produced a net-sum total for each respondent across the 4
attitudinal items in the questionnaire. The SUM attitude score was within a range from -4.0 to +4.0,
with negative scores reflecting a greater negative attitude to science, while positive scores
demonstrated a greater positive attitude. Respondents realising a net-sum score equal to zero (0)
were considered to possess a degree of attitudinal ambivalence, as their response to scientific
promise and reservation attitudinal statements did not produce a sufficient level of distinction in
their respective scores. Across the total sample (n = 3 486), 175 respondents selected the don’t
know option and were considered invalid response. This yielded a total number of valid responses of
3 311 respondents (95.0%) obtaining a valid score to be considered within the attitudes to science
index construction.
Total Attitudinal score
(across 4 items) Frequency % Valid %
-4.0 0 0.0% 0.0%
-3.5 0 0.0% 0.0%
-3.0 2 0.1% 0.1%
-2.5 9 0.3% 0.3%
-2.0 19 0.5% 0.6%
-1.5 48 1.4% 1.4%
-1.0 177 5.1% 5.3%
-.50 386 11.1% 11.7%
.00 1 209 34.7% 36.5%
.50 548 15.7% 16.6%
1.0 420 12.0% 12.7%
1.5 232 6.7% 7.0%
2.0 204 5.9% 6.2%
2.5 39 1.1% 1.2%
3.0 12 0.3% 0.4%
3.5 2 0.1% 0.1%
4.0 4 0.1% 0.1%
VALID 3 311 95.0% 100.0%
MISSING 175
3 486
Table 11.7: SUM attitude score distribution
Across the 4 items, each respondent’s SUM attitude score produced a single output that continued
to demonstrate the strength and direction of the attitudinal position. Scores ranging between -4.0
and -2.0 were indicative of stronger negative attitudes, while scores between -1.5 and 0.5
represented weaker negative attitudes. A similar scoring structure exists on the positive side of the
SUM attitude score distribution (table 11.7). Scores equal to 0 (zero) were indicative of the presence
of an ambivalent attitude. As a result of the low frequencies within the extreme ends of the SUM
Stellenbosch University https://scholar.sun.ac.za

297
attitude score distribution, the decision was taken138 to collapse the two positive and two negative
attitude categories into single positive and negative attitudinal categories. This yielded a final scoring
solution that produced three attitudinal classifications within the index of attitudes to science.
Total Attitudinal
score (across 4
items)
Frequency CLASSIFICATION
GROUP % PER
GROUP
COUNT PER
GROUP
-4.0 0
NEG
ATI
VE
19.4% 641
-3.5 0
-3.0 2
-2.5 9
-2.0 19
-1.5 48
-1.0 177
-0.5 386
.00 1 209 AMBIVALENT 36.5% 1 209
0.5 548
PO
SITI
VE
44.1% 1 461
1.0 420
1.5 232
2.0 204
2.5 39
3.0 12
3.5 2
4.0 4
VALID 3 311 INVALID 5.0% 175
INVALID 175
3 486
Table 11.8: Index of Attitudes to Science: SUM attitude score distribution
Respondents scoring below zero (0) were classified within the negative attitude to science
classification; those scoring zero (0) were classified as being attitudinally ambivalent, while those
scoring above zero were classified within the positive attitude to science level of the index.
Index Data Output and Analysis
National results within the Index of Attitudes to Science reveal a South African population generally
displaying more positive attitudes to science. Chart 11.2 indicates that 44.1% of South Africans
survey presented a generally more positive attitude to science across the 4 attitudinal statements,
while 19.4% presented a generally more negative attitudinal position. Despite this overall positive
result, at a national level, 36.5% of respondents presented a degree of attitudinal ambivalence,
where their specific attitudes were simultaneously positive and negative toward the questionnaire
items, thereby producing no clear attitudinal direction within their response. As noted in Chapter
138
After consultation with the research supervisor
Stellenbosch University https://scholar.sun.ac.za

298
Five, ambivalent attitudes are less desirable than either positive or negative positions as they are
inherently more flexible toward change, in the face of additional informational inputs.
Chart 11.2: Index of Attitudes to Science overall national result (2015)
While the recorded proportion of South Africans presenting attitudinally ambivalent positions
remains a concern as an outcome of this research, overwhelmingly South Africans present positive
attitudes toward science which is a significant finding with regards to the overall South African public
understanding of science.
19.4
36.5
44.1
0
5
10
15
20
25
30
35
40
45
50
NEGATIVE ATTITUDE (-1) AMBIVALENT ATTITUDE (0) POSITIVE ATTITUDE (+1)
Stellenbosch University https://scholar.sun.ac.za

299
11.2.3 Index of Interest in Science
Response to seven questionnaire items was employed in the development of the Index of Interest in
Science. The seven items included in the interest in science assessment have been discussed in
Chapter Six and are directly related to the science knowledge and the informedness in science
questionnaire items. The questionnaire structure is again presented in table 11.9 below.
INTEREST AREA VERY
interested MODERATELY
interested NO
interest D/K
Medical Science 1 2 3 8
Climate Change 1 2 3 8
Technology and the Internet 1 2 3 8
Politics 1 2 3 8
Economics 1 2 3 8
Astronomy 1 2 3 8
Energy 1 2 3 8
Table 11.9: Interest in science assessment question set
The response options were coded within SPSS toward the development of a total SUM interest score
for each respondent. An initial scoring option revised and reversed the questionnaire coding, such
that a higher coding value would relate to an increase in reported interest in science. As such all
don’t know response was coded as 0 (zero); no interest was coded as 1; moderately interested as 2
and very interested was coded as 3. Following input from the research supervisor, it was decided to
revise this coding structure to achieve two corrective steps. The inclusion of don’t know selections
within the SUM interest score would introduce a confounding effect and this was to be excluded as
invalid response. The second corrective measure was to revise the coding of the items, such that the
response option for no interest reflected the lowest possible score equal to zero (0); moderately
interested as 1 and very interested was coded as 2. Within the scoring of the SUM interest for each
respondent, a process was followed to remove all invalid response. Within this process, all don’t
know selections as well as response within the no interest option (coded as zero) were considered
invalid response. Together, these two categories of invalid response accounted for 846 respondents,
whom were excluded from the input data leading toward the index development. This revised
coding structure enabled scoring of the interest in science questionnaire items toward a final SUM
interest score. The SUM interest score was calculated as a minimum of 1 and a maximum of 14 for
each respondent, based on the valid response coding of moderately interested as 1 and very
interested coded as 2, across 7 questionnaire items. The total valid response was 2 640 respondents
(75.7%), that went on toward the development of the Index of Interest in Science.
Stellenbosch University https://scholar.sun.ac.za

300
SUM Interest score
(across 7 items) Frequency %
Valid %
Invalid 0 737 24.3
Val
id
1 206 5.9 7.8%
2 222 6.4 8.4%
3 212 6.1 8.0%
4 223 6.4 8.4%
5 180 5.2 6.8%
6 236 6.8 8.9%
7 343 9.8 13.0%
8 162 4.6 6.1%
9 159 4.6 6.0%
10 185 5.3 7.0%
11 147 4.2 5.6%
12 131 3.8 5.0%
13 60 1.7 2.3%
14 174 5.0 6.6%
VALID 2640 75.7% 100.0
NO INTEREST 737 21.1%
MISSING (D/K) 109 3.1%
TOTAL 3486 100.0%
Table 11.10: SUM interest score distribution
Within this distribution, respondents obtaining a SUM interest score between 1 and 4 were classified
as the low interest group; those attaining a score of between 5 and 8 as the moderate interest group
and respondents scoring between 9 and 14 as the high interest group.
SUM Interest score
(across 7 items) Frequency
CLASSIFICATION GROUP
COUNT PER
GROUP
valid % PER
GROUP
1 206
LOW
863 32.7% 2 222
3 212
4 223
5 180
MODERATE 921 34.9% 6 236
7 343
8 162
9 159
HIG
H
856 32.4%
10 185
11 147
12 131
13 60
14 174
VALID 2640 75.7%
TOTAL 3486
Table 11.11: Index of Interest in Science - SUM interest score distribution
The classifications were adopted within the final scoring solution and development of the index of
interest in science (see table 11.11).
Stellenbosch University https://scholar.sun.ac.za
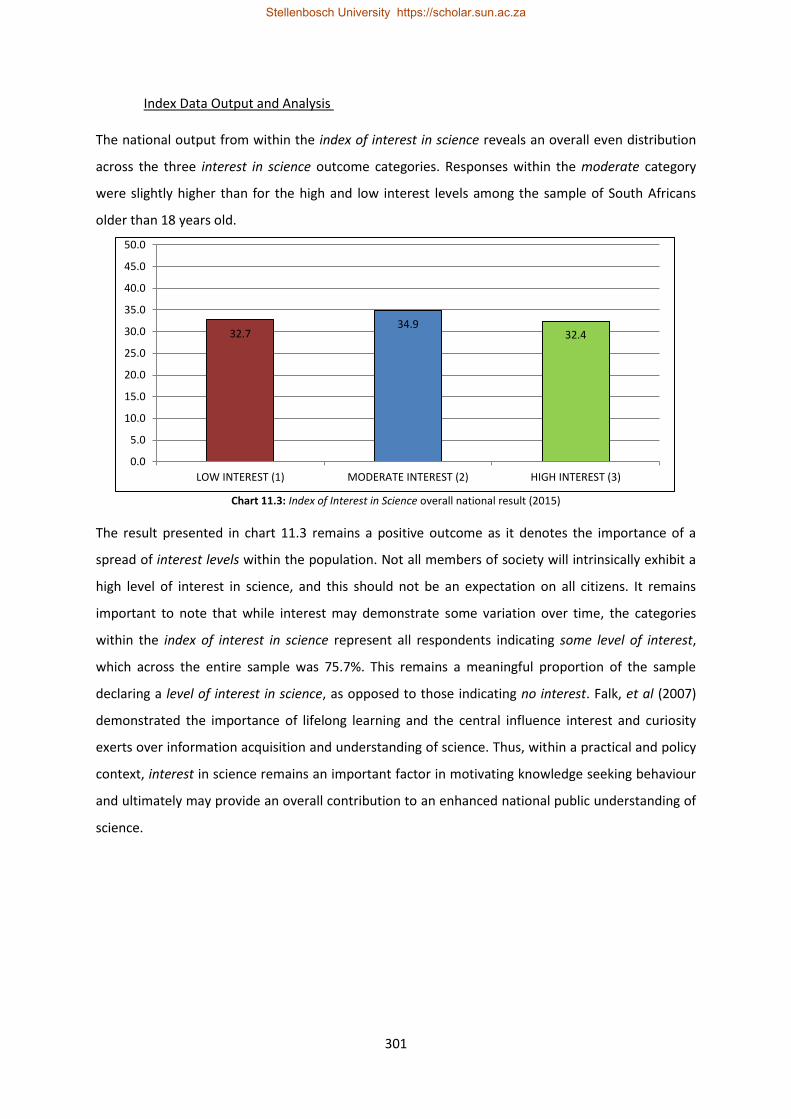
301
Index Data Output and Analysis
The national output from within the index of interest in science reveals an overall even distribution
across the three interest in science outcome categories. Responses within the moderate category
were slightly higher than for the high and low interest levels among the sample of South Africans
older than 18 years old.
Chart 11.3: Index of Interest in Science overall national result (2015)
The result presented in chart 11.3 remains a positive outcome as it denotes the importance of a
spread of interest levels within the population. Not all members of society will intrinsically exhibit a
high level of interest in science, and this should not be an expectation on all citizens. It remains
important to note that while interest may demonstrate some variation over time, the categories
within the index of interest in science represent all respondents indicating some level of interest,
which across the entire sample was 75.7%. This remains a meaningful proportion of the sample
declaring a level of interest in science, as opposed to those indicating no interest. Falk, et al (2007)
demonstrated the importance of lifelong learning and the central influence interest and curiosity
exerts over information acquisition and understanding of science. Thus, within a practical and policy
context, interest in science remains an important factor in motivating knowledge seeking behaviour
and ultimately may provide an overall contribution to an enhanced national public understanding of
science.
32.7 34.9
32.4
0.0
5.0
10.0
15.0
20.0
25.0
30.0
35.0
40.0
45.0
50.0
LOW INTEREST (1) MODERATE INTEREST (2) HIGH INTEREST (3)
Stellenbosch University https://scholar.sun.ac.za

302
11.2.4 Index of Informedness about Science
Analogous to the construction of the interest index, the 7-item informedness in science
questionnaire item was used in the construction of the Index of Informedness about Science. The
question structure is presented in 11.12 below.
INFORMEDNESS AREA VERY well informed
MODERATELY well informed
NOT well informed
D/K
Medical Science 1 2 3 8
Climate Change 1 2 3 8
Technology and the Internet 1 2 3 8
Politics 1 2 3 8
Economics 1 2 3 8
Astronomy 1 2 3 8
Energy 1 2 3 8
Table 11.13: Informedness in science assessment question set
As within the previous indices, response to the 7-item question set were recoded toward the
development of a SUM Informedness score for each respondent. Responses were coded to reflect
increasing levels of informedness within increases in score value. Accordingly, response under not
well informed was coded 1; moderately well informed was coded as 2 while very well informed was
coded as 3 within an initial coding and scoring procedure.
SCORE ACROSS 7
ITEMS
Frequency Count
Frequency %
Valid %
Invalid 0 140 4.0%
Val
id
1 26 0.7% 0.8%
2 35 1.0% 1.0%
3 16 0.5% 0.5%
4 23 0.7% 0.7%
5 21 0.6% 0.6%
6 31 0.9% 0.9%
7 946 27.1% 28.3%
8 277 7.9% 8.3%
9 252 7.2% 7.5%
10 232 6.7% 6.9%
11 193 5.5% 5.8%
12 165 4.7% 4.9%
13 177 5.1% 5.3%
14 272 7.8% 8.1%
15 127 3.6% 3.8%
16 117 3.4% 3.5%
17 124 3.6% 3.7%
18 92 2.6% 2.7%
19 76 2.2% 2.3%
20 49 1.4% 1.5%
21 95 2.7% 2.8%
Total 3486 100.0% 96.0%
Table 11.13: SUM informed score distribution
Stellenbosch University https://scholar.sun.ac.za

303
All response within the don’t know option was considered invalid and was not included within the
SUM Informedness score generation. Within the sample, 140 respondents selected the don’t know
option and the total valid response within this index development process was 3 346 (96.0%). The
SUM Informedness score was calculated by adding the sum of individual respondent selections,
based on the above discussed scoring method and obtaining a value ranging between 1 and 21139.
Within the initial scoring option, response frequencies were divided equally based on the SUM
Informedness score frequencies of respondents. This yielded three equal groups within the data. On
the advice of the research supervisor, the group structure was amended, as a result of a review of
the empirical distributions within each response category. The final structure of the index scoring
and grouping was thus attained and is presented in table 11.14.
SUM Informedness
score (across 7 items)
FREQUENCY CLASSIFICATION
GROUP
COUNT PER
GROUP
valid % PER
GROUP
1 26
LOW
1098 32.8%
2 35
3 16
4 23
5 21
6 31
7 946
8 277
MODERATE 1119 33.4%
9 252
10 232
11 193
12 165
13 177
HIG
H
1129 33.7%
14 272
15 127
16 117
17 124
18 92
19 76
20 49
21 95
VALID 3346
Total 3486
Table 11.14: Index of Informedness about Science: SUM informed score distribution
Respondents obtaining a SUM Informedness score of between 1 and 7 were classified as the low
Informedness group; those scoring between 8 and 12 were classified as the moderate Informedness
group while respondents scoring between 13 and 21 were classified as the high Informedness
classification.
139
Maximum score per each of the 7 questionnaire items = 3, across 7 items the maximum score = 21
Stellenbosch University https://scholar.sun.ac.za

304
Index Data Output and Analysis
The national result for Index of Informedness about Science reveals a similar trend to that of the
interest in science index. Response within the high informedness category was marginally higher,
however, overall there is an even spread in response within each outcome of the Index of
Informedness about Science (see chart 11.14).
Chart 11.4 Index of Informedness about Science overall national result (2015)
As noted in the earlier section, rates of informedness would lag rates of interest in science, as a
result of the relationship between these variables (to be discussed). These results were earlier
discussed in Chapter Five, wherein overall informedness was recorded at lower proportions
compared to level of interest within this sample. That being said, over all, 67.2% of respondents
within this survey report a moderate to high level of informedness regarding science. This is an
encouraging outcome, despite the similarly high level of respondents being classified as possessing a
low level of informedness with respect to science.
32.8 33.4 33.7
0
5
10
15
20
25
30
35
40
45
50
LOW INFORMEDNESS (1) MODERATE INFORMEDNESS (2) HIGH INFORMEDNESS (3)
Stellenbosch University https://scholar.sun.ac.za

305
11.2.5 Scientific Information Immersion Index
Response within the sources of science information question set is used in the development of the
Scientific Information Immersion Index. As discussed in Chapters Four and Nine, items included span
a wide array of technologies, media channels and information sources. Response categories ask
respondents to indicate the frequency of encountering science related information from each of the
11 items in the information source column (see table 11.15)
INFORMATION SOURCE Most
Frequently Frequently
Least
Frequently
Satellite Pay Television (DSTV, TopTv) 1 2 3
Free-to-Air Television (SABC / E-Tv) 1 2 3
Radio 1 2 3
Newspapers 1 2 3
News Websites 1 2 3
Institutional Websites (University / Research Lab) 1 2 3
Government Announcements 1 2 3
Blogs 1 2 3
Social media (Facebook, Twitter) 1 2 3
Other people (Family, Friends, Colleagues) 1 2 3
Books / Magazines 1 2 3
Table 11.15: Information sources about science assessment question set
From these 11 items, a measure was established that provides an assessment of respondent
immersion in scientific information channels. This was achieved through developing an assessment
of the count and frequency of encountering information via the selected information sources.
Responses to the question set were recoded to allow for the creation of a SUM InfoSource variable.
Recoding involved applying the highest code to the most frequently category (3), followed by
occasionally (2) and least frequently (1). All don’t know response was classified as invalid and not
used within the construction of the SUM InfoSource variable nor the index. Within the sample of
3 486 respondents, 257 individuals selected an invalid response, thus yielding a final valid response
equal to 92.6% (3 229). Within this revised coding and scoring system, the maximum SUM InfoSource
score achievable across the 11 items was 33 while the lowest valid score was 1. Various
mathematical operations were attempted to reduce the SUM InfoSource maximum value from 33, to
a value that would be less demanding to communicate. However, many of the solutions, while
Stellenbosch University https://scholar.sun.ac.za

306
successful, offered little additional value to the actual index and introduced cumbersome categories
for cut-off points, as a result the original scoring range was retained.
SUM INFO SOURCE SCORE ACROSS 11
ITEMS
Frequency Count
% (VALID)
VA
LID
33 28 0.9%
32 9 0.3%
31 19 0.6%
30 22 0.7%
29 23 0.7%
28 40 1.2%
27 51 1.6%
26 59 1.8%
25 70 2.2%
24 88 2.7%
23 96 3.0%
22 124 3.8%
21 100 3.1%
20 119 3.7%
19 132 4.1%
18 151 4.7%
17 153 4.7%
16 172 5.3%
15 216 6.7%
14 153 4.7%
13 203 6.3%
12 122 3.8%
11 353 10.9%
10 71 2.2%
9 70 2.2%
8 75 2.3%
7 64 2.0%
6 99 3.1%
5 72 2.2%
4 65 2.0%
3 97 3.0%
2 70 2.2%
1 43 1.3%
INVALID 0 257 7.4%
VALID 3229 100.0%
TOTAL 3486
Table 11.16: Information sources about science: SUM infosource score distribution
Following consultation with the research supervisor, and minor changes to the index construction,
akin to those in the previous sections, the final index output design and response is presented in
table 11.17. Respondents with a SUM InfoSource score of between 1 and 11 were classified as the
low information immersion group; those with a score of 12 to 17 were categorised as the moderate
information immersion group while respondents scoring between 18 and 33 were classified as the
high information immersion group. These index categories represent the count and frequency of
Stellenbosch University https://scholar.sun.ac.za

307
science information sources accessed by the respondents, with increasing counts and frequencies
attaining higher scores within the final scoring solution.
SUM INFO SOURCE
(score across 11 items)
FREQUENCY CLASSIFICATION
GROUP
COUNT PER
GROUP
valid % PER
GROUP V
ALI
D
33 28
HIG
H
1131 35.0%
32 9
31 19
30 22
29 23
28 40
27 51
26 59
25 70
24 88
23 96
22 124
21 100
20 119
19 132
18 151
17 153
MODERATE 1019 31.6%
16 172
15 216
14 153
13 203
12 122
11 353
LOW
1079 33.4%
10 71
9 70
8 75
7 64
6 99
5 72
4 65
3 97
2 70
1 43
3229
3486
Table 11.17: Scientific Information Immersion Index
Within the Scientific Information Immersion Index respondents are classified on a 3-level outcome in
response to their total SUM InfoSource score.
Stellenbosch University https://scholar.sun.ac.za

308
Index Data Output and Analysis
The Scientific Information Immersion Index demonstrates a pattern of broad distribution regarding
science information immersion behaviours within the total sample. Overall a marginally larger share
of respondents were classified as having high information immersion (35.0%), while 31.6% report a
moderate level and 33.4% display tendencies toward a low information immersion classification. This
indicates that within the high information immersion group, 35.0% of respondents accessed a
greater number of information channels and had done so at a greater frequency.
Chart 11.5: Scientific Information Immersion Index overall national result (2015)
The high information immersion group was comprised of 1 131 respondents. Among these
individuals 22.2% reported encountering science information via more than 8 different channels
most frequently. The majority of people within this group (77.8%) report encountering science
information through between 6 and 8 different channels most frequently. The moderate information
immersion group contained 1 019 respondents and 53.1% of these individuals report an average of
between 5 and 6 science information channels with a frequency ranging between occasionally and
most frequently. The remainder of this group (46.9%) was made up of individuals whom had
reported between 4 and 5 science information sources within the same frequency range as
previously mentioned. The low information immersion group classified 1 079 respondents, with
58.7% of these encountering science information from between 2 or 3 information channels least
frequently or occasionally. While the remaining 41.3% of individuals within this group encountered
science information from between 1 and 2 information sources at a very low frequency.
33.4% 31.6%
35.0%
0%
5%
10%
15%
20%
25%
30%
35%
40%
45%
50%
LOW INFORMATIONIMMERSION (1)
MODERATE INFORMATIONIMMERSION (2)
HIGH INFORMATIONIMMERSION (3)
Stellenbosch University https://scholar.sun.ac.za

309
11.2.6 Index of Science Engagement
Data from the science engagement question set was adopted in the development and construction
of the Index of Science Engagement. This question set asked respondents to indicate if they had
visited one of the science engagement locations within the preceding 12 month period (see Chapter
Four and Chapter Ten). Response was captured through a single selection of yes; no or don’t know
options (see table 11.18).
SCIENCE ENGAGEMENT ACTIVITIES YES NO
Public Library 1 2
Zoo or Aquarium 1 2
Museum (any) 1 2
Science Centre, Technology exhibition 1 2
Science Fair, Festival or similar Public Event 1 2
Table 11.18: Science engagement question set
Minimal recoding was applied to this question set toward the development of a SUM engaged
variable. All don’t know and no responses were considered invalid and not considered in the
development of the SUM engaged score. Among all respondents, 2 536 individuals reported an
invalid response and these were not included in the development of the index structure. All valid
responses received a score of 1 and allowed SPSS to compute the SUM engaged variable across all 5
items for each respondent. The SUM engaged score had a range from 1 to a maximum of 5.
SUM ENGAGEMENT SCORE ACROSS
5 ITEMS
Frequency Count
% (VALID)
INVALID 0 2536
VA
LID
1 458 13.1%
2 224 6.4%
3 126 3.6%
4 70 2.0%
5 72 2.1%
TOTAL 3486 27.3%
Table 11.19: SUM engagement score distribution
An initial index classification system was revised following review in favour of an empirically driven
classification system. The final index classification ranking was based on 33% percentile cut-offs
where respondents reporting attendance at 1 engagement activity was classified as low
engagement; those attending 2 engagement activities were classified as moderate engagement and
those attending between 3 and 5 activities within the reference period were classified within the
Stellenbosch University https://scholar.sun.ac.za

310
high engagement group. The final index classification and response frequencies are presented in
table 11.20 below.
SUM ENGAGEMENT
SCORE FREQUENCY
COUNT PER
GROUP
valid % PER
GROUP
COUNT OF ACTIVITIES ATTENDED
1 458 LOW 48.2%
2 224 MODERATE 23.6%
3 126
HIGH 28.2% 4 70
5 72
VALID 950 27.3%
TOTAL 3 486
Table 11.20: Index of Science Engagement
As a result of the low levels of reported science engagement, the decision to include 3 or more visits
to any of the listed locations as high engagement is supported by the data as it appears South
Africans in general do not regularly visit these locations. This may change with future research,
however, is acceptable within the current exploratory study framework.
Index Data Output and Analysis
A key finding within this study is that the vast majority of South Africans do not attend science
engagement activities regularly. Among the total sample of 3 486, 72.7% of respondents reported a
no or don’t know response, though invalid in terms of the index, still represents an interesting
finding from this research.
Among the 950 individuals that reported attendance at a minimum of one science engagement
activity within the reference period, the vast majority of these were classified within the low
category (48.2%).
Chart 11.6: Index of Science Engagement: overall national result (2015)
48.2
23.6
28.2
0
10
20
30
40
50
60
LOW ENGAGEMENT (1) MODERATE ENGAGEMENT (2) HIGH ENGAGEMENT (3)
Stellenbosch University https://scholar.sun.ac.za

311
Respondents reporting 2 visits to science engagement activities were classified within the moderate
engagement group (23.6%), while 28.2% indicated more frequent attendance and were thus
classified within the high science engagement grouping.
11.2.7 Assessment of Relationships between SAPUS Indicators
An analysis was undertaken to assess the strength and direction of any relationships that may exist
between the six indicators produced. The potential for relationships between the indicators is
analysed using the Pearson product–moment correlation, which provides reliable estimations as to
the degree to which a linear predictive relationship exists between the various outputs of this
research. Within the correlation outputs, if a relationship exists between the indicators, the
correlation would tend toward a value of 1.00 (or -1.00). If no relationship exists the correlation
value would equal 0.00. A positive value for the correlation is indicative of concurrent increases in
both variables – as the outcome on one indicator changes so does the outcome on the other. The
presentation of a negative correlation value would yield the inverse relationship wherein increases
in one indicator may be indicative of decreases in the other (Wilson et al, 2007).
Establishing the existence of relationships between the six indicators remains important toward
demonstrating additional reliability within the measures while also contributing to the overall
validation of the metrics produced.
Among the six indicators produced, five demonstrated weak positive correlations among each of
them, while one indicator demonstrated negligible coefficient value to only a single indicator. While
it is not expected that all indicators would demonstrate very strong relationships between them, it is
expected that positive associations would be demonstrated among these theoretically related
measures.
The science knowledge index demonstrated weak positive relationships with the Interest (0.120**);
informedness (0.122**); info-source (0.147*) and engagement (0.081*) indices. All of these
correlations, while they may be considered negligible, are none-the-less positive and have been
found to be statistically significant.
No significant association was found between the knowledge index and the attitudinal index;
however, this has long been supported within the literature and was not entirely surprising (Evans
and Durant, 1995; Aminrad, et al, 2013). The index of attitudes to science was not correlated with
any of the remaining five indices produced. A very weak association with the informedness index was
Stellenbosch University https://scholar.sun.ac.za

312
found to be statistically significant, however at the 0.045 value would in most cases be considered a
negligible correlation outcome.
Table 11.21: Correlation between 6 SAPUS indicators
With the exception of the attitude index, the index of interest in science was positively correlated
with the knowledge (0.120**); informedness (0.537**); info-source (0.352*) and engagement
(0.172*) indices. The association between scientific interest and scientific informedness, while
theoretically expected, presented the highest correlation value among all indicators. This value
indicates a moderate positive two-way relationship between these variables. Definitive causality
cannot be established within this analysis; however the existence of this strong association highlights
a significant finding. A similar relationship, albeit weaker than the aforementioned, does exist
between interest and the information source indicator, while between the interest and engagement
indices, a weak, though positive association exists.
The relationships between the informedness index and the knowledge, interest as well as attitude
indices have already been addressed. A significant association was found between the informedness
KNOWLEDGE INDEX
ATTITUDE INDEX
INTEREST INDEX
INFORMEDNESS INDEX
INFO SOURCE INDEX
ENGAGEMENT INDEX
KNOWLEDGE INDEX
Pearson Correlation
1.00 0.009 .120**
.122**
.147**
.081*
Sig. (2-tailed) 0.631 0.000 0.000 0.000 0.014
N 3188 3105 2512 3106 3021 906
ATTITUDE INDEX
Pearson Correlation
0.009 1.00 -0.030 .045* 0.000 -0.005
Sig. (2-tailed) 0.631 0.128 0.011 0.991 0.868
N 3105 3311 2584 3223 3127 936
INTEREST INDEX
Pearson Correlation
.120**
-0.030 1.00 .537**
.352**
.172**
Sig. (2-tailed) 0.000 0.128 0.000 0.000 0.000
N 2512 2584 2640 2624 2531 875
INFORMEDNESS INDEX
Pearson Correlation
.122**
.045* .537
** 1.00 .479
** .196
**
Sig. (2-tailed) 0.000 0.011 0.000 0.000 0.000
N 3106 3223 2624 3346 3141 938
INFO SOURCE INDEX
Pearson Correlation
.147**
0.000 .352**
.479**
1.00 .203**
Sig. (2-tailed) 0.000 0.991 0.000 0.000 0.000
N 3021 3127 2531 3141 3229 907
ENGAGEMENT INDEX
Pearson Correlation
.081* -0.005 .172
** .196
** .203
** 1.00
Sig. (2-tailed) 0.014 0.868 0.000 0.000 0.000
N 906 936 875 938 907 950
** Correlation is significant at the 0.01 level (2-tailed)* Significant at the 0.05 level (2-tailed).(Info-Source = information immersion index)
Stellenbosch University https://scholar.sun.ac.za

313
index and the information immersion index (0.479**) as well as the science engagement index
(0.196**). The association between the informedness index and the information immersion index,
while not unexpected demonstrates a similarly moderate positive association between these
indicators. The science engagement index, while being addressed above in its relationships to the
other indicators, was positively associated with the information immersion index (0.203**). While
many of these associations are below the level of 0.300, and may be considered weak the positive
relationship between the variables is none the less an encouraging pattern within this exploratory
research, producing an indicator series to measure the South African public understanding of
science.
11.2.8 Segmenting the South African PublicS
Segmentation refers to the practice of organising people into uniform groups, based on a set of
defined input criteria (Cirksena and Flora, 1995). Segmentation has been advanced within the
commercial research environment toward the production of audience or market segmentation
models that offer business or media channels the most accurate picture of whom their target
consumers are and how best to serve their needs. While the purpose of segmenting a consumer
base is essentially a discriminatory practice – intended to illuminate need so as to best serve those
needs – within the public sector space this often raises multiple ethical considerations. Research and
eventual segmentation related to health promotion, public services and party-political campaigns
often attract unintended controversy regarding the methodological and moral implications of
targeted informational segments, and the exclusion of other general public segments (Gruber and
Caffrey, 2005).
The practice of audience and public segmentation has tremendous value within public sector
research and may offer greater efficiency toward responding to the multitude of important social
questions in addressing research and service delivery. It is however essential to reframe the
discriminatory facet of segmentation practice when transposing these techniques into the area of
public focused research. Particularly within this public engagement space, the requirement remains
not to separate the public in order to discriminate, but rather to recognise diversity in order to
enhance inclusivity (Barnett and Mahony, 2011).
Segmentation techniques rely on multiple data inputs toward effectively discovering or developing
realistic representations of the general public within a data model. As the result of this segmentation
is often a time consuming, costly and inherently risky endeavour, leading to various categories of
segmentation outputs. The inherent risk relates to the trust investment required toward policy and
operational system adjustment based on these models that are theoretically designed to highlight
Stellenbosch University https://scholar.sun.ac.za

314
and best serve the given public segments of concern. Where the implications and consequences of
poor planning requires a vigilant approach, the significant resources invested into the development
of accurate and reliable segmentation accounts for this risk. On the other hand, within lower risk
applications, as an exploratory technique, segmentation also offers the ability to better understand
specific target audience profiles within an iterative approach of ongoing refinement. This has
particular value within emerging fields such as science communication for the South African context.
The earlier noted diversity and commonalities among South African society requires targeted
approaches of communication and science policy implementation directed at specific areas and
publicS within the broader South African population.
Segmentation employed various techniques to arrive at specific public profiles or audience
characteristics. These may include demographic variables such as race, age, education, gender or
geographic location. Similarly, classification may employ the use of behavioural information
(information seeking, media usage etc.) or an emerging area of psychographic variables. These
psychographic variables include areas of beliefs, feelings, attitudes and shifting patterns of opinion
particularly with respect to a variety of public sector topics (Barnett and Mahony, 2011).
Within the dataset discussed in this research, a general segmentation approach was adopted to
describe140 potential groupings within the sample regarding their general public understanding and
engagement with science. Data for the variables interest, informedness, knowledge, information
immersion, attitude to science and science engagement were considered within the development of
the segmentation process. As a result of the degree of interrelatedness as well as the behavioural
and practical implications attached, respondents were initially segmented into classifications using
their response to the interest, informedness and knowledge indices. These were selected by
adopting a generalised linear decision making process: greater reported interest leading to
information seeking behaviour (toward building informedness) and demonstrating this through
outcomes on knowledge assessments. Respondents were then segmented based on their
performance on these interest, informedness and knowledge assessment outcomes into four
segments to be discussed below. Characteristics for attitude and engagement were later included.
140
Rather than discover particular audiences– targeted segmentation requires clearly defined strategic purposes related to specific outcomes, within this sense, the purpose here is to demonstrate what is possible through a general segmentation, rather than produce a definitive specific segmentation model
Stellenbosch University https://scholar.sun.ac.za

315
SEGMENT NAME % SEGMENT CHARACTERISTICS
NON-ENGAGERS 31.3% LOW INTEREST, INFORMEDNESS, KNOWLEDGE, NEGATIVE ATTITUDE
CASUALLY INTERESTED 21.0% LOW-MODERATE INTEREST, INFORMEDNESS, KNOWLEDGE, NEGATIVE – AMBIVALENT ATTITUDE
CAUTIOUS OPTIMISTS 19.4% MODERATE-HIGH INTEREST, INFORMEDNESS, KNOWLEDGE, POSITIVE-AMBIVALENT ATTITUDE
ACTIVE ENGAGERS 28.3% HIGH INTEREST, INFORMEDNESS, KNOWLEDGE, POSITIVE ATTITUDE
Table 11.22: Proposed South African Public Understanding of Science segmentation groups
Table 11.22 presents the proposed public segmentation from within the data in this research. It is
important to note that while the clusters represent respondents who share similar interest,
informedness, knowledge and attitudes regarding science, not all respondents included in each
group are identical. This remains common practice within exploratory segmentation outputs and a
consequence the produced segments are illustrative typologies, rather than exact representation of
every member within that segment (BIS, 2011).
The Non-Engagers are the largest cluster making up 31.3% of respondents within this survey. These
respondents generally demonstrate lower levels of scientific interest, informedness and scientific
knowledge, compared to other groups. They similarly display attitudes that are more critical of
science and are least likely to believe in the contribution of science to society. Less than 2% of
respondents within this category have attended a science engagement activity within the preceding
12 month period. Non-Engagers tend to be non-white, mostly from within the black, coloured or
Indian / Asian sub-samples and predominantly female. These individuals also tend to predominantly
reside within rural areas, are older than 50 years old and have a pre-matric educational attainment
level. These respondents are often unemployed and therefore have a low household income level.
The Casually Interested represents about 1 in 5 respondents within this sample (21.0%). They usually
present a low to moderate level of interest, informedness and scientific knowledge. They tend to be
interested in science; however, do not often report being highly informed or demonstrate higher
levels of scientific knowledge. The casually interested present attitudes that are negative to
ambivalent and while they do appreciate scientific advances, they remain sceptical about the value
Stellenbosch University https://scholar.sun.ac.za

316
science may add to their contemporary and future experiences. This segment contained the largest
proportion of respondents within the coloured sub-sample with an even distribution of males and
females. They tend to be aged between 20 and 49 years old and generally have not had exposure to
post-matric education. The majority report being unemployed or other (not working) leading to low
or moderate household income within this segment.
Cautious Optimists account for 19.4% of response within the survey. These individuals present
moderate to high interest, informedness and levels of scientific knowledge, compare to previous
segments. While their attitudes tend to be more positive about science, they do possess a degree of
ambivalence regarding the value of science to society. Respondents within this segment tend to
strongly support the promise of scientific advancement while maintaining a cautious awareness of
the ways in which technology influences their lives. The majority of these respondents tend to be
females located within the urban centres and are largely from within the coloured and white
population groups. Cautious optimists are generally younger than 39 years old and possess a
completed matric or higher educational qualification. These individuals are mostly employed,
retired, involved in domestic or academic activities and report a moderate to high household
income. An average of 11.4% of respondents within this segment has attended a science
engagement activity within the reference period, not differentiated from the national average.
The segment with the highest overall reported level of interest, informedness and scientific
knowledge are the Active Engagers (28.3%). These respondents generally have very positive
attitudes to science, strongly supporting the promise of science and its value to future South
Africans. The greater part of this segment tends to be white, urban males below the age of 30 years.
These respondents generally have a post-matric educational attainment level, are employed and
report a high level of household income. On average, 29% of active engagers report attending at
least one science engagement location within the preceding 12 month period. Members of this
group report that approximately 40% have visited a public library while more than 20% have visited
a zoo, aquarium or museum within the reference period.
The above empirically derived segmentation proposal presents what is possible and what has till this
point not been attempted within the South African scholarly contributions to the public
understanding of science. It must be noted that this remains a proposal and greater confirmatory
effort must be invested toward specific strategically relevant segmentation frameworks. However,
as a general segmentation model of the overall South African public, the above presents a useful
point of departure. Adopting a targeted communication and engagement facilitation approach
would introduce greater efficiencies and enable the diversion of critical resources to the areas of
Stellenbosch University https://scholar.sun.ac.za

317
greatest investment need. Science communication, science policy and the academic polemic within
scientific literacy and the public understanding of science, as interdisciplinary areas must
meaningfully adapt solutions that would best serve to deliver the essential information and research
that will drive effective evidence based decisions influencing the public relationship with science.
Reversing the discussion from public understanding of science, to understanding who the public are,
may represent the most useful undertaking along that journey.
11.3 PREDICTORS OF OUTCOMES ON SAPUS INDICES
As discussed in the introductory chapters to this thesis (Chapter One and Chapter Two), South Africa
is a country of diverse and multicultural backgrounds all seated within a legacy of separate
development as a result of the apartheid past. As a direct result of this, sociodemographic variables
exert a dramatic influence on individuals’ access to services, resources and various other variables
that have been demonstrated to influence respondent outcomes on the six elements of the South
African public understanding of science. In order to provide a holistic evaluation of the South African
general public understanding of science it remains important to determine which sociodemographic
variables may best serve as predictors of outcomes within each indicator. This would provide an
appraisal of the most influential factors determining respondent performance on each indicator
toward highlighting the impact of these predictors in relation to the various indices produced. This
research question will be addressed within this sub-section toward highlighting the influence of the
most salient sociodemographic predictors influencing the general South African public
understanding of science.
Regression analytics was identified as the most suitable tool to adopt in responding to this research
question. This analytical tool is useful in identifying relationships among a set of independent
(predictor) variables and an outcome variable and is widely used in prediction and forecasting
analysis (Long and Freese, 2001). A generalised regression equation would infer the following:
𝑌 = 𝑎 + 𝑏𝑋
Where Y = Outcome variable (dependant variable) a = Intercept (value of Y where X = 0) b = slope (change in Y per unit change in X) X = unknown parameter
Each of the six indicators produced has been considered as a dependant variable within this analysis,
while each of the sociodemographic predictors have been considered as independent variables. As a
result of each of the index outcome variables being polytomous – i.e. having more than one outcome
Stellenbosch University https://scholar.sun.ac.za

318
possibility141, an extension to the standard regression model is required that would be best equipped
to produce the analysis. As such multinomial logistic regression was identified as the most suitable
analytic tool to perform this analysis as it has become the benchmark tool to identify and describe
relationship between response and explanatory variables, within these conditions (Agresti, 2007).
Multinomial Logistic Regression has become the standard analysis (among other more specialised
techniques), for efficiently identifying and interpreting outputs of relationships between variables in
a wide-array of fields including engineering, social research, risk analysis, medicine and numerous
other research areas (Bayaga, 2010). The basic deviation from standard regression analysis involves
the multiple levels of outcomes within the response variable (dependant variable). As such
multinomial logistic regression models the probability of responses appearing within the outcome
levels of Y (response variable) as a result of the influence of a set of explanatory variables. This is
achieved through the production of a series of probability estimates based on the influence of the
predictor variables and is represented as a function of the probability of appearing within one level
of the outcome variable, compared to the reference category. According to Agresti (2007) the
selection of the reference category is arbitrary. A generalised representation of the multinomial
logistic regression is presented in image 11.1 below.
Image 11.1: Generalised multinomial logistic regression equation (Agresti, 2007)
The outputs of the multinomial logistic regression provides insight into the probability, or odds of an
outcome occurring, given a particular set of predictor attributes as a measure of association
between the outcome and predictor variables within the model (Long and Freese, 2001).
Each of the six indices within this study has undergone a similar analytic procedure, which will be
described to avoid duplication. This will be followed by the presentation of the outputs from this
analysis. The procedures and analysis within this section was largely influenced by the early work of
Laugksch (1996) and is guided methodologically by the work of Long & Freese (2001) and Agresti
(2007). Statistical output and interpretation within this section was assessed by senior statisticians at
the HSRC to ensure their accuracy and reliability of the results obtained142.
141
As an example – the Knowledge Index has 3 outcome levels – High, Moderate and Low 142
Specific appreciation is extended to Dr Moses Sithole for his invaluable input into this section
Stellenbosch University https://scholar.sun.ac.za

319
As described in the earlier chapters this survey collected information from 3 486 valid respondents
using a 6-question, 43 item research instrument. Selected items within this instrument were
adopted, following rigorous statistical quality assurance procedures toward the development of six
indices, measuring the defined elements of the South African public understanding of science. The
indices developed have been used as the dependant variables within this analysis and are again
presented in table 11.23 below.
INDICATOR (Outcome variable)
Valid N Cronbach's
Alpha Mean
Standard Deviation
Coding
Science knowledge index 3188 0.911 1.99 0.85 1= Low; 2 = Moderate; 3 = High
Attitudes to science index 3311 0.939 0.25 0.76 -1= Negative; 0 = Ambivalent; 3 = Positive
Interest in science index 2640 0.936 2.00 0.81 1= Low; 2 = Moderate; 3 = High
Informedness in science index 3346 0.949 2.01 0.82 1= Low; 2 = Moderate; 3 = High
Information immersion index 3229 0.946 2.02 0.83 1= Low; 2 = Moderate; 3 = High
Science Engagement index 950 0.943 1.80 0.85 1= Low; 2 = Moderate; 3 = High
Table 11.23: Six indices developed to be used as dependant (outcome) variables
The development, validation and result within each index have been discussed within this chapter
and will not be repeated here. Table 11.23 however presents the overall quality and reliability
statistics for each indicator as well as the coding system adopted within the final index construction.
An initial purposive selection of 12 sociodemographic variables was considered as predictors of
outcomes for each indicator. Coding, variable characteristics and descriptive statistics are provided
in table 11.24 below.
Sociodemographic Predictors
Valid N Mean Standard Deviation
Coding
DEMOG_RELIGION 3486 4.70 4.27 1-14 Categories for all major religions; Other; None and D/K (see appendix table)
DEMOG_MARITAL_STATUS 3486 1.77 0.99 1 = single; 2 = married; 3 = cohabitation; 4 = widowed; 5 = Divorced; 6 = separated
DEMOG_PERSONAL_INCOME 3486 24.82 10.08 same as Household Income
DEMOG_POP_GROUP 3486 2.17 0.79 1 = White; 2 = Black; 3 = Indian / Asian; 4 = Coloured
DEMOG_PROVINCE 3486 5.24 2.50 1 - 9: All provincial areas (see appendix table)
DEMOG_RURAL_URBAN 3486 1.34 0.47 1 = Urban; 2 = Rural
DEMOG_GENDER 3486 1.50 0.50 1 = Male; 2 = Female
DEMOG_AGE 3472 3.21 1.34 6 age categories from <20 years to 60 years + (see appendix table)
DEMOG_LANGUAGE 3486 6.40 3.87 12 language categories, including Other category (see appendix table)
DEMOG_EDUCATION 3486 1.76 0.70 1 = Pre-matric; 2 = Matric completed; 3 = Post-matric
DEMOG_EMPLOYMENT 3486 1.74 0.75 1 = Employed; 2 = Unemployed; 3 = Other (not working)
DEMOG_HH_INCOME 2271 1.35 0.60 1 = Low income; 2 = Moderate income = 3 = High income (see appendix table)
Table 11.24: Sociodemographic variables considered for modelling of predictors
With due consideration for issues related to model stability as a result of the number of predictors
included in the analysis, a data reduction strategy was employed to ascertain the variables offering
the maximum predictability and reliability within the outcome estimations. The recommendations of
Stellenbosch University https://scholar.sun.ac.za

320
Agresti (2007) and Long & Freese (2001) were adopted toward reducing the number of potential
predictors from 12 to 8. To avoid complications as a result of multicollinearity and singularity within
the regression analysis, relating to the contribution of each variable as well as the degree of
correlation between those included, variables were excluded from the available set for use within
the regression analysis. Univariate and bivariate analysis (see chapters five through ten) indicated
that the variables for religion; marital status; personal income and province would not offer
additional explanatory value and were no longer considered within the multinomial regression
analysis.
Following further initial regression analysis it was found that the language group variable was
similarly confounding the output as a result of its association with race and other variables and was
subsequently removed from further analyses. The final list of potential sociodemographic predictor
variables then included 7 items race; rural-urban location; gender; age group; education;
employment status and household income.
The multinomial logistic regression was performed using IBM-SPSS (version 24) adopting the
following procedure. Within the regression options in SPSS, the option for multinomial logistic
regression was selected. The outcome variable (SAPUS index) was included as the dependant
variable field, while all 7 sociodemographic potential predictor variables were input into the factors
field. Within the dependant variable the reference category selected was the first code (low in most
indices) while the reference category for the independent variables (predictors) was automatically
set to be last by SPSS. This is not changeable and where required coding adjustment would be
reported to account for any impact this may have. The model selected for the processing of the
regression was a custom stepwise model to assess main effects within each potential predictor
variable. A backward-elimination-stepwise method was employed as this allowed for the initial
inclusion of all variables, and through a testing procedure deleting any variable that does not
statistically improve the model’s predictive accuracy. This procedure ensures that the final model
included only the predictor variables with the highest predictive value within the model. The same
procedure was applied for the analysis of each of the six indices and where any variations were
introduced these will be highlighted in the appropriate sub-sections to follow. The results of the
multinomial logistic regression are consistent with the chi-square analysis presented earlier in this
chapter (indicators results).
Stellenbosch University https://scholar.sun.ac.za

321
Predictors of outcomes on the Science Knowledge Index (SKi)
The multinomial logistic regression model of predictors of outcomes on the Science Knowledge Index
is based on a valid response of 2 041 respondents as a result of case-wise deletion due to selected
cells containing zero frequencies143 (L: 101.678; d.f. = 14; p < 0.001). Among the seven potential
variables included within the analysis, six were retained following the output of the step-wise
multinomial logistic regression procedure. The four variables that were eliminated include: age;
employment status; rural / urban location and gender. These variables were excluded based on the
value of the chi-square achieved within the likelihood ratio test, all of which were found not be
statistically significant. The result for the model fitting information, goodness-of-fit and likelihood
ratio test are presented in table 11.25. The model fitting information demonstrates a significant chi-
square and p-value, indicating that the retained variables significantly improve the overall model,
compared to the intercept-only model.
Model Fitting Information
Model
Model Fitting Criteria
Likelihood Ratio Tests
-2 Log Likelihood
Chi-Square
df Sig.
Intercept Only 1931.190
Final 1829.512 101.678 14 0.000
Goodness-of-Fit
Chi-Square df Sig.
Pearson 1000.608 1044 0.829
Likelihood Ratio Tests
Effect
Model Fitting Criteria
Likelihood Ratio Tests
-2 Log Likelihood of
Reduced Model
Chi-Square
df Sig.
Intercept 1829.512 0.000 0
DEMOG_RACE 1842.536 13.024 6 0.043
DEMOG_EDUCATION 1849.143 19.631 4 0.001
DEMOG_HH_INCOME 1860.721 31.209 4 0.000
Table 11.25: Model fitting information, goodness-of-fit and likelihood ratio test
An assessment of the goodness-of-fit information reveals how well the model fits the observed data
within the study. The p-value indicates a value greater than 0.05, demonstrating that the model fits
the data well due to the predicted values not being significantly different from the observed values
143
Due to the manner of calculation, the NOMREG (multinomial logistic regression) procedure in SPSS calculated cells
based on the 3 category outcome variable and populates this as a contingency table for each category within the predictor variables. Sub-populations may as a result have a zero frequency (0), where SPSS deletes the entire case from within the analysis. Important to note this is not missing data, but due to the NOMREG calculation process.
Stellenbosch University https://scholar.sun.ac.za

322
in the data set. The variables retained within the model are presented within the likelihood ratio test
and include: race; educational attainment and household income as a result of their statistically
significant p-value (see table 11.25).
In table 11.26, for each of the variables statistically significant within the model the following
information is presented: A) the slope coefficient; B) the standard error C) the odds ratio and D) the
95% confidence interval for the odds ratio. Within the initial table all three variables produced a
unique contribution to the overall model. The influence of race demonstrates the strongest
predictive value within the model (B = -1.214; Wald= 9.18; p < 0.01). This is demonstrated where
respondents within the Indian / Asian group are only 29.7% as likely as coloured respondents
(reference category) to appear within the moderate scientific knowledge group, compared to the low
scientific knowledge group. With the adjustment of the race variable reference category to the white
sub-sample, members of the Indian / Asian sub-sample are 42.0% as likely to appear in the moderate
group (compared to the low group) when compared to white respondents (not in table). This result
is in further agreement with earlier presented scientific knowledge index findings, where white and
Indian / Asian respondents were significantly more frequently represented within the high scientific
knowledge group compared to other race classifications.
95% CI
Mo
de
rate
co
mp
are
d t
o L
ow
kn
ow
led
ge
Predictor B SE (B) Odds Ratio
Lower bound
Upper Bound
DEMOG_RACE - White (1) -0.348 0.284 0.706 0.405 1.231
DEMOG_RACE - Black (2) -0.347 0.206 0.706 0.472 1.058
DEMOG_RACE - Indian / Asian (3) -1.214 0.401 0.297 0.135 0.651
DEMOG_RACE - Coloured (4) Reference Reference Reference Reference Reference
DEMOG_EDUCATION - Low (1) -0.542 0.205 0.582 0.389 0.870
DEMOG_EDUCATION - Moderate (2) 0.014 0.185 1.014 0.706 1.456
DEMOG_EDUCATION - High (3) Reference Reference Reference Reference Reference
DEMOG_HH_INCOME - Low (1) -0.854 0.304 0.426 0.235 0.772
DEMOG_HH_INCOME - Moderate (2) -0.409 0.294 0.664 0.373 1.183
DEMOG_HH_INCOME - High (3) Reference Reference Reference Reference Reference
95% CI
Hig
h c
om
par
ed
to
Lo
w k
no
wle
dge
Predictor B SE (B) Odds Ratio
Lower bound
Upper Bound
DEMOG_RACE - White (1) 0.085 0.261 1.089 0.653 1.815
DEMOG_RACE - Black (2) -0.206 0.195 0.814 0.555 1.193
DEMOG_RACE - Indian / Asian (3) -0.404 0.320 0.668 0.357 1.250
DEMOG_RACE - Coloured (4) Reference Reference Reference Reference Reference
DEMOG_EDUCATION - Low (1) -0.124 0.188 0.883 0.611 1.276
DEMOG_EDUCATION - Moderate (2) -0.016 0.172 0.985 0.702 1.380
DEMOG_EDUCATION - High (3) Reference Reference Reference Reference Reference
DEMOG_HH_INCOME - Low (1) -1.166 0.276 0.312 0.181 0.535
DEMOG_HH_INCOME - Moderate (2) -0.481 0.265 0.618 0.368 1.039
DEMOG_HH_INCOME - High (3) Reference Reference Reference Reference Reference
Table 11.26: Scientific Knowledge Index Parameter estimates (Reference category: Low knowledge)
Stellenbosch University https://scholar.sun.ac.za

323
The educational attainment variable indicates that respondents in the low education group were
only 58.2% as likely as respondents in the high education category to appear in the moderate
scientific knowledge classification compared to the low knowledge classification (B = -0.542; Wald=
6.958; p < 0.01). Where the reference group for education is shifted from the high group to the low
education group, both those with moderate and high educational attainment levels are 1.7 times
more likely to appear in the moderate scientific knowledge group than the low scientific knowledge
classification group, compared to respondents with low educational attainment. This reinforces the
tremendous role education plays within science knowledge and ranking within the scientific
knowledge index.
Household income was significantly associated both within the moderate and the high knowledge
parameter estimate tables. The influence of household income is observed, wherein respondents
with low reported household income are only 42.6% as likely as those within the high income group
to appear in the moderate scientific knowledge group, compared to the low scientific knowledge
group (B = -0.854; Wald= 7.902; p < 0.01). Similarly, respondents within the low income group were
only 31.2% as likely as high income earners to appear in the high scientific knowledge group,
compared to the low scientific knowledge group (B = -1.116; Wald= 17.853; p < 0.001). Further
reinforcing the influence of household income, respondents within the moderate income category
were found to only be 61.8% as likely as high income earners to appear in the high knowledge
classification compared to the low knowledge group. As reported within the index results, the
influence of household income has a significant determining influence on performance, where more
often, respondents from higher income households, present a higher outcome ranking on the
science knowledge index.
These results confirm the outcomes presented in the initial part of this chapter and highlight race,
education and household income as the key demographic variables influencing outcome on the
scientific knowledge index. Considering the interrelations between race, education and income
within the South African context this result is not entirely unexpected and highlights the
sociodemographic areas of potential intervention toward increasing scientific knowledge among the
population. Accordingly, the multinomial logistic regression model representing the log odds of
respondents appearing in the moderate scientific knowledge group compared to the low scientific
knowledge group is given by the equation:
Stellenbosch University https://scholar.sun.ac.za

324
𝑳𝑶𝑮 (𝑴𝑶𝑫
𝒍𝒐𝒘) = 𝟎. 𝟖𝟔𝟐 + (−𝟎. 𝟑𝟒𝟖 × 𝑷𝒐𝒑𝑾) + (−𝟎. 𝟑𝟒𝟕 × 𝑷𝒐𝒑𝑩) + (−𝟏. 𝟐𝟏𝟒 × 𝑷𝒐𝒑𝑰)
+ (−𝟎. 𝟓𝟒𝟐 × 𝑬𝒅𝒖𝑳𝒐𝒘) + (𝟎. 𝟎𝟏𝟒 × 𝑬𝒅𝒖𝑴𝒐𝒅) + (−𝟎. 𝟖𝟓𝟒 × 𝑯𝑯𝑰𝑳𝒐𝒘) + (−𝟎. 𝟒𝟎𝟗 × 𝑯𝑯𝑰𝑴𝒐𝒅)
While the log odds of respondents appearing in the high scientific knowledge group compared to the
low scientific knowledge group is represented by the equation:
𝑳𝑶𝑮 (𝑯𝑰𝑮𝑯
𝒍𝒐𝒘) = 𝟏. 𝟏𝟏𝟑 + (𝟎. 𝟎𝟖𝟓 × 𝑷𝒐𝒑𝑾) + (−𝟎. 𝟐𝟎𝟔 × 𝑷𝒐𝒑𝑩) + (−𝟎. 𝟒𝟎𝟒 × 𝑷𝒐𝒑𝑰)
+ (−𝟎. 𝟏𝟐𝟒 × 𝑬𝒅𝒖𝑳𝒐𝒘) + (−𝟎. 𝟎𝟏𝟔 × 𝑬𝒅𝒖𝑴𝒐𝒅) + (−𝟏. 𝟏𝟔𝟔 × 𝑯𝑯𝑰𝑳𝒐𝒘)
+ (−𝟎. 𝟒𝟖𝟏 × 𝑯𝑯𝑰𝑴𝒐𝒅)
Where: the applicable indication of each of the below variable definitions can be substituted
PopW – Race: White PopB - Race: Black PopI - Race: Indian
EduLow – Low Education EduMod- Moderate Education HHILow – Low Income HHIMod- Moderate Income
Stellenbosch University https://scholar.sun.ac.za

325
Predictors of outcomes on the Attitudes to Science Index (ASi)
The analysis of outcomes on the Attitudes to Science Index within they multinomial logistic
regression procedures included valid response from 2 140 respondents as a result of case-wise
deletion described earlier. Among the seven predictor variables included within the analysis, 6 were
removed as a result of their chi-square result. The variables excluded from the final model include:
educational attainment level; employment status; rural-urban location; household income; age and
gender. One variable therefore constituted the final model of predictors on the attitudes to science
index (L: 18.927; d.f. = 6; p < 0.01). Test statistics are presented in table 11.27 discussing the results
of the model fitting information, goodness-of-fit and likelihood ratio test.
Model Fitting Information
Model Model Fitting Criteria Likelihood Ratio Tests
-2 Log Likelihood Chi-Square df Sig.
Intercept Only 1925.212
Final 1906.285 18.927 6 0.004
Goodness-of-Fit
Chi-Square df Sig.
Pearson 1093.869 1068 0.284
Likelihood Ratio Tests
Effect
Model Fitting Criteria Likelihood Ratio Tests
-2 Log Likelihood of Reduced Model
Chi-Square df Sig.
Intercept 1906.285 0.000 0
DEMOG_RACE 1925.212 18.927 6 0.004
Table 11.27: Model fitting information, goodness-of-fit and likelihood ratio test
Despite the fact that only a single variable was retained explaining the data within this model, the
chi-square and p-value indicate a significant association and therefore represents an improvement
over the intercept-only model. The Pearson’s chi-square within the goodness-of-fit table
demonstrates that the predicted values fits the observed data points very well as a result of the p-
value being greater than 0.05. The outcome of the likelihood ratio test indicates that race of
respondent is significantly associated with outcomes on the attitudes to science index, more so than
the 6 variables removed during the step-wise elimination process.
Table 11.28 presents the significant categories within the race variable constituting this model.
Stellenbosch University https://scholar.sun.ac.za

326
95% CI A
mb
ival
en
t co
mp
are
d
to N
ega
tive
att
itu
de
Predictor B SE (B)
Odds Ratio
Lower bound
Upper Bound
DEMOG_RACE - White (1) -0.328 0.292 0.720 0.406 1.278
DEMOG_RACE - Black (2) 0.079 0.236 1.082 0.682 1.717
DEMOG_RACE - Indian / Asian (3) -0.061 0.394 0.941 0.435 2.036
DEMOG_RACE - Coloured (4) Reference Reference Reference Reference Reference
95% CI
Po
siti
ve c
om
par
ed
to
Ne
gati
ve a
ttit
ud
e Predictor B SE (B)
Odds Ratio
Lower bound
Upper Bound
DEMOG_RACE - White (1) -0.487 0.260 0.614 0.369 1.023
DEMOG_RACE - Black (2) -0.491 0.212 0.612 0.404 0.927
DEMOG_RACE - Indian / Asian (3) -0.335 0.359 0.716 0.354 1.445
DEMOG_RACE - Coloured (4) Reference Reference Reference Reference Reference
Table 11.28: Attitudes to science index: Parameter estimates (Reference category: Negative attitude)
As seen within the chi-square analysis in the earlier chapters, there is a strong relationship between
race and attitudes to science. In table 11.28 the black race group is shown to demonstrate a
significant association to outcomes on the attitudes to science index. Within this result, black
respondents are only 61.2% as likely as coloured respondents to display a positive attitude to
science, over a negative attitude to science (B = -0.491; Wald= 5.382; p < 0.05). As a result of the
high proportion of positive attitudinal response received from within the coloured sub-sample, white
respondents were similarly found to only be 61.4% as likely as the former to demonstrate positive
attitudes compared to negative attitudes (B = -0.487; Wald= 3.501; p < 0.01). When reference
categories are switched from the coloured sub-sample to the white sub-sample, a similar picture
emerges. Black respondents are 66.6% as likely as white respondents to display a negative attitude
compared to an ambivalent attitude to science (B = -0.407; Wald= 4.211; p < 0.05), while the same
sub-sample remain 66.3% as likely as white respondents to demonstrate a positive attitude over an
ambivalent attitude to science (B = -0.410; Wald= 5.994; p < 0.05 - not shown in table).
These results are reflective of the significant association between race and attitudes to science.
Black South Africans demonstrate significant propensity toward ambivalent attitudes to science.
There is no doubt that the significance of race must include the effect of interactions with related
socioeconomic variables that are influencing the recorded attitudinal responses within this research.
It may transpire within future research that the influence of increased educational outcomes on
attitudes to science may develop a more critical attitudinal response.
Stellenbosch University https://scholar.sun.ac.za

327
The model developed from these results for a function of the log odds of respondents appearing in
the ambivalent attitudes group compared to the negative attitudinal group is represented by the
following equation:
𝑳𝑶𝑮 (𝑨𝑴𝑩𝑰𝑽
𝒏𝒆𝒈) = 𝟎. 𝟒𝟔𝟔 + (−𝟎. 𝟑𝟐𝟖 × 𝑷𝒐𝒑𝑾) + (𝟎. 𝟎𝟕𝟗 × 𝑷𝒐𝒑𝑩) + (−𝟎. 𝟎𝟔𝟏 × 𝑷𝒐𝒑𝑰)
Conversely, the log odds of respondents appearing in the positive attitudinal group, compared to
those appearing in the negative attitude group are defined in the following equation:
𝑳𝑶𝑮 (𝑷𝑶𝑺
𝒏𝒆𝒈) = 𝟏. 𝟐𝟐𝟔 + (−𝟎. 𝟒𝟖𝟕 × 𝑷𝒐𝒑𝑾) + (−𝟎. 𝟒𝟗𝟏 × 𝑷𝒐𝒑𝑩) + (−𝟎. 𝟑𝟑𝟓 × 𝑷𝒐𝒑𝑰)
Where: the applicable indication of each of the below variable definitions can be substituted
PopW – Race: White PopB - Race: Black PopI - Race: Indian
Predictors of outcomes on the Interest in Science Index (ISi)
The analysis of predictors of outcomes on the Interest in Science Index was based on a total valid
sample of 1 748 respondents. Adopting the earlier discussed multinomial logistic regression
procedure in SPSS with step-wise (backward) elimination, 4 variables of the 7 initially included were
removed as a result of the outcome of the likelihood ratio test. The final model included three (3)
variables that were found to be significantly associated with the outcome variable (L: 92.107; d.f. =
12; p < 0.001). The variables excluded from this final model include: gender; employment status;
household income and age. The result for the model fitting information, goodness-of-fit and
likelihood ratio test all reveal good overall model statistics and will be discussed in conjunction with
table 11.29.
Model Fitting Information
Model Model Fitting Criteria Likelihood Ratio Tests
-2 Log Likelihood Chi-Square df Sig.
Intercept Only 1768.065
Final 1675.958 92.107 12 0.000
Goodness-of-Fit
Chi-Square df Sig.
Pearson 965.698 932 0.216
Stellenbosch University https://scholar.sun.ac.za

328
Likelihood Ratio Tests
Effect
Model Fitting Criteria Likelihood Ratio Tests
-2 Log Likelihood of Reduced Model
Chi-Square df Sig.
Intercept 1675.958 0.000 0
DEMOG_RURAL_URBAN 1687.602 11.643 2 0.003
DEMOG_EDUCATION 1710.237 34.279 4 0.000
DEMOG_RACE 1702.917 26.959 6 0.000
Table 11.29: Model fitting information, goodness-of-fit and likelihood ratio test
A significant chi-square and p-value are observed within the model fitting information table,
indicating that the retained variables significantly improve the overall model, compared to the
intercept-only model. The Pearson’s correlation coefficient is shown not to be statistically significant
at the 0.05 level and as a result indicates that the final model fits the data well due to the predicted
values not being significantly different from the observed values. The likelihood ratio test contains
the variables retained within the model and their statistically significant p-values indicate the
importance of their retention (see table 11.29).
Significant contributions to the overall significance of the model are observed in both sections of
table 11.30.
95% CI
Mo
de
rate
co
mp
are
d t
o L
ow
INTE
RES
T
Predictor B SE (B) Odds Ratio
Lower bound
Upper Bound
DEMOG_RURAL_URBAN - URBAN -0.051 0.128 0.950 0.740 1.221
DEMOG_RURAL_URBAN - RURAL Reference Reference Reference Reference Reference
DEMOG_EDUCATION - Low (1) -0.396 0.200 0.673 0.455 0.995
DEMOG_EDUCATION - Moderate (2) -0.079 0.189 0.924 0.638 1.338
DEMOG_EDUCATION - High (3) Reference Reference Reference Reference Reference
DEMOG_RACE - White (1) 0.355 0.276 1.426 0.831 2.447
DEMOG_RACE - Black (2) 0.341 0.194 1.406 0.961 2.058
DEMOG_RACE - Indian / Asian (3) 0.991 0.429 2.695 1.163 6.243
DEMOG_RACE - Coloured (4) Reference Reference Reference Reference Reference
95% CI
Hig
h c
om
par
ed
to
Lo
w IN
TER
EST
Predictor B SE (B) Odds Ratio
Lower bound
Upper Bound
DEMOG_RURAL_URBAN - URBAN 0.386 0.140 1.471 1.118 1.934
DEMOG_RURAL_URBAN - RURAL Reference Reference Reference Reference Reference
DEMOG_EDUCATION - Low (1) -1.056 0.197 0.348 0.236 0.512
DEMOG_EDUCATION - Moderate (2) -0.521 0.181 0.594 0.417 0.846
DEMOG_EDUCATION - High (3) Reference Reference Reference Reference Reference
DEMOG_RACE - White (1) 1.189 0.315 3.282 1.769 6.089
DEMOG_RACE - Black (2) 1.145 0.256 3.143 1.903 5.193
DEMOG_RACE - Indian / Asian (3) 1.320 0.482 3.743 1.455 9.630
DEMOG_RACE - Coloured (4) Reference Reference Reference Reference Reference
Table 11.30: Interest in science index: Parameter estimates (Reference category: Low interest)
As far as educational attainment is concerned, respondents with low education were 67.3% as likely
as those with a post-matric education to appear in the moderate interest outcome compared to the
low interest outcome category (B = -3.96; Wald= 3.939; p < 0.05). Likewise, respondents with low
Stellenbosch University https://scholar.sun.ac.za
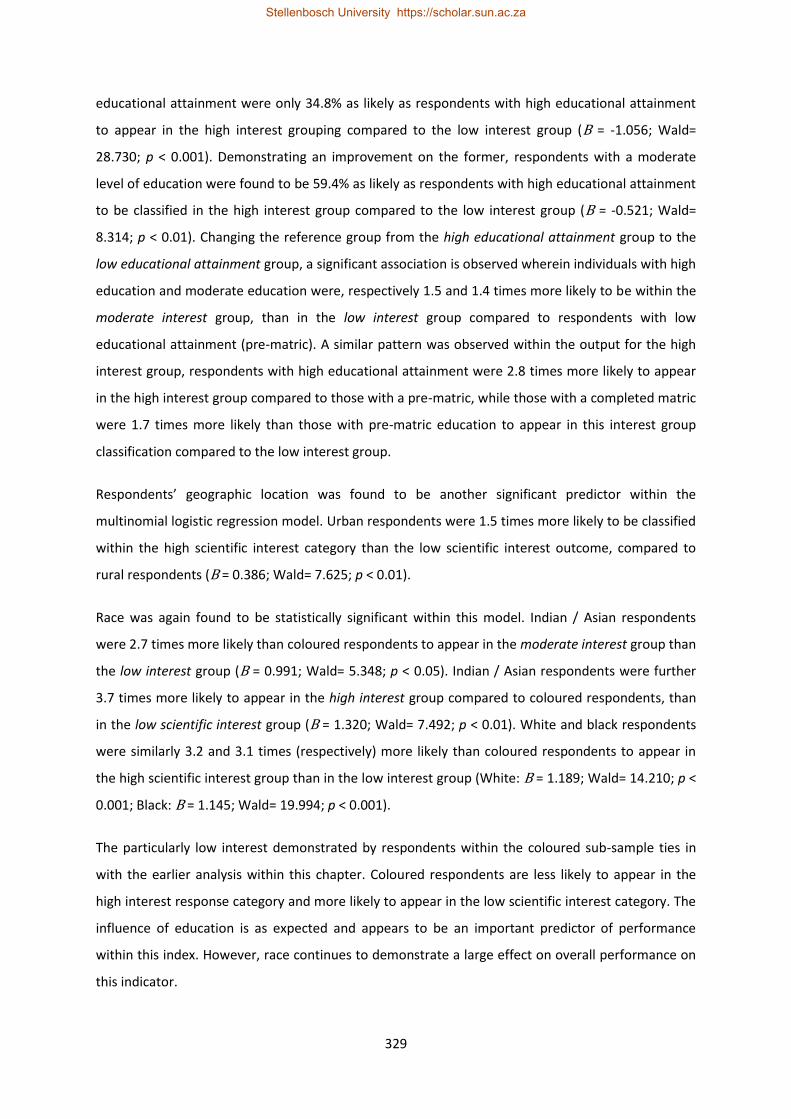
329
educational attainment were only 34.8% as likely as respondents with high educational attainment
to appear in the high interest grouping compared to the low interest group (B = -1.056; Wald=
28.730; p < 0.001). Demonstrating an improvement on the former, respondents with a moderate
level of education were found to be 59.4% as likely as respondents with high educational attainment
to be classified in the high interest group compared to the low interest group (B = -0.521; Wald=
8.314; p < 0.01). Changing the reference group from the high educational attainment group to the
low educational attainment group, a significant association is observed wherein individuals with high
education and moderate education were, respectively 1.5 and 1.4 times more likely to be within the
moderate interest group, than in the low interest group compared to respondents with low
educational attainment (pre-matric). A similar pattern was observed within the output for the high
interest group, respondents with high educational attainment were 2.8 times more likely to appear
in the high interest group compared to those with a pre-matric, while those with a completed matric
were 1.7 times more likely than those with pre-matric education to appear in this interest group
classification compared to the low interest group.
Respondents’ geographic location was found to be another significant predictor within the
multinomial logistic regression model. Urban respondents were 1.5 times more likely to be classified
within the high scientific interest category than the low scientific interest outcome, compared to
rural respondents (B = 0.386; Wald= 7.625; p < 0.01).
Race was again found to be statistically significant within this model. Indian / Asian respondents
were 2.7 times more likely than coloured respondents to appear in the moderate interest group than
the low interest group (B = 0.991; Wald= 5.348; p < 0.05). Indian / Asian respondents were further
3.7 times more likely to appear in the high interest group compared to coloured respondents, than
in the low scientific interest group (B = 1.320; Wald= 7.492; p < 0.01). White and black respondents
were similarly 3.2 and 3.1 times (respectively) more likely than coloured respondents to appear in
the high scientific interest group than in the low interest group (White: B = 1.189; Wald= 14.210; p <
0.001; Black: B = 1.145; Wald= 19.994; p < 0.001).
The particularly low interest demonstrated by respondents within the coloured sub-sample ties in
with the earlier analysis within this chapter. Coloured respondents are less likely to appear in the
high interest response category and more likely to appear in the low scientific interest category. The
influence of education is as expected and appears to be an important predictor of performance
within this index. However, race continues to demonstrate a large effect on overall performance on
this indicator.
Stellenbosch University https://scholar.sun.ac.za

330
Accordingly, the multinomial logistic regression model representing the log odds of respondents
appearing in the moderate scientific interest group compared to the low scientific interest group is
given by the equation:
𝐋𝐎𝐆 (𝐌𝐎𝐃
𝐥𝐨𝐰) = −𝟎. 𝟎𝟒𝟗 + (−𝟎. 𝟎𝟓𝟏 × 𝐋𝐎𝐂 − 𝐔𝐑𝐁) + (−𝟎. 𝟑𝟗𝟔 × 𝐄𝐝𝐮𝐋𝐨𝐰)
+ (−𝟎. 𝟎𝟕𝟗 × 𝐄𝐝𝐮𝐌𝐨𝐝) + (𝟎. 𝟑𝟓𝟓 × 𝐏𝐨𝐩𝐖) + (𝟎. 𝟑𝟒𝟏 × 𝐏𝐨𝐩𝐁) + (𝟎. 𝟗𝟗𝟏× 𝐏𝐨𝐩𝐈)
While the log odds of respondents appearing in the high scientific interest group compared to the
low interest group is represented by the equation:
𝐋𝐎𝐆 (𝐇𝐈𝐆𝐇
𝐥𝐨𝐰) = −𝟎. 𝟕𝟔𝟖 + (𝟎. 𝟑𝟖𝟔 × 𝐋𝐎𝐂 − 𝐔𝐑𝐁) + (−𝟏. 𝟎𝟓𝟔 × 𝐄𝐝𝐮𝐋𝐨𝐰)
+ (−𝟎. 𝟓𝟐𝟏 × 𝐄𝐝𝐮𝐌𝐨𝐝) + (𝟏. 𝟏𝟖𝟗 × 𝐏𝐨𝐩𝐖) + (𝟏. 𝟏𝟒𝟓 × 𝐏𝐨𝐩𝐁) + (𝟏. 𝟑𝟐𝟎× 𝐏𝐨𝐩𝐈)
Where: the applicable indication of each of the below variable definitions can be substituted
PopW – Race: White PopB - Race: Black PopI - Race: Indian LOC-URB – Urban Location
EduLow – Low Education EduMod- Moderate Education HHILow – Low Income HHIMod- Moderate Income
Predictors of outcomes on the Informedness in Science Index (InSi)
The multinomial logistic regression model of predictors of outcomes on the Informedness in Science
Index is based on 2 173 valid observations as a result of case-wise deletion procedures (L: 248.106;
d.f. = 30; p < 0.001). Only one variable was removed during the analytic process, as it was found not
be significantly associated (gender). Table 11.31 presents the model fitting information, goodness-of-
fit and likelihood ratio test, where all test statistics were found to be within the acceptable level and
the model was demonstrated to be a good fit within the observed data.
Model Fitting Information
Model
Model Fitting Criteria
Likelihood Ratio Tests
-2 Log Likelihood Chi-
Square df Sig.
Intercept Only 2157.452
Final 1909.346 248.106 30 0.000
Goodness-of-Fit
Chi-Square df Sig.
Pearson 1096.869 1054 0.175
Likelihood Ratio Tests
Effect
Model Fitting Criteria Likelihood Ratio Tests
-2 Log Likelihood of Chi- df Sig.
Stellenbosch University https://scholar.sun.ac.za

331
Reduced Model Square
Intercept 1909.346 0.000 0
DEMOG_POP_GROUP 1952.898 43.552 6 0.000
DEMOG_RURAL_URBAN 1935.669 26.323 2 0.000
DEMOG_AGE 1927.588 18.242 10 0.051
DEMOG_EDUCATION 1958.322 48.976 4 0.000
DEMOG_EMPLOYMENT 1920.439 11.093 4 0.026
DEMOG_HH_INCOME 1918.291 8.945 4 0.063
Table 11.31: Model fitting information, goodness-of-fit and likelihood ratio test
The variables retained within the model include race; geographic location (rural - urban); age;
educational attainment; employment status and household income. All of these variables, except
age, demonstrated a significant p-value within the likelihood test table (table 11.31), however
despite the value associated with the age variable – it was retained by SPSS within the final model.
Race of respondent was a significant factor within the informedness in science index. Indian / Asian
respondents were only 27.1% as likely to be classified into the moderate outcome compared to
coloured respondents, than into the low informedness group (B = -1.305; Wald= 15.597; p < 0.001).
Similarly, white respondents were about twice as likely as coloured respondents to appear in the
high informedness category, than in the low informedness category (B = 0.728; Wald= 6.133; p <
0.05). Black respondents were found to be 1.7 times more likely than coloured respondents to
appear in the high informedness group than in the low informedness group, while Indian / Asian
respondents were 41.1% as likely as coloured respondents to appear in the former group than the
latter (Black: B = 0.474; Wald= 4.687; p < 0.05; Indian / Asian: B = -0.890; Wald= 5.849; p < 0.05).
With reference to geography, urban respondents are 1.6 times more likely than rural respondents to
be classified in the moderate informedness category than the low informedness category (B = 0.477;
Wald= 16.497; p < 0.001). Similarly, urban respondents were found to be 1.8 times more likely to
appear in the high informedness group than the low informedness group compared to rural
respondents (B = 0.592; Wald= 22.239; p < 0.001).
Based on the earlier analysis in Chapter Eight, level of educational attainment was expected to be
significantly associated with the informedness in science index. Respondents within pre-matric
education are only 48.4% as likely as those with post-matric education to appear in the moderate
informedness group than in the low informedness group (B = -0.726; Wald= 10.511; p < 0.01), while
respondents with a completed matric were 63.7% as likely as those with a post-matric education to
be in the moderate category, compared to the low category (B = -0.450; Wald= 4.724; p < 0.05).
Accordingly, those with pre-matric education and a completed matric were less likely to appear in
the high informedness category, compared to those with a post-matric education (Pre-matric: B = -
1.444; Wald= 42.632; p < 0.001; Matric completed: B = -0.818; Wald= 16.934; p < 0.001).
Stellenbosch University https://scholar.sun.ac.za

332
95% CI
Mo
der
ate
com
par
ed t
o L
ow
INFO
RM
EDN
ESS
Predictor B SE (B) Odds Ratio
Lower bound
Upper Bound
DEMOG_RACE - White (1) -0.342 0.280 0.710 0.410 1.230
DEMOG_RACE - Black (2) -0.269 0.183 0.764 0.534 1.094
DEMOG_RACE - Indian / Asian (3) -1.305 0.330 0.271 0.142 0.518
DEMOG_RACE - Coloured (4) Reference Reference Reference Reference Reference
DEMOG_RURAL_URBAN - URBAN 0.477 0.117 1.611 1.280 2.028
DEMOG_RURAL_URBAN - RURAL Reference Reference Reference Reference Reference
DEMOG_AGE - <20 years 0.453 0.347 1.572 0.797 3.101
DEMOG_AGE - 20-29 years 0.151 0.239 1.163 0.728 1.860
DEMOG_AGE - 30-39 years -0.004 0.243 0.996 0.619 1.603
DEMOG_AGE - 40-49 years 0.375 0.252 1.455 0.888 2.384
DEMOG_AGE - 50-59 years 0.059 0.267 1.061 0.629 1.791
DEMOG_AGE 60+ years Reference Reference Reference Reference Reference
DEMOG_EDUCATION - Low (1) -0.726 0.224 0.484 0.312 0.750
DEMOG_EDUCATION - Moderate (2) -0.450 0.207 0.637 0.425 0.957
DEMOG_EDUCATION - High (3) Reference Reference Reference Reference Reference
DEMOG_EMPLOYMENT - Employed 0.494 0.184 1.640 1.143 2.352
DEMOG_EMPLOYMENT - Unemployed 0.456 0.184 1.577 1.099 2.264
DEMOG_EMPLOYMENT - Not-Working Reference Reference Reference Reference Reference
DEMOG_HH_INCOME - Low (1) -0.560 0.326 0.571 0.302 1.082
DEMOG_HH_INCOME - Moderate (2) -0.428 0.318 0.652 0.349 1.216
DEMOG_HH_INCOME - High (3) Reference Reference Reference Reference Reference
95% CI
Hig
h c
om
par
ed t
o L
ow
INFO
RM
EDN
ESS
Predictor B SE (B) Odds Ratio
Lower bound
Upper Bound
DEMOG_RACE - White (1) 0.728 0.294 2.070 1.164 3.683
DEMOG_RACE - Black (2) 0.474 0.219 1.607 1.046 2.470
DEMOG_RACE - Indian / Asian (3) -0.890 0.368 0.411 0.200 0.845
DEMOG_RACE - Coloured (4) Reference Reference Reference Reference Reference
DEMOG_RURAL_URBAN - URBAN 0.592 0.125 1.807 1.414 2.309
DEMOG_RURAL_URBAN - RURAL Reference Reference Reference Reference Reference
DEMOG_AGE - <20 years 1.131 0.354 3.099 1.548 6.204
DEMOG_AGE - 20-29 years 0.350 0.262 1.420 0.849 2.374
DEMOG_AGE - 30-39 years 0.161 0.266 1.175 0.698 1.977
DEMOG_AGE - 40-49 years 0.311 0.278 1.364 0.791 2.353
DEMOG_AGE - 50-59 years 0.237 0.291 1.268 0.716 2.245
DEMOG_AGE 60+ years Reference Reference Reference Reference Reference
DEMOG_EDUCATION - Low (1) -1.444 0.221 0.236 0.153 0.364
DEMOG_EDUCATION - Moderate (2) -0.818 0.199 0.441 0.299 0.652
DEMOG_EDUCATION - High (3) Reference Reference Reference Reference Reference
DEMOG_EMPLOYMENT - Employed 0.550 0.193 1.734 1.188 2.530
DEMOG_EMPLOYMENT - Unemployed 0.529 0.196 1.697 1.156 2.492
DEMOG_EMPLOYMENT - Not-Working Reference Reference Reference Reference Reference
DEMOG_HH_INCOME - Low (1) -0.839 0.318 0.432 0.232 0.805
DEMOG_HH_INCOME - Moderate (2) -0.525 0.308 0.592 0.324 1.081
DEMOG_HH_INCOME - High (3) Reference Reference Reference Reference Reference
Table 11.32: Informedness in science index: Parameter estimates (Reference category: Low informedness)
Respondents who are employed are 1.6 times more likely to appear in the moderate group than the
low group and 1.7 more likely to appear in the high informedness group than the low informedness
group than respondents not working (Moderate: B = 0.494; Wald= 7.208; p < 0.01; High: B = 0.550;
Wald= 8.155; p < 0.01). Interestingly, unemployed respondents were 1.5 times more likely to appear
in the moderate informedness group than the low informedness group and 1.7 times more likely to
Stellenbosch University https://scholar.sun.ac.za

333
appear in the high informdness group than the low informedness group than those reporting they
are not working (Moderate: B = 0.456; Wald= 6.103; p < 0.01; High: B = 0.529; Wald= 7.300; p <
0.01).
The role of income revealed that individuals within lower income households were 43.2% as likely as
those with high household income to be in the high informedness group compared to the low
informedness group (B = -0.839; Wald= 6.976, p < 0.01). Respondents reporting moderate household
income were 59.2% as likely as those within the high household income category to be within the
high group than in the low informedness group (B = -0.525; Wald= 2.910; p < 0.05).
The multinomial logistic regression model representing the log odds of respondents appearing in the
moderate informedness group compared to the low informedness group is provided within the
equation:
𝑳𝑶𝑮 (𝑴𝑶𝑫
𝒍𝒐𝒘) = 𝟎. 𝟔𝟎𝟒 + (−𝟎. 𝟑𝟒𝟐 × 𝑷𝒐𝒑𝑾) + (−𝟎. 𝟐𝟔𝟗 × 𝑷𝒐𝒑𝑩) + (−𝟏. 𝟑𝟎𝟓 × 𝑷𝒐𝒑𝑰)
+ (𝟎. 𝟒𝟕𝟕 × 𝑳𝒐𝒄𝑼𝒓𝒃) + (−𝟎. 𝟒𝟓𝟑 × 𝑨𝒈𝒆𝟏) + (𝟎. 𝟏𝟓𝟏 × 𝑨𝒈𝒆𝟐)+ (−𝟎. 𝟎𝟎𝟒 × 𝑨𝒈𝒆𝟑) + (𝟎. 𝟑𝟕𝟓 × 𝐀𝐠𝐞𝟒) + (𝟎. 𝟎𝟓𝟗 × 𝐀𝐠𝐞𝟓)+ (−𝟎. 𝟕𝟐𝟔 × 𝐄𝐝𝐮𝐋𝐎𝐖) + (−𝟎. 𝟒𝟓𝟎 × 𝐄𝐝𝐮𝐌𝐎𝐃) + (𝟎. 𝟒𝟗𝟒 × 𝐄𝐦𝐩𝐥𝟏)+ (𝟎. 𝟒𝟓𝟔 × 𝐄𝐦𝐩𝐥𝟐) + (−𝟎. 𝟓𝟔𝟎 × 𝑯𝑯𝑰𝑳𝒐𝒘) + (−𝟎. 𝟒𝟐𝟖 × 𝑯𝑯𝑰𝑴𝒐𝒅)
While the log odds of respondents appearing in the high informedness category compared to the low
informedness category is represented by the equation:
𝑳𝑶𝑮 (𝑯𝑰𝑮𝑯
𝒍𝒐𝒘) = 𝟎. 𝟏𝟖𝟒 + (𝟎. 𝟕𝟐𝟖 × 𝑷𝒐𝒑𝑾) + (𝟎. 𝟒𝟕𝟒 × 𝑷𝒐𝒑𝑩) + (−𝟎. 𝟖𝟗𝟎 × 𝑷𝒐𝒑𝑰)
+ (𝟎. 𝟓𝟗𝟐 × 𝑳𝒐𝒄𝑼𝒓𝒃) + (𝟏. 𝟏𝟑𝟏 × 𝑨𝒈𝒆𝟏) + (𝟎. 𝟑𝟓𝟎 × 𝑨𝒈𝒆𝟐)+ (𝟎. 𝟏𝟔𝟏 × 𝑨𝒈𝒆𝟑) + (𝟎. 𝟑𝟏𝟏 × 𝐀𝐠𝐞𝟒) + (𝟎. 𝟐𝟑𝟕 × 𝐀𝐠𝐞𝟓)+ (−𝟏. 𝟒𝟒𝟒 × 𝐄𝐝𝐮𝐋𝐎𝐖) + (−𝟎. 𝟖𝟏𝟖 × 𝐄𝐝𝐮𝐌𝐎𝐃) + (𝟎. 𝟓𝟓𝟎 × 𝐄𝐦𝐩𝐥𝟏)+ (𝟎. 𝟓𝟐𝟗 × 𝐄𝐦𝐩𝐥𝟐) + (−𝟎. 𝟖𝟑𝟗 × 𝑯𝑯𝑰𝑳𝒐𝒘) + (−𝟎. 𝟓𝟐𝟓 × 𝑯𝑯𝑰𝑴𝒐𝒅)
Where: the applicable indication of each of the below variable definitions can be substituted
PopW – Race: White PopB - Race: Black PopI - Race: Indian EduLow – Low Education
EduMod- Moderate Education HHILow – Low Income HHIMod- Moderate Income Age1 - <20 years
Age2 – 20-29 years Age3 – 30-39 years Age4 – 40-49 years Age5 – 50-59 years
Empl1 - Employed Empl2 - Unemployed LocUrb - Urban
Stellenbosch University https://scholar.sun.ac.za

334
Predictors of outcomes on the Information Immersion Science Index (InfoSI)
An assessment of predictors for the scientific information immersion index adopting a multinomial
logistic regression model yielded a significant outcome (L: 237.003; d.f. = 22; p < 0.001). The analysis
involved 2 101 valid cases, equalling 60.2% of the total sample. Within the model procedure, three
variables were not found to significantly influence the outcome and were excluded from further
analysis. These include: employment status; household income and gender.
Model Fitting Information
Model
Model Fitting Criteria
Likelihood Ratio Tests
-2 Log Likelihood
Chi-Square
df Sig.
Intercept Only 2090.208
Final 1853.206 237.003 22 0.000
Goodness-of-Fit
Chi-
Square df Sig.
Pearson 1058.372 1044 0.372
Likelihood Ratio Tests
Effect
Model Fitting Criteria
Likelihood Ratio Tests
-2 Log Likelihood
of Reduced
Model
Chi-Square
df Sig.
Intercept 1853.206 0.000 0
DEMOG_RACE 1873.267 20.061 6 0.003
DEMOG_RURAL_URBAN 1863.895 10.689 2 0.005
DEMOG_AGE 1880.020 26.814 10 0.003
DEMOG_EDUCATION 1958.253 105.047 4 0.000
Table 11.33: Model fitting information, goodness-of-fit and likelihood ratio test
The model fitting information and related test statistic are presented in the compound table 11.33.
The model fitting information demonstrates a significant chi-square and p-value, indicating that the
included variables had a significant improvement on the intercept-only model. An assessment of the
goodness-of-fit information reveals how well the model fits the observed data within the study. The
p-value equals a value greater than 0.05, indicating that the model fits the data well. The variables
retained within the model are presented within the likelihood ratio test and include: race group;
educational attainment; rural - urban location and age as a result of their statistically significant p-
value (see table 11.33).
The influence of age group classification appears to be highly significant within this model.
Respondents below the age of 60 year are significantly less likely to be assigned to the low
Stellenbosch University https://scholar.sun.ac.za

335
information immersion group than respondents older than 60 years. People aged between 50 and
59 are 1.9 times more likely to be assigned to the moderate information immersion category than
the low information immersion category, compared to those 60 years and older (B = -0.647; Wald=
6.711; p < 0.01). Similarly, respondents aged below 60 years were in most cases twice as likely as
those aged 60 years and older to appear in the high information immersion group than in the low
group. Among respondents aged less than 20 years this odds ratio was found to be 2.7 times more
than for those aged 60+ years (B = 1.005; Wald= 7.564; p < 0.01).
95% CI
Mo
der
ate
com
par
ed t
o L
ow
info
rmat
ion
imm
ersi
on
Predictor B SE (B) Odds Ratio
Lower bound
Upper Bound
DEMOG_RACE - White (1) -0.151 0.294 0.860 0.483 1.531
DEMOG_RACE - Black (2) -0.386 0.206 0.680 0.454 1.017
DEMOG_RACE - Indian / Asian (3) -0.353 0.364 0.702 0.344 1.434
DEMOG_RACE - Coloured (4) Reference Reference Reference Reference Reference
DEMOG_RURAL_URBAN - URBAN 0.209 0.119 1.232 0.975 1.557
DEMOG_RURAL_URBAN - RURAL Reference Reference Reference Reference Reference
DEMOG_AGE - <20 years 0.257 0.343 1.293 0.660 2.535
DEMOG_AGE - 20-29 years 0.115 0.218 1.122 0.732 1.719
DEMOG_AGE - 30-39 years 0.266 0.214 1.304 0.857 1.985
DEMOG_AGE - 40-49 years 0.232 0.227 1.262 0.808 1.970
DEMOG_AGE - 50-59 years 0.647 0.250 1.910 1.171 3.116
DEMOG_AGE 60+ years Reference Reference Reference Reference Reference
DEMOG_EDUCATION - Low (1) -0.629 0.208 0.533 0.354 0.802
DEMOG_EDUCATION - Moderate (2) -0.565 0.202 0.568 0.383 0.845
DEMOG_EDUCATION - High (3) Reference Reference Reference Reference Reference
95% CI
Hig
h c
om
par
ed t
o L
ow
info
rmat
ion
imm
ersi
on
Predictor B SE (B) Odds Ratio
Lower bound
Upper Bound
DEMOG_RACE - White (1) 0.177 0.282 1.193 0.686 2.074
DEMOG_RACE - Black (2) -0.544 0.207 0.580 0.387 0.871
DEMOG_RACE - Indian / Asian (3) -0.180 0.352 0.835 0.419 1.665
DEMOG_RACE - Coloured (4) Reference Reference Reference Reference Reference
DEMOG_RURAL_URBAN - URBAN 0.405 0.124 1.499 1.175 1.912
DEMOG_RURAL_URBAN - RURAL Reference Reference Reference Reference Reference
DEMOG_AGE - <20 years 1.005 0.365 2.731 1.335 5.588
DEMOG_AGE - 20-29 years 0.876 0.254 2.401 1.460 3.948
DEMOG_AGE - 30-39 years 0.716 0.252 2.046 1.248 3.355
DEMOG_AGE - 40-49 years 0.898 0.262 2.456 1.470 4.102
DEMOG_AGE - 50-59 years 0.801 0.293 2.228 1.256 3.955
DEMOG_AGE 60+ years Reference Reference Reference Reference Reference
DEMOG_EDUCATION - Low (1) -1.779 0.201 0.169 0.114 0.250
DEMOG_EDUCATION - Moderate (2) -0.910 0.185 0.403 0.280 0.578
DEMOG_EDUCATION - High (3) Reference Reference Reference Reference Reference
Table 11.34: Information Immersion Science Index Parameter estimates (Reference category: Low information immersion)
Within race, only a single predictor made a unique statistically significant contribution. Black
respondents were 58.0% as likely as coloured respondents to appear in the high information
immersion group than in the low group (B = -0.544; Wald= 6.894; p < 0.01).
Educational attainment groups reveal that respondents with pre-matric education are 53.3% as likely
as those with post-matric education to appear in the moderate information immersion group, as
Stellenbosch University https://scholar.sun.ac.za
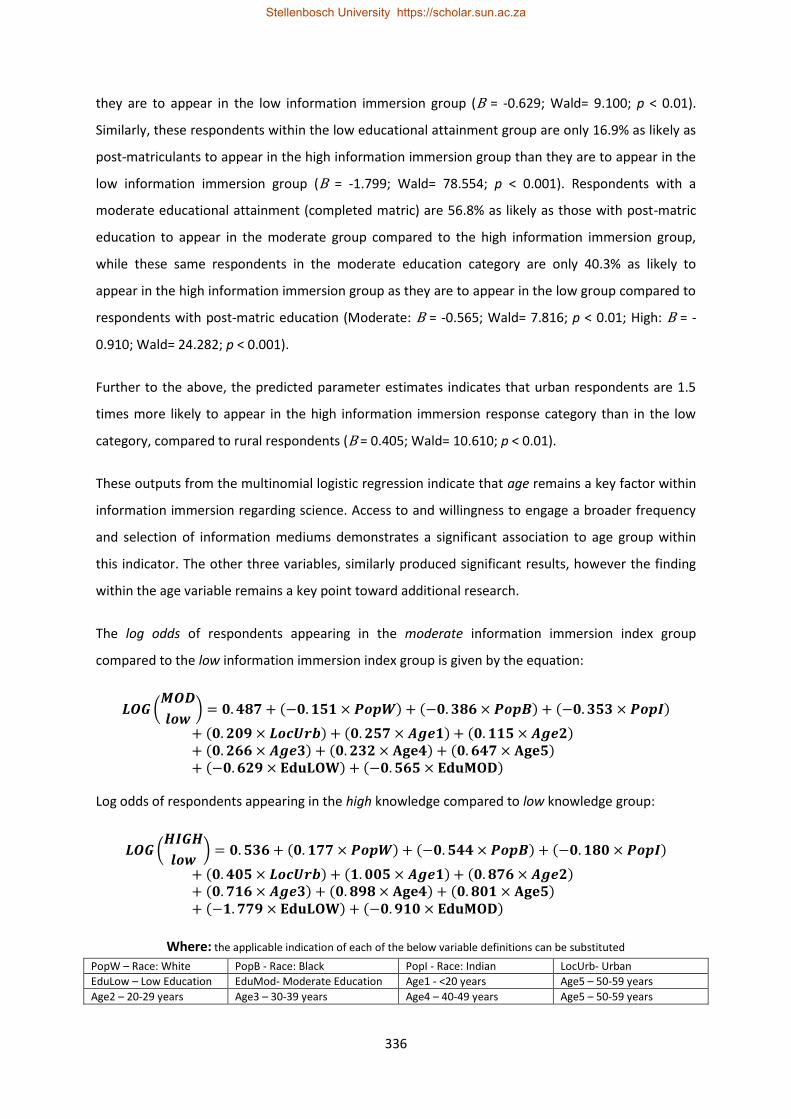
336
they are to appear in the low information immersion group (B = -0.629; Wald= 9.100; p < 0.01).
Similarly, these respondents within the low educational attainment group are only 16.9% as likely as
post-matriculants to appear in the high information immersion group than they are to appear in the
low information immersion group (B = -1.799; Wald= 78.554; p < 0.001). Respondents with a
moderate educational attainment (completed matric) are 56.8% as likely as those with post-matric
education to appear in the moderate group compared to the high information immersion group,
while these same respondents in the moderate education category are only 40.3% as likely to
appear in the high information immersion group as they are to appear in the low group compared to
respondents with post-matric education (Moderate: B = -0.565; Wald= 7.816; p < 0.01; High: B = -
0.910; Wald= 24.282; p < 0.001).
Further to the above, the predicted parameter estimates indicates that urban respondents are 1.5
times more likely to appear in the high information immersion response category than in the low
category, compared to rural respondents (B = 0.405; Wald= 10.610; p < 0.01).
These outputs from the multinomial logistic regression indicate that age remains a key factor within
information immersion regarding science. Access to and willingness to engage a broader frequency
and selection of information mediums demonstrates a significant association to age group within
this indicator. The other three variables, similarly produced significant results, however the finding
within the age variable remains a key point toward additional research.
The log odds of respondents appearing in the moderate information immersion index group
compared to the low information immersion index group is given by the equation:
𝑳𝑶𝑮 (𝑴𝑶𝑫
𝒍𝒐𝒘) = 𝟎. 𝟒𝟖𝟕 + (−𝟎. 𝟏𝟓𝟏 × 𝑷𝒐𝒑𝑾) + (−𝟎. 𝟑𝟖𝟔 × 𝑷𝒐𝒑𝑩) + (−𝟎. 𝟑𝟓𝟑 × 𝑷𝒐𝒑𝑰)
+ (𝟎. 𝟐𝟎𝟗 × 𝑳𝒐𝒄𝑼𝒓𝒃) + (𝟎. 𝟐𝟓𝟕 × 𝑨𝒈𝒆𝟏) + (𝟎. 𝟏𝟏𝟓 × 𝑨𝒈𝒆𝟐)+ (𝟎. 𝟐𝟔𝟔 × 𝑨𝒈𝒆𝟑) + (𝟎. 𝟐𝟑𝟐 × 𝐀𝐠𝐞𝟒) + (𝟎. 𝟔𝟒𝟕 × 𝐀𝐠𝐞𝟓)+ (−𝟎. 𝟔𝟐𝟗 × 𝐄𝐝𝐮𝐋𝐎𝐖) + (−𝟎. 𝟓𝟔𝟓 × 𝐄𝐝𝐮𝐌𝐎𝐃)
Log odds of respondents appearing in the high knowledge compared to low knowledge group:
𝑳𝑶𝑮 (𝑯𝑰𝑮𝑯
𝒍𝒐𝒘) = 𝟎. 𝟓𝟑𝟔 + (𝟎. 𝟏𝟕𝟕 × 𝑷𝒐𝒑𝑾) + (−𝟎. 𝟓𝟒𝟒 × 𝑷𝒐𝒑𝑩) + (−𝟎. 𝟏𝟖𝟎 × 𝑷𝒐𝒑𝑰)
+ (𝟎. 𝟒𝟎𝟓 × 𝑳𝒐𝒄𝑼𝒓𝒃) + (𝟏. 𝟎𝟎𝟓 × 𝑨𝒈𝒆𝟏) + (𝟎. 𝟖𝟕𝟔 × 𝑨𝒈𝒆𝟐)+ (𝟎. 𝟕𝟏𝟔 × 𝑨𝒈𝒆𝟑) + (𝟎. 𝟖𝟗𝟖 × 𝐀𝐠𝐞𝟒) + (𝟎. 𝟖𝟎𝟏 × 𝐀𝐠𝐞𝟓)+ (−𝟏. 𝟕𝟕𝟗 × 𝐄𝐝𝐮𝐋𝐎𝐖) + (−𝟎. 𝟗𝟏𝟎 × 𝐄𝐝𝐮𝐌𝐎𝐃)
Where: the applicable indication of each of the below variable definitions can be substituted
PopW – Race: White PopB - Race: Black PopI - Race: Indian LocUrb- Urban
EduLow – Low Education EduMod- Moderate Education Age1 - <20 years Age5 – 50-59 years
Age2 – 20-29 years Age3 – 30-39 years Age4 – 40-49 years Age5 – 50-59 years
Stellenbosch University https://scholar.sun.ac.za

337
Predictors of outcomes on the Science Engagement Index (SEI)
An investigation into the predictors of outcomes on the science engagement index was completed
using the procedures adopted previously. As reported in the previous chapters, the majority of
South Africans (84.9%) had not visited a science engagement activity within the preceding 12 month
period and as a result, the multinomial logistic regression analysis was performed using a base
starting sample of 950 respondents. Due to the manner in which SPSS initiates the NOMREG
(multinomial logistic regression) procedure, cases with cells containing zero (0) frequencies were
eliminated and thus the final analysis included 606 respondents (63.7%).
Model Fitting Information
Model
Model Fitting Criteria
Likelihood Ratio Tests
-2 Log Likelihood
Chi-Square
df Sig.
Intercept Only 861.923
Final 821.920 40.003 6 0.000
Goodness-of-Fit
Chi-
Square df Sig.
Pearson 585.576 568 0.296
Likelihood Ratio Tests
Effect
Model Fitting Criteria Likelihood Ratio Tests
-2 Log Likelihood
of Reduced
Model Chi-
Square df Sig.
Intercept 821.920 0.000 0
DEMOG_RURAL_URBAN 837.710 15.789 2 0.000
DEMOG_EDUCATION 840.008 18.088 4 0.001
Table 11.35: Model fitting information, goodness-of-fit and likelihood ratio test
The step-wise backward elimination process in the multinomial logistic regression removed the
variables relating to: race; employment status; age; household income and gender. The final model
included geographic location (rural - urban) as well as educational attainment and was found to be
significant (L: 40.003; d.f. = 6; p < 0.001). The result for the model fitting information, goodness-of-fit
and likelihood ratio test are presented in table 11.35.
Test outputs indicate a significant model fitting chi-square value for the variables included as
compared to the intercept-only model. The predicted data values within the model fit the actual
observations very well as suggested by the chi-square value and outcome of the test of significance
which yielded a p-value greater than 0.05. The likelihood ratio tests for variables retained in the
Stellenbosch University https://scholar.sun.ac.za

338
model indicate both as highly significant predictors of performance on the science engagement
index.
95% CI
Mo
der
ate
com
par
ed
to L
ow
en
gage
me
nt
Predictor B SE (B) Odds Ratio
Lower bound
Upper Bound
DEMOG_RURAL_URBAN – URBAN 0.221 0.235 1.248 0.788 1.977
DEMOG_RURAL_URBAN – RURAL Reference Reference Reference Reference Reference
DEMOG_EDUCATION - Low (1) -0.011 0.311 0.989 0.538 1.819
DEMOG_EDUCATION - Moderate (2) -0.058 0.253 0.944 0.575 1.548
DEMOG_EDUCATION - High (3) Reference Reference Reference Reference Reference
95% CI
Hig
h c
om
par
ed t
o
Low
en
gage
men
t Predictor B SE (B) Odds Ratio
Lower bound
Upper Bound
DEMOG_RURAL_URBAN – URBAN 1.061 0.286 2.891 1.651 5.061
DEMOG_RURAL_URBAN – RURAL Reference Reference Reference Reference Reference
DEMOG_EDUCATION - Low (1) -1.211 0.337 0.298 0.154 0.577
DEMOG_EDUCATION - Moderate (2) -0.663 0.223 0.516 0.333 0.799
DEMOG_EDUCATION - High (3) Reference Reference Reference Reference Reference
Table 11.36: Science Engagement Index Parameter estimates (Reference category: Low engagement)
Both variables produced statistically significant results, as far as science engagement is concerned,
particularly within the high engagement outcome group. Urban respondents were 2.9 times more
likely than rural respondents to appear in the high science engagement outcome, than the low
outcome group (B = 1.061; Wald= 13.798; p < 0.001).
Educational attainment level was again found to correlate significantly to outcomes within the
science engagement index. Respondents with low educational attainment (pre-matric) were only
29.8% as likely as those with a post-matric education to be within the high engagement outcome,
compared to the low science engagement classification. Respondents with a completed matric were
similarly only 51.6% as likely as those within the high educational attainment group to appear in the
high science engagement classification compared to the low engagement group. With the reference
category set to compare respondents to the low educational attainment group, the converse is
revealed. Respondents with post-matric education are 3.4 times more likely than those with a pre-
matric education to appear in the high science engagement group compared to the low science
engagement group. Respondents with a completed matric were 1.7 times more likely to appear in
the high group, than the low engagement group compared to respondents with pre-matric
educational attainment.
The result of the multinomial logistic regression is in agreement with the previously reported
bivariate analysis and the indicator results presented earlier in this chapter. Predictors of attendance
at science engagement activities would in many ways be determined by the overall level of
informedness and interest in science that is highly related to educational attainment.
Stellenbosch University https://scholar.sun.ac.za

339
Correspondingly, beyond the influence of the interactions between geographic location, income,
education and employment, the noted role of the rural / urban variable is demonstrative of access
and availability of science engagement centres within the rural locations. While the data does not
allow us to access affective and motivational reasons directing attendance at science engagement
locations, the simple reality is, people cannot attend what is not there. As a result of this analysis it
has however been demonstrated that lack of access and availability of science engagement
programmes within rural areas negatively influence outcomes on the science engagement index.
The final multinomial logistic regression model representing the log odds of respondents appearing
in the moderate science engagement group compared to the low science engagement group is
presented within the equation:
𝑳𝑶𝑮 (𝑴𝑶𝑫
𝒍𝒐𝒘) = −𝟎. 𝟖𝟎𝟎 + (𝟎. 𝟐𝟐𝟏 × 𝑳𝒐𝒄𝑼𝒓𝒃) + (−𝟎. 𝟎𝟏𝟏 × 𝑬𝒅𝒖𝑳𝑶𝑾) + (−𝟎. 𝟎𝟓𝟖 × 𝑬𝒅𝒖𝑴𝑶𝑫)
While the log odds of respondents appearing in the high science engagement group compared to
the low science engagement group is represented by the equation:
𝑳𝑶𝑮 (𝑯𝑰𝑮𝑯
𝒍𝒐𝒘) = −𝟎. 𝟖𝟕𝟎 + (𝟏. 𝟎𝟔𝟏 × 𝑳𝒐𝒄𝑼𝒓𝒃) + (−𝟏. 𝟐𝟏𝟏 × 𝑬𝒅𝒖𝑳𝑶𝑾) + (−𝟎. 𝟔𝟔𝟑 × 𝑬𝒅𝒖𝑴𝑶𝑫)
Where: the applicable indication of each of the below variable definitions can be substituted
LocUrb - Urban EduLow – Low Education EduMod- Moderate Education
Chapter Summary and Conclusions
This chapter presented the procedures employed during the construction and validation of the six
indicators for the measurement of the South African public understanding of science (SAPUS). The
discussion extends from chapter four and five and introduces the indicators produced.
The results reveal that while a large share of South Africans demonstrate a moderate to high level of
scientific knowledge, an equally large proportion of respondents displayed a lower level of scientific
knowledge within the index. This may be attributable to levels of education and related
socioeconomic factors that influence educational attainment, informedness and access to
information sources.
South Africans generally present positive attitudes to science. A marginal share of the sample was
found to hold more negative attitudes than positive attitudes; this is not unexpected and in certain
respects a healthy sign of a population aware of risks and simultaneously supportive of the scientific
enterprise. As noted in Chapter Six, a large proportion of respondents demonstrated a degree of
Stellenbosch University https://scholar.sun.ac.za

340
attitudinal ambivalence while remains of concern, due to its influence on the strength and direction
of national attitudes to science in the long term.
South Africans appear interested in science, though the level of interest does vary greatly between
demographic sub-samples. Among the total sample, 67.3% indicated a moderate to high interest in
science while 32.7% indicated a low interest, however an interest none-the-less (n = 2 640). Within
Chapter Seven it was revealed that 44.4% of the total sample (3 486) indicated no interest in science,
which has been shown to significantly impact overall levels of knowledge, informedness and
engagement activities.
Within the Index of Informedness about Science South Africans report equal levels of informedness
across the three response categories. While 33.7% of respondents report a high level of
informedness and 33.4% indicate a moderate informedness, 32.8% still report that they do not feel
very well informed about science. Informedness appears to lag interest in South Africa where levels
of interest in science is somewhat higher than reported levels of informedness, for the same items
and scientific areas. This remains an intriguing finding within these results.
Within an assessment of the count of information channels accessed as well as the frequency of
encountering scientific information within those channels, the science information immersion index
demonstrated that two-thirds of South Africans have a higher scientific information immersion than
the balance of the sample. It remains critical to frame this outcome with issues related to
affordability and access to service infrastructure. An assessment of information access and service
infrastructure, particularly within rural South Africa remains an important aspect that would further
contribute to the outputs of this index.
A key finding of the study is that despite the recorded levels of knowledge, informedness and
reported interest in science, the majority of South Africans do not attend science engagement
activities. The largest proportion of respondents recorded low science engagement scores, while the
overwhelming majority of all respondents reported no engagement within the preceding 12 month
period. While engagement is highly related to access, affordability and relative proximity to
engagement locations, the broadening of the science engagement programme from both public and
private sources remains a clear area of significant improvement.
The outcomes of the indicator-set combined with a selection of demographic variable inputs allowed
for a general segmentation of respondents within this dataset, in terms of the overall public
understanding of science (PUS) behaviour. Four categories of the general public were created within
this segmentation, profiling those most likely to appear within each segment. The segmentation
Stellenbosch University https://scholar.sun.ac.za

341
model represents a proposal toward greater refinement of such segmentation techniques within the
PUS research area. It is hoped that such techniques will provide guidance and improvement to
implement targeted communications and platforms that speak to the segments of society in most
critical need of access and interactions with scientific areas.
The predictors of performance on each indicator were assessed using multinomial logistic regression
within IBM-SPSS toward developing an understanding of the main demographic variables that
influence outcomes on each index. Table 11.37 presents the results for each indicator. The influence
of race remains a major predictor of performance most all of the indicators developed. There can be
no doubt that this influence is interacting and may in fact be moderated by selected other
demographic variables, such as income, employment and education, which compounds the impact
and influence of the race variable within these indicators.
Predictor Science
Knowledge Index
Attitudes to Science
Index
Interest in Science Index
Informedness in Science
Index
Information Immersion
Science Index
Science Engagement
Index
Race group
Educational attainment
Household Income
Geographic location (rural / urban)
Age group
Employment status
Table 11.37: Summary of predictors on each indicator
Educational attainment is a significant predictor in all indices, except the attitudinal index.
Respondents demonstrating higher education performed increasingly well within each indicator set,
clearly noting the value and importance of this variable in predicting outcomes on each index.
Household income was found to be significant as far as knowledge of science and informedness
about science is concerned. The relationships between scientific knowledge, interest, informedness,
income, education and employment are noted and across this report has demonstrated significant
influence on the outputs presented. This was similarly observed where it was found that
employment and level of informedness about science was significantly associated.
Rural - urban geographic location was also found to be a significant predictor for interest in science,
informedness about science, information immersion and science engagement. The geographic
availability of services and infrastructure remains a developmental challenge within contemporary
South Africa. While great strides have been made toward closing the developmental divide between
Stellenbosch University https://scholar.sun.ac.za

342
rural and urban populations, there remains some distance to go toward achieving parity across
geographic location sub-samples. As a result of this, location continues to be a significant predictor
on SAPUS indices as they influence numerous measurement areas due to the mentioned factors.
Respondent age classification was also found to be significantly associated with level of scientific
informedness and degree of information immersion. This may relate to an increasingly diverse array
of information sources among younger age classification, compared to more senior respondents.
Similarly this outcome may also point to affordability and ease of access within selected
demographic groups that demonstrates the significant influence of age classification on information
seeking behaviour and reported level of informedness among South Africans.
During the development of indicators for the measurement of the public understanding of science in
South Africa, significant evidence was presented toward the identification of viable demographic
predictor variables with respect to performance outcomes on each of the six (6) indicators
produced. However, as noted in Chapter Four, the multiple determinants involved in the formation
of beliefs, attitudes and values that impact on human behaviour in the social context are often
complex (Gorsuch; 1969) and beyond the scope of this research. A logical next phase of such
research would be to understand the antecedents of the acquisition of knowledge, the formation of
attitude, interest and informedness as well as interaction with information sources and engagement
activities and how these influence the public understanding of science. The interactions of the
identified demographic predictor variables in the South African context introduces further
complexity to a proposed dynamic explanatory model of the domestic public understanding of
science. As noted by Rokeach (1968) the formation of attitudes (in particular) are not one
dimensional, but as a result of interacting multidimensional determinants. This research has
identified the variables and statistical relationships that best serve as predictors in statistical models
of the South African public understanding of science. However, a theory explaining the formation of
attitudinal and related structures, both physical and affective is still required to understand the
complex interaction between knowledge, attitude, interest, informedness, information seeking and
engagement behaviours. While these variables and predictors may serve to inform models that
predict outcomes on indices, a theoretical formulation is none-the-less still required to explain these
interactions within a multi-layered social context. Much work is however still required to understand
these interactions prior to the development of such an explanatory theoretical model of the South
African public understanding of science.
A summary of the results of the above discussion as well as the outputs coming out of the
multinomial logistic regression is presented in image 11.2 below. Within each of the six SAPUS
Stellenbosch University https://scholar.sun.ac.za

343
elements, and the respective survey questionnaire items, the factors that best predict the outcomes
for each indicator are highlighted. Important to note remains the interacting system of demographic
predictors driving scores on SAPUS indicators.
Image 11.2: Predictors of SAPUS indicators within South Africa
The development of explanatory models of predictors of performance for each indicator remains a
key development within this study as it lays a foundation for further exploration into the main
drivers influencing the South Africa public understanding of science. The results paint a picture of a
South African public highly interested, but not as informed as they feel they should be. An
Stellenbosch University https://scholar.sun.ac.za

344
assessment of scientific knowledge further confirms a lower level of overall scientific knowledge
among the general public. While attitudes to science remain generally positive, the degree of
attitudinal ambivalence is of concern and further investigation in this area would be required.
Overall the level of engagement remains very low among South Africans. Any increases as far as
science engagement is concerned would be an organic extension of increased knowledge, interest
and reported informedness. A deeper understanding of drivers of attendance at these activities
among urban respondents would assist in understanding engagement behaviour antecedents in the
future. However, beyond this access and infrastructure remains a key area that may be influencing
rural respondents’ propensities to attend such science engagement activities.
Stellenbosch University https://scholar.sun.ac.za

345
Chapter Twelve
Summary, Recommendations and Conclusions
"The role of scientific knowledge is to ensure that decisions are made based on fact and knowledge rather than belief, myth and superstition."
Nelson Mandela (13 July 2003)
This chapter presents a summary of the main stages of development, implementation and key
findings of the study. The limitations and recommendations for future research are also presented.
12.1 Science in South Africa
The study was conducted in 2015, coinciding with the 21st commemoration of the first democratic
elections in South Africa. Within the interceding period, much progress has been made in supporting
equality and furthering the cause for basic human rights across South Africa. However, despite the
mammoth success achieved as a nation, South Africa still faces an uncertain future as it starts to deal
with the multitude of challenges confronting its development, governance and economic growth
prospects into the 21st century. Vital to meeting these challenges are solutions seated within the
sphere of science and technology, that are seen as critical success factors toward accelerating
growth, development and social cohesion. Despite this, concern still looms over the suitability of
adopting technological innovations within a society that struggles to provide access and
infrastructure to satisfy the minimal requirements of a population eager to engage and employ
technology toward an enhanced social and economic landscape. While science and technology may
well be the best suited mechanism toward bridging the economic divide, the development of a
citizenry suitably skilled and equipped to meet the challenges of this new era remains of greater
concern on this path toward a truly equal South Africa.
Science and technology (S&T) has had a chequered past and political association within South Africa.
While great strides have been made in accelerating development and industry during the 19th and
20th century, much of the progress achieved have only benefitted a minority within the (then)
racially segregated population. As a result of race politics, imperial ambition, conflict and the
struggle for liberation, science in South Africa has shared an uneasy relationship with the general
public. As noted in Chapter One, the history and context of science within the South African setting
cannot be separated from the apartheid past, despite (the likelihood of) the best intentions of many
practitioners within this early period. In many respects this initial era, irrespective of its
uncomfortable past and interconnections with the government of the time, made significant
advances toward establishing some of the premier scientific societies and institutions, many of
Stellenbosch University https://scholar.sun.ac.za

346
which are still active at the national level within contemporary South Africa. These foundations have
laid the groundwork for the national science system and it remains valuable and appropriate to
acknowledge these early efforts within a present-day South African national system of innovation.
South Africa is a heterogeneous society, with numerous cultures, languages, religions, traditions and
belief systems that give rise to a population unique in its national identity, but diverse in its parts.
While much of this diversity is related to the cultural facets alluded to earlier, many social parallels
coexist as a result of the legacy impacts of apartheid that influence development, access to basic
services and education. Consequently, this leads to the notion of a segmented public which is best
considered as multiple publics, than as a homogenous collective. This by no means speaks to issues
of national identity, patriotism or social cohesion, though the latter has been challenged in the
recent past144. What the point does concern however, relates to the notion of a South African
society still emerging from the legacy influence of separated development under apartheid, where
inequality, income, access to resources, services and education still negatively impact the larger
share of the population. This inequality within contemporary South Africa will tremendously
influence the country’s ability to meet its set developmental goals toward effectively addressing
imbalances that permeate all levels of society. The preamble of the South African constitution
contains the passage [to] improve the quality of life of all citizens and free the potential of each
person – however, 20 years following the adoption of this document, as a country we still face
challenges toward achieving this goal. To bridge the developmental divide, science and technology
has a significant role to play in addressing many of these social and developmental challenges. The
ultimate socio-economic objective of such programmes must be to build communities and societies,
rich in education and releasing the potential in all citizens to be involved in productive labour and
civically active toward building the South Africa envisioned in this foundational document.
Toward this goal, and seating South Africa’s developmental and social progress within a science and
technology space, the Department of Science and Technology (DST) has formulated numerous policy
documents guiding the expanded programme of the scientific enterprise in this country. The 1996
White Paper on Science and Technology, the 2008 Ten-Year Innovation Plan, the 2012 National
Development Plan and the future dated Science Engagement Policy Framework, have all echoed the
vision of a South Africa rising to the challenge of its past and ensuring equality and prosperity for all
through the adoption of a knowledge economy framework. These documents further go on to
illustrate the potential that science and technology may unleash within the national economy while
providing structure toward implementation of programs to accelerate these objectives. While some
144
Issues of race relations on social media, political contestation and access to education are key events in 2015
Stellenbosch University https://scholar.sun.ac.za

347
of these strategic directives have been operationalised, many well-intended programs remain
dormant and must be actioned toward advancing the needs of the people of this country.
Within the current knowledge economy context and changing modes of economic production, there
remains a looming crisis of a lack of an adequately skilled science and technology workforce.
Moreover the importance of a suitably skilled citizenry, able to meaningfully engage within this
changing domestic and increasingly globalised productive landscape remains key toward driving
economic and social progress. A citizenry skilled in areas of science and technology is better
positioned to make more informed decisions, politically, economically and in every aspect of their
lives (Laugksch, 1996). Within this context an exploration of the public relationship with science
remains an important contribution toward best facilitating the ambitions of the evolving policy and
social landscape within contemporary South Africa.
There is a greater need to more fully understand the many segments of the South African public.
This remains a national imperative in order to best respond to the many issues impacted by the lack
of a general public understanding of science. By understanding the social envelope of the many
segments of the South African public, this study has aimed to develop a comprehensive assessment
of the numerous interrelated factors that influence the general public understanding and
engagement with science. We believe that the finding will allow for the development of strategies
that address segments of the populations neglected within this space. A comprehensive assessment
of the South African public understanding of science would facilitate targeted communications and
educational advancement that would best respond to the social and developmental challenges
discussed within this document. The impacts of demographic variables that in many respects
segment the public on educational attainment, income, employment and other factors remains a
salient consideration toward meaningfully addressing these challenges. As such this study aimed to
measure the general public understanding of science in South Africa through a public relationship
with science framework suggested by Reddy et al (2009). This approach takes into account science
literacy; attitudes; interest; informdness; information sources and engagement activities through the
diverse social context of the many South African publicS.
12.2 Research Design and Data Collection
To inform this research, Chapter Two and Chapter Three of the thesis presents an extensive review
of the literature that forms the foundation of this study. A detailed historical account of the
theoretical development of the main framework for the measurement of the public understanding of
science is presented, guiding the reader from the early period of scientific literacy through to the
public understanding of science and the science and society research paradigms. While there has
Stellenbosch University https://scholar.sun.ac.za

348
been much debate as to the theoretical advancement and its influence on measurement practice,
Bauer et al (2007) notes that “none of the preceding approaches supersedes the other, but continue
to inform enquiry, thereby liberating and expanding the research agenda”.
The work of Miller (1987, 2004) has informed numerous surveys on scientific literacy and the public
understanding of science. As such, this research adopted the foundations of these forerunners,
within the design and conceptual framework of this study. Beyond the early work within the
scientific literacy paradigm, concerned predominantly with knowledge of scientific methods and
facts – the evolution of this field quickly became interested in elements of the public understanding
of science related to attitudes and similar influences. As discussed in chapters three and four, the
current study defined the South African public understanding of science to comprise of a minimum
of six elements that include: scientific knowledge; attitudes to science; interest; informedness;
sources of science information and science engagement activities.
The individual as the basic unit of the public is seen through an ecological systems theory model
wherein different levels of the social environment interact and influence the individual, and their
ability to engage within areas of science in meaningful ways.
Image 12.1: The 6 elements of the South African public understating of science (SAPUS) in the social context
This model informed the research design and instrument construction in a manner that seeks to
understand the various elements contributing to the South African public relationship with science.
Stellenbosch University https://scholar.sun.ac.za
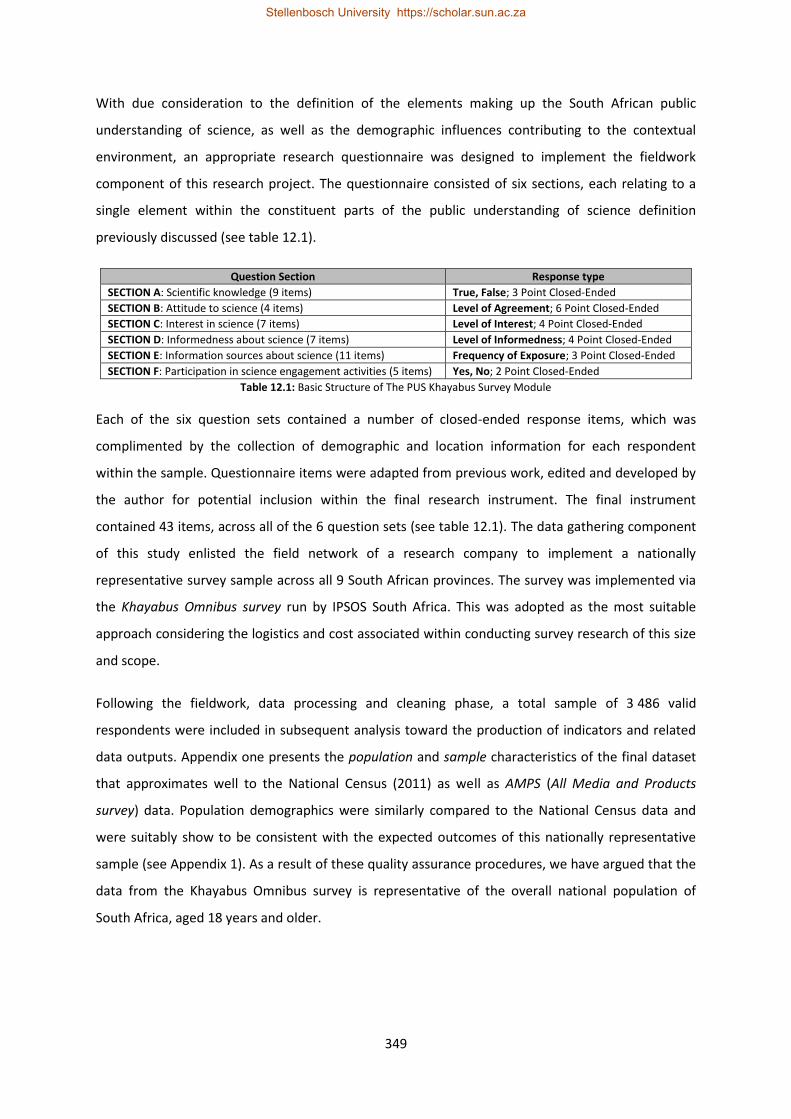
349
With due consideration to the definition of the elements making up the South African public
understanding of science, as well as the demographic influences contributing to the contextual
environment, an appropriate research questionnaire was designed to implement the fieldwork
component of this research project. The questionnaire consisted of six sections, each relating to a
single element within the constituent parts of the public understanding of science definition
previously discussed (see table 12.1).
Question Section Response type
SECTION A: Scientific knowledge (9 items) True, False; 3 Point Closed-Ended
SECTION B: Attitude to science (4 items) Level of Agreement; 6 Point Closed-Ended
SECTION C: Interest in science (7 items) Level of Interest; 4 Point Closed-Ended
SECTION D: Informedness about science (7 items) Level of Informedness; 4 Point Closed-Ended
SECTION E: Information sources about science (11 items) Frequency of Exposure; 3 Point Closed-Ended
SECTION F: Participation in science engagement activities (5 items) Yes, No; 2 Point Closed-Ended
Table 12.1: Basic Structure of The PUS Khayabus Survey Module
Each of the six question sets contained a number of closed-ended response items, which was
complimented by the collection of demographic and location information for each respondent
within the sample. Questionnaire items were adapted from previous work, edited and developed by
the author for potential inclusion within the final research instrument. The final instrument
contained 43 items, across all of the 6 question sets (see table 12.1). The data gathering component
of this study enlisted the field network of a research company to implement a nationally
representative survey sample across all 9 South African provinces. The survey was implemented via
the Khayabus Omnibus survey run by IPSOS South Africa. This was adopted as the most suitable
approach considering the logistics and cost associated within conducting survey research of this size
and scope.
Following the fieldwork, data processing and cleaning phase, a total sample of 3 486 valid
respondents were included in subsequent analysis toward the production of indicators and related
data outputs. Appendix one presents the population and sample characteristics of the final dataset
that approximates well to the National Census (2011) as well as AMPS (All Media and Products
survey) data. Population demographics were similarly compared to the National Census data and
were suitably show to be consistent with the expected outcomes of this nationally representative
sample (see Appendix 1). As a result of these quality assurance procedures, we have argued that the
data from the Khayabus Omnibus survey is representative of the overall national population of
South Africa, aged 18 years and older.
Stellenbosch University https://scholar.sun.ac.za

350
12.3 Key Outcomes and Recommendations
The purpose of this study was to a) identify a set of indicators to measure the South African public
understanding of science and b) to understand which demographic variables may best serve as
predictors to the performance of South Africans on each of the indicators developed.
We now return to a concluding discussion of the research hypotheses presented in the first chapter
of the thesis.
Hypothesis 1a: South Africans are likely to record low scores on an index of scientific knowledge
From our review of South African studies on scientific knowledge (or by extension “scientific
literacy”) in Chapter Three, it transpired that most studies found South Africans typically answered
fewer scientific knowledge items correctly than their international counterparts (Pouris, 1991, 1993;
FRD, 1995; Laugksch, 1996; Blankley and Arnold, 2001; Reddy et al, 2010).
Laugksch reported that the overall scientific literacy rate as measured by his Test for Basic Scientific
Literacy in 1995 was 36% (Laugksch, 1996). The Foundation for Research Development (FRD) study
of 1996, for example, found that on average South Africans answered only about 5 out of the 12
questions in the item set correctly. On a ranking of 20 international studies, employing a similar
question set, South Africa was ranked 18th out of the 20 countries. Blankley and Arnold reported, in
2001 that across five items assessing South Africans factual knowledge of science, only 50% were
able to provide correct responses, compared to 70% within a comparable American sample (using
the same items). Similarly, results from within the 2010 HSRC - South African Social Attitudes Survey
(SASAS), report that 53.0% of South Africans were able to provide correct responses to 6 scientific
knowledge items.
Based on the results of these studies, we formulated the hypothesis that South Africans are typically
not very knowledgeable about science. This study essentially confirms this hypothesis. Based on the
index of scientific knowledge that we constructed (Chapter Five), slightly more than one third of the
respondents (35.7%) were found to have high levels of scientific knowledge, but 27.3% and 37.0%
respectively were found to have only moderate and low levels of scientific knowledge.
At the item level, this is demonstrated by the fact that large proportions of the total sample (more
than 40%) got three items wrong. Conversely, only a single item was correctly answered by 50% of
the sample (In the majority of cases, HIV causes AIDS in humans–67.4%).
Stellenbosch University https://scholar.sun.ac.za

351
Scientifically Correct
Scientifically Incorrect
D/K
2 Lightning never strikes the same place twice 32.7% 45.2% 22.1%
6 Schizophrenia is the same as Multiple Personality disorder 24.4% 42.0% 33.6%
5 The price of petrol in South Africa is NOT influenced by the price of crude oil 35.5% 40.8% 23.7%
9 The main purpose of the Square Kilometre Array (SKA) radio telescope is to search for extra-terrestrial life 28.4% 34.3% 37.3%
8 The earth's climate has NOT changed over millions of years 41.7% 33.8% 24.5%
7 The father carries the genetic material that will determine if a baby is a boy or a girl 46.6% 33.2% 20.3%
3 South Africa was the first nation in the world to voluntarily dismantle its nuclear weapons 39.5% 27.3% 33.2%
4 The continents which we live on are continually moving due to forces deep within the Earth 46.2% 24.9% 28.9%
1 In the majority of cases, HIV causes AIDS in humans 67.4% 18.7% 13.9%
Table 12.2: Survey Results: Science Knowledge items (Khayabus, Wave 2, 2015)
Hypothesis 1b: South Africans of different demographic categories (race, education, income) are
likely to record different levels of knowledgeability about science
As we have argued in this thesis, knowledge of science varies by demographic variable. Given the
huge inequalities and disparities between sub-groups in the South African population, one would
expect that belonging to a specific race group, having a certain level of education, living in an urban
or rural area, earning high as opposed to low income would be associated with different degrees of
knowledgeability about science.
Chapter Three reviewed many of the studies conducted in South Africa and provided detailed insight
into the variation in responses to scientific knowledge items, by demographic classifications.
Laugksch (1996) commented on the difference between respondents of different races where
approximately 50% of white and Indian students were classified as scientifically literate, while only
25% of coloured students and 10% of black students were classified as scientifically literate. Similarly
the 1996 FRD study reported that males generally scored higher than females; while it was further
noted that a relationship between age, education level and access to media sources increased scores
on these questions. Reddy et al, in the SASAS 2010 data record that correct response on knowledge
questions increase as level of household income increases.
As a result of the findings of these earlier studies, the hypothesis was formulated, that South
Africans would differ in recorded levels of knowledgeability, by demographic classification. This
hypothesis was validated in the results of the science knowledge index where variations were
recorded for respondents from different demographic groups (see table 12.3). Results at item-level
reflect similar patterns across different demographics.
Stellenbosch University https://scholar.sun.ac.za

352
LOW SCIENTIFIC
KNOWLEDGE
MODERATE SCIENTIFIC
KNOWLEDGE
HIGH SCIENTIFIC
KNOWLEDGE N
Asymptotic Significance
(2-sided) Pearson's R
NATIONAL 37.0% 27.3% 35.7% 3 486
RACE N = 3 188 RACE
BLACK 39.6% 27.3% 33.1% 2 273
p < 0.001 -0.039 WHITE 24.3% 26.7% 49.0% 404
INDIAN / ASIAN 38.6% 15.8% 45.6% 114
COLOURED 34.3% 31.2% 34.5% 397
HOUSEHOLD INCOME N = 2 042 HOUSEHOLD INCOME
LOW 43.2% 24.9% 31.9% 1 432
p < 0.001 0.175 MODERATE 27.5% 28.5% 44.0% 466
HIGH 18.8% 28.5% 52.8% 144
EDUCATION N = 3 188 EDUCATION
PRE-MATRIC 44.1% 24.0% 31.9% 1 197
p < 0.001 0.124 MATRIC COMPLETED 34.6% 30.4% 35.1% 1 476
POST-MATRIC 27.4% 26.2% 46.4% 515
Table 12.3: Survey Results: Science Knowledge Index by selected demographics
The outputs of the multinomial logistic regression analysis similarly revealed that the best predictors
of outcomes on the science knowledge index were respondent race classification; household income
and educational attainment level. These results show that respondents with lower household income
levels were only 31.2% as likely as those from high income household to score high on the scientific
knowledge index. Similarly, respondents with a pre-matric educational attainment level were only
58.2% as likely as those with post-matric education to appear in the moderate scientific knowledge
group, when compared to the low scientific knowledge group.
Likelihood Ratio Tests
Effect
Model Fitting
Criteria Likelihood Ratio Tests
-2 Log Likelihood
of Reduced Model Chi-Square df Sig.
Intercept 1829.512 .000 0 .
RACE 1842.536 13.024 6 .043
EDUCATIONAL ATTAINMENT 1849.143 19.631 4 .001
HOUSEHOLD INCOME 1860.721 31.209 4 .000
Table 12.4: Multinomial logistic regression result: Predictors of outcomes on Science Knowledge Index
Hypothesis 2a: South Africans are more likely to hold positive than negative attitudes towards
science
Blankley and Arnold (2001) had measured South Africans’ attitudes to science using the Index of
Scientific Promise and Reservation. The results of their investigations revealed that, while
respondents did show some reservation with regards to certain aspects of science, in general South
Africans had demonstrated a generally positive attitude to science (Index ratio: 1.28). This compared
favourably with international studies, ranking South Africa 4th, behind Italy (1.28); Canada (1.29) and
Stellenbosch University https://scholar.sun.ac.za

353
the USA (1.89). In his 2001 study, Pouris reports that respondents generally indicated strong
agreements to statements of scientific promise (greater than 70%) while an average of 63% of
respondents agreed with the scientific reservation statements. In the 2010 SASAS survey, the HSRC
reports that South Africans continue to display more positive than negative attitudes to science.
Comparison of the output of the Promise/Reservation Index with international surveys shows that
South Africa obtained an index ratio of 1.20; India was 0.80; while the USA achieved a ratio of 1.70.
The results of the 2013 SASAS survey module on the public understanding of science similarly
reports greater positive attitudes to science among South Africans (see Chapter Three).
Based on the findings of these studies and numerous empirical research reports on attitudes to
science in South Africa, this research formulated the hypothesis that South Africans are more likely
to hold positive than negative attitudes towards science. This hypothesis is supported by the findings
of this study. At the item level, an average of 58.2% of respondents agreed with scientific reservation
items, while 70.3% of the sample agreed with scientific promise items.
Chart 12.1: Survey Results: Attitude to Science items (Khayabus, Wave 2, 2015)
Similarly, the outcome of the index of scientific promise and reservation produced a ratio of 1.21 for
the current study, again affirming the hypothesis that South Africans hold more positive than
negative attitudes to science. Finally, within the index of attitudes to science, a larger proportion of
respondents were classified as having a positive attitude to science (44.1%) when compared to those
recording negative attitudes (19.4%).
Stellenbosch University https://scholar.sun.ac.za

354
Chart 12.2: Index outcome: Attitude to Science
Hypothesis 2b: South Africans of different demographic categories are likely to differ in their
attitudes towards science
Previous South African empirical studies about attitudes to science have highlighted the association
between such attitudes and different demographic variables. Pouris (1993) found that respondent
language group showed some association with attitude to science. English speaking respondents,
most frequently expressed a lower positive attitude toward science, while black respondents
reported being more optimistic about science and its impact on daily life. The FRD (1996) study
highlighted similar patterns of demographic variation in attitudes to science. In that study, males
(68%) generally indicated a marginally more positive appreciation of science compared to females
(64%), while Indians showed more positive attitudes (94%) compared to white (93%), coloured (61%)
and black respondents (59%).
In 2010 Reddy et al reported disaggregated attitudinal data from within the SASAS survey by
educational level, age and gender. They report that there were no striking variations for attitudes to
science with respect to gender; however age was shown to demonstrate a significant relationship
with attitudes toward science. Younger participants (16-19 years old) showed a greater sense of
scientific promise and consequently more positive attitudes toward science compared to older age
groups. Similarly, as educational level increased so too do positive attitudes to science and a greater
sense of scientific promise, compared to respondents reporting lower academic attainment levels.
These results were again reflected in the SASAS 2013 data, where age, educational attainment level
and LSM (living standard measure) were shown to have a significant relationship with measures of
attitudes to science.
19.4
36.5
44.1
0
5
10
15
20
25
30
35
40
45
50
NEGATIVE ATTITUDE (-1) AMBIVALENT ATTITUDE (0) POSITIVE ATTITUDE (+1)
Stellenbosch University https://scholar.sun.ac.za
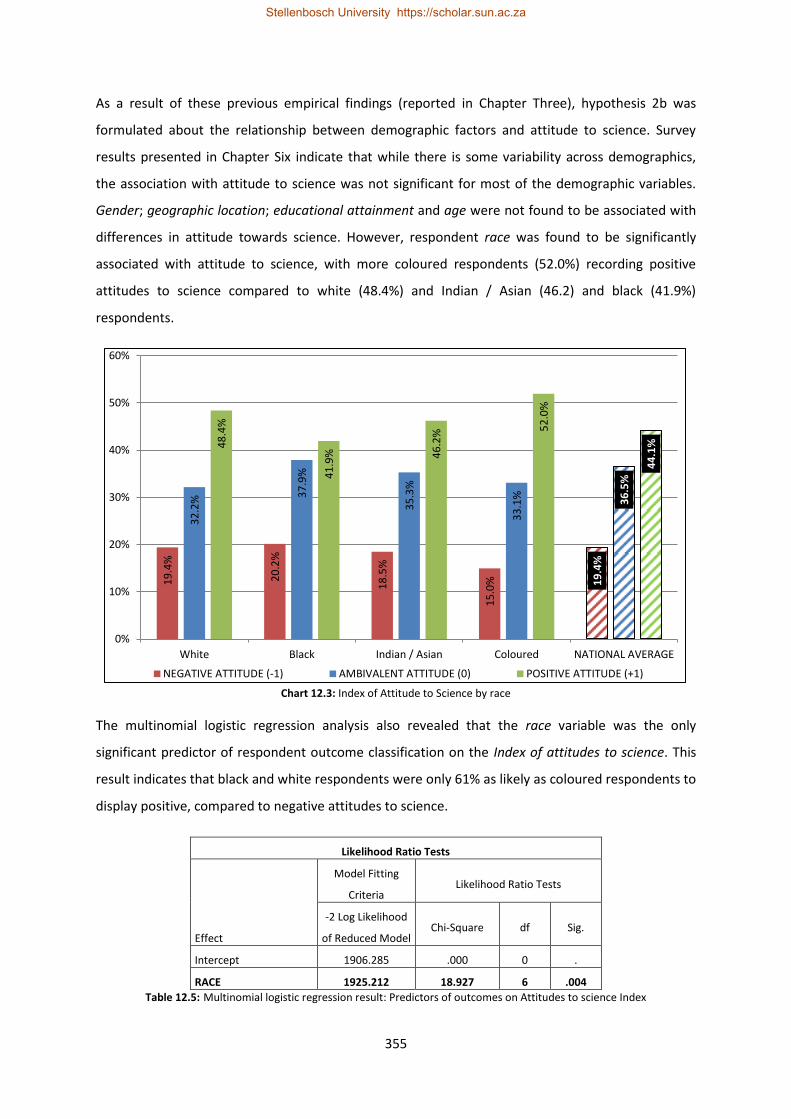
355
As a result of these previous empirical findings (reported in Chapter Three), hypothesis 2b was
formulated about the relationship between demographic factors and attitude to science. Survey
results presented in Chapter Six indicate that while there is some variability across demographics,
the association with attitude to science was not significant for most of the demographic variables.
Gender; geographic location; educational attainment and age were not found to be associated with
differences in attitude towards science. However, respondent race was found to be significantly
associated with attitude to science, with more coloured respondents (52.0%) recording positive
attitudes to science compared to white (48.4%) and Indian / Asian (46.2) and black (41.9%)
respondents.
Chart 12.3: Index of Attitude to Science by race
The multinomial logistic regression analysis also revealed that the race variable was the only
significant predictor of respondent outcome classification on the Index of attitudes to science. This
result indicates that black and white respondents were only 61% as likely as coloured respondents to
display positive, compared to negative attitudes to science.
Likelihood Ratio Tests
Effect
Model Fitting
Criteria Likelihood Ratio Tests
-2 Log Likelihood
of Reduced Model Chi-Square df Sig.
Intercept 1906.285 .000 0 .
RACE 1925.212 18.927 6 .004
Table 12.5: Multinomial logistic regression result: Predictors of outcomes on Attitudes to science Index
19
.4%
20
.2%
18
.5%
15
.0%
19
.4%
32
.2%
37
.9%
35
.3%
33
.1%
36
.5%
48
.4%
41
.9%
46
.2%
52
.0%
44
.1%
0%
10%
20%
30%
40%
50%
60%
White Black Indian / Asian Coloured NATIONAL AVERAGE
NEGATIVE ATTITUDE (-1) AMBIVALENT ATTITUDE (0) POSITIVE ATTITUDE (+1)
Stellenbosch University https://scholar.sun.ac.za
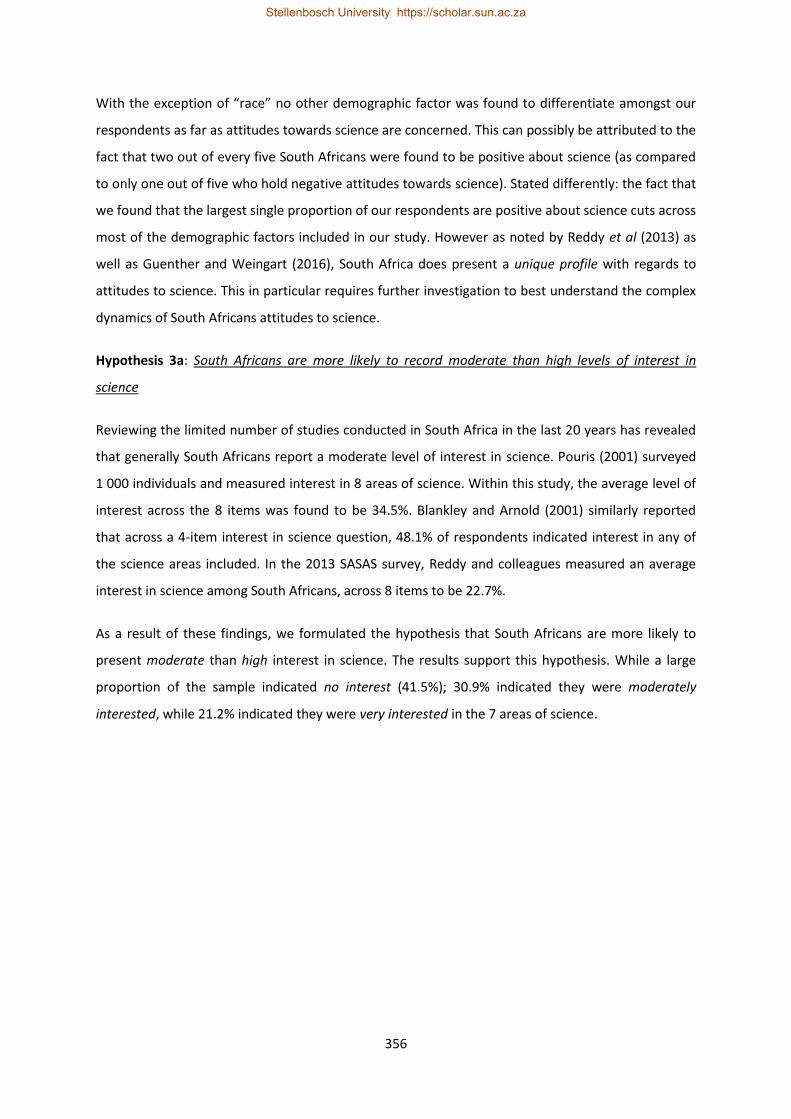
356
With the exception of “race” no other demographic factor was found to differentiate amongst our
respondents as far as attitudes towards science are concerned. This can possibly be attributed to the
fact that two out of every five South Africans were found to be positive about science (as compared
to only one out of five who hold negative attitudes towards science). Stated differently: the fact that
we found that the largest single proportion of our respondents are positive about science cuts across
most of the demographic factors included in our study. However as noted by Reddy et al (2013) as
well as Guenther and Weingart (2016), South Africa does present a unique profile with regards to
attitudes to science. This in particular requires further investigation to best understand the complex
dynamics of South Africans attitudes to science.
Hypothesis 3a: South Africans are more likely to record moderate than high levels of interest in
science
Reviewing the limited number of studies conducted in South Africa in the last 20 years has revealed
that generally South Africans report a moderate level of interest in science. Pouris (2001) surveyed
1 000 individuals and measured interest in 8 areas of science. Within this study, the average level of
interest across the 8 items was found to be 34.5%. Blankley and Arnold (2001) similarly reported
that across a 4-item interest in science question, 48.1% of respondents indicated interest in any of
the science areas included. In the 2013 SASAS survey, Reddy and colleagues measured an average
interest in science among South Africans, across 8 items to be 22.7%.
As a result of these findings, we formulated the hypothesis that South Africans are more likely to
present moderate than high interest in science. The results support this hypothesis. While a large
proportion of the sample indicated no interest (41.5%); 30.9% indicated they were moderately
interested, while 21.2% indicated they were very interested in the 7 areas of science.
Stellenbosch University https://scholar.sun.ac.za

357
Chart 12.4: Survey Results: Interest in Science items (Khayabus, Wave 2, 2015)
With response for no interest removed (chart 12.4), at the item level, more items recorded a
moderately interested response, rather than a very interested response. With the exception of the
items relating to technology and the internet as well as medical science, in every other item, the
response within the moderately interested category was more than 10% higher than within the very
interested option.
Hypothesis 3b: South Africans of different demographic categories are likely to differ in their levels of
interest in science
Previous scholarship notes that Interest in science presents some variation as a result of various
demographic factors. Blankley and Arnold (2001) report that while the average interest within their
sample was 48.1%, this was highest among black respondents (49.3%); followed by white (47.9%);
coloured (42.0%) and Indian / Asian (40.3%) respondents. Pouris (2001) reported gender-based
variations for interest in science, where across 8-items, males (39.4%) reported higher interest in the
8 scientific areas compared to females (30.8%). Reddy et al (2013) report that younger respondents
reported higher interest across 8 science-interest items, compared to older respondents, while those
within higher education and LSM groups similarly reported higher interest in science.
The hypothesis above was validated within the results that found South Africans did differ on the
interest in science measure across three demographics.
24
.0%
24
.2%
17
.7%
23
.0%
31
.3%
24
.7%
13
.2%
35
.9%
35
.0%
34
.3%
33
.8%
33
.3%
31
.7%
26
.9%
0%
5%
10%
15%
20%
25%
30%
35%
40%
Climate Change Economics Politics Energy Technologyand theInternet
MedicalScience
Astronomy
Very Interested Moderately Interested
Stellenbosch University https://scholar.sun.ac.za

358
LOW INTEREST
MODERATE INTEREST
HIGH INTEREST
N
Asymptotic Significance
(2-sided) Pearson's R
NATIONAL 32.7% 34.9% 32.4% 2 640
RACE N = 2 640 RACE
BLACK 31.4% 34.7% 33.8% 1 934
p < 0.01 -0.133 WHITE 28.8% 32.6% 38.6% 337
INDIAN / ASIAN 16.7% 47.2% 36.1% 72
COLOURED 49.2% 35.4% 15.5% 297
GEOGRAPHIC LOCATION N = 2 640 GEOGRAPHIC LOCATION
URBAN 31.5% 33.5% 35.0% 1 824 p < 0.01 -0.071
RURAL 35.4% 38.0% 26.6% 816
EDUCATION N = 2 640 EDUCATION
PRE-MATRIC 40.1% 34.7% 25.2% 926
p < 0.01 0.153 MATRIC COMPLETED 30.4% 36.3% 33.3% 1 252
POST-MATRIC 24.0% 31.6% 44.4% 462
Table 12.5: Survey Results: Interest in science Index by selected demographics
Variations in recorded level of interest by race, geographic location and educational attainment level
were shown to be statistically significant (see table 12.5). Coloured respondents; those who live in
the rural areas and those with pre-matric education, recorded significantly lower levels of interest in
science when compared to other categories within each demographic. Results at item-level reflect
similar patterns for demographic classifications and were reported in detail within Chapter Seven.
The outputs of the multinomial logistic regression analysis presents further confirmatory results in
identifying race, geographic location and educational attainment level as the best predictors of
outcomes on the interest in science index.
Likelihood Ratio Tests
Effect
Model Fitting
Criteria Likelihood Ratio Tests
-2 Log Likelihood
of Reduced
Model
Chi-Square df Sig.
Intercept 1675.958 .000 0 .
GEOGRAPHIC LOCATION 1687.602 11.643 2 .003
EDUCATIONAL ATTAINMENT 1710.237 34.279 4 .000
RACE 1702.917 26.959 6 .000
Table 12.7: Multinomial logistic regression result: Predictors of outcomes on interest in science Index
The regression results show that respondents with pre-matric education are only 61% as likely as
those with a post-matric education to appear in the moderate interest category, compared to the
low interest category. Similarly, urban respondents are 1.5 times more likely to appear in the high
interest group than rural respondents, when compared to the low interest group. As a result of the
low overall interest in science within the coloured sub-sample, all other race classifications were
Stellenbosch University https://scholar.sun.ac.za

359
found to be 3 times more likely than coloured respondents to appear in the high interest compared
to the low interest outcome. This was highest among Indian / Asian (3.74); followed by white (3.28)
and then black (3.14) respondents
Hypothesis 4a: South Africans are more likely to record low than high levels of informedness about
science
From the literature review it emerged that South Africans generally report not being well-informed
about areas of science. Pouris (2001) included 8 areas of science and asked respondents to indicate
their level of informedness for each item. While there was significant variation in level of
informedness within each item, the average level of informedness across the 8 items was 18.6%.
Reddy et al (2013) similarly report that in the 2013 SASAS survey, two-thirds of South Africans more
often reported not being very well informed or not at all informed about science, compared to one
third that reported being well informed.
As a result of the above we formulated the following hypothesis: South Africans are more likely to
record low than high levels of informedness about science. Our survey confirms this hypothesis, as
we found that only 13.7% of respondents said that they are very well informed, while 28.2% and
50.5% report being moderately well informed or not well informed, respectively. These latter two
response categories account for 78.7% of total responses (n = 3 486).
Chart 12.6: Survey Results: Informedness about Science items (Khayabus, Wave 2, 2015)
Confirming the assertion that South Africans are more likely to record low than high levels of
informedness about science, chart 12.6 presents the results at item level, demonstrating the higher
proportion of moderately well informed and not well informed responses, compared to the very well
informed option.
15
.1%
13
.8%
20
.5%
15
.2%
15
.9%
9.0
%
14
.4%
29
.5%
33
.3%
33
.9%
37
.1%
31
.4%
20
.4%
28
.2%
59
.2%
53
.5%
47
.1%
48
.3%
52
.7%
65
.8%
56
.1%
0%
10%
20%
30%
40%
50%
60%
70%
Astronomy MedicalScience
Energy Climate Change Economics Politics Technology andthe Internet
VERY WELL INFORMED MODERATELY WELL INFORMED NOT WELL INFORMED
Stellenbosch University https://scholar.sun.ac.za

360
Hypothesis 4b: South Africans of different demographic classifications are likely to differ in their
levels of informedness about science
Level of informedness is generally a self-assessment by respondents on how well they understand a
particular area of science. While limited empirical work has been done within this particular area,
Pouris (2001) showed that informedness among South Africans did show some variation by
demographic variable. Across 8 areas of science, also included in the interest in science assessment,
an average of 22.1% of males report being very well informed, while only 15.6% of females provided
the same response. Pouris further reports, that younger and more educated respondents record
higher levels of informedness, compared to other respondents.
Based on this, the current study formulated the hypothesis that South Africans of different
demographic classifications are likely to differ in their levels of informedness about science. This
study confirmed this hypothesis, where response variations were recorded for respondents from
different demographic groups (see table 12.8). Results at item-level reflect similar patterns for
demographic classifications and were reported in detail within Chapter Eight and Chapter Eleven of
this thesis. The variables for race, geographic location, educational attainment and respondent age
were statistically associated with the reported level of informedness among the sample.
LOW INFORMEDNESS
MODERATE INFORMEDNESS
HIGH INFORMEDNESS
N
Asymptotic Significance
(2-sided) Pearson's R
NATIONAL 32.8% 33.4% 33.7% 3 346
RACE N = 3 346 RACE
BLACK 33.6% 32.2% 34.3% 2 410
p < 0.001 -0.120 WHITE 21.2% 32.7% 46.1% 401
INDIAN / ASIAN 43.7% 28.6% 27.7% 119
COLOURED 36.5% 43.0% 20.4% 416
GEOGRAPHIC LOCATION N = 3 346 GEOGRAPHIC LOCATION
URBAN 27.9% 34.9% 37.2% 2 232 p < 0.001 -0.146
RURAL 42.6% 30.6% 26.8% 1 114
EDUCATION N = 3 346 EDUCATION
PRE-MATRIC 43.3% 32.3% 24.4% 1 278
p < 0.001 0.229 MATRIC COMPLETED 29.6% 35.1% 35.3% 1 546
POST-MATRIC 16.5% 31.2% 52.3% 522
AGE N = 3 332 AGE
<20 YEARS 34.3% 27.1% 38.6% 166
p < 0.01 -0.050
20-29 YEARS 32.2% 33.3% 34.5% 1 075
30-39 YEARS 31.9% 34.0% 34.1% 913
40-49 YEARS 29.8% 35.4% 34.8% 573
50-59 YEARS 33.0% 33.6% 33.4% 351
60+ YEARS 45.3% 31.5% 23.2% 254
Table 12.8: Survey Results: Informedness about science Index by selected demographics
Stellenbosch University https://scholar.sun.ac.za

361
In particular, white, urban, well-educated and younger respondents recorded higher levels of
informedness about science, compared to respondents within other demographic classifications and
sub-classifications.
Results from the multinomial logistic regression show that the best predictors of respondent
outcome on the index of informedness about science are: race; geographic location; age;
educational attainment; employment status and household income.
Likelihood Ratio Tests
Effect
Model Fitting
Criteria Likelihood Ratio Tests
-2 Log Likelihood
of Reduced Model Chi-Square df Sig.
Intercept 1909.346 .000 0 .
RACE 1952.898 43.552 6 .000
GEOGRAPHIC LOCATION 1935.669 26.323 2 .000
AGE 1927.588 18.242 10 .051
EDUCATION 1958.322 48.976 4 .000
EMPLOYMENT STATUS 1920.439 11.093 4 .026
HOUSEHOLD INCOME 1918.291 8.945 4 .063
Table 12.9: Multinomial logistic regression result: Predictors of outcomes on informedness about science Index
Respondents who live in the urban areas as well as those employed were 1.6 times more likely to be
‘classified’ as belonging to the moderate informedness group than rural respondents, when
compared to the low informedness group. Similarly, white respondents were twice as likely to
appear in the high informedness group as coloured respondents, when compared to the low
informedness group. Younger respondents were three times as likely to appear in the high
informedness group, than older respondents, compared to the low informedness group.
Hypothesis 5a: South Africans overall are more likely to favour “old technologies” (Radio, TV and
Print) compared to “new technology” (online) information sources
Our review of the literature revealed that very few empirical studies in South Africa investigated
sources of scientific information. However, two studies did include questions relating to science
information sources, one in 2001 and another in 2013. Pouris included four science information
source items in his 2001 investigation into Interests, Public Understanding and Sources of [science]
Information in South Africa. In 2001, he reports that the most frequently accessed science
information source was magazines (77%), followed by television (66%); newspapers (57%) and then
Stellenbosch University https://scholar.sun.ac.za
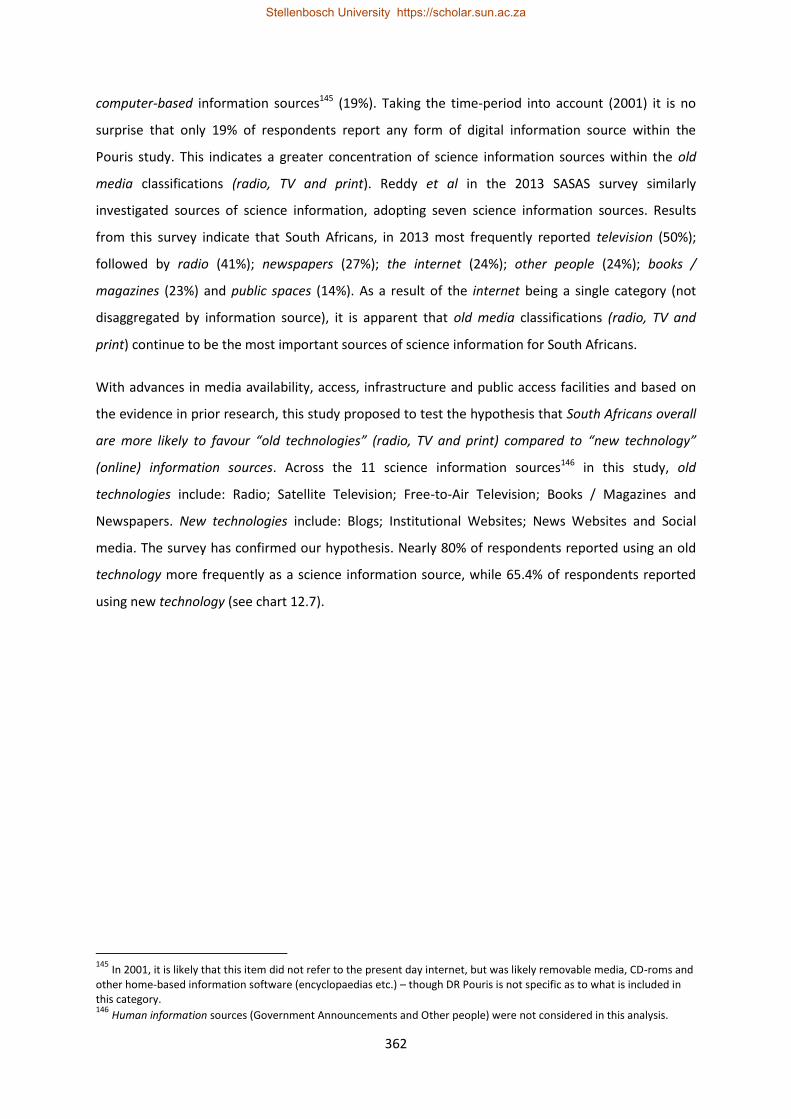
362
computer-based information sources145 (19%). Taking the time-period into account (2001) it is no
surprise that only 19% of respondents report any form of digital information source within the
Pouris study. This indicates a greater concentration of science information sources within the old
media classifications (radio, TV and print). Reddy et al in the 2013 SASAS survey similarly
investigated sources of science information, adopting seven science information sources. Results
from this survey indicate that South Africans, in 2013 most frequently reported television (50%);
followed by radio (41%); newspapers (27%); the internet (24%); other people (24%); books /
magazines (23%) and public spaces (14%). As a result of the internet being a single category (not
disaggregated by information source), it is apparent that old media classifications (radio, TV and
print) continue to be the most important sources of science information for South Africans.
With advances in media availability, access, infrastructure and public access facilities and based on
the evidence in prior research, this study proposed to test the hypothesis that South Africans overall
are more likely to favour “old technologies” (radio, TV and print) compared to “new technology”
(online) information sources. Across the 11 science information sources146 in this study, old
technologies include: Radio; Satellite Television; Free-to-Air Television; Books / Magazines and
Newspapers. New technologies include: Blogs; Institutional Websites; News Websites and Social
media. The survey has confirmed our hypothesis. Nearly 80% of respondents reported using an old
technology more frequently as a science information source, while 65.4% of respondents reported
using new technology (see chart 12.7).
145
In 2001, it is likely that this item did not refer to the present day internet, but was likely removable media, CD-roms and other home-based information software (encyclopaedias etc.) – though DR Pouris is not specific as to what is included in this category. 146
Human information sources (Government Announcements and Other people) were not considered in this analysis.
Stellenbosch University https://scholar.sun.ac.za

363
Chart 12.7: Survey Results: Science information source items (Khayabus, Wave 2, 2015)
At the item-level results (Chapter Nine), it is clear that radio, newspapers and television remain the
most important science information source for the majority of South Africans. While the availability
and access to online material and services is expanding, South Africans currently appear to favour
old technologies, over new technologies as a source of science information.
Hypothesis 5b: South Africans of different demographics are likely to differ as far as their preferred
sources of science information are concerned
The SASAS (2013) survey presented results on the source of science information, disaggregated by
age; education and LSM (living standard measure). Overall, this study reported that younger
respondents access a wider variety of information sources more frequently compared to older
respondents. However, the survey did highlight that radio presented similar usage / access patterns
across all age groups, while print information sources were increasingly reported by older
respondents. Respondents who are better educated reported using a greater number of science
information sources, including books / magazines and the internet. Similarly, respondents within
higher LSM categories reported using a greater number of science information sources, with
television, newspapers and the internet recording the highest selections. Moderate and low LSM
respondents selected television, radio and other people, while those within the low LSM groups
favoured radio.
Based on the above evidence, and similar findings from international studies, we hypothesized that
South Africans of different demographic classifications are likely to differ as far as their preferred
sources of science information are concerned. Again this hypothesis was corroborated by our study.
63.6%
64.3%
65.6%
68.2%
71.6%
75.3%
82.5%
82.8%
86.3%
Blogs
Institutional Websites (University / Research Lab)
News Websites
Social media (Facebook, Twitter)
Satellite Pay Television (DSTV, TopTv)
Books / Magazines
Free-to-Air Television (SABC / E-Tv)
Newspapers
Radio
Stellenbosch University https://scholar.sun.ac.za

364
OVERALL NATIONAL RANKING ORDER
Radio Newspapers
Free-to-Air TV
Other people
N
NATIONAL 86.3% 82.8% 82.5% 78.8% 3 486
Ranking varies within demographic groups
RACE N = 3 486
BLACK 85.9% 81.4% 81.0% 75.9% 2 523
WHITE 92.2% 92.9% 91.2% 93.6% 408
INDIAN / ASIAN 94.2% 93.4% 93.4% 91.7% 121
COLOURED 81.3% 78.6% 80.2% 77.9% 434
GEOGRAPHIC LOCATION N = 3486
URBAN 88.6% 86.3% 85.2% 82.4% 2 297
RURAL 82.0% 76.1% 77.3% 71.8% 1 189
EDUCATION N = 3486
PRE-MATRIC 81.7% 74.4% 75.8% 70.9% 1 369
MATRIC COMPLETED 88.5% 86.9% 85.6% 82.4% 1 578
POST-MATRIC 91.8% 92.4% 90.5% 88.1% 539
AGE N = 3 472
<20 YEARS 86.5% 80.0% 84.7% 78.2% 170
20-29 YEARS 86.6% 84.1% 84.0% 80.7% 1 101
30-39 YEARS 85.7% 82.8% 81.6% 78.1% 956
40-49 YEARS 88.0% 84.8% 84.1% 79.8% 598
50-59 YEARS 84.9% 81.5% 79.8% 78.5% 372
60+ YEARS 85.1% 76.4% 77.8% 71.3% 275
Table 12.10: Survey Results: Science information source by selected demographics
As far as sources of science information is concerned, race; geographic location; educational
attainment and age were found to be statistically significant. While most all demographic groups
selected either radio, newspapers, television or other people as the top four information sources,
some variation in the ranking order did emerge across demographic sub-samples. White
respondents preferred information sources such as other people followed by newspaper; radio;
satellite pay television. Black respondents selected radio; followed by newspapers; free-to-air
television and then other people. Among the coloured sub-sample the selections were as follows:
radio; followed by free-to-air television; newspapers and other people. While within the Indian /
Asian sub-sample the preferred information sources were: radio; followed by newspaper; free-to-air
television and other people. The information source patterns within the rural / urban classifications
included: radio; followed by newspapers; free-to-air television and other people, with the rural
sample ranking free-to-air television higher than newspapers. Educational attainment classifications
ranked information sources as follows: Pre-matric: Radio, Free-to-Air Television, Newspapers and
Other people; Matric completed: Radio; Newspapers; Free-to-Air Television and Other people; Post-
matric: Newspapers; Radio; Free-to-Air Television and Satellite Pay Television. Age classifications
showed some commonalities in selections. Respondents younger than 20 years and older than 60
years selected the top four items in the following order: Radio; Free-to-Air Television; Newspapers
and Other people.
Stellenbosch University https://scholar.sun.ac.za

365
Respondents aged 20 to 59 years selected thee following: Radio; Newspapers; Free-to-Air Television
and Other people.
While the selections of the type of information source remained within four categories, the
preference of science information sources among the sample does appear to differ within
demographic variables.
Previous studies on the public understanding of science did not provide adequate evidence on
science engagement activities to enable us to formulate specific hypotheses. Hence, we formulated
the more exploratory hypotheses as below:
Hypothesis 6a: South Africans are more likely to record low than high levels of attendance at science
engagement activities
Based on the outcomes of this survey, there is strong evidence that, in general South Africans do not
attend science engagement activities with great frequency. Chart 12.8 presents the output of the
science engagement items. Within the 3 345 valid responses, only 11.5% (950) attended a science
engagement activity within the preceding 12 month period.
Chart 12.8: Survey Results: Science engagement items (Khayabus, Wave 2, 2015)
Of the respondents that did report attending some science engagement activity, the majority
attended a public library (19.8%) followed by going to a zoo or aquarium (13.1%) or a museum
Stellenbosch University https://scholar.sun.ac.za

366
(10.5%). Very few respondents attended any of the other science engagement activities. This result
points to a general low engagement in science activities.
Hypothesis 6b: South Africans of different demographic classifications are likely to differ in the
frequency of attendance at science engagement activities
As discussed in Chapter Ten, respondents from different demographic classification groups record
varying levels of attendance at science engagement activities. Table 12.11 details the response
within the science engagement index, by demographic classifications.
LOW ENGAGEMENT
MODERATE ENGAGEMENT
HIGH ENGAGEMENT
N
Asymptotic Significance
(2-sided) Pearson's R
NATIONAL 48.2% 23.6% 28.2% 2 536
RACE N = 950 RACE
BLACK 52.0% 22.3% 25.6% 613
p < 0.001 -0.128 WHITE 32.8% 23.2% 44.1% 177
INDIAN / ASIAN 40.0% 28.0% 32.0% 25
COLOURED 52.6% 28.9% 18.5% 135
GENDER N = 950 GENDER
FEMALE 52.0% 23.8% 24.2% 479 p < 0.05 -0.092
MALE 44.4% 23.4% 32.2% 471
GEOGRAPHIC LOCATION N = 950 GEOGRAPHIC LOCATION
URBAN 44.4% 23.1% 32.5% 728 p < 0.001 -0.174
RURAL 60.8% 25.2% 14.0% 222
EDUCATION N = 950 EDUCATION
PRE-MATRIC 59.3% 26.0% 14.7% 204
p < 0.001 0.208 MATRIC COMPLETED 49.2% 24.4% 26.4% 508
POST-MATRIC 36.6% 19.7% 43.7% 238
Table 12.11: Survey Results: Science engagement activities by selected demographics
Among the 950 respondents that reported attendance at science engagement activities, 48.2% were
classified within the low engagement group (attended one activity); 23.6% were within the
moderate engagement group (attended two activities) while 28.2% were classified within the high
engagement group (attended three or more activities). Race, gender, geographic location and
educational attainment were all found to be associated with engagement in science. More black and
coloured respondents were classified as the low engagement group compared to Indian / Asian and
white respondents. Females, respondents in rural areas as well as those with lower educational
attainment were similarly shown to attend fewer science engagement activities. This result validates
the hypothesis of a differential science engagement attendance pattern for various demographic
classifications.
Stellenbosch University https://scholar.sun.ac.za

367
The results of the study demonstrate the importance of demographics in understanding public
understanding of science measures. While some of the impacts of demographic classifications are
alterable – such as quality of education; access to engagement activities etc. – other factors related
to the interactions with race categories remain complex and less alterable.
The clear message to communicators of science and science policy leaders is that a one-size-fits-all
approach is not ideal within the South African context. Within race, gender, rural / urban and age
classifications there remain variations in access to resources that influence how well sub-populations
within these classifications perform on such assessments. Beyond the short terms focus on indicator
outcomes, the creation of real change within these underserved segments of the South African
population remains a key focus.
These findings may have significant implications for the national science policy agenda, wherein a
shifting of focus from funders and performers of science needs to be redistributed to further include
the general publics as consumers of scientific information. While there have been efforts toward the
development of a suitable science engagement policy framework, the role of the general South
African public has not been central to these policy formulations. This realignment of the national
policy direction to allow for the public to make a greater contribution would naturally rely on a
citizenry suitably skilled and informed toward substantially advancing these policy discussions.
However a perceived deficiency at either end of this value chain need not necessarily allow for the
exclusion of these equal partners in the future growth of South Africa. Serving the public interest
requires input from the public – this must be the foundation of future policy formulations that
influence the South African public understanding of science.
Stellenbosch University https://scholar.sun.ac.za

368
12.4 Limitations of this Study
The development of the indicators in this study required the use of a large sample toward ensuring
that the outputs are reflective of the national public understanding of science. The design and
implementation of a nationally representative survey sample ensured a consistent link to National
Census and allowed for generalisability to the population. However despite this the study focused on
a limited scope to highlight the six functional areas of the South African public understanding of
science (PUS) related to indicator development. This ultimately resulted in the focus of the study
being narrowed to a limited degree of focus, despite the wealth of information gathered during the
data collection phase.
The literature review identifies the broad scope of this research area; however as a result of the
aims of this particular study, a deliberate narrowing of the potential scope of this research was
employed. Cost considerations were to a large extent the most severe limitation on the
questionnaire items included, however despite this a reasonable degree of coverage within the
questionnaire as well as the objectives of this research study was included and ultimately achieved.
An extensive review of the international literature has been undertaken and summarized within the
opening chapters of this document. However despite this a limited number of empirical studies with
specific reference to the public understanding of science in the South African context are available.
This relates specifically to the implications of racial, cultural and developmental economics within
this context and remains far removed from the volumes of measurement literature emanating from
with the developed world.
The development of items for inclusion in this research maintained a focus on international
comparability, while attempting to suitably localise the content such that it remains relevant for the
intended population. It was considered more important to ensure that the content of the science
knowledge assessment reflected the local context of measurement to ensure the relevance of the
outcome indicators produced. Further research into the selection of items and international
comparability would be required toward addressing this issue that would impact many developing
contexts implementing surveys of this nature. Despite these challenges, every effort was made to
ensure the goals of this research project were met, while maintaining a relative degree of
international comparability.
South Africa is not a homogenous society and as a result the focus of this research was to
understand the role played by demographic variables on the general public understanding of
science. The noted variation within the general public opens the discussion for the notion of the
Stellenbosch University https://scholar.sun.ac.za

369
many South African publicS. This is further complicated by the varying degrees of ability as a result of
the influence of access to education; income and related variables discussed in this document.
Understanding the many publicS opens the discussion on the level of difficulty that assessments of
this nature should aim to achieve. Standards that are too high or too low would result in inaccurate
results and indices that do not provide an accurate picture of the South African public understanding
of science. Benchmarking then remains crucial; to effectively position the level of questions within
such assessment toward attaining a true reflection of PUS in South Africa.
An extensive review of the theoretical and empirical scholarship within this field was performed;
however an important outcome is the lack of suitable literature on public understating of science
indicator development. Perhaps a broader reading of the literature on social indicator development
may be required toward adopting a multidisciplinary approach to enhance measurement outcomes
within this field.
As discussed within the indicator development chapter, the cut-off scores on the indicator
classifications were based on empirically driven cut-off and not theoretically driven cut-offs. These
may result in the index not being as precise as it could be. It remains critically important to note here
that there is a persistent lack of literature guiding such efforts, that in the absence of better
guidance, this research adopted the most justifiable approach toward the development and
construction of the indices within this study.
The scope of the current study was amended and as a result, two points within the initial research
proposal were not operationalised. The first was a planned assessment on potential variations in
South Africans’ attitudes to general science issues versus specific topical issues (nuclear technology
or fracking – shale gas exploration). While this was a particular area of interest, the number of items
required to meaningfully explore this question was not financially viable within the funding structure
and did not contribute toward the primary goal of indicator development. As a result this research
question was omitted within the final study design. A further item within the original research
proposal was to reproduce selected international PUS indicators within South African data (example:
the Science Culture Index; Cultural Distance of Knowledge Concepts). Similar to the previous point,
the research supervisor advised that these pursuits, though valuable, were not contributing to the
specific indicator set that is the outcome of this research and as a result this aspect was no longer
included within the study outputs.
Stellenbosch University https://scholar.sun.ac.za

370
12.5 Future Research Directions
The volume of data within this research has highlighted a few areas requiring further research
investigation toward enhancing and complimenting the results reported herein:
Dedicated study within each of the six indicators developed is required to fully understand
the antecedents as well as the predictors of outcomes on each indicator. While this research
has presented an initial exploration into this data, it has given rise to more questions as a
result of the demographic and related analysis.
Race of respondent was known to play a significant role in overall results within this
research. However the detailed interactions of variables such as income, employment,
education and location need to be further investigated toward establishing a path of
causality toward developing more effective measurement and intervention strategies.
The domain of scientific knowledge, though broadly defined in this research, may require
further investigation to ascertain the areas specifically relevant to the South African
population. The selection of 7 science-subject categories and 9 questionnaire items was to
ensure as broad coverage as possible, however this may be expanded to include a greater
number of items where funding is available to do so.
An increase in the coverage of attitudinal items to better profile and assist in segmentation
activities will become a required part of future assessments of this nature. Further to this,
race was found to be the only predictor of outcome on the attitudinal index, which raises
additional questions as to how this influences attitudes to science. Related to this was the
exceptionally high degree of positive attitudes recorded within the coloured sub-sample,
that is not congruent with performance on the other indices – within this aspects an
investigation into population dynamics and its role within attitudes to science may be
required.
A key finding of this research was that despite interest in science, a large proportion of South
Africans do not participate in science engagement activities. This research was not designed
to ascertain the reasons for this; however, future research may investigate these reasons to
ascertain barriers to attendance at science engagement activities such that science
communicators may use this toward better programs and more accessible activities.
Each of the indices developed may be considered in further analysis as predictors of
performance on each of the other indicators. The complexity of this analysis was beyond the
scope of this research, however as discussed by Guenther and Weingart (2016) evidence
Stellenbosch University https://scholar.sun.ac.za

371
may exist of complex interactions between these indicators and their relative influence on
each other.
Additional research and development of the measure of attitudinal ambivalence as well as
the science-audience segmentation may broaden the discussion and variety of tool used
within this field of research.
12.6 GENERAL CONCLUSION
It is hoped that this research and the resources produced within its results will be of value to
researchers, policy makers and science communicators (in both the private and public sector), as
South Africa continues its shift toward a knowledge-based economy. As a country on this
evolutionary path of changing modes and means of production, it remains essential that the general
population of South Africa is knowledgeable and adequately skilled to make an active contribution
within this changing economic landscape. Likewise as advances in technology influence work
environments, increasingly primary production (agriculture; mining etc.) is reliant on science and
technology derived solutions that would not be accessible to a workforce lacking the appropriate
skills to meaningfully engage with these rapid changes in the employment context. As South Africa
tends toward becoming a continental leader and global role player, the internationalisation of the
domestic workforce will require a degree of proficiency with respect to basic understanding of
science and technology toward meeting the socio-economic objectives of the country.
Beyond employment, as science and technology become an increasingly more prevalent part of daily
life, due to constant innovation, basic services, communication, health care and factors that may
influence general quality of life will become increasingly dependent on users being able to interact
with such technologies. The role of science in society must be explored and understood toward
better facilitating the social, cultural and economic transformation it will eventually give rise to.
Government has a significant role to play in furthering our understanding of the South African public
understanding of science. However beyond this there similarly remains the need for the public to be
actively engaged in science learning and activities that would promote a bi-directional flow of
information to best facilitate an interactive space that promotes the ideals of equality and
participation.
The value and contribution of the print, broadcast and online based media cannot be over-stated.
These are the mediums people most frequently report encountering science information and there
needs to be a greater focus on reliable, accurate and accessible information within the public space
and private sector operators. This would encourage the public toward enhanced information seeking
Stellenbosch University https://scholar.sun.ac.za

372
behaviour and ultimately increase their knowledge base through a process of informal learning.
While the role of education is noted within this study, the importance and value of life-long learning
regarding science remains an important factor. Edutainment147 remains a valuable new tool that
broadcasters can employ toward fostering greater informal learning opportunities within the South
African public.
As language remains a critical factor in teaching and learning technical subjects, a greater focus on
developing a scientific vocabulary within the traditional languages needs to be made. While strides
have been accomplished within isiZulu, with the creation of a Zulu scientific dictionary, similar
initiatives would assist in ensuring that learning is accessible to a wider demographic in a language
that is appropriate; rather than exclusively in English.
The results of this research are also aimed at serving the more immediate need of policy makers and
science communicators in addressing the crucial gaps in science communication efforts. Further
understanding and the development of tools to enhance the study of the public’s relationship with
science will go a long way toward not only building a more inclusive innovation system, but also
address the crucial social, human and democracy building potential that lies in an awareness of this,
often complex, interaction between science and the general publicS (Reddy et al, 2009).
The investigation into the South African public understanding of science with respect to its
demographic predictors has highlighted the enormous impact that still influences the many South
African publicS. This diversity should not be seen as factor that divides us, but as a foundation on
which we build a future the people of this country deserve. This nations’ strength has always rested
in its diversity and this will, in time, become its greatest asset.
[We] Believe that South Africa belongs to all who live in it, united in our diversity.
Preamble of the constitution of the Republic of South Africa (1996)
147
Documentaries, educational programming televised in an informal way
Stellenbosch University https://scholar.sun.ac.za

373
References Agresti, A.; 2007. An Introduction to Categorical Data Analysis. Second edition. Wiley InterScience Aiwuyor W, 2011. Calculated Optimism: Africa’s Booming Youth Population and Demographic
Dividends. Accessed online at: http://face2faceafrica.com/article/calculated-optimism-africa-s-booming-youth-population-and-demographic-dividends. Accessed 12 August 2013
Albright, D, 1994. “South Africa and the Affordable Bomb”. Atomic Scientists, No. 4, issue 37 (Jul/Aug 1994).
Allum, N; Sturgis, P; Tabourazi, D; 2008. “Science knowledge and attitudes across cultures: a meta- analysis” Public Understanding of Science, vol. 17, 1: pp. 35-54. Aminrad, Z.; Binti, S. Z.; Zakariya, S.; Hadi, a. S.; Sakari, M.; 2013. Relationship Between
Awareness, Knowledge and Attitudes Towards Environmental Education Among Secondary School Students in Malaysia. World Applied Sciences Journal 22 (9): 1326-1333, 2013
Anderson, M; Gouasmia, S; Khan, A; Lorenzetti, C, 2009. “Innovation as a Threat”. Available online at: http://www.slideshare.net/abakhan/innovation-as-a-threat. Accessed 16 March 2013 APF, OECD, 2008. ICT in Africa: Boosting Economic Growth and Poverty Reduction. (Accessed 14 July 2010) http://www.oecd.org/dataoecd/46/51/40314752.pdf ARC: Agricultural Research Council, 2011. Website home page: History of Onderstepoort Veterinary Institute. Accessed 2011-07-08. http://www.arc.agric.za/home.asp?pid=2565 Archibugi, D.; 2004. A New Indicator of Technological Capabilities for Developed and Developing Countries (ArCo). World Development Vol. 32, No. 4, pp. 629–654 AU-NEPAD (African Union New Partnership for Africa’s Development), 2010. African Innovation Outlook 2010, AU-NEPAD, Pretoria. Aubert, J.E and Reiffers, JL; 2003. Knowledge Economies in the Middle East and North Africa: Toward New Development Strategies. World Bank. Available online at:
http://www.ecolabs.org/IMG/pdf/MENA4K.pdf. Accessed 6 March 2013
Babbie, E. R; 2007. The Practice of Social Research. 11th edition. Cengage Learning. Available online at https://www.cengagebrain.co.nz/content/9781133794882.pdf.
Bann, C. M.; Schwerin,M.J.; 2004. “Public knowledge and attitudes scale construction: development of short forms”. National Science Foundation – RTI International Barnett, C. and Mahony, N.; 2011. Segmenting Publics. National Co-ordinating Centre for Public
Engagement and the Economic and Social Research Council. Available online at: https://www.publicengagement.ac.uk/sites/default/files/publication/segmenting_publics_2_nov_2011.pdf
Barre, R, 2010. Towards socially robust S&T indicators: indicators as debatable devices, enabling collective learning. Research Evaluation (2010) 19(3): 227-231. Available online at http://rev.oxfordjournals.org/content/19/3/227.full.pdf+html
Stellenbosch University https://scholar.sun.ac.za
https://www.publicengagement.ac.uk/sites/default/files/publication/segmenting_publics_2_nov_2011.pdf

374
Battrawi, B; Muhtaseb, R; 2013. The Use of Social Networks as a Tool to Increase Interest in Science and Science Literacy: A Case Study of 'Creative Minds' Facebook Page. Conference presentation: “New Perspectives in Science Education” Florence, Italy 14 - 15 March 2013. Available online at: http://conference.pixel-online.net/npse2013/common/download/Paper_pdf/043-SPI08-FP-Battrawi-NPSE2013.pdf. Accessed 22 November 2013.
Bauer, M; Durant, J and Evans, G; 1994. European Public Perceptions Of Science. International Journal of Public Opinion Research 6, 163-186 Bauer, M. and Durant, J.; 1997. “Belief in Astrology: a Social-Psychological Analysis,” Culture and Cosmos: A Journal of the History of Astrology and Cultural Astronomy 1: 55–72. Bauer,M , Petkova, K and Boyadjieva, P.; 2000. “Public Knowledge of and Attitudes to Science:
Alternative Measures that may end the “Science War”.” Science, Technology & Human Values. Vol. 25 (1) p 30-51
Bauer, M., Allum, N & Miller, S.; 2007. "What can we learn from 25 years of PUS survey research? Liberating and expanding the agenda." Public Understanding of Science, Vol. 16(1): 79-95 Bauer, M.; 2009. The evolution of public understanding of science - discourse and comparative evidence. Science, technology and society, 14 (2): 221-240. Bauer, M and Falade, B; 2014. Public understanding of Science – The survey Research. Handbook of
Public communication of Science and Technology. London School of Economics and political Sciences. London.
Bayaga, A.; 2010. Multinomial logistic regression: usage and application in risk analysis. Journal of Applied Quantitative Methods, Vol 5, No 2, 2010 Beveridge, A.A. & Rudell, F; 1988 “An Evaluation of ‘Public Attitudes toward Science and Technology’: Science Indicators: the 1985 Report,” Public Opinion Quarterly 52: 374–85. Beyleveld, D and Friele, MB; 2003. Chapter 4.4 (page 166-172) “General Attitudes to Science and Technology in Europe”. Chapter in book: Embryo Research in Pluralistic Europe. Springer. BIS, 2011. Public attitudes to Science; 2011. Department for Business, Innovation and Skills / IPSOS MORI Social research Institute. Bhorat, H; Meyer, J.B; Mlatsheni, C; 2002. “Skilled Labour Migration from Developing Countries:
Study on South And Southern Africa” report for the International Labour Office. Accessed 2011-07-08. Available at http://www.ilo.int/public/english/protection/migrant/download/imp/imp52e.pdf
Blankley, W. O; Arnold, R; 2001. Public Understand of Science in South Africa – aiming for better intervention strategies. South African Journal of Science, 97, March / April 2001. South Africa Blankley, W; Booyens, I; 2010. Building a Knowledge Economy in South Africa. South African Journal of Science. Nov / Dec 2010, Vol. 106 Issue 11/12, p15.
Stellenbosch University https://scholar.sun.ac.za

375
Blik, H. and Goldstein, M; 2013. An Introduction to Social Media for Scientists. Public Library of Science – PLOS online Journal, Vol. 11, Issue 4, April 2013. Available online at: http://www.plosbiology.org/article/fetchObject.action?uri=info%3Adoi%2F10.1371%2Fjournal.pbio.1001535&representation=PDF. Accessed 14 November 2013.
BMHRC; 2008. The Bhopal Gas Tragedy. Available online at http://www.bmhrc.org/Bhopal%20Gas%20Tragedy.htm Accessed 16 July 20104. Bora, A; Heiko, H; 2006. “Participatory science governance revisited: normative expectations versus empirical evidence”. Science and Public Policy, 33(7), 478–488. Brochu, P; Deussing, M. A.; Houme, K.; Chuy, M.; 2013 . Measuring Up: Canadian Results of the OECD
PISA study: The Performance of Canada’s Youth in Reading, Mathematics and Science 2012 First Results for Canadians Aged 15. Statistics Canada. Available online at: http://cmec.ca/Publications/Lists/Publications/Attachments/318/PISA2012_CanadianReport_EN_Web.pdf . Accessed 27 March 2014
Burns, T; O’Connor, D and Stockmayer, S. 2003. “Science Communication: a Conceptual Definition.” Public Understanding of Science. 12, 183-202. Burns, M.; Audouin, M.; Weaver, A.; 2006. “Advancing sustainability science in South Africa”. South African Journal of Science. Vol 102, September/October 2006 Burawoy,M; 2007. Deliberative democracy in a global context: a South African model of higher
education? Lecture presented at Centre for Education Policy Development 26 December 2007.
Bybee, R. W.; 1997. Achieving Scientific Literacy: From Purposes to Practices. Heinemann Publishers. Byrnes, R.M; 1996. South Africa: A Country Study. Washington: GPO for the Library of Congress. Located online at: http://countrystudies.us/south-africa/20.htm. Accessed 09 July 2013
Castro-Martínez, E.; Jiménez-Sáez, F; Ortega-Colomer, F. J; 2009. Science and technology policies: A tale of political use, misuse and abuse of traditional R&D indicators. Scientometrics, September 2009, Volume 80, Issue 3, pp 827–844
Center for American Progress, 2012. “Retooling to Ensure America Remains No. 1 in the 21st
Century” Series on U.S. Science, Innovation, and Economic Competitiveness. Available online at http://www.americanprogress.org/wp-content/uploads/issues/2012/01/pdf/dwwsp_overview.pdf. Accessed 25 July 2013
Chari, R.; Hogan, J.; Murphy, G., 2010. Regulating Lobbying: A Global Comparison. Manchester University Press. Chen S. & Ravaillon M.; 2004. How have the world’s poorest fared since the early 1980’s? World Bank Policy Research Working Paper 3341. Washington, D.C. Chen, F., Shi, Y., Xu, F.; 2009. An analysis of the Public Scientific Literacy study in China. Public Understanding of Science September 2009 vol. 18 no. 5 607-616
Stellenbosch University https://scholar.sun.ac.za

376
CIA; 2012. “The World Fact book: South Africa 2012”. Washington, DC: Central Intelligence Agency. Accessed online on 21-04-2013. Available at https://www.cia.gov/library/publications/the-world-factbook/index.html
Cirksena, M.K.; Flora, J.A., 1995. Audience segmentation in worksite health promotion: A procedure using social marketing concepts. Health Education Research (1995) 10 (2):211-224. Claassen, G. N; 2009. Covering Science: why we don’t measure up. The Media. Johannesburg. September 2009 30-31 Claassen, G. N; 2010. Why Journalism is failing the Scientific Age. Rhodes Journalism Review. July 2010 42-43 Clarke, R.; Thompson, L.; 2011. A majestic start: How the OECD was won. OECD Observer, online
magazine of the OECD. Available online at http://www.oecdobserver.org/news/fullstory.php/aid/3492/. Accessed 13 December 2013
Collins English Dictionary – Complete and Unabridged; 2003. Retrieved November 25 2015 from http://www.thefreedictionary.com/informedness Conradie, E. S.; 2004. The role of key role players in science communication at South African higher
education institutions: an exploratory study. University of Pretoria, South Africa (Unpublished PhD thesis)
Coughlan, S; 2013. England's young adults trail world in literacy and maths. BBC News – Education &
Family. 9 October 2013. Available online at: http://www.bbc.com/news/education-24433320. Accessed 22 December 2013
Critchley , C, Turney , L.; 2004. “Understanding Australians’ Perceptions of Controversial Scientific
Research”. Australian Journal of Emerging Technologies and Society. Vol. 2, No. 2, 2004, pp: 82-107
Crush, J; Campbell, E; Green, T; Nangulah, S; Simelane, H, 2005. States of Vulnerability: The Future
Brain Drain of Talent to South Africa. Southern African Migration Project. Southern African Research Centre Queen’s University, Kingston, Canada.
Cummings, M.; 1979. Random Digit Dialing: A Sampling Technique for Telephone Surveys. Public Opinion Quarterly, 1979, issue 43 (2) page 233-244. CVCE; 2012. Centre Virtuel de la Connaissance sur l'Europe (CVCE): European Commission. Published
online at http://www.cvce.eu/obj/european_commission-en-281a3c0c-839a-48fd-b69c-bc2588c780ec.html. Accessed 06 April 2014.
Daamen, D.D.L. and van der Lans, I.A; 1995 “The Changeability of Public Opinions about New Technology: Assimilation Effects in Attitude Surveys,” in M. Bauer (ed.) Resistance to New Technology, pp. 81–96. Cambridge: Cambridge University Press.
Dahlman, C. J.; Aubert, J.; 2001. China and the Knowledge Economy: Seizing the 21st Century. WBI Development Studies. World Bank Publications
Stellenbosch University https://scholar.sun.ac.za
377
Darzentas, N; Goldovsky, L; Ouzounis, C; Karapiperis, K; Karapiperis, C; 2007. “Science communication media for scientists and the public”. EMBO reports VOL 8 NO 10 2007. Accessed online at: http://www.nature.com/embor/journal/v8/n10/full/7401074.html
DeBoer, G. E; 2000. “Scientific Literacy: Another Look at Its Historical and Contemporary Meanings
and Its Relationship to Science Education Reform”. Journal of Research in Science Teaching vol. 37, no. 6.
Dell, S; 2009. Fifteen years after Apartheid Died. Newspaper article: The Witness (26 Jun 2009)
accessed online (12-06-2011): http://www.witness.co.za/index.php?showcontent&global%5B_id%5D=24611
Department of Arts, Culture, Science and Technology (DACST); 1996. White Paper on Science and Technology. Pretoria: Government Press. De Lanerolle, L.; 2012. The New Wave: Who connects to the internet, how they connect and what
they do when they connect. South African Network Society Project. University of Witwatersrand. Available online at: http://www.networksociety.co.za/internet-report.php
De Sousa W. H; de Souza B; Zamudio Igam, M. P; 2009. “R&D Management and the Stokes Diagram:
An exploratory Study”. Journal of Technology Management and Innovation. Volume 4, Issue 4
Department of Communications; 2011. Department of Communications strategic plan 2011 -2014.
Department of Communications, Republic of South Africa. Accessed, 17 May 2011, from, http://www.doc.gov.za/index.php?option=com_docman&task=cat_view&gid=119&Itemid=543 .
Department of Science and Technology (DST); 2007. Innovation towards a knowledge-based
economy ten-year plan for South Africa (2008 – 2018). Department of Science and Technology, South Africa. Government Press
Department of Science and Technology (DST); 2008. Ten Year Innovation Plan. Pretoria: Government Press Department of Science and Technology (DST); 2011. Enhancing the National System of Innovation to
support growth and development: A strategy to increase R&D investment in South Africa. Pretoria: Government Press
Department of Science and Technology (DST); 2014. Science Engagement Framework: Science
engaging with society to foster an informed environment for innovation, economic strength and social improvement. Pretoria: Government Press
Dewey, J.; 1916. DEMOCRACY AND EDUCATION. Macmillan. Accessed online via the “The Project
Gutenberg EBook of Democracy and Education, by John Dewey”. Available at http://www.gutenberg.org/files/852/852-h/852-h.htm. Accessed: 19 November 2013
Diseko, L; 2010. “South Africa's brain-drain generation returning home”. CNN online edition:
http://articles.cnn.com/2010-11-18/world/south.africa.migration_1_south-africans-violent-crime-job-seekers?_s=PM:WORLD
Stellenbosch University https://scholar.sun.ac.za

378
Dolnicar, S. & Rossiter, J. R.; 2009. “Not offering don't know options in brand image surveys contaminates data”. Australia and New Zealand Marketing Academy (ANZMAC) Conference (pp. 1-7). Melbourne, Australia: Australian & New Zealand Marketing Academy. Available online AT: http://ro.uow.edu.au/cgi/viewcontent.cgi?article=3554&context=commpapers
Drubin, D., G.; Kellogg, D. R.; 2012. English as the universal language of science: opportunities and challenges. Molecular Biology of the Cell vol. 23 no. 8 Dunn, L. A.; 2013. “Teaching in higher education: can social media enhance the learning
experience?” Interdisciplinary Science Education, Technologies and Learning. The University of Glasgow. Available online at: http://www.gla.ac.uk/media/media_276225_en.pdf
Du Plessis, H, 2011. “Science and Society: Public Understanding of Science (PUS) in South Africa and
other collaborations”. Unpublished: HSRC Seminar series presentation. 25 January 2011. Pretoria
Durant, J. R; Evans, G. A; Thomas, G. P; 1989. The public understanding of science. Nature 340, 11-14 Durant, J. 1999. “Participatory Technology Assessment and the Democratic Model of the Public Understanding of Science.” Science and Public Policy. 26(5): 313-319
Eagly, A.H. and Chaiken, S ; 1993 The Psychology of Attitudes. Fort Worth: Harcourt Brace College Publishers. Eden, G; 2014. REVIEW: Special Eurobarometer 401: Survey Summary on Responsible Research and
Innovation, Science and Technology coordinated by the European Commission. Journal of Responsible Innovation, January 2014. Available online at: http://users.ox.ac.uk/~lina1361/Eden-JRRI-Review.pdf. Accessed 09 April 2014.
Edgerton, D; 1996. The 'White Heat’ Revisited: The British Government and Technology in the 1960s.
Twentieth Century British History, Vol. 7, No. 1, 1996, pp. 53-82. Available online at: https://workspace.imperial.ac.uk/humanities/Public/files/Edgerton%20Files/edgerton_white_heat.pdf. Accessed 16 October 2013.
Edgerton, D; 2004. ‘The linear model’ did not exist: Reflections on the history and historiography of
science and research in industry in the twentieth century”. In Grandin, K and Wormbs, N (eds), The Science–Industry Nexus: History, Policy, Implications. (New York: Watson, 2004). Available online at https://workspace.imperial.ac.uk/historyofscience/Public/files/edgerton_linear_model_did_not_exist.pdf
Egbetokun, A; Siyanbola, W; Olamade, O; Adeniyi, A; Irefin, I; 2008. "Innovation in Nigerian SMEs:
types and impact," MPRA Paper 25338, University Library of Munich, Germany, revised 2008.
Eisner, P; 2009. Measuring South Africa’s progress since apartheid. World Focus online edition.
Accessed 12-06-2011 from: http://worldfocus.org/blog/2009/04/27/measuring-south-africas-progress-since-apartheid/5134/
Stellenbosch University https://scholar.sun.ac.za

379
Einsiedel, F, Jelsøe, E., Breck, T; 2001. “Publics at the technology table: the consensus conference in Denmark, Canada, and Australia”. Public Understanding of Science vol 10 (2001) 83–98 Elkana, Y.; Lederberg, J.; Merton, R. K.; Thackray, A.; Zuckerman, H; 1978. “Toward a metric of
science. The Advent of Science Indicators”. Based upon a conference sponsored by the Center for Advanced Study in the Behavioral Sciences and the Social Science Research Council.”
Ellis, F. R. G; 2001. “Science research policy in South Africa”. Royal Society of South Africa. European Commission; 2001. Eurobarometer 55.2: Europeans, science and technology. European
Commission, Directorate-General for Press and Communication, Public Opinion Sector. Report available online at: http://ec.europa.eu/research/press/2001/pr0612en-report.pdf. Accessed 08 April 2014.
European Commission; 2013a. Special Eurobarometer 401 Responsible Research and Innovation
(RRI), Science and Technology report. Available online at http://ec.europa.eu/public_opinion/index_en.htm. Accessed 08 April 2014
European Commission, 2013b. Welcome, Croatia! Press release on European Commission website.
Available online at http://ec.europa.eu/news/eu_explained/130701_en.htm. Accessed 08 April 2014
Evans, G; Durant, D; 1995. The relationship between knowledge and attitudes in the public
understanding of science in Britain. Public Understanding of Science January 1995 vol. 4 no. 1 57-74
Everitt, B.S.; 2002. The Cambridge Dictionary of Statistics, 2nd Edition.
Falk, J. H.; Storksdieck, M.; Dierking, L. D; 2007. Investigating public science interest and understanding: evidence for the importance of free-choice learning. Public Understand of Science, vol. 16 no. 4 pp 455-469
Fedderk, J; 2001. “Technology, Human Capital and Growth: Evidence from a Middle Income Country
Case Study Applying Dynamic Heterogeneous Panel Analysis”. ERSA, University of the Witwatersrand. Accessible online at http://www.tips.org.za/files/
Feller, I & Gamota, G; 2007. Science indicators as reliable evidence. Minerva (2007) 45:17 Felt, U., & Fochler, M.; 2008. “The Bottom-up meanings of the Concept of Public Participation in Science and Technology.” Science and Public Policy. 35 (7) p489-499. Feinstein, N.; 2011. Salvaging science literacy. Science Education. Volume 95, Issue 1, pages 168– 185, January 2011. Field, A.; 2005. Discovering Statistics Using SPSS. 2nd ed. London: Sage Foundation for Research Development (FRD), 1996. “South African Science and Technology Indicators”. Chapter 6: Public Understand of Science and Technology. Pretoria, South Africa
Stellenbosch University https://scholar.sun.ac.za

380
Fourie, J; 2006. The South African poor white problem in the early 20th century: Lessons for poverty
today. Bureau for Economic Research & University of Stellenbosch (Department of Economics).
Fuller, S; 2000. Book Review: Increasing Science's Governability: Response to Hans Radder. Science Technology Human Values, 2000, Vol. 25: No. 4, pp 527-534 Freeman, C. and Soete, L.; 2007. Developing science, technology and innovation indicators: what we can learn from the past. UNU-MERIT Working Paper Series. January 2007. ISSN 1871-9872 Gardner, P.; 1975. Attitudes to science. Studies in Science Education, 2, 1–41. Gardner, P.; 1995. Measuring attitudes to science. Research in Science Education, 25, 283–289. Gascoigne, T. H. and Metcalse, J. E.; 1994. Public Communication of Science and Technology in
Australia. Published in When Science Becomes Culture, proceedings from a conference held in Montreal, Canada April 10-13 1994. Available online at: http://www.cirst.uqam.ca/pcst3/PDF/actes/When%20science%20becomes%20culture.pdf. Accessed 06 February 2014
Gastrow, M; 2010. The Public Understanding of Biotechnology in the Media. A report for the
National Advisory Council on Innovation and the National Biotechnology Advisory Committee. Education and Skills Development Research Programme Human Sciences Research Council
Gauchat, G; 2010. The cultural authority of science: Public trust and acceptance of organized science. Public Understanding of Science, Vol 20, 2010. Gault, F; 2011. “Social impacts of the development of science, technology and innovation
indicators”. UNU-MERIT. United Nations University – Maastricht Economic and social Research and training centre on Innovation and Technology. Available online at: www.merit.unu.edu/.../wppdf/.../wp2011-008
Gedye, L; 2012. “African mobile markets on exponential growth track” Mail and Guardian November 23 to 29 2012, page 5. Godin, B.; 2001. The emergence of S&T indicators: why did governments supplement statistics with indicators. Paper No. 8. Montreal. Godin, B.; 2000. Outline for a history of science measurement. Paper No. 1. Montreal. Godin, B.; 2005. Measurement and Statistics in Science and Technology: 1920 to the Present. London, Routledge. Godin, B.; 2010. Taking Statistics (More) Seriously: The Measurement of Science, Technology and
Innovation and its Future. Prepared for a UNESCO Workshop on “New Dimensions of STI Indicators”, Paris, 9-10 December 2010.
Godin, B; Gingras, Y.; 2000. “What is scientific and technological culture and how is it measured? A multidimensional model”. Public Understanding of Science 2000 9: 43
Stellenbosch University https://scholar.sun.ac.za

381
Goedhuys, M, 2007. The impact of innovation activities on productivity and firm growth: evidence
from Brazil. United Nations University, Maastricht Economic and social Research and training center on Innovation and Technology in its series UNU-MERIT Working Paper Series with number 002.
Goolam, F.; 2001. The scientific and technological literacy of first year students: the effect of
traditional school curriculum. Unpublished PhD thesis. University of Pretoria. Available online at http://upetd.up.ac.za/thesis/submitted/etd-12092005-155023/unrestricted/00front.pdf. Accessed 23 October 2013.
Gorsuch, R. (1969). Beliefs, attitudes and values, by Milton Rokeach – review. American Sociological Review, Vol. 34, No. 2, 267-268
Gregory, J; 2001. Public understanding of science: lessons from the UK experience. Available online at: http://www.scidev.net/global/communication/feature/public-understanding-of-science-lessons-from-the.html. Accessed 15-11-2013
Gregory, J., & Lock, S.; 2008. "Evolution of "Public Understanding of Science": Public engagement as a Tool of Science Policy in the UK." Sociology Compass. 2 (4): 1252-1265. Gruber, J. and Caffrey, M; 2005. HIV/AIDS and community conflict in Nigeria: implications and challenges. Social Science & Medicine 60 (2005) 1209–1218 Grupp, H.; Mogee, M. E.; 2004. Indicators for national science and technology policy: how robust are composite indicators? Research Policy, vol. 33 page 1373–1384 Guenther L, Weingart P.; 2106. A unique fingerprint? Factors influencing attitudes towards science
and technology in South Africa. South African Journal of Science. 112. Available online at: http://sajs.co.za/unique-fingerprint-factors-influencing-attitudes-towards-science-and-technology-south-africa/lars-guenther-peter-weingart
Harrison, R. ; Kessels, J; 2003. “Human Resource Development in a Knowledge Economy”. CIPD Publishers Hasan, R.; 2013. “First world problems: why economic development categories need a rethink”.
Article published in the Guardian Online. Available online at http://www.theguardian.com/business/economics-blog/2013/nov/22/first-world-problems-economic-development-categories. Accessed 25 January 2014.
Hattie, J.; 1985. Methodology Review: Assessing Unidimensionality of Tests and items. Applied Psychological Measurement, vol 9, No 2, June 1985. Hawken, A. and Munck, G.L.; 2013.Cross-National Indices with Gender-Differentiated Data: What Do
They Measure? How Valid Are They? Social Indicators Research May 2013, Volume 111, Issue 3, pp 801–838
Stellenbosch University https://scholar.sun.ac.za

382
Hays, A. R; 2001. The Role of Interest Groups. Extracts from his book: Who Speaks for the Poor? Routledge. Extract available online at: http://www.ait.org.tw/infousa/zhtw/docs/demopaper/dmpaper9.html. Accessed 05 February 2014
Hazen, R. M., and J. S. Trefil; 2009. Science Matters: Achieving Scientific Literacy. Anchor House Publishing. New York. HEMIS-DoE, 2009. By special data sharing policy with HSRC. Henseler, J.; Ringle, C. M.; Sarstedt, M.; 2015. A new criterion for assessing discriminant validity in
variance-based structural equation modelling. The Journal of the Academy of Marketing Science (JAMS) (2015) 43:115–135
Hock, D. K. W.; 2007. Legacies of World War II in South and East Asia. Institute of Southeast Asian
Studies, Singapore. p. 48. Available online at http://www.google.co.za/books?id=awLp4TeUkzoC&printsec=frontcover&redir_esc=y#v=onepage&q&f=false. Accessed 18 March 2014.
Hodson, D.; 2008 Towards Scientific Literacy. A teacher’s guide to the History, Philosophy and Sociology of Science. Rotterdam: Sense Publishers Hodson, D.; 2009. Toward scientific literacy: A teachers’ guide to the history, philosophy and
sociology of science. Sense Publishers. The Netherlands. Available online: https://www.sensepublishers.com/media/1191-towards-scientific-literacy.pdf . Accessed 02 January 2014.
Holbrook, J.; Rannikmae, M.; 2009. The Meaning of Scientific Literacy. International Journal of
Environmental & Science Education: special issue on scientific literacy. Vol. 4, No. 3, July 2009, 275-288. Available online at: http://www.ijese.com/IJESE_v4n3_Special_Issue_Holbrook.pdf. Accessed 03 October 2013.
House of Lords Report, 2000. Science and Society. Her Majesty’s Stationery office. London. Available
online at: http://www.publications.parliament.uk/pa/ld199900/ldselect/ldsctech/38/3801.htm
Howitt, P; 2007. “Innovation, Competition and Growth”. C.D. Howe Institute Commentary. No. 246, April 2007 Hrbek, Ivan; Fasi, Muhammad; 1988. Africa from the Seventh to the Eleventh Century. London: UNESCO. HSRC. 2004. Report on Public Understanding of Biotechnology. Available online at www.hsrc.ac.za HSRC, 2011. Trends in International Mathematics and Science Study (TIMSS). International Association for The Evaluation Of Educational Achievement (IEA). HSRC-CeSTII, 2012. “Results of the National Research and Experimental Development Survey 2009-
2010”. Research commissioned by the Department of Science and Technology. Pretoria, South Africa
Stellenbosch University https://scholar.sun.ac.za

383
Hu, M. and Peng, Y.; 2010. Chinese lacking scientific literacy. News article in China Daily published 2010-11-02. Available online at: http://www.chinadaily.com.cn/china/2010-11/02/content_11487848.htm. Accessed 18 June 2014.
Hurd, P. 1958. Science literacy: It’s meaning for American schools. Educational Leadership, 16, 13 – 16, 52. Hurd, P. 1998. Scientific literacy: New minds for a changing world. Science Education 82: 407—416. Hurley, H. M.; 1998. Science Literacy: Lessons from the First Generation. University at Albany, State University of New York. Research Matters No. 9801, March, 1998 Hwang, K.; 2005. The Inferior Science and the Dominant Use of English in Knowledge Production: A
Case Study of Korean Science and Technology. Science Communication June 2005 vol. 26 no. 4 390-427
IEA-TIMSS, 2007. Trends in International Mathematics and Science Study (TIMSS) 2007. Available online: http://nces.ed.gov/timss/results07.asp Ighobor, K; 2013. Africa’s youth: a “ticking time bomb” or an opportunity? Africa Renewal. Accessed
online at: http://www.un.org/africarenewal/magazine/may-2013/africas-youth-ticking-time-bomb-or-opportunity. Accessed 12 August 2013
IMF, 2013. Report for Selected Countries and Subjects: South Africa 2012. Database available online
at: http://www.imf.org/external/pubs. Accessed April 2013. Indiwe, 2012. South African Airways inflight magazine article. Issue: February 2012. Page 43. Editor Piet Van Niekerk. Ishii, M. 2002. Public Understanding of Science and Technology in Japan 'The influence of people's
liking of science at school age on their understanding of science after grown-up. National Institute of Science and Technology Policy. Available online at: http://www.saasta.ac.za/scicom/pcst7/masamichi.pdf. Accessed 24 January 2014.
Jasanoff, S; 1997. “Civilization and madness: the great BSE scare of 1996”. Public Understanding of Science July 1997 vol. 6 no. 3 221-232 Kahn, M. J., Blankley W.O.; 2005. The history of research and experimental development
measurement in South Africa and some current perspectives. South African Journal of Science, 101 March 2005.
Kaplan, D; 2008a.” Science and Technology Policy in South Africa : Past Performance and Proposals for the Future”. In Science Technology Society 2008 13: 95 Kaplan, D; 2008b. “Science and technology policy in South Africa: a critical assessment of past performance and of proposed future directions”. Conference Paper, Oxford 2008. Kawamoto, S.; Nakayama, M.; Saijo, M.; 2013. A survey of scientific literacy to provide a foundation for designing science communication in Japan. Public Understanding of Science. August 2013 vol. 22 no. 6 674-690
Stellenbosch University https://scholar.sun.ac.za

384
Kennedy, P; 1989. The Rise and Fall of the Great Powers- Economic change and Military conflict from 1500 to 2000. Fontana Press, London, 1989. Kennett, K, 2005. South Africa: Tackling the legacy of apartheid. Thomson Learning. Accessed online (12-06-2011)
http://www.swlearning.com/economics/kennett/kennett2e/Kennett_SouthAfrica.pdf Khumalo, S; 2013. School with zero pass rate an omen of crisis. Independent Online Newspapers.
Available online at http://www.iol.co.za/news/south-africa/limpopo/school-with-zero-pass-rate-an-omen-of-crisis-1.1548020#.Ueba640-uOF. Accessed July 17 2013 at 09:59am
King, C, 2010. South African Science: Signs of Progress. Science Watch. Available online at http://archive.sciencewatch.com/ana/fea/10mayjunFea/. Accessed 14 July 2012 Knighton, T.; Brochu, P; Gluszynski, T.; 2010. Measuring Up: Canadian Results of the OECD PISA
study: The Performance of Canada’s Youth in Reading, Mathematics and Science 2009 First Results for Canadians Aged 15. Statistics Canada. Available online at: http://www.statcan.gc.ca/pub/81-590-x/81-590-x2010001-eng.pdf. Accessed 08 January 2014
Kraak, A., & Press, K.; 2008. Human Resources Development Review 2008: Education, Employment and Skills in South Africa. HSRC Press: Cape Town. Lamberts, R; Grant, W. J; Martin, A.; 2010. Public opinion about science. ANUPoll: The Australian
National University. ANU College of Physical and Mathematical Sciences and ANU College of Arts and Social Sciences.
Laugksch, RC. 1996. Development of a Test for Scientific Literacy. Cape Town: UCT (Unpublished PhD thesis) Laugksch, RC and Spargo, P.E.; 1999. Scientific Literacy of selected South African matriculants
entering tertiary education: a baseline survey. South African Journal of Science. Vol 95 pp 427-432. October 1999.
Laugksch, RC. 2000 “Scientific Literacy: A Conceptual Overview.” Science Education. 84(1), 71-94. Layton, D., Jenkins, E., Donnelly, J.; 1994. Scientific and Technological Literacy: Meanings and
Rationales - An Annotated Bibliography. Centre for Studies in Science and Mathematics Education, University of Leeds. UNESCO. Available online at: http://www.unesco.org/education/pdf/325_94.pdf. Accessed 8 December 2013
Lee, O.; 2001. Culture and Language in Science Education: What Do We Know and What Do We Need to Know? Journal of Research in Science Teaching vol. 38, no. 5, pp. 499 – 501. Lewenstein, B. V.; 1992. The meaning of ‘public understanding of science’ in the United States after World War II. Public Understanding of Science January 1992 vol. 1 no. 1 45-68 Liu, X; 2009. Beyond Science Literacy: Science and the Public. International Journal of Environmental & Science Education Vol. 4, No. 3, July 2009, 301-311
Stellenbosch University https://scholar.sun.ac.za

385
Lizotte, M. K; Sidman, A.H.; 2009. Explaining the Gender Gap in Political Knowledge. Politics & Gender, 5 (2009), 127 –151. Printed in the U.S.A. available online at: http://web.pdx.edu/~mev/pdf/PS471_Readings_2012/Lizotte_Sidman.pdf
Locke, S; 2002. “The Public Understanding of Science-A Rhetorical Invention. Science Technology Human Values 2002 27: 87 Lodge, J; 2012. Education in the information age: is technology making us stupid? The Conversation.
Available online at http://theconversation.com/education-in-the-information-age-is-technology-making-us-stupid-10844. Accessed 06 May 2013
Long, J. S., Freese, J.; 2001. Regression models for categorical dependent variables using STATA. A
Stata Press Publication. Available online at: http://investigadores.cide.edu/aparicio/data/refs/Long%26Freese_RegModelsUsingStata_2001.pdf
Maierbrugger, A, 2013. Malaysia bans opening of new universities. Article in the
Www.investvine.com/ news portal. Available online at: http://investvine.com/malaysia-freezes-setting-up-of-universities/. Accessed 10 July 2014.
Malaysian Biotechnology Information Centre (MABIC), 2014. Strategies for biotech in Malaysia.
Malaysian Biotechnology Information Centre website. Online link: http://www.bic.org.my/biotech-in-malaysia/strategies. Accessed 16 June 2014.
Malaysian Science and Technology Information Centre (MASTIC), 1998. Public Awareness of Science
and Technology Malaysia 1998. Available online at: http://www.mastic.gov.my/documents/10156/919963c4-b14c-4368-b7df-9b96dfe94eaf. Accessed 12 July 2014.
Malaysian Science and Technology Information Centre (MASTIC), 2008. Public Awareness of Science
and Technology Malaysia 1998. Available online at: http://www.mastic.gov.my/documents/10156/050c1993-dd1f-485b-b92b-903736afda55. Accessed 12 July 2014.
Mansour, N; 2009. “Science-Technology- Society (STS): A new paradigm in Science Education”.
Bulletin of Science, Technology and Society. 29(4), 287-297. Available online at: https://ore.exeter.ac.uk/repository/bitstream/handle/10871/11347/a%20new%20paradigm.pdf?sequence=2 . Accessed 27 January 2014.
Marais, H.C and Pienaar, M; 2010. “Evolution of the South African Science, Technology and Innovation system 1994-2010: an Exploration”. African Journal of Science, Technology,
Innovation and Development. Volume 2 Number 3, 2010. Page 82-109
McCarthy. M; 2010. “Public opinion stopped GM, says campaigner”. The Independent . Published 26- 09-2010. Available online at : http://www.independent.co.uk/environment/green-living/public-opinion-stopped-gm-says-campaigner-2089974.html
McCurdy, R. 1958. Toward a population literate in science. The Science Teacher, 25, 366 - 368, 408.
Stellenbosch University https://scholar.sun.ac.za
386
McGregor, D. and Kearton, G.; 2010. What do researchers say about scientific literacy in schools? Article in the Association for Science Education (ASE) journal: Education in Science. November 2010 (240)
Millar, R.; 2007. ‘Twenty-first Century Science: Insights from the design and implementation of a
scientific literacy approach in school science’, International Journal of Science Education, 28, (13), 1499–1522
Miller, J.D. 1983 “Scientific Literacy: a Conceptual and Empirical Review,” Daedalus Spring: 29–48. Miller, J.D. 1987 “Scientific Literacy in the United States,” in Communicating Science to the Public, pp. 19–40. Chichester: Wiley. Miller, J.D. 1992 “Towards a Scientific Understanding of the Public Understanding of Science and Technology,” Public Understanding of Science 1: 23–30. Miller, J.D.; 1996. Scientific literacy for effective citizenship. State University of New York Press, Albany, NY Miller, J.D. 1998. “The Measurement of Civil Scientific Literacy.” Public Understanding of Science. Vol 7 pp 203-223 Miller, J. D.; 2004. "Public Understanding of, and Attitudes toward, Scientific Research: What We Know and What We Need to Know." Public Understanding of Science. 13: 273-294. Miller, S. 2001 “Public Understanding at the Crossroads,” Public Understanding of Science 10: 115– 20. Miller, S., Caro, P., Koulaidis, V., de Semir, V., Staveloz, W. and Vargas, R. (2002) Benchmarking the
Promotion of RTD Culture and Public Understanding of Science. Brussels: Commission of the European Communities.
Ministry of Science, Technology and Innovation (MOSTI) – Malaysia, 2014. Introduction and
Background. Ministry of Science, Technology and Innovation official website. Located at http://www.mosti.gov.my/. Last updated: 25 June 2014. Accessed 25 June 2014.
Moon Hee, K.; 2005. “Human Resources Development for Knowledge Economy - Republic of Korea”. Asian Development Bank Institute. Motshekga, A. 2011. “2010 Matric pass rate 67.8%”. News article on news 24 website (accessed 02- 03-2011) http://www.news24.com/SouthAfrica/News/2010-matric-pass-rate-678-20110106 Mouton, J; Waast, R; Boschof, S. C; Grebe, E; Ravat, E; Ravjee, N; 2001. “Country Report on South
Africa”, in Science in Africa at the dawn of the 21st century. University of Stellenbosch (South Africa) and IRD (Paris)
Mouton, J ; Geevers, W, 2009. “Introduction: Genesis and history of public science in South Africa”,
in The State of Science in South Africa, 2009. Published by Academy of Science of South Africa (ASSAF). South Africa
Stellenbosch University https://scholar.sun.ac.za

387
Mouton, J; Boshoff, N; 2010. Bibliometric Analysis of Scientific Output of Selected African Countries. Chapter in African Innovation Outlook, 2010. African Union-Nepad-SEDA Publication MRC, 2001. Thirty years of the MRC - a history. Medical Research Council of South Africa Website. Located at http://www.mrc.ac.za/history/history.pdf. Accessed 09 July 2013. Murray, J. F, 1963. “History of the South African Institute for Medical Research, South African Medical Journal. April 1963 Nagahama, H, 1994. Scientific Literacy in Japan. Historical and Cultural Permeation and Current
Changes. Published in When Science Becomes Culture, proceedings from a conference held in Montreal, Canada April 10-13 1994. Available online at: http://www.cirst.uqam.ca/pcst3/PDF/actes/When%20science%20becomes%20culture.pdf. Accessed 06 February 2014
NASA, 2013. “The Decision to Go to the Moon: President John F. Kennedy's May 25, 1961 Speech before a Joint Session of Congress”. National Aeronautics and Space Administration - NASA History Office. Available online at http://history.nasa.gov/moondec.html. Updated October 29, 2013. Accessed 20 November 2013.
National Council of Applied Economic Research (NCAER). 2005. India Science Report. National Council of Applied Economic Research: New Deli. National Planning Commission (South Africa), 2012. National Development Plan 2030 Our Future- make it work. Department of the Presidency. Government Press. ISBN: 978-0-621-41180-5 NBEET, 1993. What do they know? : The understanding of science and technology by children in
their last year of primary school in Australia. Commissioned report by the Australian National Board of Employment, Education and Training no. 23. Canberra: Australian Government. Publication Services, 1993.
Ndulu B. J; 2004. “Human Capital Flight: Stratification, Globalization, and the Challenges to Tertiary Education in Africa”. Journal of Higher Education in Africa Vol. 2, No. 1, , pp. 57–91 NEPAD. 2006. Africa’s Science & Technology Consolidated Plan of Action. Compiled Dr John Mugabe
and Prof Aggrey Ambali. Available at: http://www.nepadst.org/doclibrary/pdfs/doc27_082005.pdf
Nisbet, M. C.; Scheufele, D. A.; Shanahan, J.; Moy, P.; Brossard, D.; Lewenstein, B. V.; 2002. “Knowledge, Reservations, or Promise? A Media Effects Model for Public Perceptions of
Science and Technology”. Communication Research. 29(5):584-608
NISTEP, 2002. The 2001 Survey of Public Attitudes Toward and Understanding of Science & Technology in Japan. National Institute of Science and Technology Policy Ministry of Education, Culture, Sports, Science and Technology. Available online at: http://www.nistep.go.jp/achiev/sum/eng/rep072e/rep72se.pdf. Accessed 24 January 2014
Noble, M., Barnes, H., Wright, G., Roberts, B.; 2008. Small Area Indices of Multiple Deprivation for
South Africa. Prepared for the UNU-WIDER Conference. Available online at www.hsrc.ac.za/en/research-data/ktree-doc/1160
Stellenbosch University https://scholar.sun.ac.za

388
Noble, D; 2013. “We are still saving British science from Margaret Thatcher?” Nature Online. April 17, 2013. Available online at http://www.nature.com/news/we-are-still-saving-british-science-from-margaret-thatcher-1.12800. Accessed 06 May 2013
NORC, 2013. General social surveys, 1972-2012 cumulative codebooks. Available online at:
http://publicdata.norc.org/GSS/DOCUMENTS/BOOK/GSS_Codebook_intro.pdf. Accessed 25 March 2014
Norris, S. P & Phillips, L. M.; 2003. How Literacy in Its Fundamental Sense Is Central to Scientific Literacy. Science Education, Volume 87, Issue 2, pages 224–240, March 2003 Nowotny, H, P Scott and M Gibbons 2001. Re-Thinking Science: Knowledge and the Public in an Age of Uncertainty, Cambridge, UK: Polity Press. NPTEL, 2013. Humanities and Social Sciences – Science, Technology and Society Lecture 27: Influence
of Freedom Movements on Scientific Research in India. Available online at http://nptel.ac.in/courses/109103024/pdf/module5/SM%20Lec%2027.pdf. Accessed 05 July 2014
NRUHSE, 2011. Russian Monitoring Survey of Innovative Behaviour of the Population by the National Research University Higher School of Economics. Available online at:
http://www.hse.ru/en/monitoring/innpeople/inp1#03
NSF, 2010. Science and Engineering Indicators 2010. Arlington, United States of America NSF, 2014. National Science foundation: Science and Engineering Indicators 2014. Available online at http://www.nsf.gov/statistics/seind14/. Accessed 25 March 2014. OECD, 1976. Science and Technology Indicators. Available online at: http://www.oecd.org/science/inno/msti.htm OECD, 1996. “The Knowledge-Based Economy” Organisation for Economic Cooperation and Development. Paris OECD; 2006. Assessing Scientific, Reading and Mathematical Literacy: A Framework for PISA 2006.
Available online at: http://www.keepeek.com/Digital-Asset-Management/oecd/education/assessing-scientific-reading-and-mathematical-literacy_9789264026407-en#page22. Accessed 27 March 2014.
OECD, 2007. Organisation for Economic Co-operation and Development: ‘Review of South Africa’s Innovation policy’, Paris: Directorate for Scientific and Technology Policy OECD. 26-27 March. OECD, 2009. Assessment framework: key competencies in reading, mathematics and science.
Available online at: http://www.oecd.org/pisa/pisaproducts/44455820.pdf. Accessed 27 March 2014
OECD, 2010. Main Science and Technology Indicators. 2009/01 Edition available online at: www.oecd.org/sti/msti
Stellenbosch University https://scholar.sun.ac.za

389
OECD, 2014. PISA 2012 Results: What Students Know and Can Do – Student Performance in Mathematics, Reading and Science (Volume I, Revised edition, February 2014), PISA, OECD Publishing. Available online at http://www.oecd.org/pisa/keyfindings/pisa-2012-results-volume-I.pdf. Accessed February 2014
Office of Science and Technology & The Welcome Trust; 2000. Science and the Public A Review of
Science Communication and Public Attitudes to Science in Britain. Available online at http://tinyurl.com/6a5b22e. Accessed 22 January 2014.
Osborne, J; 2003. Attitudes towards science: a review of the literature and its implications.
International Journal of Science Education. Vol. 25, No. 9, 1049–1079. Available online at: https://cset.stanford.edu/sites/default/files/files/documents/publications/Osborne-Attitudes%20Toward%20Science.pdf
Osborne, J.; 2007. ‘Science education for the Twenty First Century’, Eurasia Journal of Mathematics, Science and Technology Education, 3, (3), 173–184 Osborne, A; 2013. “Margaret Thatcher: one policy that led to more than 50 companies being sold or
privatised”. In the Telegraph. Located online at: http://www.telegraph.co.uk/finance/comment/alistair-osborne/9980292/Margaret-Thatcher-one-policy-that-led-to-more-than-50-companies-being-sold-or-privatised.html. Accessed 04 September 2014
Ostrom, T.M.; 1969. The relationship between the affective, behavioral, and cognitive components
of attitude. Journal of Experimental Social Psychology, Volume 5, Issue 1, January 1969, Pages 12–30
Otsubo, S. T; 2007. Post--war Development of the Japanese Economy. Presentation Available online
at http://www.gsid.nagoya-u.ac.jp/sotsubo/Postwar. Accessed 10 February 2014. Pagano, U; Ross, M.A.; 2009. “The crash of the knowledge economy” Cambridge Journal of Economics (2009) 33 (4): 665-683. Pardo, R and Calvo, F; 2002. Attitudes toward science among the European public: a methodological analysis. Public Understand. Science 11 (2002) page 155–195. Pella, M. O.; O'hearn, G. T.; Gale, C. W.; 1966. Referents to scientific literacy. Journal of Research in Science Teaching. Volume 4, Issue 3, pages 199–208, September 1966 Perkins, P; Fedderke, J; Luiz, J, 2005. An analysis of economic infrastructure investment in South
Africa. CSSR Working Paper No. 102. Centre for Social Science Research. University of Cape Town
Petraglia, M. D., Allchin, B; 2007. "Human evolution and culture change in the Indian subcontinent",
in The Evolution and History of Human Populations in South Asia: Inter-disciplinary Studies in Archaeology, Biological Anthropology, Linguistics and Genetics, Springer.
Pianta, M, 2004. “The impact of innovation on jobs, skills and wages”. Economia e Lavoro, n.1, 2004 Piedmont, R., L.; 2014. “Inter-item Correlations”. Encyclopaedia of Quality of Life and Well-Being Research. Pages 3 303 - 3 304.
Stellenbosch University https://scholar.sun.ac.za
390
Pike, J, 2010. "Nuclear Weapons Program – South Africa". Globalsecurity.org. Retrieved 15 June 2011. Polzer, T; 2010. Migration Fact Sheet 1: Population Movements in and to South Africa. Forced
Migration Studies Programme. University of the Witwatersrand. Available online at: http://www.cormsa.org.za/wp-content/uploads/2010/07/fmsp-fact-sheet-migration-in-sa-june-2010doc.pdf . Accessed 17 May 2013
Pouris, A; 1989. The hidden crisis - S&T and Manpower development in South Africa. Pretoria, South Africa: Foundation for Research and Development Pouris, A. 1991. Understanding and appreciation of science by the public in South Africa. South African Journal of Science. Vol 87, August 1991. Pouris, A. 1993. Understanding and appreciation of science among South African teenagers. South African Journal of Science. Vol 89, February 1993. Pouris, A. 2001. Interests, Public attitudes and Sources of Scientific Information in South Africa. Pouris, A. 2006. "Assessing the knowledge base for biotechnology in South Africa." Scientometrics 68(1): 97-108. Power, D; 1897. “Sharp, William (1805-1896)”. Dictionary of National Biography, 1885-1900, Volume
51. Smith, Elder & Co. Accessed on 22 October 2013. Available online at:
http://en.wikisource.org/wiki/Sharp,_William_(1805-1896). Pronina, L; 2013. China to Influence Emerging Economies More Than U.S. Bloomberg News service.
Accessed 06 June 2014. Available online at http://www.bloomberg.com/news/2013-01-10/china-to-influence-emerging-economies-more-than-u-s-hsbc-says.html.
Pwiti, G.; 1991. “Trade and economies in Southern Africa: the archaeological evidence”. Zambezia XVIII (18) 2 Raza, G., Singh, S., Dutt, B.; 1995. Public Understanding of Science and Literacy Campaign in India. National Institute of Science, Technology and Development Studies (CSIR). Available online
at: http://st.niscair.res.in/sites/default/files/MHRD%201995%20report.pdf. Accessed 15 July 2014.
Raza, G., Singh, S., & Dutt, B. 2002. "Public, Science, and Cultural Distance." Science Communication. 23(3):293-309 Raza, G and Singh, S; 2008. Public understanding of Science in India. India, Science and Technology. Reddy, V.; Juan, A.; Gastrow, M; Bantwini, B; 2009. Science and the publics: A review of Public Understand of Science studies. HSRC, Pretoria. Reddy V, Gastrow M, Juan A, Roberts B, B; 2013. Public attitudes to science in South Africa. South African Journal of Science Volume 109 | Number 1/2 January/February 2013
Stellenbosch University https://scholar.sun.ac.za
http://www.cormsa.org.za/wp-content/uploads/2010/07/fmsp-fact-sheet-migration-in-sa-june-2010doc.pdf

391
Reddy, V.; Juan, A.; Hannan, S.; Arends, F.; Gastrow, M; Roberts, B; 2015. Science Awareness, Attitudes and astronomy: Continuity and Changes South African Social Attitudes Survey 2013. Human Sciences Research Council, 2015. Available online at: http://www.timss-sa.org.za/?wpfb_dl=31
Reser, J. P.; Bradley,G. L.; Glendon, A. I.; Ellul, M. C.; Callaghan, R.; 2012. Public Risk Perceptions, Understandings, and Responses to Climate Change and Natural Disasters in Australia, 2010
and 2011. National Climate Change Adaptation Research Facility, Gold Coast, 245 pp Rip, A; 1997. “Qualitative Conditions of Scientometrics: The New Challenge”. Scientometrics, 38 (1), (1997), 7–26. Roberts, D.A; 1983 Scientific Literacy: towards balance in setting goals for school science programs. A discussion paper for the Science Council of Canada. Ottawa: science council of Canada. Roberts, D. A. 2007. Scientific literacy/science literacy. In S. K. Abell & N. G. Lederman (Eds.),
Handbook of research in science education (pp. 729 – 779). Mahwah, NJ: Erlbaum. Section available online at: http://faculty.education.ufl.edu/tsadler/Roberts-SciLit.pdf. Accessed 15 November 2013
Rokeach, M. (1968). Beliefs, attitudes, and values: A theory of organization and change. San
Francisco, CA: Jossey-Bass. Rose, N; 1999. Powers of Freedom: Reframing Political Thought. Cambridge, UK: Cambridge
University Press. Available online: http://assets.cambridge.org/97805216/50755/sample/9780521650755wsc00.pdf
Royal Society, 1985 The Public Understanding of Science. London: Royal Society. Royal Society, 2007. International Indicators of Science and the Public workshop. Conference Proceeding. Salvadori, N. 2003. The Theory of Economic Growth: A Classical Perspective. Cheltenham: Edward Elgar. Sapp, G; 1992. Science Literacy: A Discussion and an Information-based Definition. College &
Research Libraries. vol. 53 no. 1 21-30. Available online at: http://crl.acrl.org/content/53/1/21.full.pdf+html. Accessed 23 December 2013
Sasol, 2005. Unlocking the potential wealth of coal. Publicity Brochure published by Sasol. www.sasol.com/sasol_internet/.../CTL_Brochure_1125921891488.pdf Scerri, Mario; 2008. “The Parameters of Science and Technology Policy Formulation in South Africa”. African Development Review. Volume 10, Issue 1, pages 73–89, June 1998 Seekings, J, 2003. “Social Stratification and Inequality in South Africa at the end of Apartheid”. CSSR
Working Paper No. 31. Centre for Social Science Research. University of Cape Town. Available online at http://cssr.uct.ac.za/sites/cssr.uct.ac.za/files/pubs/wp31.pdf. Accessed 22 April 2013
Stellenbosch University https://scholar.sun.ac.za

392
Shamos, M. H, 1995. “The Myth of Scientific Literacy”. Rutgers University Press. New Jersey. Shen, B.; 1975. Science literacy: public understanding of science is becoming vitally needed in
developing and industrialized countries alike. American Scientist 63 (May-June 1975), 265-268.
Shephard, A; 2003. "Income Inequality under the Labour Government". Briefing Note No. 33.
Institute for Fiscal Studies. Available online at: http://www.ifs.org.uk/bns/bn33.pdf. Retrieved 18 January 2013.
Shukla, R.; 2005. India Science Report Science Education, Human Resources and Public Attitude
towards Science and Technology. Chapter 4: Public Attitude towards Science and Technology. Available online at: http://www.insaindia.org/pdf/India_Science_report-Main.pdf. Accessed: 13 July 2014.
Shukla, R.; Bauer, M.; 2009. Construction and Validation of ‘Science Culture Index’: Results from
Comparative Analysis of Engagement, Knowledge and Attitudes to Science: India and Europe. Working Paper No: 100, Royal Society, UK
Singh, S. and Raza, G.; 2012. Shift in Cultural Distance between Science and Public: Evidence of
Kumbh Survey Studies. Available online at: http://st.niscair.res.in/publications/shift-cultural-distance-between-science-and-public-evidence-kumbh-survey-studies-0. Accessed 16 July 2014.
Slocum-Gori, S. L.; Zumbo, B. D.; 2011. Assessing the Unidimensionality of Psychological Scales: Using Multiple Criteria from Factor Analysis. Social Indicators Research July 2011, Volume 102, Issue 3, pp 443–461
Smith, L. I; 2002. “A tutorial on Principal Components Analysis”. Online tutorial series. Available at: http://www.cs.otago.ac.nz/cosc453/student_tutorials/principal_components.pdf Snow, C.P. 1959. Rede Lecture. Cambridge University. Press, Cambridge, England. Available online at:
http://s-f-walker.org.uk/pubsebooks/2cultures/Rede-lecture-2-cultures.pdf. Accessed 08 December 2012
Song, J.; Chung, M.; Choi, E.; Kim, L.; Cho, S. K.; 2008. Developing the Indicator System for Diagnosing
the National Status Quo of Science Culture. Journal of the Korean association for science education; vol. 28; no. 4; page: 316-330. Translated from Korean to English using https://translate.google.com/
Song, J.; Chung, M.; Choi, E.; Kim, L.; Cho, S. K.; 2011. How to compare the social foundations of science culture: A trial with five cities in Korea. Public Understanding of Science 22: 110 Stanat, P; Artelt, C; Baumert, J; Klieme, E; Neubrand, M; Prenzel, M; Schiefele, U; Schneider, W;
2002. PISA 2000: Overview of the study—Design, method and results. Max Planck Institute for Human Development. Berlin. Available online at: https://www.mpib-berlin.mpg.de/Pisa/PISA-2000_Overview.pdf. Accessed 06 June 2013.
Stastny, K; 2005. Risk Communication and Asymmetric Information in the Case of Mad Cow Disease.
Unpublished senior thesis. Available online at: http://tinyurl.com/o99fe4h.Accessed 11 November 2013
Stellenbosch University https://scholar.sun.ac.za

393
Stats Canada, 2013. Scientific Literacy in PISA. Programme for International Student Assessment information website. Direct link: http://www.pisa.gc.ca/eng/science.shtml. Accessed 27 March 2014
StatSA, 2012. Census 2011: Statistical release (Revised). Publication number: P0301.4. Publication
date 06 October 2012. Accessed 22 March 2013. Available online at: http://www.statssa.gov.za/Publications/P03014/P030142011.pdf
StatSA, 2013. Quarterly Labour Force Survey Quarter 1, 2013. Publication number: P0211.
Publication date 06 May 2013. Accessed online http://www.statssa.gov.za/publications/P0211/P02111stQuarter2013.pdf
StatsSA, 2014. “Mid-year population estimates 2014” PO302 Statistics South Africa, Pretoria. Accessed online: http://www.statssa.gov.za/publications/P0302/P03022014.pdf StatSA, 2016. Quarterly Labour Force Survey Quarter 1, 2016. Publication number: P0277.
Publication date 04 July 2016. Accessed online http://www.statssa.gov.za/publications/P0277/P0277March2016.pdf
State Council of the People’s Republic of China (2006) The Outline of the Action Plan for Improving Scientific Literacy for All (From 2006–2010 and then 2010–2020). Beijing: The People Press. Stocklmayer, S & Gilbert, J.K.; 2002. 'New experiences and old knowledge: Towards a model for the
personal awareness of science and technology', International Journal of Science Education, 24: 8,
Stokes, D.E. 1997: Pasteur´s Quadrant – Basic Science and Technological Innovation, Washington DC. Sturgis, P and Allum, N. 2004. “Science in Society: Re-Evaluating the Deficit Model of Public Attitudes.” Public Understanding of Science. Vol 13 p 55-74. Struwig, J. and Roberts, B.; 2011. Heart of the matter nuclear attitudes in South Africa. HSRC review, Vol 10 Number 2. June 2012. Sun, M; 2010. Science Education and Communication in China: Policies and Measures. China
Association for Science and Technology (CAST). Presentation available online at http://cache-www.intel.com/cd/00/00/45/51/455169_455169.pdf. Accessed 28 June 2014
Tardy, C.; 2004. The role of English in scientific communication: Lingua franca or Tyrannosaurus Rex? Journal of English for Academic Purposes 3(3):247-269 · July 2004 The American Association for Public Opinion Research. 2011. Standard Definitions: Final Dispositions of Case Codes and Outcome Rates for Surveys. 7th edition. AAPOR. Thomson, S.; Hillman, K.; Wernert, N.; Schmid, M.; Buckley, S.; Munene, A.; 2011. Highlights from
the reports: Monitoring Australian Year 4 student achievement internationally: TIMSS and PIRLS 2011. Report available online at: http://www.acer.edu.au/documents/TIMSS-PIRLS_Australian-Highlights.pdf . Accessed 22 February 2014
Tiley-Nel, S. (Ed). 2010. Mapungubwe Remembered: A legacy of the University of Pretoria and Mapungubwe. Chris Van Rensburg Publishing (Pty) Ltd.
Stellenbosch University https://scholar.sun.ac.za

394
Torun-Cumhur Çiçekçi, H; 2007. Innovation: Is the engine for the economic growth? Ege University,Turkey. Accessable online at: http://www.tcmb.gov.tr/yeni/iletisimgm/Innovation.pdf. Accessed 22 July 2013.
Turner, S; 2008. School science and its controversies; or, whatever happened to scientific literacy?
Public Understanding of Science 2008 17: 55. Available online at http://pus.sagepub.com/content/17/1/55.full.pdf. Accessed 16 July 2013
UNDP-HDI, 2013. Human Development Report 2013: The Rise of the South: Human Progress in a Diverse World. Published by the United Nations Development Programme (UNDP), New
York. Available online at http://hdr.undp.org/en/mediacentre/ United Nations Statistical Services Branch; 2006. Standard Country or Area Codes for Statistical Use.
Available online at http://unstats.un.org/unsd/methods/m49/m49.htm. Accessed 14 March 2014.
Van der Berg, S & Louw M., 2003. “Changing patterns of South African income distribution: Towards time series estimates of distribution and poverty”. Paper to the Conference of the Economic
Society of South Africa, Stellenbosch, 17-19 September 2003. Accessed online on 27-05-2011. Available at http://www.sarpn.org.za/documents/d0000727/P800-Poverty_trends_vdBerg_Louw.pdf
Van der Berg, S; 2010. “Current poverty and income distribution in the context of South African
history”. Stellenbosch Economic Working Papers: 22/10 October 2010. Accessed online on 13-06-2011. Available at www.ekon.sun.ac.za/wpapers/2010/wp222010/wp-22-2010.pdf
Van Rooyen, C, 2004. “Science not a priority for SA Press”. Science in Africa. Accessed April 2011. Available at: www.scienceinafrica.co.za/2004/april/pressscience.htm Van Weijen, D.; 2012. The Language of (Future) Scientific Communication. Research Trends, issue 31
November 2012. Available online at https://www.researchtrends.com/issue-31-november-2012/the-language-of-future-scientific-communication/
Vavi, Z, 2010. “The legacy of apartheid is still with us”. COSATU, accessed online 12-06-2011 from:
http://www.politicsweb.co.za/politicsweb/view/politicsweb/en/page71654?oid=177433&sn=Detail
Weeks, F. H. The quest for a culture of learning: a South African schools perspective. SA Journal of
Education, Vol 32, No 1 (2012). Available online at: http://www.sajournalofeducation.co.za/index.php/saje/article/view/565. Accessed 06 May 2013
Wenning, C.; Wenning-Vieyra, R.; 2009. Teaching High School Physics: A resource for teacher
preparation and professional development. Chapter 10: Scientific Literacy The Main Goal Of Science Education. Available online at: http://www.phy.ilstu.edu/~wenning/thsp/chapters/Scientific_Literacy[1].pdf. Accessed 22 April 2013
Wenning, C. J.; 2011. Science literacy: What it is, how to assess it, and a way to achieve it. Illinois State University. Unpublished presentation. Available online at: http://www.phy.ilstu.edu/pte/INDONESIA/G.%20SciLit-What_&_How.pptx. Accessed 06 January 2014.
Stellenbosch University https://scholar.sun.ac.za

395
Worden, N; 1994. The Making of Modern South Africa: Conquest, Apartheid, Democracy. Blackwell Publishers. Edition 5, 2012. Tavakol, M.; Dennick, R.; 2011. Making sense of Cronbach’s alpha. International Journal of Medical
Education. 2011; 2:53-55. Available online at: https://www.ijme.net/archive/2/cronbachs-alpha.pdf. Accessed: 23 March 2016
The World Bank, 2011. Purchasing Power Parities and Real Expenditures of World Economies
Summary of Results and Findings of the 2011 International Comparison Program. Available online at http://siteresources.worldbank.org/ICPINT/Resources/270056-1183395201801/Summary-of-Results-and-Findings-of-the-2011-International-Comparison-Program.pdf. Accessed 15 June 2014
Thelwall, M.; 2016. Interpreting correlations between citation counts and other indicators. Scientometrics July 2016, Volume 108, Issue 1, pp 337–347 Tredoux, C.; Durrheim, K. (Eds).; 2002. Numbers, hypotheses and conclusions: A course in statistics for the social sciences. Juta: Cape Town. Turney, J.; 2003. How Greenfield got it wrong. The Guardian, Thursday 17 April 2003. Available online at: http://www.theguardian.com/education/2003/apr/17/research.highereducation1 Venkateswaran, T. V.; 2013. Vigyan Mandir experiment – the first mass scientific literacy effort in
India. Conference paper presented at the Fifth International Conference to review research on Science, Technology and Mathematics Education. Homi Bhabha Centre for Science Education, Mumbai, India January 7, 2013 – January 11, 2013. Available online at: http://episteme.hbcse.tifr.res.in/index.php/episteme5/5/paper/view/102. Accessed 01 August 2014.
WikiCommons, 2013. “South Africa - Location Map (2013) - ZAF - UNOCHA.svg”. Available at
Wikipedia Commons at location: https://en.wikipedia.org/wiki/File:South_Africa_-_Location_Map_(2013)_-_ZAF_-_UNOCHA.svg
Williams, W., 2006. Existing National and International Database Comparisons: A regional study of community attitudes and engagement with science and technology in Australia. Wilson, E. O.; 1998. “Consilience: The Unity Of Knowledge”. Vintage Books. New York. Available online at: http://wtf.tw/ref/wilson.pdf Wilson, J.; Tyedmers, P.; Pelot, R.; 2007. Contrasting and comparing sustainable development indicator metrics Article in Ecological Indicators. Ecological Indicators 7 (2007) 299–314 Wolff, M. R, Barton, A. C; 2004. Rethinking Scientific Literacy. Taylor and Francis (Routledge) United Kingdom. Accessed online at Google books Wu, M. L.; 2009. A Comparison of PISA and TIMSS 2003 achievement results in Mathematics.
Prospects. March 2009, Volume 39, Issue 1, pp 33-46. Available online at: http://www.iea.nl/fileadmin/user_upload/IRC/IRC_2008/Papers/IRC2008_Wu.pdf. Accessed 11 November 2013
Stellenbosch University https://scholar.sun.ac.za

396
Wyatt, N.; Stolper, D.; 2013. Science literacy in Australia. Report prepared for: Australian Academy of Science. Wynne, B. (1992). Public understanding of science research: New horizons or hall of mirrors? Public Understanding of Science, 1(1), 37–43. Yechury, S; 2008. “Eat your words Mr Bush!”. Hindustan Times, India, May 8 2008. Accessed online 07-06-2011. Available at http://worldmeets.us/hindustantimes000003.shtml#axzz1RdEz5eIj Zhang, Z and Zhang, J.; 1993. A survey of public scientific literacy in China. Public Understanding of Science January 1993 issue 2, page 21-38. Ziman, J. 1991. "Public Understanding of Science." Science, Technology,& Human Values.16(1): 99- 105 Zuzovsky, R.; 1997. Assessing Scientific and Technological Literacy among Sixth Graders in Israel. Studies in Educational Evaluation, vol. 23 number 3
Stellenbosch University https://scholar.sun.ac.za

397
Appendix 1
POPULATION DESCRIPTION
South Africa is a country of 9 provinces as well as multiple cultural and linguistic groupings that form
the foundations of an eclectic mix of various segments of the general South African public. Covering
an expanse of 1.2 million square-kilometres, the current population of South Africa is estimated at
54 million people (StatsSA, 2014). The country has 3 official capital cities and 4 major metropolitan
areas, namely, Johannesburg-Pretoria, Cape Town and Durban, with multiple regional hubs in each
province (see Figure A1-1).
Figure A1-1: General map of South African major cities (Source: WikiCommons, 2013)
Among the total population of 54 million people, 30% of South Africans are below the age of 15
years old, while 51% are female and 49% are male. The vast majority of the South African population
is therefore between the ages of 18 and 59 years old and, despite large unemployment, many are
considered part of the headcounts of economically active South Africans (StatsSA, 2012). This study
therefore undertook data collection accessing a nationally representative sample based, in part, on
the population profile within the latest available completed South African Census data.
The South African National Census was completed in 2011 and yielded a total national population of
54 002 000 individuals. As 30% of these individuals are aged below 15 years old, the total population
that forms the basis of this study is therefore 37 664 000 individuals. While specific sample selection
and related information has been reported in Chapter Four this will be briefly recapped in the below
section. The survey fieldwork, run by IPSOS, yielded a representative sample of the South African
population. A total sample of 4 123 South Africans was interviewed in face-to-face home-based
Stellenbosch University https://scholar.sun.ac.za

398
interviews. Sampling units and housing units were identified using established and accepted
fieldwork rotation means, while interviewees within the residential units were identified using a
selection grid (see chapter 4). These included 2 959 urban and 1 164 rural and deep-rural interviews
by fieldwork completion (n = 4 123). Results from the fieldwork were then cleaned and weighted
back to the valid population of 37 664 000 individuals from which the sampling frame was
developed. The sampling frame was based on the All Media and Products Survey (AMPS) sampling
frame, which in turn is based on the South African National Census 2011. Following the cleaning
process a total of 506 units148 were found to be incomplete or refused to participate fully, while a
further 131 units were found to be below the specified age criteria149 yielding a final valid sample for
this survey of 3 486 individual units. These 3 486 individual reporting units were then weighted by
province and estimations for the entire population are provided in figure A1-2 below.
Figure A1-2: Sample and Population per Province, South Africa (Source: With Permission: IPSOS Public Affairs)
As per the population estimates within the national census, each provincial sample cohort was
calculated on actual population representation and similarly the sample within in each province
reflects the same population demographic profile to ensure representivity. Weights were applied
based on in-Province population characteristics such as age, gender, population group, community
size and related demographic criteria. Further to this the sample weighting and benchmarking was
completed using data from the South African Audience Research Foundation (SARF) called the All
Media and Products Survey (AMPS). AMPS is a highly respected data source within South Africa and
issues two data releases per annum, in their coverage of more than 25 000 individuals in each of the
2 survey waves. The AMPS survey forms the basis of most every large public opinion and consumer
148
Units in this sense implies individuals surveyed 149
As this is an omnibus survey, the age limitation was only enforced for this study module
Stellenbosch University https://scholar.sun.ac.za

399
insights survey in South Africa and is closely correlated to population distributions within the
National Census.
Comparisons between the Khayabus survey sample distribution statistics that of the AMPS survey as
well as the National Census data were compared and revealed a high degree of consistency between
the population characteristics distribution of the 3 data sets. Presented below are selected items
from within the comparison to illustrate the high-degree of consistency between the 3 datasets as
well as the overall national representivity achieved in employing the Khayabus Survey as the vehicle
for the data collection within this study (see Table A1-1 below150).
South African National Distributions
Gender Khayabus 2015 (18+: n= 3 486)
AMPS (18+)
CENSUS 2011 (18+)
Male 48.5% 47.8% 47.7%
Female 51.5% 52.2% 52.3%
Total 100.0% 100.0% 100.0%
Race Khayabus 2015 AMPS CENSUS 2011*
White 10.4% 10.3% 10.8%
Black 77.5% 77.9% 76.6%
Indian / Asian 2.7% 2.8% 2.9%
Coloured 9.4% 9.1% 9.0%
Total 100.0% 100.0% 99.4.0%
Province Khayabus 2015 AMPS CENSUS 2011
Western Cape 12.0% 11.7% 12.1%
Eastern Cape 11.7% 12.0% 11.7%
Northern Cape 2.1% 2.2% 2.2%
Free State 5.0% 5.3% 5.3%
KwaZulu Natal 18.9% 18.7% 18.7%
North West 6.9% 6.8% 6.8%
Gauteng 25.7% 26.3% 26.3%
Mpumalanga 7.9% 7.5% 7.5%
Limpopo 9.8% 9.5% 9.5%
Total 100.0% 100.0% 100.0%
Table A1-1: Metro and Non Metro weighted Sample comparison with AMPS sampling data age 18+ (Source: IPSOS Public Affairs) (*OTHER category in Census 2011 not represented)
As can be seen in table A1-1, small variations do exist between the Khayabus as well as the AMPS
distributions and the National Census data. This observed variation is likely as a result of in-field
substitutions and sampling error; however results maintain the required level of accuracy and still
remain acceptable for its intended application within this study. The detailed statistical
considerations and techniques adopted in developing the survey sampling frame as well as the
related data sources and benchmarking practices further underpins the overall reliability of the
quality of the survey sample presented within the Khayabus Wave 2 of 2015.
150
Data is weighted and figures represent values for the population not the survey sample
Stellenbosch University https://scholar.sun.ac.za

400
The American Association for Public Opinion Research (AAPOR) defines survey response rates to
include, “the number of complete interviews with reporting units divided by the number of eligible
reporting units in the sample” (AAPOR, 2011). The AAPOR further defines 6 categories of response
rates, each with varying definitions, depending on the scope and operationalisation of the fieldwork
for the research. Within the survey fieldwork a total sample of 4 123 units were interviewed.
Accounting for missing values, refusals, age cut-offs (M-R-A) and other non-response categories, all
respondents within the 3 617 valid participants completed all question sections within this module,
thus yielding a 100% raw-response rate to all survey items. Following the completion of data
cleaning and quality assurance procedures the survey yielded a final valid sample of 3 486
individuals, as well as a survey response rate of 96.38 %. As the Khayabus survey has set deliverables
on the sample size, measures are in place to allow appropriate respondent substitution to ensure
that the final survey size meets the design specifications.
Question Section Sample M-R-A
Values* Valid
Responses
Raw Response
rate
Total Response
Rate
SECTION A: Scientific knowledge 3 617 131 3 486 100% 96.38%
SECTION B: Attitude to science** 3 617 131 3 486 100% 96.38%
SECTION C: Interest in science 3 617 131 3 486 100% 96.38%
SECTION D: Informedness about science 3 617 131 3 486 100% 96.38%
SECTION E: Information sources about science 3 617 131 3 486 100% 96.38%
SECTION F: Participation in science engagement activities 3 617 131 3 486 100% 96.38%
* M-R-A Values: Missing, Refusals, Age criteria cut -off
Table A1-2: Response rates for the Public Understanding of Science Khayabus Survey Module, 2015 wave 2
Table A1-2 details the response rates for each section of the questionnaire, providing both raw
response rate151 as well as total survey response rates152. This metadata reveals that of the
individuals that responded to the Khayabus survey, respondents answering this particular
questionnaire module completed all required questions. The next section will provide additional
insight into the sample composition, geographic location as well as demographic analysis on selected
variables.
5.3 DEMOGRAPHIC PROFILE of SAMPLE
The previous section detailed the sample composition and addressed issues pertaining to national
representivity of the data. The following section will explore selected demographic variables within
the sample to develop some insights into the demographic context of the overall sample. Within the
demographic data collected in the Khayabus Survey, 7 items will be explored in this section,
151
Raw response rate based on Total Response / Total Surveyed Units. 152
Total survey response rate is the response rate for Total Valid Response / Total Responses per Question Set.
Stellenbosch University https://scholar.sun.ac.za

401
including: province, gender, population group, age, working status, levels of education as well as
household income.
Within this study design respondents from all 9 South African provinces are represented within the
coverage footprint as detailed in Table A1-33. The majority of respondents were from the Gauteng
province (32.5%), followed by KwaZulu Natal (18.3%), the Western Cape (12.8%) and the Eastern
Cape Province (11.2%). The provincial boundaries of these South African provinces are home to the
five major Metropolitan areas namely Johannesburg-Pretoria, Cape Town, Durban and Port
Elizabeth. Combined, these 4 provincial areas account for 74.9% of the total sample covered in the
Khayabus Survey, while the remaining 5 provinces jointly account for the remaining 25.1% of
respondents.
Frequency Percent Valid % Cumulative %
WESTERN CAPE 447 12.8 12.8 12.8
EASTERN CAPE 390 11.2 11.2 24.0
NORTHERN CAPE 85 2.4 2.4 26.4
FREE STATE 149 4.3 4.3 30.7
KWAZULU NATAL 639 18.3 18.3 49.1
NORTH WEST 167 4.8 4.8 53.8
GAUTENG 1134 32.5 32.5 86.4
MPUMALANGA 212 6.1 6.1 92.5
LIMPOPO 263 7.5 7.5 100.0
Total 3 486 100.0 100.0
Table A1-3: Provincial representation in Khayabus wave 2, 2015
Contained within the total sample of 3 486 participants, 56.8% were from metropolitan areas, 4.8%
were from cities and 4.3% from large towns. These areas combined account for 65.9% of total
responses to the survey, while 9.0% of responses were obtained within small towns and villages.
Further to the above, responses were collected from rural and deep rural areas across all 9
provinces, which combined accounted for 34.1% of the total survey response (See Table A1-4).
QUESTIONNAIRE CATEGORIES
Rural- Urban
Questionnaire Categories
Frequency %
Recoded Variable
Frequency %
CITY 166 4.8
Urban 2 297 65.9%
LARGE TOWN 151 4.3
Rural 1 189 34.1%
METRO 1 980 56.8
Total 3 486 100.0%
SMALL TOWN 205 5.9
RURAL 875 25.1
VILLAGE 109 3.1
Total 3 486 100.0
Table A1-4: Total sample by geographic area type in Khayabus wave 2, 2015
Stellenbosch University https://scholar.sun.ac.za

402
These 6 community size clusters were recoded, using the Recode facility within SPSS 24.0 to create a
new variable called Rural-Urban. The recoding was achieved by combining the responses for
metropolitan areas, cities and large towns as a single urban classification. Similarly the responses
under the questionnaire categories small towns153, rural and village were classified in a single rural
classification. Results for the recoded classifications of community size are presented in Table A1-4
above.
The gender distribution within the sample is reflective of the National Census 2011. Among the 3
486 participants in this study females comprised 50.1%, while males accounted for 49.9% of the total
sample. Table A1-5 below presents the total sample of 3 486 individuals split by gender
classification.
Frequency Percent Valid % Cumulative %
Female 1 747 50.1 50.1 50.1
Male 1 739 49.9 49.9 100.0
Total 3 486 100.0 100.0
Table A1-5: Total sample by Gender distribution in Khayabus wave 2, 2015
Similar to the geographical splits by province, overlaying gender characteristics within provincial
data reveals that the gender representation per province continues to reflect the National Census
population characteristic154. Gauteng province achieved the largest overall contribution to the
national population despite being the smallest geographical area. Data from within the survey for
the Gauteng province indicates that of the 1 134 individuals surveyed in the province, 575 were
female (50.7%) while 559 were male (49.3%). Within KwaZulu-Natal, the survey recorded more
males (50.5%) than females (49.5%), while within the Western Cape; a similar pattern emerged, with
49.2% of respondents being female, while 50.8% were male. The province with the biggest
difference between the gender groupings was Mpumalanga, where 51.4% of respondents were
female (109) and 48.6% were male (103), a value consistent with Census 2011 data for this province
(see Table A1-6).
153
Due to the definition applied for Small Town, these areas have been grouped under Rural, as they represent
commercial centres within predominantly Rural and agricultural areas 154
For those South Africans aged 18 years and older N = 37 664 000
Stellenbosch University https://scholar.sun.ac.za

403
TOTAL Female Male
COUNT % COUNT %
Eastern Cape 390 194 49.7% 196 50.3%
Free State 149 75 50.3% 74 49.7%
Gauteng 1 134 575 50.7% 559 49.3%
KwaZulu-Natal 639 316 49.5% 323 50.5%
Limpopo 263 131 49.8% 132 50.2%
Mpumalanga 212 109 51.4% 103 48.6%
North West 167 84 50.3% 83 49.7%
Northern Cape 85 43 50.6% 42 49.4%
Western Cape 447 220 49.2% 227 50.8%
Total 3 486 1 747 50.1% 1 739 49.9%
Table A1-6: Total sample by Gender and Province in Khayabus wave 2, 2015
South Africa is a country that still carries many of the legacy influences of its former apartheid
system of racial segregation, influencing numerous aspects of contemporary life. As a result of this
racially based population classification under the apartheid government, in present day South Africa
major population classifications still reflect these grouping classifications. In contemporary South
Africa while income inequality, access to resources and infrastructure as well as social services is no
longer planned along racial classifications, many areas remain racially segmented, in geographic and
demographic terms, as a result of the legacy impacts of apartheid, poverty and social engineering. As
such the below discussion of population groups is presented from the premise that as a result of the
many legacy impacts and inequalities stemming from the apartheid past, identifying areas requiring
greater intervention remains valuable, and understanding its racial dynamics would continue to be
useful within the South African context.
Frequency Percent Valid %
Black 2 523 72.4 72.4
White 408 11.7 11.7
Indian / Asian 121 3.5 3.5
Coloured 434 12.4 12.4
Total 3 486 100.0 100.0
Table A1-7: Total sample by Population Group breakdown in Khayabus wave 2, 2015
Within the total sample of 3 486 participants, the general population group profile is presented in
Table 5.7. Black South Africans represented 72.4% of the total sample, followed by coloured
participants (12.4%), white (11.7%) and Indian / Asian participants (3.5%). These population groups
analysed alongside the variable of Gender highlights the Gendered composition of the population
groups discussed (see table A1-8). Specific in-group variances were noted with respect to gender and
population group; however this broadly reflects the overall National demographic profile in South
Africa.
Stellenbosch University https://scholar.sun.ac.za

404
Total Female Male
Count % Count %
White 408 203 49.8% 205 50.2%
Black 2 523 1 267 50.2% 1 256 49.8%
Indian / Asian 121 58 47.9% 63 52.1%
Coloured 434 219 50.5% 215 49.5%
Total 3 486 1 747 50.1% 1 739 49.9%
Table A1-8: Total sample by Population Group and Gender breakdown in Khayabus wave 2, 2015
Previous studies on scientific literacy and the public understanding of science have noted the
influence of respondent age on general survey results (see Chapter 3). Within the Khayabus survey
respondents were asked to provide an indication of their age. South Africa has a large youth
population, with more than 60% of the national population being below the age of 35 years (StatsSA,
2014). Within the current research, only respondents 18 years and older were considered, however
a profile similar to the national Census emerges, when looking at the age data from within the
survey results. Table A1-9 defines the age profile of survey participants within the 11 questionnaire
age group clusters.
Frequency Percent Valid % Cumulative
%
18 – 19 years 170 4.9 4.9 4.9
20 – 24 years 563 16.2 16.2 21.0
25 – 29 years 538 15.4 15.4 36.5
30 – 34 years 526 15.1 15.1 51.5
35 – 39 years 430 12.3 12.3 63.9
40 – 44 years 334 9.6 9.6 73.5
45 – 49 years 264 7.6 7.6 81.0
50 – 54 years 199 5.7 5.7 86.7
55 – 59 years 173 5.0 5.0 91.7
60 – 64 years 123 3.5 3.5 95.2
65+ years 152 4.4 4.4 99.6
Refusal 14 0.4 0.4 100.0
Total 3 486 100.0 100.0
Table A1-9: Total sample by self-reported age groupings in Khayabus wave 2, 2015
As with the rural-urban variable, the Age variable was recoded within SPSS as a data reduction
strategy toward streamlining the analysis and presenting more meaningful analysis of this important
variable. The original 11 age categories presented in table A1-9, were recoded into a NEW AGE
variable that had now combined these into 6 age categories. To achieve this, the 18 and 19 years
category was retained and renamed < 20 years, while every category beyond this was defined into
decade segments until the age of 59 years. Participants reporting age in excess of 59 years old were
categorised into a category called 60+ years. These recoded age categories are presented in table
A1-10 below.
Stellenbosch University https://scholar.sun.ac.za

405
Frequency Percent Valid
Percent Cumulative
Percent < 20 years 170 4.9 4.9 4.9
20-29 years 1 101 31.6 31.7 36.6
30-39 years 956 27.4 27.5 64.1
40-49 years 598 17.2 17.2 81.4
50-59 years 372 10.7 10.7 92.1
60+ years 275 7.9 7.9 100.0
Total 3 472 99.6 100.0
Missing 14 0.4
Total 3 486 100.0
Table A1-10: Recoded Age categories in Khayabus wave 2, 2015
Age grouping clusters within the Khayabus Survey similarly identifies the combined age groups 18-35
years old as being the largest segment of the sample within this study, accounting for 51.5% of the
total response. Within the above recoded age cohorts, adults aged between 20 and 29 years account
for 31.6% of the total sample of 3 486 participants. Individuals between the ages of 30 and 39 years
account for 27.4%, while those reporting in the category 40-49 years made up 17.2% of all fieldwork
responses. Respondents older than 50 years accounted for 18.6% of total response. Within the total
sample, 14 respondents selected the refuse option and did not divulge their age155 (0.4%).
The very large youth population in South Africa is not uncommon within developing nations;
however an additional consideration would be the current employment status of these individuals.
Employment status can be seen as an indicator of economic productivity within this large youth
segment with the national population. Data from within this study reveals respondent working life
status through the use of 7 categories describing current employment status (see table A1-11).
Frequency Percent Valid %
Working full-time 1 265 36.3 36.3
Working part-time 288 8.3 8.3
Not Working - Housewife 152 4.4 4.4
Not Working - Student 274 7.9 7.9
Not Working - Retired 228 6.5 6.5
Unemployed - seeking work 1 081 31.0 31.0
Unemployed - not seeking work 198 5.7 5.7
Total 3 486 100.0 100.0
Table A1-11: Total sample by employment status groupings in Khayabus wave 2, 2015
Individuals reporting some form of employment accounted for 44.5% of total response, comprising
of 36.3% working full-time while a further 8.3% report being employed in a part-time capacity.
Parallel to this is the finding that 36.7% of individuals in this survey report being unemployed, 31.0%
of which are active job seekers while 5.7% are currently not seeking employment. Within the
155 These include missing values and refusals.
Stellenbosch University https://scholar.sun.ac.za

406
remaining 18.8% of respondents reporting no current employment, 4.4% were home-based156, 7.9%
were students and 6.5% report being retired.
Total Unemployed: 1 279 (36.7%)
GENDER AGE
Female Male <20
YEARS 20-29 YEARS
30-39 YEARS
40-49 YEARS
50-59 YEARS
60+ YEARS
Total
Unemployed - seeking work 607 474 2.1% 47.0% 29.9% 14.1% 5.8% 1.0% 100%
Unemployed - not seeking work 124 74 3.6% 15.9% 10.8% 15.9% 32.8% 21.0% 100%
Total 731 548 4.9% 31.7% 27.5% 17.2% 10.7% 7.9% 100%
Table A1-12: Respondents reporting unemployment status in Khayabus wave 2, 2015
Among the 1 279 respondents reporting unemployment, but actively seeking work, 607 were female
while 474 were male. Within those reporting unemployment, but not seeking work 124 were female
and 74 were male. These results indicate that a larger share of unemployed individuals is female,
whether actively engaged in employment seeking or not. Among individuals reporting
unemployment though still actively seeking work, 79% are below the age of 39 years, while those
older account for the remaining 21.0% of unemployed job seekers. This profile is very different when
looking at respondents reporting unemployment and not actively seeing work with 69.7% of
individuals reporting within this category being 40 years and older.
Recoding of the EMPLOYMENT variable as a data reduction requirement yielded 3 categories in a
new variable called EMPLOYMENT_RECODED. The questionnaire categories for Working full-time
and Working part-time were combined into an EMPLOYED category containing 1 553 respondents
(44.5%). The categories for Unemployed - looking for work and Unemployed - not looking for work
were combined yielding a new category called UNEMPLOYED representing 36.7% of the valid sample
(1 279). The 3 questionnaire categories for Not Working, as a Housewife, Student or Retiree were
combined into an OTHER (Not working) category accounting for the remainder of the sample
(18.8%).
Frequency Percent
Valid Percent
Cumulative Percent
Employed 1553 44.5 44.5 44.5
Unemployed 1279 36.7 36.7 81.2
Other (Not Working) 654 18.8 18.8 100.0
Total 3486 100.0 100.0
Table A1-13: Respondents reporting unemployment status in Khayabus wave 2, 2015
A further demographic characteristic that influences the public understanding of science and
provides additional insight into the sample and population characteristics is the level of educational
attainment. Respondents were asked to report their highest level of educational attainment under 156
Housewives, care-givers, unpaid domestic work etc.
Stellenbosch University https://scholar.sun.ac.za

407
12 questionnaire categories from No Schooling to Completed University Degree, with a category
provided to capture other responses157. Certificates and Technikon qualifications were classified
independently. As before, data reduction techniques were applied and recoding of the education
variable was performed to create 7 categories of educational attainment as represented in table A1-
14a.
No schooling No schooling
Some primary school Primary School
Primary school completed
Some high school Some High School
Matric / Grade 12 completed Matric completed
Artisan’s certificate completed Certificate / Diploma completed
Technikon diploma/degree completed University degree completed University Degree completed
Professional
Other Technical
Secretarial
Other(Specify)
Table A1-14a: Recoding of educational attainment variable in Khayabus wave 2, 2015
Frequency Percent Valid % Cumulative
%
No schooling 36 1.0% 1.0% 1.0%
Primary School 231 6.6% 6.6% 7.7%
Some High School 1 102 31.6% 31.6% 39.3%
Matric completed 1 578 45.3% 45.3% 84.5%
Certificate / Diploma completed 351 10.1% 10.1% 94.6%
University Degree completed 125 3.6% 3.6% 98.2%
Other 63 1.8% 1.8% 100.0%
TOTAL 3 486 100.0% 100.0%
Table A1-14b: Respondents educational attainment in Khayabus wave 2, 2015
Included within the 3 486 respondents in this survey, very few respondents reported having no
education (1.0%); while 6.6% reported having completed Primary School158. The vast majority of
respondents have attended high school (76.9%), however among these 31.6% report having not
completed high school, while 45.3% report having completed Grade 12 (Matric) successfully. With
respect to post-schooling qualifications, 10.1% report having completed a Certificate, Diploma or
similar Artisanal qualification, while only 3.6% report having completed a University degree. Among
the total number of respondents, 63 (1.8%) reported qualifications not listed within these groups
and classified under the grouping Other.
These Educational Attainment groups were further reduced to allow for more meaningful categories
within the data analysis phase. Ultimately 3 categories of Educational Attainment were obtained, by
157
This includes vocational training, diplomas and other qualifications not listed in the 8 categories 158
In South Africa this covers grades 1 to grade 7
Stellenbosch University https://scholar.sun.ac.za
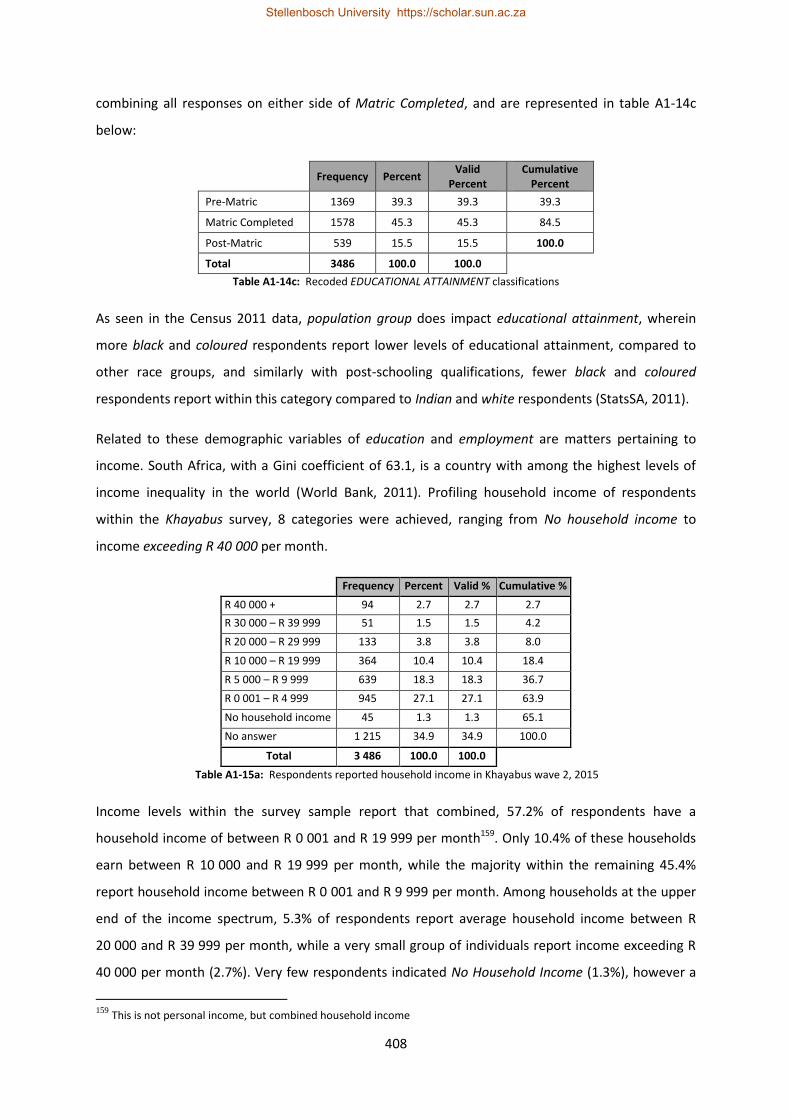
408
combining all responses on either side of Matric Completed, and are represented in table A1-14c
below:
Frequency Percent
Valid Percent
Cumulative Percent
Pre-Matric 1369 39.3 39.3 39.3
Matric Completed 1578 45.3 45.3 84.5
Post-Matric 539 15.5 15.5 100.0
Total 3486 100.0 100.0
Table A1-14c: Recoded EDUCATIONAL ATTAINMENT classifications
As seen in the Census 2011 data, population group does impact educational attainment, wherein
more black and coloured respondents report lower levels of educational attainment, compared to
other race groups, and similarly with post-schooling qualifications, fewer black and coloured
respondents report within this category compared to Indian and white respondents (StatsSA, 2011).
Related to these demographic variables of education and employment are matters pertaining to
income. South Africa, with a Gini coefficient of 63.1, is a country with among the highest levels of
income inequality in the world (World Bank, 2011). Profiling household income of respondents
within the Khayabus survey, 8 categories were achieved, ranging from No household income to
income exceeding R 40 000 per month.
Frequency Percent Valid % Cumulative %
R 40 000 + 94 2.7 2.7 2.7
R 30 000 – R 39 999 51 1.5 1.5 4.2
R 20 000 – R 29 999 133 3.8 3.8 8.0
R 10 000 – R 19 999 364 10.4 10.4 18.4
R 5 000 – R 9 999 639 18.3 18.3 36.7
R 0 001 – R 4 999 945 27.1 27.1 63.9
No household income 45 1.3 1.3 65.1
No answer 1 215 34.9 34.9 100.0
Total 3 486 100.0 100.0
Table A1-15a: Respondents reported household income in Khayabus wave 2, 2015
Income levels within the survey sample report that combined, 57.2% of respondents have a
household income of between R 0 001 and R 19 999 per month159. Only 10.4% of these households
earn between R 10 000 and R 19 999 per month, while the majority within the remaining 45.4%
report household income between R 0 001 and R 9 999 per month. Among households at the upper
end of the income spectrum, 5.3% of respondents report average household income between R
20 000 and R 39 999 per month, while a very small group of individuals report income exceeding R
40 000 per month (2.7%). Very few respondents indicated No Household Income (1.3%), however a
159
This is not personal income, but combined household income
Stellenbosch University https://scholar.sun.ac.za

409
large proportion of the sample elected to not report on household income (35.2%), which is not
unexpected within surveys of this nature. Categories of monthly household income were recoded for
ease of analysis and a new variable called DEMOG_3_HH_INCOME was created yielding 3 categories
of Household Income (table A1-15b).
Frequency Percent Valid
Percent Cumulative
Percent
Low Income (Less Than R 10 000) 1629 46.7 71.7 71.7
Moderate Income (Between R 10 000 – R 20 000) 497 14.3 21.9 93.6
High Income (R 30 000+) 145 4.2 6.4 100.0
Valid 2271 65.1 100.0
Missing 1215 34.9
TOTAL 3486 100.0
Table A1-15b: Revised Household Income variable categories
Household income was higher for respondents reporting full time employment and decreased with
individuals reporting part-time and other employment categories. Similarly, population group did
display some influence on household income levels with white respondents reporting more
frequently into the higher income groupings, while black and coloured respondents similarly report
more often into the lower income groupings160. The relationship between educational attainment
and household income is further noted here as individuals reporting higher educational attainment
similarly report higher household income, compared to those respondents reporting lesser
educational attainment.
The above section presented an overall sample and demographic profile from within a selection of
salient variables within the 2015 wave 2 of the Khayabus survey. These demographic variables
influence the results of this research at multiple levels, which will be discussed within the next
section, exploring the results of the South African Public Understating of Science from within survey
module.
160
This is not the rule, but a general observation as in certain cases black household do report into the higher income categories; however across the entire sample, and within the Census (2011) the relationship between income and population group is noted.
Stellenbosch University https://scholar.sun.ac.za

410
Appendix 2
Knowledge of science: Reliability analyses
The analysis will be presented within this chapter along 6 sub-sections as per the questionnaire item
areas. Each of the 6 question sets within the Khayabus Survey module has been analysed along the
specific demographic variables to understanding the influence of these factors on each facet of the
South African public understanding of science. Significance testing was performed on all cross-
tabulations to determine statistical independence.
QUESTIONNAIRE ITEMS
The level of scientific knowledge among a representative sample of the South African public was
assessed using a 9-item question set as previously discussed, but will be briefly revisited below161.
Questions were developed or adopted from various sources and following a field testing and pilot
phase, a final 9-item question set was produced (see table A2-1 & correct response in table A2-1-2).
QUESTIONNAIRE ITEM TRUE FALSE D/K In the majority of cases, HIV causes AIDS in humans 1 2 8
Lightning never strikes the same place twice 1 2 8
South Africa was the first nation in the world to voluntarily dismantle its nuclear weapons 1 2 8
The continents which we live on are continually moving due to forces deep within the Earth 1 2 8
The price of petrol in South Africa is NOT influenced by the price of crude oil 1 2 8
Schizophrenia is the same as Multiple Personality disorder 1 2 8
The father carries the genetic material that will determine if a baby is a boy or a girl 1 2 8
The earth's climate has NOT changed over millions of years 1 2 8
The main purpose of the Square Kilometre Array (SKA) radio telescopes is to search for extra-terrestrial life 1 2 8
Table A2-1: 9-item Science Knowledge question set in Khayabus wave 2, 2015
SCIENTIFICALLY CORRECT RESPONSES TRUE FALSE
1 In the majority of cases, HIV causes AIDS in humans TRUE
2 Lightning never strikes the same place twice FALSE
3 South Africa was the first nation in the world to voluntarily dismantle its nuclear weapons TRUE
4 The continents which we live on are continually moving due to forces deep within the Earth TRUE
5 The price of petrol in South Africa is NOT influenced by the price of crude oil FALSE
6 Schizophrenia is the same thing as Multiple Personality disorder FALSE
7 The father carries the genetic material that will determine if a baby is a boy or a girl TRUE
8 The earth's climate has NOT changed over millions of years FALSE
9 The main purpose of the Square Kilometre Array (SKA) radio telescopes is to search for extra-terrestrial life FALSE
Table A2-1-2: Scientifically Correct response to 9-item Science Knowledge question set
Each of the items was selected based on a process of understanding the actual self-reported interest
in science held by members of the South African public162 as well as an analysis into the source-
161
See chapter 4: Questionnaire Design and Item Selection. 162
See references in Chapter 4
Stellenbosch University https://scholar.sun.ac.za

411
scientific fields from which the selected interest areas were derived. These interest areas and science
subject categories were then combined and populated with questionnaire items that reflect the
combination of these science subject areas as well as the identified interest areas (see table A2-2).
These interest / knowledge areas include Biological Science – Medical, Biological Science – Genetics,
Physical Science – Electricity, Physical Science – Geology, Social Science – History, Social Science –
Economics, Social Science – Psychology, Earth Science - Climate Change as well as Astronomy –
Square Kilometre Array. Table A2-2 below highlights each science subject area and the
corresponding question within the 9-item Science Knowledge question set.
In the majority of cases, HIV causes AIDS in humans BIOLOGICAL SCIENCE - MEDICAL
Lightning never strikes the same place twice PHYSICAL SCIENCE - ELECTRICITY
South Africa was the first nation in the world to voluntarily dismantle its nuclear weapons SOCIAL SCIENCE - HISTORY
The continents which we live on are continually moving due to forces deep within the Earth PHYSICAL SCIENCE - GEOLOGY
The price of petrol in South Africa is NOT influenced by the price of crude oil SOCIAL SCIENCE - ECONOMICS
Schizophrenia is the same as Multiple Personality disorder SOCIAL SCIENCE - PSYCHOLOGY
The father carries the genetic material that will determine if a baby is a boy or a girl BIOLOGICAL SCIENCE – GENETICS
The earth's climate has NOT changed over millions of years EARTH SCIENCE - CLIMATE CHANGE
The main purpose of the Square Kilometre Array (SKA) radio telescopes is to search for extra-terrestrial life ASTRONOMY - SKA
Table A2-2: Science Knowledge question bank with science subject knowledge / interest areas in Khayabus wave 2, 2015
Each of the science subject / interest areas was selected in order to ensure that the science-
knowledge question set included the widest definition of science and related science knowledge.
The broad subject categories selected allows this research to examine the South African public
understanding of science within a social context, while simultaneously covering a broader area of
scientific knowledge than in previous research of this nature. Understanding of science is as much a
manner of applying logic as it is recalling factual information. As such selected questions were
phrased in the negative in order to test this ability within the general population.
Each respondent in the total sample of 3 486 provided a response to each of the nine (9) Science
Knowledge items, within the three (3) questionnaire response options. These responses were later
recoded as scientifically correct or scientifically incorrect, based on the documented scientifically
correct response to the items in table A2-1-2. Within each item the frequency of don’t know
selections varied, yielding 920 individuals that selected this option across the 9 items. However
within these, 298 respondents selected a don’t know response for each of the 9 items, and these
were considered invalid.
Stellenbosch University https://scholar.sun.ac.za
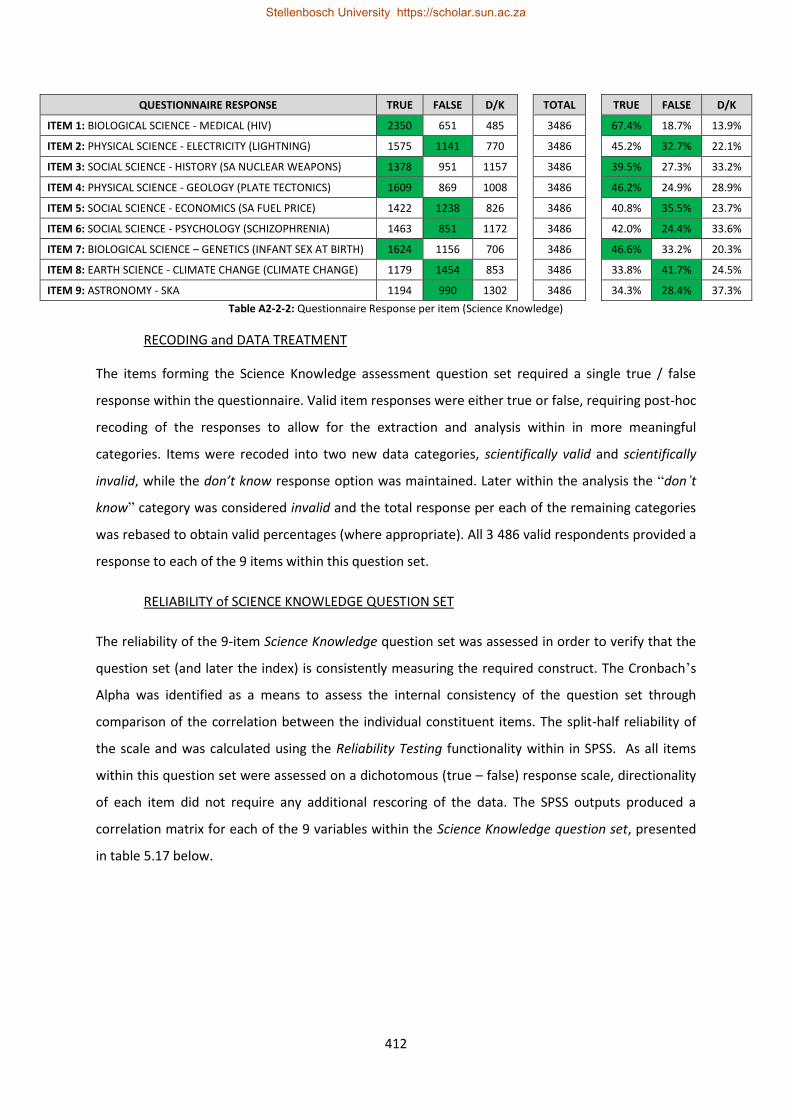
412
QUESTIONNAIRE RESPONSE TRUE FALSE D/K TOTAL TRUE FALSE D/K
ITEM 1: BIOLOGICAL SCIENCE - MEDICAL (HIV) 2350 651 485 3486 67.4% 18.7% 13.9%
ITEM 2: PHYSICAL SCIENCE - ELECTRICITY (LIGHTNING) 1575 1141 770 3486 45.2% 32.7% 22.1%
ITEM 3: SOCIAL SCIENCE - HISTORY (SA NUCLEAR WEAPONS) 1378 951 1157 3486 39.5% 27.3% 33.2%
ITEM 4: PHYSICAL SCIENCE - GEOLOGY (PLATE TECTONICS) 1609 869 1008 3486 46.2% 24.9% 28.9%
ITEM 5: SOCIAL SCIENCE - ECONOMICS (SA FUEL PRICE) 1422 1238 826 3486 40.8% 35.5% 23.7%
ITEM 6: SOCIAL SCIENCE - PSYCHOLOGY (SCHIZOPHRENIA) 1463 851 1172 3486 42.0% 24.4% 33.6%
ITEM 7: BIOLOGICAL SCIENCE – GENETICS (INFANT SEX AT BIRTH) 1624 1156 706 3486 46.6% 33.2% 20.3%
ITEM 8: EARTH SCIENCE - CLIMATE CHANGE (CLIMATE CHANGE) 1179 1454 853 3486 33.8% 41.7% 24.5%
ITEM 9: ASTRONOMY - SKA 1194 990 1302 3486 34.3% 28.4% 37.3%
Table A2-2-2: Questionnaire Response per item (Science Knowledge)
RECODING and DATA TREATMENT
The items forming the Science Knowledge assessment question set required a single true / false
response within the questionnaire. Valid item responses were either true or false, requiring post-hoc
recoding of the responses to allow for the extraction and analysis within in more meaningful
categories. Items were recoded into two new data categories, scientifically valid and scientifically
invalid, while the don’t know response option was maintained. Later within the analysis the “don’t
know” category was considered invalid and the total response per each of the remaining categories
was rebased to obtain valid percentages (where appropriate). All 3 486 valid respondents provided a
response to each of the 9 items within this question set.
RELIABILITY of SCIENCE KNOWLEDGE QUESTION SET
The reliability of the 9-item Science Knowledge question set was assessed in order to verify that the
question set (and later the index) is consistently measuring the required construct. The Cronbach’s
Alpha was identified as a means to assess the internal consistency of the question set through
comparison of the correlation between the individual constituent items. The split-half reliability of
the scale and was calculated using the Reliability Testing functionality within in SPSS. As all items
within this question set were assessed on a dichotomous (true – false) response scale, directionality
of each item did not require any additional rescoring of the data. The SPSS outputs produced a
correlation matrix for each of the 9 variables within the Science Knowledge question set, presented
in table 5.17 below.
Stellenbosch University https://scholar.sun.ac.za

413
ITEM 1 ITEM 2 ITEM 3 ITEM 4 ITEM 5 ITEM 6 ITEM 7 ITEM 8 ITEM 9
ITEM 1: 'In the majority of cases, HIV causes AIDS in humans'
1.000
ITEM 2: Lightning never strikes the same place twice
.562 1.000
ITEM 3: South Africa was the first nation in the world to voluntarily dismantle its nuclear weapons
.433 .566 1.000
ITEM 4: The continents which we live on are continually moving due to forces deep within the Earth
.463 .546 .689 1.000
ITEM 5: The price of petrol in South Africa is NOT influenced by the price of crude oil
.489 .535 .567 .605 1.000
ITEM 6: Schizophrenia is the same as Multiple Personality disorder
.406 .442 .516 .563 .590 1.000
ITEM 7: The father carries the genetic material that will determine if a baby is a boy or a girl
.500 .532 .492 .493 .530 .487 1.000
ITEM 8: The earth's climate has NOT changed over millions of years
.511 .539 .571 .608 .562 .570 .552 1.000
ITEM 9: The main purpose of the Square Kilometre Array (SKA) radio telescopes is to search for extra-terrestrial life
.384 .490 .607 .597 .520 .590 .457 .598 1.000
Table A2-3: Reliability Analysis Inter-Item Correlation matrix: Science Knowledge question set in Khayabus wave 2, 2015
The Inter-Item Correlation matrix assesses the reliability of scores for each item within the scale by
comparing each participant item score to every other item score within the scale. Inter-Item
Correlation provides an accurate assessment of item redundancy, as an indication of the degree to
which items within the scale measures the same construct (Cohen & Swerdlik, 2005, in Piedmont,
2014). Items scoring below the threshold value are to be considered redundant and should be
removed from the question set, while items scoring above the threshold could be further considered
for inclusion. Independently, Everet (2002) and Field (2005) have indicated that any items with
correlation values below 0.300 should be considered candidates for removal as they do not relate
favourably to other items within the question set. Table A2-4 provides the correlations for each of
the 9 items within the question set, all of which are above the threshold used (0.300). As a result of
this evidence, all 9 items were thus considered to be favourably related and further reliability
analysis was then performed.
Stellenbosch University https://scholar.sun.ac.za

414
Reliability Statistics
Cronbach's Alpha Cronbach's Alpha Based on Standardized Items N of Items
.911 .911 9
Table A2-4: Reliability Statistics: Science Knowledge question set in Khayabus wave 2, 2015
The reliability statistics for the Science Knowledge question set was computed and revealed a high
internal consistency of 0.911. Table A2-5 presents the results for the Item Total Statistics for the
Science Knowledge question set. Particularly important are the values in the column headed
Corrected Item-Total Correlation, which provides the correlations between scores for each
questionnaire item. All 9 items within the questionnaire achieved high correlations, between 0.60
and 0.75 indicating high consistency across all items within the question set. The column headed
Cronbach's Alpha if Item Deleted provides an indication of the impact each item has on the overall
Cronbach’s Alpha score (see table 5.18) should that item be deleted. All values within the scale are
between 0.90 and 0.91 equal to, or marginally less than the stated Cronbach’s Alpha and thus would
not change the reliability of the scale, if deleted.
Item-Total Statistics
Scale Mean if Item
Deleted
Scale Variance if
Item Deleted
Corrected Item-Total Correlation
Squared Multiple
Correlation
Cronbach's Alpha if Item
Deleted
In the majority of cases, HIV causes AIDS in humans'
26.13 338.48 0.60 0.41 0.91
Lightning never strikes the same place twice
25.42 321.41 0.68 0.50 0.90
South Africa was the first nation in the world to voluntarily dismantle its nuclear weapons
24.70 306.56 0.73 0.58 0.90
The continents which we live on are continually moving due to forces deep within the Earth
25.02 306.89 0.75 0.60 0.90
The price of petrol in South Africa is NOT influenced by the price of crude oil
25.28 316.53 0.72 0.53 0.90
Schizophrenia is the same as Multiple Personality disorder
24.70 310.81 0.68 0.50 0.90
The father carries the genetic material that will determine if a baby is a boy or a girl
25.54 326.19 0.65 0.44 0.90
The earth's climate has NOT changed over millions of years
25.16 314.91 0.74 0.55 0.90
The main purpose of the Square Kilometre Array (SKA) radio telescopes is to search for extra-terrestrial life
24.39 308.20 0.70 0.52 0.90
Table A2-5: Reliability Analysis Item Total statistics: Science Knowledge question set in Khayabus wave 2, 2015
All items correlated well to the complete question set, with the lowest correlation being equal to
0.60. These results indicate that the 9 items Science Knowledge question set retains a high internal
consistency and therefore provides a reliable measure of scientific knowledge within this
Stellenbosch University https://scholar.sun.ac.za

415
questionnaire, achieving a Cronbach’s Alpha of 0.911. This result confirms the assumption that each
of the 9 items reflects a key concept within each field of science concerned, and although distinct
factually, conceptually provides an overall assessment of scientific knowledge across multiple fields
of science for each respondent.
Knowledge assessment tests, such as the questions in the scientific knowledge question set further
item analysis procedures include Item-difficulty and item-discrimination testing. Item-difficulty
procedures provide an assessment of how challenging the items were for respondents to complete
by producing a ratio of respondents selecting the correct response. Within each of the 9 items,
scientifically valid responses were computed as a proportion of the total sample (see chart A2-1).
Chart 5.1: Item Difficulty and Discrimination statistics: Science Knowledge question (x-axis = item number)
Tredoux and Durrhiem (2002) suggest that in general items producing a difficulty index ratio of
between 0.300 and 0.700 should be retained as these provide an acceptable level of difficulty among
the population concerned. Chart A2-1 indicates that all items within the science knowledge question
set produce proportions within this range. Item 6, the question relating to the area of psychology163
produced the lowest overall scientifically valid response, corresponding to a difficulty index
proportion of 0.244. While this is below the established cut-off of 0.300, it was retained for its
conceptual and discriminatory value to the question set.
The item-discrimination index indicates the degree of score differentiation on each item for high-
scoring respondents and low-scoring respondents. This implies that optimal knowledge-assessment
questionnaire items should adequately differentiate between respondents with high-knowledge and
low-knowledge. The discrimination index uses mathematical difference between the top-scoring 25%
of the sample and the bottom-scoring 25% of the sample, which is then divided by the total number
163
Item text: Schizophrenia is the same as Multiple Personality disorder
Stellenbosch University https://scholar.sun.ac.za

416
of individuals in either 25% group (Tredoux and Durrhiem; 2002). This calculation uses the following
formula (Item Discrimination = IDsI):
Where : T = The number of respondents in the top 25%
scoring group B = The number of respondents in the bottom 25%
scoring group N = the total sample (value used = 25% of sample)
The general rule of thumb is that items with a discriminatory value of +0.200 and above are
acceptable. All scores on the 9-item science knowledge question set were above a value of 0.415 and
were retained as they provided optimal discriminatory value.
RESPONSE ANALYSIS
Data in this section was analysed by running frequencies, cross-tabulations and related analysis
within SPSS for all 9 items within the science knowledge question set. Data outputs for individual
questions were then processed and responses to all questions were analysed for each response
category. All respondents in the total sample of 3 486 provided an answer to each item within this
question set.
Chart A2-2: Overall result: South African Science Knowledge assessment (Khayabus wave 2, 2015)
The average proportion of Scientifically Correct answers across all the statements for the entire
South African sample of 3 486 participants, was 1 404 (40.3%) while 1 162 (33.3%) provided a
Scientifically Incorrect responses. A further 920 respondents (26.4%) made use of the Don’t Know
response option. The above general result indicates that across all science subject areas included,
40.3% of the sample was able to provide scientifically valid response. While this is the largest share
of the response breakdown, it does offer insight into the general level of South African public
40.3%
33.3%
26.4%
Scientifically Correct Scientifically Incorrect D/K
Stellenbosch University https://scholar.sun.ac.za

417
scientific literacy. While it is noted that individuals that have been exposed to scientific material and
media, across all subject areas would be at an advantage to those that have not had a similar level of
exposure, all questions within this survey module should be answerable by those with some or
completed high school education, which includes 76.9% of the total sample. The population
demographics and issues related to social inequality however, previously discussed, are noted and
taken into consideration when reviewing the above general result from this survey. The 59.7% of
respondents that provided scientifically incorrect and don’t know responses does highlight an
interesting finding, which will be further explored by related population demographic analysis in a
later section.
The removal of individual responses using the don’t know category reveals a different picture of the
South African public science knowledge assessment. Chat A2-3 below presents the survey data for
the science knowledge question set, however with all don’t know responses removed and the base
proportionality calculation adjusted similarly. Among the total sample of 3 486 respondents, an
average of 920 respondents elected to use the don’t know option. The remaining 2 566 responses
indicate that, 59.4% of individuals were able to provide the scientifically correct response, while
40.6% provided scientifically incorrect responses.
Chart A2-3: Overall result: South African Science Knowledge assessment (D/K removed)
Response analysis per individual respondent indicates that the majority of participants were able to
correctly respond to 4 of the 9 questionnaire items. Respondents able to correctly respond to,
between 3 and 5 of the 9 questionnaire items accounted for 2 037 (58.4%) of the total 3 486. At the
extreme ends of the response analysis, only a single respondent was able to respond correctly to all
9 questionnaire items, while 298 (8.5%) respondents did not provide a single correct response (see
chart A2-4).
59.4%
40.6%
Scientifically Correct Scientifically Incorrect
Stellenbosch University https://scholar.sun.ac.za

418
Chart A2-4: Response analysis: South African Science Knowledge assessment
Respondents selecting the scientifically incorrect and the don’t know response options collectively
account for the proportion of participants with lower levels of scientific knowledge. These individuals
make up 59.7% of the total sample of 3 486.
Chart A2-5: Response analysis: Scientifically invalid responses - Science Knowledge assessment
Among these respondents, the science subject area attracting the highest number of scientifically
incorrect and don’t know responses was Social Sciences – Psychology (75.6%) followed by Astronomy
– SKA (71.6%). These two categories attracted 42.0% and 34.3% scientifically incorrect responses
and 33.6% and 37.3% Don’t Know responses, respectively. The Physical Sciences – Electricity (67.3%),
Social Sciences – Economics (64.5%) and Social Sciences – History (60.5%) represent the next 3
categories of most frequent scientifically invalid response. Physical Sciences – Geology (53.8%) as
well as the 2 Medical Science categories (53.4% and 32.6%) attracted the lowest proportion of
scientifically invalid responses (see chart A2-5).
29
8
22
8
38
3
56
8
87
0
59
9
35
5
14
9
35
1
0
100
200
300
400
500
600
700
800
900
1000
0 1 2 3 4 5 6 7 8 9
Number of questions and count of Individuals providing scientifically valid response
42
.0%
34
.3%
45
.2%
40
.8%
27
.3%
33
.8%
24
.9%
33
.2%
18
.7%
33
.6%
37
.3%
22
.1%
23
.7%
33
.2%
24
.5%
28
.9%
20
.3%
13
.9%
75.6% 71.6%
67.3% 64.5%
60.5% 58.3% 53.8% 53.4%
32.6%
0%
10%
20%
30%
40%
50%
60%
70%
80%
SOCIALSCIENCE -
PSYCHOLOGY
ASTRONOMY- SKA
PHYSICALSCIENCE -
ELECTRICITY
SOCIALSCIENCE -
ECONOMICS
SOCIALSCIENCE -HISTORY
EARTHSCIENCE -CLIMATECHANGE
PHYSICALSCIENCE -GEOLOGY
BIOLOGICALSCIENCE -MEDICAL
BIOLOGICALSCIENCE -MEDICAL
Scientifically Incorrect D/K Total Invalid Response
Stellenbosch University https://scholar.sun.ac.za

419
Appendix 3
Attitudes towards Science: Reliability Analyses
To adequately respond to this requirement, multiple data sources were reviewed (see chapter 3)
and an extensive listing of attitudinal statements were considered prior to the finalisation of the
items used in the research instrument. General attitudes toward science were measured within this
research using a 4-item attitudinal scale (see chapter 4 for details). Questions were developed or
adopted from various sources and following a pilot phase, the final 4-item question set was
produced (see table A3-1).
Attitudinal Statement STRONGLY
AGREE AGREE
NEITHER
AGREE OR
DISAGREE
DISAGREE STRONGLY
DISAGREE
DON’T
KNOW
1 Science and technology are making our lives healthier, easier and more comfortable
1 2 3 4 5 8
2 It is not important for me to know about science in my daily life
1 2 3 4 5 8
3 Thanks to science and technology, there will be more opportunities for the future generation
1 2 3 4 5 8
4 The application of science and new technology makes our way of life change too fast
1 2 3 4 5 8
Table A3-1: 4-Item attitude to science question set in Khayabus wave 2, 2015
Assessments of public attitudes to science are often specific to fields of science (like biotechnology
or nuclear energy), but also take on a more general stream when considering general attitudes to
science. This research focused on general attitudes to science and adopted the 4 questionnaire
items used in multiple international studies as part of the final research instrument. Items 1 and
Item 3 have been adopted directly from Shukla & Bauer’s 2009 work, while item 2 was adapted by
the author based on the findings of Bann and Schwerin (2004)164. The last question in the attitude
section was adapted and edited from the original work of Shukla & Bauer (2009).
The questions adopted, speak directly to the 4 areas of social influence science may have on South
African society (see paragraph 1 of this section). Item 1 assesses attitudes toward the contribution of
science to the lived reality of respondents, while Item 3 looks at the role of science in shaping a
future society. Item 2 investigates the personal value attached to science in daily activities, while
item 4 produces an indication of perceived public risk perception associated with scientific
advancement. The grouping of these items is deliberate, as Items 1 and 3 carry a supportive
164
Though to note this item has appears in other research of similar nature, it was not used as result of those readings but instead as an item that assess the value that science presented to the respondents own life.
Stellenbosch University https://scholar.sun.ac.za

420
sentiment about science while items 2 and 4 are somewhat critical of the contribution of science to
society. This speaks to the notion of scientific promise and scientific reservation, which will be
discussed later in this chapter.
TOTAL 3486
Attitudinal Statement STRONGLY
AGREE AGREE
NEITHER AGREE OR DISAGREE
DISAGREE STRONGLY DISAGREE
D/K N
ITEM 1: PROMISE 1 014 1 232 670 232 121 217 3 486
ITEM 2: RESERVATION 1 011 1 340 600 200 120 215 3 486
ITEM 3: PROMISE 609 951 731 609 381 205 3 486
ITEM 4: RESERVATION 984 1 263 636 247 135 221 3 486
% TOTAL 3486
Attitudinal Statement STRONGLY
AGREE AGREE
NEITHER AGREE OR DISAGREE
DISAGREE STRONGLY DISAGREE
D/K N
ITEM 1: PROMISE 29.1% 35.3% 19.2% 6.7% 3.5% 6.2% 100.0%
ITEM 2: RESERVATION 29.0% 38.4% 17.2% 5.7% 3.4% 6.2% 100.0%
ITEM 3: PROMISE 17.5% 27.3% 21.0% 17.5% 10.9% 5.9% 100.0%
ITEM 4: RESERVATION 28.2% 36.2% 18.2% 7.1% 3.9% 6.3% 100.0%
Table A3-1-2: Questionnaire Response per item (Attitudes to Science)
RECODING and DATA TREATMENT
The 4 items in the attitudinal assessment question all required a single selection response from
within a 5-point array of agreement options ranging from strongly agree to strongly disagree (with a
neutral option). Each item row also had a don’t know response option (see table A3-1). Valid item
responses were located within one of the 5 options provided (excluding don’t know). Where
required, response categories were collapsed to create Agree, Neutral and Disagree categories, from
the original 5 categories.
In preparation for additional analytic applications, 2 recoding processes were performed for these
attitudinal variables. The original recoding structure was maintained while additional variables were
created within this data and recoding applied to allow for the extraction and analysis within in more
meaningful categories. The original coding as per the questionnaire used numerical coding 1 through
5 and adopted 8 as the code for the don’t know response option.
During an initial recoding step, this coding structure was maintained for the positive items (item 1
and item 3) however the coding was reversed for the critical items (item 2 and item 4). This resulted
in coding for items 2 and 4 as reflected in table A3-2 below. This ensured that all responses to
attitudinal question are on a similar scale such that high scores reflect positive attitudes and low
Stellenbosch University https://scholar.sun.ac.za

421
scores reflect negative attitudes. Here it is postulated that positive responses to positive items and
negative responses to negative items reflect a general positive attitudes and visa-versa.
Reverse coding of attitude items STRONGLY
AGREE AGREE NEUTRAL DISAGREE
STRONGLY DISAGREE
ORIGINAL CODING (ITEM 1 AND 3) 1 2 3 4 5
REVERSE CODING (ITEM 2 AND 4) 5 4 3 2 1
Table A3-2: Reverse coding of critical attitudinal items
These recoding categories were then collapsed, such that Strongly Agree and Agree responses
became a single Agree category, coded as 1. Strongly Disagree and Disagree responses were
similarly collapsed into a single Disagree category and were coded as 3. All neutral responses were
coded as 2 (see below)
Original 5 point coding
STRONGLY
AGREE AGREE NEUTRAL DISAGREE
STRONGLY DISAGREE
ORIGINAL CODING 1 2 3 4 5
Revised 3 point coding
AGREE NEUTRAL DISAGREE
POSITIVE (ITEM 1 AND 3) 1 2 3
CRITICAL (ITEM 2 AND 4) 3 2 1
Table A3-3: Revised coding of attitudinal items
The collapsing of these categories ensured that a single scale was achieved to provide the general
direction of respondent attitude across all 4 questionnaire items. This allowed for the 4 items within
the question set to be integrated toward the development of an attitudinal index score for each
respondent (to be discussed later). However as a consequence, an indication of the relative strength
of these attitudes was lost within the 3-point recoding structure. As a result, and for a different
analytical application, a further recoding was completed, again differentiating the positive items
from the critical items in the attitudinal assessment, however this time reverting to a 5 point coding
system. This ensured that the strength and direction of the respondents’ original selection is
maintained within the dataset under a (second) set of attitude variables. This additional coding
structure adopted a 5-point structure, ranging from +1 to -1, and applied reverse coding to critical
items (see table A3-4).
Stellenbosch University https://scholar.sun.ac.za

422
POSITIVE ITEMS (ITEMS 1 AND 3)
POSITIVE ITEMS (1 & 3)
STRONGLY AGREE AGREE NEUTRAL DISAGREE STRONGLY DISAGREE DK
1 0.5 0 -0.5 -1 8
CRITICAL ITEMS (REVERSED SCALE – ITEMS 2 AND 4)
CRITICAL ITEMS (2 & 4)
STRONGLY AGREE AGREE NEUTRAL DISAGREE STRONGLY DISAGREE DK
-1 -0.5 0 0.5 1 8
Table A3-4: Attitudinal items recoding structure
This revised coding structure ensured that the original strength and general direction of responses to
attitudinal questions would be maintained in the analysis. The outputs from these variables would
be used toward developing a measure of attitudinal ambivalence, to be discussed at a later point in
this sub-section.
RELIABILITY OF ATTITUDES TO SCIENCE QUESTION SET
As a result of the attitudinal questions being measured on an interval scale the most suitable test of
reliability was found to be the Cronbach’s Alpha procedure (Tredoux and Durrheim, 2004). The
procedure and background to this approach was previously discussed and will not be repeated here,
beyond a brief discussion on the test output.
The SPSS outputs produced a correlation matrix for each of the 4 variables within the Attitudes to
Science question set, presented in table A3-5 below.
ITEM 1
ITEM 2
ITEM 3
ITEM 4
Item 1
Science and technology are making our lives healthier, easier and more comfortable
1.000
Item 2
It is not important for me to know about science in my daily life 0.742 1.000
Item 3
Thanks to science and technology, there will be more opportunities for the future generation
0.828 0.749 1.000
Item 4
The application of science and new technology makes our way of life change too fast
0.862 0.743 0.827 1.000
Table A3-6: Reliability Analysis Inter-Item Correlation matrix: Attitudes to Science question set in Khayabus wave 2, 2015
Everet (2002) and Field (2005) have proposed a threshold score of 0.300 as indicative of items that
should be excluded as a result of poor inter-item correlation. All inter-item correlation values
presented in table A3-6 were found to be above the threshold value proposed and thus were
retained within the attitudinal question set.
Stellenbosch University https://scholar.sun.ac.za

423
Reliability Statistics
Cronbach's Alpha Cronbach's Alpha Based on Standardized Items
N of Items
0.939 0.938 4
Table A3-7: Reliability statistics: Attitudes to Science question set in Khayabus wave 2, 2015
The reliability statistics for the 4-item attitudes to science question set were computed and indicated
a high degree of internal consistency (Cronbach’s Alpha: 0.939). Examining the results of the Item-
Total statistics (table A3-7) it is noted that within the column Corrected Item-Total Correlation, all
items achieved high correlations, ranging between 0.788 and 0.881. This result confirms the high
degree of internal consistency between the items in this question set. The column headed
Cronbach's Alpha if Item Deleted provides an indication of the impact each item has on the overall
Cronbach’s Alpha score (see table A3-8) should that item be deleted. All values within the scale are
between 0.91 and 0.94. While item 2 was marginally higher than the reported Cronbach’s Alpha
reported earlier (0.939), this was found to not change the overall reliability of the question set in any
meaningful way (0.001) and thus the item was retained.
Scale Mean if Item
Deleted
Scale Variance if
Item Deleted
Corrected Item-Total Correlation
Squared Multiple
Correlation
Cronbach's Alpha if Item
Deleted
Science and technology are making our lives healthier, easier and more comfortable
5.82 22.329 0.881 0.792 0.911
It is not important for me to know about science in my daily life
5.46 23.871 0.788 0.622 0.940
Thanks to science and technology, there will be more opportunities for the future generation
5.87 22.545 0.867 0.755 0.915
The application of science and new technology makes our way of life change too fast
5.81 22.193 0.880 0.791 0.911
Table A3-8: Reliability Analysis Item Total statistics: Attitudes to Science question set in Khayabus wave 2, 2015
According to Tavakol and Dennick (2011) an acceptable level of Cronbach’s Alpha should be between
the range of 0.70 and 0.95. The above results therefore indicate that the 4-item Attitudes to Science
question set retains a high level of internal consistency and therefore provides a reliable measure of
attitudes to science within this questionnaire, achieving a Cronbach’s Alpha of 0.939.
Stellenbosch University https://scholar.sun.ac.za
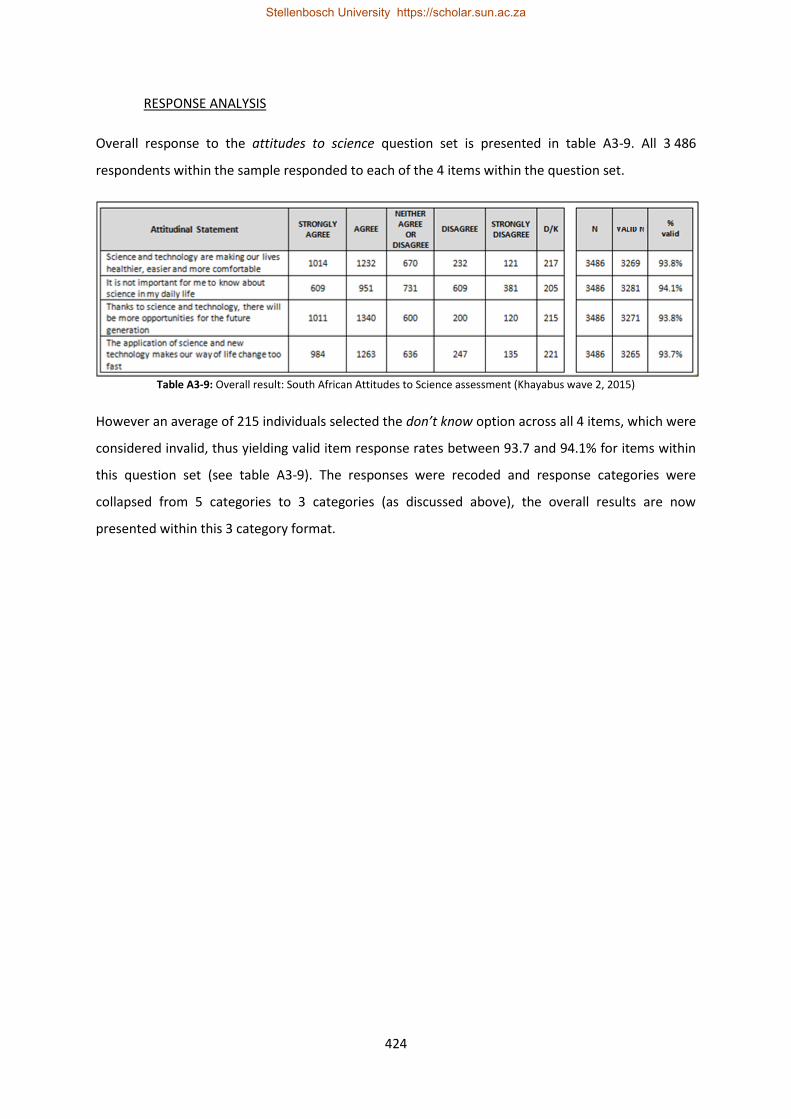
424
RESPONSE ANALYSIS
Overall response to the attitudes to science question set is presented in table A3-9. All 3 486
respondents within the sample responded to each of the 4 items within the question set.
Table A3-9: Overall result: South African Attitudes to Science assessment (Khayabus wave 2, 2015)
However an average of 215 individuals selected the don’t know option across all 4 items, which were
considered invalid, thus yielding valid item response rates between 93.7 and 94.1% for items within
this question set (see table A3-9). The responses were recoded and response categories were
collapsed from 5 categories to 3 categories (as discussed above), the overall results are now
presented within this 3 category format.
Stellenbosch University https://scholar.sun.ac.za

425
Appendix 4
Interest in Science: Reliability Analyses
The next section of this chapter outlines the development of the questionnaire items assessing
interest in science, data treatment procedures, reliability as well as general results to the interest in
science question set within this survey module.
QUESTIONNAIRE ITEMS
During the development of the survey instrument, due consideration was applied toward integrating
the input material for the measurement of the public understanding of science elements for
knowledge, interest as well as informedness. This was done in order to ensure that each of these
elements considers and relates to the same areas of scientific knowledge as well as simultaneously
ensuring the data across each of the three measurement areas are comparable.
Interest in science was measured using a 3-level interest scale as well as a don’t know response
option. These interest levels ranged from Very Interested, Moderately Interested to No Interest. This
3-level interest in science scale was used to assess interest within 7 scientific disciplines that have a
direct relation to the items within the science knowledge assessment question set (see chapter 4).
The 7 items included in the interest in science question set are presented in table A4-1 below. In
addition to the commonalities of subject areas with the science knowledge assessment items, each
of the interest in science items reflects a critical contribution area for science in the current South
African National System of Innovation.
Interest Area VERY
INTERESTED MODERATELY INTERESTED
NO INTEREST
DON’T KNOW
1 Medical Science 1 2 3 8
2 Climate Change 1 2 3 8
3 Technology and the Internet 1 2 3 8
4 Politics 1 2 3 8
5 Economics 1 2 3 8
6 Astronomy 1 2 3 8
7 Energy 1 2 3 8
Table A4-1: 7-Item Interest in Science question set in Khayabus wave 2, 2015
Moreover each of these 7 areas has a critical impact on current and planned activities that are
projected to contribute in significant ways to the future developmental agenda in South Africa. It
remains important to note that during the fieldwork for this research, data collectors were
Stellenbosch University https://scholar.sun.ac.za

426
instructed to not read out the don’t know response option, but simply record respondent feedback
should they indicate this verbally.
Questionnaire response per each of the seven (7) items is presented in Table A4-1-2 below:
VERY INTERESTED
MODERATELY INTERESTED
NO INTEREST
DON’T KNOW
N VALID
N
Medical Science 807 1035 1422 222 3486 3264
Climate Change 782 1172 1310 222 3486 3264
Technology and the Internet 1030 1096 1168 192 3486 3294
Politics 588 1144 1599 155 3486 3331
Economics 798 1153 1343 192 3486 3294
Astronomy 416 846 1887 337 3486 3149
Energy 747 1095 1399 245 3486 3241
VERY INTERESTED
MODERATELY INTERESTED
NO INTEREST
DON’T KNOW
N VALID
N
Medical Science 23.1% 29.7% 40.8% 6.4% 100.0% 52.8%
Climate Change 22.4% 33.6% 37.6% 6.4% 100.0% 56.1%
Technology and the Internet 29.5% 31.4% 33.5% 5.5% 100.0% 61.0%
Politics 16.9% 32.8% 45.9% 4.4% 100.0% 49.7%
Economics 22.9% 33.1% 38.5% 5.5% 100.0% 56.0%
Astronomy 11.9% 24.3% 54.1% 9.7% 100.0% 36.2%
Energy 21.4% 31.4% 40.1% 7.0% 100.0% 52.8%
Table A4-1-2: Questionnaire Response per item (Interest in Science)
RECODING and DATA TREATMENT
The interest in science question set required little data treatment and recoding within the data
analysis phase of this research. The 3-level interest in science response categories were adopted
within the data set and are reported within the following sub-sections.
A minor recoding procedure was performed wherein response to each of the 7 questions were
classified into one of three new categories that was to be used during the development of an index
of interest in science. Within this recoding procedure IBM SPSS 24.0 was used to perform recoding
and the creation of a new variable. The result of this recoding procedure reclassified all don’t know
responses as missing; no interest responses as 0; moderate interest as 1 and high interest responses
as 2. These new values were then adopted into the development of the index of interest in science.
Stellenbosch University https://scholar.sun.ac.za

427
RELIABILITY OF INTEREST IN SCIENCE QUESTION SET
An assessment of the reliability of the interest in science question set was performed adopting the
Cronbach’s Alpha procedures describes previously.
The SPSS output produced a correlation matrix for each of the 7 variables within the Interest in
Science question set and is presented in table A4-5 below.
INTEREST in SCIENCE ITEM 1 ITEM 2 ITEM 3 ITEM 4 ITEM 5 ITEM 6 ITEM 7
Medical Science 1.000
Climate Change 0.775 1.000
Technology and the Internet 0.736 0.709 1.000
Politics 0.626 0.622 0.646 1.000
Economics 0.744 0.717 0.707 0.686 1.000
Astronomy 0.657 0.614 0.591 0.516 0.628 1.000
Energy 0.797 0.744 0.684 0.617 0.733 0.688 1.000
Table A4-5: Reliability Analysis Inter-Item Correlation matrix: 7-Item Interest in Science question set
The previously discussed threshold measure as proposed by Everet (2002) and Field (2005) have
similarly been applied to the analysis of the inter-item correlation matrix within the interest in
science question set. Each of the 7 items within the question set produced high inter-item
correlations and was found to relate well to each other item within the question set.
The reliability statistic produced within the SPSS output indicated a high degree of internal
consistency (Cronbach’s Alpha: 0.936) among the 7 questionnaire items and is presented in table A4-
5 below:
Reliability Statistics
Cronbach's Alpha Cronbach's Alpha Based on Standardized Items N of Items
0.936 0.936 7
Table A4-5: Reliability statistics: interest in Science question set in Khayabus wave 2, 2015
Results of the Item-Total statistics (table A4-6) within the Corrected Item-Total Correlation column
demonstrates high item total correlation values ranging between 0.712 and 0.855. This further
confirms the previously discussed high level of internal consistency among the 7 questionnaire
items. All values within the column headed Cronbach's Alpha if Item Deleted is within the range of
0.920 and 0.934, below the level of the Cronbach's Alpha (0.936) reported earlier. This indicates that
there would be no significant change to the reliability measure should any of the items be deleted.
Stellenbosch University https://scholar.sun.ac.za

428
Scale Mean if Item Deleted
Scale Variance if Item
Deleted
Corrected Item-Total Correlation
Squared Multiple Correlation
Cronbach's Alpha if Item Deleted
Medical Science 15.56 65.393 0.855 0.749 0.920
Climate Change 15.58 66.264 0.818 0.684 0.923
Technology and the Internet 15.75 67.438 0.792 0.641 0.926
Politics 15.56 71.767 0.712 0.537 0.933
Economics 15.63 67.252 0.824 0.687 0.923
Astronomy 15.11 66.665 0.712 0.526 0.934
Energy 15.51 65.063 0.839 0.722 0.921
Table A4-6: Reliability Analysis Item Total statistics: Interest in Science question set in Khayabus wave 2, 2015
These results thus indicate that the 7-item Interest in Science question set retains a high level of
internal consistency and therefore provides a reliable measure of respondent interest in science
within this study.
RESPONSE ANALYSIS
Across all 7 interest areas related to science, respondent reported interest in science is presented in
chart A4-7. All 3 486 respondents within the valid sample provided a response to each of the 7 items
within the interest in science question set (see table A4-7). Regardless of this response, an average
of 224 respondents at each of the 7 items selected the don’t know response option, and these
responses were considered invalid. The average valid response to the interest in science question set
is therefore 3 262 representing 93.6% of the total sample.
Interest Area Very
Interested Moderately Interested
No Interest
D/K N VALID N VALID N
%
Medical Science 807 1035 1422 222 3486 3264 93.6%
Climate Change 782 1172 1310 222 3486 3264 93.6%
Technology and the Internet 1030 1096 1168 192 3486 3294 94.5%
Politics 588 1144 1599 155 3486 3331 95.6%
Economics 798 1153 1343 192 3486 3294 94.5%
Astronomy 416 846 1887 337 3486 3149 90.3%
Energy 747 1095 1399 245 3486 3241 93.0%
Table A4-7: Overall results: South African Interest in Science assessment (Khayabus wave 2, 2015)
Response for all 7 questionnaire items represents the overall level of interest within the fields of
science included. Among the 3 262 respondents, 22.6% indicated that they were very interested
while 33.0% of participants indicated that they were moderately interested any of the 7 scientific
interest areas. Within the total response to this question set, 44.4% of the total valid response
indicated that they have no interest in any of the 7 areas of science (see chart A4-8).
Stellenbosch University https://scholar.sun.ac.za

429
Chart A4-8: Overall result: South African Interest in Science assessment (Khayabus wave 2, 2015)
These overall response patterns did vary within each item and within the various demographic
classification groupings which will be discussed in greater detail in the following sections. Overall
response to the 7 items within the question set will be initially presented by examining response
frequencies and South Africans’ interest in science at an aggregate level. This will then be followed
by a closer examination within the demographic classifications discussed in earlier sections.
Stellenbosch University https://scholar.sun.ac.za

430
Appendix 5
Level of Informedness about Science: Reliability Analyses
The next sub section presents the development, processing and results of the data related to the
level of informedness in science within the South African population. As the specific questionnaire
items, coding procedures and data treatment did not deviate appreciably from those mentioned
within the preceding section, these will be concisely presented in the next section, prior to the
presentation of the general results to the informedness in science question set within this research
study.
QUESTIONNAIRE ITEMS
The noted relationship between scientific knowledge, scientific interest and scientific informedness
continued to inform the development and design of the questionnaire items within the
measurement of scientific informedness.
As with the Interest in science items, informedness in science was measured using a 3-level
informedness scale as well as a don’t know response option. This scale however ranged from Very
well informed, moderately well informed to not well informed. This 3-level informedness in science
scale was used to assess interest within the same 7 scientific disciplines that have been presented
within the interest in science question set (see previous section and greater detail in chapter 4).
Each of the informedness in science items are the same as those included within the interest in
science question set to ensure comparability in the data with regard to the interrelation between
interest and information seeking outcomes. While the response scale differs from the interest items,
overall item text and order remains unchanged (see table A5-1 below).
Interest Area VERY WELL INFORMED
MODERATELY WELL
INFORMED
NOT WELL INFORMED
DON’T KNOW
1 Medical Science 1 2 3 8
2 Climate Change 1 2 3 8
3 Technology and the Internet 1 2 3 8
4 Politics 1 2 3 8
5 Economics 1 2 3 8
6 Astronomy 1 2 3 8
7 Energy 1 2 3 8
Table A5-1: 7-Item Informedness in Science question set in Khayabus wave 2, 2015
Stellenbosch University https://scholar.sun.ac.za

431
As with the interest items during the fieldwork for this research, data collectors were trained to not
read out the don’t know response option, but simply record respondent feedback should they
indicate this verbally.
VERY WELL INFORMED
MODERATELY WELL
INFORMED
NOT WELL INFORMED
DON’T KNOW
N % VALID N
%
Medical Science 13.5% 26.4% 52.8% 7.4% 100% 92.6% Climate Change 12.8% 30.8% 49.6% 6.8% 100% 93.2% Technology and the Internet 18.8% 31.1% 43.3% 6.8% 100% 93.2% Politics 14.2% 34.6% 45.0% 6.3% 100% 93.7% Economics 14.8% 29.2% 48.9% 7.1% 100% 92.9% Astronomy 8.5% 19.1% 61.7% 10.7% 100% 89.3% Energy 13.4% 26.3% 52.3% 8.1% 100% 91.9% Table A5-1-2: Questionnaire Response per item (Informedness about Science)
RECODING and DATA TREATMENT
The informedness in science question set adopted the same data treatment and minor recoding
procedures presented earlier in this chapter. As a result those processes will not be repeated here,
except where variations to the presented procedures occurred. The 3-level informedness in science
response categories were adopted within the data set and are reported within the following sub-
sections. Where required, all Very Well Informed and Moderately Well Informed responses were
combined into a single SUM Informed category, for purposes of clarity, ease of analysis and data
presentation.
A minor recoding procedure was performed as with the interest in science items wherein the all
don’t know responses were recoded as missing; not well informed responses as 1; moderately well
informed 2 and very well informed responses as 3.
RELIABILITY OF INFORMEDNESS IN SCIENCE QUESTION SET
Similar to the preceding section, an assessment of the reliability of the informedness in science
question set was performed adopting the Cronbach’s Alpha procedures previously described.
The correlation matrix for each of the 7 variables within the informedness in Science question set
was produced and demonstrated an appropriately high inter-item correlation among each of the
items, above the stated threshold value (see table A5-2).
Stellenbosch University https://scholar.sun.ac.za

432
Informedness Area ITEM 1 ITEM 2 ITEM 3 ITEM 4 ITEM 5 ITEM 6 ITEM 7
Medical Science 1.000
Climate Change 0.824 1.000
Technology and the Internet 0.752 0.764 1.000
Politics 0.657 0.685 0.661 1.000
Economics 0.787 0.786 0.733 0.714 1.000
Astronomy 0.727 0.697 0.657 0.564 0.681 1.000
Energy 0.843 0.800 0.718 0.658 0.779 0.771 1.000
Table A5-2: Reliability Analysis Inter-Item Correlation matrix: 7-Item informedness in Science question set
The reliability statistic (Cronbach’s Alpha: 0.949) indicated a high degree of internal consistency
among the 7 questionnaire items within the informedness in science question set (see table A5-3).
This indicates that all items are closely associated with each other thereby providing evidence of
overall reliability within the question set.
Reliability Statistics
Cronbach's Alpha Cronbach's Alpha Based on Standardized Items N of Items
0.949 0.949 7
Table A5-3: Reliability statistics: informedness in Science question set in Khayabus wave 2, 2015
Table A5-4 presents the Item-Total Statistics output from SPSS, where in the item-total correlation
values indicate a high degree of correlation among the 7 questionnaire items. All indications within
the Cronbach's Alpha if Item Deleted column is below the value of the Cronbach’s Alpha in table 5.49
(0.949) and thus indicate no appreciable increase in reliability should any of the items be removed.
Informedness Area Scale Mean
if Item Deleted
Scale Variance if
Item Deleted
Corrected Item-Total Correlation
Squared Multiple
Correlation
Cronbach's Alpha if Item
Deleted
Medical Science 16.92 72.972 0.878 0.794 0.936
Climate Change 16.98 73.941 0.870 0.768 0.937
Technology and the Internet 17.11 74.505 0.810 0.666 0.942
Politics 17.08 77.558 0.735 0.568 0.948
Economics 16.99 73.712 0.852 0.735 0.938
Astronomy 16.58 73.165 0.771 0.629 0.946
Energy 16.89 72.213 0.875 0.791 0.936
Table A5-4: Reliability Analysis Item Total statistics: informedness in Science question set in Khayabus wave 2, 2015
These results thus indicate that the 7-item informedness in science question set retains a high level
of internal consistency and therefore provides a reliable measure of respondent informedness with
respect to the 7 questionnaire items adopted in this study.
Stellenbosch University https://scholar.sun.ac.za

433
RESPONSE ANALYSIS
All 3 486 respondents within the sample provided a response to each of the 7 items within the
informedness in science question set. With this total response, and average of 264 respondents
selected the don’t know response option, considered invalid, thus yielding a valid response rate of
92.6% within this item (see table A5-5).
Informedness Area VERY WELL INFORMED
MODERATELY WELL
INFORMED
NOT WELL INFORMED
DON’T KNOW
N VALID
N VALID
N %
Medical Science 469 919 1841 257 3486 3229 92.6%
Climate Change 447 1074 1729 236 3486 3250 93.2%
Technology and the Internet 656 1085 1508 237 3486 3249 93.2%
Politics 494 1205 1569 218 3486 3268 93.7%
Economics 516 1018 1706 246 3486 3240 92.9%
Astronomy 295 667 2150 374 3486 3112 89.3%
Energy 467 916 1822 281 3486 3205 91.9%
Table A5-5: Overall results: South African informedness in Science assessment (Khayabus wave 2, 2015)
Among the 3 486 individuals responding to this question set, across the 7 informedness in science
items, an average of 13.7% indicated being very well informed; 28.2% indicated that they are
moderately well informed while 50.5% report being not well informed. Among the total response, an
average of 7.6% indicated a don’t know response. The total valid response proportions are
presented in chart A5-6.
Chart A5-6: Overall result: South African informedness in science assessment (Khayabus wave 2, 2015)
Within the valid response, 14.8 % of respondents indicate being very well informed while 30.5% of
respondents indicated being moderately well informed. The largest share of respondents, across the
7 items reported being not well informed (54.7%).
Stellenbosch University https://scholar.sun.ac.za

434
Within the sample, overall response patterns did vary among the various demographic classification
groupings. Response patterns will initially be addressed at the overall national level followed by a
more detailed examination of these results within each demographic classification.
Stellenbosch University https://scholar.sun.ac.za

435
Appendix 6
Sources of information about science: Reliability Analyses
Within this study an assessment was operationalised toward gaining an understanding of the main
sources of science information among the South African public. This subsection describes the
questionnaire items, data treatment, and reliability assessment as well as presenting the overall
results of the evaluation of the main sources of scientific information for South African public.
QUESTIONNAIRE ITEMS
An assessment of the main sources of scientific information among the South African public was
operationalised adopting 11 information sources, from within a multitude of media, public and
private information streams. While media monitoring information does exist for the South African
population via noted market research surveys such as the All Media and Products Survey (South
African Audience Research Foundation - AMPS), relating it back to specifically to areas of science
remains impossible with AMPS data (see chapter 4).
Within the 11 information source items respondents were asked to indicate the frequency of
actively encountering science information using a 3-point frequency scale. The scale ranged from
Most Frequently, Occasionally to Least Frequently, with an additional Don’t Know option provided,
but as before not read to respondents. The 11 items used within this assessment of sources of
scientific information ranged from Broadcast (Television and Radio); Print (Newspapers, Books and
Magazines), Online (News websites, Social Media, Institutional websites) as well as Human
information sources (Other people and Government). These sources cover aspects related to
traditional media, such as print and broadcast as well as new media sources within digital online
platforms.
Within this question set, the media format is of most interest in this question as it differentiates the
various information channels to best understand sources of scientific information, beyond
technological penetration factors. The 11 information source categories as well as the response scale
is presented in table A6-1 below.
Stellenbosch University https://scholar.sun.ac.za

436
Information Source MOST
FREQUENTLY OCCASIONALLY LEAST FREQUENTLY DON’T KNOW
1 Satellite Pay Television such as DSTV or Star Sat 1 2 3 8
2 Free-to-Air Television such as SABC or ETV 1 2 3 8
3 Radio 1 2 3 8
4 Newspapers 1 2 3 8
5 News Websites 1 2 3 8
6 Institutional Websites such as University or Research
Labs 1 2 3 8
7 Government Announcements 1 2 3 8
8 Blogs 1 2 3 8
9 Social media such as Facebook or Twitter 1 2 3 8
10 Other people such as Family, Friends, or Colleagues 1 2 3 8
11 Books / Magazines 1 2 3 8
Table A6-1: 11-Item Sources of Scientific Information question set in Khayabus wave 2, 2015
Important advances within the above question set are the disaggregation of the broadcast channels
to include both digital pay services (DSTV / Star Sat) and terrestrial TV services (SABC). Similarly
online information sources have been classified into distinct categories of social media, blogs, news
and institutional websites. These distinctions allow for greater disaggregation within the responses
as well as providing greater accuracy within these important sources of information and learning.
RECODING and DATA TREATMENT
Within items response analysis minimal recoding was applied to the data and reporting is largely
within the questionnaire categories discussed earlier. Where required the 2 highest frequency
categories were combined to produce a SUM frequency response, however this did not require any
data recoding.
New variables were created for items within this question set where all responses were reverse
coded. The questionnaire categories applied a coding wherein a Most Frequently response received
a code of 1, while a Least Frequently response received a code of 3. To ensure that the higher
information source access frequency related to the higher coding value, the questionnaire codes
were reversed. The revised coding structure ensured that a Most Frequently response received a
code of 3, occasionally was coded as 2; while a Least Frequently response received a code of 1. These
recoded values were used as scores to allow for the application of the responses within the
development of an index of information immersion.
Stellenbosch University https://scholar.sun.ac.za

437
RELIABILITY OF INFORMATION SOURCES IN SCIENCE QUESTION SET
The Cronbach’s Alpha was employed in assessing the reliability of this question set, as within the
preceding sections. While in questions of this nature it is not entirely required, it will be briefly
presented below for completeness.
All 11 items within the question set obtained sufficiently high inter-item correlation values (see table
A6-2). While some low inter-item correlations are noted within the 0.400 range, this was not entirely
unexpected and remains above the stated threshold value (0.300).
ITEM 1 ITEM 2 ITEM 3 ITEM 4 ITEM 5 ITEM 6 ITEM 7 ITEM 8 ITEM 9 ITEM 10 ITEM 11
Satellite Pay Television such as DSTV or Star Sat
1.000
Free-to-Air Television such as SABC or ETV
0.504 1.000
Radio 0.449 0.655 1.000
Newspapers 0.562 0.576 0.650 1.000
News Websites 0.699 0.470 0.445 0.546 1.000
Institutional Websites such as University or Research Labs
0.692 0.473 0.436 0.530 0.840 1.000
Government Announcements
0.656 0.536 0.495 0.578 0.724 0.770 1.000
Blogs 0.671 0.462 0.404 0.506 0.791 0.815 0.753 1.000
Social media such as Facebook or Twitter
0.687 0.480 0.430 0.541 0.752 0.745 0.695 0.784 1.000
'Other people such as Family, Friends, or Colleagues '
0.600 0.576 0.530 0.580 0.582 0.579 0.622 0.582 0.667 1.000
Books / Magazines 0.689 0.570 0.555 0.639 0.664 0.673 0.661 0.650 0.689 0.710 1.000
Table A6-2: Reliability Analysis Inter-Item Correlation matrix: 11-Item Science Information sources question set
The reliability statistic for the Cronbach’s Alpha was computed to be 0.946 and indicates a high
degree of internal consistency among the 11 questionnaire items (see table A6-3).
Reliability Statistics
Cronbach's Alpha Cronbach's Alpha Based on Standardized Items N of Items
0.946 0.945 11
Table A6-3: Reliability statistics: Science Information Sources question set in Khayabus wave 2, 2015
Stellenbosch University https://scholar.sun.ac.za

438
The Item-Total Statistics are presented in table A6-4 wherein the item-total correlation values
indicate a high degree of correlation among the 11 questionnaire items.
INFORMATION SOURCE
Scale Mean if
Item Deleted
Scale Variance
if Item Deleted
Corrected Item-Total
Correlation
Squared Multiple
Correlation
Cronbach's Alpha if
Item Deleted
Satellite Pay Television such as DSTV or Star Sat 37.87 415.916 0.774 0.619 0.940
Free-to-Air Television such as SABC or ETV 38.72 437.446 0.643 0.530 0.945
Radio 39.00 445.841 0.610 0.552 0.946
Newspapers 38.61 434.763 0.699 0.569 0.943
News Websites 37.31 413.332 0.818 0.764 0.939
Institutional Websites such as University or Research Labs 37.21 413.090 0.824 0.792 0.938
Government Announcements 37.59 415.832 0.812 0.691 0.939
Blogs 37.16 414.998 0.806 0.762 0.939
Social media such as Facebook or Twitter 37.58 412.166 0.812 0.720 0.939
Other people such as Family, Friends, or Colleagues 38.39 424.616 0.745 0.608 0.942
Books / Magazines 38.01 418.091 0.810 0.679 0.939
Table A6-4: Reliability Analysis Item Total statistics: Science Information Sources question set in Khayabus wave 2, 2015
All indications within the Cronbach's Alpha if Item Deleted column is below or equal to the value of
the Cronbach’s Alpha (0.946) and thus indicate no appreciable increase in reliability should any of
the items be removed.
Stellenbosch University https://scholar.sun.ac.za

439
RESPONSE ANALYSIS
A response to each of the 11 items was realised from all 3 486 respondents within the sample.
Within this response, an average of 923 respondents (across 11 items) selected a don’t know
response yielding a valid response from 2 563 respondents. A large proportion of the sample
selected the don’t know option, influencing the final response rate for this question. As a result, this
question realised a 73.5% valid response from within the sample. Across all the items in this question
set, 16.7% of respondents reported they most frequently receive science information from one of
the sources listed, while 19.5% reported an occasionally response. The largest proportion of
response was within the least frequently category (37.3%) while 26.5% of respondents provided a
don’t know response (see table A6-5).
INFORMATION SOURCE Most
Frequently Occasionally
Least Frequently
D/K N VALID N VALID
N %
Satellite Pay Television (DSTV, TopTv) 660 592 1 243 991 3 486 2 495 71.6%
Free-to-Air Television (SABC / E-Tv) 1 084 785 1 007 610 3 486 2 876 82.5%
Radio 1 190 899 920 477 3 486 3 009 86.3%
Newspapers 797 940 1 150 599 3 486 2 887 82.8%
News Websites 255 499 1 532 1 200 3 486 2 286 65.6%
Institutional Websites (University / Research Lab)
221 428 1 594 1 243 3 486 2 243 64.3%
Government Announcements 282 654 1 499 1 051 3 486 2 435 69.9%
Blogs 182 443 1 591 1 270 3 486 2 216 63.6%
Social media (Facebook, Twitter) 451 577 1 350 1 108 3 486 2 378 68.2%
Other people (Family, Friends, Colleagues)
810 839 1 098 739 3 486 2 747 78.8%
Books / Magazines 453 838 1 333 862 3 486 2 624 75.3%
Table A6-5: Response Analysis: South African information sources on science assessment (Khayabus wave 2, 2015)
An important consideration within the proportion of don’t know response option selections is
evident under many of the internet based information sources. The items for news websites,
institutional websites, blogs and social media attracted a significantly larger proportion of these
responses. Similarly, government announcements also attracted more than 1 000 responses within
the don’t know response option.
Stellenbosch University https://scholar.sun.ac.za

440
Appendix 7
Science Engagement: Reliability Analyses
Toward addressing this lack of data, the following section describes the operationalisation of a
measure of attendance at science engagement activities among the general South African public.
This subsection describes the questionnaire items, data treatment, and reliability assessment as well
as presenting the overall results of the evaluation of attendance at science engagement activities for
South African public.
QUESTIONNAIRE ITEMS
The science engagement question set comprised a selection list of 5 items that represents various
locations the general public would encounter a focused concentration of science information.
Beyond the exposure to new information, the hallmark of the 5 items listed is that these locations
exist within a context of dialogue, wherein the public may engage with scientific concepts and the
people that are involved in this critical area of work.
Science Engagement Activities YES NO DON’T KNOW
1 Public Library 1 2 8
2 Zoo or Aquarium 1 2 8
3 Museum (any) 1 2 8
4 Science Centre, Technology exhibition 1 2 8
5 Science Café, Festival or similar Public Event 1 2 8
Table A7-1: 5-item science engagement question set in Khayabus wave 2, 2015
The items adopted in the questionnaire represent the key areas that members of the general public
may engage with experts within their respective fields and encounter new scientific ideas. These
areas include visits to and attending events at: public libraries; zoo or aquariums; museums; science
centres / technology exhibitions as well as science cafés, festivals or similar public events (see table
A7-1). Within the 5 item selection list, respondents were asked to indicate if they had visited one or
more of the listed locations within the preceding 12 month period, by indicating a Yes or No
response using a 3-point response scale165.
165
The 3rd point was a don’t know response option
Stellenbosch University https://scholar.sun.ac.za

441
RECODING and DATA TREATMENT
The data requested within this item was used within the questionnaire categories toward
understanding South African science engagement behaviours within the given reference period. All
responses within the don’t know response were considered invalid.
Within the development of an index, the response within this item was considered by the count of
science engagement activities attended toward the development of an index of science engagement.
RELIABILITY OF SCIENCE ENGAGEMENT ACTIVITIES QUESTION SET
Toward assessing the reliability and internal consistence of the 5 items within the science
engagement question, the Cronbach’s Alpha procedure was employed as within previous question
sets.
ITEM 1 ITEM 2 ITEM 3 ITEM 4 ITEM 5
Public Library 1.000
Zoo or Aquarium 0.759 1.000
Museum (any) 0.765 0.799 1.000
Science Centre, Technology exhibition 0.766 0.812 0.769 1.000
Science Café, Festival or similar Public Event 0.706 0.761 0.733 0.828 1.000
Table A7-2: Reliability Analysis Inter-Item Correlation matrix: 5-Item Science Engagement question set
All items within the question set obtained sufficiently high inter-item correlation values (see table
A7-2). As before the threshold of 0.300 recommended by Everet (2002) and Field (2005) has been
adopted toward making an assessment within the inter-item correlation values achieved.
The Cronbach’s Alpha value of 0.943 indicates a generally high degree of internal consistence among
the 5 items in this question set. The reliability statistic produced within SPSS is presented in table A7-
3.
Reliability Statistics
Cronbach's Alpha Cronbach's Alpha Based on Standardized Items N of Items
0.943 0.944 5
Table A7-3: Reliability Statistics: 5-Item Science Engagement question set
Within the table of Item-Total statistics (table A7-4) it is noted that under the column Corrected
Item-Total Correlation, all items achieved high correlations, ranging between 0.0.818 and 0.880. This
result confirms the high degree of internal consistency between the items in this question set. The
column headed Cronbach's Alpha if Item Deleted provides an indication of the impact each item has
on the overall Cronbach’s Alpha score should that item be deleted. All values within the scale are
between 0.927 and 0.934 and as a result all items were retained within the question set.
Stellenbosch University https://scholar.sun.ac.za

442
Scale Mean if
Item Deleted
Scale Variance
if Item Deleted
Corrected Item-Total Correlation
Squared Multiple
Correlation
Cronbach's Alpha if Item
Deleted
Public Library 8.63 20.822 0.818 0.678 0.935
Zoo or Aquarium 8.55 20.247 0.864 0.751 0.927
Museum (any) 8.53 20.750 0.842 0.718 0.931
Science Centre, Technology exhibition 8.48 20.087 0.880 0.786 0.924
Science Café, Festival or similar Public Event 8.45 20.219 0.829 0.718 0.934
Table A7-4: Reliability Analysis Item Total statistics: Science engagement question set in Khayabus wave 2, 2015
The guideline measure for reliability proposed by Tavakol and Dennick (2011) indicates that an
acceptable level for the Cronbach’s Alpha should be between 0.70 and 0.95. The above result
therefore conforms to this guideline, with the Cronbach’s Alpha value of 0.943. This further indicates
that the 5-item Science Engagement question set retains a high degree of internal consistency and
therefore provides a reliable measure within this questionnaire.
RESPONSE ANALYSIS
Responses were achieved from all 3 486 respondents within the sample. As noted earlier, responses
within the don’t know response option were considered invalid and as a result an average of 141
responses across the 5-item question set fell into this response category.
SCIENCE ENGAGEMENT ACTIVITIES YES NO D/K N VALID
N VALID N
%
Public Library 664 2695 127 3486 3359 96.4%
Zoo or Aquarium 438 2909 139 3486 3347 96.0%
Museum (any) 353 3000 133 3486 3353 96.2%
Science Centre, Technology exhibition 241 3098 147 3486 3339 95.8%
Science Café, Festival or similar Public Event 228 3100 158 3486 3328 95.5%
Table A7-5: Response Analysis: Science engagement activities assessment (Khayabus wave 2, 2015)
Total valid response was achieved from 3 345 respondents. This yielded an average valid response
rate of 96.0%, however this did vary for individual questionnaire items (see table A7-5).
Stellenbosch University https://scholar.sun.ac.za
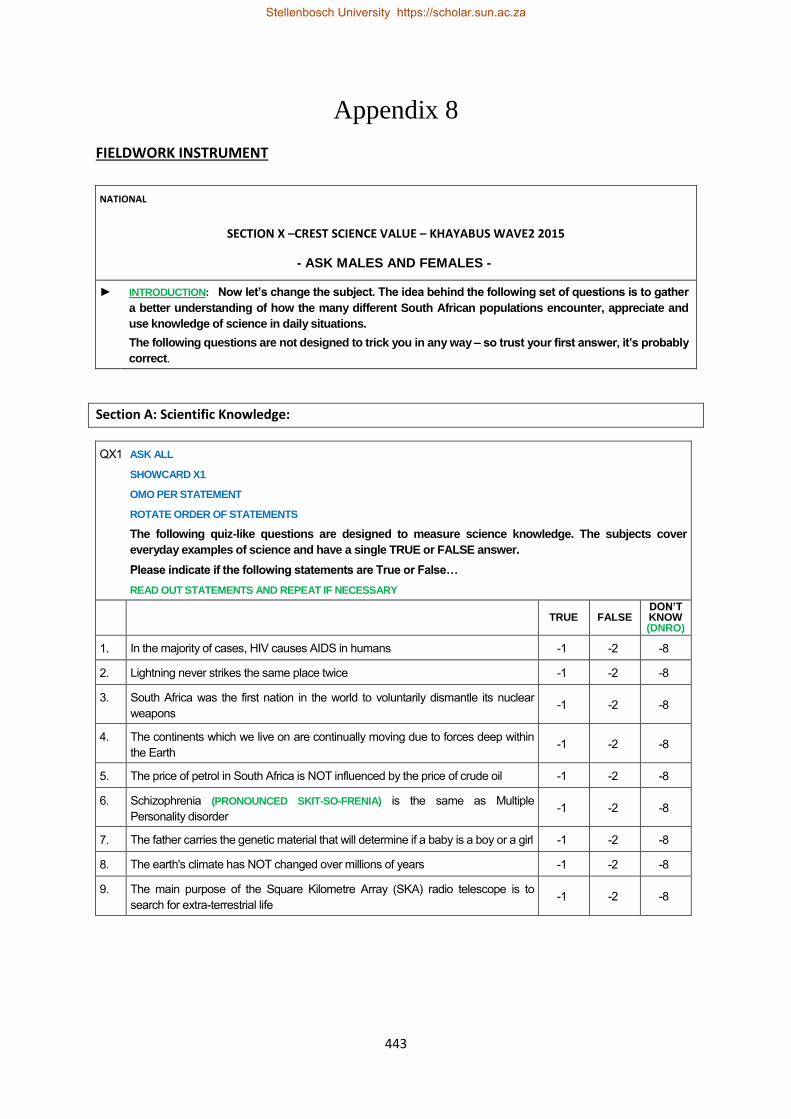
443
Appendix 8
FIELDWORK INSTRUMENT
NATIONAL
SECTION X –CREST SCIENCE VALUE – KHAYABUS WAVE2 2015
- ASK MALES AND FEMALES -
► INTRODUCTION: Now let’s change the subject. The idea behind the following set of questions is to gather
a better understanding of how the many different South African populations encounter, appreciate and
use knowledge of science in daily situations.
The following questions are not designed to trick you in any way – so trust your first answer, it’s probably
correct.
Section A: Scientific Knowledge:
QX1 ASK ALL
SHOWCARD X1
OMO PER STATEMENT
ROTATE ORDER OF STATEMENTS
The following quiz-like questions are designed to measure science knowledge. The subjects cover
everyday examples of science and have a single TRUE or FALSE answer.
Please indicate if the following statements are True or False…
READ OUT STATEMENTS AND REPEAT IF NECESSARY
TRUE FALSE DON’T KNOW (DNRO)
1. In the majority of cases, HIV causes AIDS in humans -1 -2 -8
2. Lightning never strikes the same place twice -1 -2 -8
3. South Africa was the first nation in the world to voluntarily dismantle its nuclear weapons
-1 -2 -8
4. The continents which we live on are continually moving due to forces deep within the Earth
-1 -2 -8
5. The price of petrol in South Africa is NOT influenced by the price of crude oil -1 -2 -8
6. Schizophrenia (PRONOUNCED SKIT-SO-FRENIA) is the same as Multiple Personality disorder
-1 -2 -8
7. The father carries the genetic material that will determine if a baby is a boy or a girl -1 -2 -8
8. The earth's climate has NOT changed over millions of years -1 -2 -8
9. The main purpose of the Square Kilometre Array (SKA) radio telescope is to search for extra-terrestrial life
-1 -2 -8
Stellenbosch University https://scholar.sun.ac.za

444
Section B: Attitudes toward Science:
QX2. ASK ALL
SHOWCARD X2
OMO PER STATEMENT
ROTATE ORDER OF STATEMENTS
Please think about the following 4 statements and tell me to what degree you AGREE or DISAGREE with each of them.
Please use a scale where 1 is strongly agree, 2 is agree, 3 is neither agree nor disagree, 4 is disagree , and 5 is
strongly disagree. READ OUT STATEMENT AND SCALE. REPEAT SCALE AS NECESSARY
HAVE CAUTION TO USE THE CORRECT SHOWCARD AS THIS SCALE IS REVERSED
Attitudinal Statement
STRONGLY
AGREE AGREE
NEITHER
AGREE OR
DISAGREE
DISAGREE STRONGLY
DISAGREE
DON’T
KNOW/
REFUSED
(DNRO)
1. Science and technology are making our lives healthier, easier and more comfortable -1 -2 -3 -4 -5 -8
2. It is not important for me to know about science in my daily life -1 -2 -3 -4 -5 -8
3. Thanks to science and technology, there will be more opportunities for the future generation -1 -2 -3 -4 -5 -8
4. The application of science and new technology makes our way of life change too fast -1 -2 -3 -4 -5 -8
SECTION C: Interest in Science
QX3 ASK ALL
SHOWCARD X3
OMO PER AREA
ROTATE ORDER OF AREAS
Please indicate your general LEVEL OF INTEREST in developments along the following science and
technology areas
READ OUT AREAS AND SCALE. REPEAT SCALE AS NECESSARY
Interest Area VERY INTERESTED
MODERATELY INTERESTED
NO INTEREST DON’T KNOW
(DNRO)
1. Medical Science -1 -2 -3 -8
2. Climate Change -1 -2 -3 -8
3. Technology and the Internet -1 -2 -3 -8
4. Politics -1 -2 -3 -8
5. Economics -1 -2 -3 -8
6. Astronomy -1 -2 -3 -8
7. Energy -1 -2 -3 -8
Stellenbosch University https://scholar.sun.ac.za
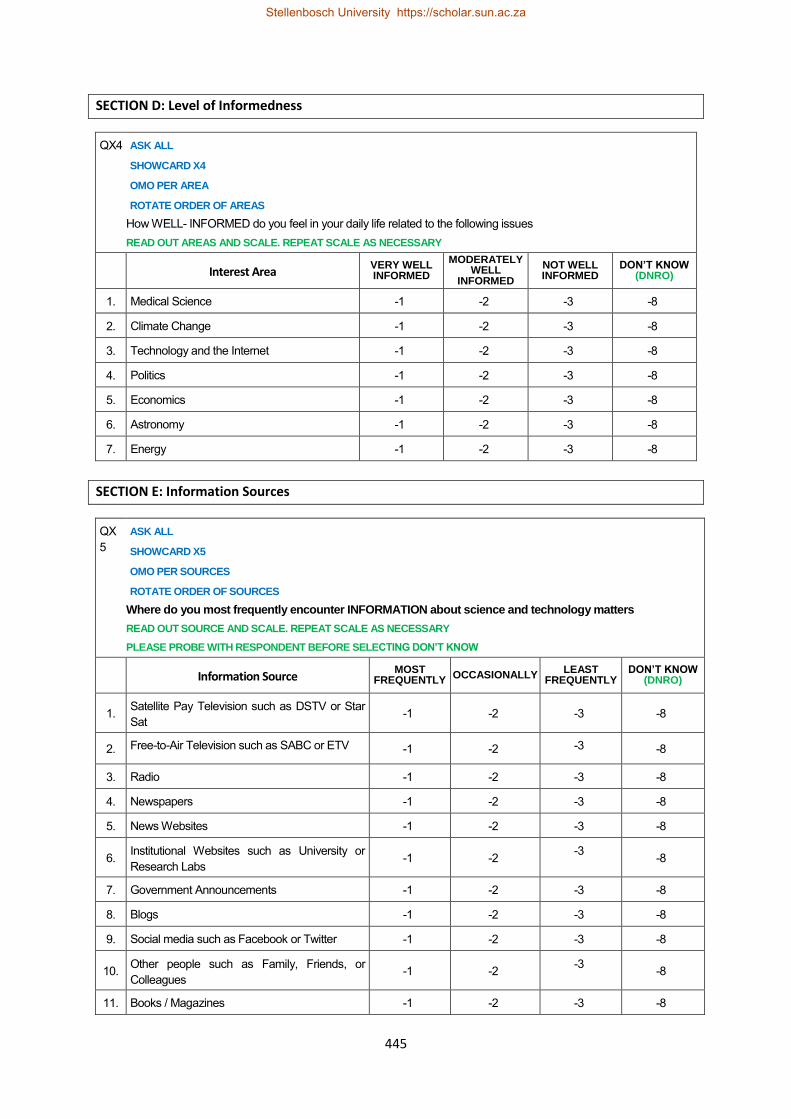
445
SECTION D: Level of Informedness
QX4 ASK ALL
SHOWCARD X4
OMO PER AREA
ROTATE ORDER OF AREAS
How WELL- INFORMED do you feel in your daily life related to the following issues
READ OUT AREAS AND SCALE. REPEAT SCALE AS NECESSARY
Interest Area VERY WELL INFORMED
MODERATELY WELL
INFORMED
NOT WELL INFORMED
DON’T KNOW (DNRO)
1. Medical Science -1 -2 -3 -8
2. Climate Change -1 -2 -3 -8
3. Technology and the Internet -1 -2 -3 -8
4. Politics -1 -2 -3 -8
5. Economics -1 -2 -3 -8
6. Astronomy -1 -2 -3 -8
7. Energy -1 -2 -3 -8
SECTION E: Information Sources
QX5
ASK ALL
SHOWCARD X5
OMO PER SOURCES
ROTATE ORDER OF SOURCES
Where do you most frequently encounter INFORMATION about science and technology matters
READ OUT SOURCE AND SCALE. REPEAT SCALE AS NECESSARY
PLEASE PROBE WITH RESPONDENT BEFORE SELECTING DON’T KNOW
Information Source MOST FREQUENTLY
OCCASIONALLY LEAST
FREQUENTLY DON’T KNOW
(DNRO)
1. Satellite Pay Television such as DSTV or Star Sat
-1 -2 -3 -8
2. Free-to-Air Television such as SABC or ETV -1 -2 -3 -8
3. Radio -1 -2 -3 -8
4. Newspapers -1 -2 -3 -8
5. News Websites -1 -2 -3 -8
6. Institutional Websites such as University or Research Labs
-1 -2 -3 -8
7. Government Announcements -1 -2 -3 -8
8. Blogs -1 -2 -3 -8
9. Social media such as Facebook or Twitter -1 -2 -3 -8
10. Other people such as Family, Friends, or Colleagues
-1 -2 -3 -8
11. Books / Magazines -1 -2 -3 -8
Stellenbosch University https://scholar.sun.ac.za

446
SECTION F: Involvement in Engagement Activities
QX6 ASK ALL
SHOWCARD X6
OMO PER ACTIVITY
ROTATE ORDER OF ACTIVITIES
Have you have VISITED any of the following during the past 12 months
READ OUT ACTIVITIES AND REPEAT IF NECESSARY
Science Engagement Activities YES NO
DON’T KNOW (DNRO)
1. Public Library -1 -2 -8
2. Zoo or Aquarium -1 -2 -8
3. Museum (any) -1 -2 -8
4. Science Centre, Technology exhibition -1 -2 -8
9. Science Café, Festival or similar Public Event -1 -2 -8
=========================================END=====================================
QUESTIONNAIRE SUMMARY INFORMATION
Question Number of Items
SECTION A: Knowledge 9
SECTION B: Attitude 4
SECTION C: Interest 7
SECTION D: Informdness 7
SECTION E: Information sources 11
SECTION F: Engagement activities 5
TOTAL NUMBER OF ITEMS 43
Stellenbosch University https://scholar.sun.ac.za

447
Appendix 9
CODES BOOK - SPSS DATA FILE
VARIABLE DESCRIPTION SPSS VARIABLE NAME CODE LABEL
KNOWLEDGE ITEM 1: HIV AIDS QH1_r1_answ
1 TRUE
2 FALSE
8 DON’T KNOW
KNOWLEDGE ITEM 2: LIGHTNING
QH1_r2_answ
1 TRUE
2 FALSE
8 DON’T KNOW
KNOWLEDGE ITEM 3: SA NUCLEAR WEAPONS
QH1_r3_answ
1 TRUE
2 FALSE
8 DON’T KNOW
KNOWLEDGE ITEM 4: PLATE TECTONICS
QH1_r4_answ
1 TRUE
2 FALSE
8 DON’T KNOW
KNOWLEDGE ITEM 5: PRICE OF PETROL IN SA
QH1_r5_answ
1 TRUE
2 FALSE
8 DON’T KNOW
KNOWLEDGE ITEM 6: SCHIZOPHRENIA
QH1_r6_answ
1 TRUE
2 FALSE
8 DON’T KNOW
KNOWLEDGE ITEM 7: HUMAN GENETICS
QH1_r7_answ
1 TRUE
2 FALSE
8 DON’T KNOW
KNOWLEDGE ITEM 8: CLIMATE CHANGE
QH1_r8_answ
1 TRUE
2 FALSE
8 DON’T KNOW
KNOWLEDGE ITEM 9: MAIN PURPOSE OF THE SKA
QH1_r9_answ
1 TRUE
2 FALSE
8 DON’T KNOW
ATTITUDE ITEM 1: PROMISE: SCIENCE MAKING LIFE
SIMPLER, BETTER QH2_r1_answ
1 STRONGLY AGREE
2 AGREE
3 NEITHER AGREE OR DISAGREE
4 DISAGREE
5 STRONGLY DISAGREE
8 DON’T KNOW/ REFUSED
ATTITUDE ITEM 2: RESERVATION: NOT
IMPORTANT TO KNOW ABOUT SCIENCE
QH2_r2_answ
1 STRONGLY AGREE
2 AGREE
3 NEITHER AGREE OR DISAGREE
4 DISAGREE
5 STRONGLY DISAGREE
8 DON’T KNOW/ REFUSED
Stellenbosch University https://scholar.sun.ac.za

448
ATTITUDE ITEM 3: PROMISE: THANKS TO SCIENCE MORE
OPPORTUNITIES QH2_r3_answ
1 STRONGLY AGREE
2 AGREE
3 NEITHER AGREE OR DISAGREE
4 DISAGREE
5 STRONGLY DISAGREE
8 DON’T KNOW/ REFUSED
ATTITUDE ITEM 4: RESERVATION: SCIENCE MAKES
LIFE CHANGE TOO FAST QH2_r4_answ
1 STRONGLY AGREE
2 AGREE
3 NEITHER AGREE OR DISAGREE
4 DISAGREE
5 STRONGLY DISAGREE
8 DON’T KNOW/ REFUSED
INTEREST ITEM1: MEDICAL QH3_r1_answ
1 VERY INTERESTED
2 MODERATELY INTERESTED
3 NO INTEREST
8 DON’T KNOW
INTEREST ITEM 2: CLIMATE CHANGE
QH3_r2_answ
1 VERY INTERESTED
2 MODERATELY INTERESTED
3 NO INTEREST
8 DON’T KNOW
INTEREST ITEM 3: TECHNOLOGY
QH3_r3_answ
1 VERY INTERESTED
2 MODERATELY INTERESTED
3 NO INTEREST
8 DON’T KNOW
INTEREST ITEM 4: POLITICS QH3_r4_answ
1 VERY INTERESTED
2 MODERATELY INTERESTED
3 NO INTEREST
8 DON’T KNOW
INTEREST ITEM 5: ECONOMICS QH3_r5_answ
1 VERY INTERESTED
2 MODERATELY INTERESTED
3 NO INTEREST
8 DON’T KNOW
INTEREST ITEM 6: ASTRONOMY QH3_r6_answ
1 VERY INTERESTED
2 MODERATELY INTERESTED
3 NO INTEREST
8 DON’T KNOW
Stellenbosch University https://scholar.sun.ac.za

449
INTEREST ITEM 7: ENERGY QH3_r7_answ
1 VERY INTERESTED
2 MODERATELY INTERESTED
3 NO INTEREST
8 DON’T KNOW
INFORMEDNESS ITEM1: MEDICAL
QH4_r1_answ
1 VERY WELL INFORMED
2 MODERATELY WELL INFORMED
3 NOT WELL INFORMED
8 DON’T KNOW
INFORMEDNESS ITEM 2: CLIMATE CHANGE
QH4_r2_answ
1 VERY WELL INFORMED
2 MODERATELY WELL INFORMED
3 NOT WELL INFORMED
8 DON’T KNOW
INFORMEDNESS ITEM 3: TECHNOLOGY
QH4_r3_answ
1 VERY WELL INFORMED
2 MODERATELY WELL INFORMED
3 NOT WELL INFORMED
8 DON’T KNOW
INFORMEDNESS ITEM 4: POLITICS
QH4_r4_answ
1 VERY WELL INFORMED
2 MODERATELY WELL INFORMED
3 NOT WELL INFORMED
8 DON’T KNOW
INFORMEDNESS ITEM 5: ECONOMICS
QH4_r5_answ
1 VERY WELL INFORMED
2 MODERATELY WELL INFORMED
3 NOT WELL INFORMED
8 DON’T KNOW
INFORMEDNESS ITEM 6: ASTRONOMY
QH4_r6_answ
1 VERY WELL INFORMED
2 MODERATELY WELL INFORMED
3 NOT WELL INFORMED
8 DON’T KNOW
INFORMEDNESS ITEM 7: ENERGY
QH4_r7_answ
1 VERY WELL INFORMED
2 MODERATELY WELL INFORMED
3 NOT WELL INFORMED
8 DON’T KNOW
INFORMATION SOURCES ITEM 1: SATELLITE TV
QH5_r1_answ
1 MOST FREQUENTLY
2 OCCASIONALLY
3 LEAST FREQUENTLY
8 DON’T KNOW
INFORMATION SOURCES ITEM 2: SABC TV
QH5_r2_answ
1 MOST FREQUENTLY
2 OCCASIONALLY
3 LEAST FREQUENTLY
8 DON’T KNOW
Stellenbosch University https://scholar.sun.ac.za

450
INFORMATION SOURCES ITEM 3: RADIO
QH5_r3_answ
1 MOST FREQUENTLY
2 OCCASIONALLY
3 LEAST FREQUENTLY
8 DON’T KNOW
INFORMATION SOURCES ITEM 4: NEWSPAPERS
QH5_r4_answ
1 MOST FREQUENTLY
2 OCCASIONALLY
3 LEAST FREQUENTLY
8 DON’T KNOW
INFORMATION SOURCES ITEM 5: NEWS WEBSITES
QH5_r5_answ
1 MOST FREQUENTLY
2 OCCASIONALLY
3 LEAST FREQUENTLY
8 DON’T KNOW
INFORMATION SOURCES ITEM 6: INSTITUTIONAL WEBSITES
QH5_r6_answ
1 MOST FREQUENTLY
2 OCCASIONALLY
3 LEAST FREQUENTLY
8 DON’T KNOW
INFORMATION SOURCES ITEM 7: GOVERNMENT
ANNOUNCEMENTS QH5_r7_answ
1 MOST FREQUENTLY
2 OCCASIONALLY
3 LEAST FREQUENTLY
8 DON’T KNOW
INFORMATION SOURCES ITEM 8: BLOGS
QH5_r8_answ
1 MOST FREQUENTLY
2 OCCASIONALLY
3 LEAST FREQUENTLY
8 DON’T KNOW
INFORMATION SOURCES ITEM 9: SOCIAL MEDIA
QH5_r9_answ
1 MOST FREQUENTLY
2 OCCASIONALLY
3 LEAST FREQUENTLY
8 DON’T KNOW
INFORMATION SOURCES ITEM 10: OTHER PEOPLE
QH5_r10_answ
1 MOST FREQUENTLY
2 OCCASIONALLY
3 LEAST FREQUENTLY
8 DON’T KNOW
INFORMATION SOURCES ITEM 11: BOOKS / MAGAZINES
QH5_r11_answ
1 MOST FREQUENTLY
2 OCCASIONALLY
3 LEAST FREQUENTLY
8 DON’T KNOW
SCIENCE ENGAGEMENT ITEM 1: LIBRARY
QH6_r1_answ
1 YES
2 NO
8 DON’T KNOW
Stellenbosch University https://scholar.sun.ac.za

451
SCIENCE ENGAGEMENT ITEM 2: ZOO
QH6_r2_answ
1 YES
2 NO
8 DON’T KNOW
SCIENCE ENGAGEMENT ITEM 3: MUSEUM
QH6_r3_answ
1 YES
2 NO
8 DON’T KNOW
SCIENCE ENGAGEMENT ITEM 4: SCIENCE CENTRE
QH6_r4_answ
1 YES
2 NO
8 DON’T KNOW
SCIENCE ENGAGEMENT ITEM 5: SCIENCE CAFÉ
QH6_r5_answ
1 YES
2 NO
8 DON’T KNOW
ATTITUDINAL ITEM RECODED 3 CATEGORIES
ATT_1_P1_RECODE
1 AGREE
2 NEUTRAL
3 DISAGREE
8 D/K
ATTITUDINAL ITEM RECODED 3 CATEGORIES
ATT_2_R1_RECODE
1 AGREE
2 NEUTRAL
3 DISAGREE
8 D/K
ATTITUDINAL ITEM RECODED 3 CATEGORIES
ATT_3_P2_RECODE
1 AGREE
2 NEUTRAL
3 DISAGREE
8 D/K
ATTITUDINAL ITEM RECODED 3 CATEGORIES
ATT_4_R2_RECODE
1 AGREE
2 NEUTRAL
3 DISAGREE
8 D/K
SELF-EMPLOYED (Y/N) P6_SELF_EMPL 1 Yes
2 No
Stellenbosch University https://scholar.sun.ac.za

452
RELIGION AFFILIATION P29_RELIGION
1 Protestant (including Zionist, Baptist, Evangelical, Pentecostal, Methodist)
2 Catholic
3 Ancestral, tribal, animist, or other traditional African religion, such as Zulu or San beliefs
4 Just a Christian
5 Jehovah's Witness
6 Mormon (Church of Jesus Christ of Latter-day Saints/LDS)
7 Muslim
8 Hindu
9 Jewish
10 Atheist
11 Agnostic
12 Nothing in particular
13 Something else (SPECIFY)
14 Don't know / Refused <font color = "green">(DNRO)</font>
AGE GROUP P8_AGE_GROUP
1 01 - (15 – 17 years)
2 02 - (18 – 19 years)
3 03 - (20 – 24 years)
4 04 - (25 – 29 years)
5 05 - (30 – 34 years)
6 06 - (35 – 39 years)
7 07 - (40 – 44 years)
8 08 - (45 – 49 years)
9 09 - (50 – 54 years)
10 10 - (55 – 59 years)
11 11 - (60 – 64 years)
12 12 - (65+ years)
13 Refusal <font color = "green">(DNRO)</font>
MARITAL STATUS P9_MARITAL
1 Single
2 Married
3 Living together
4 Widowed
5 Divorced
6 Separated
Stellenbosch University https://scholar.sun.ac.za

453
EDUCATIONAL ATTAINMENT P10_EDUCATION
1 No schooling
2 Some primary school
3 Primary school completed
4 Some high school
5 Matric / Grade 12
6 Artisan’s certificate obtained
7 Technikon diploma/degree completed
8 University degree completed
9 Professional
10 Technical
11 Secretarial
12 Other(Specify)
HOUSEHOLD INCOME P11_2_HH_INCOME
1 01 - (R40 000 +)
2 02 - (R30 000 – R39 999)
3 03 - (R25 000 – R29 999)
4 04 - (R20 000 – R24 999)
5 05 - (R16 000 – R19 999)
6 06 - (R14 000 – R15 999)
7 07 - (R12 000 – R13 999)
8 08 - (R11 000 – R11 999)
9 09 - (R10 000 – R10 999)
10 10 - (R9 000 – R9 999)
11 11 - (R8 000 – R8 999)
12 12 - (R7 000 – R7 999)
13 13 - (R6 000 – R6999)
14 14 - (R5 000 – R5 999)
15 15 - (R4 000 – R4 999)
16 16 - (R3000 – R3 999)
17 17 - (R2500 – R2 999)
18 18 - (R2000 – R2499)
19 19 - (R1600 – R1 999)
20 20 - (R1400 – R1599)
21 21 - (R1200 – R1399)
22 22 - (R1100 – R1199)
23 23 - (R1000 – R1099)
24 24 - (R900 – R999)
25 25 - (R800 – R899)
26 26 - (R700 – R799)
27 27 - (R600 – R699)
28 28 - (R500 – R599)
29 29 - (R400 – R499)
Stellenbosch University https://scholar.sun.ac.za
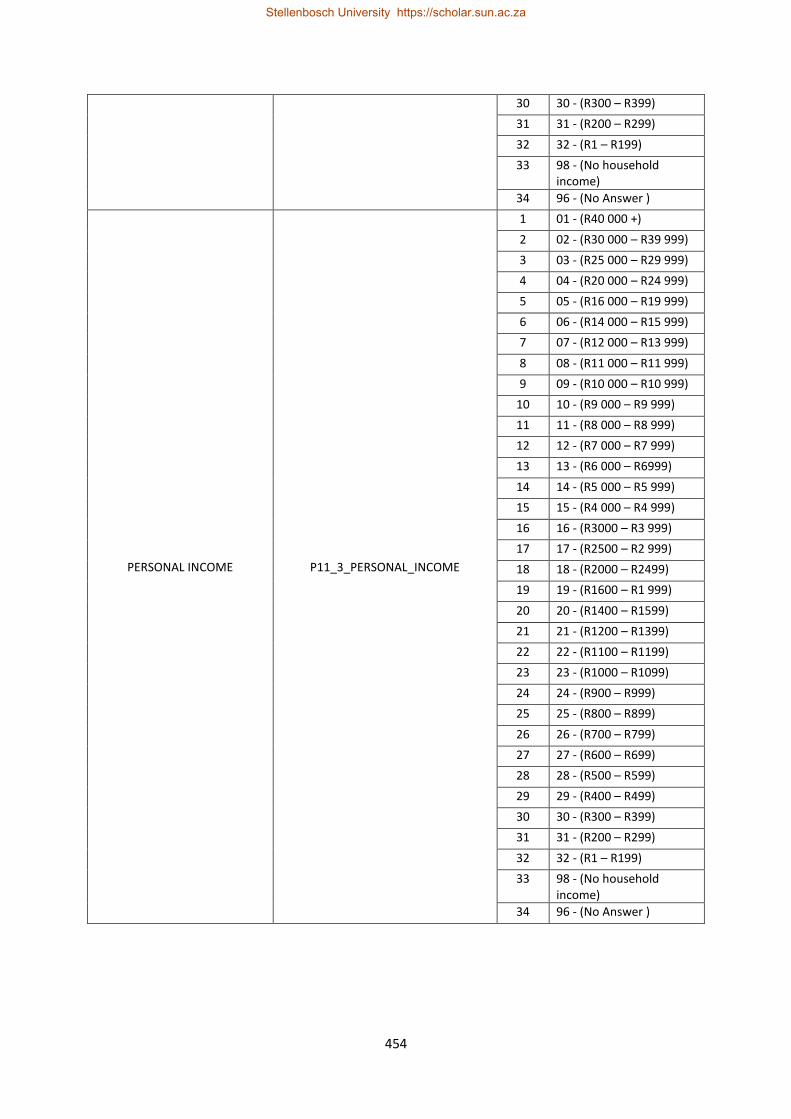
454
30 30 - (R300 – R399)
31 31 - (R200 – R299)
32 32 - (R1 – R199)
33 98 - (No household income)
34 96 - (No Answer )
PERSONAL INCOME P11_3_PERSONAL_INCOME
1 01 - (R40 000 +)
2 02 - (R30 000 – R39 999)
3 03 - (R25 000 – R29 999)
4 04 - (R20 000 – R24 999)
5 05 - (R16 000 – R19 999)
6 06 - (R14 000 – R15 999)
7 07 - (R12 000 – R13 999)
8 08 - (R11 000 – R11 999)
9 09 - (R10 000 – R10 999)
10 10 - (R9 000 – R9 999)
11 11 - (R8 000 – R8 999)
12 12 - (R7 000 – R7 999)
13 13 - (R6 000 – R6999)
14 14 - (R5 000 – R5 999)
15 15 - (R4 000 – R4 999)
16 16 - (R3000 – R3 999)
17 17 - (R2500 – R2 999)
18 18 - (R2000 – R2499)
19 19 - (R1600 – R1 999)
20 20 - (R1400 – R1599)
21 21 - (R1200 – R1399)
22 22 - (R1100 – R1199)
23 23 - (R1000 – R1099)
24 24 - (R900 – R999)
25 25 - (R800 – R899)
26 26 - (R700 – R799)
27 27 - (R600 – R699)
28 28 - (R500 – R599)
29 29 - (R400 – R499)
30 30 - (R300 – R399)
31 31 - (R200 – R299)
32 32 - (R1 – R199)
33 98 - (No household income)
34 96 - (No Answer )
Stellenbosch University https://scholar.sun.ac.za

455
COMMUNITY SIZE CommSize
1 Metropolitan area
2 City
3 Large Town
4 Small Town
5 Large Village
6 Small Village
7 Settlement
8 Rural
RACE GROUP DEMOG_P19_POP_GROUP
1 White
2 Black
3 Indian / Asian
4 Coloured
PROVINCE DEMOG_Province
1 Western Cape
2 Eastern Cape
3 Northern Cape
4 Free State
5 KwaZulu Natal
6 North West
7 Gauteng
8 Mpumalanga
9 Limpopo
RURAL URBAN DEMOG_RURAL_URBAN 1 URBAN
2 RURAL
GENDER DEMOG_P1_GENDER 1 Male
2 Female
AGE - RECODED DEMOG_New_AGE
1 <20 YEARS
2 20-29 YEARS
3 30-39 YEARS
4 40-49 YEARS
5 50-59 YEARS
6 60+ YEARS
LANGUAGE SPOKEN DEMOG_P2_LANGUAGE
1 Afrikaans
2 English
3 Ndebele
4 North Sotho (Sepedi)
5 South Sotho (Sesotho)
6 Swazi
7 Tsonga/Shangaan
8 Tswana
9 Venda
10 Xhosa
11 Zulu
12 Other
Stellenbosch University https://scholar.sun.ac.za

456
EDUCATIONAL ATTAINMENT RECODED
DEMOG_NEW_EDUCATION
1 No schooling
2 Primry School
3 Some High School
4 Matric completed
5 Certificate / Diploma completed
6 University Degree completed
7 Other
EDUCATIONAL ATTAINMENT CATEGORIES
DEMOG_3_EDUCATION
1 PRE-MATRIC (1)
2 MATRIC COMPLETED (2)
3 POST-MATRIC (3)
EMPLOYMENT DETAIL DEMOG_P5_EMPLOYMENT
1 Working full-time
2 Working part-time
3 Not Working - Housewife
4 Not Working - Student
5 Not Working - Retired
6 Unemployed - looking for work
7 Unemployed - not looking for work
EMPLOYMENT RECODED 3 CATEGORIES
DEMOG_EMPLOYMENT_RECODE
1 EMPLOYED (1)
2 UNEMPLOYED (2)
3 OTHER (NOT WORKING) (3)
HOUSEHOLD INCOME RECODED
DEMOG_HH_INCOME
1 01 - (R40 000 +)
2 02 - (R30 000 – R39 999)
3 03 - (R20 000 – R29 999)
4 04 - (R10 000 – R19 999)
5 05 - (R5 000 – R9 999)
6 06 - (R0 001 – R4 999)
7 07 - (No household income)
8 08 - (No answer)
HOUSEHOLD INCOME 3 CATEGORIES
DEMOG_3_HH_INCOME
1 LOW INCOME (LESS THAN R10K) (1)
2 MODERATE INCOME (BETWEEN R10K-R29K) (2)
3 HIGH INCOME (R 30K+) (3)
KNOWLEDGE ITEM RECODED CORRECT - INCORRECT
KNOW_HIV_RECODE
0 SCIENTIFICALLY INVALID (0)
1 SCIENTIFICALLY VALID (1)
KNOWLEDGE ITEM RECODED CORRECT - INCORRECT
KNOW_LIGHT_RECODE
0 SCIENTIFICALLY INVALID (0)
1 SCIENTIFICALLY VALID (1)
Stellenbosch University https://scholar.sun.ac.za

457
KNOWLEDGE ITEM RECODED CORRECT - INCORRECT
KNOW_NUKE_RECODE
0 SCIENTIFICALLY INVALID (0)
1 SCIENTIFICALLY VALID (1)
KNOWLEDGE ITEM RECODED CORRECT - INCORRECT
KNOW_PLATE_RECODE
0 SCIENTIFICALLY INVALID (0)
1 SCIENTIFICALLY VALID (1)
KNOWLEDGE ITEM RECODED CORRECT - INCORRECT
KNOW_PETROL_RECODE
0 SCIENTIFICALLY INVALID (0)
1 SCIENTIFICALLY VALID (1)
KNOWLEDGE ITEM RECODED CORRECT - INCORRECT
KNOW_PSYC_RECODE
0 SCIENTIFICALLY INVALID (0)
1 SCIENTIFICALLY VALID (1)
KNOWLEDGE ITEM RECODED CORRECT - INCORRECT
KNOW_GENETICS_RECODE
0 SCIENTIFICALLY INVALID (0)
1 SCIENTIFICALLY VALID (1)
KNOWLEDGE ITEM RECODED CORRECT - INCORRECT
KNOW_CLIMATE_RECODE
0 SCIENTIFICALLY INVALID (0)
1 SCIENTIFICALLY VALID (1)
KNOWLEDGE ITEM RECODED CORRECT - INCORRECT
KNOW_SKA_RECODE
0 SCIENTIFICALLY INVALID (0)
1 SCIENTIFICALLY VALID (1)
KNOWLEDGE_INDEX KNOWLEDGE_INDEX
1 LOW (1)
2 MODERATE (2)
3 HIGH (3)
ATTITUDE_INDEX ATTITUDE_INDEX
-1 NEGATIVE ATTITUDE (-1)
0 AMBIVALENT ATTITUDE (0)
1 POSITIVE ATTITUDE (+1)
INTEREST ITEM RECODED 3 CATEGORIES
INTEREST_MED_RECODE
0 NO INTEREST (0)
1 MODERATE INTEREST (1)
2 HIGH INTEREST (2)
INTEREST ITEM RECODED 3 CATEGORIES
INTEREST_CLIMATE_RECODE
0 NO INTEREST (0)
1 MODERATE INTEREST (1)
2 HIGH INTEREST (2)
INTEREST ITEM RECODED 3 CATEGORIES
INTEREST_TECH_RECODE
0 NO INTEREST (0)
1 MODERATE INTEREST (1)
2 HIGH INTEREST (2)
INTEREST ITEM RECODED 3 CATEGORIES
INTEREST_POL_RECODE
0 NO INTEREST (0)
1 MODERATE INTEREST (1)
2 HIGH INTEREST (2)
INTEREST ITEM RECODED 3 CATEGORIES
INTEREST_ECON_RECODE
0 NO INTEREST (0)
1 MODERATE INTEREST (1)
2 HIGH INTEREST (2)
INTEREST ITEM RECODED 3 CATEGORIES
INTEREST_ASTRO_RECODE
0 NO INTEREST (0)
1 MODERATE INTEREST (1)
2 HIGH INTEREST (2)
Stellenbosch University https://scholar.sun.ac.za

458
INTEREST ITEM RECODED 3 CATEGORIES
INTEREST_ENERGY_RECODE
0 NO INTEREST (0)
1 MODERATE INTEREST (1)
2 HIGH INTEREST (2)
INTEREST_INDEX INTEREST_INDEX
1 LOW INTEREST (1)
2 MODERATE INTEREST (2)
3 HIGH INTEREST (3)
INFORMEDNESS ITEM RECODED
INFORM_MED_RECODE
0 D/K (0)
1 NOT WELL INFORMED (1)
2 MODERATE INFORMED (2)
3 VERY WELL INFORMED (3)
INFORMEDNESS ITEM RECODED
INFORM_CLIMATE_RECODE
0 D/K (0)
1 NOT WELL INFORMED (1)
2 MODERATE INFORMED (2)
3 VERY WELL INFORMED (3)
INFORMEDNESS ITEM RECODED
INFORM_TECH_RECODE
0 D/K (0)
1 NOT WELL INFORMED (1)
2 MODERATE INFORMED (2)
3 VERY WELL INFORMED (3)
INFORMEDNESS ITEM RECODED
INFORM_POL_RECODE
0 D/K (0)
1 NOT WELL INFORMED (1)
2 MODERATE INFORMED (2)
3 VERY WELL INFORMED (3)
INFORMEDNESS ITEM RECODED
INFORM_ECON_RECODE
0 D/K (0)
1 NOT WELL INFORMED (1)
2 MODERATE INFORMED (2)
3 VERY WELL INFORMED (3)
INFORMEDNESS ITEM RECODED
INFORM_ASTRO_RECODE
0 D/K (0)
1 NOT WELL INFORMED (1)
2 MODERATE INFORMED (2)
3 VERY WELL INFORMED (3)
INFORMEDNESS ITEM RECODED
INFORM_ENERGY_RECODE
0 D/K (0)
1 NOT WELL INFORMED (1)
2 MODERATE INFORMED (2)
3 VERY WELL INFORMED (3)
Stellenbosch University https://scholar.sun.ac.za

459
INFORMEDNESS_INDEX INFORMEDNESS_INDEX
1 LOW INFORMEDNESS (1)
2 MODERATE INFORMEDNESS (2)
3 HIGH INFORMEDNESS (3)
INFORMATION SOURCE RECODED
INFOSOURCE_PAYTV_RECODE
0 D/K (0)
1 LEAST FREQUENTLY (1)
2 OCCASIONALLY (2)
3 MOST FREQUENTLY (3)
INFORMATION SOURCE RECODED
INFOSOURCE_FREETV_RECODE
0 D/K (0)
1 LEAST FREQUENTLY (1)
2 OCCASIONALLY (2)
3 MOST FREQUENTLY (3)
INFORMATION SOURCE RECODED
INFOSOURCE_RADIO_RECODE
0 D/K (0)
1 LEAST FREQUENTLY (1)
2 OCCASIONALLY (2)
3 MOST FREQUENTLY (3)
INFORMATION SOURCE RECODED
INFOSOURCE_NEWSPAPERS_RECODE
0 D/K (0)
1 LEAST FREQUENTLY (1)
2 OCCASIONALLY (2)
3 MOST FREQUENTLY (3)
INFORMATION SOURCE RECODED
INFOSOURCE_NEWSwww_RECODE
0 D/K (0)
1 LEAST FREQUENTLY (1)
2 OCCASIONALLY (2)
3 MOST FREQUENTLY (3)
INFORMATION SOURCE RECODED
INFOSOURCE_INSTITwww_RECODE
0 D/K (0)
1 LEAST FREQUENTLY (1)
2 OCCASIONALLY (2)
3 MOST FREQUENTLY (3)
INFORMATION SOURCE RECODED
INFOSOURCE_GOV_RECODE
0 D/K (0)
1 LEAST FREQUENTLY (1)
2 OCCASIONALLY (2)
3 MOST FREQUENTLY (3)
INFORMATION SOURCE RECODED
INFOSOURCE_BLOG_RECODE
0 D/K (0)
1 LEAST FREQUENTLY (1)
2 OCCASIONALLY (2)
3 MOST FREQUENTLY (3)
INFORMATION SOURCE RECODED
INFOSOURCE_SOCwww_RECODE
0 D/K (0)
1 LEAST FREQUENTLY (1)
2 OCCASIONALLY (2)
3 MOST FREQUENTLY (3)
INFORMATION SOURCE RECODED
INFOSOURCE_PEOPLE_RECODE
0 D/K (0)
1 LEAST FREQUENTLY (1)
2 OCCASIONALLY (2)
3 MOST FREQUENTLY (3)
Stellenbosch University https://scholar.sun.ac.za

460
INFORMATION SOURCE RECODED
INFOSOURCE_BOOKSMAGS_RECODE
0 D/K (0)
1 LEAST FREQUENTLY (1)
2 OCCASIONALLY (2)
3 MOST FREQUENTLY (3)
INFOSOURCE_INDEX INFOSOURCE_INDEX
1 LOW INFORMATION IMMERSION (1)
2 MODERATE INFORMATION IMMERSION (2)
3 HIGH INFORMATION IMMERSION (3)
SCIENCE ENGAGEMENT ITEM RECODED
ENG_LIB_RECODE 0 NO (0)
1 YES (1)
SCIENCE ENGAGEMENT ITEM RECODED
ENG_ZOO_RECODE 0 NO (0)
1 YES (1)
SCIENCE ENGAGEMENT ITEM RECODED
ENG_MUS_RECODE 0 NO (0)
1 YES (1)
SCIENCE ENGAGEMENT ITEM RECODED
ENG_SCICEN_RECODE 0 NO (0)
1 YES (1)
SCIENCE ENGAGEMENT ITEM RECODED
ENG_FEST_RECODE 0 NO (0)
1 YES (1)
ENGAGEMENT_INDEX ENGAGEMENT_INDEX
1 LOW ENGAGEMENT (1)
2 MODERATE ENGAGEMENT (2)
3 HIGH ENGAGEMENT (3)
Stellenbosch University https://scholar.sun.ac.za

461
Appendix 10
MULTINOMIAL LOGISTIC REGRESSION OUTPUTS:
SCIENTIFIC KNOWLEDGE INDEX:
Case Processing Summary
N
Marginal
Percentage
KNOWLEDGE_INDEX LOW (1) 774 37.9%
MODERATE (2) 530 26.0%
HIGH (3) 737 36.1%
P19_POP_GROUP White 227 11.1%
Black 1558 76.3%
Indian / Asian 76 3.7%
Coloured 180 8.8%
DEMOG_RURAL_URBAN URBAN 1392 68.2%
RURAL 649 31.8%
DEMOG_P1_GENDER Male 1038 50.9%
Female 1003 49.1%
DEMOG_New_AGE <20 YEARS 70 3.4%
20-29 YEARS 605 29.6%
30-39 YEARS 626 30.7%
40-49 YEARS 377 18.5%
50-59 YEARS 202 9.9%
60+ YEARS 161 7.9%
DEMOG_3_EDUCATION PRE-MATRIC (1) 720 35.3%
MATRIC COMPLETED (2) 987 48.4%
POST-MATRIC (3) 334 16.4%
DEMOG_EMPLOYMENT_RE
CODE
EMPLOYED (1) 1035 50.7%
UNEMPLOYED (2) 696 34.1%
OTHER (NOT WORKING) (3) 310 15.2%
DEMOG_3_HH_INCOME LOW INCOME (LESS THAN
R10K) (1)
1431 70.1%
MODERATE INCOME
(BETWEEN R10K-R20K) (2)
466 22.8%
HIGH INCOME (R 30K+) (3) 144 7.1%
Valid 2041 100.0%
Missing 1445
Total 3486
Subpopulation 530a
a. The dependent variable has only one value observed in 303 (57.2%) subpopulations.
Stellenbosch University https://scholar.sun.ac.za

462
Step Summary
Model Action Effect(s)
Model Fitting
Criteria Effect Selection Tests
-2 Log Likelihood Chi-Squareb df Sig.
0 Entered <all>a 1813.310 .
1 Removed DEMOG_New_A
GE
1822.302 8.992 10 .533
2 Removed DEMOG_EMPLO
YMENT_RECOD
E
1825.345 3.043 4 .551
3 Removed DEMOG_RURAL
_URBAN
1827.387 2.042 2 .360
4 Removed DEMOG_P1_GE
NDER
1829.512 2.125 2 .346
Stepwise Method: Backward Elimination
a. This model contains all effects specified or implied in the MODEL subcommand.
b. The chi-square for removal is based on the likelihood ratio test.
Model Fitting Information
Model
Model Fitting
Criteria Likelihood Ratio Tests
-2 Log Likelihood Chi-Square df Sig.
Intercept Only 1931.190
Final 1829.512 101.678 14 .000
Goodness-of-Fit Chi-Square df Sig.
Pearson 1000.608 1044 .829
Deviance 1118.375 1044 .054
Likelihood Ratio Tests
Effect
Model Fitting
Criteria Likelihood Ratio Tests
-2 Log Likelihood
of Reduced
Model Chi-Square df Sig.
Intercept 1829.512a .000 0 .
P19_POP_GROUP 1842.536 13.024 6 .043
DEMOG_3_EDUCATION 1849.143 19.631 4 .001
DEMOG_3_HH_INCOME 1860.721 31.209 4 .000
Stellenbosch University https://scholar.sun.ac.za

463
Parameter Estimates
KNOWLEDGE_INDEXa B Std. Error Wald df Sig. Exp(B)
95% Confidence Interval for
Exp(B)
Lower Bound Upper Bound
MODERATE (2) Intercept .862 .339 6.458 1 .011
[P19_POP_GROUP=1] -.348 .284 1.504 1 .220 .706 .405 1.231
[P19_POP_GROUP=2] -.347 .206 2.850 1 .091 .706 .472 1.058
[P19_POP_GROUP=3] -1.214 .401 9.176 1 .002 .297 .135 .651
[P19_POP_GROUP=4] 0b . . 0 . . . .
[DEMOG_3_EDUCATION=1.00
]
-.542 .205 6.958 1 .008 .582 .389 .870
[DEMOG_3_EDUCATION=2.00
]
.014 .185 .005 1 .942 1.014 .706 1.456
[DEMOG_3_EDUCATION=3.00
]
0b . . 0 . . . .
[DEMOG_3_HH_INCOME=1.0
0]
-.854 .304 7.902 1 .005 .426 .235 .772
[DEMOG_3_HH_INCOME=2.0
0]
-.409 .294 1.928 1 .165 .664 .373 1.183
[DEMOG_3_HH_INCOME=3.0
0]
0b . . 0 . . . .
HIGH (3) Intercept 1.113 .313 12.682 1 .000
[P19_POP_GROUP=1] .085 .261 .107 1 .743 1.089 .653 1.815
[P19_POP_GROUP=2] -.206 .195 1.115 1 .291 .814 .555 1.193
[P19_POP_GROUP=3] -.404 .320 1.593 1 .207 .668 .357 1.250
[P19_POP_GROUP=4] 0b . . 0 . . . .
[DEMOG_3_EDUCATION=1.00
]
-.124 .188 .436 1 .509 .883 .611 1.276
[DEMOG_3_EDUCATION=2.00
]
-.016 .172 .008 1 .928 .985 .702 1.380
[DEMOG_3_EDUCATION=3.00
]
0b . . 0 . . . .
[DEMOG_3_HH_INCOME=1.0
0]
-1.166 .276 17.853 1 .000 .312 .181 .535
[DEMOG_3_HH_INCOME=2.0
0]
-.481 .265 3.292 1 .070 .618 .368 1.039
[DEMOG_3_HH_INCOME=3.0
0]
0b . . 0 . . . .
a. The reference category is: LOW (1).
b. This parameter is set to zero because it is redundant.
Stellenbosch University https://scholar.sun.ac.za

464
ATTITUDE TO SCIENCE INDEX
Case Processing Summary
N
Marginal
Percentage
ATTITUDE_INDEX NEGATIVE ATTITUDE (-1) 443 20.7%
AMBIVALENT ATTITUDE (0) 725 33.9%
POSITIVE ATTITUDE (+1) 972 45.4%
DEMOG_RURAL_URBAN URBAN 1461 68.3%
RURAL 679 31.7%
DEMOG_P1_GENDER Male 1082 50.6%
Female 1058 49.4%
DEMOG_New_AGE <20 YEARS 84 3.9%
20-29 YEARS 653 30.5%
30-39 YEARS 650 30.4%
40-49 YEARS 384 17.9%
50-59 YEARS 212 9.9%
60+ YEARS 157 7.3%
DEMOG_3_EDUCATION PRE-MATRIC (1) 764 35.7%
MATRIC COMPLETED (2) 1033 48.3%
POST-MATRIC (3) 343 16.0%
DEMOG_EMPLOYMENT_REC
ODE
EMPLOYED (1) 1092 51.0%
UNEMPLOYED (2) 732 34.2%
OTHER (NOT WORKING) (3) 316 14.8%
DEMOG_3_HH_INCOME LOW INCOME (LESS THAN
R10K) (1)
1512 70.7%
MODERATE INCOME
(BETWEEN R10K-R20K) (2)
483 22.6%
HIGH INCOME (R 30K+) (3) 145 6.8%
P19_POP_GROUP White 229 10.7%
Black 1640 76.6%
Indian / Asian 79 3.7%
Coloured 192 9.0%
Valid 2140 100.0%
Missing 1346
Total 3486
Subpopulation 538a
a. The dependent variable has only one value observed in 312 (58.0%) subpopulations.
Stellenbosch University https://scholar.sun.ac.za

465
Step Summary
Model Action Effect(s)
Model Fitting
Criteria Effect Selection Tests
-2 Log Likelihood Chi-Squareb df Sig.
0 Entered <all>a 1876.856 .
1 Removed DEMOG_3_EDU
CATION
1879.066 2.210 4 .697
2 Removed DEMOG_EMPLO
YMENT_RECOD
E
1882.338 3.272 4 .513
3 Removed DEMOG_RURAL
_URBAN
1884.504 2.166 2 .339
4 Removed DEMOG_3_HH_I
NCOME
1889.852 5.347 4 .253
5 Removed DEMOG_New_A
GE
1902.563 12.711 10 .240
6 Removed DEMOG_P1_GE
NDER
1906.285 3.722 2 .155
Stepwise Method: Backward Elimination
a. This model contains all effects specified or implied in the MODEL subcommand.
b. The chi-square for removal is based on the likelihood ratio test.
Model Fitting Information
Model
Model Fitting
Criteria Likelihood Ratio Tests
-2 Log Likelihood Chi-Square df Sig.
Intercept Only 1925.212
Final 1906.285 18.927 6 .004
Goodness-of-Fit Chi-Square df Sig.
Pearson 1093.869 1068 .284
Deviance 1201.242 1068 .003
Stellenbosch University https://scholar.sun.ac.za

466
Likelihood Ratio Tests
Effect
Model Fitting
Criteria Likelihood Ratio Tests
-2 Log Likelihood
of Reduced
Model Chi-Square df Sig.
Intercept 1906.285a .000 0 .
P19_POP_GROUP 1925.212 18.927 6 .004
The chi-square statistic is the difference in -2 log-likelihoods between the final
model and a reduced model. The reduced model is formed by omitting an effect
from the final model. The null hypothesis is that all parameters of that effect are 0.
a. This reduced model is equivalent to the final model because omitting the effect
does not increase the degrees of freedom.
Parameter Estimates
ATTITUDE_INDEXa B Std. Error Wald df Sig. Exp(B)
95% Confidence
Interval for Exp(B)
Lower
Bound
Upper
Bound
AMBIVALENT ATTITUDE (0) Intercept .466 .226 4.272 1 .039
[P19_POP_GROUP=1] -.328 .292 1.258 1 .262 .720 .406 1.278
[P19_POP_GROUP=2] .079 .236 .112 1 .738 1.082 .682 1.717
[P19_POP_GROUP=3] -.061 .394 .024 1 .878 .941 .435 2.036
[P19_POP_GROUP=4] 0b . . 0 . . . .
POSITIVE ATTITUDE (+1) Intercept 1.226 .201 37.159 1 .000
[P19_POP_GROUP=1] -.487 .260 3.501 1 .061 .614 .369 1.023
[P19_POP_GROUP=2] -.491 .212 5.382 1 .020 .612 .404 .927
[P19_POP_GROUP=3] -.335 .359 .871 1 .351 .716 .354 1.445
[P19_POP_GROUP=4] 0b . . 0 . . . .
a. The reference category is: NEGATIVE ATTITUDE (-1).
b. This parameter is set to zero because it is redundant.
Stellenbosch University https://scholar.sun.ac.za

467
INTEREST IN SCIENCE INDEX
Case Processing Summary
N
Marginal
Percentage
INTEREST_INDEX LOW INTEREST (1) 577 33.0%
MODERATE INTEREST (2) 608 34.8%
HIGH INTEREST (3) 563 32.2%
DEMOG_RURAL_URBAN URBAN 1222 69.9%
RURAL 526 30.1%
DEMOG_P1_GENDER Male 901 51.5%
Female 847 48.5%
DEMOG_New_AGE <20 YEARS 72 4.1%
20-29 YEARS 545 31.2%
30-39 YEARS 527 30.1%
40-49 YEARS 319 18.2%
50-59 YEARS 168 9.6%
60+ YEARS 117 6.7%
DEMOG_3_EDUCATION PRE-MATRIC (1) 590 33.8%
MATRIC COMPLETED (2) 853 48.8%
POST-MATRIC (3) 305 17.4%
DEMOG_EMPLOYMENT_REC
ODE
EMPLOYED (1) 910 52.1%
UNEMPLOYED (2) 590 33.8%
OTHER (NOT WORKING) (3) 248 14.2%
P19_POP_GROUP White 197 11.3%
Black 1360 77.8%
Indian / Asian 46 2.6%
Coloured 145 8.3%
DEMOG_3_HH_INCOME LOW INCOME (LESS THAN
R10K) (1)
1219 69.7%
MODERATE INCOME
(BETWEEN R10K-R20K) (2)
403 23.1%
HIGH INCOME (R 30K+) (3) 126 7.2%
Valid 1748 100.0%
Missing 1738
Total 3486
Subpopulation 473a
a. The dependent variable has only one value observed in 280 (59.2%) subpopulations.
Stellenbosch University https://scholar.sun.ac.za

468
Step Summary
Model Action Effect(s)
Model Fitting
Criteria Effect Selection Tests
-2 Log Likelihood Chi-Squareb df Sig.
0 Entered <all>a 1646.714 .
1 Removed DEMOG_P1_GE
NDER
1648.394 1.680 2 .432
2 Removed DEMOG_EMPLO
YMENT_RECOD
E
1653.606 5.212 4 .266
3 Removed DEMOG_3_HH_I
NCOME
1659.981 6.375 4 .173
4 Removed DEMOG_New_A
GE
1675.958 15.977 10 .100
Stepwise Method: Backward Elimination
a. This model contains all effects specified or implied in the MODEL subcommand.
b. The chi-square for removal is based on the likelihood ratio test.
Model Fitting Information
Model
Model Fitting
Criteria Likelihood Ratio Tests
-2 Log Likelihood Chi-Square df Sig.
Intercept Only 1768.065
Final 1675.958 92.107 12 .000
Goodness-of-Fit Chi-Square df Sig.
Pearson 965.698 932 .216
Deviance 1067.480 932 .001
Likelihood Ratio Tests
Effect
Model Fitting
Criteria Likelihood Ratio Tests
-2 Log Likelihood
of Reduced Model Chi-Square df Sig.
Intercept 1675.958a .000 0 .
DEMOG_RURAL_URBAN 1687.602 11.643 2 .003
DEMOG_3_EDUCATION 1710.237 34.279 4 .000
P19_POP_GROUP 1702.917 26.959 6 .000
Stellenbosch University https://scholar.sun.ac.za

469
Parameter Estimates
INTEREST_INDEXa B Std. Error Wald df Sig. Exp(B)
95% Confidence
Interval for
Exp(B)
Lower
Bound
Upper
Bound
MODERATE INTEREST
(2)
Intercept -.049 .263 .034 1 .854
[DEMOG_RURAL_URBAN=1.
00]
-.051 .128 .159 1 .690 .950 .740 1.221
[DEMOG_RURAL_URBAN=2.
00]
0b . . 0 . . . .
[DEMOG_3_EDUCATION=1.0
0]
-.396 .200 3.939 1 .047 .673 .455 .995
[DEMOG_3_EDUCATION=2.0
0]
-.079 .189 .175 1 .676 .924 .638 1.338
[DEMOG_3_EDUCATION=3.0
0]
0b . . 0 . . . .
[P19_POP_GROUP=1] .355 .276 1.660 1 .198 1.426 .831 2.447
[P19_POP_GROUP=2] .341 .194 3.077 1 .079 1.406 .961 2.058
[P19_POP_GROUP=3] .991 .429 5.348 1 .021 2.695 1.163 6.243
[P19_POP_GROUP=4] 0b . . 0 . . . .
HIGH INTEREST (3) Intercept -.768 .309 6.184 1 .013
[DEMOG_RURAL_URBAN=1.
00]
.386 .140 7.625 1 .006 1.471 1.118 1.934
[DEMOG_RURAL_URBAN=2.
00]
0b . . 0 . . . .
[DEMOG_3_EDUCATION=1.0
0]
-1.056 .197 28.730 1 .000 .348 .236 .512
[DEMOG_3_EDUCATION=2.0
0]
-.521 .181 8.314 1 .004 .594 .417 .846
[DEMOG_3_EDUCATION=3.0
0]
0b . . 0 . . . .
[P19_POP_GROUP=1] 1.189 .315 14.210 1 .000 3.282 1.769 6.089
[P19_POP_GROUP=2] 1.145 .256 19.994 1 .000 3.143 1.903 5.193
[P19_POP_GROUP=3] 1.320 .482 7.492 1 .006 3.743 1.455 9.630
[P19_POP_GROUP=4] 0b . . 0 . . . .
a. The reference category is: LOW INTEREST (1).
b. This parameter is set to zero because it is redundant.
Stellenbosch University https://scholar.sun.ac.za

470
INFORMEDNESS ABOUT SCIENCE INDEX
Case Processing Summary
N
Marginal
Percentage
INFORMEDNESS_INDEX LOW INFORMEDNESS (1) 678 31.2%
MODERATE INFORMEDNESS
(2)
763 35.1%
HIGH INFORMEDNESS (3) 732 33.7%
P19_POP_GROUP White 227 10.4%
Black 1671 76.9%
Indian / Asian 79 3.6%
Coloured 196 9.0%
DEMOG_RURAL_URBAN URBAN 1473 67.8%
RURAL 700 32.2%
DEMOG_P1_GENDER Male 1102 50.7%
Female 1071 49.3%
DEMOG_New_AGE <20 YEARS 84 3.9%
20-29 YEARS 665 30.6%
30-39 YEARS 646 29.7%
40-49 YEARS 392 18.0%
50-59 YEARS 217 10.0%
60+ YEARS 169 7.8%
DEMOG_3_EDUCATION PRE-MATRIC (1) 786 36.2%
MATRIC COMPLETED (2) 1045 48.1%
POST-MATRIC (3) 342 15.7%
DEMOG_EMPLOYMENT_REC
ODE
EMPLOYED (1) 1092 50.3%
UNEMPLOYED (2) 747 34.4%
OTHER (NOT WORKING) (3) 334 15.4%
DEMOG_3_HH_INCOME LOW INCOME (LESS THAN
R10K) (1)
1544 71.1%
MODERATE INCOME
(BETWEEN R10K-R20K) (2)
485 22.3%
HIGH INCOME (R 30K+) (3) 144 6.6%
Valid 2173 100.0%
Missing 1313
Total 3486
Subpopulation 543a
a. The dependent variable has only one value observed in 318 (58.6%) subpopulations.
Stellenbosch University https://scholar.sun.ac.za

471
Step Summary
Model Action Effect(s)
Model Fitting
Criteria Effect Selection Tests
-2 Log Likelihood Chi-Squareb df Sig.
0 Entered <all>a 1907.463 .
1 Removed DEMOG_P1_GE
NDER
1909.346 1.883 2 .390
Stepwise Method: Backward Elimination
a. This model contains all effects specified or implied in the MODEL subcommand.
b. The chi-square for removal is based on the likelihood ratio test.
Model Fitting Information
Model
Model Fitting
Criteria Likelihood Ratio Tests
-2 Log Likelihood Chi-Square df Sig.
Intercept Only 2157.452
Final 1909.346 248.106 30 .000
Goodness-of-Fit Chi-Square df Sig.
Pearson 1096.869 1054 .175
Deviance 1202.849 1054 .001
Likelihood Ratio Tests
Effect
Model Fitting
Criteria Likelihood Ratio Tests
-2 Log Likelihood
of Reduced Model Chi-Square df Sig.
Intercept 1909.346a .000 0 .
P19_POP_GROUP 1952.898 43.552 6 .000
DEMOG_RURAL_URBAN 1935.669 26.323 2 .000
DEMOG_New_AGE 1927.588 18.242 10 .051
DEMOG_3_EDUCATION 1958.322 48.976 4 .000
DEMOG_EMPLOYMENT_REC
ODE
1920.439 11.093 4 .026
DEMOG_3_HH_INCOME 1918.291 8.945 4 .063
The chi-square statistic is the difference in -2 log-likelihoods between the final model and
a reduced model. The reduced model is formed by omitting an effect from the final model.
The null hypothesis is that all parameters of that effect are 0.
a. This reduced model is equivalent to the final model because omitting the effect does
not increase the degrees of freedom.
Stellenbosch University https://scholar.sun.ac.za
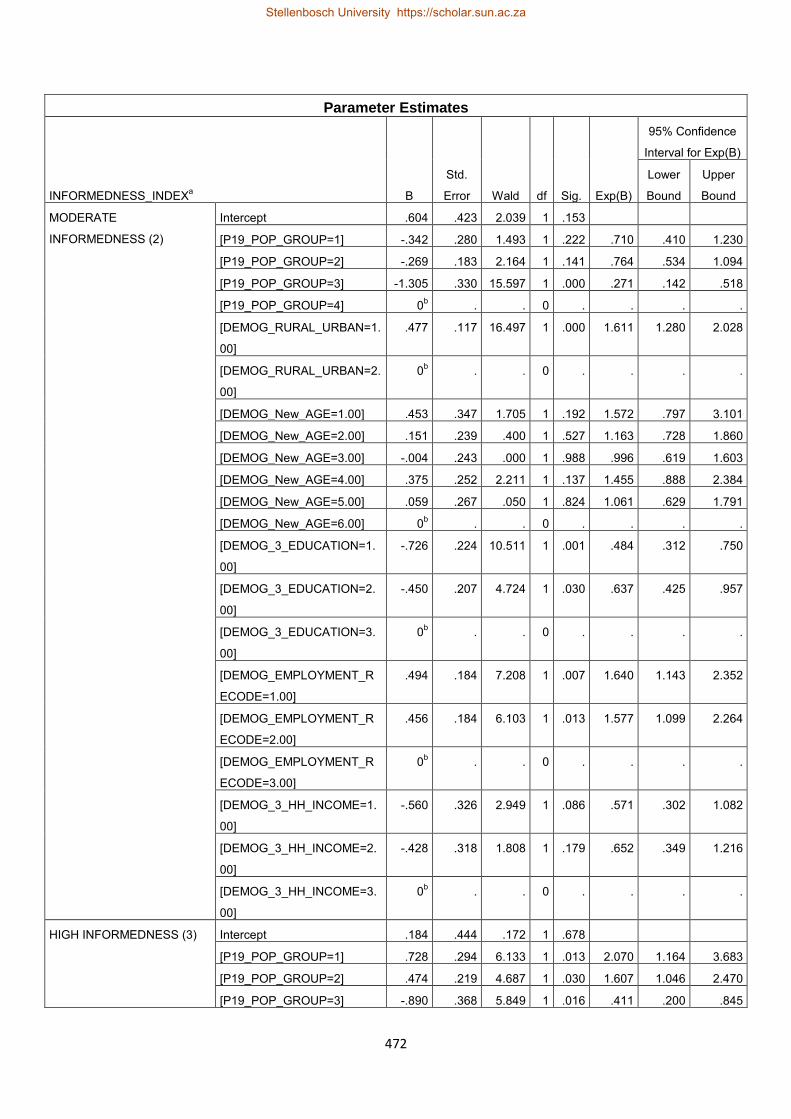
472
Parameter Estimates
INFORMEDNESS_INDEXa B
Std.
Error Wald df Sig. Exp(B)
95% Confidence
Interval for Exp(B)
Lower
Bound
Upper
Bound
MODERATE
INFORMEDNESS (2)
Intercept .604 .423 2.039 1 .153
[P19_POP_GROUP=1] -.342 .280 1.493 1 .222 .710 .410 1.230
[P19_POP_GROUP=2] -.269 .183 2.164 1 .141 .764 .534 1.094
[P19_POP_GROUP=3] -1.305 .330 15.597 1 .000 .271 .142 .518
[P19_POP_GROUP=4] 0b . . 0 . . . .
[DEMOG_RURAL_URBAN=1.
00]
.477 .117 16.497 1 .000 1.611 1.280 2.028
[DEMOG_RURAL_URBAN=2.
00]
0b . . 0 . . . .
[DEMOG_New_AGE=1.00] .453 .347 1.705 1 .192 1.572 .797 3.101
[DEMOG_New_AGE=2.00] .151 .239 .400 1 .527 1.163 .728 1.860
[DEMOG_New_AGE=3.00] -.004 .243 .000 1 .988 .996 .619 1.603
[DEMOG_New_AGE=4.00] .375 .252 2.211 1 .137 1.455 .888 2.384
[DEMOG_New_AGE=5.00] .059 .267 .050 1 .824 1.061 .629 1.791
[DEMOG_New_AGE=6.00] 0b . . 0 . . . .
[DEMOG_3_EDUCATION=1.
00]
-.726 .224 10.511 1 .001 .484 .312 .750
[DEMOG_3_EDUCATION=2.
00]
-.450 .207 4.724 1 .030 .637 .425 .957
[DEMOG_3_EDUCATION=3.
00]
0b . . 0 . . . .
[DEMOG_EMPLOYMENT_R
ECODE=1.00]
.494 .184 7.208 1 .007 1.640 1.143 2.352
[DEMOG_EMPLOYMENT_R
ECODE=2.00]
.456 .184 6.103 1 .013 1.577 1.099 2.264
[DEMOG_EMPLOYMENT_R
ECODE=3.00]
0b . . 0 . . . .
[DEMOG_3_HH_INCOME=1.
00]
-.560 .326 2.949 1 .086 .571 .302 1.082
[DEMOG_3_HH_INCOME=2.
00]
-.428 .318 1.808 1 .179 .652 .349 1.216
[DEMOG_3_HH_INCOME=3.
00]
0b . . 0 . . . .
HIGH INFORMEDNESS (3) Intercept .184 .444 .172 1 .678
[P19_POP_GROUP=1] .728 .294 6.133 1 .013 2.070 1.164 3.683
[P19_POP_GROUP=2] .474 .219 4.687 1 .030 1.607 1.046 2.470
[P19_POP_GROUP=3] -.890 .368 5.849 1 .016 .411 .200 .845
Stellenbosch University https://scholar.sun.ac.za

473
[P19_POP_GROUP=4] 0b . . 0 . . . .
[DEMOG_RURAL_URBAN=1.
00]
.592 .125 22.398 1 .000 1.807 1.414 2.309
[DEMOG_RURAL_URBAN=2.
00]
0b . . 0 . . . .
[DEMOG_New_AGE=1.00] 1.131 .354 10.198 1 .001 3.099 1.548 6.204
[DEMOG_New_AGE=2.00] .350 .262 1.785 1 .182 1.420 .849 2.374
[DEMOG_New_AGE=3.00] .161 .266 .367 1 .545 1.175 .698 1.977
[DEMOG_New_AGE=4.00] .311 .278 1.250 1 .264 1.364 .791 2.353
[DEMOG_New_AGE=5.00] .237 .291 .663 1 .415 1.268 .716 2.245
[DEMOG_New_AGE=6.00] 0b . . 0 . . . .
[DEMOG_3_EDUCATION=1.
00]
-1.444 .221 42.632 1 .000 .236 .153 .364
[DEMOG_3_EDUCATION=2.
00]
-.818 .199 16.934 1 .000 .441 .299 .652
[DEMOG_3_EDUCATION=3.
00]
0b . . 0 . . . .
[DEMOG_EMPLOYMENT_R
ECODE=1.00]
.550 .193 8.155 1 .004 1.734 1.188 2.530
[DEMOG_EMPLOYMENT_R
ECODE=2.00]
.529 .196 7.300 1 .007 1.697 1.156 2.492
[DEMOG_EMPLOYMENT_R
ECODE=3.00]
0b . . 0 . . . .
[DEMOG_3_HH_INCOME=1.
00]
-.839 .318 6.976 1 .008 .432 .232 .805
[DEMOG_3_HH_INCOME=2.
00]
-.525 .308 2.910 1 .088 .592 .324 1.081
[DEMOG_3_HH_INCOME=3.
00]
0b . . 0 . . . .
a. The reference category is: LOW INFORMEDNESS (1).
b. This parameter is set to zero because it is redundant.
Stellenbosch University https://scholar.sun.ac.za

474
INFORMATION SOURCES
Case Processing Summary
N
Marginal
Percentage
INFOSOURCE_INDEX LOW INFORMATION
IMMERSION (1)
677 32.2%
MODERATE INFORMATION
IMMERSION (2)
664 31.6%
HIGH INFORMATION
IMMERSION (3)
760 36.2%
P19_POP_GROUP White 229 10.9%
Black 1615 76.9%
Indian / Asian 78 3.7%
Coloured 179 8.5%
DEMOG_RURAL_URBAN URBAN 1439 68.5%
RURAL 662 31.5%
DEMOG_P1_GENDER Male 1067 50.8%
Female 1034 49.2%
DEMOG_New_AGE <20 YEARS 78 3.7%
20-29 YEARS 633 30.1%
30-39 YEARS 635 30.2%
40-49 YEARS 381 18.1%
50-59 YEARS 209 9.9%
60+ YEARS 165 7.9%
DEMOG_3_EDUCATION PRE-MATRIC (1) 748 35.6%
MATRIC COMPLETED (2) 1016 48.4%
POST-MATRIC (3) 337 16.0%
DEMOG_EMPLOYMENT_REC
ODE
EMPLOYED (1) 1069 50.9%
UNEMPLOYED (2) 712 33.9%
OTHER (NOT WORKING) (3) 320 15.2%
DEMOG_3_HH_INCOME LOW INCOME (LESS THAN
R10K) (1)
1478 70.3%
MODERATE INCOME
(BETWEEN R10K-R20K) (2)
480 22.8%
HIGH INCOME (R 30K+) (3) 143 6.8%
Valid 2101 100.0%
Missing 1385
Total 3486
Subpopulation 534a
a. The dependent variable has only one value observed in 316 (59.2%) subpopulations.
Stellenbosch University https://scholar.sun.ac.za

475
Step Summary
Model Action Effect(s)
Model Fitting
Criteria Effect Selection Tests
-2 Log Likelihood Chi-Squareb df Sig.
0 Entered <all>a 1837.225 .
1 Removed DEMOG_EMPLO
YMENT_RECOD
E
1842.839 5.614 4 .230
2 Removed DEMOG_3_HH_I
NCOME
1848.831 5.993 4 .200
3 Removed DEMOG_P1_GE
NDER
1853.206 4.374 2 .112
Stepwise Method: Backward Elimination
a. This model contains all effects specified or implied in the MODEL subcommand.
b. The chi-square for removal is based on the likelihood ratio test.
Model Fitting Information
Model
Model Fitting
Criteria Likelihood Ratio Tests
-2 Log Likelihood Chi-Square df Sig.
Intercept Only 2090.208
Final 1853.206 237.003 22 .000
Goodness-of-Fit Chi-Square df Sig.
Pearson 1058.372 1044 .372
Deviance 1172.243 1044 .003
Likelihood Ratio Tests
Effect
Model Fitting
Criteria Likelihood Ratio Tests
-2 Log Likelihood
of Reduced Model Chi-Square df Sig.
Intercept 1853.206a .000 0 .
P19_POP_GROUP 1873.267 20.061 6 .003
DEMOG_RURAL_URBAN 1863.895 10.689 2 .005
DEMOG_New_AGE 1880.020 26.814 10 .003
DEMOG_3_EDUCATION 1958.253 105.047 4 .000
Stellenbosch University https://scholar.sun.ac.za

476
Parameter Estimates
INFOSOURCE_INDEXa B
Std.
Error Wald df Sig. Exp(B)
95%
Confidence
Interval for
Exp(B)
Lower
Bound
Upper
Bound
MODERATE INFORMATION
IMMERSION (2)
Intercept .487 .334 2.123 1 .145
[P19_POP_GROUP=1] -.151 .294 .264 1 .607 .860 .483 1.531
[P19_POP_GROUP=2] -.386 .206 3.529 1 .060 .680 .454 1.017
[P19_POP_GROUP=3] -.353 .364 .940 1 .332 .702 .344 1.434
[P19_POP_GROUP=4] 0b . . 0 . . . .
[DEMOG_RURAL_URBAN=
1.00]
.209 .119 3.059 1 .080 1.232 .975 1.557
[DEMOG_RURAL_URBAN=
2.00]
0b . . 0 . . . .
[DEMOG_New_AGE=1.00] .257 .343 .562 1 .454 1.293 .660 2.535
[DEMOG_New_AGE=2.00] .115 .218 .278 1 .598 1.122 .732 1.719
[DEMOG_New_AGE=3.00] .266 .214 1.537 1 .215 1.304 .857 1.985
[DEMOG_New_AGE=4.00] .232 .227 1.044 1 .307 1.262 .808 1.970
[DEMOG_New_AGE=5.00] .647 .250 6.711 1 .010 1.910 1.171 3.116
[DEMOG_New_AGE=6.00] 0b . . 0 . . . .
[DEMOG_3_EDUCATION=1.
00]
-.629 .208 9.100 1 .003 .533 .354 .802
[DEMOG_3_EDUCATION=2.
00]
-.565 .202 7.816 1 .005 .568 .383 .845
[DEMOG_3_EDUCATION=3.
00]
0b . . 0 . . . .
HIGH INFORMATION
IMMERSION (3)
Intercept .536 .351 2.333 1 .127
[P19_POP_GROUP=1] .177 .282 .391 1 .532 1.193 .686 2.074
[P19_POP_GROUP=2] -.544 .207 6.894 1 .009 .580 .387 .871
[P19_POP_GROUP=3] -.180 .352 .262 1 .609 .835 .419 1.665
[P19_POP_GROUP=4] 0b . . 0 . . . .
[DEMOG_RURAL_URBAN=
1.00]
.405 .124 10.610 1 .001 1.499 1.175 1.912
[DEMOG_RURAL_URBAN=
2.00]
0b . . 0 . . . .
[DEMOG_New_AGE=1.00] 1.005 .365 7.564 1 .006 2.731 1.335 5.588
[DEMOG_New_AGE=2.00] .876 .254 11.908 1 .001 2.401 1.460 3.948
[DEMOG_New_AGE=3.00] .716 .252 8.049 1 .005 2.046 1.248 3.355
[DEMOG_New_AGE=4.00] .898 .262 11.782 1 .001 2.456 1.470 4.102
[DEMOG_New_AGE=5.00] .801 .293 7.494 1 .006 2.228 1.256 3.955
Stellenbosch University https://scholar.sun.ac.za

477
[DEMOG_New_AGE=6.00] 0b . . 0 . . . .
[DEMOG_3_EDUCATION=1.
00]
-1.779 .201 78.554 1 .000 .169 .114 .250
[DEMOG_3_EDUCATION=2.
00]
-.910 .185 24.282 1 .000 .403 .280 .578
[DEMOG_3_EDUCATION=3.
00]
0b . . 0 . . . .
a. The reference category is: LOW INFORMATION IMMERSION (1).
b. This parameter is set to zero because it is redundant.
SCIENCE ENGAGEMENT INDEX
Case Processing Summary
N
Marginal
Percentage
ENGAGEMENT_INDEX LOW ENGAGEMENT (1) 290 47.9%
MODERATE ENGAGEMENT
(2)
148 24.4%
HIGH ENGAGEMENT (3) 168 27.7%
P19_POP_GROUP White 107 17.7%
Black 422 69.6%
Indian / Asian 16 2.6%
Coloured 61 10.1%
DEMOG_RURAL_URBAN URBAN 469 77.4%
RURAL 137 22.6%
DEMOG_P1_GENDER Male 311 51.3%
Female 295 48.7%
DEMOG_New_AGE <20 YEARS 45 7.4%
20-29 YEARS 194 32.0%
30-39 YEARS 182 30.0%
40-49 YEARS 101 16.7%
50-59 YEARS 54 8.9%
60+ YEARS 30 5.0%
DEMOG_3_EDUCATION PRE-MATRIC (1) 108 17.8%
MATRIC COMPLETED (2) 334 55.1%
POST-MATRIC (3) 164 27.1%
DEMOG_EMPLOYMENT_REC
ODE
EMPLOYED (1) 365 60.2%
UNEMPLOYED (2) 139 22.9%
OTHER (NOT WORKING) (3) 102 16.8%
DEMOG_3_HH_INCOME LOW INCOME (LESS THAN
R10K) (1)
345 56.9%
Stellenbosch University https://scholar.sun.ac.za

478
MODERATE INCOME
(BETWEEN R10K-R20K) (2)
192 31.7%
HIGH INCOME (R 30K+) (3) 69 11.4%
Valid 606 100.0%
Missing 2880
Total 3486
Subpopulation 288a
a. The dependent variable has only one value observed in 205 (71.2%) subpopulations.
Step Summary
Model Action Effect(s)
Model Fitting
Criteria Effect Selection Tests
-2 Log Likelihood Chi-Squareb df Sig.
0 Entered <all>a 789.872 .
1 Removed P19_POP_GROU
P
793.193 3.321 6 .768
2 Removed DEMOG_EMPLO
YMENT_RECOD
E
796.687 3.494 4 .479
3 Removed DEMOG_New_A
GE
810.492 13.805 10 .182
4 Removed DEMOG_3_HH_I
NCOME
817.468 6.976 4 .137
5 Removed DEMOG_P1_GE
NDER
821.920 4.452 2 .108
Stepwise Method: Backward Elimination
a. This model contains all effects specified or implied in the MODEL subcommand.
b. The chi-square for removal is based on the likelihood ratio test.
Model Fitting Information
Model
Model Fitting
Criteria Likelihood Ratio Tests
-2 Log Likelihood Chi-Square df Sig.
Intercept Only 861.923
Final 821.920 40.003 6 .000
Goodness-of-Fit Chi-Square df Sig.
Pearson 585.576 568 .296
Deviance 631.131 568 .034
Stellenbosch University https://scholar.sun.ac.za

479
Likelihood Ratio Tests
Effect
Model Fitting
Criteria Likelihood Ratio Tests
-2 Log Likelihood
of Reduced Model Chi-Square df Sig.
Intercept 821.920a .000 0 .
DEMOG_RURAL_URBAN 837.710 15.789 2 .000
DEMOG_3_EDUCATION 840.008 18.088 4 .001
The chi-square statistic is the difference in -2 log-likelihoods between the final model and
a reduced model. The reduced model is formed by omitting an effect from the final model.
The null hypothesis is that all parameters of that effect are 0.
a. This reduced model is equivalent to the final model because omitting the effect does
not increase the degrees of freedom.
Parameter Estimates
ENGAGEMENT_INDEXa B
Std.
Error Wald df Sig. Exp(B)
95% Confidence
Interval for Exp(B)
Lower
Bound
Upper
Bound
MODERATE
ENGAGEMENT (2)
Intercept -.800 .289 7.649 1 .006
[DEMOG_RURAL_URBAN
=1.00]
.221 .235 .888 1 .346 1.248 .788 1.977
[DEMOG_RURAL_URBAN
=2.00]
0b . . 0 . . . .
[DEMOG_3_EDUCATION=
1.00]
-.011 .311 .001 1 .971 .989 .538 1.819
[DEMOG_3_EDUCATION=
2.00]
-.058 .253 .053 1 .819 .944 .575 1.548
[DEMOG_3_EDUCATION=
3.00]
0b . . 0 . . . .
HIGH ENGAGEMENT (3) Intercept -.870 .311 7.826 1 .005
[DEMOG_RURAL_URBAN
=1.00]
1.061 .286 13.798 1 .000 2.891 1.651 5.061
[DEMOG_RURAL_URBAN
=2.00]
0b . . 0 . . . .
[DEMOG_3_EDUCATION=
1.00]
-1.211 .337 12.892 1 .000 .298 .154 .577
[DEMOG_3_EDUCATION=
2.00]
-.663 .223 8.802 1 .003 .516 .333 .799
[DEMOG_3_EDUCATION=
3.00]
0b . . 0 . . . .
a. The reference category is: LOW ENGAGEMENT (1).
Stellenbosch University https://scholar.sun.ac.za

480
Appendix 11
NOTIFICATION OF ACCEPTANCE INTO PhD PROGRAM
Stellenbosch University https://scholar.sun.ac.za

481
NOTIFICATION OF ETHICS APPROVAL
Stellenbosch University https://scholar.sun.ac.za