
Development of Efficient Air Conditioning and Refrigeration ...
186
Development of Efficient Air Conditioning and Refrigeration System for Service Vehicles by Farshid Bagheri M.Sc., Sharif University of Technology, 2005 B.Sc., Iran University of Science and Technology, 2003 Thesis Submitted in Partial Fulfillment of the Requirements for the Degree of Doctor of Philosophy in the School of Mechantronic Systems Engineering Faculty of Applied Science Farshid Bagheri 2016 SIMON FRASER UNIVERSITY Spring 2016
-
Upload
khangminh22 -
Category
Documents
-
view
1 -
download
0
Transcript of Development of Efficient Air Conditioning and Refrigeration ...
Development of Efficient Air Conditioning and
Refrigeration System for Service Vehicles
by
Farshid Bagheri
M.Sc., Sharif University of Technology, 2005 B.Sc., Iran University of Science and Technology, 2003
Thesis Submitted in Partial Fulfillment of the
Requirements for the Degree of
Doctor of Philosophy
in the
School of Mechantronic Systems Engineering
Faculty of Applied Science
Farshid Bagheri 2016
SIMON FRASER UNIVERSITY
Spring 2016
ii
Approval
Name: Farshid Bagheri
Degree: Doctor of Philosophy
Title: Development of Efficient Air conditioning and Refrigeration System for Servicer Vehicles
Examining Committee: Chair: Kevin Oldknow Lecturer, School of Mechatronic Systems Engineering
Majid Bahrami Senior Supervisor Professor
John Jones Supervisor Associate Professor
Gary Wang Supervisor Professor
Flavio Firmani Internal Examiner Lecturer School of Mechatronic Systems Engineering
Bidyut Baran Saha External Examiner Professor Department of Energy and Environmental Engineering Kyushu University
Date Defended/Approved: March 31, 2016
iii
Abstract
This research aims to develop a proof-of-concept demonstration of a high efficiency
vehicle air conditioning and refrigeration (VACR) system to be employed in service
vehicles. The work herein is part of a collaborative research project with two local
companies: Cool-It Group, and Saputo Inc., with a main focus on service vehicles. Due
to global energy consumption and the environmental impacts of air conditioning and
refrigeration (A/C-R) systems, the development of a high efficiency system can
significantly contribute to green and sustainable development and environmental
protection.
This research fills a gap in the literature by developing real-time thermal and
performance characteristics of the VACR systems employed in the food transportation
industry. Field data is acquired from pilot refrigerated service vehicles during different
seasons of the year and the duty cycles are established. The acquisition of field data
begins in stationary A/C-R systems and continues in mobile VACR systems. Moreover, a
testbed is built in the Laboratory for Alternative Energy Conversion (LAEC) for more
comprehensive experiments. Mathematical models are developed for thermal and
performance simulations of VACR systems under steady state and transient operating
conditions. The models are validated using the laboratory and field data and employed
for a thermal and performance investigation of VACR systems.
A proof-of-concept demonstration of high efficiency VACR systems is built in LAEC
using variable speed compressor and fans and high efficiency heat exchangers. The
modeling results are validated and used to develop an optimization model. The
optimization model is validated and utilized to determine the optimum compressor and
fans speeds for achievement of the highest coefficient of performance (COP) under real-
time operating conditions. The optimization model is integrated with an existing cooling
demand simulator to develop a proof-of-concept demonstration of a proactive and model
predictive controller (MPC) for the VACR system. The controller is implemented on the
laboratory-built VACR system and a proof-of-concept demonstration of high efficiency
VACR is finalized. The developed concept and platform is expandable to the entire
transportation industry as well as stationary A/C-R systems.

iv
Keywords: Vehicle Air conditioning and Refrigeration, Performance Optimization, Mathematical Modeling, Experimentation, Proactive, Model Predictive Controller

v
Dedication
To my beloved wife, mother, and father

vi
Acknowledgements
I owe my gratitude to a great many people who have made this dissertation possible.
First and foremost, I would like to express my sincere gratitude to my senior supervisor,
Dr. Majid Bahrami, whose expertise, guidance, encouragement, and supports added
considerably to my work. I appreciate his vast knowledge and skill in many areas, and
his assistance in conducting research and writing reports.
I would like to thank my supervisory committee members, Dr. Gary Wang, and Dr. John
Jones for the insightful comments and encouragement they provided at all levels of the
research project. I am grateful to Dr. Flavio Firmani and Dr. Bidyut Baran Saha for their
time reading this thesis and helping to refine it.
I am also indebted to the members of the laboratory for alternative energy conversion
(LAEC) with whom I have interacted during the course of my graduate studies.
Particularly, I would like to acknowledge Mr. Marius Haiducu, Dr. Wendell Huttema,
Dr. Mehran Ahmadi, Dr. Mohammad Fakoor-Pakdaman, Dr. Mohammad Ali
Fayazbakhsh, and undergraduate co-op students Mr. Jit Tian Lim, Mr. Jordan Lam, and
Mr.Tian Lin Yang for their assistance over the past three years.
I recognize that this research would not have been possible without the financial
assistance of natural sciences and engineering research council of Canada (NSERC)
and Simon Fraser University, and supports from Cool-It Group (Mr. Saeed Zaeri) and
Saputo Inc. (Mr. Norman Desilets), and express my gratitude to those institutes.
Most importantly, none of this would have been possible without the love and patience of
my wife and parents.
vii
Table of Contents
Approval .............................................................................................................................ii Abstract ............................................................................................................................. iii Dedication ......................................................................................................................... v Acknowledgements ...........................................................................................................vi Table of Contents ............................................................................................................. vii List of Tables .....................................................................................................................ix List of Figures.................................................................................................................... x List of Acronyms .............................................................................................................. xvi Nomenclature ................................................................................................................. xvii Executive Summary ........................................................................................................ xxi
Chapter 1. Introduction ............................................................................................... 1 1.1. Research Background and Importance .................................................................... 1 1.2. Research Motivation................................................................................................. 3 1.3. Research Scope ....................................................................................................... 4 1.4. Thesis Structure ....................................................................................................... 5 1.5. Relevant Literature ................................................................................................... 7
1.5.1. Thermal and performance studies on A/C-R systems ................................ 7 1.5.2. Control studies on A/C-R systems ............................................................ 13 1.5.3. Lack of literature ....................................................................................... 17
Chapter 2. Mathematical Model Development ........................................................ 18 2.1. Steady State Model Development .......................................................................... 19
2.1.1. Compressor sub-model ............................................................................. 20 2.1.2. Condenser and evaporator sub-model ..................................................... 20 2.1.3. Thermostatic expansion valve sub-model ................................................. 23 2.1.4. Thermodynamic correlations for the refrigerant ........................................ 23 2.1.5. Numerical solver ....................................................................................... 23
2.2. Quasi-Steady State Model Development ............................................................... 25 2.3. Transient Model Development ............................................................................... 29
2.3.1. Condenser sub-model ............................................................................... 29 2.3.2. Evaporator sub-model ............................................................................... 33 2.3.3. Compressor sub-model ............................................................................. 34 2.3.4. Expansion valve ........................................................................................ 34 2.3.5. Unknowns of the model ............................................................................ 34
2.4. Conclusion ............................................................................................................. 35
Chapter 3. Experimental Study and Data Acquisition ............................................ 37 3.1. Testbed Design and Construction .......................................................................... 37 3.2. Development of a Proof-of-Concept Demonstration of a High Efficiency
VACR System ........................................................................................................ 42 3.3. Field Data Collection, Stationary A/C-R System .................................................... 43
viii
3.3.1. Data collection and duty cycle definition ................................................... 47 3.3.2. Effect of on-off cycling on power consumption.......................................... 51
3.4. Field Data Collection, VACR System ..................................................................... 52 3.4.1. Measuring equipment installation and duty cycle definition ...................... 55 3.4.2. Real-time data acquisition ......................................................................... 60
3.5. Conclusion ............................................................................................................. 69
Chapter 4. Model Validation, Thermal and Performance Investigation ................ 71 4.1. Steady State Model Validation, Thermal and Performance Investigation .............. 71
4.1.1. Results relevant to the developed testbed in LAEC .................................. 71 4.1.1.1. Effects of condenser air flow rate (condenser fan speed) on COP .......... 78 4.1.1.2. Effects of evaporator air flow rate (evaporator fan speed) on COP.......... 82
4.1.2. Results relevant to the studied stationary A/C-R system .......................... 89 4.2. Quasi Steady State Model Validation ..................................................................... 92 4.3. Transient Model Validation, Real-time Performance Investigation ......................... 97 4.4. Conclusion ........................................................................................................... 103
Chapter 5. Metamodel Development for Optimization ......................................... 105 5.1. Metamodel Development Based on Steady State Thermal Model ....................... 105
5.1.1. Sample space generation ....................................................................... 110 5.1.2. Metamodel development ......................................................................... 112 5.1.3. Metamodel validation .............................................................................. 113
5.2. Metamodel Development Based on Transient Thermal Model ............................ 116 5.2.1. Sample space generation ....................................................................... 118 5.2.2. Metamodel development ......................................................................... 118 5.2.3. Metamodel validation .............................................................................. 120
5.3. Conclusion ........................................................................................................... 121
Chapter 6. Proof-of-concept Demonstration of High Efficiency VACR System for Service Vehicles ................................................................ 122
6.1. Development of Optimization Solver and Integration with a Cooling Demand Simulator, Proactive Control ................................................................................. 122
6.2. Proactive, Optimization-Based, Model Predictive Control under Steady State Condition ..................................................................................................... 127
6.3. Proactive, Optimization-Based, Model Predictive Control under Transient Condition .............................................................................................................. 138
6.4. Conclusion ........................................................................................................... 145
Chapter 7. Summary and Future Works ................................................................ 147 7.1. Summary of Thesis .............................................................................................. 147 7.2. Future work .......................................................................................................... 149
References.................... ............................................................................................... 151

ix
List of Tables
Table 1-1: Summary of literature on thermal and performance studies of A/C-R systems ................................................................................................... 11
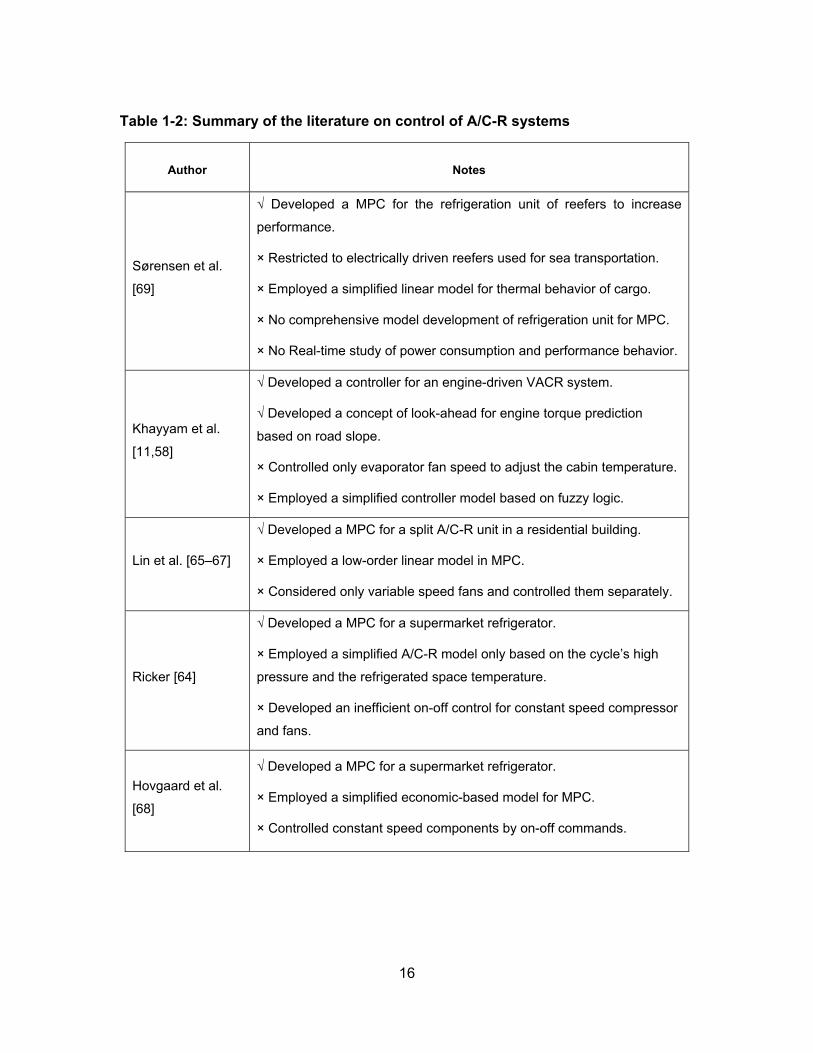
Table 1-2: Summary of the literature on control of A/C-R systems ................................. 16
Table 2-1: Mathematical model correlations ................................................................... 22
Table 2-2: Output parameters of the mathematical model .............................................. 24
Table 2-3: Calculated parameters at each time step ...................................................... 35
Table 3-1: Duty cycle definition for the stationary refrigeration system ........................... 51
Table 5-1: A few representatives of the generated sample space for metamodel development-steady state ..................................................................... 111
Table 5-2: Obtained coefficients of metamodel for steady-state condition ................... 113
Table 5-3: Comparison of obtained accuracies for different NSP ................................. 116
Table 5-4: Obtained coefficients of metamodel for transient condition ......................... 119
Table 5-5: Comparison of obtained accuracies for different NSP ................................. 120
x
List of Figures
Figure 1-1: Schematic of a basic VCR cycle [14] .............................................................. 2
Figure 1-2: Thesis structure .............................................................................................. 6
Figure 2-1: Schematic of a basic A/C-R unit and the main parameters .......................... 19
Figure 2-2: An integral overview of a heat exchanger (evaporator or condenser) in A/C-R systems ..................................................................................... 28
Figure 2-3: Schematic representative of a cross flow condenser in VCR systems ......... 30
Figure 3-1: Typical battery-powered anti-idling VACR system employed in the testbed ..................................................................................................... 38
Figure 3-2: Experimental setup schematic ...................................................................... 39
Figure 3-3: First version of the developed experimental setup ....................................... 40
Figure 3-4: Current experimental setup configuration ..................................................... 41
Figure 3-5: Purchased components for building the proof-of-concept demonstration of a high efficiency VACR system .................................... 43
Figure 3-6: The selected freezer room (left), its condensing unit (mid), dimensions (right) .................................................................................... 45
Figure 3-7: Installation of thermocouples, pressure transducers, and flow meters on the condensing unit ............................................................................ 46
Figure 3-8: Installation of thermocouples on the evaporating unit .................................. 47
Figure 3-9: Sample measured temperature during weekdays - evaporating unit ........... 48
Figure 3-10: Sample measured temperature during weekdays - condensing unit .......... 48
Figure 3-11: Sample measured input electric power to the condensing unit .................. 49
Figure 3-12: A typical power draw of the compressor after start-up ............................... 52
Figure 3-13: Selected typical refrigerated trailers for field data acquisition ..................... 54
Figure 3-14: Sample installed measuring equipment on the condensing unit ................. 55
Figure 3-15: Sample installed measuring equipment on the evaporating unit ................ 56
xi
Figure 3-16: Duty cycle of the VACR unit trailer #1 – Monday to Wednesday ................ 58
Figure 3-17: Duty cycle of the VACR unit trailer #1 – Thursday to Saturday .................. 58
Figure 3-18: Duty cycle of the VACR unit trailer #1 – Saturday to Monday .................... 59
Figure 3-19: Duty cycle of the VACR unit trailer #2 – Weekdays and Weekends ........... 59
Figure 3-20: Sample ambient air (condenser inlet) temperature variations – Jan 2014 ......................................................................................................... 61
Figure 3-21: Sample air temperature variations at evaporator inlet and outlet – trailer # 1, Jan 2014 ................................................................................. 61
Figure 3-22: Sample refrigerant temperature variations at compressor inlet and outlet – trailer # 1, Jan 2014 .................................................................... 62
Figure 3-23: Sample refrigerant temperature variations at evaporating unit – trailer # 1, Jan 2014 ................................................................................. 62
Figure 3-24: Sample ambient air (condenser inlet) temperature variations – Jul 2014 ......................................................................................................... 64
Figure 3-25: Sample ambient air (condenser inlet) temperature variations – Aug 2015 ......................................................................................................... 65
Figure 3-26: Sample refrigerant temperature variations at compressor inlet and outlet – trailer # 1, Mon to Thu, Jul 2014 ................................................. 65
Figure 3-27: Sample refrigerant temperature variations at compressor inlet and outlet – trailer # 1, Thu to Sun, Jul 2014 .................................................. 66
Figure 3-28: Sample air temperature variations at evaporator inlet and outlet – trailer # 1, Mon to Thu, Jul 2014 .............................................................. 66
Figure 3-29: Sample air temperature variations at evaporator inlet and outlet – trailer # 1, Thu to Sun, Jul 2014 .............................................................. 67
Figure 3-30: Sample zoomed air temperature variations at beginning of a cycle “ON”– trailer # 1, Jul 2014 ....................................................................... 67
Figure 3-31: Sample zoomed air temperature variations at end of a cycle “ON”– trailer # 1, Jul 2014 .................................................................................. 68
Figure 3-32: Sample refrigerant temperature variations at compressor inlet and outlet – trailer # 2, Aug 2015 ................................................................... 68
Figure 3-33: Sample air temperature variations at evaporator inlet and outlet – trailer # 2, Aug 2015 ................................................................................ 69
xii
Figure 4-1: Sample steady state condition achievement - measured refrigerant side temperature ...................................................................................... 72
Figure 4-2: Validation of the model (lines) with experimental data (symbols), evaporator air outlet temperature , ,( )a evap outT vs. condenser air inlet
temperature , ,( )a cond inT .............................................................................. 73
Figure 4-3: Validation of the model (lines) with experimental data (symbols), Evaporating temperature ( )eT vs. condenser air inlet temperature
, ,( )a cond inT ................................................................................................. 74
Figure 4-4: Validation of the model (lines) with experimental data (symbols), refrigerant mass flow rate ( )refm vs. condenser air inlet
temperature , ,( )a cond inT .............................................................................. 76
Figure 4-5: Validation of the model (lines) with experimental data (symbols), total power consumption vs. condenser air inlet temperature , ,( )a cond inT .......... 76
Figure 4-6: Validation of the model (lines) with experimental data (symbols), cooling power vs. condenser air inlet temperature , ,( )a cond inT ................... 77
Figure 4-7: Validation of the model (lines) with experimental data (symbols), COP vs. condenser air inlet temperature , ,( )a cond inT .......................................... 77
Figure 4-8: Refrigerant flow rate vs. condenser air flow rate ,( )a condm ............................. 80
Figure 4-9: Total power consumption vs. condenser air flow rate ,( )a condm ..................... 81
Figure 4-10: Cooling power vs. condenser air flow rate ,( )a condm .................................... 81
Figure 4-11: COP vs. condenser air flow rate ,( )a condm ................................................... 82
Figure 4-12: Total power consumption vs. evaporator air flow rate ,( )a evapm ................... 83
Figure 4-13: Cooling power vs. evaporator air flow rate ,( )a evapm .................................... 84
Figure 4-14: COP vs. evaporator air flow rate ,( )a evapm ................................................... 84
Figure 4-15: Total power consumption vs. condenser and evaporator air flow rates , ,( , )a cond a evapm m ................................................................................ 86
xiii
Figure 4-16: Cooling power vs. condenser and evaporator air flow rates
, ,( , )a cond a evapm m ........................................................................................ 86
Figure 4-17: COP vs. condenser and evaporator air flow rates , ,( , )a cond a evapm m ............. 87
Figure 4-18: Comparison of thermodynamic pressure-enthalpy cycle between nominal (red continuous lines) and optimal (green dashed lines) condenser and evaporator air flow rates (ANSI/AHRI 210/240-2008 air-side condition) ........................................................................... 88
Figure 4-19: Validation of the model (simulation) results with the measured values, walk-in freezer room .................................................................... 89
Figure 4-20: Present and design COP of the VCR system for different duty cycles ....... 90
Figure 4-21: Comparison between first quasi-steady model and experimental data during on-off cycling ........................................................................ 93
Figure 4-22: Comparison between modified quasi-steady model and experimental data during on-off cycling ................................................... 95
Figure 4-23: Comparison of cooling power variation between modified quasi-steady model and experimental data during combined imposed conditions ................................................................................................ 96
Figure 4-24: Comparison of power consumption variation between modified quasi-steady model and experimental data during combined imposed conditions .................................................................................. 97
Figure 4-25: Sample simulated and measured air temperature at evaporator outlet - Trailer #2, Wed to Thu, August 2015 ........................................... 98
Figure 4-26: Sample simulated and measured cooling power - Trailer #2, Thu to Sat, August 2015 ..................................................................................... 99
Figure 4-27: Sample simulated power consumption for 10 days - Trailer #2, August 2015 .......................................................................................... 100
Figure 4-28: Sample simulated COP for 10 days - Trailer #2, August 2015 ................. 102
Figure 6-1: A sample section of developed LabVIEW interface for acquiring system’s data and implementing the proactive controller ...................... 125
Figure 6-2: Developed section for executing the cooling demand simulator in LabVIEW ............................................................................................... 126
Figure 6-3: Developed section in LabVIEW interface for commanding compressor, evaporator and condenser fans based on optimization model results ..................................................................... 127
xiv
Figure 6-4: Outdoor (ambient) temperature and heater power setting for steady state sample #1 ..................................................................................... 129
Figure 6-5: Outdoor (ambient) temperature and heater power setting for steady state sample #2 ..................................................................................... 129
Figure 6-6: Compressor and fans speed ratio variation for steady state sample #1, thermostatic control (low set point = 25.7, high set point = 27.7 oC) 132
Figure 6-7: Compressor and fans speed ratio variation for steady state sample #2, thermostatic control (low set point = 23, high set point = 25 oC) 132
Figure 6-8: Indoor (conditioned space) temperature variation for steady state samples, thermostatic control ................................................................ 133
Figure 6-9: Power consumption of VACR system for steady state sample #1, thermostatic control ............................................................................... 133
Figure 6-10: Power consumption of VACR system for steady state sample #2, thermostatic control ............................................................................... 134
Figure 6-11: COP of VACR system for steady state sample #1, thermostatic control .................................................................................................... 134
Figure 6-12: COP of VACR system for steady state sample #2, thermostatic control .................................................................................................... 135
Figure 6-13: Compressor and fans speed ratio variation for steady state sample #1, proactive optimal control .................................................................. 135
Figure 6-14: Compressor and fans speed ratio variation for steady state sample #2, proactive optimal control .................................................................. 136
Figure 6-15: Indoor (conditioned space) temperature variation for steady state samples, proactive optimal control ........................................................ 136
Figure 6-16: Power consumption of VACR system for steady state sample #1, proactive optimal control ........................................................................ 137
Figure 6-17: Power consumption of VACR system for steady state sample #2, proactive optimal control ........................................................................ 137
Figure 6-18: Heater power setting for transient test ...................................................... 140
Figure 6-19: Outdoor (ambient) temperature setting for transient test .......................... 140
Figure 6-20: Compressor and fans speed ratio variation for transient test, thermostatic control (low set point = 25.7, high set point = 27.7 oC) ..... 141
xv
Figure 6-21: Indoor (conditioned space) temperature variation for transient test, thermostatic control (low set point = 25.7, high set point = 27.7 oC) ..... 141
Figure 6-22: Power consumption of VACR system for transient test, thermostatic control .................................................................................................... 142
Figure 6-23: COP of VACR system for transient test, thermostatic control .................. 142
Figure 6-24: Compressor and fans speed ratio variation for transient test, proactive optimal control ........................................................................ 143
Figure 6-25: Indoor (conditioned space) temperature variation for transient test, proactive optimal control ........................................................................ 143
Figure 6-26: Power consumption of VACR system for transient test, proactive optimal control ....................................................................................... 144
Figure 6-27: COP of VACR system for transient test, proactive optimal control ........... 144
xvi
List of Acronyms
COP Coefficient of Performance
A/C-R Air Conditioning and Refrigeration
VACR Vehicle Air Conditioning and Refrigeration
VCR Vapor Compression Refrigeration
MPC Model Predictive Controller
GHG Greenhouse Gas
VCC Variable Capacity Compressor
FCC Fixed Capacity Compressor
PCM Phase Change Mater
ANSI American National Standard Institute
AHRI Air Conditioning Heating and Refrigeration Institute
ASHRAE American Society of Heating, Refrigeration, and Air Conditioning Engineers
RAAE Relative Average Absolute Error
NSP Number of Sample Points
xvii
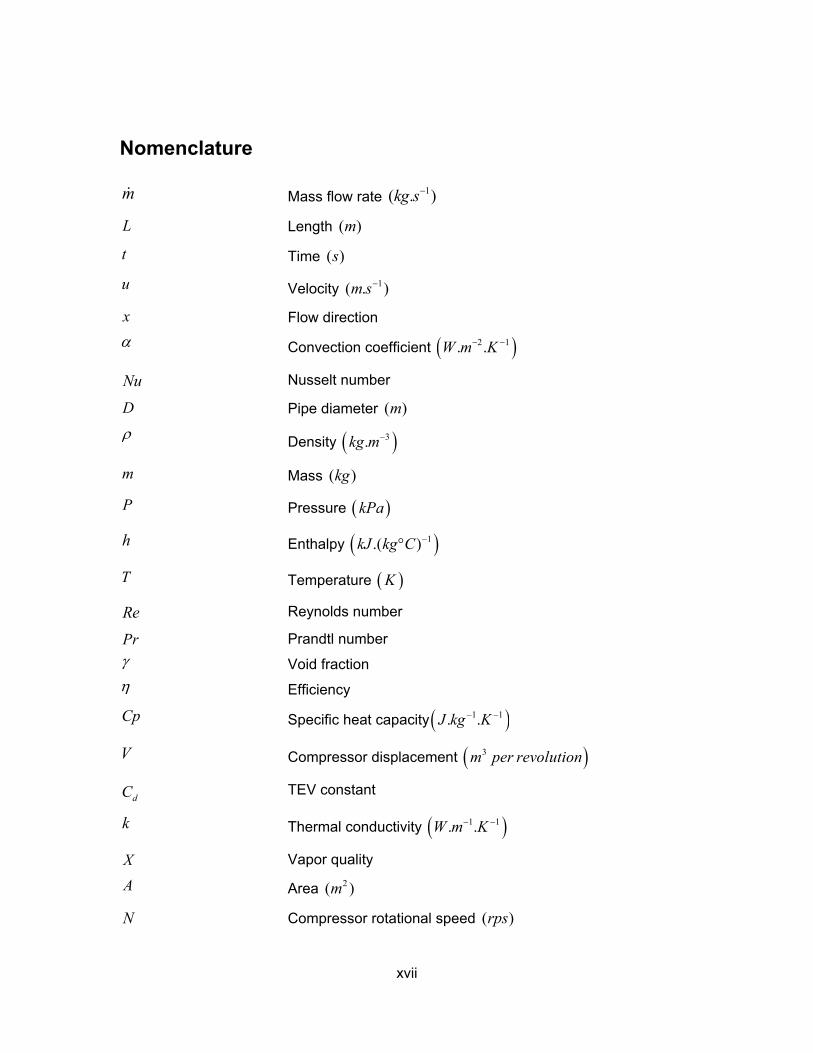
Nomenclature
m Mass flow rate 1( . )kg s
L Length ( )m
t Time ( )s
u Velocity 1( . )m s
x Flow direction
Convection coefficient 2 1. .W m K
Nu Nusselt number
D Pipe diameter ( )m
Density 3.kg m
m Mass ( )kg
P Pressure kPa
h Enthalpy 1.( )kJ kg C
T Temperature K
Re Reynolds number
Pr Prandtl number
Void fraction
Efficiency
Cp Specific heat capacity 1 1. .J kg K
V Compressor displacement 3m per revolution
dC TEV constant
k Thermal conductivity 1 1. .W m K
X Vapor quality
A Area 2( )m
N Compressor rotational speed ( )rps
xviii
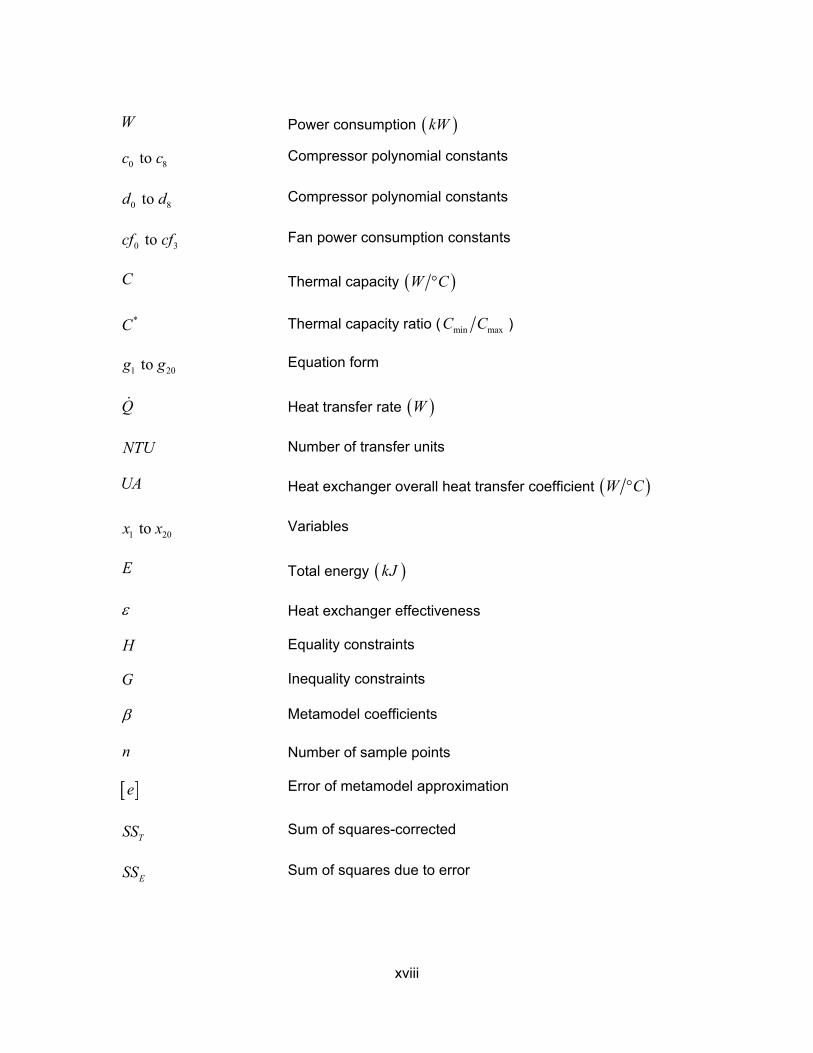
W Power consumption kW
0 8 to c c Compressor polynomial constants
0 8 to d d Compressor polynomial constants
0 3 to cf cf Fan power consumption constants
C Thermal capacity W C
*C Thermal capacity ratio ( min maxC C )
1 20 to g g Equation form
Q Heat transfer rate W
NTU Number of transfer units
UA Heat exchanger overall heat transfer coefficient W C
1 20 to x x Variables
E Total energy kJ
Heat exchanger effectiveness
H Equality constraints
G Inequality constraints
Metamodel coefficients
n Number of sample points
e Error of metamodel approximation
TSS Sum of squares-corrected
ESS Sum of squares due to error
xix
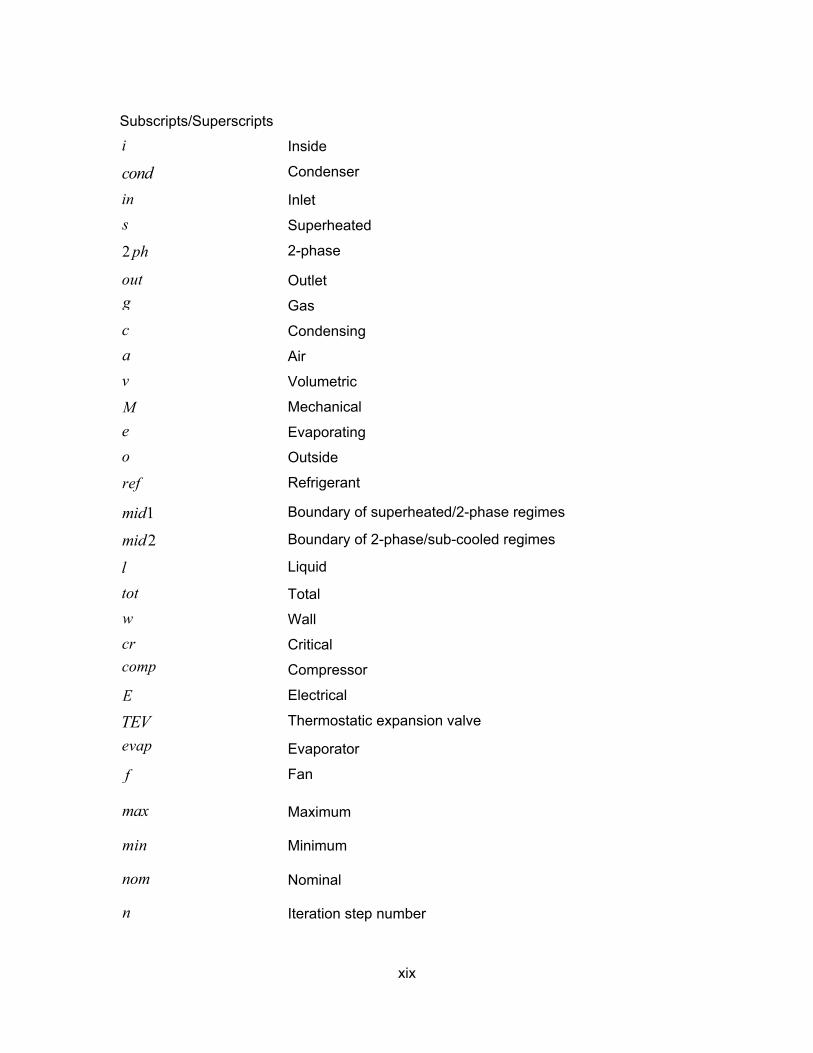
Subscripts/Superscripts
i Inside
cond Condenser
in Inlet
s Superheated
2 ph 2-phase
out Outlet
g Gas
c Condensing
a Air
v Volumetric
M Mechanical
e Evaporating
o Outside
ref Refrigerant
1mid Boundary of superheated/2-phase regimes
2mid Boundary of 2-phase/sub-cooled regimes
l Liquid
tot Total
w Wall
cr Critical
comp Compressor
E Electrical
TEV Thermostatic expansion valve
evap Evaporator
f Fan
max Maximum
min Minimum
nom Nominal
n Iteration step number

xx
avg
Average value
Metamodel-formulated
L Lower band
U Upper band
xxi
Executive Summary
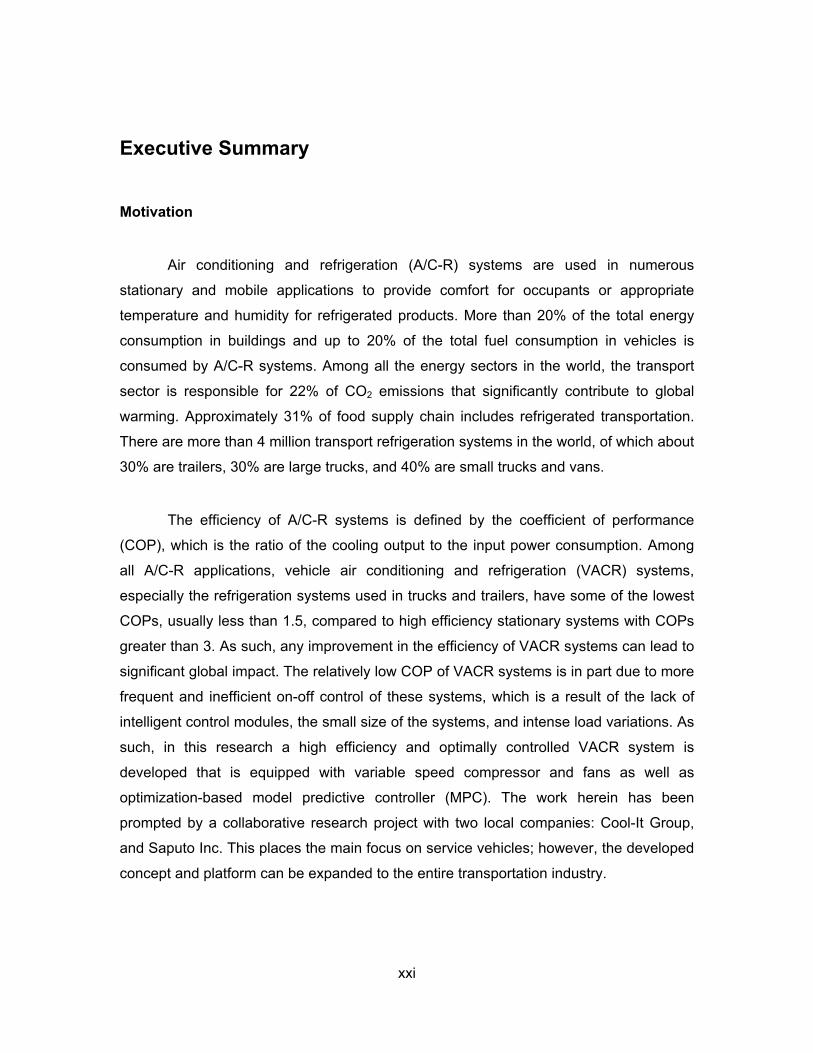
Motivation
Air conditioning and refrigeration (A/C-R) systems are used in numerous
stationary and mobile applications to provide comfort for occupants or appropriate
temperature and humidity for refrigerated products. More than 20% of the total energy
consumption in buildings and up to 20% of the total fuel consumption in vehicles is
consumed by A/C-R systems. Among all the energy sectors in the world, the transport
sector is responsible for 22% of CO2 emissions that significantly contribute to global
warming. Approximately 31% of food supply chain includes refrigerated transportation.
There are more than 4 million transport refrigeration systems in the world, of which about
30% are trailers, 30% are large trucks, and 40% are small trucks and vans.
The efficiency of A/C-R systems is defined by the coefficient of performance
(COP), which is the ratio of the cooling output to the input power consumption. Among
all A/C-R applications, vehicle air conditioning and refrigeration (VACR) systems,
especially the refrigeration systems used in trucks and trailers, have some of the lowest
COPs, usually less than 1.5, compared to high efficiency stationary systems with COPs
greater than 3. As such, any improvement in the efficiency of VACR systems can lead to
significant global impact. The relatively low COP of VACR systems is in part due to more
frequent and inefficient on-off control of these systems, which is a result of the lack of
intelligent control modules, the small size of the systems, and intense load variations. As
such, in this research a high efficiency and optimally controlled VACR system is
developed that is equipped with variable speed compressor and fans as well as
optimization-based model predictive controller (MPC). The work herein has been
prompted by a collaborative research project with two local companies: Cool-It Group,
and Saputo Inc. This places the main focus on service vehicles; however, the developed
concept and platform can be expanded to the entire transportation industry.
xxii
Objectives
The research objectives are as follows:
o Establish the duty cycle(s) and investigate the thermal and performance
characteristics of VACR systems under real-time operating conditions by
developing mathematical model, experimental study, and field data acquisition.
o Demonstrate a proof-of-concept for optimization-based, model predictive control
of VACR systems.
o Provide a platform for proactive prediction and optimal control of VACR systems
over the duty cycle.
Methodology
The following highlights the methodology and approach taken for achieving the
objective of this research project:
o Designed and built an experimental setup and performed in-lab data acquisition
to obtain real-time performance characteristics of VACR systems.
o Acquired field data from a stationary commercial refrigeration system as a
starting point to develop the skills for on-site measurements. Established the duty
cycle, and investigated the thermal and energy performance characteristics of
commercial refrigeration systems.
o Performed comprehensive field data collection to establish the duty cycle(s),
thermal behaviour and performance of conventional VACR systems in
collaboration with Saputo.
o Developed new mathematical models for the simulation of thermal and
performance characteristics of VACR systems under realistic operating
conditions and duty cycles.
o Validated accuracy of the developed models using the acquired real-time data.
o Built a lab-scale proof-of-concept demonstration of a high efficiency VACR
system based on variable speed compressor and fans and high efficiency heat
exchangers.
xxiii
o Developed an optimization model to determine the optimum compressor and
fans speeds under real-time operating conditions.
o Developed a proactive controller by integrating the developed optimization model
with an existing cooling demand simulation tool.
o Implemented the proactive optimization-based controller on the built VACR
system, evaluated the performance improvement, and finalized the proof-of-
concept demonstration of high efficiency VACR system to be employed in the
service transportation industry.
Contributions
A summary of the contributions of this research project is listed as follows:
o Established the duty cycle and investigated the thermal and performance
characteristics of a pilot commercial A/C-R system. A potential energy saving of
4,600 kWh/yr and COP improvement of 29-39% for the pilot system over the duty
cycle was evaluated [7].
o Established the duty cycle and investigated the thermal and performance
characteristics of VACR systems theoretically and experimentally. A potential
reduction of 3,105 litres/yr of diesel fuel from one pilot truck-trailer equivalent to
8,320 kg CO2/yr (10 million tons of CO2/yr globally) was estimated [3].
o Developed a new steady state model and studied the VACR systems’ thermal
and performance behaviour under steady state conditions. Validated the model
using the collected data in the lab and on-board testing [1].
o Developed and validated quasi-steady state and transient models. The models
were used to investigate real-time thermal and performance characteristics of the
VACR systems [3, 5].
o Built a high efficiency, variable capacity VACR system by employing high
efficiency heat exchangers and variable speed compressor and fans, showed
more than 150% COP enhancement [4, 6, 12, 14-15].
o Developed optimization models based on steady state and transient thermal
models [2, 4].
xxiv
o Developed a proactive and model predictive controller (MPC) for the VACR
system by integrating the optimization model and an existing cooling demand
simulation tool [2, 8-12].
o Developed a proof-of-concept demonstration of a proactively and optimally
controlled high efficiency VACR system that can be integrated in the service
transportation industry. Up to 24% COP enhancement was achieved when
compared to the on-off thermostatic controller systems [2, 8-13].
References
1- F. Bagheri, M. A. Fayazbakhsh, P. C. Thimmaiah, M. Bahrami, “Theoretical and Experimental Investigation into Anti-idling A/C System for Trucks”, Journal of Energy Conversion and Management, Vol. 98, 2015, pp. 173–183.
2- F. Bagheri, M. A. Fayazbakhsh, M. Bahrami, “Proactive and Optimal Control of A/C-R Systems”, In Preparation.
3- F. Bagheri, M. A. Fayazbakhsh, M. Bahrami, “Real-time Performance Evaluation and Potential GHG Reduction in Refrigerated Trailers”, Submitted to International Journal of Refrigeration, Under Review.
4- F. Bagheri, M. A. Fayazbakhsh, M. Bahrami, “Performance Optimization of a Battery-Powered Vehicle Air Conditioning System”, Submitted to Journal of Green Energy, Under Review.
5- F. Bagheri, M. A. Fayazbakhsh, M. Bahrami, “Investigation of Optimum Refrigerant Charge and Fans Speed for a Vehicle Air Conditioning System”, Submitted to ASME Journal of Thermal Science and Engineering Applications, Under Review.
6- F. Bagheri, M. Fakoor-Pakdaman, M. Bahrami, "Utilization of Orthotropic Graphite-Based Plates in Plate Heat Exchangers", International Journal of Heat and Mass Transfer, Vol. 77, 2014, pp. 301-310.
7- F. Bagheri, M. A. Fayazbakhsh, M. Bahrami, “Thermodynamic Investigation of a Typical Commercial Refrigeration System”, IEEE SEMI-THERM 32 Conference, San Jose, March 2016.
8- M. A. Fayazbakhsh, F. Bagheri, M. Bahrami, “An Inverse Method for Calculation of Thermal Inertia and Heat Gain in Air Conditioning and Refrigeration Systems”, Journal of Applied Energy, Vol. 138, 2015, pp. 496–504.
9- M. A. Fayazbakhsh, F. Bagheri, M. Bahrami, “A Resistance-Capacitance (RC) Model for Real-Time Calculation of Cooling Load in HVAC-R Systems”, ASME Journal of Thermal Science and Engineering Applications, Vol. 7, 2015, 041008.
10- M. A. Fayazbakhsh, F. Bagheri, M. Bahrami, “A Self-Adjusting Method for Real-Time Calculation of Thermal Loads in HVAC-R Applications”, ASME Journal of Thermal Science and Engineering Applications, Vol. 7, 2015, 041012.

xxv
11- M. A. Fayazbakhsh, F. Bagheri, M. Bahrami, “Real-Time Thermal Load Calculation by Automatic Estimation of Convection Coefficients”, International Journal of Refrigeration, Vol. 57, 2015, pp. 229–238.
12- M. A. Fayazbakhsh, F. Bagheri, M. Bahrami, "Gray-Box Model for Energy-Efficient Selection of Set Point Hysteresis in HVAC-R Controllers”, Energy Conversion and Management, Vol. 103, 2015, pp. 459-467.
13- Y. Huang, A. Khajepour, F. Bagheri, M. Bahrami, “Modelling and Optimal Energy-Saving Control of Automotive Air-Conditioning and Refrigeration Systems”, Journal of Automobile Engineering 19, 2016, 10.1177/0954407016636978.
14- M. Fakoor-Pakdaman, M. Ahmadi, F. Bagheri, M. Bahrami, " Optimal Time-Varying Heat Transfer in Multilayered Packages with Arbitrary Heat Generations and Contact Resistance”, ASME Journal of Heat Transfer, Vol. 137, 2015, 081401.
15- M. Fakoor-Pakdaman, M. Ahmadi, F. Bagheri, M. Bahrami, "Dynamic Heat Transfer Inside Multilayered Packages with Arbitrary Heat Generations”, AIAA Journal of Thermophysics and Heat Transfer, Vol. 28, 2014, pp. 687-699.
1
Chapter 1. Introduction
1.1. Research Background and Importance
Despite widespread attention during the past decades, there is a significant
potential to reduce energy consumption and greenhouse gas (GHG) emissions from
energy systems all around the globe. Based on the fifth report from Intergovernmental
Panel on Climate Change released in 2013, the average global surface temperature has
increased by 0.85 K during 1880-2012, which accelerates the rate of glacier melt and
sea level rise [1,2]. Among all the energy sectors in the world, the transport sector is
responsible for 22% of global CO2 emissions, which significantly contribute to global
warming [3,4]. Around 31% of the food supply chain includes refrigerated transportation
[5,6]. Furthermore, about 20% of total global refrigerant emissions come from mobile air
conditioning and refrigeration systems [7].
Air conditioning and refrigeration (A/C-R) systems are used in many stationary
and mobile applications to provide either comfort conditions for people or an appropriate
condition for food and other temperature/humidity sensitive creatures/products. These
systems consume a tremendous amount of energy leading to large quantities of GHG
emissions. In the U.S., A/C-R systems consume more than 20% of the total energy used
in residential buildings and more than 25% in commercial buildings [8]. It was reported
that more than 26 billion liters of fuel oil is consumed each year just to run air
conditioning systems in light-duty vehicles in the U.S. [9,10]. Running vehicle air
conditioning and refrigeration (VACR) systems increases higher fuel consumption in
compact-midsize vehicles by 12-17% [11,12].
refrig
expa
In th
comp
pump
cond
secon
from
the e
low-p
coolin
evapo
The e
in ag
Figur
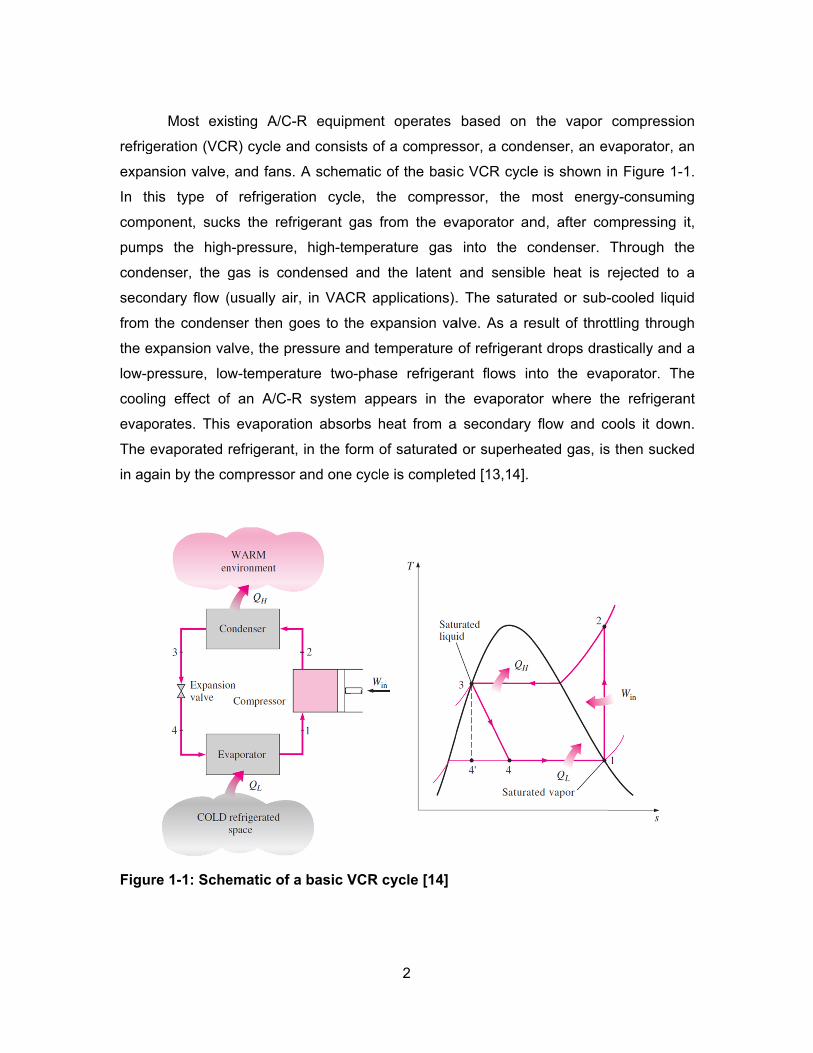
Most exis
eration (VC
nsion valve,
his type of
ponent, suck
ps the high
enser, the g
ndary flow (
the conden
expansion va
pressure, low
ng effect of
orates. This
evaporated
ain by the co
re 1-1: Sche
sting A/C-R
R) cycle and
, and fans. A
f refrigeratio
ks the refrig
h-pressure,
gas is cond
(usually air,
ser then go
alve, the pre
w-temperatu
f an A/C-R
s evaporatio
refrigerant,
ompressor a
ematic of a
R equipmen
d consists o
A schematic
on cycle, t
gerant gas f
high-tempe
densed and
in VACR a
oes to the ex
ssure and te
ure two-pha
system ap
on absorbs h
in the form o
and one cycl
basic VCR
2
t operates
f a compres
c of the basi
he compre
from the ev
rature gas
the latent
pplications).
xpansion va
emperature
ase refrigera
pears in th
heat from a
of saturated
e is complet
cycle [14]
based on
ssor, a cond
c VCR cycle
essor, the m
vaporator an
into the c
and sensib
. The satura
alve. As a re
of refrigeran
ant flows in
he evaporato
a secondary
d or superhe
ted [13,14].
the vapor
enser, an ev
e is shown i
most energ
nd, after co
condenser.
ble heat is r
ated or sub-
esult of thro
nt drops dra
nto the eva
or where th
flow and c
eated gas, is
compressio
vaporator, a
in Figure 1-1
gy-consumin
mpressing
Through th
rejected to
-cooled liqui
ttling throug
astically and
aporator. Th
he refrigeran
cools it down
s then sucke
on
an
1.
ng
it,
he
a
id
gh
a
he
nt
n.
ed
3
The efficiency of A/C-R systems is defined by the coefficient of performance
(COP), which is the ratio of the cooling power output to the input power consumption.
A/C-R systems in transportation applications operate in a harsh environment (intensively
variant) and experience a wide range of cooling demand and constraints imposed by
available space and weight. As such, these systems have lower COP (usually less than
1.5) than stationary systems (usually larger than 3) [15–18]. In addition to the low COP,
the quantity of transported goods, amount of home delivery, and expectations for the
quality of goods are increasing, resulting in a tremendous amount of energy
consumption by the refrigerated transport industry [19,20]. Furthermore, the globalized
nature of food production has led to longer transit distances for many food products [21].
In the U.S. alone, it is estimated that processed foods are, on average, transported over
2,100 km before being consumed and fresh food products 2,400 km [21,22]. In addition,
delivery of food products requires frequent opening of the door, which leads to air
infiltration and a remarkable increase in the cooling demand. It is reported that a food
product can be subjected to as many as 50 door-openings during a delivery [23]. The
low performance, combined with the harsh operating conditions, lead to significant global
impacts and put high pressure on the food industry to find remedies to reduce the
energy consumption of refrigerated transport [19].
1.2. Research Motivation
Due to the low COP of the numerous VACR systems worldwide, any small
improvement can bring a significant global impact. The relatively low COP of VACR
systems is in part due to more frequent and inefficient on-off cycling of these systems,
which is a result of the lack of intelligent control modules, the small size of the systems,
and a more intense load variation. The more intense load variations in VACR systems
are due to poor compartment insulation, the high frequency of opening and closing doors
or windows, sun exposure, and movement of the vehicle.
4
Accordingly, development of an optimally controlled, proactive VACR system with
higher efficiency to replace existing inefficiently controlled VACR systems will have
significant global improvement on energy consumption and the corresponding GHG
emissions. The optimally controlled VACR system is equipped with a variable speed
compressor and variable speed fans that enable the capacity of the system to be
controlled instead of using on-off cycling. The focus of this research is on service
vehicles; however, the developed concept and system could be used in all sectors of the
transportation industry.
The work herein has been prompted by a collaborative research project with two
local companies; Cool-It Group, an Abbotsford, BC based manufacturer of anti-idling
battery-powered VACR systems for truck and vans; and Saputo Inc., Canada’s largest
dairy product processor, located in Burnaby, BC. The low COP of battery-powered
VACR systems leads to a relatively short life for the batteries and highly affects the
reliability of Cool-It’s products. Also, Saputo spends an enormous amount on fuel for
their refrigerated trailers that are used to deliver dairy products every day. Due to the
impact of VACR systems on countrywide fuel consumption and the environment, this
research project is financially supported by the Natural Sciences and Engineering
Research Council of Canada (NSERC) through an Automotive Partnership Canada
(APC) Grant, No: APCPJ 401826-10.
1.3. Research Scope
Based on the reported low performance and significant global impacts of VACR
systems and as a result of collaboration with two local companies; Cool-It Group and
Saputo Inc., this research is focused on developing high efficiency VACR system for
service vehicles. The objectives of the research are to: 1) establish the duty cycle and
actual operating conditions for refrigerated (delivery) service vehicles, 2) investigate the
performance of VACR systems under real-time operating conditions employing
mathematical techniques and experimentation, 3) demonstrate a proof-of-concept for
5
optimization-based, model predictive control of VACR systems, and 4) provide a
platform for proactive prediction and control of VACR systems over the duty cycle. As
such, an experimental setup is developed to perform in-lab data acquisition and obtain
the real-time performance characteristics of VACR systems. In addition, comprehensive
field data is collected to establish the duty cycle(s) and obtain real-time thermal behavior
and performance characteristics of the VACR systems. Mathematical models are
developed and validated to simulate thermal and performance behavior of VACR
systems under steady state and transient conditions. Furthermore, a proof-of-concept
demonstration of a high efficiency VACR system based on variable speed compressor
and fans and high efficiency heat exchangers is developed. A model-based optimization
method is employed to determine the optimum compressor and fans speeds under any
imposed operating condition. Finally, an in-lab proof-of-concept demonstration for
proactive and optimal control of VACR systems by integrating the developed model-
based optimizer with an existing cooling demand simulator is developed. The developed
concept and platform can be expanded to the entire transportation industry and even
stationary systems and will lead to significant global energy savings and GHG reduction.
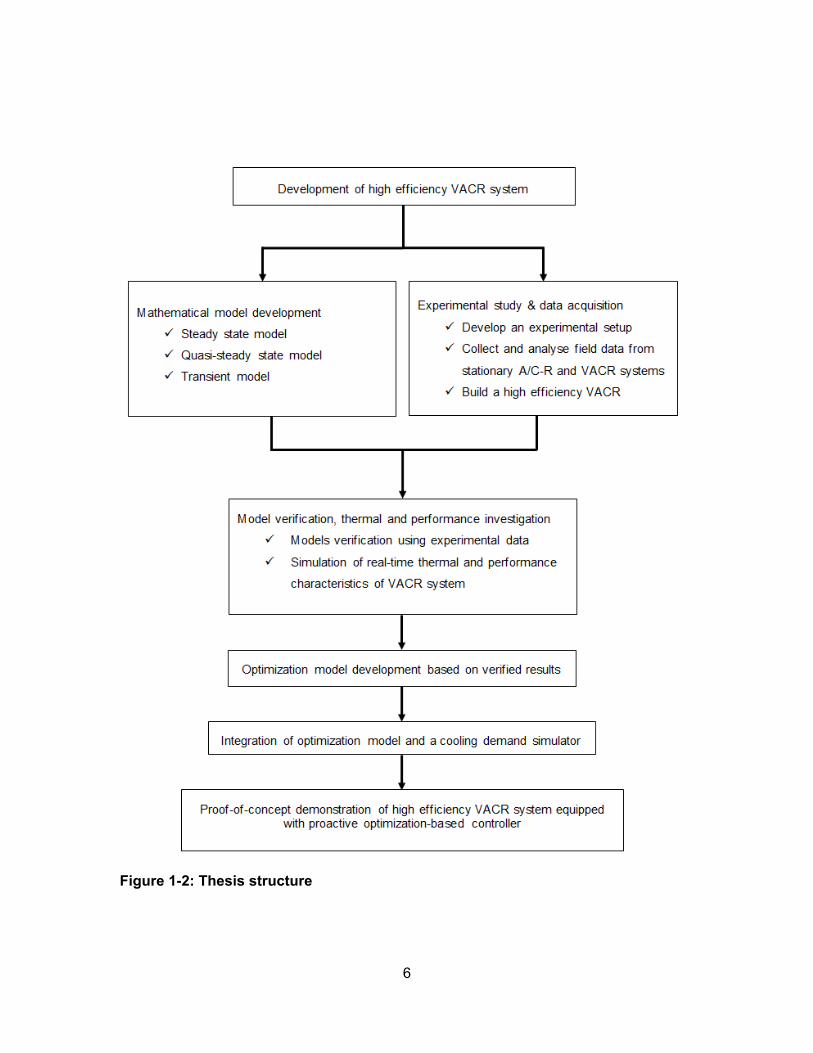
1.4. Thesis Structure
Based on the scope of research, Figure 1-2 represents the structure of the
Thesis. Chapter 2 covers the development of the mathematical model. In Chapter 3, the
development of the experimental test bed and acquisition of field data are presented.
Model validation as well as an investigation of the thermal and performance behaviour is
presented in Chapter 4. The metamodels for optimization are developed in Chapter 5.
The integration of the model equipped with the optimization solver and an existing
cooling demand simulator is covered in Chapter 6. Chapter 6 also represents a proof-of-
concept demonstration of a high efficiency VACR system equipped with a proactive
optimization-based controller as the expandable solution for the future of the
transportation industry.
6
Figure 1-2: Thesis structure
7
1.5. Relevant Literature
A/C-R systems have been the topic of many studies in the last decades due to
their significant global energy consumption and corresponding environmental impact. In
spite of numerous studies in the literature focusing on the stationary A/C-R systems in
different applications, the number of studies relevant to general category of VACR
systems is limited [24–30]. In addition, most VACR-related studies have concentrated on
engine-driven car A/C-R systems rather than the service vehicle category. Furthermore,
the literature lacks an in-depth study on performance optimization of VACR systems in
service vehicles. The literature review is represented in two separate categories: 1)
thermal and performance studies on A/C-R systems, 2) control studies on A/C-R
systems.
1.5.1. Thermal and performance studies on A/C-R systems
The majority of the studies in the field of VACR systems are related to the
assessment of the effects of refrigerant type on the characteristics and the performance
[30–34]. Yoo et al. [33] studied the performance of an automotive air conditioning system
charged with R152a, and compared it to R134a. The results of this study showed that
the R152a system was slightly better than R134a not only under driving conditions, but
also under idling conditions. Brown et al. [34] compared a VACR system charged with
CO2 and R134a, and showed that the R134a refrigerant led to a 21-34% higher
coefficient of performance (COP). Cho et al. [30] experimentally compared the
characteristics of a VACR system charged alternatively with R134a and R1234yf, and
showed that using R1234yf resulted in a relatively lower compressor power consumption
and cooling capacity by 4% and 7%. They also investigated the effectiveness of
installing an internal heat exchanger for heat transfer between cold refrigerant leaving
the evaporator and warm refrigerant leaving the condenser to increase the amount of
sub-cooling and found a 4.6% improvement in COP.
8
A variety of other important parameters including refrigerant charge, compressor
speed, fan speed, and ambient temperature have also been considered in VACR system
studies. Ratts et al. [35] experimentally analyzed the COP of a passenger car A/C-R
system, focusing on relationships between the COP, the compressor revolution, and the
vehicle speed. Their analysis showed that the performance of the system degraded with
increasing vehicle speed. Macagnan et al. [17] experimentally investigated effects of the
amount of refrigerant charge and compressor speed on the cooling power and
performance of a typical VACR and showed that although the refrigerant charge did not
sensibly affect the VACR system characteristics, the compressor speed caused a
variation in the system COP in a range of 1-1.8. Jabardo et al. [36] studied the effects of
compressor speed and the evaporator and condenser inlet air temperatures on the
performance of a VACR by developing a steady state thermodynamic simulation model.
They experimentally changed the refrigerant charge in a relatively narrow range,
however, could not extract a pattern for the behavior of cooling capacity and COP versus
the refrigerant charge due to the limited range of studied charge.
Lee et al. [29] developed a simulation model for a VACR system based on
component sub-models and reported a 7% discrepancy with experimental data. They
investigated the effects of refrigerant charge and condenser size on the system COP.
Wang et al. [16] measured the vapor quality of refrigerant R134a at the inlet of a
compressor and analyzed the effects of different parameters on the COP of a VACR
system. They showed that the COP of the system decreases with increasing of
refrigerant charge, condensing temperature and compressor speed, and increases with
the increase of evaporator air inlet temperature. They also demonstrated that the total
quality of the refrigerant at the compressor inlet increases with increasing the evaporator
air inlet temperature, and decreases with the increase of the refrigerant charge,
condensing temperature, and compressor speed. The value of COP reported was in the
range of 1.1-2.5.
Since VACR compressors are usually belt-driven by the vehicle engine, the
compressor speed is directly proportional to the engine speed. The compressor can be
either of fixed or variable capacity. Therefore, the cooling capacity of a VACR system
using a fixed capacity compressor (FCC) varies as a function of the engine speed.
9
Consequently, the FCC continually cycles on and off to meet the air conditioning
demand. On the other hand, the cooling capacity of a VACR system using a variable
capacity compressor (VCC) is independent of the compressor speed, because in this
type of compressor the piston displacement varies by speed in order to control the
capacity. Therefore, such a system meets the air conditioning demand at all operating
conditions with much less cycling effects. Alkan et al. [37] experimentally compared
employing VCC or FCC for a VACR system at different engine rotational speeds as well
as evaporator and condenser air stream characteristics. Based on the steady state tests,
they showed that the FCC operations provided a rising cooling capacity with increasing
compressor speed, while the cooling capacity of the VCC remained almost constant
after a certain compressor speed due to the intervention of the capacity control system.
It was shown that although the COP of VCC system during the low engine rpm
operations was slightly poorer, it surpassed the COP of FCC system at the higher rpms.
Moreover, the COP of FCC system decreases persistently with the increase in
compressor speed. Tian et al. [38,39] studied the transient behavior of a VACR system
equipped with a variable capacity compressor experimentally and mathematically using
a steady-state-based compressor model. They assumed that the changes in compressor
rotary speed are very rapid and mainly focused on the transient changes in refrigerant
pressures and piston stroke length after a sudden compressor speed change. They
showed that the variation of a VCC’s piston stroke length usually has a time lag after
changes of the effective parameters (mainly the compressor’s rpm) and some
regulations are required for achieving any desired cooling capacity due to engine’s rpm
variations during the transient operations.
Returning to the category of stationary A/C-R systems, few studies can be found
that focused on performance optimization of these systems. Abdullah et al. [40] studied
the effects of evaporator temperature on the COP of a stationary A/C-R system and
obtained a maximum COP by changing this temperature. Green et al. [41] introduced a
performance function that encompassed food quality, energy efficiency, and system
reliability, to enable performance assessment and optimization of a supermarket
refrigeration system. They studied the effects of thermostatic set point temperature as
the control parameter to optimize the defined performance function. Sahin et al. [42]
presented a thermo-economic performance model for a two-stage refrigerator and
10
determined the optimal operation and design parameters of the refrigerator based on the
thermo-economic criterion. They mainly focused on the effects of investment and energy
costs in designing a high efficiency cascade refrigerator and demonstrated that the
economical parameter had a great influence on the optimal operating and design
condition.
In addition, a variety of innovative technologies to increase the energy efficiency
of VACR systems have been introduced in the literature. Waste-heat-driven air
conditioning systems, which operate based on absorption or adsorption cycles, have
been introduced in several studies as a promising way to make sustainable VACR
systems [9,43,44]. Also, employing microchannel condensers as a performance
enhancement technology for VACR systems is covered in reference [45]. Muller [46]
introduced the feasibility of employing magnetocaloric cooling for transportation industry.
Gould et al. [47] studied the effects of capturing waste heat from the internal combustion
engine exhaust to run air conditioning system using steam-pressure-exchange ejector
for an automobile. Unal et al. [48] investigated the effects of using two-phase ejectors as
the expansion valve in the A/C-R system of buses and showed the potential for a15%
performance improvement.
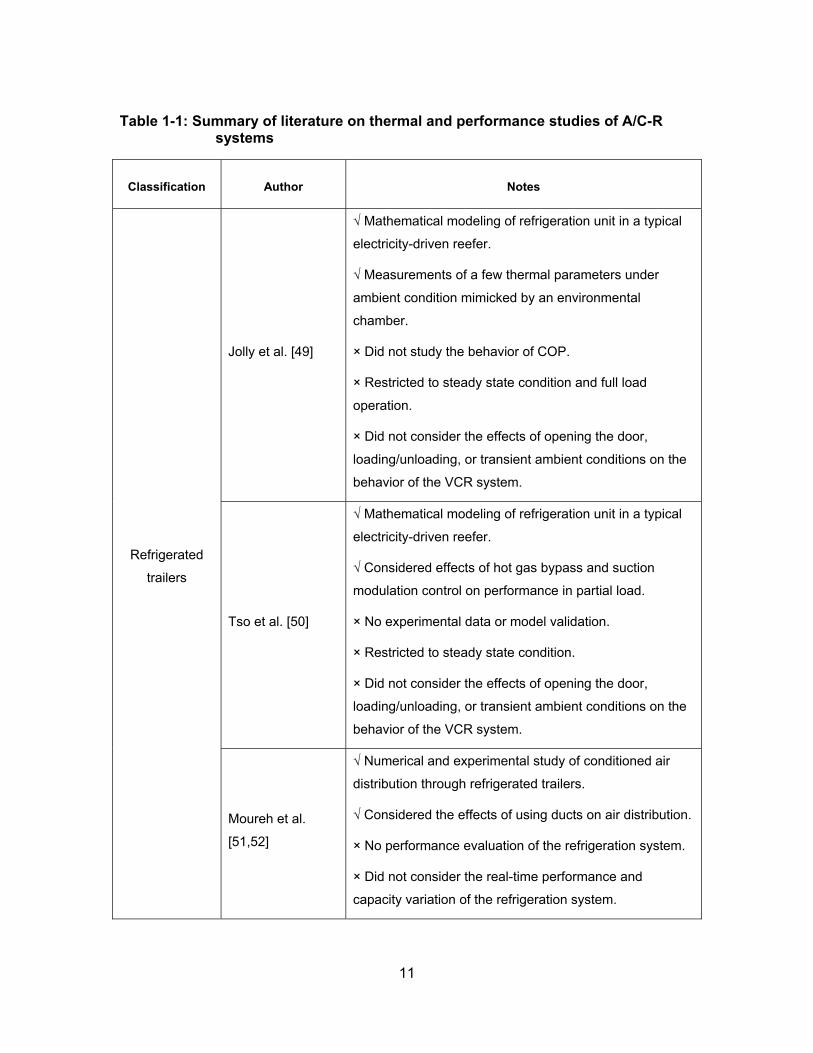
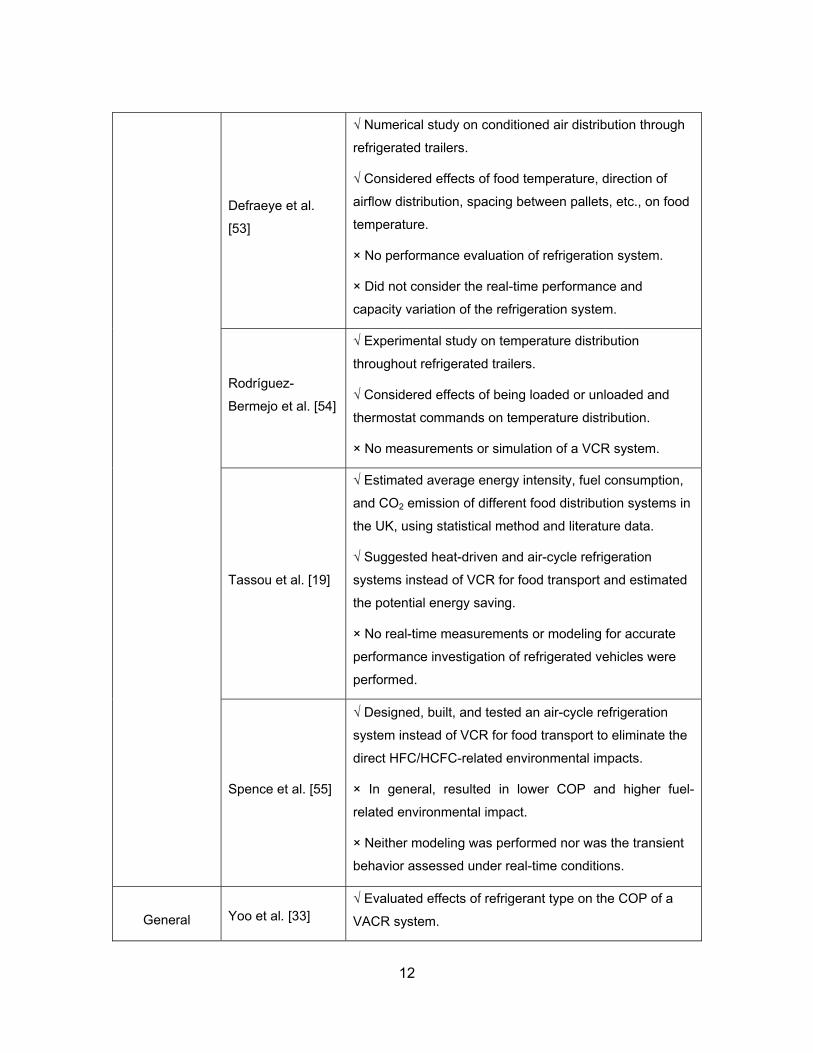
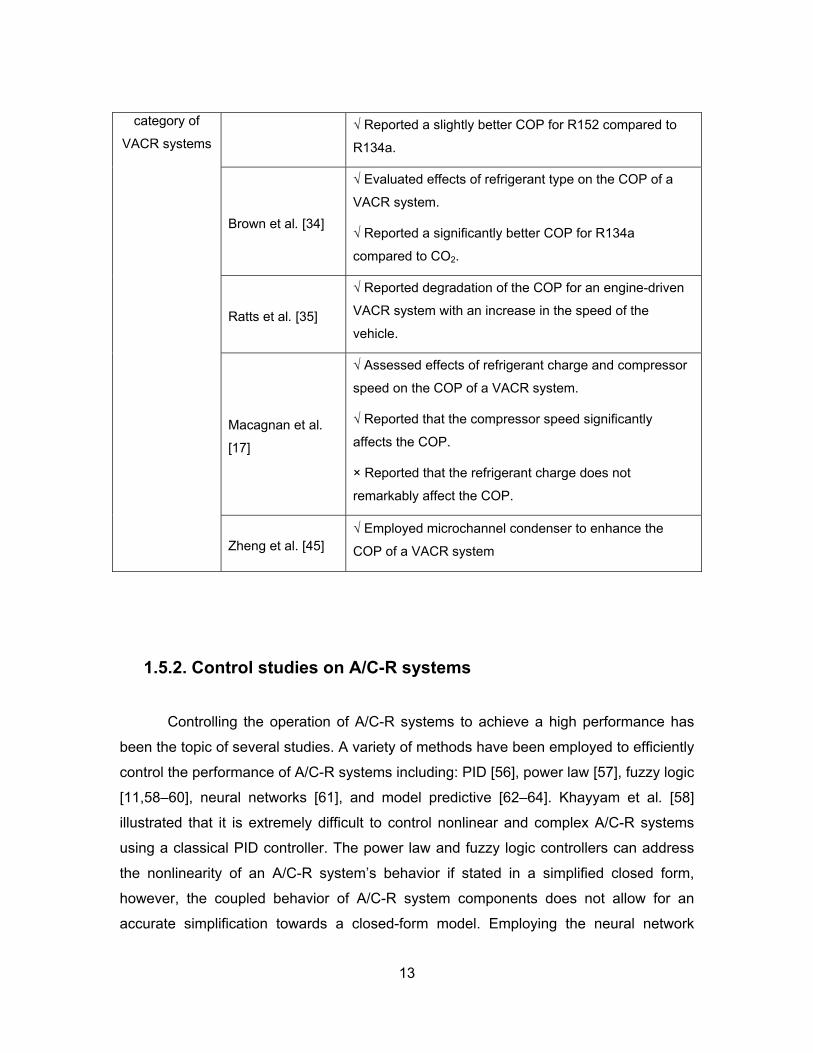
A summary of the most relevant existing literature on thermal and performance
characteristics of VACR systems is presented in Table 1-1. Because a major part of this
thesis is focused on refrigerated trailers, the literature summary is separated for this type
of VACR systems.
11
Table 1-1: Summary of literature on thermal and performance studies of A/C-R systems
Classification Author Notes
Refrigerated
trailers
Jolly et al. [49]
√ Mathematical modeling of refrigeration unit in a typical
electricity-driven reefer.
√ Measurements of a few thermal parameters under
ambient condition mimicked by an environmental
chamber.
× Did not study the behavior of COP.
× Restricted to steady state condition and full load
operation.
× Did not consider the effects of opening the door,
loading/unloading, or transient ambient conditions on the
behavior of the VCR system.
Tso et al. [50]
√ Mathematical modeling of refrigeration unit in a typical
electricity-driven reefer.
√ Considered effects of hot gas bypass and suction
modulation control on performance in partial load.
× No experimental data or model validation.
× Restricted to steady state condition.
× Did not consider the effects of opening the door,
loading/unloading, or transient ambient conditions on the
behavior of the VCR system.
Moureh et al.
[51,52]
√ Numerical and experimental study of conditioned air
distribution through refrigerated trailers.
√ Considered the effects of using ducts on air distribution.
× No performance evaluation of the refrigeration system.
× Did not consider the real-time performance and
capacity variation of the refrigeration system.
12
Defraeye et al.
[53]
√ Numerical study on conditioned air distribution through
refrigerated trailers.
√ Considered effects of food temperature, direction of
airflow distribution, spacing between pallets, etc., on food
temperature.
× No performance evaluation of refrigeration system.
× Did not consider the real-time performance and
capacity variation of the refrigeration system.
Rodríguez-
Bermejo et al. [54]
√ Experimental study on temperature distribution
throughout refrigerated trailers.
√ Considered effects of being loaded or unloaded and
thermostat commands on temperature distribution.
× No measurements or simulation of a VCR system.
Tassou et al. [19]
√ Estimated average energy intensity, fuel consumption,
and CO2 emission of different food distribution systems in
the UK, using statistical method and literature data.
√ Suggested heat-driven and air-cycle refrigeration
systems instead of VCR for food transport and estimated
the potential energy saving.
× No real-time measurements or modeling for accurate
performance investigation of refrigerated vehicles were
performed.
Spence et al. [55]
√ Designed, built, and tested an air-cycle refrigeration
system instead of VCR for food transport to eliminate the
direct HFC/HCFC-related environmental impacts.
× In general, resulted in lower COP and higher fuel-
related environmental impact.
× Neither modeling was performed nor was the transient
behavior assessed under real-time conditions.
General Yoo et al. [33] √ Evaluated effects of refrigerant type on the COP of a
VACR system.
13
category of
VACR systems
√ Reported a slightly better COP for R152 compared to
R134a.
Brown et al. [34]
√ Evaluated effects of refrigerant type on the COP of a
VACR system.
√ Reported a significantly better COP for R134a
compared to CO2.
Ratts et al. [35]
√ Reported degradation of the COP for an engine-driven
VACR system with an increase in the speed of the
vehicle.
Macagnan et al.
[17]
√ Assessed effects of refrigerant charge and compressor
speed on the COP of a VACR system.
√ Reported that the compressor speed significantly
affects the COP.
× Reported that the refrigerant charge does not
remarkably affect the COP.
Zheng et al. [45] √ Employed microchannel condenser to enhance the
COP of a VACR system
1.5.2. Control studies on A/C-R systems
Controlling the operation of A/C-R systems to achieve a high performance has
been the topic of several studies. A variety of methods have been employed to efficiently
control the performance of A/C-R systems including: PID [56], power law [57], fuzzy logic
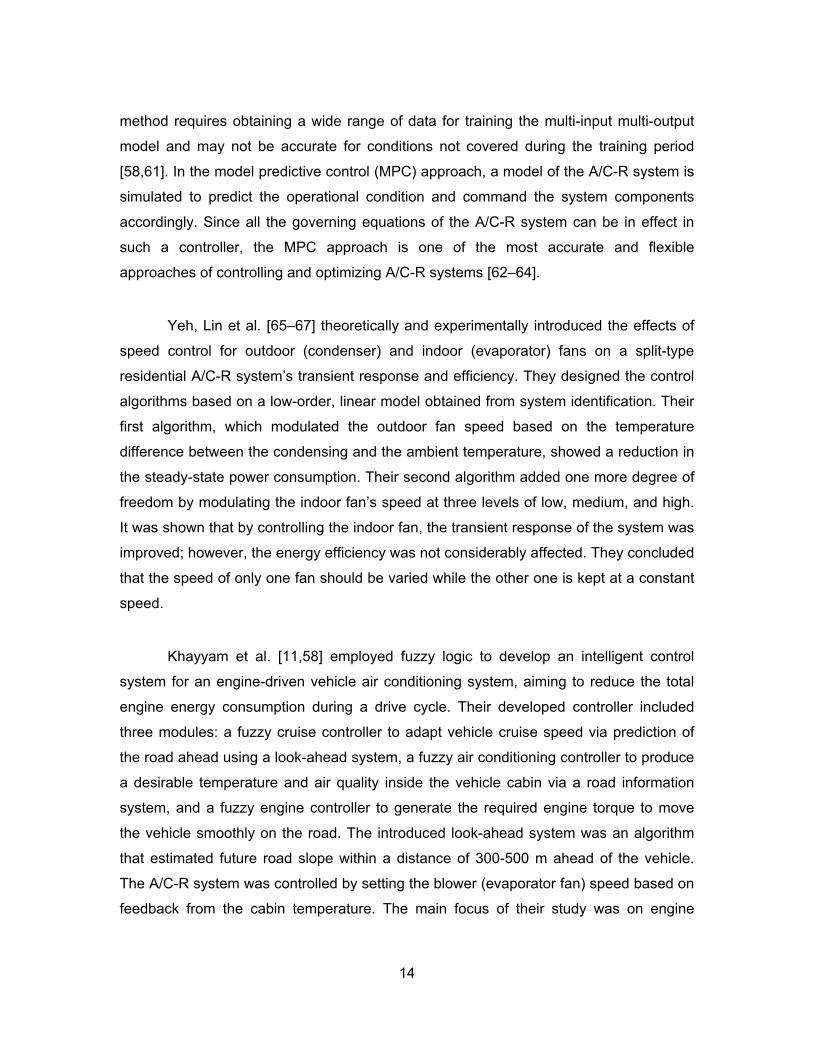
[11,58–60], neural networks [61], and model predictive [62–64]. Khayyam et al. [58]
illustrated that it is extremely difficult to control nonlinear and complex A/C-R systems
using a classical PID controller. The power law and fuzzy logic controllers can address
the nonlinearity of an A/C-R system’s behavior if stated in a simplified closed form,
however, the coupled behavior of A/C-R system components does not allow for an
accurate simplification towards a closed-form model. Employing the neural network
14
method requires obtaining a wide range of data for training the multi-input multi-output
model and may not be accurate for conditions not covered during the training period
[58,61]. In the model predictive control (MPC) approach, a model of the A/C-R system is
simulated to predict the operational condition and command the system components
accordingly. Since all the governing equations of the A/C-R system can be in effect in
such a controller, the MPC approach is one of the most accurate and flexible
approaches of controlling and optimizing A/C-R systems [62–64].
Yeh, Lin et al. [65–67] theoretically and experimentally introduced the effects of
speed control for outdoor (condenser) and indoor (evaporator) fans on a split-type
residential A/C-R system’s transient response and efficiency. They designed the control
algorithms based on a low-order, linear model obtained from system identification. Their
first algorithm, which modulated the outdoor fan speed based on the temperature
difference between the condensing and the ambient temperature, showed a reduction in
the steady-state power consumption. Their second algorithm added one more degree of
freedom by modulating the indoor fan’s speed at three levels of low, medium, and high.
It was shown that by controlling the indoor fan, the transient response of the system was
improved; however, the energy efficiency was not considerably affected. They concluded
that the speed of only one fan should be varied while the other one is kept at a constant
speed.
Khayyam et al. [11,58] employed fuzzy logic to develop an intelligent control
system for an engine-driven vehicle air conditioning system, aiming to reduce the total
engine energy consumption during a drive cycle. Their developed controller included
three modules: a fuzzy cruise controller to adapt vehicle cruise speed via prediction of
the road ahead using a look-ahead system, a fuzzy air conditioning controller to produce
a desirable temperature and air quality inside the vehicle cabin via a road information
system, and a fuzzy engine controller to generate the required engine torque to move
the vehicle smoothly on the road. The introduced look-ahead system was an algorithm
that estimated future road slope within a distance of 300-500 m ahead of the vehicle.
The A/C-R system was controlled by setting the blower (evaporator fan) speed based on
feedback from the cabin temperature. The main focus of their study was on engine
15
power control to move the vehicle appropriately, while the A/C-R load was taken into
account as a by-product
Ricker [64] developed a MPC for a supermarket refrigeration system in which all
the actuators were on-off devices. A simplified compressor model employing the cycle’s
high pressure and the cabinet temperature to generate on-off commands were prepared
as the brain of the MPC. They could reduce the frequency of on-off cycling using the
developed MPC controller instead of the existing simple thermostatic controller.
Hovgaard et al. [68] presented the economical optimization of a supermarket
refrigeration system by employing a MPC controller based on the compressor and
refrigerated space thermal models. By optimizing a defined cost function, they showed
that the operational costs of the refrigeration system could be reduced if thermal energy
storage was added to the refrigeration system. Schalbart et al. [62] developed a MPC to
optimize the energy management of an ice-cream warehouse refrigeration system
coupled to a phase-change material (PCM) tank. The MPC model was developed based
on a PCM tank thermal sub-model as well as a simple refrigeration system sub-model.
They showed a potential for energy management by integrating the refrigeration and
thermal storage systems using a MPC approach. Based on the literature, employing an
MPC for performance optimization of A/C-R systems can be a promising methodology.
However, it requires an accurate mathematical simulator of the A/C-R system to operate
satisfactorily. In addition to the mathematical model development, an in-depth
understanding of the A/C-R system’s behavior under real-time operating conditions is
required for an effective design of the controller. Although the performance
characteristics of stationary A/C-R systems have been well attended in the literature,
VACR systems have not been studied in-depth so far. A concise summary of the major
findings from the performed literature review is classified in Table 1-2.
16
Table 1-2: Summary of the literature on control of A/C-R systems
Author Notes
Sørensen et al.
[69]
√ Developed a MPC for the refrigeration unit of reefers to increase
performance.
× Restricted to electrically driven reefers used for sea transportation.
× Employed a simplified linear model for thermal behavior of cargo.
× No comprehensive model development of refrigeration unit for MPC.
× No Real-time study of power consumption and performance behavior.
Khayyam et al.
[11,58]
√ Developed a controller for an engine-driven VACR system.
√ Developed a concept of look-ahead for engine torque prediction
based on road slope.
× Controlled only evaporator fan speed to adjust the cabin temperature.
× Employed a simplified controller model based on fuzzy logic.
Lin et al. [65–67]
√ Developed a MPC for a split A/C-R unit in a residential building.
× Employed a low-order linear model in MPC.
× Considered only variable speed fans and controlled them separately.
Ricker [64]
√ Developed a MPC for a supermarket refrigerator.
× Employed a simplified A/C-R model only based on the cycle’s high
pressure and the refrigerated space temperature.
× Developed an inefficient on-off control for constant speed compressor
and fans.
Hovgaard et al.
[68]
√ Developed a MPC for a supermarket refrigerator.
× Employed a simplified economic-based model for MPC.
× Controlled constant speed components by on-off commands.
17
1.5.3. Lack of literature
The reported literature review indicates that the performance optimization and
proactive control development of VACR systems has not been studied in-depth, and the
pertinent literature lacks the following:
o An in-depth study on the duty cycle, thermal, and performance
characteristics of VACR systems employed in service transportation
under realistic operating conditions.
o Model-based performance optimization and control of variable capacity
VACR systems under transient operating conditions.
o Proactive and model predictive control of the operation of a VACR system
based on cooling demand prediction and VACR behavior simulation.
18
Chapter 2. Mathematical Model Development
Mathematical simulation of A/C-R systems is an effective method for
investigating the thermal behavior and thermodynamic characteristics of these systems
and to obtain the power consumption, cooling power, and COP under any operating
conditions. A mathematical model for a complete A/C-R system is an integration of the
component sub-models, including the compressor, condenser, evaporator, and
expansion valve. Therefore, a detailed analysis of each component in an A/C-R system
is covered during the modeling procedure. The detailed component analysis in the
mathematical modeling results in a complex set of conservation equations that should be
solved numerically [25,26]. Thus, a numerical algorithm and a solver should be
developed to simulate VCR systems.
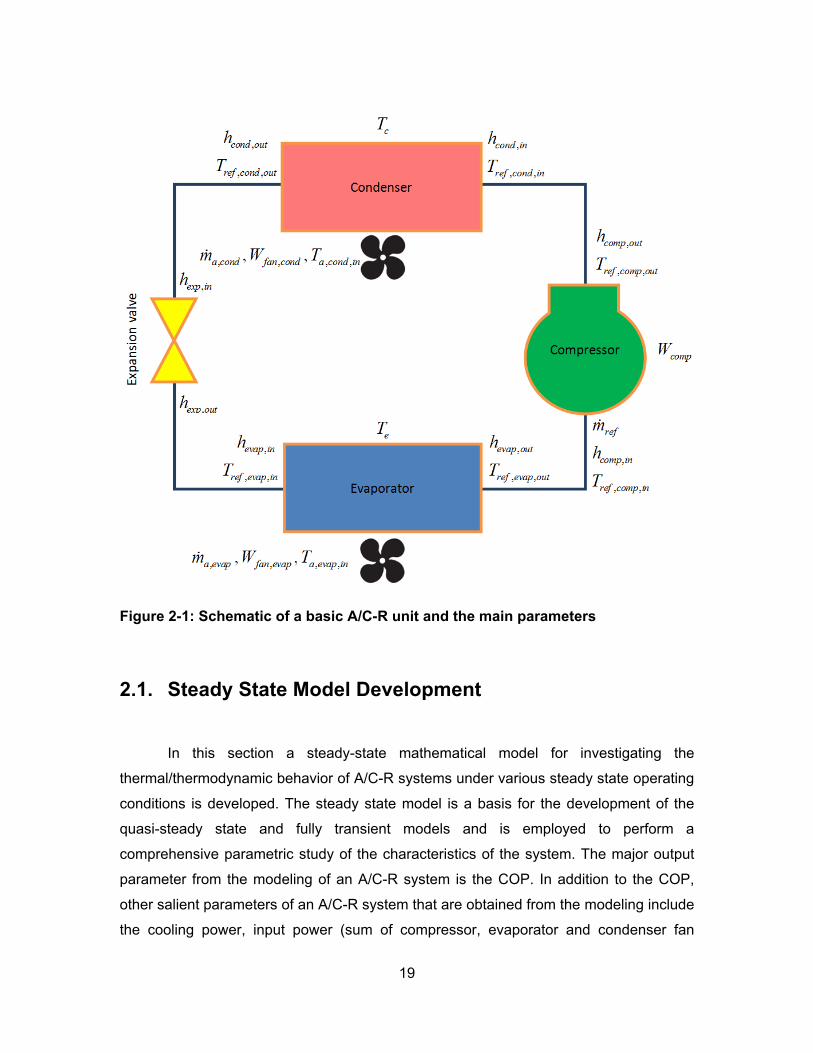
In Figure 2-1, a schematic of a basic A/C-R system and the main
thermal/thermodynamic parameters used in the mathematical modeling are presented.
In this chapter, the mathematical modeling of such a system is presented in three
sections: 1) steady state model, 2) quasi-steady state model, 3) transient model.
19
Figure 2-1: Schematic of a basic A/C-R unit and the main parameters
2.1. Steady State Model Development
In this section a steady-state mathematical model for investigating the
thermal/thermodynamic behavior of A/C-R systems under various steady state operating
conditions is developed. The steady state model is a basis for the development of the
quasi-steady state and fully transient models and is employed to perform a
comprehensive parametric study of the characteristics of the system. The major output
parameter from the modeling of an A/C-R system is the COP. In addition to the COP,
other salient parameters of an A/C-R system that are obtained from the modeling include
the cooling power, input power (sum of compressor, evaporator and condenser fan
20
powers), and refrigerant mass flow rate. An integration of the component sub-models of
an A/C-R system forms its complete mathematical model [70].
2.1.1. Compressor sub-model
A map-based model is used in this study for thermodynamic simulation of the
compressor under steady state conditions. It has been experimentally shown that this
approach had a good agreement with experimental data [49,71,72]. Second-order
polynomials are developed for the compressor input power and refrigerant mass flow
rate quantities based on the manufacturer's test data, as shown in Eqs. (2.1) and (2.2) in
Table 2-1. These equations yield a maximum of 2.5% discrepancy when compared to
the manufacturer's data. It should be noted that the manufacturer’s data is usually
provided for fixed magnitudes of superheating and subcooling. If the A/C-R system is
equipped with a thermostatic expansion valve, the refrigerant flow rate is controlled to
achieve a pre-set amount of superheating. Accordingly, throughout the duty cycle the
degree of superheating at the outlet of the evaporator is kept nearly constant. However,
the degree of subcooling varies, depending upon the imposed conditions on the system
from the air-stream sides at the condenser (major impact) and evaporator (minor
impact). Therefore, a modification will be required for different degrees of superheating
and subcooling. In the present research, wide ranges of superheating and subcooling (0-
15 oC) are tested and the modified correlations of the compressor model under different
superheating and subcooling values are obtained. The refrigerant side thermodynamic
correlation for the compressor is presented in Eq. (2.3), as seen in Table 2-1. Based on
these correlations, with known inlet conditions at the compressor inlet, the state point of
the refrigerant gas at the compressor discharge can be calculated.
2.1.2. Condenser and evaporator sub-model
Energy balance correlations between the refrigerant and air flow in condensers
and evaporators are used to model heat transfer in these components of the A/C-R
system. In the present study, we follow Shah and Sekulic [73], and an NTU model is
21
used to derive the mathematical model for the condenser and evaporator. In this
approach, the effectiveness is defined as the ratio of the actual heat transfer to the
maximum possible heat transfer; see Eq. (2.4) of Table 2-1. The maximum possible heat
transfer happens when the temperature of one stream at the outlet reaches the inlet
temperature of the other stream and is defined in Eq. (2.5). The actual heat transfer
between the air stream and refrigerant flow can be calculated using Eq. (2.6). To use
this equation, it is required that be found from Eqs. (2.7) and (2.8). For the current
study, the condenser and evaporator specifications are obtained from the manufacturer’s
datasheet and drawings. In addition to the NTU correlations, which represent the
heat transfer between the air and refrigerant streams, correlations of enthalpy change for
both the refrigerant and air streams should be added to complete the heat transfer
model for the evaporator and condenser. Equations (2.9) and (2.10) represent the
enthalpy change for the air and refrigerant streams in the condenser and evaporator.
The cooling capacity of an A/C-R system is obtained using either of these equations (Eq.
(2.9) or (2.10)) when written for the evaporator. Also, the total heat rejection of the
system is calculated using either of these equations for the condenser. For the air
stream in the evaporator, the enthalpy is calculated based on the temperature and
relative humidity to include both the sensible and latent heat transfers. However, for the
air stream in the condenser, the enthalpy of air can be simply found using the
temperature and thermal capacity of air since there is no water condensation on the
condenser coil.
It should be mentioned that two heat transfer regimes exist in the evaporator: 1)
two-phase heat transfer, relevant to the saturated zone; and 2) single-phase heat
transfer, relevant to the superheated zone. Also, the condenser can be divided into three
heat transfer regimes: single-phase superheated; two-phase saturated; and single-
phase subcooled. Due to governance of different convective heat transfer equations for
the mentioned regimes, in this study the evaporator and condenser are divided into two
and three sub-zones, respectively. Thus, the NTU model is applied for each sub-
zone separately to achieve a high level of accuracy. In addition to the heat transfer
model for the condenser and evaporator, map-based correlations are employed to obtain
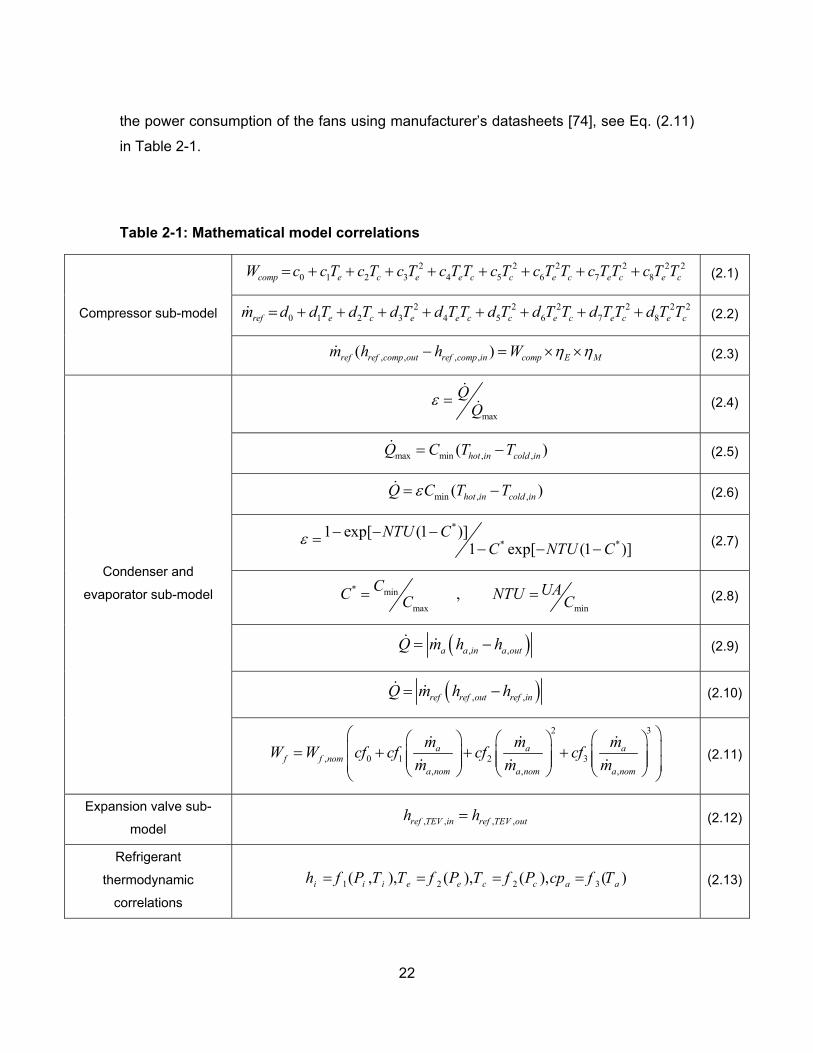
22
the power consumption of the fans using manufacturer’s datasheets [74], see Eq. (2.11)
in Table 2-1.
Table 2-1: Mathematical model correlations
Compressor sub-model
2 2 2 2 2 20 1 2 3 4 5 6 7 8comp e c e e c c e c e c e cW c c T c T c T c T T c T c T T c T T c T T (2.1)
2 2 2 2 2 20 1 2 3 4 5 6 7 8ref e c e e c c e c e c e cm d d T d T d T d T T d T d T T d T T d T T (2.2)
, , , ,( )ref ref comp out ref comp in comp E Mm h h W (2.3)
Condenser and
evaporator sub-model
max
(2.4)
max min , ,( )hot in cold inQ C T T (2.5)
min , ,( )hot in cold inQ C T T (2.6)
*
* *1 exp[ (1 )]
1 exp[ (1 )]NTU C
C NTU C
(2.7)
* min
max min,C UAC NTUC C (2.8)
, ,a a in a outQ m h h (2.9)
, ,ref ref out ref inQ m h h (2.10)
2 3
, 0 1 2 3, , ,
a a af f nom
a nom a nom a nom
m m mW W cf cf cf cf
m m m
(2.11)
Expansion valve sub-
model , , , ,ref TEV in ref TEV outh h (2.12)
Refrigerant
thermodynamic
correlations
1 2 2 3( , ), ( ), ( ), ( )i i i e e c c a ah f P T T f P T f P cp f T (2.13)
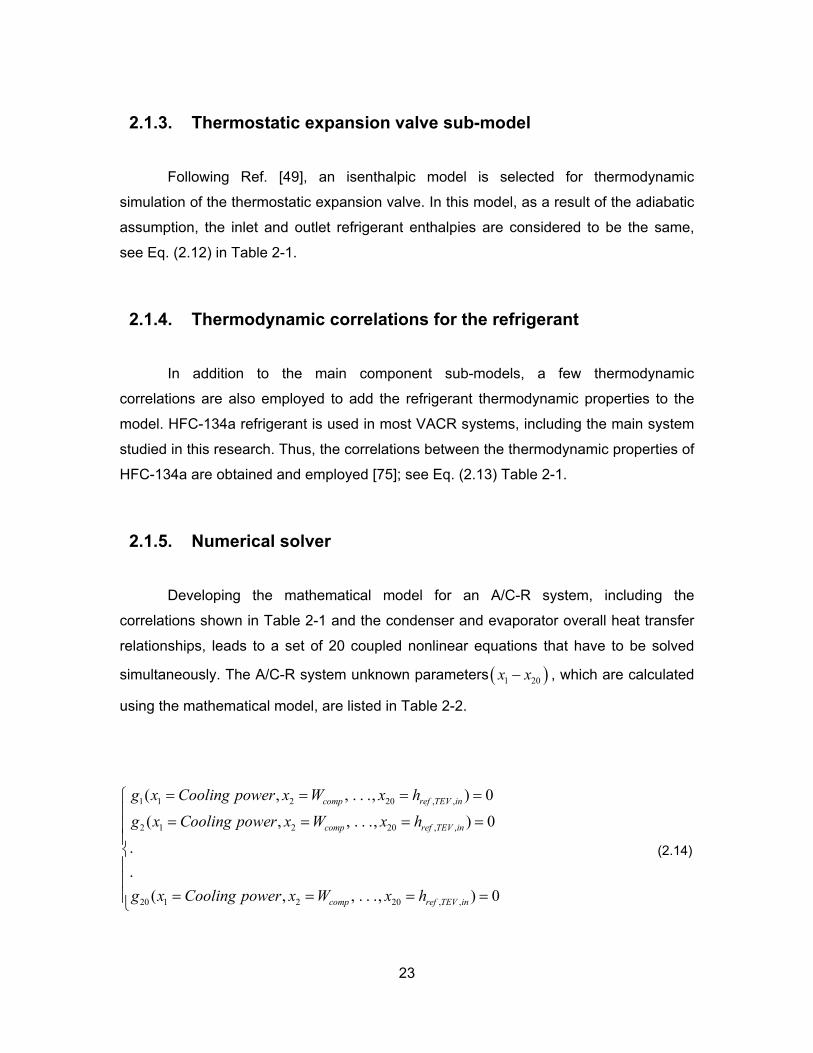
23
2.1.3. Thermostatic expansion valve sub-model
Following Ref. [49], an isenthalpic model is selected for thermodynamic
simulation of the thermostatic expansion valve. In this model, as a result of the adiabatic
assumption, the inlet and outlet refrigerant enthalpies are considered to be the same,
see Eq. (2.12) in Table 2-1.
2.1.4. Thermodynamic correlations for the refrigerant
In addition to the main component sub-models, a few thermodynamic
correlations are also employed to add the refrigerant thermodynamic properties to the
model. HFC-134a refrigerant is used in most VACR systems, including the main system
studied in this research. Thus, the correlations between the thermodynamic properties of
HFC-134a are obtained and employed [75]; see Eq. (2.13) Table 2-1.
2.1.5. Numerical solver
Developing the mathematical model for an A/C-R system, including the
correlations shown in Table 2-1 and the condenser and evaporator overall heat transfer
relationships, leads to a set of 20 coupled nonlinear equations that have to be solved
simultaneously. The A/C-R system unknown parameters 1 20x x , which are calculated
using the mathematical model, are listed in Table 2-2.
1 1 2 20 , ,
2 1 2 20 , ,
20 1 2 20 , ,
( , , . . ., ) 0
( , , . . ., ) 0
.
.
( , , . . ., ) 0
comp ref TEV in
comp ref TEV in
comp ref TEV in
g x Cooling power x W x h
g x Cooling power x W x h
g x Cooling power x W x h
(2.14)

24
1
1 11
1 20 11 1
120 2020 20 20
1 20
...( )
. . . .
. . . .
. . . .
( )...ni
nn ni
n n ni
x
g g
x x g xx x
g gx x g xx x
(2.15)
Table 2-2: Output parameters of the mathematical model
evapQ
(cooling
power)
compW
(compressor
power)
,f condW
(condenser fan
power)
,f evapW
(evaporator fan
power)
condQ
(heat rejection)
COP
(coefficient of
performance)
evapNTU
(number of
transfer units,
evap.)
condNTU
(number of
transfer units,
cond.)
evap
(effectiveness,
evap.)
cond
(effectiveness, cond.)
Tc
(condensing
temperature)
href,evap,in
(refrigerant
enthalpy @
evap. inlet)
refm
(refrigerant mass
flow rate)
Ta, evap, out
(air temperature
@ evap. outlet)
hg @ Te
(saturated gas
enthalpy @
evaporating
temperature)
href,comp,in
(refrigerant
enthalpy @
comp. inlet)
h ref,cond,in
(refrigerant
enthalpy @
cond. inlet)
hg @ Tc
(saturated gas
enthalpy @
condensing
temperature)
hf @ Tc
(saturated liquid
enthalpy @
condensing
temperature)
h ref,TEV,in
(refrigerant enthalpy
@ expansion valve
inlet)
25
A Newton-Raphson method is employed to develop an iterative numerical code
in C for solving the set of nonlinear correlations presented in Eq. (2.14) [76]. In this
method, the derivatives of all the equations are calculated with respect to all the
unknowns and a Jacobian matrix is formed. During an iterative solution procedure, all
the unknowns are calculated at iteration (n) and used for the next iteration (n+1), see Eq.
(2.15). The iterative procedure is repeated until the maximum relative residual for all the
unknown parameters becomes less than 0.001.
2.2. Quasi-Steady State Model Development
The A/C-R systems undergo a wide range of imposed operating conditions
during the duty cycle. Among all the variables described in the previous section, the
following impose the operational conditions on an existing A/C-R system:
o Evaporator inlet air enthalpy , dependent on both temperature and
humidity
o Condenser inlet air enthalpy , dependent on both temperature and
humidity
o Evaporator air flow rate , dependent on evaporator fan feed power
o Condenser air flow rate ,dependent on condenser fan feed power
o Compressor feed power (on-off or speed/capacity change command)
o Expansion valve orifice area
The rest of the parameters that appear in the described model equations will vary
as the system respond to the imposed conditions. Thus, the developed steady state
model is used to find the response of the system for any imposed operating conditions
and eventually obtain the performance of the system. In real-time, any A/C-R system
experiences a narrow or wide range of imposed operating conditions, depending upon
the application. The imposed operating conditions may change due to one or a
combination of the following reasons:
, ,a evap inh
, ,a cond inh
,fan evapW
,fan condW
26
o Ambient temperature/humidity variations
o Conditioned space cooling demand variations
o Controller commands (usually an on-off command from a thermostatic controller)
Ambient temperature and humidity continuously vary and affect the operation of
almost all components of A/C-R systems. The conditioned space cooling demand varies
due to peripheral heat transfer variations as well as indoor heat generation changes.
Cooling demand variations can happen gradually or suddenly depending upon the
application. For conditioned spaces with either a high rate of door/window
opening/closing or a repetitive loading/unloading of thermal mass, the variations in
cooling demand can be high; however, for most applications the variations are not
significant and do not suddenly affect the A/C-R system, due to the thermal mass of the
conditioned space. In addition to the variations in the ambient or conditioned space
temperatures and cooling demand, all A/C-R systems are equipped with a controller that
commands the components to turn on/off or change their capacity. Accordingly, the
controller command is another imposed parameter that affects the operational
characteristics of an A/C-R system. Due to the existence of such variations in the
operating condition of an A/C-R system, a transient model is required to simulate the
behavior of the system during unsteady conditions. Accordingly, in this research the
transient model is also developed.
In the quasi-steady state approach for modeling A/C-R systems, it is assumed
that at any instant the A/C-R system is at a quasi-equilibrium condition that can be
considered as a steady state condition [77,78]. By this assumption, the modeling of real-
time operation can be condensed into a time-marching steady state approach. Based on
this approach, modeling of the transient behavior of A/C-R systems is divided into two
steps: 1) quasi-steady state modeling, 2) fully transient modeling. The main advantage
of quasi-steady state modeling approach is its lower computational costs with acceptable
accuracy for most of the smooth transitions taking place in reality.
In the quasi-steady state modeling approach, if the rate of variations in the
imposed operating condition of an A/C-R system is small, the quasi-equilibrium
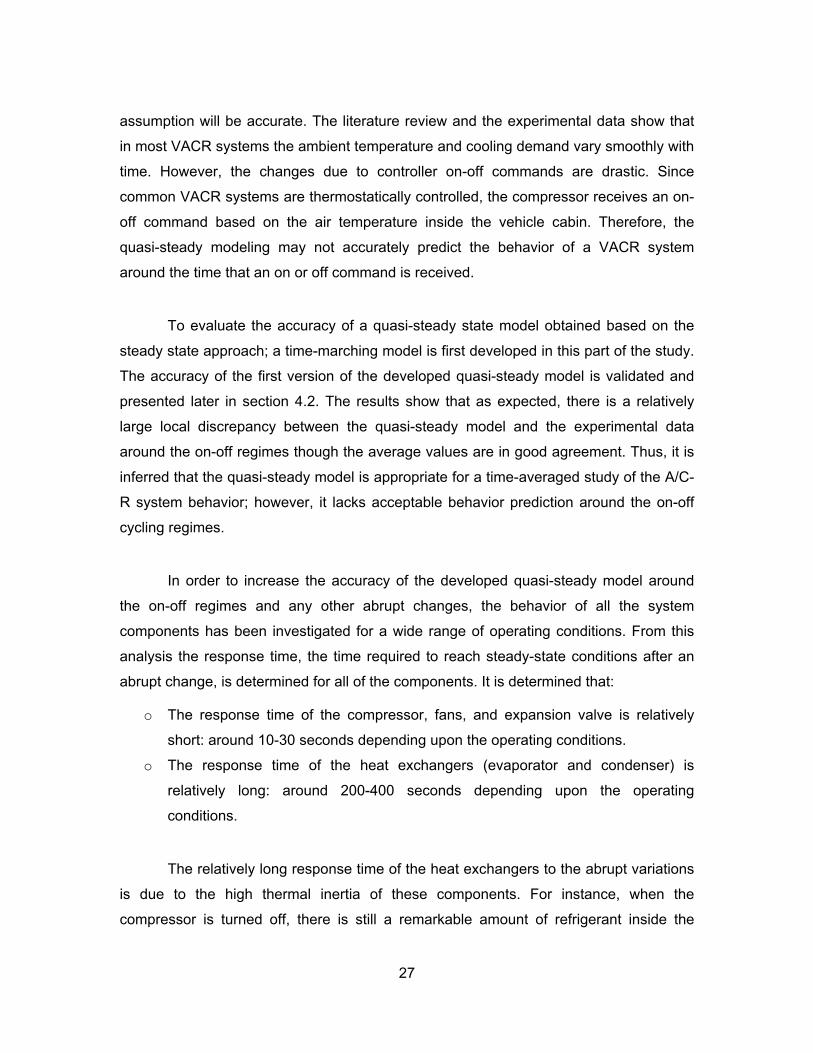
27
assumption will be accurate. The literature review and the experimental data show that
in most VACR systems the ambient temperature and cooling demand vary smoothly with
time. However, the changes due to controller on-off commands are drastic. Since
common VACR systems are thermostatically controlled, the compressor receives an on-
off command based on the air temperature inside the vehicle cabin. Therefore, the
quasi-steady modeling may not accurately predict the behavior of a VACR system
around the time that an on or off command is received.
To evaluate the accuracy of a quasi-steady state model obtained based on the
steady state approach; a time-marching model is first developed in this part of the study.
The accuracy of the first version of the developed quasi-steady model is validated and
presented later in section 4.2. The results show that as expected, there is a relatively
large local discrepancy between the quasi-steady model and the experimental data
around the on-off regimes though the average values are in good agreement. Thus, it is
inferred that the quasi-steady model is appropriate for a time-averaged study of the A/C-
R system behavior; however, it lacks acceptable behavior prediction around the on-off
cycling regimes.
In order to increase the accuracy of the developed quasi-steady model around
the on-off regimes and any other abrupt changes, the behavior of all the system
components has been investigated for a wide range of operating conditions. From this
analysis the response time, the time required to reach steady-state conditions after an
abrupt change, is determined for all of the components. It is determined that:
o The response time of the compressor, fans, and expansion valve is relatively
short: around 10-30 seconds depending upon the operating conditions.
o The response time of the heat exchangers (evaporator and condenser) is
relatively long: around 200-400 seconds depending upon the operating
conditions.
The relatively long response time of the heat exchangers to the abrupt variations
is due to the high thermal inertia of these components. For instance, when the
compressor is turned off, there is still a remarkable amount of refrigerant inside the
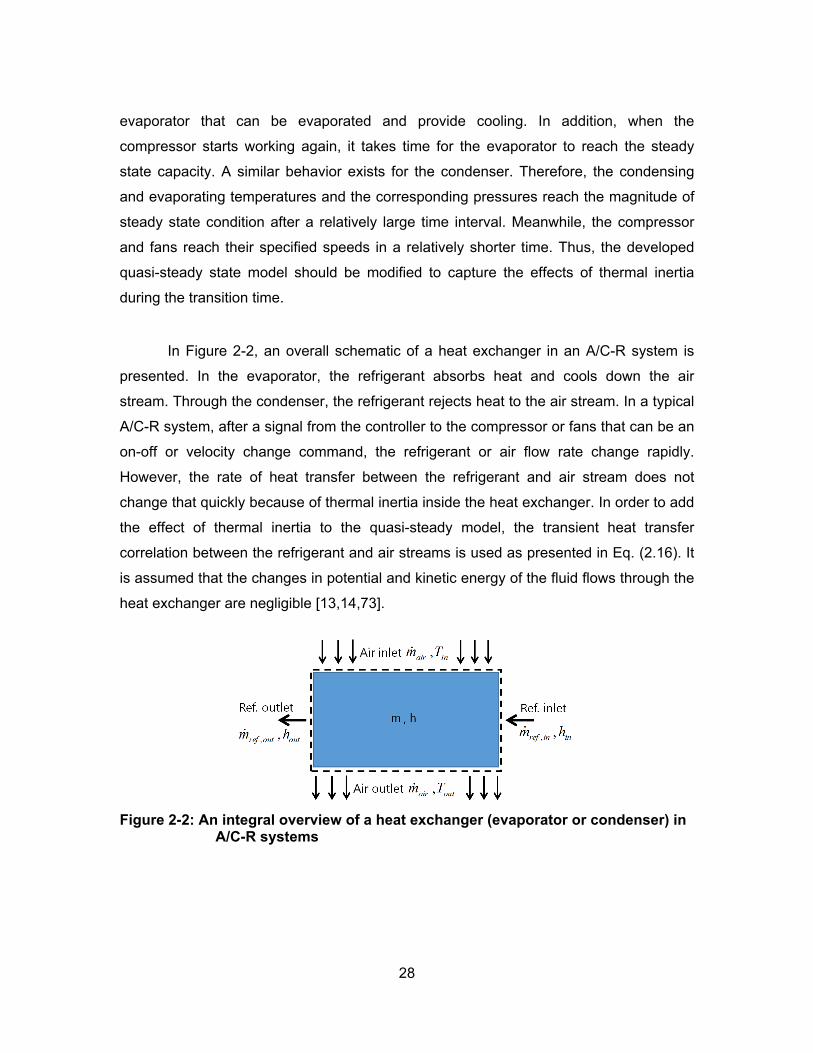
28
evaporator that can be evaporated and provide cooling. In addition, when the
compressor starts working again, it takes time for the evaporator to reach the steady
state capacity. A similar behavior exists for the condenser. Therefore, the condensing
and evaporating temperatures and the corresponding pressures reach the magnitude of
steady state condition after a relatively large time interval. Meanwhile, the compressor
and fans reach their specified speeds in a relatively shorter time. Thus, the developed
quasi-steady state model should be modified to capture the effects of thermal inertia
during the transition time.
In Figure 2-2, an overall schematic of a heat exchanger in an A/C-R system is
presented. In the evaporator, the refrigerant absorbs heat and cools down the air
stream. Through the condenser, the refrigerant rejects heat to the air stream. In a typical
A/C-R system, after a signal from the controller to the compressor or fans that can be an
on-off or velocity change command, the refrigerant or air flow rate change rapidly.
However, the rate of heat transfer between the refrigerant and air stream does not
change that quickly because of thermal inertia inside the heat exchanger. In order to add
the effect of thermal inertia to the quasi-steady model, the transient heat transfer
correlation between the refrigerant and air streams is used as presented in Eq. (2.16). It
is assumed that the changes in potential and kinetic energy of the fluid flows through the
heat exchanger are negligible [13,14,73].
Figure 2-2: An integral overview of a heat exchanger (evaporator or condenser) in A/C-R systems
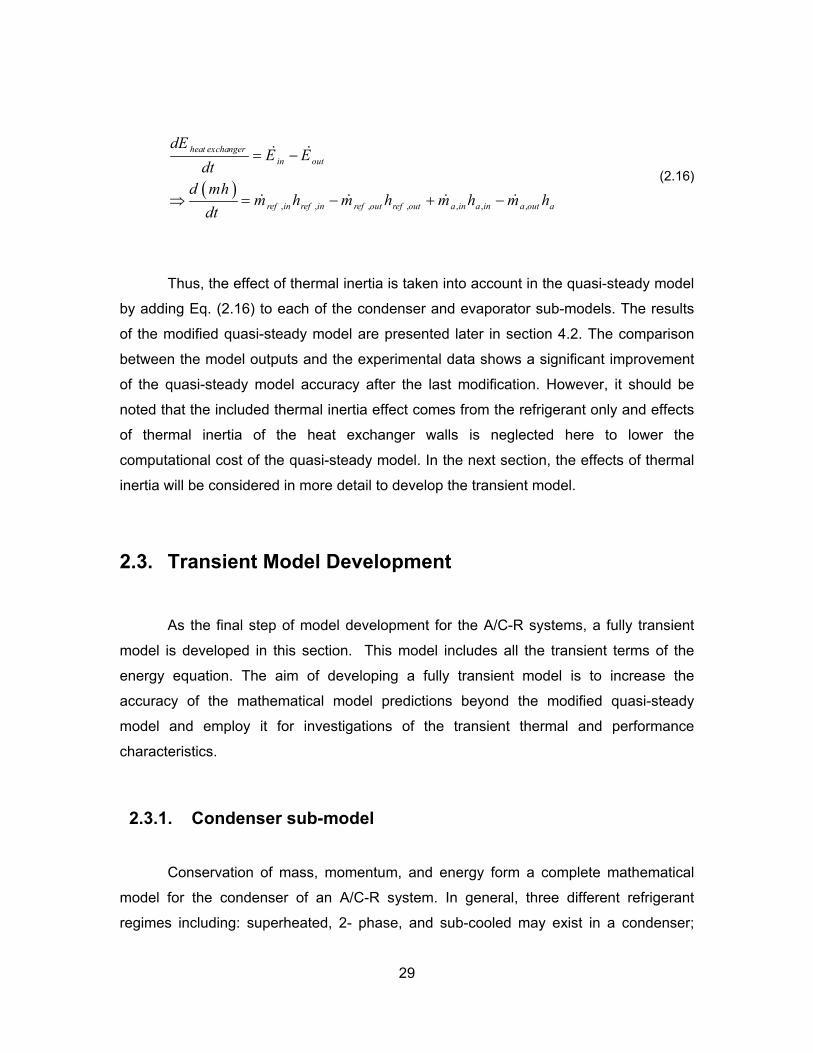
29
, , , , , , ,
heat exchangerin out
ref in ref in ref out ref out a in a in a out a
dEE E
dtd mh
m h m h m h m hdt
(2.16)
Thus, the effect of thermal inertia is taken into account in the quasi-steady model
by adding Eq. (2.16) to each of the condenser and evaporator sub-models. The results
of the modified quasi-steady model are presented later in section 4.2. The comparison
between the model outputs and the experimental data shows a significant improvement
of the quasi-steady model accuracy after the last modification. However, it should be
noted that the included thermal inertia effect comes from the refrigerant only and effects
of thermal inertia of the heat exchanger walls is neglected here to lower the
computational cost of the quasi-steady model. In the next section, the effects of thermal
inertia will be considered in more detail to develop the transient model.
2.3. Transient Model Development
As the final step of model development for the A/C-R systems, a fully transient
model is developed in this section. This model includes all the transient terms of the
energy equation. The aim of developing a fully transient model is to increase the
accuracy of the mathematical model predictions beyond the modified quasi-steady
model and employ it for investigations of the transient thermal and performance
characteristics.
2.3.1. Condenser sub-model
Conservation of mass, momentum, and energy form a complete mathematical
model for the condenser of an A/C-R system. In general, three different refrigerant
regimes including: superheated, 2- phase, and sub-cooled may exist in a condenser;
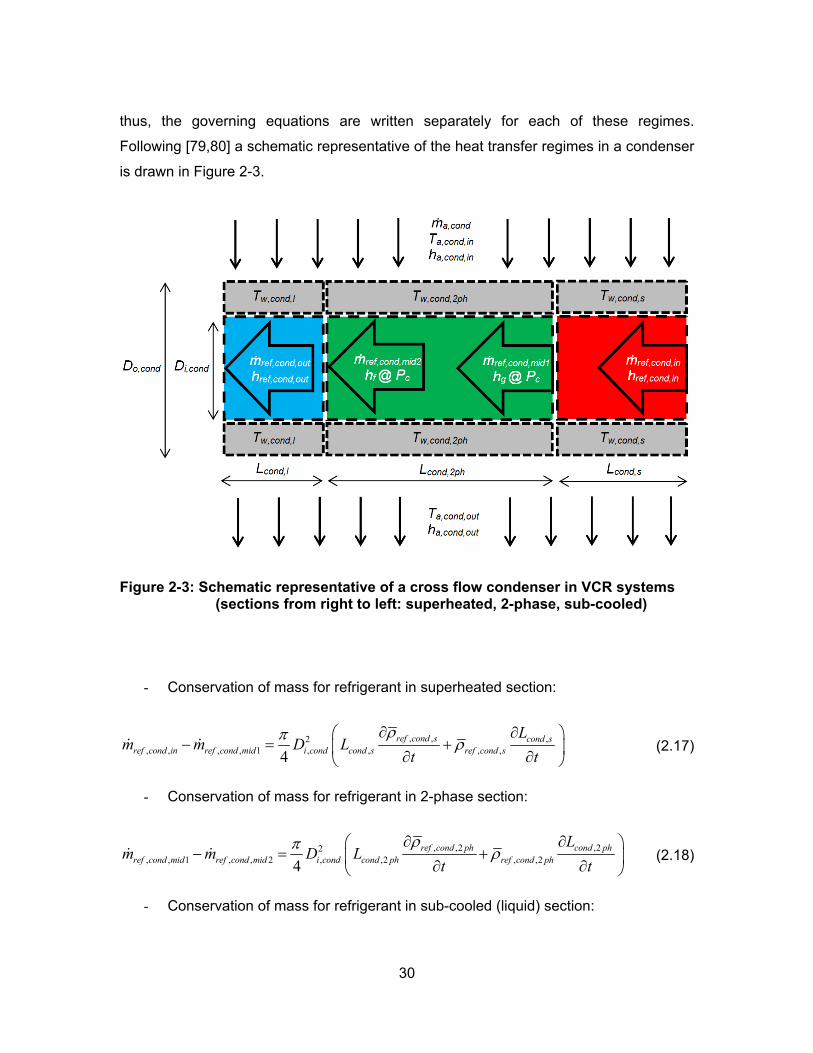
30
thus, the governing equations are written separately for each of these regimes.
Following [79,80] a schematic representative of the heat transfer regimes in a condenser
is drawn in Figure 2-3.
Figure 2-3: Schematic representative of a cross flow condenser in VCR systems (sections from right to left: superheated, 2-phase, sub-cooled)
- Conservation of mass for refrigerant in superheated section:
, , ,2, , , , 1 , , , ,4
ref cond s cond sref cond in ref cond mid i cond cond s ref cond s
Lm m D L
t t
(2.17)
- Conservation of mass for refrigerant in 2-phase section:
, ,2 ,22, , 1 , , 2 , ,2 , ,24
ref cond ph cond phref cond mid ref cond mid i cond cond ph ref cond ph
Lm m D L
t t
(2.18)
- Conservation of mass for refrigerant in sub-cooled (liquid) section:
31
, , ,2, , 2 , , , , , ,4
ref cond l cond lref cond mid ref cond out i cond cond l ref cond l
Lm m D L
t t
(2.19)
- Conservation of momentum for refrigerant (fully-developed flow):
, , , ,, , , ,
2 2, , , , , ,
2, ,
4 4
4
ref cond in ref cond outcondref cond in ref cond out
ref cond in i cond ref cond out i cond
i cond cond tot
mu m mm m
t D D
PD L Viscous losses
x
(2.20)
- Conservation of energy for refrigerant in superheated section:
, , 1 , , , , , , , ,, ,
2,
, , , ,,, , , , , , , , , ,
4
ref cond mid g i cond cond s ref cond s ref cond s w cond sref cond in
i cond
ref cond s ref cond scond scond s ref cond s ref cond s ref cond s ref cond s cond s
mh m h D L T T
D
hLL h h L
t t t
(2.21)
where, the convective heat transfer coefficient , ,ref cond s is calculable using Dittus-Boelter
correlation [73,81]:
, , , 0.8 0.4
, ,
0.023Re Prref cond s i cond
ref cond s
DNu
k
(2.22)
- Conservation of energy for refrigerant in 2-phase section:
, , 1 , , 2 , ,2 , ,2 , ,2
, ,2 ,22, ,2 , ,2
( )( )
4
ref cond mid g ref cond mid l i cond cond ph ref cond ph c w cond ph
ref cond ph cond phi cond cond ph ref cond ph
m h m h D L T T
h LD L h
t t
(2.23)
The following correlations also govern the 2-phase region [82]:
32
, ,2( ) (1 )ref cond ph g g l l condh h h (2.24)
2
3
1
11 g
l
XX
(2.25)
The convective heat transfer coefficient , ,2ref cond ph is calculated from Kandlikar
correlation [83,84]:
0.040.760.8,0.8 0.4
, ,2 , , 0.38,
3.8 10.023Re Pr 1l cond
ref cond ph l cond l condi cond c
cr
k X XX
D PP
(2.26)
- Conservation of energy for refrigerant in sub-cooled (liquid) section:
, , 2 , , , , , , , ,, ,
2,
, , , ,,, , , , , , , , , ,
4
ref cond mid l i cond cond l ref cond l ref cond l w cond lref cond out
i cond
ref cond l ref cond lcond lcond l ref cond l ref cond l ref cond l ref cond l cond l
m h mh D L T T
D
hLL h h L
t t t
(2.27)
- Conservation of energy for wall in superheated section:
, , , , , , , , , , , ,
, , ,
, , ,2 2, , , , ,4
i cond cond s ref cond s ref cond s w cond s a cond o cond cond s fin fin s
w cond s a cond
w cond s cond so cond i cond cond s w cond sw w
D L T T D L A
T T
T LD D L Cp Cp T
t t
(2.28)
- Conservation of energy for wall in 2-phase section:
33
, ,2 , ,2 , ,2 , , ,2 ,2
, ,2 ,
, ,2 ,22 2, , ,2 , ,24
i cond cond ph ref cond ph c w cond ph a cond o cond cond ph fin fin ph
w cond ph a cond
w cond ph cond pho cond i cond cond ph w cond phw w
D L T T D L A
T T
T LD D L Cp Cp T
t t
(2.29)
- Conservation of energy for wall in sub-cooled (liquid) section:
, , , , , , , , , , , ,
, , ,
, , ,2 2, , , , ,4
i cond cond l ref cond l ref cond l w cond l a cond o cond cond l fin fin l
w cond l a cond
w cond l cond lo cond i cond cond l w cond lw w
D L T T D L A
T T
T LD D L Cp Cp T
t t
(2.30)
- Conservation of energy for air:
, , , , , , , , , ,a cond a cond in a cond out a cond o cond cond tot fin fin a cond w condm h h D L A T T (2.31)
where:
, , , , ,2 ,2 , , ,,
,
w cond s cond s w cond ph cond ph w cond l cond lw cond
cond tot
T L T L T LT
L
(2.32)
2.3.2. Evaporator sub-model
Similar to condenser, writing the conservation of mass, momentum, and energy
forms a complete model for evaporator in an A/C-R system. It should be noted that there
are only two sections in an evaporator: 1) 2-phase, and 2) superheated.
34
2.3.3. Compressor sub-model
For a compressor in A/C-R systems, the refrigerant mass flow rate can be
obtained from the following correlation [85]:
, , ,ref comp ref comp in vm NV (2.33)
where, volumetric efficiency v is a function of evaporating and condensing pressures.
Also, the power input to compressor can be calculated using the following equation:
, , , , ,ref comp ref comp out ref comp in
compE M
m h hW
(2.34)
2.3.4. Expansion valve
Assuming an isenthalpic process, the following correlations can be used for
modelling the expansion valve behavior [81]:
, , ,ref TEV d ref TEV in c em C A P P (2.35)
, , , ,ref TEV in ref TEV outh h (2.36)
2.3.5. Unknowns of the model
All the time-gradient terms appearing in the equations are discretized using the
finite difference approach. For an arbitrary variable A:
1n nA AA
t t
(2.37)
Accordingly, the transient solution is commenced with an initial condition @ 0n and
marches through time by solving all the equations at each time step. The model can be
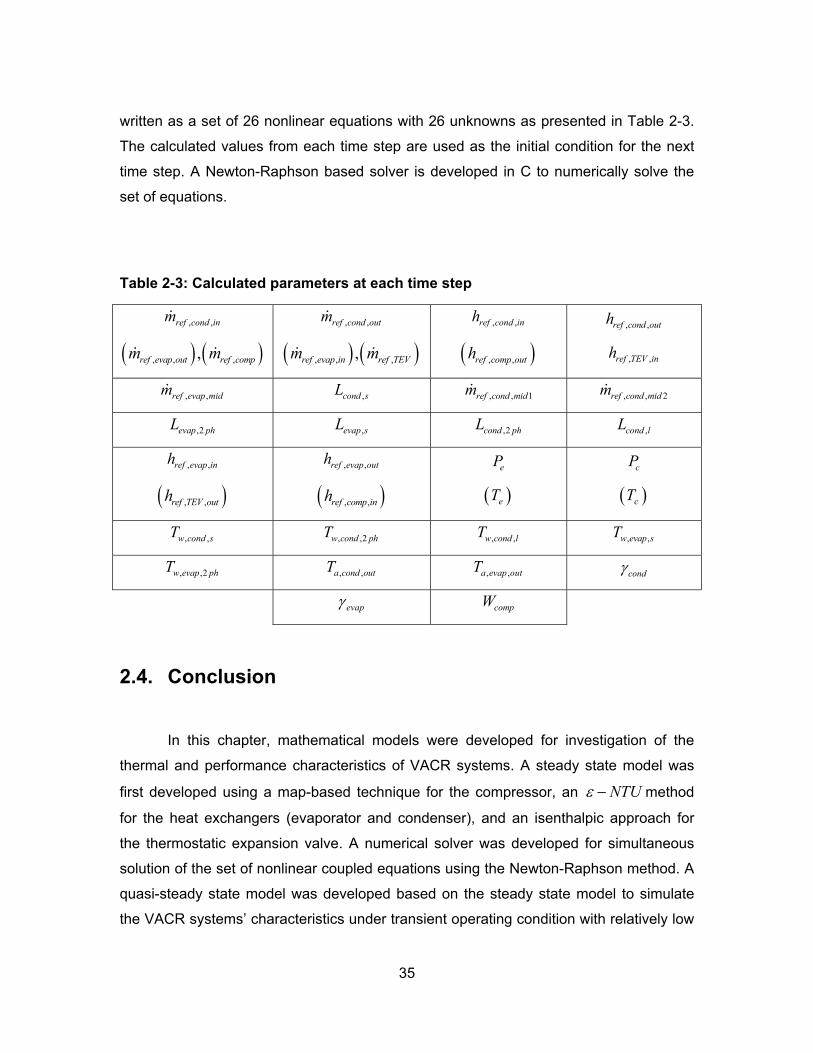
35
written as a set of 26 nonlinear equations with 26 unknowns as presented in Table 2-3.
The calculated values from each time step are used as the initial condition for the next
time step. A Newton-Raphson based solver is developed in C to numerically solve the
set of equations.
Table 2-3: Calculated parameters at each time step
, ,ref cond inm
, , ,,ref evap out ref compm m
, ,ref cond outm
, , ,,ref evap in ref TEVm m
, ,ref cond inh
, ,ref comp outh
, ,ref cond outh
, ,ref TEV inh
, ,ref evap midm ,cond sL , , 1ref cond midm , , 2ref cond midm
,2evap phL ,evap sL ,2cond phL ,cond lL
, ,ref evap inh
, ,ref TEV outh
, ,ref evap outh
, ,ref comp inh
eP
eT
cP
cT
, ,w cond sT , ,2w cond phT , ,w cond lT , ,w evap sT
, ,2w evap phT , ,a cond outT , ,a evap outT cond
evap compW
2.4. Conclusion
In this chapter, mathematical models were developed for investigation of the
thermal and performance characteristics of VACR systems. A steady state model was
first developed using a map-based technique for the compressor, an NTU method
for the heat exchangers (evaporator and condenser), and an isenthalpic approach for
the thermostatic expansion valve. A numerical solver was developed for simultaneous
solution of the set of nonlinear coupled equations using the Newton-Raphson method. A
quasi-steady state model was developed based on the steady state model to simulate
the VACR systems’ characteristics under transient operating condition with relatively low

36
computational costs. Finally, a transient model was developed to investigate the
dynamic behavior of VACR systems under realistic variable conditions. The transient
model was derived employing the laws of mass, momentum, and energy conservation,
resulting in a set of 26 nonlinear equations that need to be solved numerically to find the
26 unknowns of the VACR system. Model validation is described in Chapter 4.
37
Chapter 3. Experimental Study and Data Acquisition
Obtaining real-time data to verify the accuracy of the mathematical models in a
wide range of operating condition requires an experimental study. Moreover, an
experimental setup should be prepared to implement and test the performance of the
developed proactive controller. For these reasons a testbed is built in the Laboratory for
Alternative Energy Conversion (LAEC) at Simon Fraser University. Furthermore, real-
time field data is collected from stationary and mobile A/C-R units to obtain realistic duty
cycles. Additionally, a new high efficiency and variable capacity VACR system is built
using high efficiency components from well-known manufacturers. In this chapter, first
the development of testbed and then the specifications of high efficiency VACR system
are presented. Thereafter, the field data acquisition from typical stationary A/C-R as well
as VACR units is discussed.
3.1. Testbed Design and Construction
A new testbed was designed and built in LAEC to simulate the real-time
operating condition of a typical VACR system. The employed VACR system in this
testbed is a battery-powered anti-idling system widely installed on trucks and vans.
Figure 3-1 shows a sample of this battery-powered anti-idling VACR installed on the
sleeper berth of a long-haul truck to avoid idling of the truck engine for air conditioning
purposes while the truck is not moving.
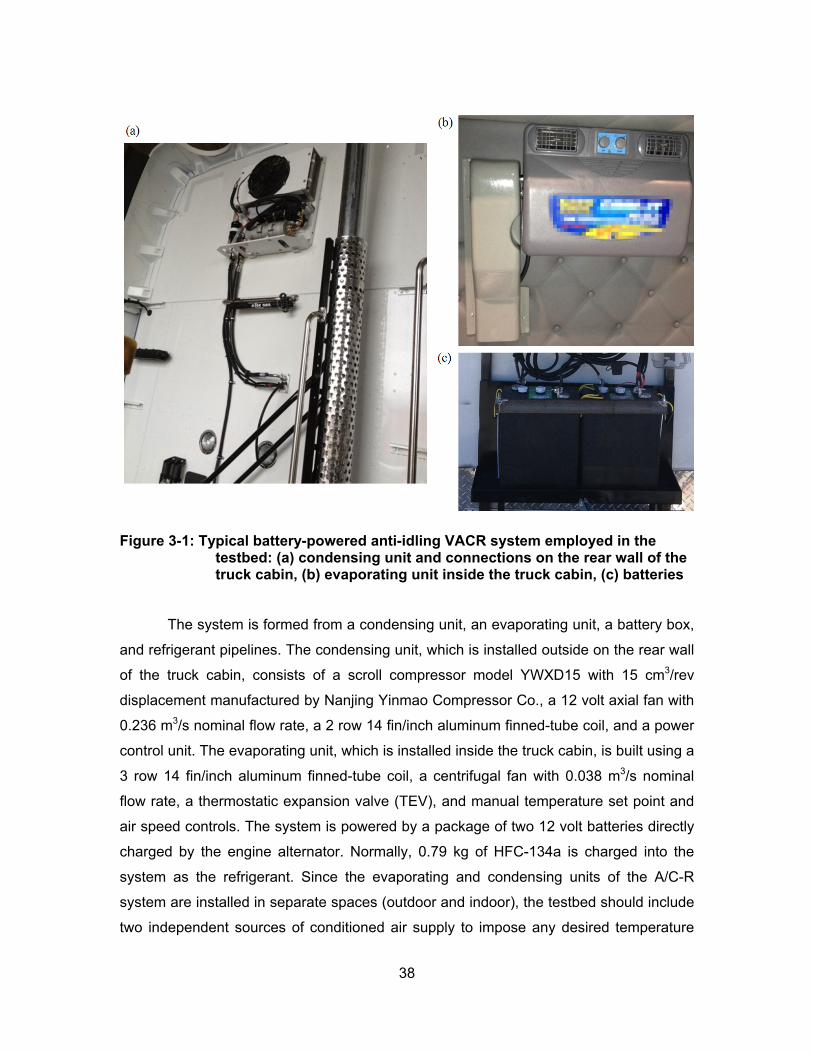
38
Figure 3-1: Typical battery-powered anti-idling VACR system employed in the testbed: (a) condensing unit and connections on the rear wall of the truck cabin, (b) evaporating unit inside the truck cabin, (c) batteries
The system is formed from a condensing unit, an evaporating unit, a battery box,
and refrigerant pipelines. The condensing unit, which is installed outside on the rear wall
of the truck cabin, consists of a scroll compressor model YWXD15 with 15 cm3/rev
displacement manufactured by Nanjing Yinmao Compressor Co., a 12 volt axial fan with
0.236 m3/s nominal flow rate, a 2 row 14 fin/inch aluminum finned-tube coil, and a power
control unit. The evaporating unit, which is installed inside the truck cabin, is built using a
3 row 14 fin/inch aluminum finned-tube coil, a centrifugal fan with 0.038 m3/s nominal
flow rate, a thermostatic expansion valve (TEV), and manual temperature set point and
air speed controls. The system is powered by a package of two 12 volt batteries directly
charged by the engine alternator. Normally, 0.79 kg of HFC-134a is charged into the
system as the refrigerant. Since the evaporating and condensing units of the A/C-R
system are installed in separate spaces (outdoor and indoor), the testbed should include
two independent sources of conditioned air supply to impose any desired temperature
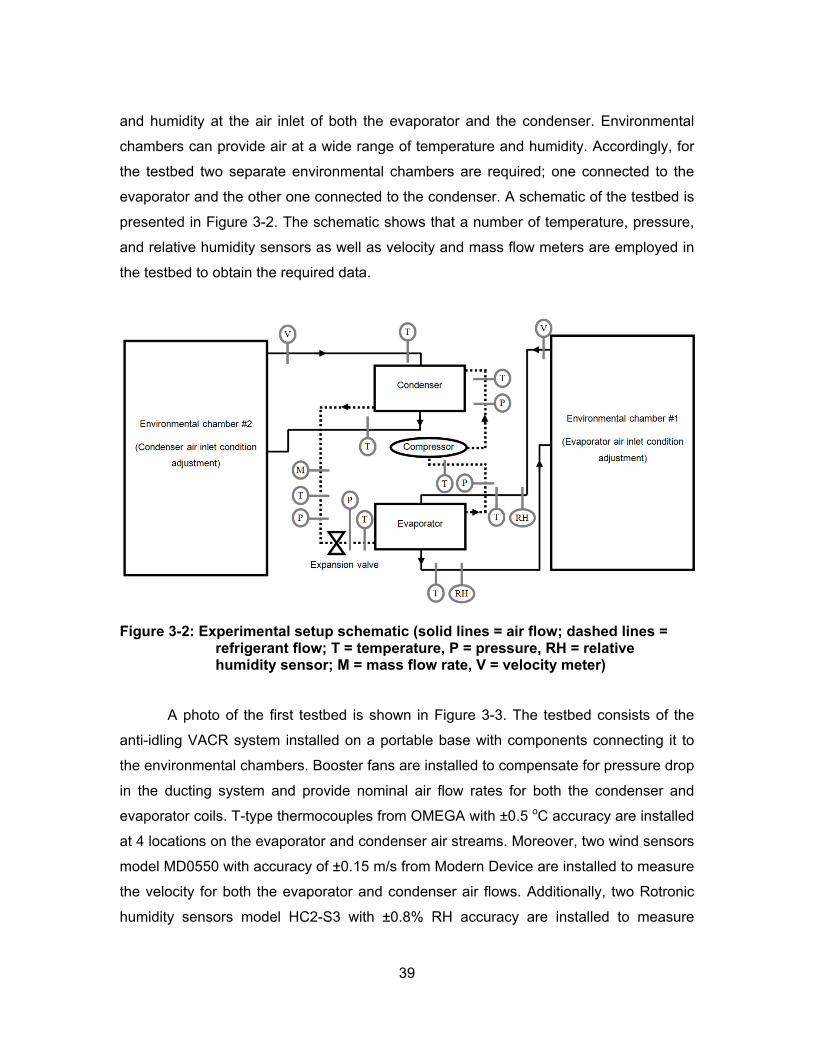
39
and humidity at the air inlet of both the evaporator and the condenser. Environmental
chambers can provide air at a wide range of temperature and humidity. Accordingly, for
the testbed two separate environmental chambers are required; one connected to the
evaporator and the other one connected to the condenser. A schematic of the testbed is
presented in Figure 3-2. The schematic shows that a number of temperature, pressure,
and relative humidity sensors as well as velocity and mass flow meters are employed in
the testbed to obtain the required data.
Figure 3-2: Experimental setup schematic (solid lines = air flow; dashed lines = refrigerant flow; T = temperature, P = pressure, RH = relative humidity sensor; M = mass flow rate, V = velocity meter)
A photo of the first testbed is shown in Figure 3-3. The testbed consists of the
anti-idling VACR system installed on a portable base with components connecting it to
the environmental chambers. Booster fans are installed to compensate for pressure drop
in the ducting system and provide nominal air flow rates for both the condenser and
evaporator coils. T-type thermocouples from OMEGA with ±0.5 oC accuracy are installed
at 4 locations on the evaporator and condenser air streams. Moreover, two wind sensors
model MD0550 with accuracy of ±0.15 m/s from Modern Device are installed to measure
the velocity for both the evaporator and condenser air flows. Additionally, two Rotronic
humidity sensors model HC2-S3 with ±0.8% RH accuracy are installed to measure
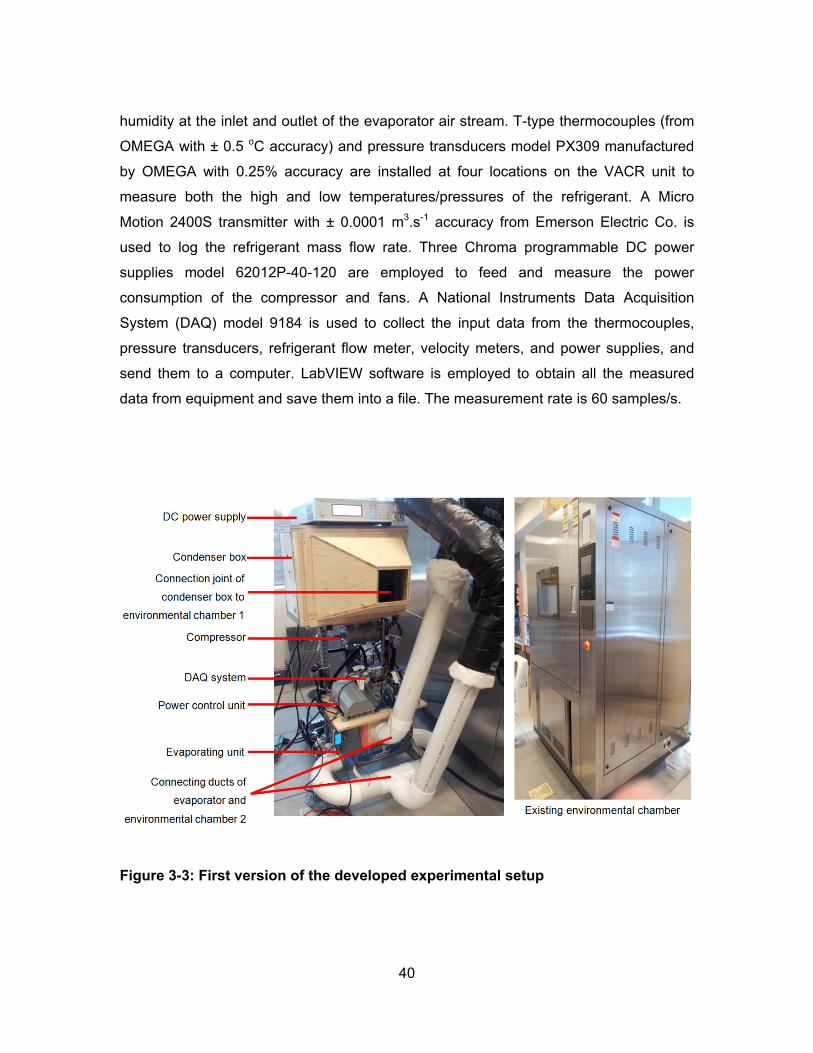
40
humidity at the inlet and outlet of the evaporator air stream. T-type thermocouples (from
OMEGA with ± 0.5 oC accuracy) and pressure transducers model PX309 manufactured
by OMEGA with 0.25% accuracy are installed at four locations on the VACR unit to
measure both the high and low temperatures/pressures of the refrigerant. A Micro
Motion 2400S transmitter with ± 0.0001 m3.s-1 accuracy from Emerson Electric Co. is
used to log the refrigerant mass flow rate. Three Chroma programmable DC power
supplies model 62012P-40-120 are employed to feed and measure the power
consumption of the compressor and fans. A National Instruments Data Acquisition
System (DAQ) model 9184 is used to collect the input data from the thermocouples,
pressure transducers, refrigerant flow meter, velocity meters, and power supplies, and
send them to a computer. LabVIEW software is employed to obtain all the measured
data from equipment and save them into a file. The measurement rate is 60 samples/s.
Figure 3-3: First version of the developed experimental setup
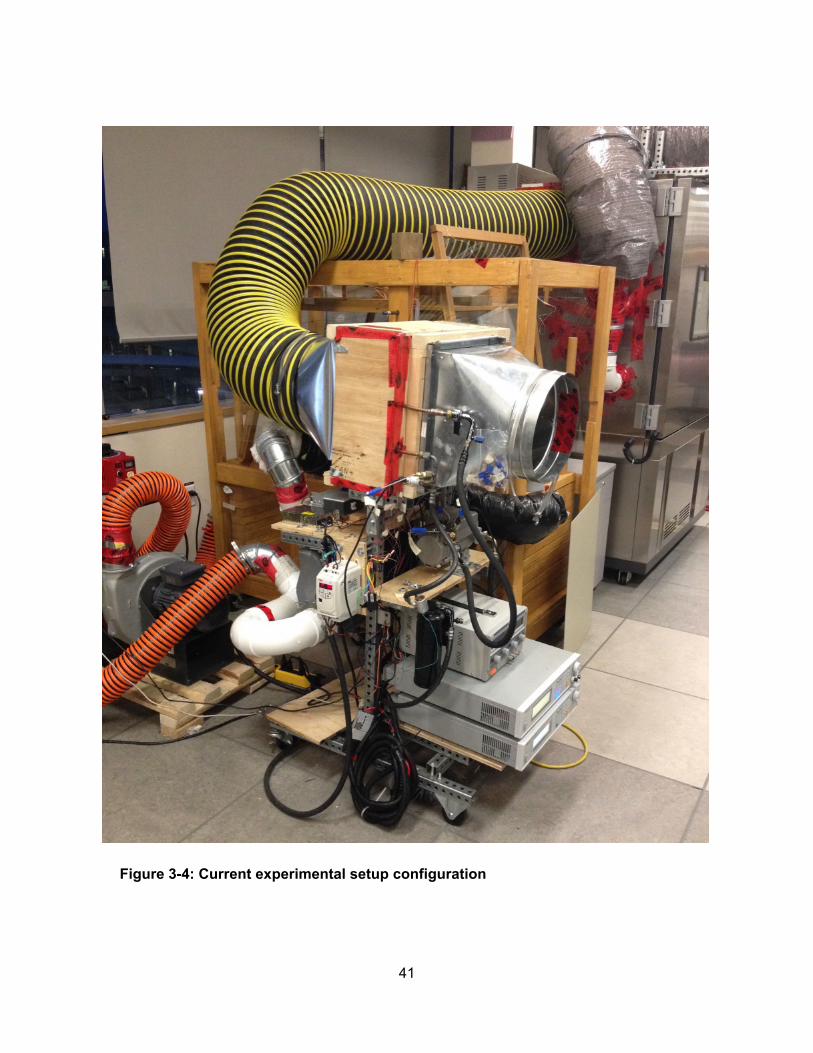
41
Figure 3-4: Current experimental setup configuration
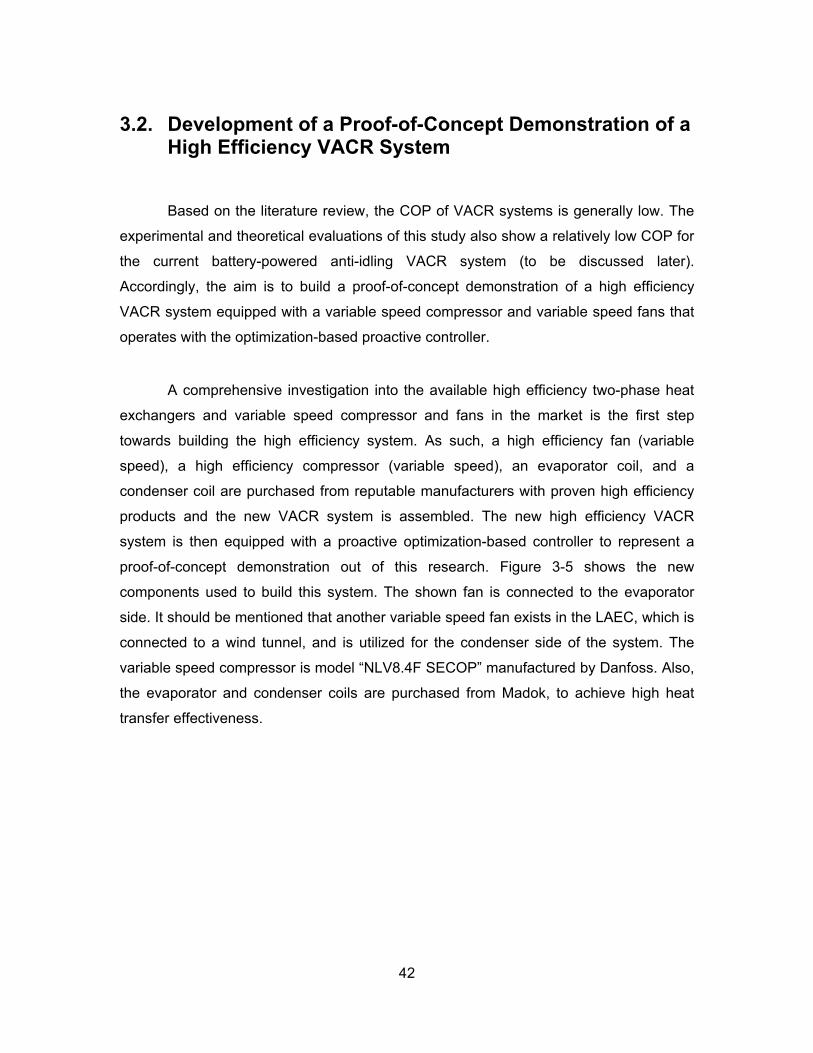
42
3.2. Development of a Proof-of-Concept Demonstration of a High Efficiency VACR System
Based on the literature review, the COP of VACR systems is generally low. The
experimental and theoretical evaluations of this study also show a relatively low COP for
the current battery-powered anti-idling VACR system (to be discussed later).
Accordingly, the aim is to build a proof-of-concept demonstration of a high efficiency
VACR system equipped with a variable speed compressor and variable speed fans that
operates with the optimization-based proactive controller.
A comprehensive investigation into the available high efficiency two-phase heat
exchangers and variable speed compressor and fans in the market is the first step
towards building the high efficiency system. As such, a high efficiency fan (variable
speed), a high efficiency compressor (variable speed), an evaporator coil, and a
condenser coil are purchased from reputable manufacturers with proven high efficiency
products and the new VACR system is assembled. The new high efficiency VACR
system is then equipped with a proactive optimization-based controller to represent a
proof-of-concept demonstration out of this research. Figure 3-5 shows the new
components used to build this system. The shown fan is connected to the evaporator
side. It should be mentioned that another variable speed fan exists in the LAEC, which is
connected to a wind tunnel, and is utilized for the condenser side of the system. The
variable speed compressor is model “NLV8.4F SECOP” manufactured by Danfoss. Also,
the evaporator and condenser coils are purchased from Madok, to achieve high heat
transfer effectiveness.
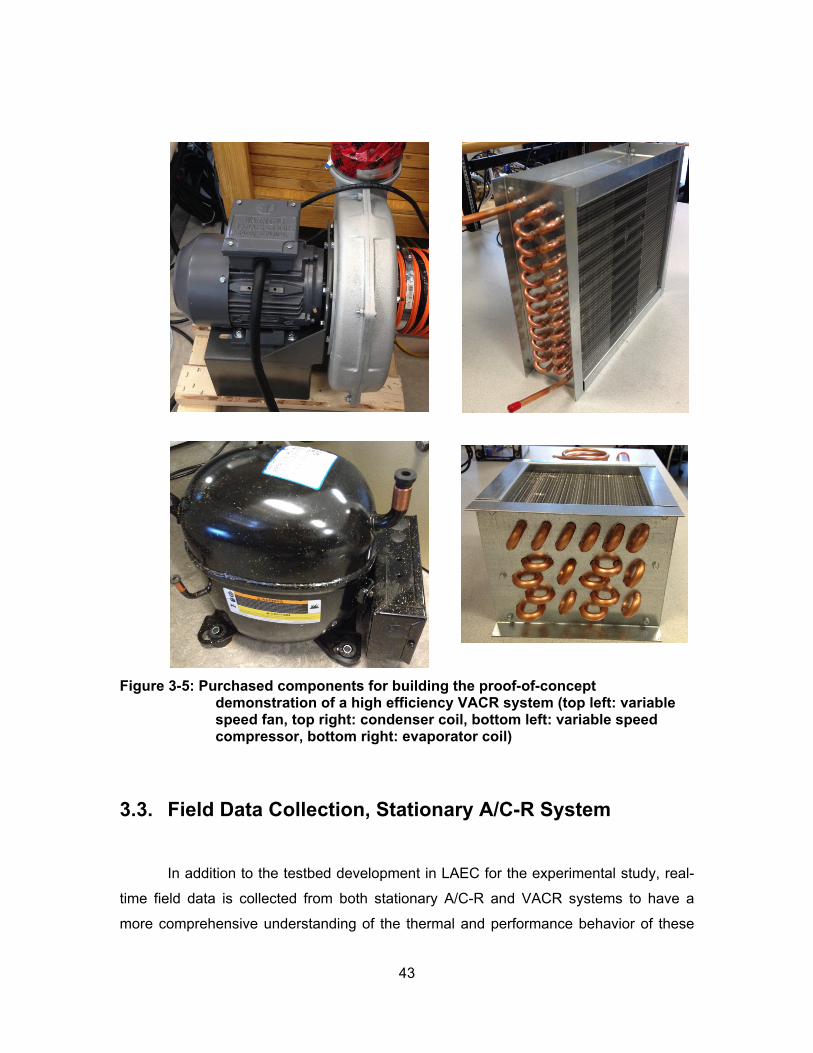
43
Figure 3-5: Purchased components for building the proof-of-concept demonstration of a high efficiency VACR system (top left: variable speed fan, top right: condenser coil, bottom left: variable speed compressor, bottom right: evaporator coil)
3.3. Field Data Collection, Stationary A/C-R System
In addition to the testbed development in LAEC for the experimental study, real-
time field data is collected from both stationary A/C-R and VACR systems to have a
more comprehensive understanding of the thermal and performance behavior of these
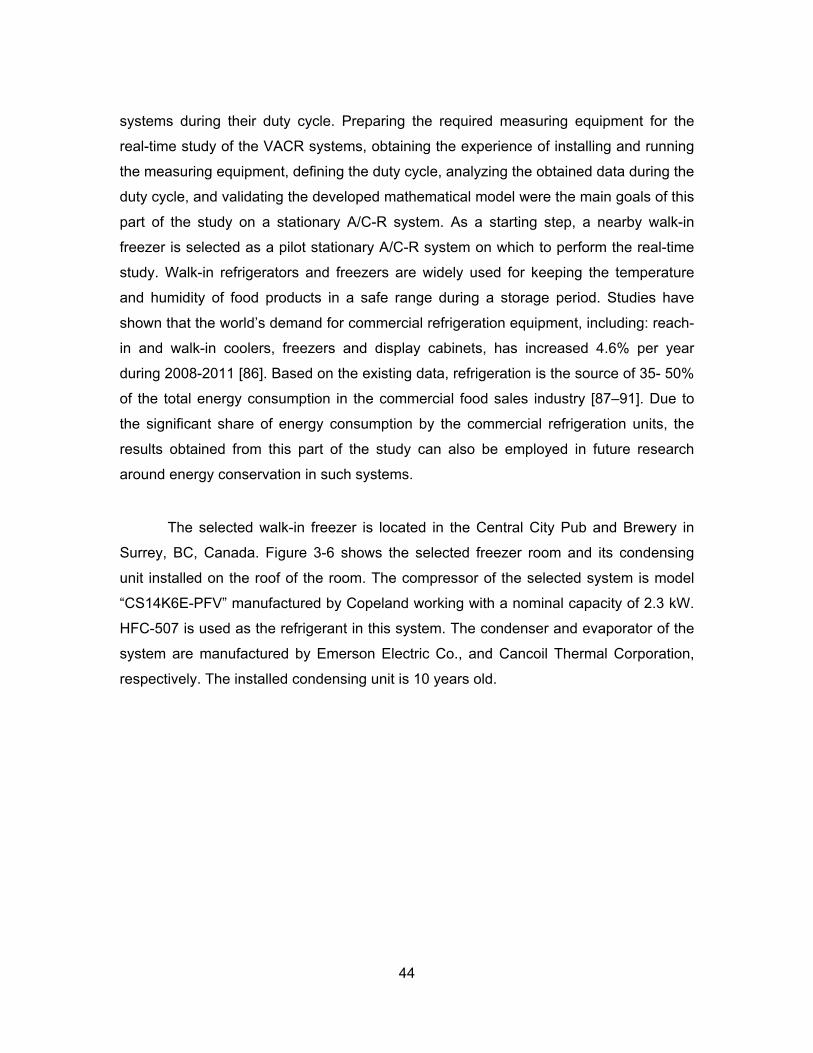
44
systems during their duty cycle. Preparing the required measuring equipment for the
real-time study of the VACR systems, obtaining the experience of installing and running
the measuring equipment, defining the duty cycle, analyzing the obtained data during the
duty cycle, and validating the developed mathematical model were the main goals of this
part of the study on a stationary A/C-R system. As a starting step, a nearby walk-in
freezer is selected as a pilot stationary A/C-R system on which to perform the real-time
study. Walk-in refrigerators and freezers are widely used for keeping the temperature
and humidity of food products in a safe range during a storage period. Studies have
shown that the world’s demand for commercial refrigeration equipment, including: reach-
in and walk-in coolers, freezers and display cabinets, has increased 4.6% per year
during 2008-2011 [86]. Based on the existing data, refrigeration is the source of 35- 50%
of the total energy consumption in the commercial food sales industry [87–91]. Due to
the significant share of energy consumption by the commercial refrigeration units, the
results obtained from this part of the study can also be employed in future research
around energy conservation in such systems.
The selected walk-in freezer is located in the Central City Pub and Brewery in
Surrey, BC, Canada. Figure 3-6 shows the selected freezer room and its condensing
unit installed on the roof of the room. The compressor of the selected system is model
“CS14K6E-PFV” manufactured by Copeland working with a nominal capacity of 2.3 kW.
HFC-507 is used as the refrigerant in this system. The condenser and evaporator of the
system are manufactured by Emerson Electric Co., and Cancoil Thermal Corporation,
respectively. The installed condensing unit is 10 years old.
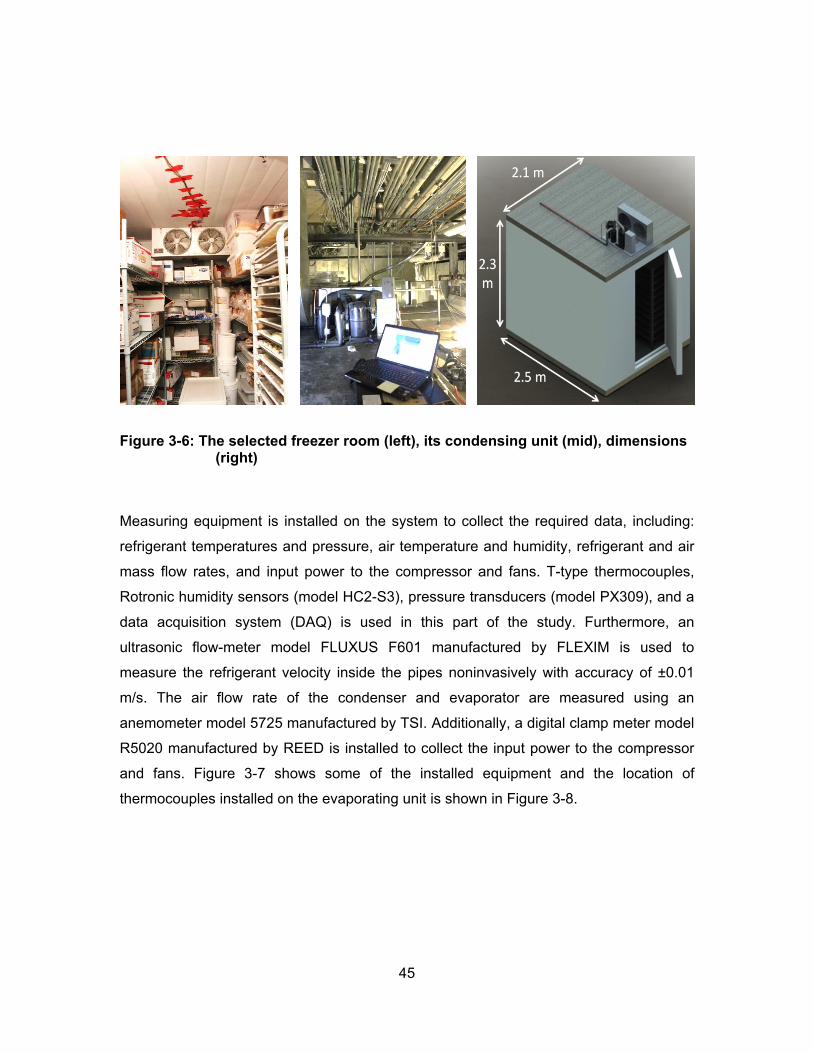
45
Figure 3-6: The selected freezer room (left), its condensing unit (mid), dimensions (right)
Measuring equipment is installed on the system to collect the required data, including:
refrigerant temperatures and pressure, air temperature and humidity, refrigerant and air
mass flow rates, and input power to the compressor and fans. T-type thermocouples,
Rotronic humidity sensors (model HC2-S3), pressure transducers (model PX309), and a
data acquisition system (DAQ) is used in this part of the study. Furthermore, an
ultrasonic flow-meter model FLUXUS F601 manufactured by FLEXIM is used to
measure the refrigerant velocity inside the pipes noninvasively with accuracy of ±0.01
m/s. The air flow rate of the condenser and evaporator are measured using an
anemometer model 5725 manufactured by TSI. Additionally, a digital clamp meter model
R5020 manufactured by REED is installed to collect the input power to the compressor
and fans. Figure 3-7 shows some of the installed equipment and the location of
thermocouples installed on the evaporating unit is shown in Figure 3-8.
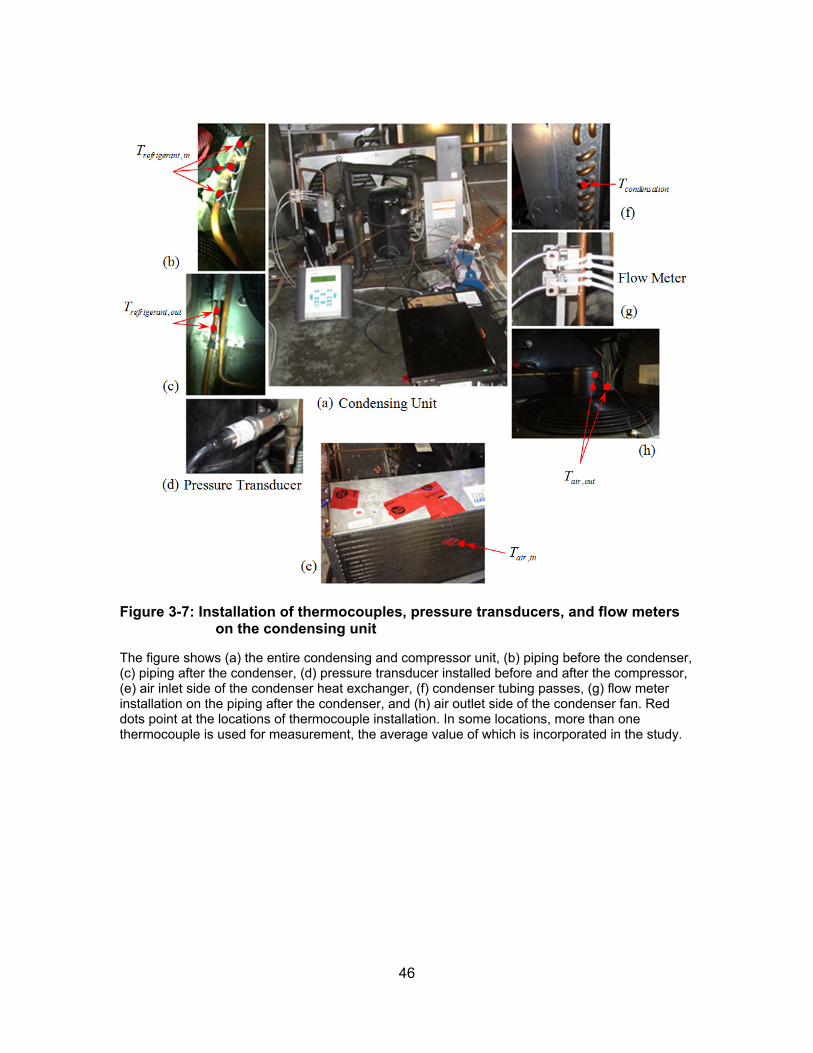
46
Figure 3-7: Installation of thermocouples, pressure transducers, and flow meters on the condensing unit
The figure shows (a) the entire condensing and compressor unit, (b) piping before the condenser, (c) piping after the condenser, (d) pressure transducer installed before and after the compressor, (e) air inlet side of the condenser heat exchanger, (f) condenser tubing passes, (g) flow meter installation on the piping after the condenser, and (h) air outlet side of the condenser fan. Red dots point at the locations of thermocouple installation. In some locations, more than one thermocouple is used for measurement, the average value of which is incorporated in the study.
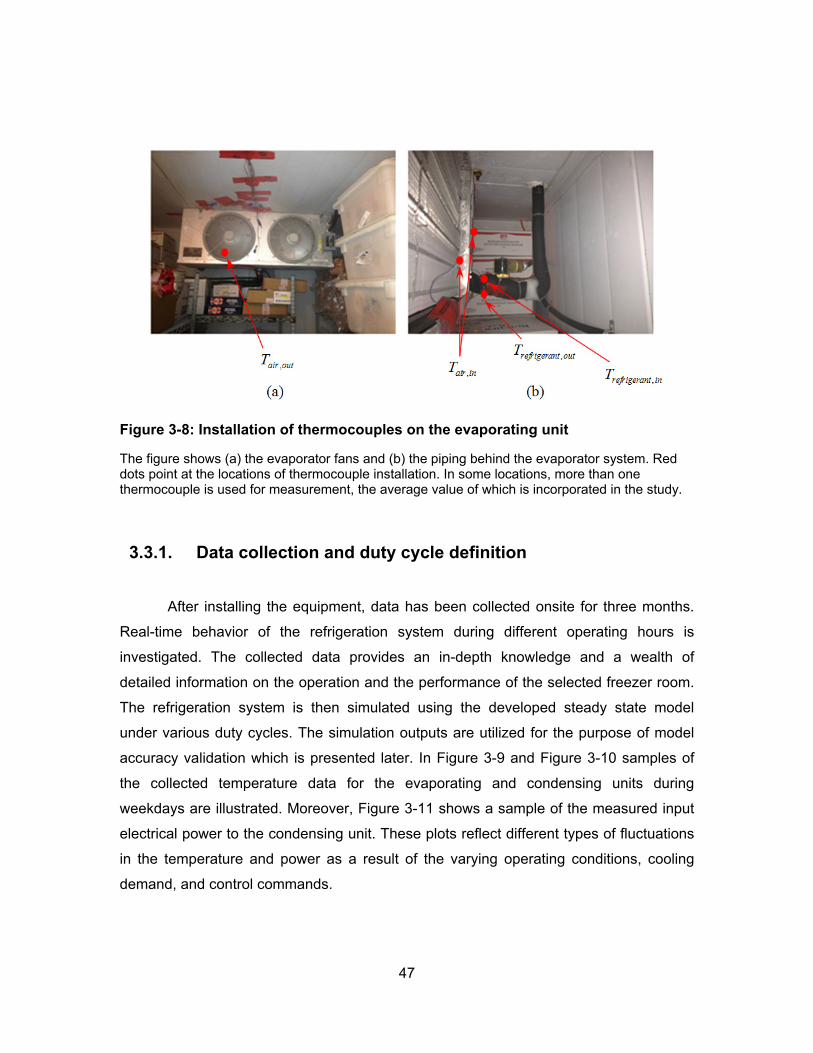
47
Figure 3-8: Installation of thermocouples on the evaporating unit
The figure shows (a) the evaporator fans and (b) the piping behind the evaporator system. Red dots point at the locations of thermocouple installation. In some locations, more than one thermocouple is used for measurement, the average value of which is incorporated in the study.
3.3.1. Data collection and duty cycle definition
After installing the equipment, data has been collected onsite for three months.
Real-time behavior of the refrigeration system during different operating hours is
investigated. The collected data provides an in-depth knowledge and a wealth of
detailed information on the operation and the performance of the selected freezer room.
The refrigeration system is then simulated using the developed steady state model
under various duty cycles. The simulation outputs are utilized for the purpose of model
accuracy validation which is presented later. In Figure 3-9 and Figure 3-10 samples of
the collected temperature data for the evaporating and condensing units during
weekdays are illustrated. Moreover, Figure 3-11 shows a sample of the measured input
electrical power to the condensing unit. These plots reflect different types of fluctuations
in the temperature and power as a result of the varying operating conditions, cooling
demand, and control commands.
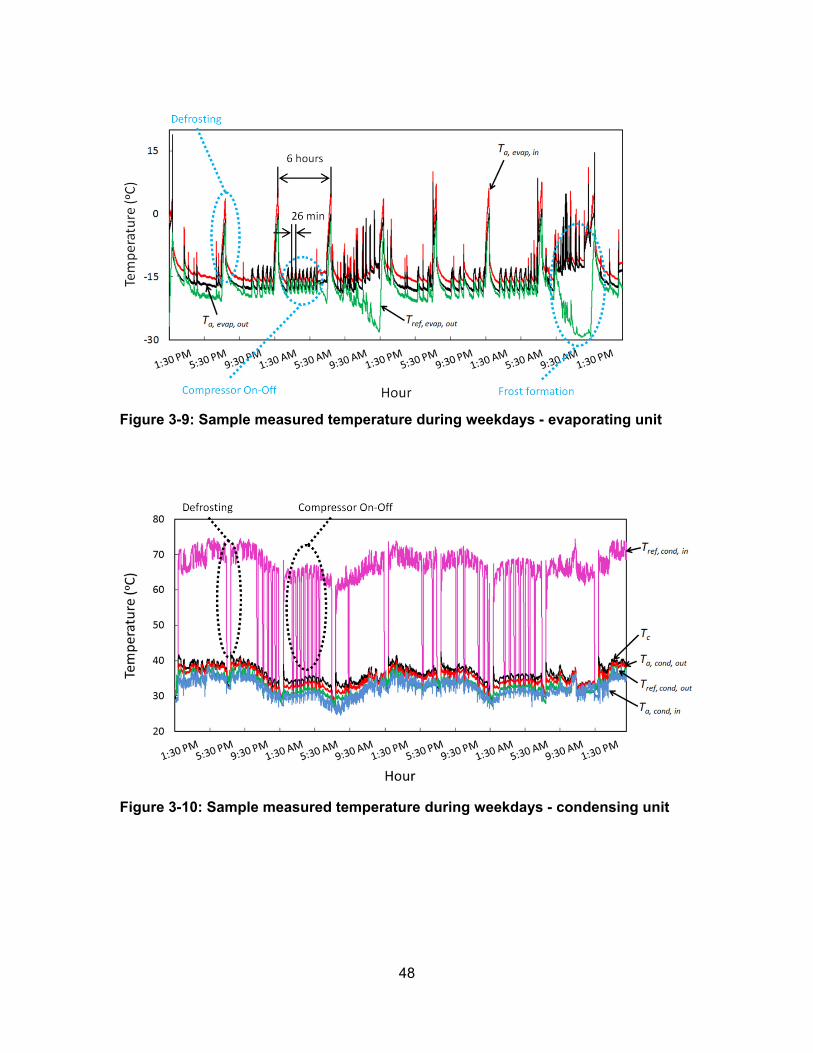
48
Figure 3-9: Sample measured temperature during weekdays - evaporating unit
Figure 3-10: Sample measured temperature during weekdays - condensing unit
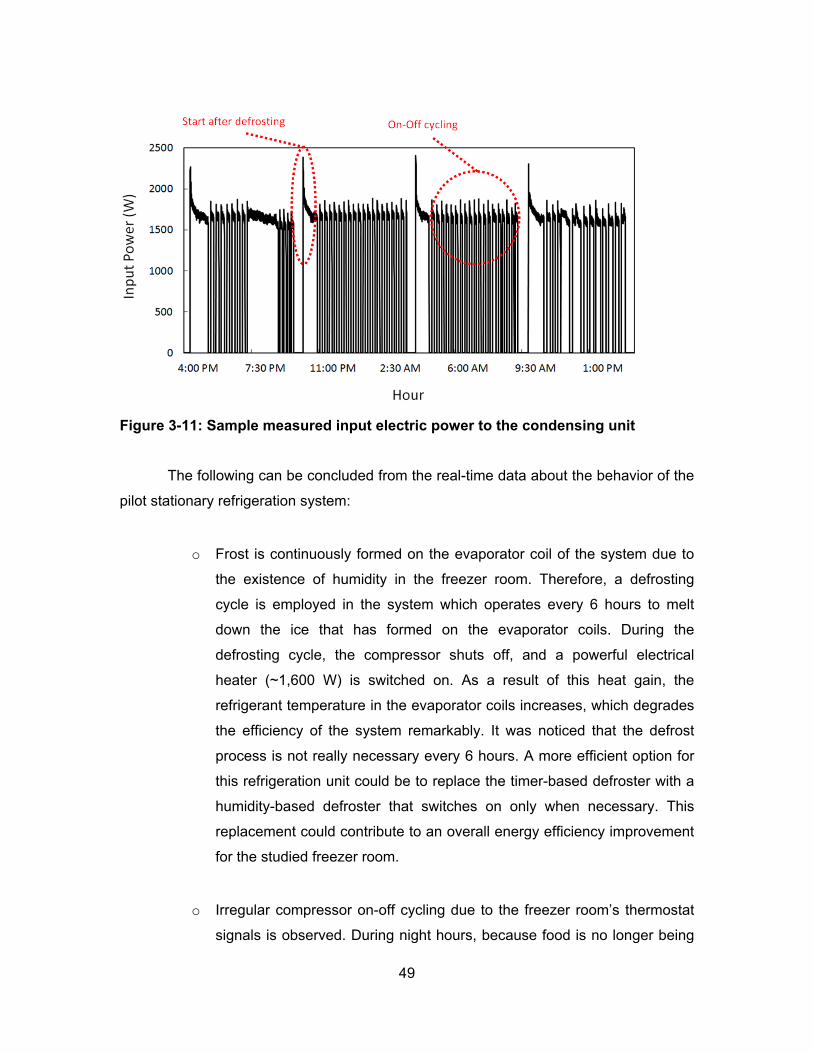
49
Figure 3-11: Sample measured input electric power to the condensing unit
The following can be concluded from the real-time data about the behavior of the
pilot stationary refrigeration system:
o Frost is continuously formed on the evaporator coil of the system due to
the existence of humidity in the freezer room. Therefore, a defrosting
cycle is employed in the system which operates every 6 hours to melt
down the ice that has formed on the evaporator coils. During the
defrosting cycle, the compressor shuts off, and a powerful electrical
heater (~1,600 W) is switched on. As a result of this heat gain, the
refrigerant temperature in the evaporator coils increases, which degrades
the efficiency of the system remarkably. It was noticed that the defrost
process is not really necessary every 6 hours. A more efficient option for
this refrigeration unit could be to replace the timer-based defroster with a
humidity-based defroster that switches on only when necessary. This
replacement could contribute to an overall energy efficiency improvement
for the studied freezer room.
o Irregular compressor on-off cycling due to the freezer room’s thermostat
signals is observed. During night hours, because food is no longer being
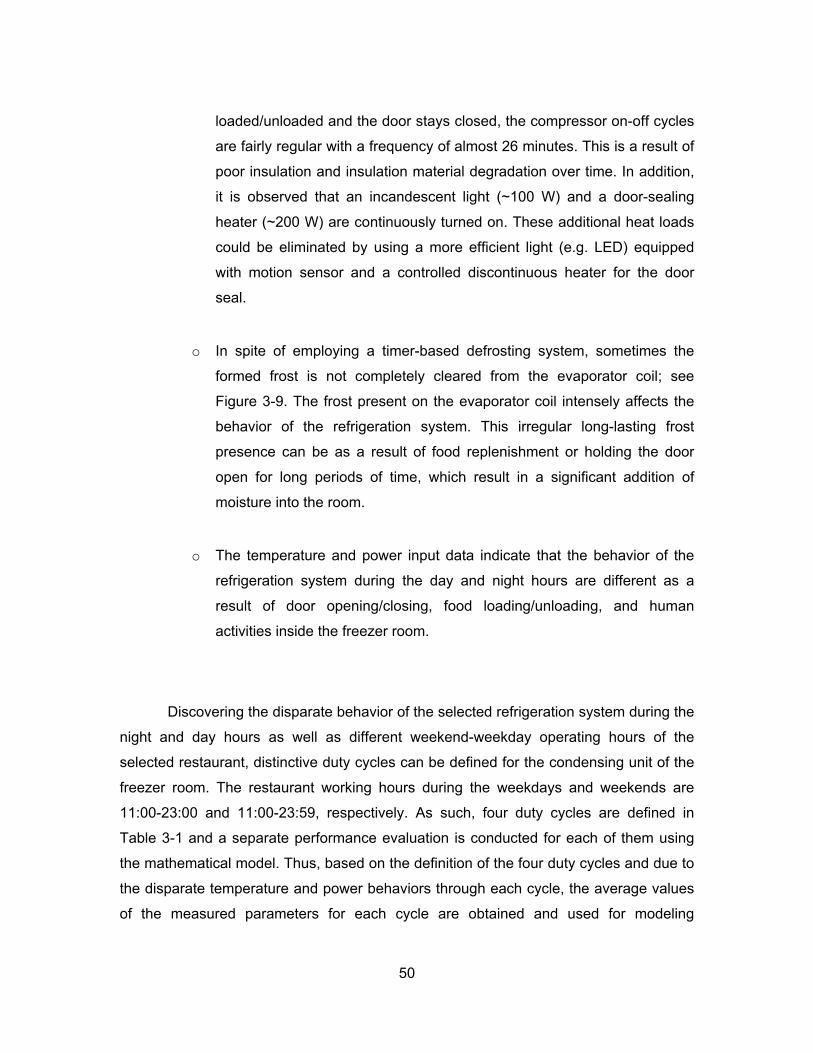
50
loaded/unloaded and the door stays closed, the compressor on-off cycles
are fairly regular with a frequency of almost 26 minutes. This is a result of
poor insulation and insulation material degradation over time. In addition,
it is observed that an incandescent light (~100 W) and a door-sealing
heater (~200 W) are continuously turned on. These additional heat loads
could be eliminated by using a more efficient light (e.g. LED) equipped
with motion sensor and a controlled discontinuous heater for the door
seal.
o In spite of employing a timer-based defrosting system, sometimes the
formed frost is not completely cleared from the evaporator coil; see
Figure 3-9. The frost present on the evaporator coil intensely affects the
behavior of the refrigeration system. This irregular long-lasting frost
presence can be as a result of food replenishment or holding the door
open for long periods of time, which result in a significant addition of
moisture into the room.
o The temperature and power input data indicate that the behavior of the
refrigeration system during the day and night hours are different as a
result of door opening/closing, food loading/unloading, and human
activities inside the freezer room.
Discovering the disparate behavior of the selected refrigeration system during the
night and day hours as well as different weekend-weekday operating hours of the
selected restaurant, distinctive duty cycles can be defined for the condensing unit of the
freezer room. The restaurant working hours during the weekdays and weekends are
11:00-23:00 and 11:00-23:59, respectively. As such, four duty cycles are defined in
Table 3-1 and a separate performance evaluation is conducted for each of them using
the mathematical model. Thus, based on the definition of the four duty cycles and due to
the disparate temperature and power behaviors through each cycle, the average values
of the measured parameters for each cycle are obtained and used for modeling
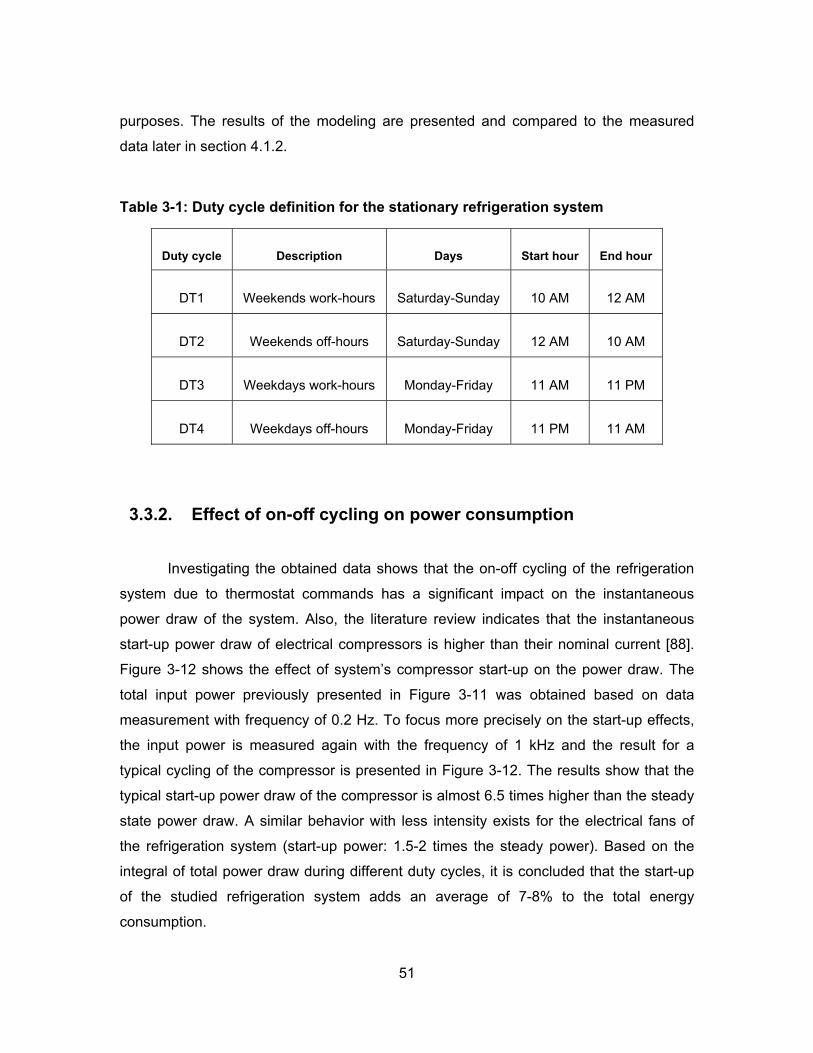
51
purposes. The results of the modeling are presented and compared to the measured
data later in section 4.1.2.
Table 3-1: Duty cycle definition for the stationary refrigeration system
Duty cycle Description Days Start hour End hour
DT1 Weekends work-hours Saturday-Sunday 10 AM 12 AM
DT2 Weekends off-hours Saturday-Sunday 12 AM 10 AM
DT3 Weekdays work-hours Monday-Friday 11 AM 11 PM
DT4 Weekdays off-hours Monday-Friday 11 PM 11 AM
3.3.2. Effect of on-off cycling on power consumption
Investigating the obtained data shows that the on-off cycling of the refrigeration
system due to thermostat commands has a significant impact on the instantaneous
power draw of the system. Also, the literature review indicates that the instantaneous
start-up power draw of electrical compressors is higher than their nominal current [88].
Figure 3-12 shows the effect of system’s compressor start-up on the power draw. The
total input power previously presented in Figure 3-11 was obtained based on data
measurement with frequency of 0.2 Hz. To focus more precisely on the start-up effects,
the input power is measured again with the frequency of 1 kHz and the result for a
typical cycling of the compressor is presented in Figure 3-12. The results show that the
typical start-up power draw of the compressor is almost 6.5 times higher than the steady
state power draw. A similar behavior with less intensity exists for the electrical fans of
the refrigeration system (start-up power: 1.5-2 times the steady power). Based on the
integral of total power draw during different duty cycles, it is concluded that the start-up
of the studied refrigeration system adds an average of 7-8% to the total energy
consumption.
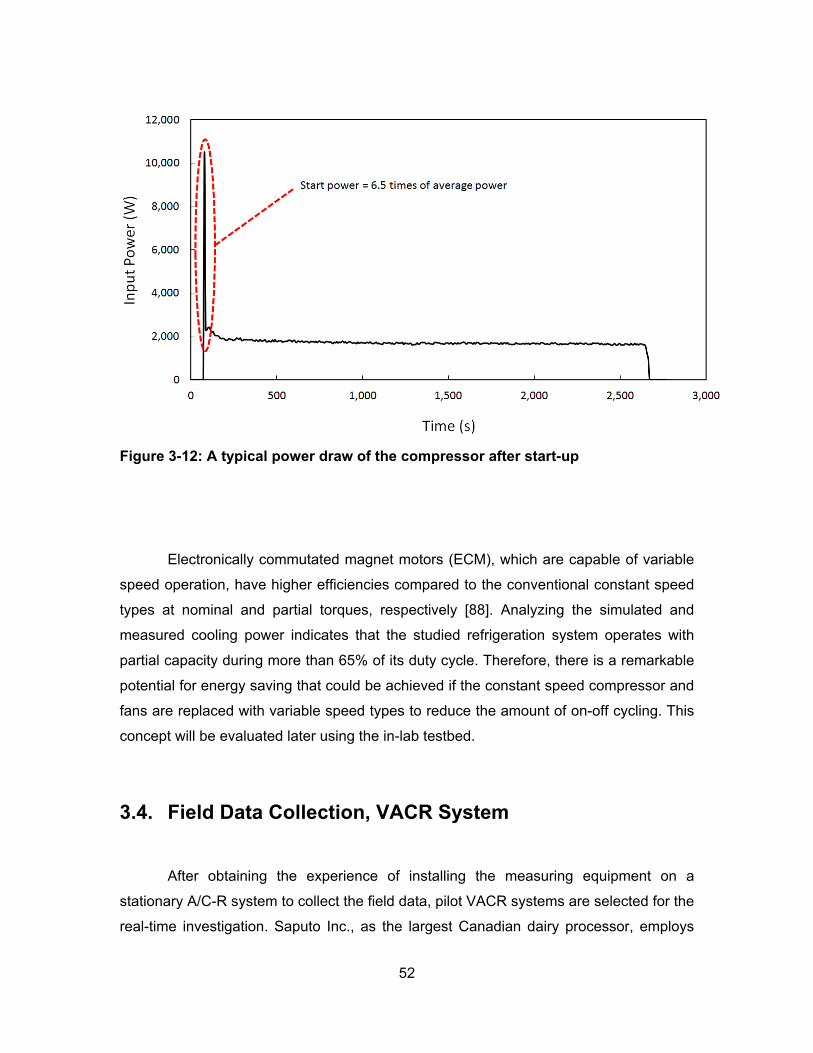
52
Figure 3-12: A typical power draw of the compressor after start-up
Electronically commutated magnet motors (ECM), which are capable of variable
speed operation, have higher efficiencies compared to the conventional constant speed
types at nominal and partial torques, respectively [88]. Analyzing the simulated and
measured cooling power indicates that the studied refrigeration system operates with
partial capacity during more than 65% of its duty cycle. Therefore, there is a remarkable
potential for energy saving that could be achieved if the constant speed compressor and
fans are replaced with variable speed types to reduce the amount of on-off cycling. This
concept will be evaluated later using the in-lab testbed.
3.4. Field Data Collection, VACR System
After obtaining the experience of installing the measuring equipment on a
stationary A/C-R system to collect the field data, pilot VACR systems are selected for the
real-time investigation. Saputo Inc., as the largest Canadian dairy processor, employs
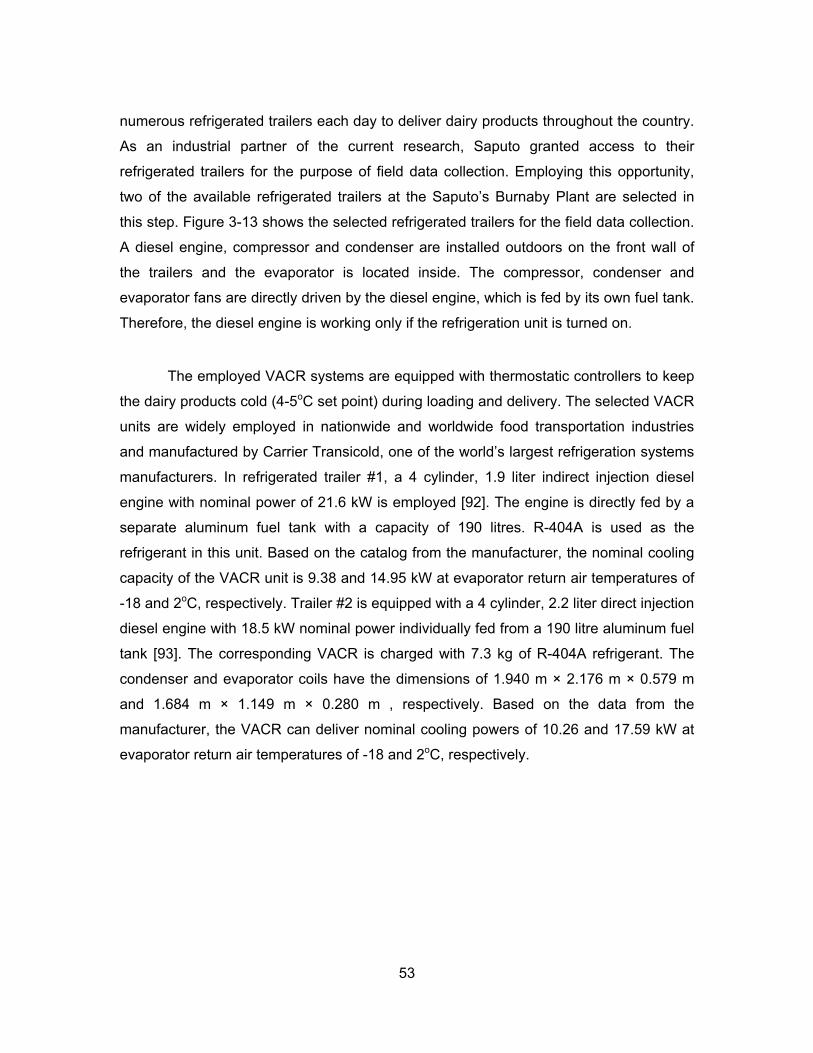
53
numerous refrigerated trailers each day to deliver dairy products throughout the country.
As an industrial partner of the current research, Saputo granted access to their
refrigerated trailers for the purpose of field data collection. Employing this opportunity,
two of the available refrigerated trailers at the Saputo’s Burnaby Plant are selected in
this step. Figure 3-13 shows the selected refrigerated trailers for the field data collection.
A diesel engine, compressor and condenser are installed outdoors on the front wall of
the trailers and the evaporator is located inside. The compressor, condenser and
evaporator fans are directly driven by the diesel engine, which is fed by its own fuel tank.
Therefore, the diesel engine is working only if the refrigeration unit is turned on.
The employed VACR systems are equipped with thermostatic controllers to keep
the dairy products cold (4-5oC set point) during loading and delivery. The selected VACR
units are widely employed in nationwide and worldwide food transportation industries
and manufactured by Carrier Transicold, one of the world’s largest refrigeration systems
manufacturers. In refrigerated trailer #1, a 4 cylinder, 1.9 liter indirect injection diesel
engine with nominal power of 21.6 kW is employed [92]. The engine is directly fed by a
separate aluminum fuel tank with a capacity of 190 litres. R-404A is used as the
refrigerant in this unit. Based on the catalog from the manufacturer, the nominal cooling
capacity of the VACR unit is 9.38 and 14.95 kW at evaporator return air temperatures of
-18 and 2oC, respectively. Trailer #2 is equipped with a 4 cylinder, 2.2 liter direct injection
diesel engine with 18.5 kW nominal power individually fed from a 190 litre aluminum fuel
tank [93]. The corresponding VACR is charged with 7.3 kg of R-404A refrigerant. The
condenser and evaporator coils have the dimensions of 1.940 m × 2.176 m × 0.579 m
and 1.684 m × 1.149 m × 0.280 m , respectively. Based on the data from the
manufacturer, the VACR can deliver nominal cooling powers of 10.26 and 17.59 kW at
evaporator return air temperatures of -18 and 2oC, respectively.
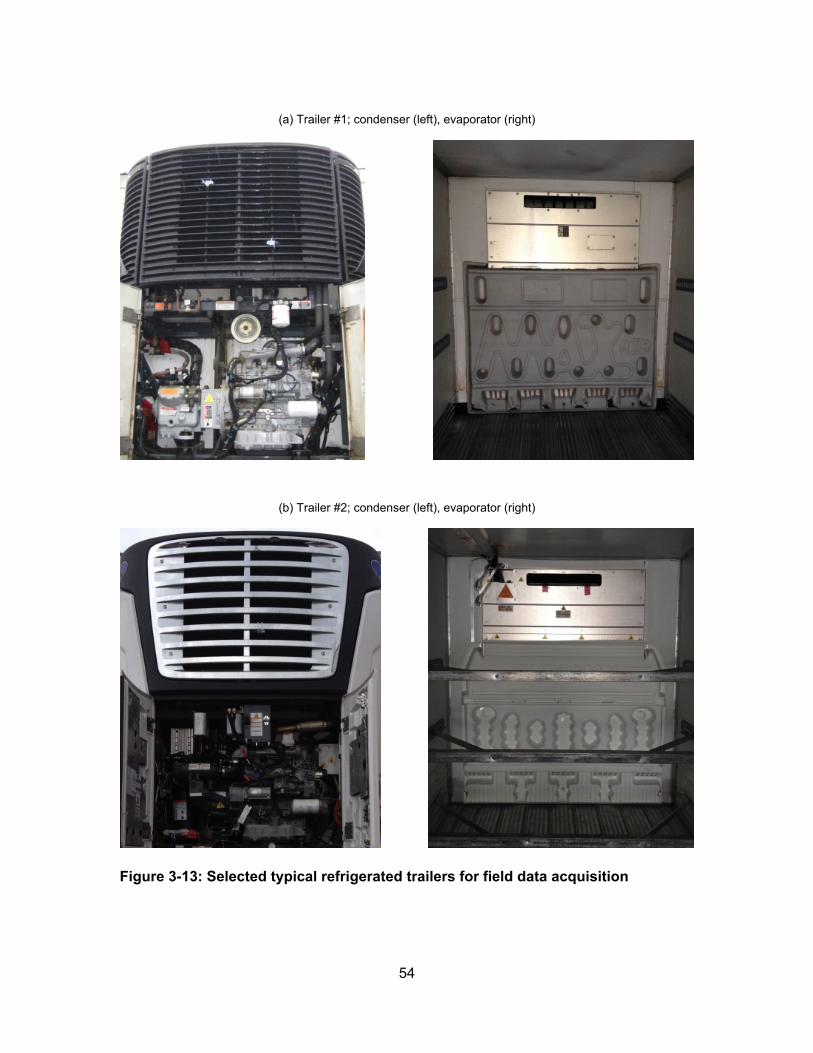
54
(a) Trailer #1; condenser (left), evaporator (right)
(b) Trailer #2; condenser (left), evaporator (right)
Figure 3-13: Selected typical refrigerated trailers for field data acquisition
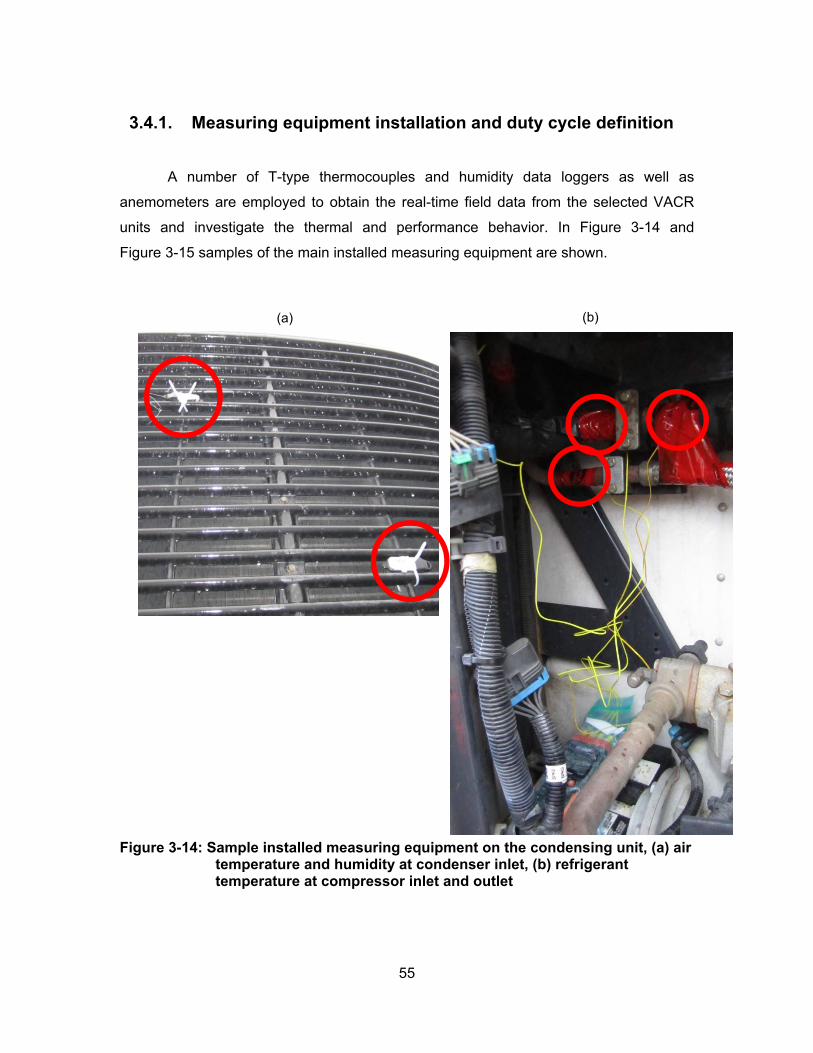
55
3.4.1. Measuring equipment installation and duty cycle definition
A number of T-type thermocouples and humidity data loggers as well as
anemometers are employed to obtain the real-time field data from the selected VACR
units and investigate the thermal and performance behavior. In Figure 3-14 and
Figure 3-15 samples of the main installed measuring equipment are shown.
Figure 3-14: Sample installed measuring equipment on the condensing unit, (a) air temperature and humidity at condenser inlet, (b) refrigerant temperature at compressor inlet and outlet
(a) (b)
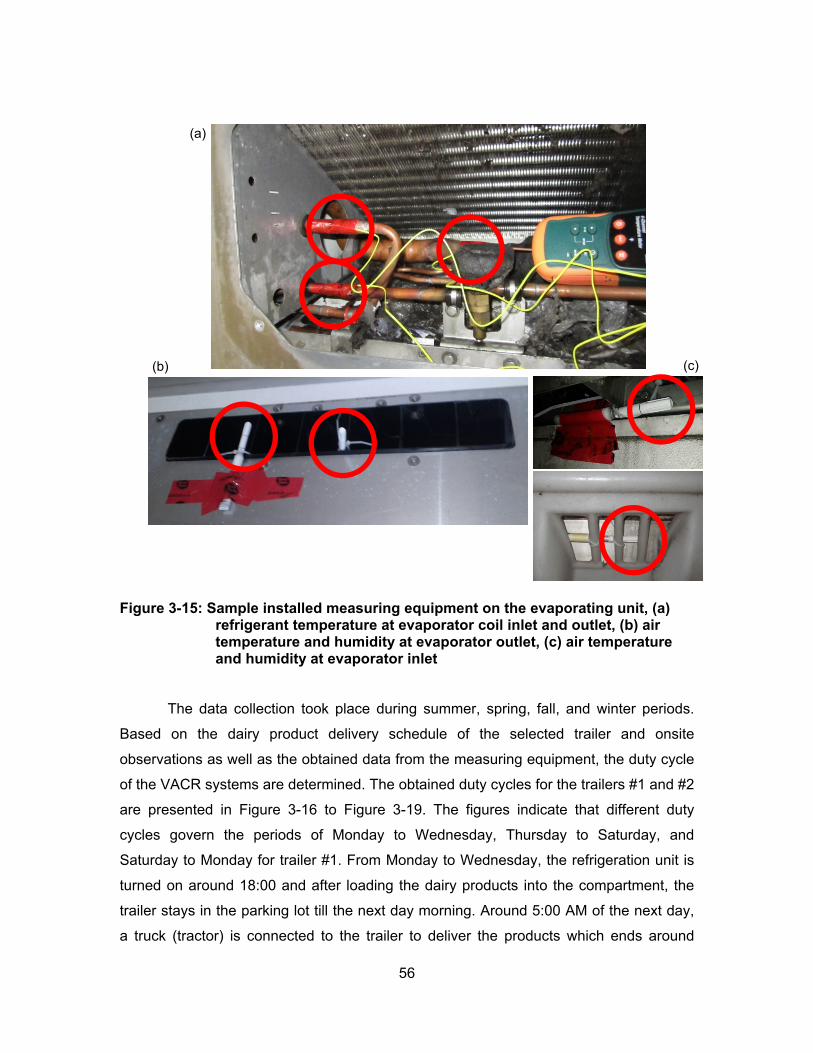
56
Figure 3-15: Sample installed measuring equipment on the evaporating unit, (a) refrigerant temperature at evaporator coil inlet and outlet, (b) air temperature and humidity at evaporator outlet, (c) air temperature and humidity at evaporator inlet
The data collection took place during summer, spring, fall, and winter periods.
Based on the dairy product delivery schedule of the selected trailer and onsite
observations as well as the obtained data from the measuring equipment, the duty cycle
of the VACR systems are determined. The obtained duty cycles for the trailers #1 and #2
are presented in Figure 3-16 to Figure 3-19. The figures indicate that different duty
cycles govern the periods of Monday to Wednesday, Thursday to Saturday, and
Saturday to Monday for trailer #1. From Monday to Wednesday, the refrigeration unit is
turned on around 18:00 and after loading the dairy products into the compartment, the
trailer stays in the parking lot till the next day morning. Around 5:00 AM of the next day,
a truck (tractor) is connected to the trailer to deliver the products which ends around
(a)
(b) (c)
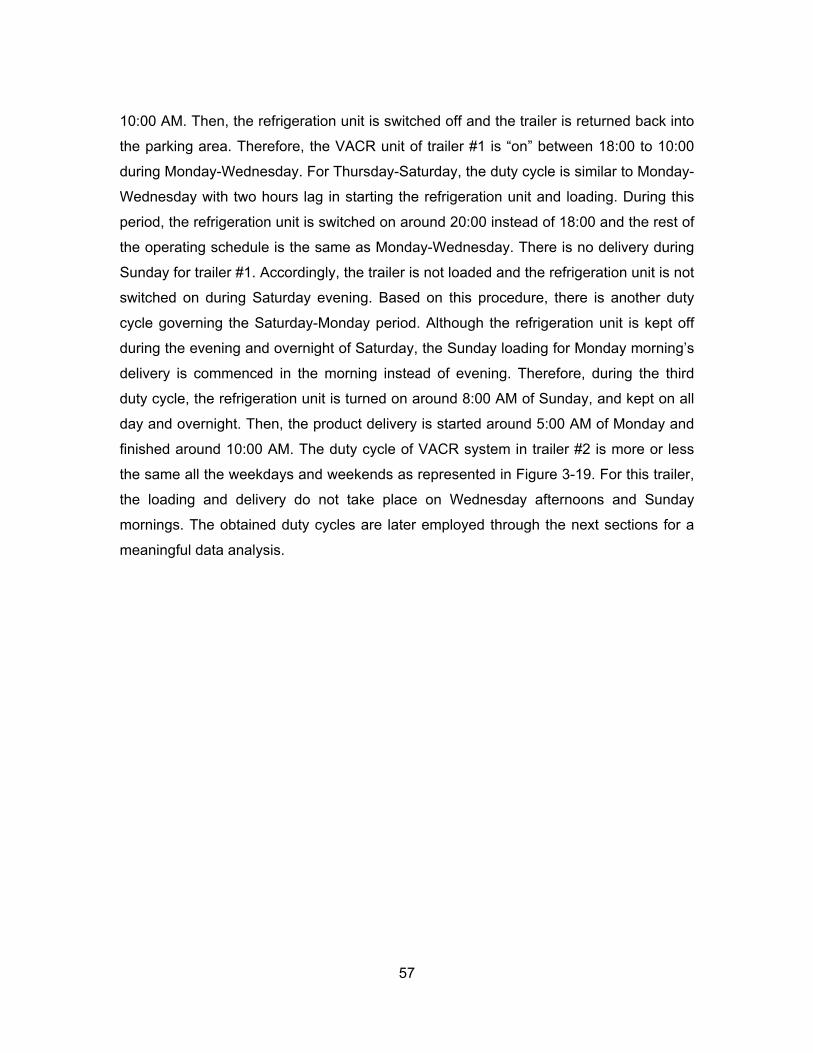
57
10:00 AM. Then, the refrigeration unit is switched off and the trailer is returned back into
the parking area. Therefore, the VACR unit of trailer #1 is “on” between 18:00 to 10:00
during Monday-Wednesday. For Thursday-Saturday, the duty cycle is similar to Monday-
Wednesday with two hours lag in starting the refrigeration unit and loading. During this
period, the refrigeration unit is switched on around 20:00 instead of 18:00 and the rest of
the operating schedule is the same as Monday-Wednesday. There is no delivery during
Sunday for trailer #1. Accordingly, the trailer is not loaded and the refrigeration unit is not
switched on during Saturday evening. Based on this procedure, there is another duty
cycle governing the Saturday-Monday period. Although the refrigeration unit is kept off
during the evening and overnight of Saturday, the Sunday loading for Monday morning’s
delivery is commenced in the morning instead of evening. Therefore, during the third
duty cycle, the refrigeration unit is turned on around 8:00 AM of Sunday, and kept on all
day and overnight. Then, the product delivery is started around 5:00 AM of Monday and
finished around 10:00 AM. The duty cycle of VACR system in trailer #2 is more or less
the same all the weekdays and weekends as represented in Figure 3-19. For this trailer,
the loading and delivery do not take place on Wednesday afternoons and Sunday
mornings. The obtained duty cycles are later employed through the next sections for a
meaningful data analysis.
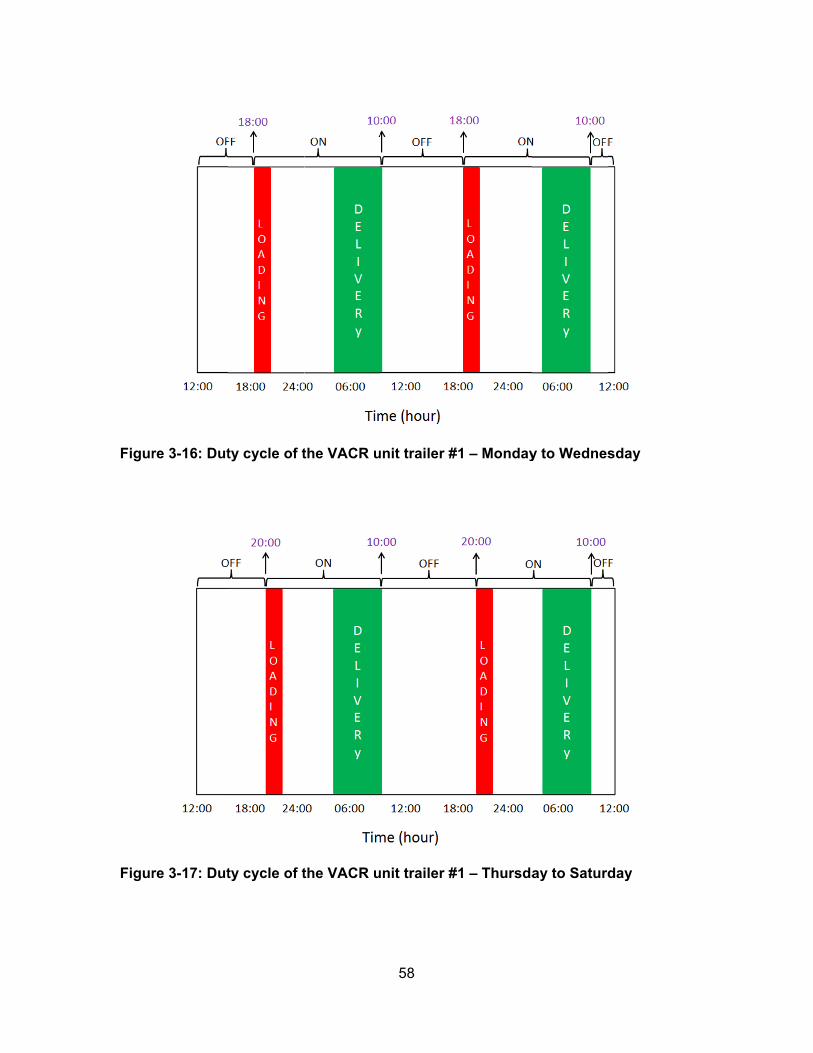
Figur
Figur
re 3-16: Dut
re 3-17: Dut
ty cycle of t
ty cycle of t
the VACR u
the VACR u
58
unit trailer #
unit trailer #
#1 – Monday
#1 – Thursda
y to Wednes
ay to Saturd
sday
day
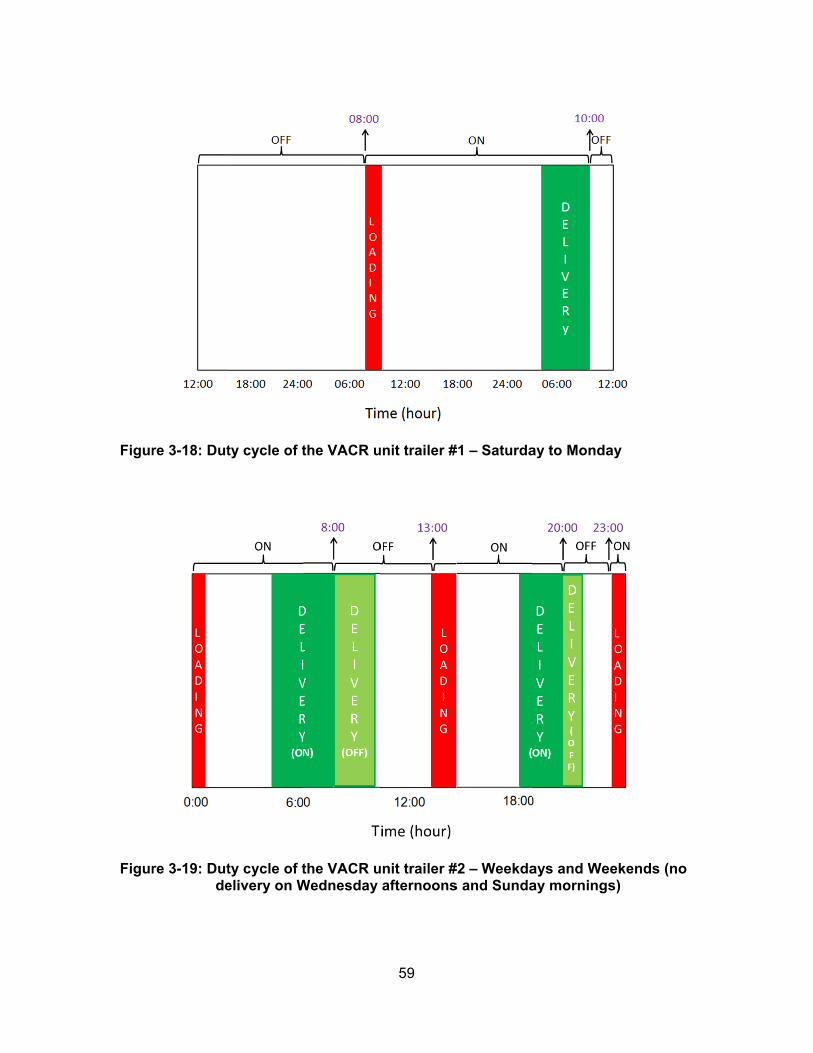
Figur
Figur
re 3-18: Dut
re 3-19: Dutde
ty cycle of t
ty cycle of telivery on W
the VACR u
the VACR uWednesday
59
unit trailer #
unit trailer #afternoons
#1 – Saturda
#2 – Weekdas and Sunda
ay to Monda
ays and Weay mornings
ay
eekends (nos)
o
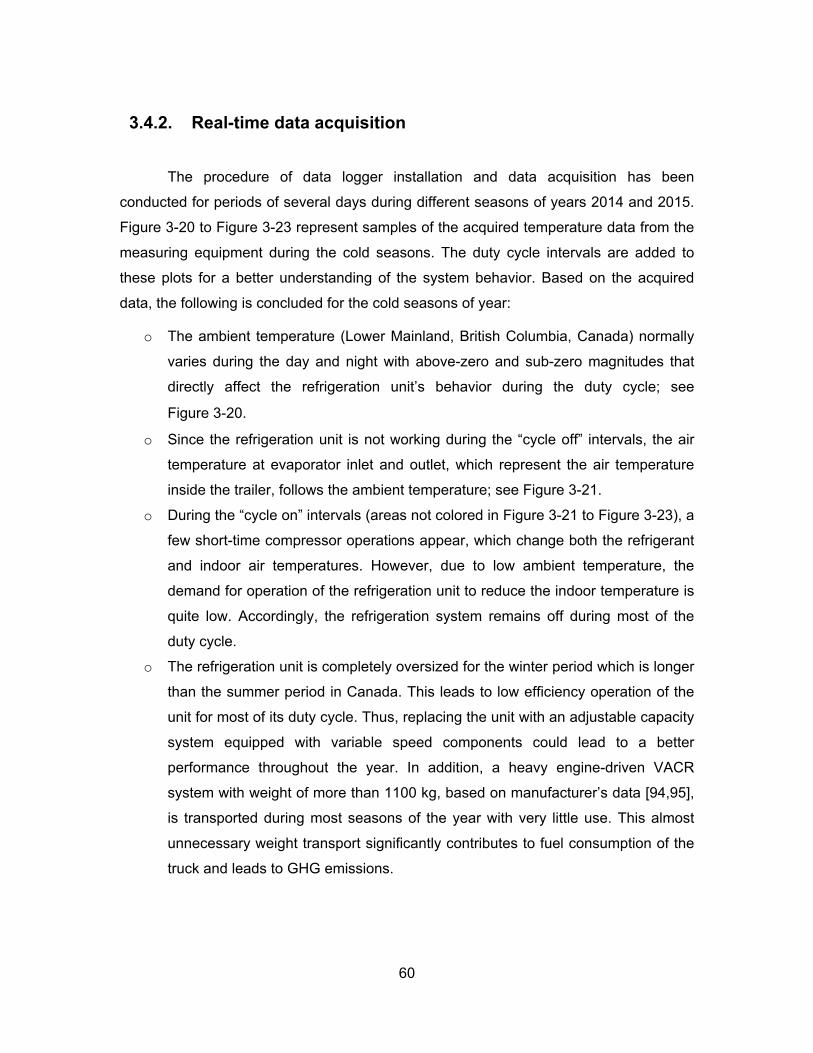
60
3.4.2. Real-time data acquisition
The procedure of data logger installation and data acquisition has been
conducted for periods of several days during different seasons of years 2014 and 2015.
Figure 3-20 to Figure 3-23 represent samples of the acquired temperature data from the
measuring equipment during the cold seasons. The duty cycle intervals are added to
these plots for a better understanding of the system behavior. Based on the acquired
data, the following is concluded for the cold seasons of year:
o The ambient temperature (Lower Mainland, British Columbia, Canada) normally
varies during the day and night with above-zero and sub-zero magnitudes that
directly affect the refrigeration unit’s behavior during the duty cycle; see
Figure 3-20.
o Since the refrigeration unit is not working during the “cycle off” intervals, the air
temperature at evaporator inlet and outlet, which represent the air temperature
inside the trailer, follows the ambient temperature; see Figure 3-21.
o During the “cycle on” intervals (areas not colored in Figure 3-21 to Figure 3-23), a
few short-time compressor operations appear, which change both the refrigerant
and indoor air temperatures. However, due to low ambient temperature, the
demand for operation of the refrigeration unit to reduce the indoor temperature is
quite low. Accordingly, the refrigeration system remains off during most of the
duty cycle.
o The refrigeration unit is completely oversized for the winter period which is longer
than the summer period in Canada. This leads to low efficiency operation of the
unit for most of its duty cycle. Thus, replacing the unit with an adjustable capacity
system equipped with variable speed components could lead to a better
performance throughout the year. In addition, a heavy engine-driven VACR
system with weight of more than 1100 kg, based on manufacturer’s data [94,95],
is transported during most seasons of the year with very little use. This almost
unnecessary weight transport significantly contributes to fuel consumption of the
truck and leads to GHG emissions.
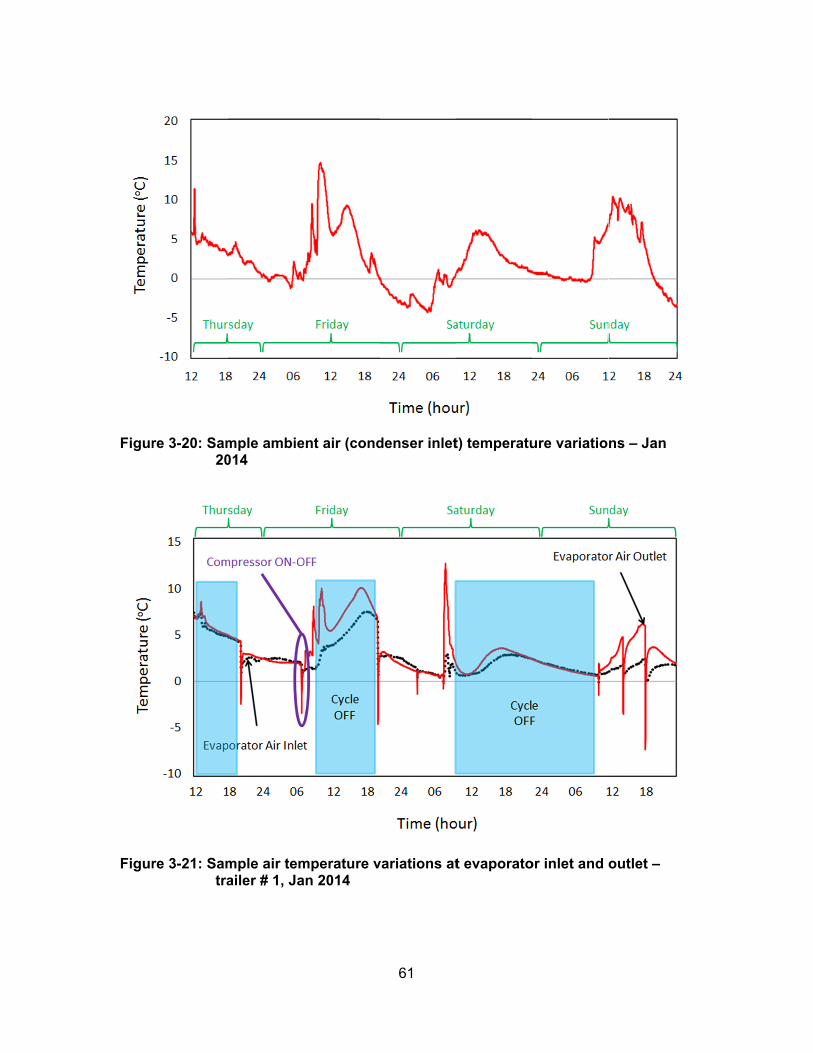
Figur
Figur
re 3-20: Sam20
re 3-21: Samtra
mple ambie014
mple air temailer # 1, Ja
ent air (cond
mperature vn 2014
61
denser inlet
variations at
t) temperatu
t evaporato
ure variatio
or inlet and
ns – Jan
outlet –
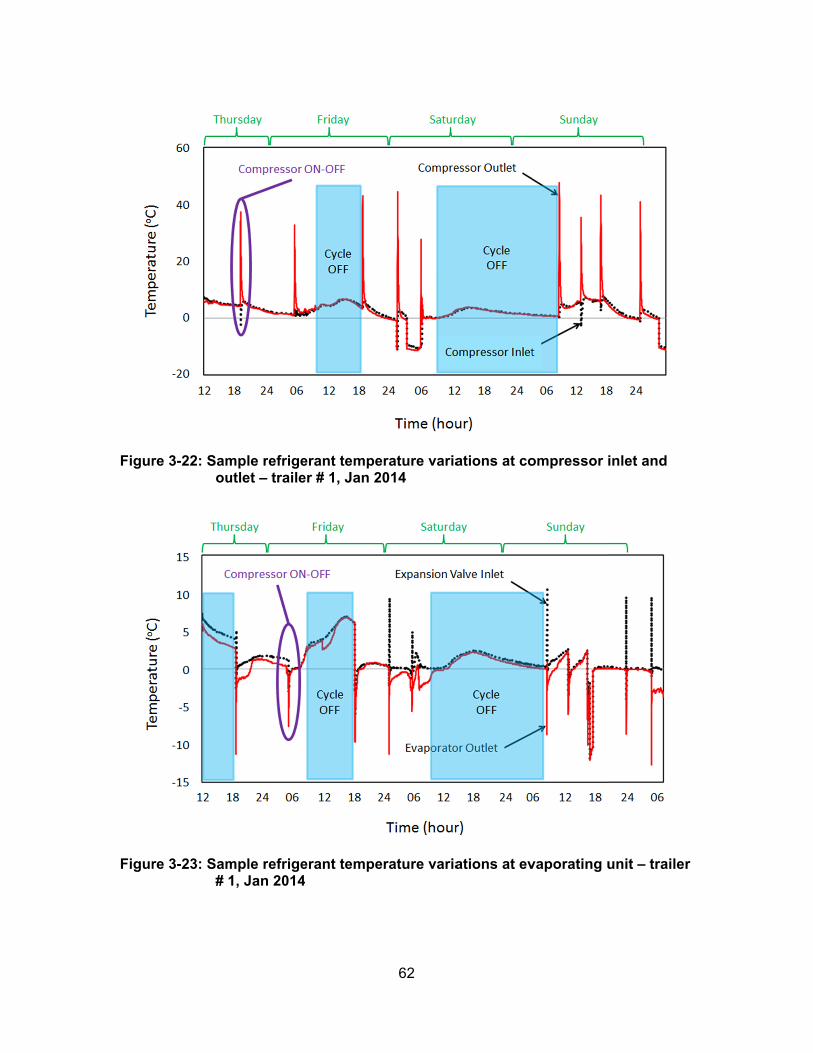
Figur
Figur
re 3-22: Samou
re 3-23: Sam#
mple refrigeutlet – traile
mple refrige1, Jan 2014
erant tempeer # 1, Jan 2
erant tempe4
62
erature varia2014
erature varia
ations at co
ations at ev
ompressor i
vaporating u
inlet and
unit – trailer
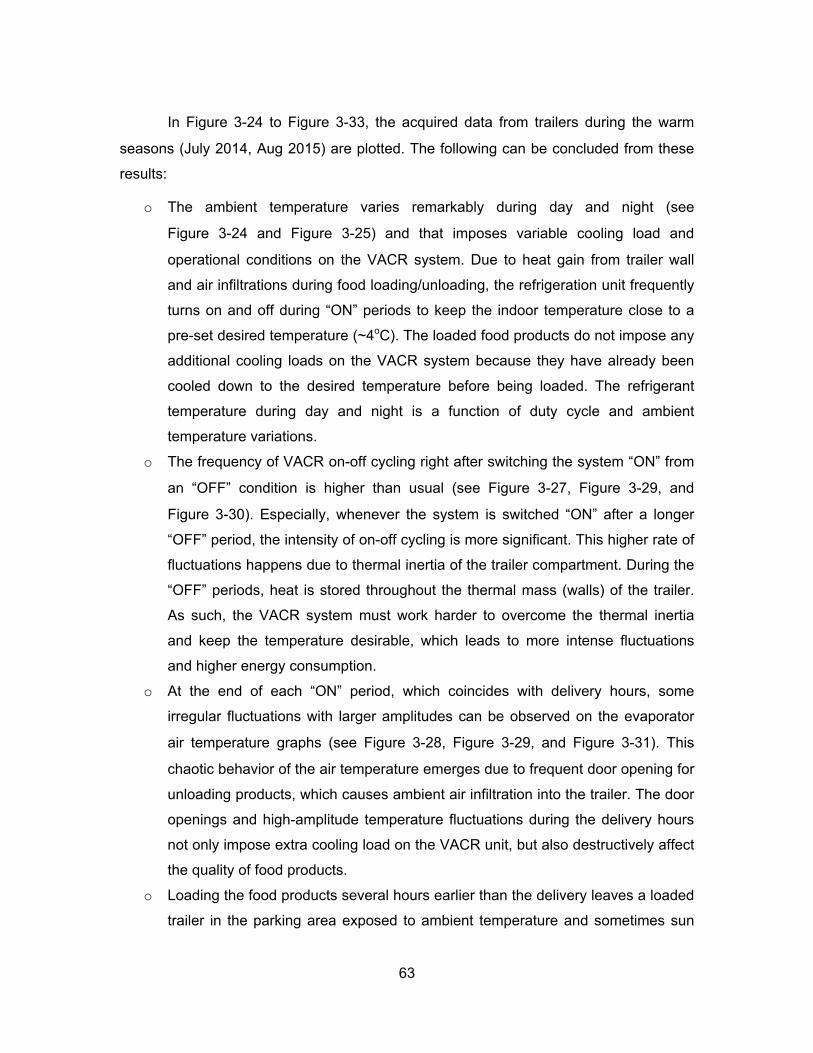
63
In Figure 3-24 to Figure 3-33, the acquired data from trailers during the warm
seasons (July 2014, Aug 2015) are plotted. The following can be concluded from these
results:
o The ambient temperature varies remarkably during day and night (see
Figure 3-24 and Figure 3-25) and that imposes variable cooling load and
operational conditions on the VACR system. Due to heat gain from trailer wall
and air infiltrations during food loading/unloading, the refrigeration unit frequently
turns on and off during “ON” periods to keep the indoor temperature close to a
pre-set desired temperature (~4oC). The loaded food products do not impose any
additional cooling loads on the VACR system because they have already been
cooled down to the desired temperature before being loaded. The refrigerant
temperature during day and night is a function of duty cycle and ambient
temperature variations.
o The frequency of VACR on-off cycling right after switching the system “ON” from
an “OFF” condition is higher than usual (see Figure 3-27, Figure 3-29, and
Figure 3-30). Especially, whenever the system is switched “ON” after a longer
“OFF” period, the intensity of on-off cycling is more significant. This higher rate of
fluctuations happens due to thermal inertia of the trailer compartment. During the
“OFF” periods, heat is stored throughout the thermal mass (walls) of the trailer.
As such, the VACR system must work harder to overcome the thermal inertia
and keep the temperature desirable, which leads to more intense fluctuations
and higher energy consumption.
o At the end of each “ON” period, which coincides with delivery hours, some
irregular fluctuations with larger amplitudes can be observed on the evaporator
air temperature graphs (see Figure 3-28, Figure 3-29, and Figure 3-31). This
chaotic behavior of the air temperature emerges due to frequent door opening for
unloading products, which causes ambient air infiltration into the trailer. The door
openings and high-amplitude temperature fluctuations during the delivery hours
not only impose extra cooling load on the VACR unit, but also destructively affect
the quality of food products.
o Loading the food products several hours earlier than the delivery leaves a loaded
trailer in the parking area exposed to ambient temperature and sometimes sun
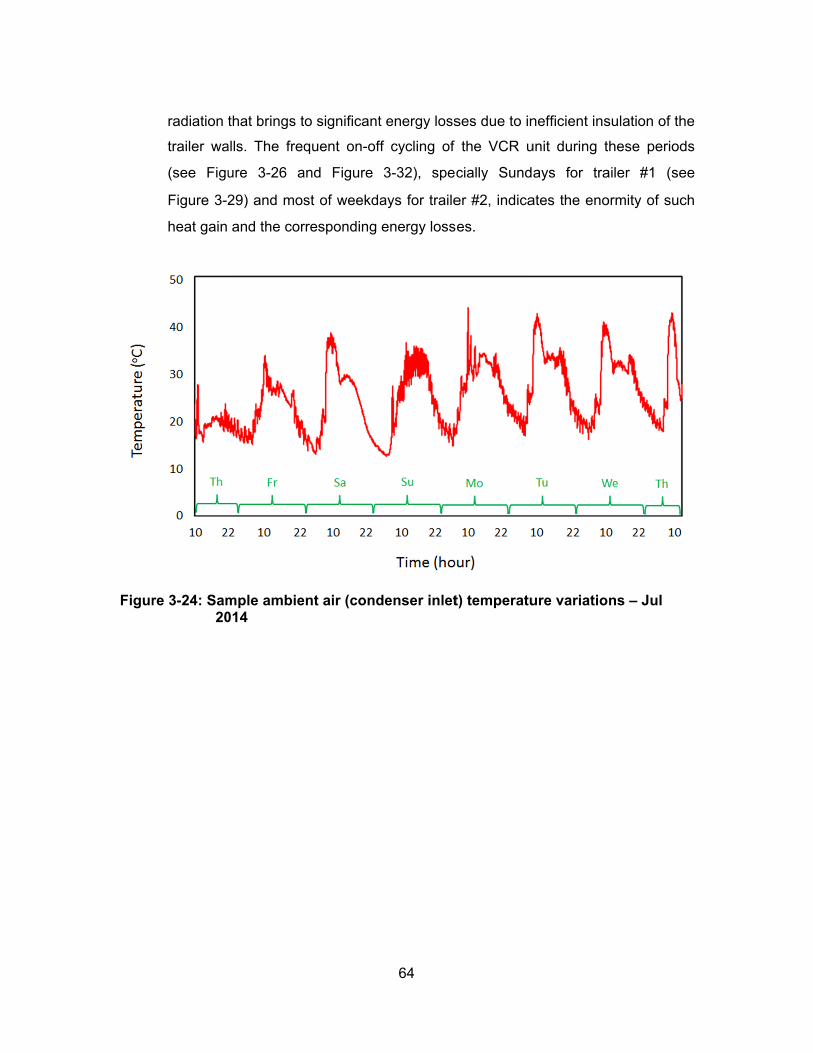
Figur
radiation
trailer wa
(see Figu
Figure 3-2
heat gain
re 3-24: Sam20
that brings t
alls. The freq
ure 3-26 a
29) and mos
and the cor
mple ambie014
o significant
quent on-off
and Figure
st of weekda
rresponding
ent air (cond
64
t energy loss
f cycling of
3-32), spec
ays for traile
energy loss
denser inlet
ses due to in
the VCR u
cially Sund
er #2, indica
es.
t) temperatu
nefficient ins
unit during t
ays for tra
ates the eno
ure variatio
sulation of th
hese period
ailer #1 (se
ormity of suc
ns – Jul
he
ds
ee
ch
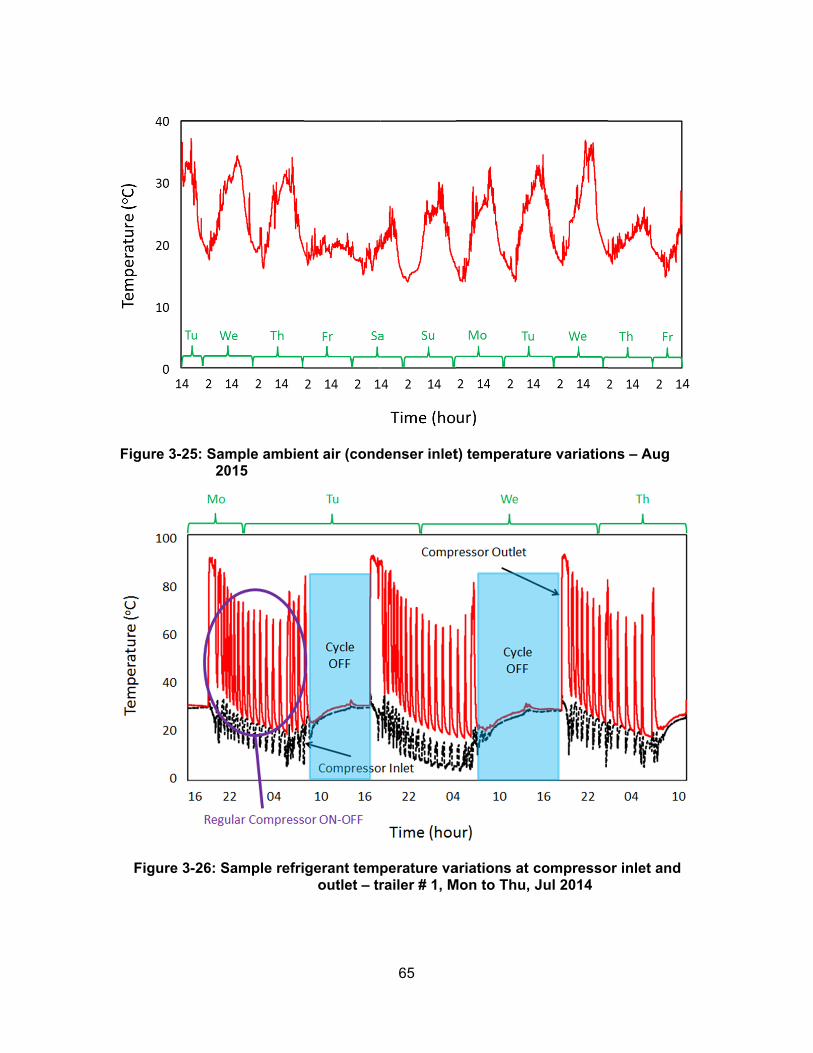
Figur
Fig
re 3-25: Sam20
gure 3-26: S
mple ambie015
Sample refri
ent air (cond
gerant temoutlet – tr
65
denser inlet
perature varailer # 1, M
t) temperatu
ariations atMon to Thu,
ure variatio
compressoJul 2014
ns – Aug
or inlet and
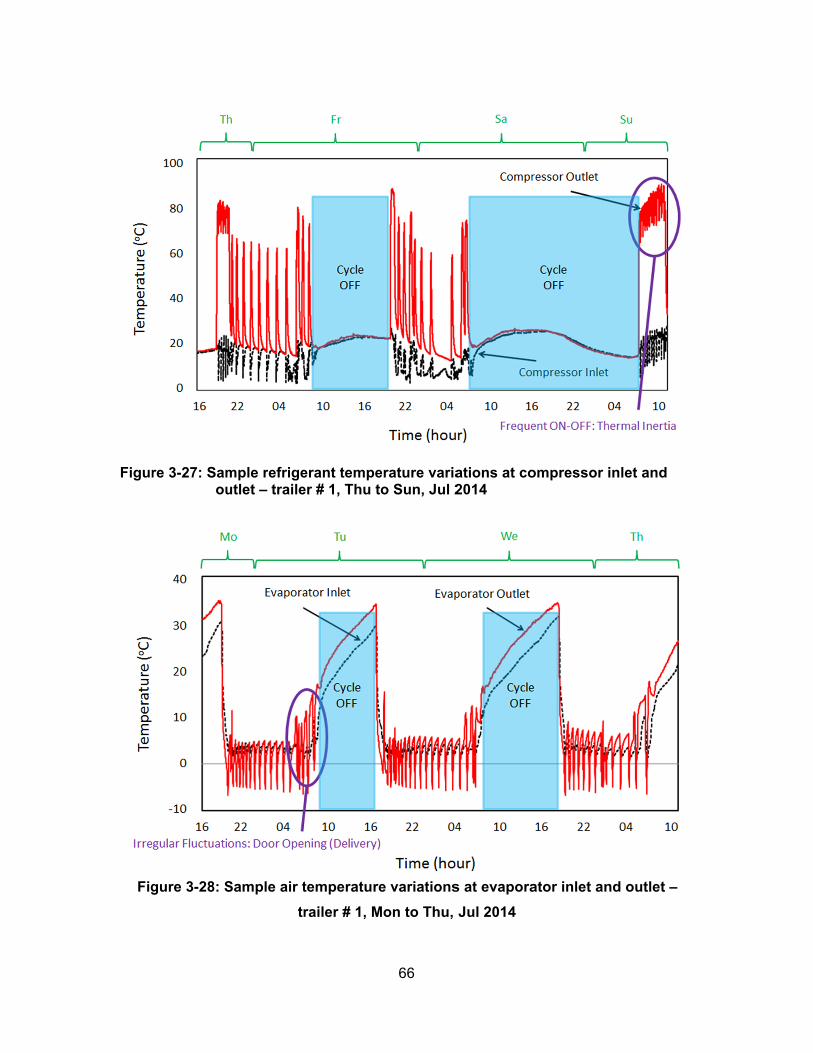
Figur
Fig
re 3-27: Samou
gure 3-28: S
mple refrigeutlet – traile
Sample air t
tr
erant tempeer # 1, Thu t
temperature
railer # 1, M
66
erature variao Sun, Jul 2
e variations
Mon to Thu,
ations at co2014
s at evapora
Jul 2014
ompressor i
ator inlet an
inlet and
nd outlet –
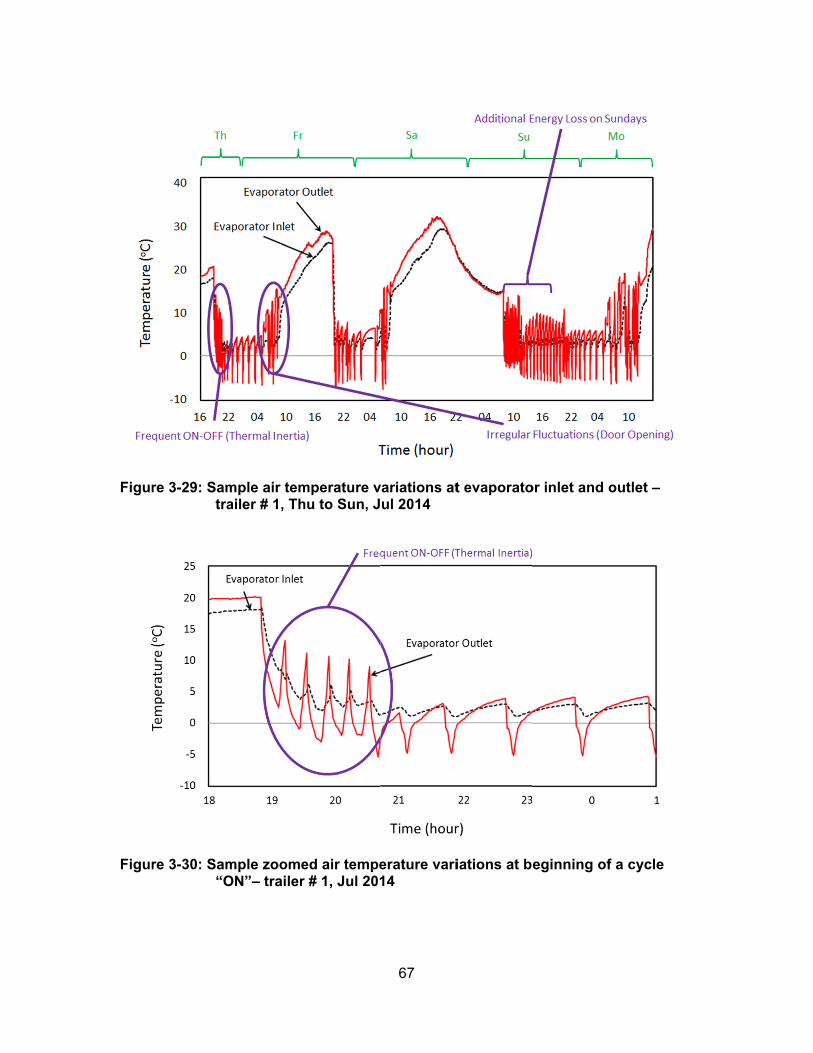
Figur
Figur
re 3-29: Samtra
re 3-30: Sam“O
mple air temailer # 1, Th
mple zoomeON”– trailer
mperature vhu to Sun, J
ed air temper # 1, Jul 201
67
variations atul 2014
erature vari14
t evaporato
iations at b
or inlet and
eginning of
outlet –
f a cycle
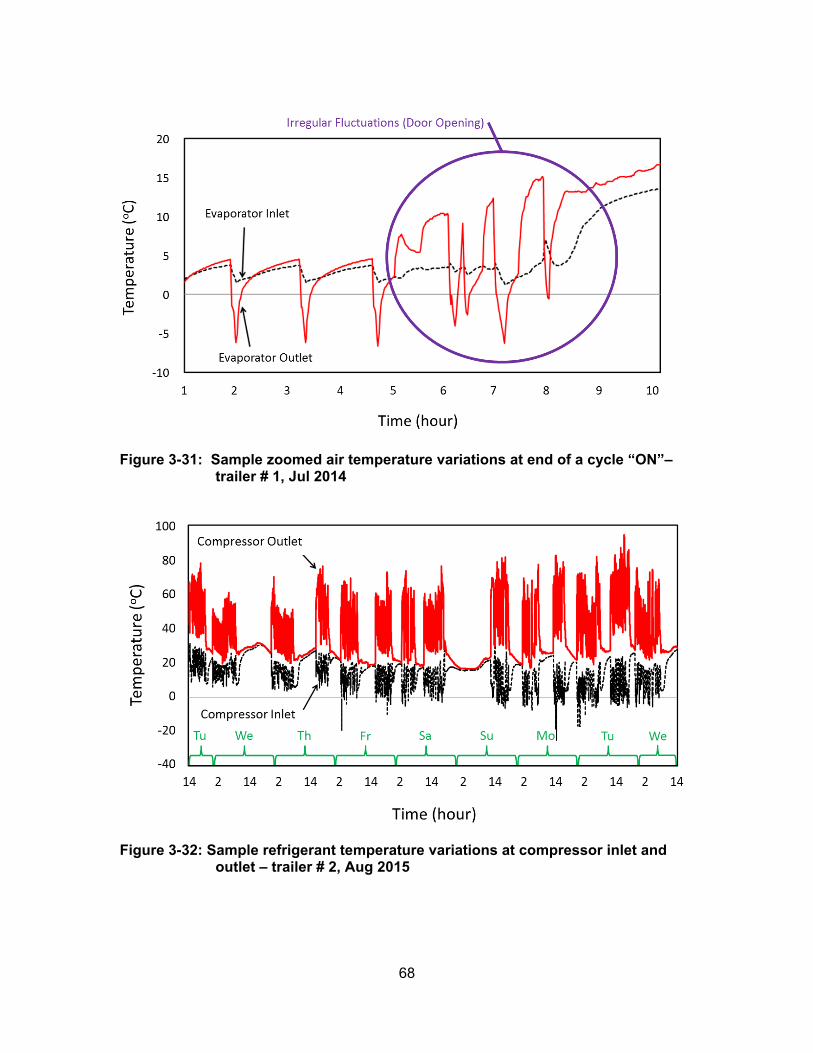
68
Figure 3-31: Sample zoomed air temperature variations at end of a cycle “ON”– trailer # 1, Jul 2014
Figure 3-32: Sample refrigerant temperature variations at compressor inlet and outlet – trailer # 2, Aug 2015
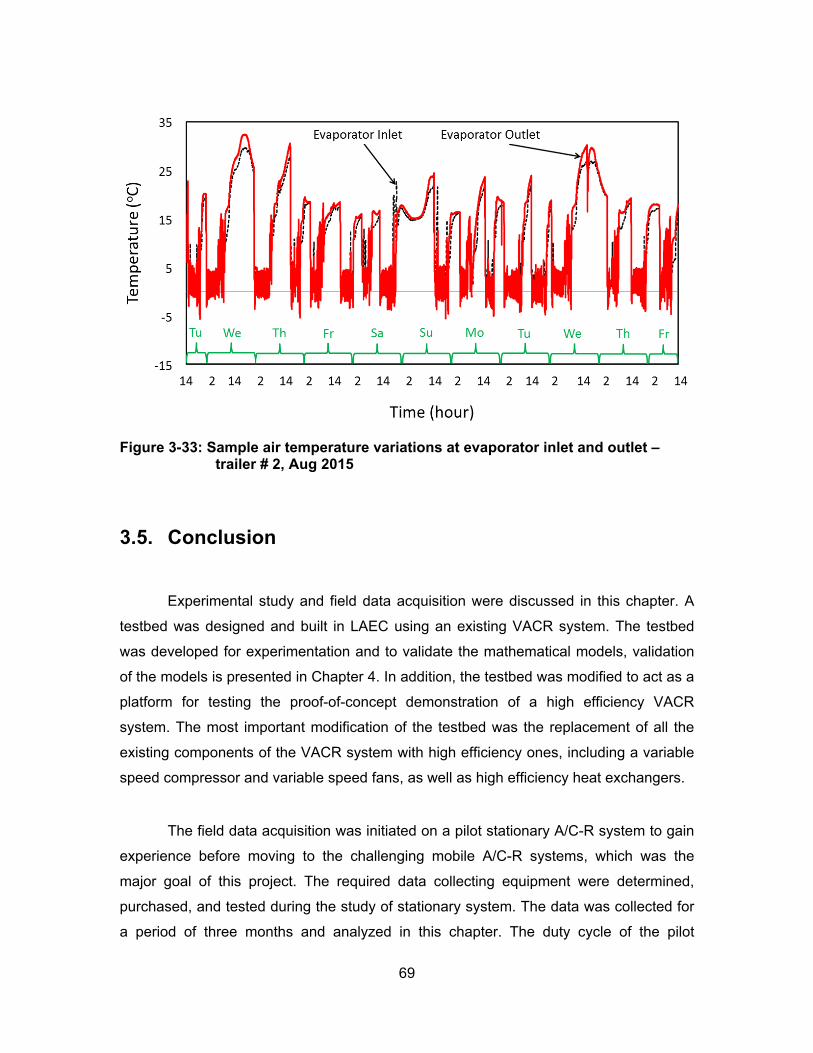
69
Figure 3-33: Sample air temperature variations at evaporator inlet and outlet – trailer # 2, Aug 2015
3.5. Conclusion
Experimental study and field data acquisition were discussed in this chapter. A
testbed was designed and built in LAEC using an existing VACR system. The testbed
was developed for experimentation and to validate the mathematical models, validation
of the models is presented in Chapter 4. In addition, the testbed was modified to act as a
platform for testing the proof-of-concept demonstration of a high efficiency VACR
system. The most important modification of the testbed was the replacement of all the
existing components of the VACR system with high efficiency ones, including a variable
speed compressor and variable speed fans, as well as high efficiency heat exchangers.
The field data acquisition was initiated on a pilot stationary A/C-R system to gain
experience before moving to the challenging mobile A/C-R systems, which was the
major goal of this project. The required data collecting equipment were determined,
purchased, and tested during the study of stationary system. The data was collected for
a period of three months and analyzed in this chapter. The duty cycle of the pilot
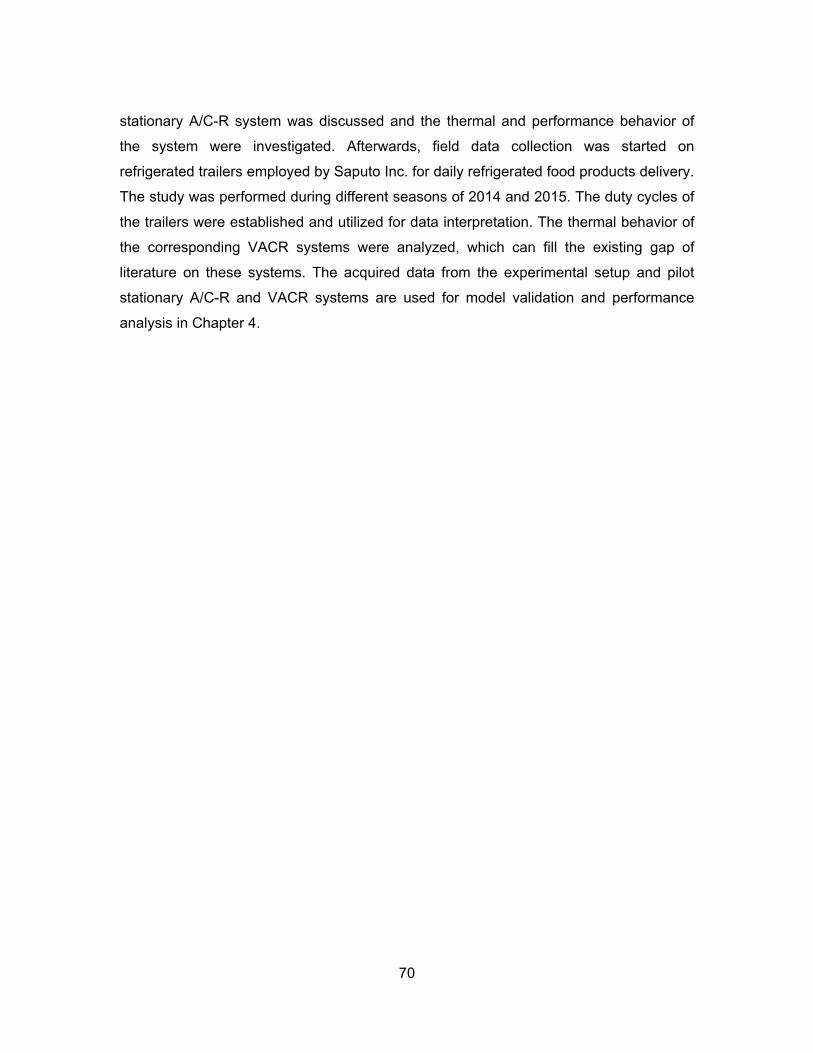
70
stationary A/C-R system was discussed and the thermal and performance behavior of
the system were investigated. Afterwards, field data collection was started on
refrigerated trailers employed by Saputo Inc. for daily refrigerated food products delivery.
The study was performed during different seasons of 2014 and 2015. The duty cycles of
the trailers were established and utilized for data interpretation. The thermal behavior of
the corresponding VACR systems were analyzed, which can fill the existing gap of
literature on these systems. The acquired data from the experimental setup and pilot
stationary A/C-R and VACR systems are used for model validation and performance
analysis in Chapter 4.
71
Chapter 4. Model Validation, Thermal and Performance Investigation
The steady-state, quasi-steady-state and transient mathematical models were
presented in Chapter 2. The developed models are employed in thermal and
performance investigations of the A/C-R systems. In addition, the models are utilized to
develop an optimization-based controller for the proof-of-concept demonstration of high
efficiency VACR. To employ the developed models for these purposes, the accuracy of
their simulations is validated using the obtained experimental and field data. In this
chapter, the model validation is shown and the models are used for thermal and
performance investigations of the stationary and mobile A/C-R systems.
4.1. Steady State Model Validation, Thermal and Performance Investigation
4.1.1. Results relevant to the developed testbed in LAEC
Utilizing the developed testbed in LAEC, the accuracy of the steady state model
is validated. To cover all the operating conditions of a real VACR system, the model
validation is carried out in a wide range of temperature, 20-60 oC for the condenser air
inlet temperature (ambient temperature) and 10-50 oC for the evaporator air inlet
temperature (the conditioned space temperature). The experiments show that it takes
around one hour to arrive at steady state conditions for each test, see Figure 4-1. After
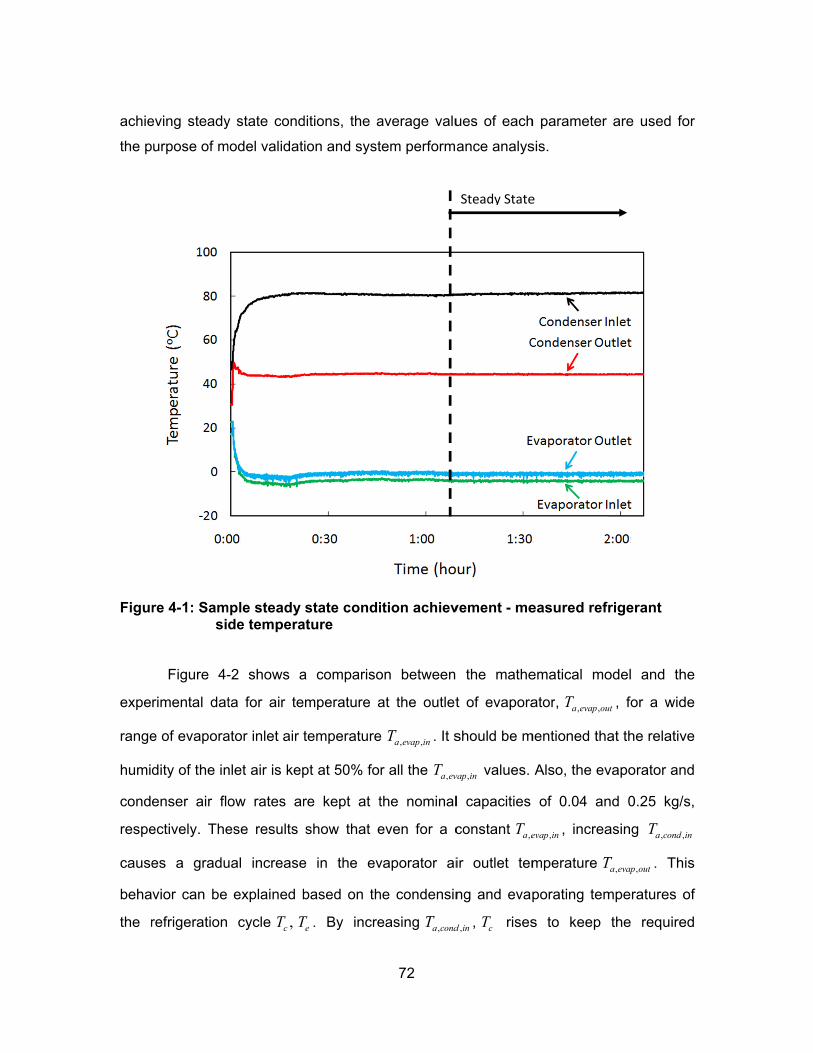
achie
the p
Figur
expe
range
humid
cond
respe
cause
beha
the r
eving steady
urpose of m
re 4-1: Samsi
Figure 4-
rimental dat
e of evapora
dity of the in
enser air flo
ectively. The
es a gradu
vior can be
refrigeration
y state cond
model validat
mple steady de tempera
-2 shows a
ta for air te
ator inlet air t
nlet air is kep
ow rates ar
ese results
ual increase
explained b
cycle ,cT T
ditions, the a
ion and syst
state condiature
a compariso
mperature a
temperature
pt at 50% fo
re kept at t
show that e
e in the ev
based on th
eT . By incre
72
average valu
tem perform
ition achiev
on between
at the outlet
e , ,a evap inT . It s
r all the ,a evT
the nominal
even for a c
vaporator ai
he condensin
easing ,a condT
ues of each
ance analys
vement - me
the mathe
t of evapora
should be m
,vap in values.
l capacities
constant ,a eT
ir outlet tem
ng and evap
,d in , cT rises
Steady State
h parameter
sis.
easured refr
ematical mo
ator, , ,a evap ouT
mentioned tha
Also, the ev
of 0.04 an
,evap in , increa
mperature T
porating tem
s to keep
e
are used fo
rigerant
odel and th
ut , for a wid
at the relativ
vaporator an
nd 0.25 kg/s
asing , ,a condT
, ,a evap outT . Th
mperatures o
the require
or
he
de
ve
nd
s,
in
is
of
ed
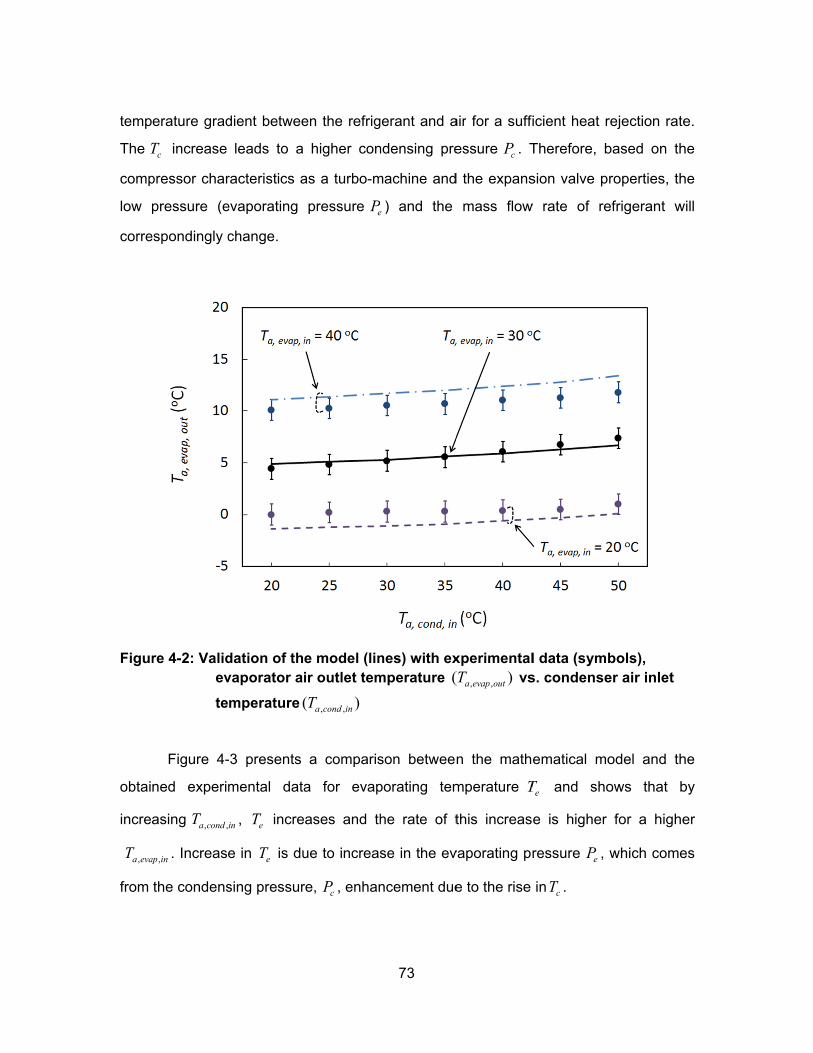
temp
The T
comp
low
corre
Figur
obtai
incre
,a evapT
from
erature grad
cT increase
pressor char
pressure (e
espondingly c
re 4-2: Validev
te
Figure 4-
ned experi
asing , ,a condT
,ap in . Increas
the condens
dient betwee
leads to a
racteristics a
evaporating
change.
dation of thvaporator ai
mperature (
-3 presents
mental data
in , eT incre
e in eT is du
sing pressur
en the refrig
higher con
as a turbo-m
pressure eP
e model (linir outlet tem
, ,( )a cond inT
a comparis
a for evap
ases and th
ue to increas
re, cP , enhan
73
gerant and a
ndensing pre
machine and
e ) and the
nes) with exmperature (
son betwee
porating tem
he rate of t
se in the ev
ncement due
air for a suffi
essure cP . T
d the expans
mass flow
xperimental
, ,( )a evap outT vs
n the math
mperature T
this increas
vaporating pr
e to the rise
icient heat r
Therefore, b
sion valve p
w rate of re
l data (symbs. condense
ematical mo
eT and sho
e is higher
ressure eP ,
in cT .
rejection rate
based on th
roperties, th
efrigerant w
bols), er air inlet
odel and th
ows that b
for a highe
which come
e.
he
he
will
he
by
er
es
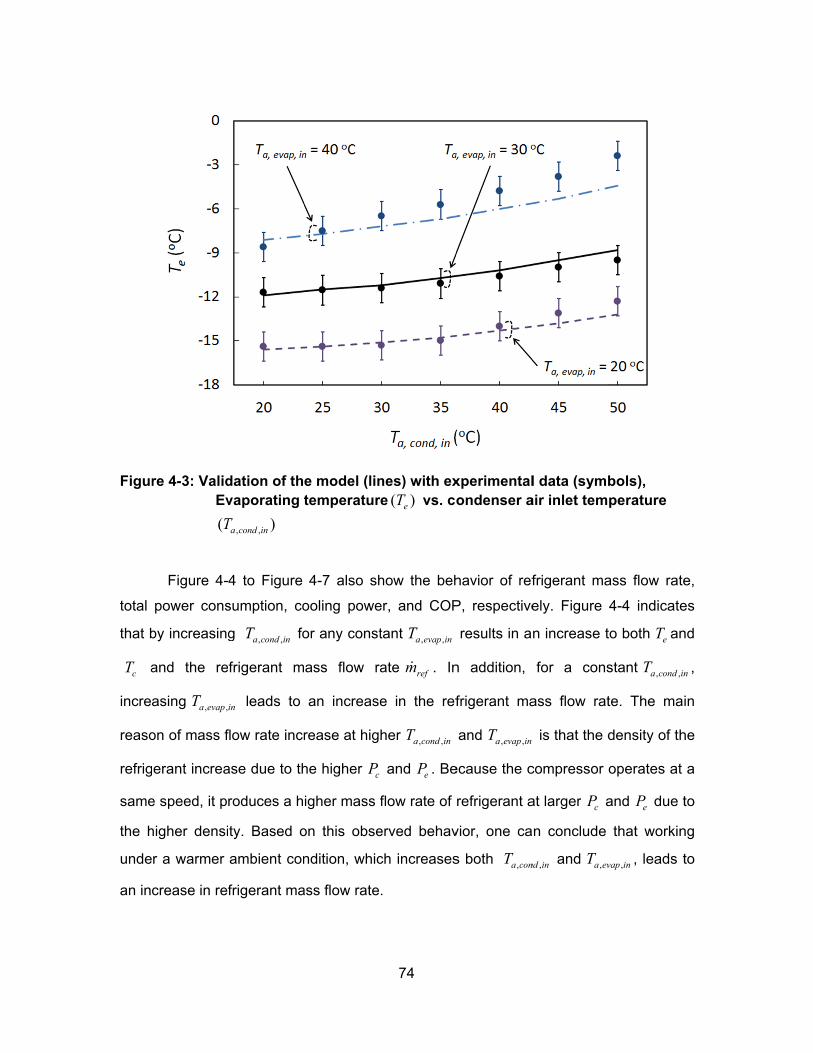
Figur
total
that b
cT a
incre
reaso
refrig
same
the h
unde
an in
re 4-3: ValidEv
(T
Figure 4-
power cons
by increasing
and the re
asing , ,a evapT
on of mass f
erant increa
e speed, it p
higher densi
r a warmer
crease in ref
dation of thvaporating t
, , )a cond inT
4 to Figure
sumption, co
g , ,a cond inT fo
frigerant m
in leads to
flow rate incr
ase due to th
roduces a h
ty. Based o
ambient con
frigerant ma
e model (lintemperatur
4-7 also sh
ooling powe
or any const
ass flow ra
an increase
rease at hig
he higher cP
igher mass f
on this obse
ndition, whic
ass flow rate
74
nes) with exre ( )eT vs. co
how the beh
er, and COP
tant , ,a evap inT
ate refm . In
e in the ref
her , ,a cond inT
and eP . Be
flow rate of
erved behav
ch increases
.
xperimentalondenser a
havior of ref
P, respective
results in a
n addition,
frigerant ma
and , ,a evap inT
ecause the c
refrigerant a
vior, one ca
s both ,a conT
l data (symbair inlet tem
frigerant ma
ely. Figure
n increase t
for a cons
ass flow rat
is that the d
compressor
at larger cP a
n conclude
,nd in and ,a evT
bols), perature
ass flow rate
4-4 indicate
to both eT an
stant , ,a cond inT
te. The mai
density of th
operates at
and eP due t
that workin
,vap in , leads t
e,
es
nd
n ,
in
he
a
to
ng
to
75
Due to the increase in refrigerant mass flow rate as well as the pressure ratio
changes, the total power consumption increases with increasing , ,a cond inT ; see Figure 4-5.
The same trend exists for increases in , ,a evap inT at any constant , ,a cond inT . This behavior
indicates that in warmer areas, a refrigeration unit draws more full-load power than in
colder areas. Furthermore, as can be observed in Figure 4-6, by increasing , ,a cond inT for
a constant , ,a evap inT , the cooling capacity of the system decreases. By recalling the
behavior of evaporating temperature eT from Figure 4-3, the cooling capacity decrease
can be explained. This decrease is a result of air-refrigerant temperature difference
reduction due to increase in eT from increasing , ,a cond inT for a constant , ,a evap inT . However,
this figure shows that for any constant , ,a cond inT , increasing , ,a evap inT results in a higher
cooling capacity of the system. Therefore, increasing the ambient temperature (higher
, ,a cond inT and , ,a evap inT ) may increase or decrease the total cooling capacity of the system.
The thermal insulation of the conditioned space can be decisive for this behavior.
If the thermal insulation of the conditioned space prevents a large temperature rise
inside the space after a large increase in ambient temperature (increasing , ,a cond inT for
almost a constant , ,a evap inT ), the cooling capacity of the system will drop. However, if poor
insulation lets the indoor temperature increase with increases in ambient temperature,
the cooling provided by the system will increase though the total efficiency degrades due
to higher thermal losses. Furthermore, for any constant , ,a evap inT , the power consumption
increase and cooling capacity decrease of the system with increasing , ,a cond inT leads to a
COP decrease that can be observed in Figure 4-7. However, increasing , ,a evap inT for any
constant , ,a cond inT slightly increases the system COP. Based on this behavior, one can
conclude that increasing the thermostatic set points of the conditioned space (higher
, ,a evap inT ) for any ambient condition will result in a higher COP.
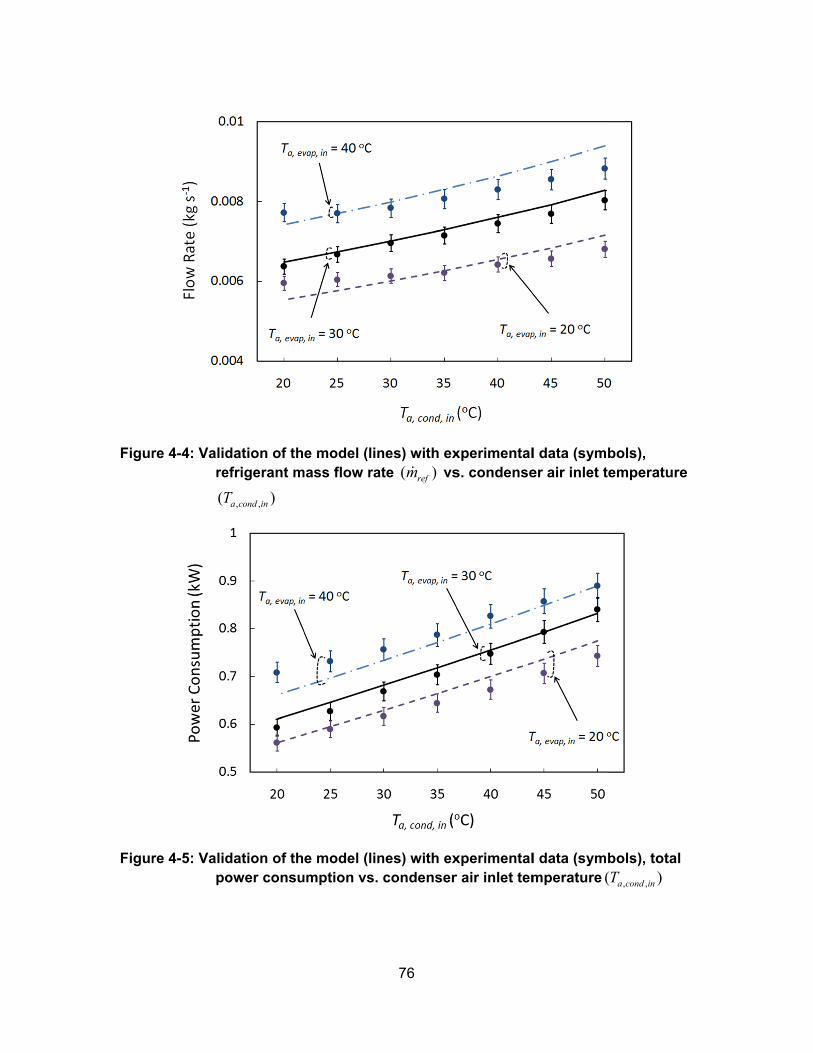
Figur
Figur
re 4-4: Validre
(T
re 4-5: Validpo
dation of thefrigerant m
, , )a cond inT
dation of thower consu
e model (linmass flow ra
e model (linumption vs.
76
nes) with exate ( )refm vs
nes) with excondenser
xperimentals. condense
xperimentalr air inlet tem
l data (symber air inlet te
l data (symbmperature (
bols), emperature
bols), total
, ,( )a cond inT
e
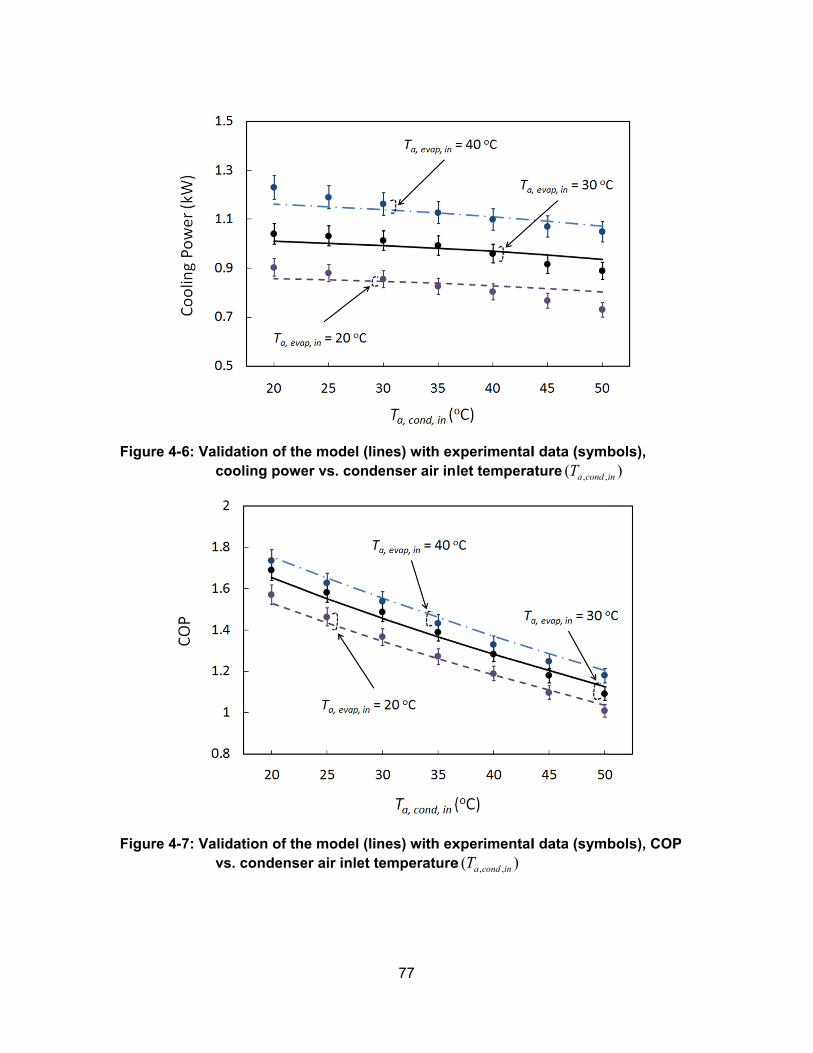
Figur
Figur
re 4-6: Validco
re 4-7: Validvs
dation of thooling powe
dation of ths. condense
e model (liner vs. conde
e model (liner air inlet te
77
nes) with exenser air in
nes) with exemperature
xperimentallet tempera
xperimentale , ,( )a cond inT
l data (symbature , ,( a cond iT
l data (symb
bols), )in
bols), COP
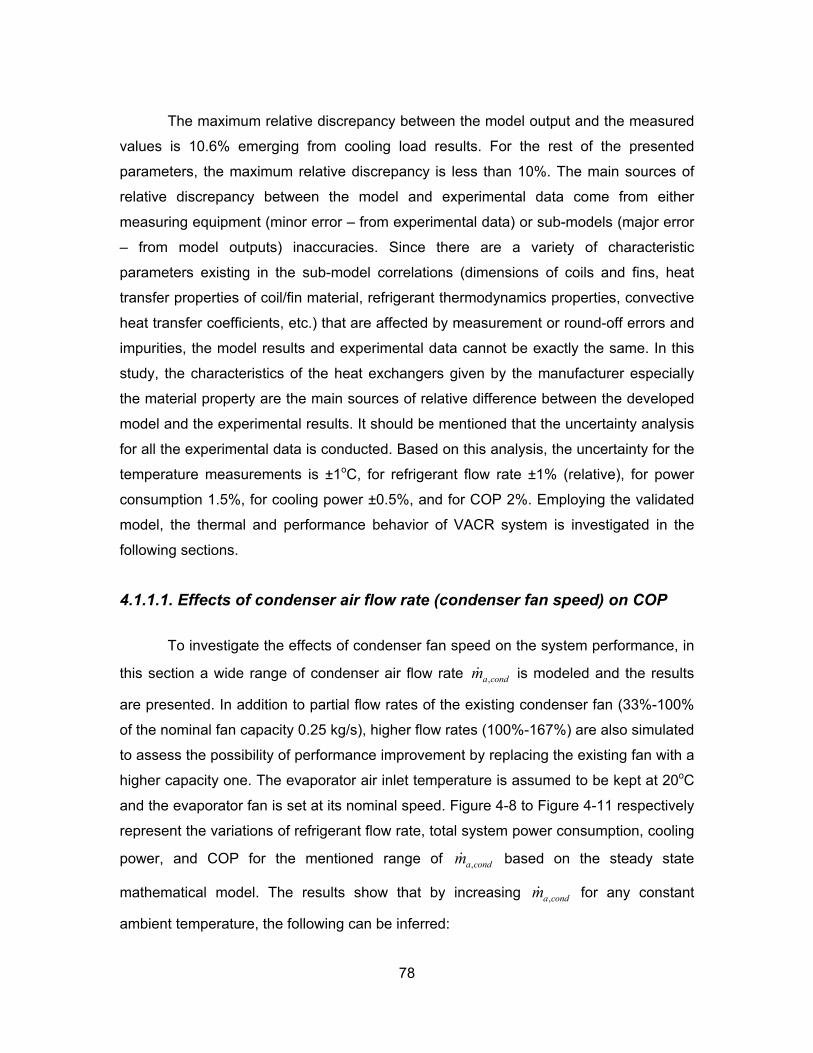
78
The maximum relative discrepancy between the model output and the measured
values is 10.6% emerging from cooling load results. For the rest of the presented
parameters, the maximum relative discrepancy is less than 10%. The main sources of
relative discrepancy between the model and experimental data come from either
measuring equipment (minor error – from experimental data) or sub-models (major error
– from model outputs) inaccuracies. Since there are a variety of characteristic
parameters existing in the sub-model correlations (dimensions of coils and fins, heat
transfer properties of coil/fin material, refrigerant thermodynamics properties, convective
heat transfer coefficients, etc.) that are affected by measurement or round-off errors and
impurities, the model results and experimental data cannot be exactly the same. In this
study, the characteristics of the heat exchangers given by the manufacturer especially
the material property are the main sources of relative difference between the developed
model and the experimental results. It should be mentioned that the uncertainty analysis
for all the experimental data is conducted. Based on this analysis, the uncertainty for the
temperature measurements is ±1oC, for refrigerant flow rate ±1% (relative), for power
consumption 1.5%, for cooling power ±0.5%, and for COP 2%. Employing the validated
model, the thermal and performance behavior of VACR system is investigated in the
following sections.
4.1.1.1. Effects of condenser air flow rate (condenser fan speed) on COP
To investigate the effects of condenser fan speed on the system performance, in
this section a wide range of condenser air flow rate ,a condm is modeled and the results
are presented. In addition to partial flow rates of the existing condenser fan (33%-100%
of the nominal fan capacity 0.25 kg/s), higher flow rates (100%-167%) are also simulated
to assess the possibility of performance improvement by replacing the existing fan with a
higher capacity one. The evaporator air inlet temperature is assumed to be kept at 20oC
and the evaporator fan is set at its nominal speed. Figure 4-8 to Figure 4-11 respectively
represent the variations of refrigerant flow rate, total system power consumption, cooling
power, and COP for the mentioned range of ,a condm based on the steady state
mathematical model. The results show that by increasing ,a condm for any constant
ambient temperature, the following can be inferred:
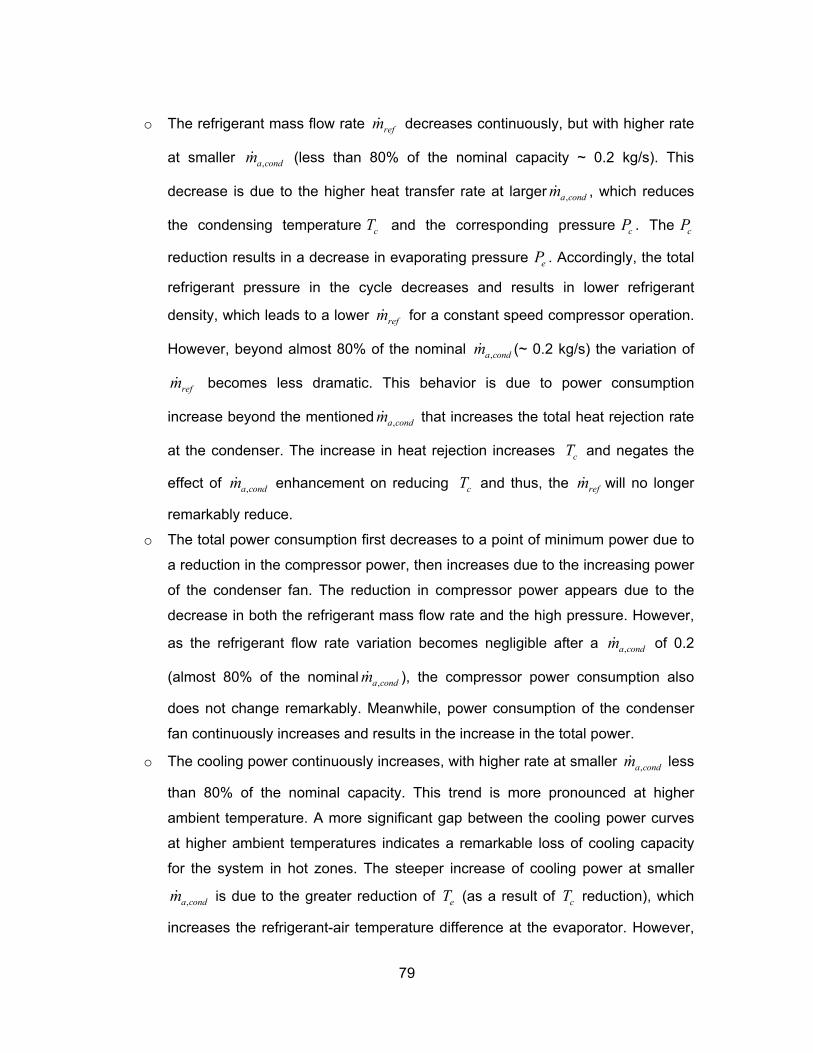
79
o The refrigerant mass flow rate refm decreases continuously, but with higher rate
at smaller ,a condm (less than 80% of the nominal capacity ~ 0.2 kg/s). This
decrease is due to the higher heat transfer rate at larger ,a condm , which reduces
the condensing temperature cT and the corresponding pressure cP . The cP
reduction results in a decrease in evaporating pressure eP . Accordingly, the total
refrigerant pressure in the cycle decreases and results in lower refrigerant
density, which leads to a lower refm for a constant speed compressor operation.
However, beyond almost 80% of the nominal ,a condm (~ 0.2 kg/s) the variation of
refm becomes less dramatic. This behavior is due to power consumption
increase beyond the mentioned ,a condm that increases the total heat rejection rate
at the condenser. The increase in heat rejection increases cT and negates the
effect of ,a condm enhancement on reducing cT and thus, the refm will no longer
remarkably reduce.
o The total power consumption first decreases to a point of minimum power due to
a reduction in the compressor power, then increases due to the increasing power
of the condenser fan. The reduction in compressor power appears due to the
decrease in both the refrigerant mass flow rate and the high pressure. However,
as the refrigerant flow rate variation becomes negligible after a ,a condm of 0.2
(almost 80% of the nominal ,a condm ), the compressor power consumption also
does not change remarkably. Meanwhile, power consumption of the condenser
fan continuously increases and results in the increase in the total power.
o The cooling power continuously increases, with higher rate at smaller ,a condm less
than 80% of the nominal capacity. This trend is more pronounced at higher
ambient temperature. A more significant gap between the cooling power curves
at higher ambient temperatures indicates a remarkable loss of cooling capacity
for the system in hot zones. The steeper increase of cooling power at smaller
,a condm is due to the greater reduction of eT (as a result of cT reduction), which
increases the refrigerant-air temperature difference at the evaporator. However,
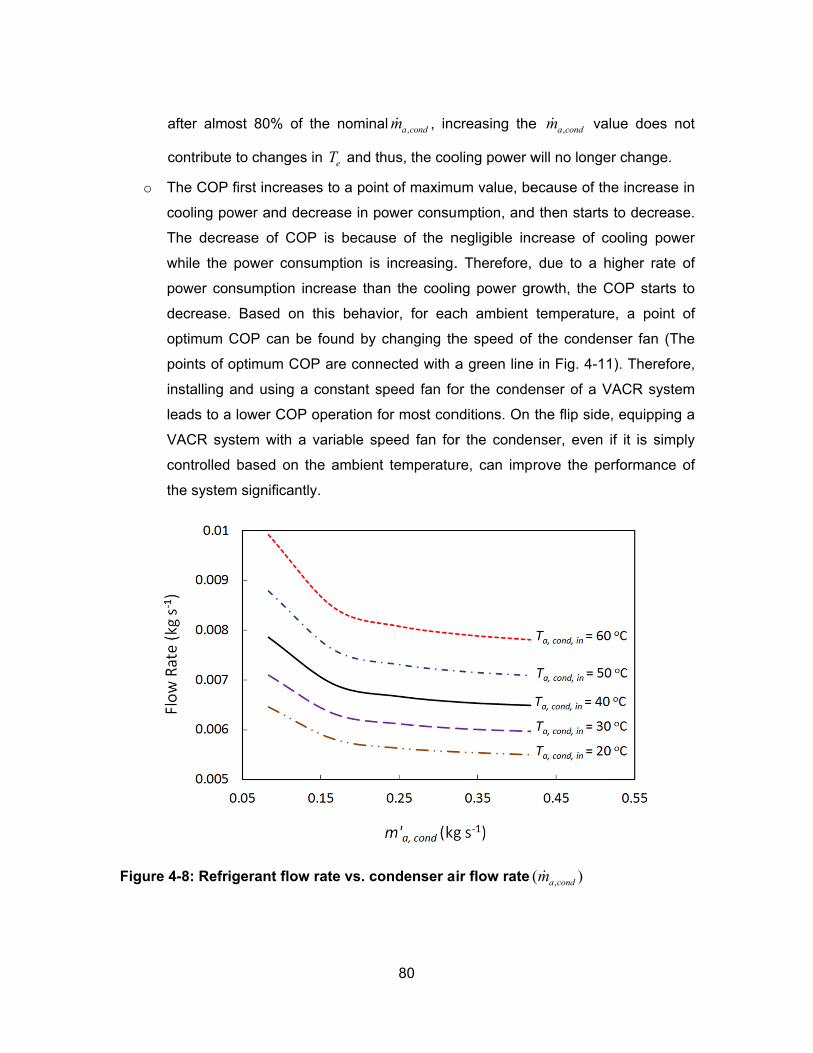
o
Figur
after almo
contribute
The COP
cooling po
The decre
while the
power co
decrease
optimum
points of
installing
leads to a
VACR sy
controlled
the system
re 4-8: Refr
ost 80% of
e to changes
first increas
ower and de
ease of CO
power cons
nsumption i
. Based on
COP can b
optimum CO
and using a
a lower COP
stem with a
d based on
m significant
igerant flow
the nomina
s in eT and t
ses to a poin
ecrease in p
OP is becau
sumption is
ncrease tha
this behav
e found by
OP are conn
a constant s
P operation f
a variable sp
the ambient
tly.
w rate vs. co
80
al ,a condm , inc
hus, the coo
nt of maximu
power consu
use of the n
increasing.
an the coolin
vior, for eac
changing th
nected with a
speed fan fo
for most con
peed fan for
t temperatu
ondenser ai
creasing the
oling power w
um value, be
mption, and
negligible inc
. Therefore,
ng power gr
ch ambient
he speed of
a green line
or the conde
nditions. On
r the conde
re, can imp
ir flow rate
e ,a condm va
will no longe
ecause of th
d then starts
crease of c
due to a h
rowth, the C
temperature
f the conden
e in Fig. 4-11
enser of a V
the flip side
nser, even
rove the pe
,( )a condm
lue does no
er change.
he increase i
to decrease
cooling powe
higher rate o
COP starts t
e, a point o
nser fan (Th
1). Therefore
VACR system
e, equipping
if it is simp
erformance o
ot
in
e.
er
of
to
of
he
e,
m
a
ly
of
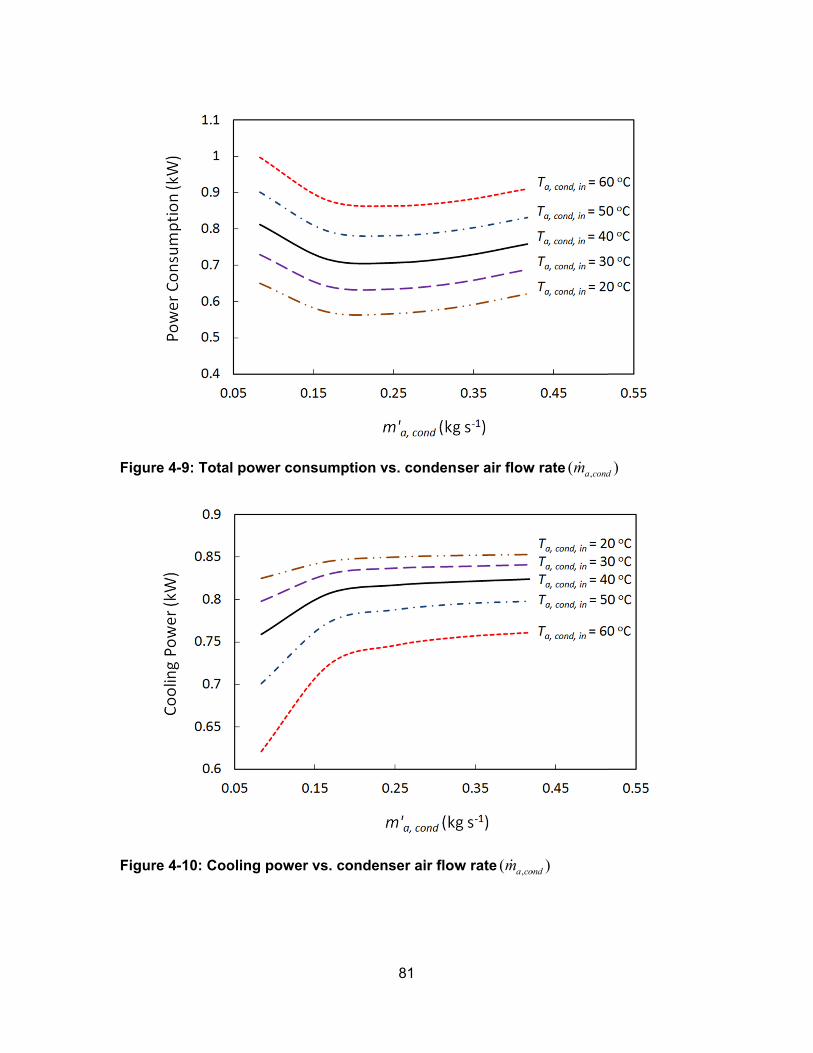
Figur
Figur
re 4-9: Tota
re 4-10: Coo
al power con
oling power
nsumption
r vs. conde
81
vs. conden
nser air flow
ser air flow
w rate ,( a com
w rate ,( a condm
)ond
)d
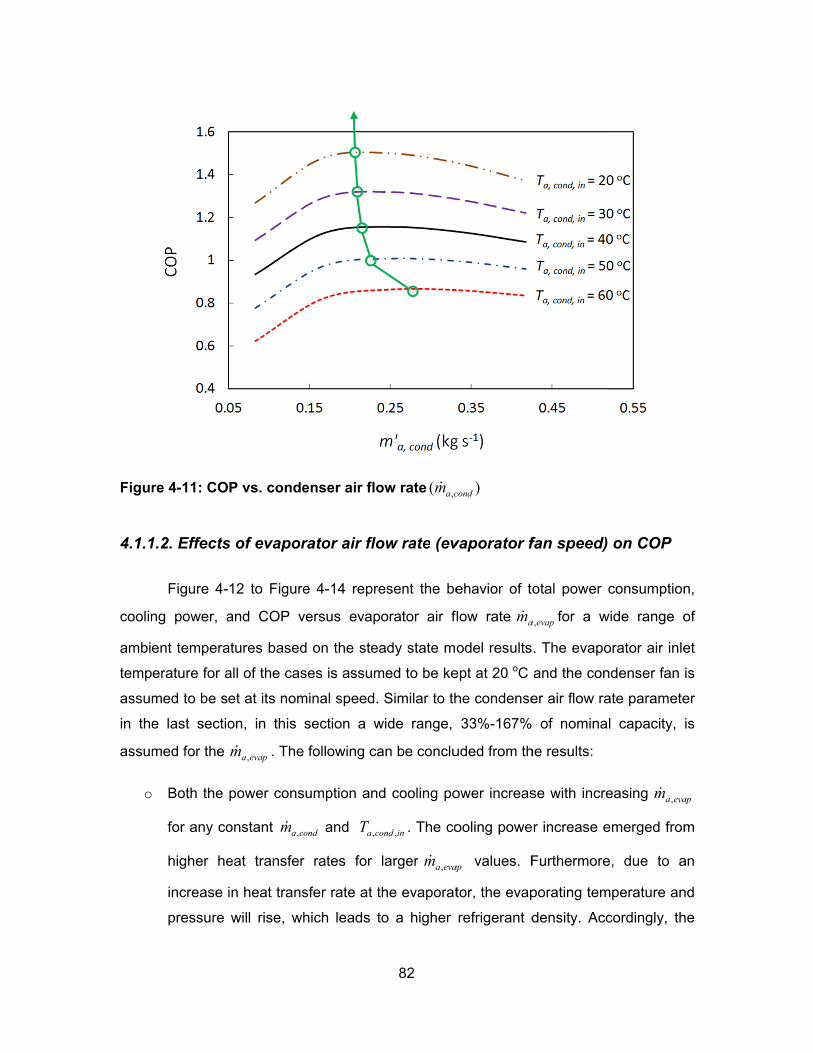
Figur
4.1.1
coolin
ambie
temp
assum
in the
assum
o
re 4-11: CO
1.2. Effects
Figure 4-
ng power, a
ent tempera
erature for a
med to be s
e last sectio
med for the
Both the
for any co
higher he
increase
pressure
P vs. conde
s of evapor
12 to Figure
and COP v
atures based
all of the cas
et at its nom
on, in this
,a evapm . The
power cons
onstant ,a com
eat transfer
in heat trans
will rise, wh
enser air flo
rator air flo
e 4-14 repre
versus evap
d on the stea
ses is assum
minal speed.
section a w
following ca
umption and
ond and ,a coT
r rates for
sfer rate at t
hich leads t
82
ow rate ,( a cm
ow rate (ev
esent the be
orator air fl
ady state m
med to be ke
Similar to th
wide range,
an be conclu
d cooling po
,ond in . The co
larger ,a evapm
the evaporat
to a higher
)cond
vaporator f
ehavior of to
flow rate am
odel results
ept at 20 oC
he condense
33%-167%
uded from th
ower increas
ooling powe
ap values. F
tor, the evap
refrigerant d
fan speed)
otal power c
,a evap for a w
. The evapo
and the con
er air flow ra
of nomina
he results:
se with incre
r increase e
Furthermore
porating tem
density. Acc
on COP
consumption
wide range o
orator air inle
ndenser fan
ate paramete
l capacity,
easing ,a evam
emerged from
e, due to a
mperature an
cordingly, th
n,
of
et
is
er
is
ap
m
an
nd
he
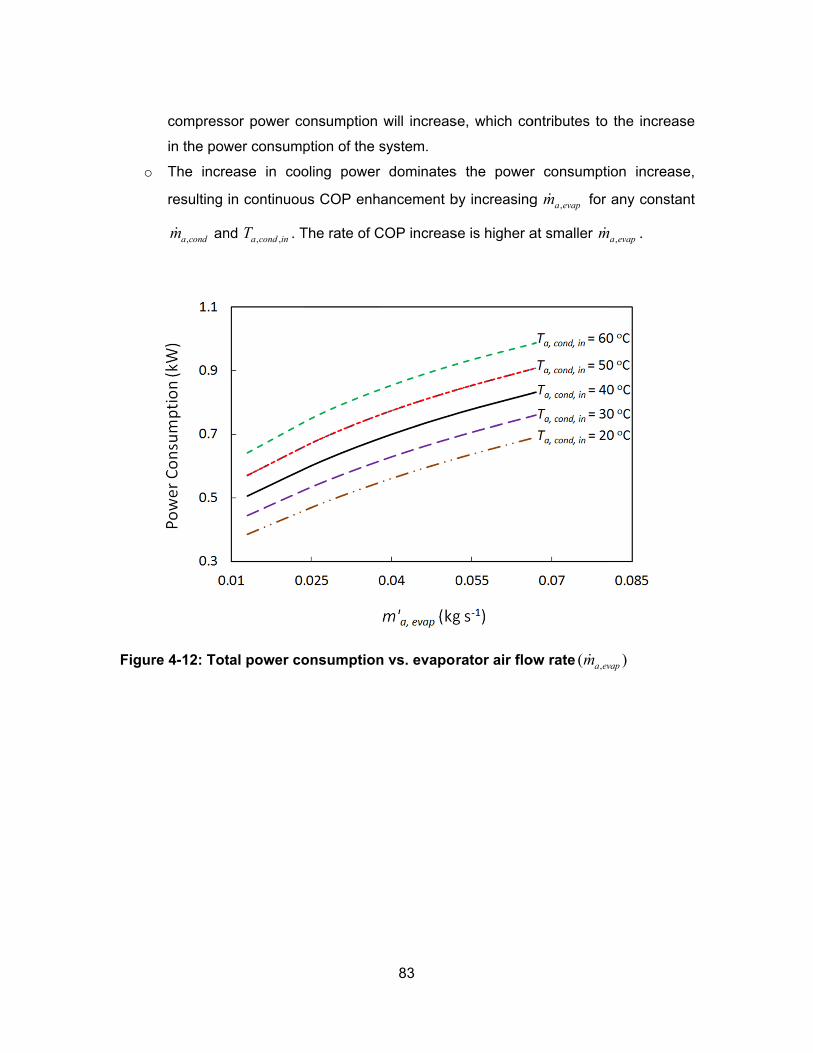
o
Figur
compress
in the pow
The incre
resulting
,a condm an
re 4-12: Tot
sor power co
wer consump
ease in coo
in continuou
nd , ,a cond inT . T
tal power co
onsumption
ption of the s
oling power
us COP enh
The rate of C
onsumption
83
will increas
system.
r dominates
ancement b
COP increas
n vs. evapor
se, which co
s the power
by increasing
se is higher a
rator air flo
ontributes to
r consumpti
g ,a evapm for
at smaller m
ow rate ,( a evm
the increas
ion increase
any constan
,a evapm .
)vap
se
e,
nt
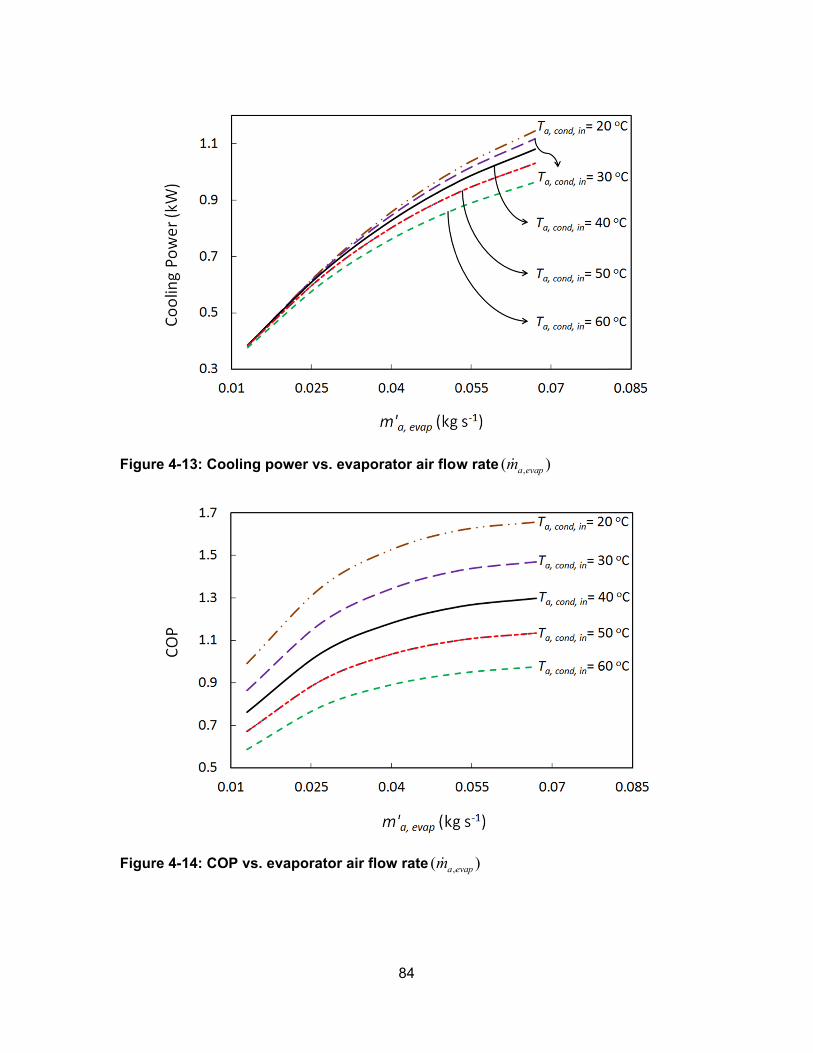
Figur
Figur
re 4-13: Coo
re 4-14: CO
oling power
P vs. evapo
r vs. evapor
orator air flo
84
rator air flow
ow rate ,( a em
w rate ,( a evm
)evap
)vap
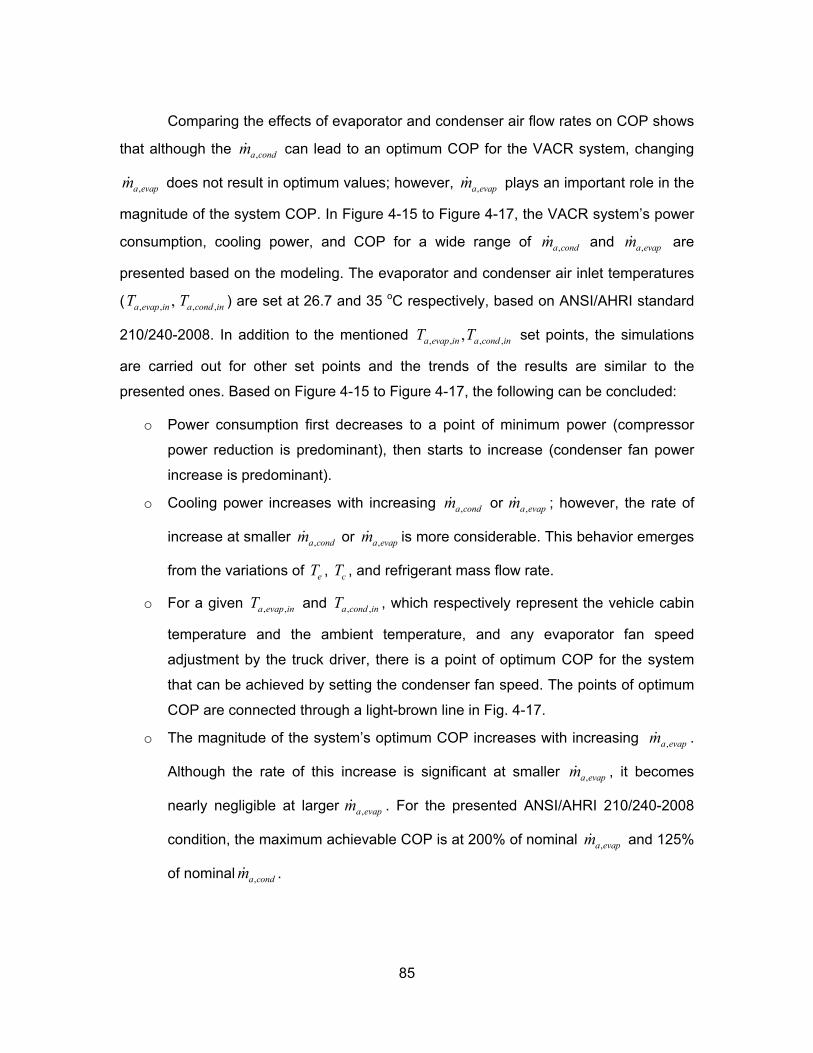
85
Comparing the effects of evaporator and condenser air flow rates on COP shows
that although the ,a condm can lead to an optimum COP for the VACR system, changing
,a evapm does not result in optimum values; however, ,a evapm plays an important role in the
magnitude of the system COP. In Figure 4-15 to Figure 4-17, the VACR system’s power
consumption, cooling power, and COP for a wide range of ,a condm and ,a evapm are
presented based on the modeling. The evaporator and condenser air inlet temperatures
( , , , ,,a evap in a cond inT T ) are set at 26.7 and 35 oC respectively, based on ANSI/AHRI standard
210/240-2008. In addition to the mentioned , , , ,,a evap in a cond inT T set points, the simulations
are carried out for other set points and the trends of the results are similar to the
presented ones. Based on Figure 4-15 to Figure 4-17, the following can be concluded:
o Power consumption first decreases to a point of minimum power (compressor
power reduction is predominant), then starts to increase (condenser fan power
increase is predominant).
o Cooling power increases with increasing ,a condm or ,a evapm ; however, the rate of
increase at smaller ,a condm or ,a evapm is more considerable. This behavior emerges
from the variations of eT , cT , and refrigerant mass flow rate.
o For a given , ,a evap inT and , ,a cond inT , which respectively represent the vehicle cabin
temperature and the ambient temperature, and any evaporator fan speed
adjustment by the truck driver, there is a point of optimum COP for the system
that can be achieved by setting the condenser fan speed. The points of optimum
COP are connected through a light-brown line in Fig. 4-17.
o The magnitude of the system’s optimum COP increases with increasing ,a evapm .
Although the rate of this increase is significant at smaller ,a evapm , it becomes
nearly negligible at larger ,a evapm . For the presented ANSI/AHRI 210/240-2008
condition, the maximum achievable COP is at 200% of nominal ,a evapm and 125%
of nominal ,a condm .
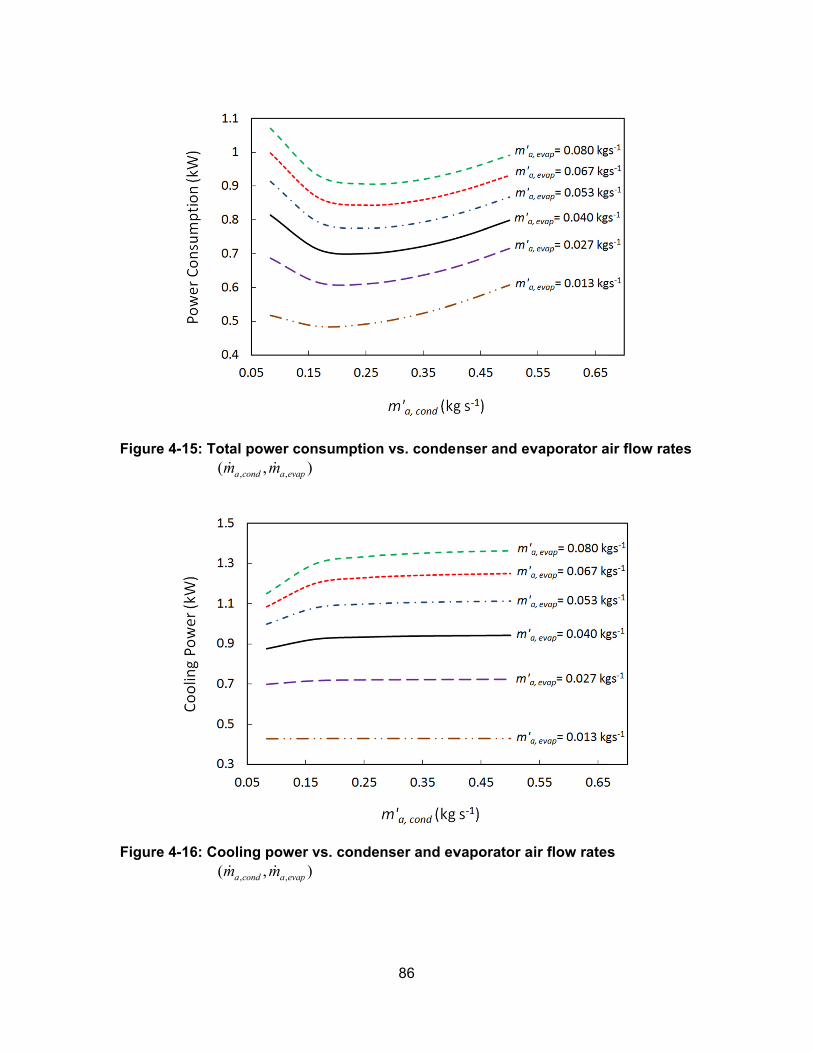
Figur
Figur
re 4-15: Tot(m
re 4-16: Coo(m
tal power co
, ,,a cond a evapm m
oling power
, ,,a cond a evapm m
onsumption)p
r vs. conde)p
86
n vs. conde
nser and ev
nser and ev
vaporator a
vaporator a
air flow rates
air flow rates
s
s
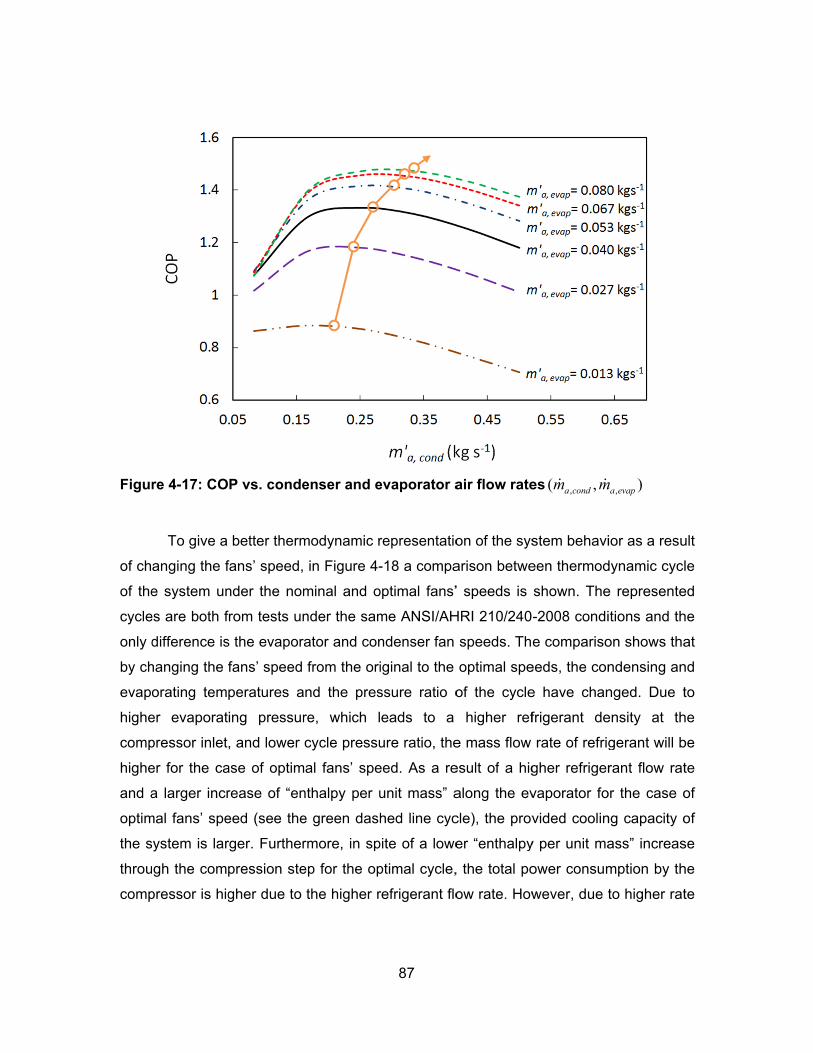
Figur
of ch
of the
cycle
only d
by ch
evapo
highe
comp
highe
and a
optim
the s
throu
comp
re 4-17: CO
To give a
anging the f
e system un
es are both f
difference is
hanging the
orating tem
er evaporat
pressor inlet
er for the ca
a larger incr
mal fans’ spe
ystem is lar
gh the com
pressor is hig
P vs. conde
better therm
fans’ speed,
nder the nom
from tests un
s the evapora
fans’ speed
peratures a
ing pressur
, and lower
ase of optim
rease of “en
eed (see the
rger. Further
pression ste
gher due to
enser and e
modynamic r
in Figure 4-
minal and o
nder the sam
ator and con
from the ori
nd the pres
re, which l
cycle pressu
al fans’ spe
nthalpy per u
e green dash
rmore, in sp
ep for the op
the higher r
87
evaporator a
representatio
-18 a compa
optimal fans’
me ANSI/AH
ndenser fan
iginal to the
ssure ratio o
eads to a
ure ratio, the
eed. As a re
unit mass” a
hed line cyc
pite of a lowe
ptimal cycle,
refrigerant flo
air flow rate
on of the sys
arison betwe
’ speeds is
HRI 210/240
speeds. Th
optimal spe
of the cycle
higher ref
e mass flow
esult of a hig
along the ev
cle), the prov
er “enthalpy
, the total po
ow rate. How
es ,( ,a condm m
stem behavi
een thermod
shown. The
-2008 condi
e compariso
eeds, the con
e have chan
frigerant de
rate of refrig
gher refriger
vaporator fo
vided coolin
y per unit ma
ower consum
wever, due t
, )a evapm
ior as a resu
dynamic cycl
e represente
itions and th
on shows tha
ndensing an
nged. Due t
ensity at th
gerant will b
rant flow rat
or the case o
ng capacity o
ass” increas
mption by th
to higher rat
ult
le
ed
he
at
nd
to
he
be
te
of
of
se
he
te
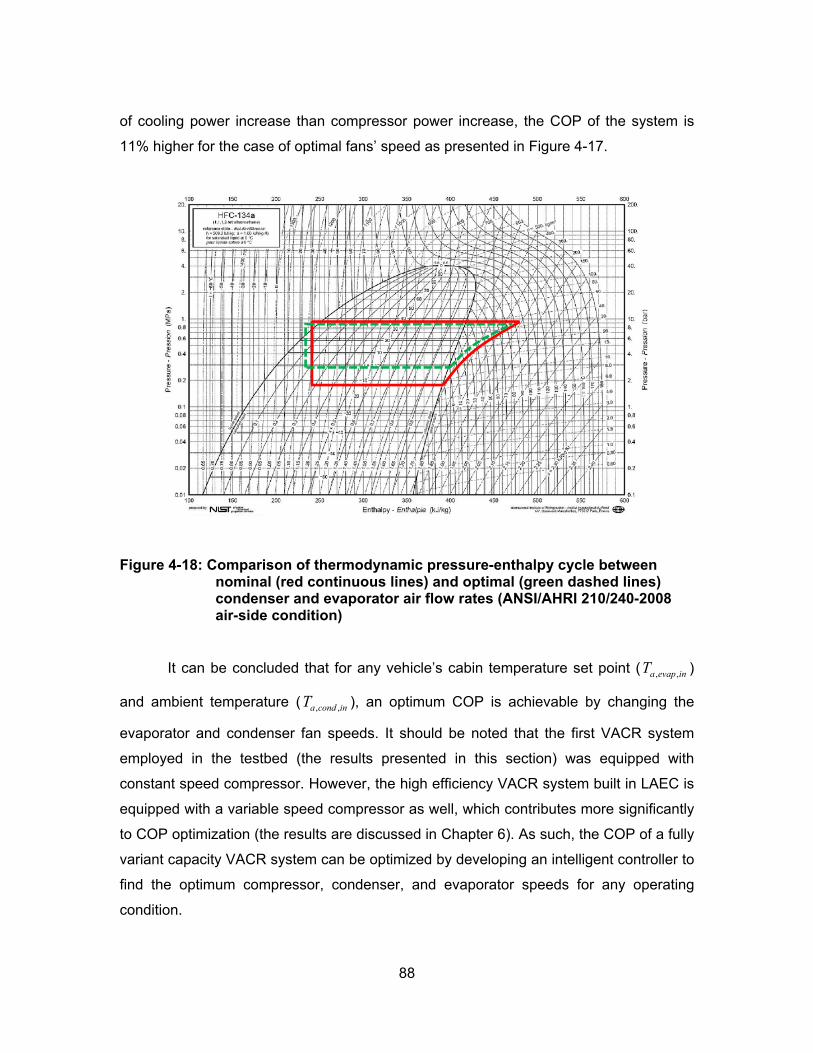
88
of cooling power increase than compressor power increase, the COP of the system is
11% higher for the case of optimal fans’ speed as presented in Figure 4-17.
Figure 4-18: Comparison of thermodynamic pressure-enthalpy cycle between nominal (red continuous lines) and optimal (green dashed lines) condenser and evaporator air flow rates (ANSI/AHRI 210/240-2008 air-side condition)
It can be concluded that for any vehicle’s cabin temperature set point ( , ,a evap inT )
and ambient temperature ( , ,a cond inT ), an optimum COP is achievable by changing the
evaporator and condenser fan speeds. It should be noted that the first VACR system
employed in the testbed (the results presented in this section) was equipped with
constant speed compressor. However, the high efficiency VACR system built in LAEC is
equipped with a variable speed compressor as well, which contributes more significantly
to COP optimization (the results are discussed in Chapter 6). As such, the COP of a fully
variant capacity VACR system can be optimized by developing an intelligent controller to
find the optimum compressor, condenser, and evaporator speeds for any operating
condition.
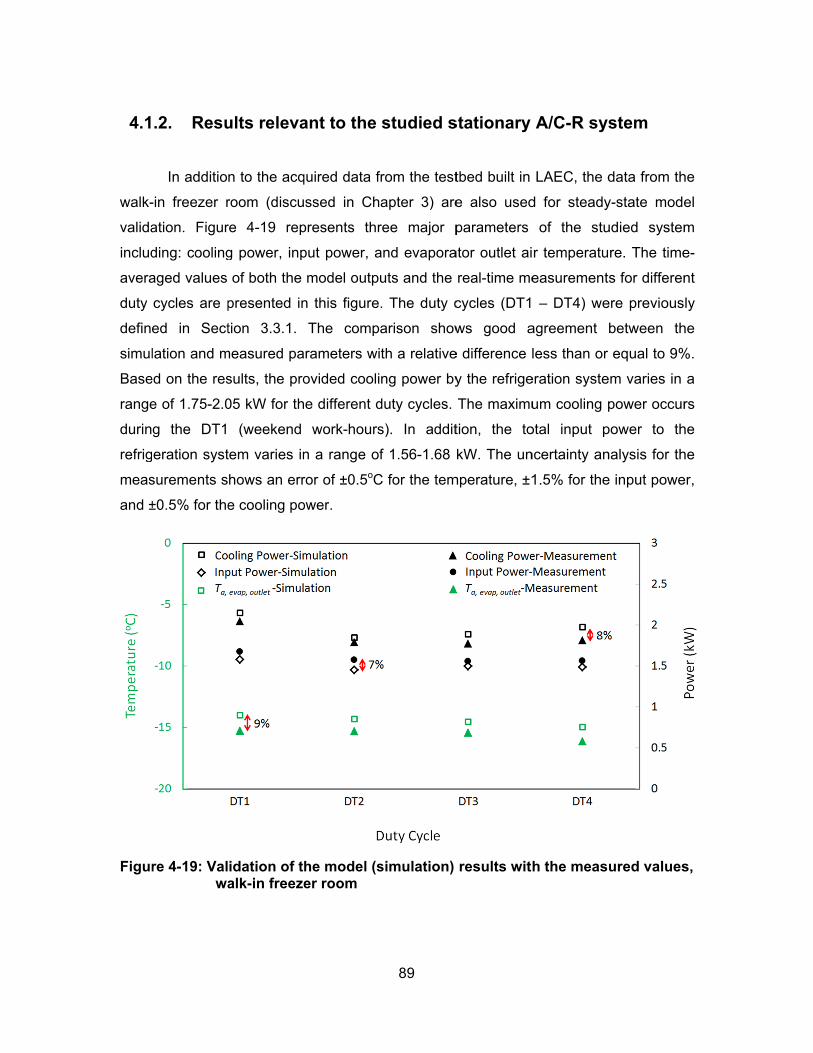
4.1
walk-
valida
includ
avera
duty
defin
simul
Base
range
durin
refrig
meas
and ±
Figur
.2. Resu
In additio
-in freezer r
ation. Figur
ding: cooling
aged values
cycles are p
ed in Sect
lation and m
ed on the res
e of 1.75-2.0
g the DT1
eration syst
surements s
±0.5% for the
re 4-19: Valwa
ults releva
n to the acq
room (discu
re 4-19 rep
g power, inp
of both the
presented in
tion 3.3.1.
measured pa
sults, the pro
05 kW for th
(weekend
tem varies in
hows an err
e cooling po
idation of talk-in freeze
ant to the
quired data f
ssed in Ch
presents thr
put power, a
model outpu
n this figure
The comp
rameters wi
ovided cooli
e different d
work-hours
n a range of
ror of ±0.5oC
ower.
he model (ser room
89
studied s
rom the test
apter 3) are
ree major p
and evapora
uts and the
. The duty c
arison show
th a relative
ng power by
duty cycles.
s). In addit
f 1.56-1.68
C for the tem
simulation)
stationary
tbed built in
e also used
parameters
ator outlet ai
real-time me
cycles (DT1
ws good a
e difference l
y the refrige
The maximu
tion, the to
kW. The un
mperature, ±1
results wit
A/C-R sys
LAEC, the d
d for steady
of the stu
r temperatu
easurement
– DT4) we
agreement
less than or
eration syste
um cooling p
otal input p
ncertainty an
1.5% for the
h the meas
stem
data from th
y-state mode
udied system
re. The time
s for differen
ere previous
between th
equal to 9%
em varies in
power occur
power to th
nalysis for th
e input powe
ured values
he
el
m
e-
nt
ly
he
%.
a
rs
he
he
er,
s,
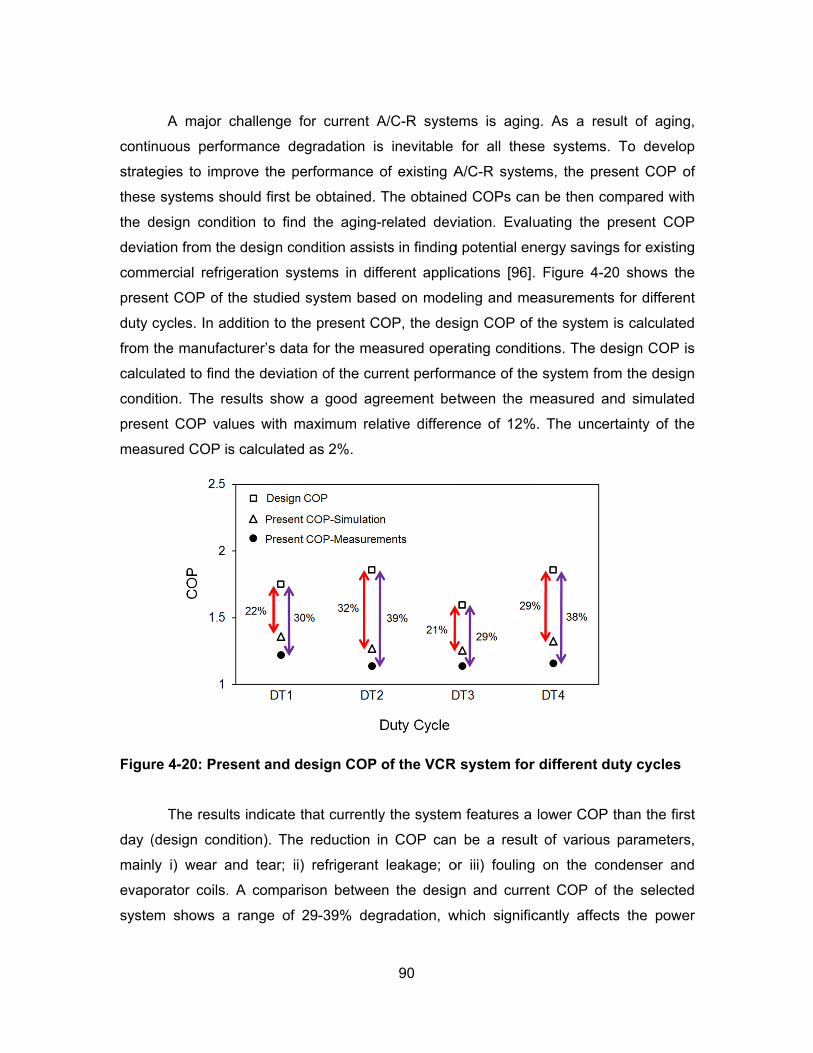
contin
strate
these
the d
devia
comm
prese
duty
from
calcu
cond
prese
meas
Figur
day (
main
evapo
syste
A major
nuous perfo
egies to imp
e systems sh
design cond
ation from th
mercial refrig
ent COP of t
cycles. In ad
the manufac
ulated to find
ition. The re
ent COP va
sured COP i
re 4-20: Pre
The resul
(design con
ly i) wear a
orator coils.
em shows a
challenge fo
ormance de
prove the pe
hould first be
ition to find
e design con
geration sys
the studied
ddition to the
cturer’s data
d the deviatio
esults show
lues with m
s calculated
esent and de
ts indicate t
dition). The
and tear; ii)
A compari
a range of 2
or current A
gradation is
erformance o
e obtained.
d the aging-
ndition assis
stems in diff
system bas
e present C
a for the me
on of the cur
a good ag
maximum rela
as 2%.
esign COP
hat currently
reduction i
refrigerant
son betwee
29-39% deg
90
A/C-R syste
s inevitable
of existing A
The obtaine
-related dev
sts in finding
ferent applic
ed on mode
OP, the des
asured oper
rrent perform
reement be
ative differe
of the VCR
y the system
n COP can
leakage; o
en the desig
gradation, w
ems is aging
for all thes
A/C-R syste
ed COPs ca
viation. Eval
g potential en
cations [96]
eling and me
sign COP of
rating condit
mance of the
etween the m
ence of 12%
system for
m features a
be a resul
or iii) fouling
gn and curre
which signific
g. As a res
se systems.
ems, the pre
n be then co
uating the p
nergy saving
. Figure 4-2
easurements
f the system
tions. The d
e system fro
measured a
%. The unce
r different d
lower COP
lt of various
g on the co
ent COP of
cantly affec
sult of aging
. To develo
esent COP o
ompared wit
present CO
gs for existin
20 shows th
s for differen
is calculate
esign COP
om the desig
and simulate
ertainty of th
duty cycles
than the firs
s parameters
ondenser an
the selecte
ts the powe
g,
op
of
th
P
ng
he
nt
ed
is
gn
ed
he
st
s,
nd
ed
er
91
consumption of the system. It should be noted that an electric defroster is installed on
the evaporator coil of the system to melt down the formed ice repeatedly. Based on the
simulation and measurements, the A/C-R system (including its defroster) currently
consumes 16,300 kWh/yr, which is 4,600 kWh/yr more than a new system (brand new of
the same condensing unit). This significantly higher energy consumption indicates the
necessity of either replacing the current system with an efficient A/C-R system or
resolving the performance-related issues of it.
The on-site observations indicate that the system is relatively new (~only 10
years old); fairly well designed; and well maintained. From the calculated COP values,
one can conclude that even for such a relatively new refrigeration system a significant
degradation takes place over years. There are many refrigeration units running around
the world that are older than the studied system. Accordingly, a significant amount of
energy can be saved worldwide by replacing or improving the efficiency of old
commercial refrigeration units.
Based on the calculated relatively high energy consumption of this system and
the large efficiency degradation over its life cycle, implementing performance
improvement technologies can have significant results (see Ref. [87]). During the
measurements, it was observed that the timer-based defrosting system consumed a
large amount of energy and released a frequent and significant heat load into the freezer
room. Utilization of defrosting systems for any freezer room is inevitable due to
continuous ice formation on the evaporator coil, which significantly reduces the thermal
conductivity of the coil. However, timer-based defrosters (employed in the current A/C-R
system) are one of the inefficient types that can be replaced by humidity-based
defrosters. In the current freezer room, the compressor is shut off during the defrost
cycle (every 6 hours) and a 1,600 W heater is turned on for heating the surface of
evaporator coil to melt down the formed ice layer. Based on the on-site observations and
temperature/humidity measurements, more than half of the defrosting cycles, especially
during the restaurant’s “off-hours” duty cycles, are unnecessary. The measurements and
calculations show that more than 1,400 kWh/yr, equal to 9% of the total energy
consumption of the VCR system, can be saved if the timer-based defroster is replaced
by a humidity-based controlled type.
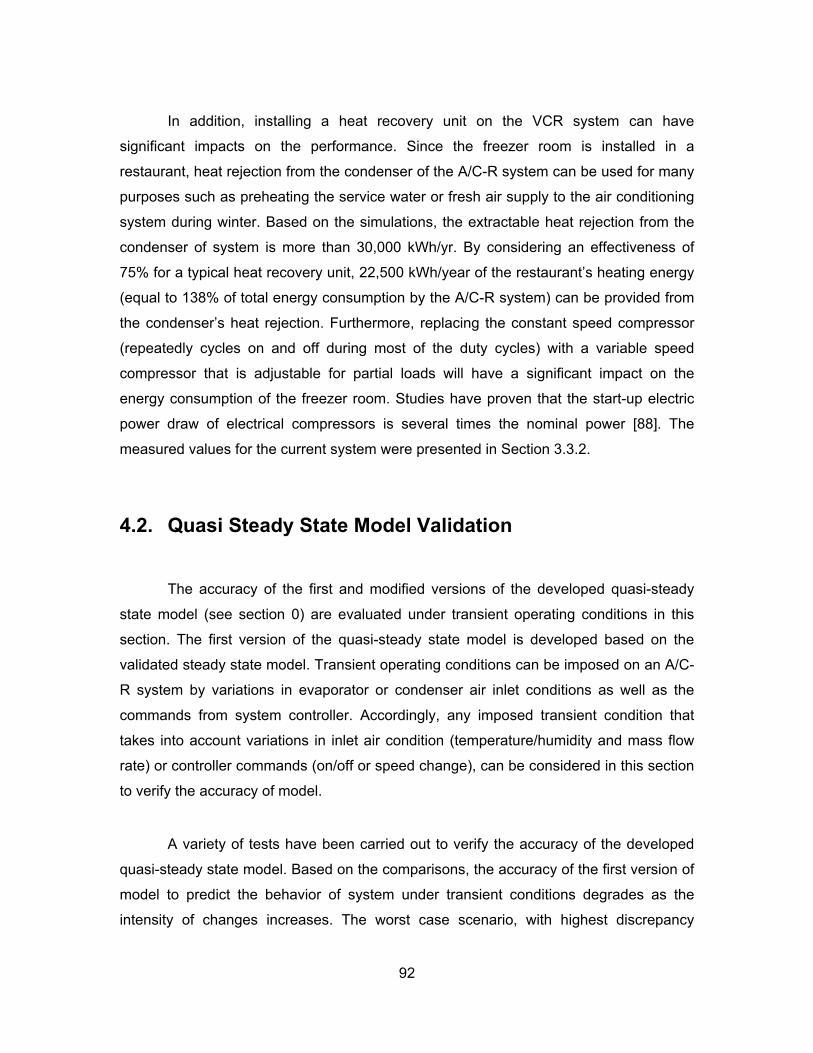
92
In addition, installing a heat recovery unit on the VCR system can have
significant impacts on the performance. Since the freezer room is installed in a
restaurant, heat rejection from the condenser of the A/C-R system can be used for many
purposes such as preheating the service water or fresh air supply to the air conditioning
system during winter. Based on the simulations, the extractable heat rejection from the
condenser of system is more than 30,000 kWh/yr. By considering an effectiveness of
75% for a typical heat recovery unit, 22,500 kWh/year of the restaurant’s heating energy
(equal to 138% of total energy consumption by the A/C-R system) can be provided from
the condenser’s heat rejection. Furthermore, replacing the constant speed compressor
(repeatedly cycles on and off during most of the duty cycles) with a variable speed
compressor that is adjustable for partial loads will have a significant impact on the
energy consumption of the freezer room. Studies have proven that the start-up electric
power draw of electrical compressors is several times the nominal power [88]. The
measured values for the current system were presented in Section 3.3.2.
4.2. Quasi Steady State Model Validation
The accuracy of the first and modified versions of the developed quasi-steady
state model (see section 0) are evaluated under transient operating conditions in this
section. The first version of the quasi-steady state model is developed based on the
validated steady state model. Transient operating conditions can be imposed on an A/C-
R system by variations in evaporator or condenser air inlet conditions as well as the
commands from system controller. Accordingly, any imposed transient condition that
takes into account variations in inlet air condition (temperature/humidity and mass flow
rate) or controller commands (on/off or speed change), can be considered in this section
to verify the accuracy of model.
A variety of tests have been carried out to verify the accuracy of the developed
quasi-steady state model. Based on the comparisons, the accuracy of the first version of
model to predict the behavior of system under transient conditions degrades as the
intensity of changes increases. The worst case scenario, with highest discrepancy
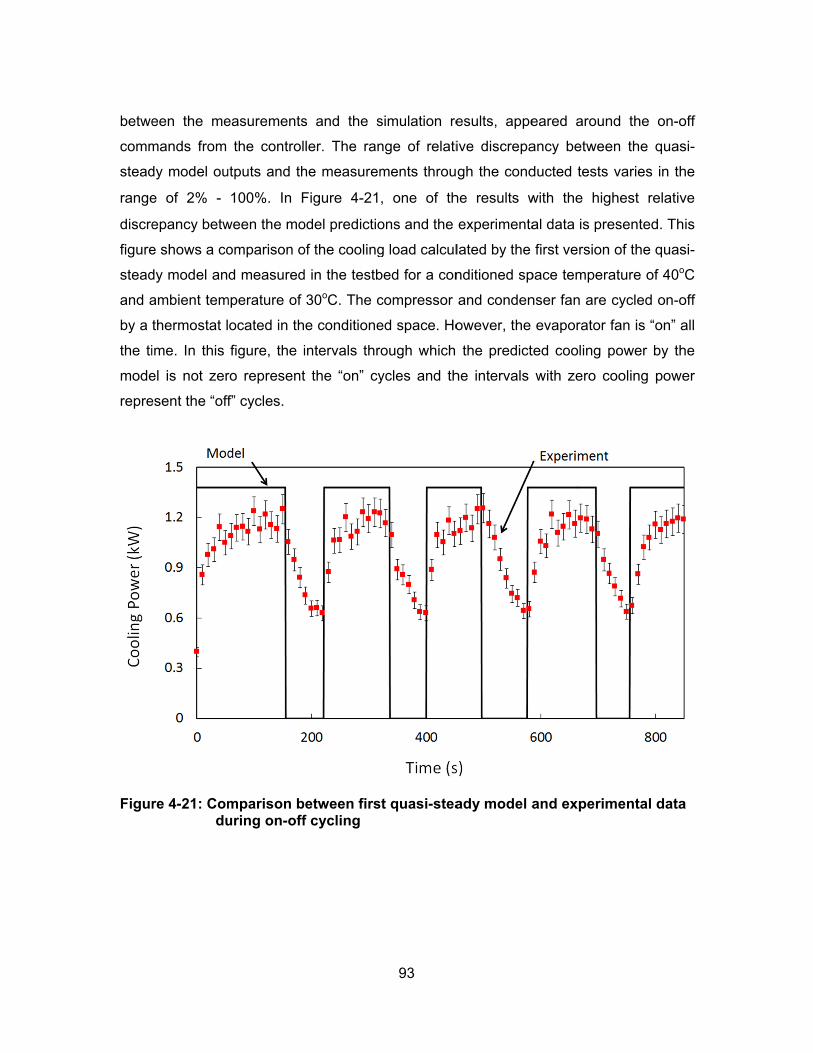
betwe
comm
stead
range
discre
figure
stead
and a
by a
the ti
mode
repre
Figur
een the me
mands from
dy model ou
e of 2% -
epancy betw
e shows a co
dy model an
ambient tem
thermostat l
ime. In this
el is not zer
esent the “off
re 4-21: Comdu
easurements
the control
utputs and th
100%. In F
ween the mo
omparison o
d measured
mperature of
ocated in th
figure, the i
ro represent
f” cycles.
mparison buring on-off
s and the s
ler. The ran
he measurem
Figure 4-21
odel predictio
of the cooling
d in the testb
30oC. The c
e conditione
intervals thr
t the “on” cy
between firsf cycling
93
simulation re
nge of relati
ments throu
, one of th
ons and the
g load calcul
bed for a con
compressor
ed space. Ho
rough which
ycles and th
st quasi-stea
esults, appe
ive discrepa
gh the cond
he results w
experimenta
lated by the
nditioned sp
and conden
owever, the
the predict
he intervals
ady model a
eared aroun
ancy betwee
ducted tests
with the hig
al data is pre
first version
pace temper
nser fan are
evaporator
ted cooling p
with zero c
and experim
nd the on-o
en the quas
varies in th
ghest relativ
esented. Th
n of the quas
ature of 40o
cycled on-o
fan is “on” a
power by th
cooling powe
mental data
off
si-
he
ve
is
si-
C
off
all
he
er
a
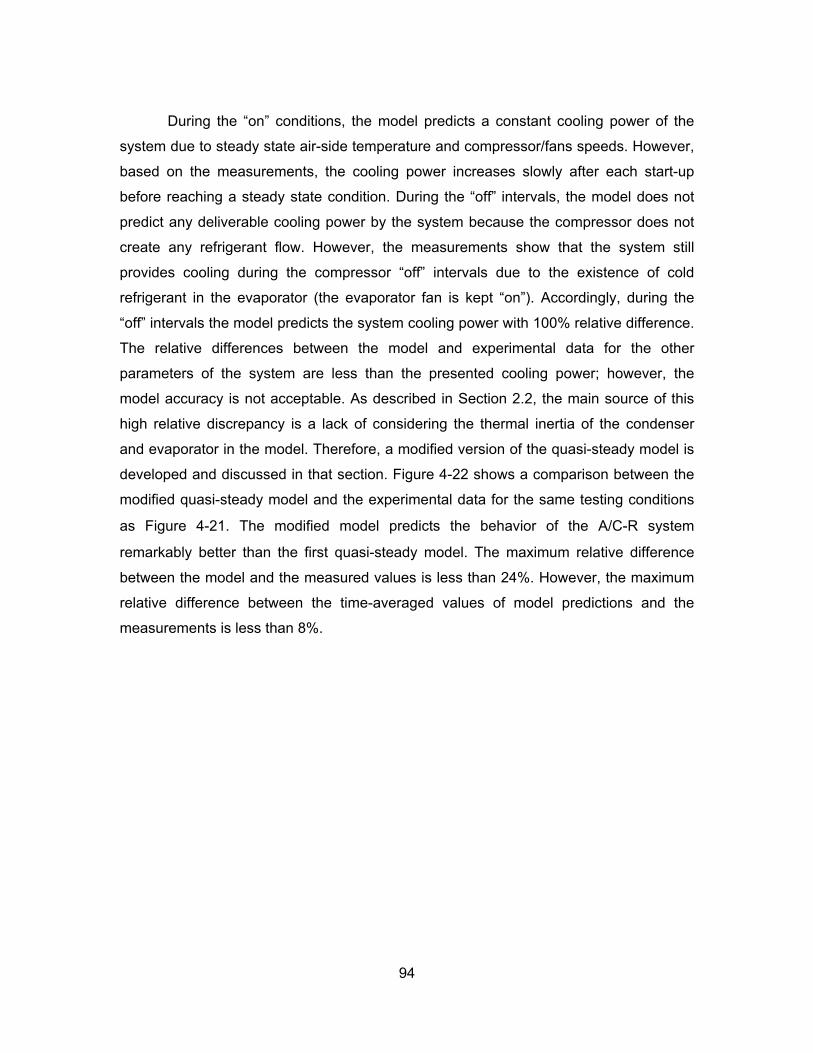
94
During the “on” conditions, the model predicts a constant cooling power of the
system due to steady state air-side temperature and compressor/fans speeds. However,
based on the measurements, the cooling power increases slowly after each start-up
before reaching a steady state condition. During the “off” intervals, the model does not
predict any deliverable cooling power by the system because the compressor does not
create any refrigerant flow. However, the measurements show that the system still
provides cooling during the compressor “off” intervals due to the existence of cold
refrigerant in the evaporator (the evaporator fan is kept “on”). Accordingly, during the
“off” intervals the model predicts the system cooling power with 100% relative difference.
The relative differences between the model and experimental data for the other
parameters of the system are less than the presented cooling power; however, the
model accuracy is not acceptable. As described in Section 2.2, the main source of this
high relative discrepancy is a lack of considering the thermal inertia of the condenser
and evaporator in the model. Therefore, a modified version of the quasi-steady model is
developed and discussed in that section. Figure 4-22 shows a comparison between the
modified quasi-steady model and the experimental data for the same testing conditions
as Figure 4-21. The modified model predicts the behavior of the A/C-R system
remarkably better than the first quasi-steady model. The maximum relative difference
between the model and the measured values is less than 24%. However, the maximum
relative difference between the time-averaged values of model predictions and the
measurements is less than 8%.
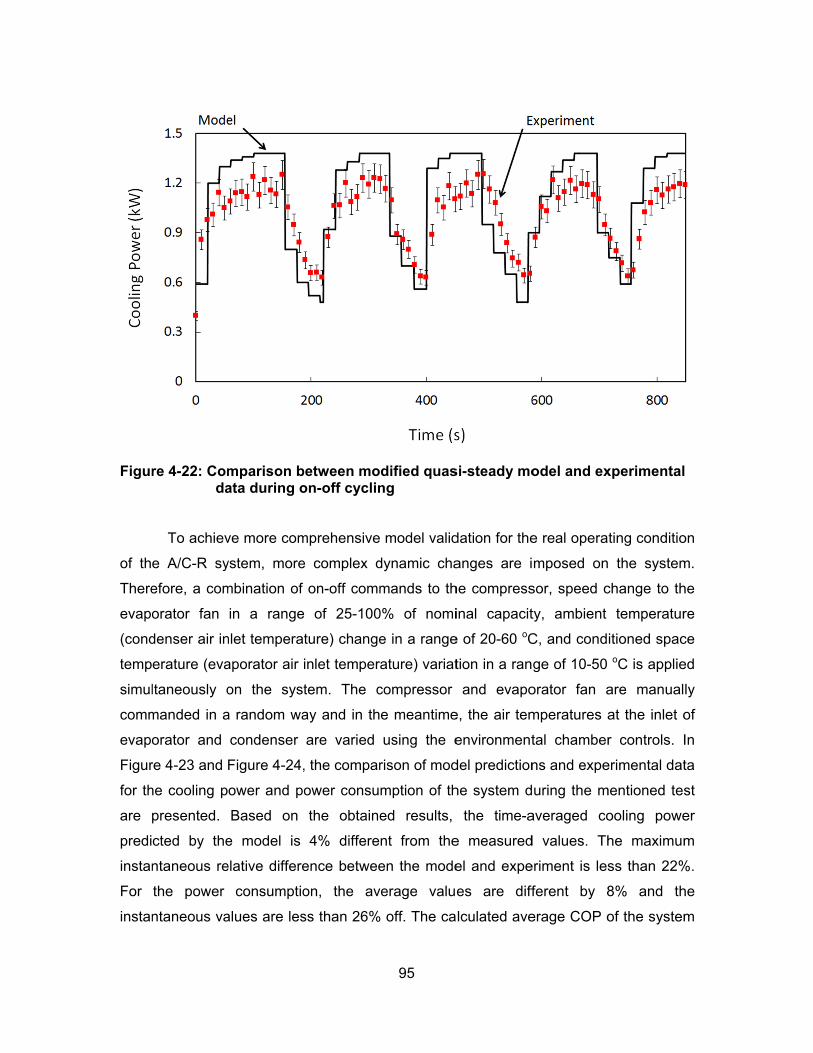
Figur
of th
There
evapo
(cond
temp
simul
comm
evapo
Figur
for th
are
predi
instan
For
instan
re 4-22: Comda
To achiev
e A/C-R sy
efore, a com
orator fan
denser air in
erature (eva
ltaneously o
manded in a
orator and
re 4-23 and
he cooling p
presented.
cted by the
ntaneous re
the power
ntaneous va
mparison bata during o
ve more com
ystem, more
mbination of
in a range
nlet temperat
aporator air i
on the syst
a random wa
condenser
Figure 4-24,
ower and po
Based on
e model is
elative differe
consumptio
alues are les
between moon-off cyclin
mprehensive
e complex d
on-off comm
of 25-100
ture) change
inlet temper
tem. The c
ay and in th
are varied
, the compar
ower consu
the obtaine
4% differe
ence betwee
on, the av
ss than 26%
95
dified quasng
model valid
dynamic cha
mands to th
0% of nomi
e in a range
ature) variat
compressor
e meantime
using the e
rison of mod
mption of th
ed results,
nt from the
en the mode
verage valu
% off. The ca
si-steady mo
dation for the
anges are i
he compress
inal capacit
e of 20-60 oC
tion in a ran
and evapo
e, the air tem
environment
del prediction
he system d
the time-a
e measured
el and expe
es are diff
lculated ave
odel and ex
e real opera
mposed on
sor, speed c
ty, ambient
C, and cond
ge of 10-50
orator fan a
mperatures a
tal chamber
ns and expe
uring the m
averaged co
d values. Th
eriment is les
ferent by 8
erage COP o
xperimental
ting conditio
the system
change to th
temperatur
itioned spacoC is applie
are manual
at the inlet o
r controls. I
erimental dat
mentioned tes
ooling powe
he maximum
ss than 22%
8% and th
of the system
on
m.
he
re
ce
ed
ly
of
In
ta
st
er
m
%.
he
m
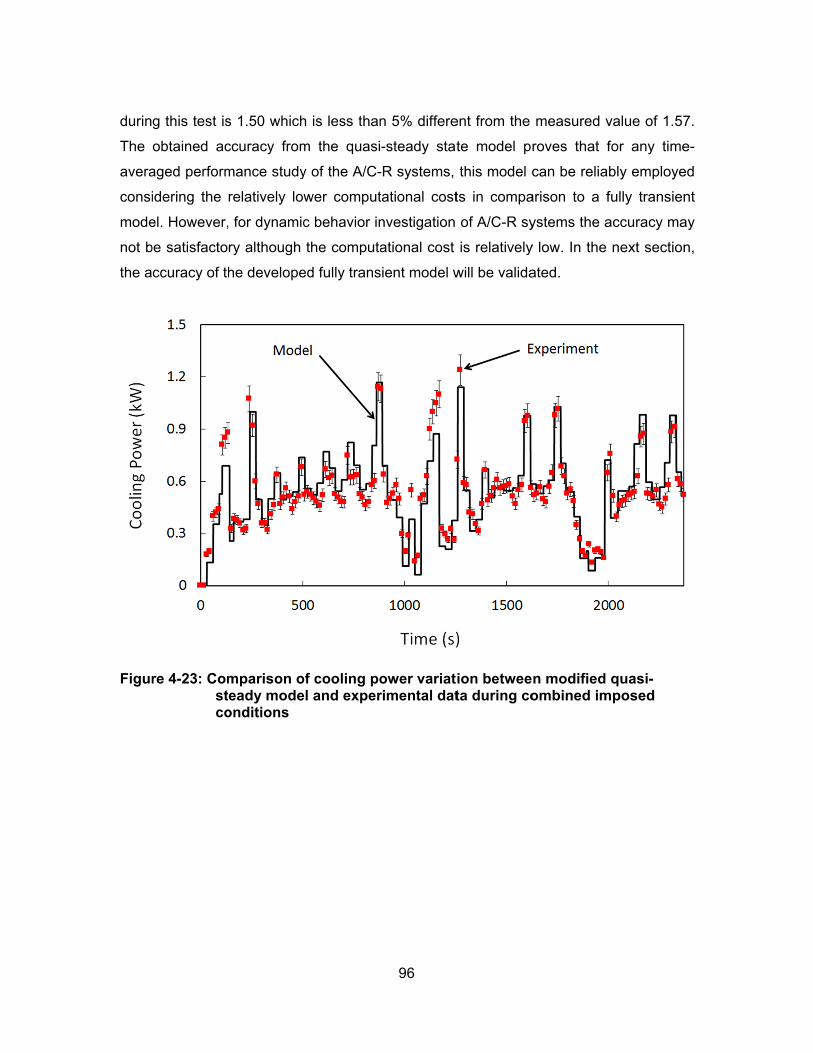
durin
The
avera
consi
mode
not b
the a
Figur
g this test is
obtained ac
aged perform
idering the
el. However,
be satisfacto
ccuracy of th
re 4-23: Comstco
s 1.50 which
ccuracy from
mance study
relatively low
, for dynamic
ry although
he develope
mparison oeady mode
onditions
h is less than
m the quasi
y of the A/C-
wer comput
c behavior in
the computa
ed fully trans
of cooling pol and exper
96
n 5% differe
-steady stat
-R systems,
tational cost
nvestigation
ational cost
sient model w
ower variatrimental dat
ent from the
te model pr
this model c
ts in compa
of A/C-R sy
is relatively
will be valida
ion betweeta during co
measured v
roves that f
can be relia
arison to a f
ystems the a
y low. In the
ated.
n modified ombined im
value of 1.57
for any time
bly employe
fully transien
accuracy ma
next section
quasi-mposed
7.
e-
ed
nt
ay
n,
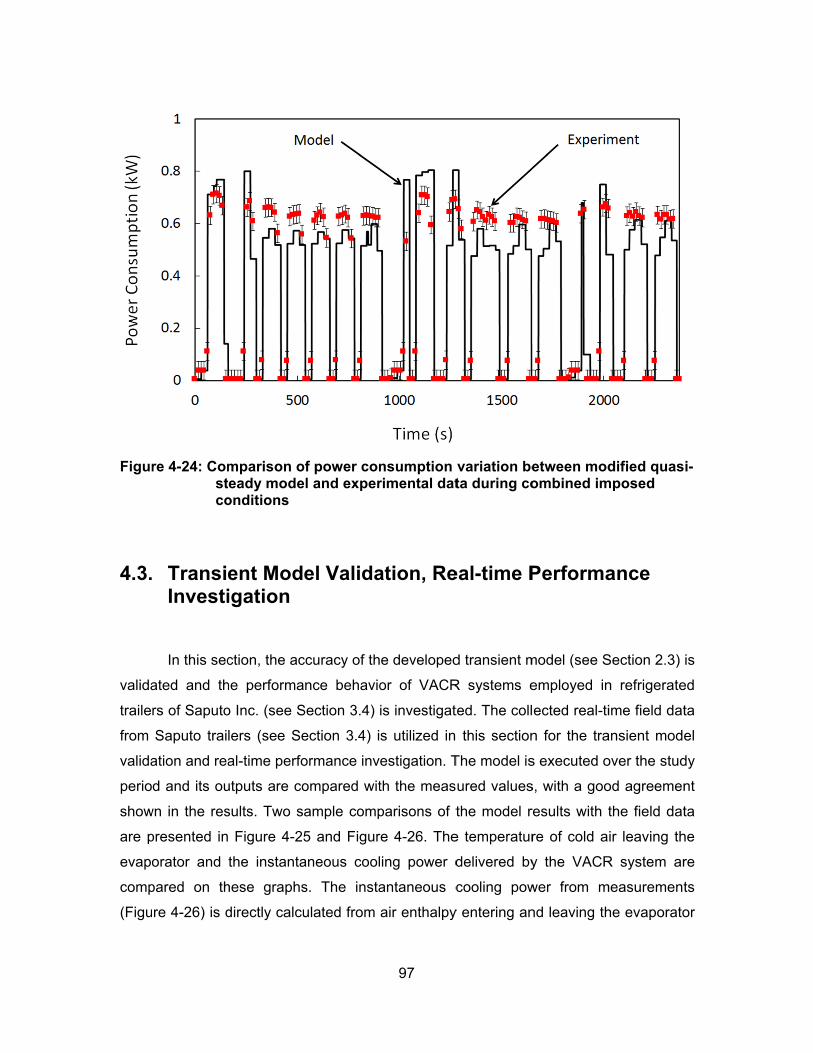
Figur
4.3.
valida
traile
from
valida
perio
show
are p
evapo
comp
(Figu
re 4-24: Comstco
TransieInvesti
In this sec
ated and th
rs of Saputo
Saputo trai
ation and rea
d and its ou
wn in the res
presented in
orator and
pared on th
re 4-26) is d
mparison oeady mode
onditions
ent Modigation
ction, the ac
he performa
o Inc. (see S
lers (see Se
al-time perfo
utputs are co
sults. Two sa
Figure 4-25
the instanta
hese graphs
directly calcu
of power conl and exper
el Valida
ccuracy of th
nce behavio
Section 3.4)
ection 3.4) i
ormance inv
ompared wit
ample comp
5 and Figur
aneous cool
s. The insta
ulated from
97
nsumption rimental dat
ation, Re
e developed
or of VACR
is investigat
s utilized in
estigation. T
th the meas
parisons of t
re 4-26. The
ing power d
antaneous c
air enthalpy
variation beta during co
eal-time P
d transient m
R systems e
ted. The coll
this section
The model is
ured values
the model r
e temperatur
delivered by
cooling pow
y entering an
etween modombined im
Performa
model (see S
employed in
ected real-ti
n for the tra
s executed o
s, with a goo
results with t
re of cold a
y the VACR
wer from m
nd leaving th
dified quasmposed
ance
Section 2.3)
n refrigerate
ime field dat
ansient mode
over the stud
od agreemen
the field dat
ir leaving th
R system ar
measurement
he evaporato
i-
is
ed
ta
el
dy
nt
ta
he
re
ts
or
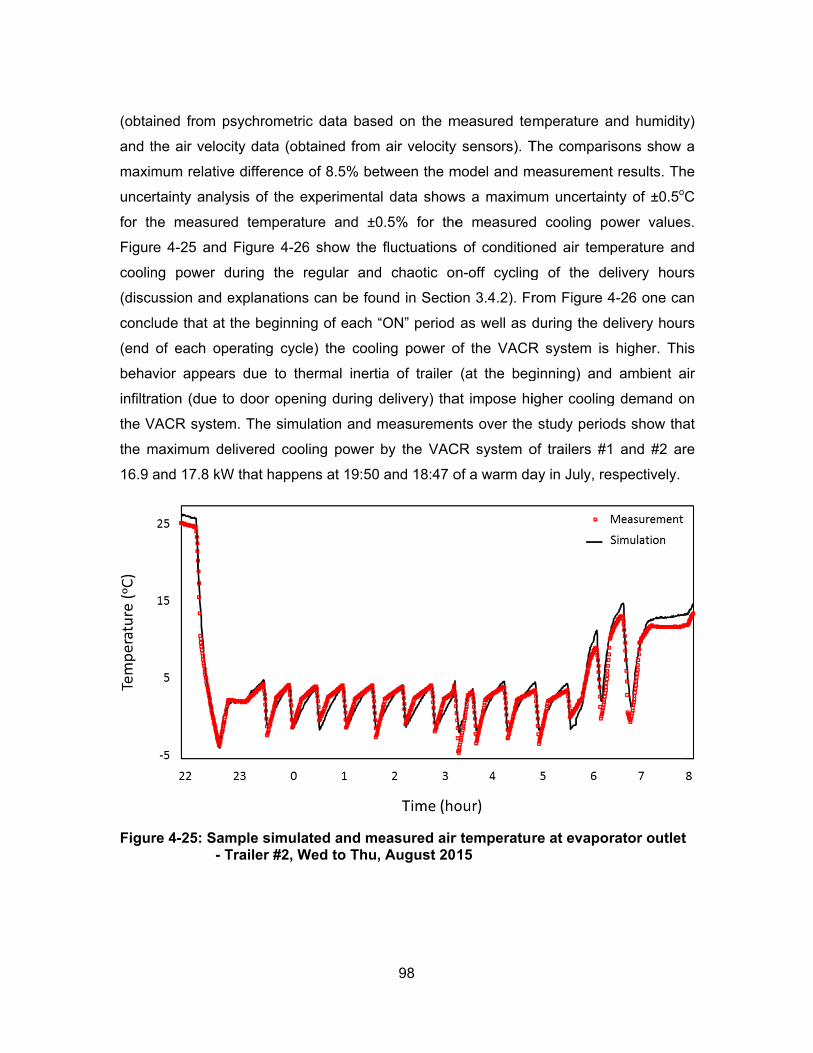
(obta
and t
maxim
unce
for th
Figur
coolin
(discu
concl
(end
beha
infiltra
the V
the m
16.9
Figur
ained from p
the air veloc
mum relative
rtainty analy
he measure
re 4-25 and
ng power d
ussion and e
lude that at
of each op
vior appear
ation (due to
VACR system
maximum de
and 17.8 kW
re 4-25: Sam- T
psychrometri
city data (ob
e difference
ysis of the e
ed temperat
Figure 4-26
during the r
explanations
the beginnin
perating cycl
rs due to th
o door open
m. The simu
elivered coo
W that happe
mple simulaTrailer #2, W
ic data base
btained from
of 8.5% bet
experimenta
ture and ±0
6 show the
regular and
s can be fou
ng of each “
le) the cooli
hermal inerti
ning during d
ulation and m
oling power
ens at 19:50
ated and meWed to Thu,
98
ed on the m
air velocity
tween the m
l data show
0.5% for the
fluctuations
d chaotic on
und in Sectio
“ON” period
ing power o
ia of trailer
delivery) tha
measuremen
by the VAC
and 18:47 o
easured air August 20
measured te
y sensors). T
model and m
ws a maximu
e measured
s of conditio
n-off cycling
on 3.4.2). Fr
as well as d
of the VACR
(at the beg
at impose hi
nts over the
CR system o
of a warm da
r temperatur15
mperature a
The compar
measuremen
um uncertain
d cooling p
ned air tem
g of the de
rom Figure 4
during the d
R system is
ginning) and
igher cooling
study perio
of trailers #1
ay in July, re
re at evapo
and humidity
isons show
t results. Th
nty of ±0.5o
ower values
mperature an
elivery hour
4-26 one ca
delivery hour
s higher. Th
d ambient a
g demand o
ods show tha
1 and #2 ar
espectively.
rator outlet
y)
a
he
C
s.
nd
rs
an
rs
is
air
on
at
re
t
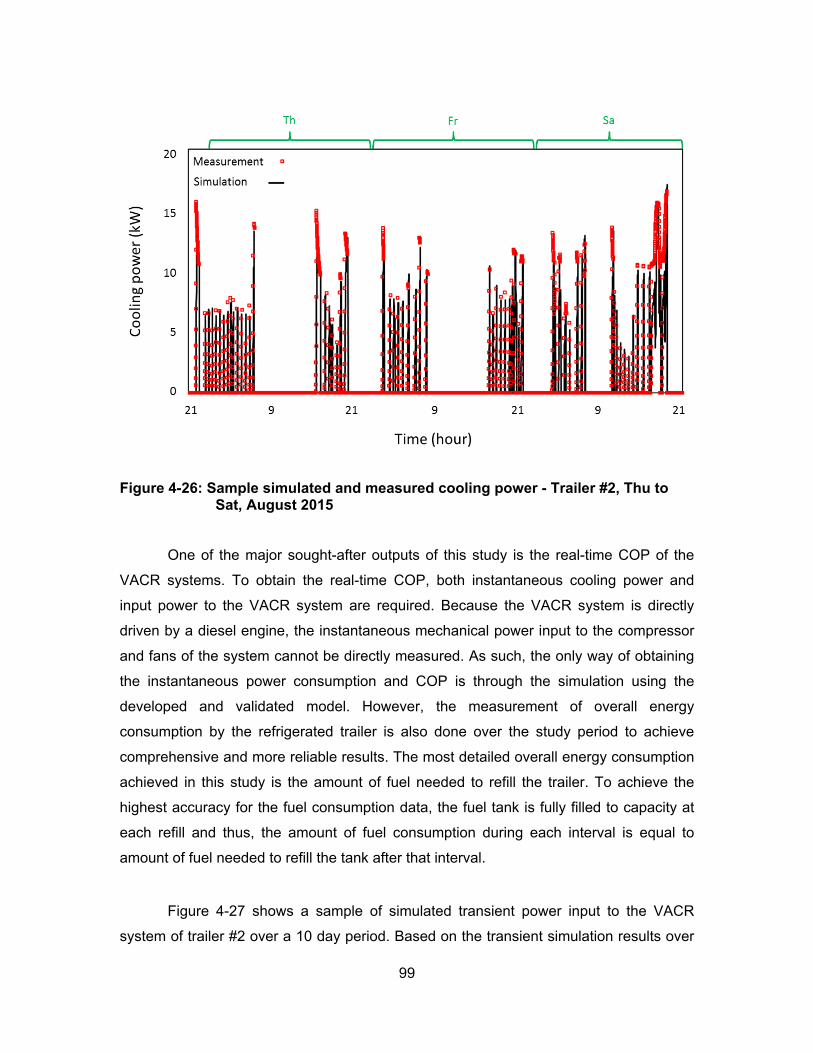
99
Figure 4-26: Sample simulated and measured cooling power - Trailer #2, Thu to Sat, August 2015
One of the major sought-after outputs of this study is the real-time COP of the
VACR systems. To obtain the real-time COP, both instantaneous cooling power and
input power to the VACR system are required. Because the VACR system is directly
driven by a diesel engine, the instantaneous mechanical power input to the compressor
and fans of the system cannot be directly measured. As such, the only way of obtaining
the instantaneous power consumption and COP is through the simulation using the
developed and validated model. However, the measurement of overall energy
consumption by the refrigerated trailer is also done over the study period to achieve
comprehensive and more reliable results. The most detailed overall energy consumption
achieved in this study is the amount of fuel needed to refill the trailer. To achieve the
highest accuracy for the fuel consumption data, the fuel tank is fully filled to capacity at
each refill and thus, the amount of fuel consumption during each interval is equal to
amount of fuel needed to refill the tank after that interval.
Figure 4-27 shows a sample of simulated transient power input to the VACR
system of trailer #2 over a 10 day period. Based on the transient simulation results over
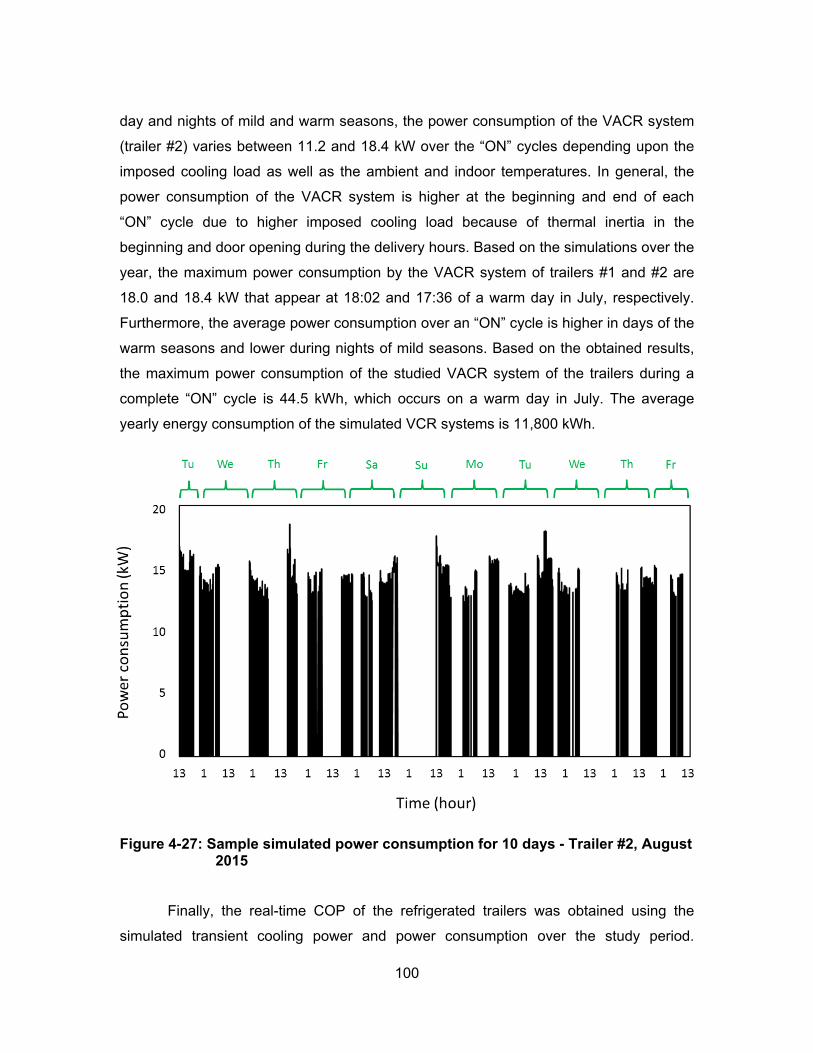
100
day and nights of mild and warm seasons, the power consumption of the VACR system
(trailer #2) varies between 11.2 and 18.4 kW over the “ON” cycles depending upon the
imposed cooling load as well as the ambient and indoor temperatures. In general, the
power consumption of the VACR system is higher at the beginning and end of each
“ON” cycle due to higher imposed cooling load because of thermal inertia in the
beginning and door opening during the delivery hours. Based on the simulations over the
year, the maximum power consumption by the VACR system of trailers #1 and #2 are
18.0 and 18.4 kW that appear at 18:02 and 17:36 of a warm day in July, respectively.
Furthermore, the average power consumption over an “ON” cycle is higher in days of the
warm seasons and lower during nights of mild seasons. Based on the obtained results,
the maximum power consumption of the studied VACR system of the trailers during a
complete “ON” cycle is 44.5 kWh, which occurs on a warm day in July. The average
yearly energy consumption of the simulated VCR systems is 11,800 kWh.
Figure 4-27: Sample simulated power consumption for 10 days - Trailer #2, August 2015
Finally, the real-time COP of the refrigerated trailers was obtained using the
simulated transient cooling power and power consumption over the study period.
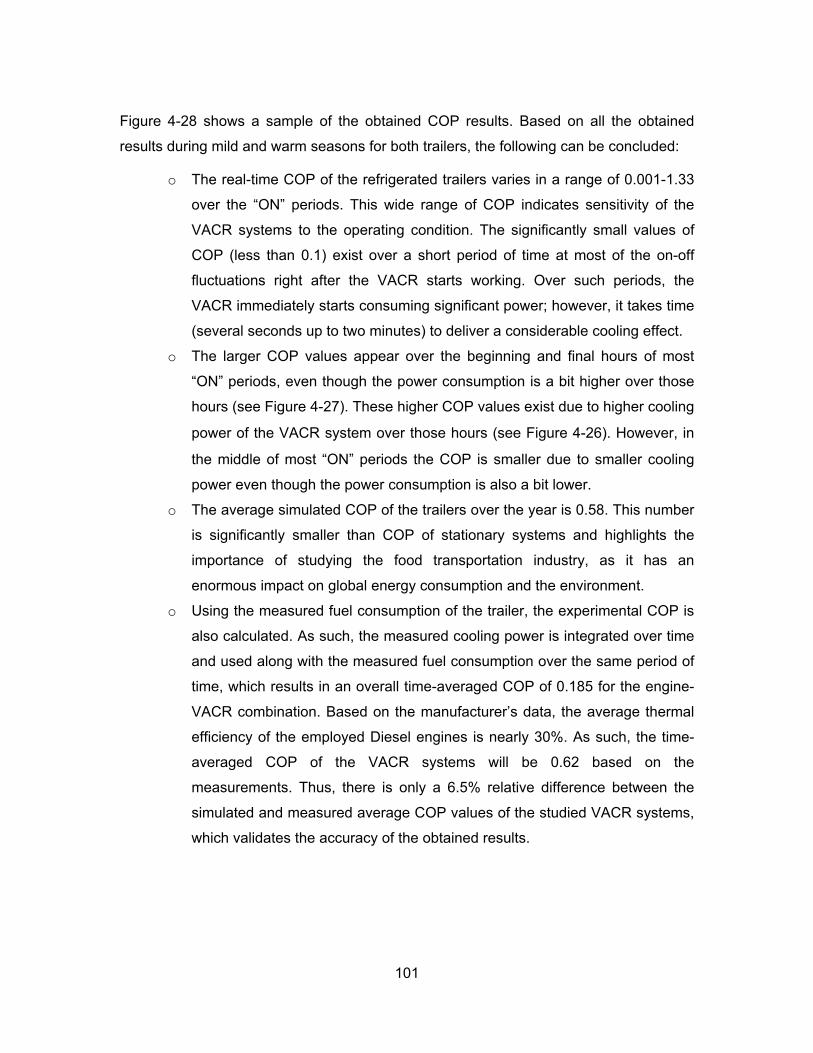
101
Figure 4-28 shows a sample of the obtained COP results. Based on all the obtained
results during mild and warm seasons for both trailers, the following can be concluded:
o The real-time COP of the refrigerated trailers varies in a range of 0.001-1.33
over the “ON” periods. This wide range of COP indicates sensitivity of the
VACR systems to the operating condition. The significantly small values of
COP (less than 0.1) exist over a short period of time at most of the on-off
fluctuations right after the VACR starts working. Over such periods, the
VACR immediately starts consuming significant power; however, it takes time
(several seconds up to two minutes) to deliver a considerable cooling effect.
o The larger COP values appear over the beginning and final hours of most
“ON” periods, even though the power consumption is a bit higher over those
hours (see Figure 4-27). These higher COP values exist due to higher cooling
power of the VACR system over those hours (see Figure 4-26). However, in
the middle of most “ON” periods the COP is smaller due to smaller cooling
power even though the power consumption is also a bit lower.
o The average simulated COP of the trailers over the year is 0.58. This number
is significantly smaller than COP of stationary systems and highlights the
importance of studying the food transportation industry, as it has an
enormous impact on global energy consumption and the environment.
o Using the measured fuel consumption of the trailer, the experimental COP is
also calculated. As such, the measured cooling power is integrated over time
and used along with the measured fuel consumption over the same period of
time, which results in an overall time-averaged COP of 0.185 for the engine-
VACR combination. Based on the manufacturer’s data, the average thermal
efficiency of the employed Diesel engines is nearly 30%. As such, the time-
averaged COP of the VACR systems will be 0.62 based on the
measurements. Thus, there is only a 6.5% relative difference between the
simulated and measured average COP values of the studied VACR systems,
which validates the accuracy of the obtained results.
102
Figure 4-28: Sample simulated COP for 10 days - Trailer #2, August 2015
The obtained results from simulations and measurements shows that a typical
VACR of a refrigerated trailer that works in a relatively average climatic condition (British
Columbia, Canada) consumes 11,800 kWh/yr. Assuming that the average diesel engine
has a thermal efficiency of 30%, the typical refrigerated trailer consumes more than
3,000 liter/yr of Diesel fuel. The maximum required power and energy during an “ON”
period throughout the year (including loading and delivery) are calculated as 18.4 kW
and 44.5 kWh, respectively. Based on the obtained data from the GPS of the trucks that
move the studied trailers, more than 60,000 km/yr is travelled by each trailer. Therefore,
a heavy and low-efficiency engine-driven VACR (total of 1,100 kg including the fuel tank)
is transported more than 60,000 km/yr, significantly contributing to GHG emissions. As a
key conclusion of this part of the study regarding the required power and energy and
performance variations of the VACR systems, it is highly recommended that all the
engine-driven refrigerated trailers around the world be replaced by battery-powered
refrigerated trailers to eliminate the relevant GHG emissions. Based on the
manufacturer’s data [94,95], eliminating the engine and fuel tank will reduce the total
weight of trailer up to 600 kg. Assuming an average specific power and energy of 300
103
W/kg and 0.2 kWh/kg for Li-ion batteries to replace the engine and fuel tank [97,98], the
maximum weight of required electromotor and batteries will be 250 kg. Thus, 350 kg of
total trailer weight can be removed by replacing the engine-driven VACR with a battery-
driven VACR system. This weight reduction equals 1.5% of total truck-full trailer weight
based on the field measurements and manufacturer’s data.
Utilizing the available data on average fuel consumption versus weight of freight
in transportation industry, the total fuel consumption of the truck that moves the trailer
will be reduced by more than 0.5% as a result of such a weight reduction [99,100]. Thus,
assuming an average truck-trailer combination fuel consumption of 35 L/100 km
[101,102], at least 105 liters of Diesel fuel can be saved per year per truck-trailer. In
addition, all the fuel consumption (3,000 liter/yr based on the obtained results) and GHG
emissions from the refrigerated trailer’s Diesel engine will be eliminated. As such, a total
of 3105 liters of diesel fuel, which is equivalent to 8,320 kg CO2/yr [103,104] can be
reduced per truck-trailer combination by replacing the engine-driven VACR with battery-
powered type. In some areas around the globe, electricity is produced using clean
techniques. Eventually, expanding the obtained results from the studied trailers shows
that if all the engine-driven trailers in the world (estimated to be 1.2 million [7]) are
replaced by battery-powered types fed from clean tech-generated electricity, more than
3.7 billion liters of diesel fuel will be saved and CO2 production can be reduced by up to
10 million tons annually.
4.4. Conclusion
In this chapter, the developed steady state, quasi-steady state, and transient
models were validated and employed for comprehensive thermal and performance
investigation of stationary A/C-R and VACR systems. The results of the steady state
model were validated over a wide range of operating conditions using the testbed and
showed less than 10.6% relative difference from experimental data. In addition, the
accuracy of the steady state model was validated using the filed data from a stationary
A/C-R system and showed a maximum of 9% relative difference. The quasi-steady state
104
model was validated using the experimental data from testbed and showed a maximum
of 26% relative difference on the dynamic parameters; however, a good accuracy with
less than 8% relative difference was achieved on the time-averaged parameters. The
accuracy of the transient model was also validated using the field data from real VACR
systems. The results showed a good agreement with less than 8.5% maximum relative
difference on the transient parameters of VACR systems.
The validated steady state model was employed for a comprehensive
investigation of thermal and performance characteristics of VACR systems under
different operating conditions. The results showed that for any imposed ambient and
conditioned space temperatures, a point of maximum COP can be achieved by properly
adjusting the evaporator and condenser fans speeds. The obtained results showed 11%
potential improvement of COP under ANSI/AHRI 210/240-2008 conditions. The obtained
results will be utilized for optimization model development in the next chapter. The
steady state model was also employed for a performance evaluation of the pilot
stationary A/C-R system and showed a remarkable degradation of the COP of the
system from the design condition. Areas of potential energy savings were discussed for
the studied stationary system. Finally, the results of the transient modelling of the real
VACR system over the duty cycles were discussed and employed for an estimation of
the global impact. By expanding the obtained results, it was recommended that all the
existing engine-driven VACR systems employed in the refrigerated trailers all around the
world be replaced by battery-powered VACR systems, which could lead to saving more
than 3.7 billion liters of diesel fuel and reducing CO2 production by up to 10 million tons
per annum. The results obtained in this chapter will be employed to develop an
optimization model that will be implemented on the proof-of-concept high efficiency
VACR system.
105
Chapter 5. Metamodel Development for Optimization
In Section 4.1.1 of Chapter 4, it was concluded that for any imposed operating
condition on a VACR system, a point of maximum COP can be achieved by adjusting
the capacity of controllable components of the system. As such, taking advantage of
optimization techniques can properly lead the project toward achieving the final goal:
development of an optimally controlled high-efficiency VACR system. A variety of
techniques have been developed during the last decades for optimization of engineering
systems in the steps of design or operation [105]. The literature review shows that
numerous studies have generally covered the optimization of A/C-R systems in a variety
of applications; however, the literature lacks a systematic optimization model
development for VACR systems equipped with variable speed compressor and fans
under realistic operating condition [106–116]. As such, in this chapter, a metamodel is
developed for the new high efficiency VACR system built in LAEC to implement an
optimization method on it and achieve the highest COP under any operating condition.
The metamodel will be used in an optimization solver to be implemented on the proof-of-
concept demonstration of high efficiency VACR system in Chapter 6.
5.1. Metamodel Development Based on Steady State Thermal Model
The goal of the optimization in this research is to maximize the COP of the VACR
system under any operating conditions by adjusting the speed of the compressor and
fans. As such, the so-called cost (objective) function to be minimized in the standard
106
form of optimization problem definition is -COP [105,117]. The COP is calculated using
the following equation:
, ,
evap
comp f cond f evap
QCooling powerCOP
Input Power W W W
(5.1)
To achieve the maximum COP of the VACR system in reality, all the appeared
variables ( evapQ , , ,, ,comp f cond f evapW W W ) should be calculable and controllable. However,
these variables are not directly controllable since they are functions of other system
variables. The only controllable variables are the speed of compressor and fans. Based
on the model developed in Chapter 2, the cooling power evapQ is calculated using:
, , , ,evap ref ref evap in ref evap outQ m h h (5.2)
The appeared variables on the right hand side are not still directly controllable.
These three variables are also functions of other VACR system’s variables as follows:
2 2 2 2 2 20 1 2 3 4 5 6 7 8ref e c e e c c e c e c e cm d d T d T d T d T T d T d T T d T T d T T
(5.3)
, , 1 , , 2( , ); ( )ref evap out ref evap out e e eh f T P P f T (5.4)
min, , , , ,, , , ,
( )evap evap ref evap in ref evap outref evap in ref evap out
ref
C T Th h
m
(5.5)
Again, none of the appeared variables are controllable since all of them are
functions of other variables of a VACR system. Accordingly, other correlations should be
employed for calculating these variables [70]. In addition to the abovementioned
correlations for calculating the cooling power, evapQ , the power consumption (input
107
power) variables appeared in the denominator of Eq. (5.1) should also be correlated
based on the controllable variables (see Chapter 2):
2 2 2 2 2 20 1 2 3 4 5 6 7 8comp e c e e c c e c e c e cW c c T c T c T c T T c T c T T c T T c T T (5.6)
2 3
, , ,, , , 0 1 2 3
, , , , , ,
a cond a cond a condf cond f cond nom
a cond nom a cond nom a cond nom
m m mW W cf cf cf cf
m m m
(5.7)
2 3
, , ,, , , 0 1 2 3
, , , , , ,
a evap a evap a evapf evap f evap nom
a evap nom a evap nom a evap nom
m m mW W cf cf cf cf
m m m
(5.8)
From the above equations, one can conclude that the power consumptions of the
compressor and fans are correlated to variables that are not directly controllable (similar
to the cooling power). Accordingly, these formulae should also be broken into other
formulae to have relationships between controllable variables and the power
consumptions [70].
According to the abovementioned governing equations for COP calculation, it
can be concluded that the cost function, which is -COP, cannot be explicitly expressed
based on the VACR system’s controllable variables. In other words, all the mentioned
coupled equations should be solved together in order to achieve a value for COP. As
such, the full steady state mathematical model obtained in Chapter 2, which is a set of
20 coupled nonlinear equations, should be solved to calculate the COP of the VACR
system. In order to achieve optimization for problems like this, metamodeling has been
intensively used. The followings are limitations of the classical gradient-based
optimization methods that hinder the direct application of these methods for solving such
problems [117]:
1- Explicitly formulated and/or computationally cheap models are required; however,
engineering simulation involves implicit and computation-intensive models.
108
2- The output of gradient-based methods is usually a single optimum solution, while
obtaining multiple design alternatives is desirable.
3- The gradient-based methods provide inadequate insight since they are
sequential and non-transparent.
4- High level of expertise in optimization is required to apply the gradient-based
optimization methods.
On the flip side, the metamodeling approach has the following advantages [117]:
1- Optimization techniques for metamodels have higher efficiencies.
2- Parallel computations can be done to generate sample points since the
metamodels are obtained from separate independent points.
3- Engineering insight can be more efficiently achieved since the sensitivity of
effective variables is easily assessable.
4- The metamodeling approach can deal with both continuous and discrete
variables.
Metamodel-based optimization can be performed with different strategies. In this
research, the “sequential approach” is employed that is formed from: 1) sample space
generation, 2) metamodel development, 3) metamodel validation, 4) optimization on
metamodel [117]. For the current problem, which is maximization of the COP, the
sample space is generated by executing the steady state mathematical model
developed in Chapter 2. Then, the metamodel is obtained by using “Least Square
Regression” for the generated space and after validation, it is employed for optimization.
A standard optimization problem is usually formulated as [105]:
1 2
min ( )
. .
0; 1:
0; 1:
, ,..., ; ,
i
j
T
n L U
f x
S T
H i p
G j m
x x x x x x x
x
x (5.9)
109
where, ( )f x COP in this study. Therefore, a typical metamodel formulation for
optimization is [117]:
1 2
min ( )
. .
0; 1:
0; 1:
, ,..., ; ,
i
j
T
n L U
f x
S T
H i p
G j m
x x x x x x x
x
x
(5.10)
For the current problem, the speed of compressor, condenser and evaporator
fans are controllable and independent. In addition, the metamodel-based optimization
solver is supposed to be integrated with a cooling demand simulator in the next chapter
to proactively and optimally control the operation of VACR system under any imposed
ambient condition. As such, the cooling demand is an important input to the metamodel
for the purpose of COP maximization. In addition, based on the model characteristics
and the results of thermal study presented in Chapter 3 and Chapter 4, the air
temperature at evaporator and condenser entries directly and independently affect the
thermal and performance characteristics of the VACR system. The rest of available
parameters and variables appeared in the mathematical model are dependent on the
abovementioned variables. Accordingly, the following is defined as the standard form of
the so-called design variables vector x for the metamodel:
1
2
3
4 , ,
5 , ,
:
:
:
: ( @ )
: ( @
oa evap in
oa cond in
x Compressor rotational speed ratio
x Condenser fan rotational speed ratio
x Evaporator fan rotational speed ratiox
x T Air temperature evaporator entry C
x T Air temperature condenser entry C
6
)
: ( )x Cooling demand kW
(5.11)
110
Therefore, the metamodel 1 2 6( ) ( , ,..., )f x COP x x x will be obtained for the
optimization purpose. Due to capacity and range of operation, the following linear
constraints govern the optimization problem:
531
51 3
2 64
2 4 6
15 000
60 01 0 1 0
0 010 0
1 0 50 0 2.5 0
xxx
xx x
x xx
x x x
(5.12)
Based on the developed formulation, the metamodel is obtained in this chapter
and will be used along with a cooling demand simulator in the next chapter to find the
global optimum point of operation for any imposed cooling demand and temperatures on
the VACR system. The three steps of sequential metamodel development for this
problem including: sample space generation, metamodel development, and metamodel
validation, are discussed in this section. In the next chapter, the validated metamodel will
be used for the purpose of proactive and optimal control of the built high efficiency
VACR system.
5.1.1. Sample space generation
The previously developed steady state model is executed for random design
variables within the feasible ranges of application formulated in Eq. (5.12). Different
numbers of sample points (NSP) between 500-5000 are tested to achieve the highest
accuracy; a comparison between the results is presented in the next section. A few
representative of the generated sample points are shown in Table 5-1.
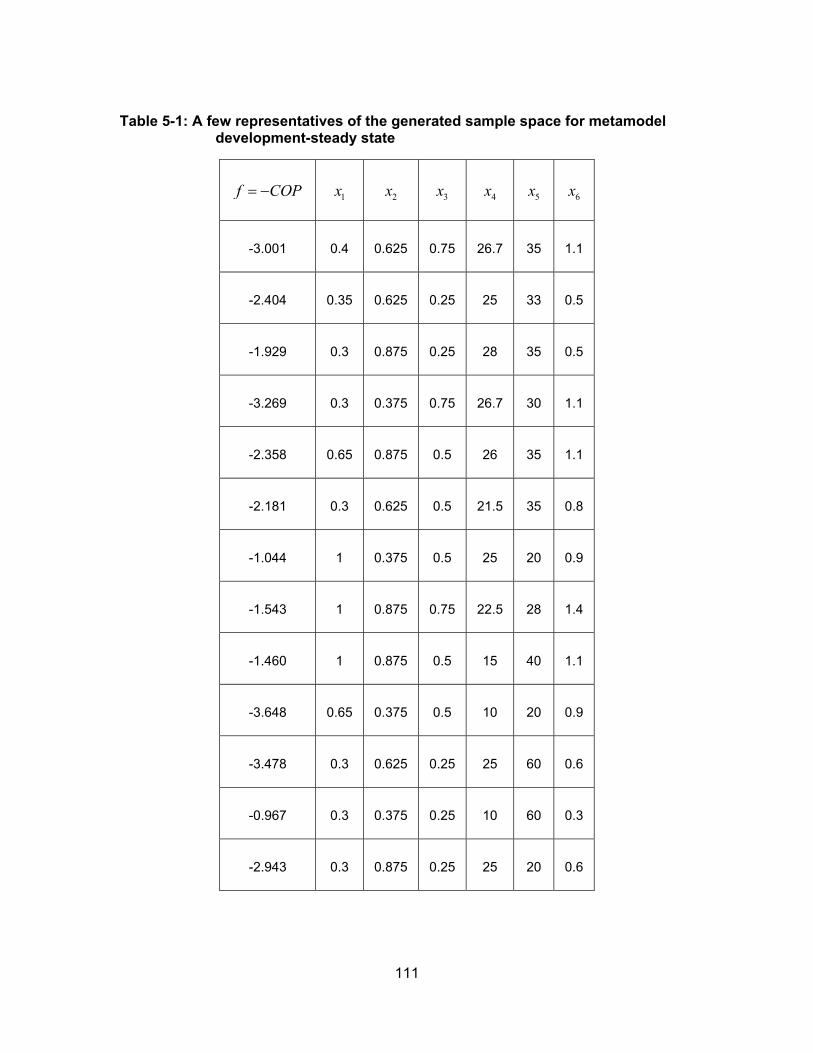
111
Table 5-1: A few representatives of the generated sample space for metamodel development-steady state
f COP 1x 2x 3x 4x 5x 6x
-3.001 0.4 0.625 0.75 26.7 35 1.1
-2.404 0.35 0.625 0.25 25 33 0.5
-1.929 0.3 0.875 0.25 28 35 0.5
-3.269 0.3 0.375 0.75 26.7 30 1.1
-2.358 0.65 0.875 0.5 26 35 1.1
-2.181 0.3 0.625 0.5 21.5 35 0.8
-1.044 1 0.375 0.5 25 20 0.9
-1.543 1 0.875 0.75 22.5 28 1.4
-1.460 1 0.875 0.5 15 40 1.1
-3.648 0.65 0.375 0.5 10 20 0.9
-3.478 0.3 0.625 0.25 25 60 0.6
-0.967 0.3 0.375 0.25 10 60 0.3
-2.943 0.3 0.875 0.25 25 20 0.6
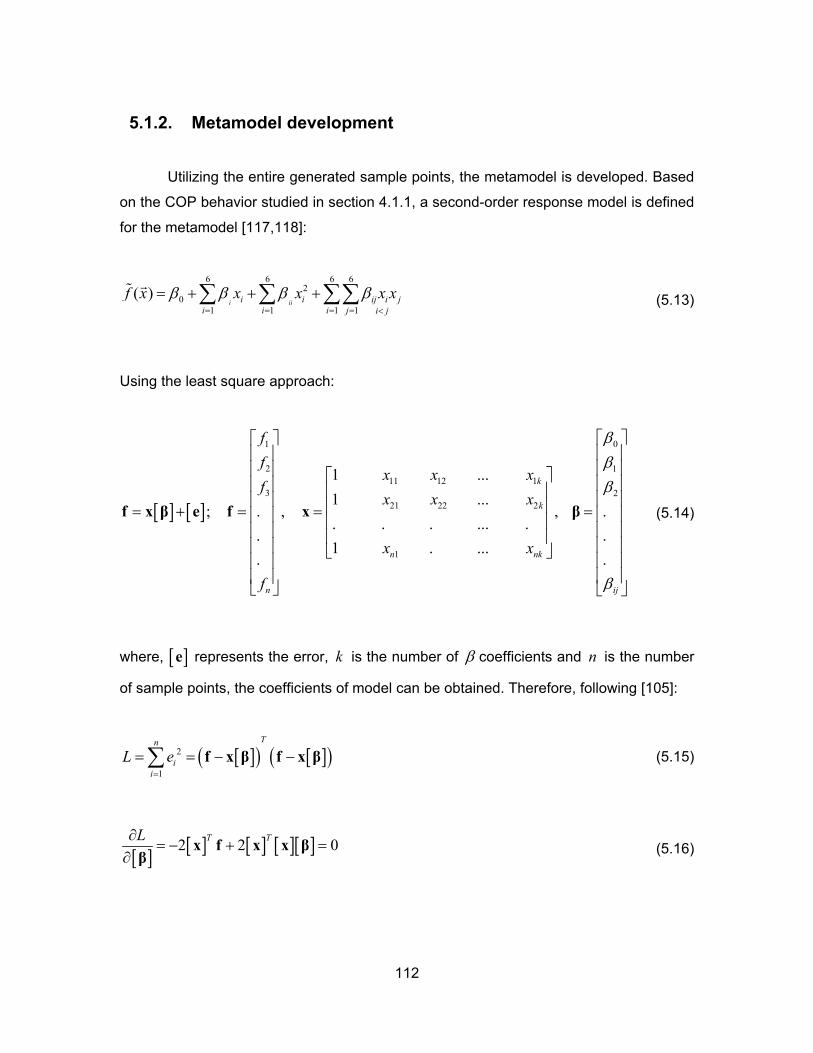
112
5.1.2. Metamodel development
Utilizing the entire generated sample points, the metamodel is developed. Based
on the COP behavior studied in section 4.1.1, a second-order response model is defined
for the metamodel [117,118]:
6 6 6 62
01 1 1 1
( )i iii i ij i j
i i i j i j
f x x x x x
(5.13)
Using the least square approach:
1 0
2 111 12 1
3 221 22 2
1
1 ...
1 ...; . , , .
. . . ... .. .
1 . .... .
k
k
n nk
n ij
f
fx x x
fx x x
x x
f
f x β e f x β (5.14)
where, e represents the error, k is the number of coefficients and n is the number
of sample points, the coefficients of model can be obtained. Therefore, following [105]:
2
1
Tn
ii
L e
f x β f x β (5.15)
2 2 0T TL
x f x x ββ
(5.16)
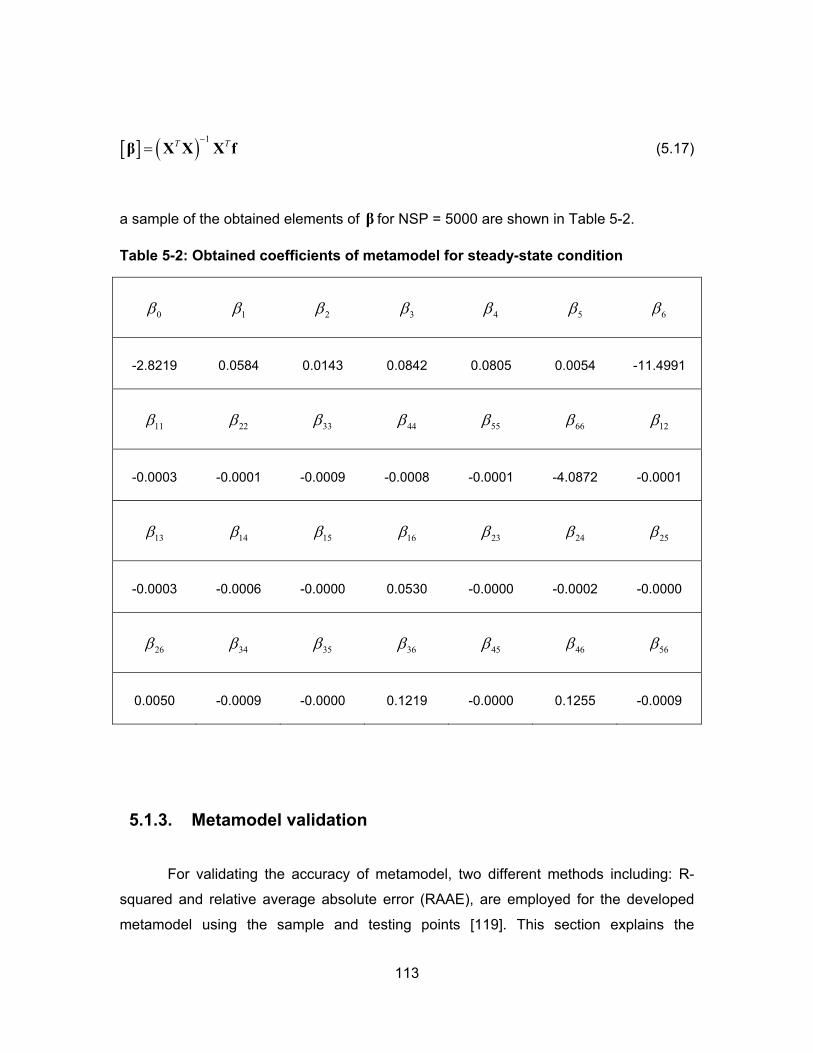
113
1T Tβ X X X f (5.17)
a sample of the obtained elements of β for NSP = 5000 are shown in Table 5-2.
Table 5-2: Obtained coefficients of metamodel for steady-state condition
0 1 2 3 4 5 6
-2.8219 0.0584 0.0143 0.0842 0.0805 0.0054 -11.4991
11 22 33 44 55 66 12
-0.0003 -0.0001 -0.0009 -0.0008 -0.0001 -4.0872 -0.0001
13 14 15 16 23 24 25
-0.0003 -0.0006 -0.0000 0.0530 -0.0000 -0.0002 -0.0000
26 34 35 36 45 46 56
0.0050 -0.0009 -0.0000 0.1219 -0.0000 0.1255 -0.0009
5.1.3. Metamodel validation
For validating the accuracy of metamodel, two different methods including: R-
squared and relative average absolute error (RAAE), are employed for the developed
metamodel using the sample and testing points [119]. This section explains the
114
calculation of these parameters and validation of the metamodel. The corrected sum of
squares TSS is used as a measure of overall variability in the data [117,119].
2
1
n
iiT
T
f
SSn
f f (5.18)
In addition, the sum of squares due to error is:
TT TESS f f β x f (5.19)
As such, the R-squared is defined as follows:
2
2 12
1
1
ns s
tT E
ns sT
t
f x f xSS SS
RSS
f x f x
(5.20)
where, sf x and sf x are the so-called black-box function (previously developed
mathematical model of VACR system, see section 2.1) and the metamodel function at a
sample point sx , respectively. Moreover, sf x denotes the mean of black-box
function over the n sample points in approximating the black-box function. The R-
squared indicates the overall accuracy of the approximated metamodel with given
sample points. The closer the value of R-squared approaches one, the more accurate is
the approximation model. However, R-squared is not sufficient for comparing accuracies
of two models because it only shows the accuracy with respect to modeling points, not
the model’s extrapolation ability. As such, the RAAE is defined as:
115
1
nt t
t
f x f xRAAE
n STD
(5.21)
2
1
1/n
t t
t
STD n f x f x
(5.22)
where, STD denotes the standard deviation of the black-box function prediction at the
test points. The defined RAAE indicates the overall accuracy of the approximated model
in the entire design range, computed at random test points. The smaller the RAAE value,
the more accurate is the approximation. Both R-squared and RAAE show the average
accuracy over the entire space.
As such, the R-squared and RAAE for all the NSP values from 500 to 5000 are
calculated and presented in Table 5-3. For the selected NSP = 5000, the R-squared is
0.820 and the RAAE is 0.184. The results show that by increasing the NSP, the R-
squared decreases; however, the RAAE also decreases. The R-squared value is
decreasing with the increasing number of sample points. It is expected because the
model tries to find the coefficients in a way that the model becomes close to all of the
sample points. By comparing the RAAE values, it can be concluded that the derived
model is getting more accurate by increasing the number of sample points. This
happens due to the fact that the RAAE is getting lower as the NSP increases [119]. In
fact, by increasing the NSP, the accuracy of obtained metamodel increases since a
wider range of design variable values are engaged in development of the model. A
comparison between the NSP of 2000 and 5000 shows that the relative difference
between the R-squared values and RAAE values on these NSPs are less than 4%,
which shows a good validation for such complex engineering problem [117–119].
Accordingly, the NSP of 5000 and the corresponding metamodel are selected for the
purpose of global optimization in this study.
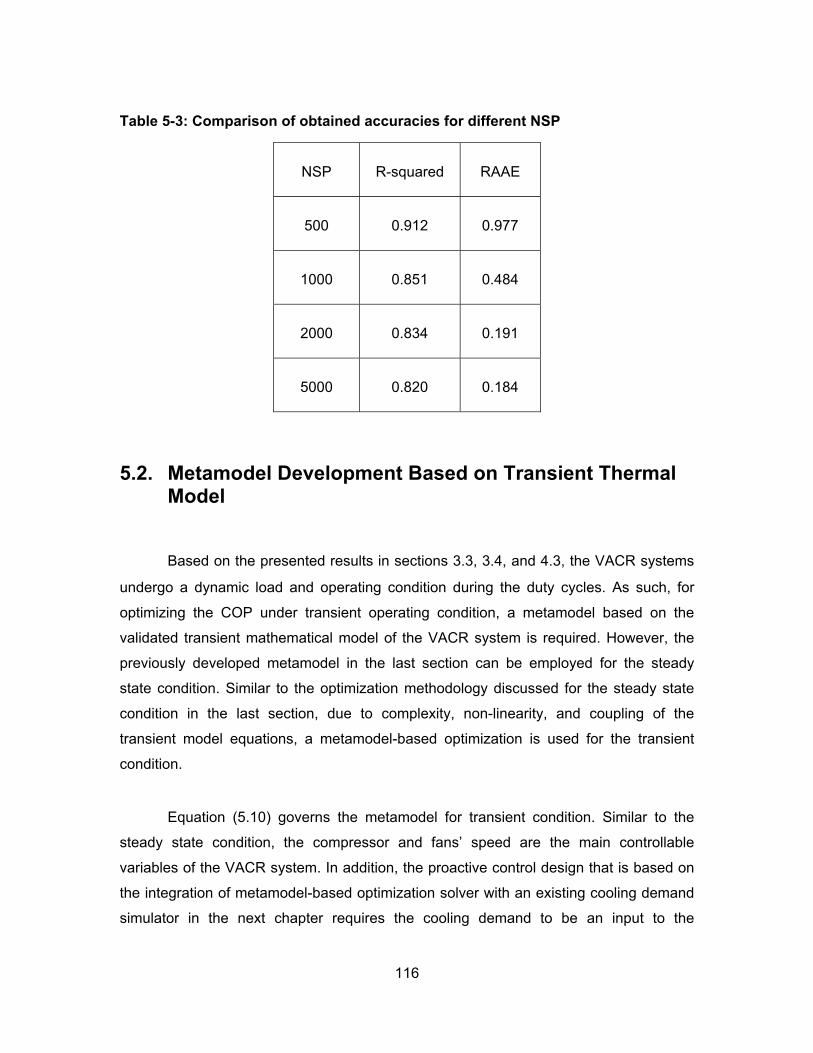
116
Table 5-3: Comparison of obtained accuracies for different NSP
NSP R-squared RAAE
500 0.912 0.977
1000 0.851 0.484
2000 0.834 0.191
5000 0.820 0.184
5.2. Metamodel Development Based on Transient Thermal Model
Based on the presented results in sections 3.3, 3.4, and 4.3, the VACR systems
undergo a dynamic load and operating condition during the duty cycles. As such, for
optimizing the COP under transient operating condition, a metamodel based on the
validated transient mathematical model of the VACR system is required. However, the
previously developed metamodel in the last section can be employed for the steady
state condition. Similar to the optimization methodology discussed for the steady state
condition in the last section, due to complexity, non-linearity, and coupling of the
transient model equations, a metamodel-based optimization is used for the transient
condition.
Equation (5.10) governs the metamodel for transient condition. Similar to the
steady state condition, the compressor and fans’ speed are the main controllable
variables of the VACR system. In addition, the proactive control design that is based on
the integration of metamodel-based optimization solver with an existing cooling demand
simulator in the next chapter requires the cooling demand to be an input to the
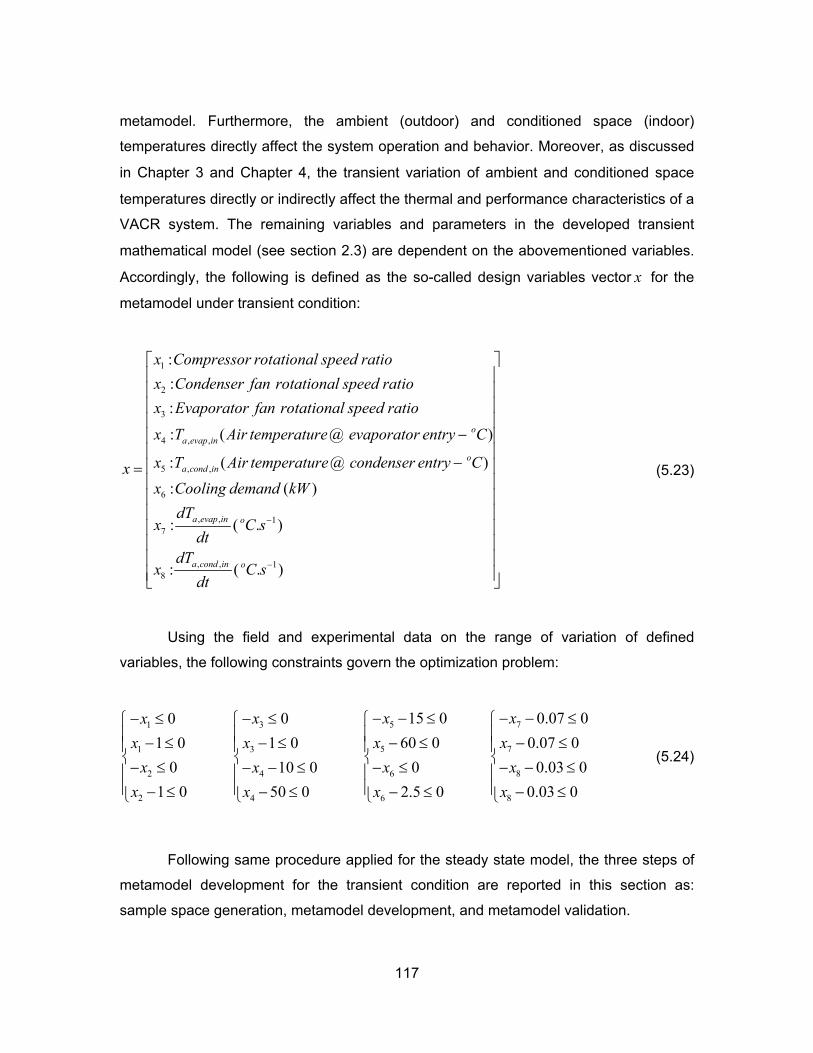
117
metamodel. Furthermore, the ambient (outdoor) and conditioned space (indoor)
temperatures directly affect the system operation and behavior. Moreover, as discussed
in Chapter 3 and Chapter 4, the transient variation of ambient and conditioned space
temperatures directly or indirectly affect the thermal and performance characteristics of a
VACR system. The remaining variables and parameters in the developed transient
mathematical model (see section 2.3) are dependent on the abovementioned variables.
Accordingly, the following is defined as the so-called design variables vector x for the
metamodel under transient condition:
1
2
3
4 , ,
5 , ,
:
:
:
: ( @ )
: ( @
oa evap in
oa cond in
x Compressor rotational speed ratio
x Condenser fan rotational speed ratio
x Evaporator fan rotational speed ratio
x T Air temperature evaporator entry C
x T Air temperature condenser entry Cx
6
, , 17
, , 18
)
: ( )
: ( . )
: ( . )
a evap in o
a cond in o
x Cooling demand kW
dTx C s
dtdT
x C sdt
(5.23)
Using the field and experimental data on the range of variation of defined
variables, the following constraints govern the optimization problem:
5 731
5 71 3
2 6 84
2 4 6 8
15 0 0.07 000
60 0 0.07 01 0 1 0
0 0 0.03 010 0
1 0 50 0 2.5 0 0.03 0
x xxx
x xx x
x x xx
x x x x
(5.24)
Following same procedure applied for the steady state model, the three steps of
metamodel development for the transient condition are reported in this section as:
sample space generation, metamodel development, and metamodel validation.
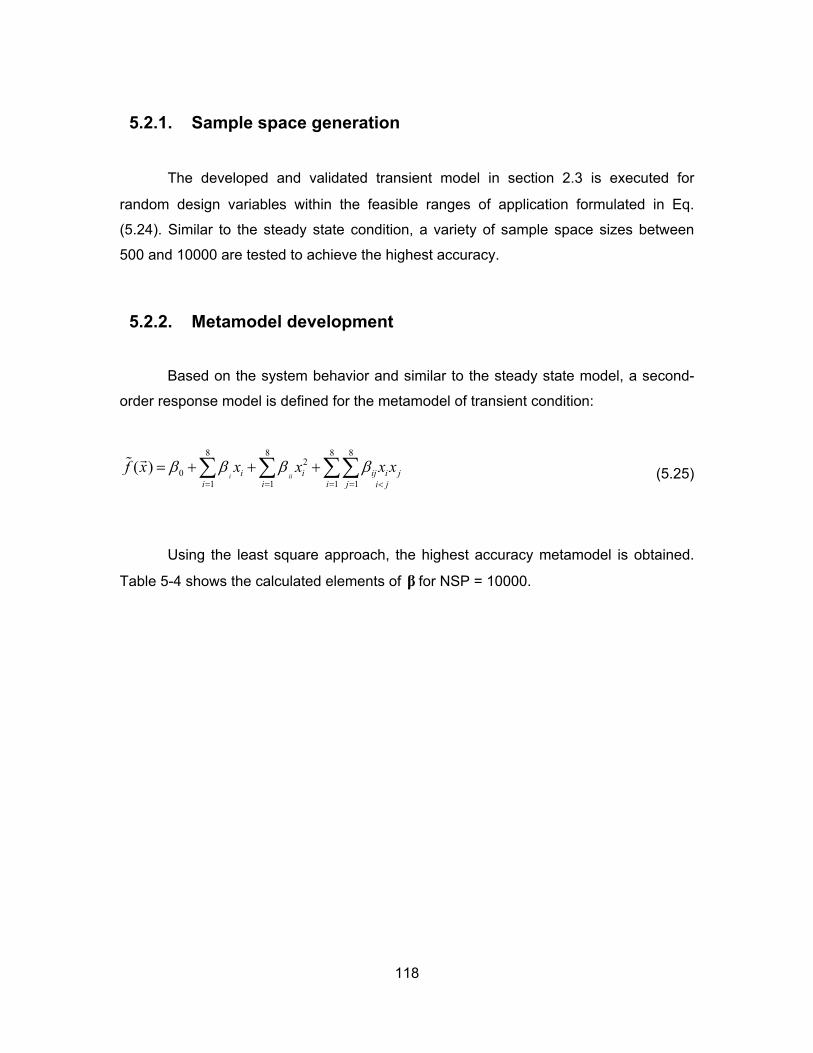
118
5.2.1. Sample space generation
The developed and validated transient model in section 2.3 is executed for
random design variables within the feasible ranges of application formulated in Eq.
(5.24). Similar to the steady state condition, a variety of sample space sizes between
500 and 10000 are tested to achieve the highest accuracy.
5.2.2. Metamodel development
Based on the system behavior and similar to the steady state model, a second-
order response model is defined for the metamodel of transient condition:
8 8 8 82
01 1 1 1
( )i iii i ij i j
i i i j i j
f x x x x x
(5.25)
Using the least square approach, the highest accuracy metamodel is obtained.
Table 5-4 shows the calculated elements of β for NSP = 10000.
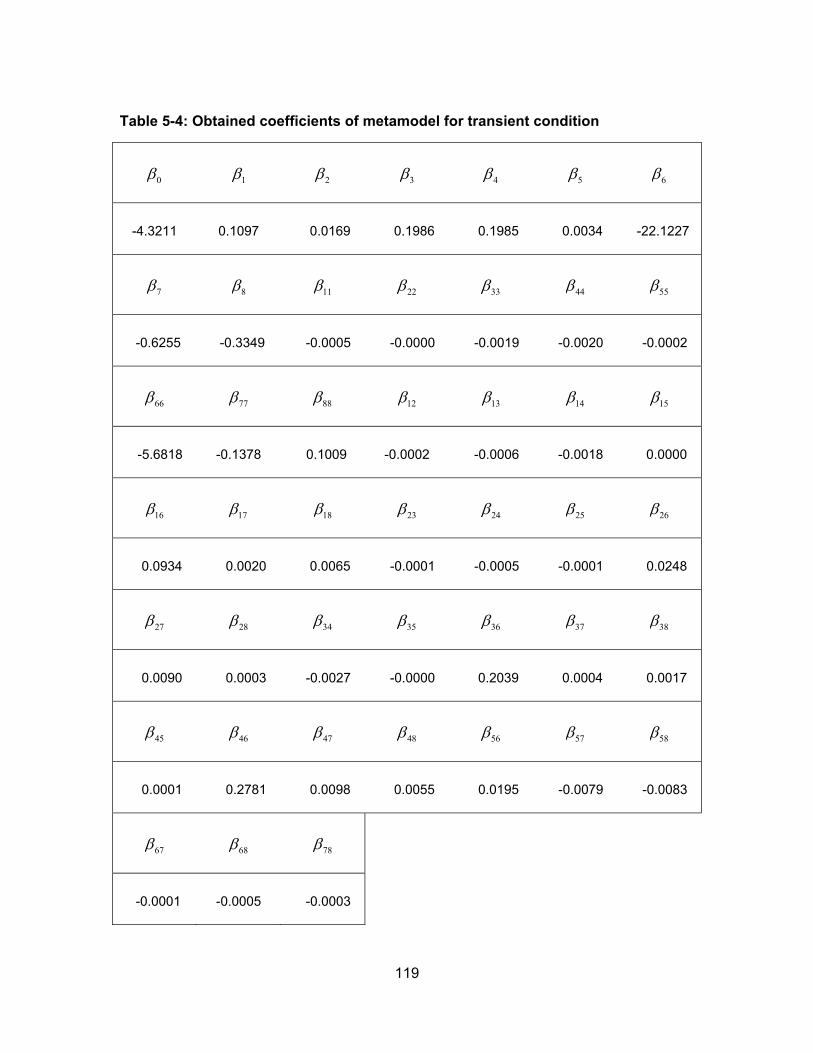
119
Table 5-4: Obtained coefficients of metamodel for transient condition
0 1 2 3 4 5 6
-4.3211 0.1097 0.0169 0.1986 0.1985 0.0034 -22.1227
7 8 11 22 33 44 55
-0.6255 -0.3349 -0.0005 -0.0000 -0.0019 -0.0020 -0.0002
66 77 88 12 13 14 15
-5.6818 -0.1378 0.1009 -0.0002 -0.0006 -0.0018 0.0000
16 17 18 23 24 25 26
0.0934 0.0020 0.0065 -0.0001 -0.0005 -0.0001 0.0248
27 28 34 35 36 37 38
0.0090 0.0003 -0.0027 -0.0000 0.2039 0.0004 0.0017
45 46 47 48 56 57 58
0.0001 0.2781 0.0098 0.0055 0.0195 -0.0079 -0.0083
67 68 78
-0.0001 -0.0005 -0.0003
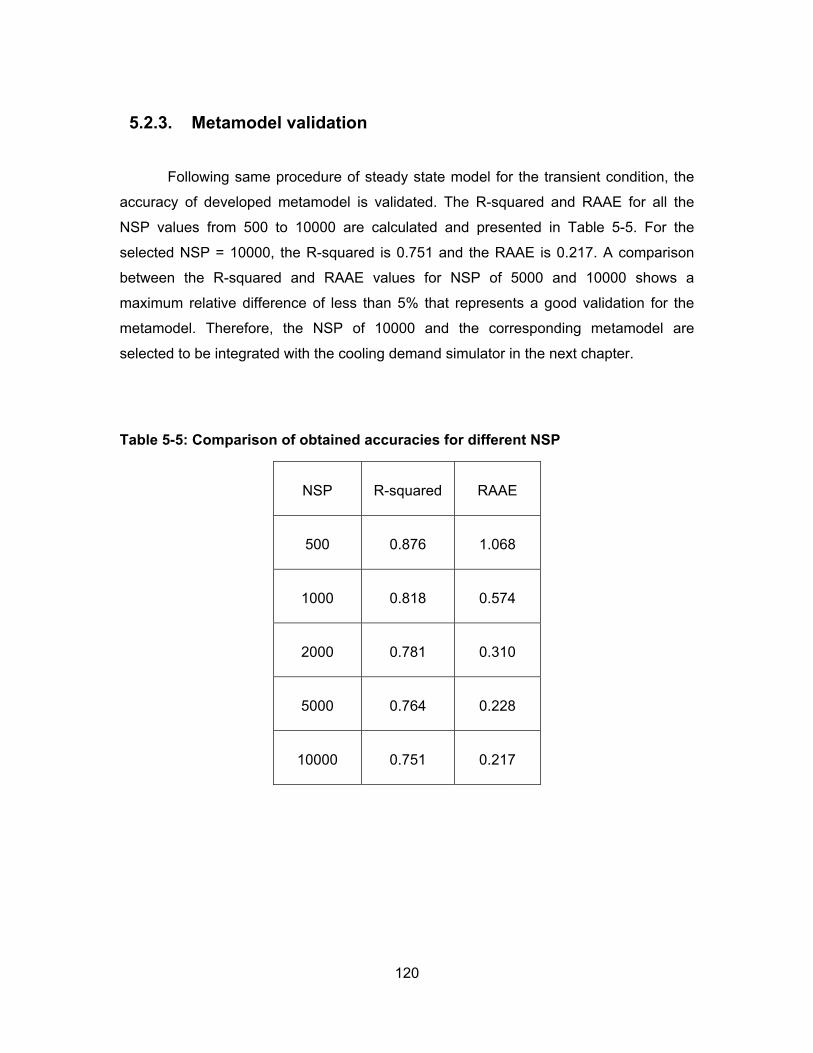
120
5.2.3. Metamodel validation
Following same procedure of steady state model for the transient condition, the
accuracy of developed metamodel is validated. The R-squared and RAAE for all the
NSP values from 500 to 10000 are calculated and presented in Table 5-5. For the
selected NSP = 10000, the R-squared is 0.751 and the RAAE is 0.217. A comparison
between the R-squared and RAAE values for NSP of 5000 and 10000 shows a
maximum relative difference of less than 5% that represents a good validation for the
metamodel. Therefore, the NSP of 10000 and the corresponding metamodel are
selected to be integrated with the cooling demand simulator in the next chapter.
Table 5-5: Comparison of obtained accuracies for different NSP
NSP R-squared RAAE
500 0.876 1.068
1000 0.818 0.574
2000 0.781 0.310
5000 0.764 0.228
10000 0.751 0.217
121
5.3. Conclusion
The metamodels for steady state and transient operating conditions were
obtained in this chapter. Due to complexity of previously developed mathematical
models, which appeared from the nonlinear and coupled governing equations, the
metamodel-based optimization was selected in this study. The objective function was
defined and the metamodel was obtained for steady state and transient conditions
separately. The so-called design variables vector for steady state condition was formed
from speeds of compressor and fans, cooling demand, ambient temperature, and
conditioned space temperature. The ambient and conditioned space temperature
gradients (time derivative) were added to the mentioned variables to form the set of
design variables for the transient metamodel. Sample spaces with NSP of 500-5000 for
the steady state and 500-10000 for the transient condition were generated by executing
the original mathematical models for random design variables. The metamodels were
then developed using second-order response model approach and validated using R-
squared and RAAE methods. The values of 0.820 for R-squared and 0.184 for RAAE of
steady state metamodel were achieved using the NSP of 5000. In addition, the R-
squared of 0.751 and the RAAE of 0.217 were achieved for the transient model using
the NSP of 10000. The obtained metamodels will be integrated with a cooling demand
simulator in the next chapter to develop the proactive, optimization-based model
predictive controller for achieving the highest COP of the built VACR system in the
LAEC.
122
Chapter 6. Proof-of-concept Demonstration of High Efficiency VACR System for Service Vehicles
The main goal of this research is to develop a proof-of-concept demonstration of
high efficiency VACR system to be used for service vehicles in transportation industry.
Thus far, the comprehensive theoretical and experimental study on thermal and
performance characteristics of pilot stationary A/C-R and VACR systems have been
performed and metamodels are developed based on the validated results. Moreover, a
high efficiency VACR system is built in the lab using the variable speed compressor and
fans. The final step to achieve the main goal is to develop an optimization solver for the
metamodels and integrate it with a validated cooling load simulation tool and develop a
proactive and optimal controller to be added to the built VACR system. In this chapter,
the optimization solver is developed and integrated with a cooling demand simulator and
implemented on the VACR system. The system is then tested under both steady state
and transient conditions to evaluate the achieved efficiency enhancement in this project.
6.1. Development of Optimization Solver and Integration with a Cooling Demand Simulator, Proactive Control
The reported literature review in section 1.5 and observations on the existing
A/C-R systems show that most existing systems are equipped with simple thermostatic
controllers to keep the desired temperature in the conditioned spaces. Although the
usage of thermostatic controllers reduces the initial cost of A/C-R systems and has
shown a reliable functionality of these systems, the inevitable on-off cycling over the
123
partial cooling demands (as described in the previous chapters) significantly reduces the
life time and performance of the systems. The thermostatic controllers are usually
designed to keep the conditioned space temperature between adjustable low and high
set points. As such, the A/C-R systems receive an “ON” command from the
corresponding thermostat whenever the temperature is above the high set point and an
“OFF” command whenever the temperature drops below the low set point. The
difference between high and low set points varies depending upon the application;
usually around 2-3 oC. The existence of such temperature range in the controller of A/C-
R systems means that the conditioned space temperature can be at most kept within a
range of ±1-1.5 oC from a desired temperature. Therefore, there is always inevitable
temperature fluctuations in the conditioned spaces as reported and discussed in Chapter
3 and Chapter 4.
According to inefficient on-off cycling of common stationary A/C-R and VACR
systems, an idea of “proactive and optimal control” development for these systems
emerged in this research. The proactive feature enables the controller to predict the
effects of current cooling demand in a close future and command the system
accordingly. In other words, if the upcoming effects of cooling demand in a conditioned
space is accurately predicted using a cooling demand simulator, the capacity of
corresponding A/C-R system can be adjusted in advance to compensate the upcoming
effects. This proactive action prevents the system from more or less than enough cooling
power generation and leads to keeping a constant temperature in the conditioned space.
The proactive control concept development is an important step toward the efficient
usage of A/C-R systems. If the proactive controller is also equipped with an optimization
solver of the developed metamodels, the final product can predict the upcoming effects
of current cooling demand, find the optimum speeds of compressor and fans for
compensating the demand, and command the system to operate optimally. As such, the
system can keep the temperature on the desired set point and operate optimally.
To develop a proactive and optimization-based controller for the built VACR
system, an optimization solver of the developed metamodels in Chapter 5 is integrated
with a validated high accuracy cooling demand simulation model [120]. The cooling
demand simulator has been recently developed and validated through a PhD thesis at
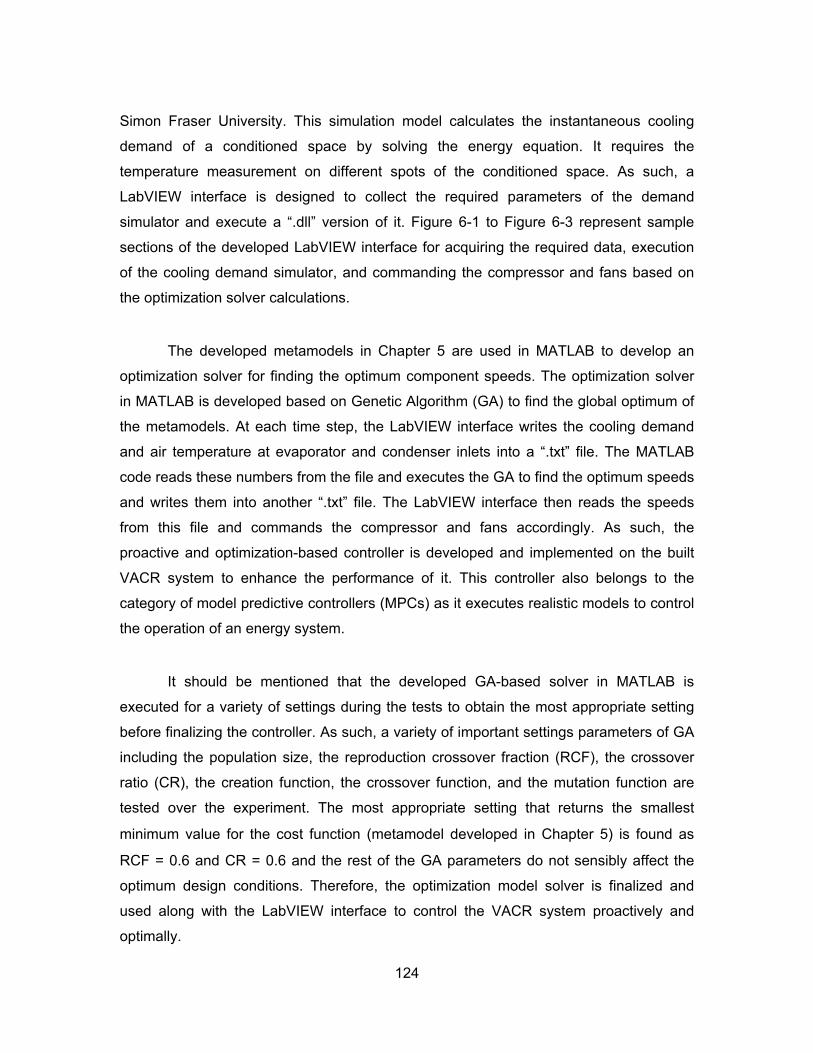
124
Simon Fraser University. This simulation model calculates the instantaneous cooling
demand of a conditioned space by solving the energy equation. It requires the
temperature measurement on different spots of the conditioned space. As such, a
LabVIEW interface is designed to collect the required parameters of the demand
simulator and execute a “.dll” version of it. Figure 6-1 to Figure 6-3 represent sample
sections of the developed LabVIEW interface for acquiring the required data, execution
of the cooling demand simulator, and commanding the compressor and fans based on
the optimization solver calculations.
The developed metamodels in Chapter 5 are used in MATLAB to develop an
optimization solver for finding the optimum component speeds. The optimization solver
in MATLAB is developed based on Genetic Algorithm (GA) to find the global optimum of
the metamodels. At each time step, the LabVIEW interface writes the cooling demand
and air temperature at evaporator and condenser inlets into a “.txt” file. The MATLAB
code reads these numbers from the file and executes the GA to find the optimum speeds
and writes them into another “.txt” file. The LabVIEW interface then reads the speeds
from this file and commands the compressor and fans accordingly. As such, the
proactive and optimization-based controller is developed and implemented on the built
VACR system to enhance the performance of it. This controller also belongs to the
category of model predictive controllers (MPCs) as it executes realistic models to control
the operation of an energy system.
It should be mentioned that the developed GA-based solver in MATLAB is
executed for a variety of settings during the tests to obtain the most appropriate setting
before finalizing the controller. As such, a variety of important settings parameters of GA
including the population size, the reproduction crossover fraction (RCF), the crossover
ratio (CR), the creation function, the crossover function, and the mutation function are
tested over the experiment. The most appropriate setting that returns the smallest
minimum value for the cost function (metamodel developed in Chapter 5) is found as
RCF = 0.6 and CR = 0.6 and the rest of the GA parameters do not sensibly affect the
optimum design conditions. Therefore, the optimization model solver is finalized and
used along with the LabVIEW interface to control the VACR system proactively and
optimally.
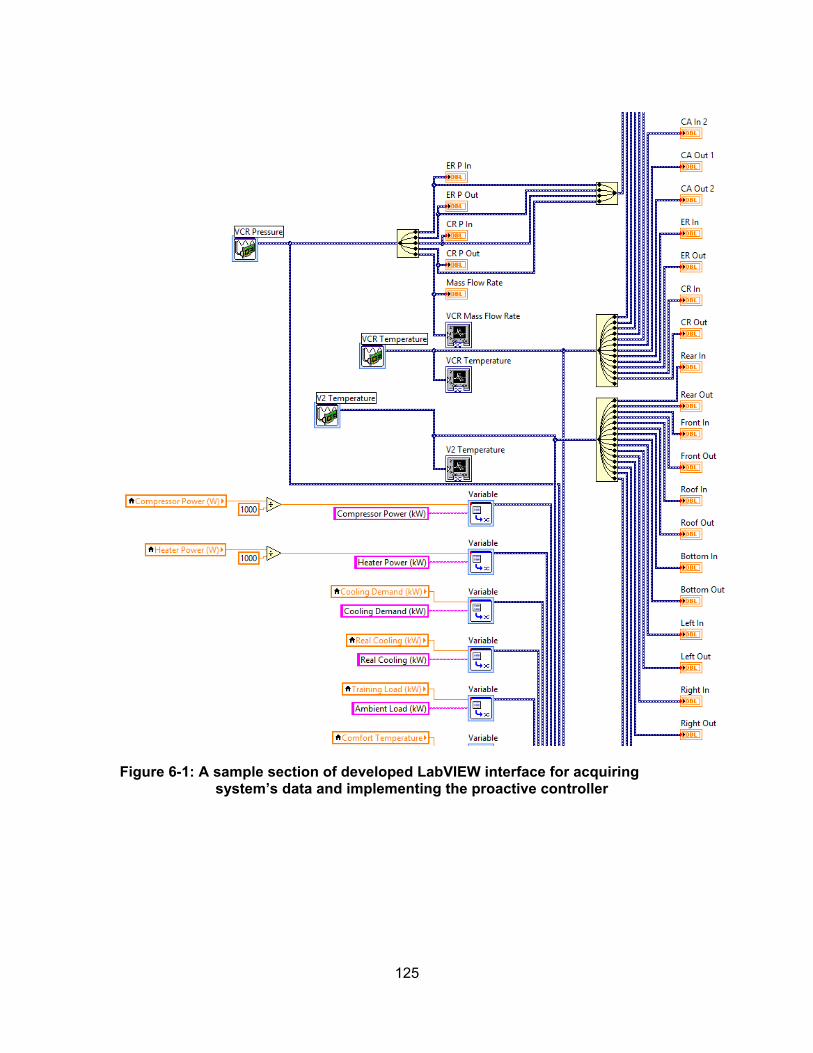
125
Figure 6-1: A sample section of developed LabVIEW interface for acquiring system’s data and implementing the proactive controller
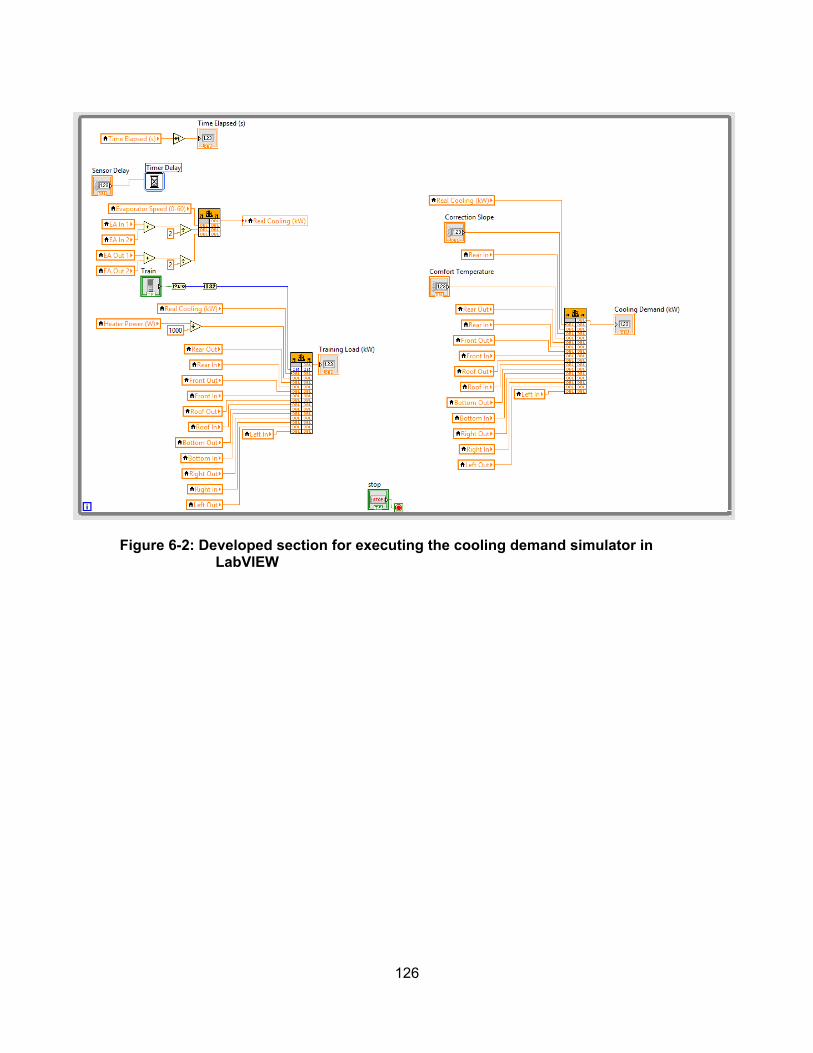
126
Figure 6-2: Developed section for executing the cooling demand simulator in LabVIEW
127
Figure 6-3: Developed section in LabVIEW interface for commanding compressor, evaporator and condenser fans based on optimization model results
6.2. Proactive, Optimization-Based, Model Predictive Control under Steady State Condition
Utilizing the developed proactive and optimal controller, a variety of tests is
performed on the built VACR system to evaluate the performance characteristics. In
addition, to evaluate the achieved performance enhancement due to development of the
proactive and optimal controller, the results are compared with a thermostatic based on-
off controller on the same system. To perform the thermostatic on-off tests, the cooling
demand simulator is bypassed in the LabVIEW interface and the optimization code is
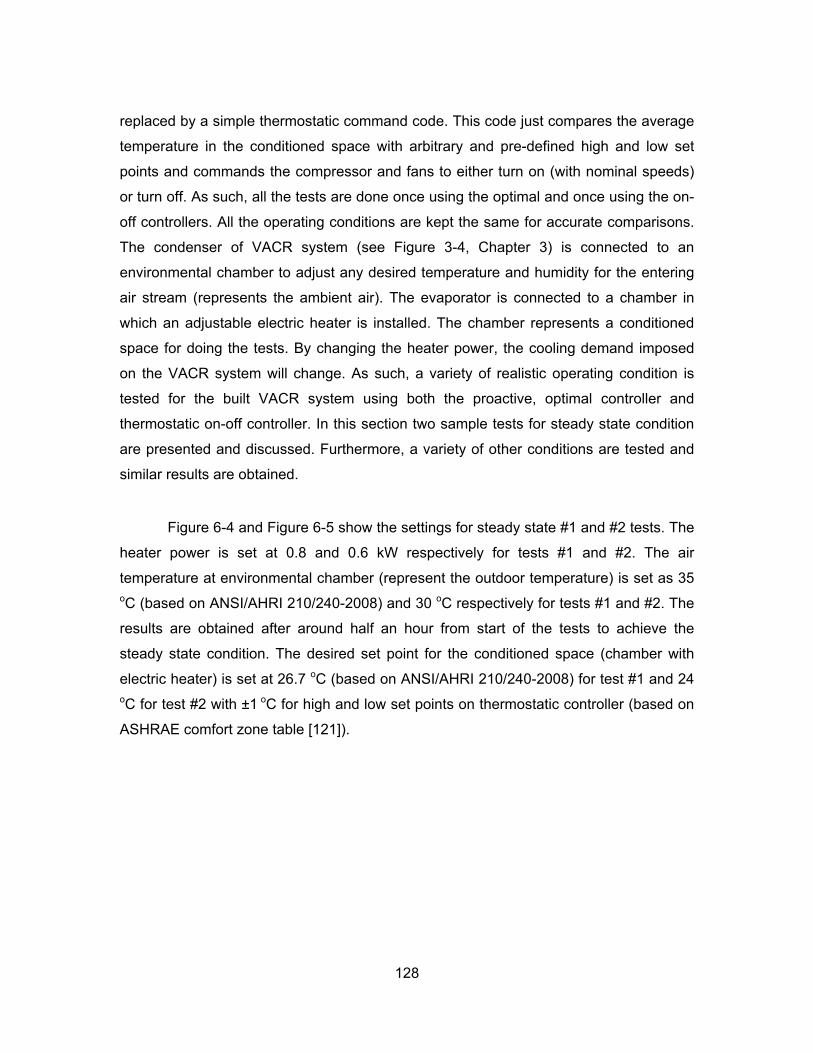
128
replaced by a simple thermostatic command code. This code just compares the average
temperature in the conditioned space with arbitrary and pre-defined high and low set
points and commands the compressor and fans to either turn on (with nominal speeds)
or turn off. As such, all the tests are done once using the optimal and once using the on-
off controllers. All the operating conditions are kept the same for accurate comparisons.
The condenser of VACR system (see Figure 3-4, Chapter 3) is connected to an
environmental chamber to adjust any desired temperature and humidity for the entering
air stream (represents the ambient air). The evaporator is connected to a chamber in
which an adjustable electric heater is installed. The chamber represents a conditioned
space for doing the tests. By changing the heater power, the cooling demand imposed
on the VACR system will change. As such, a variety of realistic operating condition is
tested for the built VACR system using both the proactive, optimal controller and
thermostatic on-off controller. In this section two sample tests for steady state condition
are presented and discussed. Furthermore, a variety of other conditions are tested and
similar results are obtained.
Figure 6-4 and Figure 6-5 show the settings for steady state #1 and #2 tests. The
heater power is set at 0.8 and 0.6 kW respectively for tests #1 and #2. The air
temperature at environmental chamber (represent the outdoor temperature) is set as 35 oC (based on ANSI/AHRI 210/240-2008) and 30 oC respectively for tests #1 and #2. The
results are obtained after around half an hour from start of the tests to achieve the
steady state condition. The desired set point for the conditioned space (chamber with
electric heater) is set at 26.7 oC (based on ANSI/AHRI 210/240-2008) for test #1 and 24 oC for test #2 with ±1 oC for high and low set points on thermostatic controller (based on
ASHRAE comfort zone table [121]).
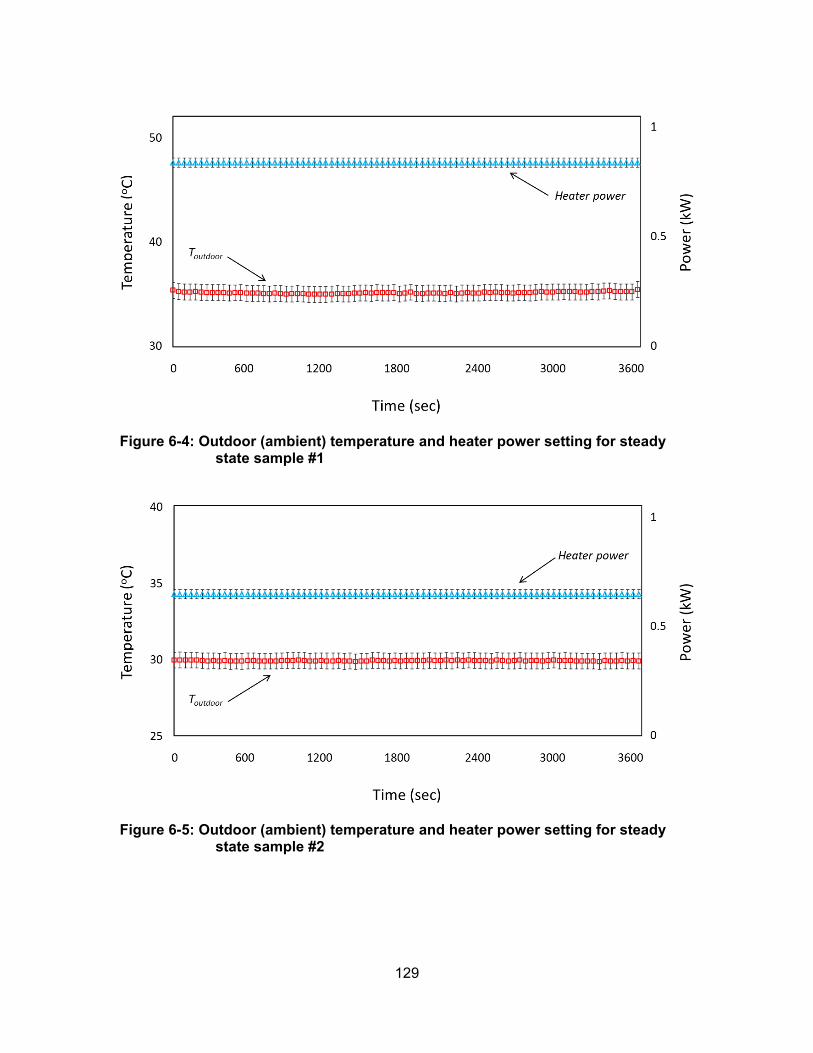
129
Figure 6-4: Outdoor (ambient) temperature and heater power setting for steady state sample #1
Figure 6-5: Outdoor (ambient) temperature and heater power setting for steady state sample #2
130
The results of these tests are presented in Figure 6-6 to Figure 6-12 for the
thermostatic (on-off) controller and in Figure 6-13 to Figure 6-17 for the developed
proactive, optimization-based, model predictive controller. All the presented results
except the speed ratios are from measurements. The speed ratios are generated by the
proactive and optimal controller and sent to the compressor and fans. It should be
mentioned that in conditioned space temperature graph (Figure 6-8), the error bars are
not shown to have a clearer vision of the variations. The uncertainty of temperature
measurements is ±0.5 oC. The following are concluded from the presented results:
o The VACR system equipped with thermostatic controller frequently cycles on-off
(see Figure 6-6 and Figure 6-7) to keep the conditioned space temperature within
the desired ranges (see Figure 6-8). However, the system equipped with
proactive and optimal controller adjusts the speed of compressor and fans (see
Figure 6-13 and Figure 6-14) to overcome the imposed cooling load and keep the
temperature constant in the conditioned space (see Figure 6-15). Therefore, the
proactive and optimal controller functions satisfactorily (as per its design) and
eliminates any inefficient on-off cycling of the VACR system. This is one of the
most important achievements of this study that can also solve many issues in
industries with high sensitivity to temperature variations.
o The steady state tests are repeated for a variety of temperature and loads and
similar trends are obtained. The proactive optimal controller functions
consistently with no observed incoherent and unreasonable outputs under
different test conditions. From the results one can conclude that a same
command is reproduced through a steady state condition that confirms stability of
the model predictive controller (see Figure 6-13 and Figure 6-14). The
consistency and reproducibility of commands is a major element of controller’s
reliability.
o The frequent on-off cycling is reflected in the power consumption and COP of the
thermostatically controlled VACR system (see Figure 6-9 to Figure 6-12). The
frequent cycling of the VACR system’s components reduces their lifetime and
performance. However, a consistent and uniform behavior is observed for the
proactively and optimally controlled VACR system.
131
o The COP of thermostatically controlled VACR system for the presented tests
varies between 0 (for “OFF” cycles) and 3.3 (during the “ON” cycles) depending
upon the operating condition and cycling. However, the COP of proactively and
optimally controlled VACR system is nearly constant over time for each of the
tests. The average COP of system during the steady state test #1 is 3.0 and 3.7
respectively for the thermostatic (averaged only for the “ON” cycles) and optimal
controllers. Also, for the test #2 the average COP is 2.8 and 3.4 respectively for
the thermostatic and optimal controllers. These numbers indicate 23.3% and
21.4% higher COP for the optimal controller in comparison with the thermostatic
controller.
o A comparison of the achieved COP from the proactively and optimally controlled
VACR system built in LAEC with the original VACR system (the first VACR
system from industrial partner, see section 3.1) under same steady state
condition of ANSI/AHRI 210/240-2008 shows an improvement from 1.3 to 3.7
equivalent to 185%. From this 185% COP improvement, 162% is achieved by
replacing the VACR elements including compressor, condenser, evaporator, and
fans with high efficiency products in the market. The rest of COP enhancement,
which is 23%, is achieved by developing the proactive and optimal model
predictive controller. The comparisons for other tests over different operating
conditions show a COP enhancement in a range of 179-187%. The share of
proactive and optimal controller in COP enhancement varies in a range of 19-
24% depending upon the operating condition.
o The 19-24% COP enhancement is achieved using the developed proactive and
optimal controller on a VACR system that is built from high efficiency
components in the market. It is predicted that utilizing the developed controller for
any existing high efficiency VACR system (or even any A/C-R system) can lead
to similar remarkable COP enhancement. Furthermore, for any low efficiency
A/C-R system, the components can be replaced with high efficiency and variable
speed types and the new system be integrated with the proactive and optimal
controller to achieve a significant COP enhancement.
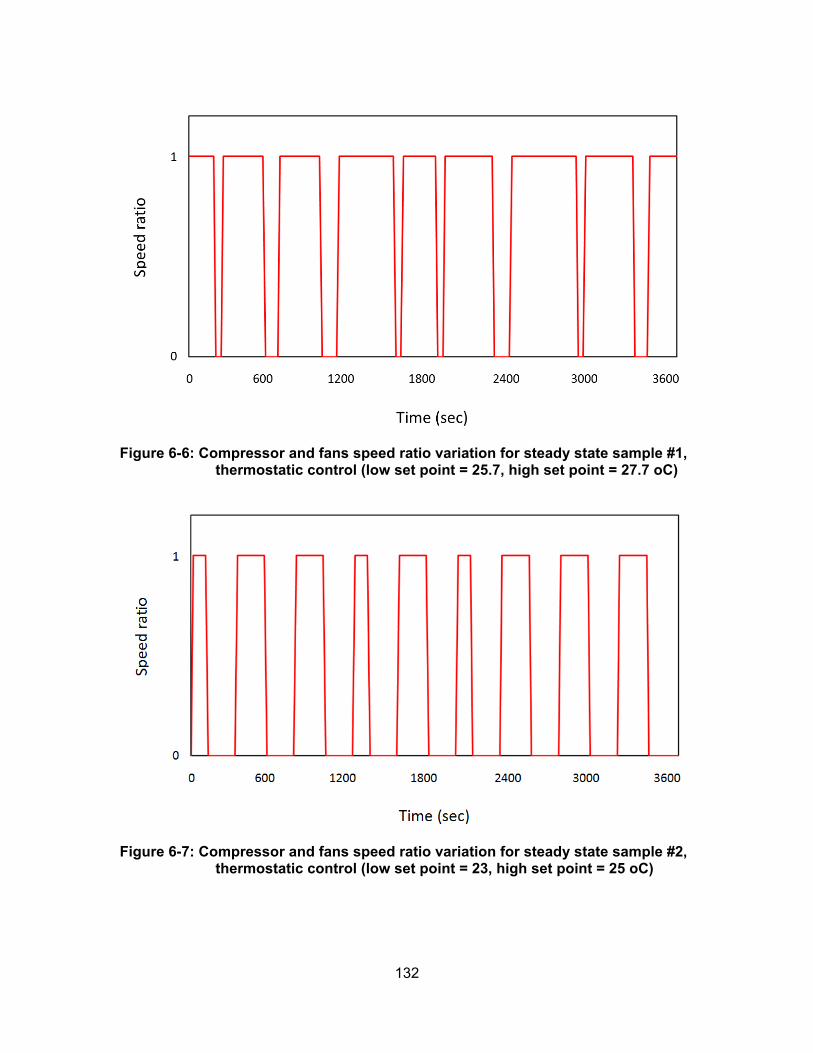
132
Figure 6-6: Compressor and fans speed ratio variation for steady state sample #1, thermostatic control (low set point = 25.7, high set point = 27.7 oC)
Figure 6-7: Compressor and fans speed ratio variation for steady state sample #2, thermostatic control (low set point = 23, high set point = 25 oC)
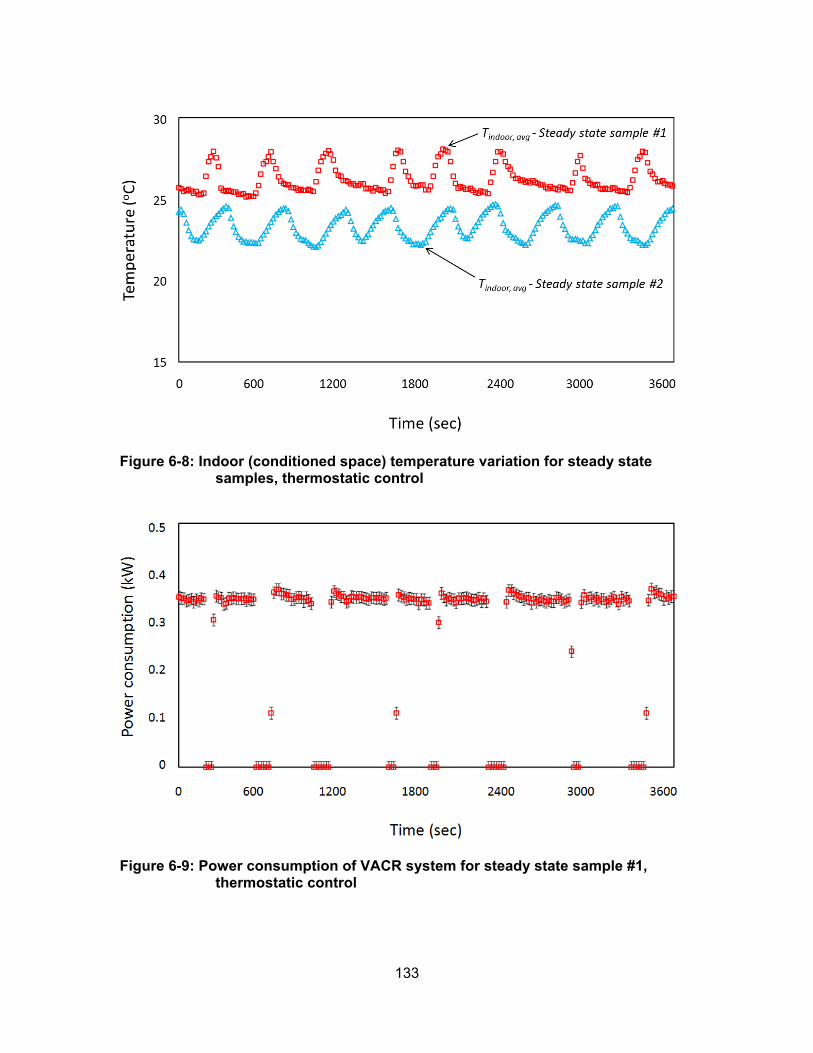
133
Figure 6-8: Indoor (conditioned space) temperature variation for steady state samples, thermostatic control
Figure 6-9: Power consumption of VACR system for steady state sample #1, thermostatic control
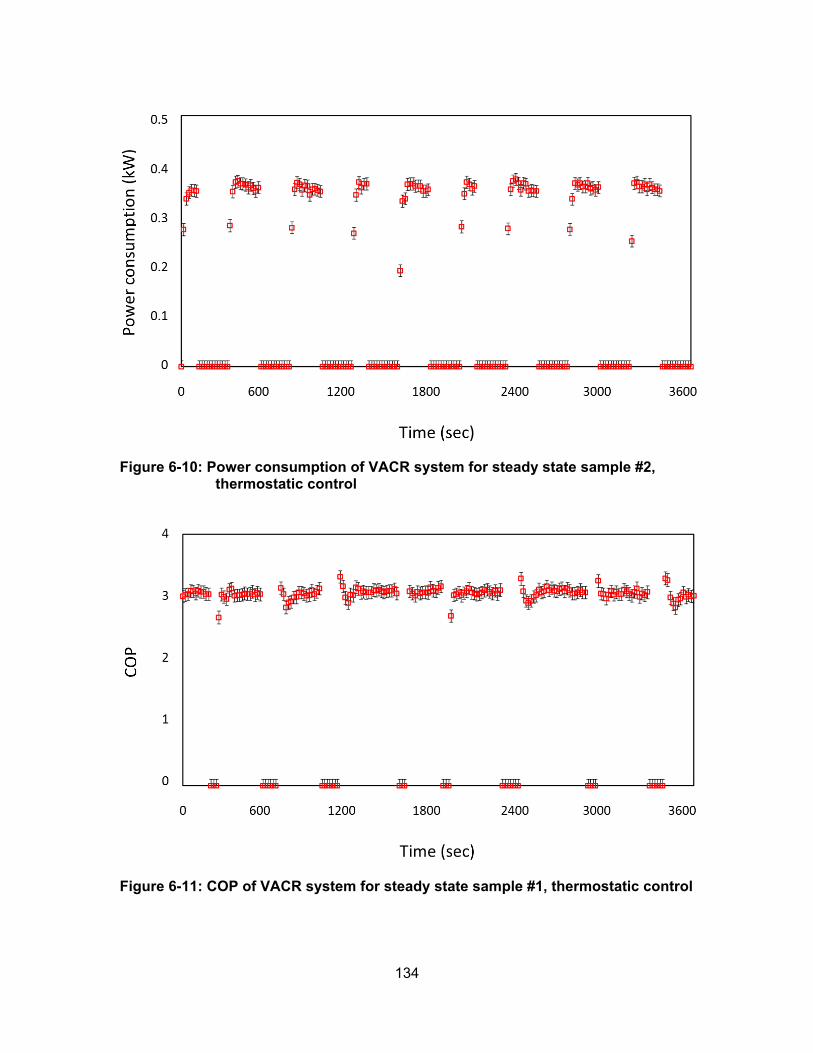
134
Figure 6-10: Power consumption of VACR system for steady state sample #2, thermostatic control
Figure 6-11: COP of VACR system for steady state sample #1, thermostatic control
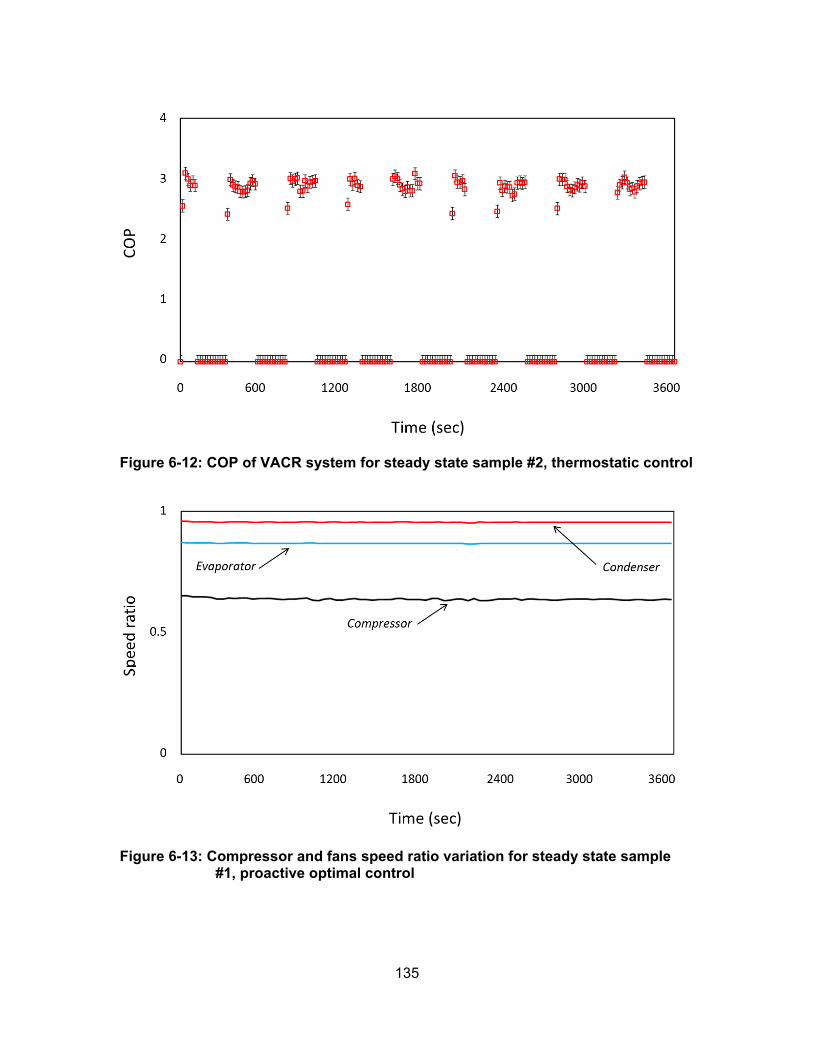
135
Figure 6-12: COP of VACR system for steady state sample #2, thermostatic control
Figure 6-13: Compressor and fans speed ratio variation for steady state sample #1, proactive optimal control
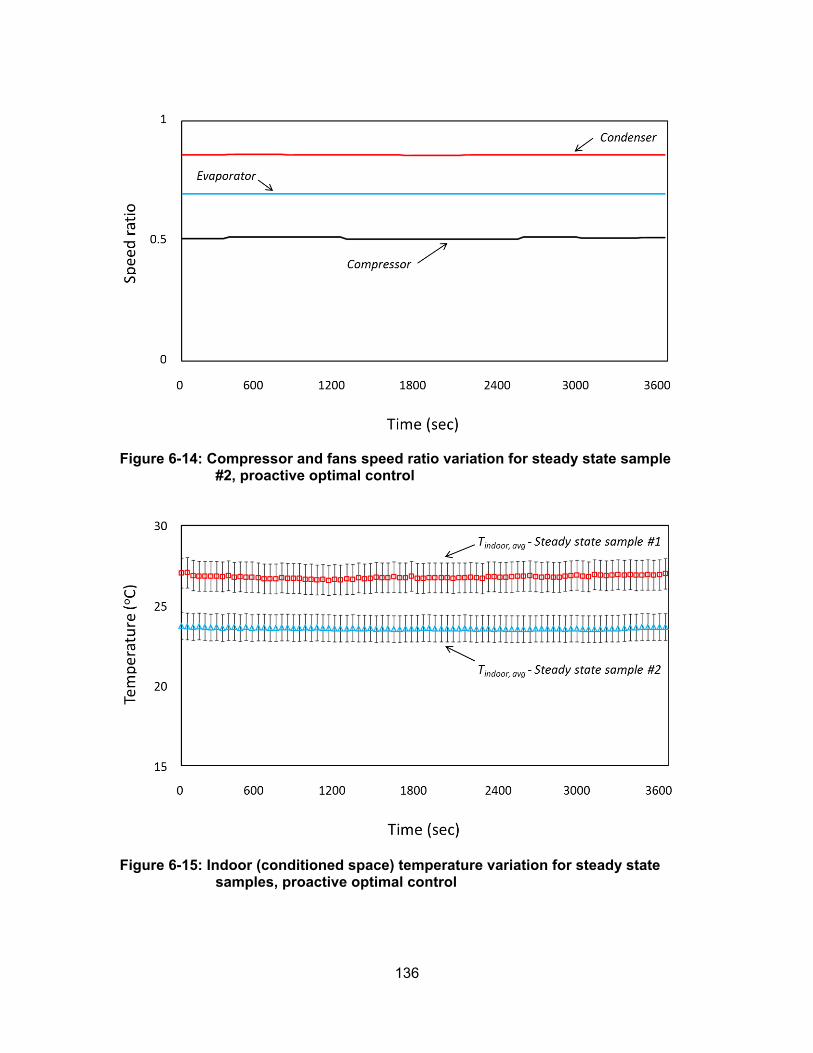
136
Figure 6-14: Compressor and fans speed ratio variation for steady state sample #2, proactive optimal control
Figure 6-15: Indoor (conditioned space) temperature variation for steady state samples, proactive optimal control
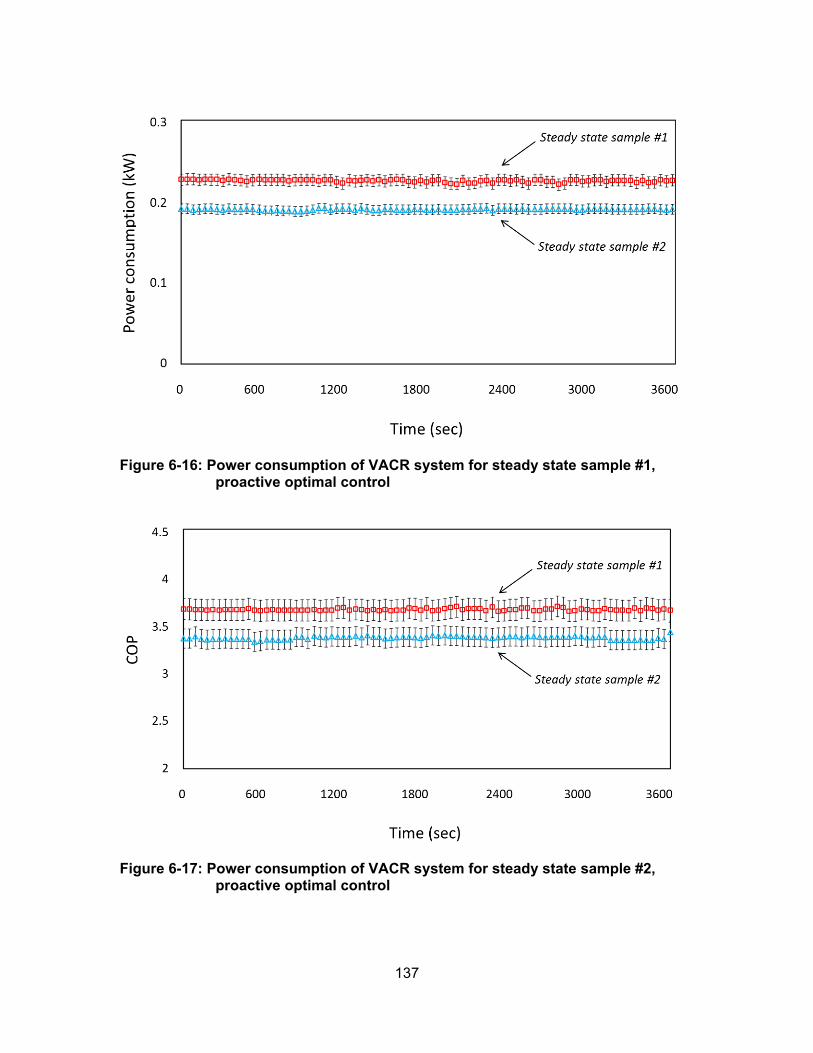
137
Figure 6-16: Power consumption of VACR system for steady state sample #1, proactive optimal control
Figure 6-17: Power consumption of VACR system for steady state sample #2, proactive optimal control
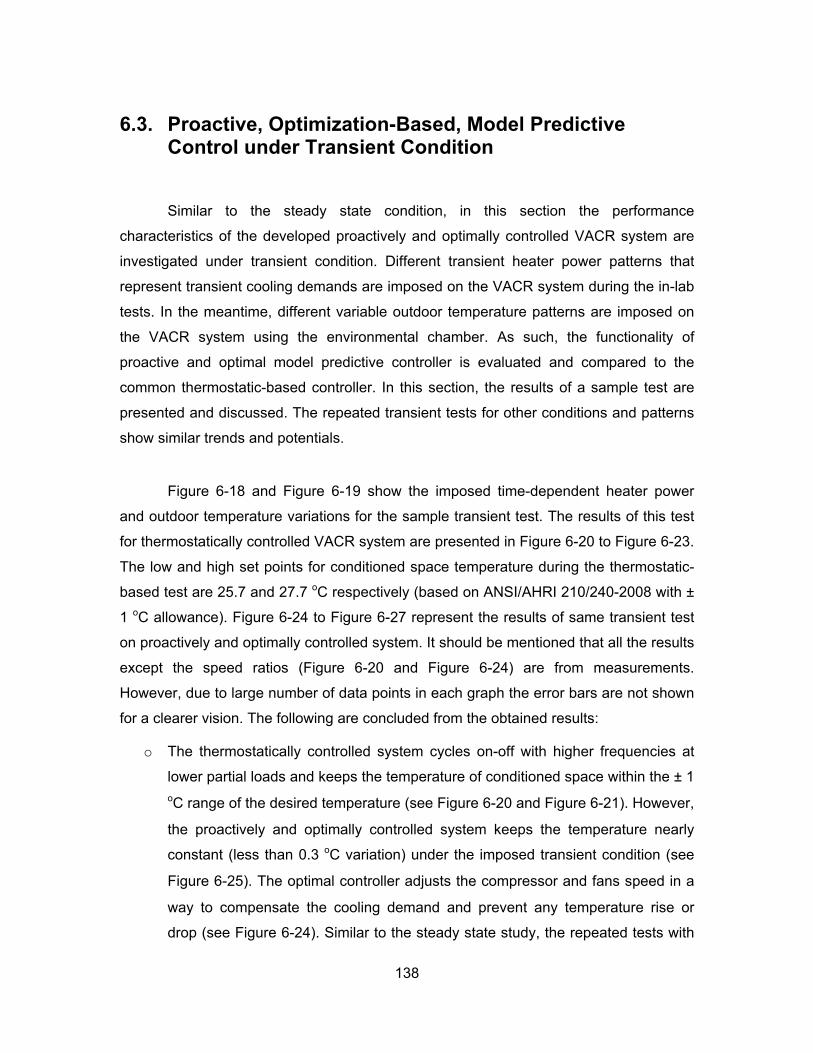
138
6.3. Proactive, Optimization-Based, Model Predictive Control under Transient Condition
Similar to the steady state condition, in this section the performance
characteristics of the developed proactively and optimally controlled VACR system are
investigated under transient condition. Different transient heater power patterns that
represent transient cooling demands are imposed on the VACR system during the in-lab
tests. In the meantime, different variable outdoor temperature patterns are imposed on
the VACR system using the environmental chamber. As such, the functionality of
proactive and optimal model predictive controller is evaluated and compared to the
common thermostatic-based controller. In this section, the results of a sample test are
presented and discussed. The repeated transient tests for other conditions and patterns
show similar trends and potentials.
Figure 6-18 and Figure 6-19 show the imposed time-dependent heater power
and outdoor temperature variations for the sample transient test. The results of this test
for thermostatically controlled VACR system are presented in Figure 6-20 to Figure 6-23.
The low and high set points for conditioned space temperature during the thermostatic-
based test are 25.7 and 27.7 oC respectively (based on ANSI/AHRI 210/240-2008 with ±
1 oC allowance). Figure 6-24 to Figure 6-27 represent the results of same transient test
on proactively and optimally controlled system. It should be mentioned that all the results
except the speed ratios (Figure 6-20 and Figure 6-24) are from measurements.
However, due to large number of data points in each graph the error bars are not shown
for a clearer vision. The following are concluded from the obtained results:
o The thermostatically controlled system cycles on-off with higher frequencies at
lower partial loads and keeps the temperature of conditioned space within the ± 1 oC range of the desired temperature (see Figure 6-20 and Figure 6-21). However,
the proactively and optimally controlled system keeps the temperature nearly
constant (less than 0.3 oC variation) under the imposed transient condition (see
Figure 6-25). The optimal controller adjusts the compressor and fans speed in a
way to compensate the cooling demand and prevent any temperature rise or
drop (see Figure 6-24). Similar to the steady state study, the repeated tests with
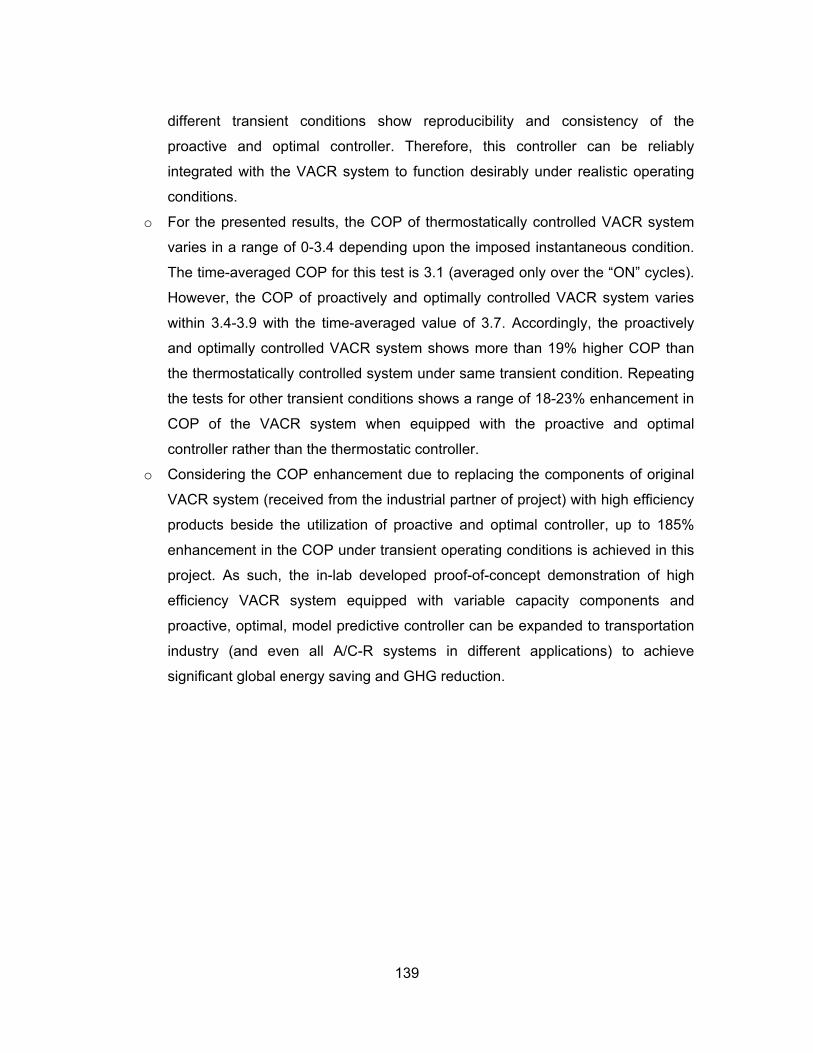
139
different transient conditions show reproducibility and consistency of the
proactive and optimal controller. Therefore, this controller can be reliably
integrated with the VACR system to function desirably under realistic operating
conditions.
o For the presented results, the COP of thermostatically controlled VACR system
varies in a range of 0-3.4 depending upon the imposed instantaneous condition.
The time-averaged COP for this test is 3.1 (averaged only over the “ON” cycles).
However, the COP of proactively and optimally controlled VACR system varies
within 3.4-3.9 with the time-averaged value of 3.7. Accordingly, the proactively
and optimally controlled VACR system shows more than 19% higher COP than
the thermostatically controlled system under same transient condition. Repeating
the tests for other transient conditions shows a range of 18-23% enhancement in
COP of the VACR system when equipped with the proactive and optimal
controller rather than the thermostatic controller.
o Considering the COP enhancement due to replacing the components of original
VACR system (received from the industrial partner of project) with high efficiency
products beside the utilization of proactive and optimal controller, up to 185%
enhancement in the COP under transient operating conditions is achieved in this
project. As such, the in-lab developed proof-of-concept demonstration of high
efficiency VACR system equipped with variable capacity components and
proactive, optimal, model predictive controller can be expanded to transportation
industry (and even all A/C-R systems in different applications) to achieve
significant global energy saving and GHG reduction.
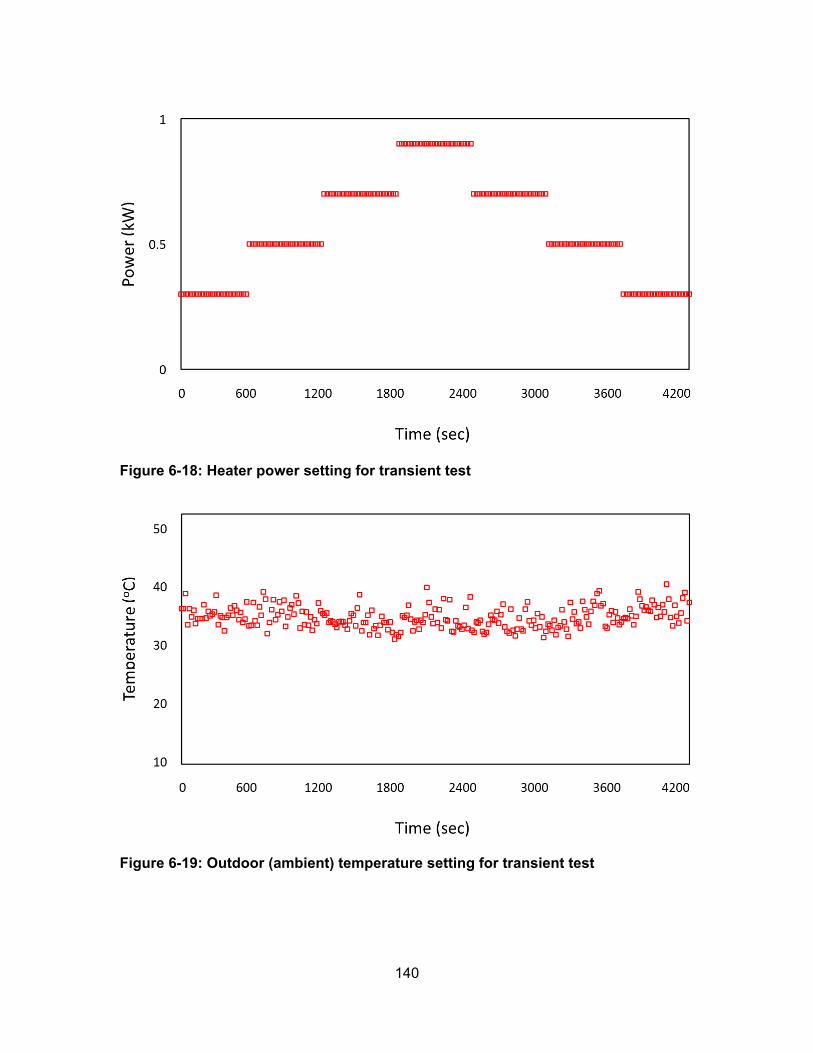
140
Figure 6-18: Heater power setting for transient test
Figure 6-19: Outdoor (ambient) temperature setting for transient test
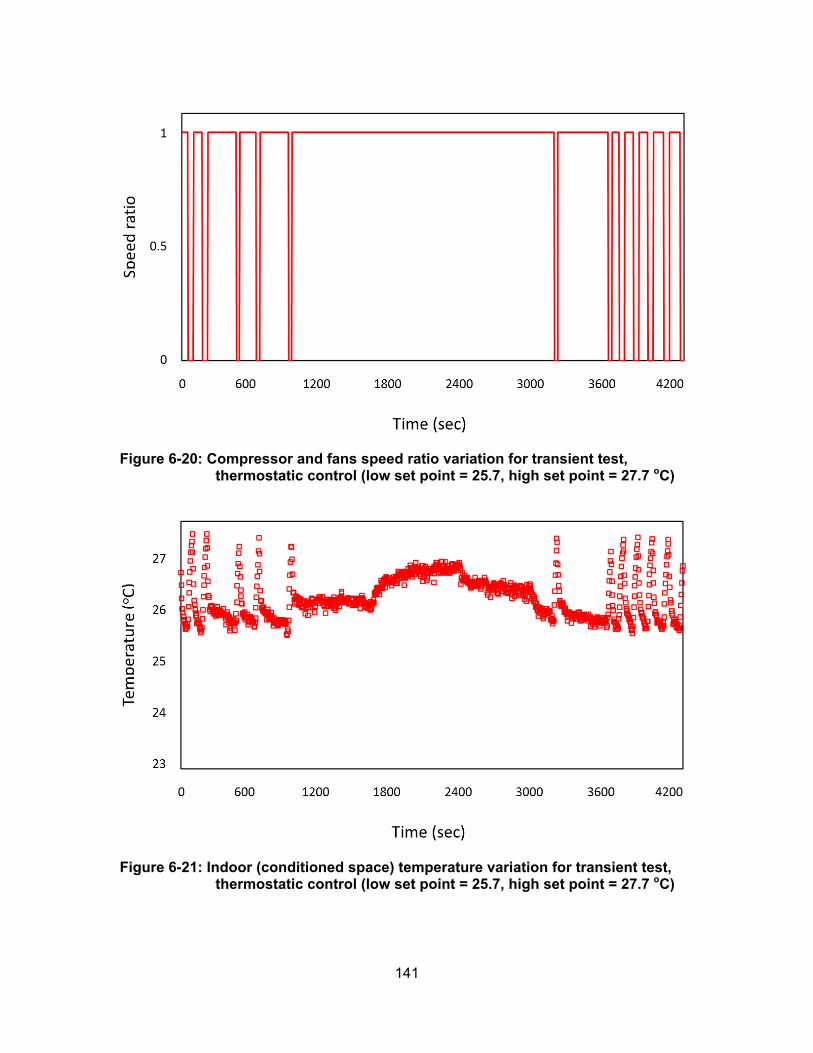
141
Figure 6-20: Compressor and fans speed ratio variation for transient test, thermostatic control (low set point = 25.7, high set point = 27.7 oC)
Figure 6-21: Indoor (conditioned space) temperature variation for transient test, thermostatic control (low set point = 25.7, high set point = 27.7 oC)
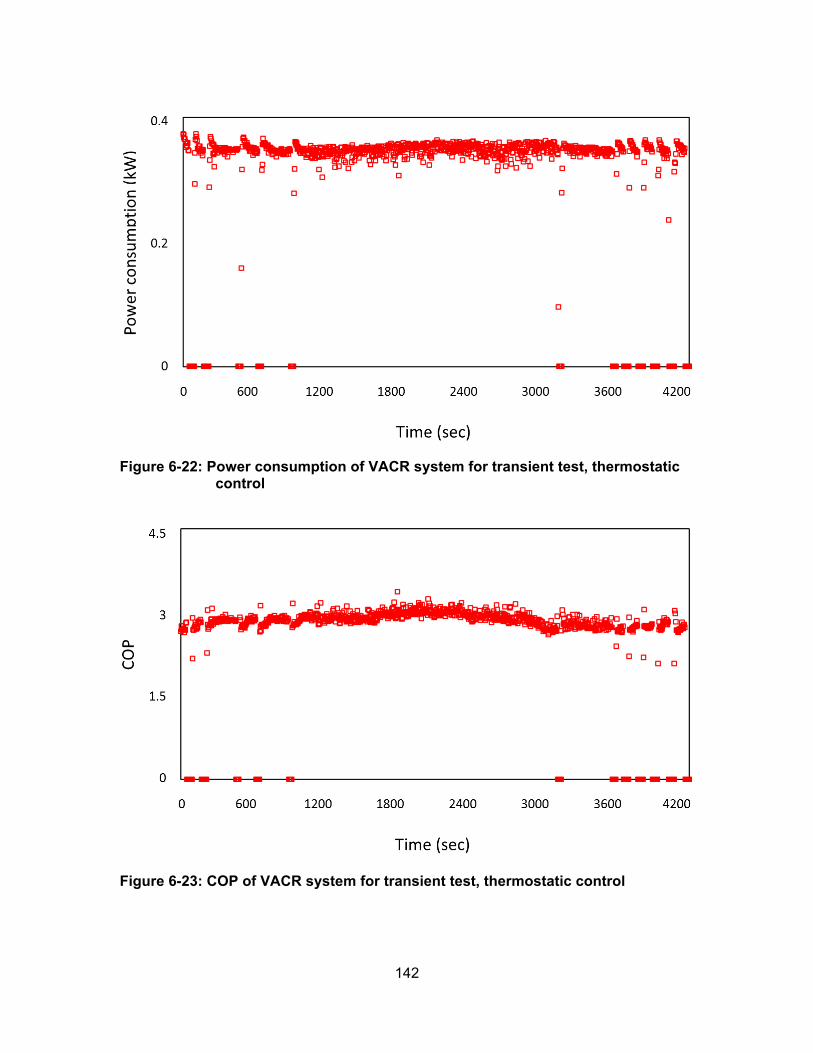
142
Figure 6-22: Power consumption of VACR system for transient test, thermostatic control
Figure 6-23: COP of VACR system for transient test, thermostatic control
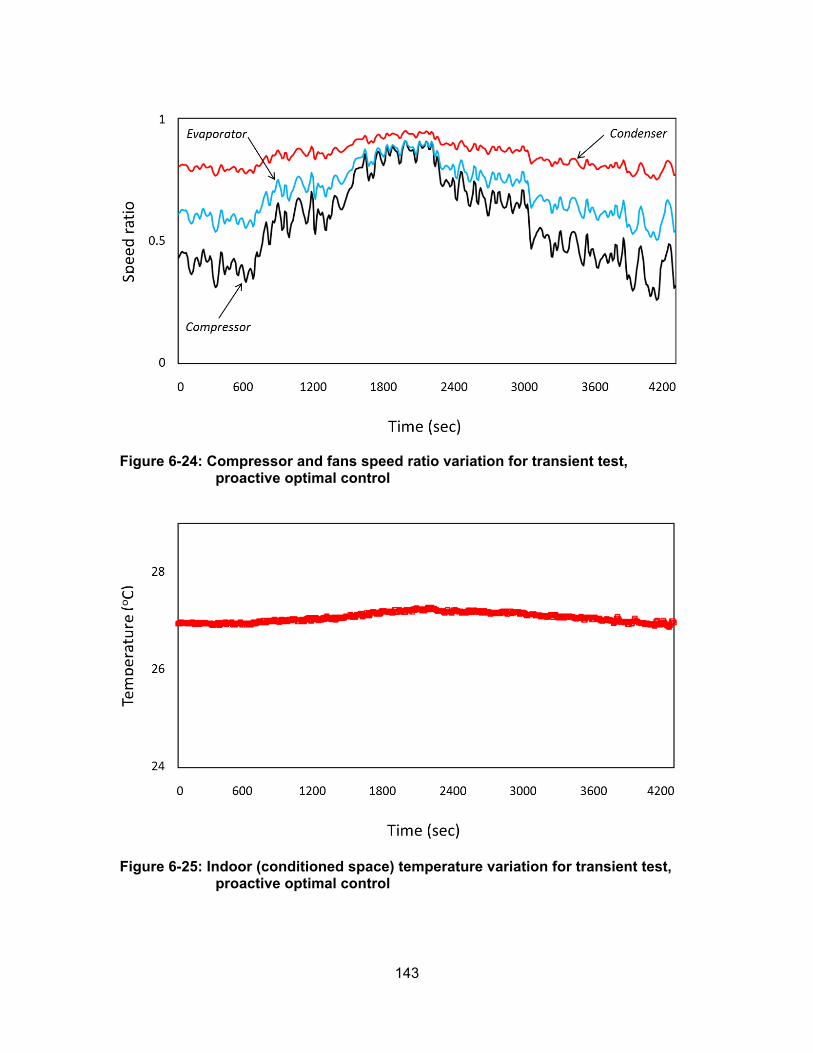
143
Figure 6-24: Compressor and fans speed ratio variation for transient test, proactive optimal control
Figure 6-25: Indoor (conditioned space) temperature variation for transient test, proactive optimal control
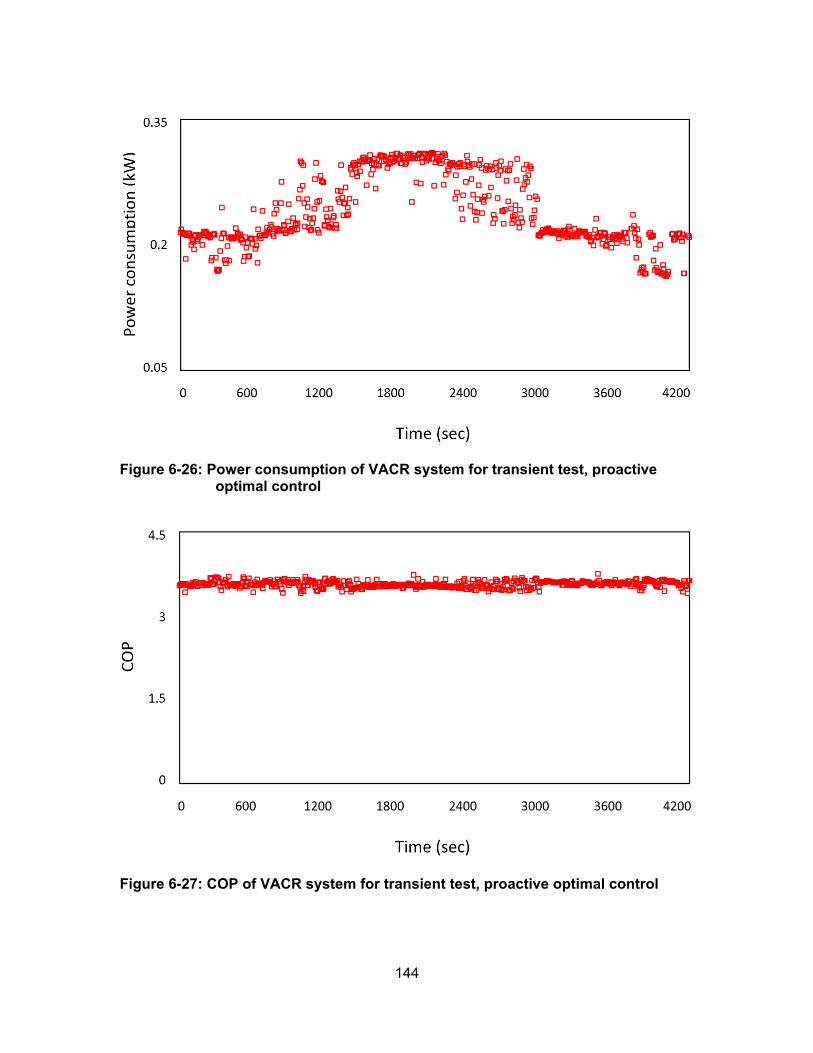
144
Figure 6-26: Power consumption of VACR system for transient test, proactive optimal control
Figure 6-27: COP of VACR system for transient test, proactive optimal control
145
6.4. Conclusion
In this chapter, the optimization models from previous chapter were integrated
with an existing validated cooling demand simulator and a proactive, optimization-based,
model predictive controller was developed. A LabVIEW interface was designed to collect
all required data for the cooling demand simulator and execute a “.dll” version of it. A
MATLAB code was developed to find the global maximum COP based on genetic
algorithm, which was coupled with the LabVIEW interface later on. At each time step, the
LabVIEW interface executed the cooling demand simulator and wrote the cooling
demand and air temperatures into a “.txt” file. The MATLAB code read these numbers
from the file, executed the GA, found the optimum speed of compressor and fans, and
wrote them into another “.txt” file. The LabVIEW interface then read the speeds from this
file and commanded the compressor and fans accordingly. As such, the performance of
VACR system was proactively and optimally controlled based on model predictions. The
functionality of developed controller was tested under different steady state and transient
conditions that showed a consistent and reliable operation. The performance
characteristics of the built VACR system equipped with the proactive and optimal
controller was tested under different operating conditions. In addition, a thermostatic-
based controller as the most commonly used controller for A/C-R systems was
developed to evaluate the COP enhancement of proactive and optimal controller. The
steady state and transient tests were performed and comparisons showed significant
COP enhancement for proactive and optimal controller in comparison with the
thermostatic controller. The proactive and optimal controller could eliminate the
inefficient on-off cycling of the system’s components and keep the conditioned space
temperature nearly constant under steady or transient working conditions. The results
showed up to 187% COP enhancement of the developed proactively and optimally
controlled VACR system (equipped with high efficiency and variable capacity
components) in comparison with the original thermostatically controlled constant
capacity VACR system received from the industrial partner of the project. Up to 24% of
the COP enhancement was achieved from the developed proactive and optimal
controller. The developed concept and platform can be expanded to any VACR or even

146
stationary A/C-R application to significantly reduce the global energy consumption and
environmental impacts.
147
Chapter 7. Summary and Future Works
7.1. Summary of Thesis
In this thesis, a lab-scale proof-of-concept demonstration of high efficiency
vehicle air conditioning and refrigeration (VACR) system is developed. The developed
high efficiency system is scalable and can be expanded to all transportation and
stationary applications. Due to tremendous global energy consumption and
environmental impacts of air conditioning and refrigeration (A/C-R) systems, any
improvement of these systems’ performance significantly contributes to green and
sustainable development and environmental protection. The work is initiated as
collaboration with two local companies: Cool-It Group, and Saputo Inc., with main focus
on service vehicles; however, the developed concept and platform is expandable to any
size and application.
An in-lab testbed is built in Laboratory for Alternative Energy Conversion (LAEC)
for performance investigation of VACR systems under different operating conditions. The
testbed is first built using the components of a VACR system received from one of the
industrial partners. A number of measuring equipment, an environmental chamber, and
power supplies are utilized in the testbed. A LabVIEW interface is developed for data
collection that is featured with compressor and fans speed control later. The
performance of VACR system is comprehensively investigated using the test results.
The testbed is later upgraded using high efficiency heat exchangers and variable speed
compressor and fans.
148
In addition to the in-lab experimental study, real-time field data is acquired from a
stationary A/C-R system used in commercial refrigeration and VACR systems used in
trailers of food transportation. The real-time thermal and performance characteristics of
these systems are investigated under different duty cycles. The potential energy saving
and GHG reduction is estimated.
Mathematical models are developed for thermal and performance simulation of
VACR systems under steady state and transient operating conditions. The models are
validated using the experimental and field data and used for performance investigations.
The validated results are utilized for development of performance optimization model.
A high efficiency VACR system is built using variable speed compressor and fans
and high efficiency heat exchangers as a platform for proof-of-concept demonstration.
Two metamodels are developed, validated, and used for optimization of COP under
realistic operating conditions. An optimization solver is coded in MATLAB and integrated
with the LabVIEW interface to form an optimal model predictive controller (MPC) for the
built VACR system. A feature of “proactive” response is added to the controller using a
validated existing cooling demand simulator. The proactive and optimal controller is then
tested under different steady state and transient operating conditions that show
significant COP enhancements. The developed proof-of-concept demonstration is
scalable and expandable to any stationary and mobile air conditioning and refrigeration
system. The contributions resulted from this study are listed below:
o Establish the duty cycle and investigate the thermal and performance
characteristics of a pilot commercial A/C-R system, “SEMI-THERM 32
Conference, San Jose, 2016”.
o Establish the duty cycle and investigate the thermal and performance
characteristics of VACR systems theoretically and experimentally, “Submitted to
International Journal of Refrigeration, under review”.
o Develop a new steady state model and study the VACR systems’ thermal and
performance behaviour under steady state conditions. Validate the model using
the collected data in the lab and on-board testing, “Published in Journal of
Energy Conversion and Management, Vol. 98, 2015, pp. 173–183”.
149
o Develop and validate quasi-steady state and transient models for VACR
systems, “Submitted to ASME Journal of Thermal Science and Engineering
Applications, under review”.
o Build a high efficiency, variable capacity VACR system by employing high
efficiency heat exchangers and variable speed compressor and fans, “Published
in International Journal of Heat and Mass Transfer, Vol. 77, 2014, pp. 301-310”,
“Published in Journal of Energy Conversion and Management, Vol. 103, 2015,
pp. 459-467”, “Published in ASME Journal of Heat Transfer, Vol. 137, 2015,
081401”, “Published in AIAA Journal of Thermophysics and Heat Transfer, Vol.
28, 2014, pp. 687-699”, “Submitted to Journal of Green Energy, under review”.
o Develop optimization models based on steady state and transient thermal
models “In preparation to be submitted to Journal of Applied Energy”.
o Develop a proactive and model predictive controller (MPC) for the VACR system
by integrating the optimization model and an existing cooling demand simulator,
“Published in Journal of Applied Energy, Vol. 138, 2015, pp. 496–504”,
“Published in ASME Journal of Thermal Science and Engineering Applications,
Vol. 7, 2015, 041008”, “Published in ASME Journal of Thermal Science and
Engineering Applications, Vol. 7, 2015, 041012”, “Published in International
Journal of Refrigeration, Vol. 57, 2015, pp. 229–238”.
o Develop a proof-of-concept demonstration of a proactively and optimally
controlled high efficiency VACR system that can be integrated in the service
transportation industry, “Published in Journal of Automobile Engineering 19,
2016, 10.1177/0954407016636978”, “In preparation to be submitted to Journal of
Applied Energy”.
7.2. Future works
The following research directions can be considered as the continuation of this
study:
o Implement the developed proactive, optimal, and model predictive concept on
engine-driven VACR systems of trailers and other service vehicles and
150
investigate the real-time performance improvement in such applications. Reduce
the computational costs of model predictive controller by simplifying the models
(e.g. find the dominant terms of optimization model and drop the insignificant
terms).
o Study the effects of using different types of refrigerant on the thermal and
performance characteristics of the VACR systems.
o Develop similar concept and platform for cascade refrigeration used in
commercial systems.
o Extend the developed concept to air conditioning and refrigeration systems in
buildings and integrate it with building energy management systems to achieve
the highest overall energy efficiency.
o Equip the developed controller with additional features to enhance its
comprehensiveness; for instance, defrost module can be added to the controller
to avoid evaporator coil freeze in low temperature applications.
o Develop a similar concept and platform for thermally-driven air conditioning and
refrigeration systems or even heating systems in buildings and industries.
151
References
[1] Wu X., Hu S., and Mo S., 2013, “Carbon footprint model for evaluating the global warming impact of food transport refrigeration systems,” J. Clean. Prod., 54, pp. 115–124.
[2] WMO, and UNEP, 2013, Report on climate change 2013; the physical science basis.
[3] International Energy Agency, 2013, Report on CO2 emissions from fuel combustion.
[4] Haass R., Dittmer P., Veigt M., and Lütjen M., 2015, “Reducing food losses and carbon emission by using autonomous control – A simulation study of the intelligent container,” Int. J. Prod. Econ., 164, pp. 400–408.
[5] Fitzgerald W. B., Howitt O. J. a., Smith I. J., and Hume A., 2011, “Energy use of integral refrigerated containers in maritime transportation,” Energy Policy, 39(4), pp. 1885–1896.
[6] Jul M., 1985, “Refrigeration and world food requirements,” Int. J. Refrig., 8, pp. 6–9.
[7] UNEP, 2010, Report on the refrigeration, air conditioning and heat pumps.
[8] 2014, U.S. Energy Information Administration, Annual energy outlook 2014 with projections to 2040.
[9] Li J., and Xu S., 2013, “The performance of absorption–compression hybrid refrigeration driven by waste heat and power from coach engine,” Appl. Therm. Eng., 61(2), pp. 747–755.
[10] Johnson V. H., 2002, “Fuel used for vehicles air conditioning: a state by state thermal comfort approach,” SAE Paper 2002-01-1957.
152
[11] Khayyam H., Nahavandi S., Hu E., Kouzani A., Chonka A., Abawajy J., Marano V., and Davis S., 2011, “Intelligent energy management control of vehicle air conditioning via look-ahead system,” Appl. Therm. Eng., 31(16), pp. 3147–3160.
[12] Lambert M. A., and Jones B. J., 2006, “Automotive adsorption air conditioner powered by exhaust heat. Part 1: conceptual and embodiment design,” Automob. Eng., 220, pp. 959–972.
[13] Bejan A., 2006, Advanced Engineering Thermodynamics, John Wiley & Sons.
[14] Cengel Y., and Boles M., 2014, Thermodynamics: An Engineering Approach, McGraw-Hill.
[15] Park K.-J., and Jung D., 2007, “Thermodynamic performance of HCFC22 alternative refrigerants for residential air-conditioning applications,” Energy Build., 39(6), pp. 675–680.
[16] Wang S., Gu J., Dickson T., Dexter J., and McGregor I., 2005, “Vapor quality and performance of an automotive air conditioning system,” Exp. Therm. Fluid Sci., 30(1), pp. 59–66.
[17] Macagnan M. H., Copetti J. B., Souza R. B., Reichert R. K., and Amaro M., 2013, “Analysis of the influence of refrigerant charge and compressor duty cycle in an automotive air conditioning system,” 22nd International Congress of Mechanical Engineering (COBEM 2013), pp. 6151–6161.
[18] Alklaibi a. M., 2008, “Evaluating the possible configurations of incorporating the loop heat pipe into the air-conditioning systems,” Int. J. Refrig., 31(5), pp. 807–815.
[19] Tassou S. a., De-Lille G., and Ge Y. T., 2009, “Food transport refrigeration – Approaches to reduce energy consumption and environmental impacts of road transport,” Appl. Therm. Eng., 29(8-9), pp. 1467–1477.
[20] Ahmed M., Meade O., and Medina M. a., 2010, “Reducing heat transfer across the insulated walls of refrigerated truck trailers by the application of phase change materials,” Energy Convers. Manag., 51(3), pp. 383–392.
[21] Abban S., 2013, “Microbial behaviour and cross contamination between cargoes in containerized transportation of food,” PhD Thesis, University of Copenhagen.
[22] Hill H., 2008, Report on food miles : background and marketing.
153
[23] James S. J., James C., and Evans J. A., 2006, “Modelling of food transportation systems – a review,” Int. J. Refrig., 29(6), pp. 947–957.
[24] Afram A., and Janabi-Sharifi F., 2014, “Review of modeling methods for HVAC systems,” Appl. Therm. Eng., 67(1-2), pp. 507–519.
[25] Anand S., Gupta a., and Tyagi S. K., 2013, “Simulation studies of refrigeration cycles: A review,” Renew. Sustain. Energy Rev., 17, pp. 260–277.
[26] Ding G., 2007, “Recent developments in simulation techniques for vapour-compression refrigeration systems,” Int. J. Refrig., 30(7), pp. 1119–1133.
[27] Hermes C. J. L., Melo C., Knabben F. T., and Gonçalves J. M., 2009, “Prediction of the energy consumption of household refrigerators and freezers via steady-state simulation,” Appl. Energy, 86(7-8), pp. 1311–1319.
[28] Boeng J., and Melo C., 2014, “Mapping the energy consumption of household refrigerators by varying the refrigerant charge and the expansion restriction,” Int. J. Refrig., 41, pp. 37–44.
[29] Lee G. H., and Yoo J. Y., 2000, “Performance analysis and simulation of automobile air conditioning system,” Int. J. Refrig., 23, pp. 243–254.
[30] Cho H., Lee H., and Park C., 2013, “Performance characteristics of an automobile air conditioning system with internal heat exchanger using refrigerant R1234yf,” Appl. Therm. Eng., 61(2), pp. 563–569.
[31] Joudi K. a., Mohammed A. S. K., and Aljanabi M. K., 2003, “Experimental and computer performance study of an automotive air conditioning system with alternative refrigerants,” Energy Convers. Manag., 44(18), pp. 2959–2976.
[32] Han X. H., Li P., Xu Y. J., Zhang Y. J., Wang Q., and Chen G. M., 2013, “Cycle performances of the mixture HFC-161 + HFC-134a as the substitution of HFC-134a in automotive air conditioning systems,” Int. J. Refrig., 36(3), pp. 913–920.
[33] Yoo S. Y., and Lee D. W., 2009, “Experimental study on performance of automotive air conditioning system using R-152a refrigerant,” Int. J. Automot. Technol., 10(3), pp. 313–320.
[34] Brown J. S., Yana-motta S. F., and Domanski P. A., 2002, “Comparitive analysis of an automotive air conditioning systems operating with CO2 and R134a,” Int. J. Refrig., 25, pp. 19–32.
154
[35] Ratts E. B., and Brown J. S., 2000, “An experimental analysis of cycling in an automotive air conditioning system,” Appl. Therm. Eng., 20(11), pp. 1039–1058.
[36] Jabardo J. M. S., Mamani W. G., and Ianella M. R., 2002, “Modeling and experimental evaluation of an automotive air conditioning system with a variable capacity compressor,” Int. J. Refrig., 25, pp. 1157–1172.
[37] Alkan A., and Hosoz M., 2010, “Comparative performance of an automotive air conditioning system using fixed and variable capacity compressors,” Int. J. Refrig., 33(3), pp. 487–495.
[38] Tian C., and Li X., 2005, “Numerical simulation on performance band of automotive air conditioning system with a variable displacement compressor,” Energy Convers. Manag., 46(17), pp. 2718–2738.
[39] Tian C., and Li X., 2005, “Transient behavior evaluation of an automotive air conditioning system with a variable displacement compressor,” Appl. Therm. Eng., 25(13), pp. 1922–1948.
[40] Al-Rashed A., 2011, “Effect of evaporator temperature on vapor compression refrigeration system,” Alexandria Eng. J., 50(4), pp. 283–290.
[41] Green T., Izadi-Zamanabadi R., Razavi-Far R., and Niemann H., 2014, “Plant-wide dynamic and static optimisation of supermarket refrigeration systems,” Int. J. Refrig., 38, pp. 106–117.
[42] Sahin B., and Kodal A., 2002, “Thermoeconomic optimization of a two stage combined refrigeration system: a finite-time approach,” Int. J. Refrig., 25, pp. 872–877.
[43] Sharafian A., and Bahrami M., 2014, “Assessment of adsorber bed designs in waste-heat driven adsorption cooling systems for vehicle air conditioning and refrigeration,” Renew. Sustain. Energy Rev., 30, pp. 440–451.
[44] Rêgo a. T., Hanriot S. M., Oliveira a. F., Brito P., and Rêgo T. F. U., 2014, “Automotive exhaust gas flow control for an ammonia–water absorption refrigeration system,” Appl. Therm. Eng., 64(1-2), pp. 101–107.
[45] Zheng W., Chen Y., Hua N., Zhong T., and Gong Y., 2014, “Comparative performance of an automotive air conditioning system using micro-channel condensers with and cithout liquid-vapor separation,” Energy Procedia, 61, pp. 1646–1649.
155
[46] Muller C., “New reversible air-conditioning magnetocaloric system, environmentally friendly and highly energy efficient,” SAE Tech. Pap. no. 2009-01-0313.
[47] D G., 2009, “Theoretical analysis of the steam pressure exchange ejector for an automotive air conditioning application,” University of Vermont.
[48] Ünal Ş., and Yilmaz T., 2015, “Thermodynamic analysis of the two-phase ejector air-conditioning system for buses,” Appl. Therm. Eng.
[49] Jolly P. G., Tso C. P., Wong Y. W., and Ng S. M., 2000, “Simulation and measurement on the full-load performance of a refrigeration system in a shipping container,” Int. J. Refrig., 23, pp. 112–126.
[50] Tso C. P., Wong Y. W., Jolly P. G., and Ng S. M., 2001, “A comparison of hot-gas by-pass and suction modulation method for partial load control in refrigerated shipping containers,” Int. J. Refrig., 24, pp. 544–553.
[51] Moureh J., Tapsoba S., Derens E., and Flick D., 2009, “Air velocity characteristics within vented pallets loaded in a refrigerated vehicle with and without air ducts,” Int. J. Refrig., 32(2), pp. 220–234.
[52] Moureh J., and Flick D., 2004, “Airflow pattern and temperature distribution in a typical refrigerated truck configuration loaded with pallets,” Int. J. Refrig., 27(5), pp. 464–474.
[53] Defraeye T., Cronjé P., Verboven P., Linus U., and Nicolai B., 2015, “Exploring ambient loading of citrus fruit into reefer containers for cooling during marine transport using computational fluid dynamics,” Postharvest Biol. Technol., 108, pp. 91–101.
[54] Rodríguez-Bermejo J., Barreiro P., Robla J. I., and Ruiz-García L., 2007, “Thermal study of a transport container,” J. Food Eng., 80(2), pp. 517–527.
[55] Spence S. W. T., John Doran W., and Artt D. W., 2004, “Design, construction and testing of an air-cycle refrigeration system for road transport,” Int. J. Refrig., 27(5), pp. 503–510.
[56] Khayyam H., Kouzani A. Z., Hu E. J., and Nahavandi S., 2011, “Coordinated energy management of vehicle air conditioning system,” Appl. Therm. Eng., 31(5), pp. 750–764.
156
[57] Buzelin L. O. S., Amico S. C., Vargas J. V. C., and Parise J. a. R., 2005, “Experimental development of an intelligent refrigeration system,” Int. J. Refrig., 28(2), pp. 165–175.
[58] Khayyam H., Abawajy J., and Jazar R. N., 2012, “Intelligent energy management control of vehicle air conditioning system coupled with engine,” Appl. Therm. Eng., 48, pp. 211–224.
[59] Thompson R., and Dexter A., 2005, “A fuzzy decision-making approach to temperature control in air-conditioning systems,” Control Eng. Pract., 13(6), pp. 689–698.
[60] Calvino F., La Gennusa M., Rizzo G., and Scaccianoce G., 2004, “The control of indoor thermal comfort conditions: introducing a fuzzy adaptive controller,” Energy Build., 36(2), pp. 97–102.
[61] Durovic Z. M., and Kovadevic B. D., 2004, “Control of heating, ventilation and air conditioning system based on neural network,” 7th Seminar on Neural Network Applications in Electrical Engineering, Ieee, pp. 37–38.
[62] Schalbart P., Leducq D., and Alvarez G., 2014, “Ice-cream storage energy efficiency with model predictive control of a refrigeration system coupled to a PCM tank,” Int. J. Refrig., pp. 1–11.
[63] Hovgaard T. G., Larsen L. F. S., Edlund K., and Jørgensen J. B., 2012, “Model predictive control technologies for efficient and flexible power consumption in refrigeration systems,” Energy, 44(1), pp. 105–116.
[64] Lawrence Ricker N., 2010, “Predictive hybrid control of the supermarket refrigeration benchmark process,” Control Eng. Pract., 18(6), pp. 608–617.
[65] Yeh T.-J., Chen Y.-J., Hwang W.-Y., and Lin J.-L., 2009, “Incorporating fan control into air-conditioning systems to improve energy efficiency and transient response,” Appl. Therm. Eng., 29(10), pp. 1955–1964.
[66] Lin J.-L., and Yeh T.-J., 2007, “Modeling, identification and control of air-conditioning systems,” Int. J. Refrig., 30(2), pp. 209–220.
[67] Lin J.-L., and Yeh T.-J., 2007, “Identification and control of multi-evaporator air-conditioning systems,” Int. J. Refrig., 30(8), pp. 1374–1385.
157
[68] Hovgaard T. G., Larsen L. F. S., Skovrup M. J., and Jørgensen J. B., 2011, “Power consumption in refrigeration systems - modeling for optimization,” International Symposium on Advanced Control of Industrial Processes, pp. 234–239.
[69] Sørensen K. K., Stoustrup J., and Bak T., 2015, “Adaptive MPC for a reefer container,” Control Eng. Pract., 44, pp. 55–64.
[70] Bagheri F., Fayazbakhsh M. A., Cheppudira Thimmaiah P., and Bahrami M., 2015, “Theoretical and experimental investigation into anti-idling A/C system for trucks,” Energy Convers. Manag., 98, pp. 173–183.
[71] Ge Y. T., and Tassou S. A., 2011, “Performance evaluation and optimal design of supermarket refrigeration systems with supermarket model ‘SuperSim’, Part I: Model description and validation,” Int. J. Refrig., 34(2), pp. 527–539.
[72] Sanaye S., and Malekmohammadi H. ., 2004, “Thermal and economical optimization of air conditioning units with vapor compression refrigeration system,” Appl. Therm. Eng., 24(13), pp. 1807–1825.
[73] Shah R. K., and Sekulic D. P., 2003, Fundamentals of heat exchanger design, John Wiley & Sons.
[74] Zhao L., Cai W., Ding X., and Chang W., 2013, “Model-based optimization for vapor compression refrigeration cycle,” Energy, 55, pp. 392–402.
[75] Dupont, 2013, Report on thermodynamic properties of HFC-134a.
[76] Abbasbandy S., 2003, “Improving Newton–Raphson method for nonlinear equations by modified Adomian decomposition method,” Appl. Math. Comput., 145(2-3), pp. 887–893.
[77] Corberan J. M., Finn D. P., Montagud C. M., Murphy F. T., and Edwards K. C., 2011, “A quasi-steady state mathematical model of an integrated ground source heat pump for building space control,” Energy Build., 43(1), pp. 82–92.
[78] Borges B. N., Hermes C. J. L., Gonçalves J. M., and Melo C., 2011, “Transient simulation of household refrigerators: A semi-empirical quasi-steady approach,” Appl. Energy, 88(3), pp. 748–754.
[79] Li B., and Alleyne A. G., 2010, “A dynamic model of a vapor compression cycle with shut-down and start-up operations,” Int. J. Refrig., 33(3), pp. 538–552.
158
[80] Liang N., Shao S., Tian C., and Yan Y., 2010, “Dynamic simulation of variable capacity refrigeration systems under abnormal conditions,” Appl. Therm. Eng., 30(10), pp. 1205–1214.
[81] Liang N., Shao S., Tian C., and Yan Y., 2010, “Dynamic simulation of variable capacity refrigeration systems under abnormal conditions,” Appl. Therm. Eng., 30(10), pp. 1205–1214.
[82] Wang F. Q., Maidment G. G., Missenden J. F., and Tozer R. M., 2007, “A novel special distributed method for dynamic refrigeration system simulation,” Int. J. Refrig., 30(5), pp. 887–903.
[83] Browne M. W., and Bansal P. K., 2002, “Transient simulation of vapour-compression packaged liquid chillers,” Int. J. Refrig., 25, pp. 597–610.
[84] Beatty K., and Katz D., 1948, “Condensation of vapours on the outside of finned tube,” Chemical Engineering Progress.
[85] Koury R. N. N., Machado L., and Ismail K. A. R., 2001, “Numerical simulation of a variable speed refrigeration system,” Int. J. Refrig., 24, pp. 192–200.
[86] Gaspar P. D., Carrilho Gonçalves L. C., and Pitarma R. a., 2011, “Experimental analysis of the thermal entrainment factor of air curtains in vertical open display cabinets for different ambient air conditions,” Appl. Therm. Eng., 31(5), pp. 961–969.
[87] Yang L., and Zhang C.-L., 2010, “Analysis on energy saving potential of integrated supermarket HVAC and refrigeration systems using multiple subcoolers,” Energy Build., 42(2), pp. 251–258.
[88] Pasific Gas and Electric Company, 2013, Supermarket refrigeration; 2013 California building energy efficiency standards.
[89] D. Cowan, J. Gartshore, I. Chaer, C. Francis G. M., 2009, “REAL Zero – reducing refrigerant emissions and leakage - feedback from the IOR Project,” Proc. Inst. Refrig.
[90] Tassou S. a., Ge Y., Hadawey a., and Marriott D., 2011, “Energy consumption and conservation in food retailing,” Appl. Therm. Eng., 31(2-3), pp. 147–156.
159
[91] Kullheim J., 2011, “Field measurement and evaluation of CO2 refrigeration systems for supermarket,” KTH, School of Industrial Engineering and Management.
[92] Carrier Transicold, 2010, Ultra XT/Extra XT unit catalog.
[93] Carrier Transicold, 2013, Vector 8600 MT unit catalog.
[94] Carrier Transicold, 2010, Trailer and rail refrigeration-service parts list.
[95] Carrier Transicold, 2012, Truck regrigeration unit-operation and service.
[96] Zhao L., Cai W.-J., Ding X., and Chang W., 2013, “Decentralized optimization for vapor compression refrigeration cycle,” Appl. Therm. Eng., 51(1-2), pp. 753–763.
[97] Brodd R. J., 2012, Batteries for Sustainability, Springer.
[98] Tahil W., 2010, Report: "How much lithium does a LiIon EV battery really need ?"
[99] Galos J., Sutcliffe M., Cebon D., Piecyk M., and Greening P., 2015, “Reducing the energy consumption of heavy goods vehicles through the application of lightweight trailers: Fleet case studies,” Transp. Res. Part D Transp. Environ., 41, pp. 40–49.
[100] Casadei A., and Broda R., 2008, Report on impact of vehicle weight reduction on fuel economy for various vehicle architectures.
[101] “http://www.inboundlogistics.com/cms/article/smarter-trucking-saves-fuel-over-the-long-haul.”
[102] “http://www.nrcan.gc.ca/energy/efficiency/transportation/commercial-vehicles/reports/7607.”
[103] “http://www.eia.gov/tools/faqs/faq.cfm?id=307&t=11.”
[104] “http://people.exeter.ac.uk/TWDavies/energy_conversion/Calculation%20of%20CO2%20emissions%20from%20fuels.htm.”
[105] Arora J., 2004, Introduction to Optimum Design, Elsevier Press.
160
[106] Green T., Izadi-zamanabadi R., and Razavi-far R., 2014, “Plant-wide dynamic and static optimisation of supermarket refrigeration systems,” Int. J. Refrig., 38, pp. 106–117.
[107] Wang B., Shi W., Han L., and Li X., 2009, “Optimization of refrigeration system with gas-injected scroll compressor,” Int. J. Refrig., 32(7), pp. 1544–1554.
[108] Yen R. H., Huang B. J., Chen C. Y., Shiu T. Y., Cheng C. W., Chen S. S., and Shestopalov K., 2013, “Performance optimization for a variable throat ejector in a solar refrigeration system,” Int. J. Refrig., 36, pp. 1512–1520.
[109] Turkakar Goker, and Tuba O.-O., 2015, “Entropy generation analysis and dimensional optimization of an evaporator for use in a microscale refrigeration cycle,” Int. J. Refrig., 56, pp. 140–153.
[110] Ge Y. T., Tassou S. a., Santosa I. D., and Tsamos K., 2015, “Design optimisation of CO2 gas cooler/condenser in a refrigeration system,” Appl. Energy, 160, pp. 973–981.
[111] Selbas R., Kizilkan O., and Sencan a, 2006, “Thermoeconomic optimization of subcooled and superheated vapor compression refrigeration cycle,” Energy, 31(12), pp. 2108–2128.
[112] Zhao L., Cai W., Ding X., and Chang W., 2013, “Model-based optimization for vapor compression refrigeration cycle,” Energy, 55, pp. 392–402.
[113] Xu Y.-C., and Chen Q., 2013, “A theoretical global optimization method for vapor-compression refrigeration systems based on entransy theory,” Energy, 60, pp. 464–473.
[114] Aminyavari M., Najafi B., Shirazi A., and Rinaldi F., 2014, “Exergetic , economic and environmental ( 3E ) analyses , and multi- objective optimization of a CO 2 / NH 3 cascade refrigeration system,” Appl. Therm. Eng., 65, pp. 42–50.
[115] Hao J.-H., Chen Q., and Xu Y.-C., 2014, “A global optimization method for regenerative air refrigeration systems,” Appl. Therm. Eng., 65(1-2), pp. 255–261.
[116] Ghorbani B., Ma M., and Shirmohammadi R., 2014, “Optimization of operation parameters of refrigeration cycle using particle swarm and NLP techniques,” Nat. Gas Sci. Eng., 21, pp. 779–790.

161
[117] Wang G., and Shan S., 2007, “Review of metamodeling techniques in support of engineering design optimization,” J. Mech. Des., 129, pp. 370–380.
[118] Simpson T. W., Peplinski J. D., Koch P. N., and Allen J. K., 1997, “On the use of statistics in design and the implications for deterministic computer experiments,” ASME Design Engineering, pp. 1–14.
[119] Haji Hajikolaei K., and Wang G., 2014, “High dimensional model representation with principal component analysis,” ASME J. Mech. Des., 136.
[120] Fayazbakhsh M. A., 2015, “Intelligent Calculation of Thermal Loads in Mobile and Stationary Heating, Ventilation, Air Conditioning, and Refrigeration Systems,” PhD Thesis, Simon Fraser University.
[121] ASHRAE, 2009, ASHRAE Handbook-Fundamentals.