Chapter One: A Computer and Communications Network Performance Analysis Primer
Upload
rwth-aachenCategory
view
1download
0
arX
iv:1
103.
1977
v1 [
cs.D
L]
10
Mar
201
1
SNAM manuscript No.(will be inserted by the editor)
Development of Computer Science Disciplines - A
Social Network Analysis Approach
Manh Cuong Pham · Ralf Klamma ·
Matthias Jarke
the date of receipt and acceptance should be inserted later
Abstract In contrast to many other scientific disciplines, computer science con-siders conference publications. Conferences have the advantage of providing fastpublication of papers and of bringing researchers together to present and discussthe paper with peers. Previous work on knowledge mapping focused on the mapof all sciences or a particular domain based on ISI published JCR (Journal Ci-tation Report). Although this data covers most of important journals, it lackscomputer science conference and workshop proceedings. That results in an im-precise and incomplete analysis of the computer science knowledge. This paperpresents an analysis on the computer science knowledge network constructed fromall types of publications, aiming at providing a complete view of computer sci-ence research. Based on the combination of two important digital libraries (DBLPand CiteSeerX), we study the knowledge network created at journal/conferencelevel using citation linkage, to identify the development of sub-disciplines. Weinvestigate the collaborative and citation behavior of journals/conferences by an-alyzing the properties of their co-authorship and citation subgraphs. The paperdraws several important conclusions. First, conferences constitute social structuresthat shape the computer science knowledge. Second, computer science is becomingmore interdisciplinary. Third, experts are the key success factor for sustainabilityof journals/conferences.
Manh Cuong PhamInformation Systems and Database TechnologyRWTH Aachen University, AachenAhornstr. 55, D-52056, Aachen, GermanyE-mail: [email protected]
Ralf KlammaInformation Systems & Database TechnologyRWTH Aachen University, AachenAhornstr. 55, D-52056, Aachen, GermanyE-mail: [email protected]
Matthias JarkeInformation Systems & Database TechnologyRWTH Aachen University, AachenAhornstr. 55, D-52056, Aachen, GermanyE-mail: [email protected]

1 Introduction
Recent studies on knowledge mapping in scientometrics are concerned with build-ing, visualizing and qualitatively analyzing the knowledge networks of sciences[5,4,26,34]. Similar to the geographical map, the knowledge network of sciences,or the map of sciences is used to provide us an insight into the structure of sci-ence. It can be used to visually identify major areas of science, their similarityand interconnectedness. Methods developed in bibliometrics and scientometricssuch as citation analysis, content analysis and recently proposed method based onclickstream data [2] are commonly used in this domain.
Computer science is a fast-changing research field. Unlike other disciplineswhere academic standard of publishing is to publish in journals, in computer sci-ence we consider conference publication. Previous work on knowledge mappingtypically focused on single disciplines [44,10,30,4] or on the whole science [5,21,2] based on the analysis of massive citation data such as Journal Citation Report(JCR), Science Citation Index (SCI), Science Citation Index Expanded (SCIE)and Social Science Citation Index (SSCI), published by Thompson Scientific (TS,formally ISI). Those datasets cover most of important journals of science, butthey do not contain computer science conference and workshop proceedings. Thatmakes any attempt to map computer science knowledge either imprecise or limitedto small fields.
With the recent availability of large-scale citation index from digital librariesin computer science such as ACM Portal1, IEEE Xplore2, DBLP3 and CiteSeerX4,it is possible to study the relationship between publication venues and provide amore precise and complete view of today’s computer science research landscapeat both local and global scale. In this paper (some of results are published inan earlier conference paper [39]), we are concerned with studying the structureof knowledge network and the publication culture in computer science. Using thecombination of two large important digital libraries in computer science, DBLPand CiteSeerX, we build a so-called knowledge map of the computer science andprovide a comprehensive visualization which allows us to explore its macro struc-ture and its development over time. To get an insight into the collaborative andcitation behavior in computer science, we investigate the graphical features of thecitation and collaboration subgraphs of journals/conferences. One of our mainfindings is that conferences constitute social structures that shape the computerscience knowledge. By analyzing the combined knowledge network of journal andconference publications, we are able to identify clusters (or sub-disciplines) andtrace their development, which is not possible by the analysis of journals only.We also find that computer science publications are very heterogeneous and thefield is becoming more interdisciplinary as each sub-disciplines tends to connect tomany other sub-disciplines. Finally, there is a connection between the local struc-ture of the citation and collaboration subgraphs of journals/conferences and theirimpact. On the one hand, high impact journals/conferences successfully build thecore topic and attract the contributions from research community. On the other
1 http://portal.acm.org/portal.cfm2 http://ieeexplore.ieee.org/Xplore/dynhome.jsp3 http://www.informatik.uni-trier.de/~ley/db/4 http://citeseerx.ist.psu.edu/
hand, experts are the key success factor for maintaining and cultivating the com-munity of journals/conferences (hereafter called venues).
The paper is organized as follows. In Section 2, we briefly survey the relatedwork. In Section 3, we discuss about the role of conferences in computer science. InSection 4, we describe the data set used in our study. In Section 5, the creation ofnetworks used in our study is presented. In Section 6, we discus about the networkvisualization. In Section 7 we discuss about the development of sub-disciplines incomputer science. In Section 8, we present the venues ranking using SNA metrics.In section 9, we present our analysis on the properties of venue’s subgraph andtheir relation to the impact of venues. The paper finishes with some conclusionsand our directions for future research.
2 Related Work
Social network analysis and visual analytics have been applied to represent theknowledge [47], to detect the communities and hierarchical structures in dynamicnetworks [14,29]. In scientometrics, the knowledge maps have been generated fromcitation data to visualize the relationship between scholarly publications or disci-plines. Early work on mapping journals focused on single disciplines. Morris [33]explored the interdisciplinary nature of medical informatics and its internal struc-ture using inter-citation and co-citation analysis. Combination of the SCI and SSCIdata was used in this study. McCain [30] performed the co-citation analysis forjournals in neural network research. Cluster analysis, principal component analysisand multidimensional scaling (MDS) maps were used to identify the main researchareas. Regarding to computer science, Ding [10] studied the relationship betweenjournals in information retrieval area using the same techniques. Based on theScieSearch database, Tsay [44] mapped semiconductor literature using co-citationanalysis. The datasets used in these studies were rather small, ranging from tensto several hundred journals. In more recent work, Boyack [4] mapped the structureand evolution of chemistry research over a 30-year time frame. Based on a generalmap generated from the combined SCIE and SSCI from 2002, he assigned journalsto clusters using inter-citation counts. Journals were assigned to the chemistry do-mains using JCR categories. Then, the maps of chemistry at different time periodsand at domain level were generated. Maps show many changes that have takenplace over the 30 years development of chemistry research.
Recently, several maps based on large-scale digital libraries have been pub-lished. ISI has published journal citation reports for many years. This datasetallows for generating the map of all of sciences. Leydesdorff has used the 2001JCR dataset to map 5,748 journals from the SCI [26] and 1,682 journals from theSSCI [27] in two separate studies. In those studies, Leydesdorff used Pearson corre-lation on citation counts as the edge weight and progressive lowering threshold tofind the clusters. These clusters can be considered as disciplines or sub-disciplines.Moya-Anegon et al. [34] created category maps using documents with a Spanishaddress and ISI categories. The high level map shows the relative positions, sizesand relationships between 25 broad categories of science in Spain. Boyack [5] com-bined SCIE and SSCI from 2000 and generated maps of 7,121 journals. The mainobjective of this study was to evaluate the accuracy of maps using eight differentinter-citation and co-citation similarity measures.
There are several studies which applied SNA measures to derive useful infor-mation from knowledge maps. Leydesdorff [28] used the combination of SCIE andSSCI, and generated centrality measures (betweenness, closeness and degree cen-trality). These measures were analyzed in both global (the entire digital library)and local (small set of journals where citing is above a certain threshold) environ-ments. Bollen et al. [2] generated the maps of science based on clickstream datalogged by six web portals (Thomson Scientific, Elsevier, JSTOR, Ingenta, Uni-versity of Texas and California State University). They validated the structure ofthe maps by two SNA measures: betweenness centrality [46] and PageRank [6]. Inanother study, Bollen [3] performed a principal component analysis on 39 scientificimpact factors, including four SNA factors (degree centrality, closeness centrality,betweenness centrality and PageRank).
Regarding to the research on the performance of individuals and their localsocial network structures, Shi et al. [41] studied the citation projection graphs ofpublications in different disciplines, including natural science, social science andcomputer science, to understand their citation behaviors. Using several social net-work analysis measures, they identified the idiosyncratic citers, within-communityciters and brokerage citers. They found that there are significant differences inhow high, low and medium impact papers position their citation. There are alsoother studies on the optimal network structure for the individuals’ performance[23], the benefits of the communities in fostering trust, facilitating the enforcementof social norm and common culture [9], and the benefits of structural holes andweak ties in accessing new information and ideas [15].
3 The Role of Conferences in Computer Science Research
Computer science history can be traced back from 1936, with the invention of Tur-ing machine. Till early 1970s, the main publication outlet is journals. The Jour-nal of Symbolic Logic (born in 1936), IEEE Transactions on Information Theory(1953), Journal of the ACM (1954), Information and Computation (1957) andCommunications of the ACM (CACM) (1959) are probably the oldest journals incomputer science. In late 1960s and early 1970s, some conferences emerged. IFIPCongress (1962), SYMSAC(Symposium on Symbolic and Algebraic Computation)(1966), the ACM Symposium on Operating Systems Principles (SOSP) (1966),Symposium on Operating Systems Principles (SOSP) (1967), International JointConference on Artificial Intelligence (IJCAI) (1969), Architecture of ComputingSystems (ARCS) (1970), International Colloquium on Automata, Languages andProgramming (ICALP) (1972), Symposium on Principles of Programming Lan-guages (POPL) (1973) are some examples of the earliest conference series. Sinceearly 1980s, conference has had a dominant present in computer science. Accord-ing to DBLP digital library, as of 2010 there are 2716 conference series and 774journals.
In 2009 and 2010, a dozen of articles, letters and blog entries discussed aboutthe role of conferences, the quality and impact of conference publications [45,32,11]. In [42], Menczer supports the abolition of conference proceedings altogetherand submissions should instead go to journals, which would receive more and morebetter ones. The impact and quality of conference publications are also questioned,mainly dues to the review process. Every conference has a desire to be “competitive
and reducing the acceptance rate is an easy way. The great papers always areaccepted and the worst papers mostly get rejected, but the problem here is forthe vast majority of papers landing in the middle. That leads to an emphasison safe papers (incremental and technical) versus those that explore new modelsand research directions outside the established core areas of the conferences [11].Nevertheless, recent study by J. Chen and J. Kostan [7] shows that within ACM,papers in highly selective conferences are cited at a rate comparable to or greaterthan ACM transactions and journals. Freyne et al. [12] demonstrates that papersin leading conferences match the impact of papers in mid-ranking journals andsurpass the impact of papers in journals in the bottom half of the ThompsonReuters rankings.
Why conference becomes an important outlet in computer science? In [11], L.Fortnow gave a short history of computer science conferences and the reasons forthat computer science holds conferences. The fundamental reason is that the quickdevelopment of the field requires a rapid review and distribution of results. A com-plete journal publishing decision takes at least one year, comparing to 6 monthsfor publishing in a conference. That delay is unacceptable for such a fast-changingfield. Secondly, conferences bring the community together to disseminate new re-search and results, to network and discuss about the issues. That rarely happensin journals, where the only possible communication is between reviewers, edito-rial board and authors in review process. Lastly, with the tremendous continualgrowth in computer science, there are too many papers to publish and archivaljournals alone can not handle.
Our work is based on the above intuitions. We show that analysis on journalonly can not fully capture the characteristics and development of computer sci-ence research since focusing exclusively on journal papers misses many significantpapers published by conferences. We further show that conferences facilitate thecommunication and build a community between participants.
4 Data Collection
The dataset used in our study is the combination of DBLP and CiteSeerX dig-ital libraries. We choose them because they cover most of sub-disciplines, whileIEEE Xplore and ACM Portal cover only IEEE and ACM journals and conferenceproceedings. We retrieve the publication list of journals/conferences from DBLP.Unfortunately, DBLP does not record citations. Therefore, we use CiteSeerX tofill the citation list of publications in DBLP.
DBLP data was downloaded in July, 2009 which consists of 788,259 author’snames, 1,226,412 publications and 3,490 venues. At the same time, we obtainedCiteSeerX data by first download the OAI (Open Archives Initiative) dataset usingthe OAIHavester API. Since the OAI dataset contains only references betweenpublications which are stored in CiteSeerX (with PDF documents), we continuedto crawl XML documents from CiteSeerX site to obtain full citation list for eachpublication. Overall, we had complete CiteSeerX data with 7,385,652 publications(including publications in reference lists), 22,735,140 references and over 4 millionauthor names.
Naming is a problem that many digital libraries are faced because one authormay have several names (synonyms) or there are several authors with the same
1980 1985 1990 1995 2000 2005 2010
0e+0
01e
+05
2e+0
53e
+05
4e+0
55e
+05
6e+0
5
Year
Num
ber o
f cita
tions
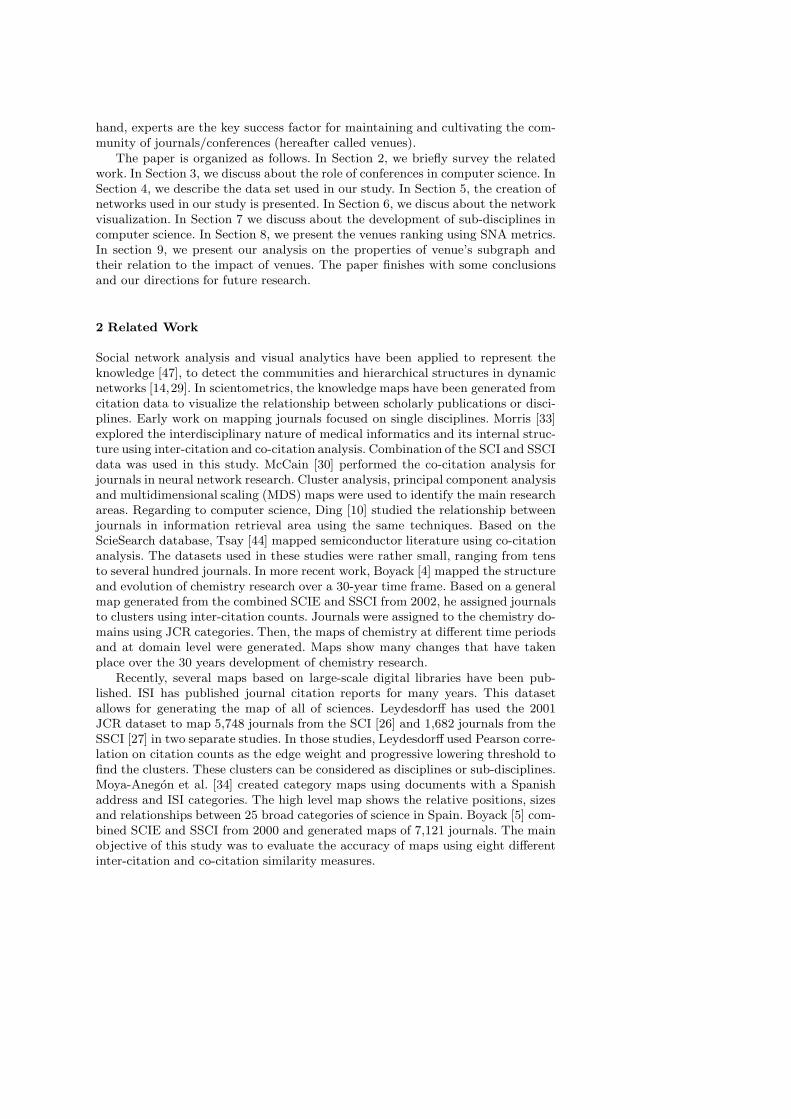
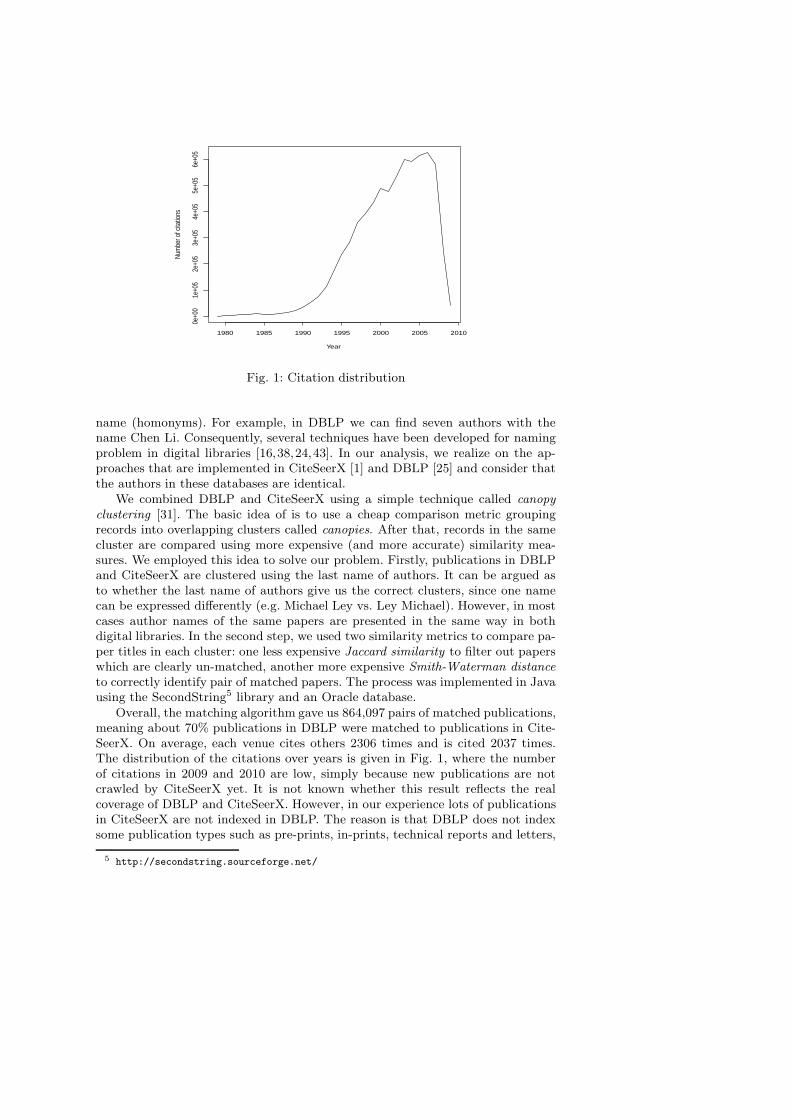
Fig. 1: Citation distribution
name (homonyms). For example, in DBLP we can find seven authors with thename Chen Li. Consequently, several techniques have been developed for namingproblem in digital libraries [16,38,24,43]. In our analysis, we realize on the ap-proaches that are implemented in CiteSeerX [1] and DBLP [25] and consider thatthe authors in these databases are identical.
We combined DBLP and CiteSeerX using a simple technique called canopy
clustering [31]. The basic idea of is to use a cheap comparison metric groupingrecords into overlapping clusters called canopies. After that, records in the samecluster are compared using more expensive (and more accurate) similarity mea-sures. We employed this idea to solve our problem. Firstly, publications in DBLPand CiteSeerX are clustered using the last name of authors. It can be argued asto whether the last name of authors give us the correct clusters, since one namecan be expressed differently (e.g. Michael Ley vs. Ley Michael). However, in mostcases author names of the same papers are presented in the same way in bothdigital libraries. In the second step, we used two similarity metrics to compare pa-per titles in each cluster: one less expensive Jaccard similarity to filter out paperswhich are clearly un-matched, another more expensive Smith-Waterman distance
to correctly identify pair of matched papers. The process was implemented in Javausing the SecondString5 library and an Oracle database.
Overall, the matching algorithm gave us 864,097 pairs of matched publications,meaning about 70% publications in DBLP were matched to publications in Cite-SeerX. On average, each venue cites others 2306 times and is cited 2037 times.The distribution of the citations over years is given in Fig. 1, where the numberof citations in 2009 and 2010 are low, simply because new publications are notcrawled by CiteSeerX yet. It is not known whether this result reflects the realcoverage of DBLP and CiteSeerX. However, in our experience lots of publicationsin CiteSeerX are not indexed in DBLP. The reason is that DBLP does not indexsome publication types such as pre-prints, in-prints, technical reports and letters,
5 http://secondstring.sourceforge.net/
and it covers a limited number of PhD theses, master theses and books. That doesnot affect our analysis since we focuss on journal and conference publications.On the other hand, not all publications in DBLP are indexed by CiteSeerX. If apublication is not online and public, it will not be crawled by CiteSeerX.
5 Networks Creation
We created two networks using the dataset described above: one knowledge network
K based on relatedness of venues and one citation network F based on citationcounts. We processed as following:
Bibliography coupling counts were calculated at the publication level on thewhole digital libraries. These counts were aggregated at the venue level (3,490venues), giving us the bibliography coupling counts between pairs of venues. Of3,490 venues, 303 venues which have no citations were excluded. The result is asymmetric bibliography coupling frequency matrix V with venues as columns androws. Based on this matrix, we created the knowledge network K by normalizingbibliography coupling counts using cosine similarity as suggested in [21], in whichthe full version of cosine index was used. Concretely, cosine similarity between pairof venues is computed as:
Ci,j =−→Bi •
−→Bj
‖−→Bi ‖ × ‖
−→Bj ‖
=
n∑
k=1
Bi,kBj,k
√
√
√
√
n∑
k=1
B2
i,k
√
√
√
√
n∑
k=1
B2
j,k
(1)
where Ci,j is the cosine similarity between venue Vi and Vj , Bi is the vectorrepresentation of the list of citations from venue Vi to all publications, n is numberof publications in the database, and Bi,k is the number of times venue Vi citespublication k. The resulting network consists of 1,930,471 un-directed weightededges. 120 venues whose cosine similarity to others equal to zero were not includedin the network.
The citation network F is formulated by counting the inter-citation betweenvenues. Nodes are venues and there is an edge from venue Vi to venue Vj if Vi citedVj , weighted by number of that citations. The network contains 351,756 directededges, resulting in a network density of 3.5%.
To prevent noise in the visualization and analysis, we consider the most rele-vant connections between venues. For the knowledge network K, we eliminated allconnections which have cosine similarity smaller than 0.1, obtaining the reducednetwork K ′ whose connection cosine similarity is in the range [0.1, 1.0]. Althoughthis threshold is arbitrary, the network K ′ retains 1,739 nodes and 9,637 connec-tions, corresponding to 57% of the nodes and 0.5% of the edges of the originalnetwork. For the citation network F , the same procedure was performed in whichwe only keep the connections whose citation counts were greater than 50. Theremaining network F ′ contains 1,060 venues and 9,964 connections, correspondingto 33% of the nodes and 2.8% of the edges of the original network. A summary ofnetworks properties is given in Table 1.
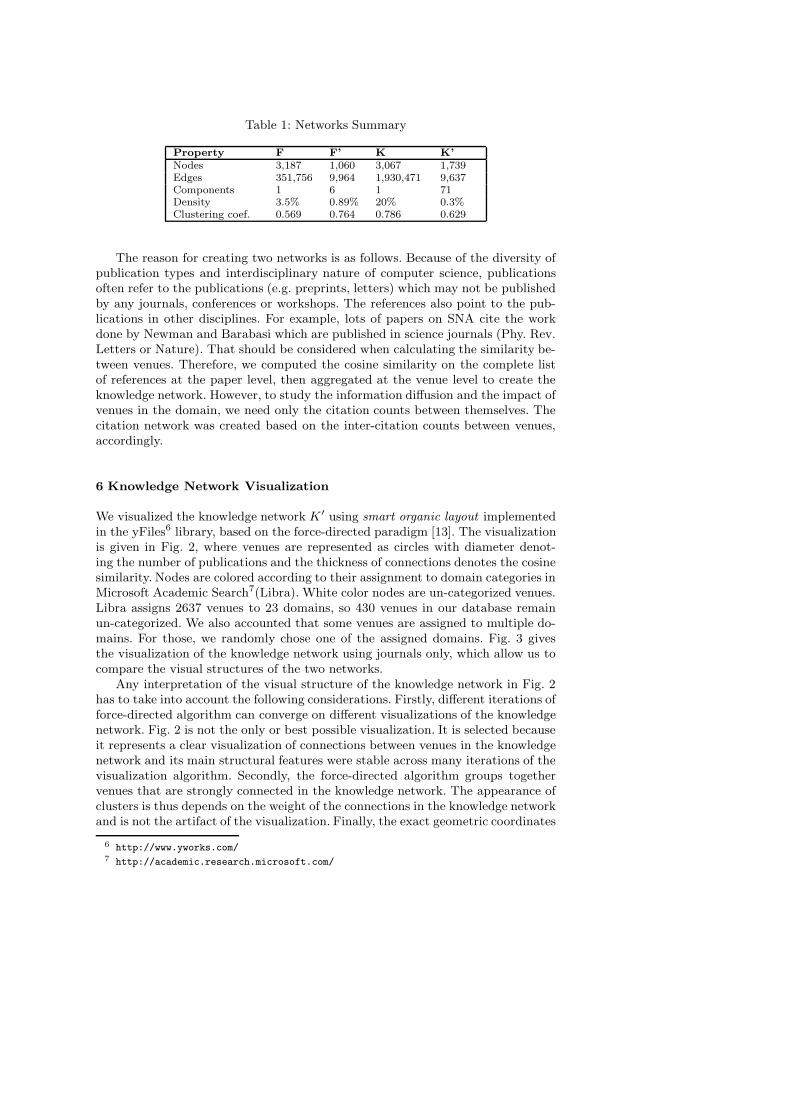
Table 1: Networks Summary
Property F F’ K K’Nodes 3,187 1,060 3,067 1,739Edges 351,756 9,964 1,930,471 9,637Components 1 6 1 71Density 3.5% 0.89% 20% 0.3%Clustering coef. 0.569 0.764 0.786 0.629
The reason for creating two networks is as follows. Because of the diversity ofpublication types and interdisciplinary nature of computer science, publicationsoften refer to the publications (e.g. preprints, letters) which may not be publishedby any journals, conferences or workshops. The references also point to the pub-lications in other disciplines. For example, lots of papers on SNA cite the workdone by Newman and Barabasi which are published in science journals (Phy. Rev.Letters or Nature). That should be considered when calculating the similarity be-tween venues. Therefore, we computed the cosine similarity on the complete listof references at the paper level, then aggregated at the venue level to create theknowledge network. However, to study the information diffusion and the impact ofvenues in the domain, we need only the citation counts between themselves. Thecitation network was created based on the inter-citation counts between venues,accordingly.
6 Knowledge Network Visualization
We visualized the knowledge network K ′ using smart organic layout implementedin the yFiles6 library, based on the force-directed paradigm [13]. The visualizationis given in Fig. 2, where venues are represented as circles with diameter denot-ing the number of publications and the thickness of connections denotes the cosinesimilarity. Nodes are colored according to their assignment to domain categories inMicrosoft Academic Search7(Libra). White color nodes are un-categorized venues.Libra assigns 2637 venues to 23 domains, so 430 venues in our database remainun-categorized. We also accounted that some venues are assigned to multiple do-mains. For those, we randomly chose one of the assigned domains. Fig. 3 givesthe visualization of the knowledge network using journals only, which allow us tocompare the visual structures of the two networks.
Any interpretation of the visual structure of the knowledge network in Fig. 2has to take into account the following considerations. Firstly, different iterations offorce-directed algorithm can converge on different visualizations of the knowledgenetwork. Fig. 2 is not the only or best possible visualization. It is selected becauseit represents a clear visualization of connections between venues in the knowledgenetwork and its main structural features were stable across many iterations of thevisualization algorithm. Secondly, the force-directed algorithm groups togethervenues that are strongly connected in the knowledge network. The appearance ofclusters is thus depends on the weight of the connections in the knowledge networkand is not the artifact of the visualization. Finally, the exact geometric coordinates
6 http://www.yworks.com/7 http://academic.research.microsoft.com/
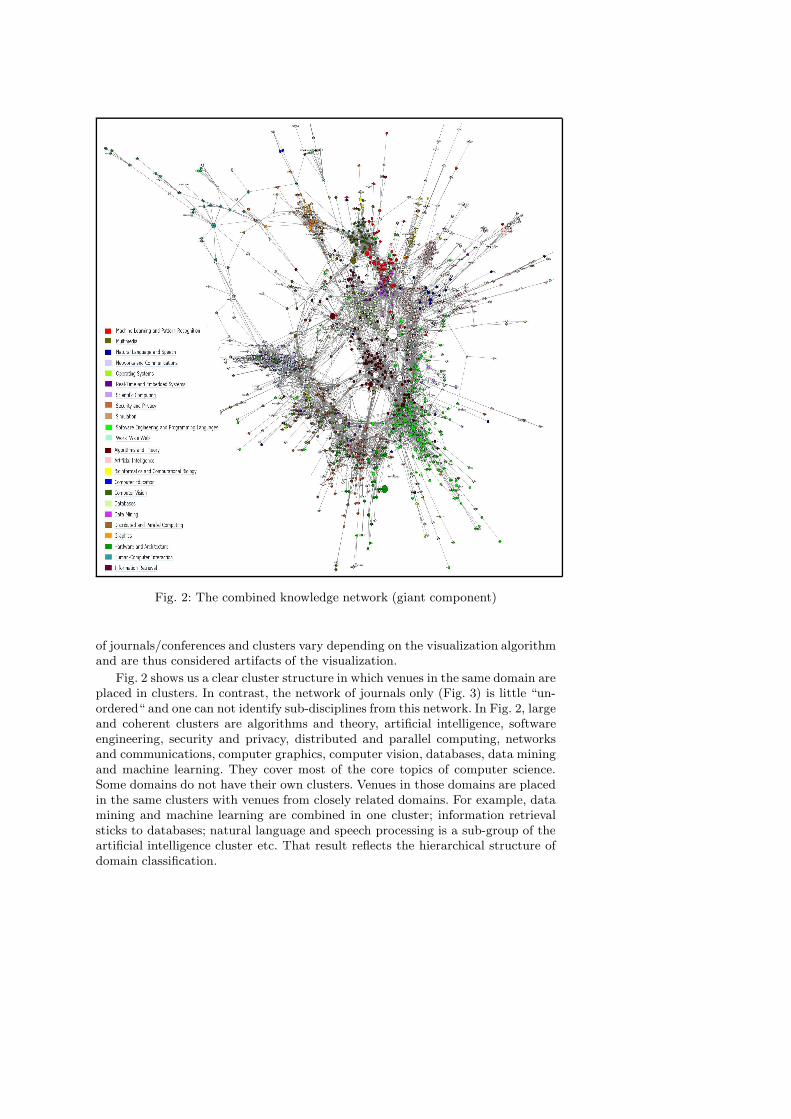
Fig. 2: The combined knowledge network (giant component)
of journals/conferences and clusters vary depending on the visualization algorithmand are thus considered artifacts of the visualization.
Fig. 2 shows us a clear cluster structure in which venues in the same domain areplaced in clusters. In contrast, the network of journals only (Fig. 3) is little “un-ordered“ and one can not identify sub-disciplines from this network. In Fig. 2, largeand coherent clusters are algorithms and theory, artificial intelligence, softwareengineering, security and privacy, distributed and parallel computing, networksand communications, computer graphics, computer vision, databases, data miningand machine learning. They cover most of the core topics of computer science.Some domains do not have their own clusters. Venues in those domains are placedin the same clusters with venues from closely related domains. For example, datamining and machine learning are combined in one cluster; information retrievalsticks to databases; natural language and speech processing is a sub-group of theartificial intelligence cluster etc. That result reflects the hierarchical structure ofdomain classification.
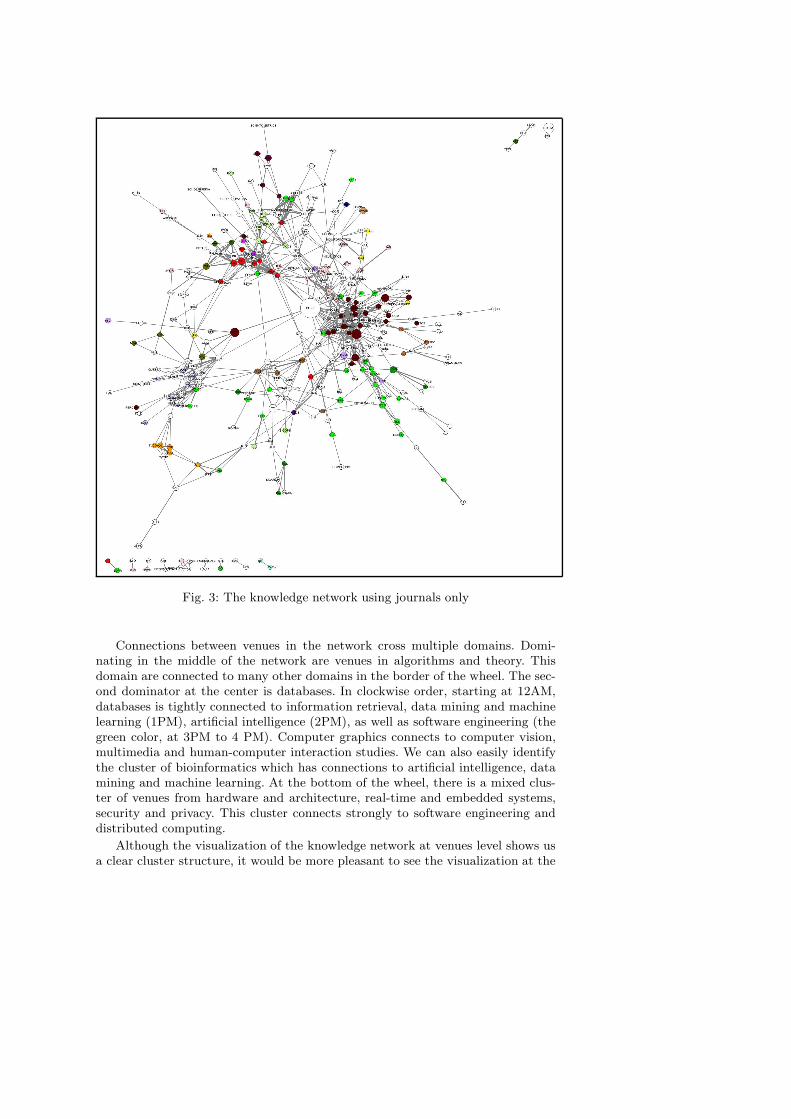
Fig. 3: The knowledge network using journals only
Connections between venues in the network cross multiple domains. Domi-nating in the middle of the network are venues in algorithms and theory. Thisdomain are connected to many other domains in the border of the wheel. The sec-ond dominator at the center is databases. In clockwise order, starting at 12AM,databases is tightly connected to information retrieval, data mining and machinelearning (1PM), artificial intelligence (2PM), as well as software engineering (thegreen color, at 3PM to 4 PM). Computer graphics connects to computer vision,multimedia and human-computer interaction studies. We can also easily identifythe cluster of bioinformatics which has connections to artificial intelligence, datamining and machine learning. At the bottom of the wheel, there is a mixed clus-ter of venues from hardware and architecture, real-time and embedded systems,security and privacy. This cluster connects strongly to software engineering anddistributed computing.
Although the visualization of the knowledge network at venues level shows usa clear cluster structure, it would be more pleasant to see the visualization at the
cluster level. During the network reduction process, lots of venues were excluded.To make the visualization at cluster level more precise, we process as follows:
– The knowledge network K ′ is clustered using a density-based clustering algo-rithm proposed by Newman and Clauset [35,8]. The basic idea of the algorithmis to find a division of the network into clusters within which the network con-nections are dense, but between which they are sparser. To measure the qualityof a division, the modularity Q [36,37] is used. In our case, the algorithm givesus 92 clusters with the modularity Q = 0.771.
– Using the bibliography coupling frequency matrix V where columns and rowsare venues, the counts were aggregated to cluster level for the venues which wereassigned to clusters, thus give us the bibliography coupling counts between un-clustered venues and clusters. That results in a bibliography coupling frequencymatrix V ′ with venues and clusters in both columns and rows. We calculatethe cosine index between 1328 un-clustered venues and 92 clusters, and assignun-clustered venues to clusters with which they have highest cosine values.
– After that, cosine index is re-computed for pairs of clusters in the same wayas we did for venues.
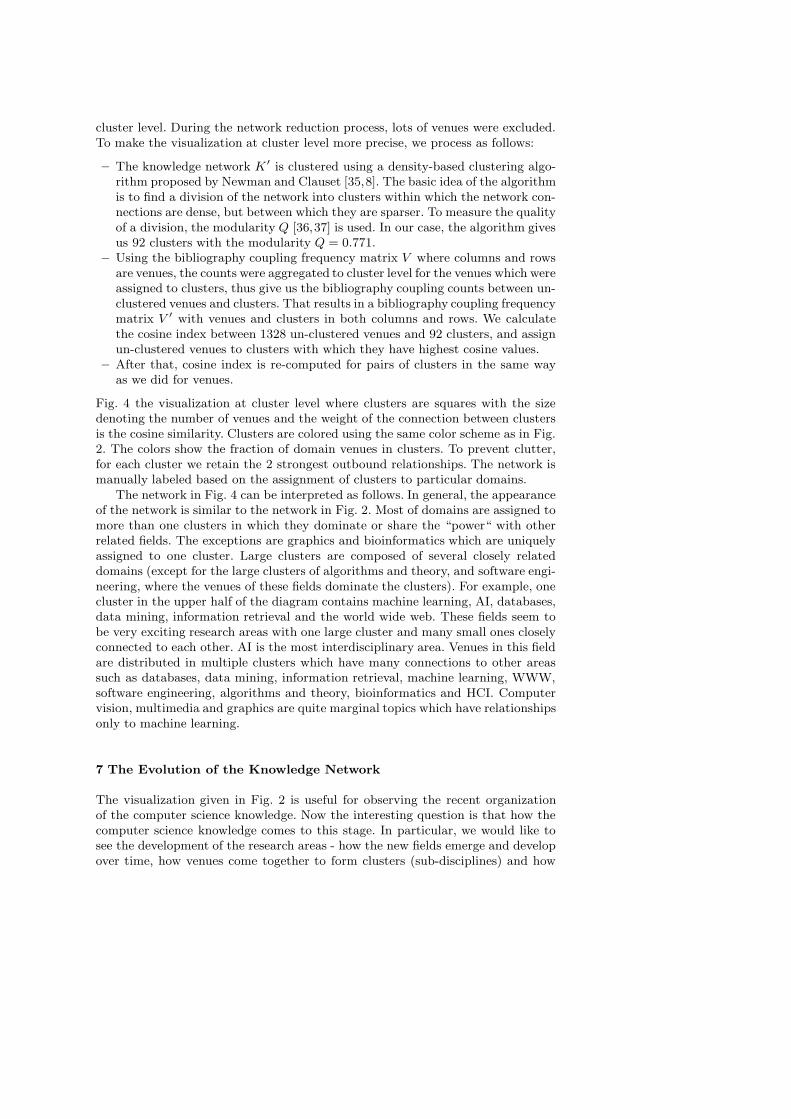
Fig. 4 the visualization at cluster level where clusters are squares with the sizedenoting the number of venues and the weight of the connection between clustersis the cosine similarity. Clusters are colored using the same color scheme as in Fig.2. The colors show the fraction of domain venues in clusters. To prevent clutter,for each cluster we retain the 2 strongest outbound relationships. The network ismanually labeled based on the assignment of clusters to particular domains.
The network in Fig. 4 can be interpreted as follows. In general, the appearanceof the network is similar to the network in Fig. 2. Most of domains are assigned tomore than one clusters in which they dominate or share the “power“ with otherrelated fields. The exceptions are graphics and bioinformatics which are uniquelyassigned to one cluster. Large clusters are composed of several closely relateddomains (except for the large clusters of algorithms and theory, and software engi-neering, where the venues of these fields dominate the clusters). For example, onecluster in the upper half of the diagram contains machine learning, AI, databases,data mining, information retrieval and the world wide web. These fields seem tobe very exciting research areas with one large cluster and many small ones closelyconnected to each other. AI is the most interdisciplinary area. Venues in this fieldare distributed in multiple clusters which have many connections to other areassuch as databases, data mining, information retrieval, machine learning, WWW,software engineering, algorithms and theory, bioinformatics and HCI. Computervision, multimedia and graphics are quite marginal topics which have relationshipsonly to machine learning.
7 The Evolution of the Knowledge Network
The visualization given in Fig. 2 is useful for observing the recent organizationof the computer science knowledge. Now the interesting question is that how thecomputer science knowledge comes to this stage. In particular, we would like tosee the development of the research areas - how the new fields emerge and developover time, how venues come together to form clusters (sub-disciplines) and how
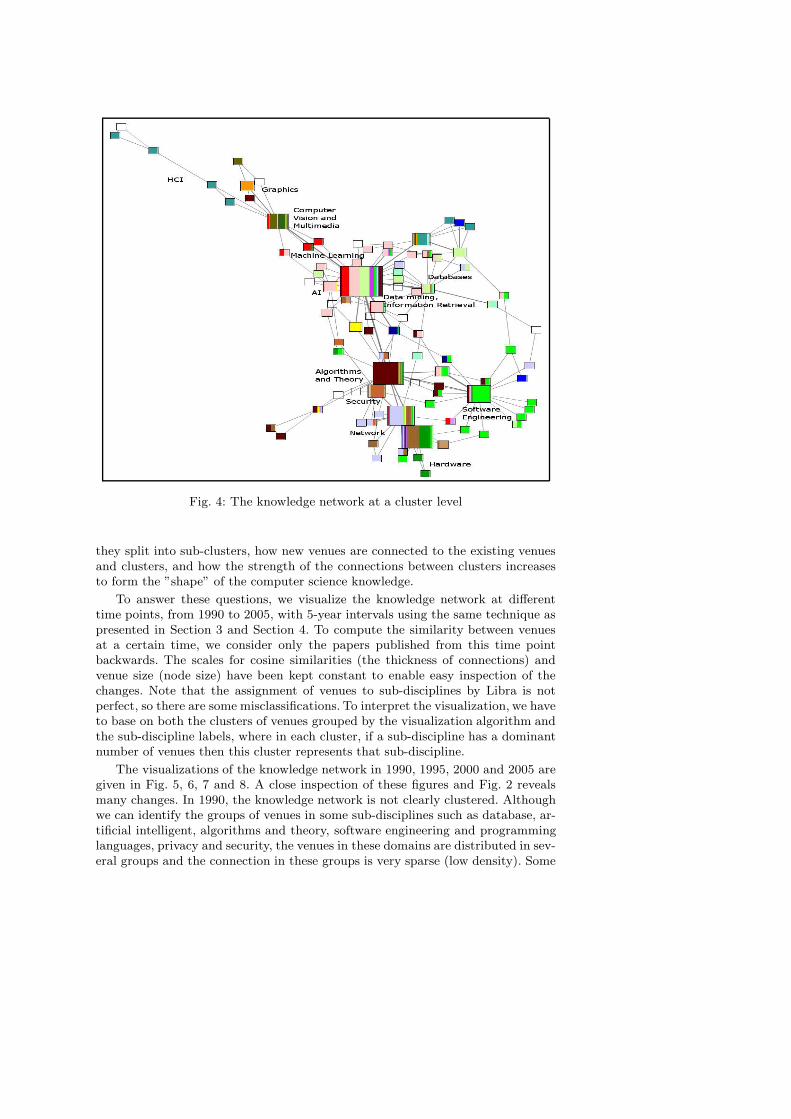
Fig. 4: The knowledge network at a cluster level
they split into sub-clusters, how new venues are connected to the existing venuesand clusters, and how the strength of the connections between clusters increasesto form the ”shape” of the computer science knowledge.
To answer these questions, we visualize the knowledge network at differenttime points, from 1990 to 2005, with 5-year intervals using the same technique aspresented in Section 3 and Section 4. To compute the similarity between venuesat a certain time, we consider only the papers published from this time pointbackwards. The scales for cosine similarities (the thickness of connections) andvenue size (node size) have been kept constant to enable easy inspection of thechanges. Note that the assignment of venues to sub-disciplines by Libra is notperfect, so there are some misclassifications. To interpret the visualization, we haveto base on both the clusters of venues grouped by the visualization algorithm andthe sub-discipline labels, where in each cluster, if a sub-discipline has a dominantnumber of venues then this cluster represents that sub-discipline.
The visualizations of the knowledge network in 1990, 1995, 2000 and 2005 aregiven in Fig. 5, 6, 7 and 8. A close inspection of these figures and Fig. 2 revealsmany changes. In 1990, the knowledge network is not clearly clustered. Althoughwe can identify the groups of venues in some sub-disciplines such as database, ar-tificial intelligent, algorithms and theory, software engineering and programminglanguages, privacy and security, the venues in these domains are distributed in sev-eral groups and the connection in these groups is very sparse (low density). Some
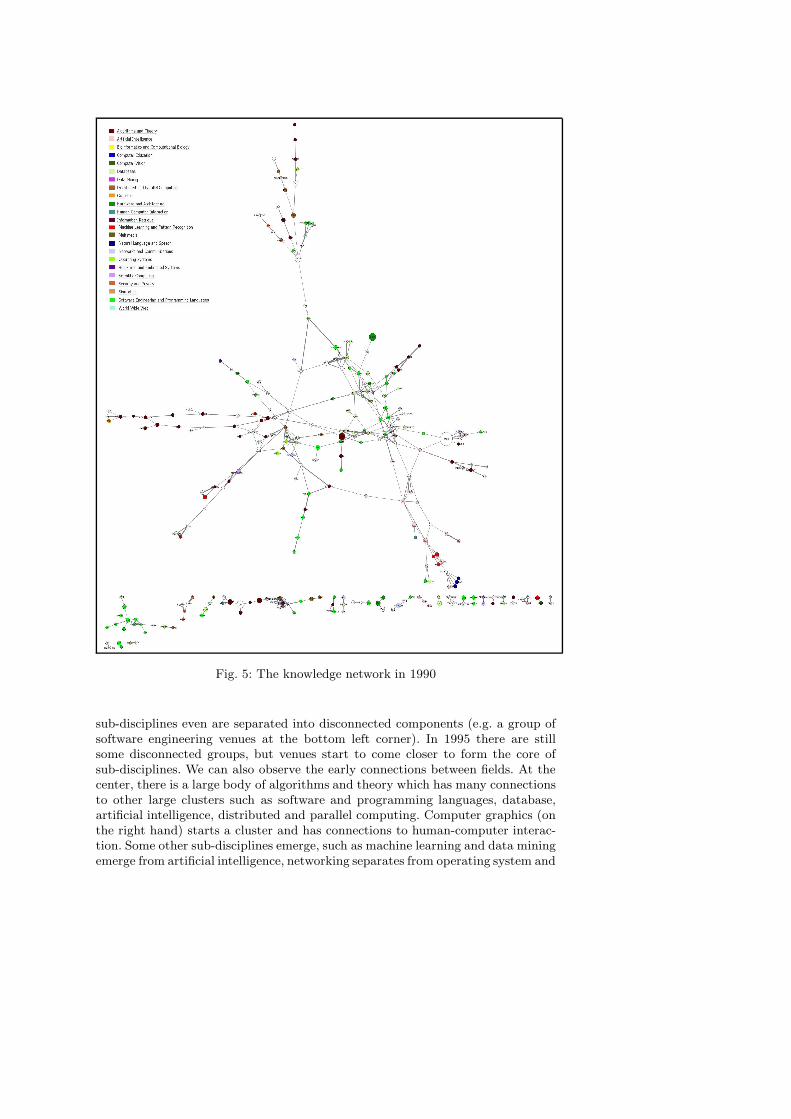
Fig. 5: The knowledge network in 1990
sub-disciplines even are separated into disconnected components (e.g. a group ofsoftware engineering venues at the bottom left corner). In 1995 there are stillsome disconnected groups, but venues start to come closer to form the core ofsub-disciplines. We can also observe the early connections between fields. At thecenter, there is a large body of algorithms and theory which has many connectionsto other large clusters such as software and programming languages, database,artificial intelligence, distributed and parallel computing. Computer graphics (onthe right hand) starts a cluster and has connections to human-computer interac-tion. Some other sub-disciplines emerge, such as machine learning and data miningemerge from artificial intelligence, networking separates from operating system and
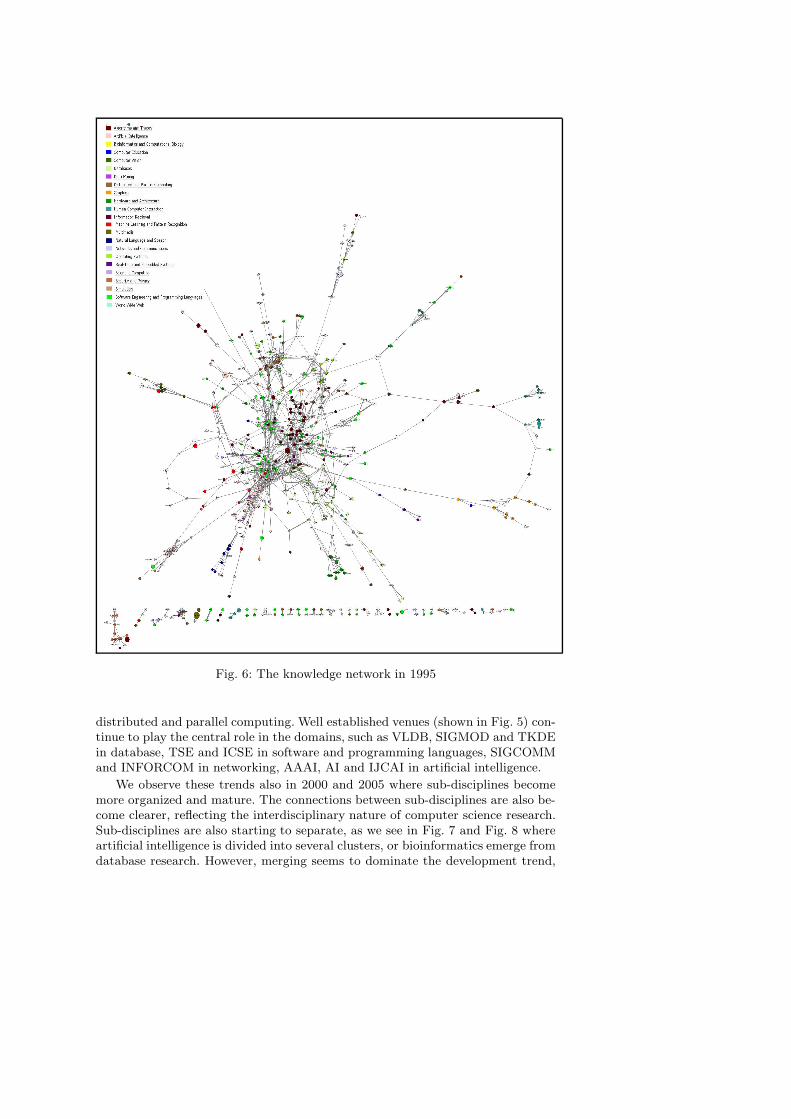
Fig. 6: The knowledge network in 1995
distributed and parallel computing. Well established venues (shown in Fig. 5) con-tinue to play the central role in the domains, such as VLDB, SIGMOD and TKDEin database, TSE and ICSE in software and programming languages, SIGCOMMand INFORCOM in networking, AAAI, AI and IJCAI in artificial intelligence.
We observe these trends also in 2000 and 2005 where sub-disciplines becomemore organized and mature. The connections between sub-disciplines are also be-come clearer, reflecting the interdisciplinary nature of computer science research.Sub-disciplines are also starting to separate, as we see in Fig. 7 and Fig. 8 whereartificial intelligence is divided into several clusters, or bioinformatics emerge fromdatabase research. However, merging seems to dominate the development trend,
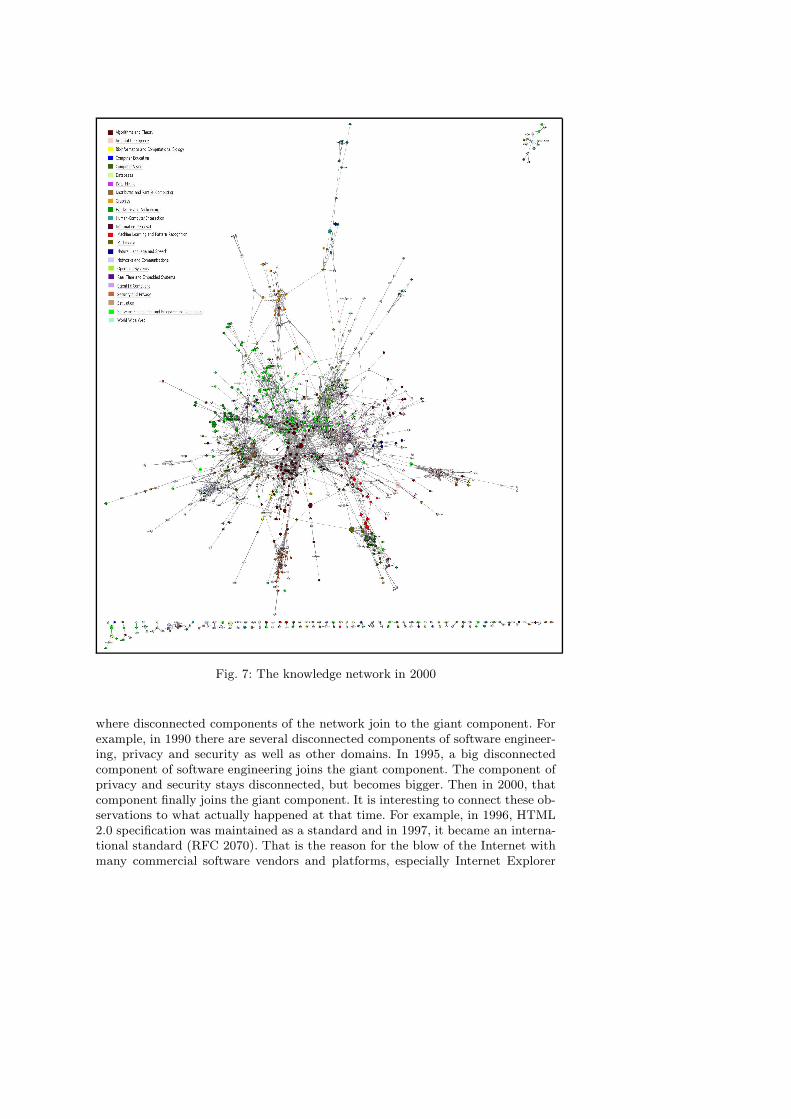
Fig. 7: The knowledge network in 2000
where disconnected components of the network join to the giant component. Forexample, in 1990 there are several disconnected components of software engineer-ing, privacy and security as well as other domains. In 1995, a big disconnectedcomponent of software engineering joins the giant component. The component ofprivacy and security stays disconnected, but becomes bigger. Then in 2000, thatcomponent finally joins the giant component. It is interesting to connect these ob-servations to what actually happened at that time. For example, in 1996, HTML2.0 specification was maintained as a standard and in 1997, it became an interna-tional standard (RFC 2070). That is the reason for the blow of the Internet withmany commercial software vendors and platforms, especially Internet Explorer
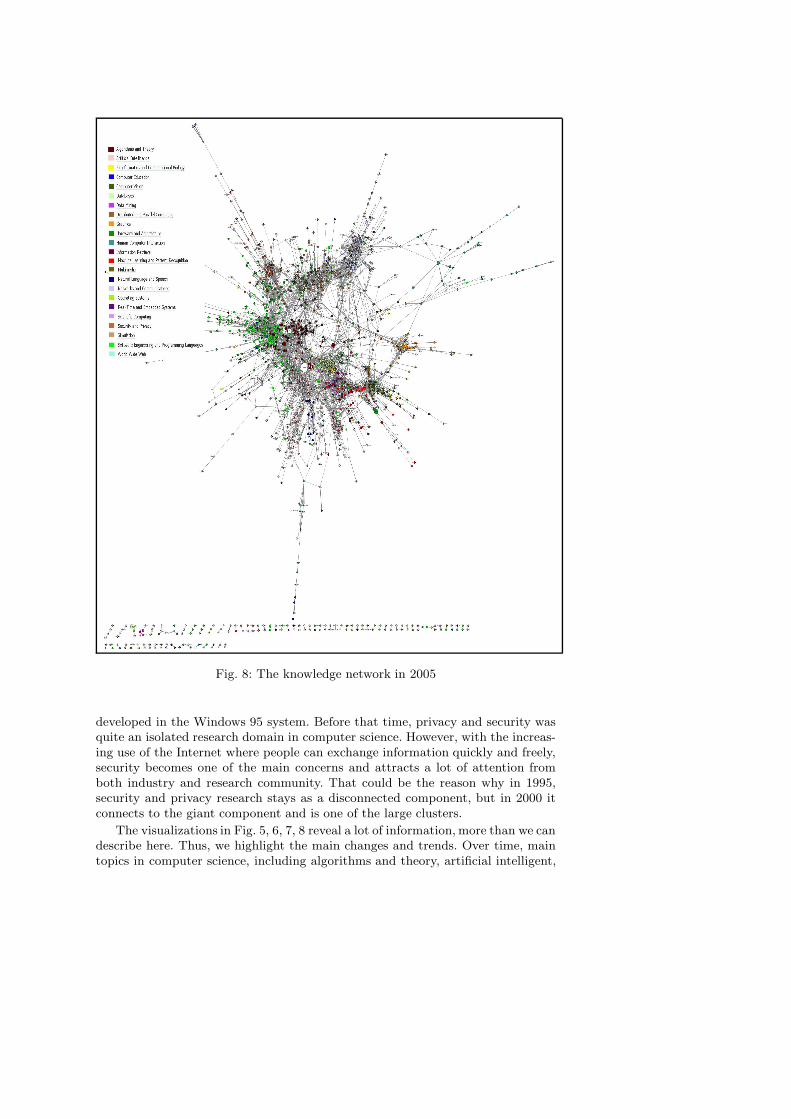
Fig. 8: The knowledge network in 2005
developed in the Windows 95 system. Before that time, privacy and security wasquite an isolated research domain in computer science. However, with the increas-ing use of the Internet where people can exchange information quickly and freely,security becomes one of the main concerns and attracts a lot of attention fromboth industry and research community. That could be the reason why in 1995,security and privacy research stays as a disconnected component, but in 2000 itconnects to the giant component and is one of the large clusters.
The visualizations in Fig. 5, 6, 7, 8 reveal a lot of information, more than we candescribe here. Thus, we highlight the main changes and trends. Over time, maintopics in computer science, including algorithms and theory, artificial intelligent,

database, networking, and software engineering, develop consistently. Domainsbecome more and more interdisciplinary where they connect more or less to otherdomains or sub-domains. Fields are starting to split into sub-fields, though mergingdominates the development trend. New fields or sub-fields continuously emergefrom the existing sub-disciplines. With the growth of the Web, data mining andinformation retrieval, emerging from database and artificial intelligence, as wellas privacy and security are becoming more and more exciting fields with a lot ofconferences and journals.
8 Venue Ranking
There are different metrics to evaluate the performance and prestige of individualsand journals such as citations count, H-index [17], impact factor8 by the Institutefor Scientific Information (ISI), now part of Thomson Reuters. However, thesemetrics are controversial [40,22] and it turns out that using one single metriccannot judiciously evaluate the impact of a journal or a scientist. A metric shouldbe used in the combination with other metrics to fully and reliably justify theperformance of scientists, publications and venues.
We employ two social network measures, betweenness centrality and PageRank,for venue ranking. These measures do not intend to be a replacement, but a com-plement to the existing metrics. Given the assignment of venues to domains andthe citation network F ′, we calculated node’s betweenness centrality and PageR-
ank to determine interdisciplinary and high prestige venues, respectively. UsingPageRank has one advantage over the impact factor: PageRank does highly rankvenues which are cited by other highly ranked venues, so new venues have a higherimpact when they are cited by well-known venues.
Betweenness centrality [46] of a venue Vi is defined as the number of shortestpaths in the network that pass through Vi and it is computed as follows:
C(Vk) =∑
i 6=j 6=k
Pi,j(k)
Pi,j
(2)
where Pi,j is the number of (weighted) shortest paths between venues Vi and Vj ,Pi,j(k) is the number of that shortest paths which go through venue Vk. Highlyvalue of betweenness centrality indicates a venue as a ”gateway” which connectsa large number of venues and venue clusters. Venues with high betweenness cen-trality values often are interdisciplinary. Table 2 gives the list of top 30 centralityvenues. They are indeed highly interdisciplinary venues. The first position is CORR(Computing Research Repository) with the betweenness 0.185. DBLP classifies itas a journal, but in fact CORR is a repository to which researchers could submittechnical reports. CORR covers almost every topic of computer science. Paperspublished in CORR are not peer reviewed, only the relatedness to the topic areais checked. That is the reason for the appearance of CORR as a large venue inthe visualization (Fig. 2) and as a top interdisciplinary venue. Among others, AI,machine learning, databases and the world wide web contribute ten venues to thislist. That confirms their interdisciplinary nature reflected in Fig. 4.
8 http://thomsonreuters.com/products_services/science/academic/impact_factor/
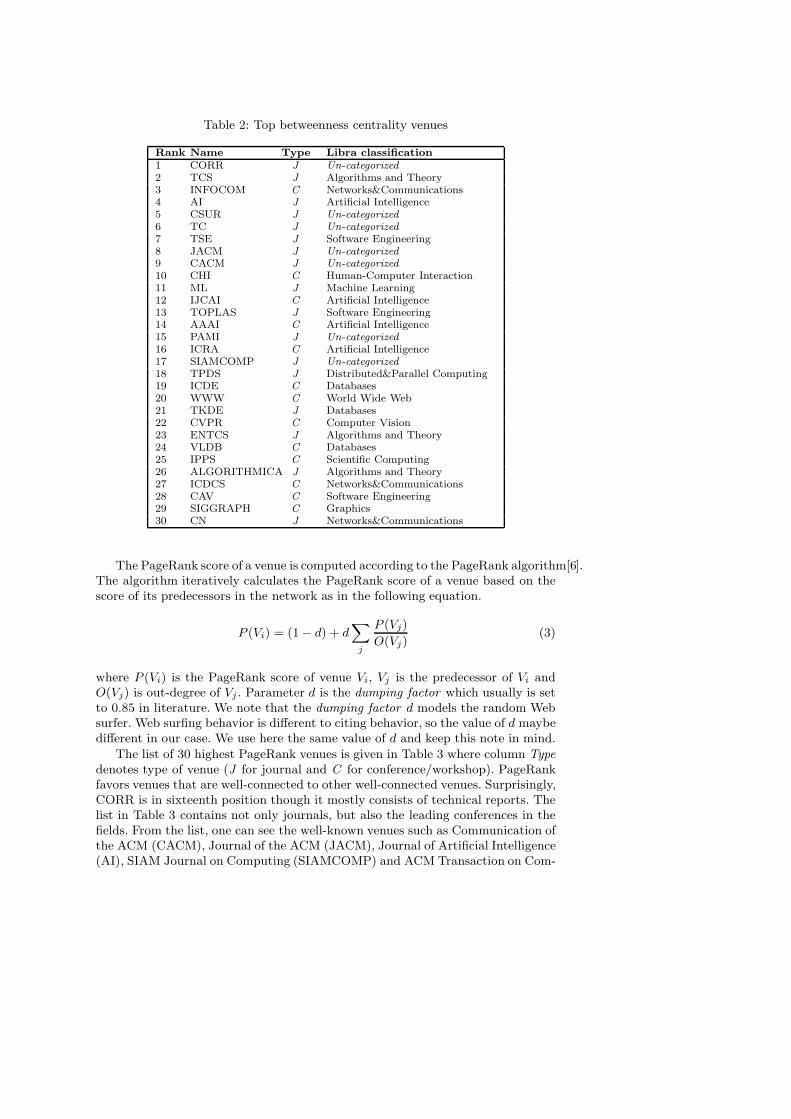
Table 2: Top betweenness centrality venues
Rank Name Type Libra classification1 CORR J Un-categorized
2 TCS J Algorithms and Theory3 INFOCOM C Networks&Communications4 AI J Artificial Intelligence5 CSUR J Un-categorized
6 TC J Un-categorized
7 TSE J Software Engineering8 JACM J Un-categorized
9 CACM J Un-categorized
10 CHI C Human-Computer Interaction11 ML J Machine Learning12 IJCAI C Artificial Intelligence13 TOPLAS J Software Engineering14 AAAI C Artificial Intelligence15 PAMI J Un-categorized
16 ICRA C Artificial Intelligence17 SIAMCOMP J Un-categorized
18 TPDS J Distributed&Parallel Computing19 ICDE C Databases20 WWW C World Wide Web21 TKDE J Databases22 CVPR C Computer Vision23 ENTCS J Algorithms and Theory24 VLDB C Databases25 IPPS C Scientific Computing26 ALGORITHMICA J Algorithms and Theory27 ICDCS C Networks&Communications28 CAV C Software Engineering29 SIGGRAPH C Graphics30 CN J Networks&Communications
The PageRank score of a venue is computed according to the PageRank algorithm[6].The algorithm iteratively calculates the PageRank score of a venue based on thescore of its predecessors in the network as in the following equation.
P (Vi) = (1− d) + d∑
j
P (Vj)
O(Vj)(3)
where P (Vi) is the PageRank score of venue Vi, Vj is the predecessor of Vi andO(Vj) is out-degree of Vj . Parameter d is the dumping factor which usually is setto 0.85 in literature. We note that the dumping factor d models the random Websurfer. Web surfing behavior is different to citing behavior, so the value of d maybedifferent in our case. We use here the same value of d and keep this note in mind.
The list of 30 highest PageRank venues is given in Table 3 where column Type
denotes type of venue (J for journal and C for conference/workshop). PageRankfavors venues that are well-connected to other well-connected venues. Surprisingly,CORR is in sixteenth position though it mostly consists of technical reports. Thelist in Table 3 contains not only journals, but also the leading conferences in thefields. From the list, one can see the well-known venues such as Communication ofthe ACM (CACM), Journal of the ACM (JACM), Journal of Artificial Intelligence(AI), SIAM Journal on Computing (SIAMCOMP) and ACM Transaction on Com-
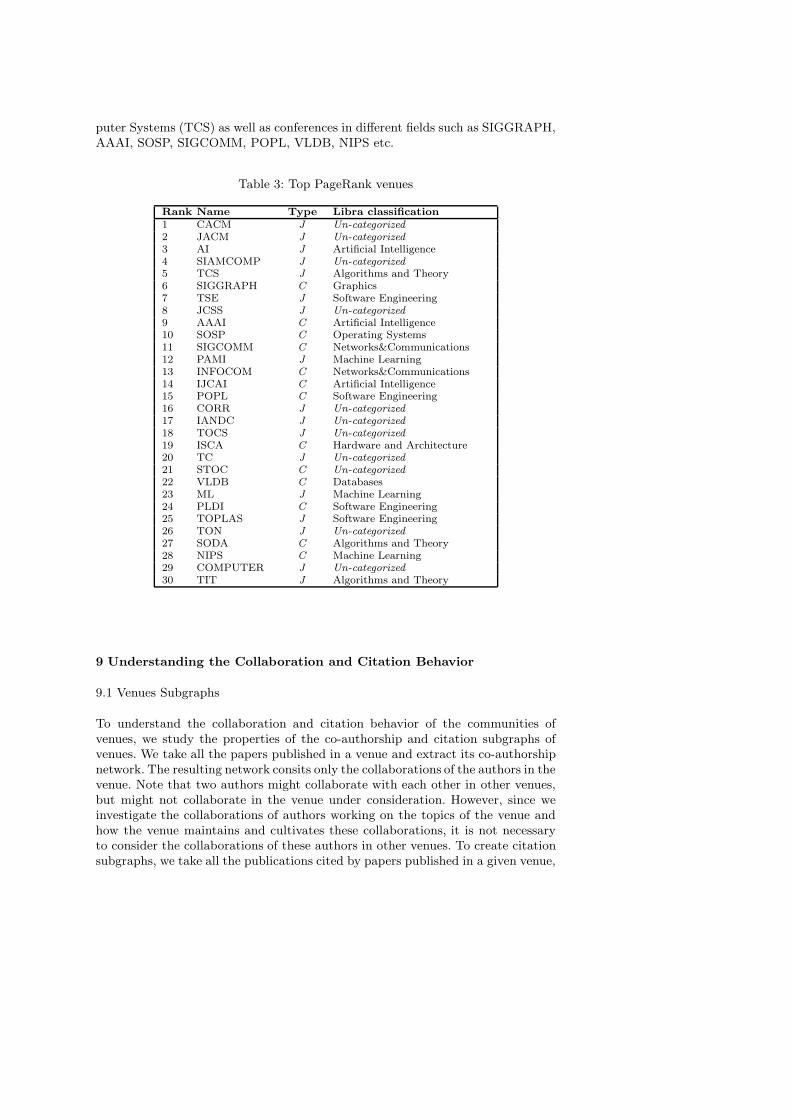
puter Systems (TCS) as well as conferences in different fields such as SIGGRAPH,AAAI, SOSP, SIGCOMM, POPL, VLDB, NIPS etc.
Table 3: Top PageRank venues
Rank Name Type Libra classification1 CACM J Un-categorized
2 JACM J Un-categorized
3 AI J Artificial Intelligence4 SIAMCOMP J Un-categorized
5 TCS J Algorithms and Theory6 SIGGRAPH C Graphics7 TSE J Software Engineering8 JCSS J Un-categorized
9 AAAI C Artificial Intelligence10 SOSP C Operating Systems11 SIGCOMM C Networks&Communications12 PAMI J Machine Learning13 INFOCOM C Networks&Communications14 IJCAI C Artificial Intelligence15 POPL C Software Engineering16 CORR J Un-categorized
17 IANDC J Un-categorized
18 TOCS J Un-categorized
19 ISCA C Hardware and Architecture20 TC J Un-categorized
21 STOC C Un-categorized
22 VLDB C Databases23 ML J Machine Learning24 PLDI C Software Engineering25 TOPLAS J Software Engineering26 TON J Un-categorized
27 SODA C Algorithms and Theory28 NIPS C Machine Learning29 COMPUTER J Un-categorized
30 TIT J Algorithms and Theory
9 Understanding the Collaboration and Citation Behavior
9.1 Venues Subgraphs
To understand the collaboration and citation behavior of the communities ofvenues, we study the properties of the co-authorship and citation subgraphs ofvenues. We take all the papers published in a venue and extract its co-authorshipnetwork. The resulting network consits only the collaborations of the authors in thevenue. Note that two authors might collaborate with each other in other venues,but might not collaborate in the venue under consideration. However, since weinvestigate the collaborations of authors working on the topics of the venue andhow the venue maintains and cultivates these collaborations, it is not necessaryto consider the collaborations of these authors in other venues. To create citationsubgraphs, we take all the publications cited by papers published in a given venue,
project them on the underlying citation graph and extract the subgraph of cita-tions among these publications. Formally, we define the co-authorship subgraphGa = (A,E) of a venue is a graph where A is the set of authors who publishedsome papers in this venue and there is a connection e ∈ E between author ai andaj ∈ A if they wrote a paper published in this venue together. Similarly, we definethe citation subgraph of a venue Gc = (P,C), where P is the set of publicationscited by papers published in this venue and C is the set of citations among thesepublications.
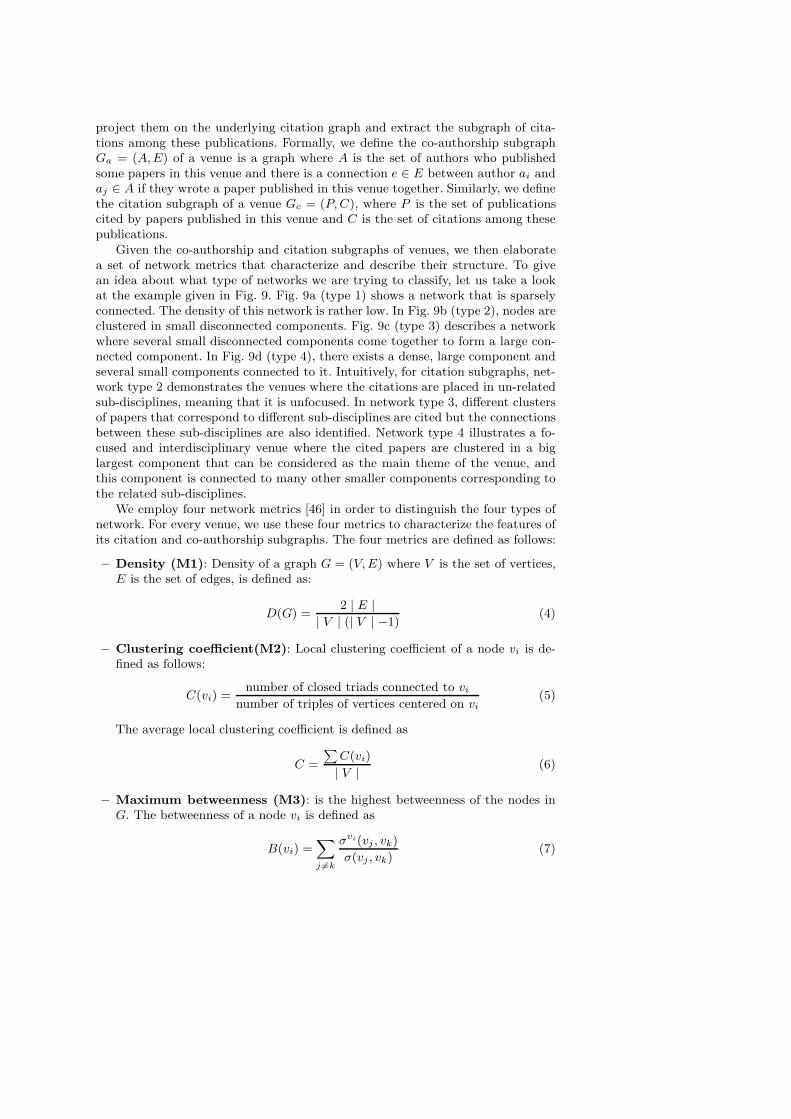
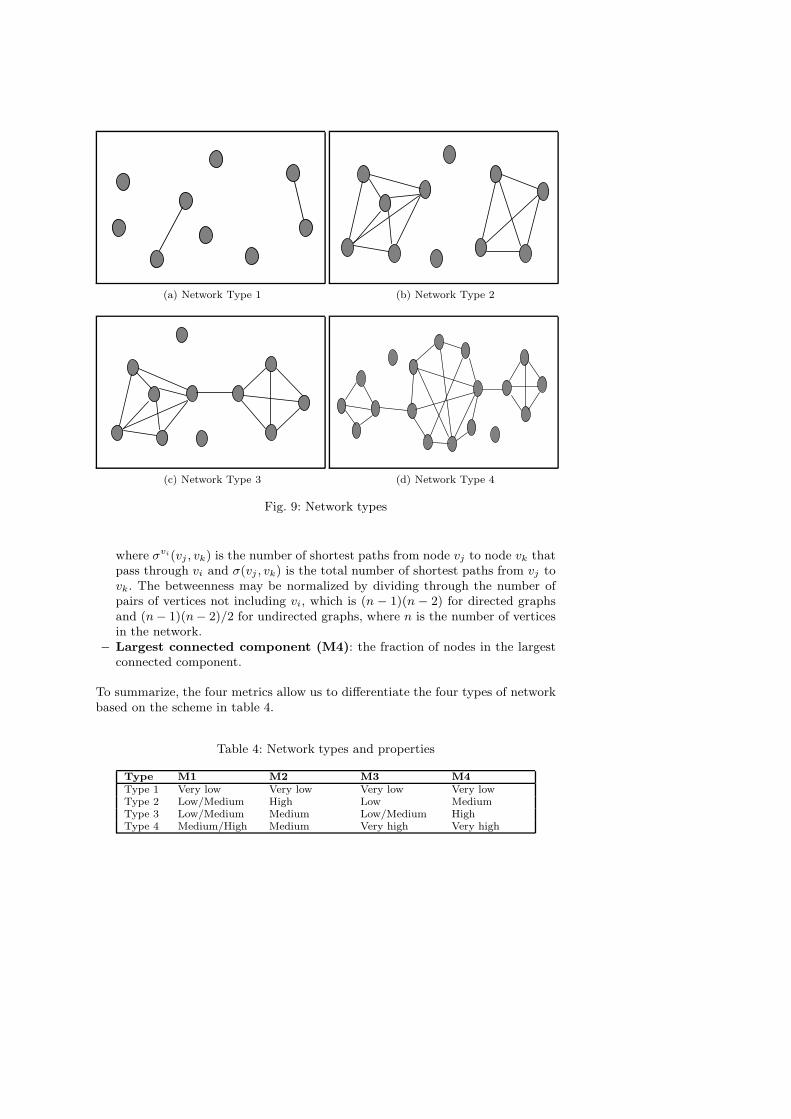
Given the co-authorship and citation subgraphs of venues, we then elaboratea set of network metrics that characterize and describe their structure. To givean idea about what type of networks we are trying to classify, let us take a lookat the example given in Fig. 9. Fig. 9a (type 1) shows a network that is sparselyconnected. The density of this network is rather low. In Fig. 9b (type 2), nodes areclustered in small disconnected components. Fig. 9c (type 3) describes a networkwhere several small disconnected components come together to form a large con-nected component. In Fig. 9d (type 4), there exists a dense, large component andseveral small components connected to it. Intuitively, for citation subgraphs, net-work type 2 demonstrates the venues where the citations are placed in un-relatedsub-disciplines, meaning that it is unfocused. In network type 3, different clustersof papers that correspond to different sub-disciplines are cited but the connectionsbetween these sub-disciplines are also identified. Network type 4 illustrates a fo-cused and interdisciplinary venue where the cited papers are clustered in a biglargest component that can be considered as the main theme of the venue, andthis component is connected to many other smaller components corresponding tothe related sub-disciplines.
We employ four network metrics [46] in order to distinguish the four types ofnetwork. For every venue, we use these four metrics to characterize the features ofits citation and co-authorship subgraphs. The four metrics are defined as follows:
– Density (M1): Density of a graph G = (V,E) where V is the set of vertices,E is the set of edges, is defined as:
D(G) =2 | E |
| V | (| V | −1)(4)
– Clustering coefficient(M2): Local clustering coefficient of a node vi is de-fined as follows:
C(vi) =number of closed triads connected to vi
number of triples of vertices centered on vi(5)
The average local clustering coefficient is defined as
C =
∑
C(vi)
| V |(6)
– Maximum betweenness (M3): is the highest betweenness of the nodes inG. The betweenness of a node vi is defined as
B(vi) =∑
j 6=k
σvi(vj , vk)
σ(vj , vk)(7)
(a) Network Type 1 (b) Network Type 2
(c) Network Type 3 (d) Network Type 4
Fig. 9: Network types
where σvi(vj , vk) is the number of shortest paths from node vj to node vk thatpass through vi and σ(vj , vk) is the total number of shortest paths from vj tovk. The betweenness may be normalized by dividing through the number ofpairs of vertices not including vi, which is (n − 1)(n − 2) for directed graphsand (n− 1)(n− 2)/2 for undirected graphs, where n is the number of verticesin the network.
– Largest connected component (M4): the fraction of nodes in the largestconnected component.
To summarize, the four metrics allow us to differentiate the four types of networkbased on the scheme in table 4.
Table 4: Network types and properties
Type M1 M2 M3 M4Type 1 Very low Very low Very low Very lowType 2 Low/Medium High Low MediumType 3 Low/Medium Medium Low/Medium HighType 4 Medium/High Medium Very high Very high

0 0.02 0.04 0.06 0.08 0.1 0.12 0.140
0.2
0.4
0.6
0.8
1
Fre
quency
Density
(a) Density
Coauthorship
Citation
0 0.2 0.4 0.6 0.8 10
0.1
0.2
0.3
0.4
0.5
0.6
0.7
Fre
quency
Clustering coefficient
(b) Clustering coefficient
Coauthorship
Citation
0 0.2 0.4 0.6 0.8 10
0.1
0.2
0.3
0.4
0.5
0.6
0.7
Fre
quency
Maximum betweenness
(c) Maximum Betweenness
Coauthorship
Citation
0 0.2 0.4 0.6 0.8 10
0.05
0.1
0.15
0.2
0.25F
requency
Largest connected component
(d) Largest Connected Component
Coauthorship
Citation
Fig. 10: Properties of collaboration and citation graphs of venues
9.2 Characteristics of Computer Science Venues
The first question we address is that to what extend the venues in computer scienceare focused and how authors collaborate on that basic. In particular, we comparethe properties of citation and co-authorship subgraph of journals and conferencesto identify the differences between two types of publishing. To gain insights into theabove questions, we process as follows: for all venues, we create their collaborationand citation subgraphs Ga and Gc. Then we compute the four metrics defined inSection 9.1. For each metric we create a normalized histogram and by observingthese histograms we are able to examine the characteristics of venues.
The normalized histograms of the four metrics are given in Fig. 10. Firstly, mostof the venues are not narrow, but they are indeed interdisciplinary (shown by lowdensity and medium clustering coefficient of citation subgraphs in Fig. 10a and Fig.10b). However, venues also tend to develop a main theme which is the main focusedand closely related topics as the core topics. That is shown by big largest connectedcomponent in the citation subgraphs (Fig. 10d). According to the scheme in Table4, most of the venues fall into the network type 3, characterized by low/mediumdensity, medium clustering coefficient, low/medium maximum betweenness andbig largest connected component.

We now consider the collaborative behavior of researchers in the venues. InFig. 10, we can see that most of the co-authorship subgraphs are of network type2 (low/medium density, high clustering coefficient, low maximum betweenness andmedium largest connected component). That means researchers in the venues areclustered in disconnected working groups. The relative small number of venues thathave big largest connected component (Fig. 10d) implies that though venues tendto develop the main theme, not so many of them successfully stimulates authorsto collaborate on that theme. Low maximum betweenness (Fig. 10c) suggests thatthe gateways who connect several working groups rarely exist in the venues. Wewill investigate the relation between the existence of the gateways and the impactof venues in the next section.
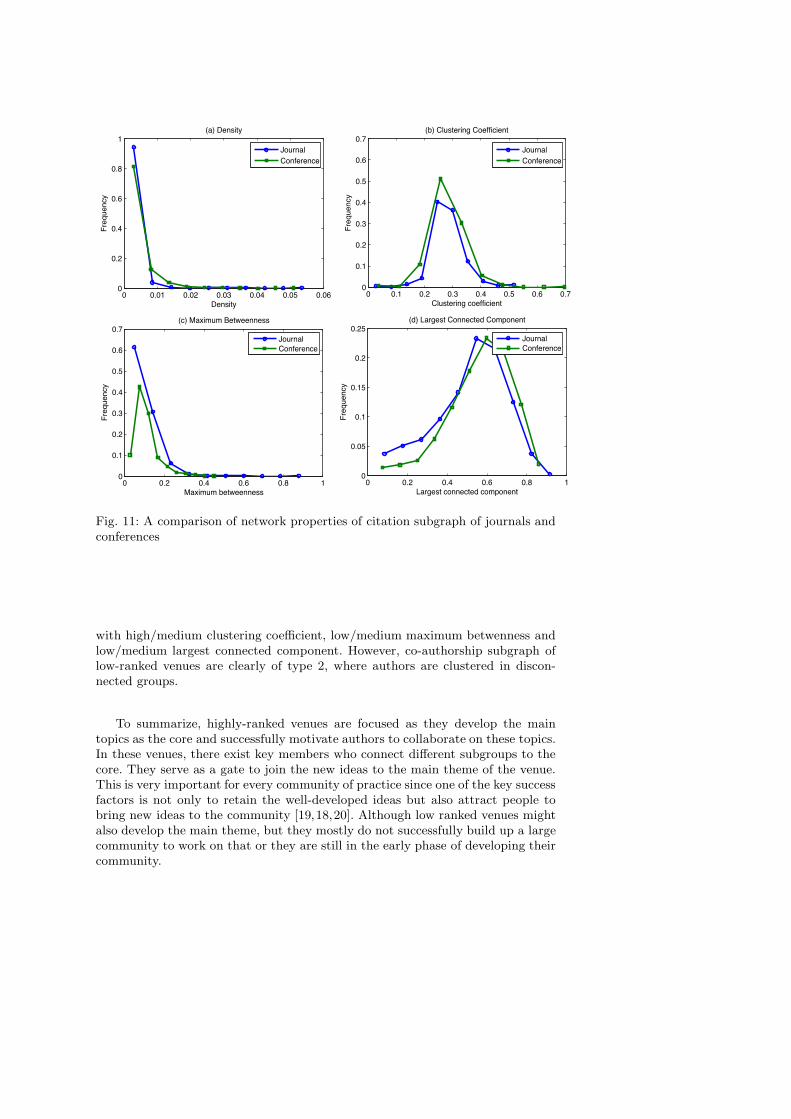
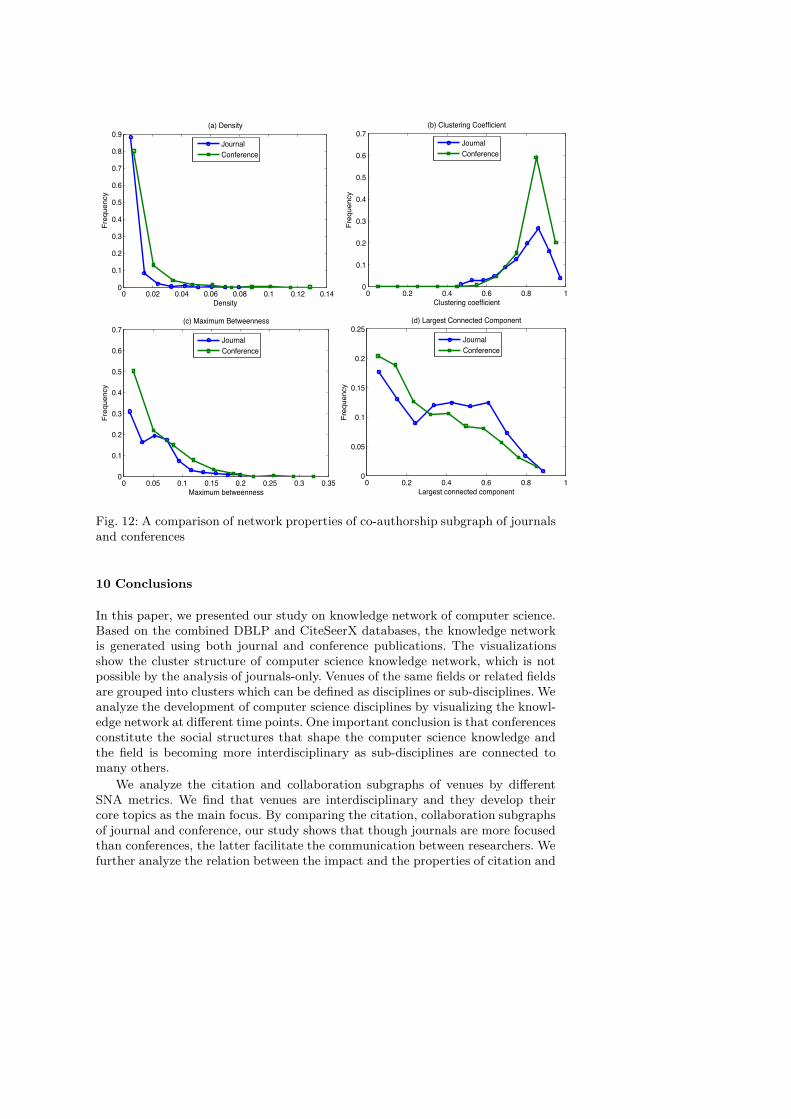
Now we compare the properties of citation and co-authorship subgraphs ofconference and journal. The question we try to address is that whether confer-ences expose the same pattern in citation and collaborative behavior as journals.Fig. 11 and Fig. 12 show the comparison of network properties of citation andco-authorship subgraphs of journal and conference. In general, most of journaland conference citation subgraphs are of network type 3 (low/medium density,medium clustering coefficient, medium maximum betweenness and big largest con-nected component). However, clustering coefficient of conferences’ citation graphis higher than that of journals and maximum betweenness is lower. That meanscitations of conferences are placed in more disconnected clusters, which suggeststhat conferences are less focused than journals. A close look at the Fig. 12 revealssome differences in collaborative behavior. Clustering coefficient and maximum be-tweenness of conferences’ co-authorship subgraph are higher than journals’, mean-ing that there exists more gateways in conferences than in journals and researchersin conferences tend to collaborate with peers in other working groups.
To summarize, venues in computer science are indeed interdisciplinary. Most ofthem established a core area while still connecting to other related areas. Journalsare more focused than conferences, but conferences facilitate the communicationbetween participants whose collaborations tend to cross different communities.
9.3 Venues Subgraph and the PageRank
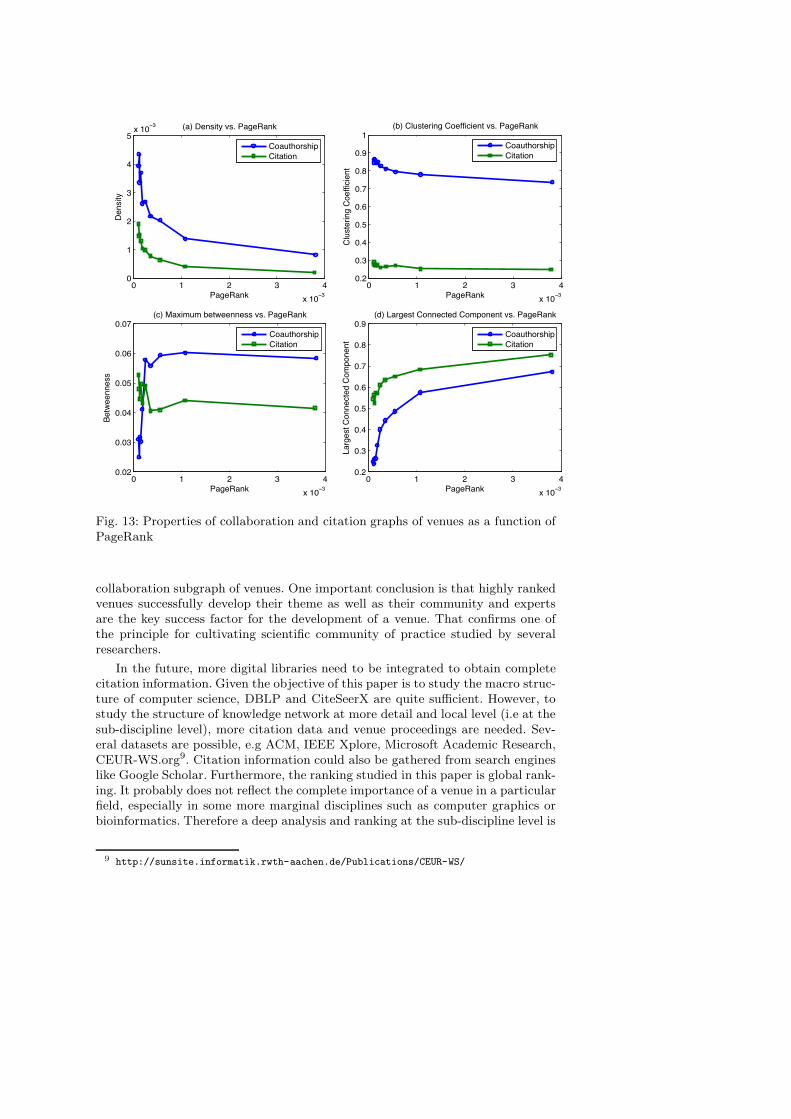
Now we investigate the relation between the ranking of venues and the propertiesof collaboration and citation subgraphs. Our interest is whether the properties ofcollaboration and citation subgraphs reflect the impact of venues. In Fig. 13, weplot the median of the network properties for each PageRank value in order toanalyze this relation.
Several observations can be made here. On the one hand, citation network ofhighly-ranked venues are of network type 3 (low/medium density, medium cluster-ing coefficient, low/medium betweenness and big largest connected component),meaning that highly-ranked venues are focused. The co-authorship network ofhighly-ranked venues fall into network type 4, characterized by medium cluster-ing coefficient, very high maximum betweenness and very big largest connectedcomponent. The vast majority of authors in those venues are connected in a largecomponent and that component is connected to many other small groups via gate-keepers. On the other hand, it is not easy to identify the type of the citation sub-graph of low-ranked venues. They might lay between network type 2 and type 3,
0 0.01 0.02 0.03 0.04 0.05 0.060
0.2
0.4
0.6
0.8
1
Fre
quency
Density
(a) Density
Journal
Conference
0 0.1 0.2 0.3 0.4 0.5 0.6 0.70
0.1
0.2
0.3
0.4
0.5
0.6
0.7
Fre
quency
Clustering coefficient
(b) Clustering Coefficient
Journal
Conference
0 0.2 0.4 0.6 0.8 10
0.1
0.2
0.3
0.4
0.5
0.6
0.7
Fre
quency
Maximum betweenness
(c) Maximum Betweenness
Journal
Conference
0 0.2 0.4 0.6 0.8 10
0.05
0.1
0.15
0.2
0.25
Fre
quency
Largest connected component
(d) Largest Connected Component
Journal
Conference
Fig. 11: A comparison of network properties of citation subgraph of journals andconferences
with high/medium clustering coefficient, low/medium maximum betwenness andlow/medium largest connected component. However, co-authorship subgraph oflow-ranked venues are clearly of type 2, where authors are clustered in discon-nected groups.
To summarize, highly-ranked venues are focused as they develop the maintopics as the core and successfully motivate authors to collaborate on these topics.In these venues, there exist key members who connect different subgroups to thecore. They serve as a gate to join the new ideas to the main theme of the venue.This is very important for every community of practice since one of the key successfactors is not only to retain the well-developed ideas but also attract people tobring new ideas to the community [19,18,20]. Although low ranked venues mightalso develop the main theme, but they mostly do not successfully build up a largecommunity to work on that or they are still in the early phase of developing theircommunity.
0 0.02 0.04 0.06 0.08 0.1 0.12 0.140
0.1
0.2
0.3
0.4
0.5
0.6
0.7
0.8
0.9
Fre
quency
Density
(a) Density
Journal
Conference
0 0.2 0.4 0.6 0.8 10
0.1
0.2
0.3
0.4
0.5
0.6
0.7
Fre
quency
Clustering coefficient
(b) Clustering Coefficient
Journal
Conference
0 0.05 0.1 0.15 0.2 0.25 0.3 0.350
0.1
0.2
0.3
0.4
0.5
0.6
0.7
Fre
quency
Maximum betweenness
(c) Maximum Betweenness
Journal
Conference
0 0.2 0.4 0.6 0.8 10
0.05
0.1
0.15
0.2
0.25
Fre
quency
Largest connected component
(d) Largest Connected Component
Journal
Conference
Fig. 12: A comparison of network properties of co-authorship subgraph of journalsand conferences
10 Conclusions
In this paper, we presented our study on knowledge network of computer science.Based on the combined DBLP and CiteSeerX databases, the knowledge networkis generated using both journal and conference publications. The visualizationsshow the cluster structure of computer science knowledge network, which is notpossible by the analysis of journals-only. Venues of the same fields or related fieldsare grouped into clusters which can be defined as disciplines or sub-disciplines. Weanalyze the development of computer science disciplines by visualizing the knowl-edge network at different time points. One important conclusion is that conferencesconstitute the social structures that shape the computer science knowledge andthe field is becoming more interdisciplinary as sub-disciplines are connected tomany others.
We analyze the citation and collaboration subgraphs of venues by differentSNA metrics. We find that venues are interdisciplinary and they develop theircore topics as the main focus. By comparing the citation, collaboration subgraphsof journal and conference, our study shows that though journals are more focusedthan conferences, the latter facilitate the communication between researchers. Wefurther analyze the relation between the impact and the properties of citation and
0 1 2 3 4
x 10 3
0
1
2
3
4
5x 10
3
Density
PageRank
(a) Density vs. PageRank
Coauthorship
Citation
0 1 2 3 4
x 10 3
0.2
0.3
0.4
0.5
0.6
0.7
0.8
0.9
1
Clu
ste
ring C
oeff
icie
nt
PageRank
(b) Clustering Coefficient vs. PageRank
Coauthorship
Citation
0 1 2 3 4
x 10 3
0.02
0.03
0.04
0.05
0.06
0.07
Betw
eenness
PageRank
(c) Maximum betweenness vs. PageRank
Coauthorship
Citation
0 1 2 3 4
x 10 3
0.2
0.3
0.4
0.5
0.6
0.7
0.8
0.9
Larg
est
Connecte
d C
om
ponent
PageRank
(d) Largest Connected Component vs. PageRank
Coauthorship
Citation
Fig. 13: Properties of collaboration and citation graphs of venues as a function ofPageRank
collaboration subgraph of venues. One important conclusion is that highly rankedvenues successfully develop their theme as well as their community and expertsare the key success factor for the development of a venue. That confirms one ofthe principle for cultivating scientific community of practice studied by severalresearchers.
In the future, more digital libraries need to be integrated to obtain completecitation information. Given the objective of this paper is to study the macro struc-ture of computer science, DBLP and CiteSeerX are quite sufficient. However, tostudy the structure of knowledge network at more detail and local level (i.e at thesub-discipline level), more citation data and venue proceedings are needed. Sev-eral datasets are possible, e.g ACM, IEEE Xplore, Microsoft Academic Research,CEUR-WS.org9. Citation information could also be gathered from search engineslike Google Scholar. Furthermore, the ranking studied in this paper is global rank-ing. It probably does not reflect the complete importance of a venue in a particularfield, especially in some more marginal disciplines such as computer graphics orbioinformatics. Therefore a deep analysis and ranking at the sub-discipline level is
9 http://sunsite.informatik.rwth-aachen.de/Publications/CEUR-WS/
necessary to gain an insight into a particular domain and to have a full evaluationof the impact of venues.
Acknowledgment
This work has been supported by the Graduiertenkolleg (GK) “Software for mobilecommunication system”, RWTH Aachen University, the BIT Research School byRWTH Aachen University and the University of Bonn, and the EU FP7 IP ROLE.We would like to thank our colleagues for the fruitful discussions.
References
1. 0002, J.H., Ertekin, S., Giles, C.L.: Efficient name disambiguation for large-scale databases.In: PKDD, pp. 536–544 (2006)
2. Bollen, J., Van de Sompel, H., Hagberg, A., Bettencourt, L., Chute, R., Ro-driguez, M.A., Balakireva, L.: Clickstream data yields high-resolution maps of sci-ence. PLoS ONE 4(3), e4803+ (2009). DOI 10.1371/journal.pone.0004803. URLhttp://dx.doi.org/10.1371/journal.pone.0004803
3. Bollen, J., de Sompel, H.V., Hagberg, A.A., Chute, R.: A principal component analysis of39 scientific impact measures. CoRR abs/0902.2183 (2009)
4. Boyack, K.W., Brner, K., Klavans, R.: Mapping the structure and evolution of chemistryresearch. In: In D. Torres-Salinas and H. Moed (Eds.), Proceedings of the 11th Interna-tional Conference of Scientometrics and Informetrics, p. 112123 (2007)
5. Boyack, K.W., Klavans, R., Borner, K.: Mapping the backbone of science. Sci-entometrics 64(3), 351–374 (2005). DOI 10.1007/s11192-005-0255-6. URLhttp://dx.doi.org/10.1007/s11192-005-0255-6
6. Brin, S., Page, L.: The anatomy of a large-scale hypertextual web search engine.Comput. Netw. ISDN Syst. 30(1-7), 107–117 (1998). DOI http://dx.doi.org/10.1016/S0169-7552(98)00110-X
7. Chen, J., Konstan, J.A.: Conference paper selectivity and impact. Commun.ACM 53, 79–83 (2009). DOI http://doi.acm.org/10.1145/1743546.1743569. URLhttp://doi.acm.org/10.1145/1743546.1743569
8. Clauset, A., Newman, M.E.J., Moore, C.: Finding community structure in very largenetworks. Physical Review E 70, 066,111 (2004). URL doi:10.1103/PhysRevE.70.066111
9. Coleman, J.S.: Social capital in the creation of human capital. The American Journal ofSociology 94, pp. S95–S120 (1988). URL http://www.jstor.org/stable/2780243
10. Ding, Y., Chowdhury, G., Foo, S.: Journal as markers of intellectual space: Journal co-citation analysis of information retrieval area. Scientometrics 47(1), 55–73 (2000)
11. Fortnow, L.: Viewpoint: Time for computer science to grow up. Commun.ACM 52, 33–35 (2009). DOI http://doi.acm.org/10.1145/1536616.1536631. URLhttp://doi.acm.org/10.1145/1536616.1536631
12. Freyne, J., Coyle, L., Smyth, B., Cunningham, P.: Relative status of journal and conferencepublications in computer science. Commun. ACM 53, 124–132 (2010). DOI http://doi.acm.org/10.1145/1839676.1839701. URL http://doi.acm.org/10.1145/1839676.1839701
13. Fruchterman, T.M.J., Reingold, E.M.: Graph drawing by force-directed placement. Softw.Pract. Exper. 21(11), 1129–1164 (1991). DOI http://dx.doi.org/10.1002/spe.4380211102
14. Gilbert, F., Simonetto, P., Zaidi, F., Jourdan, F., Bourqui, R.: Communities and hierarchi-cal structures in dynamic social networks: analysis and visualization. Social Network Anal-ysis and Mining pp. 1–13 (2010). URL http://dx.doi.org/10.1007/s13278-010-0002-8.10.1007/s13278-010-0002-8
15. Granovetter, M.: The Strength of Weak Ties: A Network Theory Revisited. SociologicalTheory 1, 201–233 (1983)
16. Han, H., Giles, C.L., Zha, H., Li, C., Tsioutsiouliklis, K.: Two supervised learning ap-proaches for name disambiguation in author citations. In: JCDL, pp. 296–305 (2004)
17. Hirsch, J.E.: An index to quantify an individual’s scientific research output. Proceedingsof the National Academy of Sciences 102(46), 16,569–16,572 (2005). DOI 10.1073/pnas.0507655102. URL http://dx.doi.org/10.1073/pnas.0507655102
18. Kienle, A., Wessner, M.: Our way to taipei: an analysis of the first tenyears of the cscl community. In: Proceedings of th 2005 conference on Com-puter support for collaborative learning: learning 2005: the next 10 years!, CSCL’05, pp. 262–271. International Society of the Learning Sciences (2005). URLhttp://portal.acm.org/citation.cfm?id=1149293.1149327
19. Kienle, A., Wessner, M.: Principles for cultivating scientific communities of prac-tice. In: P. Besselaar, G. Michelis, J. Preece, C. Simone (eds.) Communi-ties and Technologies 2005, pp. 283–299. Springer Netherlands (2005). URLhttp://dx.doi.org/10.1007/1-4020-3591-8_15
20. Kienle, A., Wessner, M.: Analysing and cultivating scientific communities of practice. Int.J. Web Based Communities 2, 377–393 (2006). DOI 10.1504/IJWBC.2006.011765. URLhttp://portal.acm.org/citation.cfm?id=1359102.1359103
21. Klavans, R., Boyack, K.W.: Identifying a better measure of relatedness for mapping sci-ence. J. Am. Soc. Inf. Sci. Technol. 57(2), 251–263 (2006). DOI http://dx.doi.org/10.1002/asi.v57
22. Kumar, M.: Evaluating Scientists: Citations, Impact Factor, h-Index, Online Page Hits andWhat Else? IETE Technical Review 26(3), 165–168 (2009). DOI 10.4103/0256-4602.50699
23. Lambiotte, R., Panzarasa, P.: Communities, knowledge creation, and information diffusion.Journal of Informetrics 3(3), 180 – 190 (2009). DOI DOI:10.1016/j.joi.2009.03.007. URLhttp://www.sciencedirect.com/science/article/B83WV-4W8TJP2-3/2/c82036ec7db02965d6ff85342d55236c.Science of Science: Conceptualizations and Models of Science
24. Lee, D., On, B.W., Kang, J., Park, S.: Effective and scalable solutions for mixed and splitcitation problems in digital libraries. In: IQIS, pp. 69–76 (2005)
25. Ley, M.: Dblp - some lessons learned. PVLDB 2(2), 1493–1500 (2009)26. Leydesdorff, L.: Clusters and maps of science journals based on bi-connected graphs
in the journal citation reports. Journal of Documentation 60(4), 317 (2004). URLhttp://www.citebase.org/abstract?id=oai:arXiv.org:0912.1221
27. Leydesdorff, L.: Top-down decomposition of the journal citation reportof the social sciencecitation index: Graph- and factor-analytical approaches. Scientometrics 60(2), 317 (2004).URL http://www.citebase.org/abstract?id=oai:arXiv.org:0912.1221
28. Leydesdorff, L.: Betweenness centrality as an indicator of the interdisciplinarity of scientificjournals. J. Am. Soc. Inf. Sci. Technol. 58(9), 1303–1319 (2007). DOI http://dx.doi.org/10.1002/asi.20614
29. Mani, D., Knoke, D.: On intersecting ground: the changing structure of us cor-porate networks. Social Network Analysis and Mining 1, 43–58 (2011). URLhttp://dx.doi.org/10.1007/s13278-010-0013-5. 10.1007/s13278-010-0013-5
30. McCain, K.W.: Neural networks research in context: A longitudinal journal cocitationanalysis of an emerging interdisciplinary field. Scientometrics 5(5), 389–410 (1998)
31. McCallum, A., Nigam, K., Ungar, L.H.: Efficient clustering of high-dimensional data setswith application to reference matching. In: KDD ’00: Proceedings of the sixth ACMSIGKDD International Conference on Knowledge Discovery and Data Mining, pp. 169–178. ACM, New York, NY, USA (2000). DOI http://doi.acm.org/10.1145/347090.347123
32. Meyer, B., Choppy, C., Staunstrup, J., van Leeuwen, J.: Viewpoint: Research evaluationfor computer science. Commun. ACM 52, 31–34 (2009). DOI http://doi.acm.org/10.1145/1498765.1498780. URL http://doi.acm.org/10.1145/1498765.1498780
33. Morris, T.A., McCain, K.W.: The structure of medical informatics journal literature. Jour-nal of the American Medical Informatics Association 5(5), 448–566 (1998)
34. Moya-Anegon, F., Vargas-Quesada, B., Herrero-Solana, V., Chinchilla-Rodrıguez, Z.,Corera-Alvarez, E., noz Fernandez, F.J.M.: A new technique for building maps of largescientific domains based on the co-citation of classes and categories. Scientometrics 61(1),129–145 (2004). URL http://eprints.rclis.org/10899/
35. Newman, M.E.J.: Fast algorithm for detecting community struc-ture in networks. Physical Review E 69, 066,133 (2004). URLhttp://www.citebase.org/abstract?id=oai:arXiv.org:cond-mat/0309508
36. Newman, M.E.J.: Modularity and community structure in networks.Proc.Natl.Acad.Sci.USA 103, 8577 (2006). URL doi:10.1073/pnas.0601602103
37. Newman, M.E.J., Girvan, M.: Finding and evaluating community struc-ture in networks. Physical Review E 69, 026,113 (2004). URLhttp://www.citebase.org/abstract?id=oai:arXiv.org:cond-mat/0308217
38. Pereira, D.A., Ribeiro-Neto, B.A., Ziviani, N., Laender, A.H.F., Goncalves, M.A., Ferreira,A.A.: Using web information for author name disambiguation. In: JCDL, pp. 49–58 (2009)
39. Pham, M., Klamma, R.: The structure of the computer science knowledge network. In:2010 International Conference on Advances in Social Networks Analysis and Mining(ASONAM), pp. 17 –24 (2010). DOI 10.1109/ASONAM.2010.58
40. Seglen, P.O.: Why the impact factor of journals should not be used for evaluating research.BMJ: British Medical Journal 314, 498–502 (1997)
41. Shi, X., Leskovec, J., McFarland, D.A.: Citing for high impact. In: Proceedings ofthe 10th annual joint conference on Digital libraries, JCDL ’10, pp. 49–58. ACM,New York, NY, USA (2010). DOI http://doi.acm.org/10.1145/1816123.1816131. URLhttp://doi.acm.org/10.1145/1816123.1816131
42. Staff, C.: Pay for editorial independence. Commun. ACM 52, 6–7 (2009). DOI http://doi.acm.org/10.1145/1592761.1592764. URL http://doi.acm.org/10.1145/1592761.1592764
43. Treeratpituk, P., Giles, C.L.: Disambiguating authors in academic publications using ran-dom forests. In: JCDL, pp. 39–48 (2009)
44. Tsay, M.Y., Xu, H., wen Wu, C.: Journal co-citation analysis of semiconductor literature.Scientometrics 57(1), 7–25 (2003)
45. Vardi, M.Y.: Conferences vs. journals in computing research. Commun. ACM52, 5–5 (2009). DOI http://doi.acm.org/10.1145/1506409.1506410. URLhttp://doi.acm.org/10.1145/1506409.1506410
46. Wasserman, S., Faust, K.: Social Network Analysis: Methods and Applications (Struc-tural Analysis in the Social Sciences). Cambridge University Press (1995). URLhttp://www.amazon.com/exec/obidos/redirect?tag=citeulike07-20&path=ASIN/0521382696
47. Zhuhadar, L., Nasraoui, O., Wyatt, R., Yang, R.: Visual knowledge representation ofconceptual semantic networks. Social Network Analysis and Mining pp. 1–11 (2010).URL http://dx.doi.org/10.1007/s13278-010-0008-2 . 10.1007/s13278-010-0008-2
Copyright © 2022 FDOKUMEN