Development of a new pulsed source for photoacoustic imaging based on aperiodically poled lithium...
6
Development of a new pulsed source for photoacoustic imaging based on aperiodically poled lithium niobate Diego Yankelevich, 1,3 J. E. González, 2 Roger S. Cudney, 2,* Luis A. Ríos, 2 and Laura Marcu 1 1 Department of Electrical and Computer Engineering, University of California, 3101 Kemper Hall, Davis, California, 95616, USA 2 Department of Optics, Centro de Investigación Científica y Educación Superior de Ensenada, Ensenada 22880, Mexico 3 Department of Biomedical Engineering, University of California, 451 Health Sciences Drive, Davis, California, 95616, USA * [email protected] Abstract: We present the development of a source of deep-red radiation for photoacoustic imaging. This source, which is based on two cascaded wavelength conversion processes in aperiodically poled lithium niobate, emits 10 nanosecond pulses of over 500 μJ at 710 nm. Photoacoustic images were obtained from phantoms designed to mimic the optical and acoustic properties of oral tissue. Results indicate this device is a viable source of optical pulses for photoacoustic applications. ©2014 Optical Society of America OCIS codes: (170.1065) Acousto-optics; (170.3880) Medical and biological imaging; (160.3730) Lithium niobate; (190.4223) Nonlinear wave mixing. References and links 1. L. Wang, V., Wu, H., Biomedical optics: principles and imaging (Wiley-Interscience, Hoboken, N.J., 2007). 2. S. Y. Emelianov, S. R. A. A. B. Karpiouk, S. Mallidi, S. Park, S. Sethuraman, J. Shah, R. W. Smalling, J. M. Rubin, and W. G. Scott, “Synergy and Applications of Combined Ultrasound, Elasticity, and Photoacoustic Imaging,” Proceedings of the 2006 Ultrasonics Symposium. 3. J. Kang, E.-K. Kim, J. Young Kwak, Y. Yoo, T.-K. Song, and J. Ho Chang, “Optimal laser wavelength for photoacoustic imaging of breast microcalcifications,” Appl. Phys. Lett. 99(15), 153702 (2011). 4. V. E. Gusev and A. A. Karabutov, Laser optoacoustics (American Institute of Physics, New York, 1993). 5. “American National Standard for the Safe Use Lasers in the Health Care Environment,” (Laser Institute of America ANSI Z136.3, 2007). 6. T. Kartaloglu, Z. G. Figen, and O. Aytur, “Simultaneous phase matching of optical parametric oscillation and second-harmonic generation in aperiodically poled lithium niobate,” J. Opt. Soc. Am. B 20(2), 343–350 (2003). 7. A. H. Norton and C. M. de Sterke, “Aperiodic 1-dimensional structures for quasi-phase matching,” Opt. Express 12(5), 841–846 (2004). 8. M. Robles-Agudo and R. S. Cudney, “Multiple wavelength generation using aperiodically poled lithium niobate,” Appl. Phys. B 103(1), 99–106 (2011). 9. D. H. Jundt, “Temperature-dependent Sellmeier equation for the index of refraction, n(e), in congruent lithium niobate,” Opt. Lett. 22(20), 1553–1555 (1997). 10. R. S. Cudney, L. A. Rios, M. J. O. Arellanes, F. Alonso, and J. Fonseca, “Fabrication of periodically polarised lithium niobate for nonlinear optics,” Rev. Mex. Fis. 48, 548–555 (2002). 11. J. M. Cannata, T. A. Ritter, W. H. Chen, R. H. Silverman, and K. K. Shung, “Design of efficient, broadband single-element (20-80 MHz) ultrasonic transducers for medical imaging applications,” IEEE Trans. Ultrason. Ferroelectr. Freq. Control 50(11), 1548–1557 (2003). 12. K. A. Snook, J. Z. Zhao, C. H. F. Alves, J. M. Cannata, W. H. Chen, R. J. Meyer, Jr., T. A. Ritter, and K. K. Shung, “Design, fabrication, and evaluation of high frequency, single-element transducers incorporating different materials,” IEEE Trans. Ultrason. Ferroelectr. Freq. Control 49(2), 169–176 (2002). 13. K. A. Snook, T. R. Shrout, and K. K. Shung, “Development of high frequency annular arrays for medical imaging,” 2003 IEEE Ultrasonics Symposium (IEEE Cat. No.03CH37476), 865–868 vol.861. 14. Y. Sun, J. Park, D. N. Stephens, J. A. Jo, L. Sun, J. M. Cannata, R. M. G. Saroufeem, K. K. Shung, and L. Marcu, “Development of a dual-modal tissue diagnostic system combining time-resolved fluorescence spectroscopy and ultrasonic backscatter microscopy,” Rev. Sci. Instrum. 80(6), 065104 (2009). 15. T. L. Szabo, Diagnostic Ultrasound Imaging (Elsevier Academic Press, Amsterdam; Boston, 2004). 16. R. Cubeddu, A. Pifferi, P. Taroni, A. Torricelli, and G. Valentini, “A solid tissue phantom for photon migration studies,” Phys. Med. Biol. 42(10), 1971–1979 (1997). #200788 - $15.00 USD Received 5 Nov 2013; revised 20 Dec 2013; accepted 7 Jan 2014; published 13 Jan 2014 (C) 2014 OSA 1 February 2014 | Vol. 5, No. 2 | DOI:10.1364/BOE.5.000468 | BIOMEDICAL OPTICS EXPRESS 468
-
Upload
independent -
Category
Documents
-
view
1 -
download
0
Transcript of Development of a new pulsed source for photoacoustic imaging based on aperiodically poled lithium...

Development of a new pulsed source for photoacoustic imaging based on aperiodically
poled lithium niobate Diego Yankelevich,1,3 J. E. González,2 Roger S. Cudney,2,* Luis A. Ríos,2
and Laura Marcu1 1Department of Electrical and Computer Engineering, University of California, 3101 Kemper Hall, Davis,
California, 95616, USA 2Department of Optics, Centro de Investigación Científica y Educación Superior de Ensenada, Ensenada 22880,
Mexico 3Department of Biomedical Engineering, University of California, 451 Health Sciences Drive, Davis, California,
95616, USA *[email protected]
Abstract: We present the development of a source of deep-red radiation for photoacoustic imaging. This source, which is based on two cascaded wavelength conversion processes in aperiodically poled lithium niobate, emits 10 nanosecond pulses of over 500 µJ at 710 nm. Photoacoustic images were obtained from phantoms designed to mimic the optical and acoustic properties of oral tissue. Results indicate this device is a viable source of optical pulses for photoacoustic applications.
©2014 Optical Society of America
OCIS codes: (170.1065) Acousto-optics; (170.3880) Medical and biological imaging; (160.3730) Lithium niobate; (190.4223) Nonlinear wave mixing.
References and links 1. L. Wang, V., Wu, H., Biomedical optics: principles and imaging (Wiley-Interscience, Hoboken, N.J., 2007). 2. S. Y. Emelianov, S. R. A. A. B. Karpiouk, S. Mallidi, S. Park, S. Sethuraman, J. Shah, R. W. Smalling, J. M.
Rubin, and W. G. Scott, “Synergy and Applications of Combined Ultrasound, Elasticity, and Photoacoustic Imaging,” Proceedings of the 2006 Ultrasonics Symposium.
3. J. Kang, E.-K. Kim, J. Young Kwak, Y. Yoo, T.-K. Song, and J. Ho Chang, “Optimal laser wavelength for photoacoustic imaging of breast microcalcifications,” Appl. Phys. Lett. 99(15), 153702 (2011).
4. V. E. Gusev and A. A. Karabutov, Laser optoacoustics (American Institute of Physics, New York, 1993). 5. “American National Standard for the Safe Use Lasers in the Health Care Environment,” (Laser Institute of
America ANSI Z136.3, 2007). 6. T. Kartaloglu, Z. G. Figen, and O. Aytur, “Simultaneous phase matching of optical parametric oscillation and
second-harmonic generation in aperiodically poled lithium niobate,” J. Opt. Soc. Am. B 20(2), 343–350 (2003). 7. A. H. Norton and C. M. de Sterke, “Aperiodic 1-dimensional structures for quasi-phase matching,” Opt. Express
12(5), 841–846 (2004). 8. M. Robles-Agudo and R. S. Cudney, “Multiple wavelength generation using aperiodically poled lithium
niobate,” Appl. Phys. B 103(1), 99–106 (2011). 9. D. H. Jundt, “Temperature-dependent Sellmeier equation for the index of refraction, n(e), in congruent lithium
niobate,” Opt. Lett. 22(20), 1553–1555 (1997). 10. R. S. Cudney, L. A. Rios, M. J. O. Arellanes, F. Alonso, and J. Fonseca, “Fabrication of periodically polarised
lithium niobate for nonlinear optics,” Rev. Mex. Fis. 48, 548–555 (2002). 11. J. M. Cannata, T. A. Ritter, W. H. Chen, R. H. Silverman, and K. K. Shung, “Design of efficient, broadband
single-element (20-80 MHz) ultrasonic transducers for medical imaging applications,” IEEE Trans. Ultrason. Ferroelectr. Freq. Control 50(11), 1548–1557 (2003).
12. K. A. Snook, J. Z. Zhao, C. H. F. Alves, J. M. Cannata, W. H. Chen, R. J. Meyer, Jr., T. A. Ritter, and K. K. Shung, “Design, fabrication, and evaluation of high frequency, single-element transducers incorporating different materials,” IEEE Trans. Ultrason. Ferroelectr. Freq. Control 49(2), 169–176 (2002).
13. K. A. Snook, T. R. Shrout, and K. K. Shung, “Development of high frequency annular arrays for medical imaging,” 2003 IEEE Ultrasonics Symposium (IEEE Cat. No.03CH37476), 865–868 vol.861.
14. Y. Sun, J. Park, D. N. Stephens, J. A. Jo, L. Sun, J. M. Cannata, R. M. G. Saroufeem, K. K. Shung, and L. Marcu, “Development of a dual-modal tissue diagnostic system combining time-resolved fluorescence spectroscopy and ultrasonic backscatter microscopy,” Rev. Sci. Instrum. 80(6), 065104 (2009).
15. T. L. Szabo, Diagnostic Ultrasound Imaging (Elsevier Academic Press, Amsterdam; Boston, 2004). 16. R. Cubeddu, A. Pifferi, P. Taroni, A. Torricelli, and G. Valentini, “A solid tissue phantom for photon migration
studies,” Phys. Med. Biol. 42(10), 1971–1979 (1997).
#200788 - $15.00 USD Received 5 Nov 2013; revised 20 Dec 2013; accepted 7 Jan 2014; published 13 Jan 2014(C) 2014 OSA 1 February 2014 | Vol. 5, No. 2 | DOI:10.1364/BOE.5.000468 | BIOMEDICAL OPTICS EXPRESS 468

17. R. C. Gonzalez and E. Woods Richard, Digital image processing (Prentice Hall, Upper Saddle River, N.J., 2008).
1. Introduction
Photoacoustic imaging (PAI) is a three-dimensional imaging technique based on the detection of acoustic waves induced in tissue by the absorption of an optical pulse. Optical radiation absorbed by a material is converted to heat that, in turn, creates a thermal expansion generating ultrasound waves detected by focused ultrasonic transducers [1]. The generation of a strong photoacoustic signal requires a high optical fluence at the area under analysis, which in turn requires low attenuation of the optical pulse from previously traversed layers. Blood (hemoglobin) absorbs strongly at wavelengths below 600 nm. However, the average optical penetration depth within the 600-1000 nm range is of the order of centimeters; therefore, this spectral range is suitable for photoacoustic imaging of tissue [2]. Experimental results previously reported [3] show that 710 nm is an optimal wavelength to construct PA images of microcalcifications in breast tissue. The optimal pulsewidth is determined mainly by the thermal relaxation time and the stress relaxation time. For efficient photoacoustic wave generation, heat diffusion has to be negligible during the excitation pulse, which limits the pulse width to ~0.5 μs. In addition, it must be shorter than the stress relaxation time; this limits the pulse width to less than 100 ns [4].
In view of the above discussion, the best source for photoacoustic imaging, particularly of microcalcifications, is a pulse with a wavelength between 600 to 800 nm and a pulse width below 100 ns. The optical pulse sources currently used for photoacoustic imaging are, for the most part, optical parametric oscillators/amplifiers (OPO/OPA) systems pumped by frequency-doubled flashlamp-pumped Nd:YAG lasers. However, since these systems have been designed for a wide range of applications, they are generally more complex and expensive than what is required for a PAI. Furthermore, ANSI Z136.6 dictates that the Maximum Permissible Exposure for skin at 710 nm is 20.9 mJ/cm2 [5]. In PA imaging systems where the beam is delivered by an optical fiber or is focused, it takes only a few hundred microjoules to reach this limit. Therefore, the pulses produced by these systems, which typically have an energy of the order of a few mJ, must be attenuated in order to be used on human beings; the excess energy is wasted.
Here we present a simple source of deep red, nanosecond pulses made specifically for PAI, based on two cascaded nonlinear wave conversion processes. Light is converted from 1064 nm to 710 nm by an OPO that uses a single aperiodically-poled crystal as both the optical parametric amplifier and wavelength converter. The crystal is designed such that it down-converts radiation at 1064 nm to twice this wavelength, 2128 nm, and simultaneously produces sum-frequency generation between the incident and down-converted wavelengths, the final result being nanosecond pulses at 710 nm with sufficient energy to obtain photoacoustic signals. In addition, using a tissue phantom designed to mimic the optical and acoustic properties of tissue, we demonstrate the ability of the source to generate images with a large signal-to-noise ratio.
2. Design of the source of radiation at 710 nm
We designed an aperiodically poled lithium niobate crystal (APLN) such that it could be used in an OPO at the degeneracy point, that is, the point where / 2s i pω ω ω= = , pω , sω and iω
being the pump, signal and idler frequencies, respectively. In addition, the crystal was also designed to obtain sum-frequency generation between the signal and the pump, obtaining a new wave with a frequency rω given by
3
.2r p s pω ω ω ω= + = (1)
#200788 - $15.00 USD Received 5 Nov 2013; revised 20 Dec 2013; accepted 7 Jan 2014; published 13 Jan 2014(C) 2014 OSA 1 February 2014 | Vol. 5, No. 2 | DOI:10.1364/BOE.5.000468 | BIOMEDICAL OPTICS EXPRESS 469

Assuming collinear propagation of the beams, the first process has a propagation constant mismatch OPOkΔ given by
2 ,OPO p sk k kΔ = − (2)
where pk and sk are the magnitudes of the wavevectors of the pump and signal beams,
respectively, given by /p p pk n cω= and /s s sk n cω= , where pn and sn are the refractive
indices of the pump and signal beams, respectively, and c is the speed of light. The mismatch
SFGkΔ of the second process is given by
,SFG r p sk k k kΔ = − − (3)
where /r r rk n cω= , rn being the refractive index at rω .
For a medium with a second order nonlinearity (2)χ , a frequency conversion process will
only occur efficiently if its associated mismatch kΔ is zero (phase-matching condition). Due to the dispersion of the refractive index, kΔ cannot be zero if all the beams have the same
polarization. However, for media with a spatially-varying (2)χ this restriction can be lifted,
provided it has a strong Fourier component at the appropriate spatial frequency kΔ , i.e., the
spatial variation of χ (2) z( ) must be chosen such that ( )(2) kχ Δ is large, where
( ) [ ](2) (2)
0
( ) exp .L
k z i kz dzχ χΔ = Δ (4)
Here L is the length of the nonlinear medium. In ferroelectric crystals, such as LiNbO3, the spatial variation of ( )(2) zχ is achieved by creating a 180° ferroelectric domain structure: the
sign of ( )(2) zχ follows the orientation of the spontaneous polarization, which rotates 180°
from one domain to another. If only one nonlinear process with an associated kΔ is desired,
then the common choice for ( )(2) zχ is simply a square wave with a spatial periodicity given
by 2 / kπΛ = Δ (first-order quasi-phase-matching). In our case we require the domain structure to have two strong components, one at OPOkΔ and another at SFGkΔ . To design our crystals we followed a procedure similar to those described in Refs [6–8]. First we define a function
( ) cos( ) (1 )cos( ),SFG OPOf z w k z w k z= Δ + − Δ (5)
where w is a weighting parameter used to adjust the importance of each of the Fourier components. We then apply a simple rule to determine the domain structure: if ( ) 0f z > , the spontaneous polarization must point in one direction, say the positive direction, while if
( ) 0f z < it must point in the opposite (negative) direction. By construction, the aperiodic domain structure designed this way contains the desired spatial frequencies.
In principle, all that is required to obtain radiation at 710 nm is a pump laser at 1064 nm and the aperiodic crystal described above. However, in order to enhance the conversion of the pump into the signal, the crystal is placed in a cavity consisting of two mirrors that have a high reflectivity at 2.1 µm and high transmission at 710 nm and 1.064 µm, effectively making an OPO that oscillates at 2.1 µm, as shown in Fig. 1.
#200788 - $15.00 USD Received 5 Nov 2013; revised 20 Dec 2013; accepted 7 Jan 2014; published 13 Jan 2014(C) 2014 OSA 1 February 2014 | Vol. 5, No. 2 | DOI:10.1364/BOE.5.000468 | BIOMEDICAL OPTICS EXPRESS 470

Fig. 1. Cascaded conversion from the pump wavelength (1.064 µm) to deep red (710 nm) using an APLN crystal. Vertical lines: aperiodic domain structure.
3. Experimental methods
We made several APLNs starting from single-domain, congruently-grown, 0.5 mm thick c-cut LiNbO3 wafers. Using the refractive index dispersion equation for LiNbO3 given in [9], we find that for 1064 nmpλ = , room temperature and extraordinary polarization, the periodicities
required are 31.7 µmOPOΛ = and 16.4 µmSFGΛ = . The domain structures were created using an electrical poling technique similar to those used by other research groups. The particular poling technique we used is described in detail in [10]. The samples were then polished and antireflection coated; all of the samples were approximately 34 mm long.
The experimental set-up to produce the red beam, excite and detect the photoacoustic waves is shown in Fig. 2. As a pump beam we used a flash-lamp pumped Nd:YAG laser adjusted to emit 12 ns (FWHM) pulses at a 10 Hz repetition rate. A half-wave plate and a polarizer were used to control the pulse energy and set the pump polarization parallel to the c-axis of the APLN (vertical polarization). In order to increase the pump energy without exceeding the damage threshold (~3 J/cm2) of the crystal while maintaining all of the beams within the 0.5 mm thick APLN sample, an elliptically shaped pump beam was used (~2 and ~0.2 mm along the horizontal and vertical directions, respectively). This asymmetric focusing was accomplished with a 400 mm focal length spherical lens and a 100 mm focal length cylindrical lens. The OPO resonator consisted of two concave (R = 100 mm) dielectric mirrors with high transmittance at 1064 and 710 nm (T>95%) and high reflectance at 2120 nm (R>99.5%), separated by approximately 58 mm with the APLN placed in the middle. We used two filters to allow only radiation at 710 nm beam to get through, a dielectric short-pass filter (Thorlabs FES0950) to block the remnant pump beam and a generic red filter to block the second harmonic of the pump that is also produced by the APLN crystal. The output coupler of the system also served as a filter to block the radiation at 2.12 µm. With this filtering more than 99% of the output corresponded to radiation centered at 710 nm.
Fig. 2. Experimental configuration for PA imaging using the APLN crystal.
The beam was launched into a multimode (600 µm, N.A. = 0.2) fiber; the output was passed through a ring ultrasonic transducer in order to make the region where the light pulse is emitted and where the acoustic wave is detected the same. The transducer - provided by the NIH Resource Center on Medical Ultrasonic Transducer Technology at USC - is a specialized high-frequency press focused transducer [11–13] with a single-element that can produce a spatial resolution of <0.1 mm with a depth sensitivity of > 4 mm [14]. Its main design parameters are the central frequency, the diameter and the focal length. For this study, we fixed the central frequency to 41 MHz where a good trade-off exists between spatial
#200788 - $15.00 USD Received 5 Nov 2013; revised 20 Dec 2013; accepted 7 Jan 2014; published 13 Jan 2014(C) 2014 OSA 1 February 2014 | Vol. 5, No. 2 | DOI:10.1364/BOE.5.000468 | BIOMEDICAL OPTICS EXPRESS 471
resolution and imaging depth [11, 15]. The diameter was kept at 3 mm to allow for a compact setup and the focal plane was ~6 mm from the transducer face. The transducer has a central circular aperture of radius 0.9 mm to accommodate a multimode optical fiber.
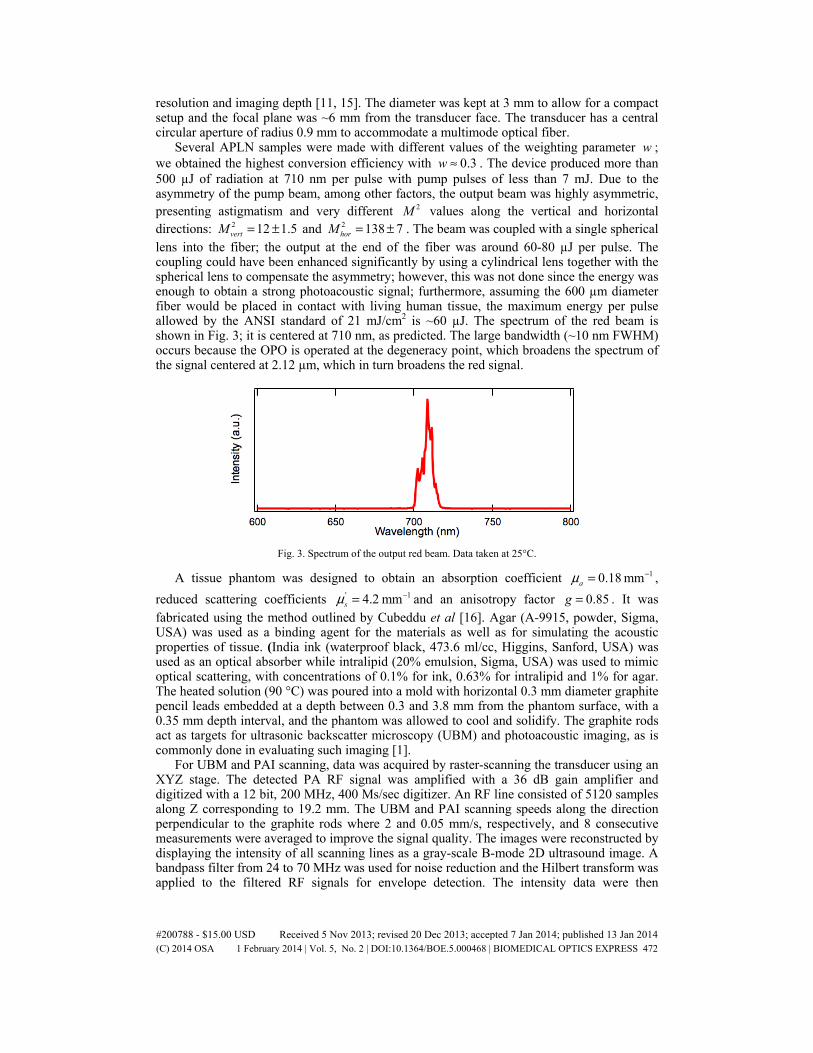
Several APLN samples were made with different values of the weighting parameter w ; we obtained the highest conversion efficiency with 0.3w ≈ . The device produced more than 500 µJ of radiation at 710 nm per pulse with pump pulses of less than 7 mJ. Due to the asymmetry of the pump beam, among other factors, the output beam was highly asymmetric, presenting astigmatism and very different 2M values along the vertical and horizontal directions: 2 12 1.5vertM = ± and 2 138 7horM = ± . The beam was coupled with a single spherical lens into the fiber; the output at the end of the fiber was around 60-80 µJ per pulse. The coupling could have been enhanced significantly by using a cylindrical lens together with the spherical lens to compensate the asymmetry; however, this was not done since the energy was enough to obtain a strong photoacoustic signal; furthermore, assuming the 600 µm diameter fiber would be placed in contact with living human tissue, the maximum energy per pulse allowed by the ANSI standard of 21 mJ/cm2 is ~60 µJ. The spectrum of the red beam is shown in Fig. 3; it is centered at 710 nm, as predicted. The large bandwidth (~10 nm FWHM) occurs because the OPO is operated at the degeneracy point, which broadens the spectrum of the signal centered at 2.12 µm, which in turn broadens the red signal.
Fig. 3. Spectrum of the output red beam. Data taken at 25°C.
A tissue phantom was designed to obtain an absorption coefficient 10.18 mmaμ −= ,
reduced scattering coefficients ' 14.2 mmsμ −= and an anisotropy factor 0.85g = . It was fabricated using the method outlined by Cubeddu et al [16]. Agar (A-9915, powder, Sigma, USA) was used as a binding agent for the materials as well as for simulating the acoustic properties of tissue. (India ink (waterproof black, 473.6 ml/cc, Higgins, Sanford, USA) was used as an optical absorber while intralipid (20% emulsion, Sigma, USA) was used to mimic optical scattering, with concentrations of 0.1% for ink, 0.63% for intralipid and 1% for agar. The heated solution (90 °C) was poured into a mold with horizontal 0.3 mm diameter graphite pencil leads embedded at a depth between 0.3 and 3.8 mm from the phantom surface, with a 0.35 mm depth interval, and the phantom was allowed to cool and solidify. The graphite rods act as targets for ultrasonic backscatter microscopy (UBM) and photoacoustic imaging, as is commonly done in evaluating such imaging [1].
For UBM and PAI scanning, data was acquired by raster-scanning the transducer using an XYZ stage. The detected PA RF signal was amplified with a 36 dB gain amplifier and digitized with a 12 bit, 200 MHz, 400 Ms/sec digitizer. An RF line consisted of 5120 samples along Z corresponding to 19.2 mm. The UBM and PAI scanning speeds along the direction perpendicular to the graphite rods where 2 and 0.05 mm/s, respectively, and 8 consecutive measurements were averaged to improve the signal quality. The images were reconstructed by displaying the intensity of all scanning lines as a gray-scale B-mode 2D ultrasound image. A bandpass filter from 24 to 70 MHz was used for noise reduction and the Hilbert transform was applied to the filtered RF signals for envelope detection. The intensity data were then
#200788 - $15.00 USD Received 5 Nov 2013; revised 20 Dec 2013; accepted 7 Jan 2014; published 13 Jan 2014(C) 2014 OSA 1 February 2014 | Vol. 5, No. 2 | DOI:10.1364/BOE.5.000468 | BIOMEDICAL OPTICS EXPRESS 472
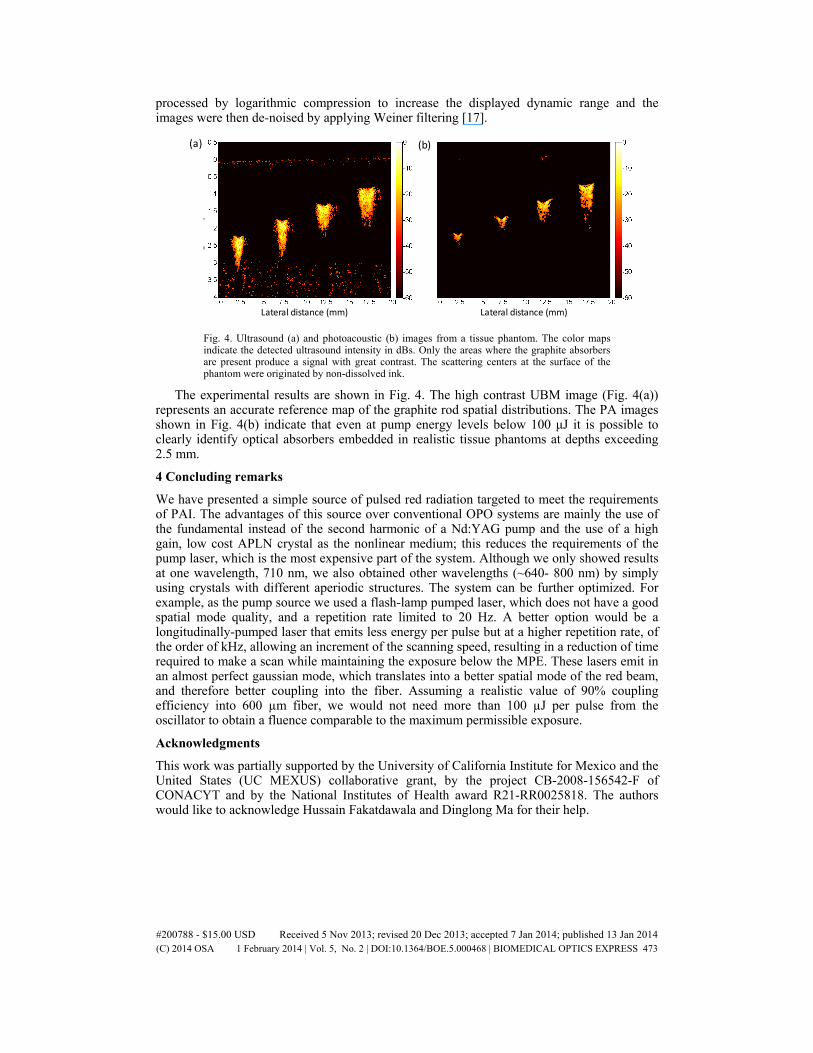
processed by logarithmic compression to increase the displayed dynamic range and the images were then de-noised by applying Weiner filtering [17].
(a) (b)
Lateral distance (mm) Lateral distance (mm)
Fig. 4. Ultrasound (a) and photoacoustic (b) images from a tissue phantom. The color maps indicate the detected ultrasound intensity in dBs. Only the areas where the graphite absorbers are present produce a signal with great contrast. The scattering centers at the surface of the phantom were originated by non-dissolved ink.
The experimental results are shown in Fig. 4. The high contrast UBM image (Fig. 4(a)) represents an accurate reference map of the graphite rod spatial distributions. The PA images shown in Fig. 4(b) indicate that even at pump energy levels below 100 μJ it is possible to clearly identify optical absorbers embedded in realistic tissue phantoms at depths exceeding 2.5 mm.
4 Concluding remarks
We have presented a simple source of pulsed red radiation targeted to meet the requirements of PAI. The advantages of this source over conventional OPO systems are mainly the use of the fundamental instead of the second harmonic of a Nd:YAG pump and the use of a high gain, low cost APLN crystal as the nonlinear medium; this reduces the requirements of the pump laser, which is the most expensive part of the system. Although we only showed results at one wavelength, 710 nm, we also obtained other wavelengths (~640- 800 nm) by simply using crystals with different aperiodic structures. The system can be further optimized. For example, as the pump source we used a flash-lamp pumped laser, which does not have a good spatial mode quality, and a repetition rate limited to 20 Hz. A better option would be a longitudinally-pumped laser that emits less energy per pulse but at a higher repetition rate, of the order of kHz, allowing an increment of the scanning speed, resulting in a reduction of time required to make a scan while maintaining the exposure below the MPE. These lasers emit in an almost perfect gaussian mode, which translates into a better spatial mode of the red beam, and therefore better coupling into the fiber. Assuming a realistic value of 90% coupling efficiency into 600 µm fiber, we would not need more than 100 µJ per pulse from the oscillator to obtain a fluence comparable to the maximum permissible exposure.
Acknowledgments
This work was partially supported by the University of California Institute for Mexico and the United States (UC MEXUS) collaborative grant, by the project CB-2008-156542-F of CONACYT and by the National Institutes of Health award R21-RR0025818. The authors would like to acknowledge Hussain Fakatdawala and Dinglong Ma for their help.
#200788 - $15.00 USD Received 5 Nov 2013; revised 20 Dec 2013; accepted 7 Jan 2014; published 13 Jan 2014(C) 2014 OSA 1 February 2014 | Vol. 5, No. 2 | DOI:10.1364/BOE.5.000468 | BIOMEDICAL OPTICS EXPRESS 473