Development of a measure model for optimal planning of maintenance and improvement of roads
9
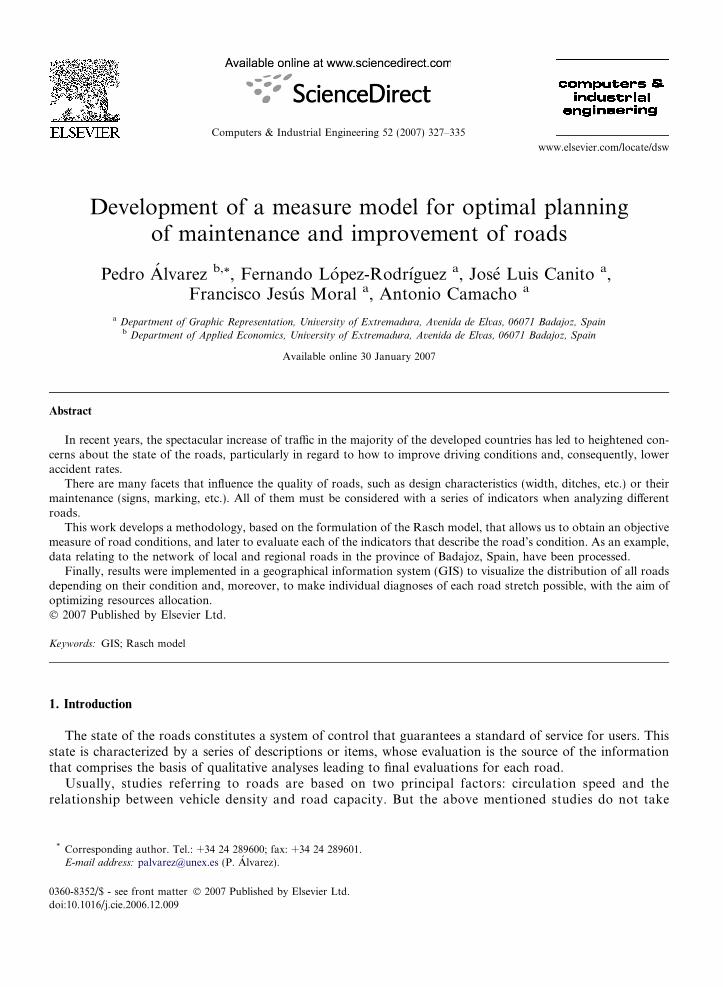
Development of a measure model for optimal planning of maintenance and improvement of roads Pedro A ´ lvarez b, * , Fernando Lo ´ pez-Rodrı ´guez a , Jose ´ Luis Canito a , Francisco Jesu ´s Moral a , Antonio Camacho a a Department of Graphic Representation, University of Extremadura, Avenida de Elvas, 06071 Badajoz, Spain b Department of Applied Economics, University of Extremadura, Avenida de Elvas, 06071 Badajoz, Spain Available online 30 January 2007 Abstract In recent years, the spectacular increase of traffic in the majority of the developed countries has led to heightened con- cerns about the state of the roads, particularly in regard to how to improve driving conditions and, consequently, lower accident rates. There are many facets that influence the quality of roads, such as design characteristics (width, ditches, etc.) or their maintenance (signs, marking, etc.). All of them must be considered with a series of indicators when analyzing different roads. This work develops a methodology, based on the formulation of the Rasch model, that allows us to obtain an objective measure of road conditions, and later to evaluate each of the indicators that describe the road’s condition. As an example, data relating to the network of local and regional roads in the province of Badajoz, Spain, have been processed. Finally, results were implemented in a geographical information system (GIS) to visualize the distribution of all roads depending on their condition and, moreover, to make individual diagnoses of each road stretch possible, with the aim of optimizing resources allocation. Ó 2007 Published by Elsevier Ltd. Keywords: GIS; Rasch model 1. Introduction The state of the roads constitutes a system of control that guarantees a standard of service for users. This state is characterized by a series of descriptions or items, whose evaluation is the source of the information that comprises the basis of qualitative analyses leading to final evaluations for each road. Usually, studies referring to roads are based on two principal factors: circulation speed and the relationship between vehicle density and road capacity. But the above mentioned studies do not take 0360-8352/$ - see front matter Ó 2007 Published by Elsevier Ltd. doi:10.1016/j.cie.2006.12.009 * Corresponding author. Tel.: +34 24 289600; fax: +34 24 289601. E-mail address: [email protected] (P. A ´ lvarez). Computers & Industrial Engineering 52 (2007) 327–335 www.elsevier.com/locate/dsw
-
Upload
independent -
Category
Documents
-
view
4 -
download
0
Transcript of Development of a measure model for optimal planning of maintenance and improvement of roads
Computers & Industrial Engineering 52 (2007) 327–335
www.elsevier.com/locate/dsw
Development of a measure model for optimal planningof maintenance and improvement of roads
Pedro Alvarez b,*, Fernando Lopez-Rodrıguez a, Jose Luis Canito a,Francisco Jesus Moral a, Antonio Camacho a
a Department of Graphic Representation, University of Extremadura, Avenida de Elvas, 06071 Badajoz, Spainb Department of Applied Economics, University of Extremadura, Avenida de Elvas, 06071 Badajoz, Spain
Available online 30 January 2007
Abstract
In recent years, the spectacular increase of traffic in the majority of the developed countries has led to heightened con-cerns about the state of the roads, particularly in regard to how to improve driving conditions and, consequently, loweraccident rates.
There are many facets that influence the quality of roads, such as design characteristics (width, ditches, etc.) or theirmaintenance (signs, marking, etc.). All of them must be considered with a series of indicators when analyzing differentroads.
This work develops a methodology, based on the formulation of the Rasch model, that allows us to obtain an objectivemeasure of road conditions, and later to evaluate each of the indicators that describe the road’s condition. As an example,data relating to the network of local and regional roads in the province of Badajoz, Spain, have been processed.
Finally, results were implemented in a geographical information system (GIS) to visualize the distribution of all roadsdepending on their condition and, moreover, to make individual diagnoses of each road stretch possible, with the aim ofoptimizing resources allocation.� 2007 Published by Elsevier Ltd.
Keywords: GIS; Rasch model
1. Introduction
The state of the roads constitutes a system of control that guarantees a standard of service for users. Thisstate is characterized by a series of descriptions or items, whose evaluation is the source of the informationthat comprises the basis of qualitative analyses leading to final evaluations for each road.
Usually, studies referring to roads are based on two principal factors: circulation speed and therelationship between vehicle density and road capacity. But the above mentioned studies do not take
0360-8352/$ - see front matter � 2007 Published by Elsevier Ltd.doi:10.1016/j.cie.2006.12.009
* Corresponding author. Tel.: +34 24 289600; fax: +34 24 289601.E-mail address: [email protected] (P. Alvarez).
328 P. �Alvarez et al. / Computers & Industrial Engineering 52 (2007) 327–335
into account items that reflect design (width, ditches, footpaths, etc.) or maintenance (markings, sign-posting, etc.), perhaps because these works are more orientated toward major roads or motorways,where these factors normally have less influence and, consequently, are never applied to regional orlocal roads, which form extensive networks, but are often seen as less important and, therefore, sub-ject to inferior investment per kilometre. A recent study carried out by the European Road Assess-ment Program, 2004, was much the same; it refers to roads within the European Union and utilizesthe risk ratio, which measures the probability of suffering a fatal accident or serious injury, dependingon the length of the road and the traffic density. From this ratio, the danger ranking of Europeanroads was obtained, and the necessity of investment in the most dangerous roads was established.The variables or factors that could make these roads safer or diminish the danger ratio, however, werenot determined.
There are other studies where more items are employed. For example, the Department of Roads of theAutonomous Community of Madrid, Spain, (Jarillo & Garcıa-Martın, 2002) conducted a work which useddomiciliary surveys supported by route surveys. The analysis of items, such as route, road surface condition,the containment system, signalling, and lighting, all of which relate to the state of the road, and other com-plementary factors, such as traffic flow, is the basis for determining the Road Service Quality Index, whichmeasures user satisfaction. This study has a certain similarity with the present work, though its item evaluation
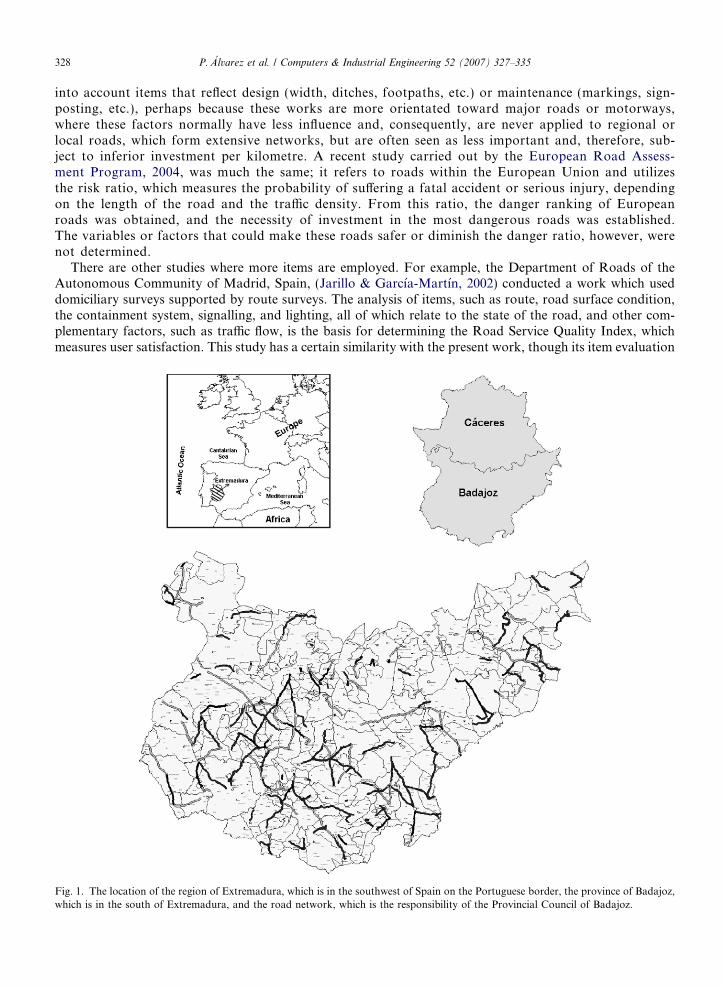
Fig. 1. The location of the region of Extremadura, which is in the southwest of Spain on the Portuguese border, the province of Badajoz,which is in the south of Extremadura, and the road network, which is the responsibility of the Provincial Council of Badajoz.
P. �Alvarez et al. / Computers & Industrial Engineering 52 (2007) 327–335 329
system differs. In this case study, all items were measured or estimated by technical personnel with broad expe-rience in the field.
The road surface evaluation proposed by Rico et al. (2002) considers one-km road stretches to improve thePavement Administration System, SIMAP, of the Mexican Institute of Transport, with the addition of frictionmodules and the introduction of conservation projects and cost studies. However, they only consider periodicmaintenance and reconstruction and do not establish service or quality levels.
In this work, the proposed measure model was generated from data collected by experts of the Road Serviceof the Provincial Council of Badajoz, Spain (Fig. 1). Thus, evaluation of the items was conducted by technicalpersonnel who are experts in road conditions, rather than based on users’ appraisals, ensuring the quality ofthe evaluation. These personnel measured items in a global manner and highlighted those that have to beaddressed in order to improve driving conditions, providing a basis for decision making with the aim of dis-tributing resources for road maintenance.
The valuation allowed us to establish comparisons between roads and determine those faults capable ofbeing corrected in order to reduce the danger index and the accident rate. The present work develops a meth-odology to obtain the final valuation as a measure of the road state in terms of a series of established items.The information was finally analyzed in a GIS in order to enhance the data to enable suitable analysis of theroad qualities.
2. Methods
2.1. The database
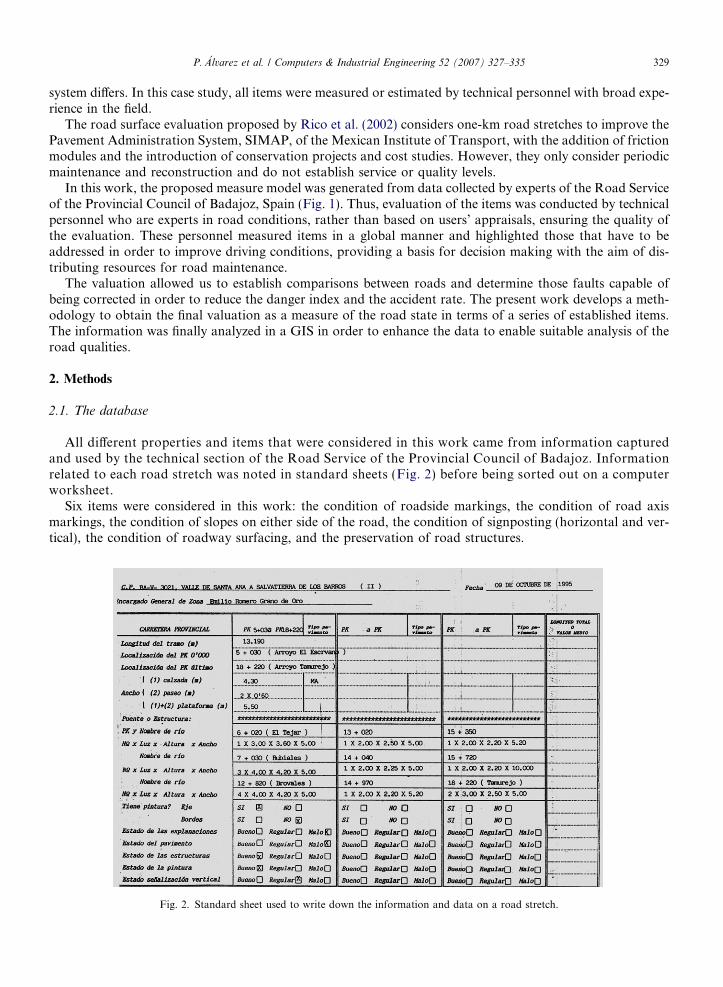
All different properties and items that were considered in this work came from information capturedand used by the technical section of the Road Service of the Provincial Council of Badajoz. Informationrelated to each road stretch was noted in standard sheets (Fig. 2) before being sorted out on a computerworksheet.
Six items were considered in this work: the condition of roadside markings, the condition of road axismarkings, the condition of slopes on either side of the road, the condition of signposting (horizontal and ver-tical), the condition of roadway surfacing, and the preservation of road structures.
Fig. 2. Standard sheet used to write down the information and data on a road stretch.
330 P. �Alvarez et al. / Computers & Industrial Engineering 52 (2007) 327–335
All roads were classified into sections and the condition of each one was evaluated for the items previouslymentioned. Thus, different rankings were obtained, depending on the item that was considered.
With the aim of obtaining only one ranking that synthesizes all individual items, the set of rankings givenby each item are unified into a single measure using a method based on the Rasch model as the instrument ofmeasurement (Canito, 2004; Tristan, 2002).
2.2. The Rasch Model
Let bn be the different road stretches in the province of Badajoz where the items di are determined. Wedefine a latent variable, road condition, which is designated Xni, with n referring to the road stretches and i
to the items. For instance, X75,3 means the determination of item 3 (the condition of roadway surfacing) atroad stretch 75 (Reina-Guadalcanal).
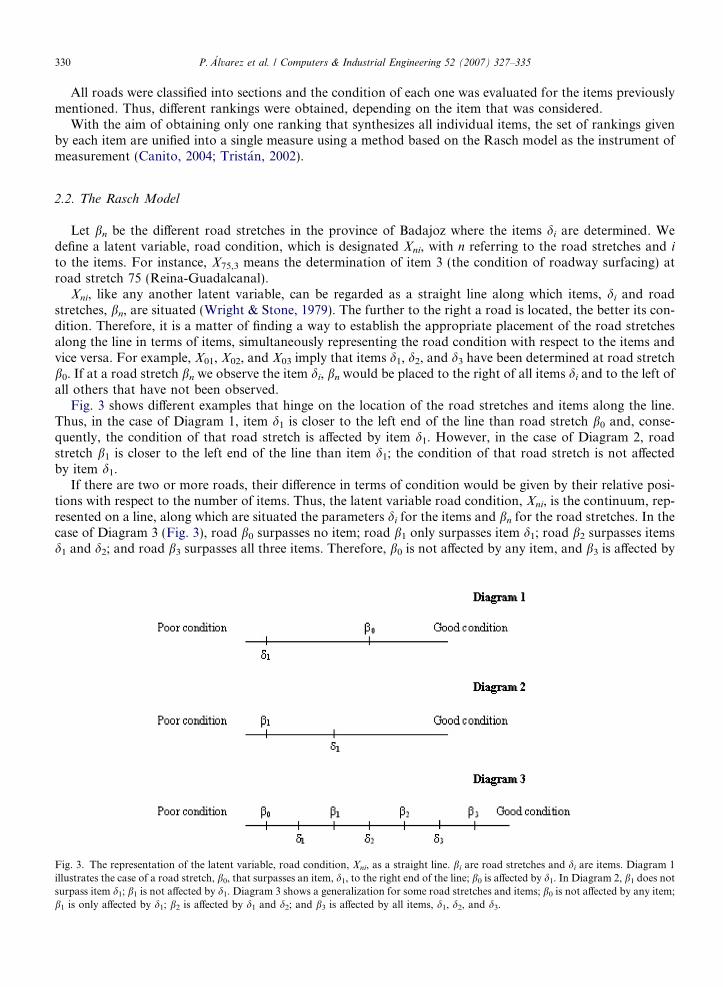
Xni, like any another latent variable, can be regarded as a straight line along which items, di and roadstretches, bn, are situated (Wright & Stone, 1979). The further to the right a road is located, the better its con-dition. Therefore, it is a matter of finding a way to establish the appropriate placement of the road stretchesalong the line in terms of items, simultaneously representing the road condition with respect to the items andvice versa. For example, X01, X02, and X03 imply that items d1, d2, and d3 have been determined at road stretchb0. If at a road stretch bn we observe the item di, bn would be placed to the right of all items di and to the left ofall others that have not been observed.
Fig. 3 shows different examples that hinge on the location of the road stretches and items along the line.Thus, in the case of Diagram 1, item d1 is closer to the left end of the line than road stretch b0 and, conse-quently, the condition of that road stretch is affected by item d1. However, in the case of Diagram 2, roadstretch b1 is closer to the left end of the line than item d1; the condition of that road stretch is not affectedby item d1.
If there are two or more roads, their difference in terms of condition would be given by their relative posi-tions with respect to the number of items. Thus, the latent variable road condition, Xni, is the continuum, rep-resented on a line, along which are situated the parameters di for the items and bn for the road stretches. In thecase of Diagram 3 (Fig. 3), road b0 surpasses no item; road b1 only surpasses item d1; road b2 surpasses itemsd1 and d2; and road b3 surpasses all three items. Therefore, b0 is not affected by any item, and b3 is affected by
Fig. 3. The representation of the latent variable, road condition, Xni, as a straight line. bi are road stretches and di are items. Diagram 1illustrates the case of a road stretch, b0, that surpasses an item, d1, to the right end of the line; b0 is affected by d1. In Diagram 2, b1 does notsurpass item d1; b1 is not affected by d1. Diagram 3 shows a generalization for some road stretches and items; b0 is not affected by any item;b1 is only affected by d1; b2 is affected by d1 and d2; and b3 is affected by all items, d1, d2, and d3.
P. �Alvarez et al. / Computers & Industrial Engineering 52 (2007) 327–335 331
all. Item d1 is that of the lowest measure and represents an item that affects the road stretches b1, b2, and b3.Item d3 is that of the highest measure (it is furthest to the right), and represents the least frequently reachedcondition since it only affects the road b3. In this case, b3 is the road stretch with the best condition because itis affected by all items, and, on the other hand, b0 is the road stretch with the worst condition since it is notaffected by any item.
Consider the dichotomous variable road condition, Xni, which describes the fact that a road stretch, bn, isaffected by the item di. If Xni = 1, then the road bn is said to be affected by that item, di, and if Xni = 0, thenroad stretch bn is said not to be affected by that item. One way of relating the positions of the road stretch andof the item with the dichotomous variable in terms of probability is (Alvarez & Pulgarın, 1996):
If (bn � di) > 0, this means that bn is on the right of di and the probability that the road stretch bn is affectedby the item di is higher than 0.5.
If (bn � di) < 0, this means that bn is on the left of di and the probability that the road stretch bn is affectedby the item di is lower than 0.5.
If bn = di, this means that bn and di coincide and the probability that the road stretch bn is affected by theitem di is 0.5, that is,
If ðbn � diÞ > 0; then P ½X ni ¼ 1� > 0:5 ð1ÞIf ðbn � diÞ < 0; then P ½X ni ¼ 1� < 0:5 ð2ÞIf bn ¼ di; then P ½X ni ¼ 1� ¼ 0:5: ð3Þ
The difference (bn � di) can range from �1 to +1, and the probability from 0 to 1, i.e.,
0 6 P ½X ni ¼ 1� 6 1 ð4Þ�1 6 ðbn � diÞ 6 þ1: ð5Þ
If we use the difference as an exponent of e, then
0 6 eðbn�diÞ6 þ1: ð6Þ
With a further adjustment, we can bring the expression into the interval from zero to one:
0 6eðbn�diÞ
1þ eðbn�diÞ
� �6 1: ð7Þ
The relationship can be written as (Rasch, 1980):
P ½X ni ¼ 1; bn; di� ¼eðbn�diÞ
1þ eðbn�diÞ; ð8Þ
which is the probability that road n is affected by the item i, given the parameters bn and di. This is GeorgRasch’s formulation of his development of latent trait theory.
The complementary probability for Xni = 0 is:
P ½X ni ¼ 0; bn; di� ¼ 1� P ½X ni ¼ 1; bn; di� ¼ 1� eðbn�diÞ
1þ eðbn�diÞ¼ 1
1þ eðbn�diÞ: ð9Þ
2.3. Data treatment
In order to analyse the information gathered in the database, corresponding to each of the items indicatedin Section 2.1, diverse computer packages were used.
Winsteps 3.35 computer program was employed to conduct the formulation of the Rasch model. Resultantinformation from that model, as well as all information relative to each of the road stretches, was implementedin GIS software – concretely in ArcGISd (version 8.3). Different maps were produced with the ArcMapd mod-ule of the ArcGISd.
332 P. �Alvarez et al. / Computers & Industrial Engineering 52 (2007) 327–335
3. Results and discussion
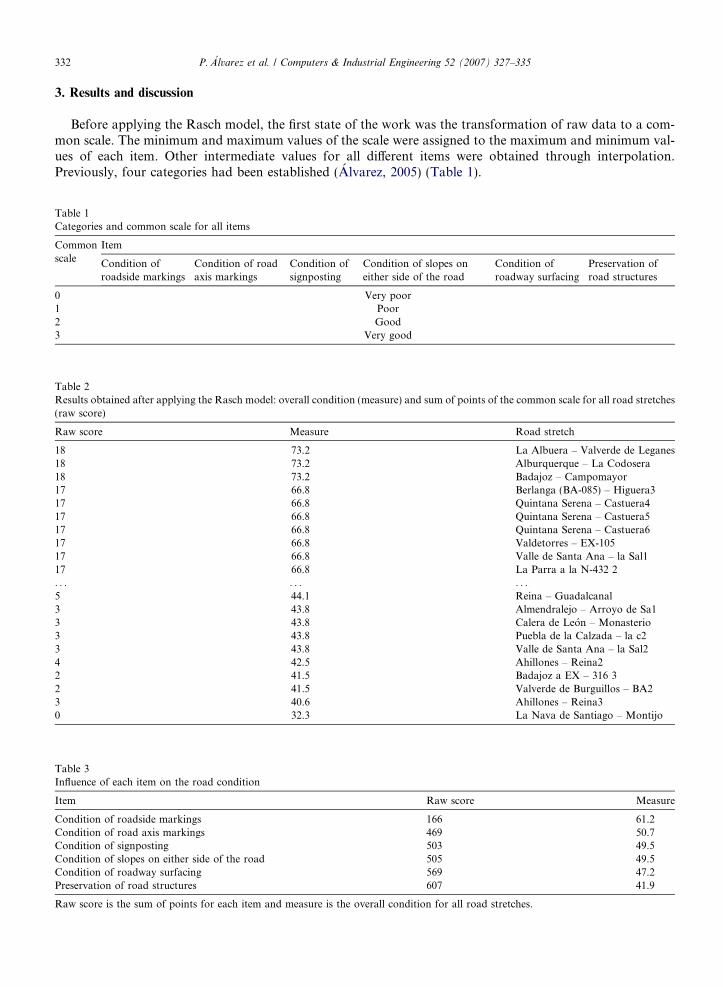
Before applying the Rasch model, the first state of the work was the transformation of raw data to a com-mon scale. The minimum and maximum values of the scale were assigned to the maximum and minimum val-ues of each item. Other intermediate values for all different items were obtained through interpolation.Previously, four categories had been established (Alvarez, 2005) (Table 1).
Table 1Categories and common scale for all items
Commonscale
Item
Condition ofroadside markings
Condition of roadaxis markings
Condition ofsignposting
Condition of slopes oneither side of the road
Condition ofroadway surfacing
Preservation ofroad structures
0 Very poor1 Poor2 Good3 Very good
Table 2Results obtained after applying the Rasch model: overall condition (measure) and sum of points of the common scale for all road stretches(raw score)
Raw score Measure Road stretch
18 73.2 La Albuera – Valverde de Leganes18 73.2 Alburquerque – La Codosera18 73.2 Badajoz – Campomayor17 66.8 Berlanga (BA-085) – Higuera317 66.8 Quintana Serena – Castuera417 66.8 Quintana Serena – Castuera517 66.8 Quintana Serena – Castuera617 66.8 Valdetorres – EX-10517 66.8 Valle de Santa Ana – la Sal117 66.8 La Parra a la N-432 2. . . . . . . . .
5 44.1 Reina – Guadalcanal3 43.8 Almendralejo – Arroyo de Sa13 43.8 Calera de Leon – Monasterio3 43.8 Puebla de la Calzada – la c23 43.8 Valle de Santa Ana – la Sal24 42.5 Ahillones – Reina22 41.5 Badajoz a EX – 316 32 41.5 Valverde de Burguillos – BA23 40.6 Ahillones – Reina30 32.3 La Nava de Santiago – Montijo
Table 3Influence of each item on the road condition
Item Raw score Measure
Condition of roadside markings 166 61.2Condition of road axis markings 469 50.7Condition of signposting 503 49.5Condition of slopes on either side of the road 505 49.5Condition of roadway surfacing 569 47.2Preservation of road structures 607 41.9
Raw score is the sum of points for each item and measure is the overall condition for all road stretches.
P. �Alvarez et al. / Computers & Industrial Engineering 52 (2007) 327–335 333
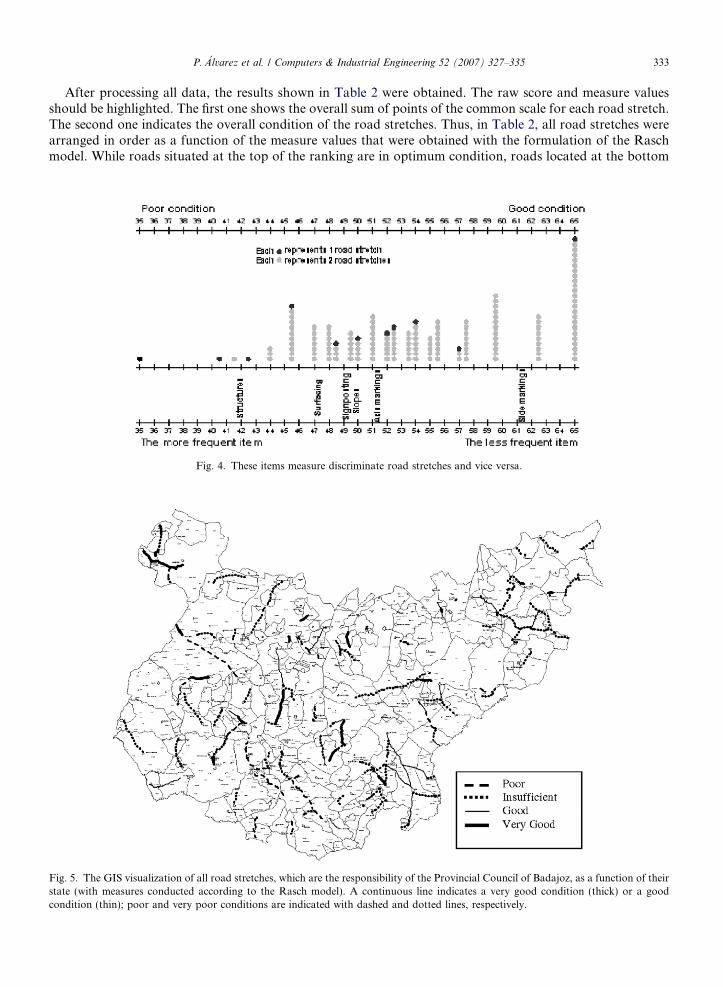
After processing all data, the results shown in Table 2 were obtained. The raw score and measure valuesshould be highlighted. The first one shows the overall sum of points of the common scale for each road stretch.The second one indicates the overall condition of the road stretches. Thus, in Table 2, all road stretches werearranged in order as a function of the measure values that were obtained with the formulation of the Raschmodel. While roads situated at the top of the ranking are in optimum condition, roads located at the bottom
Fig. 4. These items measure discriminate road stretches and vice versa.
Fig. 5. The GIS visualization of all road stretches, which are the responsibility of the Provincial Council of Badajoz, as a function of theirstate (with measures conducted according to the Rasch model). A continuous line indicates a very good condition (thick) or a goodcondition (thin); poor and very poor conditions are indicated with dashed and dotted lines, respectively.
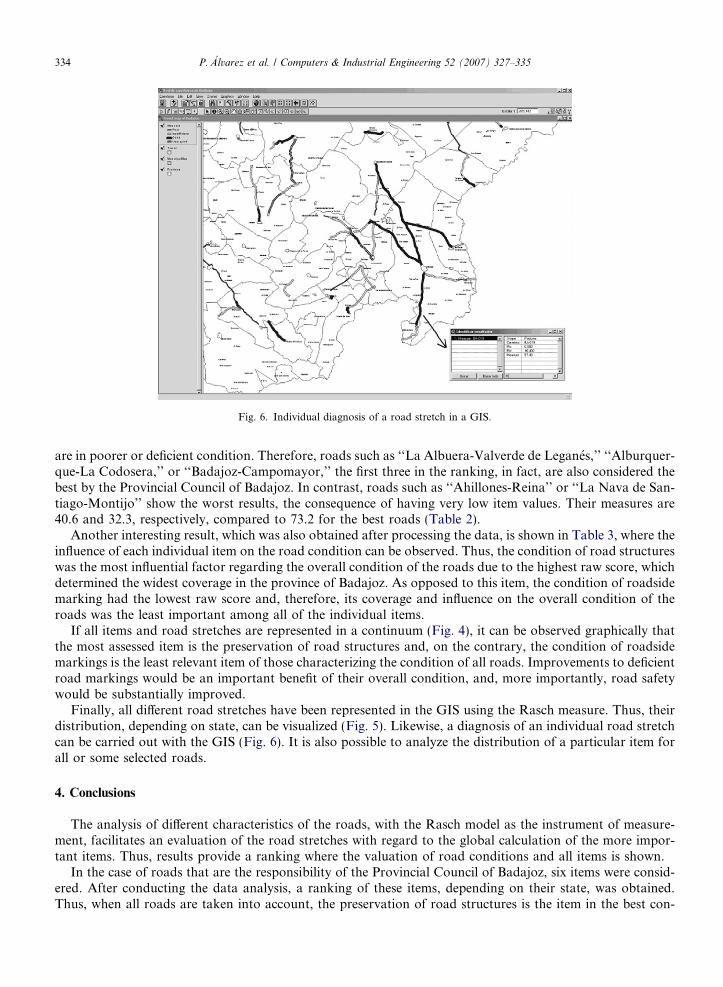
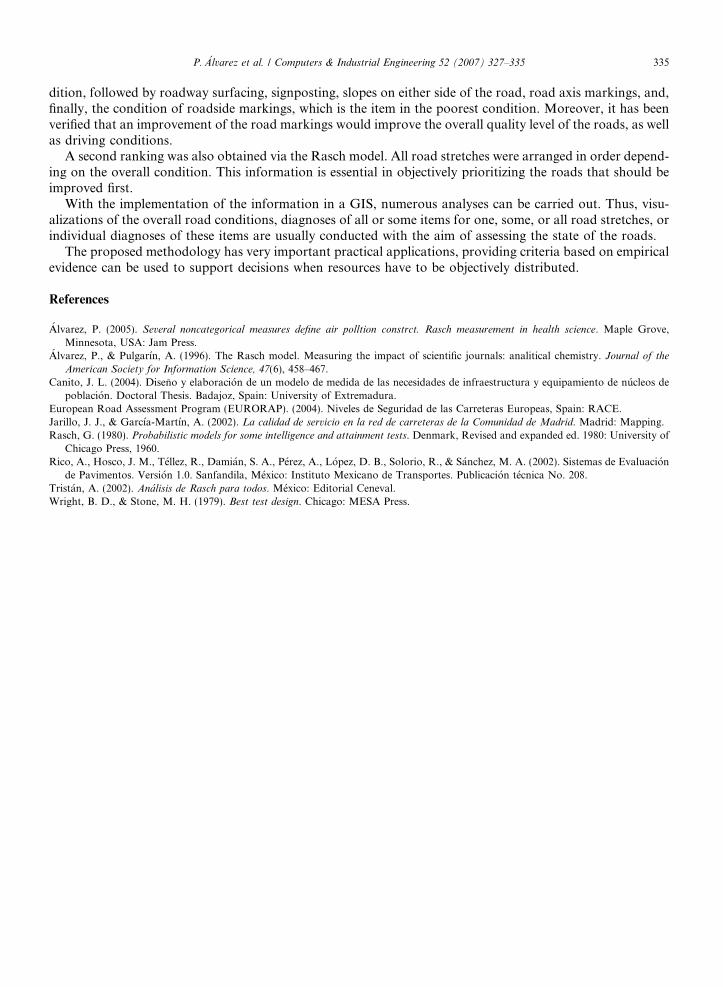
Fig. 6. Individual diagnosis of a road stretch in a GIS.
334 P. �Alvarez et al. / Computers & Industrial Engineering 52 (2007) 327–335
are in poorer or deficient condition. Therefore, roads such as ‘‘La Albuera-Valverde de Leganes,’’ ‘‘Alburquer-que-La Codosera,’’ or ‘‘Badajoz-Campomayor,’’ the first three in the ranking, in fact, are also considered thebest by the Provincial Council of Badajoz. In contrast, roads such as ‘‘Ahillones-Reina’’ or ‘‘La Nava de San-tiago-Montijo’’ show the worst results, the consequence of having very low item values. Their measures are40.6 and 32.3, respectively, compared to 73.2 for the best roads (Table 2).
Another interesting result, which was also obtained after processing the data, is shown in Table 3, where theinfluence of each individual item on the road condition can be observed. Thus, the condition of road structureswas the most influential factor regarding the overall condition of the roads due to the highest raw score, whichdetermined the widest coverage in the province of Badajoz. As opposed to this item, the condition of roadsidemarking had the lowest raw score and, therefore, its coverage and influence on the overall condition of theroads was the least important among all of the individual items.
If all items and road stretches are represented in a continuum (Fig. 4), it can be observed graphically thatthe most assessed item is the preservation of road structures and, on the contrary, the condition of roadsidemarkings is the least relevant item of those characterizing the condition of all roads. Improvements to deficientroad markings would be an important benefit of their overall condition, and, more importantly, road safetywould be substantially improved.
Finally, all different road stretches have been represented in the GIS using the Rasch measure. Thus, theirdistribution, depending on state, can be visualized (Fig. 5). Likewise, a diagnosis of an individual road stretchcan be carried out with the GIS (Fig. 6). It is also possible to analyze the distribution of a particular item forall or some selected roads.
4. Conclusions
The analysis of different characteristics of the roads, with the Rasch model as the instrument of measure-ment, facilitates an evaluation of the road stretches with regard to the global calculation of the more impor-tant items. Thus, results provide a ranking where the valuation of road conditions and all items is shown.
In the case of roads that are the responsibility of the Provincial Council of Badajoz, six items were consid-ered. After conducting the data analysis, a ranking of these items, depending on their state, was obtained.Thus, when all roads are taken into account, the preservation of road structures is the item in the best con-
P. �Alvarez et al. / Computers & Industrial Engineering 52 (2007) 327–335 335
dition, followed by roadway surfacing, signposting, slopes on either side of the road, road axis markings, and,finally, the condition of roadside markings, which is the item in the poorest condition. Moreover, it has beenverified that an improvement of the road markings would improve the overall quality level of the roads, as wellas driving conditions.
A second ranking was also obtained via the Rasch model. All road stretches were arranged in order depend-ing on the overall condition. This information is essential in objectively prioritizing the roads that should beimproved first.
With the implementation of the information in a GIS, numerous analyses can be carried out. Thus, visu-alizations of the overall road conditions, diagnoses of all or some items for one, some, or all road stretches, orindividual diagnoses of these items are usually conducted with the aim of assessing the state of the roads.
The proposed methodology has very important practical applications, providing criteria based on empiricalevidence can be used to support decisions when resources have to be objectively distributed.
References
Alvarez, P. (2005). Several noncategorical measures define air polltion constrct. Rasch measurement in health science. Maple Grove,Minnesota, USA: Jam Press.
Alvarez, P., & Pulgarın, A. (1996). The Rasch model. Measuring the impact of scientific journals: analitical chemistry. Journal of the
American Society for Information Science, 47(6), 458–467.Canito, J. L. (2004). Diseno y elaboracion de un modelo de medida de las necesidades de infraestructura y equipamiento de nucleos de
poblacion. Doctoral Thesis. Badajoz, Spain: University of Extremadura.European Road Assessment Program (EURORAP). (2004). Niveles de Seguridad de las Carreteras Europeas, Spain: RACE.Jarillo, J. J., & Garcıa-Martın, A. (2002). La calidad de servicio en la red de carreteras de la Comunidad de Madrid. Madrid: Mapping.Rasch, G. (1980). Probabilistic models for some intelligence and attainment tests. Denmark, Revised and expanded ed. 1980: University of
Chicago Press, 1960.Rico, A., Hosco, J. M., Tellez, R., Damian, S. A., Perez, A., Lopez, D. B., Solorio, R., & Sanchez, M. A. (2002). Sistemas de Evaluacion
de Pavimentos. Version 1.0. Sanfandila, Mexico: Instituto Mexicano de Transportes. Publicacion tecnica No. 208.Tristan, A. (2002). Analisis de Rasch para todos. Mexico: Editorial Ceneval.Wright, B. D., & Stone, M. H. (1979). Best test design. Chicago: MESA Press.