Development of a dairy cattle drinking water quality index (DCWQI) based on fuzzy inference systems
10
Ecological Indicators 20 (2012) 228–237 Contents lists available at SciVerse ScienceDirect Ecological Indicators jo ur n al homep ag e: www.elsevier.com/locate/ecolind Development of a dairy cattle drinking water quality index (DCWQI) based on fuzzy inference systems Hamed Gharibi a , Mohammad Hossein Sowlat b , Amir Hossein Mahvi a,c,∗ , Homayoun Mahmoudzadeh d , Hossein Arabalibeik e , Morteza Keshavarz f , Narges Karimzadeh f , Ghasem Hassani a a Department of Environmental Health Engineering, School of Public Health, Tehran university of Medical Sciences, Enghelab St., Tehran, Iran b Young Researchers Club, Medical Branch, Islamic Azad University, Tehran, Iran c National Institute of Health Research, Tehran University of Medical Sciences, Tehran, Iran d Department of Animal and Poultry Health and Nutrition, Faculty of Veterinary Medicine, University of Tehran, Enghelab St., Tehran, Iran e Research Center for Science and Technology in Medicine (RCSTIM), Tehran University of Medical Sciences, Keshavarz Boulevard, Tehran, Iran f Department of Environment and Energy, Science and Research Branch, Islamic Azad University, Tehran, Iran a r t i c l e i n f o Article history: Received 1 April 2011 Received in revised form 10 February 2012 Accepted 14 February 2012 Keywords: Fuzzy logic Fuzzy inference system Water quality index Livestock Karun River a b s t r a c t The critical role of water quality for all animals, and especially dairy cattle, the dairy products of which are consumed by humans, raises the need for an index which represents well the quality of water consumed by dairy cattle. Noting the high subjectivity and inappropriate classifications that traditional methods apply to development an index, we aimed to develop a better index that measures the quality of drinking water supplied to dairy cattle (DCWQI 1 ) based on fuzzy logic. Using fuzzy logic enabled us to capture experts’ knowledge and to simulate the human’s way of thinking in the design of the index. Our approach avoided the shortcomings of the previous models. We selected 20 parameters that available literature determined were critical to assessing the quality of water for dairy cattle to drink due mainly to their potential impacts both on dairy cattle and human health. These parameters were: dissolved oxygen (DO), biochemical oxygen demand (BOD), pH, temperature, total dissolved solids (TDS), turbidity, fecal coliform, heterotrophic plate count, hardness, alkalinity, arsenic, lead, mercury, nickel, cadmium, chromium, total phosphorous, H 2 S, nitrate, and fluoride. We used trapezoidal membership functions and the final ruleset consisted of 550 rules. Mamdani inference system captured experts’ knowledge and experience; center- of-gravity method was used to defuzzify the results. To evaluate the index performance, we conducted a case study of Karun River employing the water quality data from six sampling stations along the river over the period of 2007–2010 and compared the results to those from the National Sanitation Foundation (NSF) water quality index (WQI). Our study found that the water quality of Karun River lies in the low to medium range (annual mean index values of 38–55). In addition, the values from the fuzzy DCWQI were generally lower than the values from the NSF WQI, mainly because the DCWQI included heavy metals in its index, while the NSF WQI did not. Results of the present study suggest that DCWQI can be considered as a comprehensive tool for assessing the quality of water for dairy cattle drinking purposes and can be reliably used for that objective. © 2012 Elsevier Ltd. All rights reserved. 1. Introduction Water has the top priority for livestock because it constitutes a major part of the molecules in their body. In addition, water is ∗ Corresponding author at: Department of Environmental Health Engineering, School of Public Health, Tehran University of Medical Sciences, Enghelab St., Tehran, Iran. Tel.: +98 21 889 549 14; fax: +98 21 889 501 88. E-mail addresses: [email protected] (H. Gharibi), [email protected] (M.H. Sowlat), [email protected] (A.H. Mahvi), [email protected] (H. Mahmoudzadeh), [email protected] (H. Arabalibeik), [email protected] (M. Keshavarz), [email protected] (N. Karimzadeh), hassani [email protected] (G. Hassani). 1 dairy cattle water quality index (DCWQI). vital for all of livestock’s life’s processes, including growth, lacta- tion, reproduction, and cushioning their nervous system. A variety of other functions have also been documented in the literature (Beede, 2005; NRC, 2001; Murphy, 1992). Among all livestock, lac- tating dairy cattle have the greatest need for water, since water comprises the major portion of their body (56–81%); furthermore, the main portion of cow’s milk (87%) consists of water as well (Murphy, 1992). Lactating dairy cattle require large amounts of water, roughly 100 L every day (Kramer et al., 2008). Therefore, it is essential to provide adequate drinking water for dairy cattle. In addition to the quantity of water that dairy cattle need, the quality of their drinking water is also important, because it affects the productivity and health of dairy cattle, and has implications for their water intake (NRC, 2001). The quality of drinking water 1470-160X/$ – see front matter © 2012 Elsevier Ltd. All rights reserved. doi:10.1016/j.ecolind.2012.02.015
-
Upload
universitytehran -
Category
Documents
-
view
1 -
download
0
Transcript of Development of a dairy cattle drinking water quality index (DCWQI) based on fuzzy inference systems

Df
HHa
b
c
d
e
f
a
ARRA
KFFWLK
1
a
SI
((m(
1d
Ecological Indicators 20 (2012) 228–237
Contents lists available at SciVerse ScienceDirect
Ecological Indicators
jo ur n al homep ag e: www.elsev ier .com/ locate /eco l ind
evelopment of a dairy cattle drinking water quality index (DCWQI) based onuzzy inference systems
amed Gharibia, Mohammad Hossein Sowlatb, Amir Hossein Mahvia,c,∗ , Homayoun Mahmoudzadehd,ossein Arabalibeike, Morteza Keshavarz f, Narges Karimzadehf, Ghasem Hassania
Department of Environmental Health Engineering, School of Public Health, Tehran university of Medical Sciences, Enghelab St., Tehran, IranYoung Researchers Club, Medical Branch, Islamic Azad University, Tehran, IranNational Institute of Health Research, Tehran University of Medical Sciences, Tehran, IranDepartment of Animal and Poultry Health and Nutrition, Faculty of Veterinary Medicine, University of Tehran, Enghelab St., Tehran, IranResearch Center for Science and Technology in Medicine (RCSTIM), Tehran University of Medical Sciences, Keshavarz Boulevard, Tehran, IranDepartment of Environment and Energy, Science and Research Branch, Islamic Azad University, Tehran, Iran
r t i c l e i n f o
rticle history:eceived 1 April 2011eceived in revised form 10 February 2012ccepted 14 February 2012
eywords:uzzy logicuzzy inference systemater quality index
ivestockarun River
a b s t r a c t
The critical role of water quality for all animals, and especially dairy cattle, the dairy products of which areconsumed by humans, raises the need for an index which represents well the quality of water consumedby dairy cattle. Noting the high subjectivity and inappropriate classifications that traditional methodsapply to development an index, we aimed to develop a better index that measures the quality of drinkingwater supplied to dairy cattle (DCWQI1) based on fuzzy logic. Using fuzzy logic enabled us to captureexperts’ knowledge and to simulate the human’s way of thinking in the design of the index. Our approachavoided the shortcomings of the previous models. We selected 20 parameters that available literaturedetermined were critical to assessing the quality of water for dairy cattle to drink due mainly to theirpotential impacts both on dairy cattle and human health. These parameters were: dissolved oxygen (DO),biochemical oxygen demand (BOD), pH, temperature, total dissolved solids (TDS), turbidity, fecal coliform,heterotrophic plate count, hardness, alkalinity, arsenic, lead, mercury, nickel, cadmium, chromium, totalphosphorous, H2S, nitrate, and fluoride. We used trapezoidal membership functions and the final rulesetconsisted of 550 rules. Mamdani inference system captured experts’ knowledge and experience; center-of-gravity method was used to defuzzify the results. To evaluate the index performance, we conducteda case study of Karun River employing the water quality data from six sampling stations along the riverover the period of 2007–2010 and compared the results to those from the National Sanitation Foundation
(NSF) water quality index (WQI). Our study found that the water quality of Karun River lies in the low tomedium range (annual mean index values of 38–55). In addition, the values from the fuzzy DCWQI weregenerally lower than the values from the NSF WQI, mainly because the DCWQI included heavy metals inits index, while the NSF WQI did not. Results of the present study suggest that DCWQI can be consideredas a comprehensive tool for assessing the quality of water for dairy cattle drinking purposes and can bective
reliably used for that obje. Introduction
Water has the top priority for livestock because it constitutes major part of the molecules in their body. In addition, water is
∗ Corresponding author at: Department of Environmental Health Engineering,chool of Public Health, Tehran University of Medical Sciences, Enghelab St., Tehran,ran. Tel.: +98 21 889 549 14; fax: +98 21 889 501 88.
E-mail addresses: [email protected] (H. Gharibi), [email protected]. Sowlat), [email protected] (A.H. Mahvi), [email protected]. Mahmoudzadeh), [email protected] (H. Arabalibeik),
[email protected] (M. Keshavarz), [email protected]. Karimzadeh), hassani [email protected] (G. Hassani).
1 dairy cattle water quality index (DCWQI).
470-160X/$ – see front matter © 2012 Elsevier Ltd. All rights reserved.oi:10.1016/j.ecolind.2012.02.015
.© 2012 Elsevier Ltd. All rights reserved.
vital for all of livestock’s life’s processes, including growth, lacta-tion, reproduction, and cushioning their nervous system. A varietyof other functions have also been documented in the literature(Beede, 2005; NRC, 2001; Murphy, 1992). Among all livestock, lac-tating dairy cattle have the greatest need for water, since watercomprises the major portion of their body (56–81%); furthermore,the main portion of cow’s milk (87%) consists of water as well(Murphy, 1992). Lactating dairy cattle require large amounts ofwater, roughly 100 L every day (Kramer et al., 2008). Therefore, itis essential to provide adequate drinking water for dairy cattle.
In addition to the quantity of water that dairy cattle need, thequality of their drinking water is also important, because it affectsthe productivity and health of dairy cattle, and has implicationsfor their water intake (NRC, 2001). The quality of drinking water

l Indic
pmadpaopcamt(mhte1Safdcft2ic
iqucNghrtmaifaldbiieDIwemo
dcdiicqtqw
H. Gharibi et al. / Ecologica
rovided for dairy cattle is usually evaluated according to fiveajor aspects, including the water’s organoleptic properties (odor
nd taste), its physiochemical characteristics (including pH, totalissolved solids (TDS), total dissolved oxygen, and Hardness), theresence of toxic compounds (including heavy metals, toxic miner-ls, organophosphates, hydrocarbons, and pesticides), the presencef excessive amounts of minerals (such as nitrates, sodium, sul-hates, iron, phosphate, and fluoride), and finally the microbialontents and contaminants in the water (NRC, 2001). Amongll of these five components, toxic compounds and pathogenicicroorganisms are the two most detrimental agents lowering
he quality of the drinking water. Heavy metals such as cadmiumCd), chromium (Cr), lead (Pb), and mercury (Hg) tend to accu-
ulate in cattle’s various organs and products. From there, theseeavy metals can potentially transfer to human’s body throughheir consumption of animal products, and in turn causing adverseffects on the health of both dairy cattle and humans (Friberg et al.,985, 1986; Lopez-Alonsoa et al., 2003; Mahaffey, 1985; NRC, 2005;harma et al., 1979). Bacterial contamination of the water not onlyffects the dairy cattle, but also causes human infection throughood-borne diseases (Crump et al., 2002). Therefore, in order toetermine the sanitary quality, microbiologic analysis of water foroliform bacteria and other microorganisms is quite critical. Otheractors such as salinity (or TDS), nitrate, and H2S are also believedo have adverse effects on cattle’s health and productivity (NRC,001). Therefore, these two factors should be given higher prior-
ty when assessing the quality of drinking water for lactating dairyattle.
Instead of focusing on one or two single parameters, appropriatendices should employ several quality factors for assessing generaluality of drinking water. Two different methodologies have beensed for developing water quality indices: namely, numerical pro-edures such as the water quality index (WQI) developed by theational Sanitation Foundation (NSF (2010)) and artificial intelli-ence (AI). Traditional indices, which use numerical methodology,ave been available for several decades, but the results they obtainemain uncertain because of the insensitive classifications used inheir theory and the unclear distinctions they make between each
ode of the water quality (Chang et al., 2001; Liou et al., 2003). Inddition, simulating water quality issues using numerical methodss quite complex and the indices are not sufficiently user-friendlyor non-experts to apply them (Chau, 2006). On the other hand,fter the advent of computational methods based on artificial intel-igence (AI), researchers have expanded a great deal of effort toevelop water quality indices based on the fuzzy logic introducedy Zadeh (1965), that is able to address subjectivities, vagueness,
naccuracies, and uncertainties surrounding environmental issues,ncluding water quality problems and its traditional indices (Changt al., 2001; Lermontov et al., 2009; Liou et al., 2003; Ocampo-uque et al., 2006; Simeonova et al., 2003; Sowlat et al., 2011).
n addition, since the fuzzy approach can combine qualitative asell as quantitative data, its results are more applicable to actual
cological and real-world problems (Lermontov et al., 2009). Forore detailed and comprehensive information on the application
f AI methods to modeling water quality, see Chau (2006).All of the fuzzy indices mentioned above, however, have been
eveloped to measure the quality of drinking water for humanonsumption and are not useful for measuring the quality ofrinking water for lactating dairy cattle. In addition, they do not
nclude some of the important parameters of drinking water qual-ty such as heavy metals; furthermore, the standards used for theiralculations differ from the standards required for measuring the
uality of dairy cattle drinking water. Therefore, the main objec-ive of this work was to develop a dairy cattle drinking wateruality index (DCWQI) based on fuzzy logic, with greater focus onater quality goals for dairy cattle. A case study of Karun River, theators 20 (2012) 228–237 229
greatest and longest river in Iran, compares the outputs of theDCWQI with those of the NSF WQI.
2. Materials and methods
2.1. Fuzzy logic
Fuzzy logic was suggested by Zadeh (1965) as a tool for creatingsystems that are much more like human thinking than earlier ana-lytical methods. Fuzzy logic links the two areas of qualitative andquantitative modeling and was developed to model intricate sys-tems under uncertain and imprecise conditions. In recent years,there has been an increasing interest in applying fuzzy logic tomodel and control complex systems, because it is conceptuallyeasy to understand and is a successful method for modeling non-linear functions based on natural language. In addition, fuzzy logicuses an individual’s existing knowledge and experience as informa-tion, which cannot be considered by other methods. The systemsthat were developed based on the fuzzy logic are capable of con-fronting with complex environmental problems, such as the effectsof water quality indicators on the water quality, where large num-bers of indicators influence the results (Chau, 2006; Lermontovet al., 2009).
In general, fuzzy inference systems involve three parts: mem-bership functions, inference rules, and defuzzification. In a fuzzyinference system, each variable or input has a domain that is calledits universe of discourse, and each set in this space is expressed by alinguistic term such as “low,” “moderate,” and “high”. The relation-ships among the variables are then defined by if-then rules. Finally,a defuzzification method is used to find the best crisp value; in otherwords, a fuzzy output variable must be converted into a single valuevariable, which is done by defuzzification (Ross, 2004).
2.1.1. Membership functionsMembership functions are defined to link each point in the uni-
verse of discourse to a membership grade between 0 and 1. Let theelements of universe of discourse (X) be x1, then the fuzzy set A ⊂ Xis denoted by the following nomenclature:
A = {(x1, �A(x))|x ∈ X}, 0 ≤ �A(x) = 1 (1)
where �A(x) is a membership grade between 0 and 1. In lin-guistic terms, x1 is a member of A and also is associated with�A(x). Membership functions have different shapes, such as tri-angular, trapezoidal, and Gaussian. Different methods have beenused to determine membership functions, such as using the expert’sknowledge (Norwich and Turksen, 1984; Turksen, 1991), fuzzyclustering (Bezdek, 1981, 1992; Gustafson and Kessel, 1984; Jangand Sun, 1995; Keller and Hunt, 1985; Takagi and Hayashi, 1991;Williams, 1994; Yang, 1993), neural networks (Jang and Sun, 1995;Keller and Hunt, 1985; Takagi and Hayashi, 1991; Williams, 1994)and genetic algorithm (Karr, 1991; Karr and Gentry, 1993; Parket al., 1994; Wiggins, 1992).
2.1.2. Inference rulesThe inference rules are produced from the if-then rules. An if-
then rule consists of the if part, which is called the antecedent, andthen part, which is called the consequent. In the inference rules, theoutput variable with one or more consequents is obtained from oneor more premise antecedents. The rules are in the following forms:
IF A is a THEN C is c.
IF B is b THEN C is c.where a, b, and c are linguistic values defined by fuzzy sets inuniverse of discourse A, B, and C, respectively. A more complete

2 l Indic
d(
siIeo
•Tt
•T
•To
“fiR
2
atvbiaufsoMS
2
nWioatcpbcpfhgnmw
2(
dt
30 H. Gharibi et al. / Ecologica
iscussion of the inference rules of fuzzy logic can be found in Ross2004).
Fuzzy set operators express the relationships between the fuzzyets of the inputs. There are three standard fuzzy set operations:ntersection (AND), union (OR), and complement (negation or NOT).f A and B are defined as sets in the universe X, then for a givenlement x belonging to X, the following operations can be carriedut:
AND : �A∩B(x) = �A(x) ∩ �B(x) = min �A(x), �B(x) (2)
his type of the fuzzy set AND operation creates the intersection ofhe sets A and B.
OR : �A∩B(x) = �A(x) ∪ �B(x) = max �A(x), �B(x) (3)
his OR operation creates the union of the two sets.
NOT : �A(x) = 1 − �A(x) (4)
he negation operator NOT creates the complement set of the setperated below.
Aggregation operators can take several forms, but the functionsmin”, “max”, and “not” are the most common forms and are suf-cient most of the time. These concepts are discussed in depth inoss (2004) and Yager and Filev (1994).
.1.3. DefuzzificationA fuzzy-based system generates as the output a final fuzzy vari-
ble which is not in a form that makes it possible for inexpert peopleo understand. Hence, the fuzzy variable is converted into a crispalue through a process of defuzzification. Several methods haveeen created to find the best crisp value, including the mean of max-
ma method, the center-of-gravity method (COG), the weightedverage method, and the max method. The methods most widelysed for defuzzification are the mean of maxima and COG. Theormer computes the mean of the maxima of the output member-hip functions, while the latter points out the geometrical centerf the fuzzy variable (Lee, 2005; Ross, 2004; Zimmermann, 1992).ore detailed information on the COG method can be found in
ection 2.3.
.2. Selection of the parameters
In this section we provide detailed information about the ratio-ale behind selecting the parameters included in the DCWQI index.e chose parameters of water quality, such as the physicochem-
cal parameters, heavy metals, minerals, and microbial contentf water, based mainly on the available literature describing thedverse effects of these parameters on the health of dairy cat-le and humans. We also included parameters that do not affectattle health directly (mainly in the category of physicochemicalarameters such as temperature, pH, or turbidity). This is mainlyecause although these additional parameters cannot cause healthomplications, their presence is quite critical to providing a bettericture of the general quality of the water. In some cases (turbidity,or example), these parameters are indicators of the presence ofazardous water contaminants. However, these parameters wereiven lower priorities when developing the rules, because they doot have direct health implications. Table 1 presents a short sum-ary of the reason(s) behind the selection of each parameter, alongith the relevant references.
.3. Development of a fuzzy dairy cattle water quality indexDCWQI)
Taking into account the priority of different parameters forrinking water quality discussed in Section 2.2, twenty parame-ers were selected to use in developing a water quality index for
ators 20 (2012) 228–237
lactating dairy cattle. These parameters are: dissolved oxygen (DO),biochemical oxygen demand (BOD), pH, temperature (Temp.), totaldissolved solids (TDS), turbidity (Turb), fecal coliform (FC), het-erotrophic plate count (HPC), hardness (Hard.), alkalinity (Alkal.),arsenic (As), lead (Pb), mercury (Hg), nickel (Ni), cadmium (Cd),chromium (Cr), total phosphorous (TP), hydrogen sulfide (H2S),nitrate (N), and fluoride (F). Five fuzzy sets in terms of membershipfunctions were defined for each input indicator. Each membershipfunction links the elements in the universe of discourse to the inter-val [0,1]. Membership functions used in this study have trapezoidaland triangular shapes for the same twenty parameters. Each set inthe universe of discourse X is introduced by a linguistic term. In thisstudy, very low (VL), low (L), moderate (M), high (H), and very high(VH) were used as linguistic terms for the fuzzy sets. Table 2 showsthe data used to create the fuzzy sets according to the followingequations:
Triangular : f (x; a, b, c) =
⎧⎪⎪⎪⎪⎨⎪⎪⎪⎪⎩
0 x < a or c < x
(a − x)(a − b)
a ≤ x ≤ b
(c − x)(c − b)
b ≤ x ≤ c
⎫⎪⎪⎪⎪⎬⎪⎪⎪⎪⎭
(5)
Trapezoidal : f (x; a, b, c, d) =
⎧⎪⎪⎪⎪⎪⎪⎪⎨⎪⎪⎪⎪⎪⎪⎪⎩
0 x < a or d < x
(a − x)(a − b)
a ≤ x ≤ b
1 b ≤ x ≤ c
(d − x)(d − c)
c ≤ x ≤ d
⎫⎪⎪⎪⎪⎪⎪⎪⎬⎪⎪⎪⎪⎪⎪⎪⎭
(6)
where a, b, c, and d are membership function parameters; and xrepresents each single point on the x axis.
In this study, parameters were normalized and grouped in foursteps. As shown in Fig. 1, at the first step, the 20 parameters wereprocessed by the inference systems and then grouped and nor-malized between 0 and 100 in 10 groups. At the second step, the10 groups were processed by new inference systems and normal-ized between 0 and 100 in 5 groups. The remaining five groupswere processed by two new inference systems, which in turn wereprocessed by the last inference system, producing the global dairycattle water quality index (DCWQI). The most important advantageof the special type of classification used in creating the index is thatit simplifies the experts’ work in making the rules. This is mainlybecause considering and manipulating more than two parametersat the same time may confuse the expert and cause errors in theruleset, leading to decreased certainty of the index (Chau, 2006). Itis noteworthy that the rules obtained for the DCWQI were basedon the knowledge and experience of several experts in the fields ofenvironmental engineering, as well as animal health and nutrition.Here, an expert is a person who is skillful in both fuzzy logic andwater quality issues. In the present study, we used the expertise of10 experts with the mentioned characteristics to develop the rules.For deriving the experts’ knowledge, the index structure was thor-oughly explained to them in every detail; they were then asked tocomplete each rule and form a separate rule set, which resulted in10 different rule sets. Afterwards, these rule sets were discussed inmeetings and the agreement of all experts on each rule was consid-ered as the final rule, forming the final agreed rule set. However, inorder to show the effects of these variations in development of rulesets by different experts, and to know the effect of these changeson the index outputs, we have provided a sensitivity analysis, indi-
cating the effects of percent of changes in the rule sets in each stageon the final index outputs (Fig. 6).In contrast to the traditional methods in which tables, curves,and weighting factors are used to normalize the parameters, this

H. Gharibi et al. / Ecological Indicators 20 (2012) 228–237 231
Table 1A summary of the reason(s) behind the selection of the parameters included in the DCWQI.a
Category Parameters Reason Reference(s)
Heavy metals As, Pb, Hg, Ni, Cd, Cr Decreased feed consumption, diarrhea,anemia, reduced growth, nephritis, andeven death; transport to human bodythrough food chain and subsequentadverse effects like anemia, dermatitis,Itai-Itai, kidney and lung diseases, andeven death.
NRC (2005), Friberg et al. (1986),Lopez-Alonsoa et al. (2003), Mahaffey(1985), Sharma et al. (1979),Spivey-Fox (1987)
Microbial quality FCa, HPCa A good indicator of water microbialcontamination which can causelivestock bacterial contamination;human sickness through food-bornediseases.
NRC (2001), Crump et al. (2002)
Psychochemical properties DOa, BODa Key indicators of water quality. AWWA (2011)pH Decreased water acceptability by
livestock outside the range of 6–9;acidosis in low pHs and subsequentdecrease in feed intake andperformance.
Beede (2005), Agriculture andAgri-Food Canada (2000)
Temp.a Effects on DO, the growth rate of algaeand aquatic plants, and the metabolicrate of the microorganisms present inthe water; effects on water intake ofdairy cattle and their performance.
AWWA (2011), Huuskonen et al. (2011)
TDSa Decreased weight and milk production. NRC (2001)Turbidity A good indicator of bacterial
contamination of water.Smith et al. (2008)
Hardness, alkalinity Decreased weight and milk productionat high concentrations; mild alkalosis.
Beede (2005), Challis et al. (1987)
Minerals PO4 The major cause of eutrophication andsubsequent degradation of waterquality.
NRC (2001)
S2− Decreased food intake, milkproduction, milk fat, and milk proteinat high concentrations.
Ivancic and Weiss (2001)
NO3 Asphyxiation, poor growth, infertilityproblems, abortions, generalunhealthiness.
NRC (2001)
F Hypothyroidism and anemia. Hillman et al. (1979)
chemp
mtcssaotria
ibu
Z
a Note: DCWQI, dairy cattle water quality index; DO, dissolved oxygen; BOD, biolate count.
ethod uses fuzzy inference systems to normalize the parame-ers. We used Mamdani fuzzy inference system, which facilitatesapturing the experts’ knowledge. In addition, the fuzzy inferenceystem makes it possible to imitate experts’ knowledge in a wayimilar to human manners and thoughts (Ross, 2004). The numbernd quality of the rules determine the performance and robustnessf the system. We used 550 rules based on the experts’ knowledgeo compute the DCWQI through the fuzzy inference systems. Theules cover different possible modes in the water quality by apply-ng the twenty mentioned parameters. Some examples of the rulesre given below:
If DO is “Very Low” and BOD is “Very Low” then Gr1 is “Moderate”.If pH is “Low” and Temp is “Moderate” then Gr2 is “Moderate”.If FC is “High” and HPC is “Very High” then Gr4 is “Very Low”.If Gr1 is “Very Low” and Gr2 is “Very Low” then Gr11 is “Very Low”.If Gr5 is “Very High” and Gr6 is “Very High” then Gr13 is “Very High”.If Gr9 is “Very Low” and Gr10 is “Very Low” then Gr15 is “Very Low”.If Gr16 is “Low” and Gr17 is “Low” then DCWQI is “Low”.
The COG method was used to defuzzify the outputs. This methods believed to be the most conventional and physically applica-le method of defuzzification. The defuzzified values are obtained
sing the following equation (Ross, 2004):=∫
�(z)z dz∫�(z) dz
(7)
ical oxygen demand; Temp., temperature; FC, fecal coliforms; HPC, heterotrophic
Fig. 2 illustrates the relationships and interactions betweenparameters by using a surface graph of groups 1 (DO and BOD)and 2 (pH and temperature). The figure shows how the changes indifferent input variables (in this case, DO and BOD in one group andpH and temperature in another group) affect the final values of theDCWQI. It should be noted that all calculations were done using the“fuzzy logic toolbox” in MATLAB 7.9.0 (2009).
3. Case study
The Karun River is located in south-west region of Iran. It is thelargest and longest river in the country, running a total length ofabout 950 km. The Karun River traces its origin to the Armand andBazoft rivers in Charmahal & Bakhtiari province, passes throughseveral cities and finally empties into the Persian Gulf. The KarunRiver provides drinking water for many cities, including MasjedSoleyman, Shushtar, Ramin, Veys, Ahvaz, and Khoramshahr; there-fore, dams have been constructed at various points along the river.Agricultural activities and drinking water for livestock (includinglactating dairy cattle) provide two other demands for the river inthis area. In rural areas, particularly, the need for drinking water fordairy cattle is considerably higher than elsewhere along the river,requiring the provision of adequate, high-quality water. Fig. 3 illus-trates the location of the river with respect to surrounding main
cities.Because of the critical role the river plays in the area, vari-ous quality parameters of the water are routinely evaluated andreported at sampling stations constructed along the river. These

232
H.
Gharibi
et al.
/ Ecological
Indicators 20
(2012) 228–237
Table 2Fuzzy sets and linguistic terms for input parameters and output DCWQI.a
Group Parameters Units Very low Low Medium High Very high Range
a = b c d a b c a b c a b c a b c = d
1 DOa mg/L 0 2 4 2 4 6 4 6 8 6 8 10 8 10 12 0–12BODa mg/L 0 1 2 1 2 3 2 3 4 3 4 5 4 5 6 0–6
2 pH - 0 3 5 3 5 7 5 7 9 7 9 11 9 11 14 0–14Temp.a ◦C 0 5 10 5 10 15 10 15 20 15 20 25 20 25 30 0–30
3 TDSa mg/L 0 1000 1200 1000 1200 2000 1200 2000 3500 2000 3500 5000 3500 5000 6000 0–6000Turbidity NTU 0 1 2 1 2 3 2 3 4 3 4 5 4 5 6 0–6
4 FCa MPN/100 ml 0 1 2 1 2 4 2 4 6 4 6 16 6 16 100 0–100HPCa CFU/100 ml 0 1 2 1 2 3 2 3 4 3 4 5 4 5 100 0–100
5 As �g/L 0 50 60 50 60 80 60 80 100 80 100 120 100 120 200 0–200Pb �g/L 0 15 20 15 20 25 20 25 30 25 30 35 30 35 50 0–50
6 Hg �g/L 0 2 3 2 3 4 3 4 5 4 5 6 5 6 12 0–12Ni �g/L 0 250 270 250 270 300 270 300 350 300 350 400 350 400 500 0–500
7 Cd �g/L 0 3 5 3 5 7 5 7 9 7 9 11 9 11 14 0–14Cr �g/L 0 40 70 40 70 100 70 100 130 100 130 160 130 160 200 0–200
8 Hardness mg/L CaCO3 0 100 150 100 150 200 150 200 250 200 250 300 250 300 500 0–500Alkalinity mg/L CaCO3 0 500 600 500 600 700 600 700 800 700 800 900 800 900 1500 0–1500
9 PO4 mg/L 0 1 2 1 2 3 2 3 4 3 4 5 4 5 6 0–6S2− mg/L 0 1 2 1 2 3 2 3 4 3 4 5 4 5 6 0–6
10 NO3 mg/L 0 45 60 45 60 100 60 100 150 100 150 200 150 200 250 0–250F mg/L 0 2 3 2 3 4 3 4 5 4 5 6 5 6 7 0–7
DCWQI – 0 10 30 10 30 50 30 50 70 50 70 90 70 90 100 0–100
a Note: DCWQI, dairy cattle water quality index; DO, dissolved oxygen; BOD, biochemical oxygen demand; Temp., temperature; FC, fecal coliforms; HPC, heterotrophic plate count.

H. Gharibi et al. / Ecological Indicators 20 (2012) 228–237 233
F relationships between different quality parameters, inference systems (Inf.), and groups(
papdsatc(m(aWaGts
4
4f
sDAtt
ig. 1. Process flow-diagram of the fuzzy DCWQI index developed, indicating the
Gr.).
arameters include the 20 we selected to construct the DCWQI,s well as others. The sampling stations report psychochemicalarameters such as dissolved oxygen (DO), biochemical oxygenemand (BOD), chemical oxygen demand (COD), total dissolvedolids (TDS), total suspension solids (TSS), total solids (TS), temper-ture, pH, turbidity, fat, oil, and grease; microbial indicators likeotal coliforms (TC), fecal coliform (FC), and heterotrophic plateount (HPC); heavy metals such as arsenic (As), lead (Pb), mercuryHg), nickel (Ni), cadmium (Cd), and chromium (Cr); and finally,
inerals like chloride (Cl−), fluoride (F−), nitrate (NO3), phosphatePO4), sulfate (SO4), and sulfide (S2−). Each month these parametersre sampled according to the Standard Methods for Examination ofater and Wastewater (1995). We selected six sampling stations
nd collected their quality data (for the years 2007–2010) fromhatrab Zolal Corporation. The six sampling stations are well dis-
ributed along the river and located near critical points of use, ashown in Fig. 3.
. Results and discussion
.1. Evaluation of the water quality in the Karun River using theuzzy DCWQI
We assessed the quality of water from the Karun River at theix sampling stations over the period 2007–2010 using the fuzzy
CWQI index developed in this paper; Fig. 4 illustrates the results.s shown in the figure, the quality of the river water for dairy cat-le drinking purposes is low to moderate (the index value lies inhe range of 38–55 out of a maximum of 100). According to the
Fig. 2. Surface graph representing the relationships and interactions betweengroups 1 and 2.
quality data, these low values result mainly from the presence ofheavy metals such as Cd, Cr, and Ni. The other major contributors tothe low-to-moderate quality evaluation are microbial quality andphysical characteristics such as TDS and hardness.
Fig. 5(a)–(d) indicates the annual averages o the fuzzy indexvalues at the six sampling stations over the years 2007–2010. Forcomparison, the figure also indicates the mean annual values of
the NFS index for the same period (NSF, 2010). The figure demon-strates that the values developed from the fuzzy DCWQI index aregenerally lower than those of the NSF WQI, suggesting that the
234 H. Gharibi et al. / Ecological Indicators 20 (2012) 228–237
Fig. 3. Location of the study area with
Fs
ftssophD
ttw
factor in calculating the overall NSF index value) are quite low at
ig. 4. Annual averages of DCWQI index values in all sampling stations (SS) over thetudy period.
uzzy DCWQI index proposed by the present study is more stringenthan the NSF index. This is quite consistent with our expectations,ince the NSF WQI does not include some of the critical parameters,uch as heavy metals, that lower the fuzzy DCWQI index value. Asbserved for the indices calculated under each method for sam-ling station 4 during 2010 (Fig. 5(d)), the NSF index values remainigh, since they are insensitive to the heavy metals that lower theCWQI value.
Another reason for seeing lower DCWQI values can be the special
ype of classification used in the fuzzy method and its great abilityo overcome the uncertainties and insensitivities surrounding theater quality issues (Chau, 2006). Our results are consistent withrespect to the sampling stations.
the results from other studies, which assessed the water qualityusing fuzzy-based indices. For example, the water quality indexbased on fuzzy logic developed by Ocampo-Duque et al. (2006)produced more stringent results than those of NSF WQI. Similarfindings have also been reported by other studies (Chang et al.,2001; Lermontov et al., 2009; Liou et al., 2003; Ocampo-Duqueet al., 2006; Simeonova et al., 2003). It is noteworthy that all ofthese studies developed fuzzy water quality indices for water to beconsumed by human rather than for cattle to drink; the criteria andstandard levels they use are quite different from those used by thisstudy. Therefore, these studies are comparable with the presentstudy only with respect to the fuzzy approach taken and its differ-ence from the traditional approaches; the actual results should notbe compared.
The only unsolved question regard the points at which the fuzzyDCWQI index value exceeds the value from the NSF WQI. One suchpoint is sampling site 2 during 2009 (Fig. 5(c)), which at first glanceappeared to contradict our expectations. Further inspection of thequality data, however, revealed that at this sampling point, concen-trations of the heavy metals in the river water are quite low. Thisreading greatly increases the quality value produced by the fuzzyDCWQI index; since the NSF index does not include the heavy met-als parameter, the value produced by that index remains unaffected(Lermontov et al., 2009; NSF, 2010; Ocampo-Duque et al., 2006). Onthe other hand, concentrations of DO (which has a high weighting
this sampling point, considerably decreasing the NSF index value.Since the fuzzy DCWQI index includes many other parameters(as described in Section 2), decreasing the levels of an individual

H. Gharibi et al. / Ecological Indic
Fp
pv
4
oTitaeo
t
ig. 5. Annual averages of DCWQI index values in all sampling stations (SS) com-ared those of NSF for the years 2007 (a), 2008 (b), 2009 (c), and 2010 (d).
arameter (such as DO) has a smaller impact on the overall indexalue.
.2. Validation of the fuzzy DCWQI index
Validation of the proposed index is a daunting task, because nother water quality index exists for dairy cattle drinking water.he DCWQI index was developed with the aim of understand-ng whether the water is of appropriate quality for dairy cattleo drink, taking into consideration the physicochemical propertiesnd microbial quality of the water, as well as any presence of min-
rals and toxics in the water. We based the DCWQI on fuzzy logic,ne of the common and efficient AI computational methods.The best way for us to validate the proposed index is to jus-ify the parameters we included and to address the strength of
ators 20 (2012) 228–237 235
the methodology we applied. As mentioned briefly earlier in Sec-tion 2.2, a great body of evidence shows that all the parametersincluded in the DCWQI affect the water quality and furthermore,have strong, adverse impacts on the health of both dairy cattle andhumans. Therefore, it is necessary to include these parameters ifthe index is to represent the water quality accurately.
The most important advantage of the DCWQI lies in the specialfuzzy logic methodology we applied. Fuzzy logic is based mainlyon words rather than equations, so it can be used effectively andefficiently to analyze water quality issues surrounded by greatuncertainties and ambiguousness (Ocampo-Duque et al., 2006).Another advantage of the stepwise methodology applied to theDCWQI is that although no weighting factors were assigned tothe parameters, only 550 combinational rules were used in thebody of the index, many fewer than in other studies. For exam-ple, in the study of Lermontov et al. (2009), although only 9parameters were included, more than 3000 rules were used in thebody of the index, significantly increasing the complexity of theindex.
Another approach to validate the performance of the index isto compare our results with those from two studies conductedto assess the concentrations of heavy metals in the Karun River(Diagomanolin et al., 2004; Jafarzadeh et al., 2004). Both studiesreported high concentrations of heavy metals and the concentra-tions increase along as the river get closer to the Persian Gulf. Theirresults are consistent with the DCWQI index values we obtained.According to the results in the present study, DCWQI index valueswere generally low due to the presence of heavy metals that wereincluded in the index, especially in the case of sampling site 6 whichis close to the estuary of the Persian Gulf (a statistically significantdifference was observed between the index values at this samplingsite and the values obtained at the other five sites). However, sincethe NSF WQI does not consider heavy metals, the high concen-trations of heavy metals cannot affect the final NSF index value.Therefore, the DCWQI index tends to produce reliable and usefulresults, especially with respect to the quality of drinking water forlactating dairy cattle.
As discussed in Section 2.3, the knowledge and experience from10 experts were used to develop the final rule set. For this purpose,every expert developed a separate rule set based on their knowl-edge and experience, and the final rule set was developed basedon the agreement among the rules written by different experts. Forexample, if in a rule set developed by an expert a total number of55 rules were different from those of the final agreed ruleset, thepercent of change in the rule set was 10%. In order to conducted asensitivity analysis to gauge the robustness of the DCWQI by eval-uating the effect of changes in the rule set on the outputs of theindex, the final agreed rule set was considered as the baseline, anddeviations (or changes) from this rule set were measured as thepercent of variation (or change) in the rule sets of each steps. It isnoteworthy that these variations were, in fact, due to the differ-ent rules developed by different experts. In each rule set developedby an expert, the number of rules that differed from that of thebaseline rule set was calculated as the percent of changes in therules. As mentioned in Section 2.3, since the weighting factor areincorporated in the rules, changes in the rules were to be used onorder to perform the sensitivity analysis, which is equal to assessthe effect of changing weighting factor on the index outputs in thetraditional indices that are based on weighting factors. The resultsof the sensitivity analysis are illustrated in Fig. 6(a)–(d). As shownin the figure, changes in the rules in different steps of the fuzzyindex do not have any significant impact on the final FWQI value.
For example, a 50% change in the rules governing the second stepchanged the FWQI values by only 7% and a 50% change in the rulesof the final stage only changed the index output by approximately17%.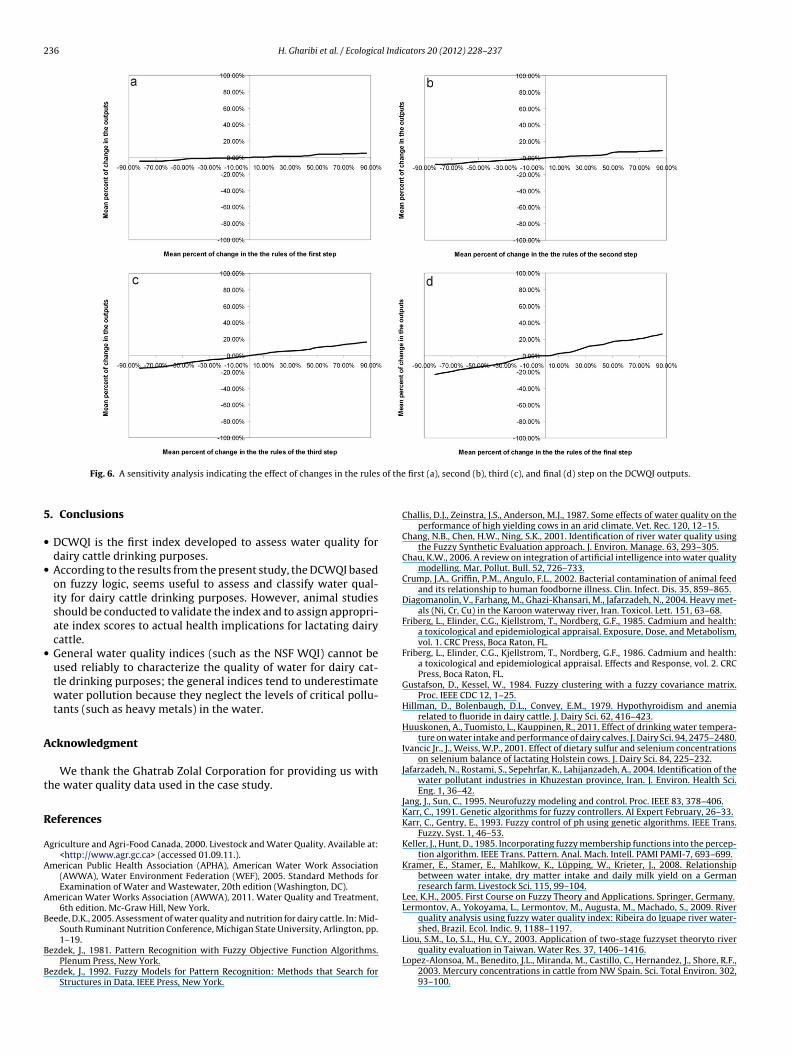
236 H. Gharibi et al. / Ecological Indicators 20 (2012) 228–237
of the
5
•
•
•
A
t
R
A
A
A
B
B
B
Fig. 6. A sensitivity analysis indicating the effect of changes in the rules
. Conclusions
DCWQI is the first index developed to assess water quality fordairy cattle drinking purposes.According to the results from the present study, the DCWQI basedon fuzzy logic, seems useful to assess and classify water qual-ity for dairy cattle drinking purposes. However, animal studiesshould be conducted to validate the index and to assign appropri-ate index scores to actual health implications for lactating dairycattle.General water quality indices (such as the NSF WQI) cannot beused reliably to characterize the quality of water for dairy cat-tle drinking purposes; the general indices tend to underestimatewater pollution because they neglect the levels of critical pollu-tants (such as heavy metals) in the water.
cknowledgment
We thank the Ghatrab Zolal Corporation for providing us withhe water quality data used in the case study.
eferences
griculture and Agri-Food Canada, 2000. Livestock and Water Quality. Available at:<http://www.agr.gc.ca> (accessed 01.09.11.).
merican Public Health Association (APHA), American Water Work Association(AWWA), Water Environment Federation (WEF), 2005. Standard Methods forExamination of Water and Wastewater, 20th edition (Washington, DC).
merican Water Works Association (AWWA), 2011. Water Quality and Treatment,6th edition. Mc-Graw Hill, New York.
eede, D.K., 2005. Assessment of water quality and nutrition for dairy cattle. In: Mid-South Ruminant Nutrition Conference, Michigan State University, Arlington, pp.
1–19.ezdek, J., 1981. Pattern Recognition with Fuzzy Objective Function Algorithms.Plenum Press, New York.
ezdek, J., 1992. Fuzzy Models for Pattern Recognition: Methods that Search forStructures in Data. IEEE Press, New York.
first (a), second (b), third (c), and final (d) step on the DCWQI outputs.
Challis, D.J., Zeinstra, J.S., Anderson, M.J., 1987. Some effects of water quality on theperformance of high yielding cows in an arid climate. Vet. Rec. 120, 12–15.
Chang, N.B., Chen, H.W., Ning, S.K., 2001. Identification of river water quality usingthe Fuzzy Synthetic Evaluation approach. J. Environ. Manage. 63, 293–305.
Chau, K.W., 2006. A review on integration of artificial intelligence into water qualitymodelling. Mar. Pollut. Bull. 52, 726–733.
Crump, J.A., Griffin, P.M., Angulo, F.L., 2002. Bacterial contamination of animal feedand its relationship to human foodborne illness. Clin. Infect. Dis. 35, 859–865.
Diagomanolin, V., Farhang, M., Ghazi-Khansari, M., Jafarzadeh, N., 2004. Heavy met-als (Ni, Cr, Cu) in the Karoon waterway river, Iran. Toxicol. Lett. 151, 63–68.
Friberg, L., Elinder, C.G., Kjellstrom, T., Nordberg, G.F., 1985. Cadmium and health:a toxicological and epidemiological appraisal. Exposure, Dose, and Metabolism,vol. 1. CRC Press, Boca Raton, FL.
Friberg, L., Elinder, C.G., Kjellstrom, T., Nordberg, G.F., 1986. Cadmium and health:a toxicological and epidemiological appraisal. Effects and Response, vol. 2. CRCPress, Boca Raton, FL.
Gustafson, D., Kessel, W., 1984. Fuzzy clustering with a fuzzy covariance matrix.Proc. IEEE CDC 12, 1–25.
Hillman, D., Bolenbaugh, D.L., Convey, E.M., 1979. Hypothyroidism and anemiarelated to fluoride in dairy cattle. J. Dairy Sci. 62, 416–423.
Huuskonen, A., Tuomisto, L., Kauppinen, R., 2011. Effect of drinking water tempera-ture on water intake and performance of dairy calves. J. Dairy Sci. 94, 2475–2480.
Ivancic Jr., J., Weiss, W.P., 2001. Effect of dietary sulfur and selenium concentrationson selenium balance of lactating Holstein cows. J. Dairy Sci. 84, 225–232.
Jafarzadeh, N., Rostami, S., Sepehrfar, K., Lahijanzadeh, A., 2004. Identification of thewater pollutant industries in Khuzestan province, Iran. J. Environ. Health Sci.Eng. 1, 36–42.
Jang, J., Sun, C., 1995. Neurofuzzy modeling and control. Proc. IEEE 83, 378–406.Karr, C., 1991. Genetic algorithms for fuzzy controllers. AI Expert February, 26–33.Karr, C., Gentry, E., 1993. Fuzzy control of ph using genetic algorithms. IEEE Trans.
Fuzzy. Syst. 1, 46–53.Keller, J., Hunt, D., 1985. Incorporating fuzzy membership functions into the percep-
tion algorithm. IEEE Trans. Pattern. Anal. Mach. Intell. PAMI PAMI-7, 693–699.Kramer, E., Stamer, E., Mahlkow, K., Lüpping, W., Krieter, J., 2008. Relationship
between water intake, dry matter intake and daily milk yield on a Germanresearch farm. Livestock Sci. 115, 99–104.
Lee, K.H., 2005. First Course on Fuzzy Theory and Applications. Springer, Germany.Lermontov, A., Yokoyama, L., Lermontov, M., Augusta, M., Machado, S., 2009. River
quality analysis using fuzzy water quality index: Ribeira do Iguape river water-shed, Brazil. Ecol. Indic. 9, 1188–1197.
Liou, S.M., Lo, S.L., Hu, C.Y., 2003. Application of two-stage fuzzyset theoryto riverquality evaluation in Taiwan. Water Res. 37, 1406–1416.
Lopez-Alonsoa, M., Benedito, J.L., Miranda, M., Castillo, C., Hernandez, J., Shore, R.F.,2003. Mercury concentrations in cattle from NW Spain. Sci. Total Environ. 302,93–100.
l Indic
M
MN
N
N
N
O
P
R
S
S
H. Gharibi et al. / Ecologica
ahaffey, K.R., 1985. Dietary and Environmental Lead: Human Health Effects. Else-vier, New york.
urphy, M.R., 1992. Water metabolism of dairy cattle. J. Dairy Sci. 75, 326–333.orwich, A., Turksen, I., 1984. A model for the measurement of membership and the
consequences of its empirical implementation. Fuzzy Sets Syst. 12, 1–25.RC, 2001. Nutrient Requirements of Dairy Cattle, 7th revised edition. National
Academy of Sciences, Washington, DC.RC, 2005. Mineral Tolerance of Domestic Animals, second revised edition. National
Academy of Sciences, Washington, DC.ational Sanitation Foundation (NSF), International, 2010. Available at:
<http://www.nsf.org> (accessed 31.12.10.).campo-Duque, W., Ferre-Huguet, N., Domingo, J.L., Schuhmacher, M., 2006. Assess-
ing water quality in rivers with fuzzy inference systems: a case study. Environ.Int. 32, 733–742.
ark, D., Kandel, A., Langholz, G., 1994. Geneticbased new fuzzy reasoning modelswith application to fuzzy control. IEEE Trans. Syst. Man Cybern. 24, 39–47.
oss, T.J., 2004. Fuzzy Logic with Engineering Applications. John Wiley & Sons, NewYork.
harma, R.P., Street, J.C., Verma, M.P., Shupe, J.L., 1979. Cadmium uptake from feed
and its distribution to food products of livestock. Environ. Health Perspect. 28,59–66.imeonova, V., Stratisb, J.A., Samarac, C., Zachariadisb, G., Voutsac, D., Anthemidis,A., Sofonioub, M., Kouimtzis, T., 2003. Assessment of the surface water qualityin Northern Greece. Water Res. 37, 4119–4124.
ators 20 (2012) 228–237 237
Smith, R.P., Paiba, G.A., Ellis-Iversen, J., 2008. Short communications: turbidity as anindicator of Escherichia coli presence in water troughs on cattle farms. J. DairySci. 91, 2082–2085.
Sowlat, M.H., Gharibi, H., Yunesian, M., Tayefeh Mahmoudi, M., Lotfi, S., 2011. Anovel, fuzzy-based air quality index (FAQI) for air quality assessment. Atmos.Environ. 45, 2050–2059.
Spivey-Fox, M.R., 1987. Assessment of cadmium, lead and vanadium statusof large animals as related to the human food chain. J. Anim. Sci. 65,1744–1752.
Takagi, H., Hayashi, I., 1991. NNdriven fuzzy reasoning. Int. J. Approx. Reason. 5,191–212.
Turksen, I., 1991. Measurement of membership functions and their acquisition.Fuzzy Sets Syst. 40, 5–38.
Wiggins, R., 1992. Fuzzy control: a genetic approach. AI Expert May,28–35.
Williams, T., 1994. New tools make fuzzy/neural more than an academic amusement.Comput. Des. 14, 69–84.
Yager, R., Filev, D., 1994. Essentials of Fuzzy Modeling and Control. John Wiley &Sons, Inc., New York.
Yang, M., 1993. A survey of fuzzy clustering. Math. Comput. Modell. 18,1–16.
Zadeh, L.A., 1965. Fuzzy sets. Inf. Control 8, 338–353.Zimmermann, H.G., 1992. Fuzzy Set Theory, second, revised edition. Springer,
Germany.