Developing Strategies for Homologous/Heterologous Plant ...
128
Developing Strategies for Homologous/Heterologous Plant Expression System for Physiological Investigations of Respective Target Proteins. Von der Naturwissenschaftlichen Fakultät der Gottfried-Wilhelm-Leibniz-Universität Hannover zur Erlangung des Grades eines Doktors der Naturwissenschaften - Dr. rer. nat.- - genehmigte Dissertation Von M.Sc. (Hons.) Agronomy Zahid Ali geboren am 10.12.1976 in Faisalabad Pakistan 2007
-
Upload
khangminh22 -
Category
Documents
-
view
1 -
download
0
Transcript of Developing Strategies for Homologous/Heterologous Plant ...

Developing Strategies for Homologous/Heterologous Plant Expression System for Physiological Investigations of Respective
Target Proteins.
Von der Naturwissenschaftlichen Fakultät der Gottfried-Wilhelm-Leibniz-Universität Hannover
zur Erlangung des Grades eines
Doktors der Naturwissenschaften
- Dr. rer. nat.- -
genehmigte Dissertation
Von
M.Sc. (Hons.) Agronomy Zahid Ali
geboren am 10.12.1976 in Faisalabad Pakistan
2007

Referent: Prof. Dr. Hans - Jörg Jacobsen
Korreferent: Prof. Dr. Bernhard Huchzermeyer
Tag der Promotion 30-08-2007

Dedicated to my beloved Parents
i
ABSTRACT
Developing Strategies for Homologous/Heterologous Plant Expression System for Physiological Investigations of Respective
Target Proteins.
A direct translational control for recombinant gene products in homologous or
heterologous plant expression systems is the major constraint for physiological
investigations. Especially in the large seed grain legume family, the transformation
recalcitrance is drastically limiting the number of independent lines which do not meet
the basic requirements for relative expression stability, e.g. the integration of more than
one copy of the transgene, which can result in gene silencing. This causes often problems
in physiological studies with transgenic plants.
Therefore dicistronic binary vector constructs based on pGreenII vectors were made
which allow a direct expression control on cellular and entire plant level. The advantage
of this approach is that cap-dependent expression of physically independent β -
glucuronidase can be monitored by the IRES (internal ribosome binding site) mediated
cap-independently co-expressed luciferase, which is located on the same mRNA. As a
first proof the functionality of the constructs was shown by using two marker genes
coding for a β- glucuronidase and a fire fly luciferase behind the IRES elements. The
proof of principle for the functionality of the dicistronic constructs in physiological
studies was made by overexpressing a sodium antiporter (AtNHX1) gene from
Arabidopsis thaliana, providing improvement of salinity tolerance in transgenic plants.
The performance of IRES elements combines absolute transcriptional linkage of two
genes on one m-RNA with the translational independence of the genes, resulting in two
separate proteins.
As a basic novelty in this work IRES elements were used for the first time to transform
plants and plant cells with a gene transferring a functional trait linked to a reporter gene.
Through IRES mediated Co-expression of target and reporter gene, instead of a fusion
protein it was possible to correlate the functional trait in physiological studies, in terms of
cell growth with the activity of the reporter gene in transient and stably transformed cells
and leaves. NaCl challenge to AtNHX1 transgenic vs wild type tobacco suspension cells
ii
showed significant tolerance over wild type up to 150 mM. With the increase in NaCl
concentration in the growth medium, increase of cell mass and luciferase expression was
observed in transgenic tobacco cells in comparison to wild type cells, the maximum was
at 100 mM. Via Agrobacterium mediated gene transfer by using the disarmed EHA 105
strain, the dicistronic construct MASnhx1/luc was transferred into the pea (Pisum
sativum) genome. Transgenic T0, T1 and T2 pea plants confirmed by PCR showed
luciferase activity, as a first indicator for the AtNHX I expression in pea.
Key words: Translation, Internal Ribosome Entry Site (IRES), Co-ordinated expression,
Tobamoviruses, Plants and plant cell lines.

iii
ZUSAMMENFASSUNG
Bei physiologischen Untersuchungen stellt die einfache und schnelle Ermittlung der
Expression rekombinanter Genprodukte in homologen und heterologen
Pflanzenexpressionssystemen ein erhebliches Problem dar. Vor allem bei großsamigen
Körnerleguminosen führen niedrige Transformationseffizienzen zu einer sehr begrenzten
Anzahl an unabhängigen Transformationslinien, die nicht immer die notwendigen
Vorbedingungnen für eine relative Expressionsstabilität erfüllen, wie z.B. die Integration
von mehr als einer Kopie des Transgens, was in der Folge zu einem unerwünschten
Genesilencing führen kann. Letzteres stellt für physiologische Untersuchungen
transgener Pflanzen oft ein Problem dar.
Um dieses Problem zu lösen wurden in dieser Arbeit dicistronische, binäre
Vektorkonstrukte hergestellt, welche auf pGreenII Vektoren aufbauen. Unter der
Kontrolle eines Promoters befinded sich in den dicistronischen Vektoren hinter dem
Targetgen ein zweites Gen, welches über ein IRES-Element (interne Ribosomen
indungsstelle) mit dem ersten Gen direkt verknüpft ist und beide Gene so zu einer
transkriptionalen Einheit werden. Der Vorteil dieses Ansatzes ist, dass die cap-abhängige
Expression des ersten Gens, in diesem Fall des β –Glucuronidasegens, durch die cap-
unabhängig co-exprimierte Luciferase detektiert werden kann, welche auf derselben
mRNA liegt. Die Funktionalität der Konstrukte wurde zunächst mittels zweier
Markergene bewiesen, welche für eine β -Glucuronidase und ein Luciferase codieren.
Als prinzipieller Beweis für die Funktionalität dicistronischer Vektoren für das
Monitoring der Genexpression wurde ein Salzantiporter aus A. thaliana verwendet,
welcher erhöhte Salztoleranz in transgenen Pflanzen hervorruft. Die Anwendung von
IRES-Elementen führt zur transkriptionellen Einheiter zweier Gene auf derselben mRNA
bei gleichzeitiger translationaler Unabhängigkeit der Gene, was entsprechend in zwei
getrennten Proteinen resultiert. In der hier vorgestellten Arbeit wurden zum ersten Mal
dicistronische Vektoren zur Transformation von Pflanzen wie auch Pflanzenzellen
eingesetzt, die ein funktionelles Gen mit einem Reportergen verknüpfen und zu einer Co-
Expression ohne Bildung eines Fusionsproteins führen. Hierbei wurde nachgewiesen, daß
das funktionelle Merkmal, gemessen am Zellwachstum, mit der gemessenen Aktivität des
Reportergens korrelierte. Im Vergleich zu nicht transformierten Suspensionszellen

iv
konnten trangene Suspensionszellen signifikant höhere Salzkonzentrationen, von bis zu
150 mM NaCl, tolerieren. Im Vergleich zu den nicht transgenen Suspensionszellen
konnte sowohl die Zunahme der Zellmasse als auch die der Luciferaseaktivität gezeigt
werden. Das Maximum für beide Messparameter lag bei 100 mM NaCl im Medium.
An transgenen Erbsen, welche über einen Agrobakterium vermittelten Gentransfer mit
dem dicistronischen MASnhx1/luc Konstrukt transformiert wurden, konnte über die
Luciferase-Aktiviät ein erster Hinweis auf die rekombinante AtNHX1 Expression in
T0,T1 und T2 Pflanzen gezeigt werden.
Stichworte: Translation, Interne Ribosomenbindungsstelle (IRES), Ko-Expression.
Tobamovirus, Pflanzen und Pflanzenzelllinien.
v
TABLE OF CONTENTS
ABSTRACT......................................................................................................................... i
ZUSAMMENFASSUNG .................................................................................................. iii
TABLE OF CONTENTS.................................................................................................... v
LIST OF FIGURES ............................................................................................................ x
ACKNOWLEDGEMENTS............................................................................................. xiii
ACKNOWLEDGEMENTS............................................................................................. xiii
LIST OF ABBREVIATIONS........................................................................................... xv
1 INTRODUCTION ...................................................................................................... 1
1.1 Overview............................................................................................................. 1
OBJECTIVES................................................................................................................. 2
1.2 Soil salinity ......................................................................................................... 3
1.2.1 Soil salinity and plant response................................................................... 3
1.2.2 Soil salinity and legumes ............................................................................ 4
1.3 Genetic engineering for stress tolerance ............................................................. 4
1.4 Translation (IRES elements)............................................................................... 5
1.5 Agrobacterium mediated gene transfer............................................................... 7
1.6 Legume transformation....................................................................................... 7
2 MATERIALS AND METHODS................................................................................ 9
2.1 Vector construction............................................................................................. 9
2.1.1 Primers designed for cloning ...................................................................... 9
2.1.2 Specific primers designed for confirmation of cloned gene fragment........ 9
2.1.3 Proof reading High Fidelitiy (HF) PCR Mixture for cloning of target
genes. ........................................................................................................ 10
2.1.4 PCR Programme. ...................................................................................... 11
2.1.5 Purification of PCR product...................................................................... 11
2.1.6 Monocistronic vectors............................................................................... 12
2.1.6.1 Isolation of AtNHX1 from A. thaliana .................................................. 12
2.1.6.2 Sub cloning of AtNHX1 into pGreen vector ......................................... 12
2.1.7 Dicistronic vectors .................................................................................... 13
2.1.7.1 pGII0229MASguscp148luc (control vector) ........................................ 13

vi
2.1.7.2 pGII0229MASluc ................................................................................. 15
2.1.7.3 pGII0229MASguscp148(antisense)luc................................................. 15
2.1.7.4 pGII0229MAS nhx1/luc ....................................................................... 16
2.1.8 Confirmation of the cloned gene fragments.............................................. 16
2.1.8.1 PCR Mixture (Immulase PCR) ............................................................. 17
2.1.8.2 PCR programme using Immulase polymerase for confirming cloned genes
............................................................................................................... 18
2.2 E. coli competent cells preparation for heat shock transformation................... 18
2.2.1 E. coli heat shock transformation.............................................................. 19
2.3 Preparation of Agrobacterium tumefaciens EHA105pSoup competent cells for
electroporation (Hood et al., 1993)................................................................... 19
2.3.1 Agrobacterium transformation through electroporation ........................... 20
2.3.2 Preparation of glycerol stocks of bacteria................................................. 20
2.4 Plasmid DNA Isolation ..................................................................................... 20
2.4.1 Requirements ............................................................................................ 20
2.4.2 Procedure .................................................................................................. 21
2.5 Plant Transformation ........................................................................................ 21
2.5.1 N. benthamiana leaf infiltration for transient studies ............................... 21
2.5.2 Tobacco transformation ............................................................................ 23
2.5.2 Generation of suspension cells from transgenic tobacco plants ............... 23
2.5.3 Pea (Pisum sativum L.) transformation..................................................... 23
2.5.3.1 Seed selection and surface sterilization ................................................ 23
2.5.3.2 Preparation of explants and Agrobacterium inoculation ...................... 24
2.5.3.3 Brief summary of pea transformation ................................................... 24
2.6 Functional analysis assays ................................................................................ 25
2.6.1 Semiquantitative luciferase assay ............................................................. 25
2.6.2 Luc imaging .............................................................................................. 26
2.6.3 Fluorimetric MUG Assay ......................................................................... 26
2.6.4 Chlorophenol Red (CR) assay .................................................................. 26
2.7 Genomic DNA isolation ................................................................................... 27
2.7.1 Invitrogen charge switch gDNA plant kit protocol................................... 27
2.7.2 CTAB method of genomic DNA isolation ............................................... 28
vii
2.7.2.1 Isolation of genomic DNA for PCR (mini isolation)............................ 28
2.7.2.2 Isolation of genomic DNA for Southern blot (maxi isolation) ............. 29
2.8 Reverse Transcription-Polymerase Chain Reaction (RT-PCR)........................ 30
2.8.1 Isolation of RNA....................................................................................... 30
2.8.2 Measuring RNA concentration ................................................................. 31
2.9 Southern blot by DIG labeled probe ................................................................. 31
2.9.1 Buffers and solutions ................................................................................ 31
2.9.2 DIG labeling probe preparation by PCR................................................... 33
2.9.2.1 PCR mixture.......................................................................................... 33
2.9.2.2 PCR Programme. .................................................................................. 34
2.9.3 Restriction digest of gDNA for Southern blot .......................................... 34
2.9.3.1 Precipitation of the digest ..................................................................... 34
2.9.3.2 Electrophoresis...................................................................................... 35
2.9.3.3 Capillary Southern-transfer................................................................... 35
2.9.3.4 Pre-hybridization and hybridization ..................................................... 36
2.9.3.5 Non-radioactive detection..................................................................... 36
2.9.3.6 Stripping of the membrane.................................................................... 36
2.10 Fresh / dry weight measurement of the calli ..................................................... 36
2.11 Statistical analysis............................................................................................. 37
3 RESULTS ................................................................................................................. 38
3.1 Vector construction........................................................................................... 38
3.1.1 Isolation of AtNHX1.................................................................................. 38
3.1.1.1 PCR based cloning of the AtNHX1 gene............................................... 38
3.1.1.2 Cloning of AtNHX1 gene in T/A Cloning vector.................................. 39
3.1.1.3 Confirmation of the cloned fragment by sequencing............................ 40
3.1.1.4 Sub cloning of AtNHX1 into pGreenII binary vector (Monocistronic). 41
3.1.1.5 Functionality of AtNHX1 (monocistronic)............................................ 41
3.1.2 Dicistronic vector constructs..................................................................... 43
3.1.2.1 Confirmation of the dicistronic vector construct
pGII0229MASguscp148luc ...................................................................... 44
3.1.2.2 Functionality of Vector constructs........................................................ 45
3.1.3 Sub cloning of AtNHX1 in dicistronic vector system ............................... 46

viii
3.1.3.1 Confirmation of AtNHX1 cDNA........................................................... 46
3.1.3.2 Functionality of 0229MAS nhx1/luc .................................................... 47
3.2 Stable transformation of dicistronic vectors (0229MASgus / luc and
0229MASnhx1/luc)............................................................................................... 48
3.3 Generation of suspension cells from MASnhx1/luc transgenic calli and s
election on the basis of luciferase expression ................................................... 52
3.3.1 Luciferase expression in transgenic cells under NaCl challenge.............. 54
3.4 Selection of suspension cells under phosphinothricin (ppt) vs sodium chloride
(NaCl) ................................................................................................................... 58
3.4.1 Selection of suspension cells under phosphinothricin (ppt) ..................... 58
3.4.2 Growth of suspension cells under (NaCl)................................................. 58
3.4.3 Suspension cells under Sodium chloride (NaCl) + phosphinothricin (ppt)
selection .................................................................................................... 59
3.5 Southern blot analysis of transgenic tobacco cells. .......................................... 62
3.6 Pea transformation ............................................................................................ 62
3.6.1 Luciferase expression in T0, T1 and T2 generation of MASnhx/luc
transgenic Pea plants................................................................................. 64
3.6.2 Expression of luciferase in transgenic pea cotyledons ............................. 66
3.6.3 Analysis of transgenic (MASnhx/luc) pea plants by PCR........................ 67
4 DISCUSSION........................................................................................................... 71
CONCLUSIONS............................................................................................................... 79
OUTLOOK ....................................................................................................................... 80
SUMMARY...................................................................................................................... 81
REFERENCES ................................................................................................................. 84
APPENDIX –I .................................................................................................................. 96
L.B Broth for E. coli (High salt) ................................................................................... 96
APPENDIX-II................................................................................................................... 96
L.B Broth for Agrobacterium (Low salt)...................................................................... 96
APPENDIX-III ................................................................................................................. 97
MMA medium for leaf infiltration................................................................................ 97
APPENDIX-IV ................................................................................................................. 98
Callus induction medium (4X)...................................................................................... 98
ix
Media for Tobacco Transformation .................................................................................. 98
APPENDIX-V................................................................................................................... 98
MS liquid ...................................................................................................................... 98
APPENDIX VI.................................................................................................................. 99
MS-1 ............................................................................................................................. 99
APPENDIX – VII ............................................................................................................. 99
MS-2 ............................................................................................................................. 99
APPNDIX – VIII ............................................................................................................ 100
MS 0 Medium ............................................................................................................. 100
Media for Pea Transformation ........................................................................................ 101
APPENDIX – IX............................................................................................................. 101
B5-i re-suspension medium ........................................................................................ 101
APPENDIX – X.............................................................................................................. 102
B5hT Co-cultivation medium ..................................................................................... 102
APENDIX – XI............................................................................................................... 103
MST Regeneration medium........................................................................................ 103
APPENDIX – XII ........................................................................................................... 104
P2 selection medium................................................................................................... 104
STATEMENT OF SOURCES........................................................................................ 105
CURRICULUM VITAE................................................................................................. 106
x
LIST OF FIGURES
Fig. 1: Restriction map of AtNHX1 (3016 bp) from A. thaliana....................................... 12
Fig. 2: Map of plasmid pGII0229 (basic vector) .............................................................. 13
Fig. 3: Cloning of target genes in pG0229 basic vector. .................................................. 14
Fig. 4: Subcloning of the luciferase gene (monocistronic). .............................................. 15
Fig. 5: TMV cp148 IRES in antisense orientation............................................................ 16
Fig. 6: Subcloning of AtNHX1 in dicistronic vector system in place of β-glucuronidase
gene. .................................................................................................................................. 16
Fig. 7: Infusion of the agrobacteria harboring specific plasmid construct into tobacco
leaves for transient expression. ......................................................................................... 22
Fig. 8: PCR amplification of AtNHX1 from six Arabidopsis plants. ................................ 38
Fig. 9: PCR amplified product restricted with HindIII and SacI. ..................................... 38
Fig. 10: Confirmation of the AtNHX1 with HindIII. Left lane is 1kb DNA marker......... 39
Fig. 11: Cloning of AtNHX1 gene in T/A cloning vector (pTZ57R). ............................... 40
Fig. 12: Confirmation of the cloned gene fragment through restriction analysis of
pTZ57R with HindIII........................................................................................................ 40
Fig. 13: Subcloning of AtNHX1 in pGreen vector under the control of double 35S
promoter. ........................................................................................................................... 41
Fig. 14(a): WT vs AtNHX1 transgenic calli (monocistronic) on Gamborg B5) growth
medium having CR pH indicator (first day of growth)..................................................... 42
Fig. 14(b): Functionalitiy of AtNHX1 (monocistronic) transgenic vs wild type calli after 4
weeks of growth................................................................................................................ 42
Fig. 15: Dry weight of transgenic AtNHX1 (monocistronic) vs wild type tobacco calli
growing on Gamborg B5 medium . .................................................................................. 43
Fig. 16: Dicistronic vector construct, pGII0229MASgus/luc........................................... 44
Fig. 17:.Confirmation of the cloned genes in dicistronic vector pG0229MASguscp148luc
........................................................................................................................................... 44
Fig. 18: Luciferase activity in transient expression after 3 days of leaf infiltration. ........ 45
Fig. 19: Kinetics of β-glucuronidase activity after transient expression in N. bethamiana
leaves................................................................................................................................. 46
Fig. 20: Synthesis of AtNHX1 cDNA. .............................................................................. 46
xi
Fig. 21: Confirmation of AtNHX1 cDNA by ClaI and SacI restriction enzymes ............. 46
Fig. 22: Functionality of MASgus/luc and MASnhx1/luc vectors. .................................. 47
Fig. 23: Transient luciferase expression of MASgus/luc and MASnhx/luc in infiltrated
tobacco leaves under salt challenge. ................................................................................. 48
Fig. 24: Kinetics of β-glucuronidase activity in MASgus/luc tobacco cells..................... 49
Fig. 25: Luciferase expression in transgenic MASgus/luc and MASnhx1/luc plant derived
suspension cells................................................................................................................. 49
Fig. 26: Wild type vs MASnhx1/luc transgenic tobacco calli growing on Gamborg B5
(4x) medium containing CR pH indicator at different NaCl concentrations (2nd day of
growth).............................................................................................................................. 50
Fig. 27: Wild type vs MASnhx/luc transgenic tobacco calli growing on Gamborg B5 (4x)
medium containing CR pH indicator at different NaCl concentrations (after 4 weeks of
growth).............................................................................................................................. 51
Fig. 28: Dry wt of MASnhx1/luc transgenic and wild type calli after 4 weeks of growth
under different NaCl concentrations. ................................................................................ 52
Fig. 29:.Growth of transgenic TO plants derived suspension cells (MASnhx1/luc) under
different NaCl concentrations. .......................................................................................... 53
Fig. 30: Luciferase expression in MASnhx1/luc suspension cells under NaCl challenge.54
Fig. 31: Luciferase activity of AtNHX1 transgenic suspension cells on solid medium
(LAU: linear arbitrary) units)............................................................................................ 54
Fig. 32: Luciferase activity imaging in titer plate cultures. .............................................. 55
Fig. 33: Luciferase expression quantification in suspension cells at different time
intervals,............................................................................................................................ 56
Fig. 34: MASnhx/luc transgenic vs wild type cells - fresh weight measurement after 4
weeks of growth under NaCl challenge. ........................................................................... 57
Fig. 35: Analysis of AtNHX1 integration in T1 tobacco plants and in suspension cells. 57
Fig. 36: Analysis of luciferase gene integration in T1 tobacco plants and in suspension
cells. .................................................................................................................................. 58
Fig. 37: MASnhx1/luc transgenic tobacco cells growing under 5 mg/l ppt in Gamborg B5
(4x) medium...................................................................................................................... 59
Fig. 38: Selection of wild type and MASnhx1/luc transgenic cells under different NaCl
concentration..................................................................................................................... 60
xii
Fig. 39: MASnhx1/luc transgenic cells under NaCl + ppt selection. ............................... 61
Fig. 40: Southern blot analysis of 0229MASnhx1/luc transgenic suspension cells ......... 62
Fig. 41: WT and transformed pea embryos on P2 media containing chlorophenol red
indicator and ppt 5mg/l. .................................................................................................... 63
Fig. 42: Luciferase expression(RLU) in shoot regenerating transgenic pea calli............. 64
Fig. 43: MASnhx/luc transgenic shoot grafted on non transgenic root stock................... 65
Fig. 44: Luciferase expression inMASnhx1/luc transgenicT0 and WT pea leaves by
spraying luciferin over the leaves ..................................................................................... 65
Fig. 45: MASnhx/luc transgenic T1 pea cotyledon expressing luciferase under Fuji
imager LAS 3000.............................................................................................................. 66
Fig .46: Luciferase expression in MASnhx/luc transgenic T1 pea seeds. ........................ 66
Fig. 47: Luciferase expression in T0, T1 and T2 MASnhx/luctransgenic pea plants....... 67
Fig. 48: AtNHX1 integration in T0 MASnhx/lucPea plants............................................. 67
Fig. 49: T1 pea plants expressing bar gene....................................................................... 68
Fig. 50: AtNHX1 integration (300 bp) in T1 pea plants................................................... 68
Fig. 51: T2 pea plants - Integration of bar gene................................................................ 69
Fig. 52: T2 pea plant - Integration of luciferase gene....................................................... 69
Fig. 52: T2 pea plants - Integration of AtNHX1 gene. ..................................................... 70

xiii
ACKNOWLEDGEMENTS
All praises and thanks for Almighty Allah, who is entire source of knowledge and
wisdom endowed to mankind and all respects are for His last Prophet Hazrat Muhammad
(peace be upon him), who is forever a torch of guidance and knowledge for humanity as a
whole.
I am deeply indebted to my supervisors Prof. Dr.Hans Jörg Jacobsen from plant
biotechnology department Gottfried-Wilhelm-Leibniz-Universität Hannover, and Dr
Fauzia Yusuf Hafeez from National Institute for Biotechnology and Genetic Engineering
(NIBGE) Pakistan whose stimulating suggestions and encouragement helped me all of
the time in my research career.
I would like to thank my committee members, Prof Dr Bernhard Huchzermeyer and Prof
Dr Edgar Maiss for their valuable suggestions.
The work presented in this dissertation could not have been done without Dr Heiko
Kiesecker from Deutsche Sammlung von Mikroorganismen und Zellkulturen (DSMZ)
who provided precious philosophical guidance, the scientific approach and unlimited
encouragement throughout the research period. I have my deep hearted thanks to him.
I express my gratitude to Dr Martin Schumacher (DSMZ) for providing friendly research
environment, highly caring behavior and also his thought provoking suggestions and
discussions helped me to write this thesis. My appreciation also goes to all members and
colleagues of Plant cell culture group of DSMZ for technical help in my PhD research.
I took initiative to work with relevance to salt tolerant transgenic plants while working
with Mr. Zahid Mukhtar from NIBGE. I would like to acknowledge him for his
constructive hints and support.
Especially I am obliged to my respectable teacher Mr. Muhammad Afzal, whose
everlasting moral support and prayers brought a big turning point in my scientific and
personal life as well. I came under the supervision of Mr. Afzal in 1988 when I got
admission in 6th grade. In school although I studied mathematics physics and chemistry
by him but his thematic and literary approach made me able to respect humanity. He is
my teacher forever and although physically he is 6000 km away from me at this moment
but his feelings, good wishes and prayers always run with me

xiv
I express my gratitude to German Academic Exchange Service (DAAD) for Ph.D. award
under sandwich programme and also I appreciate Prof. Dr. Erko Stackebrandt (Director
DSMZ) who provided me funds and facilities to finish this PhD work.
Finally, I would like to express the deepest appreciation to my family's support, my
parents, brothers and sisters and especially to my wife Saadia`s encouragement,
understanding and love enabled me to complete this work. Last but not the least with the
foundation of the support of my family members, I have been able to aspire for this level
of education. I could never be in a position of achieving my goals of life without firm
support and prayers of my parents which made me believe in me.
Zahid Ali
xv
LIST OF ABBREVIATIONS
µl Micro liter
µM Micro Mole
A. thaliana Arabidopsis thaliana
A .tumefaciens Agrobacterium tumefaciens
AtNHX1 Arabidopsis thaliana Na+/H+ exchanger
B5 B5 basal medium
BAP 6-benzyl-amino-purine
Bar BASTA® (bialaphos) resistance gene
bp base pair
CaMV Cauliflower Mosaic Virus
CCLR Cell Culture Lysis Reagent
CR Chlorophenol red (pH indicator)
CTAB Cetyl Tri-methyl Ammonium Bromide
DMSO Dimethyl sulfoxide (Commercial solvent)
EDTA Ethylene Diamine Tetra Acetate
g/l gram per liter
gDNA genomic Deoxyribo Nucleic Acid
Gus/gusA β-glucuronidase (enzyme/gene)
IBA Indole Butyric Acid
Kb Kilo base pair
LAU Linear Arbitrary Units
LAR Luciferase Assay Reagent
LB Left Border
LB Lauria Bertani
Luc Luciferase
ml milli liter
MAS Manopine Synthase promoter
mg/l milligram per Liter
MS Murashige and Skoog medium

xvi
MCS Multiple Cloning Site
mRNA messenger Ribonucleic Acid
Mug Fluorometric substrate 4-methylumbelliferyl-β-D-glucuronide
N. benthamiana Nicotiana benthamiana
N. tabacum Nicotiana tabacum
ng nano gram
NAA 1-naphthyl-acetic acid
Na+/H+ Sodium/proton
PAT Phosphinothricin acetyltransferase
PCR Polymerase Chain Reaction
PPT Phosphinothricin
RB Right Border
RLU Relative Light Units
RT Room temperature
RT-PCR Reverse Transcription Polymerase Chain Reaction
T0 First transgenic plant directly induced from callus
T1 First generation of seeds and plants after self-cross on T0 plants
T2 Second generation of seeds and plants after self-cross on T1 plants
T-DNA Transferred DNA
TE buffer Buffer solution containing 10 mM Tris and 1 mM EDTA
Ti-Plasmid Tumor-inducing Plasmid
WT Wild Type
Introduction
1
1 INTRODUCTION
1.1 Overview
Coordinated expression of multiple protein under the control of one promoter may
facilitate to influence or alter biosynthetic pathways leading to secondary metabolites or
to improve physiological traits and may help to express proteins of therapeutic or
diagnostic use. Such a coordinated expression of target genes would open new avenues
for functional genomics in transient expression systems as well as in stably transformed
tissues or entire plants. Genetic engineering of crop plants can improve drought tolerance
as it has been attempted by classical genetic methods with only some successes
(Sottosanto et al., 2007; Zhang et al., 2001; Heranandez et al., 2000; Apse et al., 1999).
Application of agricultural biotechnology to enhance drought and salinity tolerance in
plants is still in progress for finding a robust and single translational monitoring system
for basic research. For the intervention into the osmo regulative processes the coordinated
expression of two or more proteins/enzymes might be necessary. Beside the possibility of
gene stacking via crossing of transgenic plants, internal ribosome entry sites (IRES)
(Martin et al., 2004; Urwin et al., 2004; Dorokhov et al., 2001) could help to overcome
this problem much faster if the second protein is not needed to be of high abundance. One
promoter would drive two genes, the first one translated in the cap dependent manner and
the second one cap independent by the IRES element since the IRES mediated expression
is low (Dirks et al.,1993). In agro biotechnology although coordinated expression of two
genes is still a problem but seems to be possible by the IRES mediated approach.
Therefore dicistronic vectors for the translational control of target genes were made and
tested. Three kinds of IRES elements Tobamo IRES, polio IRES and putative Zea mays
IRES elements were used as intercistronic spacers in dicistronic vector system.
Functionality of the vector system was confirmed by marker gene constructs β-
glucuronidase and firefly luciferase. A sodium/proton anti porter gene from A. thaliana
has been used for the improvement of salt tolerance in plants (Cixin et al., 2005;
Blumwald, 2000) in place of GUS gene as a first cistron in front of a luciferase gene
which is mediated by an IRES element Comparative investigations were made on the
basis of luciferase expression in transgenic tobacco plant derived suspension cells by

Introduction
2
applying stress against the targeted gene AtNHX1. Finally studies were conducted to
transform the IRES mediated dicistronic system to pea (Pisum sativum L.) by
Agrobacterium mediated transformation which was used as a leguminous model plant.
Studies were conducted on the basis of luciferase expression which can ensure that the
first cistron (AtNHX1) is also being expressed.
OBJECTIVES
Development of a dicistronic gene expression system using β-glucuronidase and
firefly luciferase marker genes. This will be based on the performance of IRES
elements in which absolute transcriptional linkage of two genes on one mRNA is
combined with the physical separation of each of the proteins.
Cloning of sodium/proton anti porter gene (AtNHX1) in a mono and dicistronic
vector system for the two reasons
o As a proof of the principle for the new vectors.
o For the enhancement of the drought and salt tolerance in legumes.
Agrobacterium mediated plant transformation (Tobacco, Pea) using the
dicistronic vector system and selection of transgenic tissues/plants on the basis of
expression of the second cistron (luciferase) for physiological tests.
Introduction
3
1.2 Soil salinity
Among abiotic stresses, salinity is a major environmental problem throughout the world
(Blumwald, 2000; Apse et al., 1999; Blumwald et al., 1985) caused by both biophysical
and human factors which limit the crop growth. This problem is going to increase with
global warming and thus imposes significant difficulties during plant/crop growth
developmental stages (Wang et al., 2003) which ultimately reduce the net production and
crop yield (Munns, 1993; 2002). The food security of rapidly growing population is
dependent on the continuous development and improvement of crop plants with increased
salinity and drought tolerance (Denby et al., 2005). Plant growth is affected by salinity in
various ways e.g. by imposing water deficit, causing ion specific stresses resulting in
disturbed K+/Na+ ratio and increasing the concentration of Na+ and Cl- which are lethal to
cells in higher concentrations (Yamaguchi et al., 2005).
The detrimental affects of salinity can vary with different growth stages (Adam, 1990).
Particularly seed germination and emergence and early developmental stages are
sensitive to salinity (Ungar, 1996; Mariko et al., 1992).
According to an FAO (2005) survey, more than 800 million hectares of the land are
affected by salts and out of this 397 million hectares are affected only by salinity. This
problem is going to increase at alarming rates. In Pakistan for example, out of nearly 20
million hectares of cultivable land, about 6 million have been classified as saline or saline
sodic and the productive areas are being damaged at an alarming rate of 40,000 hectare
per year (Alam et al., 2000).
1.2.1 Soil salinity and plant response
For tolerating adverse salinity effects, the plant defense system gets activated and
responds in two different ways, either by restricting the uptake of salts and adjusting the
osmotic pressure by accumulating the osmolytes for example proline, glycinebetaine and
other simple or complex sugars i.e. salt sensitive plants (Chinnusamy et al., 2005) or by
transporting and sequestering the excessive amount of salts into vacuoles by controlling
the concentration of salts in vacuoles and plasma membrane i.e., salt tolerant plants by
maintaining high cytosolic K+/Na+ ratio in their cells (Glenn et al., 1999).
Introduction
4
1.2.2 Soil salinity and legumes
Grain legumes are an excellent and inexpensive source of plant protein. Many species are
growing well on marginal soils. When eaten in combination with wheat, rice and other
cereals they provide a balanced diet for millions of people. Pulses are known as “poor
man’s meat” in the developing world, while in the developed world they are perceived as
“health food”. Being leguminous they maintain soil fertility by converting and fixing
atmospheric nitrogen in available form through symbiosis with rhizobia (Hafeez et al.,
1988). Additionally, pulses are also important components of animal feed. Studies have
revealed that in grain legumes salt stress causes an alteration of root hair curling,
reduction in the number of rhizobia attached to root hairs and decreased nodule size. Also
the amount of fixed nitrogen per unit weight of the nodules declines with increased salt
stress (Miller et al., 1996; Hafeez et al., 1988).
1.3 Genetic engineering for stress tolerance
Genetic engineering has provided additional tools for the confirmation of molecular
markers in functional genomics or directly to improve the plants. There is broad
consensus that climate change continues to occur and that stress from climatic extremes
will continue, which are imposing considerable difficulties in plant and crop growth in
many parts of the world (Denby and Gehring, 2005).
The technology for transferring genes to plants is already available (Blumwald, 2000;
Potrykus, 1991), even for more refractory cereals (Klein et al., 1992). However, the
major problem with this approach is the isolation of the relevant halo tolerance genes to
be transferred. These genes could be components of the normal adaptation of either crop
or halophytic plants to drought/salt stress and their constitutive over expression in the
transgenic plants which may improve salt tolerance. On the other hand halo tolerance
genes could be obtained from non plant resources, in the same manner that the bacterial
toxins genes for insect killing are engineered into plants (Vaeck et al., 1987). Genes have
been isolated from yeast, bacteria and plants which potentially confer drought and salt
tolerance in plants. Attempts have already been made to transform model plants like
tobacco, Arabidopsis or even rice (Grover et al., 2003). In 2001, Zhang and Blumwald
made an excellent report by developing transgenic tomato plants carrying the AtNHX1
Introduction
5
(Na+/H+ antiporter) gene from A. thaliana which could grow and produce fruits in the
presence of sea water. Later on Zhang, et al., (2001) also transferred AtNHX1 gene to
Brasscia napus and reported that the plants over expressing AtNHX1 were able to grow
and produce seeds in the presence of 200 mM sodium chloride. Shi et al., (2003) showed
the enhancement of salt tolerance in A. thaliana using the same gene. Recently Cixin et
al., (2005) reported the incorporation of AtNHX1gene in cotton by showing AtNHX1 over
expressing cotton plants generated more biomass and produced more fibers when grown
in the presence of 200 mM NaCl under greenhouse conditions.
Successes have been reported in developing stress (drought/salt) tolerant transgenic
plants especially in tobacco, Arabidopsis, rice, tomato, canola, cotton etc. (Cixin et al.,
2005; Shi et al., 2003; Zhang et al., 2001) but still there are not sound reports proving the
applications for agricultural biotechnology to enhance drought and salinity tolerance
(Denby et al., 2005). All of the approaches which are well established and published are
on the basis of single gene transfer used to enhance drought/salt tolerance in transgenic
plants. In parallel, there are several technical and financial challenges associated with
transforming many crop plants (Yamaguchi et al., 2005) especially in monocots (other
than rice) and legumes.
1.4 Translation (IRES elements)
In eukaryotic cells translation initiation is recruited by the cap structure present at 5´ end
of mRNA (Hershey et al., 2000; Salas et al., 2001). In addition to cap dependent
translation there is another way of translation initiation which is mediated by cis-acting
elements. These elements are called internal ribosome entry sites (IRES elements)
(Jackson, 2000). The best studied example of the cap-independent mode of translation
initiation in eukaryotes is the IRES elements (Eric Jan, 2006; Sachs et al., 1997; Pelletier
and Sonnenberg, 1988).
With the discovery of Picorna virus RNAs IRES elements, many functional IRES
elements have been identified in an increasing number of mRNAs from animal cells and
their pathogens (Carter et al., 2000).
First discovered in viral DNA, it was later shown that even in eukaryotic translation
under stress conditions (e.g. viral infection) cap dependent translation is severely
compromised due to many factors for example poor availability of eIF factors (Cuesta et
Introduction
6
al., 2000; Gradi et al., 1998) but IRES mediated translation prevails (Johannes et al.,
1999; Johannes et al., 1998; Macejak et al., 1991).
Studies are still in progress for finding IRES elements in plant cells and plant viruses
(Salas et al., 2001). Naturally many plant viral mRNAs are without a cap structure so
their translation initiation can be considered to be cap independent (Niepel et al., 1999;
Skulachev et al., 1999).
Using these findings in order to co-express two distinct coding sequences under the
control of one promoter is of great interest for the modern biology (Martin et al., 2006).
Gene stacking via crossing of transgenic plants is a conventional breeding practice but
can be limited because of many factors, for example the procedure is quite lengthy and
time consuming and it is also sensitive for expression instabilities of transgenic in
combinatorial plants, since the promoter and other sequence homologies may result in
gene silencing (Matzke, 1993; Mette, 2000). The combinatorial plants are highly
vulnerable for these negative effects in case identical selectable marker genes or DNA
imprinting (Adam, 2000). Although the strategy of crossing transgenic plants has been
used successfully (Halpin and Boerjan, 2003) was difficult to obtain the coordinated
expression of multiple genes. An alternative strategy to co expressing multiple proteins in
plants is by encoding them in two or more open reading frames (ORFs) by IRES
elements. In a combined gene expression, IRES elements from polio virus or
encephalomyocarditis virus have been used to construct bi or multicistronic expression
vectors to co-express various genes from one mRNA (Hennecke et al., 2001; Urwin et
al., 2001). Various other sources have been used for the isolation of IRES elements like
Picorna viruses (Pelletier and Sonenberg, 1988; Gan and Rhoads, 1996) or some other
animal viruses (for example retroviruses and hepatitis C virus), mammalian and
Drosophila RNAs (Reynolds et al., 1995; Bernstein et al., 1997; Akiri et al., 1998;
Negulescu et al., 1998; Chappell et al., 2000; Henis-Korenblit et al., 2000).
The advantage of this IRES mediated approach is that both proteins are under the control
of same the promoter (Martin et al., 2006) thus the expression of both proteins is linked.
Additionally it also limits the usage of multiple promoters in multi genes vector system
(Hennecke et al., 2001).

Introduction
7
1.5 Agrobacterium mediated gene transfer
To express plant reporter genes and analyzing structural components of plant promoters,
Agrobacterium based transient expression system have been successfully used in leaf
tissues like N. benthamiana, N. tabacum, Phaseolous vulgaris, Phaseolous acutifolius,
Lactuca sativa, A. thaliana, Pisum sativum and Linum usitatissimum (Cazzonelli et al.,
2006; Wroblewski et al., 2005; Van der Hoorn et al., 2000; Kapila et al., 1997). The
basis of the Agrobacterium mediated transient expression system is that the pieces of
DNA are transcriptionally competent although these do not integrate into the
chromosome (Hellens et al., 2005). Furthermore, many different heterologous proteins
can be expressed without generating transgenic plants as this might be difficult and time
consuming in many plant species (Horn et al., 2004; Fisher et al., 1999).
For analyzing the functional characteristics of the target proteins, transient gene
expression is a fast, flexible and reproducible approach (Cazzonelli et al., 2006; Voinnet
et al., 2003). Agrobacterium culture infused into plant leaves, mediates the transfer of
transgenes from the T-DNA region of the bacterial Ti plasmid molecules into the plant
cells and most of the plant cells in the infiltrated region express the transgene (Kapila et
al., 1997). For the identification of appropriate candidate genes in transgenic approaches
it seems to be essential to test the constructs in the target plant at least at the cellular
level. A further essential requirement for an effective transient expression system is a
suitable reporter gene assay (Cazzonelli et al., 2006). Monitoring transient gene
expression in plants by luciferase based reporter genes (firefly luciferase) is well reported
and published. An important advantage of these systems is its respective sensitivity
(Cazzonelli et al., 2006; Ow et al., 1986).
1.6 Legume transformation
Regarding legume transformation many successes have been made and published Köhler
et al., (1987); Puonti-Kaerlas et al., (1989; 1990); De. Kathen and Jacobsen, (1990);
Davies et al., (1993); Russell et al., (1993); Grant et al., (1995); Bean et al., (1997);
Kiesecker (2000); Polowick et al., (2000); Ikea et al., (2003) Senthil et al., 2004;
Pniewski and Kapusta, (2005) and Richter et al., (2006) by establishing various protocols
but still there are species and genotypes which are considered to be more calcitrant for
Introduction
8
regeneration and transformation especially chickpea, lentil, bean and also pea.
Development of reproducible and efficient regeneration systems enabling and selection of
transgenic plants during regeneration is a really critical factor for any successful
transformation in monocots and in dicots as well. The bottleneck for legumes (bean, pea,
chickpea etc.) transformation is the lacking of transformation compatible regeneration
systems, not the transformation itself although transformation efficiency in legumes is
also quite poor (0.2% Richter et al., 2006; 2.5% Schroder et al., 1993).
In addition screening against the target gene for example stress tolerance, needs field
components as most of the stress tolerance assays used by basic researchers involve
nutrient rich media (Yamaguchi et al., 2005) whereas saline soils contain multiple kinds
of salts i.e. CaCl2, NaCl, CaSO4, Na2SO4 and high amounts of Boron. Each of the salt has
its individual and combined effect on plant growth. So those plants which show particular
tolerance to salt should eventually be tested on these soils (Yamaguchi et al., 2005).
Finally there is still lack of availability of reliable gene expression and selection systems
for functional level analysis for basic studies. Among legumes, because of high protein
contents in the seeds, pea is also becoming more important for the production of high-
value recombinant molecules in molecular pharming (Perrin et al., 2000; Saalbach et al.,
2001).
Materials and Methods
9
2 MATERIALS AND METHODS
2.1 Vector construction
Mono and dicistronic binary vectors based on pGreenII vectors were made by applying
conventional molecular biology techniques (Sambrook and Russell, 2001).
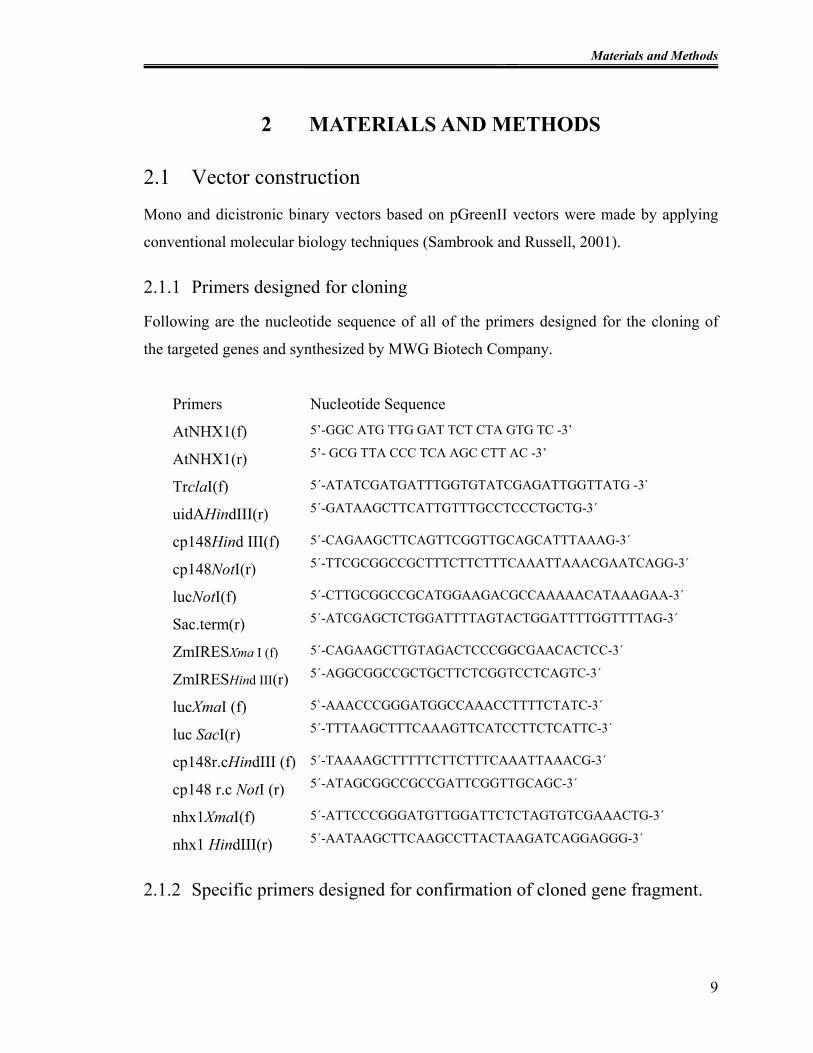
2.1.1 Primers designed for cloning
Following are the nucleotide sequence of all of the primers designed for the cloning of
the targeted genes and synthesized by MWG Biotech Company.
Primers Nucleotide Sequence
AtNHX1(f)
AtNHX1(r)
5’-GGC ATG TTG GAT TCT CTA GTG TC -3’ 5’- GCG TTA CCC TCA AGC CTT AC -3’
TrclaI(f)
uidAHindIII(r)
5´-ATATCGATGATTTGGTGTATCGAGATTGGTTATG -3` 5´-GATAAGCTTCATTGTTTGCCTCCCTGCTG-3´
cp148Hind III(f)
cp148NotI(r)
5´-CAGAAGCTTCAGTTCGGTTGCAGCATTTAAAG-3´ 5´-TTCGCGGCCGCTTTCTTCTTTCAAATTAAACGAATCAGG-3´
lucNotI(f)
Sac.term(r)
5´-CTTGCGGCCGCATGGAAGACGCCAAAAACATAAAGAA-3´ 5´-ATCGAGCTCTGGATTTTAGTACTGGATTTTGGTTTTAG-3´
ZmIRESXma I (f)
ZmIRESHind III(r)
5´-CAGAAGCTTGTAGACTCCCGGCGAACACTCC-3´ 5´-AGGCGGCCGCTGCTTCTCGGTCCTCAGTC-3´
lucXmaI (f)
luc SacI(r)
5`-AAACCCGGGATGGCCAAACCTTTTCTATC-3´ 5´-TTTAAGCTTTCAAAGTTCATCCTTCTCATTC-3´
cp148r.cHindIII (f)
cp148 r.c NotI (r)
5´-TAAAAGCTTTTTCTTCTTTCAAATTAAACG-3´ 5´-ATAGCGGCCGCCGATTCGGTTGCAGC-3´
nhx1XmaI(f)
nhx1 HindIII(r)
5´-ATTCCCGGGATGTTGGATTCTCTAGTGTCGAAACTG-3´ 5´-AATAAGCTTCAAGCCTTACTAAGATCAGGAGGG-3´
2.1.2 Specific primers designed for confirmation of cloned gene fragment.
Materials and Methods
For the confirmation of integrated genes in transgenic suspension cells and entire tobacco
and pea plants specific primers were designed against each targeted gene by Operon
(molecules for life) Company as below.
Primer name Nucleotide sequences
Bar 382
Bar 149
5`-AGCCCGATGACAGCGACCAC-3´
5`-GCAGGAACCCGAGTGGA-3´
At-nhx (f) 138
At-nhx (r) 437
5`-ATAGATGGATGAACGAAT-3´
5`-AGTCAAAGGTTCCAATGT-3´
Luc 837 (f)
Luc 837 (r)
5`-CCTTCCGCATAGAACTGCCT-3´
5`-TCCAAAACAACAACGGCG-3´
nhx 808 (f) 5`-GACATTGGAACCTTTGACTTGG-3´
nhx 808 (r) 5`-CGGCCCTTGTAAACTTGTTGTA-3´
2.1.3 Proof reading High Fidelitiy (HF) PCR Mixture for cloning of target
genes.
Reagents and concentrarions Probe
10x HF buffer + MgCl2 5 µl
10 mM dNTPs 1 µl
10 pmol primer (F) 1 µl
10 pmol primer (R) 1 µl
Immulase polymerase 0.5 µl
Double dist H2O 40.5 µl
Plasmaid DNA (1:100 dilution) 1 µl
Total 50 µl
10
Materials and Methods
2.1.4 PCR Programme.
For all of the PCR based cloning steps following PCR profile was used.
For High fidelity (HF) proof reading polymerase
PCR steps Temperature (°C) Time (s) No. of cycles
Initial denaturation 94 300 1
Denaturation 94 40
Annealing 57 40 35
Extension 72 120
Final extension 72 600
Cooling and storage 4
2.1.5 Purification of PCR product
For all of the PCR based cloning experiments, the amplified PCR products were purified
by using the Qiagen MinElute PCR purification kit protocol as below:
5 volumes of Buffer PB were added to 1 volume of PCR reaction mixture (before the
amplified PCR product was confirmed by running on agarose gel) and mixed gently.
Then MinElute column provided in 2 ml collection tube was put in a suitable rack and
applied the sample to the MinElute column. Centrifuged for 1 min, discarded the flow
through and placed the MinElute column back into the same tube. For washing 750 µl of
buffer PE was added to the MinElute column and again centrifuged for 1 min. The flow
through was discarded and put the column back into the tube. The column was
centrifuged again for 1 min at maximum speed to remove the residual ethanol
completely. After washing the column was put into new 1.5 ml micro centrifuge tube and
elution of the DNA was done by adding 10 µl buffer EB directly on the center of the
11
Materials and Methods
column. Let the column stand for 1 min and centrifuged again for 1 min to collect the
DNA in micro centrifuge tube. The purified product was used for further cloning steps.
2.1.6 Monocistronic vectors
Monocistronic vectors were constructed using Cauliflower mosaic virus (CaMV35S) and
Mannopine synthase (MAS) promoter.
2.1.6.1 Isolation of AtNHX1 from A. thaliana
The AtNHX1 gene was isolated from A. thaliana. PCR amplification of the target gene
was based on specific primers designed against the sequence information available with
the Gene Bank accession (NM122597).
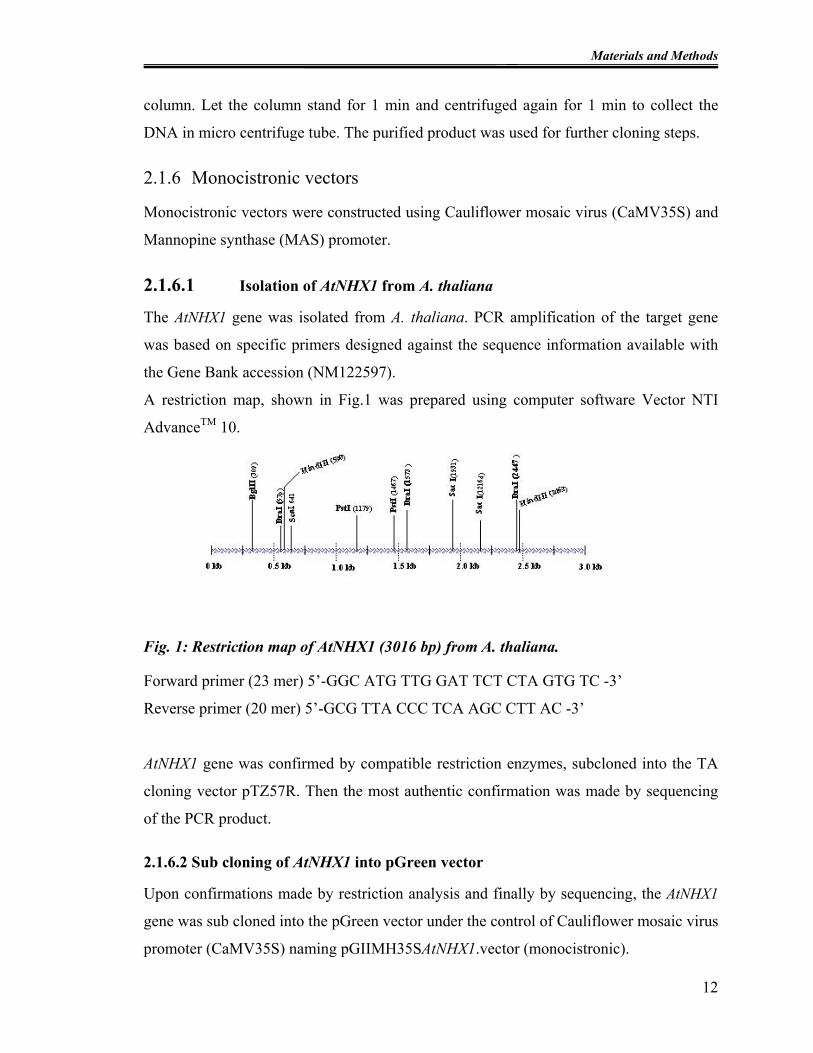
A restriction map, shown in Fig.1 was prepared using computer software Vector NTI
AdvanceTM 10.
Fi 1 R i i f A NHX1 (3016 b ) f A b d h l
Fig. 1: Restriction map of AtNHX1 (3016 bp) from A. thaliana.
Forward primer (23 mer) 5’-GGC ATG TTG GAT TCT CTA GTG TC -3’
Reverse primer (20 mer) 5’-GCG TTA CCC TCA AGC CTT AC -3’
AtNHX1 gene was confirmed by compatible restriction enzymes, subcloned into the TA
cloning vector pTZ57R. Then the most authentic confirmation was made by sequencing
of the PCR product.
2.1.6.2 Sub cloning of AtNHX1 into pGreen vector
Upon confirmations made by restriction analysis and finally by sequencing, the AtNHX1
gene was sub cloned into the pGreen vector under the control of Cauliflower mosaic virus
promoter (CaMV35S) naming pGIIMH35SAtNHX1.vector (monocistronic).
12

Materials and Methods
2.1.7 Dicistronic vectors
A series of plasmid constructs were made based on the pGreen vector pGII0229 using
Cauliflower mosaic virus 35S promoter, and Mannopine synthase (MAS) promoter down
stream marker genes β-glucuronidase (Jefferson et al., 1987) and firefly luciferase gene
(promega). Three kinds of IRES elements, tobacco mosaic virus derived IRES element
TMVIREScp148 (Dorokhov et al.,2002), polio virus derived IRES (Dirks et al., 1993)
and Zea mays IRES (Dinkova et al., 2004) elements were used as inter cistronic
sequences. Intermediate constructs were made by using pSBCI vector (Dirks et al.,
1993). Brief description of the vectors construction is explained below.
pGII02294448 bp
bar
LB
RB
Primer 297 MHGreen
Primer 303 MHGreen r1
nos-promotor
nos-terminator
HindIII
KpnI
SacI
XmaI
ClaI (1171)
ClaI (1421)
Fig. 2: Map of plasmid pGII0229 (basic vector)
2.1.7.1 pGII0229MASguscp148luc (control vector)
In the first approach, based on the pGreenII vector β-glucuronidase(GUS ) gene
(Jefferson et al., 1987) was cloned under the control of Mannopine synthase(MAS)
promoter (Fox et al., 1992) as a first cistron downstream firefly luciferase gene as a
second cistron behind Tobamo TMVcp148 IRES elements (Dorokhov et al., 2002) as
13
Materials and Methods
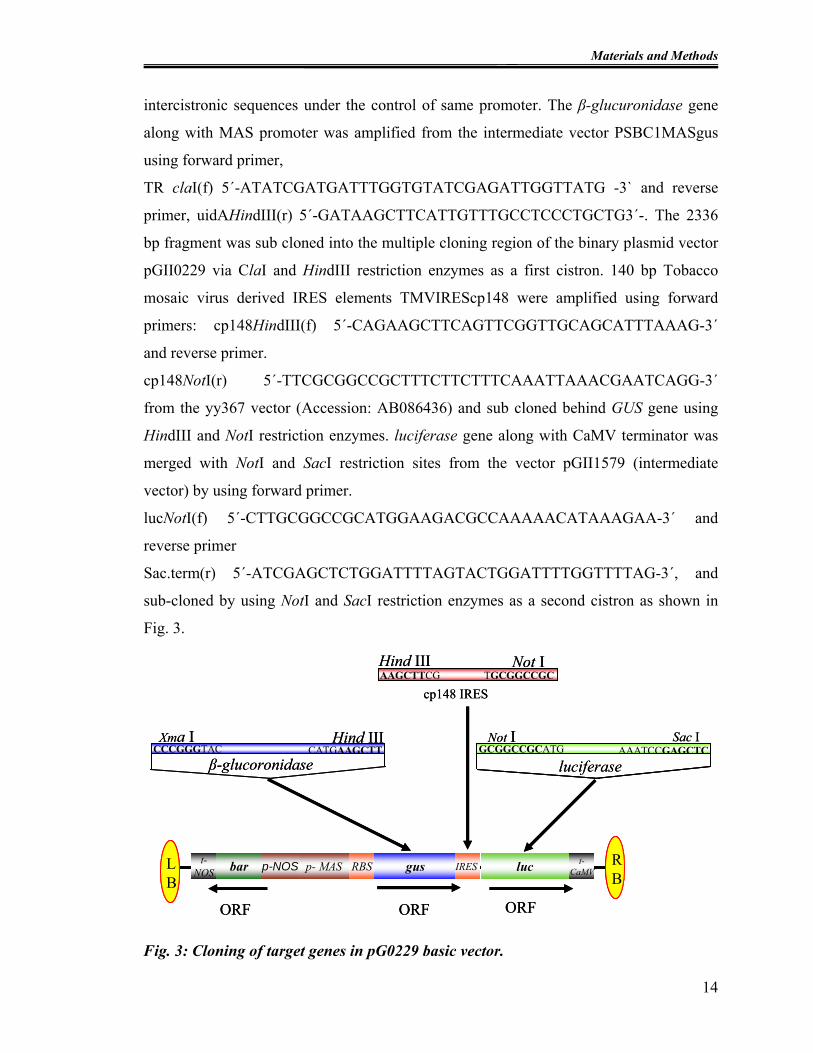
intercistronic sequences under the control of same promoter. The β-glucuronidase gene
along with MAS promoter was amplified from the intermediate vector PSBC1MASgus
using forward primer,
TR claI(f) 5´-ATATCGATGATTTGGTGTATCGAGATTGGTTATG -3` and reverse
primer, uidAHindIII(r) 5´-GATAAGCTTCATTGTTTGCCTCCCTGCTG3´-. The 2336
bp fragment was sub cloned into the multiple cloning region of the binary plasmid vector
pGII0229 via ClaI and HindIII restriction enzymes as a first cistron. 140 bp Tobacco
mosaic virus derived IRES elements TMVIREScp148 were amplified using forward
primers: cp148HindIII(f) 5´-CAGAAGCTTCAGTTCGGTTGCAGCATTTAAAG-3´
and reverse primer.
cp148NotI(r) 5´-TTCGCGGCCGCTTTCTTCTTTCAAATTAAACGAATCAGG-3´
from the yy367 vector (Accession: AB086436) and sub cloned behind GUS gene using
HindIII and NotI restriction enzymes. luciferase gene along with CaMV terminator was
merged with NotI and SacI restriction sites from the vector pGII1579 (intermediate
vector) by using forward primer.
lucNotI(f) 5´-CTTGCGGCCGCATGGAAGACGCCAAAAACATAAAGAA-3´ and
reverse primer
Sac.term(r) 5´-ATCGAGCTCTGGATTTTAGTACTGGATTTTGGTTTTAG-3´, and
sub-cloned by using NotI and SacI restriction enzymes as a second cistron as shown in
Fig. 3.
β-glucoronidase
AAGCTTCG TGCGGCCGC
cp148 IRES
Not IHind III
Not I Sac IGCGGCCGCATG AAATCCGAGCTC
Xma I Hind IIICCCGGGTAC CATGAAGCTT
luciferase
lucgus IRES t-CaMVp- MAS RBSt-
NOS p-NOSbar
ORFORFORF
RB
LB
β-glucoronidase
AAGCTTCG TGCGGCCGC
cp148 IRES
Not IHind III
Not I Sac IGCGGCCGCATG AAATCCGAGCTC
Xma I Hind IIICCCGGGTAC CATGAAGCTT
luciferase
lucgus IRES t-CaMVp- MAS RBSt-
NOS p-NOSbart-NOS p-NOSbar
ORFORFORF
RBRB
LBLB
Fig. 3: Cloning of target genes in pG0229 basic vector.
14
Materials and Methods
In second approach Zea mays IRES elements were cloned in place of TMV IRES using
forward primers
ZmIRES XmaI (f) 5´-CAGAAGCTTGTAGACTCCCGGCGAACACTCC-3´ and a
reverse primer ZmIRES HindIII (r) 5´-AGGCGGCCGCTGCTTCTCGGTCCTCAGTC-
3´. In third approach Polio IRES elements were cloned into dicistronic vector system in
place of Tobamo IRES elements for comparative studies by merging HindIII and NotI
restriction on their 5´ and 3´ ends, respectively.
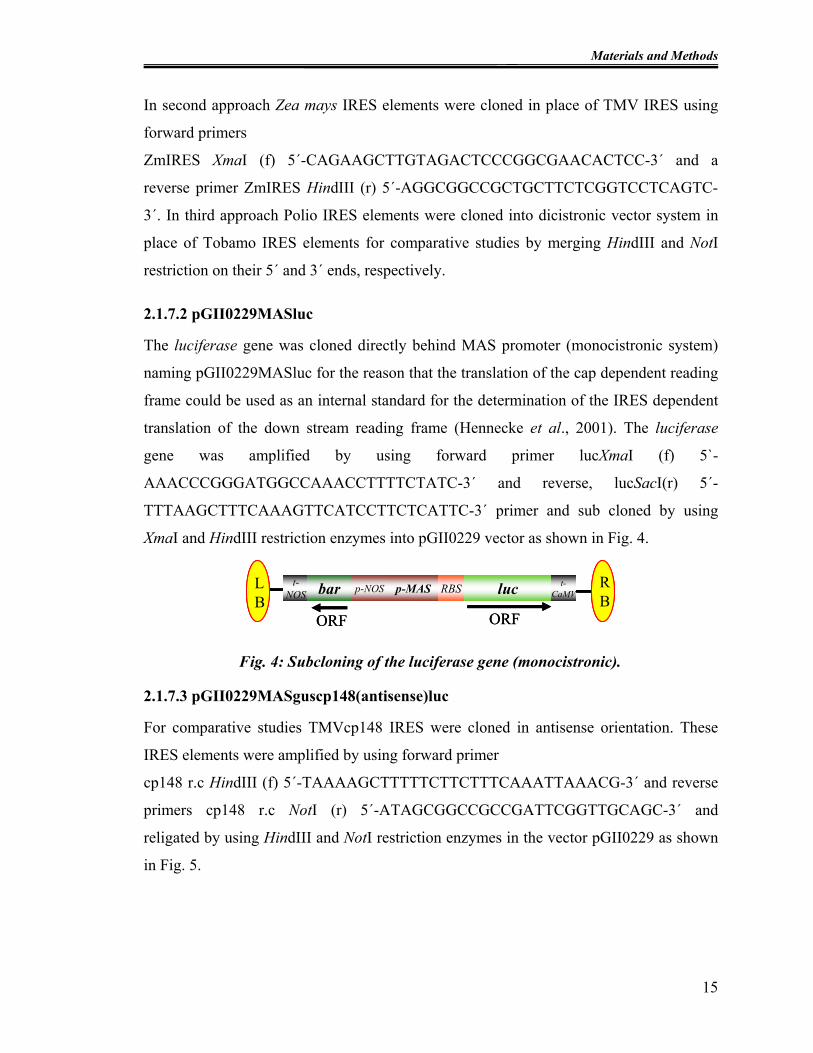
2.1.7.2 pGII0229MASluc
The luciferase gene was cloned directly behind MAS promoter (monocistronic system)
naming pGII0229MASluc for the reason that the translation of the cap dependent reading
frame could be used as an internal standard for the determination of the IRES dependent
translation of the down stream reading frame (Hennecke et al., 2001). The luciferase
gene was amplified by using forward primer lucXmaI (f) 5`-
AAACCCGGGATGGCCAAACCTTTTCTATC-3´ and reverse, lucSacI(r) 5´-
TTTAAGCTTTCAAAGTTCATCCTTCTCATTC-3´ primer and sub cloned by using
XmaI and HindIII restriction enzymes into pGII0229 vector as shown in Fig. 4.
ORF ORF
luc t-CaMVp-MAS RBSt-
NOS p-NOSbar RB
LB
ORF ORF
luc t-CaMVp-MAS RBSt-
NOS p-NOSbar RBRB
LBLB
Fig. 4: Subcloning of the luciferase gene (monocistronic).
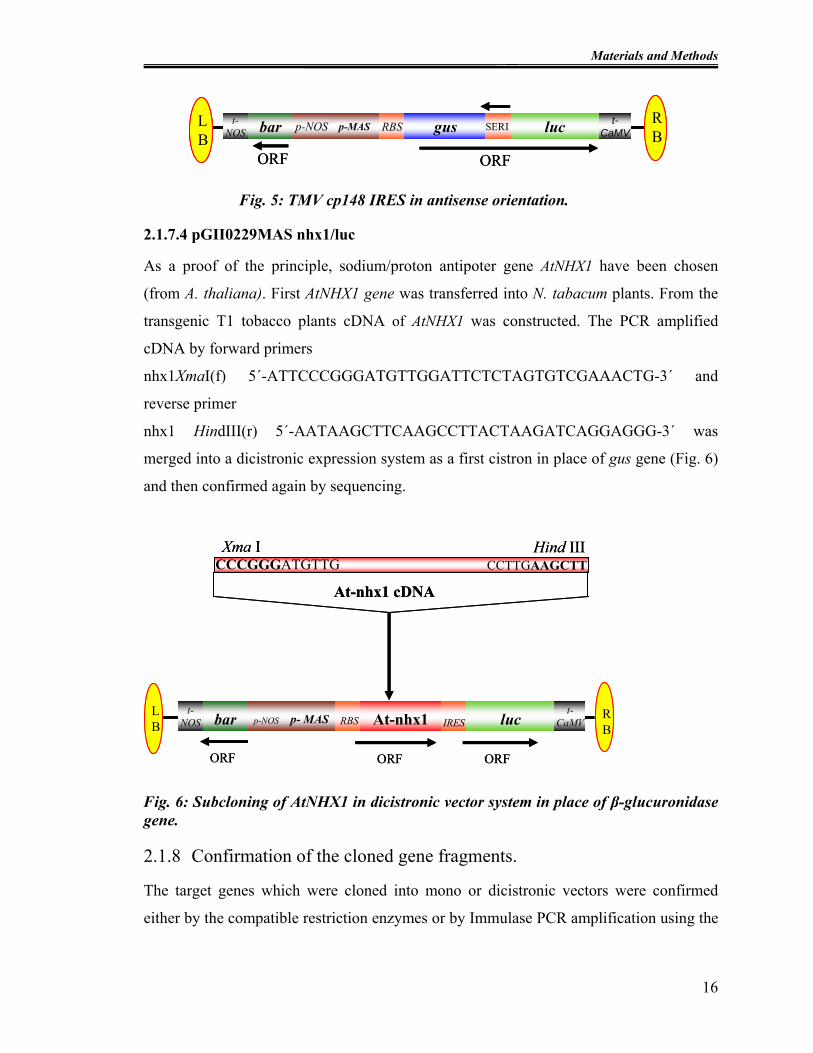
2.1.7.3 pGII0229MASguscp148(antisense)luc
For comparative studies TMVcp148 IRES were cloned in antisense orientation. These
IRES elements were amplified by using forward primer
cp148 r.c HindIII (f) 5´-TAAAAGCTTTTTCTTCTTTCAAATTAAACG-3´ and reverse
primers cp148 r.c NotI (r) 5´-ATAGCGGCCGCCGATTCGGTTGCAGC-3´ and
religated by using HindIII and NotI restriction enzymes in the vector pGII0229 as shown
in Fig. 5.
15
Materials and Methods
ORF ORF
lucgus SERI t-CaMVp-MAS RBSt-
NOS p-NOSbar RB
LB
ORF ORF
lucgus SERI t-CaMVp-MAS RBSt-
NOS p-NOSbar RBRB
LBLB
Fig. 5: TMV cp148 IRES in antisense orientation.
2.1.7.4 pGII0229MAS nhx1/luc
As a proof of the principle, sodium/proton antipoter gene AtNHX1 have been chosen
(from A. thaliana). First AtNHX1 gene was transferred into N. tabacum plants. From the
transgenic T1 tobacco plants cDNA of AtNHX1 was constructed. The PCR amplified
cDNA by forward primers
nhx1XmaI(f) 5´-ATTCCCGGGATGTTGGATTCTCTAGTGTCGAAACTG-3´ and
reverse primer
nhx1 HindIII(r) 5´-AATAAGCTTCAAGCCTTACTAAGATCAGGAGGG-3´ was
merged into a dicistronic expression system as a first cistron in place of gus gene (Fig. 6)
and then confirmed again by sequencing.
CCCGGGATGTTGXma I Hind III
RB
LB lucAt-nhx1 IRES
t-CaMVp- MAS RBS
t-NOS p-NOSbar
ORF ORFORF
At-nhx1 cDNA
CCTTGAAGCTTCCCGGGATGTTGXma I Hind III
RB
LB lucAt-nhx1 IRES
t-CaMVp- MAS RBS
t-NOS p-NOSbar
ORF ORFORF
At-nhx1 cDNA
CCTTGAAGCTT
Fig. 6: Subcloning of AtNHX1 in dicistronic vector system in place of β-glucuronidase gene.
2.1.8 Confirmation of the cloned gene fragments.
The target genes which were cloned into mono or dicistronic vectors were confirmed
either by the compatible restriction enzymes or by Immulase PCR amplification using the
16
Materials and Methods
specific primer designed against the target sequences. Following PCR mixture and
programme were used.
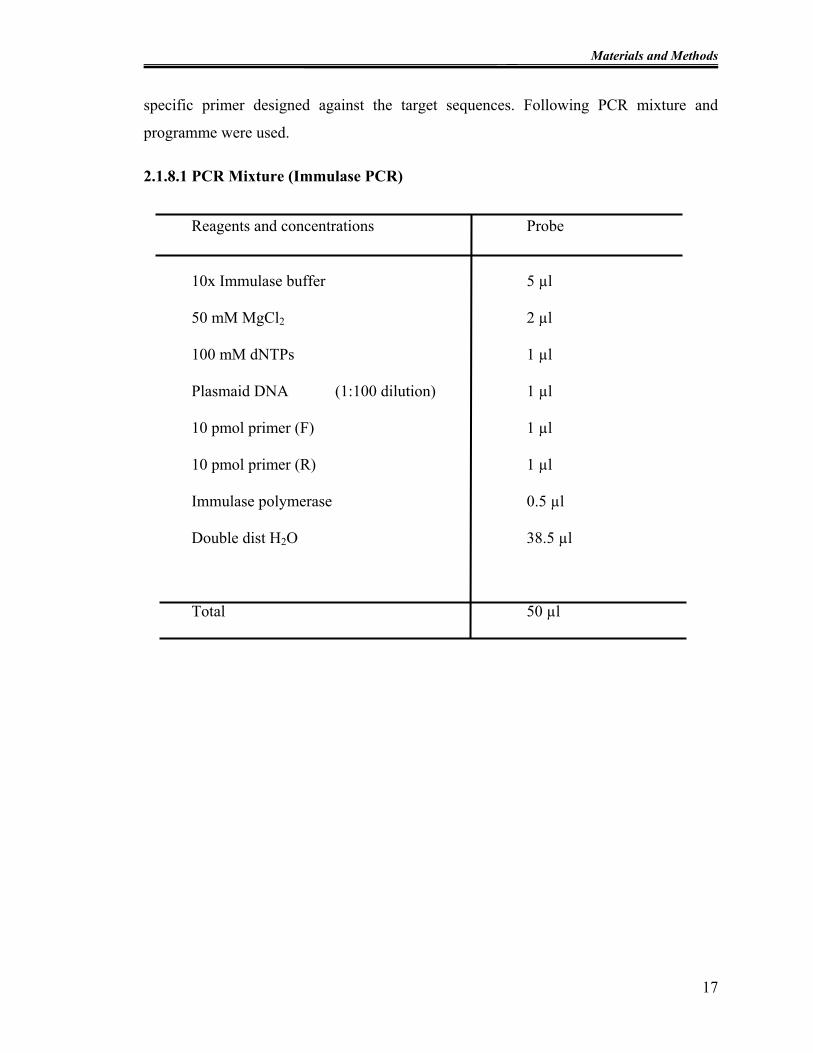
2.1.8.1 PCR Mixture (Immulase PCR)
Reagents and concentrations Probe
17
10x Immulase buffer 5 µl
50 mM MgCl2 2 µl
100 mM dNTPs 1 µl
Plasmaid DNA (1:100 dilution) 1 µl
10 pmol primer (F) 1 µl
10 pmol primer (R) 1 µl
Immulase polymerase 0.5 µl
Double dist H2O 38.5 µl
Total 50 µl

Materials and Methods
2.1.8.2 PCR programme using Immulase polymerase for confirming cloned genes
PCR steps Temperature (°C) Time (s) No. of cycles
18
Initial denaturation 95 420 1
Denaturation 94 40
Annealing 57 60 35
Extension 72 120
Final extension 72 600
Cooling and storage 4 ∞
2.2 E. coli competent cells preparation for heat shock
transformation
Many of the species of bacteria including E. coli take up DNA in a limited amount under
normal conditions. For efficient transformation of these species these bacteria have to
pass through chemical and physical treatments to enhance their ability to take up DNA.
Such cells which pass through such kind of treatments are called competent cells (Brown,
2006). To prepare E. coli competent cells (Tang et al., 1994; Nakata et al., 1997), E. coli
strain (2163) was grown overnight in 1-5 ml of LB medium (appendix I) at 37°C (without
antibiotics) to the stationary phase. The overnight culture was diluted in fresh LB 1:50
and grown at 37°C until an O.D600 was reached of ~0.4. The cells were harvested by
centrifugation at 4°C, 4400 rpm, and re-suspended in 1/2 volume ice-cold 100 mM CaCl2
and centrifuged again. The supernatant was discarded and the pellet was re-suspended in
1/2 volume of ice-cold 100 mM CaCl2. Upon centrifugation pelleted cells were re-

Materials and Methods
19
suspended in 1/10 volume of cold 100 mM CaCl2 and incubated on ice for 1 hour. The
cells were used immediately for heat shock transformation. For storage, 86% sterile
glycerol was added to a final concentration of 15% and then aliquots of 100 µl were
made in 1.5 ml tubes, the tubes were transferred immediately in liquid nitrogen and
stored at -80°C for further processes.
2.2.1 E. coli heat shock transformation
Competent E. coli cells (from-80°C) were kept on ice to thaw, 50 ng of ligation mixture
or plasmid DNA were gently mixed with competent cells (in 1.5 ml Eppendorf tubes).
Incubated on ice for 20 min upon incubation, a temperature shock at 42°C was given to
competent cells (containing ligase mixture or plasmid DNA) for 40 seconds, immediately
returned back the tube on ice for 2 minutes to release heat stress. 900 µl of pre-cooled
SOC medium without antibiotics was added to reduce damage of E.coli cells. The tube
was incubated on a shaker at 250 rpm for 90 min at 37°C. 50 µl, 100 µl and 200 µl of the
resulting culture was spread independently on LB plates containing appropriate antibiotic
and grown overnight at 37°C. The colony growth was observed after 12-16 hours.
2.3 Preparation of Agrobacterium tumefaciens EHA105pSoup
competent cells for electroporation (Hood et al., 1993)
Agrobacterium tumefaciens strain EHA105 was co transformed with the pSoup helper
plasmid according to the pGreenII system (pGreen website: Hellens et al., 2000). An
overnight seed culture of 25 ml YEB supplemented with 5 mg/l tetracycline was
incubated with 250 µl of glycerol stock of EHA105pSoup at 28°C on a shaker. 2 ml of
bacterial suspension (overnight seed culture) were added to 50 ml LB agro (appendix II)
supplemented with kanamycin antibiotic and grown for 2-5 hours until O.D600 reached
~0.4-0.5. Bacteria were pelleted by centrifugation at 4400 rpm and 4°C for 10 min, re-
suspended twice in 25 ml ice-cold 10 % glycerol. The pellet was then re-suspended twice
in 2.5 ml ice-cold 10 % glycerol after centrifugation at 4400 rpm at 4°C for 10 min.
Finally, the pellet was re-suspended in 1 ml ice-cold 10 % glycerol. Aliquots of 100 µl
were split in 2 ml eppendorf tubes and transferred immediately into liquid nitrogen and
stored at -80°C.
Materials and Methods
20
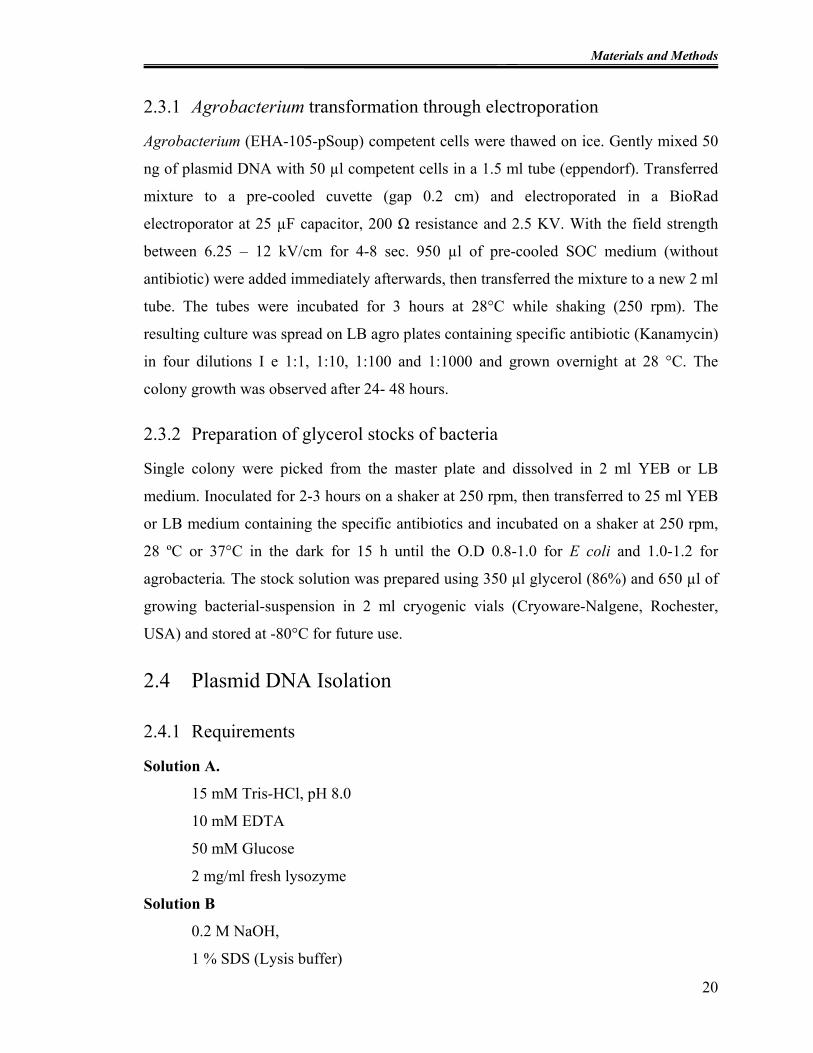
2.3.1 Agrobacterium transformation through electroporation
Agrobacterium (EHA-105-pSoup) competent cells were thawed on ice. Gently mixed 50
ng of plasmid DNA with 50 µl competent cells in a 1.5 ml tube (eppendorf). Transferred
mixture to a pre-cooled cuvette (gap 0.2 cm) and electroporated in a BioRad
electroporator at 25 µF capacitor, 200 Ω resistance and 2.5 KV. With the field strength
between 6.25 – 12 kV/cm for 4-8 sec. 950 µl of pre-cooled SOC medium (without
antibiotic) were added immediately afterwards, then transferred the mixture to a new 2 ml
tube. The tubes were incubated for 3 hours at 28°C while shaking (250 rpm). The
resulting culture was spread on LB agro plates containing specific antibiotic (Kanamycin)
in four dilutions I e 1:1, 1:10, 1:100 and 1:1000 and grown overnight at 28 °C. The
colony growth was observed after 24- 48 hours.
2.3.2 Preparation of glycerol stocks of bacteria
Single colony were picked from the master plate and dissolved in 2 ml YEB or LB
medium. Inoculated for 2-3 hours on a shaker at 250 rpm, then transferred to 25 ml YEB
or LB medium containing the specific antibiotics and incubated on a shaker at 250 rpm,
28 ºC or 37°C in the dark for 15 h until the O.D 0.8-1.0 for E coli and 1.0-1.2 for
agrobacteria. The stock solution was prepared using 350 µl glycerol (86%) and 650 µl of
growing bacterial-suspension in 2 ml cryogenic vials (Cryoware-Nalgene, Rochester,
USA) and stored at -80°C for future use.
2.4 Plasmid DNA Isolation
2.4.1 Requirements
Solution A.
15 mM Tris-HCl, pH 8.0
10 mM EDTA
50 mM Glucose
2 mg/ml fresh lysozyme
Solution B
0.2 M NaOH,
1 % SDS (Lysis buffer)
Materials and Methods
21
Solution C
3 M NaOAc, pH 4.8. (Neutrilizing buffer)
Solution D
0.1 M NaOAc, pH 7.0
0.05 M Tris-HCl pH 8.0
2.4.2 Procedure
2 ml of bacteria suspension were centrifuged at 14,000 rpm for 5 min. The supernatant
was discarded completely. For agrobacteria this step was repeated. The pellet was
carefully re-suspended in 200 µl of sol. A. The pellet was vortex till pellet dissolved
completely and incubated for 15 min at RT. 400 µl of sol. B was added and mixed very
gently to transparent color and then immediately 300 µl of sol. C was added, mixed
gently by inverting the tubes 5-6 times, followed by incubation for 15 min on ice. The
mixture was centrifuged twice for 10 min and the transparent supernatant (800 µl) was
transferred into a new 1.5 ml eppendorf-cap. Then 600 µl cold isopropanol (-20°C) were
added and gently mixed till the DNA started precipitating. After centrifugation for 10 min
at 14,000 rpm, the supernatant was discarded. The DNA pellet was re-dissolved in 200 µl
of sol. D, and incubated for 5 min at RT. Then 400 µl EtOHabs was added and mixed,
centrifuged for 10 min. The supernatant was discarded and the pellet was air dried for 30-
60 min at RT. The pellet (plasmid DNA) was dissolved in 50 µl TE buffer (48 µl TE +2
µl RNase). The quality of the DNA was checked by running on gel whereas the quantity
was measured by spectrophotometer by taking O.D of dsDNA at 260nm.
2.5 Plant Transformation
2.5.1 N. benthamiana leaf infiltration for transient studies
N. benthamiana seeds were germinated in soil. 4 to 5 weeks old (4-6 leaf stage) plants
were selected for leaf infiltration. Two experiments were conducted for the leaf
infiltration transient assay (Cazzonelli et al., 2006). In first experiments the functionality
of IRES elements was analyzed using different vector constructs i.e. pGII0229TRluc
(monocistronic), pGII0229MASguscp148luc, pGII0229MASguscp148(antisense)luc,
pGII0229MASguspolio IRESluc and pGII0229MASguszeamaizeIRESluc. In a second

Materials and Methods
series of experiments transient comparative study was conducted with and without salt
stress using pGII0229MASguscp148luc and pGII0229MASnhx1cp148luc vectors.
Agrobacterium strain EHA-105 harboring the specific plasmid construct were grown
overnight prior to leaf infiltration. Overnight grown cultures (OD600 0.8-1.0) were
independently centrifuged at 10,000 rpm for 10 min at 4°C. Supernatant was discarded
and the pallet was dissolved in the same volume of infiltration medium MMA (appendix
III). The suspended agrobacteria pellet was incubated at room temperature for 2 hours.
When all the dead cells settled down, the upper 10-15 ml of media was collected; OD600
was set to 0.9-1.0, and mechanically infused by pressing the tip of the syringe against the
lower surface of the leaf and applying the gentle pressure on the plunger as shown in
Fig.7. The infusion of the bacteria was monitored visually by observing a spread of the
capacity in the leaf as the bacterial suspension fills air space. Fully infused leaves were
marked. In the controls only the infiltration medium was infused. Plants were watered
after leaf infiltration equally. For salt stress studies the EHA105 strain harboring the
vector constructs pGII0229MASguscp148luc and pGII0229MASnhx1cp148luc were
grown over night and the same procedure was repeated as explained above but after
infusing agrobacteria into tobacco leaves, plants were watered with normal tap water
containing 100 mM NaCl. As control, plants were watered with the same volume of tap
water but without any additional NaCl. Plants were kept to grow at 20°C in dark for 60-
72 hours.
Fig. 7: Infusion of the agrobacteria harboring specific plasmid construct into tobacco leaves for transient expression.
Fully infused leaf areas were marked and selected for crude protein extraction. 22
Materials and Methods
23
2.5.2 Tobacco transformation
Transgenic T0 tobacco plants were recovered from Agrobacterium mediated leaf disc
transformation (Horsch et al., 1985) with some modifications. Leaf discs were taken from
in vitro grown tobacco plants (SR1). The over night culture of A. tumefaciens harbouring
specific plasmid construct was diluted as 50 ml MS-liquid (appendix V) + 500 µl bacteria
suspension. Soaked the leaf discs for maximum 30 min in an overnight culture of A.
tumefaciens, blotted dry and placed upside-down culture plates containing MS salts
including B5 vitamins (Duchefa), MS-1 medium (appendix VI). After 3 days of co
culture, the discs were washed with MS liquid containing 300 mg/l Tic. and transferred to
the same medium containing 300 mg/l of ticarcillin in dim light condition at 24°C.for one
week. Then further subculture on the same MS-1 medium containing 200 mg/l Tic and 5
mg/l ppt. and again after two weeks on MS-1 medium with reducing Tic (100 mg/l) and
ppt 5 mg/l. From the regenerating calli shoots were selected and subcultured on the MS-2
medium (appendix VII) Tic (100 mg/l) and ppt 5 mg/l in baby jars. Then subculture the
transgenic tobacco plants on MS-0 (appendix VIII) containing Tic 100 mg/l and ppt 5
mg/l.
2.5.2 Generation of suspension cells from transgenic tobacco plants
From the transgenic N. tabacum T0 and wild type tobacco plants, calli were induced on
4x Medium (appendix IV) (MS, containing 5 mg/l ppt). After callus induction and
confirming the transgenic nature of calli by PCR, cell suspensions were established in 4x
liquid medium from one of those T0 plant derived calli which showed luciferase
expression. Suspension cultures were maintained in 300 ml Erlenmeyer flasks containing
100 ml suspension under continuous light at 24°C and shaken on a gyratory shaker at a
speed of 100 rotations per minute. Routine subculture was done on a weekly basis by
dilution of 50 ml suspension with 50 ml fresh 4X medium.
2.5.3 Pea (Pisum sativum L.) transformation
2.5.3.1 Seed selection and surface sterilization
Pea seeds (cultivar Sponsor) were surface sterilized by soaking in 70% ethanol (EtOH)
(v/v) for 1 min followed by 6% sodium hypochlorite (NaOCl) for 5-10 min, with
Materials and Methods
24
agitation. Seeds were washed for 5-6 times with sterile de-ionized water and embedded in
water overnight.
2.5.3.2 Preparation of explants and Agrobacterium inoculation
Agrobacterium mediated pea transformation was carried out according to the protocol of
Schroeder et al., (1993) and Bean et al., (1997) with some modifications. Sterilized seeds
were split open, cotyledons were removed, radical tips were cut and the remaining
embryonic axis were sliced longitudinally with the help of razor blade (dipped into
desired agrobacteria culture) passing from the plumule to the embryonic stem into three
to five segments. The sliced embryos were inoculated with Agrobacterium suspension
supplemented with 100 μM acetosyringon and 5 μM TDZ for 40-50 min, while shaking
at 28°C with 60-70 rpm. Explants were blotted dry for 3-4 min on sterile filter paper and
plated on B5hT (appendix X) co cultivation medium for three days in the dark at 22±2°C.
After co cultivation, explants (white and white greenish color) were washed 3-4 times in
sterile distilled water until the wash out water become clear, the final wash was
supplemented with 100 mg/l Ticarcillin and incubated for 15 min on a shaker to remove
the agrobacteria. Then the explants were blotted dry on sterile filter paper and cultured on
shoot regeneration MST medium (appendix XI) for 10 days while covering the plates
with tissue paper to protect the embryos from high light stress, then subculture to MST
medium for another 10 days in light. Thereafter, the explants were sub-cultured on
selection medium P2 (appendix XII) and the healthy green shoots were sub-cultured
every three week to P2 fresh medium with increased concentrations of ppt to 2.5 mg/l, 5
mg/l, 7.5 mg/l, 10 mg/l, 12.5 mg/l, and 15 mg/l.
2.5.3.3 Brief summary of pea transformation
1) Excision of mature embryo in slices.
2) Inoculation the sliced embryos with Agrobacterium suspension for 40 to50 min at
28°C while shaking at 60 rpm.
3) Drying the agro inoculated embryos on sterile filter paper and incubation the
agrobacteria inoculated embryos for three days in the dark
(B5hT medium+TDZ) (co culture).
Materials and Methods
25
4) First subculture for one week in semi-dark condition
(MST+TDZ+NAA+Ticarcillin).
5) Second subculture for one week in light (MST+TDZ+NAA+Ticarcillin).
6) First selection for 2 to 3 week (P2+BAP+NAA+2.5 mg/l PPT).
7) Second selection 2 week (P2+BAP+NAA+5 mg/l PPT).
8) Further subcultures to fresh media in three to four week interval for selection and
multiplication.
9) In vitro grafting of shoots surviving the selection at 7.5 mg/l PPT.
10) Successful grafted shoots (after 8-15 days) transferred to greenhouse.
11) T0 seeds harvested after 30-45 days post grafting.
2.6 Functional analysis assays
2.6.1 Semiquantitative luciferase assay
Luciferase expression was observed by using Promega luciferase assay kit. For tobacco
leaves infused with desired agrobacteria, after incubation for 72 hours, Quick froze the
leaf tissues in liquid nitrogen; ground the frozen tissues to powder and re suspended in
1X lysis (CCLR) reagent by homogenization at RT. The homogenized material was
incubated at 4°C for one hour. Pelleted debris was removed by brief centrifugation and
supernatant was transferred to a new tube. 20 μl of cell lysate was mixed with 100 μl of
Luciferase Assay Reagent (LAR) and measured by luminometer Lumat L B 9501 by
Berthold Luminisence meter.
The suspension cells inoculated with agrobacteria have been washed 2-3 times with plant
media containing ticarcilline (150 mg/l). 100 mg cells were taken and dried on filter
paper. 300 µl 1X CCLR were added to 100 mg cells and cells were re suspended
completely by vortexing for 1-2 min. The cells were incubated at 4°C for one hour. Then
the cells centrifuged at 14,000 rpm at room temperature for 10 min. The supernatant was
collected 20 µl of this supernatant was mixed with 100 µl LAR and the RLU (relative
light units) values measured immediately by luminescence meter as explained above.
Materials and Methods
26
2.6.2 Luc imaging
Leaves were washed with tween (5%), rinsed with water and dried on filter paper.
Luciferin sodium salt was dissolved in water to a 1 mM concentration and sprayed over
the surface of the prepared leaves. In vitro callus material was sprayed with luciferin salt
without pretreatment. The images were taken with a Fuji LAS imager 2000 and processed
with the Aida® quantification software.
2.6.3 Fluorimetric MUG Assay
Because of highly increased sensitivity and a wide dynamic range, fluorometry is
preferred over spectrophotometry. for GUS activity measurement. GUS activity in
solution is usually measured with the fluorometric substrate 4-methyllumbelliferyl-β-D-
glucuronide (MUG).
20 µl of the extract (see 2.6.1) was added to 1 mM of MUG-buffer, (50 mM NaPO4, pH
7.0, 10 mM dithiothreitol (DTT), 1 mM Na2EDTA, 0.1% Sodium Lauryl Sarcosine, 0.1
% Triton X 100, 1 mM 4-methyllumbelliferyl-β-D-glucuronide (MUG). A kinetic of
recombinant glucuronidase activity was assayed in a semi quantitative way in three
replicates by measuring emission 465 nm after excitation at 360 nm at the temperature
range 35°C-38°C with a number of 20 replicate cycles 20 with a 15 minutes interval for
each and shaking before each measurement for 10 seconds. Measurement was performed
in a TECAN Genios device and analyzed with Magellan® software.
2.6.4 Chlorophenol Red (CR) assay
Plant cells on the specific medium supplemented with chlorophenol red (CR) induce a
color shift by decreasing the pH (from 6.0 to 5.0) if they are live and growing. The
magnitude of the pH decrease relates to growth rate of the cells. The CR assay was
performed according to protocol of Kramer et al., (1993) with some modifications for
callus, suspension cells and embryos. Phosphinothricin resistant calli and suspensions
cells were incubated on the media containing 5 mg/l ppt and 50 mg/l CR solidified with
1.0% sea-plaque agarose in the 24 well microtiter plate (each well contained 500 µl
media) under the fluorescent light with a 16/8 light/dark period. The pH of the medium
was adjusted to 6.0 without any buffering chemical which causes the medium color to be
red. Non transgenic calli and tobacco suspension cells were also grown for comparative
Materials and Methods
27
studies. For pea embryos and calli small petri dishes were used instead of micro titer
plates. The color shift in the medium was observed after 4 to 12 days of growth.
2.7 Genomic DNA isolation
For the characterization of transgenic plants and transgenic calli, the isolation of pure and
good quality DNA is an important tool for the identification of transgenes. In the present
study isolation of gDNA was done by two methods using the Invitrogen charge switch
gDNA plant kit and the CTAB method of Doyle and Doyle, 1990. First, for the PCR
screening, small scale (100-200 mg leaf material) DNA isolation was performed and on
the basis of results large scale (1-2 g leaf materials) DNA isolation was carried out. Both
protocols are described as:
2.7.1 Invitrogen charge switch gDNA plant kit protocol
Plant tissues were frozen in liquid nitrogen and the frozen tissues ground to powder using
a mortar and a pestle (for soft and non fibrous plant tissues: cut the tissues into small
pieces). 1 ml of charge switch lysis buffer and 2 µl RNase was added to ground tissues at
room temperature. The lysate was prepared by homogenizing the piece of soft tissues
with a tissue homogenizer or by vortexing. Then 100 µl of 10% SDS was added to the
plant lysate and incubated at RT for 5 min. 400 µl of charge switch precipitation buffer
was added to the lysate, mixed by vortexing for 10 sec until the precipitate was formed.
The lysate was centrifuged at maximum speed (14,000 rpm) for 5 min at RT. The clear
lysate was transferred to new sterile 1.5 ml microcentrifuge tubes. The tubes containing
the magnetic beads were thoroughly vortexed to fully resuspend the beads in the storage
buffer. Then, from the resuspended beads 100 µl were added to the approximate 1.2 ml
lysate. Now 40 µl ChargeSwitch magnetic beads were added and mixed gently by
pipetting. The mixture was incubated at RT for 1 min. The tubes were placed on the
MagnaRack to form a tight pellet. Without removing the tubes from the magnet, the
supernatant was carefully discarded without disturbing the pellet. Finally the pellet was
washed three times with 1 ml ChargeSwitch washing buffer. After washing, 150 µl
ChargeSwitch elution buffer was added and the pellet dispersed by pipetting 15-30 times
up and down (pipette volume adjusted to 100 µl). Then the resuspended beads were
incubated for 1 min at RT. Now the DNA free magnetic beads were precipitated again by

Materials and Methods
28
placing the tube back to the MagnaRack. When the DNA containing supernatant was
clear it was transferred to a new sterile micro centrifuge tube and used for further
processes.
2.7.2 CTAB method of genomic DNA isolation
CTAB-buffer
3 % CTAB (added after autoclaving and stirred overnight
1.4 M NaCl
0.2 % ß-Mercaptoethanol (added directly before using)
20 mM EDTA
100 mM Tris-HCl pH 8.0 (base)
0.5 % PVP-40 polyvinyl pyrolidone (soluble)
24:1 CI-Mix
24 part Chloroform +1 part Isoamylalcohol
TE-buffer + RNase A
10 mM Tris-HCl, pH 8.0
1 mM EDTA
10 µg/ml RNase A
Wash buffer (WB). 76 % Ethanol abs.
10 mM Ammonium acetate
7.5 M NH4-Acetate
0.5 M EDTA (pH 8)
RNase A
(10 µg/µl Stock solution in ddH2O)
2.7.2.1 Isolation of genomic DNA for PCR (mini isolation)
100 mg leaf material was harvested, crumbled to powder in liquid nitrogen using a pre-
cooled mortar and pestle. The ground material was transferred to 2 ml reaction tubes. 800
Materials and Methods
29
µl of pre-heated (60°C) CTAB-buffer was added (containing 0.2 % β-Mercaptoethanol)
followed by vigorous vortexing under a fume hood. The tubes were incubated for 30 min
at 60°C. After incubation 800 µl CI-mix was added and tubes were gently mixed to avoid
shearing of genomic DNA by inverting the tube for 4-5 times. The mixture was
centrifuged at room temperature for 10 min at 10,000 g. Two phases were developed. The
aqueous phase (~800 µl) was transferred into a fresh 1.5 ml tube (the step was repeated to
get a clear sample). 2/3 volume (550 µl) of pre-cooled (-20°C) isopropanol was added
and gently mixed to allow precipitation of gDNA. The tubes were centrifuged for 10 min
at 14,000 rpm to precipitate the gDNA. The supernatant was discarded and the DNA
pellet was washed with 200 µl wash buffer until the pellet floats. Washing buffer was
carefully removed and the pellet was re-suspended in 200 µl TE buffer supplemented
with RNase A, incubated for 30 min at 37°C, and then 100 µl 7.5 M NH4-acetate and 750
µl EtOHabs was added and gently mixed. The mixture was centrifuged at maximum speed
for 10 min at room-temperature. The supernatant was discarded completely and the pellet
let to dry for 40-50 min at 37°C. After drying the pellet was re-suspended in 100-250 µl
ddH2O or 100 µl TE buffer (for better solving and storing) and stored at 4°C over night.
2.7.2.2 Isolation of genomic DNA for Southern blot (maxi isolation)
2 g leaf material was harvested and pulverized in liquid nitrogen in a pre-cooled mortar
and pestle. The resulting powder was transferred into a 50 ml fresh tube. 3-5 ml of
preheated (60°C) CTAB-buffer (containing 0.2 % β-Mercaptoethanol) was added
followed by vortexing under the fume hood. The solution was incubated for 30 min at
60°C. 1 vol. of CI-Mix (3-5 ml) was added and gently mixed by inverting the tubes to
avoid shearing of genomic DNA. The mixture was centrifuged for 10 min (6400 rpm) at
RT and the clear aqueous phase transferred into a fresh tube (3-5 ml). For precipitation of
the gDNA, 2/3 volume of pre cooled (-20°C) isopropanol (2-3 ml) was added and gently
mixed. Precipitated DNA was collected by centrifugation for 10 min at 4000 rpm at RT;
the resulting pellet was washed with 1-2 ml WB until the pellet floats. The washing-
buffer was carefully removed and the pellet resuspended in 0.5-1 ml TE buffer
supplemented with RNase A and incubated for 30 min at 37°C. 1/2 vol of 7.5 M NH4-
acetate and 2.5 vol. of EtOHabs were added and gently mixed. Then the mixture was
centrifuged for 10 min at 4600 rpm at room-temperature. The supernatant was completely
Materials and Methods
30
discarded and the pellet dried at 37°C for 60 min, the pellet was resuspended in 200-400
µl TE buffer at 4°C overnight to allow dissolving of the gDNA. Samples were heated for
5 min at 60-65°C before observing DNA quality on an agarose gel.
2.8 Reverse Transcription-Polymerase Chain Reaction (RT-PCR)
For the transcription analysis of the introduced genes RT-PCR was applied. RNA was
isolated from transformed and non-transformed plants. cDNA was synthesized by reverse
transcriptase (MMLV-RT). Then normal PCR was performed with the cDNA as
template. RNA was isolated from young tobacco leaves using NucleoSpin RNA plant kit
(Machery-Nagel, Germany) following the manufacturer's instructions or using Plant
RNA Reagent (Invitrogen, Canada).
2.8.1 Isolation of RNA
100 mg of plant material was quickly frozen in liquid nitrogen and ground using a cold
mortar and pestle. The plant powder was transferred to 1.5 ml caps and 500 µl cooled
(4°C) Plant RNA Reagent was added and mixed by vortexing. The mixture was
incubated for 5 min at room-temperature and then the solution clarified by centrifugation
(2 min at 12,000xg at RT). The supernatant was transferred to fresh 1.5 ml tubes and 100
µl of 5 M NaCl was added and tubes were tapped to mix. Finally 300 µl of chloroform
was added and mixed thoroughly by inversion and the mixture centrifuged at 4°C for 10
min at 12,000 g. The aqueous phase was transferred to a fresh tube (~ 500 µl) and an
equal volume of isopropanol was added and mixed by inversion and let stand at RT for
10 min. The samples were centrifuged at 4°C for 10 min at 12,000 g. The supernatant
was discarded and the pellet washed with 1000 µl Ethanol abs. followed by
centrifugation for 1 min at 12,000 g. The liquid was carefully decanted by taking care not
to loose the pellet. Then it was briefly centrifuged to collect the residual liquid and the
liquid was removed with a pipette. The pellet was re dissolved in 30 µl RNase free water
and the RNA concentration was measured by spectrophotometer.

Materials and Methods
31
2.8.2 Measuring RNA concentration
The RNA concentration was quantified using a spectrophotometer. The RNA was diluted
1:200 (199 µl H2O + 1 µl RNA), and respective RNA-concentration was calculated as
follows:
RNA concentration µg/ml = (OD260 x Dilution factor x 40)
The purity of the RNA was determined using the ratio of OD260:OD280, which should be
between 1.9 and 2.0 for pure RNA.
2.9 Southern blot by DIG labeled probe
To confirm integration patterns of TDNA and to determine the copy number of the
integrated transgenes, Southern blotting was performed according to Southern, (1975).
Genomic DNA was prepared from transgenic and non transgenic plants by the large scale
DNA preparation method. Non radioactive detection methods and DIG labelled PCR
products for the different genes were used.
2.9.1 Buffers and solutions
Pre-hybridization solution: Dig Easy Hyb. (Roche Diagnostics, Mannheim,
Germany)
Hybridization solution: 45 µl probe + 33 ml Dig Easy Hyb.
Blocking Solution: 1 % blocking solution (Roche) in maleic acid buffer
Antibody solution: (Anti-Digoxigenin-alkaline phosphatase conjugate
Fab Fragments) (Roche Diagnostics) 1:10,000 (75
mU/ml in blocking solution.
Depurinizing solution 0.25 M HCl
Neutralization Solution pH 7.5 0.5 M Tris-base, (pH 7.5), 3 M NaCl
SDS 10 % (Filter sterilized)
Materials and Methods
32
Maleic acid buffer pH 7.5 0.1 M maleic acid, 0.15 M NaCl
(autoclaved)
Detection buffer pH 9.5 100 mM Tris-HCl, 100 mM NaCl
Denaturation Solution pH 9.5 0.5 N NaOH, 1.5 M NaCl
20x SSC buffer pH 7 3 M NaCl, 0.3 M sodium citrate
Washing buffer 0.1 M Maleic acid buffer, 0.15 M NaCl 0.3 %
(not autoclaved) Tween 20
Stripping buffer 0.2 M NaOH, 0.1 % SDS
DEA buffer pH 9.8 0.1 M DEA, 1 mM MgCl2
Developing solution 1: 3.5 dil. of Roentogen developer (Tetenal)
Photowerk GmbH, Norderstedt, Germany)
Fixation solution 1:4 dilution of Roentogen Superfix (Tetental
Photowerk GmbH, Norderstedt, Germany).
NBT 18.8 mg/ml (in 67%DMSO)
BCIP 9.4 mg/ml (in 67%DMSO)
Substrate buffer pH 9.5 100 mM Tris/HCl + 100 mM NaCl +5 mM MgCl2
Substarte for detection 40 ml substarte buffer +264 µl NBT + 272 µl BCIP
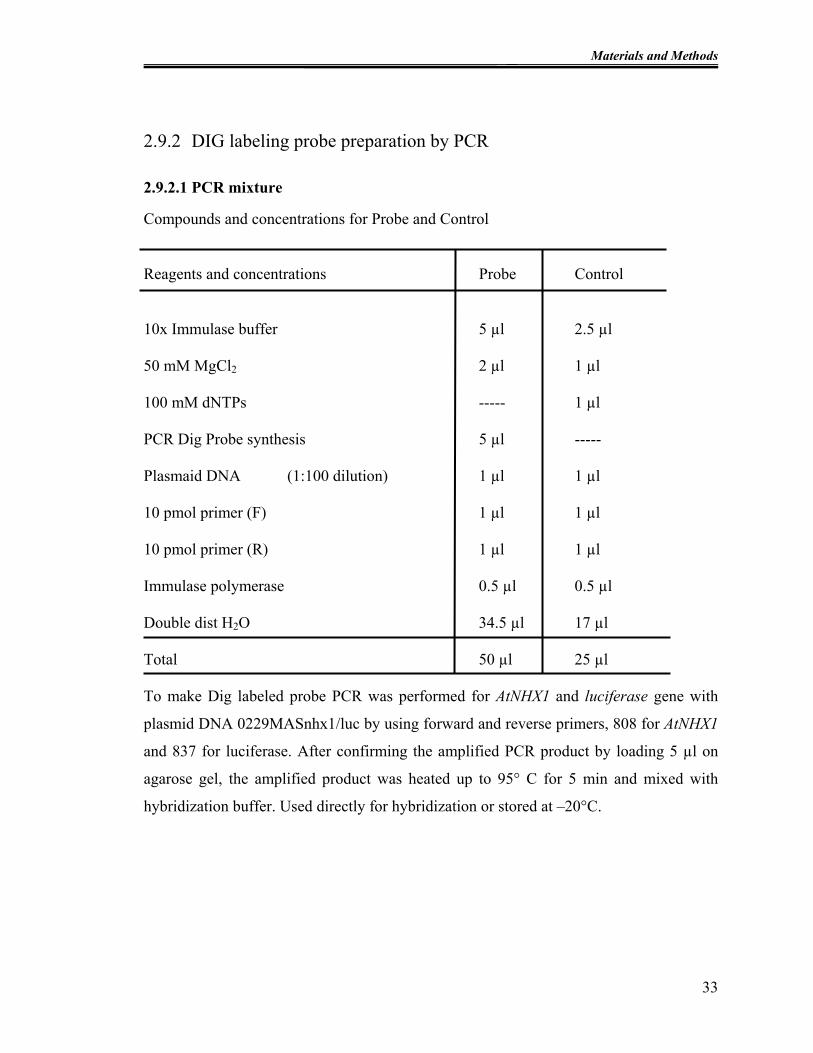
Materials and Methods
2.9.2 DIG labeling probe preparation by PCR
2.9.2.1 PCR mixture
Compounds and concentrations for Probe and Control
Reagents and concentrations Probe Control
10x Immulase buffer 5 µl 2.5 µl
50 mM MgCl2 2 µl 1 µl
100 mM dNTPs ----- 1 µl
PCR Dig Probe synthesis 5 µl -----
Plasmaid DNA (1:100 dilution) 1 µl 1 µl
10 pmol primer (F) 1 µl 1 µl
10 pmol primer (R) 1 µl 1 µl
Immulase polymerase 0.5 µl 0.5 µl
Double dist H2O 34.5 µl 17 µl
Total 50 µl 25 µl
To make Dig labeled probe PCR was performed for AtNHX1 and luciferase gene with
plasmid DNA 0229MASnhx1/luc by using forward and reverse primers, 808 for AtNHX1
and 837 for luciferase. After confirming the amplified PCR product by loading 5 µl on
agarose gel, the amplified product was heated up to 95° C for 5 min and mixed with
hybridization buffer. Used directly for hybridization or stored at –20°C.
33
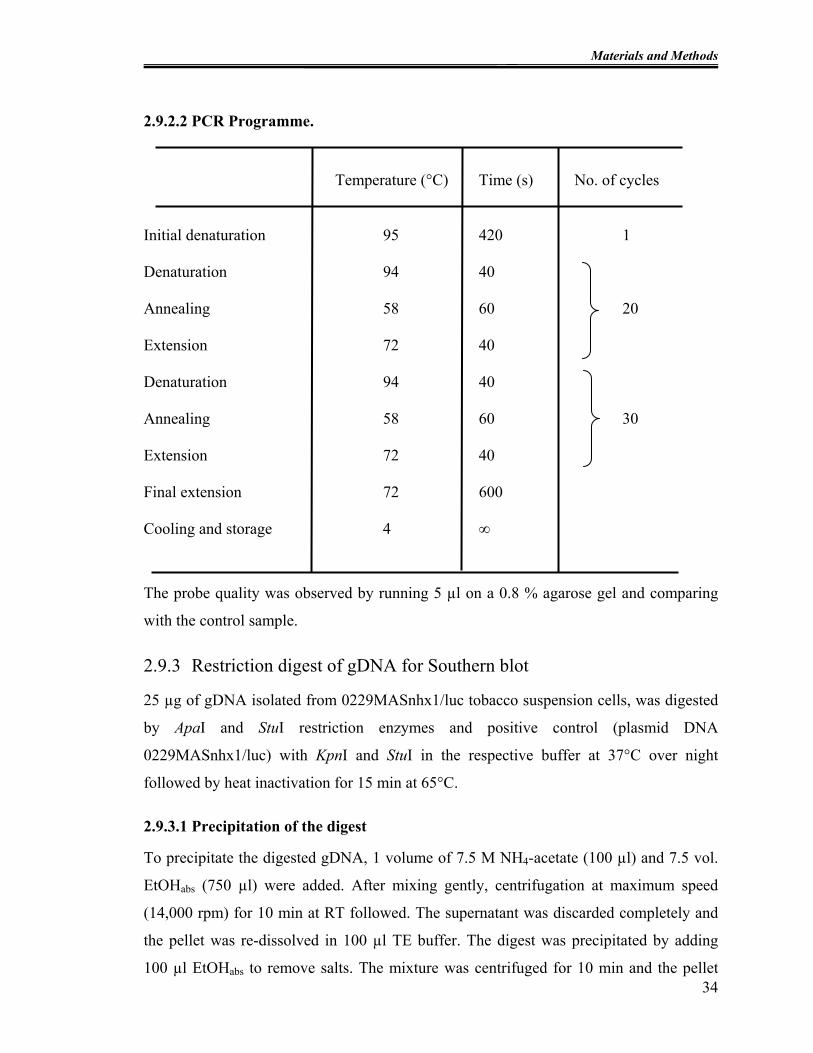
Materials and Methods
2.9.2.2 PCR Programme.
Temperature (°C) Time (s) No. of cycles
Initial denaturation 95 420 1
Denaturation 94 40
Annealing 58 60 20
Extension 72 40
Denaturation 94 40
Annealing 58 60 30
Extension 72 40
Final extension 72 600
Cooling and storage 4 ∞
The probe quality was observed by running 5 µl on a 0.8 % agarose gel and comparing
with the control sample.
2.9.3 Restriction digest of gDNA for Southern blot
25 µg of gDNA isolated from 0229MASnhx1/luc tobacco suspension cells, was digested
by ApaI and StuI restriction enzymes and positive control (plasmid DNA
0229MASnhx1/luc) with KpnI and StuI in the respective buffer at 37°C over night
followed by heat inactivation for 15 min at 65°C.
2.9.3.1 Precipitation of the digest
34
To precipitate the digested gDNA, 1 volume of 7.5 M NH4-acetate (100 µl) and 7.5 vol.
EtOHabs (750 µl) were added. After mixing gently, centrifugation at maximum speed
(14,000 rpm) for 10 min at RT followed. The supernatant was discarded completely and
the pellet was re-dissolved in 100 µl TE buffer. The digest was precipitated by adding
100 µl EtOHabs to remove salts. The mixture was centrifuged for 10 min and the pellet
Materials and Methods
35
was dried for 1 h. at 37°C. Finally it was re-dissolved in 40 µl TE buffer and incubated
for 1 hour at RT.
2.9.3.2 Electrophoresis
Next day 8 µl of 6x loading buffer were added to the restriction digest (40 µl). The
digested gDNA, 40 µl of 1:1000 dilution of restricted plasmid DNA and 3 µl of DIG-
labelled-DNA Molecular Weight Marker II (Roche) were loaded on 0.8 % agarose gel
containing 0.5 µg/ml EtBr in 1x TAE buffer. The gel was run overnight at 0.6 V/cm (15-
20 V). The DNA was visualized under a UV Trans illuminator and then the gel was
rinsed in ddH2O. The gel was then incubated in 250 ml of depurinizing sol. (0.25 M HCl)
for 10 min to nick the DNA and facilitating the transfer of large fragments. The gel was
rinsed again in ddH2O to remove the acid followed by submerging it in denaturation
solution for 2 x 15 min at room temperature on a shaker. Prior to neutralization the gel
was rinsed in ddH2O and was neutralized at room temperature in neutralization solution
for 2 x 15 min
2.9.3.3 Capillary Southern-transfer
20 x SSC solutions were put in a tray where filter paper bridges were built on a glass
plate. A layer of filter paper was soaked in 20 x SSC solutions, and then placed on the top
of the bridge (avoiding any air bubbles under the paper) in such a way that the edges of
the filter paper were dipped in 20x SSC solutions. The gel was put on the filter paper and
plastic paper was placed under the edges of gel. A piece of positively charged nylon
membrane (Roche) was first wetted in ddH2O, then in 20X SSC and placed on top of the
gel. Another 3 layers of filter paper were soaked in 20x SSC solutions, and then placed
on the membrane to avoid air bubbles. Tissue paper stacks were loaded onto the filter
papers and a glass plate centered on top of the paper towels. A 500 ml bottle full of water
was placed in the center of the glass plate to distribute the weight evenly across the gel,
the papers and the membrane. Transfer by capillary force took place over night. When the
transfer was completed, the membrane was rinsed 3x in 2X SSC and then air dried. The
membrane was either UV exposed (254 nm) for 10-15 min for covalently cross-linking
the DNA to the membrane or placed between two filter papers for 30 min at 120°C in the
oven, then covered with foil and stored at RT.
Materials and Methods
36
2.9.3.4 Pre-hybridization and hybridization
After drying the dry blot was placed in an autoclaved hybridization tube and 50 ml of pre
hybridization solution was added and the tube incubated for 40-60min at 40 °C. Then a
preheated (68°C) probe was added and incubated overnight at 40 °C. The membrane was
washed as follow,
2 x 5 min in 2 x SSC + 0.1 % SDS at 42°C
1 x 15 min in preheated (65°C) 0.5 x SSC + 0.1% SDS at 65°C
1 x 15 min in 0.1 X SSC + 0.1 % SDS at 65 °C
1 min in maleic acid buffer at RT
Incubated in blocking solution for 30 min at RT
Incubation with antibody solution again for 30 min at RT
Afterwards the blot was rinsed in washing buffer for 2 x 15 min at RT.
Equilibration for 2 min in detection buffer at RT
2.9.3.5 Non-radioactive detection
The substrate was prepared by mixing 40 ml substrate buffer, 264 µl of from NBT stock
and 272 µl from BCIP stock solution. The substrate was dropped by pipetting on the
membrane while lying in the plastic transparent chamber at RT. Incubated the membrane
in the substrate for 1-2 hours for the probe development.
2.9.3.6 Stripping of the membrane
After usage, the membrane can be stored in 2x SSC buffer for a second hybridization.
The membrane was rinsed in sterile H2O and incubated twice for 15 min in stripping
buffer at 37°C in the hybridization tube followed by rinsing in ddH2O. The membrane
could be stored in 2x SSC buffer without SDS at 4°C.
2.10 Fresh / dry weight measurement of the calli
After a specific growth period, transgenic as well as wild type cells fresh weight
measurement were carried out by collecting the cells growing on the MS agar medium in
the pre weighted caps by avoiding any agar along with the cells. Fresh weight was
recorded by using the analytical balance. To record the dry weight the cells containing
caps were put in an oven at 60°C for 72 hours and dry weight was calculated by
Materials and Methods
37
subtracting the weight of cells containing caps after drying from the weight before
drying.
2.11 Statistical analysis
For the fresh and dry weight of transgenic vs wild type suspension cells Statistical data
nalysis was made with SigmaStat® 3.1. All pair wise multiple comparison procedures
were made according to the Holm-Sidak method: Overall significance level = 0.05.
Power of the performed tests: alpha = 0.050: 1.00. The box whisker plots were generated
by SigmaPlot® 9.0 software in which the boxes mark the 25% and 75% percentile as
well as the median. The whiskers mark the 5% and 95% percentile and the dots show the
outliers.

Results
3 RESULTS
3.1 Vector construction
3.1.1 Isolation of AtNHX1
The AtNHX1 gene, coding for a sodium antiporter in A. thaliana was cloned from
Arabidopsis genomic DNA with provided sequence data from NCBI database (AT
Database seq. At5g27150).
3.1.1.1 PCR based cloning of the AtNHX1 gene
PCR amplification of the target gene was based on specific primers designed against the
sequence information available from the Gene Bank data base. The AtNHX1 gene (3016
bp) was amplified from the genomic DNA of six different plants of A. thaliana.
Confirmation of amplified fragment
First the size of the amplified product was found to be of correct size as shown in Fig. 8.
Left lane1: 1 kb ladder.
3016 bp
Fig. 8: PCR amplification of AtNHX1 from six Arabidopsis plants.
bp
1341
590 569
233 298
Fig. 9: PCR amplified product restricted with HindIII and SacI.
38

Results
For further confirmation, the amplified fragment was digested with HindIII and SacI
restriction enzymes. As seen from the restriction map shown in Fig. 1 the amplified
product should produce five fragments each of 1341, 590, 569, 298 and 233 bp. Fig. 9
shows the results of double digestions of the amplified fragment with HindIII and SacI. A
band of 1341 bp is clearly visible while that of 590 and 569 appeared as one due to size
similarity. Similarly the two bands of 298 and 233 appeared together at approximately the
same position. This double digestion confirmed that the amplified fragment is the same
gene, which was being targeted. In order to further confirm the amplified fragment, this
was purified from the gel and was digested only with HindIII, which has two sites in the
targeted region. Upon digestion with HindIII, the targeted fragment should produce three
fragments each of 1872, 590 and 569 bp. Fig. 10 shows that correct sized fragment of
1872 bp was produced while two fragments of 569 and 590 bp appeared together on the
gel due to size similarity.
Fig. 10: Confirmation of the AtNHX1 with HindIII. Left lane is 1kb DNA marker
Fig. 10 also shows the undigested fragment of 3016 bp and the production of band(s) of
2462 or 2426 bp because of partial digestion at one of the two HindIII sites. This also
indicated that the amplified fragment is the same which was targeted.
3.1.1.2 Cloning of AtNHX1 gene in T/A Cloning vector
The 3016 bp amplified fragment was cloned in T/A cloning vector named pTZ57R (2886
bp) as shown in Fig. 11 at the EcoRV site (in the MCS).
39
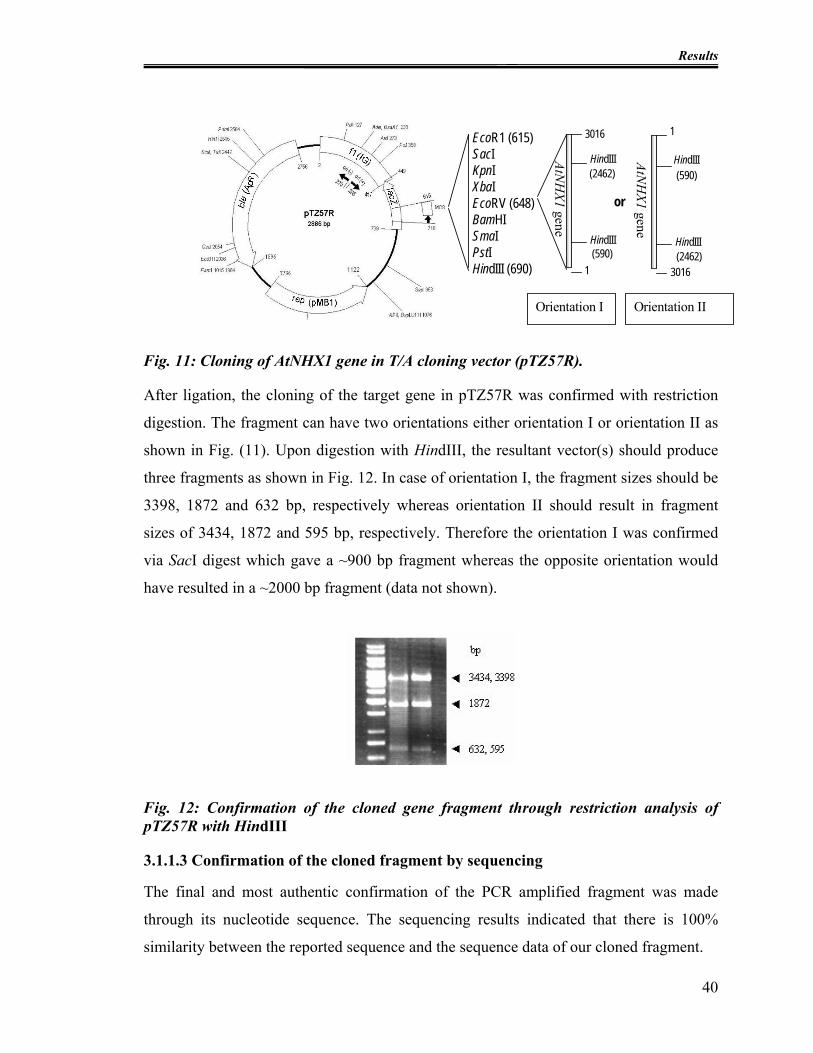
Results
EcoR1 (615)SacIKpnIXbaIEcoRV (648)BamHISmaIPstIHindIII (690)
HindIII
HindIII
3016
(2462)
(590)1
HindIII
HindIII (2462)
(590)
1
3016
or
Orientation I Orientation II
AtNH
X1gene
AtNH
X1gene
Fig. 11: Cloning of AtNHX1 gene in T/A cloning vector (pTZ57R).
After ligation, the cloning of the target gene in pTZ57R was confirmed with restriction
digestion. The fragment can have two orientations either orientation I or orientation II as
shown in Fig. (11). Upon digestion with HindIII, the resultant vector(s) should produce
three fragments as shown in Fig. 12. In case of orientation I, the fragment sizes should be
3398, 1872 and 632 bp, respectively whereas orientation II should result in fragment
sizes of 3434, 1872 and 595 bp, respectively. Therefore the orientation I was confirmed
via SacI digest which gave a ~900 bp fragment whereas the opposite orientation would
have resulted in a ~2000 bp fragment (data not shown).
Fig. 12: Confirmation of the cloned gene fragment through restriction analysis of pTZ57R with HindIII
3.1.1.3 Confirmation of the cloned fragment by sequencing
The final and most authentic confirmation of the PCR amplified fragment was made
through its nucleotide sequence. The sequencing results indicated that there is 100%
similarity between the reported sequence and the sequence data of our cloned fragment.
40

Results
3.1.1.4 Sub cloning of AtNHX1 into pGreenII binary vector (Monocistronic)
AtNHX1 gene from pTZ57R was sub cloned into pGreenII vector under the control of
double 35S promoter by using BamH1 and Xba1 restriction enzymes, named pGII MH 2-
35S-AtNHX1 as shown in Fig. 13.
pGIIMH2-35SAtNHX18500 bp
bar
npt II
AtNHX1
LB
RB
nos
35S
35S
TATA
nos
Bam HI
Xba I
Fig. 13: Subcloning of AtNHX1 in pGreen vector under the control of double 35S promoter.
3.1.1.5 Functionality of AtNHX1 (monocistronic)
The functionality of AtNHX1 gene was observed in N. tabacum plants transformed by the
A. tumefecience strain EHA105 harboring the vector pGIIMH2-35SAtNHX1. NaCl stress
first 100 mM and later on 200 mM was applied to AtNHX1 transgenic T1 tobacco plants
for 3 to 4 week but no difference in growth could be seen between transgenic and wild
type tobacco plants. Further functional investigations were made at the cellular level.
Calli were induced from transgenic T1 tobacco plants. The growth rate of transgenic and
wild type cells were observed under different salt (NaCl) concentrations ranging from 0
to 150 mM. After 4 week, reduction in growth was observed in wild type but not in
AtNHX1 transgenic calli upto 100 mM NaCl stress as shown in Fig. 14(b).
41
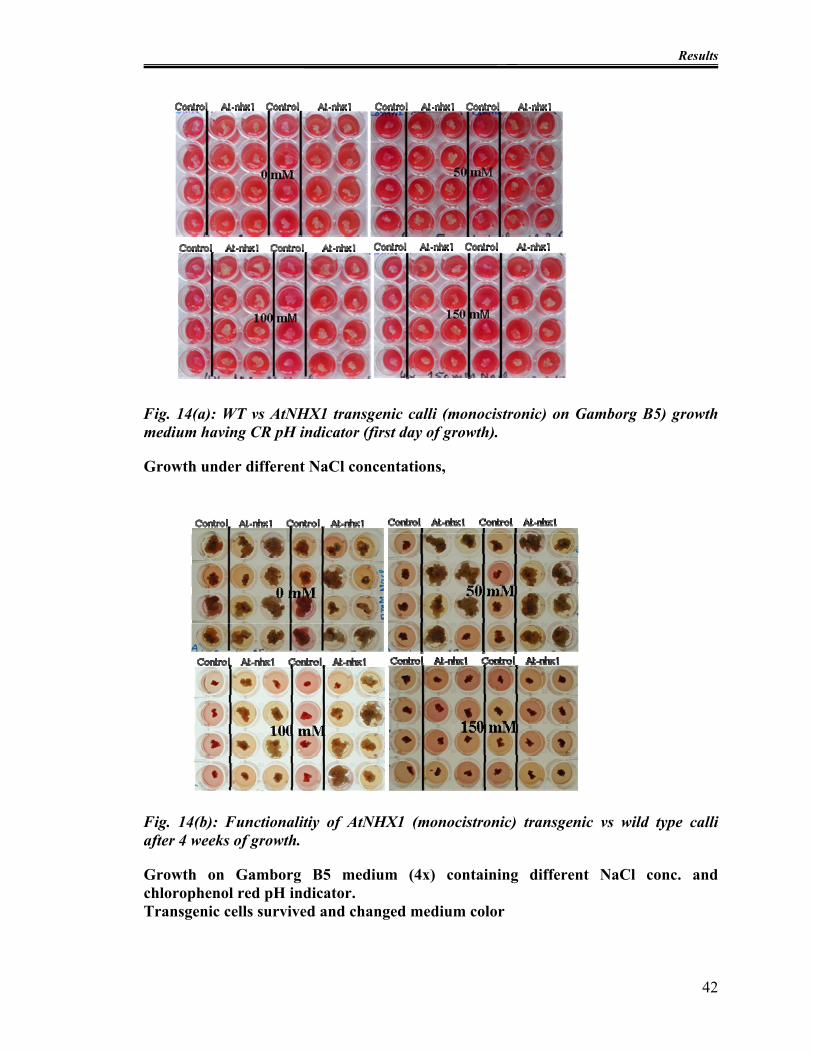
Results
Fig. 14(a): WT vs AtNHX1 transgenic calli (monocistronic) on Gamborg B5) growth medium having CR pH indicator (first day of growth).
Growth under different NaCl concentations,
Fig. 14(b): Functionalitiy of AtNHX1 (monocistronic) transgenic vs wild type calli after 4 weeks of growth.
Growth on Gamborg B5 medium (4x) containing different NaCl conc. and chlorophenol red pH indicator. Transgenic cells survived and changed medium color
42
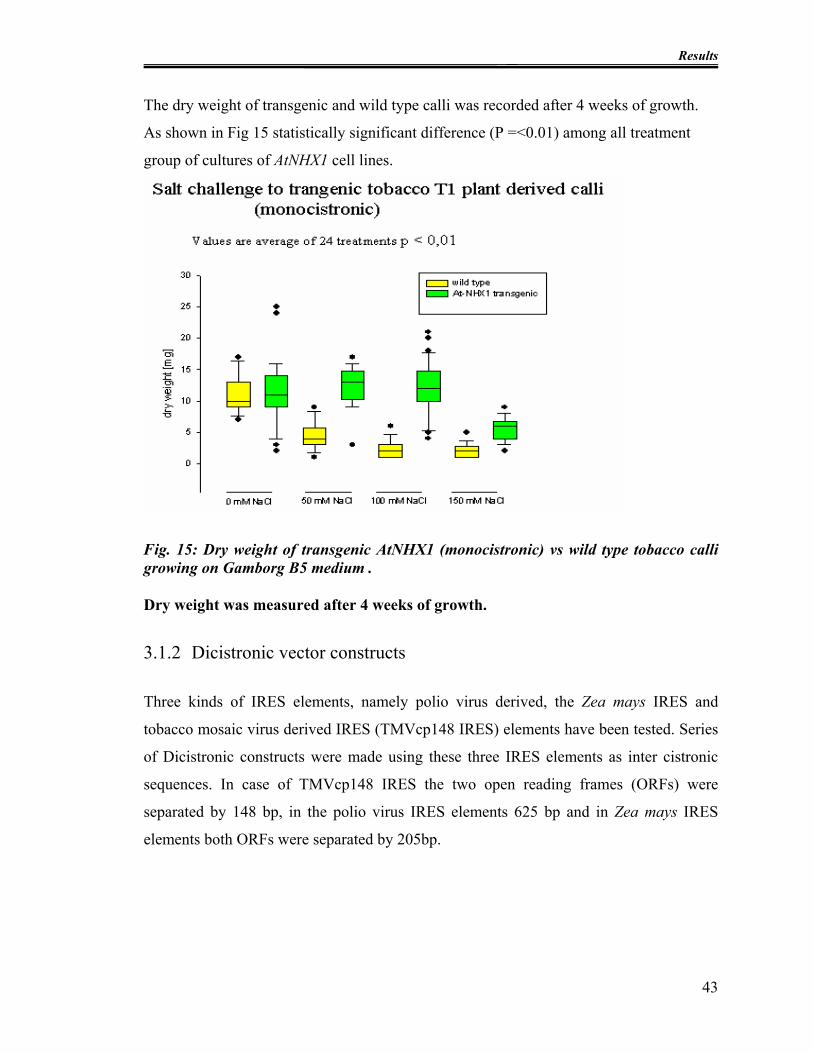
Results
The dry weight of transgenic and wild type calli was recorded after 4 weeks of growth.
As shown in Fig 15 statistically significant difference (P =<0.01) among all treatment
group of cultures of AtNHX1 cell lines.
Fig. 15: Dry weight of transgenic AtNHX1 (monocistronic) vs wild type tobacco calli growing on Gamborg B5 medium .
Dry weight was measured after 4 weeks of growth.
3.1.2 Dicistronic vector constructs
Three kinds of IRES elements, namely polio virus derived, the Zea mays IRES and
tobacco mosaic virus derived IRES (TMVcp148 IRES) elements have been tested. Series
of Dicistronic constructs were made using these three IRES elements as inter cistronic
sequences. In case of TMVcp148 IRES the two open reading frames (ORFs) were
separated by 148 bp, in the polio virus IRES elements 625 bp and in Zea mays IRES
elements both ORFs were separated by 205bp.
43

Results
44
R
B L
B lucgus
IRESt-
CaMV p-MAS
RBS
t-NOS p-NOS bar ORFORF ORF
Fig. 16: Dicistronic vector construct, pGII0229MASgus/luc.
3.1.2.1 Confirmation of the dicistronic vector construct pGII0229MASguscp148luc
After cloning of the target genes in the vector pGII0229 the resultant vector
pG0229MASguscp148luc was confirmed by restriction enzymes (Fig. 17). Upon
restriction by KpnI and XbaI there should be two fragments 522 bp and 8275 bp (lane 2).
As KpnI site is infront of MAS promoter and XbaI site is behind the promoter, therefore
production of 522 bp fragment showed the presence of MAS promoter in the vector
construct. The β-glucuronidase gene was confirmed by restriction enzymes XbaI and
HindIII enzymes. The resultant construct should produce two fragments (1840 bp and
6967 bp) as the XbaI site lies in front of the GUS gene and HindIII behind therefore the
production of 1840 bp fragment confirmed the presence of the GUS gene (lane 3). The
presence of luciferase gene along with TMV cp148 IRES and CaMV terminator was
confirmed by restriction with HindIII and SacI enzymes. As the HindIII site lies in front
of IRES elemets and SacI behind the CaMV terminator. By restriction digest with these
enzymes the 2099 bp fragment confirmed the presence of luciferase being along with
TMVcp148 IRES and CaMV terminator (lane 4).
Fig. 17:.Confirmation of the cloned genes in dicistronic vector pG0229MASguscp148luc
lane1: 100 bp DNA marker and lane 5: 1 kb DNA marker.
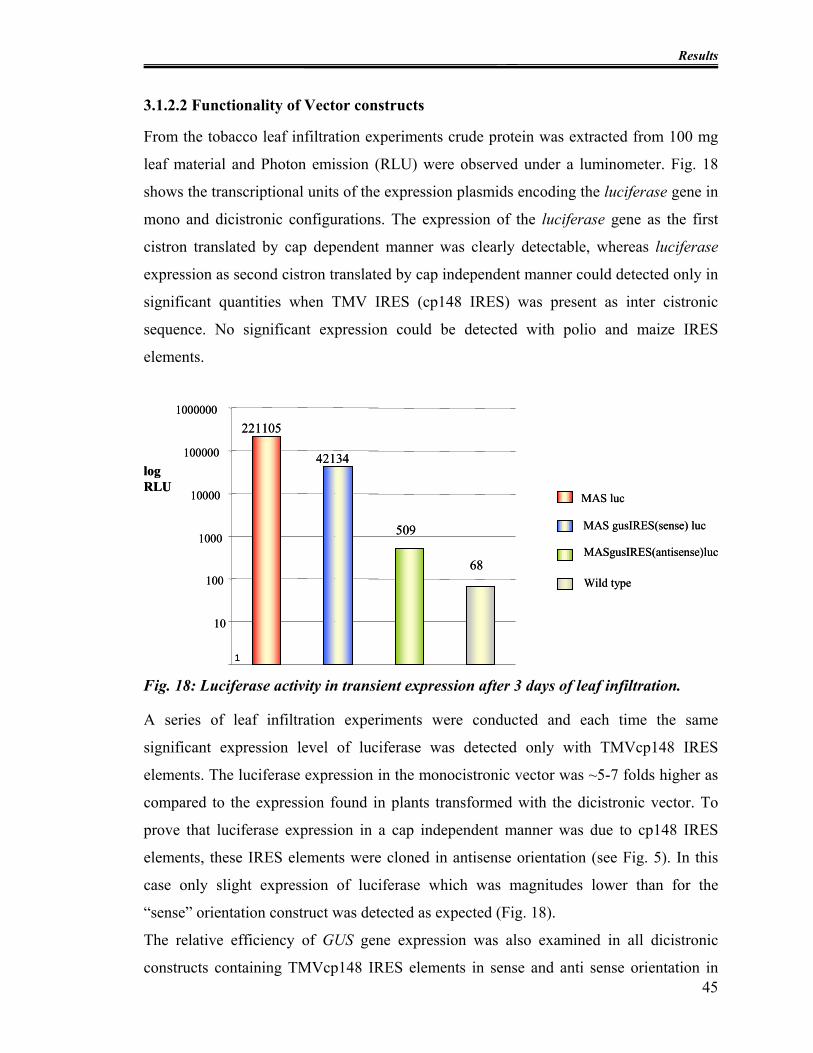
Results
3.1.2.2 Functionality of Vector constructs
From the tobacco leaf infiltration experiments crude protein was extracted from 100 mg
leaf material and Photon emission (RLU) were observed under a luminometer. Fig. 18
shows the transcriptional units of the expression plasmids encoding the luciferase gene in
mono and dicistronic configurations. The expression of the luciferase gene as the first
cistron translated by cap dependent manner was clearly detectable, whereas luciferase
expression as second cistron translated by cap independent manner could detected only in
significant quantities when TMV IRES (cp148 IRES) was present as inter cistronic
sequence. No significant expression could be detected with polio and maize IRES
elements.
MAS gusIRES(sense) luc
1
221105
42134
509
68
10
100
1000
10000
100000
1000000
log RLU
MASgusIRES(antisense)luc
Wild type
MAS luc
MAS gusIRES(sense) luc
1
221105
42134
509
68
10
100
1000
10000
100000
1000000
log RLU
MASgusIRES(antisense)luc
Wild type
MAS luc
Fig. 18: Luciferase activity in transient expression after 3 days of leaf infiltration.
A series of leaf infiltration experiments were conducted and each time the same
significant expression level of luciferase was detected only with TMVcp148 IRES
elements. The luciferase expression in the monocistronic vector was ~5-7 folds higher as
compared to the expression found in plants transformed with the dicistronic vector. To
prove that luciferase expression in a cap independent manner was due to cp148 IRES
elements, these IRES elements were cloned in antisense orientation (see Fig. 5). In this
case only slight expression of luciferase which was magnitudes lower than for the
“sense” orientation construct was detected as expected (Fig. 18).
45
The relative efficiency of GUS gene expression was also examined in all dicistronic
constructs containing TMVcp148 IRES elements in sense and anti sense orientation in
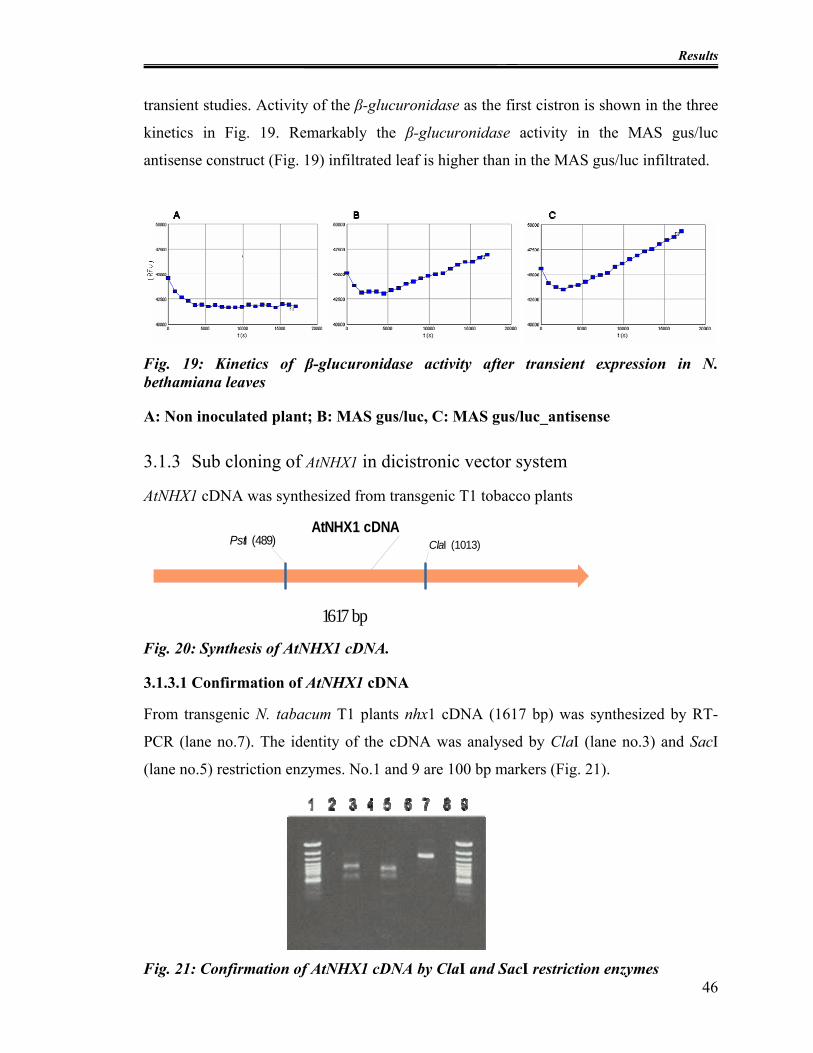
Results
transient studies. Activity of the β-glucuronidase as the first cistron is shown in the three
kinetics in Fig. 19. Remarkably the β-glucuronidase activity in the MAS gus/luc
antisense construct (Fig. 19) infiltrated leaf is higher than in the MAS gus/luc infiltrated.
Fig. 19: Kinetics of β-glucuronidase activity after transient expression in N. bethamiana leaves
A: Non inoculated plant; B: MAS gus/luc, C: MAS gus/luc_antisense
3.1.3 Sub cloning of AtNHX1 in dicistronic vector system
AtNHX1 cDNA was synthesized from transgenic T1 tobacco plants
1617 bp
AtNHX1 cDNAClaI (1013)PstI (489)
Fig. 20: Synthesis of AtNHX1 cDNA.
3.1.3.1 Confirmation of AtNHX1 cDNA
From transgenic N. tabacum T1 plants nhx1 cDNA (1617 bp) was synthesized by RT-
PCR (lane no.7). The identity of the cDNA was analysed by ClaI (lane no.3) and SacI
(lane no.5) restriction enzymes. No.1 and 9 are 100 bp markers (Fig. 21).
46Fig. 21: Confirmation of AtNHX1 cDNA by ClaI and SacI restriction enzymes
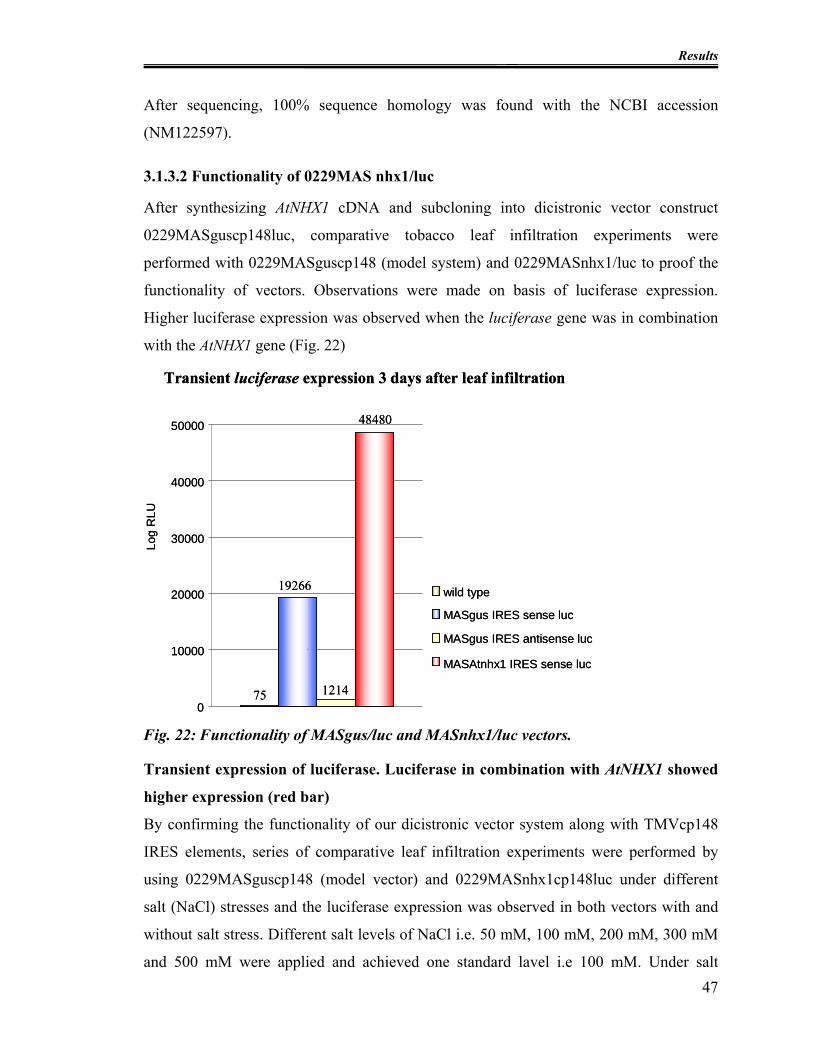
Results
After sequencing, 100% sequence homology was found with the NCBI accession
(NM122597).
3.1.3.2 Functionality of 0229MAS nhx1/luc
After synthesizing AtNHX1 cDNA and subcloning into dicistronic vector construct
0229MASguscp148luc, comparative tobacco leaf infiltration experiments were
performed with 0229MASguscp148 (model system) and 0229MASnhx1/luc to proof the
functionality of vectors. Observations were made on basis of luciferase expression.
Higher luciferase expression was observed when the luciferase gene was in combination
with the AtNHX1 gene (Fig. 22)
Transient luciferase expression 3 days after leaf infiltration
75 1214
19266
48480
0
10000
20000
30000
40000
50000
Log
RLU
wild type
MASgus IRES sense luc
MASgus IRES antisense luc
MASAtnhx1 IRES sense luc
Transient luciferase expression 3 days after leaf infiltration
75 1214
19266
48480
0
10000
20000
30000
40000
50000
Log
RLU
wild type
MASgus IRES sense luc
MASgus IRES antisense luc
MASAtnhx1 IRES sense luc
Fig. 22: Functionality of MASgus/luc and MASnhx1/luc vectors.
Transient expression of luciferase. Luciferase in combination with AtNHX1 showed
higher expression (red bar)
By confirming the functionality of our dicistronic vector system along with TMVcp148
IRES elements, series of comparative leaf infiltration experiments were performed by
using 0229MASguscp148 (model vector) and 0229MASnhx1cp148luc under different
salt (NaCl) stresses and the luciferase expression was observed in both vectors with and
without salt stress. Different salt levels of NaCl i.e. 50 mM, 100 mM, 200 mM, 300 mM
and 500 mM were applied and achieved one standard lavel i.e 100 mM. Under salt 47

Results
challenge even higher luciferase expression was observed in MASnhx1/luc as compare to
MASgus/luc vector as shown in Fig. 23.
Transient luciferase expression 3 days after leaf infiltration at 100mM NaCl stress
1e+3
1e+4
1e+5
1e+6
1e+7
1e+8
MAS gus / lucMAS nhx1 / luc
0 mM NaCl 0 mM NaCl100 mM NaCl 100 mM NaCl
[Log RLU]
1e+3
1e+4
1e+5
1e+6
1e+7
1e+8
MAS gus / lucMAS nhx1 / luc
0 mM NaCl 0 mM NaCl100 mM NaCl 100 mM NaCl
[Log RLU]
Fig. 23: Transient luciferase expression of MASgus/luc and MASnhx/luc in infiltrated tobacco leaves under salt challenge.
Salt challenge was given along with irrigation water after leaf infiltration.
3.2 Stable transformation of dicistronic vectors (0229MASgus /
luc and 0229MASnhx1/luc)
The functionality of dicistronic vectors along with AtNHX1 gene was confirmed in stably
transformed tobacco plants as a model system before moving to legumes or other crop
plants, as it takes much more time to transform in target plant (pea). Methodologically the
mode of action of recombinant nhx1 gene can only be investigated when positive effects
can be expected. Hence the major interest is the development of a reliable monitoring
system for expression studies. From the transgenic T1 tobacco plants calli were derived
and expression of glucuronidase in MASgus/luc was quantified by Mug assay where as
48
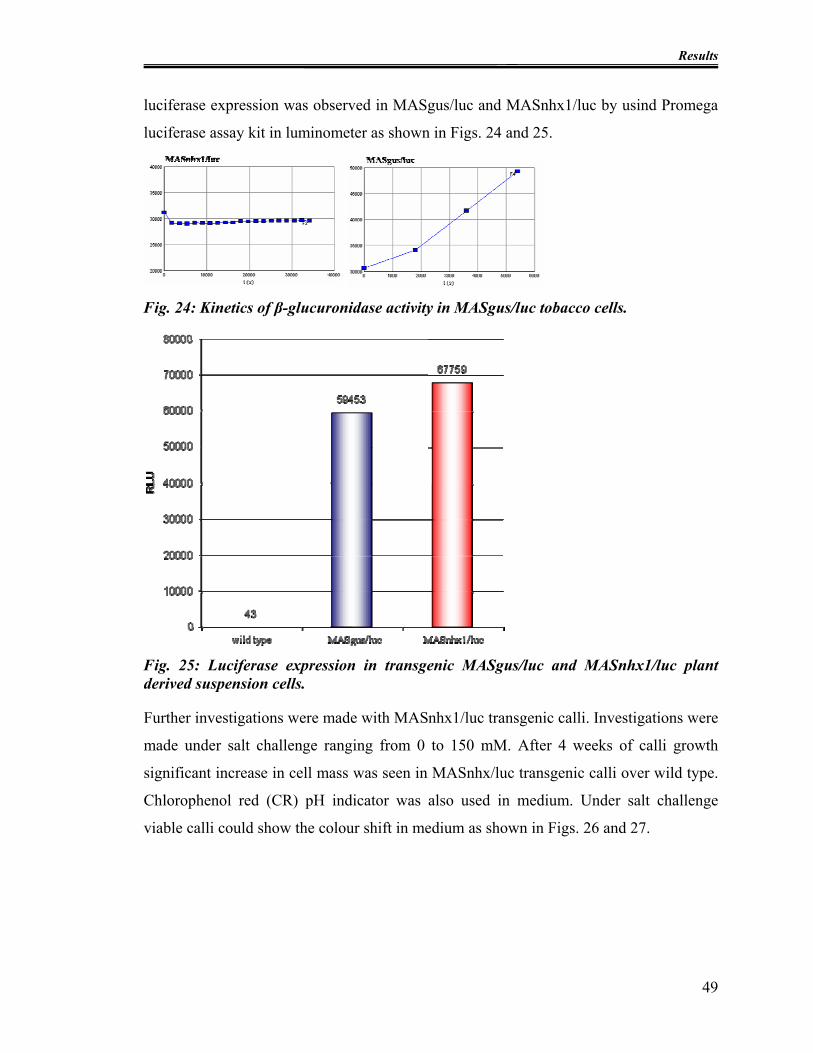
Results
luciferase expression was observed in MASgus/luc and MASnhx1/luc by usind Promega
luciferase assay kit in luminometer as shown in Figs. 24 and 25.
Fig. 24: Kinetics of β-glucuronidase activity in MASgus/luc tobacco cells.
Fig. 25: Luciferase expression in transgenic MASgus/luc and MASnhx1/luc plant derived suspension cells.
Further investigations were made with MASnhx1/luc transgenic calli. Investigations were
made under salt challenge ranging from 0 to 150 mM. After 4 weeks of calli growth
significant increase in cell mass was seen in MASnhx/luc transgenic calli over wild type.
Chlorophenol red (CR) pH indicator was also used in medium. Under salt challenge
viable calli could show the colour shift in medium as shown in Figs. 26 and 27.
49

Results
Fig. 26: Wild type vs MASnhx1/luc transgenic tobacco calli growing on Gamborg B5 (4x) medium containing CR pH indicator at different NaCl concentrations (2nd day of growth).
50
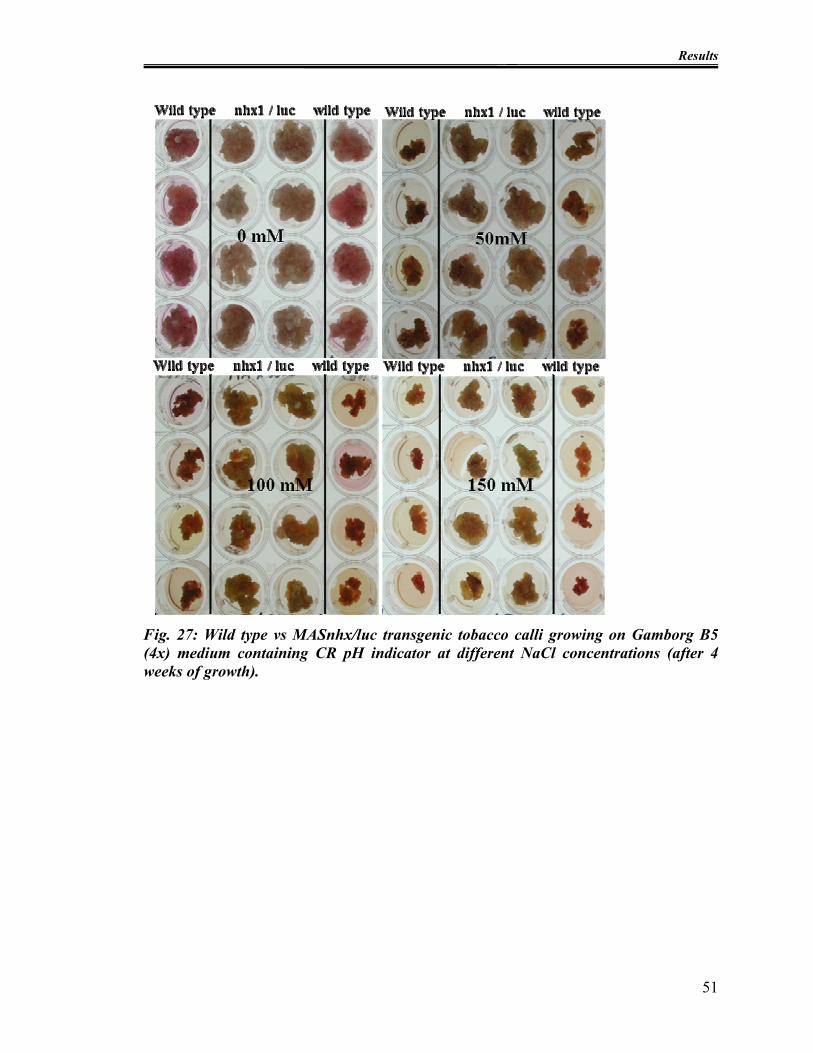
Results
Fig. 27: Wild type vs MASnhx/luc transgenic tobacco calli growing on Gamborg B5 (4x) medium containing CR pH indicator at different NaCl concentrations (after 4 weeks of growth).
51

Results
Dry weight of MASnhx1/luc transgenic and wild type calli was recorded after 4 week of
growth. All transgenic calli showed higher cell masses over wild type cells as shown in
Fig. 28.
The box wisker plots were generated by SigmaPlot® 9.0 software and the statistical data
analysis was made with SigmaStat® 3.1.
0
5
10
15
20
25
0mM 50mM 100mM 150mM
Salt challenge to dicistronic (MASnhx1/ luc) transgenic tobacco calli (p<0.05)
dry
wei
ght (
mg)
Wild type
MASnhx1/ luc
NaCl supplementation
0
5
10
15
20
25
0mM 50mM 100mM 150mM
Salt challenge to dicistronic (MASnhx1/ luc) transgenic tobacco calli (p<0.05)
dry
wei
ght (
mg)
Wild type
MASnhx1/ luc
0
5
10
15
20
25
0mM 50mM 100mM 150mM
Salt challenge to dicistronic (MASnhx1/ luc) transgenic tobacco calli (p<0.05)
dry
wei
ght (
mg)
Wild type
MASnhx1/ luc
Salt challenge to dicistronic (MASnhx1/ luc) transgenic tobacco calli (p<0.05)
dry
wei
ght (
mg)
Wild type
MASnhx1/ luc
NaCl supplementation
Fig. 28: Dry wt of MASnhx1/luc transgenic and wild type calli after 4 weeks of growth under different NaCl concentrations.
3.3 Generation of suspension cells from MASnhx1/luc transgenic
calli and selection on the basis of luciferase expression
Suspension cells were generated from dicistronic MASnhx/luc transgenic tobacco calli.
Equal amounts of cell material (fresh weight) were grown on the Gamborg B5 (appendix
IV) medium containing again cholorophenol red pH indicator and different NaCl
concentrations. The viability of the cells was observed on the basis of luciferase
52
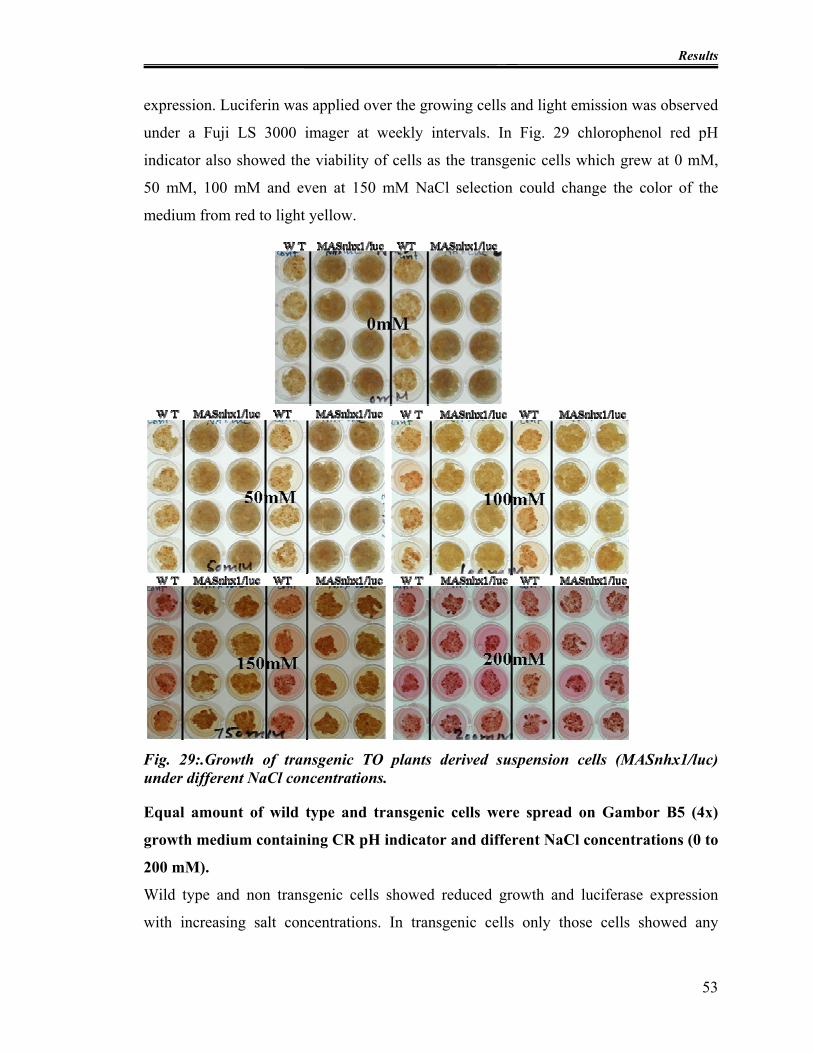
Results
expression. Luciferin was applied over the growing cells and light emission was observed
under a Fuji LS 3000 imager at weekly intervals. In Fig. 29 chlorophenol red pH
indicator also showed the viability of cells as the transgenic cells which grew at 0 mM,
50 mM, 100 mM and even at 150 mM NaCl selection could change the color of the
medium from red to light yellow.
Fig. 29:.Growth of transgenic TO plants derived suspension cells (MASnhx1/luc) under different NaCl concentrations.
Equal amount of wild type and transgenic cells were spread on Gambor B5 (4x)
growth medium containing CR pH indicator and different NaCl concentrations (0 to
200 mM).
Wild type and non transgenic cells showed reduced growth and luciferase expression
with increasing salt concentrations. In transgenic cells only those cells showed any
53

Results
luminescence under the imager which could survive under salt selection as shown in Fig.
30.
3.3.1 Luciferase expression in transgenic cells under NaCl challenge
Observation for the luciferase expression in the suspension cells under NaCl challenge
were made using Fuji imager LAS300 after 4 weeks of cells growth.
Fig. 30: Luciferase expression in MASnhx1/luc suspension cells under NaCl challenge.
With increase in NaCl concentration there is decrease in cell mass but increase in
luciferase expression, maximum at 100 mM NaCl challenge and null expression at
200 mM.
LAU/mm2
NaCl supplementation [ mM]
MS-medium 50 100 150 200
0
5000
10000
15000
20000
25000
LAU/mm2
NaCl supplementation [ mM]
MS-medium 50 100 150 200
0
5000
10000
15000
20000
25000
Fig. 31: Luciferase activity of AtNHX1 transgenic suspension cells on solid medium (LAU: linear arbitrary) units).
54

Results
Luciferase expression was quantified in the cells growing at various NaCl selection levels
by the Fuji imager LAS 3000. with the increase in NaCl concentration, gradual increase
in luciferase expression (LAU/mm²) was recorded with a maximum at 100 mM NaCl
challenge and then decline in expression took place with the increase in NaCl level a as
shown in Fig. 31 and 32.
A B C D
Fig. 32: Luciferase activity imaging in titer plate cultures.
A: wild type B: AtNHX1 transgeinc at 0 mM NaCl, C: AtNHX1 transgeinc at 50 mM
NaCl and D AtNHX1 transgeinc at 100 mM NaCl
55
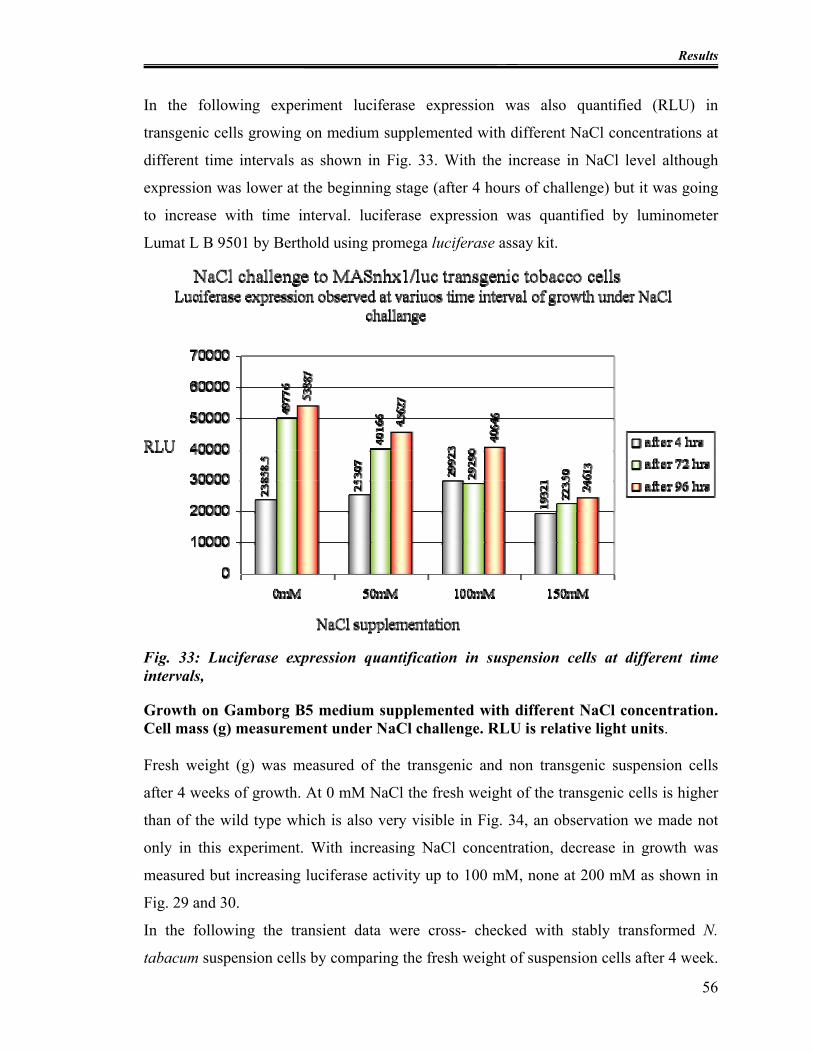
Results
In the following experiment luciferase expression was also quantified (RLU) in
transgenic cells growing on medium supplemented with different NaCl concentrations at
different time intervals as shown in Fig. 33. With the increase in NaCl level although
expression was lower at the beginning stage (after 4 hours of challenge) but it was going
to increase with time interval. luciferase expression was quantified by luminometer
Lumat L B 9501 by Berthold using promega luciferase assay kit.
Fig. 33: Luciferase expression quantification in suspension cells at different time intervals,
Growth on Gamborg B5 medium supplemented with different NaCl concentration. Cell mass (g) measurement under NaCl challenge. RLU is relative light units. Fresh weight (g) was measured of the transgenic and non transgenic suspension cells
after 4 weeks of growth. At 0 mM NaCl the fresh weight of the transgenic cells is higher
than of the wild type which is also very visible in Fig. 34, an observation we made not
only in this experiment. With increasing NaCl concentration, decrease in growth was
measured but increasing luciferase activity up to 100 mM, none at 200 mM as shown in
Fig. 29 and 30.
In the following the transient data were cross- checked with stably transformed N.
tabacum suspension cells by comparing the fresh weight of suspension cells after 4 week.
56
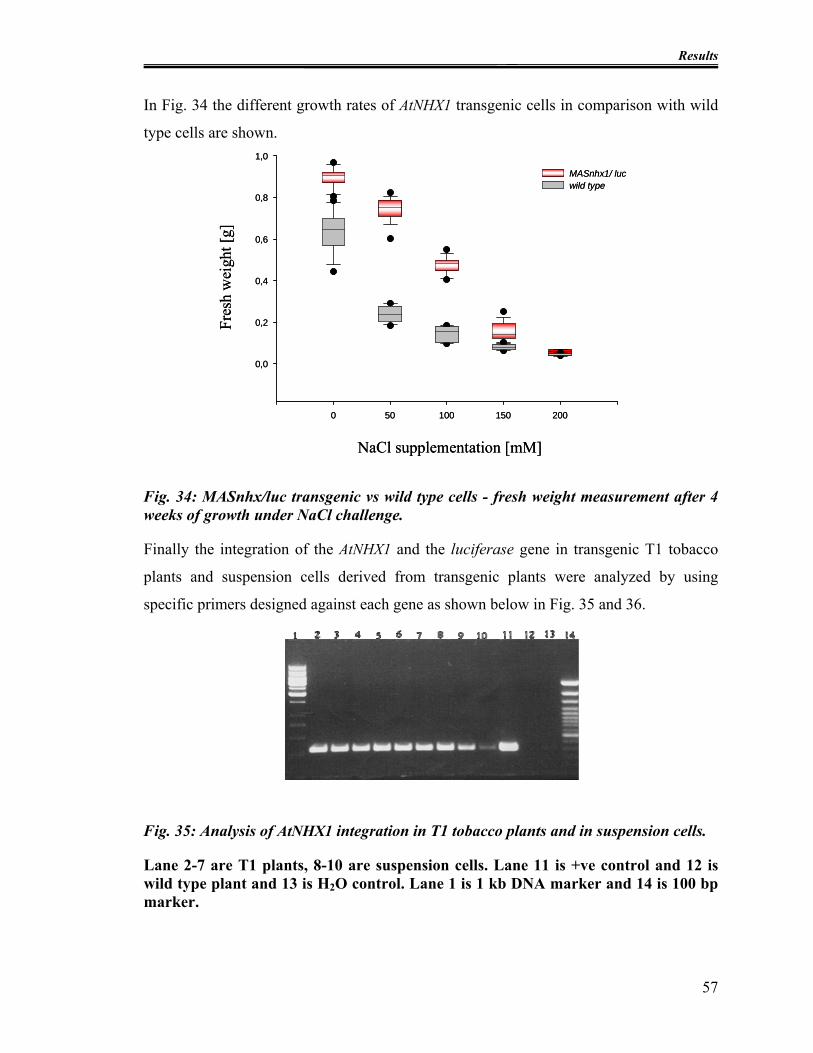
Results
In Fig. 34 the different growth rates of AtNHX1 transgenic cells in comparison with wild
type cells are shown.
0 50 100 150 200
0,0
0,2
0,4
0,6
0,8
1,0
MASnhx1/ lucwild type
Fres
h w
eigh
t [g]
NaCl supplementation [mM]
0 50 100 150 200
0,0
0,2
0,4
0,6
0,8
1,0
MASnhx1/ lucwild type
Fres
h w
eigh
t [g]
NaCl supplementation [mM]
Fig. 34: MASnhx/luc transgenic vs wild type cells - fresh weight measurement after 4 weeks of growth under NaCl challenge.
Finally the integration of the AtNHX1 and the luciferase gene in transgenic T1 tobacco
plants and suspension cells derived from transgenic plants were analyzed by using
specific primers designed against each gene as shown below in Fig. 35 and 36.
Fig. 35: Analysis of AtNHX1 integration in T1 tobacco plants and in suspension cells.
Lane 2-7 are T1 plants, 8-10 are suspension cells. Lane 11 is +ve control and 12 is wild type plant and 13 is H2O control. Lane 1 is 1 kb DNA marker and 14 is 100 bp marker.
57
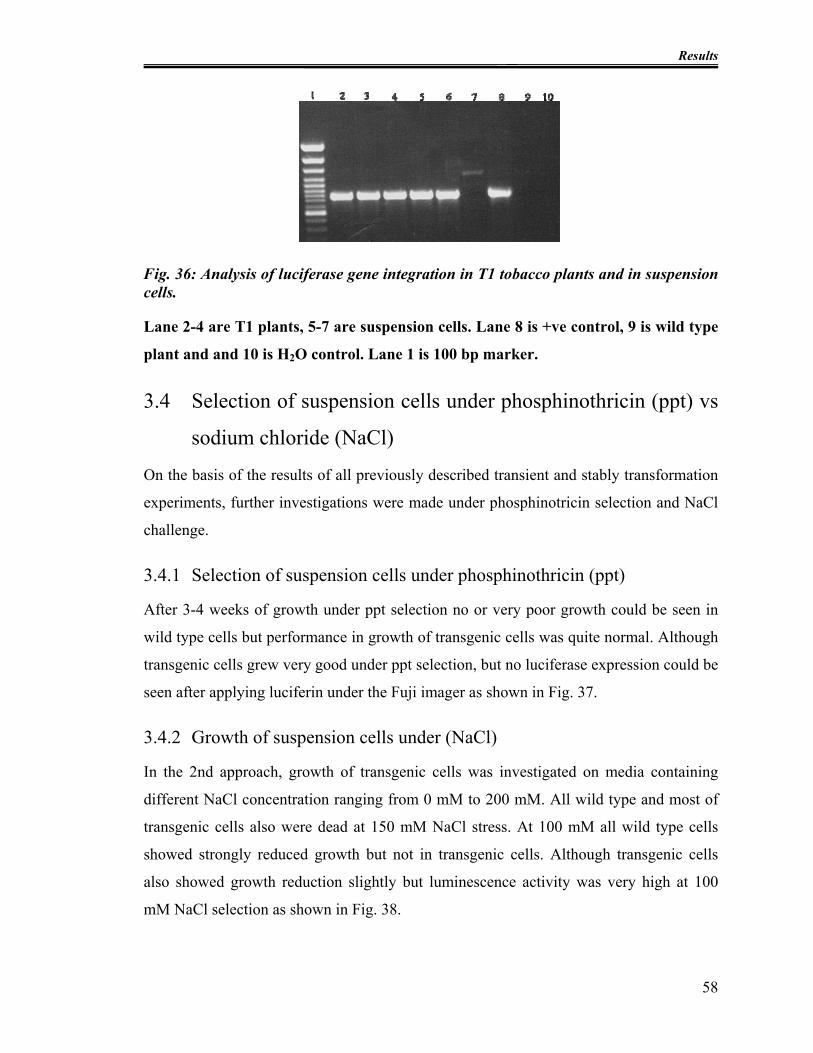
Results
Fig. 36: Analysis of luciferase gene integration in T1 tobacco plants and in suspension cells.
Lane 2-4 are T1 plants, 5-7 are suspension cells. Lane 8 is +ve control, 9 is wild type
plant and and 10 is H2O control. Lane 1 is 100 bp marker.
3.4 Selection of suspension cells under phosphinothricin (ppt) vs
sodium chloride (NaCl)
On the basis of the results of all previously described transient and stably transformation
experiments, further investigations were made under phosphinotricin selection and NaCl
challenge.
3.4.1 Selection of suspension cells under phosphinothricin (ppt)
After 3-4 weeks of growth under ppt selection no or very poor growth could be seen in
wild type cells but performance in growth of transgenic cells was quite normal. Although
transgenic cells grew very good under ppt selection, but no luciferase expression could be
seen after applying luciferin under the Fuji imager as shown in Fig. 37.
3.4.2 Growth of suspension cells under (NaCl)
In the 2nd approach, growth of transgenic cells was investigated on media containing
different NaCl concentration ranging from 0 mM to 200 mM. All wild type and most of
transgenic cells also were dead at 150 mM NaCl stress. At 100 mM all wild type cells
showed strongly reduced growth but not in transgenic cells. Although transgenic cells
also showed growth reduction slightly but luminescence activity was very high at 100
mM NaCl selection as shown in Fig. 38.
58
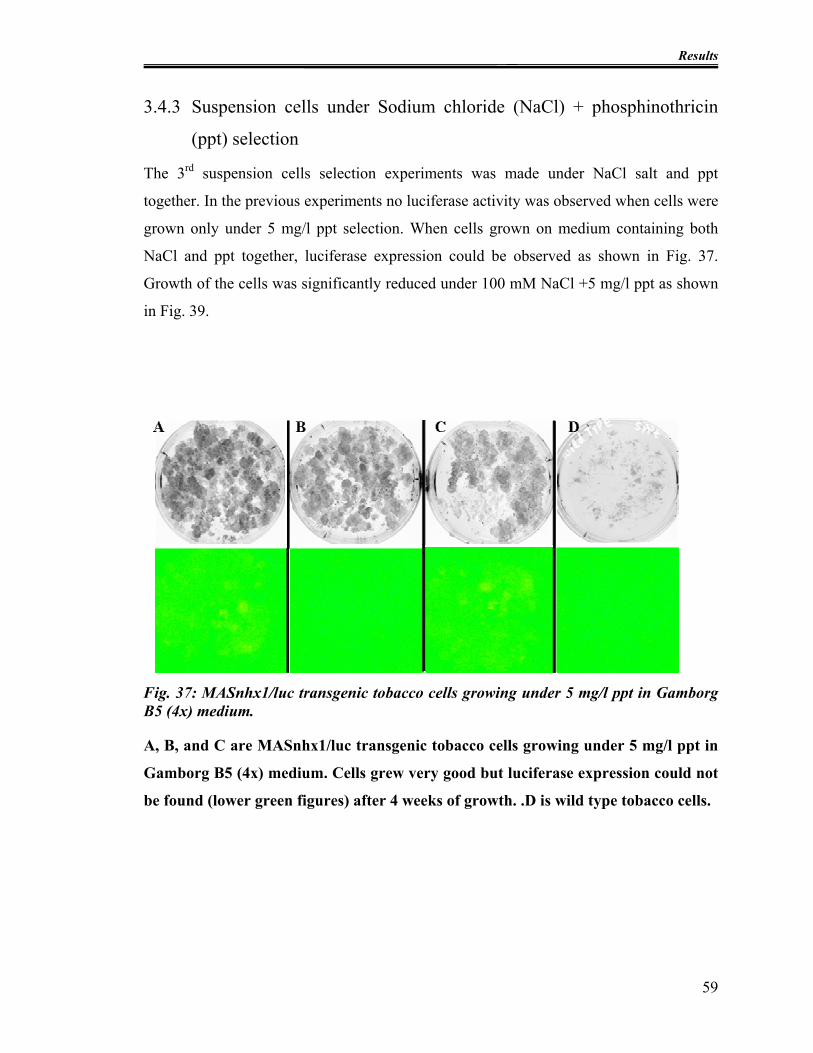
Results
3.4.3 Suspension cells under Sodium chloride (NaCl) + phosphinothricin
(ppt) selection
The 3rd suspension cells selection experiments was made under NaCl salt and ppt
together. In the previous experiments no luciferase activity was observed when cells were
grown only under 5 mg/l ppt selection. When cells grown on medium containing both
NaCl and ppt together, luciferase expression could be observed as shown in Fig. 37.
Growth of the cells was significantly reduced under 100 mM NaCl +5 mg/l ppt as shown
in Fig. 39.
Fig. 37: MASnhx1/luc transgenic tobacco cells growing under 5 mg/l ppt in Gamborg B5 (4x) medium.
A, B, and C are MASnhx1/luc transgenic tobacco cells growing under 5 mg/l ppt in
Gamborg B5 (4x) medium. Cells grew very good but luciferase expression could not
be found (lower green figures) after 4 weeks of growth. .D is wild type tobacco cells.
59
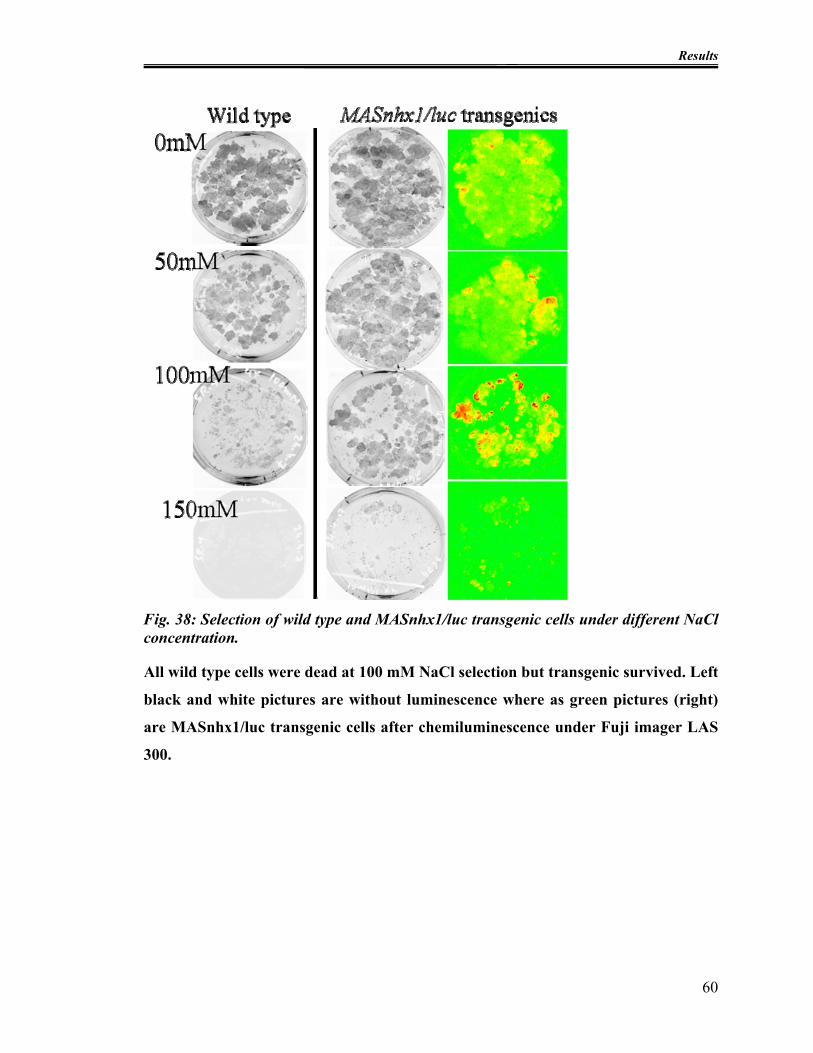
Results
Fig. 38: Selection of wild type and MASnhx1/luc transgenic cells under different NaCl concentration.
All wild type cells were dead at 100 mM NaCl selection but transgenic survived. Left
black and white pictures are without luminescence where as green pictures (right)
are MASnhx1/luc transgenic cells after chemiluminescence under Fuji imager LAS
300.
60

Results
Fig. 39: MASnhx1/luc transgenic cells under NaCl + ppt selection.
Right images are under Fuji LAS 3000 after applying luciferin and left side without
luciferin application.
61
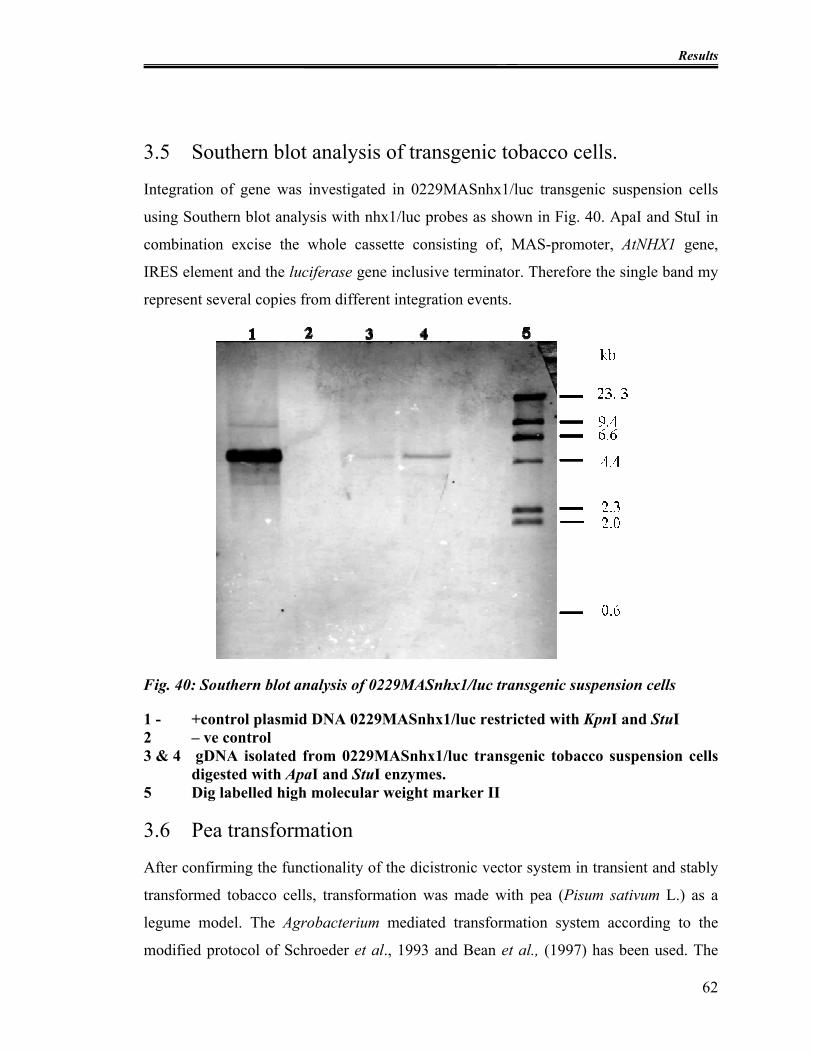
Results
3.5 Southern blot analysis of transgenic tobacco cells.
Integration of gene was investigated in 0229MASnhx1/luc transgenic suspension cells
using Southern blot analysis with nhx1/luc probes as shown in Fig. 40. ApaI and StuI in
combination excise the whole cassette consisting of, MAS-promoter, AtNHX1 gene,
IRES element and the luciferase gene inclusive terminator. Therefore the single band my
represent several copies from different integration events.
Fig. 40: Southern blot analysis of 0229MASnhx1/luc transgenic suspension cells
1 - +control plasmid DNA 0229MASnhx1/luc restricted with KpnI and StuI 2 – ve control 3 & 4 gDNA isolated from 0229MASnhx1/luc transgenic tobacco suspension cells
digested with ApaI and StuI enzymes. 5 Dig labelled high molecular weight marker II
3.6 Pea transformation
After confirming the functionality of the dicistronic vector system in transient and stably
transformed tobacco cells, transformation was made with pea (Pisum sativum L.) as a
legume model. The Agrobacterium mediated transformation system according to the
modified protocol of Schroeder et al., 1993 and Bean et al., (1997) has been used. The
62
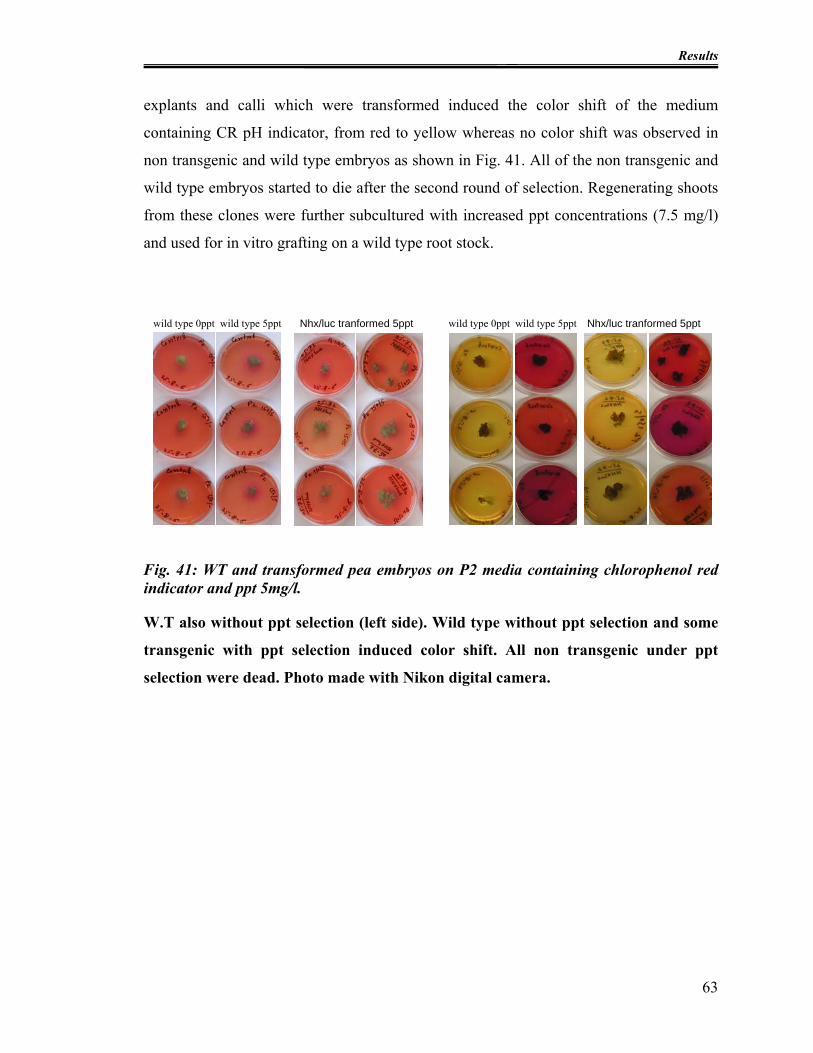
Results
explants and calli which were transformed induced the color shift of the medium
containing CR pH indicator, from red to yellow whereas no color shift was observed in
non transgenic and wild type embryos as shown in Fig. 41. All of the non transgenic and
wild type embryos started to die after the second round of selection. Regenerating shoots
from these clones were further subcultured with increased ppt concentrations (7.5 mg/l)
and used for in vitro grafting on a wild type root stock.
wild type 0ppt wild type 5ppt wild type 0ppt wild type 5ppt Nhx/luc tranformed 5ppt Nhx/luc tranformed 5ppt
Fig. 41: WT and transformed pea embryos on P2 media containing chlorophenol red indicator and ppt 5mg/l.
W.T also without ppt selection (left side). Wild type without ppt selection and some
transgenic with ppt selection induced color shift. All non transgenic under ppt
selection were dead. Photo made with Nikon digital camera.
63
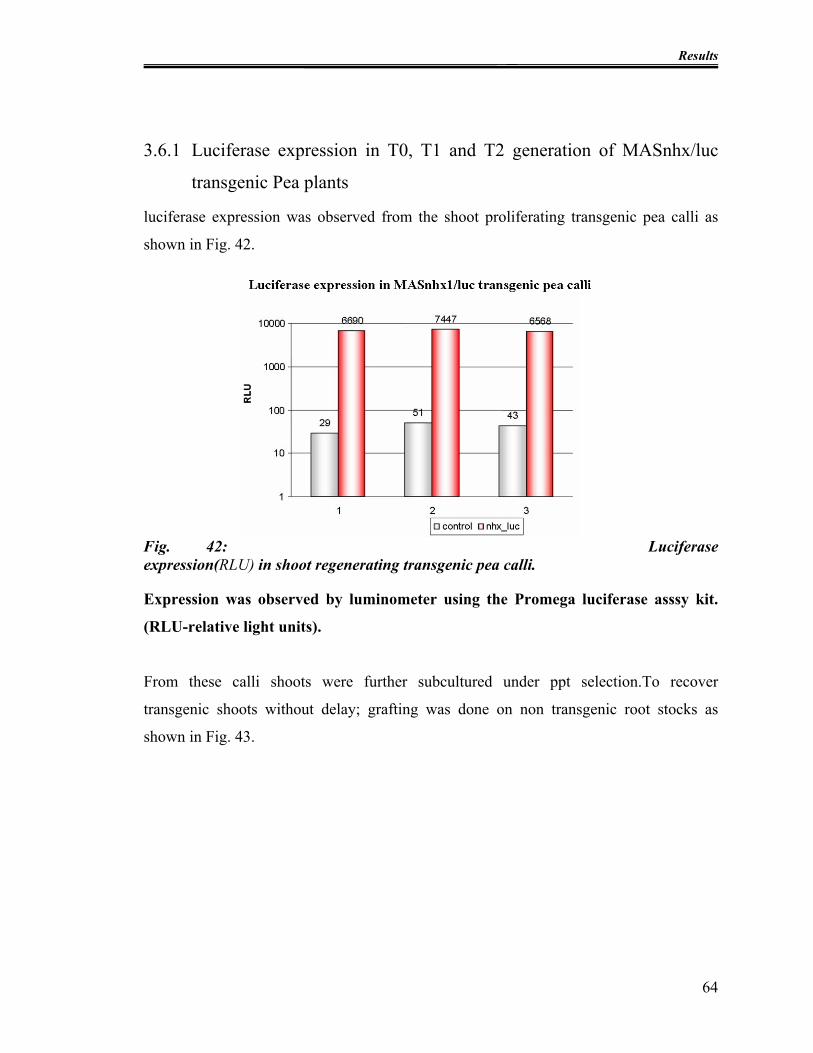
Results
3.6.1 Luciferase expression in T0, T1 and T2 generation of MASnhx/luc
transgenic Pea plants
luciferase expression was observed from the shoot proliferating transgenic pea calli as
shown in Fig. 42.
Fig. 42: Luciferase expression(RLU) in shoot regenerating transgenic pea calli.
Expression was observed by luminometer using the Promega luciferase asssy kit.
(RLU-relative light units).
From these calli shoots were further subcultured under ppt selection.To recover
transgenic shoots without delay; grafting was done on non transgenic root stocks as
shown in Fig. 43.
64
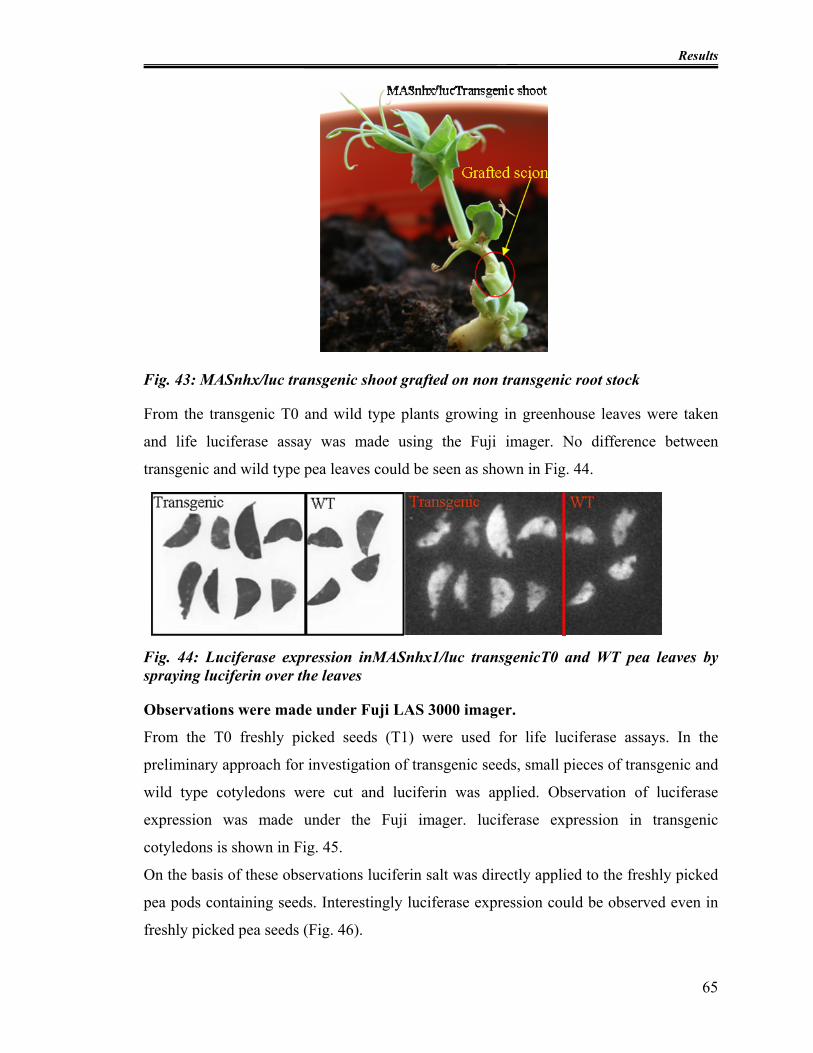
Results
Fig. 43: MASnhx/luc transgenic shoot grafted on non transgenic root stock
From the transgenic T0 and wild type plants growing in greenhouse leaves were taken
and life luciferase assay was made using the Fuji imager. No difference between
transgenic and wild type pea leaves could be seen as shown in Fig. 44.
Fig. 44: Luciferase expression inMASnhx1/luc transgenicT0 and WT pea leaves by spraying luciferin over the leaves
Observations were made under Fuji LAS 3000 imager.
From the T0 freshly picked seeds (T1) were used for life luciferase assays. In the
preliminary approach for investigation of transgenic seeds, small pieces of transgenic and
wild type cotyledons were cut and luciferin was applied. Observation of luciferase
expression was made under the Fuji imager. luciferase expression in transgenic
cotyledons is shown in Fig. 45.
On the basis of these observations luciferin salt was directly applied to the freshly picked
pea pods containing seeds. Interestingly luciferase expression could be observed even in
freshly picked pea seeds (Fig. 46).
65
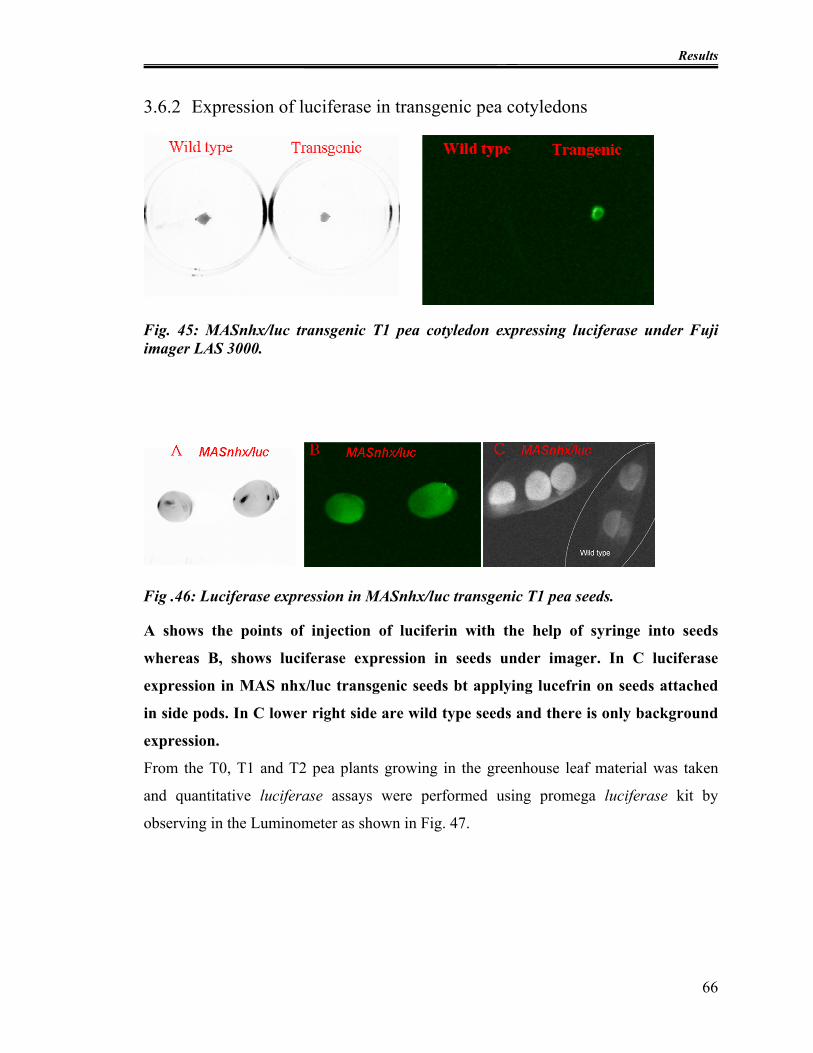
Results
3.6.2 Expression of luciferase in transgenic pea cotyledons
Fig. 45: MASnhx/luc transgenic T1 pea cotyledon expressing luciferase under Fuji imager LAS 3000.
Fig .46: Luciferase expression in MASnhx/luc transgenic T1 pea seeds.
A shows the points of injection of luciferin with the help of syringe into seeds
whereas B, shows luciferase expression in seeds under imager. In C luciferase
expression in MAS nhx/luc transgenic seeds bt applying lucefrin on seeds attached
in side pods. In C lower right side are wild type seeds and there is only background
expression.
From the T0, T1 and T2 pea plants growing in the greenhouse leaf material was taken
and quantitative luciferase assays were performed using promega luciferase kit by
observing in the Luminometer as shown in Fig. 47.
66
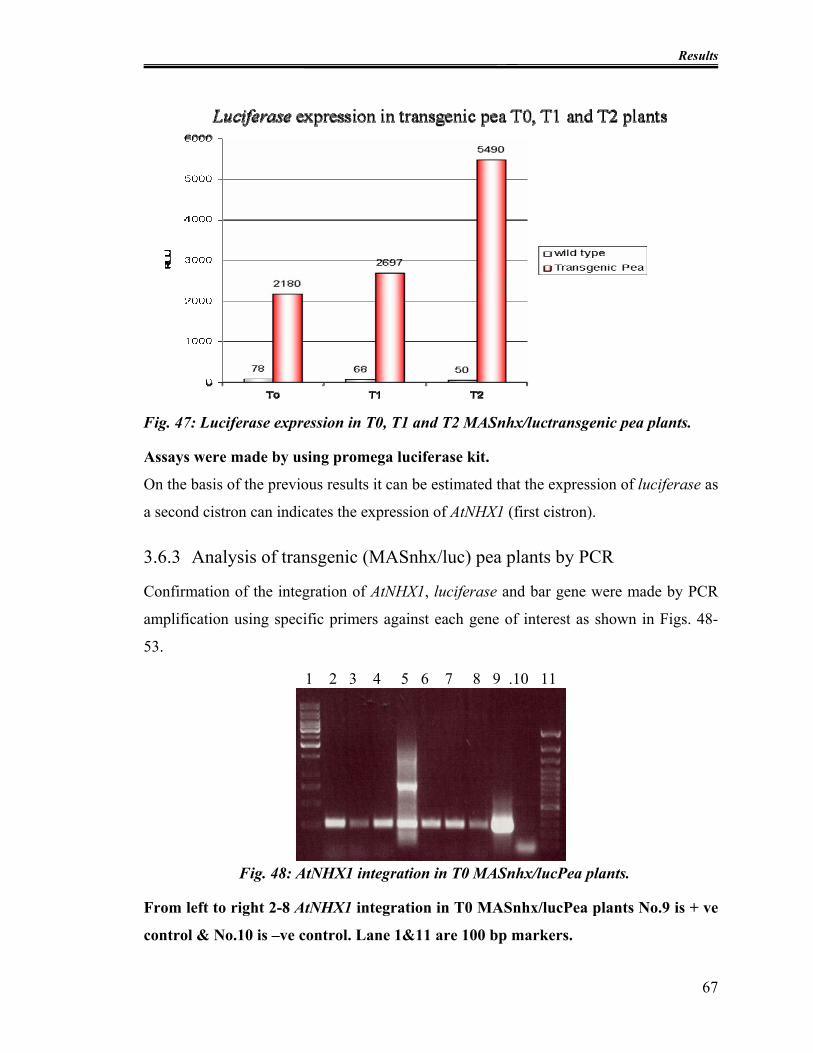
Results
Fig. 47: Luciferase expression in T0, T1 and T2 MASnhx/luctransgenic pea plants.
Assays were made by using promega luciferase kit.
On the basis of the previous results it can be estimated that the expression of luciferase as
a second cistron can indicates the expression of AtNHX1 (first cistron).
3.6.3 Analysis of transgenic (MASnhx/luc) pea plants by PCR
Confirmation of the integration of AtNHX1, luciferase and bar gene were made by PCR
amplification using specific primers against each gene of interest as shown in Figs. 48-
53.
1 2 3 4 5 6 7 8 9 .10 11
Fig. 48: AtNHX1 integration in T0 MASnhx/lucPea plants.
From left to right 2-8 AtNHX1 integration in T0 MASnhx/lucPea plants No.9 is + ve
control & No.10 is –ve control. Lane 1&11 are 100 bp markers.
67
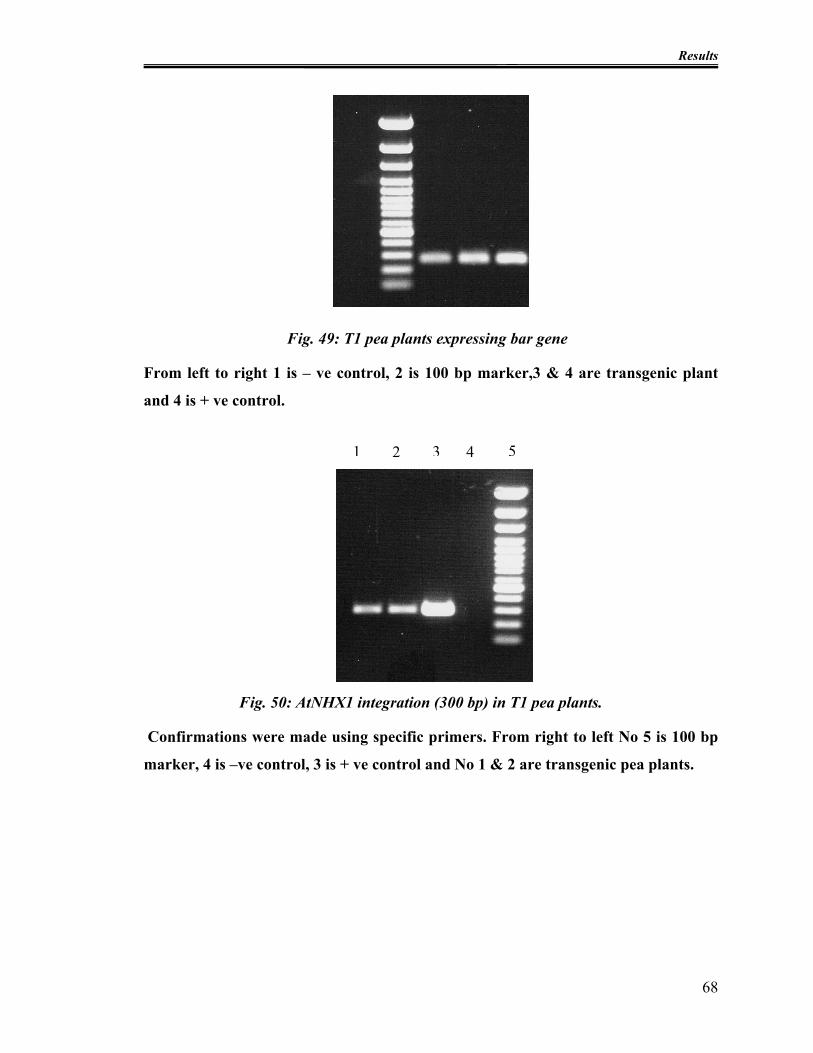
Results
Fig. 49: T1 pea plants expressing bar gene
From left to right 1 is – ve control, 2 is 100 bp marker,3 & 4 are transgenic plant
and 4 is + ve control.
51 3 42
Fig. 50: AtNHX1 integration (300 bp) in T1 pea plants.
Confirmations were made using specific primers. From right to left No 5 is 100 bp
marker, 4 is –ve control, 3 is + ve control and No 1 & 2 are transgenic pea plants.
68

Results
1 2 3 4 5 6 7 8
Fig. 51: T2 pea plants - Integration of bar gene.
No 1 is 100 bp marker, 2&3 wild type pea plant, 4&5 T2 transgenic plants 6 is T1
transgenic pea plant No 7 is + ve control and No 8 is –ve control.
1 2 3 4 5 6 7 8
Fig. 52: T2 pea plant - Integration of luciferase gene.
No 1 is 100 bp marker, 2&3 wild type pea plant, 4&5 T2 transgenic plants 6 is T1
transgenic pea plant No 7 is + ve control and No 8 is –ve control.
69

Results
1 2 3 4 5 6 7 8
Fig. 53: T2 pea plants - Integration of AtNHX1 gene.
No 1 is 100 bp marker, 2&3 wild type pea plant, 4&5 T2 transgenic plants 6 is T1
transgenic pea plant No 7 is + ve control and No 8 is –ve control.
70

Discussion
71
4 DISCUSSION
Coordinated expression of multiple proteins under control of the same promoter may be
helpful to achieve transformed plants with improved traits and is still a big challenge in
plants. To achieve this task, it seems to be reasonable to involve IRES elements as
intercistronic spacers although IRES mediated expression is lower. Genetic engineering
of crop plants with stress tolerance genes has the potential to improve among others also
drought and salt tolerance (Cixin et al., 2005; Shi et al., 2003; Zhang et al., 2001; Apse et
al., 1999). Various stress tolerance genes have been identified and their functional
properties were reported (Chinnusamy et al., 2004; Wang et al., 2003). In this study a
sodium/proton antiporter gene (AtNHX1) has been used as a proof of principle for a type
of new vectors, since the functionality of this gene is already proven by transformation of
different crop plants (Sottosanto et al., 2007; Cixin et al., 2005; shi et al., 2003; Zhang et
al., 2001).
In the first approach the functionality of the AtNHX1 gene (see 3.1.1.5), under the control
of a CaMV35S promoter in monocistronic system (see Fig. 13) was shown by
transforming N. tabacum. Transgenic T1 tobacco plants were grown on MS salt medium
containing different NaCl concentrations (0 mM, 50 mM, 100 mM, 150 mM and 200 mM
respectively). In these T1 tobacco plants enhanced salt tolerance could not be observed
because of the already very high tolerance of wild type plants. There might be already a
high level of Na+ antiporters in tobacco plants.
The objective of this study was not to develop salt tolerant plants but to establish a model
system for testing the functionality of AtNHX1. For testing its functionality in plants like
pea (Pisum sativum L.) it would take much more time. For the identification of
appropriate candidate genes in transgenic approaches it is essential to test the constructs
in a model system and than in the target plant species.
Salt challenge to AtNHX1 non-transgenic tobacco calli showed significantly improved
growth over the wild type (see Fig. 14b). Even at low salt concentrations (0 mM NaCl)
transgenic calli performed better than the wild type. This might be due to Gamborg´s B5
salt (4x) medium which was used for callus induction and growth, because it contained
comparably high amount of NaCl i.e. 2 g l-1 (Duchefa). As long as the NaCl
concentration was increased, severe reduction in growth up to 100 mM NaCl was
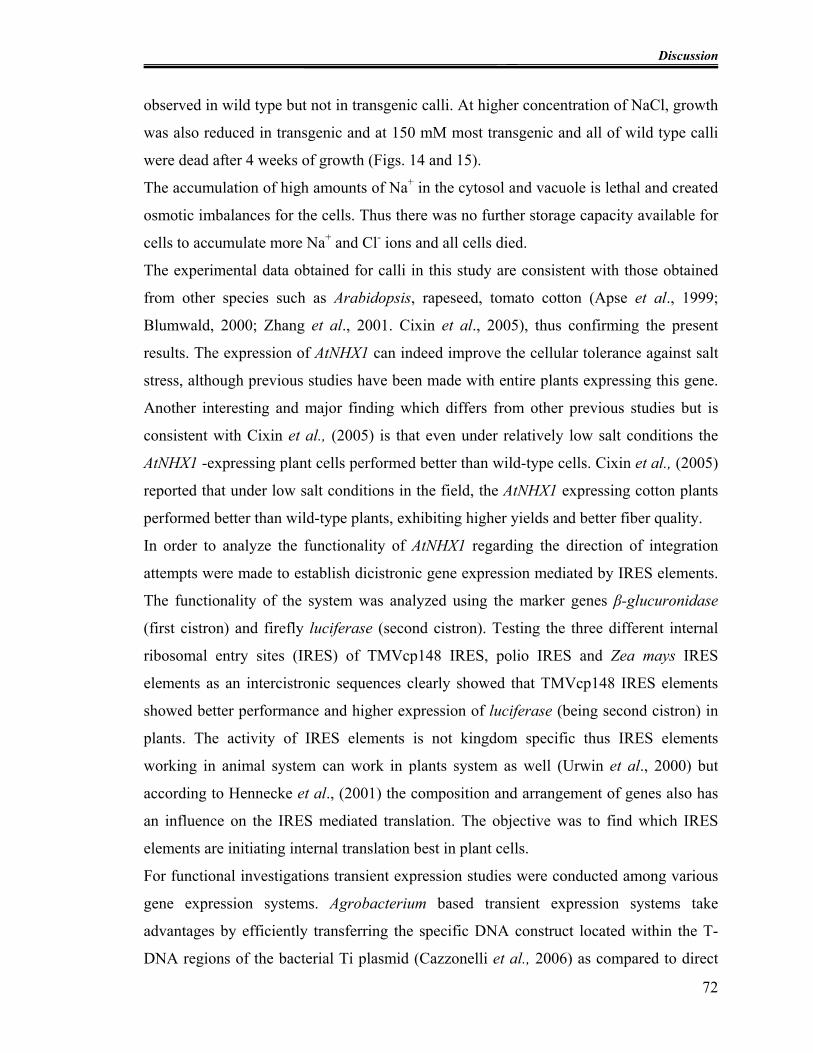
Discussion
72
observed in wild type but not in transgenic calli. At higher concentration of NaCl, growth
was also reduced in transgenic and at 150 mM most transgenic and all of wild type calli
were dead after 4 weeks of growth (Figs. 14 and 15).
The accumulation of high amounts of Na+ in the cytosol and vacuole is lethal and created
osmotic imbalances for the cells. Thus there was no further storage capacity available for
cells to accumulate more Na+ and Cl- ions and all cells died.
The experimental data obtained for calli in this study are consistent with those obtained
from other species such as Arabidopsis, rapeseed, tomato cotton (Apse et al., 1999;
Blumwald, 2000; Zhang et al., 2001. Cixin et al., 2005), thus confirming the present
results. The expression of AtNHX1 can indeed improve the cellular tolerance against salt
stress, although previous studies have been made with entire plants expressing this gene.
Another interesting and major finding which differs from other previous studies but is
consistent with Cixin et al., (2005) is that even under relatively low salt conditions the
AtNHX1 -expressing plant cells performed better than wild-type cells. Cixin et al., (2005)
reported that under low salt conditions in the field, the AtNHX1 expressing cotton plants
performed better than wild-type plants, exhibiting higher yields and better fiber quality.
In order to analyze the functionality of AtNHX1 regarding the direction of integration
attempts were made to establish dicistronic gene expression mediated by IRES elements.
The functionality of the system was analyzed using the marker genes β-glucuronidase
(first cistron) and firefly luciferase (second cistron). Testing the three different internal
ribosomal entry sites (IRES) of TMVcp148 IRES, polio IRES and Zea mays IRES
elements as an intercistronic sequences clearly showed that TMVcp148 IRES elements
showed better performance and higher expression of luciferase (being second cistron) in
plants. The activity of IRES elements is not kingdom specific thus IRES elements
working in animal system can work in plants system as well (Urwin et al., 2000) but
according to Hennecke et al., (2001) the composition and arrangement of genes also has
an influence on the IRES mediated translation. The objective was to find which IRES
elements are initiating internal translation best in plant cells.
For functional investigations transient expression studies were conducted among various
gene expression systems. Agrobacterium based transient expression systems take
advantages by efficiently transferring the specific DNA construct located within the T-
DNA regions of the bacterial Ti plasmid (Cazzonelli et al., 2006) as compared to direct
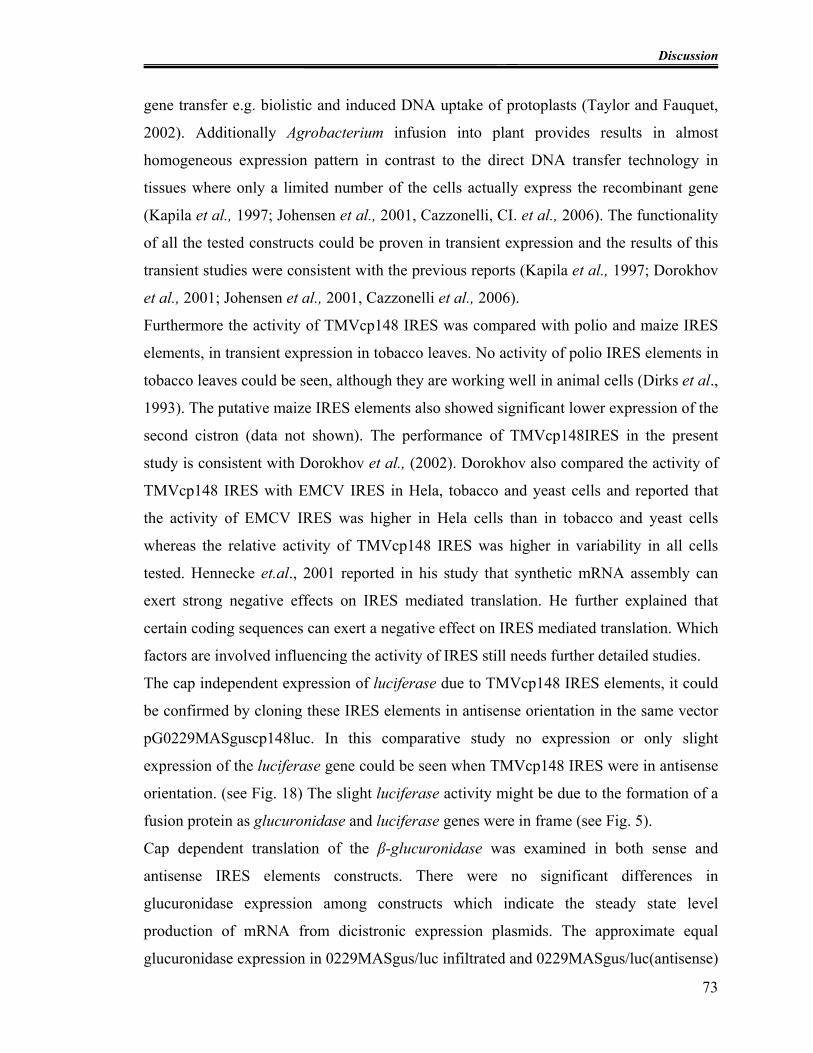
Discussion
73
gene transfer e.g. biolistic and induced DNA uptake of protoplasts (Taylor and Fauquet,
2002). Additionally Agrobacterium infusion into plant provides results in almost
homogeneous expression pattern in contrast to the direct DNA transfer technology in
tissues where only a limited number of the cells actually express the recombinant gene
(Kapila et al., 1997; Johensen et al., 2001, Cazzonelli, CI. et al., 2006). The functionality
of all the tested constructs could be proven in transient expression and the results of this
transient studies were consistent with the previous reports (Kapila et al., 1997; Dorokhov
et al., 2001; Johensen et al., 2001, Cazzonelli et al., 2006).
Furthermore the activity of TMVcp148 IRES was compared with polio and maize IRES
elements, in transient expression in tobacco leaves. No activity of polio IRES elements in
tobacco leaves could be seen, although they are working well in animal cells (Dirks et al.,
1993). The putative maize IRES elements also showed significant lower expression of the
second cistron (data not shown). The performance of TMVcp148IRES in the present
study is consistent with Dorokhov et al., (2002). Dorokhov also compared the activity of
TMVcp148 IRES with EMCV IRES in Hela, tobacco and yeast cells and reported that
the activity of EMCV IRES was higher in Hela cells than in tobacco and yeast cells
whereas the relative activity of TMVcp148 IRES was higher in variability in all cells
tested. Hennecke et.al., 2001 reported in his study that synthetic mRNA assembly can
exert strong negative effects on IRES mediated translation. He further explained that
certain coding sequences can exert a negative effect on IRES mediated translation. Which
factors are involved influencing the activity of IRES still needs further detailed studies.
The cap independent expression of luciferase due to TMVcp148 IRES elements, it could
be confirmed by cloning these IRES elements in antisense orientation in the same vector
pG0229MASguscp148luc. In this comparative study no expression or only slight
expression of the luciferase gene could be seen when TMVcp148 IRES were in antisense
orientation. (see Fig. 18) The slight luciferase activity might be due to the formation of a
fusion protein as glucuronidase and luciferase genes were in frame (see Fig. 5).
Cap dependent translation of the β-glucuronidase was examined in both sense and
antisense IRES elements constructs. There were no significant differences in
glucuronidase expression among constructs which indicate the steady state level
production of mRNA from dicistronic expression plasmids. The approximate equal
glucuronidase expression in 0229MASgus/luc infiltrated and 0229MASgus/luc(antisense)
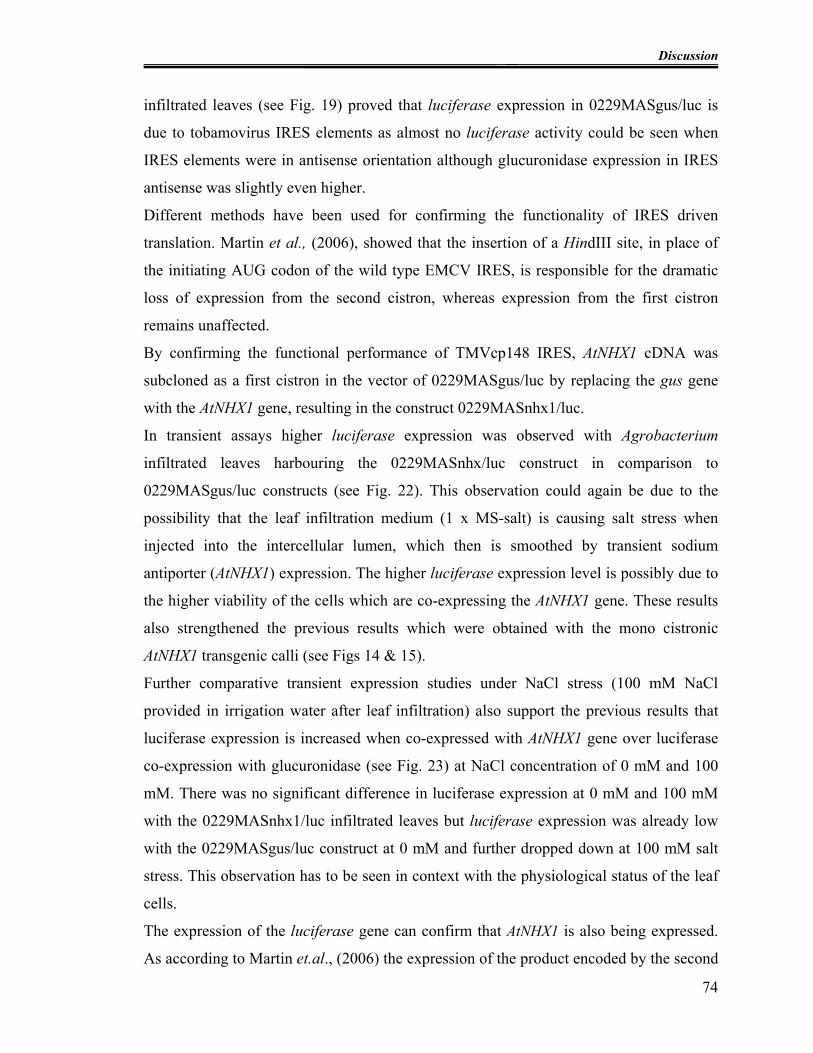
Discussion
74
infiltrated leaves (see Fig. 19) proved that luciferase expression in 0229MASgus/luc is
due to tobamovirus IRES elements as almost no luciferase activity could be seen when
IRES elements were in antisense orientation although glucuronidase expression in IRES
antisense was slightly even higher.
Different methods have been used for confirming the functionality of IRES driven
translation. Martin et al., (2006), showed that the insertion of a HindIII site, in place of
the initiating AUG codon of the wild type EMCV IRES, is responsible for the dramatic
loss of expression from the second cistron, whereas expression from the first cistron
remains unaffected.
By confirming the functional performance of TMVcp148 IRES, AtNHX1 cDNA was
subcloned as a first cistron in the vector of 0229MASgus/luc by replacing the gus gene
with the AtNHX1 gene, resulting in the construct 0229MASnhx1/luc.
In transient assays higher luciferase expression was observed with Agrobacterium
infiltrated leaves harbouring the 0229MASnhx/luc construct in comparison to
0229MASgus/luc constructs (see Fig. 22). This observation could again be due to the
possibility that the leaf infiltration medium (1 x MS-salt) is causing salt stress when
injected into the intercellular lumen, which then is smoothed by transient sodium
antiporter (AtNHX1) expression. The higher luciferase expression level is possibly due to
the higher viability of the cells which are co-expressing the AtNHX1 gene. These results
also strengthened the previous results which were obtained with the mono cistronic
AtNHX1 transgenic calli (see Figs 14 & 15).
Further comparative transient expression studies under NaCl stress (100 mM NaCl
provided in irrigation water after leaf infiltration) also support the previous results that
luciferase expression is increased when co-expressed with AtNHX1 gene over luciferase
co-expression with glucuronidase (see Fig. 23) at NaCl concentration of 0 mM and 100
mM. There was no significant difference in luciferase expression at 0 mM and 100 mM
with the 0229MASnhx1/luc infiltrated leaves but luciferase expression was already low
with the 0229MASgus/luc construct at 0 mM and further dropped down at 100 mM salt
stress. This observation has to be seen in context with the physiological status of the leaf
cells.
The expression of the luciferase gene can confirm that AtNHX1 is also being expressed.
As according to Martin et.al., (2006) the expression of the product encoded by the second
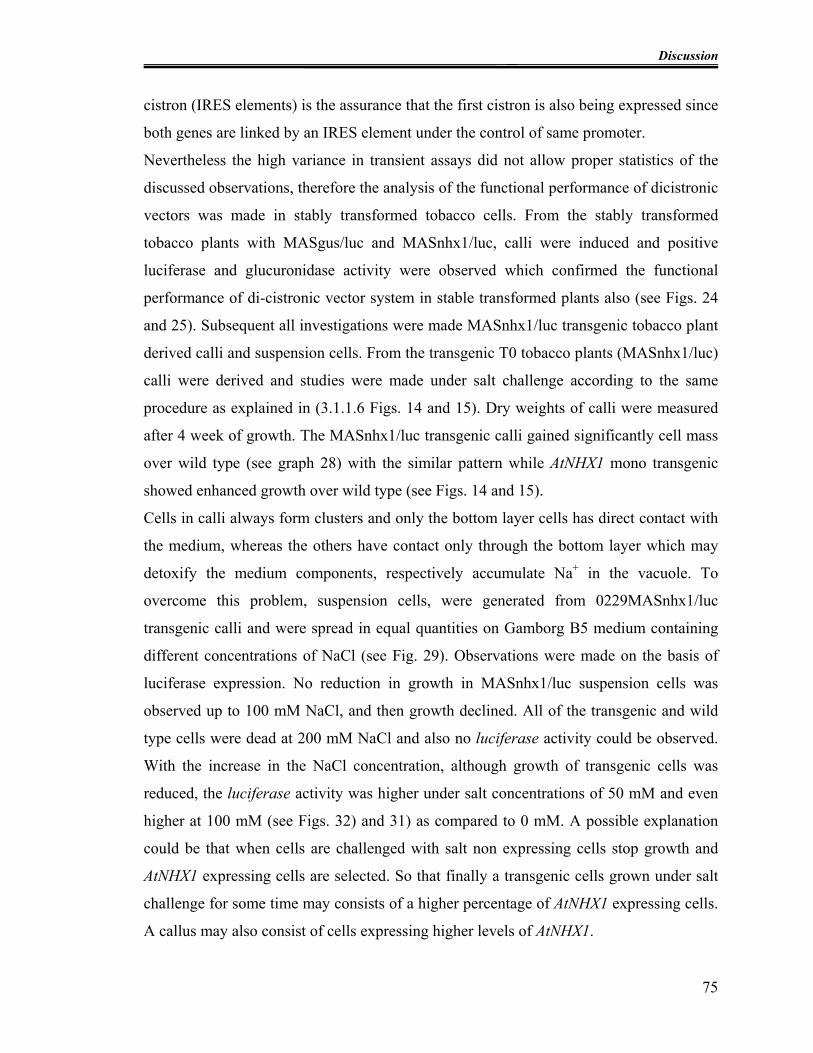
Discussion
75
cistron (IRES elements) is the assurance that the first cistron is also being expressed since
both genes are linked by an IRES element under the control of same promoter.
Nevertheless the high variance in transient assays did not allow proper statistics of the
discussed observations, therefore the analysis of the functional performance of dicistronic
vectors was made in stably transformed tobacco cells. From the stably transformed
tobacco plants with MASgus/luc and MASnhx1/luc, calli were induced and positive
luciferase and glucuronidase activity were observed which confirmed the functional
performance of di-cistronic vector system in stable transformed plants also (see Figs. 24
and 25). Subsequent all investigations were made MASnhx1/luc transgenic tobacco plant
derived calli and suspension cells. From the transgenic T0 tobacco plants (MASnhx1/luc)
calli were derived and studies were made under salt challenge according to the same
procedure as explained in (3.1.1.6 Figs. 14 and 15). Dry weights of calli were measured
after 4 week of growth. The MASnhx1/luc transgenic calli gained significantly cell mass
over wild type (see graph 28) with the similar pattern while AtNHX1 mono transgenic
showed enhanced growth over wild type (see Figs. 14 and 15).
Cells in calli always form clusters and only the bottom layer cells has direct contact with
the medium, whereas the others have contact only through the bottom layer which may
detoxify the medium components, respectively accumulate Na+ in the vacuole. To
overcome this problem, suspension cells, were generated from 0229MASnhx1/luc
transgenic calli and were spread in equal quantities on Gamborg B5 medium containing
different concentrations of NaCl (see Fig. 29). Observations were made on the basis of
luciferase expression. No reduction in growth in MASnhx1/luc suspension cells was
observed up to 100 mM NaCl, and then growth declined. All of the transgenic and wild
type cells were dead at 200 mM NaCl and also no luciferase activity could be observed.
With the increase in the NaCl concentration, although growth of transgenic cells was
reduced, the luciferase activity was higher under salt concentrations of 50 mM and even
higher at 100 mM (see Figs. 32) and 31) as compared to 0 mM. A possible explanation
could be that when cells are challenged with salt non expressing cells stop growth and
AtNHX1 expressing cells are selected. So that finally a transgenic cells grown under salt
challenge for some time may consists of a higher percentage of AtNHX1 expressing cells.
A callus may also consist of cells expressing higher levels of AtNHX1.
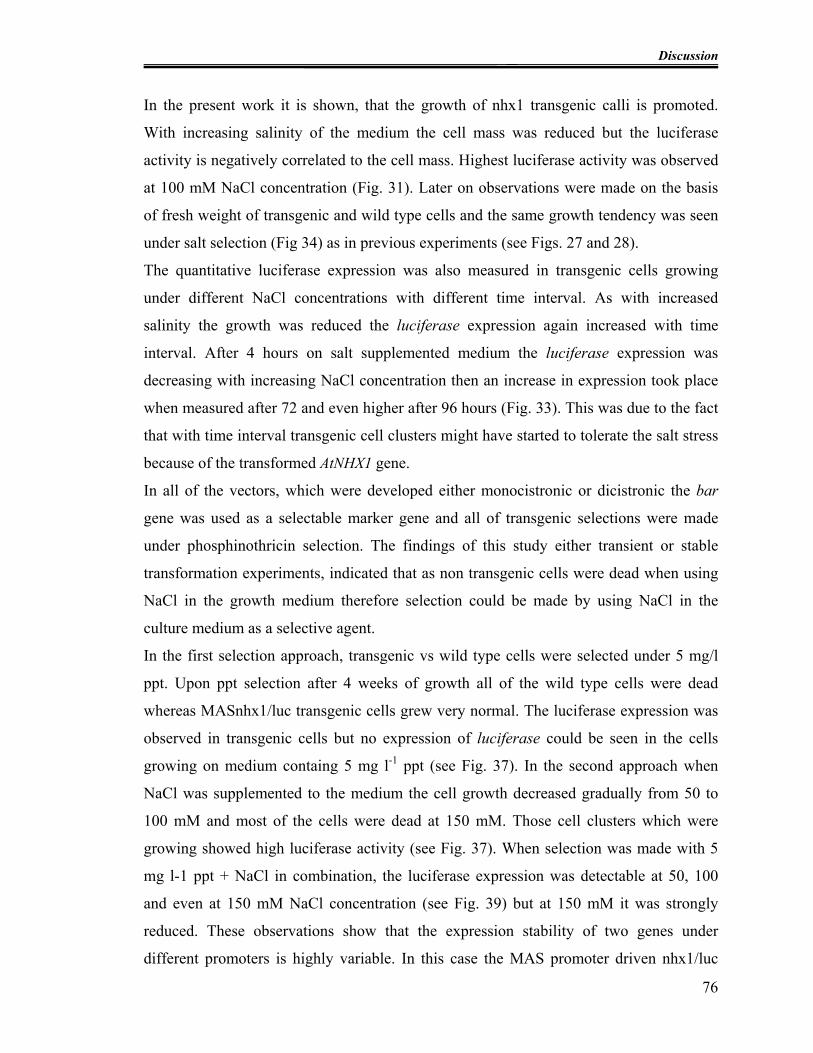
Discussion
76
In the present work it is shown, that the growth of nhx1 transgenic calli is promoted.
With increasing salinity of the medium the cell mass was reduced but the luciferase
activity is negatively correlated to the cell mass. Highest luciferase activity was observed
at 100 mM NaCl concentration (Fig. 31). Later on observations were made on the basis
of fresh weight of transgenic and wild type cells and the same growth tendency was seen
under salt selection (Fig 34) as in previous experiments (see Figs. 27 and 28).
The quantitative luciferase expression was also measured in transgenic cells growing
under different NaCl concentrations with different time interval. As with increased
salinity the growth was reduced the luciferase expression again increased with time
interval. After 4 hours on salt supplemented medium the luciferase expression was
decreasing with increasing NaCl concentration then an increase in expression took place
when measured after 72 and even higher after 96 hours (Fig. 33). This was due to the fact
that with time interval transgenic cell clusters might have started to tolerate the salt stress
because of the transformed AtNHX1 gene.
In all of the vectors, which were developed either monocistronic or dicistronic the bar
gene was used as a selectable marker gene and all of transgenic selections were made
under phosphinothricin selection. The findings of this study either transient or stable
transformation experiments, indicated that as non transgenic cells were dead when using
NaCl in the growth medium therefore selection could be made by using NaCl in the
culture medium as a selective agent.
In the first selection approach, transgenic vs wild type cells were selected under 5 mg/l
ppt. Upon ppt selection after 4 weeks of growth all of the wild type cells were dead
whereas MASnhx1/luc transgenic cells grew very normal. The luciferase expression was
observed in transgenic cells but no expression of luciferase could be seen in the cells
growing on medium containg 5 mg l-1 ppt (see Fig. 37). In the second approach when
NaCl was supplemented to the medium the cell growth decreased gradually from 50 to
100 mM and most of the cells were dead at 150 mM. Those cell clusters which were
growing showed high luciferase activity (see Fig. 37). When selection was made with 5
mg l-1 ppt + NaCl in combination, the luciferase expression was detectable at 50, 100
and even at 150 mM NaCl concentration (see Fig. 39) but at 150 mM it was strongly
reduced. These observations show that the expression stability of two genes under
different promoters is highly variable. In this case the MAS promoter driven nhx1/luc

Discussion
77
cassette is obviously silenced, when at the same time the bar gene is active. The
dicistronic approach for functional genomics provides translational control which allows
physiological investigations in vivo. In this experiment the correlation of growth and
luciferase activity is clearly documented. Where as the growth under ppt is correlated to
the transgeneity which is not the case with the nhx1 gene, respectively to the luciferase
activity.
The Southern blot analysis of the suspension culture failed several times when enzmes
were used which are cutting only once in the T-DNA but were successful when the whole
cassette was excised (see Fig 40). Since the suspension was derived from a T0 plant
which may represent already a mixture of independent transformation events, the
suspension will also be heterogeneous with respect to the transgenic character of the
cells. The heterogenousity of the cell population would then result in a multiple copies
like integration pattern in which the separate bands of the entire population might be
under the detection level of the Southern blot analysis.
By confirming and proving the functionality of the dicistronic vector system in transient
and stable transformed tobacco cells, further transformations were made in Pisum
sativum L. using it as a leguminous modal as a relevant crop plant was the final target of
this study. Since transformation efficiency of pea is very poor (Richter et al., 2006;
Polowick et al., 2004; Schroeder et al., 1993), there is a strong demand for a reliable and
functional expression system on the basis of translational control in vivo. The presented
dicistronic vectors are serving as a versatile tool for overcoming this problem. Further
more, according to Halpin, (2005), the coordinated expression of multiple genes is also
the key challenge in agro biotechnology. In this study a novel method has been
established for the selection of transgenic plant tissues or entire plants starting from the
initial phase of transformation. For the ultimate goal of this work, transgenic peas,
transformed explants were screened for luciferase expression in the shoot proliferating
calli (see Fig. 42). Those shoot proliferating calli showing positive luciferase expression
were further subcultured and transgenic shoots were recovered from these and grafted on
non transgenic rootstocks as shown in Fig. 43. From the transgenic T0 plants growing in
greenhouse leaves were taken and luciferase expression was observed by spraying
luciferin salt on the upper surface of leaves under a Fuji LAS 3000 imager but no
difference could be seen between transgenic and wild type pea leaves because of high

Discussion
78
back ground activity (Fig. 44). But when crud protein was extracted from the transgenic
pea leaves and RLU values were recorded by Luminometer by using promega luciferase
assay reagent kit, significant differences could be seen between transgenic and wild type
pea leaves as shown in Fig 47. In parallel, luciferase expressing plants were also
confirmed by PCR (Fig. 44).
Not all progenies of these T0 plants expressed luciferase in the subsequent T1 generation
and these results were consistent with negative results in PCR. Negative plants were
probably due to the chimeric character of the T0 plants, in which the germ line cells
probably were not transformed or simply due to the segregation of the transgenes.
However from T1 seeds a part of cotyledon was taken as well as from wild type seed and
assayed under the luminescence imager. Luciferase expression could be seen in
transgenic cotyledon where as no luminescence could be seen in non transgenic
cotyledons as shown in (Fig. 45). Further more luciferin was directly injected with the
help of syrnige into freshly picked seeds attached inside pods and expression of
luciferase could be observed in this way also in seeds as shown in Fig. 46. T1 seeds were
grown, leaf material was taken and positively tested for luciferase activity (Fig. 47) In
parallel, confirmation of T-DNA integration was also made by PCR (Figs. 48,49 and50).
In each generation confirmations were made on the basis of luciferase expression. Finally
expression of luciferase in the T2 transgenic pea plants was confirmed. In the T2
generation even higher luciferase expression level could be measured. These plants were
under severe attack of powdery mildew which might have caused water deficit in the
leaves and this stress might be over controlled by AtNHX1 thus enhanced the expression of
luciferasae Molecular analysis of T2 plants were made by PCR. PCR amplified products
of the all target genes are shown in Figs. 51, 52 and 53.
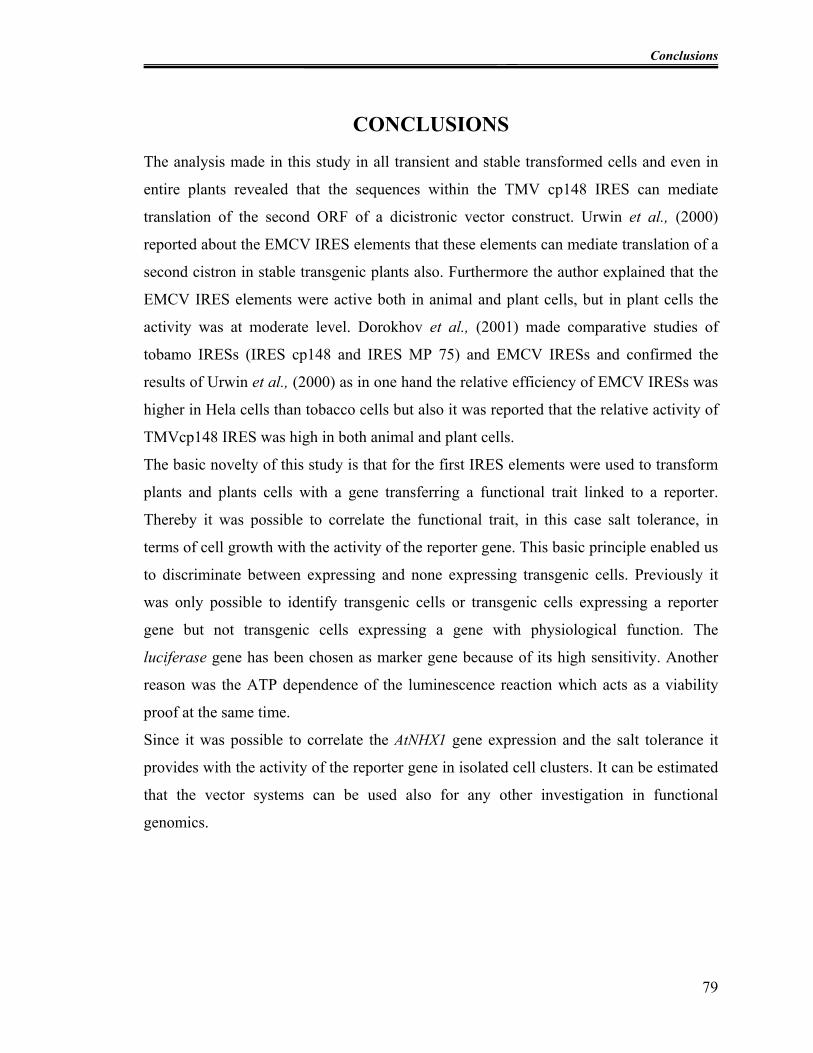
Conclusions
79
CONCLUSIONS
The analysis made in this study in all transient and stable transformed cells and even in
entire plants revealed that the sequences within the TMV cp148 IRES can mediate
translation of the second ORF of a dicistronic vector construct. Urwin et al., (2000)
reported about the EMCV IRES elements that these elements can mediate translation of a
second cistron in stable transgenic plants also. Furthermore the author explained that the
EMCV IRES elements were active both in animal and plant cells, but in plant cells the
activity was at moderate level. Dorokhov et al., (2001) made comparative studies of
tobamo IRESs (IRES cp148 and IRES MP 75) and EMCV IRESs and confirmed the
results of Urwin et al., (2000) as in one hand the relative efficiency of EMCV IRESs was
higher in Hela cells than tobacco cells but also it was reported that the relative activity of
TMVcp148 IRES was high in both animal and plant cells.
The basic novelty of this study is that for the first IRES elements were used to transform
plants and plants cells with a gene transferring a functional trait linked to a reporter.
Thereby it was possible to correlate the functional trait, in this case salt tolerance, in
terms of cell growth with the activity of the reporter gene. This basic principle enabled us
to discriminate between expressing and none expressing transgenic cells. Previously it
was only possible to identify transgenic cells or transgenic cells expressing a reporter
gene but not transgenic cells expressing a gene with physiological function. The
luciferase gene has been chosen as marker gene because of its high sensitivity. Another
reason was the ATP dependence of the luminescence reaction which acts as a viability
proof at the same time.
Since it was possible to correlate the AtNHX1 gene expression and the salt tolerance it
provides with the activity of the reporter gene in isolated cell clusters. It can be estimated
that the vector systems can be used also for any other investigation in functional
genomics.
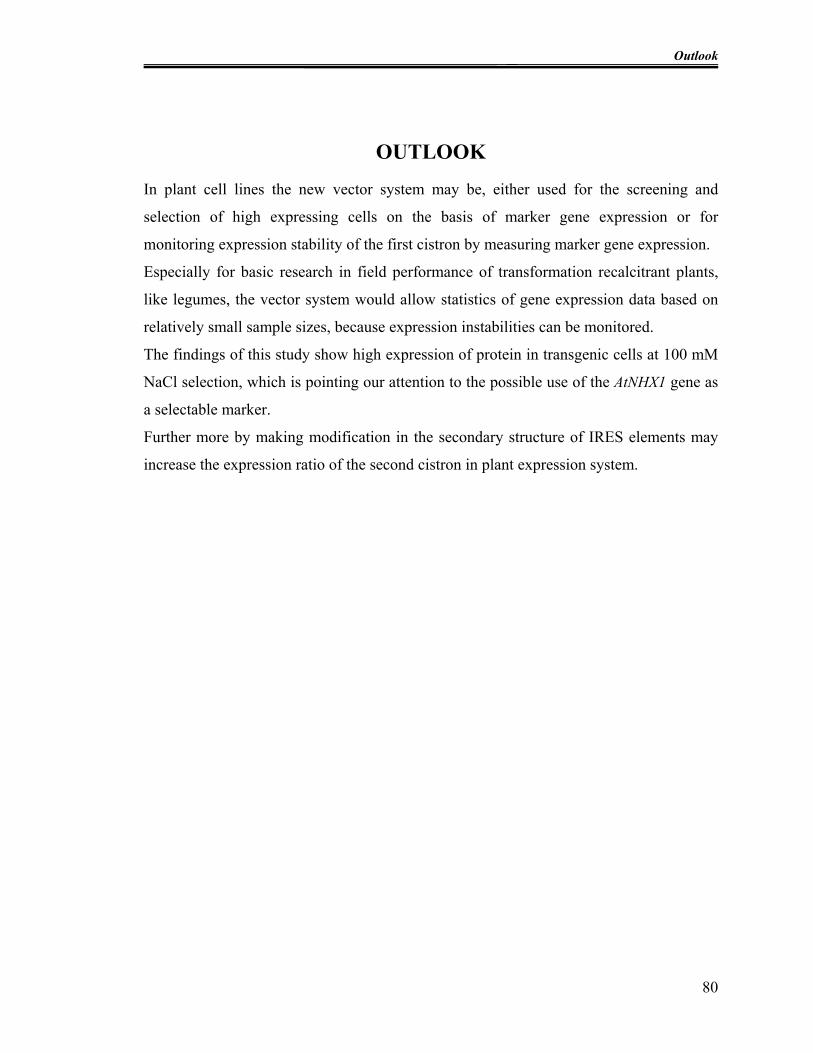
Outlook
80
OUTLOOK
In plant cell lines the new vector system may be, either used for the screening and
selection of high expressing cells on the basis of marker gene expression or for
monitoring expression stability of the first cistron by measuring marker gene expression.
Especially for basic research in field performance of transformation recalcitrant plants,
like legumes, the vector system would allow statistics of gene expression data based on
relatively small sample sizes, because expression instabilities can be monitored.
The findings of this study show high expression of protein in transgenic cells at 100 mM
NaCl selection, which is pointing our attention to the possible use of the AtNHX1 gene as
a selectable marker.
Further more by making modification in the secondary structure of IRES elements may
increase the expression ratio of the second cistron in plant expression system.
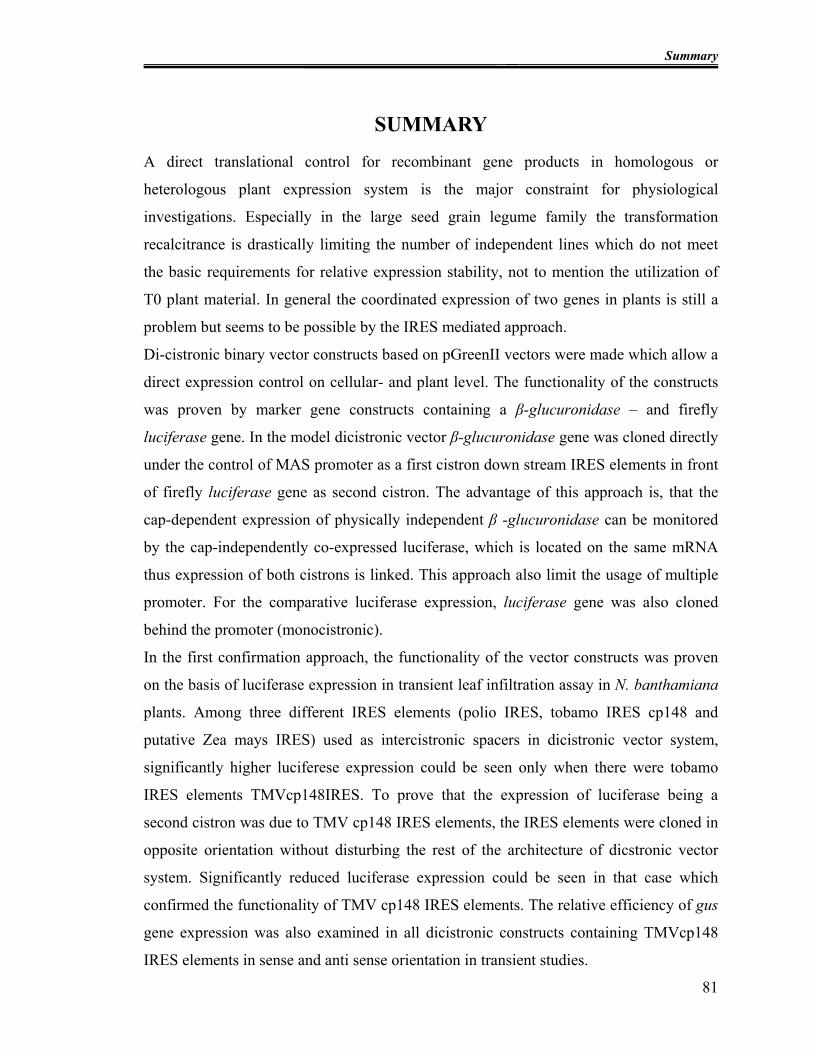
Summary
81
SUMMARY
A direct translational control for recombinant gene products in homologous or
heterologous plant expression system is the major constraint for physiological
investigations. Especially in the large seed grain legume family the transformation
recalcitrance is drastically limiting the number of independent lines which do not meet
the basic requirements for relative expression stability, not to mention the utilization of
T0 plant material. In general the coordinated expression of two genes in plants is still a
problem but seems to be possible by the IRES mediated approach.
Di-cistronic binary vector constructs based on pGreenII vectors were made which allow a
direct expression control on cellular- and plant level. The functionality of the constructs
was proven by marker gene constructs containing a β-glucuronidase – and firefly
luciferase gene. In the model dicistronic vector β-glucuronidase gene was cloned directly
under the control of MAS promoter as a first cistron down stream IRES elements in front
of firefly luciferase gene as second cistron. The advantage of this approach is, that the
cap-dependent expression of physically independent β -glucuronidase can be monitored
by the cap-independently co-expressed luciferase, which is located on the same mRNA
thus expression of both cistrons is linked. This approach also limit the usage of multiple
promoter. For the comparative luciferase expression, luciferase gene was also cloned
behind the promoter (monocistronic).
In the first confirmation approach, the functionality of the vector constructs was proven
on the basis of luciferase expression in transient leaf infiltration assay in N. banthamiana
plants. Among three different IRES elements (polio IRES, tobamo IRES cp148 and
putative Zea mays IRES) used as intercistronic spacers in dicistronic vector system,
significantly higher luciferese expression could be seen only when there were tobamo
IRES elements TMVcp148IRES. To prove that the expression of luciferase being a
second cistron was due to TMV cp148 IRES elements, the IRES elements were cloned in
opposite orientation without disturbing the rest of the architecture of dicstronic vector
system. Significantly reduced luciferase expression could be seen in that case which
confirmed the functionality of TMV cp148 IRES elements. The relative efficiency of gus
gene expression was also examined in all dicistronic constructs containing TMVcp148
IRES elements in sense and anti sense orientation in transient studies.
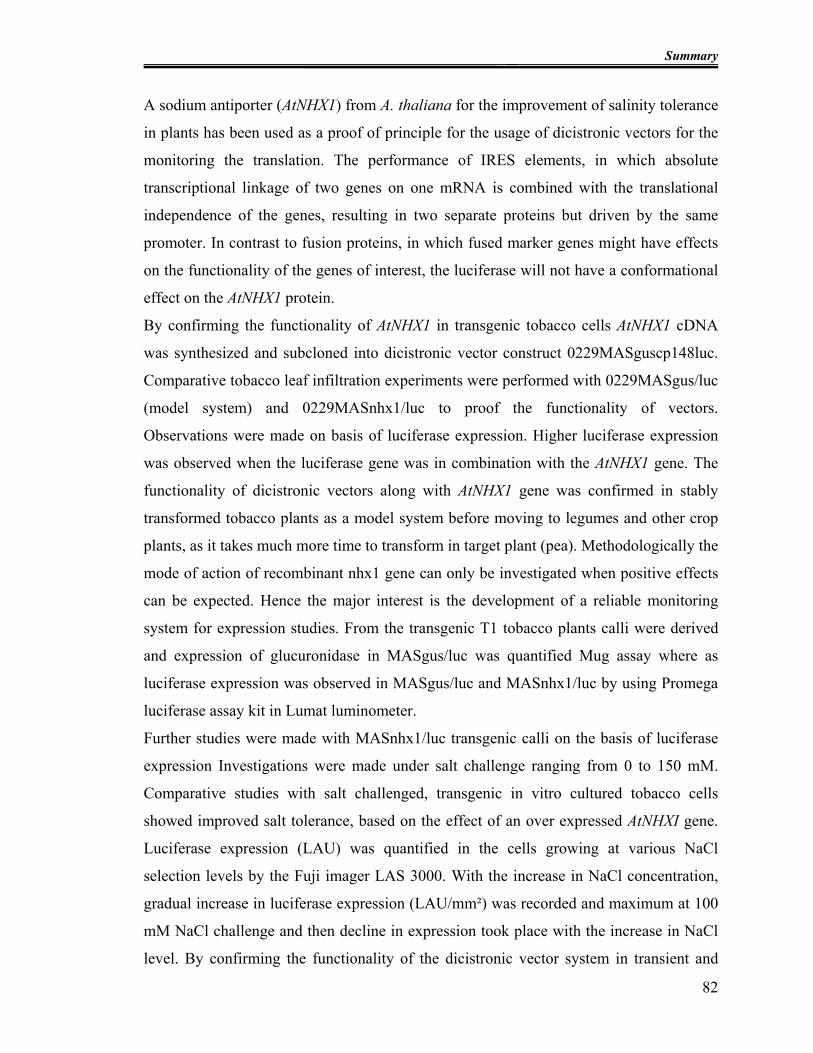
Summary
82
A sodium antiporter (AtNHX1) from A. thaliana for the improvement of salinity tolerance
in plants has been used as a proof of principle for the usage of dicistronic vectors for the
monitoring the translation. The performance of IRES elements, in which absolute
transcriptional linkage of two genes on one mRNA is combined with the translational
independence of the genes, resulting in two separate proteins but driven by the same
promoter. In contrast to fusion proteins, in which fused marker genes might have effects
on the functionality of the genes of interest, the luciferase will not have a conformational
effect on the AtNHX1 protein.
By confirming the functionality of AtNHX1 in transgenic tobacco cells AtNHX1 cDNA
was synthesized and subcloned into dicistronic vector construct 0229MASguscp148luc.
Comparative tobacco leaf infiltration experiments were performed with 0229MASgus/luc
(model system) and 0229MASnhx1/luc to proof the functionality of vectors.
Observations were made on basis of luciferase expression. Higher luciferase expression
was observed when the luciferase gene was in combination with the AtNHX1 gene. The
functionality of dicistronic vectors along with AtNHX1 gene was confirmed in stably
transformed tobacco plants as a model system before moving to legumes and other crop
plants, as it takes much more time to transform in target plant (pea). Methodologically the
mode of action of recombinant nhx1 gene can only be investigated when positive effects
can be expected. Hence the major interest is the development of a reliable monitoring
system for expression studies. From the transgenic T1 tobacco plants calli were derived
and expression of glucuronidase in MASgus/luc was quantified Mug assay where as
luciferase expression was observed in MASgus/luc and MASnhx1/luc by using Promega
luciferase assay kit in Lumat luminometer.
Further studies were made with MASnhx1/luc transgenic calli on the basis of luciferase
expression Investigations were made under salt challenge ranging from 0 to 150 mM.
Comparative studies with salt challenged, transgenic in vitro cultured tobacco cells
showed improved salt tolerance, based on the effect of an over expressed AtNHXI gene.
Luciferase expression (LAU) was quantified in the cells growing at various NaCl
selection levels by the Fuji imager LAS 3000. With the increase in NaCl concentration,
gradual increase in luciferase expression (LAU/mm²) was recorded and maximum at 100
mM NaCl challenge and then decline in expression took place with the increase in NaCl
level. By confirming the functionality of the dicistronic vector system in transient and
Summary
83
stably transformed tobacco cells, functionality of IRES elements was also confirmed in
entire plant. Agrobacterium mediated transformation was made with pea (Pisum sativum
L.) as a legume model. The Agrobacterium mediated transformation system according to
the modified protocol of Schroeder et al., 1993 and Bean et al., 1997 has been used. All
of the non transgenic and wild type embryos started to die after the second round of
selection. Luciferase expression was observed from the shoot proliferating transgenic pea
calli. Regenerating shoots from the luciferase exprssiong callis were further subcultured
with increased ppt concentrations (7.5 mg/l) and used for in vitro grafting on a wild type
root stock. From the T0 plants, freshly picked seeds (T1) were used for life luciferase
assays. In the preliminary approach for investigation of transgenic seeds, small pieces of
transgenic and wild type cotyledons were cut and luciferin was applied. Observation of
luciferase expression was made under the Fuji imager. Luciferase expression in
transgenic cotyledons could be seen. On the basis of these observations luciferin was
directly applied to the freshly picked pea pods containing seeds. Pods were opened and
luciferin was injected in the seeds. Interestingly luciferase expression could be observed
in freshly picked pea seeds. Transgenic T0, T1 and T2 pea plants confirmed by PCR
showed luciferase activity, as a first indicator for the AtNHX I expression in pea.

References
84
REFERENCES
Adam, A. M. P., (1990). Saltmarsh ecology. Cambridge University Press, Cambridge,
UK.
Adam, S., Vinkenoog R., Spielman, M., Dickinson, H. G., and Scott, R. J. (2000).
Parent-of-origin effect on seed development in Arabidopsis thaliana require DNA
methylation. Development 127: 2493-2502.
Akiri, G., Nahari, D., Finkelstein, Y., Le, S. Y., Elroy-Stein, O., and Levi, B. Z.
(1998). Regulation of vascular endothelial growth factor (VEGF) expression is mediated
by internal initiation of translation and alternative initiation of transcription. Oncogene
17: 227–236.
Alam, S. M., Ansari, R., and Khan, M. A. 2000. Saline agriculture and Pakistan. In:
Industry and Economy, 08-21 May.
http://www.pakistaneconomist.com/issue2000/issue19&20/i&e3.htm.
Apse, M. P., Aharon, G. S., Snedden, W. A., and Blumwald, E. (1999). Salt tolerance
conferred by over expression of a vacuolar N+/H+ antiport in Arabidopsis. Science 285:
1256–1258.
Bean, S. J., Gooding, P. S., Mullineaux, P. M., and Davies, D. R. (1997). A simple
system for pea transformation. Plant Cell Reports. 16: 513-519.
Bernstein, J., Sella, O., Le, S. Y., and Elroy-Stein, O. (1997). PDGF2/c-sis mRNA
leader contains a differentiation linked internal ribosomal entry site (D-IRES). J. Biol.
Chem. 272: 9356–9362.
Blumwald, E. (2000). Salt transport and salt resistance in plants and other organisms.
Curr. Opin. Cell Biol. 12: 431–434.
Blumwald, E., and Poole, R. (1985). Na+/H+-antiporter in isolated tonoplast vesicles
from storage tissue of Β. vulgaris. Plant Physiol. 78: 163–167.
References
85
Brown, T. A. 2001. Gene cloning and DNA analysis: An Introduction, 5th edition. Black
well publishing.
Carter, M. S., Kuhn, K. M., and Sarnow, P. (2000). Cellular internal ribosome entry
site elements and the use of cDNA microarrays in their investigation. In: translational
control of gene expression, pp. 615–636. Edited by N. Sonenberg, J. W. B. Hershey and
M. B. Mathews. Cold Spring Harbor, NY: Cold Spring Harbor Laboratory.
Cazzonelli, C. I., and Velten, J. (2006). An in vitro, luciferase-based, Agrobacterium-
infiltration assay system: implications for post-transcriptional gene silencing. Planta 224:
582-597.
Chappell, S. A., Edelman, G. M., and Mauro, V. (2000). A 9-nt segment of a cellular
mRNA can function as an internal ribosome entry site (IRES) and when present in linked
multiple copies greatly enhance IRES activity. Proc. Natl. Acad. Sci. USA, 97: 1536–
1541.
Chinnusamy, V., Jagendorf, A., and Zhu, J. K. (2005). Understanding and improving
salt tolerance in plants. Crop Science 45: 437-448.
Cixin, He., Juqiang Yan 1., Guoxin Shen 1., Lianhai Fu., A. Scott Holaday 1., Dick
Auld., EduardoBlumwald., and Hong Zhang. (2005) Expression of an Arabidopsis
Vacuolar Sodium/Proton Antiporter Gene in Cotton Improves Photosynthetic
Performance Under Salt Conditions and Increases Fiber Yield in the Field Plant Cell
Physiol. 46(11): 1848–1854
Cuesta, R., Laroia, G. and Schneider, R. J. (2000). Chaperone hsp27 inhibits
translation during heat shock by binding eIF4G and facilitating dissociation of cap-
initiation complexes. Genes and Development 14: 1460–1470.
Davies, D. R., Hamilton, J. and Mullineaux, P. (1993). Transformation of peas. Plant
Cell Reports. 12: 180-183.
References
86
De Kathen, A., and Jacobsen, H. J. (1990). Agrobacterium tumefaciens mediated
transformation of Pisum sativum L. using binary and cointegrate vectors. Plant Cell
Reports. 9: 276-279.
Denby, K., and Gehring, C. (2005). Engineering drought and salinity tolerance in
plants: lessons from genome-wide expression profiling in Arabidopsis. Trends in
Biotechnology. 23: 11.
Dinkova, T. D., Zepeda, H., Martinez-Salas, E., Martinez, L. M., Nieto-Sotelo, J.,
Jimenez, D. E. (2004). Cap-independent translation of maize Hsp101. Plant J. 41: 722-
731.
Dirks, W., and Hauser, H. (1994). Equimolar expression of two protein chains in
mammalian cells. In: Animal cell technology: products of today, prospects for tomorrow.
Spier, R., Griffiths, B. and Berthold, W. (eds), Butterworths, Oxford, UK, pp. 610–616.
Dirks, W., Wirth, M., and Hauser, H. (1993). Dicistronic transcription units for gene
expression in mammalian cells. Gene 128: 247-249.
Dorokhov, Y. L., Skulachev, M. V., Ivanov, P. A., Zvereva, S. D., Tjulkina, L. G.,
Merits, A., Gleba, Y. Y., Hohn, T., and Atabekov, J. G. (2002). Polypurine (A)-rich
sequences promote cross-kingdom conservation of internal ribosome entry PNAS 99:
5301-5306.
Eric, Jan (2006) Divergent IRES elements in invertebrates Virus Research 119: 16-28.
FAO. (2005). Global network on integrated soil management for sustainable use of salt-
affected soils. Rome, Italy: FAO Land and Plant Nutrition Management Service.
http://www.fao.org/ag/agl/agll/spush.
Fischer, R., Vaquero-Martin, C., Sack, M., Drossard, J., Emans, N., and
Commandeur, U. (1999). Towards molecular farming in the future: transient protein
expression in plants. Biotechnol Appl Biochem 30: 113–116.
References
87
Fox PC, Vasil V, Vasil IK, Gurley WB (1992) Multiple ocs-like elements required for
efficient transcription of the mannopine synthase gene of T-DNA in maize protoplasts.
Plant Mol Biol 20: 219-233
Gallie, D. R., and Browning, K. S. (2001). elF4G functionality differs from elFiso4G in
promoting internal initiation, cap-independent translation, and translation of structured
mRNAs. J. Biol. Chem. 276: 36951-36960.
Gan, W., and Rhoads, R. E. (1996). Internal initiation of translation directed by the 5'-
untranslated region of the mRNA for eIF4G, a factor involved in the picorna virus-
induced switch from cap-dependent to internal initiation. J. Biol. Chem. 271: 623–626.
Glenn, E. P., Brown, J. J., and Blumwald, E. (1999). Salt tolerance and crop potential
of halophytes. Critical Reviews in Plant Sciences 18: 227-255.
Gradi, A., Svitkin, Y. V., Imataka, H., and Sonenberg, N. (1998). Proteolysis of
human eukaryotic translation initiation factor eIF4GII, but not eIF4GI, coincides with the
shutoff of host protein synthesis after poliovirus infection. Proc. Natl. Acad. Sci. USA 95:
11089–11094.
Grant, J. E., Cooper, P. A., Mcara, A. E., and Frew, T. J. (1995). Transformation of
peas (Pisum sativum L.) using immature cotyledons. Plant Cell reports. 15:254-258.
Grover, A. et al., (2003). Addressing abiotic stresses in agriculture through transgenic
technology. Curr. Sci. 84: 355–367.
Hafeez, F. Y., Aslam, Z., and Malik, K. A. (1988). Effect of salinity and inoculation on
growth, nitrogen fixation and nutrient uptake of Vigna radiata (L.) Wilczek. Plant and
Soil 106: 3-8.
Halpin, C. (2005). Gene stacking in transgenic plants—the challenge for 21st century
plant biotechnology. Plant Biotechnol J. 3: 141–155.
Halpin, C., and Boerjan, W. (2003). Stacking transgenes in forest trees. Trends in Plant
Science 8: 363-365.

References
88
He, C., Yan, J., Shen, G., Fu, L., Holaday, A. S., Auld, D., Blumwald, E., and Zhang,
H. (2005). Expression of an Arabidopsis vacuolar sodium/proton antiporter gene in
cotton improves photosynthetic performance under salt conditions and increases fiber
yield in the field. Plant Cell Physiol. 46: 1848–1854.
Hellens, R. P., Andrew, C. A., Ellen, N. F., Bolitho, K., Grafton, K., Templeton, M.
D., Karunairetnam, S., Gleave, A. P., and Laing, W.A. (2005). Transient expression
vectors for functional genomics, quantification of promoter activity and RNA silencing in
plants Plant Method. 1: 13.
Henis-Korenblit, S., Strumpf, N. L., Goldstaub, D., and Kimchi, A. (2000). A novel
form of DAP5 protein accumulates in apoptotic cells as a result of caspase cleavage and
internal ribosome entry site-mediated translation. Mol. Cell. Biol. 20: 496–506.
Hennecke, M., Kwissa, M., Metzger, K., Oumard, A., Kröger, A., Schirmbeck, R.,
Reimann, J., and Hauser, H. (2001). Composition and arrangement of genes define the
strength of IRES-driven translation in bicistronic mRNAs. Nucleic Acids Research 29:
3327-3334.
Hernandez, J. A., Jimenez, A., Mullineaux, P., and Sevilla, F. (2000). Tolerance of
pea (Pisum sativum L.) to long term salt stress is associated with induction antioxidant
defences. Plant Cell Environ. 23: 853-862.
Hershey, J. W. B. and Merrick, W. C. (2000). Pathway and mechanism of initiation of
protein synthesis. In: translational control of gene expression, pp. 33–88. Edited by: N.
Sonenberg, J. W. B. Hershey and M. B. Mathews. Cold Spring Harbor, NY: Cold Spring
Harbor Laboratory.
Hood, E. E., Gelvin, S. B., Melchers, L. S. and Hoekema, A. (1993). New
Agrobacterium helper plasmids for gene transfer to plants. Transgen Res. 2:208-218.
Horn, M. E., Woodard, S. L., and Howard, J. A. (2004). Plant molecular farming:
systems and products. Plant Cell Rep 22: 711–720.

References
89
Horsch, R. B., Rogers, S. G., and Fraley, R. T. (1985). Transgenic plants. Cold Spring
Harbour. Symp. Quant. Biol. 50: 433-437.
Ikea, J., Ingelbrecht, I., Uwaifo, A. and Thottappilly, G. (2003) Stable gene
transformation in cowpea (Vigna unguiculata L. walp.) using particle gun method.
African Journal of Biotechnology. 2: 211-218.
Jackson, R. J. (2000). Comparative view of initiation site selection mechanisms. In:
Translational control of gene expression, pp. 127–184. Edited by: N. Sonenberg, J. W.
B. Hershey and M. B. Mathews. Cold Spring Harbor, NY: Cold Spring Harbor
Laboratory.
Jefferson, R. A., Kavanagh, T. A., and Bevan, M. W. (1987). GUS fusion: β-
glucuronidase as a sensitive and versatile gene fusion marker in higher plants. The Embo
journal 6:3901-3907.
Johannes, G. and Sarnow, P. (1998). Cap-independent polysomal association of natural
mRNAs encoding c-myc, BiP, and eIF4G conferred by internal ribosome entry sites.
RNA 4: 1500–1513.
Johannes, G., Carter, M. S., Eisen, M. B., Brown, P. O. and Sarnow, P. (1999).
Identification of eukaryotic mRNAs that are translated at reduced cap binding complex
eIF4F concentrations using a cDNA microarray. Proc. Natl. Acad. Sci. 96: 13118–
13123.
Kapila, J., de Rycke, R., van Montagu, M., and Angenon, G. (1997). An
Agrobacterium-mediated transient gene expression system for intact leaves. Plant Sci.
122: 101–108.
Kiesecker, H. (2000) Entwicklung eines Agrobacterium tumefaciens vermittelten
Gentransfersystems für Kichererbsen (Cicer arietinum L.) [Development of
Agrobacterium-mediated transformation of chickpea]. Ph-D thesis, Hannover University,
Germany.
References
90
Köhler, F., Golz, C., Eapen, S., Kohn, H., and Schieder, O. (1987). Stable
transformation of moth bean Vigna aconitifolia via direct gene transfer. Plant Cell
Reports. 6: 313-317.
Kramer, C., Di-Maio, J., Carswell, G. K., and Shi-Uito, R. D. (1993). Planta 190:
454-458.
Macejak, D. G. and Sarnow, P. (1991). Internal initiation of translation mediated by the
5´ leader of a cellular mRNA. Nature 353: 90–94.
Mariko, S., Kachi, N., Ishikawa, S., and Furukawa, A. (1992). Germination ecology
of coastal plants in relation to salt environment. Ecological Research 7: 225–233.
Martin, P., Albagli, O., Poggi, M. C., Boulukos, K. E., and Pognonec, P. (2006).
Development of a new bicistronic retroviral vector with strong IRES activity. BMC
Biotechnology. 6: 4.
Matsuo, N., and Hiratsuka, K. (2004). Development of IRES –mediated gene
expression system in plants. Plant Biotechnology. 21:119-126.
Matzke, M. A., Neuhuber, F., and Matzke, A. J. (1993). A variety of epistatic
interactions can occur between partially homologous transgene loci brought together by
sexual crossing. Mol. Gen. Genet. 236: 379-386.
Mette, M. F., Aufsatz, W., van der Winden, J., Matzke, M. A., and Matzke, A. J.
(2000). Transcriptional silencing and promoter methylation triggered by double-stranded
RNA. EMBO J. 19: 5194–5201.
Miller, K. J., and Wood, J. M. (1996). Osmo adaptaion by rhizosphere bacteria. Annual
Review of Microbiology. 50: 101-136.
Munns, R. (1993). Physiological processes limiting plant growth in saline soils: some
dogmas and hypotheses. Plant Cell Environ. 16: 15–24.
References
91
Munns, R. (2002). Comparative physiology of salt and water stress. Plant Cell Environ.
25: 239–250.
Nakata, Y., Tang, X., and Yokoyama, K. (1997). Preparation of competent cells for
high efficiency plasmid transformation. Methods in Molecular Biology. 69: 129-137.
Negulescu, D., Leong, L. E. C., Chandy, K. G., Semler, B. L., and Gutman, G. A.
(1998). Translation initiation of cardiac voltage-gated potassium channel by internal
ribosome entry. J. Biol. Chem. 273: 20109–20113.
Niepel, M., and Gallie, D. R. (1999). Identification and characterization of the
functional elements within the tobacco etch virus 5´ leader required for cap-independent
translation. J. Vir. 73: 9080–9088.
Ow, D. W., Wood, K. V., De-Luca, M., DeWet, J. R., Helsinki, D. R., and Howell, S.
H. (1986). Transient and stable expression of the firefly luciferase gene in plant cells and
transgenic plants. Science 234: 856–859.
Pelletier, J., and Sonenberg, N. (1988). Internal initiation of translation of eukaryotic
mRNA directed by a sequence derived from poliovirus RNA. Nature 334: 320–325.
Perrin, Y., Vaquero, C., Gerrard, I., Sack, M., Drossard, J., Stöger, E., Christou, P.
and Fischer, R. (2000). Transgenic pea seeds as bioreactors for the production of single-
chain Fv fragment (scFV) antibody used in cancer diagnosis and therapy. Molecular
Breeding 6: 345-352.
Pniewski, T., and Kapusta, J. (2005). Efficiency of transformation of Polish cultivars of
pea (Pisum sativum L.) with various regeneration capacity by using hypervirulent
Agrobacterium tumefaciens strains. J. Appl. Genet. 46: 139-147.
Polowick, P. L., Quandt, J., and Mahon, J. D. (2000). The ability of pea transformation
technology to transfer genes into peas adapted to western Canadian growing conditions.
Plant Science 153: 161-170.
References
Potrykus I (1991) Gene transfer to plants: assessment of published approaches and
results. Annu Rev Plant Physiol Plant Mol Biol. 42:205–225.
Puonti-Kaerlas, J. and Eriksson, T. (1988). Improved protoplast culture and
regeneration of shoots in pea (Pisum sativum L.). Plant Cell Reports. 7: 242-245.
Puonti-Kaerlas, J., Eriksson, T., and Engström, P. (1990). Production of transgenic
pea (Pisum sativum L.) plants by Agrobacterium tumefaciens-mediated gene transfer.
Theor. Appl. Genet. 80: 246-252.
Puonti-Kaerlas, J., Stabel, P. and Eriksson, T. (1989) Transformation of pea (Pisum
sativum L.) by Agrobacterium tumefaciens. Plant Cell Reports. 8: 321-324.
Reynolds, J. E., Kaminski, A., Kettinen, H. J., Grace, K., Clarke, B. E., Rowlands,
D. J., and Jackson, R. J. (1995). Unique features of internal initiation of translation of
hepatitis C virus translation. EMBO J. 14: 6010–6020.
Richter, A., Jacobsen, H. J., de Kathen, A., de Lorenzo, G., Briviba, K., Hain, R.,
Ramsay, G., Kiesecker, H. (2006). Transgenic peas (Pisum sativum) expressing poly
galacturonase inhibiting protein from raspberry (Rubus idaeus) and stilbene synthase
from grape (Vitis vinifera). Plant Cell Rep 25:1166-1173.
Russell, D. R., Wallace, K. M., Bathe, J. H., Martinell, B. J., and McCabe, D. E.
(1993). Stable transformation of Phaseolus vulgaris via electric discharge mediated
particle acceleration. Plant Cell Reports 12: 165-169.
Saalbach, I., Giersberg, M., and Conrad, U. (2001). High-level expression of a single-
chain Fv fragment (scFV) antibody in transgenic pea seeds. J. Plant Physiol. 158: 529-
533.
Sachs, A. B., Sarnow, P., and Hentze, M. W. (1997). Starting at the beginning, middle,
and end: translation initiation in eukaryotes. Cell 89: 831-838.
92
References
93
Salas, E.M., Ramos, R., Lafuente, E., and López de Quinto, E. (2001). Functional
interactions in internal translation initiation directed by viral and cellular IRES elements
Review article. J. Gen. Vir. 82: 973-984.
Sambrook, R., and Russell, D. W. (2001). Molecular Cloning: A Laboratory Manual,
3rd Edition. Cold Spring Harbor Laboratory Press, Cold Spring Harbor, NY.
Sanchez de Jimenez, E., Aguilar, R., and Dinkova, T. D. (1997). S6 ribosomal protein
phosphorilation and translation of stored mRNA in maize. Biochemie. 79: 187-194.
Schroder, H. E., Schotz, A. H., Wardley-Richardson, T., Spencer, D. and Higgins, T.
J. V. (1993). Transformation and regeneration of two cultivars of pea (Pisum sativum L.).
Plant Physiol. 101:751-757.
Senthil, G., Williamson, B., Dinkins, R.D. and Ramsay, G. (2004). An efficient
transformation system for chickpea (Cicer arietinum L.). Plant Cell Reports. 23: 297-
303.
Shi, H., Lee, B. H., Wu, S. J., and Zhu, J. K. (2003). Over expression of a plasma
membrane Na+/H+ antiporter gene improves salt tolerance in Arabidopsis thaliana. Nat.
Biotechnol. 21: 81–85.
Skulachev, M. V., Ivanov, P. A., Karpova, O. V., Korpela, T., Rodionova, N. P.,
Dorokhov, Yu. L. and Atabekov, J. G. (1999). Internal initiation of translation directed
by the 5´-untranslated region of the tobamovirus subgenomic RNA I2. Virology 263:
139–154.
Sottosanto, J. B., Saranga, Y., and Blumwald, E. (2007). Impact of AtnhxI, a vacuolar
Na+/H+ antiporter, upon gene expression during short- and long-term salt stress in
Arabidopsis thaliana. BMC Plant Biol. 7: 18.
Southern, E. M. (1975). Detection of specific sequences among DNA fragments
separated by gel electrophoresis. J. MOI. Biol. 98: 503-517.
References
94
Stein, I., Itin, A., Einat, P., Skaliter R., Grossman, Z., and Keshet, E. (1998).
Translation of vascular endothelial growth factor mRNA by internal ribosome entry:
implications for translation under hypoxia. Mol. Cell. Biol. 18: 3112–3119.
Sunarpi, K. M., Yang, H., Yoda, K., Horie, R., and Uozum, N. (2005). Enhanced salt
tolerance mediated by AtHKT1 transporter induced Na+ unloading from xylem vessels to
xylem parenchyma cells. The Plant Journal 44: 928–938.
Tang, X., Nakata, Y., HO, L., Zhang, M., Gao, H., Fujita, A., Sakatsume, O., Ohta,
T., and Yokoyama, K. (1994). The optimization of preparations of competent cells for
transformation of E. coli. Nucl. Acids Res. 22: 2857-2858.
Taylor NJ, Fauquet CM (2002) Microparticle bombardment as a tool in plant science
and agricultural biotechnology. DNA Cell Biol 21:963–977.
Ungar, I. A. (1996). Effect of salinity on seed germination, growth, and ion
accumulation of Atriplex patula (Chenopodiaceae). American Journal of Botany. 83:
604–607.
Urwin, P., Yi, L., Martin, H., Atkinson, H., and Gilmartin, P. M. (2000). Functional
characterization of EMCV IRES in plants. The Plant Journal 24: 583-589.
Vaeck, et al., (1987). Synthetic insecticidal crystal protein gene having a modified
frequency of codon usage. Nature 328: 33-37.
Van der Hoorn, R. A., Laurent, F., Roth, R., De Wit, P. J. (2000). Agroinfiltration is a
versatile tool that facilitates comparative analyses of Avr9/Cf-9-induced and Avr4/Cf-4-
induced necrosis. Mol Plant Microbe Interact 13: 439–446.
Voinnety, O., Rivas, S., Mestre, P., and Baulcomb, D. (2003). An enhanced transient
expression system in plants based on suppression of gene silencing by the p19 protein of
tomato bushy stunt virus. The Plant Journal 33: 949–956.
References
95
Wang, J., Zuo, K., Wu, W., Song, J., Sun, X., Lin, J., Li, X., and Tang, K. (2003).
Molecular cloning and characterization of a new Na+/H+ antiporter gene from Brassica
napus. DNA Seq. 14: 351–358.
White, J. W. et al. (2004). Genomics and crop response to global change: what have we
learned? Field Crops Res. 90: 165–169.
Wroblewski, T., Tomczak, A., and Michelmore, R. (2005). Optimization of
Agrobacterium mediated transient assays of gene expression in lettuce, tomato and
Arabidopsis. Plant Biotechnol J. 3: 259–273.
Yamaguchi, T., and Blumwald, E. (2005). Developing salt-tolerant crop plants:
Challenges and opportunities. Trends in plant Science. 10: 615-620.
Ye, X. P., Fong, P., Iizuka, N., Choate, D., and Cavener, D. R. (1997). Ultrabithorax
and Antennapedia 5' untranslated regions promote developmentally regulated internal
translation initiation. Mol. Cell. Biol. 17: 1714–1721.
Zhang, H. X., Hodson, J. N., Williams, J. P., and Blumwald, E. (2001). Engineering
salt tolerant Brassica plants: characterization of yield and seed oil quality in transgenic
plants with increased vacuolar sodium accumulation. Proc. Natl. Acad. Sci. 98: 12832–
12836.
Zhang, H. X. and Blumwald, E. (2001) Transgenic salt-tolerant tomato plants
accumulate salt in foliage but not in fruit. Nature Biotechnology 19: 765 – 768.

Appendices
96
APPENDIX –I
L.B Broth for E. coli (High salt)
Tryptone 10 g/l
NaCl 5 g/l
Yeast extract 5 g/l
pH = 7.5
APPENDIX-II
L.B Broth for Agrobacterium (Low salt)
Tryptone 10 g/l
NaCl 5 g/l
Yeast extract 5 g/l
pH = 7.5

Appendices
97
APPENDIX-III
MMA medium for leaf infiltration
MS salt 4.6 g /l
Sucrose 20 g
NAA 100 mM
MES 1.95 g/l (dissolved in 7 ml H2O add drop
wise KOH to increase pH to 6.3)
pH 5.6
Acetosyrinigone 100 µM (post autoclave)
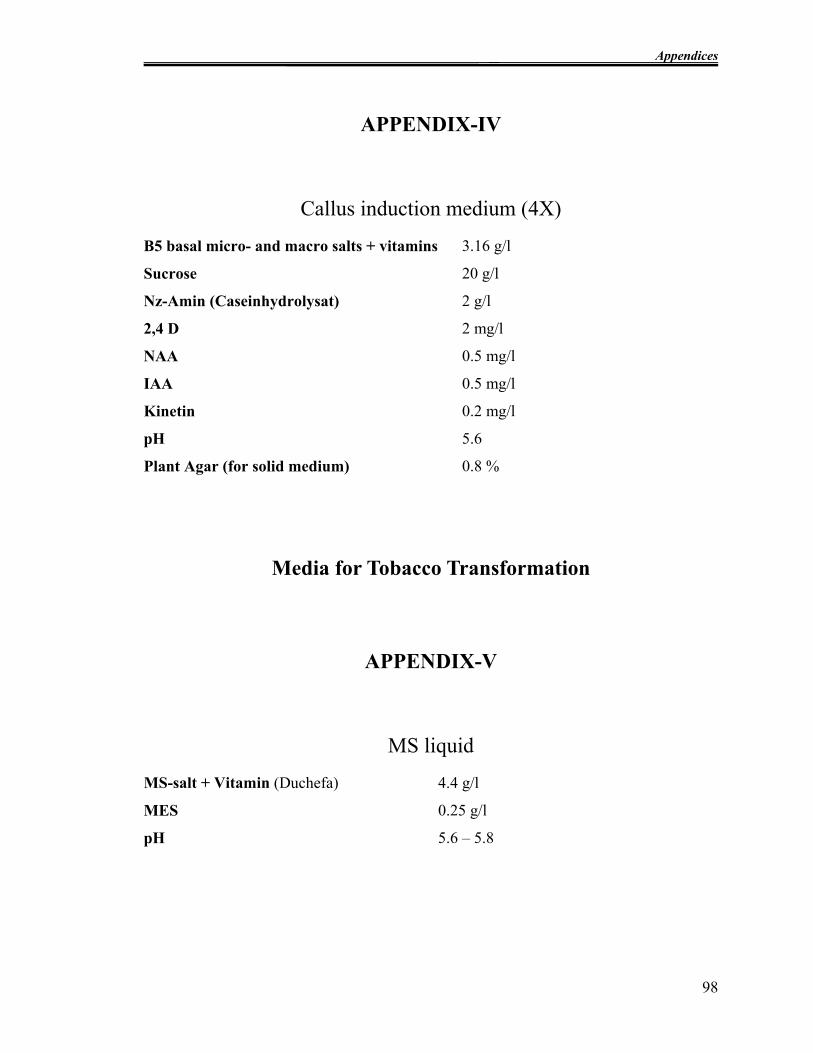
Appendices
98
APPENDIX-IV
Callus induction medium (4X)
B5 basal micro- and macro salts + vitamins 3.16 g/l
Sucrose 20 g/l
Nz-Amin (Caseinhydrolysat) 2 g/l
2,4 D 2 mg/l
NAA 0.5 mg/l
IAA 0.5 mg/l
Kinetin 0.2 mg/l
pH 5.6
Plant Agar (for solid medium) 0.8 %
Media for Tobacco Transformation
APPENDIX-V
MS liquid
MS-salt + Vitamin (Duchefa) 4.4 g/l
MES 0.25 g/l
pH 5.6 – 5.8
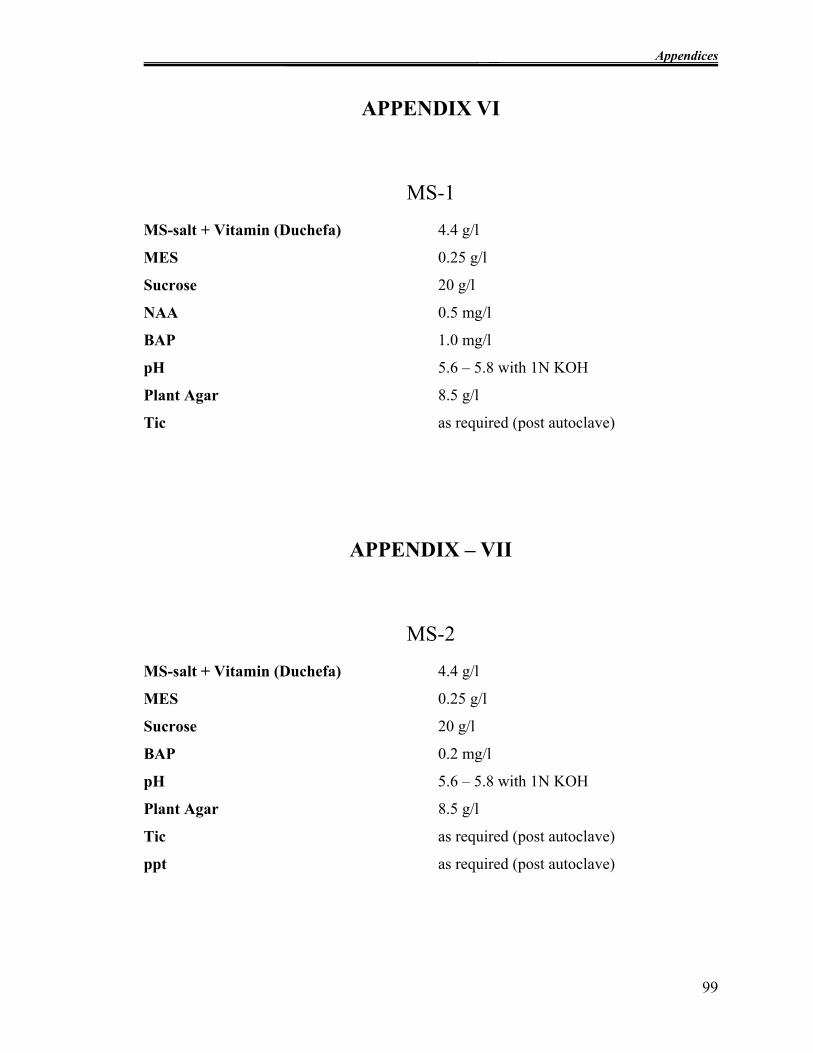
Appendices
99
APPENDIX VI
MS-1
MS-salt + Vitamin (Duchefa) 4.4 g/l
MES 0.25 g/l
Sucrose 20 g/l
NAA 0.5 mg/l
BAP 1.0 mg/l
pH 5.6 – 5.8 with 1N KOH
Plant Agar 8.5 g/l
Tic as required (post autoclave)
APPENDIX – VII
MS-2
MS-salt + Vitamin (Duchefa) 4.4 g/l
MES 0.25 g/l
Sucrose 20 g/l
BAP 0.2 mg/l
pH 5.6 – 5.8 with 1N KOH
Plant Agar 8.5 g/l
Tic as required (post autoclave)
ppt as required (post autoclave)

Appendices
100
APPNDIX – VIII
MS 0 Medium
MS-salt + Vitamin (Duchefa) 4.4 g/l
MES 0.25 g/l
Sucrose 20 g/l
pH 5.6 – 5.8 with 1N KOH
Plant Agar 8.5 g/l
Tic as required (post autoclave)
ppt as required (post autoclave)

Appendices
101
Media for Pea Transformation
APPENDIX – IX
B5-i re-suspension medium
B5 basal micro and macro salts (Gamborg et al., 1968)
3.16 g/l
Glucose 10 g/l
Sucrose 10 g/l
MES 2 g/l
pH 5.6 with 1N KOH/1N HCl

Appendices
102
APPENDIX – X
B5hT Co-cultivation medium
B5 basal micro- and macro salts +
B5 vitamin mixture
3.16 g/l
Sucrose 30 g/l
CaCl2, 2H2O 0.88 g/l
KNO3 0.5 g/l
MgSO4, 7H2O 0.5 g/l
Glutamine 0.8 g/l
Glutathione 10 mg/l
Adenine 1 mg/l
Kinetin (1 μM) 0.2 mg/l
MES 2.0 g/l
TDZ (5 μM) 1.1 mg/l
pH 5.6
GelRite 4.5 g/l
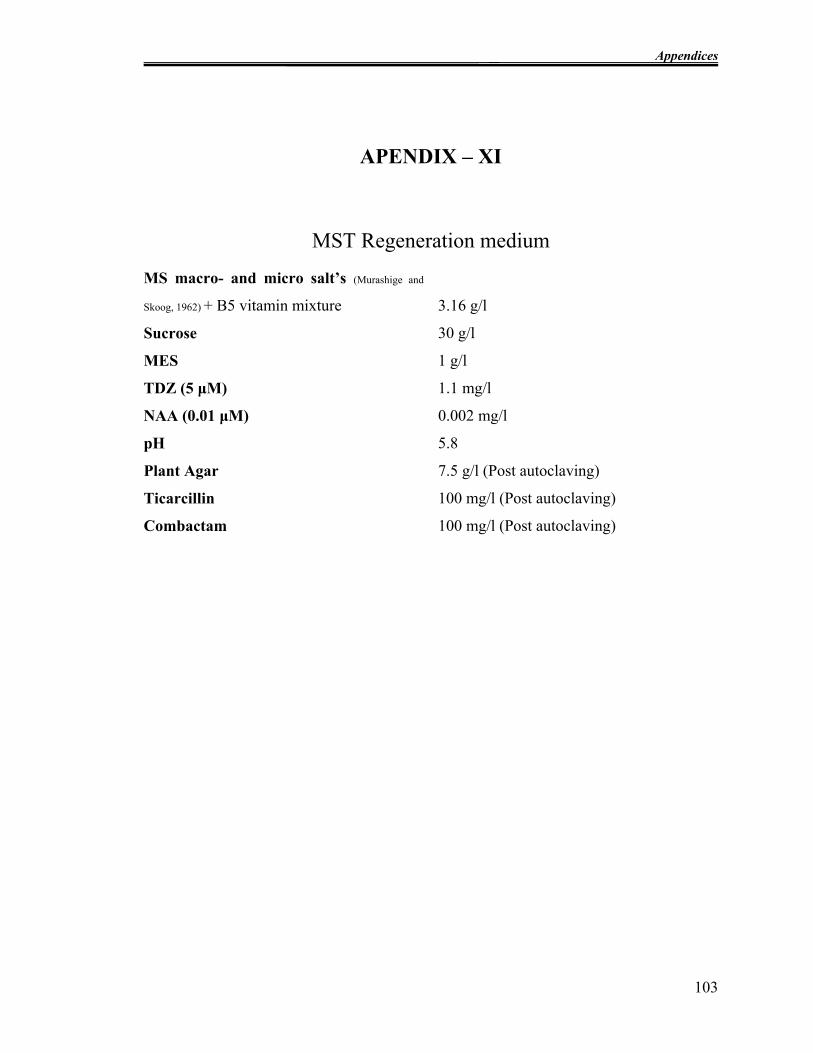
Appendices
103
APENDIX – XI
MST Regeneration medium
MS macro- and micro salt’s (Murashige and
Skoog, 1962) + B5 vitamin mixture
3.16 g/l
Sucrose 30 g/l
MES 1 g/l
TDZ (5 μM) 1.1 mg/l
NAA (0.01 μM) 0.002 mg/l
pH 5.8
Plant Agar 7.5 g/l (Post autoclaving)
Ticarcillin 100 mg/l (Post autoclaving)
Combactam 100 mg/l (Post autoclaving)
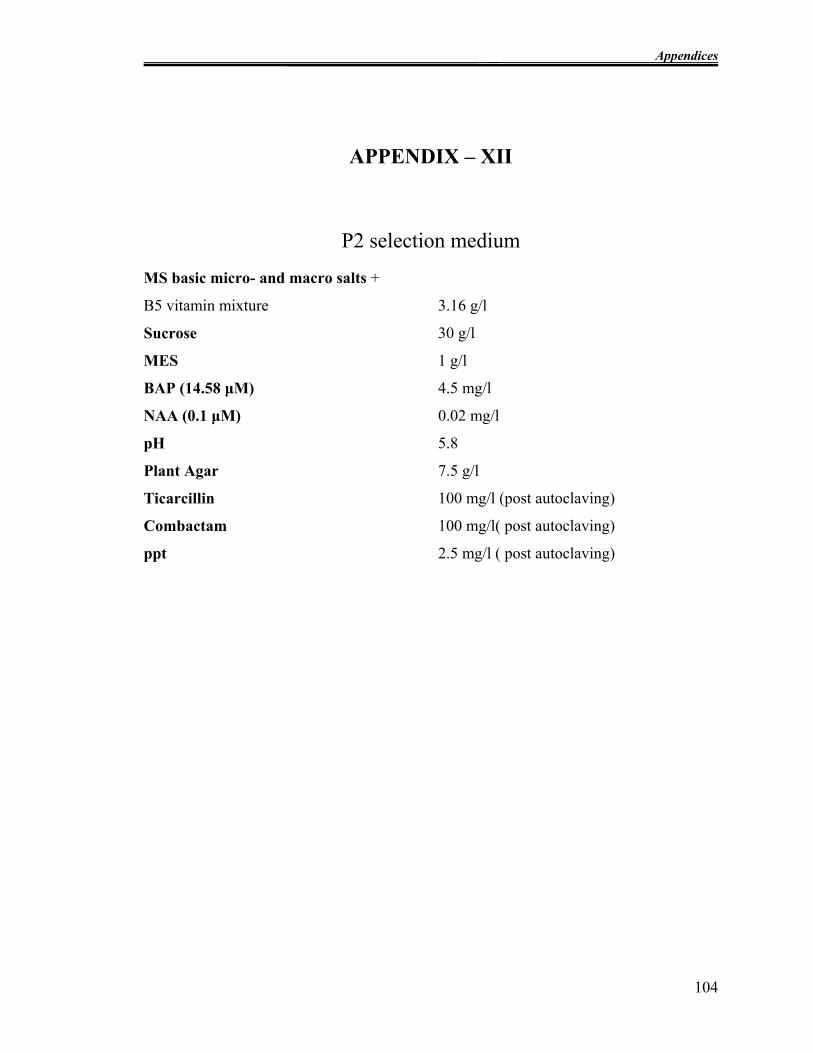
Appendices
104
APPENDIX – XII
P2 selection medium
MS basic micro- and macro salts +
B5 vitamin mixture
3.16 g/l
Sucrose 30 g/l
MES 1 g/l
BAP (14.58 μM) 4.5 mg/l
NAA (0.1 μM) 0.02 mg/l
pH 5.8
Plant Agar 7.5 g/l
Ticarcillin 100 mg/l (post autoclaving)
Combactam 100 mg/l( post autoclaving)
ppt 2.5 mg/l ( post autoclaving)

105
STATEMENT OF SOURCES
DECLARATION
I declare that this thesis is my own work and has not been submitted in any form for
another degree or diploma at any university or other institution of tertiary education.
Information derived from the published or unpublished work of others has been
acknowledged in the text and a list of references is given.
____________________________________ ____________________
Signature Date
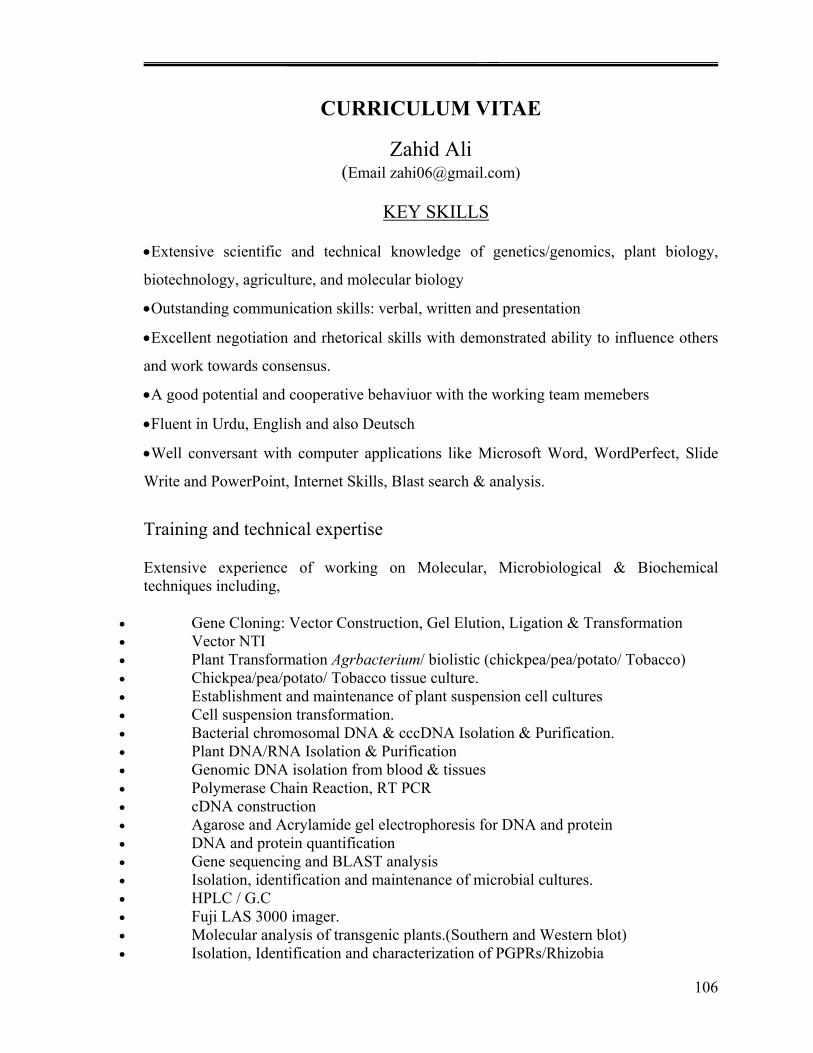
106
CURRICULUM VITAE
Zahid Ali (Email [email protected])
KEY SKILLS
•Extensive scientific and technical knowledge of genetics/genomics, plant biology,
biotechnology, agriculture, and molecular biology
•Outstanding communication skills: verbal, written and presentation
•Excellent negotiation and rhetorical skills with demonstrated ability to influence others
and work towards consensus.
•A good potential and cooperative behaviuor with the working team memebers
•Fluent in Urdu, English and also Deutsch
•Well conversant with computer applications like Microsoft Word, WordPerfect, Slide
Write and PowerPoint, Internet Skills, Blast search & analysis.
Training and technical expertise
Extensive experience of working on Molecular, Microbiological & Biochemical techniques including,
• Gene Cloning: Vector Construction, Gel Elution, Ligation & Transformation • Vector NTI • Plant Transformation Agrbacterium/ biolistic (chickpea/pea/potato/ Tobacco) • Chickpea/pea/potato/ Tobacco tissue culture. • Establishment and maintenance of plant suspension cell cultures • Cell suspension transformation. • Bacterial chromosomal DNA & cccDNA Isolation & Purification. • Plant DNA/RNA Isolation & Purification • Genomic DNA isolation from blood & tissues • Polymerase Chain Reaction, RT PCR • cDNA construction • Agarose and Acrylamide gel electrophoresis for DNA and protein • DNA and protein quantification • Gene sequencing and BLAST analysis • Isolation, identification and maintenance of microbial cultures. • HPLC / G.C • Fuji LAS 3000 imager. • Molecular analysis of transgenic plants.(Southern and Western blot) • Isolation, Identification and characterization of PGPRs/Rhizobia

107
• Making investigation studies for plant microbe interactions
EDUCATIONAL RECORD
2003-2007, Ph.D. Natural Sciences (Biotechnology) Leibniz Universität Hannover
Germany.
Dissertation Title: Developing Strategies for Homologous/Heterologous Plant
Expression System for Physiological Investigations of Respective Target Proteins.
2001-2002, M.Sc (Hons) Agronomy obtained CGPA, 3.76/4.00.from University of Agriculture, Faisalabad, Pakistan.
Dissertation Title: Characterization of Plant Growth Promoting Rhizobacteria (PGPR) and their affect on seed germination, seedling vigor and growth of cotton.
1996-2000, B.Sc (Hons) Agriculture obtained CGPA, 3.53/4.00 from University of Agriculture, Faisalabad, Pakistan.
1996, F.Sc. (Phys., Chem., Bio.) obtained 796/1100 marks, 1st div. from Govt. College Faisalabad, Pakistan.
1993, Matric (Phys., Chem., Bio, Maths.) obtained 710/850 marks, 1st div. from Govt. H/S/S Dijkot Faisalabad, Pakistan.
Personal details
Date of Birth 10-12 -1976
Domicile Faisalabad (Punjab) Pakistan
Sex Male
Nationality Pakistani
Permanent Address: H/No P-79/A Satellite town Samanabad Faisalabad, Pakistan.
Awards
DAAD PhD fellowship
Merit scholarship in matriculation
List of Publications /Presentations
Dicistronic binary vectors system - a versatile tool for plant gene expression studies.

108
Zahid ALI, Heinz Martin SHUMACHER, Hans-Jörg JACOBSEN, Heiko KIESECKER. (Invited paper, Provisionally accepted in Plant physiology)
Online ISSN: 1532-2548 Print ISSN: 0032-0889
Novel Transformation Vectors for Plant Cell Cultures
Zahid Ali, Elke-Dobbernack Heinz Martin Schumacher, Heiko Kiesecker
ICCC 11 Conference 07. 10.-11. 10. 2007 Goslar, Germany Poster presentation.
Developing strategies for homologous/heterologous plant expression system for physiological investigations of respective target proteins
Zahid Ali (key note speaker)
International Summer School on Plant Molecular Biology. Gottfried Wilhel Leibniz University Hannover Germany (01-07-2007 to 13-07-2007).
Di-cistronic Binary Vectors as a Versatile Tool for Gene Expression Studies.
Z. Ali, H.-M. Schumacher, H.- J. Jacobsen, F.-Y. Hafeez, H. Kiesecker.
International conference, Plant Transfromation Technnologies Vienna Austria 4-7 February 2007 Poster presentation
Process optimization for the Production of of Recombinant Proteins in Suspension Cultures
Heidinger B., Ali,Z., Singh M., Schumacher M., Jacobsen H.J., Kiesecker H
International conference, Plant Transfromation Technnologies Vienna Austria 4-7 February 2007 Poster presentation
Di-cistronic Binary Vectors as a Versatile Tool for Gene Expression Studies -potential of AtNHX1 in pulse crops –
Zahid Ali, Fauzia Y.Hafeez, Yusuf Zafar and Heiko Kiesecker. Microbial Technologies for Sustainable Agriculture An International Symposium held in
NIBGE Pakistan March 12-16 2007 Oral presentation.
Characterization of PGPRs and their affect on seedling vigor and growth of cotton.
F.Y.Hafeez. Z.Ali. M.E Safdar, and K.A. Malik
9th International congress for Agriculture and Biology March 2002 NIAB Pakistan.
Poster presentation
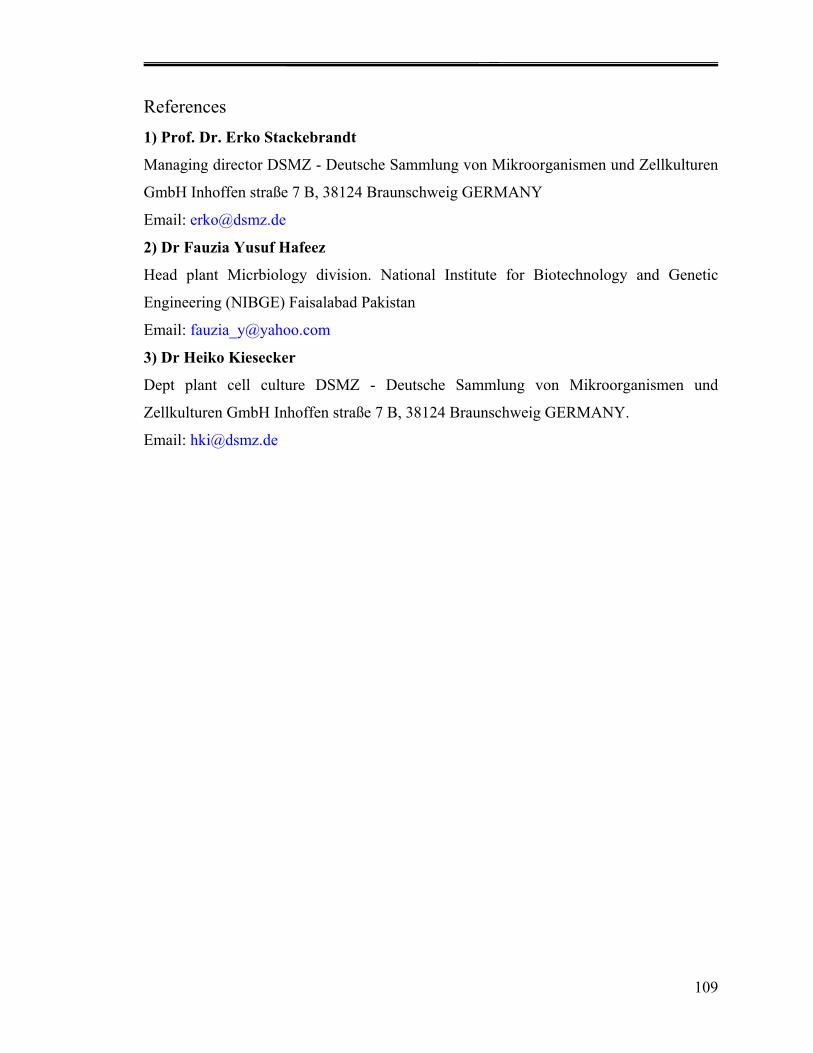
109
References 1) Prof. Dr. Erko Stackebrandt
Managing director DSMZ - Deutsche Sammlung von Mikroorganismen und Zellkulturen
GmbH Inhoffen straße 7 B, 38124 Braunschweig GERMANY
Email: [email protected]
2) Dr Fauzia Yusuf Hafeez
Head plant Micrbiology division. National Institute for Biotechnology and Genetic
Engineering (NIBGE) Faisalabad Pakistan
Email: [email protected]
3) Dr Heiko Kiesecker
Dept plant cell culture DSMZ - Deutsche Sammlung von Mikroorganismen und
Zellkulturen GmbH Inhoffen straße 7 B, 38124 Braunschweig GERMANY.
Email: [email protected]