Developing an activity-driven costing framework for a South ...
103
Developing an activity-driven costing framework for a South African cash services company MR Nkuna orcid.org 0000-0002-5437-9074 Mini-dissertation submitted in partial fulfilment of the requirements for the degree Master of Commerce in Management Accountancy at the North-West University Supervisor: Prof SL Middelberg Graduation: July 2018 Student number: 28367855
-
Upload
khangminh22 -
Category
Documents
-
view
3 -
download
0
Transcript of Developing an activity-driven costing framework for a South ...

Developing an activity-driven costing framework for a South African cash
services company
MR Nkuna orcid.org 0000-0002-5437-9074
Mini-dissertation submitted in partial fulfilment of the requirements for the degree Master of Commerce in
Management Accountancy at the North-West University
Supervisor: Prof SL Middelberg
Graduation: July 2018
Student number: 28367855

i
ACKNOWLEDGEMENTS
I wish to express my gratitude to the following people who played a vital role to the
successful completion of this dissertation:
• Firstly, I would like to express my sincere gratitude to my supervisor, Professor
Sanlie Middelberg for her patience, motivation, enthusiasm and immense
knowledge. This mini-dissertation would not have been possible without your
guidance.
• A special thank you to the management and staff of the case study company for
their generosity with their time and knowledge.
• To my husband and children, you are the inspiration behind all I do. You have
been an epitome of love and understanding. I love you guys from the top of your
heads to the tip of your toes.
• To my mother, all that I am and hope to be, I owe to you.
• To the Adoros’ and Letlaka, thank you for the support and encouragement. I am
blessed to have you as my siblings.
• Most importantly, to GOD Almighty, my shield, my strength, my shelter, my strong
tower and my deliverer. I thank you.
Dedication:
This dissertation is dedicated to the memory of my father, we miss you every day.
ii
ABSTRACT
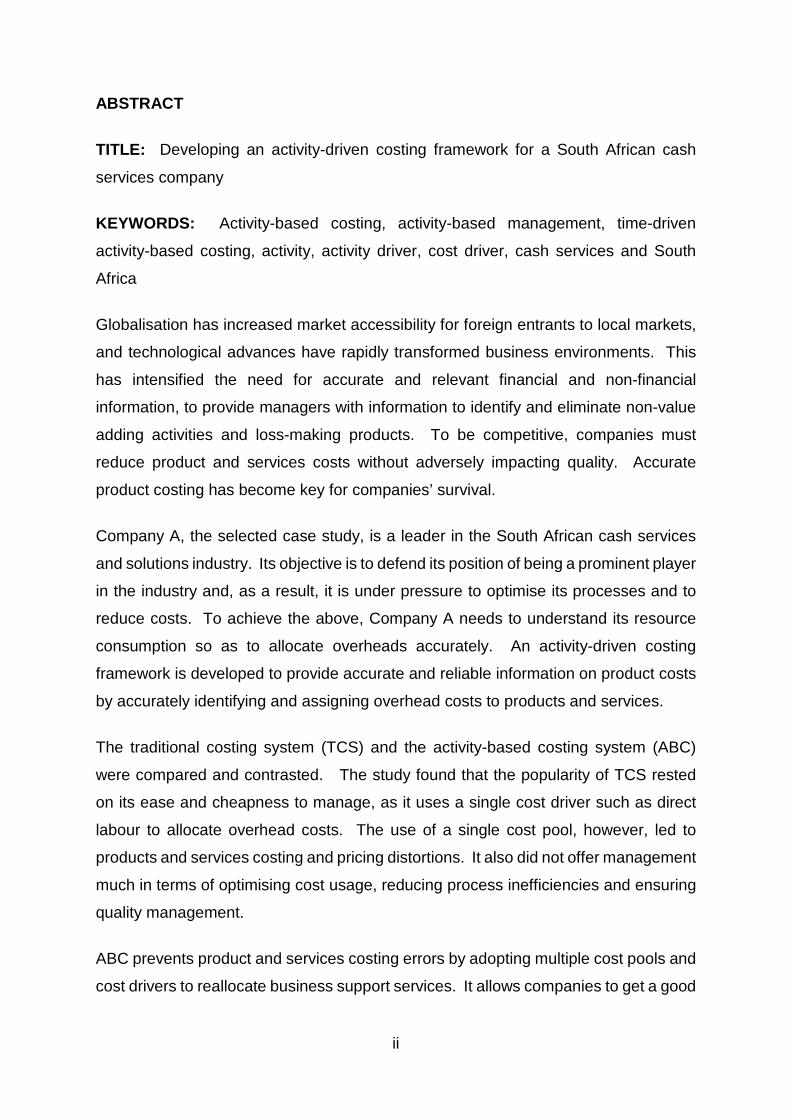
TITLE: Developing an activity-driven costing framework for a South African cash
services company
KEYWORDS: Activity-based costing, activity-based management, time-driven
activity-based costing, activity, activity driver, cost driver, cash services and South
Africa
Globalisation has increased market accessibility for foreign entrants to local markets,
and technological advances have rapidly transformed business environments. This
has intensified the need for accurate and relevant financial and non-financial
information, to provide managers with information to identify and eliminate non-value
adding activities and loss-making products. To be competitive, companies must
reduce product and services costs without adversely impacting quality. Accurate
product costing has become key for companies’ survival.
Company A, the selected case study, is a leader in the South African cash services
and solutions industry. Its objective is to defend its position of being a prominent player
in the industry and, as a result, it is under pressure to optimise its processes and to
reduce costs. To achieve the above, Company A needs to understand its resource
consumption so as to allocate overheads accurately. An activity-driven costing
framework is developed to provide accurate and reliable information on product costs
by accurately identifying and assigning overhead costs to products and services.
The traditional costing system (TCS) and the activity-based costing system (ABC)
were compared and contrasted. The study found that the popularity of TCS rested
on its ease and cheapness to manage, as it uses a single cost driver such as direct
labour to allocate overhead costs. The use of a single cost pool, however, led to
products and services costing and pricing distortions. It also did not offer management
much in terms of optimising cost usage, reducing process inefficiencies and ensuring
quality management.
ABC prevents product and services costing errors by adopting multiple cost pools and
cost drivers to reallocate business support services. It allows companies to get a good
iii
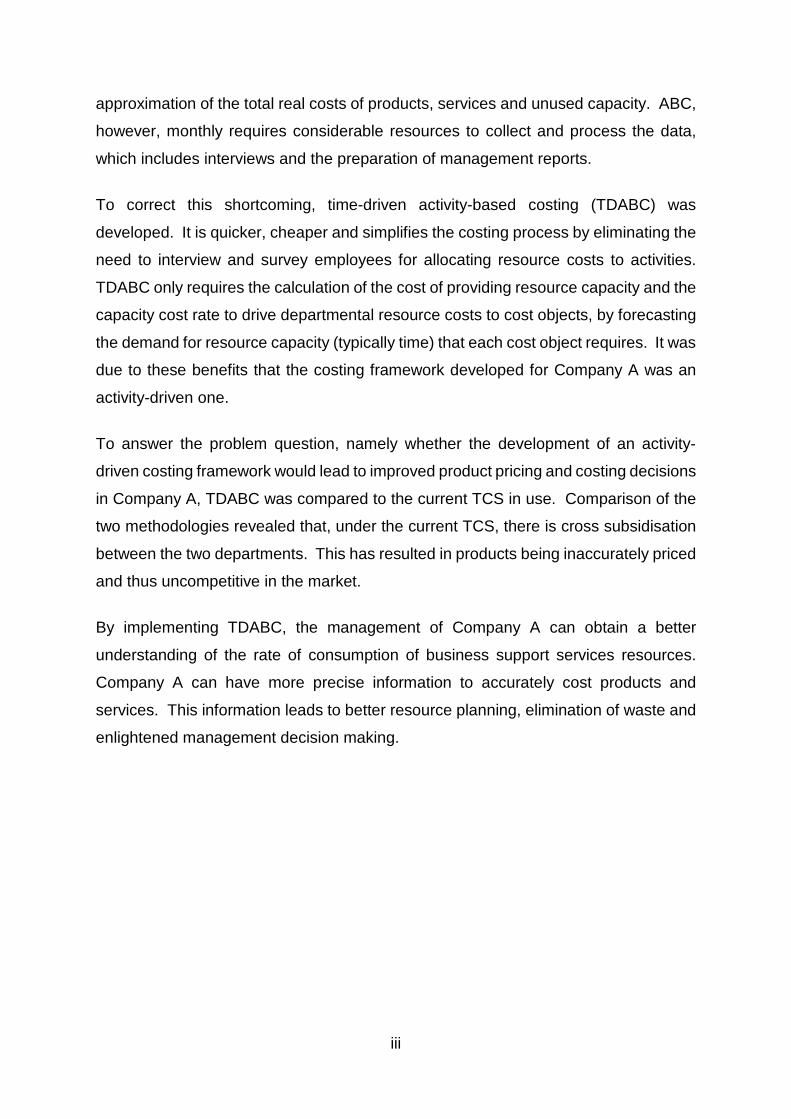
approximation of the total real costs of products, services and unused capacity. ABC,
however, monthly requires considerable resources to collect and process the data,
which includes interviews and the preparation of management reports.
To correct this shortcoming, time-driven activity-based costing (TDABC) was
developed. It is quicker, cheaper and simplifies the costing process by eliminating the
need to interview and survey employees for allocating resource costs to activities.
TDABC only requires the calculation of the cost of providing resource capacity and the
capacity cost rate to drive departmental resource costs to cost objects, by forecasting
the demand for resource capacity (typically time) that each cost object requires. It was
due to these benefits that the costing framework developed for Company A was an
activity-driven one.
To answer the problem question, namely whether the development of an activity-
driven costing framework would lead to improved product pricing and costing decisions
in Company A, TDABC was compared to the current TCS in use. Comparison of the
two methodologies revealed that, under the current TCS, there is cross subsidisation
between the two departments. This has resulted in products being inaccurately priced
and thus uncompetitive in the market.
By implementing TDABC, the management of Company A can obtain a better
understanding of the rate of consumption of business support services resources.
Company A can have more precise information to accurately cost products and
services. This information leads to better resource planning, elimination of waste and
enlightened management decision making.
iv
TABLE OF CONTENTS
ACKNOWLEDGEMENTS ........................................................................................... i
ABSTRACT ................................................................................................................. ii
TABLE OF CONTENTS ............................................................................................. iv
LIST OF FIGURES ................................................................................................... viii
LIST OF TABLES ....................................................................................................... ix
CHAPTER 1 ............................................................................................................... 1
1 INTRODUCTION .............................................................................................. 1
1.1 Background ................................................................................................ 1
History of ABC ........................................................................................ 2
Literature Review .................................................................................... 4
Motivation of topic actuality ..................................................................... 7
1.2 Problem Statement .................................................................................... 9
1.3 Objectives .................................................................................................. 9
Main Objective ........................................................................................ 9
Secondary Objectives ........................................................................... 10
1.4 Research Method ..................................................................................... 10
Literature Review .................................................................................. 10
Empirical Research .............................................................................. 11
Paradigmatic assumptions and perspectives ........................................ 11
v
1.5 Key Concepts .......................................................................................... 12
1.6 Chapter Overview .................................................................................... 13
CHAPTER 2 ............................................................................................................. 15
2 RESEARCH METHODOLOGY AND DESIGN ............................................... 15
2.1 Introduction .............................................................................................. 15
2.2 Research Paradigm ................................................................................. 16
Research paradigm of this study .......................................................... 18
2.3 Research Approach ................................................................................. 18
Research approach of this study .......................................................... 19
2.4 Research Design ..................................................................................... 19
Case study ............................................................................................ 20
Research design of this study ............................................................... 22
2.5 Research Methodology ............................................................................ 23
Data collection techniques .................................................................... 23
Data collection techniques for this study............................................... 25
Data analysis ........................................................................................ 26
Data analysis of this study .................................................................... 27
2.6 Methodological Rigour ............................................................................. 27
Internal validity ...................................................................................... 27
Construct validity .................................................................................. 27
vi
External validity .................................................................................... 28
Reliability .............................................................................................. 28
Case study methodological rigour ........................................................ 28
2.7 Ethics ....................................................................................................... 29
2.8 Summary ................................................................................................. 30
CHAPTER 3 ............................................................................................................. 32
3 ACTIVITY-BASED COSTING AND THE EMERGENCE OF TIME-DRIVEN
ACTIVITY-BASED COSTING ............................................................................... 32
3.1 Introduction .............................................................................................. 32
3.2 Fundamentals of Cost Allocation ............................................................. 33
3.3 Traditional Cost Allocation System (TCS) ................................................ 35
3.4 Activity-Based Costing Allocation System (ABC) ..................................... 37
3.5 Benefits of implementing ABC ................................................................. 39
3.6 Challenges to implementing ABC ............................................................ 41
3.7 Emergence of Time-Driven Activity-Based Costing ................................. 44
3.8 Activity-Based Costing in Cash Service Industry ..................................... 46
3.9 Implementation steps of TDABC .............................................................. 47
3.10 Critical Success Factors to implementing Activity-Based Costing ........ 49
3.11 Summary .............................................................................................. 51
CHAPTER 4 ............................................................................................................. 53
4 DEVELOPMENT OF AN ACTIVITY-DRIVEN FRAMEWORK ........................ 53
vii
4.1 Introduction .............................................................................................. 53
4.2 Background of Company A ...................................................................... 54
Centralised business support services ................................................. 55
Centralised business support services costs ........................................ 58
4.3 Divisions of Company A ........................................................................... 60
4.4 Company A’s current allocation model ..................................................... 62
4.5 Developing a TDABC framework for Company A .................................... 65
4.6 TDABC framework for Company A .......................................................... 72
4.7 TCS vs TDABC ........................................................................................ 75
4.8 Summary ................................................................................................. 78
CHAPTER 5 ............................................................................................................. 79
5 FINDINGS AND RECOMMENDATIONS ........................................................ 79
5.1 Introduction .............................................................................................. 79
5.2 Research Synopsis .................................................................................. 80
Main Objective ...................................................................................... 80
Secondary Objectives ........................................................................... 84
5.3 Recommendations ................................................................................... 85
5.4 Limitations of the study ............................................................................ 86
5.5 Recommendations for further research .................................................... 87
6 REFERENCE LIST ......................................................................................... 88

viii
LIST OF FIGURES
Figure 3.1: ABC discussion flow diagram ................................................................ 33
Figure 3.2: Fundamentals of services cost classification......................................... 34
Figure 3.3: Traditional costing system ..................................................................... 36
Figure 3.4: Activity-based costing system ............................................................... 38
Figure 4.1: TDABC framework development flow diagram ...................................... 54
Figure 4.2: Company A’s centralised business support services ............................ 56
Figure 4.3: Annual business support services cost breakdown ............................... 60
Figure 4.4: Company A’s business support services cost reallocation model ......... 62
Figure 4.5: Business support services reallocation equations ................................. 63
Figure 4.6: Company A’s TDABC model ................................................................. 66
Figure 5.1: ABC discussion flow diagram ................................................................ 80
Figure 5.2: TCS vs TDABC for Division 1 ................................................................ 82
Figure 5.3: TCS vs TDABC for Division 2 ................................................................ 83
ix
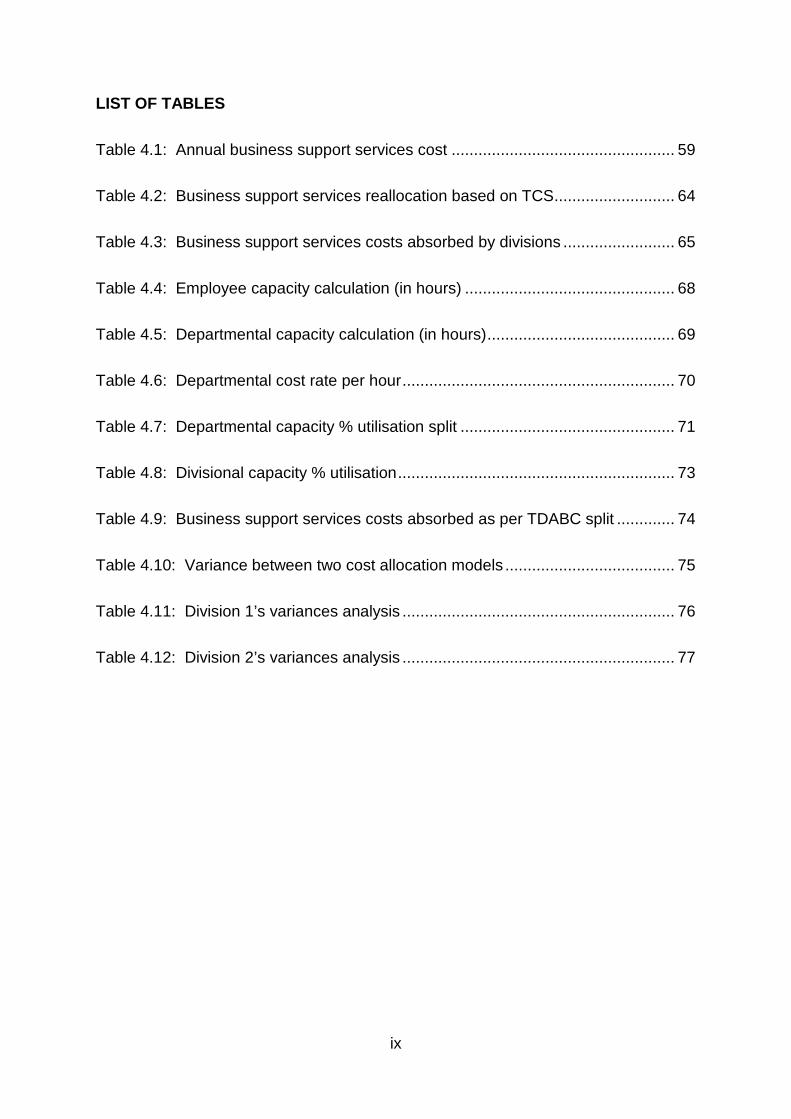
LIST OF TABLES
Table 4.1: Annual business support services cost .................................................. 59
Table 4.2: Business support services reallocation based on TCS ........................... 64
Table 4.3: Business support services costs absorbed by divisions ......................... 65
Table 4.4: Employee capacity calculation (in hours) ............................................... 68
Table 4.5: Departmental capacity calculation (in hours) .......................................... 69
Table 4.6: Departmental cost rate per hour ............................................................. 70
Table 4.7: Departmental capacity % utilisation split ................................................ 71
Table 4.8: Divisional capacity % utilisation .............................................................. 73
Table 4.9: Business support services costs absorbed as per TDABC split ............. 74
Table 4.10: Variance between two cost allocation models ...................................... 75
Table 4.11: Division 1’s variances analysis ............................................................. 76
Table 4.12: Division 2’s variances analysis ............................................................. 77
1
CHAPTER 1
1 INTRODUCTION
1.1 Background
Global competition and technological advances have prompted changes in the
business environment, these have led to innovations in the use of financial and non-
financial information in organisations (Cardos & Pete, 2011:152). Innovations in
manufacturing and communication technologies have radically changed the ways
organisations conduct their activities (Zhang & Che, 2010:144).
According to Özbayrak, Akgün and Türker (2004:49), increasing competitiveness
globally has forced organisations to pursue to produce high quality products more
speedily and at a competitive cost. In order to achieve these goals, organisations
must become more flexible, integrated and highly automated.
Responding to the above changes in the business environment, researchers and
organisations are constantly re-evaluating managerial accounting by developing
improved systems and techniques of cost allocation. Management accounting is a
tool to assist in decision making, plans formulation and operations control (Mahal &
Hossain, 2015:66).
To achieve or maintain competitive advantage, companies are forced to embrace new
strategies and implement more complex costing systems to keep track of product and
services costs and quality. Cost and quality have become differentiating factors, giving
companies an advantage over its competitors (Özkan & Karaibrahimoğlu, 2013:420).
The measurement of success of any organisation requires the appraisal of its
operations and processes, such as the quality of its products and services, its
operational proficiency and its ability to manage costs (Naidoo, 2011:109).
Developed in 1988, activity-based costing (ABC) aims to provide accurate information
about the cost of resources consumed by individual products, services and consumers
(Cardos & Pete, 2011:153). This costing method could lead to improved decision
2
making as a result of enlightened product-cost information and improved
understanding of activities that leads to overheads and greater accessibility to relevant
costs for a wider range of decisions (Wessel & Shotter, 2000:216).
ABC was simplified by Kaplan and Anderson (2003) with the introduction of time-
driven activity-based costing (TDABC). TDABC captures more variation and
complexity, providing the same high quality information. TDABC can provide quality
information on customer and channel profitability by reflecting the cost differences
between low-demand, simple-to-service customers and high-demand, complex
customers (Barndt, Oehlers & Soltis, 2015:27).
History of ABC
Traditional Costing Methods (TCM) were developed to use direct labour as an
overhead cost allocation driver, as labour was normally the biggest cost of production.
TCM has generally been popular due to its relative ease to apply. Products and
services with higher direct labour hours were allocated more overhead costs. This
system worked well for organisations that manufactured large volumes of a few
products and/or had immaterial overhead costs (Popesko, 2009:38).
The global business environment has rapidly changed over the last decades, product
ranges have increased, direct labour costs have decreased and overhead costs have
increased significantly. For these reasons, organisations that continue to use
traditional overhead absorption techniques are likely to make inaccurate cost
management decisions that could possibly be devastating (Sartorius, Eitzen &
Kamala, 2007:2).
The concept of ABC was initially introduced in the manufacturing sector. However,
Ashford’s (2011:3) research found that ABC gives a horizontal and cross-functional
view and provides a fact-based awareness into spending and profitability of not only
products, but of services and customers as well.
As the level of diversity of products and services has increased over the last several
decades, TCM has become even less reliable due to its imprecise overheads
allocation. This weakness resulted in organisations using incorrect costing information
3
when pricing products and services, and as a result in making adverse decisions that
had unfavourably affected their competitive position. This has resulted in the
development of alternatives, such as ABC (Cardos & Pete, 2011:154).
As mentioned before, ABC was developed by Cooper and Kaplan to address
deficiencies associated with TCM, which includes being incapability to accurately
determine actual production and service costs, or to give useful information for
operating decisions (Cardos & Pete, 2011:154).
The objectives of an ABC system, according to Rundora, Ziemerink and Oberholzer
(2013:488), are to assign costs according to activities consumed, to create visibility in
the overhead costs area, to provide better information for control purposes, and to
improve all operating activities.
According to the Chartered Institute of Management Accountants (CIMA), ABC is more
than just a system; it is a management process. It tracks and provides costing and
operating information that mirrors a horizontal view. Being activity-driven, it gives
useful information by introducing cost drivers and performance measures to initiate,
motivate or support development efforts and to lead to better decision making (CIMA,
2001).
The purpose of ABC includes the prevention of cost distortion, which occurs due to
TCM placing all indirect costs into a single cost pool. ABC prevents this by utilising
multiple cost pools and drivers. ABC also aims to reduce waste and non-value adding
activities by providing a comprehensive process view (Mahal & Hossain, 2015:66).
In turn, Kaplan and Anderson (2003:15) found that using the unit cost of supplying
capacity was quicker, easier and less costly. In their research, the estimation of the
practical capacity of committed resources and their costs provided more visibility to
process efficiencies and capacity utilisation. It was these characteristics that have
made TDABC gain favour.
The next section presents the literature review on the research topic.
4
Literature Review
The literature review is split between research conducted on ABC, activity-based
management (ABM) and the benefits and challenges of ABC. In Chapter 3 (refer
section 3.7, page 44) a presentation on the emergence of TDABC is provided.
ABC has attracted interest from organisations’ management accounting professionals
and academics since its introduction in 1988 in response to problems experienced
with TCM (Phan, Baird & Blair, 2014:787). Claims that the information delivered by
ABC improves the accuracy of product and service costs have been supported by a
wide range of studies done globally (Mahal & Hossain, 2015; Özkan &
Karaibrahimoğlu, 2013; Phan et al., 2014; Rundora et al., 2013; Sartorius et al., 2007;
Wessels & Shotter; 2000; Zhang & Che, 2010).
Özkan and Karaibrahimoğlu’s (2013:420) research in Turkey found that customer
satisfaction was interlinked with gaining and maintaining competitive advantage. To
increase customer satisfaction, organisations must balance product quality and cost.
Their research found that TCM accounting systems failed to provide accurate cost of
providing quality products or services that lead to customer loyalty and retention.
Precise information necessary to accurately classify and measure cost of quality was
produced by ABC, as this accounting method properly allocates activity costs over
product/services (Özkan & Karaibrahimoğlu, 2013:420).
ABC was proven by Srinivasan (2008) to have made a costing system meaningful.
The research found that ABC users obtain a good approximation of the total costs of
products and services and in turn identify idle capacity. It allows flexibility and simply
flows with the processes and activities. The study added that ABC gives clear visibility
of which products are the most profitable and which are the least profitable. The
research continued to argue that ABC aids in identifying expensive activities that can
be targeted for remodelling, and lastly helps management to recognise the cost trends
of an organisation and sectoral trends to invest in research and development for better
products at different costs.
A study of the implementation of ABC at Nestlé Bangladesh Limited added the
following benefits to ABC costing: improved pricing, marketing, product design and
5
product mix, as well as identifying non-value-adding activities and weak product lines.
The implementation of ABC at Nestlé Bangladesh assisted marketers in cost
estimation used in pricing. It directed marketers how far to adjust in negotiations, to
yield substantial cost reductions and to indicate areas for improvements in operations
to allow better satisfaction of customer wishes (Mahal & Hossain, 2015:71).
ABC is not a standalone system, but it is part of an activity-based management (ABM)
system - according to research by Phan et al. (2014:787). ABM is defined by the
Consortium for Advanced Manufacturing-International (CAM-I) as a discipline that
concentrates on the management of activities with the aim of enhancing value
received by customers and the profit realised when providing such a value. CAM-I
further adds that ABM concentrates on how to improve and redirect resource usage
to increase the value add for customers and all other stakeholders (Cardos & Pete,
2011:158).
Research by Phan et al. (2014:787) found that many more companies use one of the
three hierarchies of ABM to understand resource consumption. First on the hierarchy
is Activity Analysis (AA), which recognises activities and procedures performed to
transform resources into outputs. Secondly is Activity Cost Analysis (ACA), which
recognises costs and cost drivers of each activity. The third and final level of ABM is
ABC, which traces activity costs to products and services to allow for a more precise
measurement of product and service cost (Phan et al., 2014:788). Organisations
seem to implement ABC intensively enough to identify the exact nature of their
overheads with the intention of gaining a competitive advantage (Reynolds & Van der
Poll, 2015:126).
Phan et al. (2014:787) examined the relationship between an organisation’s life cycle
(OLC) stages and the extent of its use of ABM. The research found that the life stage
of an organisation does indeed play a role in the selection of which level on the
hierarchy an organisation chooses to implement ABM, and to what extent.
Phan et al. (2014:788) identified five OLC stages. The first being the birth stage. At
this level organisations are smaller in size and are characterised by little product
diversity but high emphasis on marketing and distribution. The second OLC stage is
the growth stage in which organisations are focused on expanding and diversifying of
6
product lines. The third and fourth are the maturity and the revival stages respectively.
Organisations in the latter stages are bigger in size and are relatively in a stable
organisational environment, with higher levels of competition and a much more formal
and centralised structure (Phan et al., 2014:789).
Business units in decline, which is the fifth and final stage, are greatly centralised,
lacks a substantial strategy and - as a result – weighs minimal amounts of information
when making decisions. Phan et al. (2014:796) concluded that birth stage
organisations use all three levels of the ABM practice (AA, ACA and ABC) to a
significantly less degree than mature and revival organisations.
Mahal and Hossain (2015:71) studied disadvantages of ABC that have resulted in
fewer than anticipated companies implementing the system. The cost and complexity
of ABC implementation, compared to TCM, was at the top of the reasons provided.
ABC provides much more data than TCM which, if no proper training is given, could
result in misinterpretation. Lack of support from management and end-users resulted
in organisations quickly regressing back to TCM.
A South African study by Wessels and Shotter (2000:221) identified factors
responsible for successful implementation of ABC. These factors being management
support, adequate employee skills/resources and coherence of the ABC
implementation with the organisation’s set goals and culture. The findings of the study
are important in the implementation stage of this research, as it assists in anticipating
common obstacles.
Supporting the above findings is research done by Sartorius et al. (2007:3) that found
that the above critical success factors were key not only in a South African context,
but in developed countries’ implementation of ABC as well. The researchers further
added that the ability of an organisation to link its performance appraisal to ABC, as
well as a proficient training of users is key to the successful implementation of ABC.
A study by Rundora et al. (2013:485) investigated experiences and perceptions of
small South African manufacturing firms based in south Gauteng province to the use
of ABC as an alternative costing method. The study found that ABC users had been
longer in business and these businesses were larger in size than non-users. The

7
study also found that some barriers impending the adoption of ABC were found to be
either individual, organisational or environmental. Barriers for individuals are related
to anxiety around the unknown or change of the status quo, possible loss of status or
a need to learn a new skill. Organisational barriers are associated with territorial as
well as corporate culture issues. And, lastly, environmental barriers are put up by
stakeholders of interest such as regulatory agencies and employee groups (Rundora
et al., 2013:489).
Zhang and Che’s (2010:145) study added that organisational factors such as top,
controlling managements’ support, relevance, training, connection to performance
appraisals and compatibility with the existing system were key to the acceptance of
ABC. The study identified four stages to the implementation of ABC: initiation,
adoption, adaptation and acceptance (Zhang & Che, 2010:145).
There is clear evidence from the above literature that ABC has been studied
extensively across numerous countries, at organisations’ different life cycles, in
various industries and implementation at different levels of the ABM hierarchy.
Benefits and challenges have also been researched in depth. What has become
evident is that no research has been conducted on the development of an activity-
driven costing framework for a South African based cash services company. This
research aims to fill this knowledge gap.
Motivation of topic actuality
This research aims to deliberate on the benefits that could flow to a company as a
result of changes in its overhead allocation, benefits including accurate product and
costing decisions. This has been triggered by the belief that the current TCS does not
empower managers to be able to evaluate the effectiveness of resource allocation. As
a result, organisations’ successful adaption to a changing environment that is needed
for survival, is hindered.
A cash services company, from hereto referred to as Company A, is the case study
selected for this empirical study. A cash services company offers solutions and
services to keep cash safe and efficiently rotating in the retail and banking systems.
8
Company A has had a monopolistic advantage over South Africa’s cash services
industry due to the high capital requirement to enter the market. This has been a
significant barrier to market entry for over three decades. However, globalisation, a
weaker South African Rand against major international currencies and stagnant
growth in developed markets have seen international and well established players
enter the South African cash services market.
In an effort to defend its position as the local prominent player, Company A is under
pressure to optimise its processes and reduce costs. Accurate product costing has
become even more important if the company is to remain cost relevant in the industry.
For Company A to manage costs, they must identify and eliminate non-value adding
activities and loss-making products. It needs to turn around relationships with
customers that are not as profitable.
Overhead costs are currently being allocated by Company A’s costing department to
products using volume numbers. This cost allocation model is being used due to
minimal understanding of the business’s cost drivers and the ease of implementation.
The inaccurate allocation has resulted in erroneous product pricing and costing
decisions. An increase in product lines, previously thought to be profitable, are
resulting in staggering financial losses.
The motivation for the research was therefore to develop an activity-driven costing
framework that generates accurate and reliable information on product costs by
accurately identifying and assigning overhead costs to products and services. A
framework is a conceptual structure intended to serve as a guide for building a costing
system for Company A. The system must enable management to make correct
decisions based on relevant and up to date information about processes and products.
Company A aims to optimise efficiencies in the cash supply value chain by reducing
the costs of cash cycle servicing and increasing its purity; ensuring high levels of
efficiency of banknote and coin processing; maintaining high security standards, and
improving the quality and authenticity controls over banknotes and coins in circulation.
9
1.2 Problem Statement
As Company A has been a major provider of cash services for the South African
market, it resulted in the company showing inefficiencies associated with monopolies.
Being a monopoly meant that Company A could set prices that were higher than both
marginal and average cost, encouraging even further production inefficiencies. The
entry of new players resulted in customers now having alternative service providers
and no longer being price-takers. Company A is now forced to produce efficiently and
to reduce costs without adversely affecting quality.
The question can therefore be asked: would the development of an activity-driven
costing framework lead to improved product pricing and costing decisions in
Company A?
ABC, if properly implemented, can serve as a powerful tool for continuous
improvements of products and services. Benefits to Company A could be achieved
through process design simplification, as well as through the elimination of
unproductive, inefficient or redundant activities. Anticipated cost savings and cost
avoidance that will be as a result of the implementation of the framework, will
safeguard the survival of Company A and could ensure it remains a serious contender
in the industry.
1.3 Objectives
The research aims to achieve the following objectives:
Main Objective
The main objective of this study is to develop an activity-driven costing framework for
Company A, a South African cash services company. This framework’s objective is
to allocate overhead costs more accurately and reliably than the current TCM model,
thereby leading to improved product pricing and costing decisions.

10
Secondary Objectives
The following secondary objectives supports the achievement of the main objective
set above:
• Development of an appropriate research methodology to meet the above set
research objective (Chapter 2);
• Reviewing the existing literature on the fundamentals of cost allocation, TCM and
ABC and the emergence of TDABC (Chapter 3);
• Developing an activity-driven costing framework for Company A, the case study,
to ensure improved product pricing and costing decisions (Chapter 4); and
• Concluding the research by providing recommendations based on the findings of
the empirical study and substantiated by the literature review (Chapter 5).
1.4 Research Method
Objective of a research design is to articulate procedures used when conducting a
study, and its main purpose is to help find answers to research questions (Mouton,
2015:49). This study was conducted in two phases, being the literature review and an
empirical study.
Literature Review
A literature review is defined as the study of existing research conducted by scholars
to understand how they have investigated and solved a defined research problem
(Mouton, 2015:87). The aim of this study’s literature review is to identify existing
knowledge and research conducted in the ABC field.
The main sources of information for this research are relevant books, academic journal
articles, subject-specific magazines, internet sources, relevant dissertations and
theses. The foundation is based on the theory of ABC and the documented methods
of implementations.
11
Empirical Research
Researchers adopt either a qualitative, a quantitative or a mixed (or multi) method
mode of enquiry. This research follows a qualitative approach (Ivankova, Creswell &
Plano Clark, 2016:312).
To achieve the above set objectives, a case study approach was followed.
Company A, a cash services company, has been selected as the case study subject.
Semi-structured face-to-face interviews were conducted to gather qualitative data.
Interviews were held with relevant stakeholders from Company A, including
representatives from finance, costing, planning, operational and support office
management. The selection criteria for the respondents was those with an
understanding of, and being able to influence how business support services
(overhead) costs are being incurred in Company A. Interviews with the above-
mentioned key players, as well as system end-users, were conducted and analysed.
The aim with the interviews was to document and describe Company A’s centralised
business support services departments and to gain an understanding of the cost
drivers of each department. Furthermore, information on departmental activities and
resources consumed was gathered.
Content analysis was utilised to collect data from Company A’s enterprise resource
planning (ERP), management reports, external stakeholder reports and any internal
information systems. Information was gathered to obtain a better understanding of
what the current status of costing is. The objective was then to develop an activity-
driven framework, based on ABC principles that Company A could utilise going
forward.
A comparison between the current costing system (TCM) and that of the newly
developed activity-driven costing model was evaluated.
Paradigmatic assumptions and perspectives
The results of this research includes data resulting from semi-structured interviews
with topic-relevant professionals. The results also include calculations and a
comparison of systematic data between the ABC methodology to be implemented by
12
Company A and the currently used TCM methodology. This results is a combination
of positivism and interpretivism.
Positivism is an objective view of a common, individual reality with positivists believing
that anything that can be seen is real and that reality exists independently of human
thoughts and perception (Bisman, 2010:8). Interpretivists on the other hand, assume
a more personal and flexible research structure and attempt to make sense of what is
perceived as reality. Interpretivism therefore embrace multiple realities, and have
multiple perceptions about a single, mind-independent reality (Bisman, 2010:12).
Bisman (2010:13) found that qualitative, naturalistic methods provide richness,
density, depth and the contextual entrenching of data. Quantitative approaches allow
for the valuation of the capacity for a wide-ranging applicability of patterns observed
in data, these approaches include those utilising certain forms of statistical analysis,
The aim of the combination of qualitative and quantitative methodologies is to utilise
the strengths of each methodology whilst mitigating the individual weaknesses.
Methods used in the research to collect data emerge from both streams, i.e. by semi-
structured interviews and from analysing quantitative data.
1.5 Key Concepts
Activity-based costing (ABC): This methodology was first introduced in 1988 by
Cooper and Kaplan. It identifies cost pools or activity centres in an organisation,
thereafter it allocates indirect costs to cost drivers based on the number of each activity
used (Akyol, Tuncel & Bayhan, 2007:136). Based on these cost drivers of activities,
indirect costs are allocated to cost objects such as finished products, services and
customers proportionately (Szychta, 2010:50).
Activity-based management (ABM): ABM uses ABC data to better manage product
portfolios and to enhance business processes (CIMA, 2001:2). Business excellence
is supported by ABM as relevant information is provided to assist long-term strategic
decisions about product mix. ABM also supports continuous improvement as
management will gain new insights into activity performance (CIMA, 2001:3).

13
Time-driven activity-based costing (TDABC): TDABC allocates resource costs
straight to cost objects using two sets of estimates: the capacity cost rate for the
department and the capacity usage by each transaction processed in the department
(Kaplan & Anderson, 2007:18). TDABC embraces process complexities with lower
errors (Hoozée & Hansen, 2014:5).
Traditional costing methods (TCM): Traditional costing methods refer to the way in
which indirect and overhead costs expenses are being assigned to cost centres on an
subjective basis, resulting in cost centres often ‘‘absorbing’’ costs not directly caused
by them (Back, Maxwell & Isidore, 2000:48). In TCM, direct materials and labour are
the only costs that can be traced directly to products. The system uses direct labour
or machine hours as basis for the computation of overhead costs (Manalo, 2004:8).
1.6 Chapter Overview
Below is a high-level chapter layout to indicate the flow of research and the reasoning
processes; also to provide initial high-level information of the objectives within each
chapter.
Chapter 1: Introduction
The aim of this chapter was to introduce the study and to provide background to the
research problem. The chapter presented the previous research conducted on ABC
as well as a motivation that led to this research. It aimed to set the objectives and
brief research methodology of the study.
Chapter 2: Research Methodology and -Design
The focus of this chapter is on the selection of an appropriate research design. It
describes the detailed research methodology followed in order to meet the set
objectives.
14
Chapter 3: Activity-based costing and the emergence of time-driven activity-based costing
The chapter reviews the fundamentals of cost allocation and differentiate between
traditional cost allocation systems and activity-based cost allocation systems. The
chapter furthermore discusses the emergence of time-driven activity-based costing.
Chapter 4: Development of an activity-driven costing framework
This chapter presents the empirical study conducted on the selected case study and
results thereof. Departmental activities and consumption were selected through
interviews with management as well as the analysis of ERP data and departmental
monthly registers. A comparison between TCM and ABC results was conducted and
analysed.
Chapter 5: Findings and recommendations;
The summary of key research results is presented in this chapter, as well as the
conclusion as to what extent the set objectives have been met.
The next chapter presents the research methodology and design.
15
CHAPTER 2
2 RESEARCH METHODOLOGY AND DESIGN
2.1 Introduction
The aim of this chapter is to address the first secondary objective as set in Chapter 1
(refer 1.3.2, page 10) by developing an appropriate research methodology to address
the main research objective of developing an activity-driven costing framework for
Company A. In order to understand the research process, the following key terms are
defined and discussed: paradigm, research design, research methodology and
research methods.
A paradigm is a set of assumptions or principles around the fundamental
characteristics of reality leading to a particular world view. It deliberates on
assumptions around the following: ontology - which is the belief about the nature of
reality; epistemology - focusses on the relationship between knower and what is
known; and assumptions around methodologies (Niewenhuis, 2016:52).
A research design is a framework utilised during a research study as guidance of
how data is collected and analysed. Alternatively, it can be viewed as a blueprint of
how data is collected, measured and analysed (Pandey & Pandey, 2015:18).
According to Kumar (2011:41), the main purpose of a research design is to detail how
a researcher goes about finding answers to the set research questions and to
furthermore outline the specifics of the enquiry.
Research design details the process of the research by elaborating on what type of
study design is being planned and motivation for the chosen design. It furthermore
details the participants including the sampling method used to identify the latter. Lastly
it describes how the information will be collected and analysed (Kumar, 2011:101).
Pandey and Pandey (2015:19) elaborates by adding that the purpose of a research
design is to make the research as effective as possible by facilitating the smooth
scaling of the various research operations.
16
Kothari (2004:8) defines research methodology as a comprehensive process of
solving a set research problem. The steps followed to address the research problem
as well as the motivation behind each step is studied. It is therefore understood to be
a discipline of studying how to scientifically solve a problem. It is furthermore essential
for the researcher to be comfortable with both the research methodology and research
method. Mouton (2015:56) agrees by positing that research methodology
concentrates on the research process and the kind of tools and procedures to be used.
It aims for the usage of unbiased procedures (Mouton, 2015:56).
Research methods are all the methods and techniques used to perform a research
study. Alternatively it is all those methods utilised by the researcher during the
progression of studying their research problem (Kothari, 2004:8). Research methods
involve varying techniques of collecting data and the analysis and interpretation
thereof as proposed by a researcher (Creswell, 2014:295).
The layout of the rest of the chapter is as follows: firstly the discussion of the research
paradigm, followed by research approach, research design, case study research and
research methodology discussions. Ethics and a summary concludes the chapter.
2.2 Research Paradigm
A paradigm is defined by Perri and Bellamy (2012:32) as a commitment by a group of
scientists regarding what is to be observed and studied. It therefore determines what
can be considered as relevant data for answering those research questions which are
deemed key, how that data is to be interpreted, and what structure should be adopted
when answering those questions.
Dammak (2010) agrees with Niewenhuis (2016:52) that a paradigm has four parts:
ontology, epistemology, methodology and methods. As mentioned before, ontology
is focussed on “the nature of existence” and is the departure point of researchers.
Epistemology, on the other hand, “deals with the nature of knowledge” and is
concerned with the interaction between the knower and what is known. The
connection between ontology and epistemology is important as it is the researcher’s
ontological and epistemological assumptions that form the basis for the choice of
methodology and methods of research (Dammak, 2010).
17
The term worldview is often used interchangeably with the term paradigm. According
to Creswell (2014:35) worldview is defined as “a basic set of beliefs that guide action”.
Worldviews can be seen as a broad philosophical orientation about the world and arise
due to discipline orientations, a researcher’s predispositions and past research
experiences. Creswell (2014:35) further states that it is these types of beliefs that
influence the approach taken by the researcher.
The two paradigms widely discussed in the literature are:
1. Positivism - supports a deterministic philosophy where causes determine
effects outcomes (Creswell, 2014:36). Positivists posit that there is a single
reality, which is known and can be measured. The former are most likely to
use quantitative methods to measure this reality. The belief is that only
objective, unbiased and observable facts can be the basis for science (Jansen,
2016:22).
2. Interpretivism – researchers’ individual backgrounds influence their
interpretation, and they therefore position themselves in the research to
acknowledge how their interpretation is affected by their personal, cultural and
historical experiences. The researcher’s objective is to make sense of the
meaning that others have about the world (Creswell, 2014:37). Interpretivists
believe that there is no single truth or reality. Interpretivism further focuses on
the meaning that individuals assign to their individual experiences (Jansen,
2016:22). According to Baxter and Jack (2008:545), this paradigm identifies
the importance of the subjective human creation of meaning, but does not
outright discard some notion of objectivity.
According to Nieuwenhuis (2016:56), research paradigms can be categorised through
their:
• Ontology: Focused on what is the reality or truth?
• Epistemology: What and how can we know reality?
• Methodology: What procedures can we use to acquire knowledge?
• Methods: What tools can we use to acquire knowledge?
• Sources: What data can we collect?
18
The next section discusses the research paradigm from which this study was
conducted.
Research paradigm of this study
This research is nested in interpretivism, as it aims to expand on the understanding by
dwelling on multiple participant meanings. There are multiple realities due to varying
human experiences, knowledge, views and interpretations. The reality of this case
study was constructed through human interactions and actions. The case study is
understood through a mental process of interpretation that is influenced by the social
context. Due to the researcher and the researched being interlocked, and data
collection being an interactive process, the approach is interpretive in nature.
2.3 Research Approach
Research approaches is defined by Creswell (2014:31) as the plans and procedures
for a research studying ranging from the broad assumptions made to the specific
methods of data collection, analysis and interpretation (Creswell, 2014:31).
Creswell (2014:32) summarises the three research approaches as follows:
• Qualitative research: an approach for exploring and aiming to obtain an improved
understanding of the meaning individuals and groups attribute to a social and
human problem. The process of research includes emerging questions and
procedures. It also includes data typically collected in the participant’s setting, data
analysis inductively building from particular to general themes, and the
interpretations of the meaning of the data. Baboucarr and Soaib (2014:35) state
that qualitative research is multi-method in focus, involving an interpretive and
natural approach to its subject matter. This means that qualitative researchers
study subject matters in their natural settings, attempting to make sense of and
interpret the meanings people bring to them.
• Quantitative research: an approach for testing unbiased theories by studying the
relationship among variables. In turn, these variables can be measured in order
that data can be analysed using statistical processes.
19
• Mixed methods research: an approach combining a collection of both quantitative
and qualitative data, incorporating the two forms of data and using distinct
strategies that may involve philosophical assumptions and theoretical frameworks.
The key assumption is that the combination of qualitative and quantitative
approaches provides a more comprehensive understanding of a research problem
than either approach single-handedly would have provided.
Next the research approach for this study is discussed.
Research approach of this study
This research took a qualitative approach to explore Company A. The motivation
thereof is that it has complexities beyond the scope of more ’controlled’ methods. The
aim is to ‘get under the skin’ of Company A, to discover what really transpires, the
informal reality which can only be observed from the inside (Yin, 2009:11).
2.4 Research Design
A research design is a procedural blueprint that is used by the researcher to answer
questions validly, objectively, economically and importantly accurately (Kumar,
2011:96). A research design is where a researcher decides and communicates to
others decisions regarding which study design are proposed to be used. This
decisions include details of how information is to be collected from participants, how
these participants are going to be selected, how collected data is going to be analysed
and findings communicated.
An excellent research design minimises bias and ensures the reliability of the data
collected and analysed. The best design in scientific investigation is one that shows
the smallest experimental error (Pandey & Pandey, 2015:20). Pandey and Pandey
(2015:20) provide the following guidance in terms of the characteristics of a good
research design:
• Objectivity - the outcomes relate to the method of data collection and scoring of
the responses.
20
• Reliability - consistency all the way through a series of measurements. For
example, if a participant responds a certain way to a particular item, he or she is
expected to provide a similar response to that item when asked again.
• Validity - a measuring device or instrument is valid when it measures what it is
supposed to measure.
• Generalisability - how best the data collected from the samples can be used for
drawing certain generalisations related to a larger group from which that sample is
drawn.
• Adequate information – evidence of a good research design is that adequate
information is provided in order for a research problem to be analysed from a wider
perspective.
This study is based on a qualitative approach. Qualitative methods focus mainly on
gathering data that will support the researcher in understanding the meaning of what
is going on (Gillham, 2008:10). The primary focus in qualitative research is to explore,
understand, discover, explain, and clarify situations with the designs often based on
deductive rather than inductive reasoning (Kumar, 2011:103). Soiferman (2010:3)
defines induction as moving from the specific to the general as opposed to deduction
which begins with the general and ends with the specific; summarily articulated as
quantitative (deductive) and qualitative (inductive).
Case study
A case study has been selected as the appropriate research tool for this study. The
term ‘case study’ is an in-depth study of one, or a limited number of cases (Tight,
2017:6). A case study is conducted to generate insight and understanding by
providing a rich and thick description of the case and by illuminating its interaction to
its broader context. It will be used to explore the problem in its focused setting (Rule
& John, 2011:7).
As a research method, the case study allows the researcher to keep the holistic and
meaningful features of real-life events (Yin, 2009:4). A case study is an in-depth
empirical examination exploring a contemporary phenomenon within its real-life
context (Yin, 2009:18). Rule and John (2011:8) agree that a case study approach
allows a great deal of depth, flexibility, versatility and manageability.

21
Case studies have been further defined as “research situations where the number of
variables of interest far outstrips the number of datapoints”. While case studies may
use quantitative data, an important difference with other research methods is that case
studies aim to study the phenomena in their contexts, rather than in an independent
setting (Gibbert, Ruigrok & Wicki, 2008:1467). This view is shared by Baboucarr and
Soaib (2014:36) who highlight that the focus of a case study is to isolate and highlight
the characteristics of a particular entity.
According to Tight (2017:6), a ‘case study’ can be distinguished when:
(a) that the data collection methods are qualitative;
(b) that the research is an in-depth examination of a phenomenon;
(c) that a specific type of evidence is used;
(d) that data is gathered in a ‘real-life context’;
(e) that it is difficult to distinguish between the case and the context;
(f) that multiple sources of evidence are employed, and
(g) that a single observation or example is investigated.
The selection of a specific type of case study design is directed by the overall study’s
purpose, be it to explore, to compare between or to describe a case (Yin, 2009).
According to Yin (2009) and Stake (1995), case study types can be categorised as
follows:
Explanatory: This type of case study is relevant when questioning the presumed
underlying links with real-life interventions that are too complex for the use of either
survey or experimental strategies (Baxter & Jack, 2008:547). Explanatory case
studies attempt to explain what happens in a specific case or why that happened (Rule
& John, 2011:8).
Exploratory: An exploratory case study examines an unexplored phenomenon and
which could furthermore lay the foundation for future studies (Rule & John, 2011:8).
Descriptive: This type of case study is used to describe the real-life context in which
a phenomenon can occur (Baxter & Jack, 2008:548). A complete description of a
22
phenomenon including its background is provided in a descriptive case study (Rule &
John, 2011:8).
Multiple-case studies: This type of case study allows the researcher to investigate
differences within and between cases with the purpose to replicate findings across
these cases. Cases should be chosen cautiously in order for the researcher to predict
similar results across cases, or to predict opposing results based on a theory (Baxter
& Jack, 2008:548).
Intrinsic: This approach is used with the purpose to gain a better understanding of a
case. The case is not undertaken as it represents other cases, or because it illustrates
a particular phenomenon or problem, but because the case itself is of high interest in
all its particularity and ordinariness (Baxter & Jack, 2008:549). Pearson, Albon and
Hubball (2015:2) describe that an intrinsic case study commonly occurs in program
evaluation as the case is generally allocated, rather than chosen.
Instrumental: This case study type is generally employed to achieve more than just
to gain an understanding of a particular situation. It often provides insight and
awareness into an issue or assists in improving a theory. The case is therefore of
secondary interest and plays a supportive role in facilitating our understanding of
something else. The case is often observed contextualised in-depth detailing its
ordinary activities as it assists the researcher to pursue the external interest (Baxter &
Jack, 2008:549).
Collective case studies is used interchangeable with the term of “multiple case
studies” (Baxter & Jack, 2008:549).
Research design of this study
An exploratory, single case study of Company A has been selected as research design
to develop an activity-driven costing framework - a unique case, as it is one of its kind
in the specific industry. It can be studied in-depth, as the researcher is an employee
of Company A and therefore has insider knowledge of the company. The case cannot
be considered without context, such as the industry and country in which the company
23
operates. It would be impossible to have a clear picture of Company A’s costing
framework without contextualising the environment.
2.5 Research Methodology
Case study methodology has the benefit of flexibility regarding the types of research
questions that can be researched, and the data collection methods that can be
employed (Pearson et al., 2015:2).
Data collection techniques
Data collection methods are procedures for capturing that which is important in
answering the research question from the data that has been collected (Perri &
Bellamy, 2012:10). According to Yin (2009:101), the following are some of the
commonly used data collection methods in case study research:
Documentation
Documents represent a formal framework that the informal reality should be related to
(Gillham, 2008:21). This type of information can take many forms and should be the
object of clear data collection procedures (Yin, 2009:101). Advantages to documents
are:
• They can be reviewed repeatedly and are a stable source of information.
• They are unobtrusive, as they are not created for the benefit of the case study.
• They are exact, as they contain names, details and references of events.
Some of the weaknesses to be mindful of are, amongst others, irretrievability (could
be difficult to find) and biased selectivity (if collection is incomplete) (Yin, 2009:102).
Archival Reports
These are historical reports, but might offer a valuable longitudinal view on the current
situation (Gillham, 2008:21). Archival reports have the same strengths and
weaknesses as documentation. According to Yin (2009:102) archives are generally
quantitative and precise but access could be limited due to privacy reasons.
24
Caution raised by Yin (2009:106) regarding archived data is to be mindful that this
data was produced for a specific purpose and audience and therefore when using
archival records it has to be contextualised.
Interviews
This data collection method is targeted as it focusses directly on the case study topics.
It can prove to be: i) insightful ii) and can provide perceived casual inferences and
iii) explanations.
A weakness of this data collection technique might be that poorly articulated questions
could lead to bias. Another weakness is that responses could be biased or lead to
inaccuracies due to poor recall. And interviewees could give the interviewers what
they want to hear (Yin, 2009:102). Notwithstanding, semi-structured interviews, if
done correctly, can be the richest source of data (Gillham, 2008:65).
Observation
This data collection method has three primary elements: observing what people do,
listening to what they are saying and then asking clarifying questions (Gillham,
2008:45). There are two main kinds of observation: direct- and participant
observations.
Direct Observation
Events are covered in real time and covers the context of the case (Yin, 2009:102).
This is a ‘fly on the wall’ approach (Gillham, 2008:21). It adds new dimensions for
understanding the context of the case being studied (Yin, 2009:111). Yin (2009:102)
points out weaknesses such as direct observation being selective, time consuming, as
well as the possibility that the event might proceed differently because it is being
observed (observer effect).
Data gathering included direct observation of meetings and side-walk activities. Yin
(2009:111) adds that, to increase reliability of observational evidence, is to have more
than a one observer, be formally or casually. Resources permitting a case study
investigation could allow for the use of more than one observer.

25
Participant Observation
Data collection includes participants’ observation where the researcher is not merely
a passive observer and can take on a number of roles within the case study situation
(Yin, 2009:2011). This is the case where the researcher will be ‘in’ the setting - in
some active sense - keeping eyes and ears open, noticing things that might normally
be overlooked (Gillham, 2008:21).
The roles for illustrative studies in the organisation that were employed included, but
not limited to, taking a functional role in expenditure processing to follow cost sources,
being a key decision maker in Company A’s organisational setting.
Data collection techniques for this study
Research data collected from Company A included, but was not limited to, financial
reports, meeting minutes, prior formal studies, budget and forecast reports,
organograms, departmental incident registers and data from the ERP system.
Archives were broadly used in this research for two important purposes, as pointed
out by Yin (2009:103), namely 1) to validate, and 2) to expand evidence from other
sources. Archival reports collected and analysed included data previously collected
by the company, prior budgets and expenditure reports.
Interviews with representatives from IT, HR, finance, sales, planning, operational and
support office management were conducted in a fluent manner. The interviews were
a guided conversation rather than a structured query. Interviews were held in the
manager’s office where participants felt the most comfortable. The interviews were
half an hour to an hour long and the interviewer took field notes of the interview.
In line with in-depth interview case study research, participants were asked facts of
matter questions, as well as their opinions about events. Interviews took an extended
period, as participants were asked to propose their insights into certain occurrences.
Key interviewees that assist in this manner are considered “informants” and provide
the researcher with corroboratory or contrary sources of evidence (Yin, 2009:107).

26
Formal and more structured questions along the lines of a survey were also be used
to collect research data to include perception and attitudes of the workers and
managers of Company A.
Data analysis
Data analysis makes use of processes to examine collected data to ensure that the
research question is answered (Perri & Bellamy, 2012:10). Gillham (2008:25) defines
data analysis procedures as basically the way the researcher will order and present
findings. An analytical strategy is essential to assist with treating the evidence fairly,
to produce analytical conclusions and to rule out alternative interpretation (Yin,
2009:130).
Yin (2009:130) describes four data analytic strategies:
i. Developing a case description: initially relevant literature should be reviewed
that could have exposed gaps or topics of interest that spurred the interest in the
case study. A descriptive framework organises the case study analysis but also
accepts that data was collected about each topic to begin with.
ii. Relying on theoretical propositions: this strategy means following the
theoretical plans that led to the case study. Theoretical proposition stemming
from “how” and “why” questions can be exceptionally useful in guiding case style
analysis.
iii. Using both qualitative and quantitative data. Quantitative data is applicable
to cover the behaviour or events that the case study is trying to clarify and the
data is linked to the unit of analysis. Collecting quantitative data subjected to
statistical analysis such as surveys - alongside quantitative data such as
interviews and observations - will lead to successful, strong analytics.
iv. Lastly, examining rival explanations tries to define and test rival explanations.
Initial proposition would have included rival hypothesis. Comparison groups may
cover rival circumstances to be examined.
The selection of analytical strategy and techniques is critical, as they deal with
difficulties of developing internal and external validity.

27
Data analysis of this study
This study conforms to developing a case description strategy to identify the overall
pattern of complexity in the development of an activity-driven costing framework for
Company A.
2.6 Methodological Rigour
According to Gibbert et al. (2008:1468) four criteria are frequently used to evaluate the
rigour of field research: internal validity, construct validity, external validity and
reliability. Each one of these are now discussed.
Internal validity
Internal validity refers to the causal interactions between variables and results. The
concern is whether the researcher provides a reasonable causal argument, logical
reasoning that is powerful and persuasive enough to defend the research’s
conclusions. Three measures have been proposed to improve internal validity: firstly,
case study researchers should articulate a clear research framework which
establishes that variable x leads to outcome y, and that y was not caused by a third
variable z. Secondly, using pattern matching, researchers should compare empirically
observed patterns with either predicted ones or patterns recognised in previous
studies and in different contexts. Thirdly, theory triangulation allows a researcher to
verify conclusions by adopting multiple perspectives (Gibbert et al., 2008:1468).
Construct validity
Construct validity refers to how far a study investigates what it claims to investigate,
i.e. to the degree to which a procedure leads to a precise observation of reality. In
order to enhance construct validity in case studies, two measures have crystallised.
Firstly, researchers have been encouraged to start a clear chain of evidence in order
to let the reader to reconstruct how the researcher progressed from the initial research
questions to the final conclusions. Secondly, researchers have sought to triangulate
which means to adopt different angles from which to view the same occurrence by
using diverse data collection approaches and diverse data sources (Gibbert et al.,
2008:1468).
28
External validity
External validity is based on the intuitive belief that theories must be seen to account
for phenomena, not only in the setting in which they are studied, but also in varying
other settings (Gibbert et al., 2008:1469).
Reliability
Reliability refers to the lack of random errors, allowing subsequent researchers to
arrive at the same conclusions if they conducted the study along the same steps again.
The crucial words here are replication and transparency. Transparency can be
heightened through measures such as cautious documentation and explaining of the
research procedures.
The three validity types are dependent; without a clear theoretical and fundamental
logic (internal validity), and without a cautious link between the theoretical assumption
and the empirical observations (construct validity), there cannot be external validity in
the first place (Gibbert et al, 2008:1469).
Case study methodological rigour
According to Yin (2009:114), principles of data collection have been established to
resolve difficulties of establishing the construct validity and reliability of the case study
evidence.
The first is to use multiple sources of evidence. The rationale for using multiple
sources of evidence is called triangulation (Yin, 2009:114). Furthermore, the
advantage of using multiple sources (the development of converging lines of inquiry,
which is a process of triangulation and corroboration) is that the case study findings
are likely to be more conclusive and accurate. Types of triangulation discussed by Yin
(2009:116) are that of data sources (data triangulation); among diverse assessors
(investigators triangulation); of perspectives to the same data set (theory triangulation)
of methods (methodological triangulation). This research relates only to data
triangulation, collecting information from multiple sources aimed at validating the same
facts and events.
29
The second principle is the creation of a case study database. It is a way of organising
and documenting the data collected for case studies such that it increases reliability
and accuracy. Gillham (2008:22) highlights the importance of maintaining a research
log. It should hold the evidence such as discussion and observation notes, as well as
personal notes such as questions the researcher needs to reflect on later, someone
to consult, etc. Research records must be open for inspection and organised so that
someone else can follow them (Gillham, 2008:23).
The third and last principle, according to Yin (2009:122), is the maintenance of a chain
of evidence. This principle allows an external observer to trail the source of evidence
from initial research questions to final case study conclusion.
Kumar’s (2011:28) research contributed the following:
• The concept of control implies that, in investigating the causality in relation to two
variables, the design and methodology has to minimise the effect of further factors
affecting the relationship.
• Rigorous is being reliable in ensuring that the procedures followed to find answers
to questions are appropriate, applicable and justified.
• Systematic implies that the procedures undertaken for the investigation follow a
certain logical sequence. The diverse steps cannot be taken in a haphazard way.
• Verifiable implies that whatever is decided based on the research’s findings, is
accurate and can be verified by others.
• Empirical means that any conclusions drawn are based upon solid evidence
gathered from data collected from real-life experiences or observations.
This study sternly follows the above-mentioned principles to enhance the study’s
quality and trustworthiness.
2.7 Ethics
Pearson et al. (2015:5) found that a case study methodology may present numerous
ethical dilemmas which are often disregarded. They state that, if the case study
comprises of data collection through interviews or other methods concerning people,
it is crucial that participants be treated with dignity, respect and care throughout the
30
process. Confidentiality must be protected and it is common to guard the identity of
individuals and research sites.
In order to ensure that the researcher approaches this study in an ethical manner,
consent was requested from and granted by Company A’s management and the study
has been approved by the ethical committee of the North-West University.
Furthermore, permission from interviewees was obtained prior to all interviews. In
addition, the company’s identity is protected by referring to it as Company A.
2.8 Summary
The aim of this chapter was to address the first secondary objective as set in
Chapter 1, namely that of developing an appropriate research methodology to be
followed to develop an activity-driven costing framework for Company A (a South
African cash services company).
The chapter addressed fundamental assumptions behind the set of common beliefs
and agreements (paradigm), what a reality is (ontology), how does one know the
reality (epistemology) and how does one go about finding it (methodologies). The
fundamentals of available research approaches such as qualitative, quantitative and
mixed methods were reviewed, as well as their roles in the selection of methods of
data collection, analysis and interpretation.
The importance of case study as a research method was introduced and explained as
a way of investigating an empirical topic by following an established set of pre-
specified procedures. The articulation of these procedures were discussed in depth
in the chapter.
The chapter reviewed six sources of case study evidence, namely documentation,
archival records, interviews, direct and participant observation as well as the evidence
that can be collected from these sources.
The chapter concluded by discussing the ethical and methodological rigour decisions
such as internal validity, construct validity, external validity and reliability that
influences a case study.

31
Chapter 3 reviews the literature on traditional costing methods, activity-based costing
and time-driven activity-based costing.
32
CHAPTER 3
3 ACTIVITY-BASED COSTING AND THE EMERGENCE OF TIME-DRIVEN ACTIVITY-BASED COSTING
3.1 Introduction
This chapter aims to address the second secondary objective as set in Chapter 1 (refer
section 1.3.2, page 10) of reviewing the existing literature on the fundamentals of cost
allocation, traditional costing methods (TCM) and activity-based costing (ABC), as well
as the emergence of time-driven activity-based costing (TDABC) .
A literature review is where theories and previous research that could influence the
chosen research topic are identified by the researcher (Ridley, 2008:2). It is where
the researcher shows that they are aware of and can interpret what is already known
by identifying contradictions and gaps in existing knowledge (Jesson, Matheson &
Lacey, 2011:10).
This study attempts to contribute to the literature by achieving the main research
objective as stated in Chapter 1 (refer section 1.3.1, page 9), namely of developing an
activity-driven costing framework for a South African cash services company.
Figure 3.1 highlights the structure of the chapter.

33
Figure 3.1: Chapter 3 flow diagram
Source: Own Research
3.2 Fundamentals of Cost Allocation
Contemporary business, whether large or small, requires management to have a clear
understanding of its costs and a scalable, easy-to-understand cost model that can
quickly reflect changes in business as they occur (Barndt, Oehlers & Soltis, 2015:24).
Costs incurred by organisations can be divided into two classes: direct and indirect
(also known as overhead) costs (refer Figure 3.2 below). Direct costs can be
accurately traced to cost objects such as direct material and labour. These costs can
be precisely and completely traced to a particular product or service, whereas indirect
costs are not so easily traceable. Indirect costs such as finance, IT, HR and group
management are shared by multiple divisions (Korok & Goldmanis, 2012:1342).
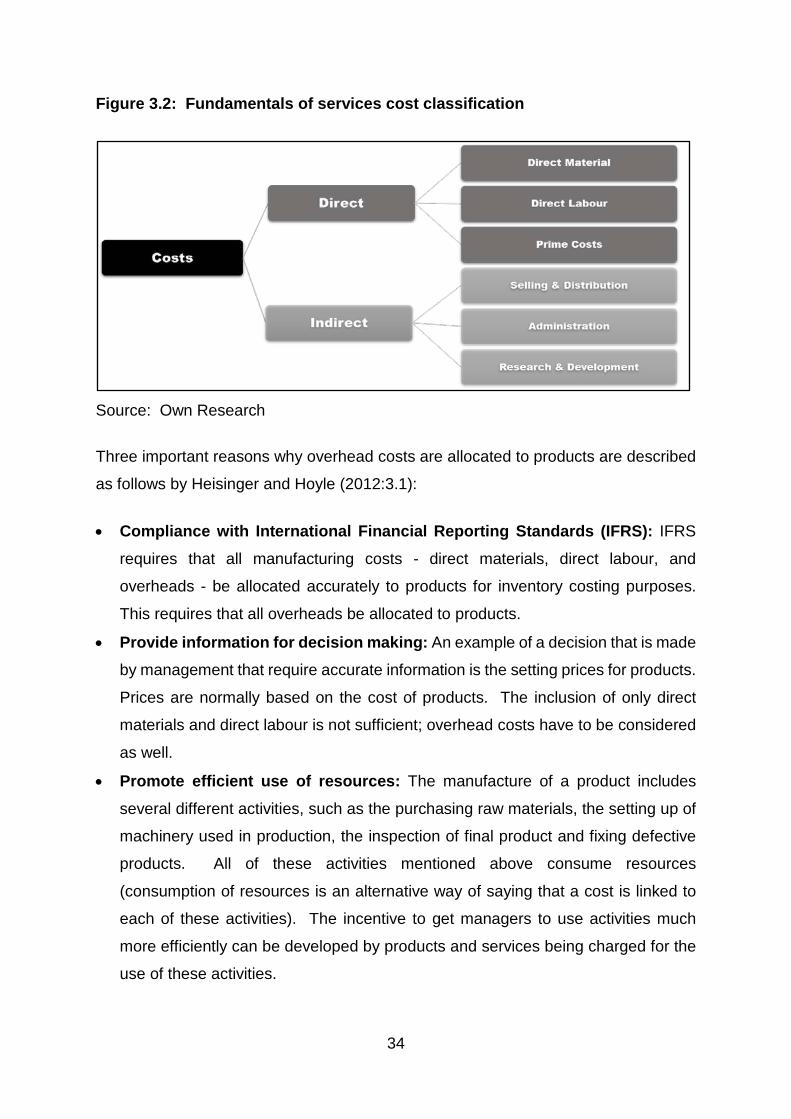
34
Figure 3.2: Fundamentals of services cost classification
Source: Own Research
Three important reasons why overhead costs are allocated to products are described
as follows by Heisinger and Hoyle (2012:3.1):
• Compliance with International Financial Reporting Standards (IFRS): IFRS
requires that all manufacturing costs - direct materials, direct labour, and
overheads - be allocated accurately to products for inventory costing purposes.
This requires that all overheads be allocated to products.
• Provide information for decision making: An example of a decision that is made
by management that require accurate information is the setting prices for products.
Prices are normally based on the cost of products. The inclusion of only direct
materials and direct labour is not sufficient; overhead costs have to be considered
as well. .
• Promote efficient use of resources: The manufacture of a product includes
several different activities, such as the purchasing raw materials, the setting up of
machinery used in production, the inspection of final product and fixing defective
products. All of these activities mentioned above consume resources
(consumption of resources is an alternative way of saying that a cost is linked to
each of these activities). The incentive to get managers to use activities much
more efficiently can be developed by products and services being charged for the
use of these activities.
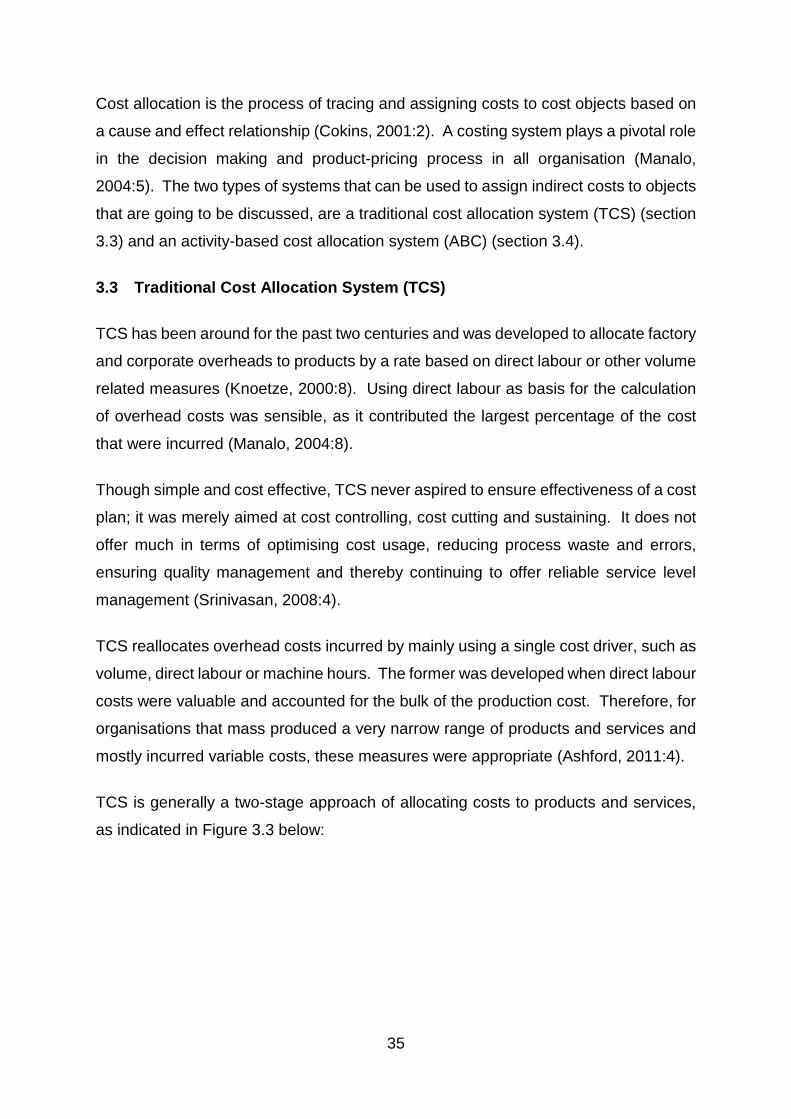
35
Cost allocation is the process of tracing and assigning costs to cost objects based on
a cause and effect relationship (Cokins, 2001:2). A costing system plays a pivotal role
in the decision making and product-pricing process in all organisation (Manalo,
2004:5). The two types of systems that can be used to assign indirect costs to objects
that are going to be discussed, are a traditional cost allocation system (TCS) (section
3.3) and an activity-based cost allocation system (ABC) (section 3.4).
3.3 Traditional Cost Allocation System (TCS)
TCS has been around for the past two centuries and was developed to allocate factory
and corporate overheads to products by a rate based on direct labour or other volume
related measures (Knoetze, 2000:8). Using direct labour as basis for the calculation
of overhead costs was sensible, as it contributed the largest percentage of the cost
that were incurred (Manalo, 2004:8).
Though simple and cost effective, TCS never aspired to ensure effectiveness of a cost
plan; it was merely aimed at cost controlling, cost cutting and sustaining. It does not
offer much in terms of optimising cost usage, reducing process waste and errors,
ensuring quality management and thereby continuing to offer reliable service level
management (Srinivasan, 2008:4).
TCS reallocates overhead costs incurred by mainly using a single cost driver, such as
volume, direct labour or machine hours. The former was developed when direct labour
costs were valuable and accounted for the bulk of the production cost. Therefore, for
organisations that mass produced a very narrow range of products and services and
mostly incurred variable costs, these measures were appropriate (Ashford, 2011:4).
TCS is generally a two-stage approach of allocating costs to products and services,
as indicated in Figure 3.3 below:
36
Figure 3.3: Traditional costing system
Source: Own Research
First stage allocation entails the assignment of overheads to cost centres. Normally
cost centres are departments. The second allocation stage entails the allocation of
costs that have accumulated in cost centres to cost objects, using a selected allocation
base, typically labour or machine hours (Osadchy & Akhmetshin, 2015:1708).
TCS has generally been popular due to its relative ease of application. Products and
services with higher direct labour hours were allocated more overhead costs. This
system worked well for organisations that manufactured large volumes of a few
products and/or had immaterial overhead costs (Popesko, 2009:38).
In 1963 Peter Drucker highlighted that traditional cost calculation methods lack
accuracy and relevance, resulting in mutual subsidy between products and their costs
(Cardos & Pete, 2011:155). Managers may therefore be misled when considering the
profitability of certain products due to the inaccurate allocation of indirect costs. In
other words, the TCS can provide misleading information leading to managers making
inaccurate decisions.
Company A currently utilises TCS to allocate indirect costs. Company A’s cost
allocation system is discussed in Chapter 4.
Normally a department e.g. Finance, HR, IT etc
First Stage Allocation
Second Stage Allocation
Overhead Cost Accountse.g. Depreciation, financing, building & vehicle costs etc.
Cost Centre 1 Cost Centre 2 Cost Centre 3
Cost Objectse.g. Product, services and customers etc.
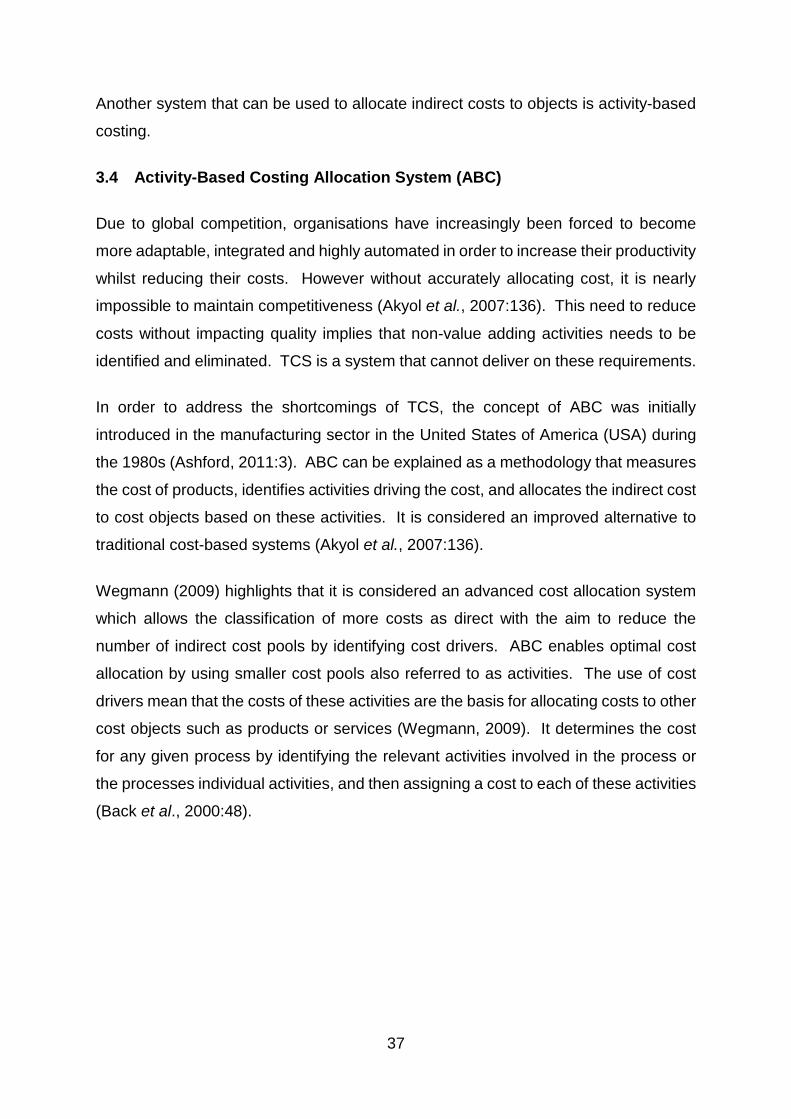
37
Another system that can be used to allocate indirect costs to objects is activity-based
costing.
3.4 Activity-Based Costing Allocation System (ABC)
Due to global competition, organisations have increasingly been forced to become
more adaptable, integrated and highly automated in order to increase their productivity
whilst reducing their costs. However without accurately allocating cost, it is nearly
impossible to maintain competitiveness (Akyol et al., 2007:136). This need to reduce
costs without impacting quality implies that non-value adding activities needs to be
identified and eliminated. TCS is a system that cannot deliver on these requirements.
In order to address the shortcomings of TCS, the concept of ABC was initially
introduced in the manufacturing sector in the United States of America (USA) during
the 1980s (Ashford, 2011:3). ABC can be explained as a methodology that measures
the cost of products, identifies activities driving the cost, and allocates the indirect cost
to cost objects based on these activities. It is considered an improved alternative to
traditional cost-based systems (Akyol et al., 2007:136).
Wegmann (2009) highlights that it is considered an advanced cost allocation system
which allows the classification of more costs as direct with the aim to reduce the
number of indirect cost pools by identifying cost drivers. ABC enables optimal cost
allocation by using smaller cost pools also referred to as activities. The use of cost
drivers mean that the costs of these activities are the basis for allocating costs to other
cost objects such as products or services (Wegmann, 2009). It determines the cost
for any given process by identifying the relevant activities involved in the process or
the processes individual activities, and then assigning a cost to each of these activities
(Back et al., 2000:48).
38
Figure 3.4: Activity-based costing system
Source: Own Research
Cost drivers are directly linked to activities and can therefore occur on several levels
(Akyol et al., 2007:136):
1. Unit level drivers, assume that the inputs increase for every unit that is in
production.
2. Batch level drivers, assume that the variation of the inputs occur as a result of
every batch that is produced.
3. Product level drivers, assume that resource inputs are to support the
production of the individual product type.
4. Facility level drivers are the drivers which are associated with the facility’s
production process.
Akyol et al. (2007:138) found that ABC can, as a result of making use of the activity
concept combined with the driver level where costs are incurred, positively link the
product costs to production knowledge. It can answer questions such as:
First Stage Allocation
Allocation using cost pools
Second Stage Allocation
Overhead Cost Accountse.g. Depreciation, financing, building & vehicle costs etc.
Activity Cost Centre 1
Cost Objectse.g. Product, services and customers etc.
Activity Cost Centre 2
Activity Cost Centre 3
39
• how a product is produced;
• how much time is required to complete an activity, and finally
• how much resources are absorbed by performing this task.
The resource expenditures allocated to an activity are determined through interviews,
time sheets and direct observations of the percentage or amount of time people spent
on different activities (Srinivasan, 2008:17).
Performance improvement are clearly seen in terms of costs, time and quality. The
connection between ABC and performance improvement is evident. ABC has a
moderate influence on time, a significant influence on quality, and a substantial
influence on cost (Ashford, 2011:5).
ABC enables management to evaluate the organisation in various ways either by:
1) product or group of related products, or 2) individual client or customer group, or
3) distribution channel. In addition, ABC analysis also highlights exactly what activities
are related with a particular part of the organisation and how those activities are in turn
related to the consumption of resources and generation of revenues (Ashford, 2011:4).
3.5 Benefits of implementing ABC
According to Sartorius et al. (2007:5) organisations have various reasons for adopting
ABC which can be classified into a number of categories:
• Cost accounting: to achieve improved allocation of indirect costs resulting in
more accurate costing of products, which in turn will provide more accurate costing
information.
• Cost management purposes: to gain a clearer understanding of cost reduction
and cost drivers.
• Development of budgets: also to support other innovations such as Just-In-Time
and Total Quality Management systems.
• Performance measurement purposes: in order to measure performance such
as product profitability, activity management and departmental efficiency.

40
• Decision making reasons: to enable improved decision making, including the
selection of the optimal product mix and activities, pricing and outsourcing as well
as the evaluation and justification of investments in new technologies.
• General management: reasons include responding to increased pressure from
regulators as well as creating cost awareness among employees by incentivising
desired behavioural changes.
• Fostering of better relationships: analysing and management of customer
profitability.
ABC is required when there is a wide product variety combined with a high product
complexity, minimal commonality in overheads, difficulties in existing cost allocations
and a change in business setting (Rundora, 2012:15).
Back et al. (2000:57) found ABC to be an important analytical tool for understanding
the interaction between cost and cycle time for any process under investigation. In a
period where construction and engineering companies are frequently striving to
improve the effectiveness and efficiency of their operations, it is imperative that they
fully comprehend the behaviour of their processes.
Small and medium enterprises (SMEs) constitute a large portion of the total
enterprises in the world economy and are known for their adaptability, innovation and
being open to change. SMEs operate in highly competitive markets and, as a result,
precise knowledge of their cost of quality (CoQ) is essential for survival. Attempts to
correct quality with cost information was difficult, due to lack of information from TCS.
Research by Özkan and Karaibrahimoğlu (2013:429) found that the use of ABC
enables the measurement and reporting of CoQ through detecting quality-related
costs. The CoQ reports under ABC provide organisations with the opportunity for
quality and cost control improvements, and in turn improving competitiveness.
According to Srinivasan (2008:6), advantages of ABC include the following:
• ABC empowers the user with a better forecast of the total real costs of products,
services and unused capacity.
• It allows flexibility as it flows with the process and activities.
• It aids to identify costly activities that can be targeted for re-engineering.
41
• ABC helps management to understand the cost trends of a business and sector,
to invest in research and development for better products at different costs.
• It can provide all benefits associated with output based budgeting.
Rundora’s research (2012:23) adds that ABC can effectively support continuous
improvement, flexible manufacturing and short lead times by helping managers to:
• identify, monitor and trace significant technology driven costs directly to products;
• identify the cost drivers that produce or impact cost and also those that do not
contribute to perceived customer value;
• to enable full understanding of the impact of new technology on all components of
performance;
• interpret company targets into activity goals and analyse the performance of
activities across business departments, and to
• endorse standards of excellence.
ABC is a method that can change management behaviour by focussing attention on
operational processes, spending patterns, supporting activities and responsibilities
across an organisation (Knoetze, 2000:34).
In conclusion, ABC is a “scalpel” management, a type of management accounting that
should be used to formulate the company strategy for its next competitive battle - that
of economic survival (Knoetze, 2000:34).
3.6 Challenges to implementing ABC
Notwithstanding the identified benefits of ABC, a limited number of companies have
attempted to adopt this costing and management technique. Sartorius et al. (2007:7)
found that the main reason why organisations do not implement ABC is due to the high
implementation cost and perceived design complexity. In addition, the lack of both
financial and technical resources in organisations tend to be the most common barrier
for lack of implementation of ABC.
Furthermore, Srinivasan’s (2008:17) research found that the traditional ABC model
has been challenging to implement. This is because of increased cost to gather
costing information from employees and other stakeholders through interviews and
42
surveys. In addition, the problems associated with updating and maintaining the ABC
model when the following occurs:
• resource and processes consumption change;
• new activities are added, and
• upsurges in the complexity and diversity of individuals’ orders, channels and
customers.
One of the challenges when implementing ABC in an organisations is that production
processes are not similar and static but rather variable to some extent. The reason
for the variability in nature is due to the need for human intervention and it has been
proven that humans do not perform activities identically every single time. It has
repeatedly been proved that humans are often prone to wide variations in personal
productivity (Back et al., 2000:49).
Furthermore, processes are rarely without variation of some kind. Even when
processes are repetitive, they are still subject to unanticipated changes, errors, rework
and other events that impact the performance of such a process. Such impacts may
influence the cost of an activity, the frequency and duration thereof or even the
relationship with other activities. It can therefore be concluded that most processes
are variable with an inherent uncertainty in their output (Back et al., 2000:49).
Mahal and Hossain (2015:71) further added the following as disadvantages of the ABC
system:
• Managers find the ABC implementation process complex and difficult to
understand. It furthermore produces a high volume of data, activity measures
which require collection, checking and interpretation.
• Due to its complexity of the process, the decision-making process can be quite
lengthy.
• Resistance against the change from TCS to ABC as managers are comfortable
using TCS to run their operations.
• ABC data can easily be misread, as there might be an enormous amount of
unrelated data.
43
• In practice, managers can insist on allocating all costs to cost objects insistence
which might lead to pricing errors due to ‘overstated cost’ and ‘understated margin
result’.
• The ABC implementation team may be discouraged if management fails to
consider the newly implemented ABC profitability and cost information.
• Consultants cannot always support management adequately as they are not
familiar with an organisation’s operations.
• Employees could feel threatened if they perceive that the new ABC system will
affect their responsibilities and in turn resist changing to the new system.
Notwithstanding the benefit of ABC delivering more accurate product or service costs
than the TCS, managers should be sensitised to the following limitations (Rundora,
2012:24):
• Allocations: Some costs do not have a clear-cut activity or cost driver and
therefore would require allocations to products and departments based on a
volume-driven measure due to the impracticality of finding an alternative activity or
cost driver.
• Omission of costs: It is not always possible to include all the costs related to the
product or service costs in an ABC system.
• Expense and time: An ABC system can be timely and expensive to develop.
Knoetze (2000:33) highlight the following reasons why some ABC systems fail:
• Perception: It is perceived by employees to be just another meaningless financial-
or managerial exercise. • Technical & Financial Capability: the difficulty in identifying relevant cost drivers
and it is furthermore expensive to set up and maintain when compared to the useful
information derived from it. • Time: The time and effort involved in establishing and implementing an ABC
system can be excessive.
Research by Rundora (2012:73) found that the non-users of ABC viewed the
challenges of implementing and maintaining an ABC system as more significant than
the ABC users. Moreover, there is evidence of a significant difference between the
44
perceptions of the non-users and those of the users. The non-users viewed the
following challenges as the most significant: lack of ABC knowledge, difficulty in
defining cost drivers and activities, and the priority of more pressing projects and
challenges.
Criticism against ABC includes that it uses historical costs, usefulness of which is
doubtful, particularly if future cost considerations are of higher importance. Critics also
state that ABC merely re-allocates costs, and practical limitations imply that nothing
can be done with the results (Knoetze, 2000:35).
The next section discusses the development and emergence of time-driven activity-
based costing.
3.7 Emergence of Time-Driven Activity-Based Costing
The conventional ABC system aimed to measure product cost and customer
profitability on a monthly basis. The latter is a goal befitting for motivating activities
relating to process improvement, product pricing and customer relationships.
However, the process required substantial resources to collect and process the data
monthly. Additionally it required quite some resources to prepare management
reports, for some organisations all this could possibly take more than thirty days to
prepare (Kaplan & Anderson, 2007:15).
A solution to the challenges associated with conventional ABC has been devised,
tested and implemented. The new approach is termed time-driven activity-based
costing (TDABC). According to Kaplan and Anderson (2007:18), TDABC is quicker,
cheaper and simplifies the costing process. This is done by eliminating the
requirement of interviewing and surveying employees, so as to allocate resource costs
to activities prior to driving them down to cost objects such as orders, products and
customers. TDABC does not assign resource costs to cost pools on the basis of
employee survey results (Barndt et al., 2015:25).
TDABC is intended to eliminate problems with implementation through varying the
collecting data method on activity times, and through the adjustment of the procedure
45
to calculate the activity cost. It takes an aggregate view of resources and uses time
as its primary cost driver (Szychta, 2010:53).
TDABC regards time as the principal cost driver of cost since the majority of resources,
such as employees, have measurable capacities based on the amount of time they
work (Szychta, 2010:53). Other measures can also be used to establish capacities
for example the storage capacity of warehouses (Kaplan & Anderson, 2007:23).
The TDABC model is a simplified model compared to the ABC model as it allocates
indirect costs directly to the cost objects. Only two sets of estimates are required
neither which are difficult to obtain. The first set of estimates is the calculation of the
cost of supplying resource capacity, for example considering a department responsible
for handling client orders. The TDABC model firstly calculates the cost of all the
resources consumed and needed by this department to operate such as employees,
management, occupancy, equipment and technology. The total cost is divided by the
capacity, i.e. the time employees can actually perform the work is used to obtain the
capacity cost rate (Kaplan & Anderson, 2007:18).
The second set of estimates TDABC requires is the capacity cost rate to allocate the
departmental resource costs to cost objects. This is done by approximating the
demand for resource capacity (usually time) that each cost object needs (Kaplan &
Anderson, 2007:18).
This simplified method of ABC namely TDABC, requires the manager to forecast the
practical capacity of the supplied resources (at a consolidated level) as percentage of
their theoretical total capacity (Szychta, 2010:53).
In addition, TDABC does not need all customer orders to be the identical. It makes
provision for the time estimates to differ on the basis of the varying demands by some
customer orders, such as orders for dangerous goods and urgent orders. The TDABC
model follows the actual processes used to accomplish the work throughout the
organisation. As a result the TDABC system can capture much more complexities
and variations than a conventional ABC model. This can be achieved without
generating a massive and ever increasing demand for data estimates, processing
capabilities or storage. A complex organisation using TDABC can therefore embrace
46
this complexity as opposed to being forced to use basic, simplified and often
inaccurate ABC models (Kaplan & Anderson, 2007:18).
An analysis of the TDABC model done by Szychta (2010:57) reveals that it offers the
following advantages:
1. It overcomes the challenges experienced especially by large entities during the
phases of implementation and maintenance of the conventional ABC model. An
example is that it is no longer a requirement to conduct regular interviews and
surveys with employees to determine the spreading of work time of employees
between numerous activities in a department.
2. The practical capacity of committed resources and resulting costs are estimated
and assigned to activities and in turn to products and services. These costs,
although it constitutes a separate grouping, affects that period’s financial results.
3. It comprises non-standard activities in cost calculation (in the phase of
calculating unit times of practical capacity consumption) by using time
equations.
4. It is much simpler to update to reflect variations in operating conditions on
account of to time equations.
On the other hand, a weakness of this approach is that departmental managers are
responsible for making estimates as input for calculations. If these estimates are too
arbitrary, substantial errors can occur which can lead to inaccurate information about
product costs and -profitability (Szychta, 2010:57).
3.8 Activity-Based Costing in Cash Service Industry
ABC, as a cost allocation tool, has its origins in the manufacturing sector. Most of the
literature on ABC is therefore applied and emphasized in a manufacturing
environment. However, significant economic activity is occurring in the non-
manufacturing environment. It is therefore critical to note that ABC principles are
applicable to all types of business (Ashford, 2011:5). One such type of business is the
service industry. Kaplan and Cooper (1998) found service organisations to be ideal
candidates for ABC, as the majority of their costs are indirect/overhead costs. In
addition, service organisations are more people-intensive than manufacturing
47
organisations. An increased need therefore exist to focus on the countless number of
activities that are performed in order to create customer satisfaction. A critical success
factor in the service industry is therefore to lower the “cost to serve” (Ashford, 2011:5).
The cash services industry, being part of the banking industry, is time conscious, with
the aim of providing the highest value at the lowest cost and at the least amount of
time. Research by Knoetze (2000:36) confirmed that efficiency and effectiveness are
critical in this industry. Efficiency, which are focused on doing things right, controls
the patterns of resources and consumption. Effectiveness, on the other hand, is
focused on doing the right things, which is to generate profit. According to Knoetze
(2000:36) there are two main inhibitors of efficiency and effectiveness, namely cross-
subsidisation among customers and cross-functional internal processes. Cross-
subsidisation adversely affects customer pricing schedules and as a result customer
profitability reporting cannot be relied upon.
In the cash services industry, the pattern is to match competitors’ products without
asking the fundamental question whether the product or relationship is profitable. TCS
only allows for the allocation of direct costs, but obscures a product’s or customer’s
true costs as a majority of the costs in the industry are fixed (Knoetze, 2000:36).
As in service industries, the most important cost is the skilled labour involved in the
production of services, such as the cost of legal, accounting and actuarial teams.
These costs are categorised as service overheads and can be compared to
manufacturing overheads in a factory (Ashford, 2011:6). Skilled labour costs are
considered service overheads as opposed to period cost and need a proper allocation
base if true product or customer profitability is to be determined.
The next section presents the implementation steps of time-driven activity-based
costing.
3.9 Implementation steps of TDABC
Ashford (2011:4) highlighted that to set up an activity-based program involves
identifying and calculating an organisation’s cost drivers and cost buckets. This is
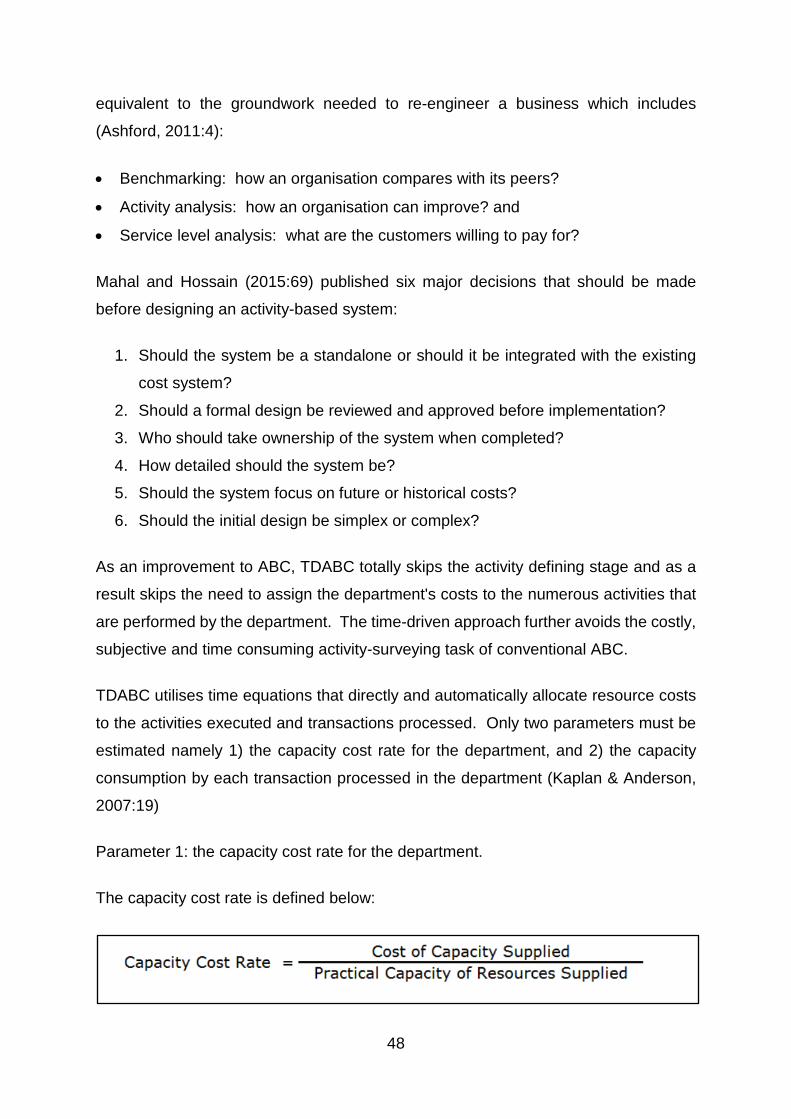
48
equivalent to the groundwork needed to re-engineer a business which includes
(Ashford, 2011:4):
• Benchmarking: how an organisation compares with its peers?
• Activity analysis: how an organisation can improve? and
• Service level analysis: what are the customers willing to pay for?
Mahal and Hossain (2015:69) published six major decisions that should be made
before designing an activity-based system:
1. Should the system be a standalone or should it be integrated with the existing
cost system?
2. Should a formal design be reviewed and approved before implementation?
3. Who should take ownership of the system when completed?
4. How detailed should the system be?
5. Should the system focus on future or historical costs?
6. Should the initial design be simplex or complex?
As an improvement to ABC, TDABC totally skips the activity defining stage and as a
result skips the need to assign the department's costs to the numerous activities that
are performed by the department. The time-driven approach further avoids the costly,
subjective and time consuming activity-surveying task of conventional ABC.
TDABC utilises time equations that directly and automatically allocate resource costs
to the activities executed and transactions processed. Only two parameters must be
estimated namely 1) the capacity cost rate for the department, and 2) the capacity
consumption by each transaction processed in the department (Kaplan & Anderson,
2007:19)
Parameter 1: the capacity cost rate for the department.
The capacity cost rate is defined below:
49
Parameter 2: the capacity consumption by each transaction processed in the
department. In most cases, this is the time taken to perform each transaction.
Conventional ABC uses a cost driver whenever activities, such as machine set-up,
issuing a purchase orders, or processing a customer orders, take about the same
amount of time. TDABC however, replaces cost drivers with estimated time required
to perform each of these transactional activities. The time estimates can be
determined by either conducting interviews with the relevant managers or by direct
observation. Similarly to the estimation of practical capacity, precision is not critical;
and moderate accuracy is acceptable. And different to the percentages that
employees subjectively estimate for a conventional ABC model, the capacity
consumption estimates in a time-driven model can be easily observed and validated
(Kaplan & Anderson, 2007:20).
3.10 Critical Success Factors to implementing Activity-Based Costing
Critical factors for Company A to bear in mind for a successful implementation of either
ABC or TDABC are as follows:
• Management Support A high number of failures of ABC implementations can commonly be attributed to a
lack of top management support and encouragement. When senior management is
committed to the ABC implementation and openly supports it, it is a clear indication to
the project team that their work is valued and it furthermore ensures that the project is
focused on business issues (Wessels & Shotter, 2000:217). The involvement and
support of an organisation’s top management to an implementation project is crucial
as it communicates to the rest of the employees the significance of the system
development.
Rundora (2012:17) added that for an ABC implementation to be successful, top
management must commit to a change in the cost accounting system. They must
understand and embrace benefits that ABC can offer the organisation in establishing
realistic and achievable objectives. The objectives have to be clear and simple so that
it is understandable for all stakeholders.
50
• Adequate employee resources Limited resources is one of major stumbling blocks in the implementation of ABC, and
in many cases has prevented projects from even being started (Wessels & Shotter,
2000:217). In order to be successful, a project team should be able to spend adequate
time on the ABC initiative.
• Coherence with the organisation’s goals and culture
The ABC initiative must be aligned with the strategic goals of the organisation for it to
succeed, if not, it is unlikely that the project team will gather information and buy-in
from the rest of the organisation (Wessels & Shotter, 2000:218).
Research by Rundora (2012:17) identified the following critical success factors and
descriptions to keep in mind when implementing ABC:
• A multi-disciplinary project team should initiate and implement the ABC system in the organisation
The team members have to share similar values and attitudes and be co-operative.
To ensure the success of the project, a knowledgeable and committed project leader
is critical. The individual must have suitable and sufficient experience in project
implementation. The project team is responsible for clearly defining time frames,
actions required and responsibilities. The project should be continuously monitored
to track progress and if required, adjustments must be made so that targets can be
achieved.
A study by Mahal and Hossain (2015:68) confirmed the above finding by Rundora
(2012:17) that a cross-functional team rather than a project team consisting solely of
members of the accounting department should be responsible for the design and
implementation of an ABC system.
• Education and training of employees on ABC The concerned employees of the organisation should be knowledgeable about ABC
so that they can appreciate the complexity of the project and the resulting impact on
the organisation. This will lead to open communication and better cooperation for
implementing ABC in a cost-effective manner.
51
• Access to outside expertise
Access to outside expertise is critical when new software and concepts have been
developed. The expertise available at the local educational institutions could be
invaluable.
• On-going feedback There should be on-going and constant feedback from the ABC project implementation
team to top management and to lower level employees alike on the progress of the
implementation of the ABC project.
• Implementation Implementation should be simplified as much as possible. It could perhaps firstly be
introduced as a pilot project.
Critical success factors have been studied and put in place in anticipation of the
implementation of ABC. The management of Company A is the driving force behind
the change from TCS to TDABC, and as a result all the financial and technical
resources required for a successful implementation have been adequately provided.
The implementation of ABC was prepared with special care to ensure maximum
beneficiation for Company A.
3.11 Summary
The aim of this chapter was to address the second secondary objective, as set in
Chapter 1 (section 1.3.2, page 10), namely the reviewing of existing literature on the
fundamentals of cost allocation, traditional costing methods (TCM) and activity-based
costing (ABC), as well as the emergence of time-driven activity-based costing
(TDABC).
It was highlighted that, although TCS is cheaper and easier to implement and maintain,
it does not offer much in terms of optimising cost usage, reducing process waste and
errors, ensuring quality management and thereby offering reliable service level
management. It was these shortcomings that led to the emergence of alternative
costing models such as ABC.
52
ABC allocates costs based on cost-and-effect relationship. It is this process which
enables the classification of more costs as direct in order to reduce the number of
indirect cost pools and to accurately identify cost drivers, making cost allocation more
accurate.
The benefits that can be derived from implementing ABC can be summarised as
follows: more accurate allocation of overhead costs based on the actual consumption
of the resources; recognition of cost drivers and activities; enabling management to
see where the most important costs occur as well as what caused the costs to be
incurred; improves pricing, marketing, product design and product mix - as a result
leading to better decision making.
Challenges in the costly and cumbersome way of collecting data has seen the
emergence of TDABC. TDABC uses time as primary cost driver. It is the usage of
time as the principal measure of operating capacity of processes and duration of
activities in an organisation that makes TDABC suitable for application in service
entities.
Company A is implementing TDABC with the aim of performance improvement, which
is evident in terms of time, cost, and quality. Activity-based information also allows
managers to identify and eliminate non-value adding activities, and thus improve cost
of quality.
The next chapter presents the empirical study, which follows a case study approach.
53
CHAPTER 4
4 DEVELOPMENT OF AN ACTIVITY-DRIVEN FRAMEWORK
4.1 Introduction
The aim of this chapter is to address the third secondary objective as set in Chapter 1
(refer section 1.3.2, page 10). This chapter aims to develop an activity-driven costing
framework for Company A for improved product pricing and costing decisions. The
data used to develop the framework was collected by conducting face-to-face
interviews with managers of the eight business support services departments.
Documents archived and ERP systems were analysed for further data collection. The
empirical study is presented in line with Figure 4.1.
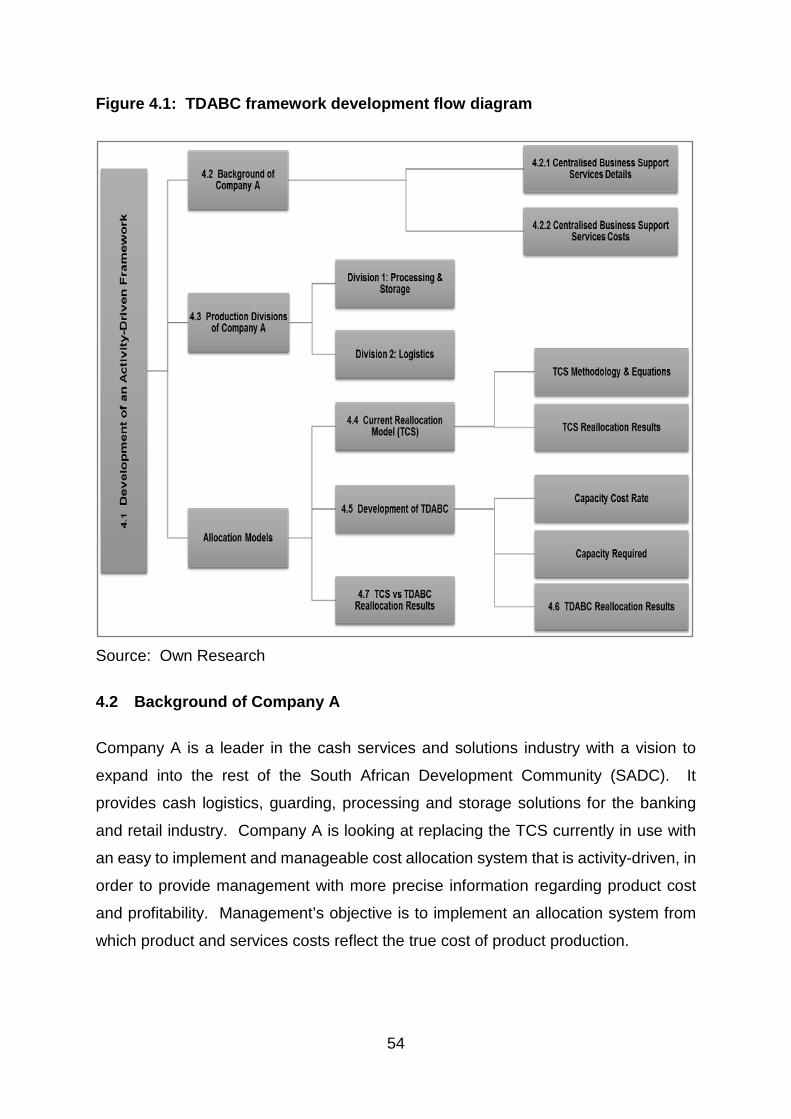
54
Figure 4.1: TDABC framework development flow diagram
Source: Own Research
4.2 Background of Company A
Company A is a leader in the cash services and solutions industry with a vision to
expand into the rest of the South African Development Community (SADC). It
provides cash logistics, guarding, processing and storage solutions for the banking
and retail industry. Company A is looking at replacing the TCS currently in use with
an easy to implement and manageable cost allocation system that is activity-driven, in
order to provide management with more precise information regarding product cost
and profitability. Management’s objective is to implement an allocation system from
which product and services costs reflect the true cost of product production.
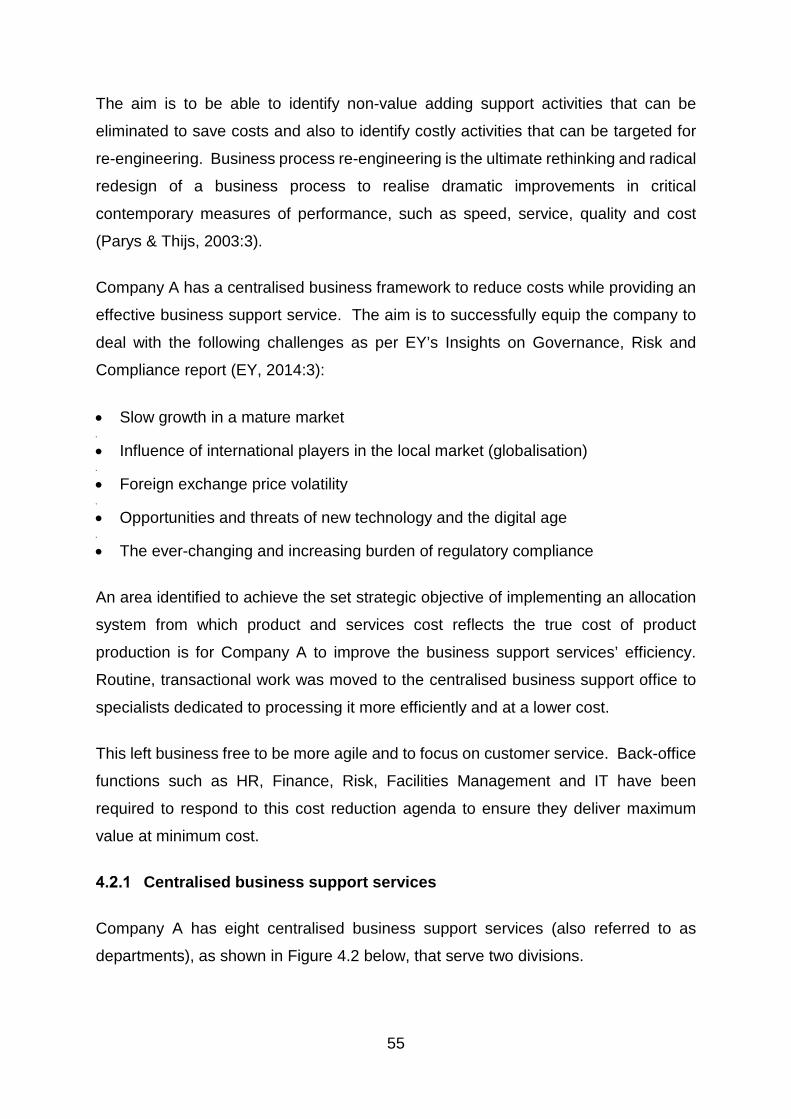
55
The aim is to be able to identify non-value adding support activities that can be
eliminated to save costs and also to identify costly activities that can be targeted for
re-engineering. Business process re-engineering is the ultimate rethinking and radical
redesign of a business process to realise dramatic improvements in critical
contemporary measures of performance, such as speed, service, quality and cost
(Parys & Thijs, 2003:3).
Company A has a centralised business framework to reduce costs while providing an
effective business support service. The aim is to successfully equip the company to
deal with the following challenges as per EY’s Insights on Governance, Risk and
Compliance report (EY, 2014:3):
• Slow growth in a mature market •
• Influence of international players in the local market (globalisation) •
• Foreign exchange price volatility •
• Opportunities and threats of new technology and the digital age •
• The ever-changing and increasing burden of regulatory compliance
An area identified to achieve the set strategic objective of implementing an allocation
system from which product and services cost reflects the true cost of product
production is for Company A to improve the business support services’ efficiency.
Routine, transactional work was moved to the centralised business support office to
specialists dedicated to processing it more efficiently and at a lower cost.
This left business free to be more agile and to focus on customer service. Back-office
functions such as HR, Finance, Risk, Facilities Management and IT have been
required to respond to this cost reduction agenda to ensure they deliver maximum
value at minimum cost.
Centralised business support services
Company A has eight centralised business support services (also referred to as
departments), as shown in Figure 4.2 below, that serve two divisions.
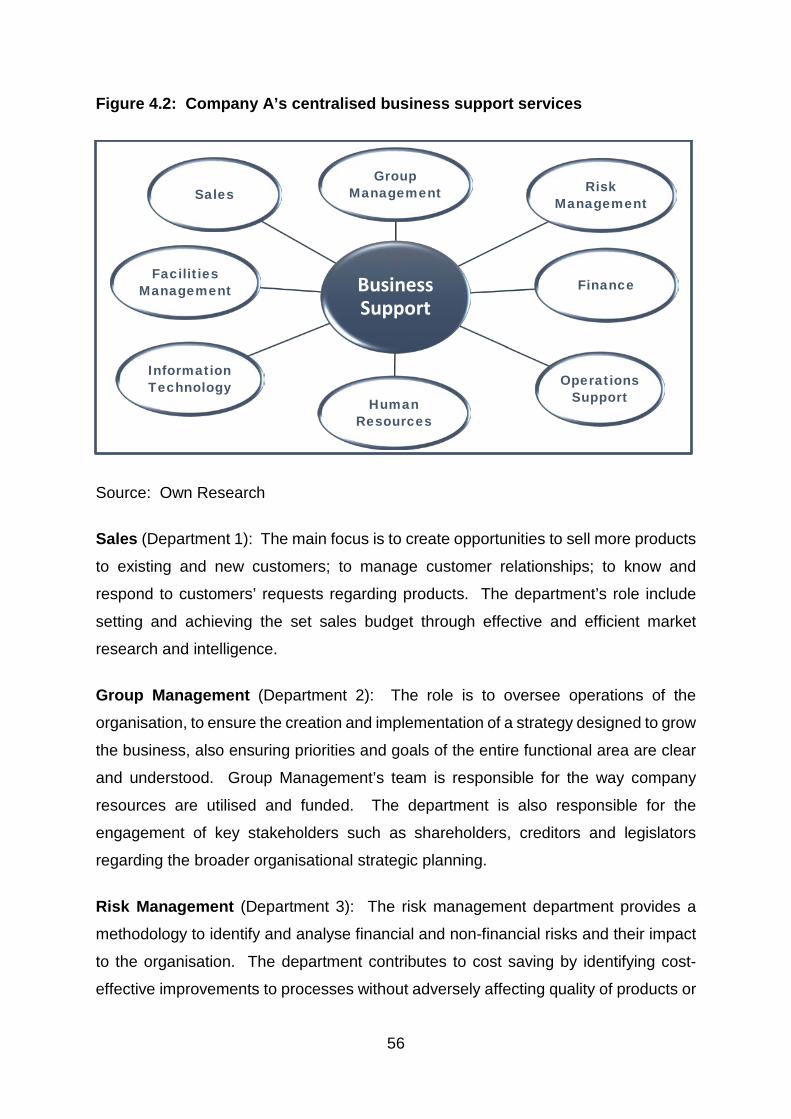
56
Figure 4.2: Company A’s centralised business support services
Source: Own Research
Sales (Department 1): The main focus is to create opportunities to sell more products
to existing and new customers; to manage customer relationships; to know and
respond to customers’ requests regarding products. The department’s role include
setting and achieving the set sales budget through effective and efficient market
research and intelligence.
Group Management (Department 2): The role is to oversee operations of the
organisation, to ensure the creation and implementation of a strategy designed to grow
the business, also ensuring priorities and goals of the entire functional area are clear
and understood. Group Management’s team is responsible for the way company
resources are utilised and funded. The department is also responsible for the
engagement of key stakeholders such as shareholders, creditors and legislators
regarding the broader organisational strategic planning.
Risk Management (Department 3): The risk management department provides a
methodology to identify and analyse financial and non-financial risks and their impact
to the organisation. The department contributes to cost saving by identifying cost-
effective improvements to processes without adversely affecting quality of products or
Business Support
Group Management Risk
Management
Finance
Operations SupportHuman
Resources
Information Technology
Facilities Management
Sales

57
client relationships. It also puts in place responses to risks that could adversely affect
the business. Methods to mitigate identified risks include risk transfer, avoidance,
elimination or control of risk through policies, procedures and guidelines.
Finance (Department 4): The department provides a cost control function and the
associated reporting thereof. The department ensures that customers are invoiced
and debtors collected timeously so not to adversely affect cash flow. It sets up treasury
management policies to guide all those who deal with cash or cash equivalents. The
finance department oversees the management of fixed assets and ensures that
corporate tax and other financial legislative requirements are met. The department is
also responsible for the employee payroll and ensures employees are paid timely and
accurately.
Operations Support (Department 5): This centralised department supports all other
departments to ensure standardisation across the company. The department
analyses operational malfunctions, provides solutions and implement these solutions
across the company. It addresses escalated issues from other businesses and adjust
policies and procedures accordingly in order to address any shortfalls identified. It
furthermore recommends process improvements to improve operational efficiency and
cost-effectiveness.
Human Resources (Department 6): The human resources department manages the
recruiting of permanent and temporary staff. Responsibilities include screening,
conducting interviews, administering skills assessment and personality tests to match
candidates with the right positions within the company. The department develops
training programmes and conducts training for new recruits and existing employees
alike. The department maintains the relationship between management and its
employees by encouraging communication and fairness within the organisation.
The department also manages disagreements between employees and management,
as well as between the management and labour unions or employee rights
organisations. Moreover, the department is responsible for the interpretation and
enforcement of labour and employment laws such as, the basic conditions of
employment, equal employment opportunity, reasonable labour standards, benefits
and as well as working hour requirements.

58
Information Technology (Department 7): The information technology department is
responsible for the hardware, software, architecture and networking of computers in
Company A. The department is responsible for creating new programs for the
organisation, collaborating with outsourced programming specialists to create
programs that would address the needs of the organisation, such as an application to
manage human resources, tracking and tracing packed stock, processing work orders
- to name only a few.
Duties include installing and setting up the computer network in the company, ensuring
that the network is operating well and that all employees are able to communicate
through the internet and company intranet. Lastly, the IT help desk provides support
to computer users within the company. This includes installing new software, repairing
or installing hardware, troubleshooting of problems and training employees how to use
new software programs.
Facilities Management (Department 8): This department is in charge of the
management of the premises. Responsibilities include building and grounds
maintenance and the management of the procurement and contracts of these
services, ensuring that buildings meet the health and safety requirements as set in
legislation. The department also ensures effective and efficient space management
and utilities usage.
The next section discusses the costs of these eight business support services
departments.
Centralised business support services costs
The next step in the presentation of the empirical results is to outline the centralised
business support services costs. In order to provide business support services by the
eight departments discussed in the previous section, Company A incurred actual costs
in excess of R 760 million for the 2017 financial year. This cost is anticipated to
increase by 11.4% for the 2018 financial year. Business support services accounts
for a significant 25.6% of total expenditure of Company A, which must be allocated
and absorbed by products and services.
59
The accuracy of product and services pricing is reliant on the accurate allocation of
business support services, an allocation based on consumption of the resource.
Below is the cost of business support services broken down into departments, as
shown in Table 4.1:
Table 4.1: Annual business support services cost
Source: Own Research
A further analysis of the total business support office costs indicates that staff costs
account for close to three fifths of the centralised services’ annual expenditure (refer
Figure 4.3). This is in line with the main purpose of the office which is to be run by
experts and specialists in the industry. The staffing costs include employees’ salaries,
staff training and travel costs.
Premises costs are costs incurred for the accommodation of the centralised business
support services. The grouping of costs include the office rental, utilities, telephone,
cleaning and security. Vehicles costs are incurred as a result of the provision and
usage of company cars. Fixed assets are the annual amortisation of assets including
printers, laptops, database servers, furniture and presentation equipment.
2017 2018Actuals Budget
Business Support Services 760 052 758 847 044 617 Sales 43 403 908 44 871 634 Group Management 48 598 591 26 150 957 Risk Management 69 099 098 65 030 789 Finance 131 859 035 141 872 140 Operations Support 200 326 888 281 555 030 Human Resources 70 886 989 90 244 917 Information Technology 176 093 093 166 078 350 Facilities Management 19 785 157 31 240 800
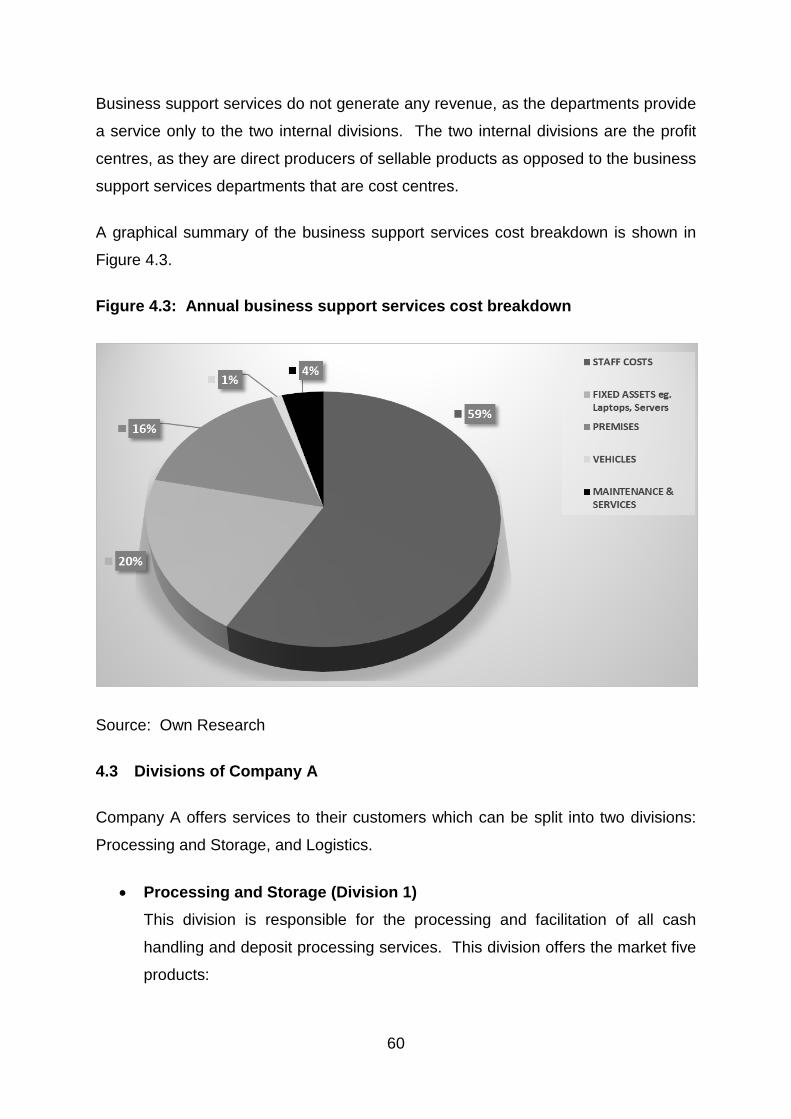
60
Business support services do not generate any revenue, as the departments provide
a service only to the two internal divisions. The two internal divisions are the profit
centres, as they are direct producers of sellable products as opposed to the business
support services departments that are cost centres.
A graphical summary of the business support services cost breakdown is shown in
Figure 4.3.
Figure 4.3: Annual business support services cost breakdown
Source: Own Research
4.3 Divisions of Company A
Company A offers services to their customers which can be split into two divisions:
Processing and Storage, and Logistics.
• Processing and Storage (Division 1) This division is responsible for the processing and facilitation of all cash
handling and deposit processing services. This division offers the market five
products:
61
Processing & packing of cash
Notes sorting
Coin management
Solutions for foreign currency
Retail cash deposit processing
• Logistics (Division 2) The division is responsible for the physical transfer of items of high monetary
value from one location to another, using armoured, satellite tracked vehicles
and armed guards. This division offers the market three products:
Cash in transit
Guarding for bank branches
ATM solutions
As mentioned above, Company A has a strategic objective to dominate the SADC
markets. This vision makes it imperative to understand which division activities and
products drive the business support service costs and to what degree. This
consumption rate has a direct impact on product pricing. Moreover, for product pricing
to be accurate and competitive, it should reflect the costs that the division utilises.
This knowledge is key for management decision making, including: 1) which products
to produce and which to terminate, and 2) determining customer profitability and which
customers require intervention.
Figure 4.4 shows the current two-step process of business support services cost
allocation to products.

62
Figure 4.4: Company A’s business support services cost reallocation model
Source: Own Research
4.4 Company A’s current allocation model
As indicated in Figure 4.1, the next section highlights Company A’s current allocation
model. Currently business support services costs are arbitrarily allocated to the two
divisions using revenue earned by each division as the basis for the allocation. The
division that therefore generates the most revenue carries the majority of the business
support services costs.
This system can therefore inaccurately reflect the resource consumption rate of
divisions, and as a result products can be inaccurately priced - hampering product
marketability.
Currently the allocation of the business support services cost are done in two stages:
1. Firstly, the revenue earned by a division is divided by the total revenue earned
by Company A, to obtain a percentage.
Business Support Services Costs
Division 1 Division 2
Dept 1 Dept 2 Dept 3 Dept 4 Dept 5 Dept 7Dept 6 Dept 8
Product 1 Product 2 Product 2Product 1Product 3
Product 4 Product 5
Product 3

63
2. Secondly, the percentage calculated in the step above is used to calculate the
portion of business support services costs that the division will absorb. These
are the costs that will be passed onto the products produced by the division.
Figure 4.5: Business support services reallocation equations
Source: Own Research
Company A operates in a mature market, the calculated percentage is relatively
stable. The allocated percentage for the 2017 costs incurred (refer Table 4.1, page
54) is shown in Table 4.2:
% of Costs =
= Support Services Costs
Division's Revenue
Company A's Revenue
Second Stage
First Stage
Costs Reallocated X% Result from
1st Stage
Support Services Costs
Division 1 Division 2
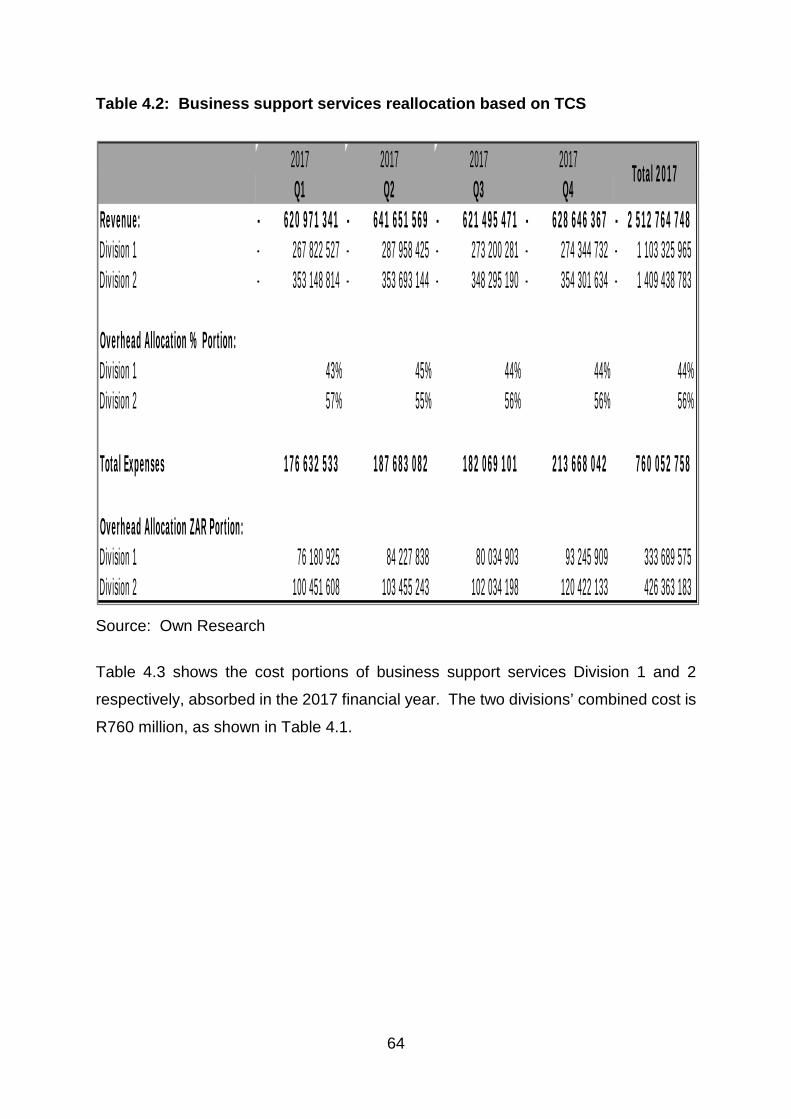
64
Table 4.2: Business support services reallocation based on TCS
Source: Own Research
Table 4.3 shows the cost portions of business support services Division 1 and 2
respectively, absorbed in the 2017 financial year. The two divisions’ combined cost is
R760 million, as shown in Table 4.1.
2017 2017 2017 2017Q1 Q2 Q3 Q4
Revenue: 620 971 341- 641 651 569- 621 495 471- 628 646 367- 2 512 764 748- Division 1 267 822 527- 287 958 425- 273 200 281- 274 344 732- 1 103 325 965- Division 2 353 148 814- 353 693 144- 348 295 190- 354 301 634- 1 409 438 783-
Overhead Allocation % Portion:Division 1 43% 45% 44% 44% 44%Division 2 57% 55% 56% 56% 56%
Total Expenses 176 632 533 187 683 082 182 069 101 213 668 042 760 052 758
Overhead Allocation ZAR Portion:Division 1 76 180 925 84 227 838 80 034 903 93 245 909 333 689 575 Division 2 100 451 608 103 455 243 102 034 198 120 422 133 426 363 183
Total 2017
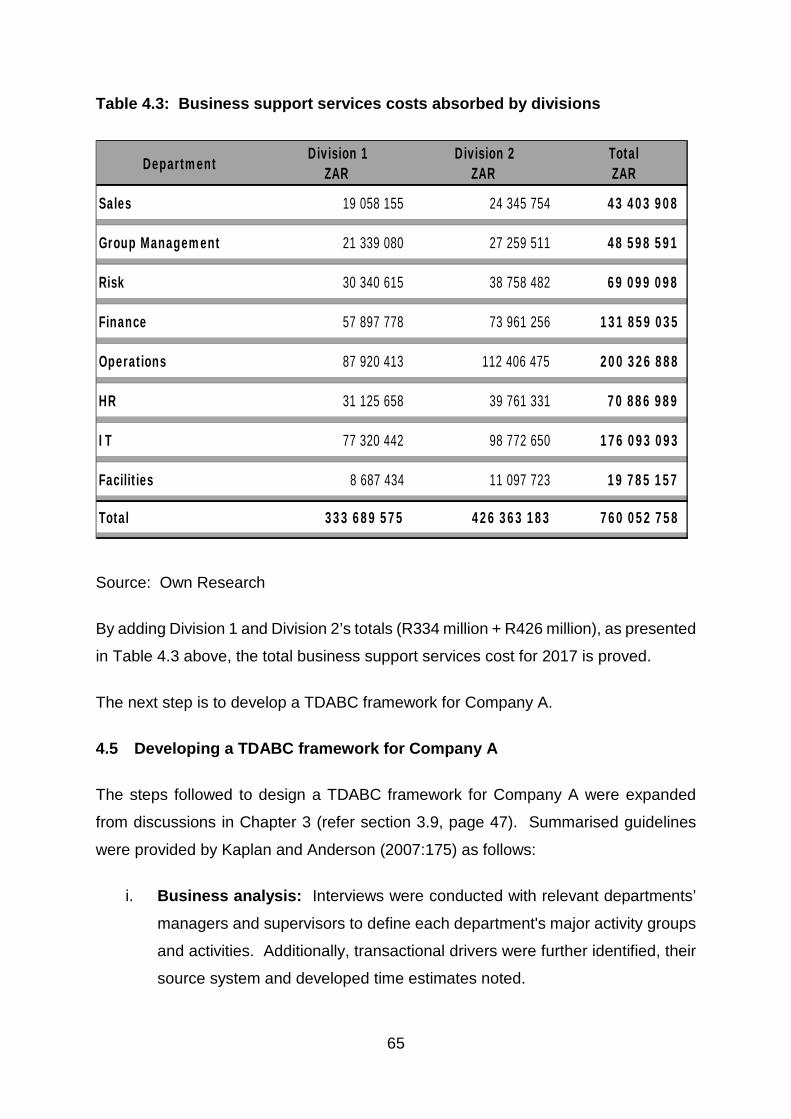
65
Table 4.3: Business support services costs absorbed by divisions
Source: Own Research
By adding Division 1 and Division 2’s totals (R334 million + R426 million), as presented
in Table 4.3 above, the total business support services cost for 2017 is proved.
The next step is to develop a TDABC framework for Company A.
4.5 Developing a TDABC framework for Company A
The steps followed to design a TDABC framework for Company A were expanded
from discussions in Chapter 3 (refer section 3.9, page 47). Summarised guidelines
were provided by Kaplan and Anderson (2007:175) as follows:
i. Business analysis: Interviews were conducted with relevant departments’
managers and supervisors to define each department's major activity groups
and activities. Additionally, transactional drivers were further identified, their
source system and developed time estimates noted.
Department Division 1ZAR
Division 2ZAR
Total ZAR
Sales 19 058 155 24 345 754 43 403 908
Group Management 21 339 080 27 259 511 48 598 591
Risk 30 340 615 38 758 482 69 099 098
Finance 57 897 778 73 961 256 131 859 035
Operations 87 920 413 112 406 475 200 326 888
HR 31 125 658 39 761 331 70 886 989
IT 77 320 442 98 772 650 176 093 093
Facilities 8 687 434 11 097 723 19 785 157
Total 333 689 575 426 363 183 760 052 758
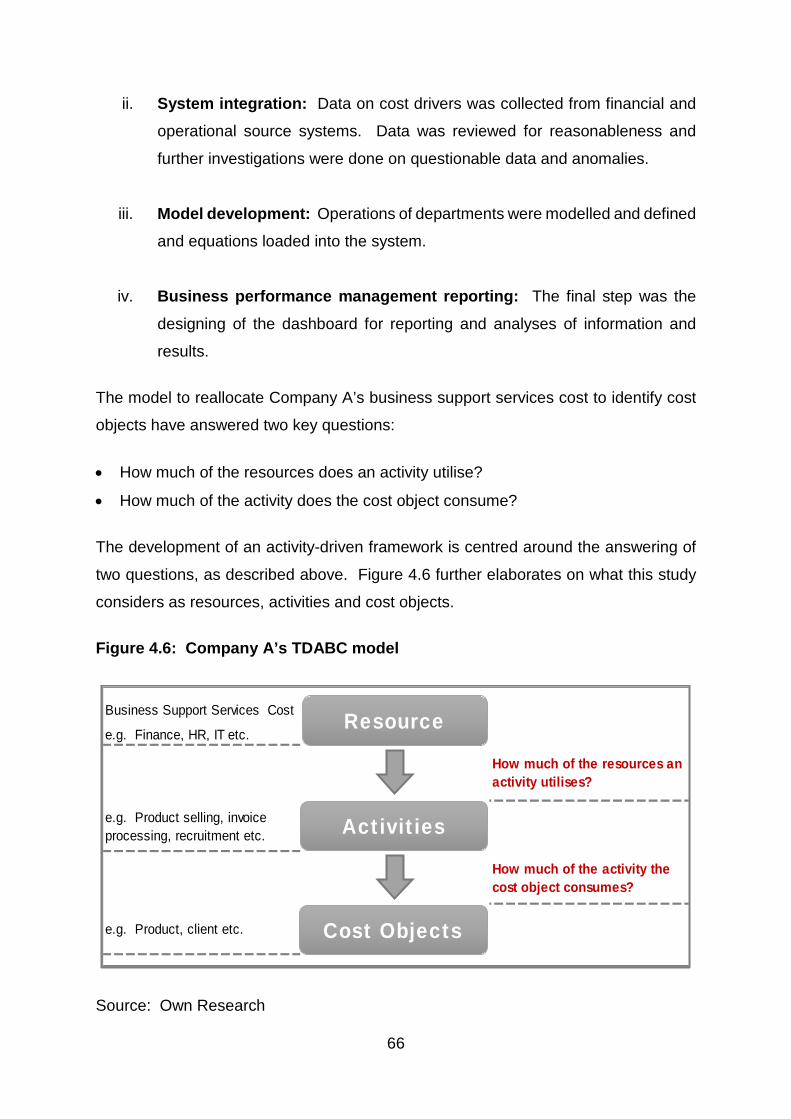
66
ii. System integration: Data on cost drivers was collected from financial and
operational source systems. Data was reviewed for reasonableness and
further investigations were done on questionable data and anomalies.
iii. Model development: Operations of departments were modelled and defined
and equations loaded into the system.
iv. Business performance management reporting: The final step was the
designing of the dashboard for reporting and analyses of information and
results.
The model to reallocate Company A’s business support services cost to identify cost
objects have answered two key questions:
• How much of the resources does an activity utilise?
• How much of the activity does the cost object consume?
The development of an activity-driven framework is centred around the answering of
two questions, as described above. Figure 4.6 further elaborates on what this study
considers as resources, activities and cost objects.
Figure 4.6: Company A’s TDABC model
Source: Own Research
Business Support Services Cost
e.g. Finance, HR, IT etc.
How much of the activity the cost object consumes?
How much of the resources an activity utilises?
e.g. Product selling, invoice processing, recruitment etc.
e.g. Product, client etc.
Resource
Activities
Cost Objects

67
Capacity cost rate
As explained in Chapter 3 (refer section 3.9, page 47), the two parameters needed to
allocate overhead costs, or in this case the business support services cost, are: 1) the
capacity cost rate for the department, and 2) the capacity usage by each activity
processed in the department. The capacity cost rate was first to be determined.
The capacity cost rate equation (as presented in Chapter 3, page 47) is summarised
as follows:
The cost of capacity, i.e. the total business support services cost as reflected in
Table 4.1 (page 59), was sourced from Company A’s enterprise resource planning
(ERP) system.
Secondly, the practical capacity of resources supplied was determined by calculating
the practical capacity of the employees and departments of Company A. The
employees’ number of working days per month were therefore translated to hours.
Employees at Company A’s business support services’ office work a 9 hour day in line
with the South African Basic Conditions of Employment Act (BCEA). The equation
used to calculate employee capacity is shown below, while the result of the
calculations is reflected in Table 4.4.
Employee capacity equation:
Employee Capacity = No. of Working Days in a month X Working Hrs per Day
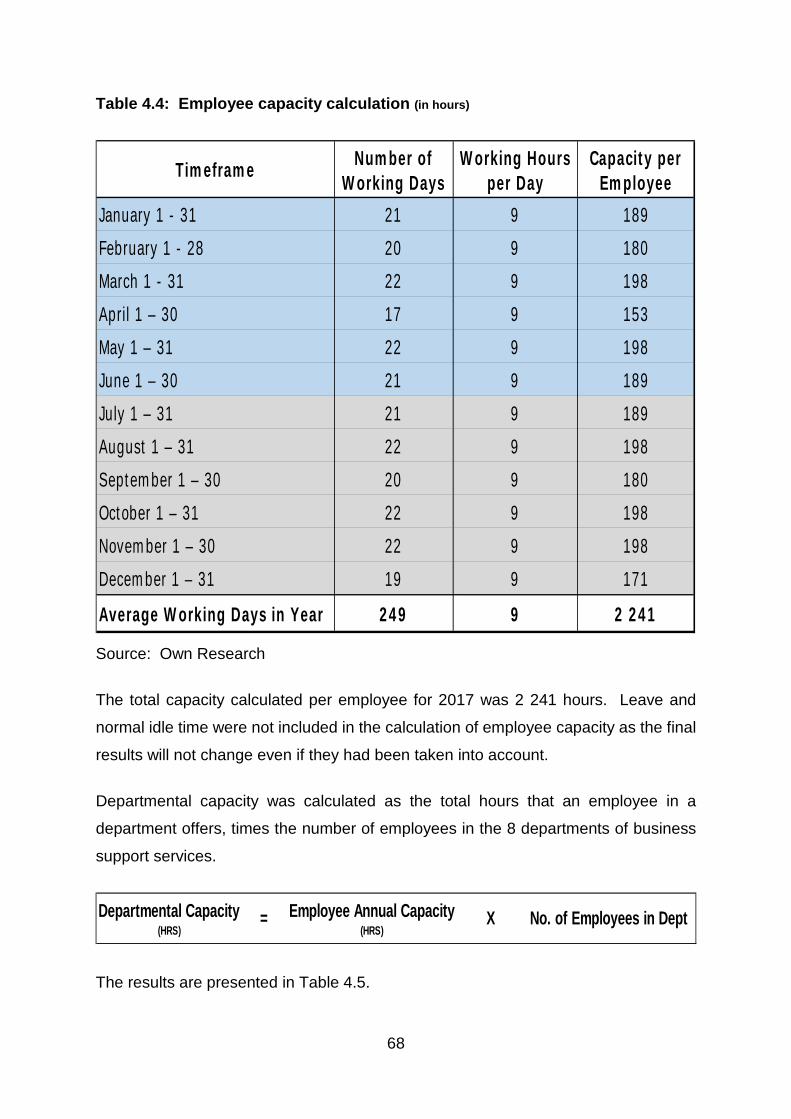
68
Table 4.4: Employee capacity calculation (in hours)
Source: Own Research
The total capacity calculated per employee for 2017 was 2 241 hours. Leave and
normal idle time were not included in the calculation of employee capacity as the final
results will not change even if they had been taken into account.
Departmental capacity was calculated as the total hours that an employee in a
department offers, times the number of employees in the 8 departments of business
support services.
The results are presented in Table 4.5.
Timeframe Number of Working Days
Working Hours per Day
Capacity per Employee
January 1 - 31 21 9 189February 1 - 28 20 9 180March 1 - 31 22 9 198April 1 – 30 17 9 153May 1 – 31 22 9 198June 1 – 30 21 9 189July 1 – 31 21 9 189August 1 – 31 22 9 198September 1 – 30 20 9 180October 1 – 31 22 9 198November 1 – 30 22 9 198December 1 – 31 19 9 171
Average Working Days in Year 249 9 2 241
Departmental Capacity(HRS)
= Employee Annual Capacity (HRS)
X No. of Employees in Dept

69
Table 4.5: Departmental capacity calculation (in hours)
Source: Own Research
The group management costs are the highest, as their remuneration is higher due to
their specialised skills. See below for departmental cost rate equation and calculation
results:
The departmental cost rate per hour is reflected in Table 4.6 on the next page. The
cost of capacity is sourced from the ERP system of Company A, as reflected in the
business support services cost in Table 4.1 (refer page 59), while the departmental
practical capacity is reflected in Table 4.5.
Department Av Employee Capacity
No. of Employees
Dept Practical Capacity
SOSales 2 241 38 85 158Group Management 2 241 6 13 446Risk Management 2 241 101 226 341Finance 2 241 70 156 870Operations Support 2 241 168 376 148Human Resources 2 241 146 327 526Information Technology 2 241 43 96 363Facilities Management 2 241 9 20 169
Capacity Cost Rate = Cost of capacity / Dept Annual Capacity (HRS)
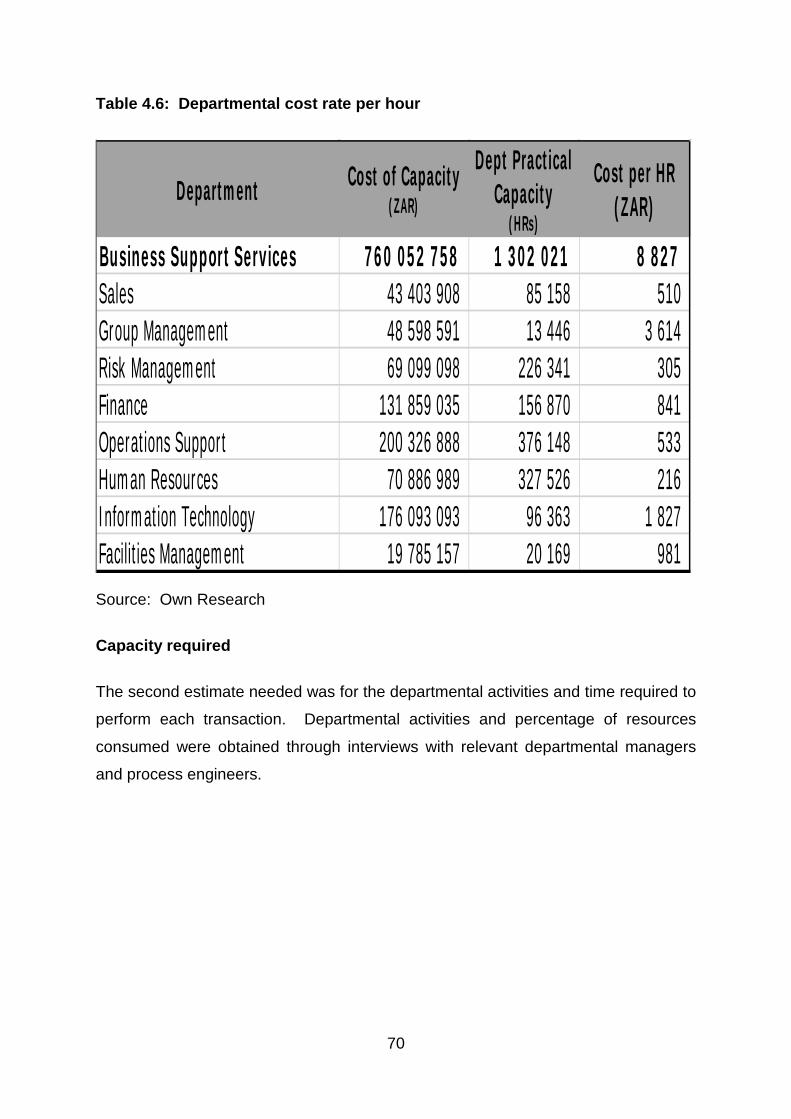
70
Table 4.6: Departmental cost rate per hour
Source: Own Research
Capacity required
The second estimate needed was for the departmental activities and time required to
perform each transaction. Departmental activities and percentage of resources
consumed were obtained through interviews with relevant departmental managers
and process engineers.
Department Cost of Capacity (ZAR)
Dept Practical Capacity
(HRs)
Cost per HR(ZAR)
Business Support Services 760 052 758 1 302 021 8 827 Sales 43 403 908 85 158 510 Group Management 48 598 591 13 446 3 614 Risk Management 69 099 098 226 341 305 Finance 131 859 035 156 870 841 Operations Support 200 326 888 376 148 533 Human Resources 70 886 989 327 526 216 Information Technology 176 093 093 96 363 1 827 Facilities Management 19 785 157 20 169 981
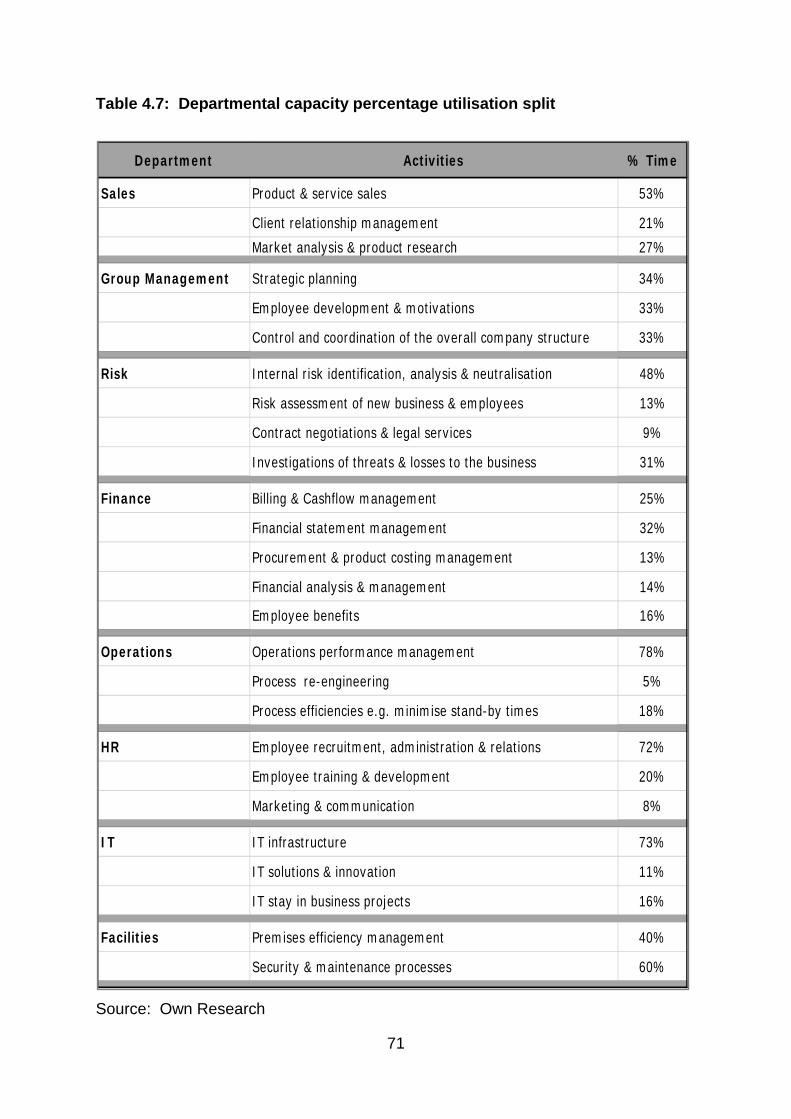
71
Table 4.7: Departmental capacity percentage utilisation split
Source: Own Research
Department Activities % Time
Sales Product & service sales 53%
Client relationship management 21%Market analysis & product research 27%
Group Management Strategic planning 34%
Employee development & motivations 33%
Control and coordination of the overall company structure 33%
Risk Internal risk identification, analysis & neutralisation 48%
Risk assessment of new business & employees 13%
Contract negotiations & legal services 9%
Investigations of threats & losses to the business 31%
Finance Billing & Cashflow management 25%
Financial statement management 32%
Procurement & product costing management 13%
Financial analysis & management 14%
Employee benefits 16%
Operations Operations performance management 78%
Process re-engineering 5%
Process efficiencies e.g. minimise stand-by times 18%
HR Employee recruitment, administration & relations 72%
Employee training & development 20%
Marketing & communication 8%
IT IT infrastructure 73%
IT solutions & innovation 11%
IT stay in business projects 16%
Facilities Premises efficiency management 40%
Security & maintenance processes 60%
72
4.6 TDABC framework for Company A
The TDABC model was developed as follows:
• Firstly: The major departmental activities were identified. Thereafter each activity
was allocated a percentage of the capacity it utilises.
• Secondly: The departmental activities resource consumption calculated above
was further divided between the two divisions, again according to their
consumption.
• Thirdly: The allocated time was multiplied by the departmental cost rate calculated
in Figure 4.11 above. Results on the next page.
The departmental activity and utilisation identification (as reflected in Table 4.8) is a
result of the face-to-face interviews conducted with the relevant departmental
managers and the analysis of audited financial transactions and / or departmental
registers of work performed.

73
Table 4.8: Divisional capacity % utilisation
Source: Own Research
Department Activities Basis of Split Division 1 % Division 2 %
Sales Product & service sales Division client serviced 0% 100%
Client relationship management Manager interview 50% 50%
Market analysis & product research Manager interview 30% 70%
Group Management Strategic planning Manager interview 50% 50%
Employee development & motivations Manager interview 50% 50%Control and coordination of the overall company structure Manager interview 50% 50%
Risk Internal risk identification, analysis & neutralisation Internal audit plan 46% 54%
Risk assessment of new business & employees Average number of assessments registered 50% 50%
Contract negotiations & legal services Manager interview 50% 50%
Investigations of threats & losses to the business Incidents register 10% 90%
Finance Billing & Cashflow management Invoices processed in the ERP system 62% 38%
Financial statement management No. of transaction processed monthly in the ERP 45% 55%
Procurement & product costing management No. of procurement transaction in the ERP syst 60% 40%
Financial analysis & management Manager interview 50% 50%
Employee benefits No. of Employees 35% 65%
Operations Division 1's performance management Manager interview 56% 44%
Division 2's performance management Manager interview 100% 0%
HR Employee recruitment, administration & relations Manager interview 40% 60%
Employee training & development No. of Employees 35% 65%
Marketing & communication Manager interview 50% 50%
IT IT infrastructure Audited industry register 70% 30%
IT solutions & innovation Manager interview 60% 40%
IT stay in business projects Manager interview 60% 40%
Facilities Premises efficiency management No of centres 80% 20%
Security & maintenance processes Manager interview 50% 50%
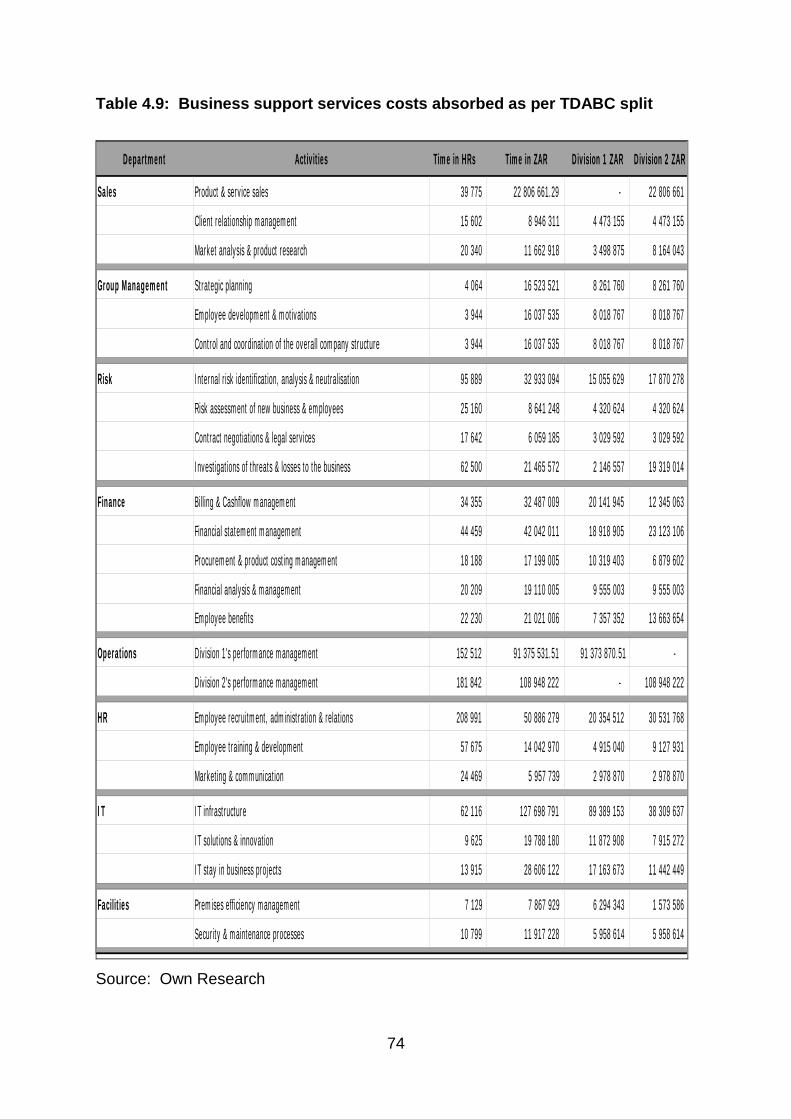
74
Table 4.9: Business support services costs absorbed as per TDABC split
Source: Own Research
Department Activities Time in HRs Time in ZAR Division 1 ZAR Division 2 ZAR
Sales Product & service sales 39 775 22 806 661.29 - 22 806 661
Client relationship management 15 602 8 946 311 4 473 155 4 473 155
Market analysis & product research 20 340 11 662 918 3 498 875 8 164 043
Group Management Strategic planning 4 064 16 523 521 8 261 760 8 261 760
Employee development & motivations 3 944 16 037 535 8 018 767 8 018 767
Control and coordination of the overall company structure 3 944 16 037 535 8 018 767 8 018 767
Risk Internal risk identification, analysis & neutralisation 95 889 32 933 094 15 055 629 17 870 278
Risk assessment of new business & employees 25 160 8 641 248 4 320 624 4 320 624
Contract negotiations & legal services 17 642 6 059 185 3 029 592 3 029 592
Investigations of threats & losses to the business 62 500 21 465 572 2 146 557 19 319 014
Finance Billing & Cashflow management 34 355 32 487 009 20 141 945 12 345 063
Financial statement management 44 459 42 042 011 18 918 905 23 123 106
Procurement & product costing management 18 188 17 199 005 10 319 403 6 879 602
Financial analysis & management 20 209 19 110 005 9 555 003 9 555 003
Employee benefits 22 230 21 021 006 7 357 352 13 663 654
Operations Division 1's performance management 152 512 91 375 531.51 91 373 870.51 -
Division 2's performance management 181 842 108 948 222 - 108 948 222
HR Employee recruitment, administration & relations 208 991 50 886 279 20 354 512 30 531 768
Employee training & development 57 675 14 042 970 4 915 040 9 127 931
Marketing & communication 24 469 5 957 739 2 978 870 2 978 870
IT IT infrastructure 62 116 127 698 791 89 389 153 38 309 637
IT solutions & innovation 9 625 19 788 180 11 872 908 7 915 272
IT stay in business projects 13 915 28 606 122 17 163 673 11 442 449
Facilities Premises efficiency management 7 129 7 867 929 6 294 343 1 573 586
Security & maintenance processes 10 799 11 917 228 5 958 614 5 958 614

75
4.7 TCS vs TDABC
The allocation of business support services cost between Division 1 and Division 2,
using the two cost allocation methods of TCS and TDABC, resulted in a variance of
R40 million between the two divisions. Alternatively it can be said that the results
indicate that there is a R40 million cross subsidisation between Company A’s two
divisions (refer to Table 4.9, p 74). Division 1 is absorbing 5% less costs than it utilises
to produce its five products. This definitely affects managements’ decisions, as
product and client profitability are distorted, leading to inaccurate product pricing and
expansion decisions. This finding is in line with what Peter Drucker found in 1963, as
cited by Cardos and Pete (2011:155). He posited that traditional costing systems often
lead to cross subsidisation between products.
Table 4.10: Variance between two cost allocation models
Source: Own Research
In the current cost allocation model used by Company A, Division 1 carries 44% of
business support services costs (driven by an arbitrary allocation), which is in turn
reallocated to the products produced by this division. The R333.7 million is absorbed
into product cost, resulting in its effect on products price and marketability.
It was determined that the highest under-recovered business support services
department is IT, which is mainly driven by Division 1’s heavy reliance on technology.
This is slightly offset by reduction in sales costs, as Division 1 specialises in few bulk
customers. Expansion in Division 1 is predominantly current customers utilising more
of the current or new services.
Department Current ModelZAR
TDABC ModelZAR Variance ZAR
Division 1 333 689 575 373 417 319 (39 727 744)
Division 2 426 363 183 386 635 438 39 727 744
Total 760 052 758 760 052 758 -

76
From the results it is clear that the expansion of Division’s 1 products could result in
losses, as product prices currently set will be inadequate to cover costs - resulting in
increase in business support services such as the IT department’s costs, e.g. number
of users and increase in servers.
Table 4.11 reflects the detailed analysis per department of variances in Division 1.
Table 4.11: Division 1’s variances analysis
Source: Own Research
On the other hand, Division 2 carries 56% of business support services costs.
According to the current traditional methodology, this cost is then reallocated to the 3
products produced by this division. The R426.4million is absorbed into product,
overstating the cost of producing these products, resulting in high prices and rendering
the company uncompetitive in the market.
Division 2’s products are overpriced. Management strategy might be to divest from
this market as they might consider Company A not being the lowest cost producer in
Division 1Department Current Model
ZAR TDABC Model
ZAR Variance ZAR
Sales 19 058 155 7 972 031 11 086 124
Group Management 21 339 080 24 299 295 (2 960 216)
Risk 30 340 615 24 552 403 5 788 213
Finance 57 897 778 66 292 607 (8 394 829)
Operations 87 920 413 91 373 871 (3 453 457)
HR 31 125 658 28 248 421 2 877 237
IT 77 320 442 118 425 735 (41 105 292)
Facilities 8 687 434 12 252 957 (3 565 523)
Total 333 689 575 373 417 319 (39 727 745)

77
the industry. Such a decision will be devastating, as Division 2 is currently subsidising
business support services cost by over 5%. However, an expansion could drive
profitability of clients and Company A.
Table 4.12: Division 2’s variances analysis
Source: Own Research
The chapter is concluded with a summary of Chapter 4.
Division 2Department Current Model
ZAR TDABC Model
ZAR Variance ZAR
Sales 24 345 754 35 443 859 (11 098 105)
Group Management 27 259 511 24 299 295 2 960 216
Risk 38 758 482 44 539 509 (5 781 027)
Finance 73 961 256 65 566 427 8 394 829
Operations 112 406 475 108 948 222 3 458 253
HR 39 761 331 42 638 568 (2 877 237)
IT 98 772 650 57 667 358 41 105 292
Facilities 11 097 723 7 532 200 3 565 523
Total 426 363 183 386 635 438 39 727 745

78
4.8 Summary
The aim of this chapter was to address the third secondary objective, as set in
Chapter 1 (refer section 1.3.2, page 10), namely to develop an activity-driven costing
framework for Company A for improved product pricing and costing decisions. A
TDABC model was developed for Company A and compared to the current traditional
standard costing system (TCS) in use. The variances between the two costing models
were analysed. The 2017 actual business support services costs were selected and
reallocated to identical divisions to compare the two costing methodologies.
A comparison of the two methodologies revealed that, under the current traditional
costing system, there is cross subsidisation between the two departments. This
finding agrees with Peter Drucker’s comment in 1963 that traditional costing systems’
lack of relatedness and relevancy leads to subsidisation between products and their
costs (Cardos & Pete, 2011:155). Division 2 is carrying over 5% more costs than it
consumes. This has resulted in products of Division 2 being overpriced and
uncompetitive as a result of this overhead burden.
By implementing TDABC, the management of Company A obtains a better
understanding of which division consumes how much of which business support
services resources. The implementation of TDABC results in a consumption-driven
allocation of business support services costs. Company A will have more precise
information to accurately cost products and services. This information will lead to
better resource planning, elimination of waste and enlightened management decision
making.
The next and final chapter discusses the findings and conclusion and provides
recommendations.

79
CHAPTER 5
5 FINDINGS AND RECOMMENDATIONS
5.1 Introduction
The objective of the chapter is to address the final secondary objective of concluding
the research by providing recommendations based on the findings of the empirical
study, and substantiated by the literature review. The main objective of this study is
to develop an activity-driven costing framework for Company A, a South African cash
services company.
In Chapter 1 (section 1.2, page 9) the research problem described Company A as
being a major provider of cash services for the South African market and that it had a
monopolistic advantage. Moreover, with the entry of new players, Company A has
been forced to manage and control costs to ensure improved product pricing and
costing decisions. Özkan and Karaibrahimoğlu (2013:420) emphasise that cost and
quality have become differentiating factors providing companies a competitive
advantage. The question was therefore raised whether the development of an activity-
driven costing framework could lead to improved product pricing and costing decisions
in Company A.
The rest of the chapter is structured as follows:
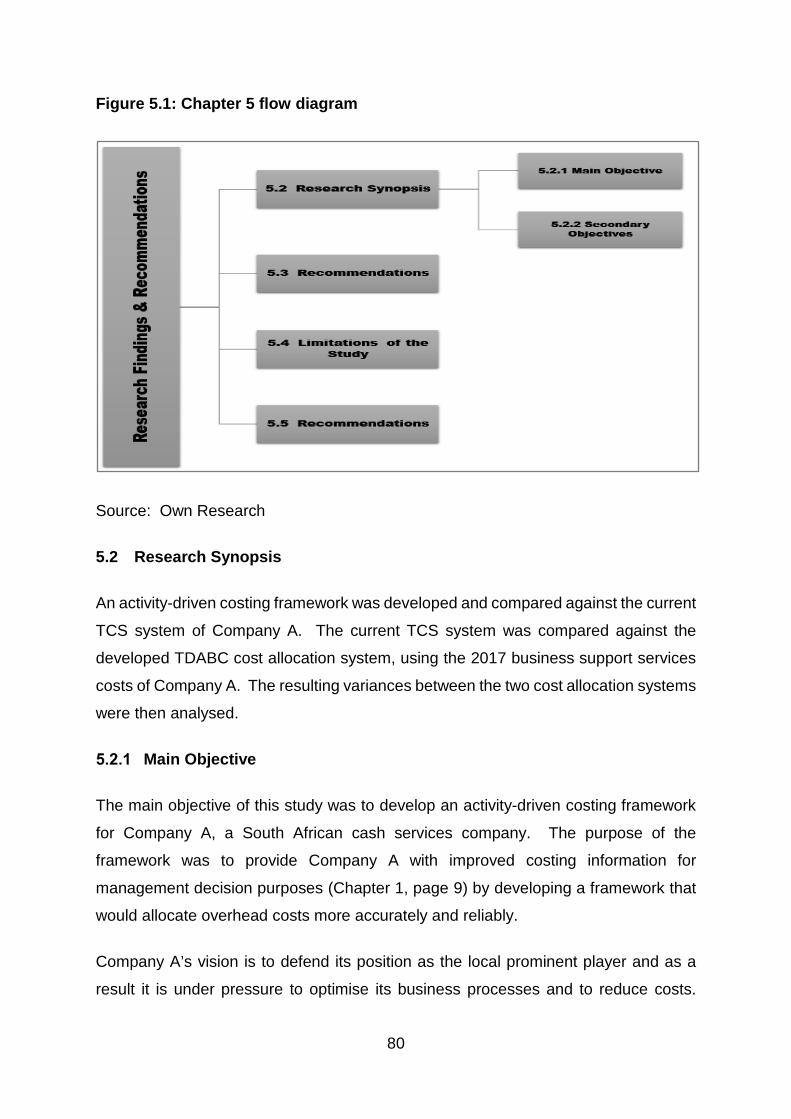
80
Figure 5.1: Chapter 5 flow diagram
Source: Own Research
5.2 Research Synopsis
An activity-driven costing framework was developed and compared against the current
TCS system of Company A. The current TCS system was compared against the
developed TDABC cost allocation system, using the 2017 business support services
costs of Company A. The resulting variances between the two cost allocation systems
were then analysed.
Main Objective
The main objective of this study was to develop an activity-driven costing framework
for Company A, a South African cash services company. The purpose of the
framework was to provide Company A with improved costing information for
management decision purposes (Chapter 1, page 9) by developing a framework that
would allocate overhead costs more accurately and reliably.
Company A’s vision is to defend its position as the local prominent player and as a
result it is under pressure to optimise its business processes and to reduce costs.
81
Accurate product costing has become key if the company is to remain cost relevant in
the industry (Chapter 1). The motivation for Company A to implement an activity-
driven costing framework is to provide accurate and reliable information on product
costs by accurately identifying and assigning overhead costs to products and services.
To achieve the above objectives, the capacity cost rates for each of the business
support services of Company A were determined (refer Table 4.6, page 70).
Departmental activities and capacity usage of each of the business support services
(refer Table 4.7, page 71) was established through conducting semi-structured
interviews with the relevant managers of the respective business support services.
Furthermore, data from the company’s ERP system and departmental registers was
analysed.
The developed TDABC model used resource cost and consumption to allocate costs,
as opposed to the TCS model that uses a revenue earned model, which for the
divisions is not the driver of business support services resources consumption. As a
result, TDABC allocated business support services costs more accurately and
realistically.
The findings of the comparison of the two cost allocation models revealed that there
is a 5% business support services cross subsidisation between the two divisions of
Company A. This inaccurate allocation of costs has led to Division 1 being reallocated
R40 million less than it consumes. This inaccurate reallocation of business support
services costs has resulted in the under-pricing of Division 1’s products:
Processing & packing of cash
Notes sorting
Coin management
Solutions for foreign currency
Retail cash deposit processing
This could lead the management of Company A to drive inaccurate strategies,
including driving the rapid expansion of Division 1’s products. Such an expansion
drive could lead to an unforeseen increase in business support services, in turn
reducing the profitability of Company A.
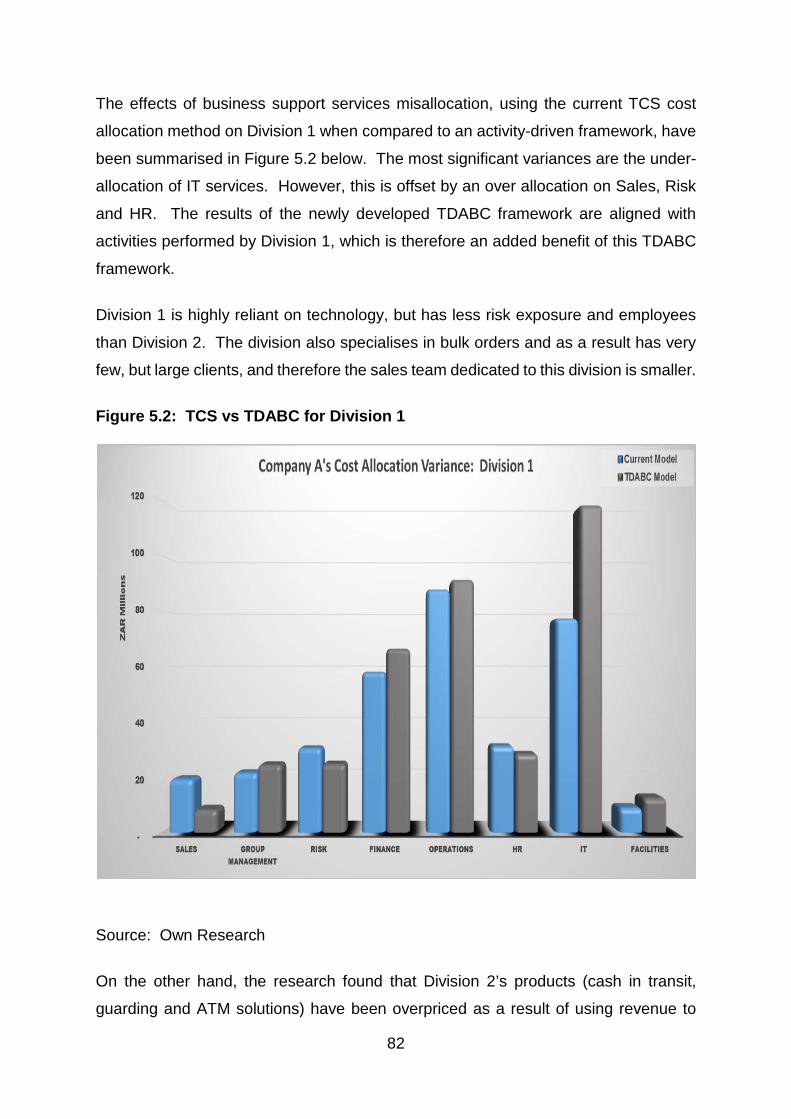
82
The effects of business support services misallocation, using the current TCS cost
allocation method on Division 1 when compared to an activity-driven framework, have
been summarised in Figure 5.2 below. The most significant variances are the under-
allocation of IT services. However, this is offset by an over allocation on Sales, Risk
and HR. The results of the newly developed TDABC framework are aligned with
activities performed by Division 1, which is therefore an added benefit of this TDABC
framework.
Division 1 is highly reliant on technology, but has less risk exposure and employees
than Division 2. The division also specialises in bulk orders and as a result has very
few, but large clients, and therefore the sales team dedicated to this division is smaller.
Figure 5.2: TCS vs TDABC for Division 1
Source: Own Research
On the other hand, the research found that Division 2’s products (cash in transit,
guarding and ATM solutions) have been overpriced as a result of using revenue to
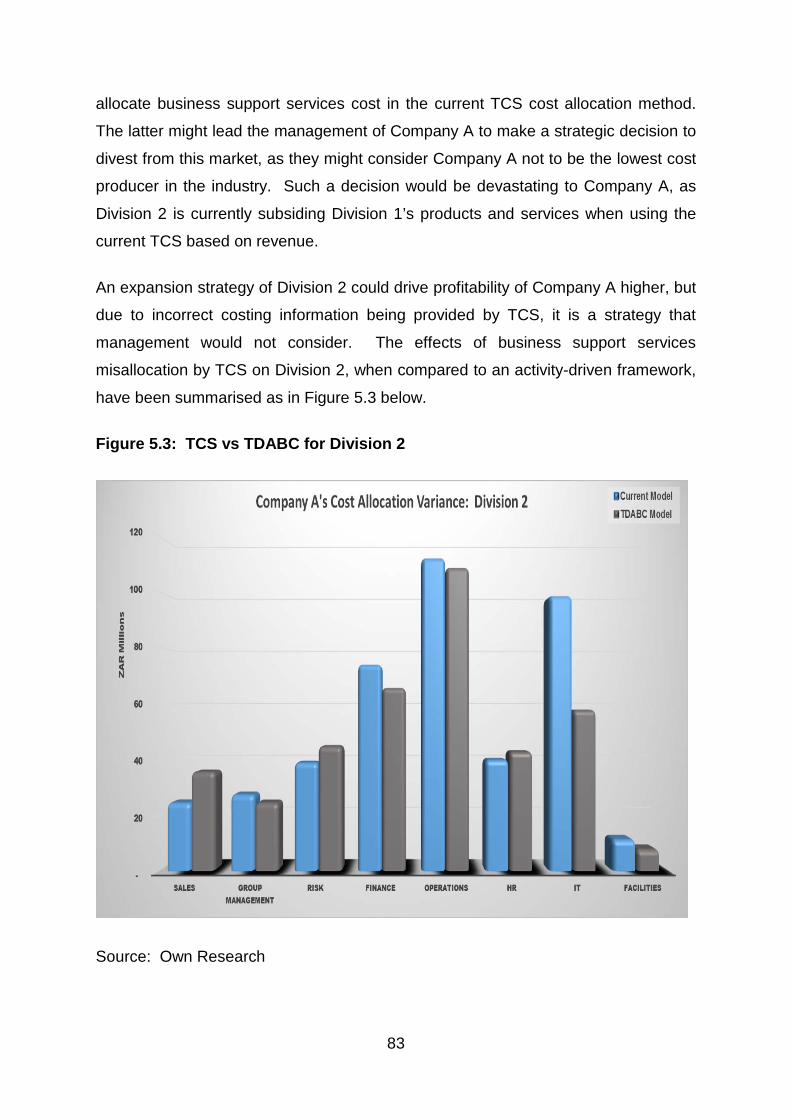
83
allocate business support services cost in the current TCS cost allocation method.
The latter might lead the management of Company A to make a strategic decision to
divest from this market, as they might consider Company A not to be the lowest cost
producer in the industry. Such a decision would be devastating to Company A, as
Division 2 is currently subsiding Division 1’s products and services when using the
current TCS based on revenue.
An expansion strategy of Division 2 could drive profitability of Company A higher, but
due to incorrect costing information being provided by TCS, it is a strategy that
management would not consider. The effects of business support services
misallocation by TCS on Division 2, when compared to an activity-driven framework,
have been summarised as in Figure 5.3 below.
Figure 5.3: TCS vs TDABC for Division 2
Source: Own Research
84
It is clear from the findings that the implementation of an activity-driven costing
framework would lead to improved product pricing and costing decisions in
Company A.
Notwithstanding the ease of calculation and cost effectiveness of the current TCS, it
has resulted in distorted costing information which has adversely affected Company
A’s competitiveness, as products and services were priced incorrectly. This was
adversely affected management’s decisions regarding product and market strategy.
To achieve its objective of remaining competitive, it is strongly advised that Company
A implement an activity-driven costing method.
Secondary Objectives
To successfully achieve the main objective of developing an activity-driven costing
framework, secondary objectives were set to provide support to the study (refer
section 1.3.2, page 10).
The first secondary objective of this study, the development of an appropriate research
methodology to meet the main research objective, was presented in Chapter 2 (refer
page 15). Fundamental assumptions behind the set of common beliefs and
agreements (paradigm), what reality is (ontology), how one knows the reality
(epistemology) and how to go about finding it (methodologies) were discussed.
Fundamentals of research approaches, as well as qualitative, quantitative and mixed
methods were reviewed and their roles in the selection of methods of data collection,
analysis and interpretation discussed.
The second secondary objective of reviewing the existing literature on the
fundamentals of cost allocation, TCM and ABC, and the emergence of TDABC, was
presented in Chapter 3 (refer page 32).
The third secondary objective was to develop an activity-driven costing framework for
Company A, the case study, to ensure improved product pricing and costing decisions
(Chapter 4). A TDABC model was built and compared to the current TCS and
variances and the impact thereof were analysed. To identify business support
services activities and to allocate resource consumption, semi-structured face-to-face
85
interviews with relevant departmental managers and employees were conducted.
Moreover, data from the ERP system and from departmental incidents registers was
analysed and used to develop the framework.
The final secondary objective was to conclude the research by providing
recommendations based on the findings of the empirical study and substantiated by
the literature review. A summary of key research results as well as a conclusion and
the extent to which the set objectives have been met, have been presented in this
chapter.
5.3 Recommendations
The results of the comparison of the TCS and TDABC cost allocation models (refer
Table 4.10, page 75) reveal that Company A is indeed in need of a system to
accurately track and allocate costs. The research question formulated in Chapter 1
(refer page 9) was: would the development of an activity-driven costing framework
lead to improved product pricing and costing decisions in Company A?
The comparison of the current TCS results against the newly developed TDABC model
results (refer Table 4.10, page 75) proved that this was indeed the case. The newly
developed TDABC framework provided a more accurate reallocation basis than that
of the TCS currently in use.
As research by Sartorius et al. (2007:2) found, companies that continue to use TCS
make erroneous cost management decisions if overhead costs are significant.
Business support services costs account for over a quarter of Company A’s total
business costs, making them significant. Misallocation of business support services
costs results in product and services costing and pricing being adversely affected, and
this in turn affecting the marketability of these products and services.
The TDABC framework identified business support services activities, time allocated
and the cost rate of each activity. The framework developed in Chapter 4 provides
Company A with the capability to allocate costs as per activities consumed, produce
transparency in the overhead costs area, deliver information for control purposes,
86
relate to the strategy of the company and improve all operating activities. This concurs
with the research findings and a recommendation made by Rundora et al. (2013:488).
To achieve and maintain its competitiveness, Company A must keep track of its
products and services costs and quality. As highlighted before, Özkan and
Karaibrahimoğlu (2013:420) agree that cost and quality have been proven to be
differentiating factors that give advantage over competitors.
Implementation of an activity-driven costing framework will result in Company A having
the ability to determine actual product and service costs and business support services
resources consumers, which provides useful information that would aid managements’
operating decisions. It also aid in the accuracy of forecasting and budgeting of
resources and ensure alignment to Company A’s strategy.
The ease in terms of time and cost of adjusting recovery and time consumption rates
means that Company A’s financial analysts can periodically compare the set
benchmarks to actuals, and adjust it accordingly to maintain the accuracy of the newly
developed framework. The ease of adjustment is an added advantage of TDABC,
over and above the benefit of accuracy of business support services cost reallocation.
The resulting information will be the basis of reference for budget and forecast
planning.
5.4 Limitations of the study
For the purposes of developing an activity-driven framework for Company A, it has
been assumed that the financial information retrieved from the ERP system and used
for the TDABC and TCS models is correct. It has been accepted that the Management
Accountants of Company A have allocated business support office costs accurately to
the correct general ledger account and department.
The framework developed for Company A cannot be replicated “as is” for another
company, but adjustments will be required based on that company’s departments and
divisions.
Furthermore, for the purposes of this study, it has been assumed that the managers
interviewed to determine their departmental activities and activities consumption rates
87
are knowledgeable about their departments. It is assumed that all information
received is a true reflection of departmental activities and is unbiased.
The data used for the comparison of TDABC and TCS reallocation principles was
based on one year’s audited financial data. It is assumed that Company A is operating
in a mature and stable industry with very few players, and that history is a close
reflection of the future. It is expected that the status of the industry trading patterns
that directly affect business support services utilisation will remain constant.
Lastly, the activity-driven framework developed for Company A is for the first phase of
business support services cost allocation only. The first phase entails the reallocation
of business support services costs from the departments to the two divisions of
Company A. The framework cannot be generalised to the second phase, which is the
reallocation of business support services costs from the divisions to the specific
products and services, as activities and activity consumption rates of resources have
not been determined.
5.5 Recommendations for further research
This study leaves the following topics for further investigation:
• The study thoroughly investigated TDABC as an alternative to the TCS model
currently in use. This is due to its ease and cost effective design, yet offering so
much more costing information for decision making. Other costing methods could
be investigated.
• The framework could be developed even further to accurately reallocate business
support services not only to the first phase of business support reallocation, but to
be extended to reallocate these costs all the way to product and services levels
also. A study to identify and analyse the specific consumption rates of resources
by specific products and services at the second phase could be embarked on.
88
6 REFERENCE LIST
Akyol, D., Tuncel, G. & Bayhan, M. 2007. A comparative analysis of activity-based
costing and traditional costing. International Scholarly and Scientific Research &
Innovation, 1(3):136-139.
Ashford, C. 2011. Activity-Based Costing System in the Service Sector: A Strategic
Approach for Enhancing Managerial Decision Making and Competitiveness.
International Journal of Business and Management, 6(11):3-10.
Baboucarr, N. & Soaib, A. 2014. Case Study as a Choice in Qualitative Methodology.
IOSR Journal of Research & Method in Education, 4(3):35-40.
Back, E., Maxwell, D. & Isidore, L. 2000. Activity-Based Costing as a tool for Process
Improvement Evaluations. Journal of Management in Engineering, 16(2):48-58.
Baxter, P. & Jack, S. 2008. Qualitative Case Study Methodology: Study Design and
Implementation for Novice Researchers. The Qualitative Report, 13(4):544-559.
Barndt, R., Oehlers, P. & Soltis, G. 2015. Time-Driven Activity-Based Costing: A
Powerful Cost Model. Today’s CPA, March/April 2015.
Bisman, J. 2010. Post-positivism and Accounting Research: A (Personal) Primer on
Critical Realism. Australasian Accounting, Business and Finance Journal, 4(4):3-25.
Cardos, I. & Pete, S. 2011. Activity-Based Costing (ABC) and Activity-Based
Management (ABM) Implementation – Is this the solution for Organisations to gain
profitability? Romanian Journal of Economics, 32(1):151-168.
CIMA. 2001. Activity-Based Management – An Overview: Developing and promoting
Strategy. CIMA Technical Briefing: April 2001.
Cokins, G. 2001. Activity-Based Cost Management. 1st ed. New York: John Wiley &
Sons, Inc.
Creswell, J. 2014. Research Design: Qualitative, Quantitative and Mixed Methods
Approaches. 4th ed. California: Sage.
89
Dammak, A. 2010. Research Paradigms: Methodologies and Compatible Methods.
http://www.stclements.edu/Articles/Research-Paradigms-Full-Article.pdf Date of
access: 10 July 2017.
EY. 2014. Insights on Governance, Risk and Compliance: Centralised Operations.
http://www.ey.com/Publication/vwLUAssets/EY_Centralized_operations:_future_of_
Risk,_Control_and_Compliance/$FILE/EY-Insights-on-GRC-Centralized-
operations.pdf Date of access: 19 December 2017.
Gaula, M.D. 2011. Activity-based costing for a non-profit organisation.
Potchefstroom: NWU. (Thesis-PhD).
Gibbert, M., Ruigrok, W. & Wicki, B. 2008. What passes as a rigorous case study?
Strategic Management Journal, 29 (13):1465-1474.
Gillham, B. 2008. Case Study Methods. 1st ed. London: Biddles Ltd.
Heisinger, K. & Hoyle, J. 2012. Managerial Accounting. 1st ed. Washington DC:
Saylor Foundation.
Hoozée, S. & Hansen, S. 2014. A Comparison of Activity-based Costing and Time-
driven Activity-based Costing. (In Dudley Knox eLibrary.
https://hdl.handle.net/10945/47751. Date of access: 14 December 2017.
Ivankova, N., Creswell, J. & Plano Clark, V. 2016. Foundations and approaches to
mixed methods research. (In Maree, K., ed. First steps into Research. 2nd ed.
Pretoria: Van Schaik. p. 305 – 336).
Jansen, J. 2016. Introduction to the language of research. (In Maree, K., ed. First
steps into Research. 2nd ed. Pretoria: Van Schaik. p. 15 – 24).
Jesson, J., Matheson, L. & Lacey, M. 2011. Doing Your Literature Review: Traditional
and Systematic Techniques. 1st ed. London: Sage.
Kaplan, R. & Anderson, S. 2003. Time-Driven Activity-Based Costing. (In SSRN
eLibrary. https://papers.ssrn.com/sol3/papers.cfm?abstract_id=485443. Date of
access: 17 April 2017).

90
Kaplan, R. & Anderson, S. 2007. Time-Driven Activity-Based Costing. 1st ed. Boston:
Harvard Business School Publishing Corporation.
Knoetze, H. 2000. The application of activity based costing principles in the South
African retail banking industry. Potchefstroom: NWU. (Thesis – MBA).
Korok, R. & Goldmanis, M. 2012. Efficient Cost Allocation. Management Science,
58(7):1341-1356.
Kothari, C. 2004. Research Methodology: Methods & Techniques. 2nd ed. New
Delhi: New Age International.
Kumar, R. 2011. Research Methodology: A step by step guide for beginners. 3rd ed.
London: Sage.
Mahal, I. & Hossain, A. 2015. Activity-Based Costing (ABC) – An effective tool for
better management. Research Journal of Finance & Accounting, 6(4):66-73.
Manalo, M. 2004. Activity based costing (ABC) vs. traditional cost accounting system
among Top 500 corporations in the Philippines. CBERD Working Paper Series, 2004-
011:1-15.
Mouton, J. 2015. How to succeed in your Master’s & Doctoral Studies. A South
African guide and resource book. 2nd ed. Pretoria: Van Schaik.
Naidoo, M. 2011. Using activity-based costing to manage private universities in South
Africa. Problems and Perspectives in Management, 9(4):109-116.
Nieuwenhuis, J. 2016. Introducing qualitative research. (In Maree, K., ed. First steps
into Research. 2nd ed. Pretoria: Van Schaik. p. 48 – 70).
Osadchy, E. & Akhmetshin, E. 2015. Accounting and control of indirect costs of
organization as a condition of optimizing its financial and economic activities.
International Business Management, 9(7): 1705-1709.
91
Özbayrak, M., Akgün, M. & Türker, A. 2004. Activity-Based Cost Estimation In A
Push/ Pull Advanced Manufacturing System. International Journal of Production
Economics, 87:49-65.
Özkan, S. & Karaibrahimoğlu, Z. 2013. Activity-based costing approach in the
measurement of cost quality in SMEs: a case study. Total Quality Management,
24(4):420-431.
Pandey, P. & Pandey, M. 2015. Research Methodology: Tools & Techniques. 1st
ed. Romania: Bridge Centre.
Parys, M. & Thijs, N. 2003. Business Process Reengineering; or how to enable
bottom-up participation in a top down reform programme. Paper presented at the
European Group of Public Administration: Study group on Public Personnel Policies,
Leuven, Belgium, 3 - 6 September 2003.
http://steunpuntbov.be/rapport/s0306004_egpa.pdf Date of access: 08 February
2018.
Pearson, M., Albon, S. & Hubball, H. 2015. Case Study Methodology: Flexibility,
Rigour, and Ethical Considerations for the Scholarship of Teaching and Learning. The
Canadian Journal for the Scholarship of Teaching and Learning, 6(3):12.
Perri, S. & Bellamy, C. 2012. Principles of Methodology: Research Design in Social
Science. 1st ed. London: Sage.
Phan, T., Baird, K. & Blair, B. 2014. The use and success of activity-based
management practices at different organisational life cycle stages. International
Journal of Production Research, 52(3):787-803.
Popesko, B. 2009. How to Implement an Accurate and Effective Costing System in
Manufacturing Organizations. European Financial and Accounting Journal, 4(4):34–
49.
Reynolds, A. & van der Poll, H. 2015. ABC implementation in the Nelson Mandela
Bay Metropole: How far should manufacturing organisations go? South African
Business Review Special Edition Accounting Research: 118-136.
92
Ridley, D. 2010. The literature review: A step-by-step guide for students. London:
Sage.
Rule, P. & John, V. 2011. Your Guide to Case Study Research. 1st ed. Pretoria: Van
Schaik.
Rundora, R. 2012. Evaluating the application of activity-based costing in small
manufacturing firms in Southern Gauteng. Vanderbijlpark: VUT. (Dissertation –
M.Tech).
Rundora, R., Ziemerink, T. & Oberholzer, M. 2013. Activity-Based Costing In Small
Manufacturing Firms: South African Study. The Journal of Applied Business
Research, 29(2):485-498.
Sartorius, K., Eitzen, C. & Kamala, P. 2007. The design and implementation of Activity
Based Costing (ABC): a South African survey. Meditari Accountancy Research,
15(2):1-21.
Soiferman, K. 2010. Compare and Contrast Inductive and Deductive Research
Approaches. https://files.eric.ed.gov/fulltext/ED542066.pdf. Date of access: 07
February 2018.
Srinivasan, P. 2008. Activity Based Costing – Concepts and Cases. India: The Icfai
University Press.
Stake, R.E. 1995. The art of case study research. Thousand Oaks, CA: Sage.
Szychta, A. 2010. Time-Driven Activity-Based Costing in Services Industries. Social
Sciences / Socialiniai mokslau, 1(67):49-60.
Tight, M. 2017. Understanding Case Study Research: Small-scale Scale Research
with Meaning. 3rd ed. London: Sage.
Van Der Linde, M. 2011. Embedding an activity-driven operational accounting
framework in a fertilizer company. Potchefstroom: NWU. (Dissertation – M.Com).

93
Wegmann, G. 2009. The Activity-Based Costing Method: Development and
Applications. India: The Icfai University Press.
Wessels, S. & Shotter, M. 2000. Organisational problems in respect of activity-based
costing in South Africa. Meditari Accountancy Research, 8:215-227.
Yin, R. 2009. Case Study Research: Design and Methods. 1st ed. California: Sage.
Zhang, P. & Che, R. 2010. Factors influencing Activity-Based Costing Success: A
Research Framework. International Journal of Trade, Economics and Finance,
1(2):144-150.