Predicting Fragmentation Propagation Probabilities for ... - DTIC
Upload
independentCategory
view
3download
0
Am. J. Hum. Genet. 62:145–158, 1998
145
Determining Carrier Probabilities for Breast Cancer–Susceptibility GenesBRCA1 and BRCA2Giovanni Parmigiani, Donald A. Berry, and Omar AguilarInstitute of Statistics and Decision Sciences, Duke University, Durham, NC
Summary
Breast cancer–susceptibility genes BRCA1 and BRCA2have recently been identified on the human genome.Women who carry a mutation of one of these genes havea greatly increased chance of developing breast and ovar-ian cancer, and they usually develop the disease at amuch younger age, compared with normal individuals.Women can be tested to see whether they are carriers.A woman who undergoes genetic counseling before test-ing can be told the probabilities that she is a carrier,given her family history. In this paper we develop amodel for evaluating the probabilities that a woman isa carrier of a mutation of BRCA1 and BRCA2, on thebasis of her family history of breast and ovarian cancerin first- and second-degree relatives. Of special impor-tance are the relationships of the family members withcancer, the ages at onset of the diseases, and the ages offamily members who do not have the diseases. This in-formation can be elicited during genetic counseling andprior to genetic testing. The carrier probabilities are ob-tained from Bayes’s rule, by use of family history as theevidence and by use of the mutation prevalences as theprior distribution. In addressing an individual’s carrierprobabilities, we incorporate uncertainty about some ofthe key inputs of the model, such as the age-specificincidence of diseases and the overall prevalence of mu-tations. There is some evidence that other, undiscoveredgenes may be important in explaining familial breastcancer. Users of the current version of the model shouldbe aware of this limitation. The methodology that wedescribe can be extended to more than two genes, shoulddata become available about other genes.
Received May 5, 1997; accepted for publication November 12,1997; electronically published January 28, 1998.
Address for correspondence and reprints: Dr. Giovanni Parmigiani,Institute of Statistics and Decision Sciences, Duke University, Durham,NC 27708-0251. E-mail: [email protected]
q 1998 by The American Society of Human Genetics. All rights reserved.0002-9297/98/6201-22$02.00
Introduction
Recent years have marked important progress in ourunderstanding of inherited susceptibility to breast can-cer, with the identifications of the BRCA1 and BRCA2genes (Futreal et al. 1994; Miki et al. 1994; Wooster etal. 1995; Szabo and King 1997). Inherited mutation ofone of these genes results in making its carriers at a muchincreased risk of developing breast cancer as well asovarian cancer. It has become possible and increasinglycommon to test for the presence of these mutations. Al-though the availability of testing represents a major op-portunity both scientifically and clinically, it also createsimportant challenges for women facing the testing de-cision and for physicians and genetic counselors inter-ested in helping women to understand risks of breastcancer and available preventive options (Hoskins et al.1995). The chance of carrying a genetic mutation variesmarkedly from woman to woman, depending on familyhistory of breast cancer and related cancers. As a result,increasing attention needs to be given to understandingand conveying risk information in an individualized way.In this context, risk-prediction algorithms that fully ex-plicitate our knowledge about the nature of the inheri-tance mechanism can contribute in an important way toa woman’s decision.
Testing for BRCA1 and BRCA2 mutations is expen-sive (currently the cost is $2,400 for both genes), and apositive outcome can affect a person’s life in importantways: in eligibility for health insurance and in potentialemployment discrimination, as well as in physical andpsychological aspects. A positive test or simply the per-ception of a high risk can lead to aggressive manage-ment, ranging from more-frequent mammographies tobilateral mastectomy, again with substantive conse-quences on a woman’s life. A crucial step in counselinga women facing these decisions is an accurate evaluationof the probability that she carries a mutation. Also, afterthe test(s) is performed, the relevant calculation for de-cision making is the posterior probability of mutation,given the outcome of the test. Accurate assessment ofthese probabilities requires accurate prior input.
The purpose of this article is to describe a method forfinding the probability that a particular family member

146 Am. J. Hum. Genet. 62:145–158, 1998
(the counseland) carries a germ-line mutation at BRCA1or BRCA2, on the basis of her family’s history of breastcancer and ovarian cancer. Although the method appliesto both women and men, the counseland is usually fe-male. The family history includes the counseland andher first- and second-degree relatives. For each member,we ascertain both whether he or she has been diagnosedwith breast cancer and either the age at diagnosis or, ifcancer free, the current age or the age at death; we followa similar procedure for ovarian cancer, if the member isfemale.
Other models have addressed the risk of breast cancerfor women with a family history of the disease (Gail etal. 1989; Claus et al. 1994; Houwing-Duistermaat andVan Houwelingen 1997). Although useful, none of thesemodels directly addresses the probability that thewoman carries a mutation at BRCA1 or BRCA2, as isneeded in genetic counseling and genetic-testing deci-sions. Shattuck-Eidens et al. (1995) have provided asummary table of estimated probabilities of carrying aBRCA1 mutation, for 11 categories of high-risk women.A logistic-regression approach has been proposed byCouch et al. (1997). These models use summary meas-ures of family history, such as the number of affectedrelatives. A woman with given numbers of first- andsecond-degree relatives with breast cancer and/or ovar-ian cancer can have a wide range of probability of mu-tation, depending on the pedigree structure, the exactrelationship of the affected members, and the family size.In practical counseling situations, it can be important toaccount for these fully.
We use basic Bayesian methods to incorporate all rel-evant family history, up to second-degree relatives. Inaddition, we incorporate uncertainty in the inputs. Weproceed by computing a likelihood ratio for the observedfamily history. An estimate of the mutation frequencyin the population provides the probability of a mutationin the counseland, prior to the ascertainment of familyhistory. Bayes’s rule applies to determination of theprobability of a mutation, given family history. Thisprobability is posterior to family history but is prior togenetic testing. Calculation of the likelihood is per-formed by use of analytic expressions, for given valuesof the model parameters. These are evaluated by use ofsoftware developed, in the C programming language,expressly for this project, since none of the publicallyavailable linkage-analysis software packages can handlerisk predictions for mutations of two genes each ofwhich leads to different penetrance functions for twodifferent diseases. Uncertainty about the model para-meters is addressed by use of a Monte Carlo simulation,programmed by means of the statistical package S-plus.
The relevance of Bayesian calculations for geneticcounseling has been recognized for a long time (Murphyand Mutalik 1969). The use of likelihood ratios in ped-
igree analysis is also well established (Thompson 1986;Thompson and Guo 1991). The use of Bayesian tech-niques in software, for determination of the positive pre-dictive power of family history, has a precedent in thework of Szolovits and Pauker (1992). A likelihood-ap-proach alternative to ours, for incorporation of uncer-tainty in the estimates of genetic parameters, has beendiscussed in the work of Leal and Ott (1994). The clin-ical implications of our probability calculations forBRCA1 only have been developed in the work of Berryet al. (1997).
The outline of this article is as follows. In the Methodssection, we introduce the notation, model assumptions,and evidence regarding the population frequency of theBRCA1 and BRCA2 mutations, as wll as the disease-incidence functions associated with these mutations. Inthe Results section, we present results for two familyhistories that arise from clinical experience. In the Ap-pendix, we give explicit expressions for the likelihoodratio.
Methods
Definitions and Notation
In this section we establish the notation and reviewthe assumptions. We assume that individuals inherit twoBRCA1/BRCA2 alleles, one from each parent, and thatalleles are either normal or mutated; mutations are in-herited independently. We assume an autosomal domi-nant inheritance of mutations, empirically supported bythe analysis presented Claus et al. (1991).
At each locus, an individual can have zero, one, ortwo mutations. Our model addresses the joint proba-bility of a specific configuration of BRCA1 and BRCA2genes, represented by a two-dimensional vector. We usethe notation to denote theP[BRCA1 5 i , BRCA2 5 i ]1 2
probability of the counseland having i1 mutated copiesof BRCA1, , and i2 mutated copies of BRCA2,i 5 0, 1, 21
.i 5 0, 1, 22
The frequencies of mutations in the allele populationare indicated by f1 and f2, for BRCA1 and BRCA2, re-spectively. In the absence of information about diseaseand family history, the probabilities that an individualinherits a given number of mutated copies of BRCA1are , ,2P[BRCA1 5 2] 5 f P[BRCA1 5 1] 5 f (1 2 f )1 1 1
and . The probability that an2P[BRCA1 5 0] 5 (1 2 f )1
individual carries at least one BRCA1 mutation is. Of these individuals, the fraction2p 5 f 1 2f (1 2 f )1 1 1 1
carrying two mutations is therefore g 5 f / [f 1 2(1 21 1 1
. Similar expressions hold for BRCA2. Joint proba-f )]1
bilities can be obtained on the basis of independence.

Parmigiani et al.: Carrier Probabilites for BRCA1 and BRCA2 147
Updating
Our goal is to compute the joint probability distri-bution of the BRCA1 and BRCA2 genetic-status vari-ables of a woman, given her family history (subsequentlydenoted as “fam.hist.” in mathematical expressions).From Bayes’s rule,
P[BRCA1, BRCA2Ffam.hist.] 5
P[BRCA1]P[BRCA2]P[fam.hist.FBRCA1, BRCA2]P[fam.hist.]
(1)
Although the BRCA1 and BRCA2 variables can be as-sumed to be independent a priori, they will typically notbe independent conditional on family history.
On the basis of the joint probability distribution aris-ing from expression (1), we can compute various sum-maries that are of interest in both decision making andgenetic testing. These include the probability, given herfamily history, that a woman is a carrier of either aBRCA1 mutation or a BRCA2 mutation,
∗p 5 1 2 P[BRCA1 5 0, BRCA2 5 0Ffam.hist.] ,
the marginal probabilities, given her family history, thata woman is a carrier of BRCA1,
∗p { P[BRCA11
5 1 or 2Ffam.hist.]2 2
5 OO P[BRCA1 5 i ,1i 51 i 501 2
BRCA2 5 i Ffam.hist.] ,2
and the marginal probabilities , given her family his-∗p2
tory, that a woman is a carrier of BRCA2, obtained ina manner similar to that given above.
Determining in expres-P[fam.hist.FBRCA1, BRCA2]sion (1) can be computationally intensive. However,there are three simple building blocks that underlie thiscalculation: the probability of the genetic status ofoffspring, given those of their parents; the probabilityof the genetic status of parents, given those of their off-spring; and the probability of disease outcome, givengenetic status. The first two are discussed next; the thirdis discussed in the Evidence subsection.In the Appendix, we show how to compute
.P[fam.hist.FBRCA1, BRCA2]The probability of a configuration of the offsprings’
genetic status, given the genetic status of their parents,is computed on the basis of random selection of eachoffspring’s alleles from each parent’s two alleles (see Fal-
coner and Mckay 1996). We use the notation “o” todesignate the offspring’s genetic status, “m” to designatethe mother’s genetic status, and “f” to designate thefather’s genetic status. Each of these is a two-dimen-sional vector. The two coordinates represent the numberof mutated alleles at BRCA1 and BRCA2, respectively.The set of possible values is . Because{0, 1, 2} # {0, 1, 2}inheritances of BRCA1 and BRCA2 mutations are as-sumed to be a priori independent, we can focus on mar-ginal distributions.
The probability of any joint configuration of the par-ents’ genetic status, given that of one of their offspring,requires a simple application of Bayes’s rule. We beginby assuming independence between the genetic status ofthe two parents, which is tenable when random matingin the population is assumed. This implies P [m, f] 5
, and, when Bayes’s rule is applied,P [m] P[f]
P[m]P[f ]P[oFm, f ]P[m, fFo] 5 .OOP[m]P[f ]P[oFm, f ]
m f
Uncertainty about Genetic Parameters
From expression (1) we see that inference about thegenetic status of the counseland requires knowledge ofthe mutation frequencies and of cancer rates for bothcarriers and noncarriers of the mutations. These need tobe evaluated for all family members whose history ofbreast cancer and ovarian cancer (including the lack ofsuch history) is available. These evaluations are basedon empirical studies and so are uncertain. Uncertaintycan be accommodated by a Bayesian approach, as fol-lows. We denote by v the set of parameters indexing thecancer-rate models, and we denote by
the probability distribution ex-P(v, f , f Fpublished data)1 2
pressing the uncertainty about (v,f1,f2), on the basis ofthe published estimates.
We can then use to computeP(v, f , f Fpublished data)1 2
the distribution of the random variables
P[BRCA1, BRCA2Ffam.hist., v, f , f ]1 2
5 {P[BRCA1, BRCA2Ff , f ]1 2
# P[fam.hist.FBRCA1, BRCA2, v, f , f ]}/1 2
# P[fam.hist.Fv, f , f ]1 2
with and . This hasBRCA1 5 0, 1, 2 BRCA2 5 0, 1, 2the feature of examining separately the uncertainty de-riving from the unknown genetic status of the familymembers, which is integrated out, from the uncertaintyabout the population rates and prevalence. Alternatively,we can write the probability distribution of interest, in

148 Am. J. Hum. Genet. 62:145–158, 1998
Figure 1 Cumulative rates of breast cancer (B) and ovarian (O)cancer, for mutation carriers, for (top) BRCA1 (based on Easton etal. 1995) and (bottom) BRCA2 (based on data of D. F. Easton, personalcommunication). The lines indicate our interpolation, based on a three-parameter gamma c.d.f, with one of the parameters being the asymp-tote, which may be !1.
presence of estimation error, by integrating out the un-known parameters:
P[BRCA1, BRCA2Ffam.hist.] 5
P[BRCA1, BRCA2Ffam.hist., v, f , f ]E 1 2
p(v, f , f Fpublished data)df df dv .1 2 1 2
We can evaluate the integrand ratio exactly (see the Ap-pendix), and we perform the integration by means ofMonte Carlo methods.
A calculation of interest is the probability that an in-dividual will develop breast cancer or ovarian cancerlater in life. This is straightforward and is a weightedaverage of the corresponding probabilities for carriers
and noncarriers, when the posterior probabilities of be-ing a carrier and a noncarrier are used as weights.
The impact that the allowance for error in the param-eter estimates has, both on the carrier probabilities andon the final risk estimates, will be illustrated in the Dis-cussion section.
Evidence
In this section we discuss the empirical evidence aboutcancer rates and mutation frequency that we will use inour calculations. Easton et al. (1995) have discussed thepenetrance of breast cancer and ovarian cancer inBRCA1 carriers, as a function of age. Figure 1 sum-marizes the rates that they report; breast cancer ratesare indicated by a “B,” and ovarian cancer rates areindicated by an “O.” The curves represent our inter-polation. For BRCA1, ∼85% of female carriers will getbreast cancer, and ∼65% will get ovarian cancer, by theage of 70 years. Apparently, these two cancersoccur independently among carriers. By age 70 years,
, or 95%, of carriers have one∼ 1 2 [(1 2 .85)(1 2 .65)]disease or the other, and , or 55%, have both∼ .85 # .65diseases. Similar multiplications apply for other ages.
Figure 1 also shows our interpolations of the ratesreported by Easton et al. (1995). The curves are basedon fitting a gamma CDF to the reported rates, by useof nonlinear least squares after an arcsine transforma-tion of the response. The asymptote (a) of the CDF isa free parameter, allowed to be !1 in order to accom-modate incomplete penetrance: not every carrier will de-velop breast cancer or ovarian cancer. Formally, if a isage and if R is the cumulative rate under consideration,we assume that
anb
n21 2xbR(a) 5 a x e dx .EG(n)0
Figure 1 also shows the results of the same type of in-terpolations on the penetrance functions for BRCA2,with data from D. F. Easton (personal communication;also see Easton et al. 1997). Data on the penetrancefunctions for male breast cancer are not available at thistime. We have assumed that the shape of the penetrancefunction for male BRCA2 carriers is the same as thatfor female BRCA2 carries but that it has a smaller as-ymptote, .15. Penetrance functions for male BRCA1 car-riers are assumed to be the same as those for normalindividuals.
Although it is rare, we need to consider the possibilitythat an individual may carry mutations at both BRCA1and BRCA2. No data are available concerning incidenceof disease among carriers of mutations at both genes. Inour model, their penetrance functions are determined asthe cumulative distribution of the minimum of two in-
Parmigiani et al.: Carrier Probabilites for BRCA1 and BRCA2 149
Figure 2 Number of breast cancer cases and ovarian cancer cases, for both BRCA1 and BRCA2 carriers and noncarriers. The scales forcarriers and noncarriers are different, for better resolution. All else being equal, ovarian cancer is a stronger indication of a mutation than isbreast cancer, and earlier-onset breast cancer is a stronger indication than is later-onset breast cancer.
dependent events: cancer due to BRCA1 and cancer dueto BRCA2. The results are not very sensitive to thisassumption.
The disease history for a family member can includebilateral breast cancer. Estimation of rates of bilateralrecurrence is difficult, because of the lack of good data.In the current version of our model, we approximate the
rates for bilateral recurrences by assuming that the ob-served breast cancer rates R(a) represent the distributionof the minimum of two independent events: cancer inthe left breast and cancer in the right breast. The cu-mulative rates of the time to cancer in a particular breastwill then be . The likelihood for′ ÎR (a) 5 1 2 1 2 R(a)bilateral breast cancer cases that are diagnosed at ages

150 Am. J. Hum. Genet. 62:145–158, 1998
Figure 3 Probability distribution of penetrance functions. Eachgraph is a sample of 30 penetrance curves. The upper two graphs referto BRCA1 carriers, and the lower two graphs refer to BRCA2 carriers.Curves are interpreted as in figure 1. The uncertainty about the pen-etrance of the mutation is captured by variability in the total numberof cases at age 80 years. The uncertainty about rates at young ages ishigh, in relative terms.
Figure 5 Family history 1 of section 4. Age, when known, isshown for each family member; it is either age at the time of the presentstudy or age at death.
Figure 6 Family history 2 of section 4. Age, when known, isshown for each female family member; it is either her age at the timeof the assessment or her age at death. If there is no indication of breastcancer or ovarian cancer, then the family member is free of both.
Figure 4 Assumed probability distributions of allele mutationfrequencies. The unbroken line is the distribution of f1, whereas thebroken line is the distribution of f2.
a1 and a2, with , will then be r′(a1)r′(a2), where r′a X a1 2
is the derivative of R′. In addition to depending on age,the likelihood of a bilateral recurrence can depend onadjuvant treatment or preventive surgery administeredafter the first primary cancer. These features are not in-corporated here.
Cancer rates for normal individuals can be obtainedfrom epidemiological registries such as the SEER database. Moolgavkar et al. (1979) used SEER data to de-
velop a general model of incidence of breast cancer inthe female population. The model accounts for a cohorteffect and yields estimates of incidence and mortality asa function of age. We have used the incidence functionsof Moolgavkar et al., together with life tables, to deter-mine the breast cancer rates for the general population.Subtraction of the estimated BRCA1/BRCA2 cases leadsto an age distribution for noncarriers. We have used asimilar strategy for ovarian cancer, on the basis of theresults reported by Yancik (1993). Figure 2 summarizesestimated carrier rates and noncarrier rates, for breastcancer and for ovarian cancer, in females. The graphs

Parmigiani et al.: Carrier Probabilites for BRCA1 and BRCA2 151
Table 1
Five Scenarios for Penetrance and Prevalence Parameters
SCENARIO
ALLELEFREQUENCY
PENETRANCE AT AGE 110 YEARS
Breast Cancer Ovarian Cancer
f1 f2 BRCA1 BRCA2 BRCA1 BRCA2
1(Baseline) .0006 .00022 .90 .70 .75 .252 .0008 .00030 .95 .75 .85 .353 .00045 .000165 .95 .75 .85 .354 .0008 .00030 .70 .40 .60 .155 .00045 .000165 .70 .40 .60 .15
Table 2
Probability That Counseland of Family1 Carries BRCA1 or BRCA2, in FiveScenarios Given in Table 1
PROBABILITY
SCENARIO∗pi BRCA1 BRCA2
1 .966 .589 .3772 .978 .429 .5493 .960 .427 .5334 .966 .843 .1235 .945 .827 .118
Figure 7 Probabilistic sensitivity analysis, family 1. Boxplots represent the distribution of the probability that family member 1 of family1 carries a mutation of BRCA1 or BRCA2, with her age being allowed to change. We are considering the modified version of the pedigree, inwhich the counseland’s father is assumed to have breast cancer and in which the mother is cancer free. Each boxplot is based on the sameMonte Carlo sample of size 100. The variability is due to uncertainty in the cancer rates and in the allele frequency.
represent the number of cases, per year, per 1,000women. Carriers have a higher incidence and a higherpropensity to develop breast cancer at a young age.
We have incorporated uncertainty about the carrierrates, as discussed in the Methods section. Easton et al.(1995) have provided confidence intervals for the inci-dence rates at age 50 years. On the basis of these, wehave assigned probability distributions to the penetrancefunctions for breast cancer rates and ovarian cancerrates. We have used beta distributions for the a para-meters and have used Gaussian distributions for the n
and b parameters. To illustrate the implications of ourspecifications, we have generated a sample of the re-sulting curves; these are shown in figure 3.
The frequency of genetic mutations at BRCA1 hasbeen discussed by Ford and Easton (1995), who providea 95% confidence interval of .0002–.001. for f1. On thebasis of this, we have assigned a beta probability dis-tribution on f1, with parameters 6.29 and 12,000, plac-ing ∼95% of the mass on the interval (.0002–.001). Theprevalence of genetic mutations at BRCA2 has been re-viewed by Andersen (1996). Uncertainty assessments are
152 Am. J. Hum. Genet. 62:145–158, 1998
Table 3
Probability That Counseland of Family1 Carries BRCA1 or BRCA2, in FiveScenarios Given in Table 1
SCENARIO
PROBABILITY
∗pi BRCA1 BRCA2
1 .961 .015 .9472 .974 .011 .9643 .953 .010 .9434 .883 .072 .8175 .803 .064 .741
NOTE.—The pedigree is modifiedcompared with that shown in figure 5;here the father of the proband has breastcancer at age 70 years, and the motherof the proband is free of cancer.
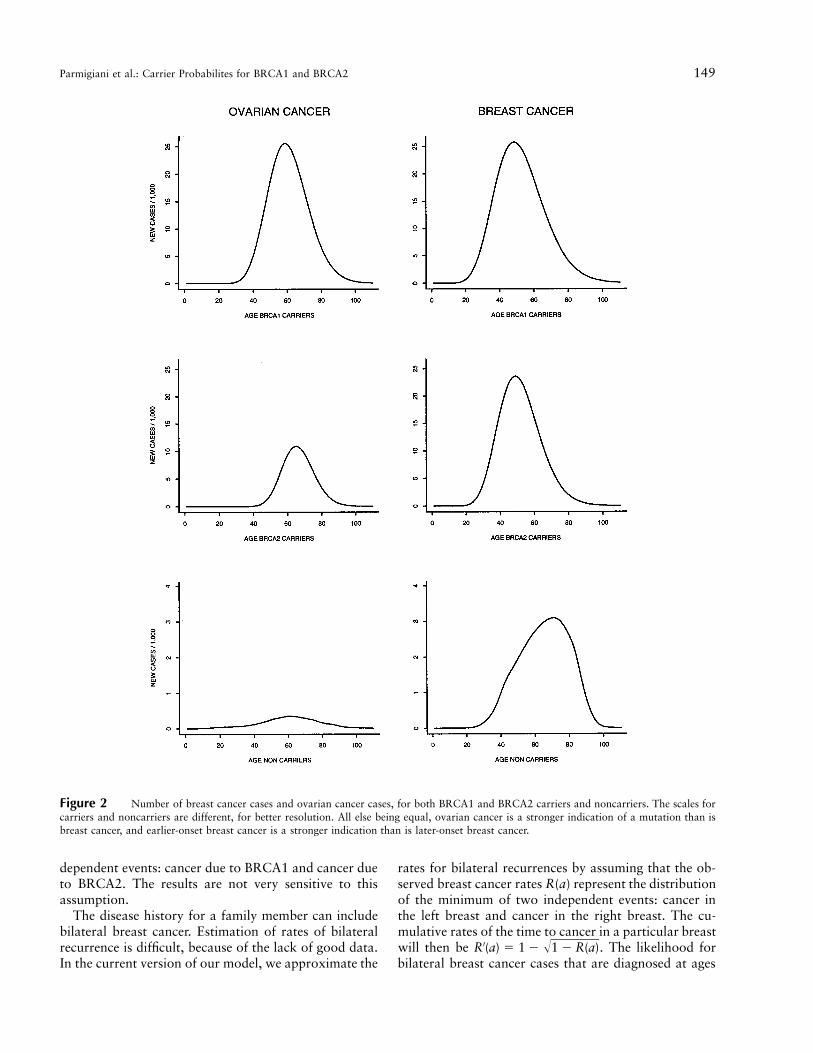
Table 4
Posterior Probabilities for Members of Family 2, in Five ScenariosGiven in Table 1
SCENARIO
AND TYPE OF
PROBABILITY
PROBABILITY FOR FAMILY MEMBER
1 2 3 4 5 6
1:∗pi .035 .036 .007 .012 .025 .005
BRCA1 .017 .018 .002 .005 .019 .003BRCA2 .018 .017 .005 .007 .005 .002
2:∗pi .040 .041 .008 .013 .035 .006
BRCA1 .015 .016 .001 .004 .026 .003BRCA2 .025 .025 .006 .009 .009 .003
3:∗pi .021 .021 .004 .007 .019 .003
BRCA1 .008 .008 .0008 .002 .013 .002BRCA2 .013 .013 .003 .005 .005 .001
4:∗pi .085 .089 .025 .034 .039 .011
BRCA1 .058 .062 .013 .021 .032 .008BRCA2 .026 .027 .012 .012 .007 .003
5:∗pi .047 .049 .014 .019 .021 .006
BRCA1 .032 .034 .007 .012 .018 .004BRCA2 .014 .015 .006 .007 .004 .002
Figure 8 Probabilistic sensitivity analysis, family 2. Boxplots represent the distribution of the probability that family member 1 of family2 carries a mutation of BRCA1 or BRCA2, with her age being allowed to change. Each boxplot is based on the same Monte Carlo sample ofsize 100. The variability is due to uncertainty in the cancer rates and in the allele frequency.
not available, and our own uncertainty assessment isbased on a comparison with BRCA1. The assumed dis-tributions of allele frequencies of BRCA1 and BRCA2are shown in figure 4. Although the proportion of fam-ilies whose cancer is explained by BRCA2 is lower, giventhe difference in penetrance, it is possible that the fre-quency of BRCA2 is similar to or even greater than thatof BRCA1. Under the assumptions used in figure 4, thereis a probability of ∼10% that the frequency of BRCA2

Parmigiani et al.: Carrier Probabilites for BRCA1 and BRCA2 153
Table 5
Posterior Probabilities for Member 1of Family 2, in Five Scenarios Given inTable 1, When 30-Year-Old Niece IsAssumed to Have Had Breast Cancerat Age 30 Years
SCENARIO
PROBABILITY
∗pi BRCA1 BRCA2
1 .256 .164 .0922 .284 .148 .1353 .167 .088 .0784 .414 .347 .0675 .276 .232 .044
Table 7
Posterior Probabilities for Member 1of Family 2, in Five Scenarios Given inTable 1, When 38-Year-old Niece IsAssumed to Have Had Breast Cancerat Age 30 Years
SCENARIO
PROBABILITY
p* BRCA1 BRCA2
1 .130 .062 .0682 .140 .047 .0933 .075 .026 .0504 .289 .218 .0715 .177 .134 .043
Table 8
Posterior Probabilities for Members ofFamily 2, in Five Scenarios Given inTable 1, When 40-Year-old Niece IsAssumed to Have Had Breast Cancerat Age 30 Years
SCENARIO
PROBABILITY
p* BRCA1 BRCA2
1 .393 .260 .1332 .429 .232 .1973 .277 .152 .1254 .557 .478 .0795 .411 .353 .057
Table 6
Posterior Probabilities for Member 1of Family 2, in Five Scenarios Given inTable 1, When 38-Year-old Niece IsAssumed to Have Had Breast Cancerat Age 38 Years
SCENARIO
PROBABILITY
p* BRCA1 BRCA2
1 .100 .041 .0592 .112 .032 .0803 .060 .017 .0424 .217 .151 .0665 .128 .089 .039
is greater than that of BRCA1. Cancer rates for the gen-eral population are based on large datasets, and the un-certainty about their values can be ignored.
Results
In this section we illustrate our approach by using twofamily pedigrees arising from actual counseling experi-ence in the Duke Specialized Program of Research Ex-cellence in breast cancer. We also consider small hypo-thetical variations of each pedigree, to show the effecton the probabilities that mutations are carried. The ped-igrees are shown in figures 5 and 6.
For each family, we performed the computations un-der five different scenarios for the penetrance and prev-alence parameters. These scenarios are specified in table1. The baseline scenario corresponds to the best esti-mates of the parameters, based on the discussion in theEvidence subsection. We also performed a probabilisticanalysis, using the distributions obtained in the Evidencesubsection.
We begin with family 1, focusing on the woman in-dicated by the arrow. The probabilities that she carriesmutations are shown in table 2. Both the occurrence ofbilateral breast cancer and the high number of cases inthe family strongly suggest the presence of a mutation.
As a result of the clear line of descent, the probabilitythat she carries either mutation does not change signif-icantly over the different scenarios. However, the prob-abilities allocated to BRCA1 mutations and to BRCA2mutations change more markedly. In the high-pene-trance scenarios, BRCA2 becomes more likely thanBRCA1. This is because, with a higher penetrance forboth genes, the ovarian cancer cases and the healthycases give less support to BRCA1, compared with thebaseline case.
We now consider a modified pedigree for family 1, inwhich the father of the proband had breast cancer atage 70 years and in which the mother is free of cancer.Table 3 shows the results. The presence of a case of malebreast cancer helps discriminate between BRCA1 andBRCA2, which receives a high probability.
Figure 7 shows a probabilistic sensitivity analysis ofthe same calculations, based on the distributions dis-cussed in the Results section. Boxplots represent the dis-tribution of the probability that family member 1 carriesa mutation of BRCA1 or BRCA2, with her age at onsetbeing allowed to change. The horizontal axis indicatesthe age at onset of the first cancer. The second cancer isassumed to follow 3 years later. Each boxplot is basedon the same Monte Carlo sample of size 100. The var-iability is due to uncertainty both in the cancer rates and
154 Am. J. Hum. Genet. 62:145–158, 1998
Table 9
Posterior Probabilities for Member 1of Family 2, in Five Scenarios Given inTable 1, When No Data RegardingMother’s Age or Cancer Status AreAssumed to Have Been Available
SCENARIO
PROBABILITY
p* BRCA1 BRCA2
1 .236 .191 .0452 .319 .246 .0743 .195 .151 .0454 .266 .233 .0325 .162 .143 .019
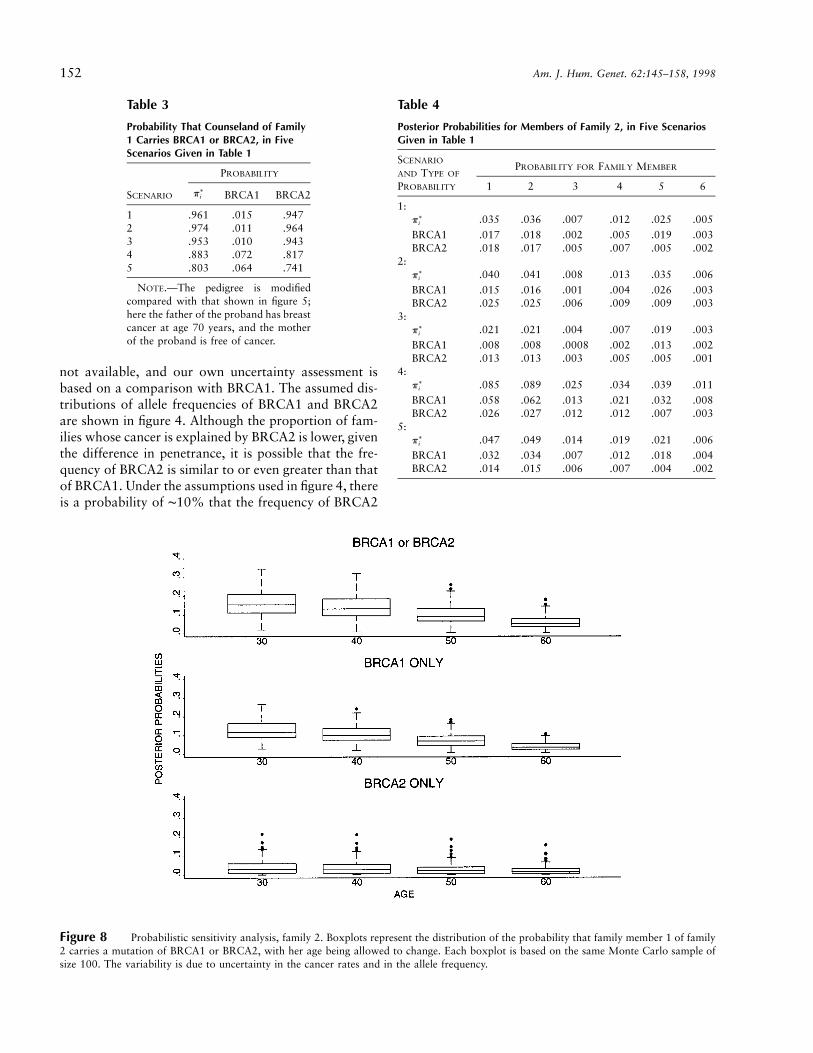
Figure 10 Probabilistic sensitivity analysis of the cumulativerisks breast and ovarian cancer for a woman with the family historyof members 3 and 4 of family 2. Each boxplot is based on the sameMonte Carlo sample of size 100.
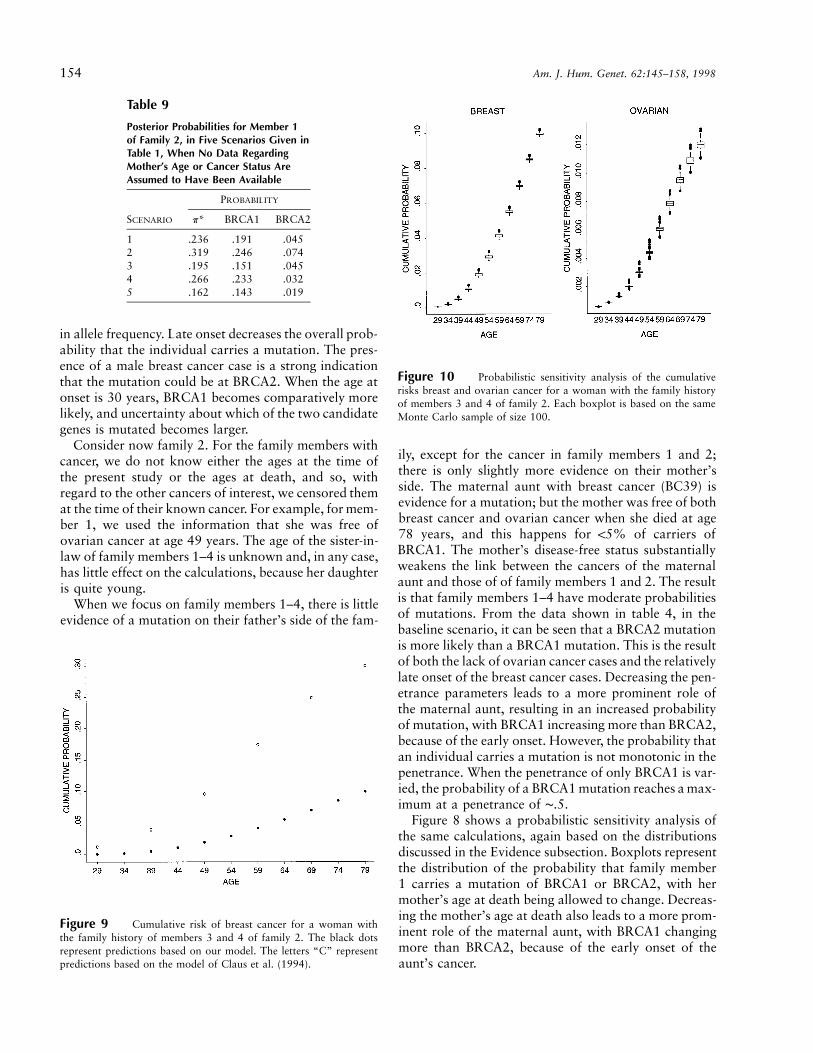
Figure 9 Cumulative risk of breast cancer for a woman withthe family history of members 3 and 4 of family 2. The black dotsrepresent predictions based on our model. The letters “C” representpredictions based on the model of Claus et al. (1994).
in allele frequency. Late onset decreases the overall prob-ability that the individual carries a mutation. The pres-ence of a male breast cancer case is a strong indicationthat the mutation could be at BRCA2. When the age atonset is 30 years, BRCA1 becomes comparatively morelikely, and uncertainty about which of the two candidategenes is mutated becomes larger.
Consider now family 2. For the family members withcancer, we do not know either the ages at the time ofthe present study or the ages at death, and so, withregard to the other cancers of interest, we censored themat the time of their known cancer. For example, for mem-ber 1, we used the information that she was free ofovarian cancer at age 49 years. The age of the sister-in-law of family members 1–4 is unknown and, in any case,has little effect on the calculations, because her daughteris quite young.
When we focus on family members 1–4, there is littleevidence of a mutation on their father’s side of the fam-
ily, except for the cancer in family members 1 and 2;there is only slightly more evidence on their mother’sside. The maternal aunt with breast cancer (BC39) isevidence for a mutation; but the mother was free of bothbreast cancer and ovarian cancer when she died at age78 years, and this happens for !5% of carriers ofBRCA1. The mother’s disease-free status substantiallyweakens the link between the cancers of the maternalaunt and those of of family members 1 and 2. The resultis that family members 1–4 have moderate probabilitiesof mutations. From the data shown in table 4, in thebaseline scenario, it can be seen that a BRCA2 mutationis more likely than a BRCA1 mutation. This is the resultof both the lack of ovarian cancer cases and the relativelylate onset of the breast cancer cases. Decreasing the pen-etrance parameters leads to a more prominent role ofthe maternal aunt, resulting in an increased probabilityof mutation, with BRCA1 increasing more than BRCA2,because of the early onset. However, the probability thatan individual carries a mutation is not monotonic in thepenetrance. When the penetrance of only BRCA1 is var-ied, the probability of a BRCA1 mutation reaches a max-imum at a penetrance of ∼.5.
Figure 8 shows a probabilistic sensitivity analysis ofthe same calculations, again based on the distributionsdiscussed in the Evidence subsection. Boxplots representthe distribution of the probability that family member1 carries a mutation of BRCA1 or BRCA2, with hermother’s age at death being allowed to change. Decreas-ing the mother’s age at death also leads to a more prom-inent role of the maternal aunt, with BRCA1 changingmore than BRCA2, because of the early onset of theaunt’s cancer.

Parmigiani et al.: Carrier Probabilites for BRCA1 and BRCA2 155
It is also interesting to focus on the probability, p*,that family member 1 is a carrier and to consider hy-pothetical changes in the cancer status of other familymembers. We begin by assuming that the 30-year-oldniece had breast cancer at age 30 years; then the prob-abilities are those given in table 5, showing a very sub-stantial increase.
If the 38-year-old niece (family member 6) had breastcancer at age 38 years, then the probabilities are thosegiven in table 6. The impact on p* is smaller than it isfor the probabilities given in table 5, for two reasons:the older age makes it less likely that breast cancer isdue to BRCA1, and the niece’s mother is disease free atage 58 years and is therefore less likely to carry themutation than are the parents of the 30-year-old niece,about whom nothing is known.
To separate the two effects, assume that the 38-year-old niece had breast cancer at age 30 years. Then theprobabilities are those given in table 7.
Next, assume that the 40-year-old niece (family mem-ber 5) had breast cancer at age 30 years. Then, the prob-abilities are those given in table 8, which is so largebecause the 40-year-old niece’s mother had ovariancancer.
Finally, consider the case in which no informationabout either the mother’s age or her cancer status wasavailable; the results are given in table 9. This strength-ens the contribution of the maternal aunt, greatly in-creasing p*.
Our model can be used to make predictions about theoccurrence of cancer in healthy family members. Thepredicted cancer rate R (either breast cancer or ovariancancer or both) at age a is
R(aFfam.hist.) 5
2 2OO P[BRCA1 5 i , BRCA2 5 i Ffam.hist.]1 2i 50 i 501 2
R(aFBRCA1 5 i , BRCA2 5 i ) .1 2
Using this expression, we can compare our model’s re-sults against the similar predictions provided by Clauset al. (1994, table 4). We focus on family 2. BecauseClaus et al. (1994) consider only breast cancer, we mod-ified family 2 by assuming that family member 2 hadbreast cancer rather than ovarian cancer. A comparisonof the cumulative incidence curves for an individual withthe same family history as has been presented for familymembers 3 and 4 is shown in figure 9. In this case, thepredictions based on our model are lower than those ofClaus et al., primarily as the result of the large numberof unaffected members in the pedigree. We also per-formed a probabilistic sensitivity analysis of the samepredictions, on the basis of the distributions discussed
in the Evidence subsection. The results, for both breastcancer and ovarian cancer, are shown in figure 10.
Discussion
In this paper we have discussed a model for evaluatingthe probability that a woman is a carrier of a geneticmutation in the BRCA1 and BRCA2 genes, on the basisof her family’s history of breast cancer and ovarian can-cer in first- and second-degree relatives. We use a Bay-esian approach to incorporate both the uncertaintyabout family members’ genetic status and the uncer-tainty about the prevalence of the mutation in the pop-ulation and about the cancer rates for carriers.
Our model is currently being used in a randomizedtrial comparing tailored material to standard printedmaterial, in genetic counseling. Women in the tailored-information arm receive estimates of the probability thatthey carry a mutation of BRCA1 or BRCA2, computedon the basis of the model described here. The infor-mation is presented in graphical (pie chart), numerical,or verbal format, depending on patient preference.Counselees are provided with a range of probabilitiesreflecting uncertainty about the genetic parameters, ob-tained according to the procedure discussed in the Un-certainty about Genetic Parameters subsection. The soft-ware used to perform the calculations is available tointerested investigators, for noncommercial purposes;thus far, it has been licensed to sites that are using it incounseling and in genetic epidemiology research.
The penetrance and prevalences used by the model arestored in an external file, which is input to the program.In this way, it is convenient to create customized com-putations for subpopulations with different genetic par-ameters. For example, recent investigations (e.g., Od-doux et al. 1996; Roa et al. 1996; Struewing et al. 1997)suggest that mutations that are specific to the AshkenaziJewish population may be associated with prevalenceand penetrance functions different from those reportedby Easton and colleagues. We have developed an anal-ysis, parallel to that described here, that can be used incounseling women of Ashkenazi Jewish ancestry.
We have considered BRCA1 and BRCA2 and regardall other breast cancer as being sporadic. This is a lim-itation of our model, since additional breast cancer genesor ovarian cancer genes may exist (Hakansson et al.1997; Vehmanen et al. 1997). Including other genes andconsidering all other breast and ovarian cancer as beingsporadic would give a different probability—usuallysmaller—that a woman carries BRCA1 and BRCA2. Itwould also give a different probability—larger—that acounseland carries at least one mutation in one or morebreast cancer genes. Our procedure can be modified toinclude additional genes; however, such a modificationwould require information, not yet available, about the

156 Am. J. Hum. Genet. 62:145–158, 1998
age-specific incidence of breast cancer and ovarian can-cer resulting from such genes.
Spontaneous mutations of BRCA1 and BRCA2 arenot currently incorporated in our model, again becauseof the lack of relevant empirical evidence. In the presenceof spontaneous mutations, the probability that an in-dividual carries a mutation is higher than our modelpredicts for cancer cases and is lower than our modelpredicts for noncancer cases. Also, compared with ourresults, the possibility of spontaneous mutations reducesthe predictive power of the family history.
Environmental or other factors may modify the sus-ceptibility to cancer, in carriers of mutations. A modelexplicitly incorporating such individual covariate infor-mation is likely to perform better that ours. In family2, discussed in this section, additional covariate infor-mation may help us to infer the genetic status of themother, a key element in the calculation. Was she a car-rier exposed to factors either delaying onset or pre-venting cancer from developing? Unfortunately, again,knowledge about relevant factors is, at present, insuf-ficient for quantitative analysis of this kind of question.
Although important, all these limitations are rootedin uncertainties regarding familial breast cancer. We ex-pect important progress in this area in the near future.Models tailored to the new information could then bedeveloped by means of the approach outlined here.
Acknowledgments
This research was supported by the National Institutes ofHealth, under the SPORE in breast cancer at Duke University,grant P50 CA68438, and by a seed grant from the Arts andSciences Research Council, Duke University. The authorsthank Andy Futreal, Joellen Schildkraut, and Marcy Speer forhelpful input and suggestions.
Appendix
Description of the Program Used for Calculation of theExpression P[fam. hist.FBRCA1,BRCA2]
The structure of a pedigree, including information onfirst- and second-degree relatives of a given counselandindividual, is specified by the following quantities: thenumber of siblings, ns; the number of mother’s siblings,na; the number of father’s siblings, nA; the number ofoffspring, nd; and the number of offspring of sibling t,n(t), where . For each family member, thet 5 1, ) , ns
contribution to the likelihood function depends on theage a; the genetic status of BRCA1, i; the genetic statusof BRCA2, j; and the disease status. We denote by
and the cumulative incidence curves forij ijR (a) R (a)B O
breast cancer and ovarian cancer, respectively, and wedenote by r the incidence curve, or the first derivativeof R. For member m, since breast cancer incidence andovarian cancer incidence are assumed to be independent,conditional on genetic status, the conditional probabilityof disease history, given genetic status, , factors intoijrm
two disease-specific terms, as , whereij B,ij O,ijr 5 r rm m m
ijr (a) if m had ovarian cancer at aOO,ijr 5m ij{1 2 R (a) if m was free of ovarian cancer until aO
and is defined similarly, with the exception of theB,ijrm
possible adjustment for bilateral breast cancer, as de-scribed in the Methods section.
Incorporation of each member’s contribution is basedon two basic building blocks: updating of data on off-spring, given data on their parents (implemented by thed functions, for downward), and updating of data onparents, given data on their offspring (implemented bythe u functions, for upward). The downward updateswill be applied, in turn, to each of the counseland’s off-spring, to siblings and their offspring, and to parents’siblings. The upward update will be applied to thecounseland, to her parents, and to her grandparents. Thecomputation of likelihood function requires a recursiveuse of these functions, as described below.
To define the basic downward function for a genericgroup of offspring of the same parents, let m1 and m2
be the BRCA1 genetic status and the BRCA2 geneticstatus of the offspring’s mother, and let f1 and f2 be theBRCA1 genetic status and the BRCA2 genetic status ofthe offspring’s father. Then, the downward step is
d(m , m , f , f ,n) 51 2 1 2
2 2n ijP OO r P[iFm , f ]P[jFm , f ] .m51 m 1 1 2 2
i50 j50
Here, the subscript m ranges over the set of siblings ofthe same parents, and the argument n can take valuesnd, na, nA, or n(t).
The contribution of the counseland’s siblings, givenboth the genetic status of the counseland’s mother andthe genetic status of the counseland’s father, is then
d (m , m , f , f ) 5S 1 2 1 2
2 2ns ijP OO r P[iFm , f ]P[jFm , f ]m51 m 1 1 2 2
i50 j50
2 2
ij [ ]OO r P[k, l]d i, j, k, l, n(t) ,q(m)k50 l50
where m ranges over the set of counseland’s siblings andq(m) indicates the corresponding mate. If there are no

Parmigiani et al.: Carrier Probabilites for BRCA1 and BRCA2 157
offspring of sibling t, then , , and ijn(t) 5 0 d 5 1 r 5q(m)
. The expression above assumes that no family history1is available for the siblings’ mates.
The information about the counseland’s parents andgrandparents will be incorporated via the upward struc-ture. For both the maternal and paternal grandparents,we use
u (o , o ) 5G 1 2
2 2 2 2
ij klOOOO r rm m1 2i50 j50 k50 l50
P[i, kFo ]P[j, lFo ]d(i, j, k, l, n) ,1 2
where m1,m2 is a pair of grandparents. andP[i, kFo ]1
are calculated as was calculated in theP[j, lFo ] P[m, fFo]2
Updating subsection. These functions can be used toincorporate the contribution of the counseland’s parents,given the counseland’s own genetic status; as above, thisis described by the variables BRCA1 and BRCA2. Then
u (BRCA1, BRCA2) 5p
2 2 2 2
ij klOOOO r rm m1 2i50 j50 k50 l50
P[i, kFBRCA1]P[j, lFBRCA2]d (i, j, k, l)u (i, k)u (j, l) ,S g g
where m1,m2 are the counseland’s parents. Finally, wecan combine all of these expressions and incorporate theinformation on the counseland by means of
P[family historyFBRCA1 5 i, BRCA2 5 j]2 2
ij ij5 r u (i, j)OO r P[k, l]d(i, j, k, l, n ) ,m p q(m) dk50 l50
for . Here, m is the counseland, and q(m) isi, j 5 0, 1, 2the counseland’s mate.
References
Andersen TI (1996) Genetic heterogeneity in breast cancer sus-ceptibility. Acta Oncol 35(4): 407–410
Berry DA, Parmigiani G, Sanchez J, Schildkraut JM, Winer E(1997) Assessing the probability of carrying a breast cancergene BRCA1 based on family history. J Natl Cancer Inst89(3): 9–20
Claus EB, Risch N, Thompson WD (1991) Genetic analysisof breast cancer in the Cancer and Steroid Hormone Study.Am J Hum Genet 48:232–242
Claus EB, Risch N, Thompson WD (1994) Autosomal dom-inant inheritance of early-onset breast cancer: implicationsfor risk prediction. Cancer 73:643–651
Couch FJ, DeShano ML, Blackwood MA, Calzone K, StopferJ, Campeau L, Ganguly A, et al (1997) BRCA1 mutationsin women attending clinics that evaluate the risk of breastcancer. N Engl J Med 336:1409–1415
Easton DF, Ford D, Bishop DT, Breast Cancer Linkage Con-sortium (1995) Breast and ovarian cancer incidence inBRCA1-mutation carriers. Am J Hum Genet 56:265–271
Easton DF, Steele L, Fields P, Ormiston W, Averill D, Daly PA,McManus R, et al (1997) Cancer risks in two large breastcancer families linked to BRCA2 on chromosome 13q12-13. Am J Hum Genet 61:120–128
Falconer DS, Mckay TFC (1996) Quantitative genetics. Long-man, Harlow, United Kingdom
Ford D, Easton DF (1995) The genetics of breast and ovariancancer. Br J Cancer 72:805–812
Futreal PA, Liu Q, Shattuck-Eidens D, Cochran C, HarshmanK, Tavtigian S, Bennett LM, et al (1994) BRCA1 mutationsin primary breast and ovarian carcinomas. Science 226:120–122
Gail MH, Brinton LA, Byar DP, Corle DK, Green SB, SchairerC, Mulvihill JJ (1989) Projecting individualized probabilitiesof developing breast cancer for white females who are beingexamined annually. J Natl Cancer Inst 81:1879–1886
Hakansson S, Johannsson O, Johansson U, Sellberg G, LomanN, Gerdes A-M, Holmberg E, et al (1997) Moderate fre-quency of BRCA1 and BRCA2 germ-line mutations in Scan-dinavian familial breast cancer. Am J Hum Genet 60:1068–1078
Hoskins KF, Stopfer JE, Calzone KA, Merajver SD, RebbeckTR, Garber JE, Weber BL (1995) Assessment and counselingfor women with a family history of breast cancer: a guidefor clinicians. JAMA 273:577–585
Houwing-Duistermaat JJ, Van Houwelingen JC (1997) A fam-ily history score for breast cancer. Genet Epidemiol 14:530
Leal SM, Ott J (1994) A likelihood approach to calculatingrisk support interval. Am J Hum Genet 54:913–917
Miki Y, Swensen J, Shattuck-Eidens DJ, Futreal PA, HarshmanK, Tavtigian S, Liu Q (1994) A strong candidate for thebreast and ovarian cancer susceptibility: gene BRCA1. Sci-ence 266(7): 66–71
Moolgavkar SH, Stevens RG, Lee JAH (1979) Effect of ageon incidence of breast cancer in females. J Natl Cancer Inst62:493–501
Murphy EA, Mutalik GS (1969) The application of Bayesianmethods in genetic counseling. Hum Hered 19:126–151
Oddoux C, Struewing JP, Clayton CM, Neuhausen S, BrodyLC, Kaback M, Haas B, et al (1996) The carrier frequencyof the BRCA2 6174delT mutation among Ashkenazi Jewishindividuals is approximately 1%. Nat Genet 14:188–190
Roa BB, Boyd AA, Volcik K, Richards CS (1996) AshkenaziJewish population frequencies for common mutations inBRCA1 and BRCA2. Nat Genet 14:185–187
Shattuck-Eidens D, McClure M, Simard J, Labrie F, Narod S,Couch F, Hoskins K, et al (1995) A collaborative survey of80 mutations in the BRCA1 breast and ovarian cancer sus-ceptibility gene: implications for presymptomatic testing andscreening. JAMA 273:535–541
Struewing JP, Hartge P, Wacholder S, Baker SM, Berlin M,McAdams M, Timmerman MM, et al (1997) The risk ofcancer associated with specific mutations of BRCA1 andBRCA2 among Ashkenazi Jews. N Engl J Med 336:1401–1408
Szabo CI, King M-C (1997) Population genetics of BRCA1and BRCA2. Am J Hum Genet 60:1013–1020
Szolovits P, Pauker S (1992) Pedigree analysis for genetic coun-

158 Am. J. Hum. Genet. 62:145–158, 1998
seling, In: Lun KC, Degoulet P, Piemme TE, Rienhoff O (eds)MEDINFO-92: proceedings of the Seventh Conference onMedical Informatics. Elsevier, New York, pp 679-683
Thompson EA (1986) Pedigree analysis in human genetics.Johns Hopkins University Press, Baltimore
Thompson EA, Guo SW (1991) Evaluation of likelihood ratiosfor complex genetic models. IMA J Math Appl Med Biol 8:149–169
Vehmanen P, Friedman LS, Eerola H, Sarantaus L, Pyrhonen
S, Ponder BAJ, Muhonen T, et al (1997) A low proportionof BRCA2 mutations in Finnish breast cancer families. AmJ Hum Genet 60:1050–1058
Wooster R, Bignell G, Lancaster J, Swift S, Seal S, MangionJ, Collins N, et al (1995) Identification of the breast cancersusceptibility gene BRCA2. Nature 378:789–792
Yancik R (1993) Ovarian cancer: age contrasts in incidence,histology, disease stage at diagnosis, and mortality. Cancer71 Suppl 2:517–523
Copyright © 2022 FDOKUMEN