Determination of the Recreational Value of Botanic Gardens. A Case Study RoyalBotanic Gardens, Kew,...
22
Revista de cercetare [i interven]ie social\ ISSN: 1583-3410 (print), ISSN: 1584-5397 (electronic) Selected by coverage in Social Sciences Citation Index, ISI databases DETERMINATION OF THE RECREATIONAL VALUE OF BOTANIC GARDENS. A CASE STUDY ROYAL BOTANIC GARDENS, KEW, LONDON Aynur DEMIR Revista de cercetare [i interven]ie social\, 2014, vol. 44, pp. 160-180 The online version of this article can be found at: www.rcis.ro, www.doaj.org and www.scopus.com Published by: Expert Projects Publishing House On behalf of: „Alexandru Ioan Cuza” University, Department of Sociology and Social Work and Holt Romania Foundation REVISTA DE CERCETARE SI INTERVENTIE SOCIALA is indexed by ISI Thomson Reuters - Social Sciences Citation Index (Sociology and Social Work Domains) Working together www.rcis.ro expert pr ojects publish ing
Transcript of Determination of the Recreational Value of Botanic Gardens. A Case Study RoyalBotanic Gardens, Kew,...

3
Revista de cercetare [i interven]ie social\
ISSN: 1583-3410 (print), ISSN: 1584-5397 (electronic)
Selected by coverage in Social Sciences Citation Index, ISI databases
DETERMINATION OF THE RECREATIONAL VALUEOF BOTANIC GARDENS.
A CASE STUDY ROYAL BOTANIC GARDENS, KEW, LONDON
Aynur DEMIR
Revista de cercetare [i interven]ie social\, 2014, vol. 44, pp. 160-180
The online version of this article can be found at:
www.rcis.ro, www.doaj.org and www.scopus.com
Published by:
Expert Projects Publishing House
On behalf of:
„Alexandru Ioan Cuza” University,
Department of Sociology and Social Work
and
Holt Romania Foundation
REVISTA DE CERCETARE SI INTERVENTIE SOCIALA
is indexed by ISI Thomson Reuters - Social Sciences Citation Index
(Sociology and Social Work Domains)
Working togetherwww.rcis.ro
expert projectspublishing
160
REVISTA DE CERCETARE SI INTERVENTIE SOCIALA - VOLUME 44/2014
Determination of the Recreational Valueof Botanic Gardens. A Case Study Royal
Botanic Gardens, Kew, London
Aynur DEMIR1
Abstract
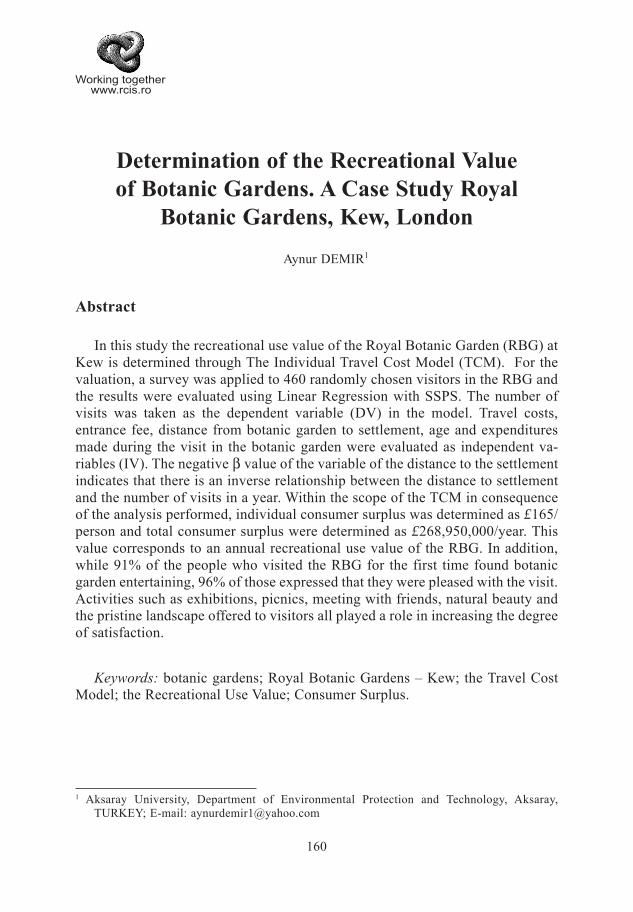
In this study the recreational use value of the Royal Botanic Garden (RBG) atKew is determined through The Individual Travel Cost Model (TCM). For thevaluation, a survey was applied to 460 randomly chosen visitors in the RBG andthe results were evaluated using Linear Regression with SSPS. The number ofvisits was taken as the dependent variable (DV) in the model. Travel costs,entrance fee, distance from botanic garden to settlement, age and expendituresmade during the visit in the botanic garden were evaluated as independent va-riables (IV). The negative β value of the variable of the distance to the settlementindicates that there is an inverse relationship between the distance to settlementand the number of visits in a year. Within the scope of the TCM in consequenceof the analysis performed, individual consumer surplus was determined as £165/person and total consumer surplus were determined as £268,950,000/year. Thisvalue corresponds to an annual recreational use value of the RBG. In addition,while 91% of the people who visited the RBG for the first time found botanicgarden entertaining, 96% of those expressed that they were pleased with the visit.Activities such as exhibitions, picnics, meeting with friends, natural beauty andthe pristine landscape offered to visitors all played a role in increasing the degreeof satisfaction.
Keywords: botanic gardens; Royal Botanic Gardens – Kew; the Travel CostModel; the Recreational Use Value; Consumer Surplus.
1 Aksaray University, Department of Environmental Protection and Technology, Aksaray,TURKEY; E-mail: [email protected]
Working togetherwww.rcis.ro

161
Introduction
Botanic gardens constitute a special garden category, being scientifically based,having spectacular vegetation designs, focusing on the plant conservation andcontributing to environmental training. Botanic gardens assume an important rolein drawing people and plants together. They give us pleasure by displaying theattractive characteristics of the rare plants, also serving as natural laboratories forbotanical researchers and they have a key role in the protection of endangeredspecies (Oldfield, 2007). Botanic gardens are also establishments where plantcollections are protected, displayed, holding various documents for training andscientific research and they also play an important role in the entertainment,recreation and resting of the people (Anonymous, 2011a). When considered fromthis aspect, they have a significant economical value in terms of recreation andeco-tourism, in particular.
Recreational activities are generally chosen by the participants who expect toderive a “benefit” from the activity. The value of this benefit for a participant, interms of economic impact is partly reflected by the amount which a participant iswilling to pay to enjoy the activity. If there is an entrance fee for a botanic garden,this can be said to be the price or economic value of the benefit to the participant.Travel costs and the cost of time spent getting to and from the recreation site areparts of the “price”, not only the entrance fee. The participant or consumer of thebenefit derives enjoyment from the visit in return. Generally the value of theamount is calculated as the “consumer surplus” (Garrod et al., 1993; Shresha etal., 2002).
In this study, the Travel Cost Model (TCM) was used in determining the valueof recreation. The advantages of using this technique include its origins in con-sumer theory, reliance on actual market data of travel costs, and the ability torepresent consumer preferences accurately (Shresha et al., 2002). The TCM hasbeen widely used in the past for the values of recreational activities (Bennett,1996; Haab and McConnell, 2002; Prayaga et al., 2010). However, there arerelatively few papers that have assessed the recreational value of botanic gardens(Garrod et al., 1993). When considered from this point of view, this study and itsresults are thought to contribute to the sustainable utilization of botanic gardensfor recreational purposes. This increases the importance and significance of thestudy.
The value of goods and services traded in the market place are reflected bytheir prices. Clearly, botanic garden services are not bought and sold in a com-petitive market setting. A central problem in estimating the value of naturalresources is that many of their services are not commonly traded in competitivemarkets. Botanic gardens services have value in current use, value in the optionfor future use, or value in existence. Existence value is generated by simply
REALITIES IN A KALEIDOSCOPE

162
REVISTA DE CERCETARE SI INTERVENTIE SOCIALA - VOLUME 44/2014
knowing that some commodity exists, while use the value occurs as a result of thesatisfaction derived from resource use (Randall and Stoll., 1983; Downing andRoberts, 1991).
Botanic gardens are collections of plants, a great number of which are priceless,but not valueless (Oldfield, 2010). Even though there are many rare and uniquespecies in the world, choices and decisions are made on a regular basis thatimplicitly assign a finite value to them. Not only the individual plants but alsogroups or families, individuals in a collection, collections themselves and groupsof collections have value. Furthermore, the land upon which the collections arelocated, historical buildings, associated landmarks and the recreational expe-riences of people visiting gardens have value.
Evidence of the demand for services provided by botanic gardens is reflectedin a variety of ways. Thousands of people visit botanic gardens each year. Aplethora of gardening books, identification manuals and reference materials arepublished each year and several magazines are devoted entirely to plants and thelives of plants. All of these are indicative of a broad national interest in plants andgardens, indentifying botanic gardens as museums of living natural resources.
The main objective of this study is to determine the recreational use values atRoyal Botanic Gardens (RBG), Kew by using the TCM. In this study the deter-mination of use value, demand for recreational use and the variables (socio-economical, cultural and demographical) affecting the tendency of users to paythe entry fee to RBG were examined. It is considered that the results of thiscomparison will guide the cost-benefit analyses which also include the envi-ronmental costs and will play a key role in developing policies concerning theprotection of natural sites. In accordance with the results obtained, proposals maybe developed to ensure sustainability with the rational use of the site by providingthe current and future benefits to be taken into account depending on the recre-ational use of RBG.
In the development, protection and rational use of botanic gardens, which arethe assurance of sustainable use of biological resources, such studies and theexpansion of these studies are seen as extremely important.
Methodology
Data Collection
Data required for the research was obtained by an extensive literature searchrelating to botanic gardens, a field study, observations, photographic and surveyapplications. In accordance with the data acquired, survey questions were preparedconcerning the Travel Cost Method. The target audience surveyed with ques-tionnaires were visitors to the RBG over the age of 18. For the determination of
163
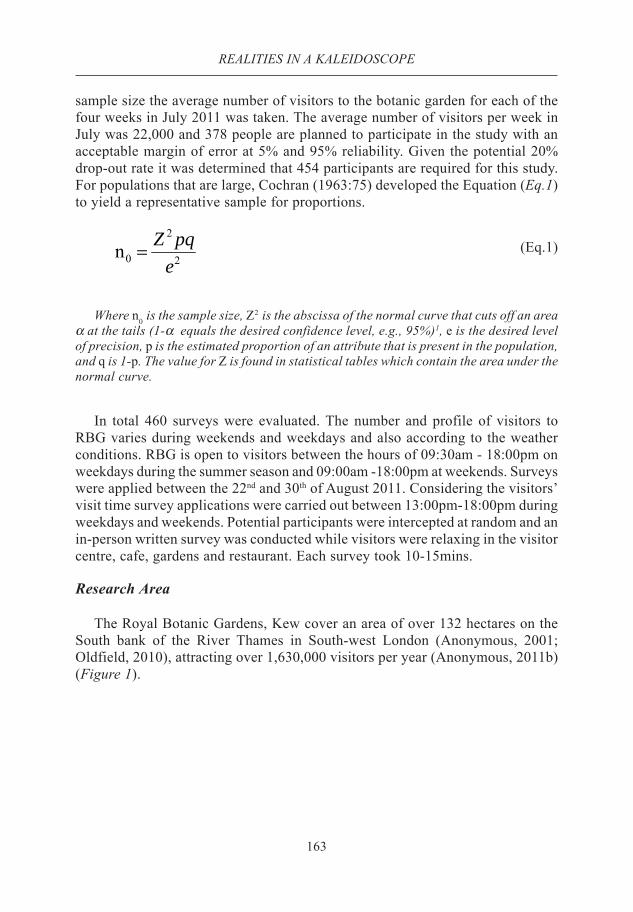
sample size the average number of visitors to the botanic garden for each of thefour weeks in July 2011 was taken. The average number of visitors per week inJuly was 22,000 and 378 people are planned to participate in the study with anacceptable margin of error at 5% and 95% reliability. Given the potential 20%drop-out rate it was determined that 454 participants are required for this study.For populations that are large, Cochran (1963:75) developed the Equation (Eq.1)to yield a representative sample for proportions.
(Eq.1)
Where n0 is the sample size, Z2 is the abscissa of the normal curve that cuts off an area
α at the tails (1-α equals the desired confidence level, e.g., 95%)1, e is the desired levelof precision, p is the estimated proportion of an attribute that is present in the population,and q is 1-p. The value for Z is found in statistical tables which contain the area under thenormal curve.
In total 460 surveys were evaluated. The number and profile of visitors toRBG varies during weekends and weekdays and also according to the weatherconditions. RBG is open to visitors between the hours of 09:30am - 18:00pm onweekdays during the summer season and 09:00am -18:00pm at weekends. Surveyswere applied between the 22nd and 30th of August 2011. Considering the visitors’visit time survey applications were carried out between 13:00pm-18:00pm duringweekdays and weekends. Potential participants were intercepted at random and anin-person written survey was conducted while visitors were relaxing in the visitorcentre, cafe, gardens and restaurant. Each survey took 10-15mins.
Research Area
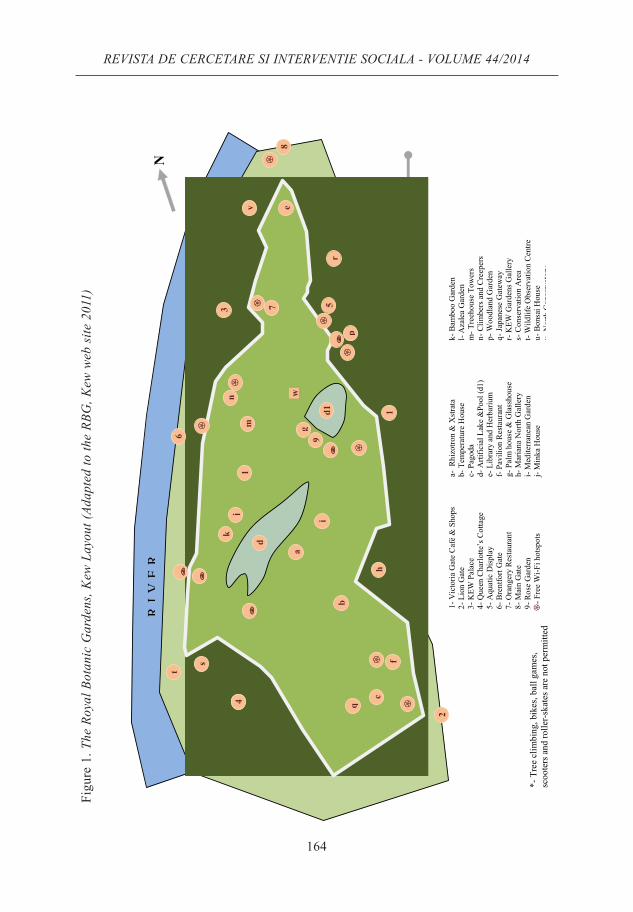
The Royal Botanic Gardens, Kew cover an area of over 132 hectares on theSouth bank of the River Thames in South-west London (Anonymous, 2001;Oldfield, 2010), attracting over 1,630,000 visitors per year (Anonymous, 2011b)(Figure 1).
2
2
0ne
pqZ=
REALITIES IN A KALEIDOSCOPE
164
REVISTA DE CERCETARE SI INTERVENTIE SOCIALA - VOLUME 44/2014
Fig
ure
1. T
he R
oyal
Bot
anic
Gar
dens
, K
ew L
ayou
t (A
dapt
ed t
o th
e R
BG
, K
ew w
eb s
ite
2011
)
1- V
icto
ria G
ate
Caf
é &
Sho
ps
2- L
ion
Gat
e 3
- KEW
Pal
ace
4- Q
ueen
Cha
rlotte
’s C
otta
ge
5- A
quat
ic D
ispl
ay
6- B
rent
fort
Gat
e 7
- Ora
nger
y R
esta
uran
t 8
- Mai
n G
ate
9- R
ose
Gar
den
- Fre
e W
i-Fi h
otsp
ots
a- R
hizo
tron
& X
stra
ta
b- T
empe
ratu
re H
ouse
c-
Pag
oda
d- A
rtific
ial L
ake
&Po
ol (d
1)
e- L
ibra
ry a
nd H
erba
rium
f-
Pav
ilion
Res
taur
ant
g- P
alm
hou
se &
Gla
ssho
use
h- M
aria
na N
orth
Gal
lery
i-
Med
iterr
anea
n G
arde
n j-
Min
ka H
ouse
N
k- B
ambo
o G
arde
n l-
Aza
lea
Gar
den
m- T
reeh
ouse
Tow
ers
n- C
limbe
rs a
nd C
reep
ers
p- W
oodl
and
Gar
den
q- Ja
pane
se G
atew
ay
r- K
EW G
arde
ns G
alle
ry
s- C
onse
rvat
ion
Are
a t-
Wild
life
Obs
erva
tion
Cen
tre
u- B
onsa
i Hou
se
vN
orth
Con
serv
ator
y*-
Tre
e cl
imbi
ng, b
ikes
, bal
l gam
es,
scoo
ters
and
rolle
r-sk
ates
are
not
per
mitt
ed
500
Yar
ds
1
2
3 4
j
6
7 8
b
a
c
e
g w
hf
5 i
k
l m
n4
p
q
t
s
r
9
d
d1
RI
VE
R
v

165
The vast number and variety of plants on display allows the nature of KewGardens to change according to the seasons. Out in the grounds and inside theplant houses, thousands of specimens’ progress through their annual flowering,fruiting, growing and resting cycles. All year long, there are plants to be seen attheir glorious best (Anonymous, 2001; Raven, 2006). But Kew is much more thanone of the world’s best showpiece gardens. It’s an internationally respected centreof scientific excellence, identifying and classifying plants, researching their struc-ture, chemistry and genetics, collecting and conserving endangered species, main-taining reference collections and sharing all this knowledge with interested partiesthroughout the World (Anonymous, 2001; Oldfield, 2007; Anonymous, 2011a).
RBG, Kew hosts one of the world’s greatest botanical gardens with extensiveliving collections, millions of herbarium specimens, a rapidly expanding seedbank and an important library and repository of botanical art. It is an internationalcentre of economic botany and research in taxonomy, molecular biology andbiological interactions. World plant conservation is one of its principal missionsand its work includes scientific expertise in plant diversity and sustainable de-velopment in the UK and around the world (Desmond, 2007).
It was accepted as a UNESCO World Heritage Site in July 2003, representingthe historical landscape of the past 250 years. The site houses over 40 listedbuildings and other impressive structures including the Palm House, TemperateHouse, Orangery and Pagoda as well as two ancient monuments, Queen Charl-otte’s Cottage and Kew Palace (Desmond, 2007; Blomfield, 2011). There aremany activities that can attract the attention of local and foreign visitors. Forexample, visitors can sit and read in the natural beauty, take a walk or have apicnic, visit an exhibition or museum, get information about the collections ofplants that grow in many parts of the world, have a nice lunch in the restaurant andcafeteria, shop or meet with friends (Figure 2). The presence of the entertainingand training areas plays an important educational role for school visits. All theseservices offered increase the use of RGB for recreation and eco-tourism purposes.
REALITIES IN A KALEIDOSCOPE

166
REVISTA DE CERCETARE SI INTERVENTIE SOCIALA - VOLUME 44/2014
Figure 2. Artificial Lake and Bridge from KEW (Sackler Crossing) (Photo by author,2011)
Figure 3. Waterlily House from KEW (Photo by author, 2011)
167
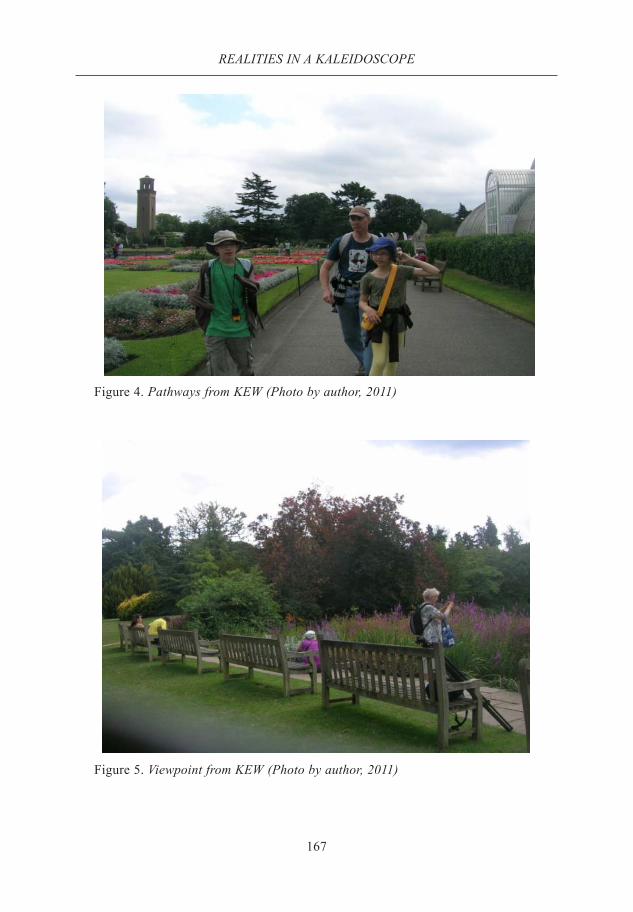
Figure 4. Pathways from KEW (Photo by author, 2011)
Figure 5. Viewpoint from KEW (Photo by author, 2011)
REALITIES IN A KALEIDOSCOPE

168
REVISTA DE CERCETARE SI INTERVENTIE SOCIALA - VOLUME 44/2014
Figure 6. Exhibition Area from KEW (Photo by author, 2011)
Figure 7. Information Panel from KEW (Photo by author, 2011)

169
The Individual Travel Cost Model (TCM)
The travel-cost model assumes that an individual must visit a botanic gardento use its services. The non-market benefits accruing per person from the botanicsite can be inferred from the relationship between travel-cost expenditures and thenumber of visits to the botanic site (Eq.2) (Pak, 2003; Lamtrakul et al., 2005;Hanley and Barbier, 2009; Mwebaze and Bennetta, 2011). Travel cost is used asa proxy for an entry price, with a change in price causing a change in consumption(Freeman, 1993; Mwebaze and Bennetta, 2011). In general, Individual TCM isformulated as follows (Wills and Garrod, 1991; Garrod et al., 1991; Iamtrakul etal., 2005; Hanley and Barbier, 2009):
Vij = f (TC
ij, SS
ij, X
ij, e
i) (Eq. 2)
In the formula: Vij;Number of visits by individual i to botanic site j in the previous 12
months, TCij;Travel cost variables by individual i to gain access to botanic garden /site j,
these include distance costs for each individual i, time costs and entry fee, SSij; A dummy
variable to capture whether individual i visited a substitute site to j, (it takes on the value1 for substitute sites and zero otherwise), X
ij;Vector of socio-economic characteristics of
individual i (income, education, age), ei; Error term assumed to be normally distributed
with constant variance and zero mean.
The individual travel cost method was employed to achieve the objectives ofthis study. The first step in the travel cost method is to estimate a regression modelfor predicting visits per person to the botanic garden from a sample of visitors.This model is known as the recreation demand curve. This demand curve predictsthe quantity of visits made by survey respondents as a function of the price paidper visit and other explanatory variables such as income. Money and time spentfor the botanic garden trip (total travel expenditure) are used as proxies for pricespaid by visitors to enjoy the botanic garden.
In this study, travel costs for per person are taken into consideration. Thesewere obtained so that the variable of total travel cost could be divided into thenumber of individuals in the group. Total travel costs including transportationcosts, entrance fee, expenses within the RBG are calculated as the costs ofopportunity cost of time. It is generally accepted in previous studies that theopportunity cost of the time spent on transport and the opportunity cost of thetime spent in the Field of Recreation, namely, the economic value of the timerequired for transportation is as important as the actual cost of the travelling itselffor determining the value of the recreation demand (Pak, 2003). In this study,Cesario’s (1976) proposal to base results on 1/3 of hourly rate of individual’sincome is accepted for the calculation of the opportunity cost of recreation time
REALITIES IN A KALEIDOSCOPE

170
REVISTA DE CERCETARE SI INTERVENTIE SOCIALA - VOLUME 44/2014
(Pak, 2003). In the calculation of travel costs, car running costs were estimated at£0.35 per mile, which takes account of the fuel cost and fixed costs such asdepreciation, road tax, insurance and service costs (Anonymous, 1989). Thisapproach has been adopted in previous travel-cost studies, in one of which asurvey confirmed that such estimates of full car running costs are close to thecosts that respondents estimate themselves for their trip (Willis and Garrod, 1991;Garrod et al., 1991).
Following the data collection work the Demand Function Model for RGB wascreated. In this study, Linear regression analysis was preferred as it is thought toprovide continuity within the data set. In the standard, or simultaneous, model, allIVs enter into the regression equation at once; each one is assessed as if it hadentered the regression after all other IVs been had entered. Each IV is evaluatedin terms of what it adds to the prediction of the DV that is different from thepredictability afforded by all the other IVs. (Tabachnick et.al, 2001), (Eq 2) hasthe simple and convenient property of allowing the estimation of consumer surplusper visit as the inverse of the travel cost coefficient (Englin and Shonkwiler, 1995;Shrestha et al., 2002; Prayaga et al., 2010). Data analysis was performed usingSPSS for Windows, version 11.5 (SPSS Inc., Chicago, IL, United States). Datawere shown as mean ± standard deviation for metric discrete variables and numberof cases and percentages for categorical ones. The differences regarding to thediscrete data among groups were analyzed by Kruskal Wallis test followingConover’s multiple comparison test. Categorical data were evaluated by Pearson’sChi-Square or Fisher’s exact test, where applicable. After the assessment, “Num-ber of visits” was taken as the dependent variable. Determining the most importantpredictive factor(s) which affects the difference in numbers of visit (i.e. dependentvariable) was evaluated by “Linear Regression” analysis Coefficient of regression,95% confidence intervals for each independent variable was also calculated. A pvalue less than 0.05 was considered statistically significant.
After the determination of the demand function, individual consumer surplus2
was calculated. Total consumer surplus was calculated by multiplying the cal-culated values of the individual consumer surplus with the number of visitors whovisit the area in a year, 1 million 630 thousand people (Anonymous, 2011b). Thisamount of surplus represents the annual Total Value of Recreational Use. Thedemand patterns and Consumer surplus for recreational visits is set out in Equation3. (Englin and Shonkwiler, 1995; Shrestha et al., 2002; Pak, 2003; Prayaga et al.,2010):
2 Consumer surplus or consumers’ surplus is the monetary gain obtained by consumers becausethey are able to purchase a product for a price that is less than the highest price that they wouldbe willing to pay. Producer surplus or producers’ surplus is the amount that producers benefitby selling at a market price that is higher than the least that they would be willing to sell for(Englin and Shonkwiler, 1995; Shrestha et al., 2002).

171
InVr = β
0- β
1TC+ β
2X
2+ β
3X
3+……. β
nX
n +e
i (Eq.3)
CS = - 1/ βTC
CS = q/ - βWhere; V
r ; the expected number of visits, TC; travel costs per trip, X
n ; a vector of
explanatory variables affecting demand. CS; individual consumer surplus. q; the averagenumber of visits made by the individual in a year, β: the slope of the demand function(expenditure coefficient)
Results and discussions
The results of the analysis are presented in two parts. First, we present anddiscuss the estimated travel cost models (Section 3.1), followed by the pre-sentation and discussion of the results of the economic analysis (Section 3.2).
Estimated Travel Cost Models
According to the results of the survey carried out at the RBG, Kew, 39% ofvisitors were male and 61% were female. It was seen from the results of thesurvey that there is a wide range of age groups of visitors. When visitors wereanalysed according to age group it was determined that the majority of visitorswere between the ages of 26-65. There is a positive relationship between age andfrequency of visits. It was seen that visitors between the ages 36-45 are especiallypredominant. The data showed that 51% of visitors had a university degree, andthat 32% of visitors had a post-graduate degree. Professionally speaking it wasseen that 32% worked in the private sector, and 24% had retired, with 20% ofvisitors incomes between £20,000 - 30,000 and 22% with £50,000 and above. Itwas determined that 68% of the visitors come from Britain and that 32% of thevisitors came from other countries. The purpose of visiting the botanic gardensand the factors affecting the nature of visit were also analysed. The data collectedshowed that 44% of visitors were in the RBG for the sole purpose of enjoying theaesthetically pleasing landscape, another 34% were there on picnics and enter-tainment, and 15% for eco-tourism. Visitors were also asked if they felt the visithad been good value for money, with 95% of visitors stating that the visit wasindeed good value for money and 98% stated that they had had fun in the RBG.While 62% of participants have come to the RBG for the first time, 17% havebeen 2-4 times. The relationship between the number of visits and the independentvariables were also evaluated in the analysis. According to the results of thisanalysis, time and money spent in the botanic garden decreases as the number ofvisits increases. This is directly related to the proximity of the settlement of theparticipants to the RBG. Another important association was observed between thenumber of visits and satisfaction level of visitors, age, education, level of income.
REALITIES IN A KALEIDOSCOPE

172
REVISTA DE CERCETARE SI INTERVENTIE SOCIALA - VOLUME 44/2014
As previously mentioned the number of visits decreases as the distance frombotanic garden to settlement increases. There is also a significant relationshipbetween the number of visits and the purpose of visits. In particular as the numberof visits increases, recreational activities such as enjoying the landscape, pic-nicking and entertainment positively affect the number of visits (Table 1).
Table 1.The Demographic distribution and the relationship between the independentvariables and the number of visits according to the survey results of Travel Cost Method
The number of visits (%) Variables n=460 % First Time 2-4 Times 3-6 Times More than 6 p-value AGE <0.001 18-25 34 7.5 10.7 5.2 - - 26-35 84 18.5 22.1 15.6 7.1 12.1 36-45 82 18.1 15.3 22.1 32.1 18.2 46-55 95 21.0 22.8 23.4 7.1 16.7 56-65 88 19.4 18.1 23.4 25.0 18.2 66+ 70 15.5 11.0 10.4 28.6 34.8 GENDER Male 179 39.0 Female 280 61.0 EDUCATION 0.100 Primary school only 4 0.9 0.7 1.3 - 1.5 Secondary school 75 16.7 18.1 10.4 18.5 17.6 Technical / University Degree 227 50.6 53.3 46.8 55.6 42.6 Post-graduate degree 143 31.8 27.9 41.6 25.9 38.2 OCCUPATION Government officer 56 12.2 Private sector 145 31.5 Self- employed 61 13.3 Unemployed 7 1.5 Retired 108 23.5 Full-time student 24 5.2 Full-time parent 9 2.0 Other 50 12.8 INCOME 0.339 Less than £ 10,000 pound 59 14.7 13.3 20.3 8.7 16.9 £10,001-20,000 61 15.2 16.1 10.1 26.1 13.5 £20,001-30,000 80 20.0 17.3 24.6 30.4 22.0 £30 .001-40,000 52 13.0 12.9 14.5 8.7 11.9 £40,001-50,000 60 15.0 14.9 10.1 8.7 23.7 More than £50,001 89 22.2 25.7 20.3 17.4 11.9 NATIONALITY Britain 315 68.5 Other 145 31.5 THE PURPOSE OF VISIT Eco-tourism 47 11 19.4 11.7 3.6 2.9 <0.001 Aesthetic and Landscape 204 45 41.7 50.6 50.0 47.1 0.454 Education 30 7 9.9 10.4 - 5.7 0.238 Scientific research 11 2.4 2.5 3.9 - 1.4 0.509 Picnic and entertainment 158 34.4 30.7 39.0 39.3 41.4 0.239 Other 10 0.5 15.5 6.5 10.7 14.3 0.215 THE DISTANCE <0.001 0-10 miles 154 34.4 15.7 41.3 67.9 87.0 11-20 miles 72 16.1 20.1 16.0 10.7 2.9 21-30 miles 44 9.8 10.9 13.3 3.6 4.3 31-40 miles 36 8.0 9.5 6.7 14.3 1.4 More than 41 miles 142 31.7 43.8 22.7 3.6 4.3 THE DEGRE of SATISFACTION 0.017 Excellent 116 25.2 21.6 28.6 25.0 38.6 Good 192 41.7 42.8 37.7 53.6 41.4 Ok 129 28.0 32.0 29.9 21.4 15.7 Poor 16 3.5 3.6 3.9 - 4.3 VISIT any OTHER BOTANIC GARDENS
YES 193 42.0 NO 262 57.0

173
In this study, the purpose of visiting the botanic gardens and the factorsaffecting the nature of visit were also analysed. The data collected showed that44% of visitors were in the RBG for the sole purpose of enjoying the aestheticallypleasing landscape, another 34% were there on picnics and entertainment, and15% for eco-tourism. The average entrance fee of RBG is £13.90. While 58% ofthe participants stated that the entrance fee was reasonable, 42% stated that it wastoo expensive. Of the participants surveyed 52% preferred to use public transport,with 37% preferring to travel by car. It was found that 92% of the visitors werefrom outside the Kew-Richmond district and arrival time of 45% of those wasbetween 31-60mins. Another 34% of visitors came from a distance of between 0-10 miles and a further 32% came from a distance of 41 miles or more. On averagevisitors spend about 4.5 hours in the RBG and spend approximately £23 (ex-cluding entrance fee) during this time. Total travel cost was calculated at about£55 per person. It was also observed from the initial analysis that 80% of thevisitors don’t have a relationship with any NGO (Non-Governmental Organi-zation) related with the environment (Table 2).
Table 2. Visits to the area according to the survey results of Travel Cost Method
Items Answers n (%) Entrance fee (Ł)3 (n=405) Ł 13.90 Too expensive 170 (42.0%) About right 233 (57.5%) Too low 2 (0.5%) Arrive at KEW (n=460) With a tour group 17 (3.7%) By car 170 (37.0%) By public transports (e.g. buses, underground,
train etc.) 238 (51.7%)
Others (e.g walking, cycling etc.) 35 (7.6%) By car median=2 (min:1-
max:6) With children(n=460) YES 104 (22.6%) NO 356 (77.4%) Place of residence (n=460) Kew/Richmond 36 (7.8%) Outside Kew/Richmond 424 (92.2%) The travel time (m/h)(n=459) Less than 30 minutes 125 (27.2%) 31-60 minutes 209 (45.4%) More than one hour 125 (27.2%) Member of NGO (n=456) YES 88 (%19.1) NO 368 (%80.0) Length of trip (hours) 4.5±1.9 Money spend during visit 22.4±24.4 Total Travel Cost 55.2±18.6
3 The entrance fee is £13.90 per person with a reduction for children, 0.A.P.’s and a season ticketis available.
REALITIES IN A KALEIDOSCOPE

174
REVISTA DE CERCETARE SI INTERVENTIE SOCIALA - VOLUME 44/2014
This function type selected in the creation of the demand model in this studyand selected for the linear regression analysis was carried out to determine thevalue of the consumer surplus found importance at the level of 0,001 and themultiple coefficient of determination of the pattern or the amount of disclosurewas determined as (R2) 39.5% (Table 3).
Table 3. Variance Analysis
* Significant at 0.001 alpha level.
The dependent variable in the model established under the travel cost methodwas the number of visits. The independent variables are travel cost, entrance fee,distance from home to botanic garden, age and the expenditures made within thebotanic garden (Table 4). The results obtained from the model variables arecompatible with theoretical expectations in the travel cost method implemen-tations. This is consistent with Creel and Loomis (1990), and Grogger and Carson(1991). The negative β value of the variable of the distance to settlement indicatesthat there is an inverse relationship between the number of visits and the distancefrom settlement. To summarize, the number of visits decreases as the distance tosettlement increases. According to the model, travel cost is another major in-fluencing factor. Travel cost as a price variable with negative sign is the mainresult of the recreation demand model indicating a downward sloping demandcurve. This implies that as the transport costs increase, botanic garden visitorswill take fewer trips. This would suggest that the price elasticity of demand fortrips (measured in terms of transport costs) is highly significant in explainingconsumer behaviour, in determining the number of annual trips to botanic sites.For example, a policy option that is characterised by changing the pricing rates ofparking fees or entrance fee might well change consumer recreational behaviour.The most influential factor on the number of visits is the entrance fee. Alternativessuch as discounts for children, season tickets or annual membership to the RBGare all offered to visitors, in an attempt to increase visitor numbers. This situationhas a positive impact on demand for recreational use of visitors particularly forthose living close to the botanic garden. All these factors play a clear role inincreasing the frequency of visits in a year.
Model Sum of Squares df value Mean Square F-Value p-değeri Regression 83,361 5 16,672 39,726 <0,001* Residual 123,385 294 ,420 Total 206,747 299

175
Table 4. Independent variables and coefficients that affect the number of visits
Results of Economic Analysis
The demand patterns and Consumer surplus (CS) for recreational visits is setout in Eq. (3). For the amount of CS, the individual consumer surplus is establishedfirst. The value q in the formula is the average of the total visits done by 460visitors participated in the economic analysis in a year. The frequency of the visitsis 2.47 (Eq.3). In general, the longer trip duration is more likely to reduce thefrequency of visits to the selected botanic gardens. The consumer surplus for theLinear Function type is as follows:
CS = £ q / -β (Eq.3)
CS = £ 2,47/-(-0.015), CS = £165 per person
Total Consumer Surplus (TCS) is obtained by multiplying the calculated valueof individual CS with the total number of visitors per year to RBG. According tothe data from the year 2011, the annual number of visits to RBG, Kew was1,630,000 (Anonymous 2011b).
Accordingly, the Total Consumer Surplus is:
TCS = CS x 1,630,000
= 165 x 1,630,000 = £268,950,000 /year.
In consequence of the analysis done and in light of these results, within thescope of TCM, individual consumer surplus was determined as £165 and totalconsumer surplus was determined at £268,950,000/year. This value correspondsto an annual recreational use value to RBG, Kew.
95.0% CI for β
Variables
Coefficient of
Regression (β)
Std. Error Standardized Coefficients
t-statistic p-value Lower
Bound Upper Bound
Constant 1.320 1.129 1.169 0.243 -0.903 3.543 Age 0.107 0.028 0.198 3.874 <0.001 0.053 0.162 Female Factor 0.091 0.083 0.057 1.099 0.273 -0.072 0.254 Education 0.109 0.058 0.094 1.869 0.063 -0.006 0.224 Income 0.051 0.035 0.114 1.445 0.150 -0.018 0.120 Other Nationalities -0.158 0.085 -0.095 -1.860 0.064 -0.324 0.009 Alternative sites -0.089 0.119 -0.052 -0.745 0.457 -0.323 0.146 The distance -0.104 0.026 -0.212 -3.966 <0.001 -0.156 -0.052 The entrance fee 0.029 0.003 0.474 9.293 <0.001 0.023 0.035 Total travel cost -0.015 0.006 -0.195 -2.485 0.014 -0.026 -0.003
REALITIES IN A KALEIDOSCOPE

176
REVISTA DE CERCETARE SI INTERVENTIE SOCIALA - VOLUME 44/2014
Conclusion
In the study, the economic value for the purpose of recreational use of theRoyal Botanic Garden at Kew is determined via the individual travel cost method.Recreational trips to the botanic gardens are an important activity in the UK andthe average number of visits is 2.47. Being a historical site, distance from the citycentre and transport costs are the predominant factors that affect the frequency ofvisits and the subsequent use of recreational amenities. Recreational trips of thosesurveyed to the botanic gardens are largely influenced by transport costs, entrancefee, distance, length of trip (hours), money spent during visit, the degree ofsatisfaction, the purpose of the visit and visitors’ socio-economic characteristicssuch as age, gender and income.
Distance from botanic garden to settlements and transportation time negativelyaffects the number of visits and as the distance increases the number of visitdecreases. However, the time and money spent in the botanic garden by visitorswho come from longer distances increases. They spend approximately 4.5 hoursand £55. This increases the recreational use value of the RBG, significantly.Especially first-time visitors and those travelling from greater distances spendlonger time in the RBG and actually spend more money.
Individual consumer’s surplus is calculated at £165/person per trip in theresearch. The estimated individual consumer’s surplus is triple the total costs anindividual had for the RBG visit. The social benefits as provided by the individualhave clearly been maximized, when it was evaluated in terms of the time spent,the visit frequency and total incurred expenses. It was estimated that the totalvalue of the recreational use to the RBG was £268,950,000/year. The most im-portant factor influencing this high value was the society’s psychology and in thissocial psychology the maximum value which is the social benefits as provided byindividuals.
People who want to escape from the stressful business tempo at work andrelieve the pressure of a demanding urban lifestyle will need to indulge in leisureactivities such as walking in natural areas, travel, recreation, festivals, concertsand exhibitions. The RGB provide many of these kinds of activities to its visitorsand this increases its potential for being an important recreational area andindirectly alleviating many of society’s psychological problems. In addition, theRGB is designed for visitors who want to spend their free-time with the familyand will come to view this site as a great place for a family outing. These thingsand the degree of satisfaction from visits creates “positive added value in terms ofits recreational use.”
Furthermore, Kew garden is amongst the 10 most popular tourist attractionscharging admission in Great Britain, with the number of visitors increasing everyyear. This plays an important role in increasing the perception of the value of

177
recreation. Another factor increasing the value of recreation is that of the degreeof satisfaction. In the study, 91% of visitors, who visited the botanic garden forthe first time, stated that the botanic garden was both entertaining and educational,96% of visitors expressed a high degree of satisfaction. These results indicate thathaving fun and being satisfied with the facilities increase the recreational use andpreference value of the botanic gardens. In addition, the wide range of recreationalactivities such as entertainment, music, painting, art, sports and shopping in theRBG can increase the value of recreational use of the RBG by attracting newvisitors.
On average, respondents visited the selected botanic gardens between 2 and 4times in a year with each trip lasting over 4 hours depending on the site. Note thatthe recreational experience not only includes learning about plant collections butalso other potentially valued joint products such as relaxation, meeting and spen-ding time with friends, gift and plant shopping, concerts, exhibitions, naturalbeauty and scenic view, and nature walks. A number of these motivating reasonsgiven above, for example natural beauty and scenic views highlight the increasingvalue of the plant collections for visitors.
Having a limited number of studies on the recreational use of botanic gardensmakes it difficult to make comparisons in this area. Nevertheless, in the paperwritten by Garrod et al. (1993), it was estimated the amount of consumer surplusobtained per visit was £0.91, £2.24, £0.35 and £0.26 respectively for each of fourbotanic gardens (Edinburgh, Sheffield, Cambridge, Westonbirt). And the totalconsumer surplus is annually £4,107,500, £267,600, £130,000, £161,000 respec-tively. Despite the use of similar variables, they are quite low according to theresults of our study at Kew. Another researching in this area is that the study ofMwebaze and Bennett (2011), the economic value of biological collections inthree major botanic gardens in Australia was estimated using the TCM. The studyused truncated count data models to control for the non-negative integer andtruncation properties of the number of visits to botanic gardens in Canberra,Melbourne and Sydney. Estimating consumer surplus values of approximatelyAus $34 per trip to each botanic garden, and resulting in the total social welfareestimate of approximately Aus $96.9 million in 2010. Downing and Roberts(1991) showed that the user-demand and consumer surplus for visits to theUniversity of Tennessee Arboretum could be estimated using the travel costmethod. Results suggest that travel cost and income of consumers are importantdeterminants of demand. At least in the case of visits to the University of Tenne-ssee Arboretum and the consumer-use value may be derived from this demand.Consumer use value is estimated to be US $20.43 per person. The results of bothstudies are lower than the results of our research. Because we considered manynew factors that directly affect visits to botanic gardens, such as urban psychologyand culture, age, gender, income level, education, understanding of the naturalworld, landscape perception, interest in botanic gardens and the various services
REALITIES IN A KALEIDOSCOPE

178
REVISTA DE CERCETARE SI INTERVENTIE SOCIALA - VOLUME 44/2014
and facilities provided to visitors by botanic gardens. Additionally, the method ofstatistical analysis used in the study and the period of data collection and researchare important factors that affect the final recreational use value.
As a result, the realization of plans and projects to increase alternative socialactivities to be offered to visitors is essential for ensuring the continuity of botanicgarden culture. Providing the sustainable use of botanic gardens as recreationalfacilities is only possible by this kind of research and the inclusion of the resultsinto future management plans. Such studies will provide much needed guidancefor the development of policies yet to be created. This study demonstrates arelatively high value of recreational use in the RBG in comparison to similarstudies conducted in other parts of the world. The findings of this study would beimportant for resource management decisions in the Royal Botanic Garden atKew and could serve as a valuable reference in assessing the sustainability ofsimilar natural resources around the world.
Acknowledgments
I would like to express my gratitude to all employees of BGCI, in particular toSara Oldfield and to Prof. Dr. Adil GUNER and to Prof. Dr. Aydin OZTAN.
References
Anonymous. (1989). Automobile Association, Motoring Costs AA Technical Services.Anonymous. (2001). Royal Botanic Gardens, Kew A souvenir Guide, p. 3, KEW publi-
shed.Anonymous. (2011a). Definition of Botanic Gardens, BGCI, http://www.bgci.org.uk,
accessed October 2009.Anonymous. (2011b). Royal Botanic Garden, Kew Annual Report and Accounts for the
Year Ended 31st March 2011, Ordered by the House of Commons to be Printed 4th
July 2011.Bennett, J. (1996). Estimating the recreational use values of national parks. Tourism
Economics, 2(4), 303–320.Blomfield, D. (2011). The Story of Kew, the Gardens, the Village, the National Archives,
Leyborne Publications, 5th Edition (enlarged), Kew.Creel, M.D. & Loomis, J.B. (1990). Theoretical and empirical advantages of truncated
count estimators for analysis of deer hunting in California. American Journal ofAgricultural Economics, 72, 434–441.
Cochran, W.G. (1963). Sampling Techniques, 2nd Ed., New York: John Wiley and Sons,Inc. Date of Acces; 16.06.2011, https://edis.ifas.ufl.edu/pd006
Desmond, R. (2007). History of the Royal Botanic Gardens Kew, October 2007, KewPublishing.

179
Downing, M., & Roberts, K.R. (1991). Estimating Visitor Use-Value of Arboreta: TheCase of the University of Tennessee Arboretum. Journal of Environmental Horti-culture, 9(4), 207-210.
Englin, J.E., & Shonkwiler, J.S. (1995). Estimating social welfare using count datamodels: an application to long-run recreation demand under conditions of endo-genous stratification and truncation. The Review of Economics and Statistics, 77,104–112.
Freeman, M. (2003). The Measurement of Environmental and Resource Values. Resourcesfor the Future, Washington, USA.
Garrod, G., Pickering, A., & Willis, K. (1991). An Economic Estimate of the RecreationalBenefits of Four Botanic Gardens, ESRC Countryside Change Initiative, WorkingPaper 25, Department of Agricultural Economics and Food Marketing, Universityof Newcastle upon Tyne.
Garrod, G., Pickering, A., & Willis, K. (1993). The Economic Value of Botanic Gardens:a Recreational Perspective. Geoforum, 24 (2), 215-224.
Grogger, J.T. & Carson, R.T., (1991). Models for truncated counts. Journal of AppliedEconometrics 6, 225–238.
Haab, T., & McConnell, K. (2003). Valuing Environmental and Natural Resources - TheEconometrics of Non-Market Valuation, Massachusetts, USA: Edward Elgar Publi-shing.
Hanley, N., & Barbier, E.B. (2009). Pricing Nature: Cost-Benefit Analysis and Envi-ronmental Policy., Massachusetts, USA: Edward Elgar.
Iamtrakul, P., Teknomo, K., & Hokao, K. (2005). Public Park Valuation Using TravelCost Method. Proceedings of the Eastern Asia Society for Transportation Studies,5, 1249-1264.
Mwebaze, P., & Bennetta, J. (2011). Valuing Botanic Collections: A Combined Travel-Cost And Contingent Valuation Survey In Australia. A Contributed paper for the55th Annual AARES National Conference, Melbourne-Victoria, 9th-11th February2011.
Oldfield, S. (2007). Great Botanic Gardens of The World, London, UK: New HollandPublishers, pp.22-23.
Oldfield, S. (2010). Botanic Gardens Modern-Day Arks, London, UK: New HollandPublishers.
Pak, M. (2003). Orman Kayna ýndan Rekreasyonel Amaçlý Yararlanmanýn EkonomikDegerinin Tahmin Edilmesi ve Bu De er Üzerine Etkili Olan De i[kenler ÜzerineBir Ara[týrma (Do u Akdeniz ve Do u Karadeniz Bölgesi Orman içi DinlenmeYerleri Örne i), Karadeniz Üniversitesi Fen Bilimleri Enstitüsü Orman Mühen-disli i Anabilim Dalý Doktora Tezi, Trabzon. (Turkish-Unpublished Dissertation)
Pickering, T.A. (1992). An Evaluation of the Roles of Botanic Gardens in Recreation andConservation, Thesis submitted for the Degree of Doctor of Philosophy De-partment of Town and Country Planning, University of Newcastle upon Tyne1992: Newcastle University Lýbrary
Prayaga, P., Rolfe, J., & Stoeckl, N. (2010). The Value of Recreational Fishing in TheGreat Barrier Reef, Australia: A Pooled Revealed Preference and ContingentBehaviour Model. Marine Policy, 34, 244-251.
REALITIES IN A KALEIDOSCOPE

180
REVISTA DE CERCETARE SI INTERVENTIE SOCIALA - VOLUME 44/2014
Randall, A., & Stoll, J. (1983). Existence Value in a Total Valuation Framework. In: R.D.Rowe, and L.G. Chestnut, ed., Managing Air Quality and Scenic Resources atNational Parks and Wilderness Areas, Boulder, CO: Westview Press, pp. 265-274.
Raven, H.P. (2006). Research in Botanical Gardens. Public Garden, 16-17.Shrestha, R.K., Seidl, A.F., & Moraes, A.S. (2002). Value of Recreational Fishing in the
Brazilian Pantanal: A Travel Cost Analysis Using Count Data Models. EcologicalEconomics, 42(1-2), 289-299.
Tabachnick, G.B., & Fidell, S.L. (2001). Using Multivariate Statistics, 4th Ed., Chapter 5,Section 5.5.1., Allyn & Bacon. p. 131.
Willis, K.G., & Garrod, G.D. (1991). An Individual Travel Cost Method of EvaluatingForest Recreation. Journal of Agricultural Economics, 42, 33-42.