Determination of the optimal periodic maintenance policy ...
115
Universidade Federal de Minas Gerais Escola de Engenharia Departamento de Engenharia de Produção Programa de Pós-Graduação em Engenharia de Produção Determination of the optimal periodic maintenance policy under imperfect repair assumption Maria Luíza Guerra de Toledo [email protected] Professor: Dra. Marta Afonso Freitas [email protected] Belo Horizonte, March 2014
-
Upload
khangminh22 -
Category
Documents
-
view
3 -
download
0
Transcript of Determination of the optimal periodic maintenance policy ...
Universidade Federal de Minas Gerais
Escola de Engenharia
Departamento de Engenharia de Produção
Programa de Pós-Graduação em Engenharia de Produção
Determination of the optimal periodic maintenancepolicy under imperfect repair assumption
Maria Luíza Guerra de Toledo
Professor: Dra. Marta Afonso Freitas
Belo Horizonte, March 2014
Abstract
An appropriate maintenance policy is essential to reduce expenses and risks related
to repairable systems failures. The usual assumptions of minimal or perfect repair at
failures are not suitable for many real systems, requiring the application of Imperfect
Repair models. In this work, the classes Arithmetic Reduction of Age and Arith-
metic Reduction of Intensity, proposed by Doyen and Gaudoin (2004) are explored.
Likelihood functions for such models are derived, and the parameters are estimated,
allowing to compute reliability indicators to forecast the future behavior of the failure
process. Under the classic Imperfect Repair virtual age model presented by Kijima et
al. (1988) (particular case of Aithmetic Reduction of Age class), a periodic Preventive
Maintenance policy is proposed, which estimates optimal time intervals for Preven-
tive Maintenance, in order to minimize (preventive and corrective) maintenance costs.
Under a dynamic perspective, it is showed how this policy can be improved, using each
failure observation in order to recalculate the optimal time to Preventive Maintenance
for a particular system, considering the effect of the repair action. These policies are
applicable to any Imperfect Repair model. Monte Carlo simulation studies are imple-
mented in order to evaluate the performance of the proposed methods. Those methods
are applied to a real situation regarding the maintenance of engines of off-road trucks
used in a mining company. These results bring valuable information to support deci-
sion making regarding Preventive Maintenance policy.
ii
Contents
1 Acronyms vii
2 Introduction 1
2.1 Problem definition . . . . . . . . . . . . . . . . . . . . . . . . . . . . 4
2.2 Objectives . . . . . . . . . . . . . . . . . . . . . . . . . . . . . . . . . 6
3 Layout of the text 8
4 ARA and ARI Imperfect Repair Models: A Case Study in a Brazil-
ian Mining Company 10
4.1 Abstract . . . . . . . . . . . . . . . . . . . . . . . . . . . . . . . . . . 10
4.2 Introduction . . . . . . . . . . . . . . . . . . . . . . . . . . . . . . . . 10
4.3 Arithmetic Reduction of Age (ARA) and Arithmetic Reduction of In-
tensity (ARI) classes of models . . . . . . . . . . . . . . . . . . . . . 13
4.4 Estimation in ARA and ARI classes of models . . . . . . . . . . . . . 16
4.4.1 Parameters estimation: The likelihood functions . . . . . . . . 16
4.4.2 Predictive reliability indicators . . . . . . . . . . . . . . . . . 19
4.5 Dump trucks data set revisited . . . . . . . . . . . . . . . . . . . . . 21
4.6 Conclusions and final remarks . . . . . . . . . . . . . . . . . . . . . . 25
5 Optimal Periodic Maintenance Policy Under Imperfect Repair: A
Case Study of Off-Road Engines 27
5.1 Abstract . . . . . . . . . . . . . . . . . . . . . . . . . . . . . . . . . . 27
5.2 Introduction . . . . . . . . . . . . . . . . . . . . . . . . . . . . . . . . 27
5.2.1 Motivating situation: Off-road engine maintenance data . . . . 27
5.2.2 Background and literature . . . . . . . . . . . . . . . . . . . . 29
5.2.3 The problem . . . . . . . . . . . . . . . . . . . . . . . . . . . . 31
5.3 Cost Function and Optimal PM Under an ARA1 Model . . . . . . . . 34
5.4 Parameter Estimation: The Likelihood Function . . . . . . . . . . . . 35
5.5 Proposed Method to Obtain the Optimal PM under IR . . . . . . . . 38
5.6 Simulation Study . . . . . . . . . . . . . . . . . . . . . . . . . . . . . 41
5.6.1 Monte Carlo Simulation Study . . . . . . . . . . . . . . . . . . 41
iii
5.6.2 Illustrating the Method with Simulated Data under the IR as-
sumption . . . . . . . . . . . . . . . . . . . . . . . . . . . . . 43
5.7 Off-Road Engines Maintenance Data Revisited . . . . . . . . . . . . . 45
5.8 Final Remarks . . . . . . . . . . . . . . . . . . . . . . . . . . . . . . . 49
6 Dynamics of the Optimal Maintenance Policy under Imperfect Re-
pair Models 53
6.1 Abstract . . . . . . . . . . . . . . . . . . . . . . . . . . . . . . . . . . 53
6.2 Introduction . . . . . . . . . . . . . . . . . . . . . . . . . . . . . . . . 53
6.3 Optimal PM policy under IR . . . . . . . . . . . . . . . . . . . . . . . 55
6.4 Statistical inference for the virtual age model . . . . . . . . . . . . . . 58
6.5 Application for a real data set . . . . . . . . . . . . . . . . . . . . . . 59
6.6 Simulation study . . . . . . . . . . . . . . . . . . . . . . . . . . . . . 63
6.7 Conclusions and final remarks . . . . . . . . . . . . . . . . . . . . . . 68
7 Final remarks 70
A Off-road engines data set 71
B R codes 74
B.1 Point and intervalar estimation of the parameters in ARAm+PLP
model, using MLE . . . . . . . . . . . . . . . . . . . . . . . . . . . . 74
B.2 Point and intervalar estimation of the parameters in ARIm+PLPmodel,
using MLE . . . . . . . . . . . . . . . . . . . . . . . . . . . . . . . . . 81
B.3 Point estimation of the optimal PM periodicity under ARA1+PLP model 87
B.4 Interval estimation (Bootstrap) of the optimal PM periodicity under
ARA1+PLP model . . . . . . . . . . . . . . . . . . . . . . . . . . . . 89
B.5 Estimating the periodicity in virtual age (Dinamic Policy) under the
model ARA1+PLP and Bootstratp CIs . . . . . . . . . . . . . . . . . 96
References 104
iv
List of Figures
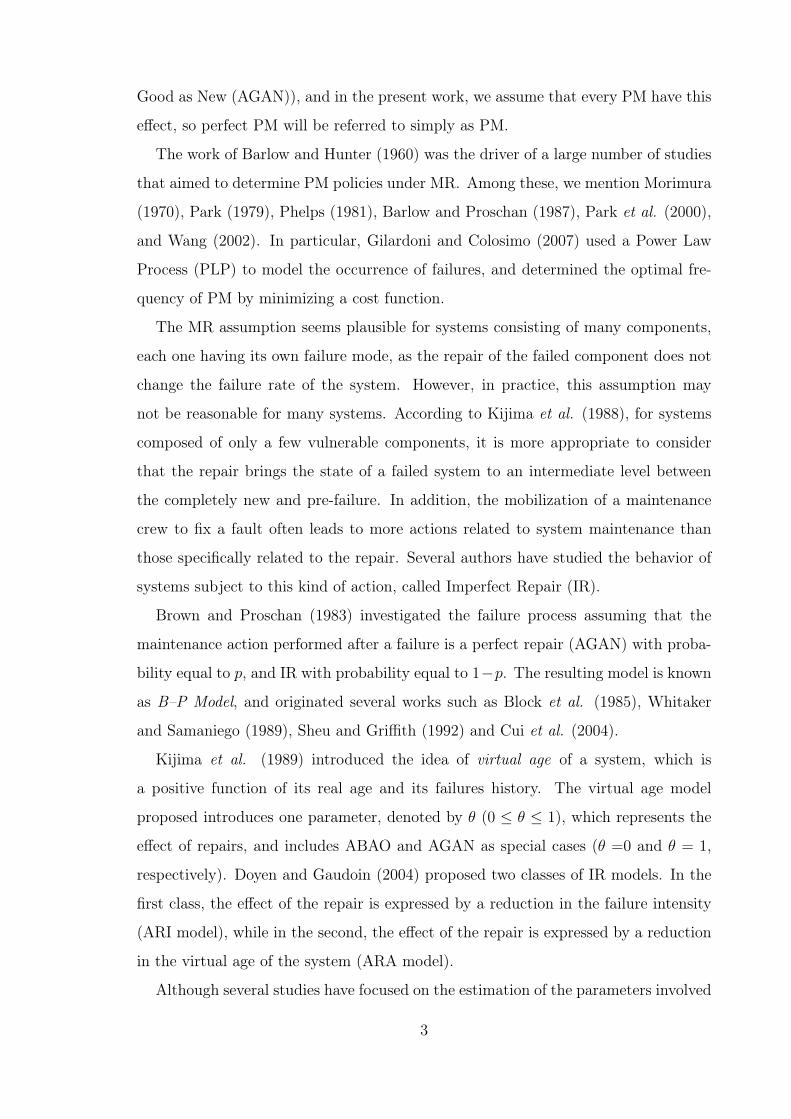
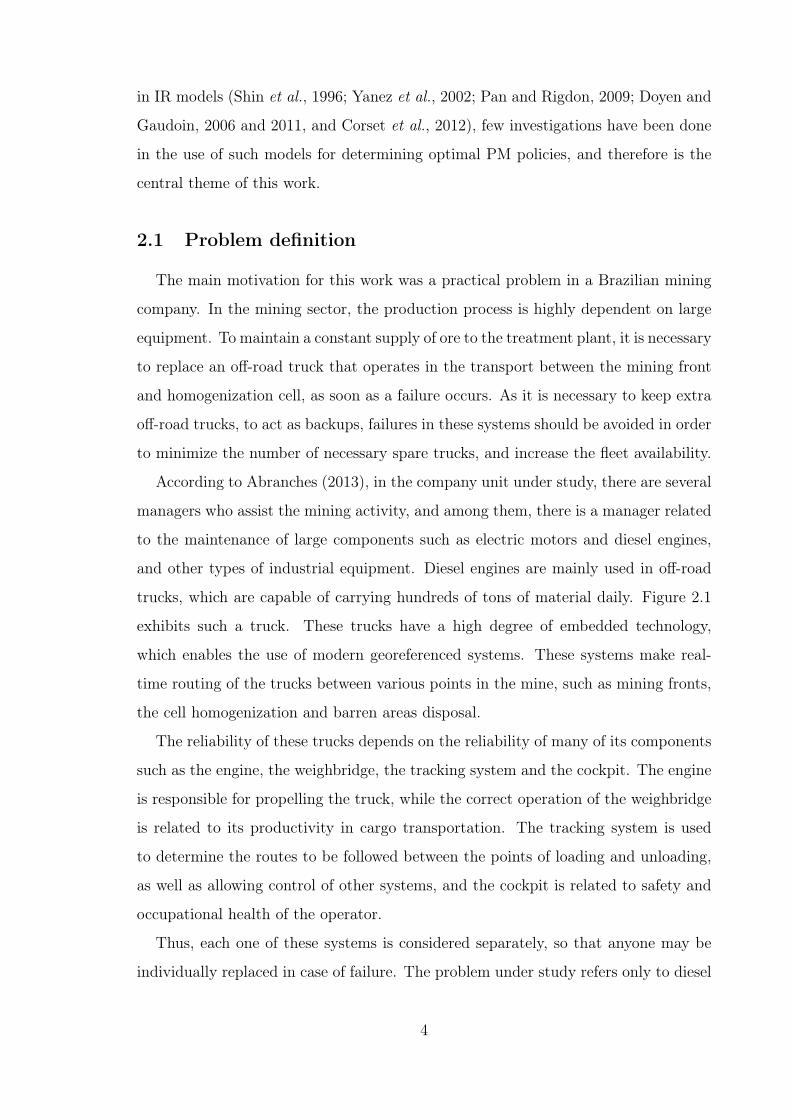
2.1 Example of an off-road truck . . . . . . . . . . . . . . . . . . . . . . . 5
4.1 (a) Failure times in days of operation for each truck (horizontal lines
are trucks and “x” are failures); (b) Cumulative number of failures
versus days of operation. . . . . . . . . . . . . . . . . . . . . . . . . . 13
4.2 ARA1 and ARI1 failure intensity functions for PLP intensity function
with β = 3, η = 1, and θ = 0.5, and observed failure times T1 = 1.2
and T2 = 1.9. . . . . . . . . . . . . . . . . . . . . . . . . . . . . . . . 16
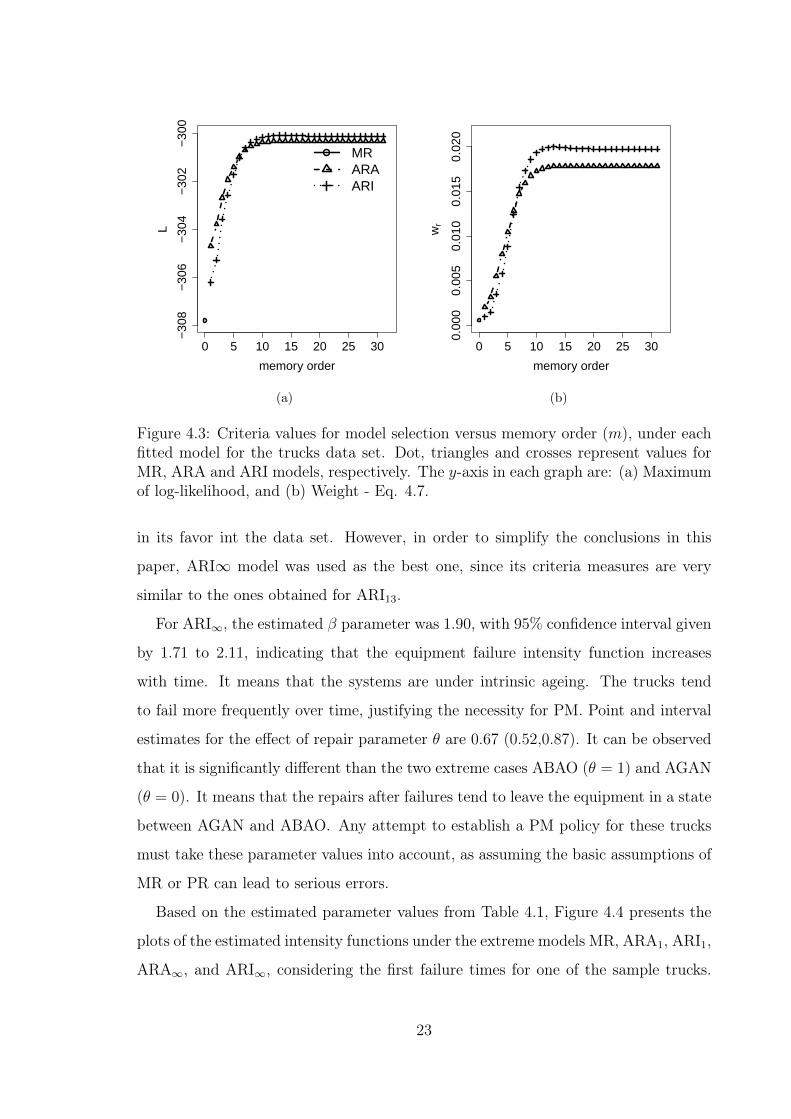
4.3 Criteria values for model selection versus memory order (m), under
each fitted model for the trucks data set. Dot, triangles and crosses
represent values for MR, ARA and ARI models, respectively. The y-
axis in each graph are: (a) Maximum of log-likelihood, and (b) Weight
- Eq. 4.7. . . . . . . . . . . . . . . . . . . . . . . . . . . . . . . . . . 23
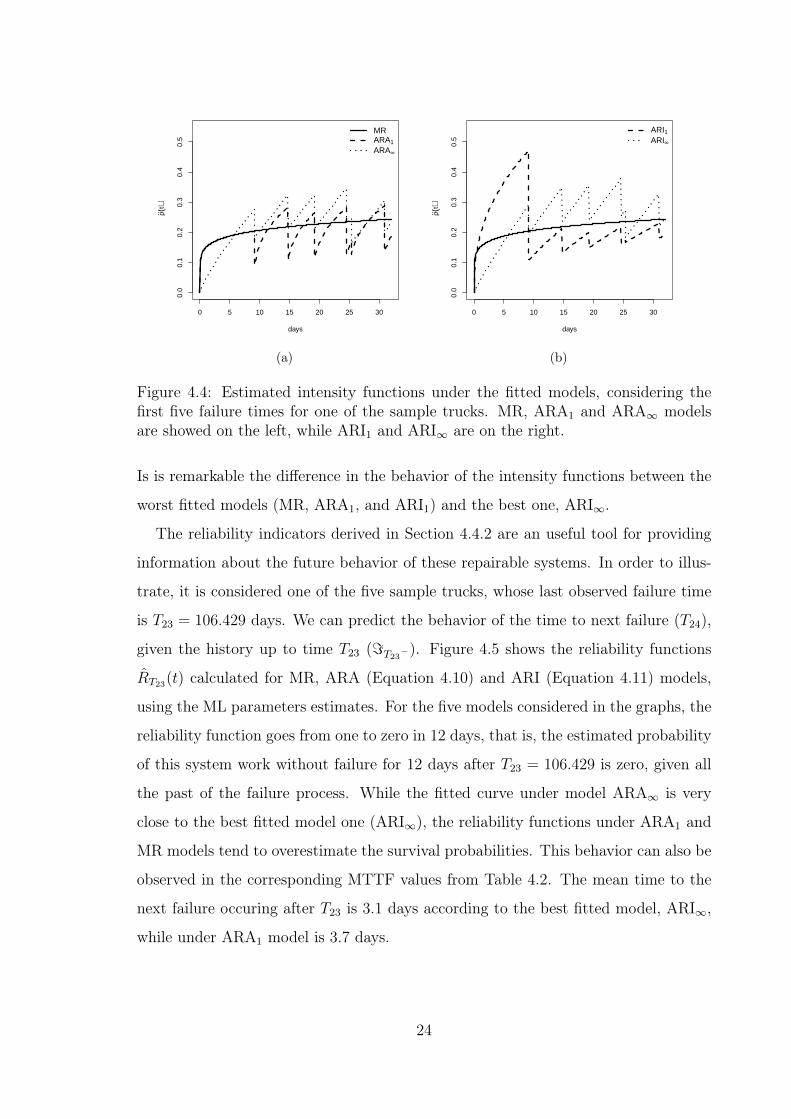
4.4 Estimated intensity functions under the fitted models, considering the
first five failure times for one of the sample trucks. MR, ARA1 and
ARA∞ models are showed on the left, while ARI1 and ARI∞ are on
the right. . . . . . . . . . . . . . . . . . . . . . . . . . . . . . . . . . . 24
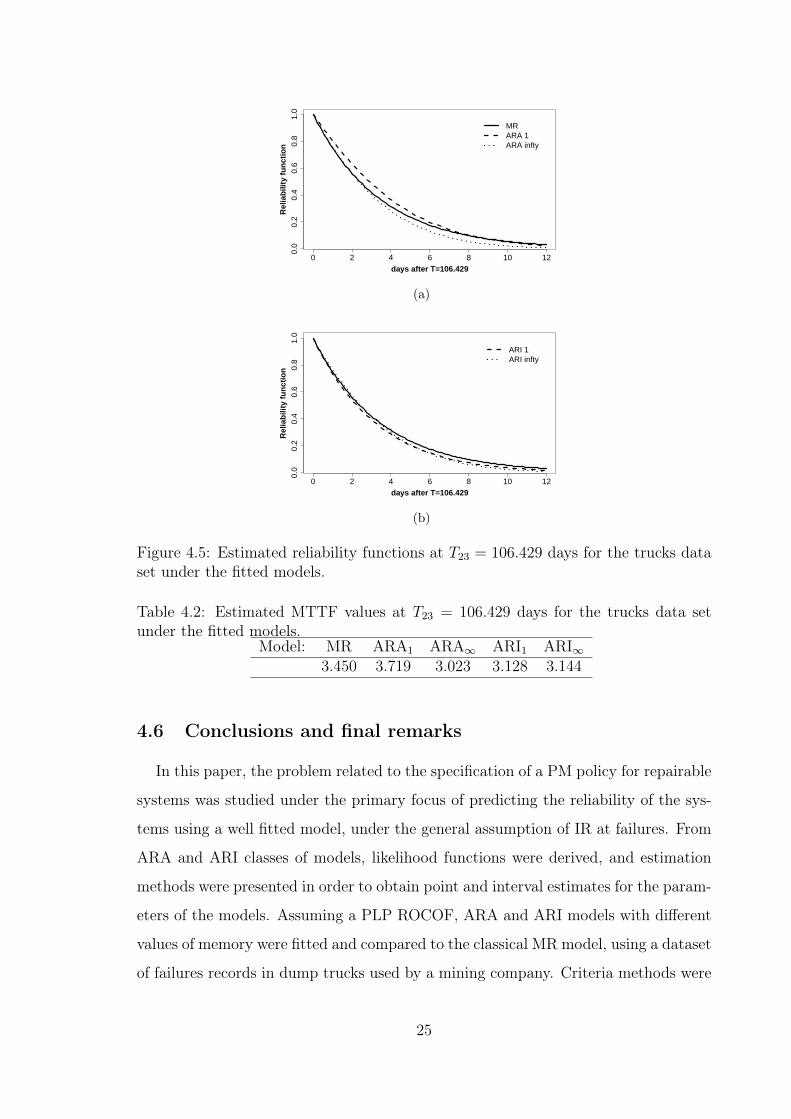
4.5 Estimated reliability functions at T23 = 106.429 days for the trucks
data set under the fitted models. . . . . . . . . . . . . . . . . . . . . 25
5.1 Mean cumulative number of failures versus time for the 193 off-road
engines. . . . . . . . . . . . . . . . . . . . . . . . . . . . . . . . . . . 29
5.2 Point estimates for the optimal PM periodicity for each generated sam-
ple, assuming CIR/CPM = (a) 1/1.23, (b) 1/5, and (c) 1/15. . . . . . 46
5.3 Estimated functions for the engines data, under MR (dotted lines) and
IR (solid lines): (a) Λ̂(t), (b) λ̂(t) and (c) D̂(t) (Equation 5.6 6), versus
time. . . . . . . . . . . . . . . . . . . . . . . . . . . . . . . . . . . . . 48
6.1 Estimated functions for the engines data set using Toledo et al. (2013)
approach: (a)λ̂(t|0) versus t and (b) B̂(t) versus t, t measured in hours
of operation. . . . . . . . . . . . . . . . . . . . . . . . . . . . . . . . . 60
6.2 Mean cost per unit time, CPM/CIR = (a)1/3; (b)1/5; (c)1/15. . . . . 67
v
List of Tables
4.1 Point and interval (95% confidence level) estimates for PLP (β, η) and
effect of repair (θ) parameters, and the values of the maximum of the
log-likelihood function (L̂) under each fitted model. . . . . . . . . . . 22
4.2 Estimated MTTF values at T23 = 106.429 days for the trucks data set
under the fitted models. . . . . . . . . . . . . . . . . . . . . . . . . . 25
5.1 Simulation Study Results-Performance measures (for point and interval
estimates) for each simulated scenario (assuming MR and PLP with η
(scale) = 16716.53) . . . . . . . . . . . . . . . . . . . . . . . . . . . . 44
5.2 Simulated Data under IR assumption- Point and interval estimates
(95% bootstrap CIs with B = 10,000) for the optimal PM periodicity
by cost ratio (CIR/CPM) for each sample of n = 193 failure processes
generated under different combinations of β and θ parameters (η =
16.716). . . . . . . . . . . . . . . . . . . . . . . . . . . . . . . . . . . 45
5.3 Off road engines data- Optimal Periodic Maintenance Policy by Cost
Ratio (CIR/CPM), under MR (τ̂MR) and IR (τ̂IR) assumptions, and
bootstrap (B=10,000) confidence intervals . . . . . . . . . . . . . . . 49
6.1 Estimations for the off-road engines data set, under different values
of costs ratios (CPM/CIR): Optimal PM periodicity (B̂−1(CPM/CIR))
based on Toledo et al. (2013) approach; Optimal dyamic PM (τ̂V A),
and bootstrap (B = 10,000) 95% confidence intervals (values are in
hours) . . . . . . . . . . . . . . . . . . . . . . . . . . . . . . . . . . . 62
6.2 Mean cost per unit time point estimates(1) and standard errors(1,2) for
the periodic (CP , SEP ) and dynamic (CD, SED) policies . . . . . . . 66
A1 Off-road engines dataset . . . . . . . . . . . . . . . . . . . . . . . . . 71
vi

1 Acronyms
ABAO As Bad as Old
AGAN As Good as New
ARA Arithmetic Reduction of Age
ARI Arithmetic Reduction of Intensity
IR Imperfect Repair
MCF Mean Cumulative Function
MR Minimal Repair
MTTF Mean Time to Failure
NHPP Nonhomogeneous Poisson Process
PLP Power Law Process
PM Preventive Maintenance
PR Perfect Repair
ROCOF Rate of Occurence of Failures
vii
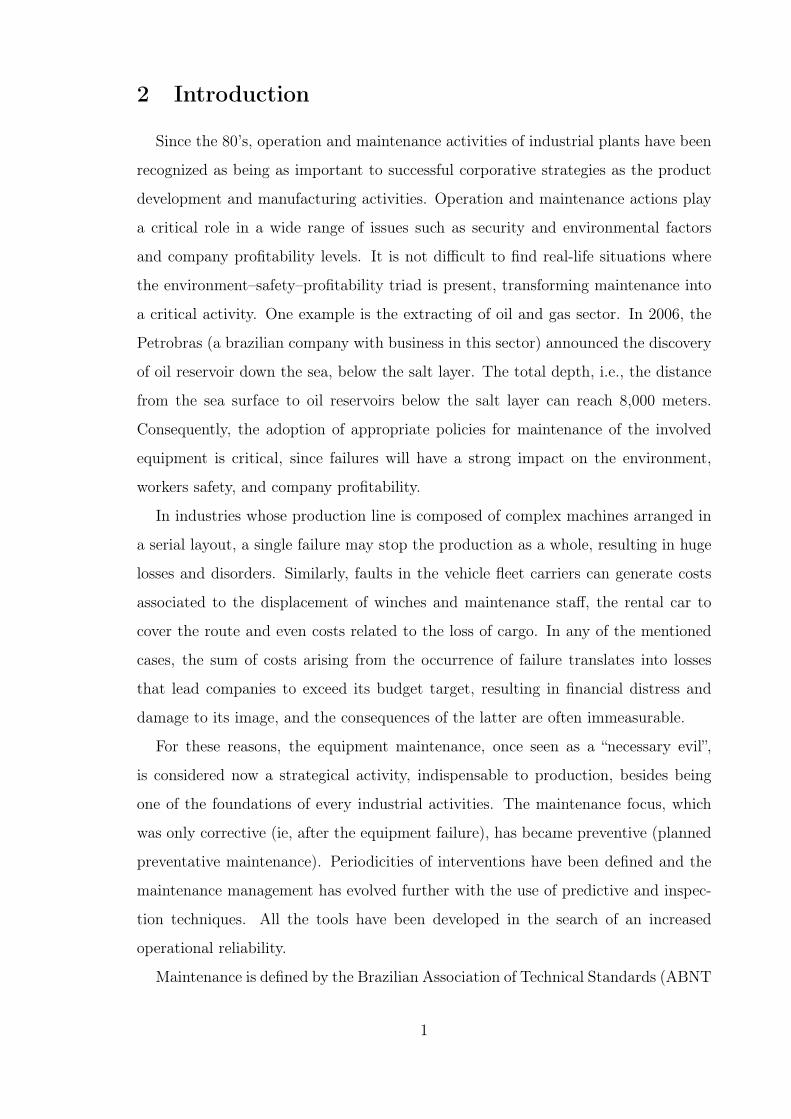
2 Introduction
Since the 80’s, operation and maintenance activities of industrial plants have been
recognized as being as important to successful corporative strategies as the product
development and manufacturing activities. Operation and maintenance actions play
a critical role in a wide range of issues such as security and environmental factors
and company profitability levels. It is not difficult to find real-life situations where
the environment–safety–profitability triad is present, transforming maintenance into
a critical activity. One example is the extracting of oil and gas sector. In 2006, the
Petrobras (a brazilian company with business in this sector) announced the discovery
of oil reservoir down the sea, below the salt layer. The total depth, i.e., the distance
from the sea surface to oil reservoirs below the salt layer can reach 8,000 meters.
Consequently, the adoption of appropriate policies for maintenance of the involved
equipment is critical, since failures will have a strong impact on the environment,
workers safety, and company profitability.
In industries whose production line is composed of complex machines arranged in
a serial layout, a single failure may stop the production as a whole, resulting in huge
losses and disorders. Similarly, faults in the vehicle fleet carriers can generate costs
associated to the displacement of winches and maintenance staff, the rental car to
cover the route and even costs related to the loss of cargo. In any of the mentioned
cases, the sum of costs arising from the occurrence of failure translates into losses
that lead companies to exceed its budget target, resulting in financial distress and
damage to its image, and the consequences of the latter are often immeasurable.
For these reasons, the equipment maintenance, once seen as a “necessary evil”,
is considered now a strategical activity, indispensable to production, besides being
one of the foundations of every industrial activities. The maintenance focus, which
was only corrective (ie, after the equipment failure), has became preventive (planned
preventative maintenance). Periodicities of interventions have been defined and the
maintenance management has evolved further with the use of predictive and inspec-
tion techniques. All the tools have been developed in the search of an increased
operational reliability.
Maintenance is defined by the Brazilian Association of Technical Standards (ABNT
1
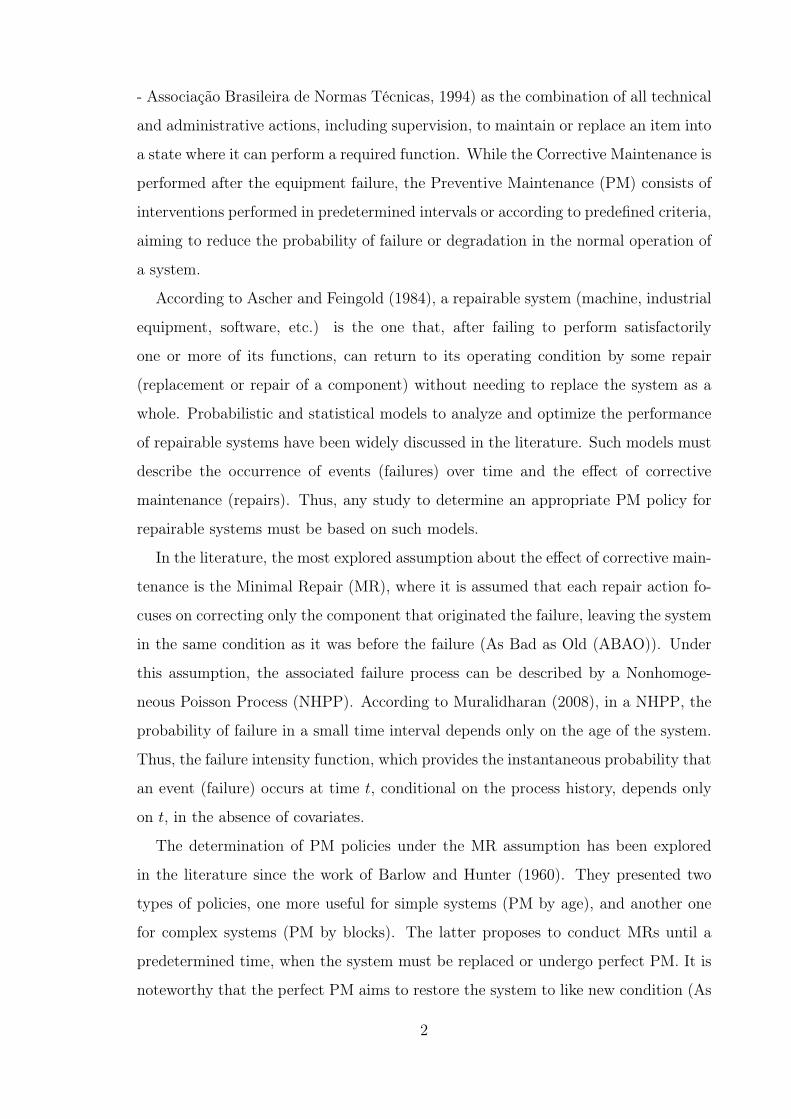
- Associação Brasileira de Normas Técnicas, 1994) as the combination of all technical
and administrative actions, including supervision, to maintain or replace an item into
a state where it can perform a required function. While the Corrective Maintenance is
performed after the equipment failure, the Preventive Maintenance (PM) consists of
interventions performed in predetermined intervals or according to predefined criteria,
aiming to reduce the probability of failure or degradation in the normal operation of
a system.
According to Ascher and Feingold (1984), a repairable system (machine, industrial
equipment, software, etc.) is the one that, after failing to perform satisfactorily
one or more of its functions, can return to its operating condition by some repair
(replacement or repair of a component) without needing to replace the system as a
whole. Probabilistic and statistical models to analyze and optimize the performance
of repairable systems have been widely discussed in the literature. Such models must
describe the occurrence of events (failures) over time and the effect of corrective
maintenance (repairs). Thus, any study to determine an appropriate PM policy for
repairable systems must be based on such models.
In the literature, the most explored assumption about the effect of corrective main-
tenance is the Minimal Repair (MR), where it is assumed that each repair action fo-
cuses on correcting only the component that originated the failure, leaving the system
in the same condition as it was before the failure (As Bad as Old (ABAO)). Under
this assumption, the associated failure process can be described by a Nonhomoge-
neous Poisson Process (NHPP). According to Muralidharan (2008), in a NHPP, the
probability of failure in a small time interval depends only on the age of the system.
Thus, the failure intensity function, which provides the instantaneous probability that
an event (failure) occurs at time t, conditional on the process history, depends only
on t, in the absence of covariates.
The determination of PM policies under the MR assumption has been explored
in the literature since the work of Barlow and Hunter (1960). They presented two
types of policies, one more useful for simple systems (PM by age), and another one
for complex systems (PM by blocks). The latter proposes to conduct MRs until a
predetermined time, when the system must be replaced or undergo perfect PM. It is
noteworthy that the perfect PM aims to restore the system to like new condition (As
2
Good as New (AGAN)), and in the present work, we assume that every PM have this
effect, so perfect PM will be referred to simply as PM.
The work of Barlow and Hunter (1960) was the driver of a large number of studies
that aimed to determine PM policies under MR. Among these, we mention Morimura
(1970), Park (1979), Phelps (1981), Barlow and Proschan (1987), Park et al. (2000),
and Wang (2002). In particular, Gilardoni and Colosimo (2007) used a Power Law
Process (PLP) to model the occurrence of failures, and determined the optimal fre-
quency of PM by minimizing a cost function.
The MR assumption seems plausible for systems consisting of many components,
each one having its own failure mode, as the repair of the failed component does not
change the failure rate of the system. However, in practice, this assumption may
not be reasonable for many systems. According to Kijima et al. (1988), for systems
composed of only a few vulnerable components, it is more appropriate to consider
that the repair brings the state of a failed system to an intermediate level between
the completely new and pre-failure. In addition, the mobilization of a maintenance
crew to fix a fault often leads to more actions related to system maintenance than
those specifically related to the repair. Several authors have studied the behavior of
systems subject to this kind of action, called Imperfect Repair (IR).
Brown and Proschan (1983) investigated the failure process assuming that the
maintenance action performed after a failure is a perfect repair (AGAN) with proba-
bility equal to p, and IR with probability equal to 1−p. The resulting model is known
as B–P Model, and originated several works such as Block et al. (1985), Whitaker
and Samaniego (1989), Sheu and Griffith (1992) and Cui et al. (2004).
Kijima et al. (1989) introduced the idea of virtual age of a system, which is
a positive function of its real age and its failures history. The virtual age model
proposed introduces one parameter, denoted by θ (0 ≤ θ ≤ 1), which represents the
effect of repairs, and includes ABAO and AGAN as special cases (θ =0 and θ = 1,
respectively). Doyen and Gaudoin (2004) proposed two classes of IR models. In the
first class, the effect of the repair is expressed by a reduction in the failure intensity
(ARI model), while in the second, the effect of the repair is expressed by a reduction
in the virtual age of the system (ARA model).
Although several studies have focused on the estimation of the parameters involved
3
in IR models (Shin et al., 1996; Yanez et al., 2002; Pan and Rigdon, 2009; Doyen and
Gaudoin, 2006 and 2011, and Corset et al., 2012), few investigations have been done
in the use of such models for determining optimal PM policies, and therefore is the
central theme of this work.
2.1 Problem definition
The main motivation for this work was a practical problem in a Brazilian mining
company. In the mining sector, the production process is highly dependent on large
equipment. To maintain a constant supply of ore to the treatment plant, it is necessary
to replace an off-road truck that operates in the transport between the mining front
and homogenization cell, as soon as a failure occurs. As it is necessary to keep extra
off-road trucks, to act as backups, failures in these systems should be avoided in order
to minimize the number of necessary spare trucks, and increase the fleet availability.
According to Abranches (2013), in the company unit under study, there are several
managers who assist the mining activity, and among them, there is a manager related
to the maintenance of large components such as electric motors and diesel engines,
and other types of industrial equipment. Diesel engines are mainly used in off-road
trucks, which are capable of carrying hundreds of tons of material daily. Figure 2.1
exhibits such a truck. These trucks have a high degree of embedded technology,
which enables the use of modern georeferenced systems. These systems make real-
time routing of the trucks between various points in the mine, such as mining fronts,
the cell homogenization and barren areas disposal.
The reliability of these trucks depends on the reliability of many of its components
such as the engine, the weighbridge, the tracking system and the cockpit. The engine
is responsible for propelling the truck, while the correct operation of the weighbridge
is related to its productivity in cargo transportation. The tracking system is used
to determine the routes to be followed between the points of loading and unloading,
as well as allowing control of other systems, and the cockpit is related to safety and
occupational health of the operator.
Thus, each one of these systems is considered separately, so that anyone may be
individually replaced in case of failure. The problem under study refers only to diesel
4
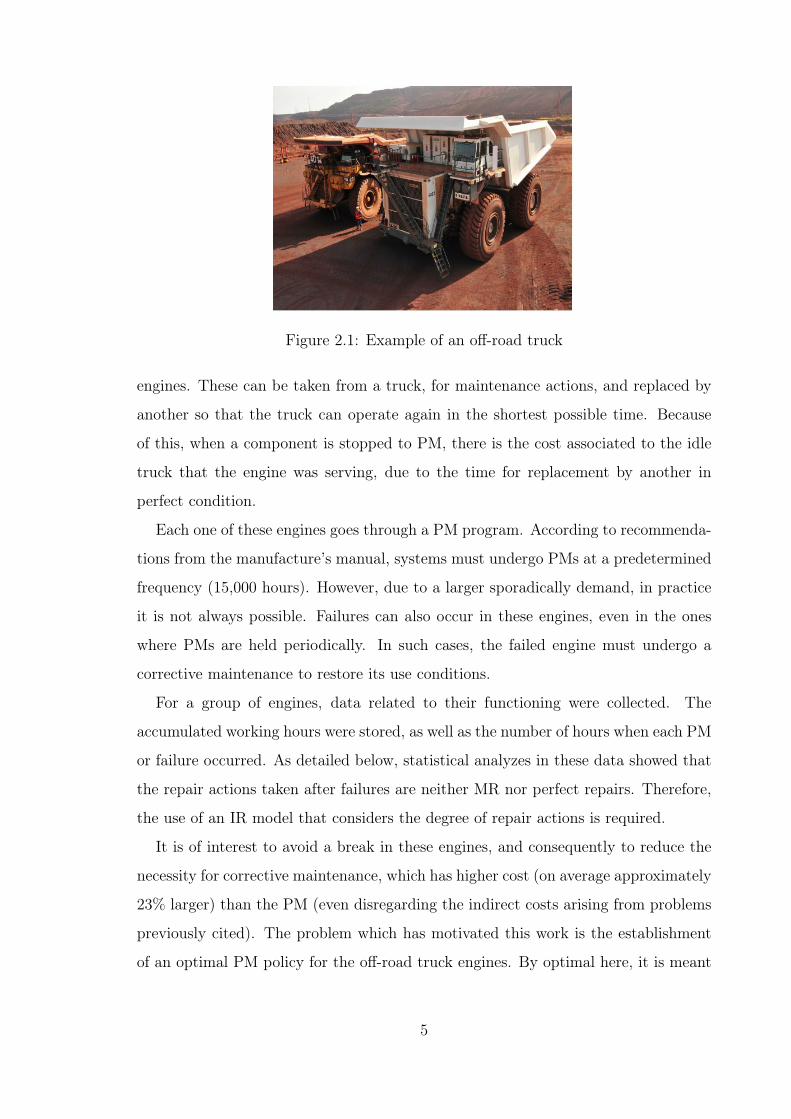
Figure 2.1: Example of an off-road truck
engines. These can be taken from a truck, for maintenance actions, and replaced by
another so that the truck can operate again in the shortest possible time. Because
of this, when a component is stopped to PM, there is the cost associated to the idle
truck that the engine was serving, due to the time for replacement by another in
perfect condition.
Each one of these engines goes through a PM program. According to recommenda-
tions from the manufacture’s manual, systems must undergo PMs at a predetermined
frequency (15,000 hours). However, due to a larger sporadically demand, in practice
it is not always possible. Failures can also occur in these engines, even in the ones
where PMs are held periodically. In such cases, the failed engine must undergo a
corrective maintenance to restore its use conditions.
For a group of engines, data related to their functioning were collected. The
accumulated working hours were stored, as well as the number of hours when each PM
or failure occurred. As detailed below, statistical analyzes in these data showed that
the repair actions taken after failures are neither MR nor perfect repairs. Therefore,
the use of an IR model that considers the degree of repair actions is required.
It is of interest to avoid a break in these engines, and consequently to reduce the
necessity for corrective maintenance, which has higher cost (on average approximately
23% larger) than the PM (even disregarding the indirect costs arising from problems
previously cited). The problem which has motivated this work is the establishment
of an optimal PM policy for the off-road truck engines. By optimal here, it is meant
5
a policy which minimizes the total maintenance cost, i.e., the costs associated to PM
and corrective maintenance actions. Thus, it is possible to improve the reliability of
these engines, which are essential to the operation of the production process from the
mining company.
2.2 Objectives
This work aims at the development of statistical models for the analysis of fail-
ure and equipment repairs data, in order to subsidize the elaboration of an optimal
maintenance policy. The focus is on situations where the system is subjected to a
program of periodic preventive maintenance (assumed here to be perfect) and cor-
rective maintenance in the occurrence of failures. However, we work here with the
more general assumption of imperfect repair at failures. The goal is to determine the
optimal frequency of PMs, where the “optimal” goes in the sense of minimizing the
total maintenance cost.
The following specific objectives can be enumerated:
• The preparation of a detailed study about the classes of IR models proposed by
Doyen and Gaudoin, 2004 (ARA and ARI models). For such models, we intend
to explore:
– The use of maximum likelihood estimation method to obtain estimates for
the involved parameters;
– The selection of the best fitted model, considering different memories in
each class, using criteria for model selection;
– The prediction of the future failure process of repairable systems using
reliability indicators based on such models.
• The determination of a PM policy under IR which specifies the optimal PM
frequency;
• The determination of a PM policy under IR with a dynamic perspective, which
allows to incorporate information from each new failure in the system to recal-
culate the optimal time for the next PM action;
6

• The performance comparison between the two proposed policies in terms of
maintenance costs, under different scenarios.
These results are then applied to the practical motivating situation described in the
previous section, aiming to provide the maintenance factory more analytical informa-
tion.
7
3 Layout of the text
The core of the text is a collection of three articles dealing with statistical mod-
els for IR. The three articles were developed with the following co-authors: Marta
Afonso Freitas (Departamento de Engenharia de Produção, UFMG), Enrico Colosimo
(Departamento de Estatística, UFMG) and Gustavo Gilardoni (Departamento de Es-
tatística, UnB).
The first article considers ARI and ARA classes of models proposed by Doyen and
Gaudoin (2004). The estimation in such models is explored and applied to a real
dataset. Note that these data do not refer to those described in Section 2.1, but were
used at this stage due to the extensive record of failures, allowing us to explore the
differences between the studied models. This work is summarized in the first article,
entitled “ARA and ARI Imperfect Repair Models: A Case Study in a Brazilian Mining
Company”, submitted to the journal Reliability Engineering and System Safety. This
article is presented in Section 4.
The second article of this thesis derives a statistical procedure to estimate a peri-
odicity PM policy under the following assumptions: (1) perfect repair in PM, and (2)
IR after each failure. This policy presents optimal time intervals for PM, in order to
minimize the total expected cost with maintenance actions. Its usage is illustrated
as a solution to the problem that motivated this work, described in Section 2.1.
This article, entitled “Optimal Periodic Maintenance Policy under Imperfect Repair:
A Case Study of Off-Road Engines”, submitted to the journal European Journal of
Operational Research and currently under revision, is presented in Section 5.
The third and final article in this thesis, presented in Section 6, discusses both the
determination and practical implementation of an optimal PM policy under IR. This
policy considers the information provided by new failures observed in a repairable
system, allowing to recalculate the optimal time for the next PM, based on the effect
of the repair performed. The proposed method is also applied as a solution to the
problem of the off-road engines. This study comprises the article entitled “Dynamics
of the Optimal Maintenance Policy under Imperfect Repair Models”, which is being
revised for submission.
Finally, Section 7 closes the work with some final remarks. The dataset associated
8

to the practical problem is presented in Appendix A, while the codes refered to the
proposed procedures, implemented in R language, are available in Appendix B.
9
4 ARA and ARI Imperfect Repair Models: A Case
Study in a Brazilian Mining Company
4.1 Abstract
An appropriate maintenance policy is essential to reduce expenses and risks related
to equipment failures. A fundamental aspect to be considered when specifying such
policies is to be able to predict the reliability of the systems under study. The
usual assumptions of minimal or perfect repair at failures are not appropriate for
many real systems, requiring the application of imperfect repair models. In this
paper, the classes Arithmetic Reduction of Age and Arithmetic Reduction of Intensity
models proposed by Doyen and Gaudoin (2004) are explored. Likelihood functions
for such models are derived, assuming Power Law Process and a memory of general
order. Based on this, point and interval estimates were obtained for a real dataset
involving failures in trucks used by a Brazilian mining company considering models
with different memories. Specific statistical measures were used for model selection.
Model parameters, namely, shape and scale for Power Law Process, and the efficiency
of repair were estimated for the best fitted model. They provided evidences that the
trucks tend to fail more frequently over time, justifying the necessity for preventive
maintenance, and also, that the repairs after failures tend to leave the equipment in a
state between as good as new and as bad as old. The Estimation of model parameters
allowed to derive reliability indicators to forecast the future behavior of the failure
process. These results are a valuable information for the mining company. They can
be used to support decision making regarding preventive maintenance policy.
4.2 Introduction
In the industrial scenario, appropriate Preventive Maintenance (PM) policies are
essential to reduce risks of equipment failures, which lead to potential expenses and
unsafe conditions. There is an extensive literature toward specifying such policies,
as the papers from Barlow and Hunter (1960), Morimura (1970), Nakagawa (1986),
Jayabalan and Chaudhuri (1992), Wu and Clements-Croome (2005), Gilardoni and
Colosimo (2007), Bartholomew-Biggs et al. (2009), Wu and Zuo (2010), and Remy
10
et al. (2013). In general, these works are concerned with the study and optimization
of PM policies, through the minimization of maintenance cost functions.
These cost functions, and consequently, the resulting PM times, depend on the
model and the parameters. In general, these parameters are not known in practice,
and, therefore, must be estimated from data. These estimates provide valuable infor-
mation about the systems under study, and allow to (1) assess the aging speed and
the efficiency of repair actions taken after failures; (2) estimate predictive reliability
indicators such as failure intensity and Mean Time to Failure (MTTF) and (3) use
these estimates in a PM optimization procedure (Doyen and Gaudoin, 2011). This
paper is concerned with the two first issues.
When considering models for repairable systems, a critical point is how to account
for the effect of repair actions taken after failures. In this sense, the most explored
assumptions are Minimal Repair (MR), which returns the system to the condition
just before the failure (ABAO), and Perfect Repair (PR), which leaves the system
as if it were new (AGAN). These assumptions were discussed in many works such
as Barlow and Hunter (1960), Phelps (1981), Barlow and Proschan (1987), Zhao and
Xie (1996), Park et al. (2000), and Wang (2002), among others.
Nevertheless, a more realistic assumption for many systems is the Imperfect Repair
(IR) condition. It means that the system returns to an intermediate state between
MR and PR. Nowadays some studies have explored this assumption, among them are
Kijima et al. (1988), Brown and Proschan (1983), Malik (1979), Shin et al. (1996),
Yanez et al. (2002), Pan and Rigdon (2009), and Corset et al. (2012). The former
one have proposed the idea of a virtual age model. It is important to emphasize that
under MR or PR assumptions, the model parameters are basically those related to
the wear-out speed of the systems, while under IR approach, an additional parameter
describes the effect of repair actions. Therefore it is necessary to develop an estimation
method to take this new parameter into account.
Doyen and Gaudoin (2004) proposed two new classes of IR models. In the first
class, ARA, the repair efficiency is expressed by a reduction in the systems virtual age.
In the second class, ARI, the repair efficiency is characterized by the reduction in the
intensity function of the failure process. These models are defined by its memory of
order m, where m refers to the maximum number of previous failure times involved in
11
the calculation of the intensity function. The virtual age model proposed by Kijima et
al. (1988) corresponds to a particular case of these classes, ARA model with memory
of order 1, denoted by ARA1.
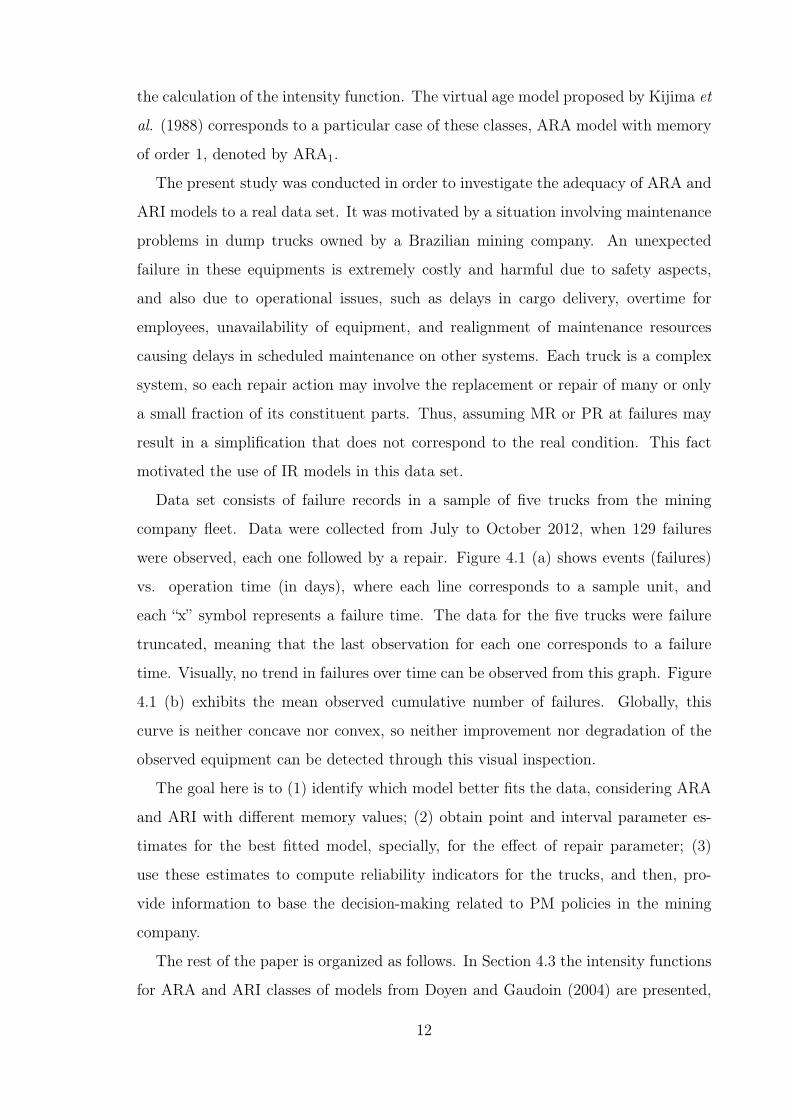
The present study was conducted in order to investigate the adequacy of ARA and
ARI models to a real data set. It was motivated by a situation involving maintenance
problems in dump trucks owned by a Brazilian mining company. An unexpected
failure in these equipments is extremely costly and harmful due to safety aspects,
and also due to operational issues, such as delays in cargo delivery, overtime for
employees, unavailability of equipment, and realignment of maintenance resources
causing delays in scheduled maintenance on other systems. Each truck is a complex
system, so each repair action may involve the replacement or repair of many or only
a small fraction of its constituent parts. Thus, assuming MR or PR at failures may
result in a simplification that does not correspond to the real condition. This fact
motivated the use of IR models in this data set.
Data set consists of failure records in a sample of five trucks from the mining
company fleet. Data were collected from July to October 2012, when 129 failures
were observed, each one followed by a repair. Figure 4.1 (a) shows events (failures)
vs. operation time (in days), where each line corresponds to a sample unit, and
each “x” symbol represents a failure time. The data for the five trucks were failure
truncated, meaning that the last observation for each one corresponds to a failure
time. Visually, no trend in failures over time can be observed from this graph. Figure
4.1 (b) exhibits the mean observed cumulative number of failures. Globally, this
curve is neither concave nor convex, so neither improvement nor degradation of the
observed equipment can be detected through this visual inspection.
The goal here is to (1) identify which model better fits the data, considering ARA
and ARI with different memory values; (2) obtain point and interval parameter es-
timates for the best fitted model, specially, for the effect of repair parameter; (3)
use these estimates to compute reliability indicators for the trucks, and then, pro-
vide information to base the decision-making related to PM policies in the mining
company.
The rest of the paper is organized as follows. In Section 4.3 the intensity functions
for ARA and ARI classes of models from Doyen and Gaudoin (2004) are presented,
12

(a) (b)
Figure 4.1: (a) Failure times in days of operation for each truck (horizontal linesare trucks and “x” are failures); (b) Cumulative number of failures versus days ofoperation.
along with an example for a better understanding of the differences between them.
Likelihood functions for these models are presented in Section 4.4. Measures to com-
pare the models are also discussed, and predictive reliability indicators are derived.
This methodology is then applied to the dump trucks data set, and the results are
presented in Section 4.5. Finally, Section 4.6 ends the paper with some concluding
remarks.
4.3 ARA and ARI classes of models
Assuming that failures in a repairable system are equivalently defined by the pro-
cesses {N(t)}t≥0, or {Ti}i≥1, where N(t) denotes the number of observed failures up
to time t, Ti corresponds to the time elapsed up to the ith failure, and that a re-
pair action (with negligible duration) is taken after each failure, the distribution of
such processes is completely determined by the failure intensity (or simply intensity)
function defined by
ρ(t) = limδt→0
P (N(t+ δt)−N(t) = 1|=t−)
δt, ∀t ≥ 0 (4.1)
where =t− is the minimal filtration defined by the history set of all failure times
occurred before t. It can be shown (Aalen, 1978) that the Mean Cumulative Function
(MCF) of the process is Λ(t) = E[N(t)] =∫ t
0E[ρ(u)]du.
Before the first repair action, the system intensity function is the rate of occurence
13

of failures (ROCOF) function, given by
λ(t) = limδt→0
P (N(t+ δt)−N(t) = 1)
δt. (4.2)
Under MR assumption, the failure process is a NHPP, and ρ(t) = λ(t). A versatile
and extensively explored parametric form under this assumption is the PLP, with
ROCOF function λ(t) = (β/η)(t/η)β−1 and its MCF is given by Λ(t) =∫ t
0λ(u)du =
(t/η)β (Crow, 1974). Here, η is a scale parameter, and β is a shape parameter. When
β > 1, λ(t) increases in t and the system is deteriorating.
Under the IR approach, the model proposed by Kijima et al. (1988) has the virtual
age of a system in time t expressed by
Vt = V (t;N(t);T1,T2, . . . ,TN(t)), (4.3)
where TN(t) denotes the elapsed time since the startup of the system and the N(t)th
failure. Under this model, each repair reduces the virtual age of the system, and the
effect of repair is represented by a parameter denoted by θ (0 ≤ θ ≤ 1), including
ABAO and AGAN as special cases (θ = 1 and θ = 0, respectively).
In ARA class of models proposed by Doyen and Gaudoin (2004), it is assumed
that the system failure intensity at time t (real age) is equal to its ROCOF at time
Vt (virtual age), where Vt ≤ t. Also, between two consecutive failures, its failure in-
tensity is horizontally parallel to its ROCOF. ARA models are defined by its memory
parameter m, so in ARAm model, it is assumed that the repair reduces the increment
in system age since the last m failures, and its failure intensity function is given by
ρARAm(t) = λ(t− (1− θ)min(m−1,N(t)−1)∑
j=0
θjTN(t)−j). (4.4)
At each repair, the θj component in this equation makes older repairs have less
effect on reducing the systems virtual age.
An extreme special case of ARA model, namely ARA1, assumes that the repair
effect is to reduce the increment in system age only by the last failure, while in the
other extreme, ARA∞ assumes that each repair reduces the virtual age of the system
in a quantity proportional to its age immediately before repair.
14
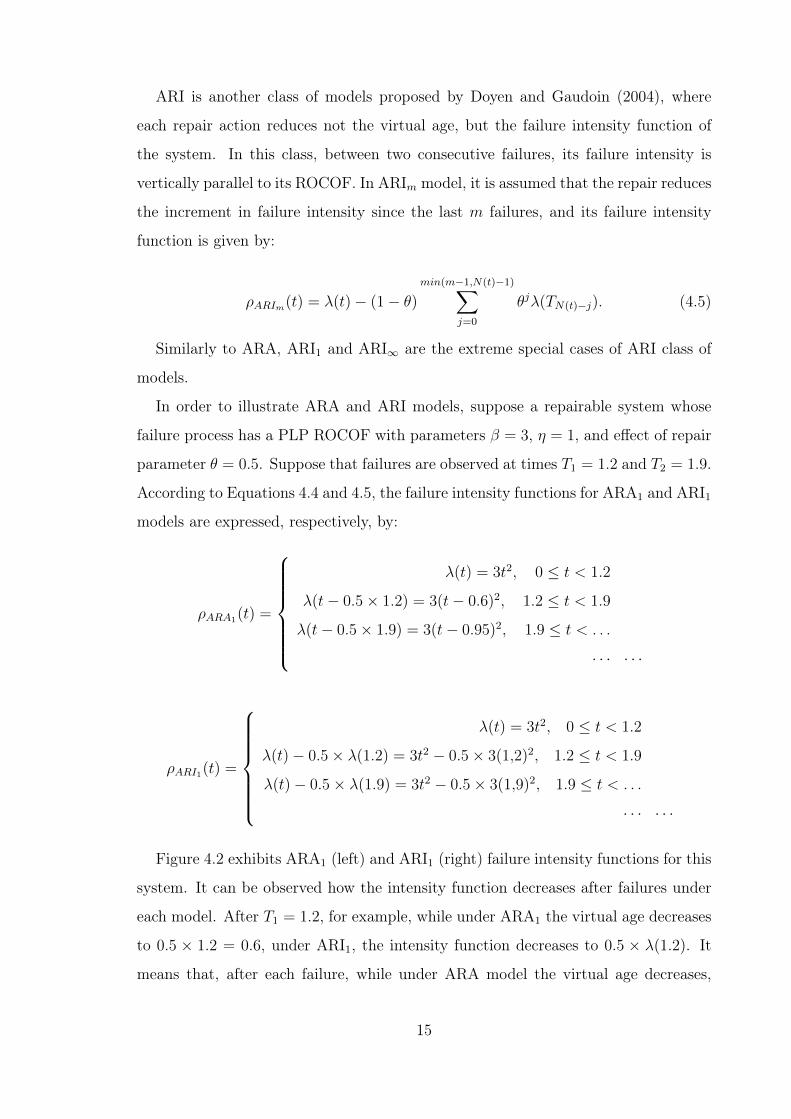
ARI is another class of models proposed by Doyen and Gaudoin (2004), where
each repair action reduces not the virtual age, but the failure intensity function of
the system. In this class, between two consecutive failures, its failure intensity is
vertically parallel to its ROCOF. In ARIm model, it is assumed that the repair reduces
the increment in failure intensity since the last m failures, and its failure intensity
function is given by:
ρARIm(t) = λ(t)− (1− θ)min(m−1,N(t)−1)∑
j=0
θjλ(TN(t)−j). (4.5)
Similarly to ARA, ARI1 and ARI∞ are the extreme special cases of ARI class of
models.
In order to illustrate ARA and ARI models, suppose a repairable system whose
failure process has a PLP ROCOF with parameters β = 3, η = 1, and effect of repair
parameter θ = 0.5. Suppose that failures are observed at times T1 = 1.2 and T2 = 1.9.
According to Equations 4.4 and 4.5, the failure intensity functions for ARA1 and ARI1
models are expressed, respectively, by:
ρARA1(t) =
λ(t) = 3t2, 0 ≤ t < 1.2
λ(t− 0.5× 1.2) = 3(t− 0.6)2, 1.2 ≤ t < 1.9
λ(t− 0.5× 1.9) = 3(t− 0.95)2, 1.9 ≤ t < . . .
· · · · · ·
ρARI1(t) =
λ(t) = 3t2, 0 ≤ t < 1.2
λ(t)− 0.5× λ(1.2) = 3t2 − 0.5× 3(1,2)2, 1.2 ≤ t < 1.9
λ(t)− 0.5× λ(1.9) = 3t2 − 0.5× 3(1,9)2, 1.9 ≤ t < . . .
· · · · · ·
Figure 4.2 exhibits ARA1 (left) and ARI1 (right) failure intensity functions for this
system. It can be observed how the intensity function decreases after failures under
each model. After T1 = 1.2, for example, while under ARA1 the virtual age decreases
to 0.5 × 1.2 = 0.6, under ARI1, the intensity function decreases to 0.5 × λ(1.2). It
means that, after each failure, while under ARA model the virtual age decreases,
15
under ARI model, the intensity function decreases, what explains the models nomen-
clature.
Figure 4.2: ARA1 and ARI1 failure intensity functions for PLP intensity functionwith β = 3, η = 1, and θ = 0.5, and observed failure times T1 = 1.2 and T2 = 1.9.
4.4 Estimation in ARA and ARI classes of models
In this section, likelihood functions associated to the intensity functions 4.4 and
4.5 are derived. They are used to get Maximum Likelihood (ML) estimators for the
parameters. Measures for choosing the best model are also discussed, and finally, reli-
ability indicators, such as Reliability function and MTTF for each model are derived.
4.4.1 Parameters estimation: The likelihood functions
Consider k identical repairable systems, k = 1,2, . . ., where the failures occur
independently, and assume the following conditions:
• At each failure, a repair action of degree θ is performed.
• ni failures are observed in the i− th system, i = 1,2, . . . ,k.
• N =∑k
i=1 ni is the total number of observed failures in the systems.
• Let Ti,j (i = 1,2, . . . ,k, j = 1,2, . . . ,ni) be random variables representing the
failure times for the i− th system, recorded as the time since the initial start-up
of the system (Ti,1 < Ti,2 < . . . < Ti,ni). For time truncated systems, ni is a
random variable, and for failure truncated systems, ni is fixed. In addition, let
16
ti,j denote their observed values (data), and Ti = (Ti,1;Ti,2; . . . ;Ti,ni)t be the
(ni × 1) random vector of failure times for the ith system.
• If the i−th system is time truncated, it is observed until the predetermined time
t∗i occurs, and if it is failure truncated, it is observed until the predetermined
number of failures ni occurs. So, the last observation time refers to a censor in
t∗i for time truncated, or a failure in ti,nifor failure truncated systems.
• Let µ denote the vector of model parameters, which includes the parameters
indexing the ROCOF and the repair efficiency parameter θ. For example, as-
suming PLP for the ROCOF, we have µ = (β; η; θ)t.
A likelihood function for this process must combine the joint probability density
of the k systems failure times. Using the failure intensity functions in Equations 4.4
and 4.5, the likelihood functions for ARAm and ARIm models are given, respectively,
by:
LARAm(µ) =
=k∏i=1
ni∏j=1
{λ(ti,j − (1− θ)min(m−1,j−2)∑
p=0
θpti,j−1−p)×
×e−Λ(ti,j−(1−θ)∑min(m−1,j−2)
p=0 θpti,j−1−p)+Λ(ti,j−1−(1−θ)∑min(m−1,j−2)
p=0 θpti,j−1−p)} ×
×e−Λ(t∗i−(1−θ)∑min(m−1,ni−1)
p=0 θpti,ni−p)+Λ(ti,ni−(1−θ)
∑min(m−1,ni−1)p=0 θpti,ni−p)
and
LARIm(µ) =
=k∏i=1
ni∏j=1
{[λ(ti,j)− (1− θ)min(m−1,j−2)∑
p=0
θpλ(ti,j−1−p)]×
×e−Λ(ti,j)+Λ(ti,j−1)+(1−θ)[ti,j−ti,j−1]∑min(m−1,j−2)
p=0 θpλ(ti,j−1−p)} ×
×e−Λ(t∗i )+Λ(ti,ni)+(1−θ)[t∗i−ti,ni
]∑min(m−1,ni−1)
p=0 θpλ(ti,ni−p),
17
where, if the system is failure truncated, t∗i = ti,ni. These likelihood functions
can then be rewritten assuming a PLP for the ROCOF. So, in order to find the ML
estimates β̂, η̂ and θ̂ of β, η, θ respectively, the following log-likelihood functions must
be numerically maximized for the ARAm and ARIm classes:
lARAm(µ) = logLARAm(µ) =
=
(k∑i=1
ni
)log(β)− β
(k∑i=1
ni
)log(η) +
+(β − 1)
k∑i=1
ni∑j=1
log(ti,j − (1− θ)min(m−1,j−2)∑
p=0
θpti,j−1−p)
+
+k∑i=1
ni∑j=1
−(ti,j − (1− θ)∑min(m−1,j−2)
p=0 θpti,j−1−p
η
)β
+
(ti,j−1 − (1− θ)
∑min(m−1,j−2)p=0 θpti,j−1−p
η
)β+
+k∑i=1
−(t∗i − (1− θ)∑min(m−1,ni−1)
p=0 θpti,ni−p
η
)β
+
(ti,ni− (1− θ)
∑min(m−1,ni−1)p=0 θpti,ni−p
η
)β
and
lARIm(µ) = logLARIm(µ) =
=
(k∑i=1
ni
)log(β)− β
(k∑i=1
ni
)log(η) +
+k∑i=1
ni∑j=1
log
tβ−1i,j − (1− θ)
min(m−1,j−2)∑p=0
θptβ−1i,j−1−p
+
+η−β
k∑i=1
ni∑j=1
−tβi,j + tβi,j−1 + (1− θ)β[ti,j − ti,j−1]
min(m−1,j−2)∑p=0
θptβ−1i,j−1−p
+
+η−β
k∑i=1
−t∗i β + tβi,ni+ (1− θ)β[t∗i − ti,ni
]
min(m−1,ni−1)∑p=0
θptβ−1i,ni−p
Asymptotic theory based on the Normal distribution can be used to construct
confidence intervals for the parameters.
18
Depending on the number of observed failures for the systems under study, ARA
and ARI models can be fitted with different memory values (m). For example, if the
maximum number of failure times observed for the systems is 5, m can assume the
values 1 to 5, with m = 5 corresponding to m = ∞. However, fitting many models
to a data set requires model selection, and a basic way to achieve this is through
the maximum values of the estimated log-likelihoods, which will be denoted here by
L̂. Since all models explored have the same number of parameters, the comparison
using L̂ corresponds to the one obtained from Akaike Information Criterion (AIC) and
Bayesian Information Criterion (BIC) measures (Akaike, 1974 and Schwarz, 1978).
Another useful measure to compare models was proposed by Burnham and Ander-
son (2004). It is based on the scaling criteria values,
∆r = L̂max − L̂r, (r = 1, . . . ,R) (4.6)
where L̂max is the maximum of the R different L̂ values, considering that R different
models were fitted. This transformation forces the best model to have ∆ = 0, while
the rest of the models have positive values. These values can then be used to calculate
weights, based on the normalization of the model likelihoods such that they sum to
1 and can be treated as probabilities,
wr =exp(−∆r/2)∑Rr=1 exp(−∆r/2)
. (4.7)
So, the wr are useful as the “weight of evidence” in favor of model r as being the
best model in the set.
After fitting and choosing the best model for the data set under study, reliability
indicators can be derived from the estimated parameters. The next section presents
some of the indicators that can be derived from models 4.4 and 4.5.
4.4.2 Predictive reliability indicators
In order to forecast for future systems behavior, ARA and ARI intensity functions
can be used to compute predictive reliability indicators. Considering that the last
observed failure time is Tn = tn, it can be of interest the time to next failure Tn+1−Tn,
given the history up to time Tn = tn (=Tn).
19
The following functions can characterize the future behavior of the process and
they might be useful for the system engineering manager:
• The reliability function at time Tn = tn is
RTn(t) = P (Tn+1 − tn > t|=Tn) = P (N(tn,tn + t] = 0|=Tn)
= exp
{−∫ tn+t
tn
ρ(u)du
}. (4.8)
where tn ≤ u ≤ tn + t < Tn+1. This function express the probability that the
system will work without failure for a given time t after Tn, given all the past
history of the failure process.
• The MTTF at time Tn = tn is the mean time to the next failure occurring after
Tn, given by
MTTFTn = E[Tn+1 − tn|=Tn ] =
∫ ∞0
RTn(u)du, (4.9)
where RTn is the Equation 4.8.
Replacing the intensity functions 4.4 and 4.5 in Equation 4.8, the reliability func-
tions for models ARAm and ARIm are given, respectively, by
RTn,ARAm(t) = exp
−∫ tn+t
tn
λ(u− (1− θ)min(m−1,n−1)∑
j=0
θjtn−j)du
= exp
−Λ(t− (1− θ)min(m−1,n−1)∑
j=1
θjtn−j)
×× exp
Λ(−(1− θ)min(m−1,n−1)∑
j=1
θjtn−j)
and
20
RTn,ARIm(t) = exp
−∫ tn+t
tn
λ(u)− (1− θ)min(m−1,n−1)∑
j=0
θjλ(tn−j)du
= exp
Λ(tn)− Λ(tn + t) + t(1− θ)min(m−1,n−1)∑
j=0
θjλ(tn−j)
which, in the particular case of a ROCOF modeled by a PLP, become
RTn,ARAm(t) = exp
−(t− (1− θ)
∑min(m−1,n−1)j=1 θjtn−j
η
)β×
× exp
(−(1− θ)
∑min(m−1,n−1)j=1 θjtn−j
η
)β (4.10)
and
RTn,ARIm(t) = exp
{(tnη
)β−(tn + t
η
)β}×
× exp
t(1− θ)min(m−1,n)−1)∑
j=0
θjβ
η
(tn−jη
)β−1
. (4.11)
After using the likelihood functions from Section 4.4.1, the ML estimates β̂, η̂ and
θ̂ can be replaced in Equations 4.10 and 4.11 and then in MTTF formula 4.9, so that
the future behavior of a given system can be predicted. The next section presents the
results of this methodology when applied to the dump trucks data set.
4.5 Dump trucks data set revisited
In the following, we apply ARAm and ARIm models with several memories to the
trucks data set described in Section 4.2. ML estimates for PLP (β and η) and for
the effect of repair (θ) parameters are obtained through the numerical maximization
of the log-likelihood functions derived in Section 4.4, using a script written in R
(www.R-project.org, v.2.15). Estimates are also obtained considering the MR PLP
21
model. Initially, the purpose is to identify which model provides the best fit to
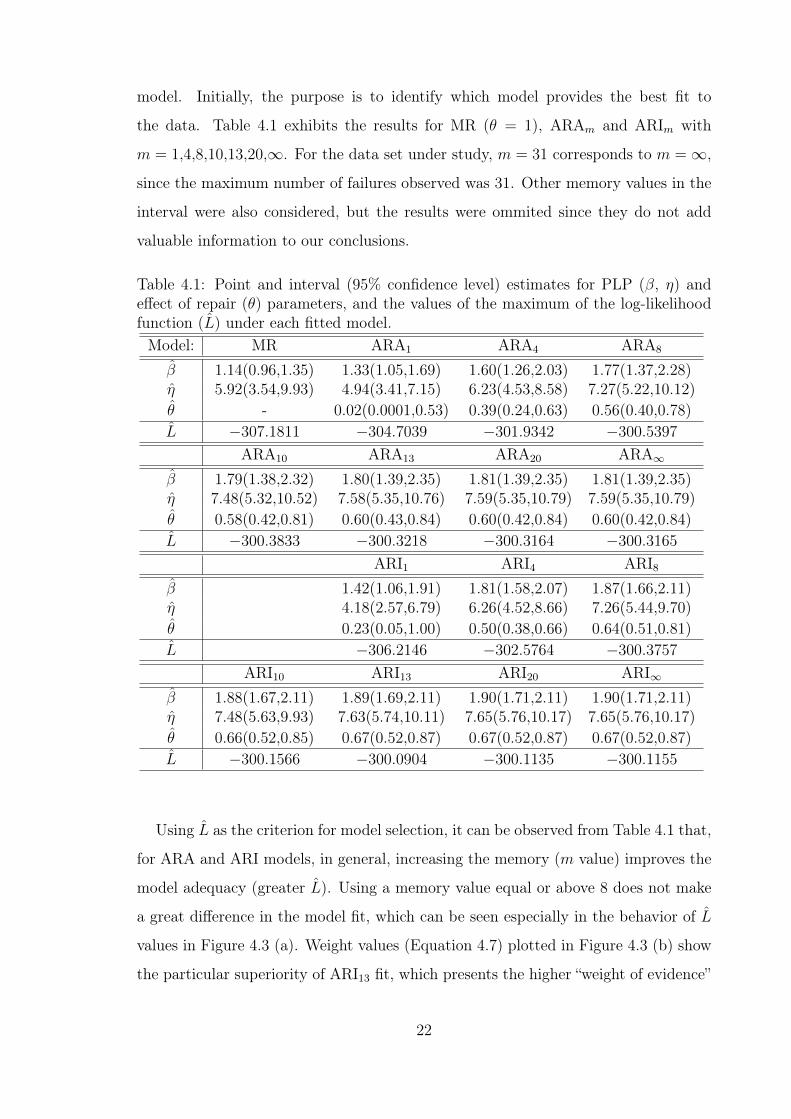
the data. Table 4.1 exhibits the results for MR (θ = 1), ARAm and ARIm with
m = 1,4,8,10,13,20,∞. For the data set under study, m = 31 corresponds to m =∞,
since the maximum number of failures observed was 31. Other memory values in the
interval were also considered, but the results were ommited since they do not add
valuable information to our conclusions.
Table 4.1: Point and interval (95% confidence level) estimates for PLP (β, η) andeffect of repair (θ) parameters, and the values of the maximum of the log-likelihoodfunction (L̂) under each fitted model.Model: MR ARA1 ARA4 ARA8
β̂ 1.14(0.96,1.35) 1.33(1.05,1.69) 1.60(1.26,2.03) 1.77(1.37,2.28)η̂ 5.92(3.54,9.93) 4.94(3.41,7.15) 6.23(4.53,8.58) 7.27(5.22,10.12)
θ̂ - 0.02(0.0001,0.53) 0.39(0.24,0.63) 0.56(0.40,0.78)
L̂ −307.1811 −304.7039 −301.9342 −300.5397
ARA10 ARA13 ARA20 ARA∞β̂ 1.79(1.38,2.32) 1.80(1.39,2.35) 1.81(1.39,2.35) 1.81(1.39,2.35)η̂ 7.48(5.32,10.52) 7.58(5.35,10.76) 7.59(5.35,10.79) 7.59(5.35,10.79)
θ̂ 0.58(0.42,0.81) 0.60(0.43,0.84) 0.60(0.42,0.84) 0.60(0.42,0.84)
L̂ −300.3833 −300.3218 −300.3164 −300.3165
ARI1 ARI4 ARI8β̂ 1.42(1.06,1.91) 1.81(1.58,2.07) 1.87(1.66,2.11)η̂ 4.18(2.57,6.79) 6.26(4.52,8.66) 7.26(5.44,9.70)
θ̂ 0.23(0.05,1.00) 0.50(0.38,0.66) 0.64(0.51,0.81)
L̂ −306.2146 −302.5764 −300.3757
ARI10 ARI13 ARI20 ARI∞β̂ 1.88(1.67,2.11) 1.89(1.69,2.11) 1.90(1.71,2.11) 1.90(1.71,2.11)η̂ 7.48(5.63,9.93) 7.63(5.74,10.11) 7.65(5.76,10.17) 7.65(5.76,10.17)
θ̂ 0.66(0.52,0.85) 0.67(0.52,0.87) 0.67(0.52,0.87) 0.67(0.52,0.87)
L̂ −300.1566 −300.0904 −300.1135 −300.1155
Using L̂ as the criterion for model selection, it can be observed from Table 4.1 that,
for ARA and ARI models, in general, increasing the memory (m value) improves the
model adequacy (greater L̂). Using a memory value equal or above 8 does not make
a great difference in the model fit, which can be seen especially in the behavior of L̂
values in Figure 4.3 (a). Weight values (Equation 4.7) plotted in Figure 4.3 (b) show
the particular superiority of ARI13 fit, which presents the higher “weight of evidence”
22
0 5 10 15 20 25 30
−30
8−
306
−30
4−
302
−30
0
memory order
L̂MRARAARI
(a)
0 5 10 15 20 25 30
0.00
00.
005
0.01
00.
015
0.02
0
memory order
wr
(b)
Figure 4.3: Criteria values for model selection versus memory order (m), under eachfitted model for the trucks data set. Dot, triangles and crosses represent values forMR, ARA and ARI models, respectively. The y-axis in each graph are: (a) Maximumof log-likelihood, and (b) Weight - Eq. 4.7.
in its favor int the data set. However, in order to simplify the conclusions in this
paper, ARI∞ model was used as the best one, since its criteria measures are very
similar to the ones obtained for ARI13.
For ARI∞, the estimated β parameter was 1.90, with 95% confidence interval given
by 1.71 to 2.11, indicating that the equipment failure intensity function increases
with time. It means that the systems are under intrinsic ageing. The trucks tend
to fail more frequently over time, justifying the necessity for PM. Point and interval
estimates for the effect of repair parameter θ are 0.67 (0.52,0.87). It can be observed
that it is significantly different than the two extreme cases ABAO (θ = 1) and AGAN
(θ = 0). It means that the repairs after failures tend to leave the equipment in a state
between AGAN and ABAO. Any attempt to establish a PM policy for these trucks
must take these parameter values into account, as assuming the basic assumptions of
MR or PR can lead to serious errors.
Based on the estimated parameter values from Table 4.1, Figure 4.4 presents the
plots of the estimated intensity functions under the extreme models MR, ARA1, ARI1,
ARA∞, and ARI∞, considering the first failure times for one of the sample trucks.
23
0 5 10 15 20 25 30
0.0
0.1
0.2
0.3
0.4
0.5
days
ρ̂(t)
MRARA1
ARA∞
(a)
0 5 10 15 20 25 30
0.0
0.1
0.2
0.3
0.4
0.5
days
ρ̂(t)
ARI1ARI∞
(b)
Figure 4.4: Estimated intensity functions under the fitted models, considering thefirst five failure times for one of the sample trucks. MR, ARA1 and ARA∞ modelsare showed on the left, while ARI1 and ARI∞ are on the right.
Is is remarkable the difference in the behavior of the intensity functions between the
worst fitted models (MR, ARA1, and ARI1) and the best one, ARI∞.
The reliability indicators derived in Section 4.4.2 are an useful tool for providing
information about the future behavior of these repairable systems. In order to illus-
trate, it is considered one of the five sample trucks, whose last observed failure time
is T23 = 106.429 days. We can predict the behavior of the time to next failure (T24),
given the history up to time T23 (=T23−). Figure 4.5 shows the reliability functions
R̂T23(t) calculated for MR, ARA (Equation 4.10) and ARI (Equation 4.11) models,
using the ML parameters estimates. For the five models considered in the graphs, the
reliability function goes from one to zero in 12 days, that is, the estimated probability
of this system work without failure for 12 days after T23 = 106.429 is zero, given all
the past of the failure process. While the fitted curve under model ARA∞ is very
close to the best fitted model one (ARI∞), the reliability functions under ARA1 and
MR models tend to overestimate the survival probabilities. This behavior can also be
observed in the corresponding MTTF values from Table 4.2. The mean time to the
next failure occuring after T23 is 3.1 days according to the best fitted model, ARI∞,
while under ARA1 model is 3.7 days.
24
0 2 4 6 8 10 12
0.0
0.2
0.4
0.6
0.8
1.0
days after T=106.429
Rel
iab
ility
fu
nct
ion
MRARA 1ARA infty
(a)
0 2 4 6 8 10 12
0.0
0.2
0.4
0.6
0.8
1.0
days after T=106.429
Rel
iab
ility
fu
nct
ion
ARI 1ARI infty
(b)
Figure 4.5: Estimated reliability functions at T23 = 106.429 days for the trucks dataset under the fitted models.
Table 4.2: Estimated MTTF values at T23 = 106.429 days for the trucks data setunder the fitted models.
Model: MR ARA1 ARA∞ ARI1 ARI∞3.450 3.719 3.023 3.128 3.144
4.6 Conclusions and final remarks
In this paper, the problem related to the specification of a PM policy for repairable
systems was studied under the primary focus of predicting the reliability of the sys-
tems using a well fitted model, under the general assumption of IR at failures. From
ARA and ARI classes of models, likelihood functions were derived, and estimation
methods were presented in order to obtain point and interval estimates for the param-
eters of the models. Assuming a PLP ROCOF, ARA and ARI models with different
values of memory were fitted and compared to the classical MR model, using a dataset
of failures records in dump trucks used by a mining company. Criteria methods were
25
applied in order to choose the best fitted model. Estimation of model parameters al-
lowed to forecast future behavior of the failure process, through reliability indicators.
According to criteria measures for model selection, the best fitted model was ARI∞.
Based on this model, the estimated shape of aging speed (β) parameter was 1.90, with
95% confidence interval given by 1.71 to 2.11, and the effect of repair parameter θ was
estimated as 0.67 (0.52 to 0.87). These values give evidences that the trucks tend to
fail more frequently over time, and also, that the repairs after failures tend to leave
the equipment in a state between AGAN and ABAO. Illustrative predictive reliability
indicators for a specific truck in the sample showed that the estimated probability of
this system to work without failure for 12 days after the last observed failure time
is zero, given all the past of the failure process. Additionally, the estimated MTTF
after the last failure indicated that the mean time to the next failure for this system
is 3.128 days.
It is important to point out that the trucks studied in this paper were originally
designed to operate in road highways, but instead of this, are used by the mining
company under much more severe conditions. Therefore, the PM policy suggested by
the trucks manufacturer is not applicable, making it necessary for the mining company
to define a PM policy based on the real working conditions of these equipment.
Parameter estimates derived in this paper, such as the shape of aging speed and
the effect of repair parameters, and also, the predictive reliability indicators, were
obtained considering a history of failure times for the systems under the operating
conditions inside the mine. They represent the real behavior of this failure process.
Therefore, they provide important information to the decision-making process related
to PM policies in the mining company.
26
5 Optimal Periodic Maintenance Policy Under Im-
perfect Repair: A Case Study of Off-Road Engines
5.1 Abstract
In the repairable systems literature one can find a great number of papers that pro-
pose maintenance policies under the assumption of minimal repair after each failure
(such repair leaves the system in the same condition as it was just before the failure
- as bad as old). This paper derives a statistical procedure to estimate the optimal
Preventive Maintenance (PM) periodic policy, under the following two assumptions:
(1) perfect repair at each PM action (i.e., the system returns to the as good as new
state) and (2) imperfect system repair after each failure (the system returns to an
intermediate state between as bad as old and as good as new). Models for imperfect
repair have already been presented in the literature. However inference procedures
for the quantities of interest have not yet been fully studied. In the present paper,
statistical methods, including the likelihood function, Monte Carlo simulation, and
bootstrap resample methods, are used in order to: (1) estimate the degree of efficiency
of repair and (2) obtain the optimal preventive maintenance check points that mini-
mize the expected total cost. This study was motivated by a real situation involving
off-road engines maintenance.
5.2 Introduction
5.2.1 Motivating situation: Off-road engine maintenance data
Off-road trucks are designed to operate in harsh conditions and, consequently,
they are used in every conceivable industry where rough terrain goes with the ter-
ritory (mining, drilling, etc.). In mining companies particularly, off-road trucks are
used to transport high production and, for that matter, the good performance of this
equipment is essential to the financial health of this kind of business. Due to the high
cost of these systems, one great concern is the implementation of good maintenance
policies in order to prolong their life and reduce any expenses generated by the oc-
curence of unexpected failures. Engine failures, for example, cost millions of dollars
27
to the global mining industry directly (replacement and corrective repair actions)
and indirectly through the inconveniences caused by those failures, such as loss of
production, security risks, and reallocation of maintenance resources.
This paper was motivated by a real situation concerning engine failures in off-road
trucks used by a Brazilian mining company. This company keeps a database with de-
tailed descriptions of all maintenance actions performed on their off-road engines. The
data used in this paper are a subset of this database, and include preventive (sched-
uled) and corrective (nonscheduled) maintenance records for a sample of 143 diesel
engines. There were 50 Preventive Maintenance (PM) actions during the follow-up
period, each assumed to be a perfect repair returning the engine to AGAN condition.
Therefore it is fair to say that a new system has been put up into observation just
after the PM action.
Consequently, as far as the data analysis is concerned, these 50 PM actions leaded
to 50 new systems. The final database consisted of 143+50=193 diesel engines and
208 failure time were recorded. In addition, among the 193 engines, 52 were right
censored since their last inspection time corresponded to a system removal for a PM.
The perfect repair assumption was verified through a statistical test comparing the
143 original systems to the 50 new ones generated by the PM actions. No evidence
of difference between the failures behavior of the two groups was found.
Figure 5.1 plots the mean cumulative number of failures versus time (in hours of
operation) for the sample of 193 engines. The convex shape of this function indicates
that failures tend to occurr more frequently as the system age increases, in other
words, the times between failures tend to get shorter with advancing age. This de-
teriorating behavior of the engines indicates that PM actions are essential to ensure
the reliability of these equipment.
According to the mining company, the cost of a corrective maintenance performed
after an unexpected failure is 23% higher than the cost of preventive maintenance.
Hence, the company needs to adopt a maintenance policy that favors PM actions, as
opposed to repair actions taken after failures.
28
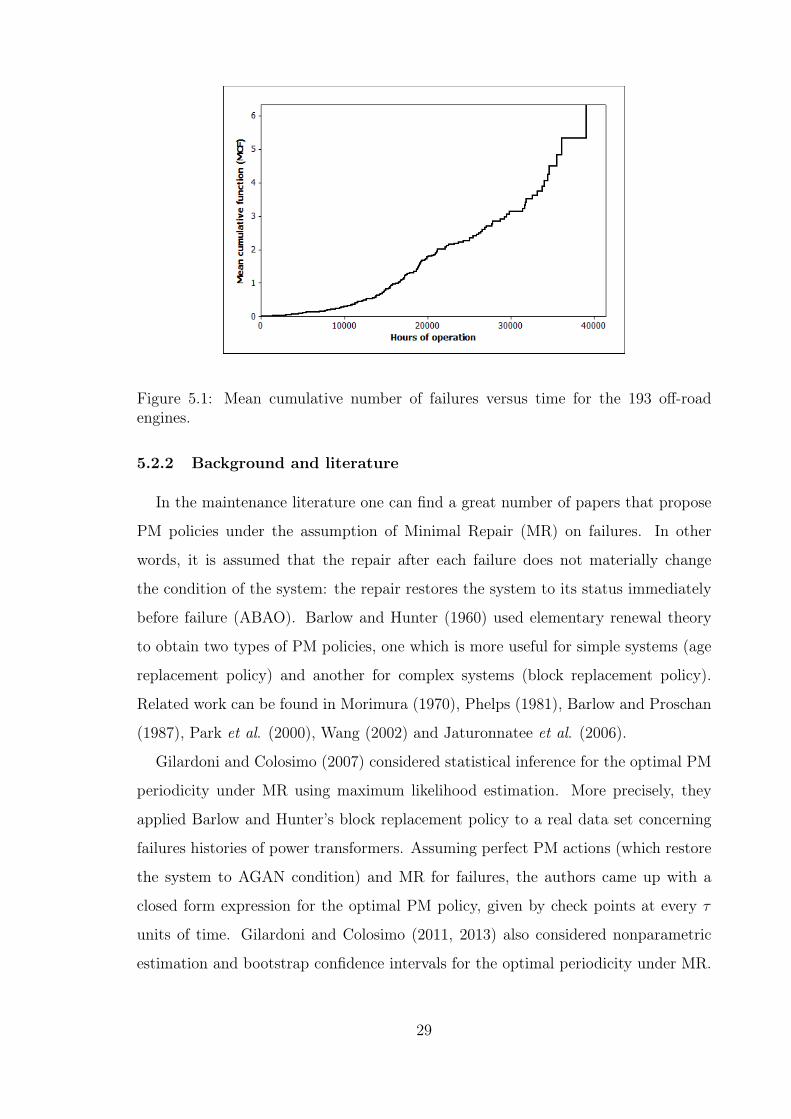
Figure 5.1: Mean cumulative number of failures versus time for the 193 off-roadengines.
5.2.2 Background and literature
In the maintenance literature one can find a great number of papers that propose
PM policies under the assumption of Minimal Repair (MR) on failures. In other
words, it is assumed that the repair after each failure does not materially change
the condition of the system: the repair restores the system to its status immediately
before failure (ABAO). Barlow and Hunter (1960) used elementary renewal theory
to obtain two types of PM policies, one which is more useful for simple systems (age
replacement policy) and another for complex systems (block replacement policy).
Related work can be found in Morimura (1970), Phelps (1981), Barlow and Proschan
(1987), Park et al. (2000), Wang (2002) and Jaturonnatee et al. (2006).
Gilardoni and Colosimo (2007) considered statistical inference for the optimal PM
periodicity under MR using maximum likelihood estimation. More precisely, they
applied Barlow and Hunter’s block replacement policy to a real data set concerning
failures histories of power transformers. Assuming perfect PM actions (which restore
the system to AGAN condition) and MR for failures, the authors came up with a
closed form expression for the optimal PM policy, given by check points at every τ
units of time. Gilardoni and Colosimo (2011, 2013) also considered nonparametric
estimation and bootstrap confidence intervals for the optimal periodicity under MR.
29
However, in many practical situations, more realistic notions of repair, intermediate
between the two extremes AGAN and ABAO, might be needed. In other words,
many repairs actions are more likely to be Imperfect Repairs (IR), and any attempt
to elaborate an optimal maintenance policy must take the actual degree of efficiency
of these repairs into account. Many models have already been proposed for IR effects
(for a review see, for example, Pham and Wang ,1996). Among them are the virtual
age models proposed by Kijima et al. (1988) and Kijima (1989). In particular, Kijima
et al. (1988) adapted the block replacement policy by Barlow and Hunter (1960) to
the assumption of IR, where the degree of efficiency of the repair is represented by
the parameter θ (0 ≤ θ ≤ 1) and includes ABAO and AGAN as special cases (θ = 1
and θ = 0, respectively). The authors developed a virtual age model to describe
the operation over time of a system which is repaired by IRs. But opposed to the
MR case developed by Gilardoni and Colosimo (2007), under IR assumption there
is no closed form expression to find the optimal PM periodicity. To overcome this
difficulty, an approximation procedure was proposed by the authors, but its usage
depends on the knowledge of the repair efficiency (θ) and the distribution of the
lifetimes of the systems being studied. Numerical examples were provided assuming
the particular case of a Gamma distribution, but the model was not statistically
studied. More recently, Wu and Zuo (2010) presented a collection of PM models
under IR assumption, but statistical estimation for the models parameters was also
not discussed.
Only a few IR models have been statistically studied, and the emphasis has been
on the estimation of the repair efficiency parameter. For virtual age models, some
empirical studies on maximum likelihood estimators have been published: Shin et al.
(1996), Yanez et al. (2002) and Doyen and Gaudoin (2004). All these articles are
based on simulation results. In particular, Doyen and Gaudoin (2004) proposed two
new classes of IR models. In the first class of models, the repair effect is expressed by
a reduction in the failure intensity (the so called Arithmetic Reduction of Intensity
or ARI models). In the second class, the repair effect is expressed by a reduction in
the system’s virtual age (the so called Arithmetic Reduction of Age or ARA models).
A numerical statistical study on the quality of the model parameters estimators was
presented. It is noteworthy that the virtual age model proposed by Kijima et al.
30
(1988) corresponds to the particular case of ARA model with memory 1, namely,
ARA1. More recently, Doyen and Gaudoin (2006, 2011) proposed the joint estimation
of aging and maintenance efficiency and also, Pan and Rigdon (2009) and Corset et
al. (2012) used Bayesian analysis for the ARA and ARI classes of models, but the
focus was not on optimal maintenance policies.
More recently, Remy et al. (2013) presented a case study of technical and eco-
nomic optimization of the periodicity of predetermined PM actions carried out on a
repairable industrial system from an EDF electric power plant. Using several model
selection criteria, the authors came up with the best model, namely [CM ARA∞; PM
AGAN], in other words, corrective maintenance (CM) actions were modeled via an
ARA model of order infinity and PM actions modeled as renewals. The parameters
associated to the intensity function and efficiency of repair were estimated. Then,
using an economic indicator as the optimization criterion, the authors came up with
an equation for CTOT , the predictive total maintenace cost. Since CTOT is a random
variable, the optimal periodicity w is the value that minimizes the expected value of
CTOT . The search for this optimal value was made through a Monte Carlo procedure
where N = 5×10⁴ trajectories were drawn, given a set of fictitious but realistic input
data.
In the present work we also deal with the estimation of the effect of the repair under
a situation where PM actions are modeled as perfect (AGAN) and the corrective
actions considered IRs. The main difference of this work with the one of Remy et al.
(2013) is that the search for the optimal periodicity was done via an approximation
of the mean (cumulative number of failures) function and not by a search for a given
set of input data.
5.2.3 The problem
From a modelling point of view, {N(t)}t≥0 (where N(t) denotes the number of
observed failures up to time t) is a stochastic point process, with mean function
Λ(t) = E[N(t)] and failure intensity function
ρ(t) = limδt→0
P (N(t+ δt)−N(t) = 1|=−t )
δt, ∀t ≥ 0 (5.1)
31
where =−t represents the history up to time t (informally, one could think of =−t as
the information provided by the failure times 0 < t1 < · · · < tN(t) < t).
It can be shown (see, e.g. Aalen, 1978) that Λ(t) =∫ t
0E[ρ(s)] ds .
Before the first maintenance action, the system failure intensity is the rate of
occurrence of failures (ROCOF), given by
λ(t) = limδt→0
E[N(t+ δt)−N(t)]
δt. (5.2)
While ρ(t) depends on the history =−t , the ROCOF λ(t) is not conditional and
hence depends only on t. The ROCOF characterizes the reliability the system would
have if it was not maintained.
Under the MP assumption, it is assumed that the effect of maintenance is to leave
the system in the same state as it was just before failure. The underlying failure
process in this case is a Nonhomogeneous Poisson Process (NHPP), and the failure
intensity function ρ(t) equals the ROCOF. In other words, ρ(t) = λ(t), t ≥ 0.
Under the IR assumption, some functional forms for ρ(t) have been proposed in the
literature. In particular, for ARA1 model, it can be shown that the failure intensity
is given by (Doyen and Gaudoin, 2004)
ρ(t) = λ(t− (1− θ)TN(t)), (5.3)
where Tn is a random variable representing the real age of the system at the nth
failure (the elapsed time since the initial start-up of the system) and λ(.) is the
ROCOF corresponding to the condition of MR.
If θ = 1, it is assumed that an MR is performed (NHPP). Futhermore, θ = 0
indicates that the system is renewed after each repair and the resulting process is a
Renewal Process. Under this model, after each repair the virtual age of the system
is reduced by the multiplicative constant 1− θ.
If the intensity function is the one given in Equation 5.3, it can be shown (Kijima
et al., 1988) that the expected number of failures (or mean function) at time τ is
given by
32
Λ(τ) =
∫ τ
0
E[λ(t− (1− θ)TN(t))]dt. (5.4)
This equation is usually referred to in the literature as the general renewal func-
tion, or g-renewal function. Unfortunately, there is no closed form solution for this
equation, except for special cases, such as θ = 1 (MR), or θ = 0 (perfect repair) with
the underlying failure times exponentially distributed.
For the general case (0 ≤ θ ≤ 1), a deterministic approximation method for Equa-
tion 5.4 was proposed by Kijima et al. (1988). However, applying such an approxi-
mation to real systems (which is of great practical interest) is not possible, because
this method does not enable estimating the parameters from the failure history data.
Later on, Yevkin and Krivtsov (2012) also proposed an approximation for the g-
renewal function, but no inference procedure with desirable statistical properties was
proposed.
Although no closed form solution may be obtained for the g-renewal function, this
function still can be estimated from the data.
In view of the limitations of the approximations cited above, this paper proposes
a procedure to obtain estimators for Equation 5.4 using the observed failure history.
The proposed method aims at dealing with the following three issues at the same time,
namely: (1) the estimation of the parameters of the intensity function ρ(t) (Equation
5.3), (2) the calculation of an estimator for the mean function Λ(t) (Equation 5.4),
and (3) the combination of (1) and (2) to find the optimal PM policy, i.e., to obtain
the optimal PM check points (or periodicity τ) that minimize the expected total
cost (preventive and corrective maintenance actions) under an IR environment. The
method is applied to the failure history of off-road engines.
The outline of this paper is as follows. In Section 5.3, the cost function to be
minimized is presented. Section 5.4 deals with statistical methods. In particular,
the expression of the likelihood function needed to estimate the model parameters,
namely, the intensity function and the efficiency of repair parameters, is derived. In
Section 5.5, a method to use these parameter estimates to find the optimal PM policy
(given by check points at every τ units of time) is proposed. In fact, this is the main
contribution of this paper. First of all, a procedure to estimate Λ(t) from the data is
33
presented. Next, it is described how to use these estimates to determine the optimal
PM periodicity for a predetermined ratio of costs (CPM/CIR), where CPM and CIR
denote the PM and IR actions costs, respectively. Also, a Monte Carlo experiment
was run to study the performance of the proposed method. Section 5.6 presents the
results of this study, and also illustrates the proposed methodology with simulations.
The method is applied to the off-road engines maintenance data and the results are
presented in Section 5.7 (point and interval estimates for τ are provided). Conclusions
and final comments end the paper in Section 5.8.
5.3 Cost Function and Optimal PM Under an ARA1 Model
Consider a system which is subject to failure, and that is put in operation at time
t = 0. Assume the following conditions:
• PM check points are scheduled after every τ units of time;
• at each PM check point, a maintenance of fixed cost CPM is executed, which
instantly returns the system to AGAN condition;
• between successive PM check points, an IR of degree θ (0 ≤ θ ≤ 1) is done
after each failure, where θ = 1 represents an MR (ABAO condition) and θ = 0
a perfect repair (AGAN);
• the expected cost for each IR action is CIR, that is, for each period defined by
successive PM check points, the expected total cost is equal to the expected
cost per failure times the expected number of failures;
• repair costs and failure times are independent;
• repair times are neglected.
Assume that PM is performed every t units of time. The long run expected main-
tenance cost C(t) per unit time for the system is given by (Gilardoni and Colosimo,
2007)
C(τ) =CPM + CIRE[N(τ)]
τ, τ > 0 (5.5)
34
Under ARA1 model, E[N(t)] is given by Equation 5.4. The objective here is to
find an optimal PM interval τ which minimizes Equation 5.5. Then, the PM policy
that minimizes C(t) is the value τ that satisfies
D(τ) = τλ(τ)− Λ(τ) =CPMCIR
. (5.6)
where λ(τ) = ddτ
Λ(τ) is the ROCOF function for the system.
However, under IR assumption no closed form solution can be obtained for the
g-renewal function Λ(τ) and, consequently, for Equation 5.6.
In this paper, a procedure to deal jointly with the three following issues is proposed:
(1) the estimation of the parameters involved in Equation 5.3, (2) the calculation of
an estimator for the mean function Λ(t) (Equation 5.4) from which the ROCOF λ(t)
may be derived, and (3) the combination of (1) and (2) to solve Equation 5.6 for τ ,
i.e., to find the optimal PM policy.
The individual values of the costs CPM and CIR are not necessary. Instead, only
the ratio between them needs to be considered, which simplifies the application in
practice.
The first step for finding the optimal PM policy is to estimate the model param-
eters. Section 5.4 introduces some additional notation and presents the likelihood
function for ARA1 model. In particular, inference procedures for the parameters
involved in Equation 5.3 using a ROCOF modeled by a Power Law Process are pre-
sented.
5.4 Parameter Estimation: The Likelihood Function
Consider k identical repairable systems, k = 1,2, . . ., where the failures occur
independently. There are basically two ways to observe data from a repairable system.
When the data collection stops after a predermined number of failures, the data are
said to be failure truncated. On the other hand, when the data collection stops at a
predetermined time t, the data are said to be time truncated. The likelihood function
is constructed here assuming that among the k observed repairable systems, k1 are
time truncated and k2 are failure truncated, k1,k2 = 1,2, . . . ,k and k1 + k2 = k.
Assume the following conditions:
35
• At each failure, a repair action of degree θ is executed.
• ni failures are observed in the ith time truncated system, i = 1,2, . . . ,k1, and n∗jfailures are observed in the jth failure truncated system, j = 1,2, . . . ,k2.
• N =∑k1
i=1 ni +∑k2
j=1 n∗j is the total number of observed failures in the systems.
• The ith time truncated system is observed until the predetermined time t∗i , and
the jth failure truncated system is observed until the predetermined number of
failures n∗j occurs.
• Let Ti,l (i = 1,2, . . . ,k1, l = 1,2, . . . ,ni) be random variables representing the
failure times for the ith time truncated system, recorded as the time since the
initial start-up of the system (Ti,1 < Ti,2 < . . . < Ti,ni). For time truncated
systems, it is a random number of variables. In addition, let ti,l denote their
observed values (data), and Ti = (Ti,1;Ti,2; . . . ;Ti,ni)t be the (ni × 1) random
vector of failure times for the ith time truncated system.
• Let Tj,m(j = 1,2, . . . ,k2, m = 1,2, . . . ,n∗j) be random variables representing the
failure times for the jth failure truncated system, thus being a fixed number of
variables (Tj,1 < Tj,2 < . . . < Tj,n∗j ). Let tj,m denote their observed values. In
addition, let Tj = (Tj,1;Tj,2; . . . ;Tj,n∗j )t be the (n∗j × 1) random vector of failure
times for the jth failure truncated system.
• Let N(t) be a random variable representing the number of failures in the interval
(0,t].
• Let µ denote the vector of model parameters. It includes the parameters index-
ing the process intensity function and the repair efficiency parameter θ.
A likelihood function appropriate to model this process must combine the joint
probability density function of the k systems global times, and is given by
L(µ) =
k1∏i=1
[fTi|N(t∗i )(ti,1, . . . ,ti,ni|ni)P (N(t∗i ) = ni)]×
k2∏j=1
fTj(tj,1, . . . ,tj,n∗j ) (5.7)
36
if k ≥ 1, k = k1 + k2.
The contributions of the k1 time truncated systems and of the k2 failure truncated
systems to the likelihood function are represented by the first and second terms of
Equation 5.7, respectively.
As discussed above, the induced intensity function under the ARA1 model is shown
in Equation 5.3. Thus, it is assumed that the failure process has an intensity function
which is conditional on the effective maintenance times. For this model, the likelihood
function in Equation 5.7 becomes
L(µ) =
k1∏i=1
[(ni∏l=1
λ(ti,l − (1− θ)ti,l−1)eΛ(θti,l)−Λ(ti,l−(1−θ)ti,l−1)
)e−Λ(t∗i−(1−θ)ti,ni
)
]×
×k2∏i=1
n∗j∏m=1
λ(tj,m − (1− θ)tj,m−1)eΛ(θtj,m−1)−Λ(tj,m−(1−θ)tj,m−1)
. (5.8)
If the Power Law Process (PLP - Crow, 1974) is used, then the ROCOF function
in Equation 5.3 and its corresponding mean function are given, respectively, by
λ(t) =β
η
(t
η
)β−1
, η,β,t > 0, (5.9)
and
Λ(t) =
∫ t
0
ρR(u)du =
(t
η
)β, (5.10)
where β (the shape parameter) represents how the system deteriorates or improves
over time (β > 1 indicates an increasing intensity function), and η is a scale parameter.
Therefore, the likelihood function (Equation 5.8) can then be rewritten as a func-
tion of the PLP intensity function parameters (β e η), and also of θ, the efficiency of
the repair parameter, yielding
37
L(µ) = β∑k1
i=1 ni+∑k2
j=1 n∗j η−β(
∑k1i=1 ni+
∑k2j=1 n
∗j )
[k1∏i=1
ni∏l=1
(ti,l−1 − (1− θ)ti,l−1)β−1
]×
×
k2∏j=1
n∗j∏m=1
(tj,m − (1− θ)tj,m−1)β−1
×× exp
{k1∑i=1
[ni∑l=1
(θti,lη
)β−(ti,l − (1− θ)ti,l−1
η
)β]−(t∗i − (1− θ)ti,ni
η
)β}×
× exp
k2∑j=1
n∗j∑m=1
(θtj,m−1
η
)β−(tj,m − (1− θ)tj,m−1
η
)β . (5.11)
Statistical inference is needed in order to estimate the model parameters and to
compute the reliability indicators from the failure data. In order to find the Max-
imum Likelihood Estimates (MLEs) β̂, η̂ and θ̂ of the parameters, the following
log-likelihood function must be numerically maximized:
l(µ) = Nlog(β)− βNlog(η) +
+ (β − 1)
k1∑i=1
ni∑l=1
log(ti,l − (1− θ)ti,l−1) +
k2∑j=1
n∗j∑m=1
log(tj,m − (1− θ)tj,m−1)
+
+
{k1∑i=1
[ni∑l=1
(θti,lη
)β−(ti,l − (1− θ)ti,l−1
η
)β]−(t∗i − (1− θ)ti,ni
η
)β}+
+
k2∑j=1
n∗j∑m=1
(θtj,mη
)β−(tj,m − (1− θ)tj,m−1
η
)β− (θtj,n∗jη
)β . (5.12)
Asymptotic theory for the Normal distribution can then be used to construct ap-
proximate confidence intervals for the parameters.
5.5 Proposed Method to Obtain the Optimal PM under IR
In a practical situation, it is necessary to estimate the optimal maintenance peri-
odicity τ using the failure history of the systems under study. It is fair to say that
under the MR assumption, the procedure to obtain the optimal maintenance peri-
odicity is straightforward. For instance, if one assumes the PLP, λ(t) and Λ(t) have
38
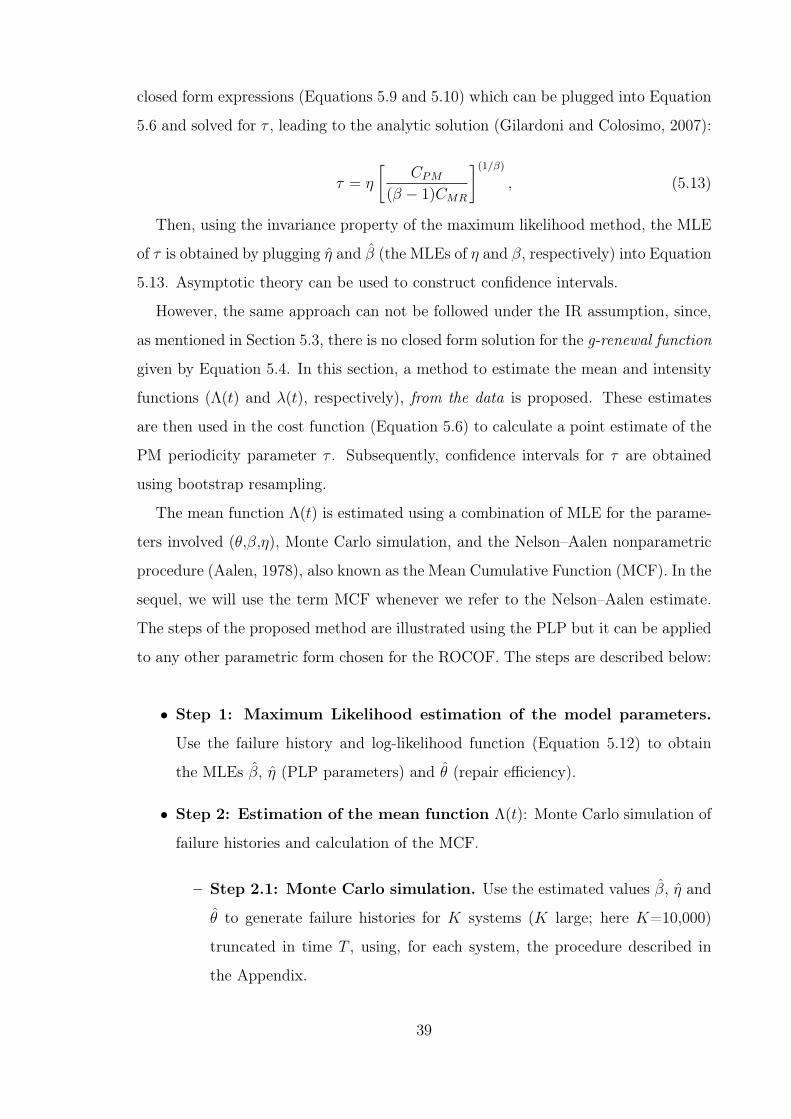
closed form expressions (Equations 5.9 and 5.10) which can be plugged into Equation
5.6 and solved for τ , leading to the analytic solution (Gilardoni and Colosimo, 2007):
τ = η
[CPM
(β − 1)CMR
](1/β)
, (5.13)
Then, using the invariance property of the maximum likelihood method, the MLE
of τ is obtained by plugging η̂ and β̂ (the MLEs of η and β, respectively) into Equation
5.13. Asymptotic theory can be used to construct confidence intervals.
However, the same approach can not be followed under the IR assumption, since,
as mentioned in Section 5.3, there is no closed form solution for the g-renewal function
given by Equation 5.4. In this section, a method to estimate the mean and intensity
functions (Λ(t) and λ(t), respectively), from the data is proposed. These estimates
are then used in the cost function (Equation 5.6) to calculate a point estimate of the
PM periodicity parameter τ . Subsequently, confidence intervals for τ are obtained
using bootstrap resampling.
The mean function Λ(t) is estimated using a combination of MLE for the parame-
ters involved (θ,β,η), Monte Carlo simulation, and the Nelson–Aalen nonparametric
procedure (Aalen, 1978), also known as the Mean Cumulative Function (MCF). In the
sequel, we will use the term MCF whenever we refer to the Nelson–Aalen estimate.
The steps of the proposed method are illustrated using the PLP but it can be applied
to any other parametric form chosen for the ROCOF. The steps are described below:
• Step 1: Maximum Likelihood estimation of the model parameters.
Use the failure history and log-likelihood function (Equation 5.12) to obtain
the MLEs β̂, η̂ (PLP parameters) and θ̂ (repair efficiency).
• Step 2: Estimation of the mean function Λ(t): Monte Carlo simulation of
failure histories and calculation of the MCF.
– Step 2.1: Monte Carlo simulation. Use the estimated values β̂, η̂ and
θ̂ to generate failure histories for K systems (K large; here K=10,000)
truncated in time T , using, for each system, the procedure described in
the Appendix.
39
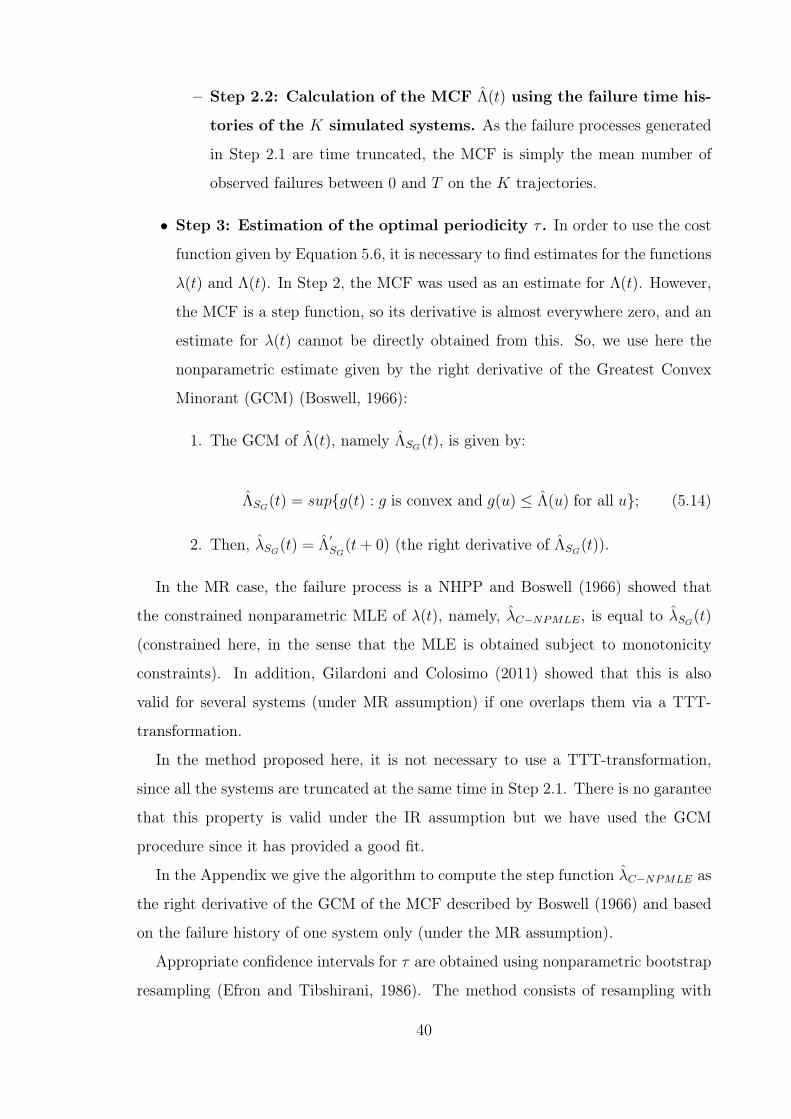
– Step 2.2: Calculation of the MCF Λ̂(t) using the failure time his-
tories of the K simulated systems. As the failure processes generated
in Step 2.1 are time truncated, the MCF is simply the mean number of
observed failures between 0 and T on the K trajectories.
• Step 3: Estimation of the optimal periodicity τ . In order to use the cost
function given by Equation 5.6, it is necessary to find estimates for the functions
λ(t) and Λ(t). In Step 2, the MCF was used as an estimate for Λ(t). However,
the MCF is a step function, so its derivative is almost everywhere zero, and an
estimate for λ(t) cannot be directly obtained from this. So, we use here the
nonparametric estimate given by the right derivative of the Greatest Convex
Minorant (GCM) (Boswell, 1966):
1. The GCM of Λ̂(t), namely Λ̂SG(t), is given by:
Λ̂SG(t) = sup{g(t) : g is convex and g(u) ≤ Λ̂(u) for all u}; (5.14)
2. Then, λ̂SG(t) = Λ̂
′SG
(t+ 0) (the right derivative of Λ̂SG(t)).
In the MR case, the failure process is a NHPP and Boswell (1966) showed that
the constrained nonparametric MLE of λ(t), namely, λ̂C−NPMLE, is equal to λ̂SG(t)
(constrained here, in the sense that the MLE is obtained subject to monotonicity
constraints). In addition, Gilardoni and Colosimo (2011) showed that this is also
valid for several systems (under MR assumption) if one overlaps them via a TTT-
transformation.
In the method proposed here, it is not necessary to use a TTT-transformation,
since all the systems are truncated at the same time in Step 2.1. There is no garantee
that this property is valid under the IR assumption but we have used the GCM
procedure since it has provided a good fit.
In the Appendix we give the algorithm to compute the step function λ̂C−NPMLE as
the right derivative of the GCM of the MCF described by Boswell (1966) and based
on the failure history of one system only (under the MR assumption).
Appropriate confidence intervals for τ are obtained using nonparametric bootstrap
resampling (Efron and Tibshirani, 1986). The method consists of resampling with
40
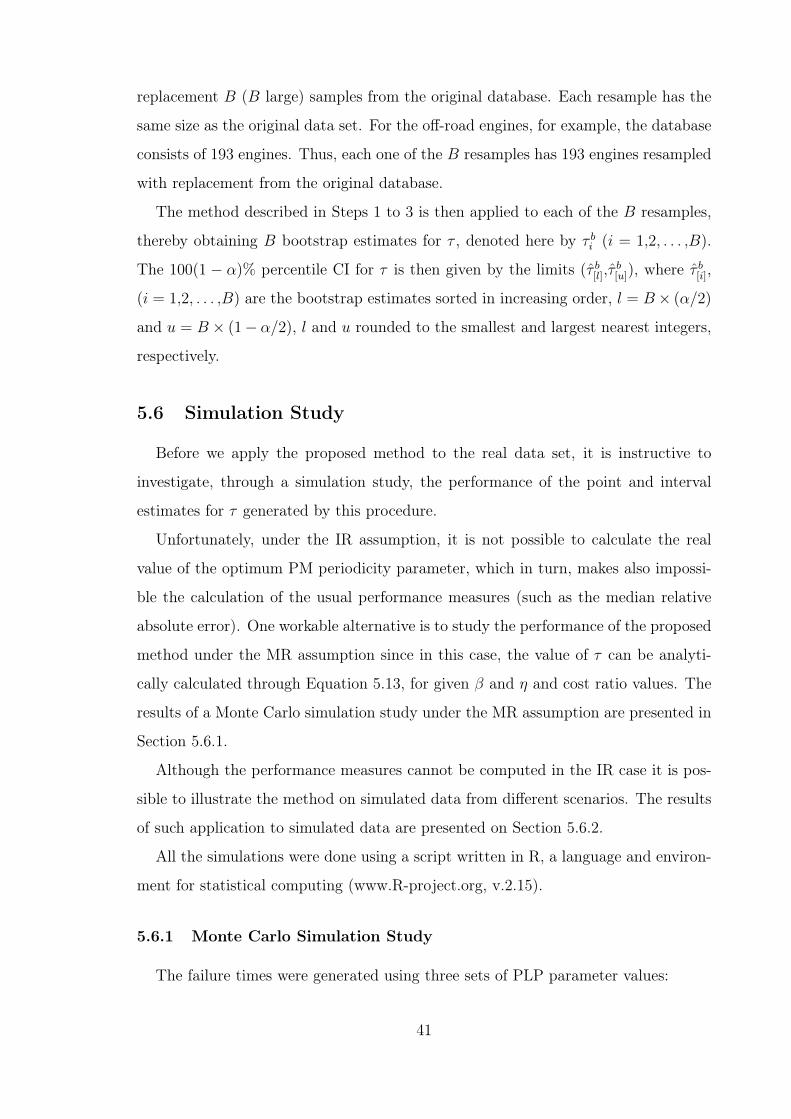
replacement B (B large) samples from the original database. Each resample has the
same size as the original data set. For the off-road engines, for example, the database
consists of 193 engines. Thus, each one of the B resamples has 193 engines resampled
with replacement from the original database.
The method described in Steps 1 to 3 is then applied to each of the B resamples,
thereby obtaining B bootstrap estimates for τ , denoted here by τ bi (i = 1,2, . . . ,B).
The 100(1 − α)% percentile CI for τ is then given by the limits (τ̂ b[l],τ̂b[u]), where τ̂
b[i],
(i = 1,2, . . . ,B) are the bootstrap estimates sorted in increasing order, l = B× (α/2)
and u = B × (1− α/2), l and u rounded to the smallest and largest nearest integers,
respectively.
5.6 Simulation Study
Before we apply the proposed method to the real data set, it is instructive to
investigate, through a simulation study, the performance of the point and interval
estimates for τ generated by this procedure.
Unfortunately, under the IR assumption, it is not possible to calculate the real
value of the optimum PM periodicity parameter, which in turn, makes also impossi-
ble the calculation of the usual performance measures (such as the median relative
absolute error). One workable alternative is to study the performance of the proposed
method under the MR assumption since in this case, the value of τ can be analyti-
cally calculated through Equation 5.13, for given β and η and cost ratio values. The
results of a Monte Carlo simulation study under the MR assumption are presented in
Section 5.6.1.
Although the performance measures cannot be computed in the IR case it is pos-
sible to illustrate the method on simulated data from different scenarios. The results
of such application to simulated data are presented on Section 5.6.2.
All the simulations were done using a script written in R, a language and environ-
ment for statistical computing (www.R-project.org, v.2.15).
5.6.1 Monte Carlo Simulation Study
The failure times were generated using three sets of PLP parameter values:
41
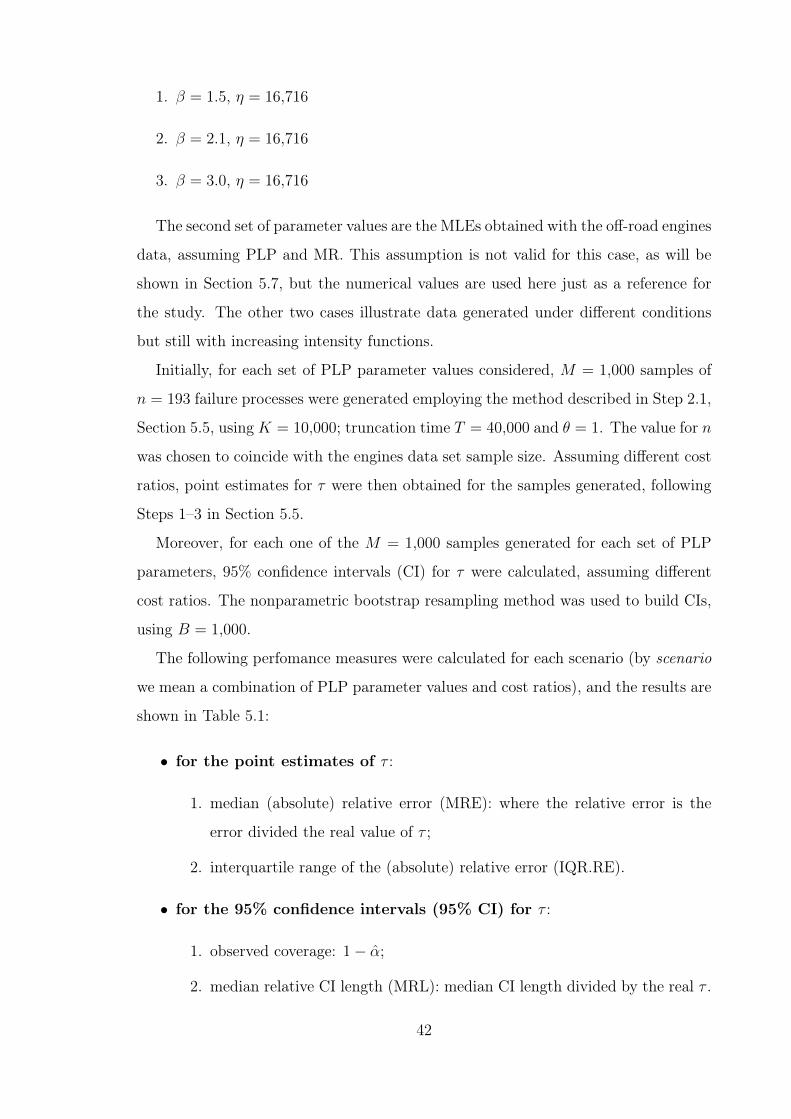
1. β = 1.5, η = 16,716
2. β = 2.1, η = 16,716
3. β = 3.0, η = 16,716
The second set of parameter values are the MLEs obtained with the off-road engines
data, assuming PLP and MR. This assumption is not valid for this case, as will be
shown in Section 5.7, but the numerical values are used here just as a reference for
the study. The other two cases illustrate data generated under different conditions
but still with increasing intensity functions.
Initially, for each set of PLP parameter values considered, M = 1,000 samples of
n = 193 failure processes were generated employing the method described in Step 2.1,
Section 5.5, usingK = 10,000; truncation time T = 40,000 and θ = 1. The value for n
was chosen to coincide with the engines data set sample size. Assuming different cost
ratios, point estimates for τ were then obtained for the samples generated, following
Steps 1–3 in Section 5.5.
Moreover, for each one of the M = 1,000 samples generated for each set of PLP
parameters, 95% confidence intervals (CI) for τ were calculated, assuming different
cost ratios. The nonparametric bootstrap resampling method was used to build CIs,
using B = 1,000.
The following perfomance measures were calculated for each scenario (by scenario
we mean a combination of PLP parameter values and cost ratios), and the results are
shown in Table 5.1:
• for the point estimates of τ :
1. median (absolute) relative error (MRE): where the relative error is the
error divided the real value of τ ;
2. interquartile range of the (absolute) relative error (IQR.RE).
• for the 95% confidence intervals (95% CI) for τ :
1. observed coverage: 1− α̂;
2. median relative CI length (MRL): median CI length divided by the real τ .
42
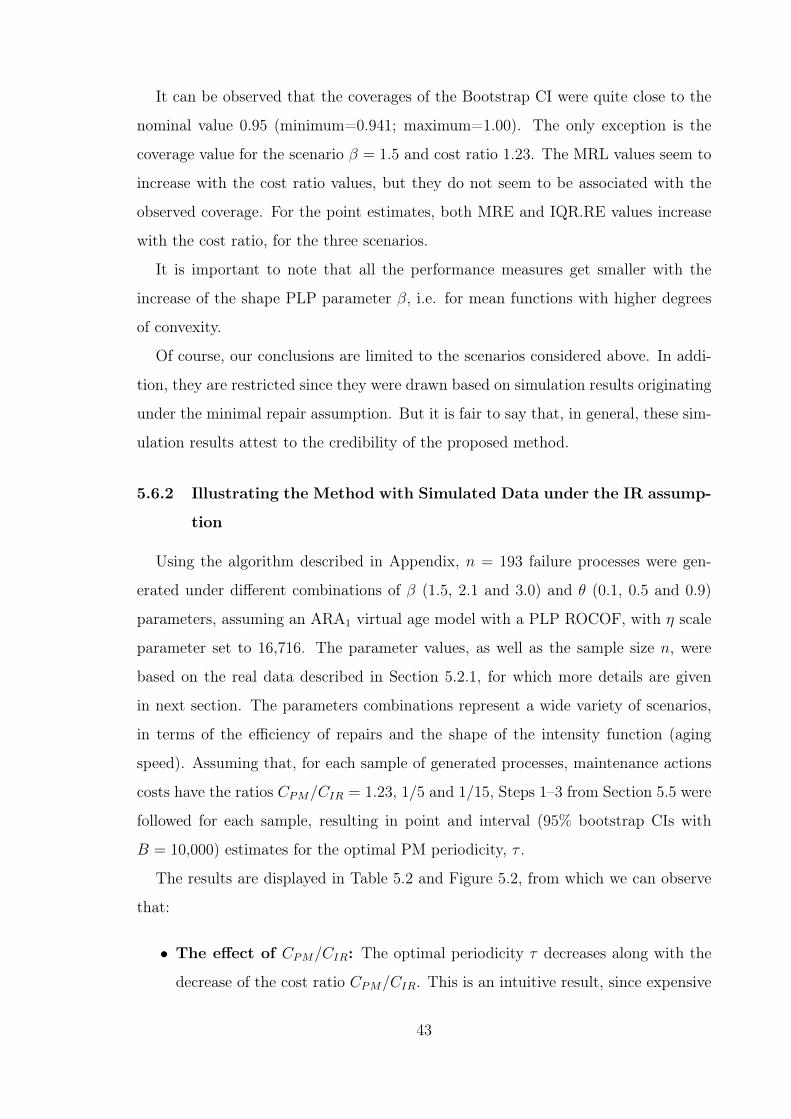
It can be observed that the coverages of the Bootstrap CI were quite close to the
nominal value 0.95 (minimum=0.941; maximum=1.00). The only exception is the
coverage value for the scenario β = 1.5 and cost ratio 1.23. The MRL values seem to
increase with the cost ratio values, but they do not seem to be associated with the
observed coverage. For the point estimates, both MRE and IQR.RE values increase
with the cost ratio, for the three scenarios.
It is important to note that all the performance measures get smaller with the
increase of the shape PLP parameter β, i.e. for mean functions with higher degrees
of convexity.
Of course, our conclusions are limited to the scenarios considered above. In addi-
tion, they are restricted since they were drawn based on simulation results originating
under the minimal repair assumption. But it is fair to say that, in general, these sim-
ulation results attest to the credibility of the proposed method.
5.6.2 Illustrating the Method with Simulated Data under the IR assump-
tion
Using the algorithm described in Appendix, n = 193 failure processes were gen-
erated under different combinations of β (1.5, 2.1 and 3.0) and θ (0.1, 0.5 and 0.9)
parameters, assuming an ARA1 virtual age model with a PLP ROCOF, with η scale
parameter set to 16,716. The parameter values, as well as the sample size n, were
based on the real data described in Section 5.2.1, for which more details are given
in next section. The parameters combinations represent a wide variety of scenarios,
in terms of the efficiency of repairs and the shape of the intensity function (aging
speed). Assuming that, for each sample of generated processes, maintenance actions
costs have the ratios CPM/CIR = 1.23, 1/5 and 1/15, Steps 1–3 from Section 5.5 were
followed for each sample, resulting in point and interval (95% bootstrap CIs with
B = 10,000) estimates for the optimal PM periodicity, τ .
The results are displayed in Table 5.2 and Figure 5.2, from which we can observe
that:
• The effect of CPM/CIR: The optimal periodicity τ decreases along with the
decrease of the cost ratio CPM/CIR. This is an intuitive result, since expensive
43
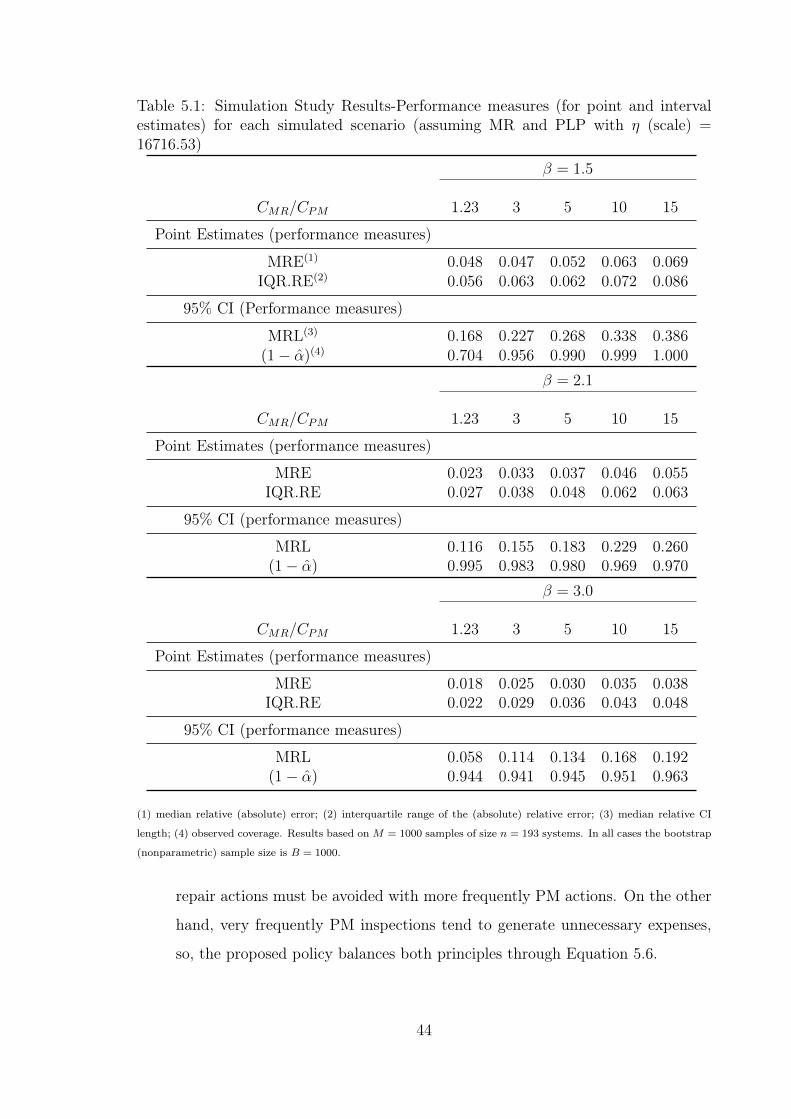
Table 5.1: Simulation Study Results-Performance measures (for point and intervalestimates) for each simulated scenario (assuming MR and PLP with η (scale) =16716.53)
β = 1.5
CMR/CPM 1.23 3 5 10 15
Point Estimates (performance measures)
MRE(1) 0.048 0.047 0.052 0.063 0.069IQR.RE(2) 0.056 0.063 0.062 0.072 0.086
95% CI (Performance measures)
MRL(3) 0.168 0.227 0.268 0.338 0.386(1− α̂)(4) 0.704 0.956 0.990 0.999 1.000
β = 2.1
CMR/CPM 1.23 3 5 10 15
Point Estimates (performance measures)
MRE 0.023 0.033 0.037 0.046 0.055IQR.RE 0.027 0.038 0.048 0.062 0.063
95% CI (performance measures)
MRL 0.116 0.155 0.183 0.229 0.260(1− α̂) 0.995 0.983 0.980 0.969 0.970
β = 3.0
CMR/CPM 1.23 3 5 10 15
Point Estimates (performance measures)
MRE 0.018 0.025 0.030 0.035 0.038IQR.RE 0.022 0.029 0.036 0.043 0.048
95% CI (performance measures)
MRL 0.058 0.114 0.134 0.168 0.192(1− α̂) 0.944 0.941 0.945 0.951 0.963
(1) median relative (absolute) error; (2) interquartile range of the (absolute) relative error; (3) median relative CI
length; (4) observed coverage. Results based on M = 1000 samples of size n = 193 systems. In all cases the bootstrap
(nonparametric) sample size is B = 1000.
repair actions must be avoided with more frequently PM actions. On the other
hand, very frequently PM inspections tend to generate unnecessary expenses,
so, the proposed policy balances both principles through Equation 5.6.
44
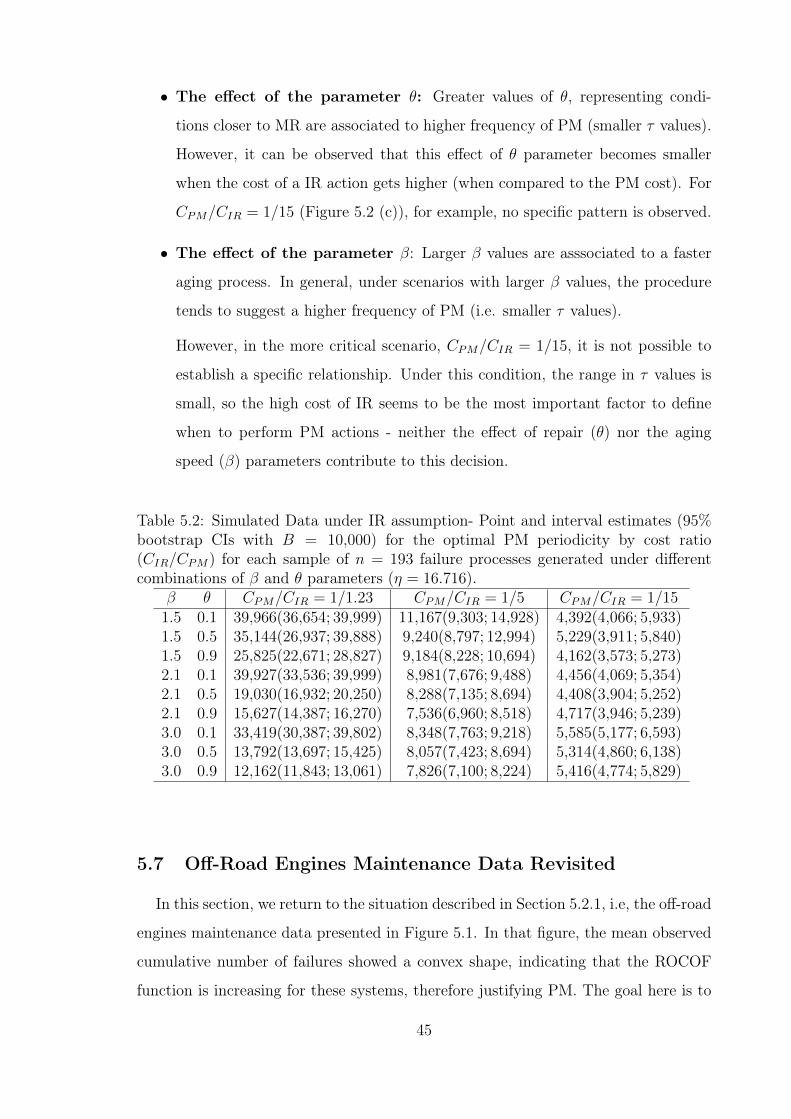
• The effect of the parameter θ: Greater values of θ, representing condi-
tions closer to MR are associated to higher frequency of PM (smaller τ values).
However, it can be observed that this effect of θ parameter becomes smaller
when the cost of a IR action gets higher (when compared to the PM cost). For
CPM/CIR = 1/15 (Figure 5.2 (c)), for example, no specific pattern is observed.
• The effect of the parameter β: Larger β values are asssociated to a faster
aging process. In general, under scenarios with larger β values, the procedure
tends to suggest a higher frequency of PM (i.e. smaller τ values).
However, in the more critical scenario, CPM/CIR = 1/15, it is not possible to
establish a specific relationship. Under this condition, the range in τ values is
small, so the high cost of IR seems to be the most important factor to define
when to perform PM actions - neither the effect of repair (θ) nor the aging
speed (β) parameters contribute to this decision.
Table 5.2: Simulated Data under IR assumption- Point and interval estimates (95%bootstrap CIs with B = 10,000) for the optimal PM periodicity by cost ratio(CIR/CPM) for each sample of n = 193 failure processes generated under differentcombinations of β and θ parameters (η = 16.716).
β θ CPM/CIR = 1/1.23 CPM/CIR = 1/5 CPM/CIR = 1/151.5 0.1 39,966(36,654; 39,999) 11,167(9,303; 14,928) 4,392(4,066; 5,933)1.5 0.5 35,144(26,937; 39,888) 9,240(8,797; 12,994) 5,229(3,911; 5,840)1.5 0.9 25,825(22,671; 28,827) 9,184(8,228; 10,694) 4,162(3,573; 5,273)2.1 0.1 39,927(33,536; 39,999) 8,981(7,676; 9,488) 4,456(4,069; 5,354)2.1 0.5 19,030(16,932; 20,250) 8,288(7,135; 8,694) 4,408(3,904; 5,252)2.1 0.9 15,627(14,387; 16,270) 7,536(6,960; 8,518) 4,717(3,946; 5,239)3.0 0.1 33,419(30,387; 39,802) 8,348(7,763; 9,218) 5,585(5,177; 6,593)3.0 0.5 13,792(13,697; 15,425) 8,057(7,423; 8,694) 5,314(4,860; 6,138)3.0 0.9 12,162(11,843; 13,061) 7,826(7,100; 8,224) 5,416(4,774; 5,829)
5.7 Off-Road Engines Maintenance Data Revisited
In this section, we return to the situation described in Section 5.2.1, i.e, the off-road
engines maintenance data presented in Figure 5.1. In that figure, the mean observed
cumulative number of failures showed a convex shape, indicating that the ROCOF
function is increasing for these systems, therefore justifying PM. The goal here is to
45
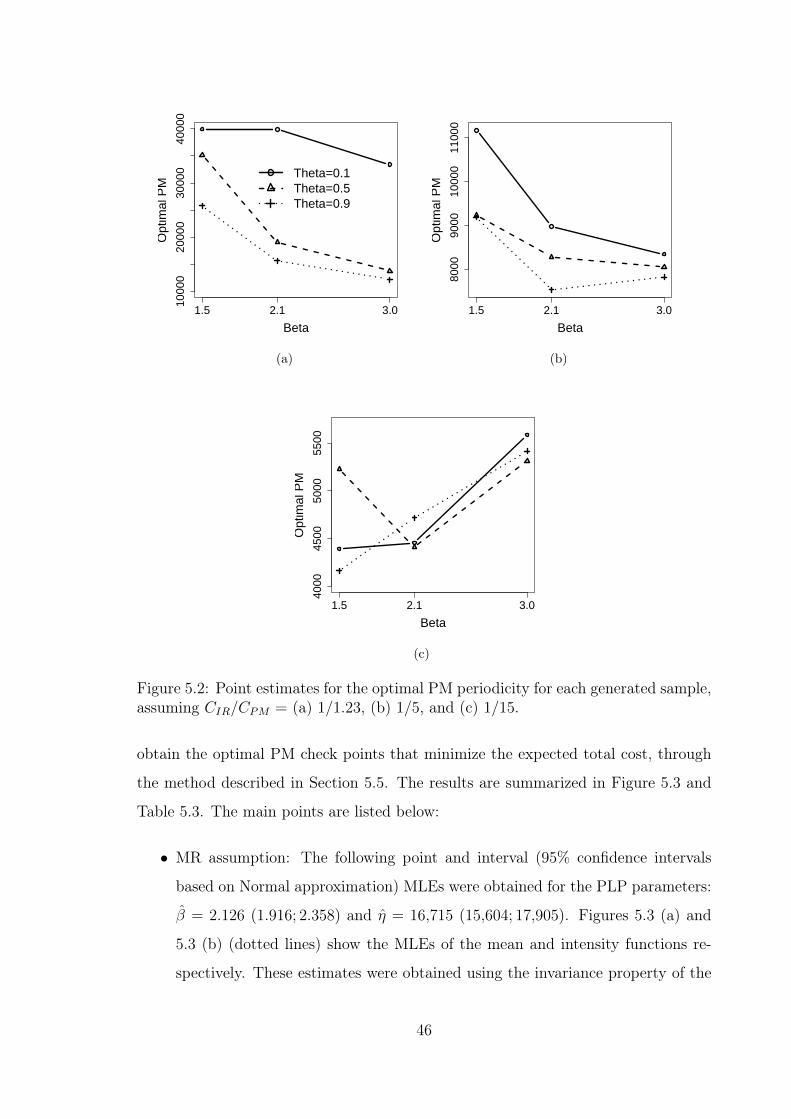
1000
020
000
3000
040
000
Beta
Opt
imal
PM
1.5 2.1 3.0
Theta=0.1Theta=0.5Theta=0.9
(a)
8000
9000
1000
011
000
Beta
Opt
imal
PM
1.5 2.1 3.0
(b)
4000
4500
5000
5500
Beta
Opt
imal
PM
1.5 2.1 3.0
(c)
Figure 5.2: Point estimates for the optimal PM periodicity for each generated sample,assuming CIR/CPM = (a) 1/1.23, (b) 1/5, and (c) 1/15.
obtain the optimal PM check points that minimize the expected total cost, through
the method described in Section 5.5. The results are summarized in Figure 5.3 and
Table 5.3. The main points are listed below:
• MR assumption: The following point and interval (95% confidence intervals
based on Normal approximation) MLEs were obtained for the PLP parameters:
β̂ = 2.126 (1.916; 2.358) and η̂ = 16,715 (15,604; 17,905). Figures 5.3 (a) and
5.3 (b) (dotted lines) show the MLEs of the mean and intensity functions re-
spectively. These estimates were obtained using the invariance property of the
46
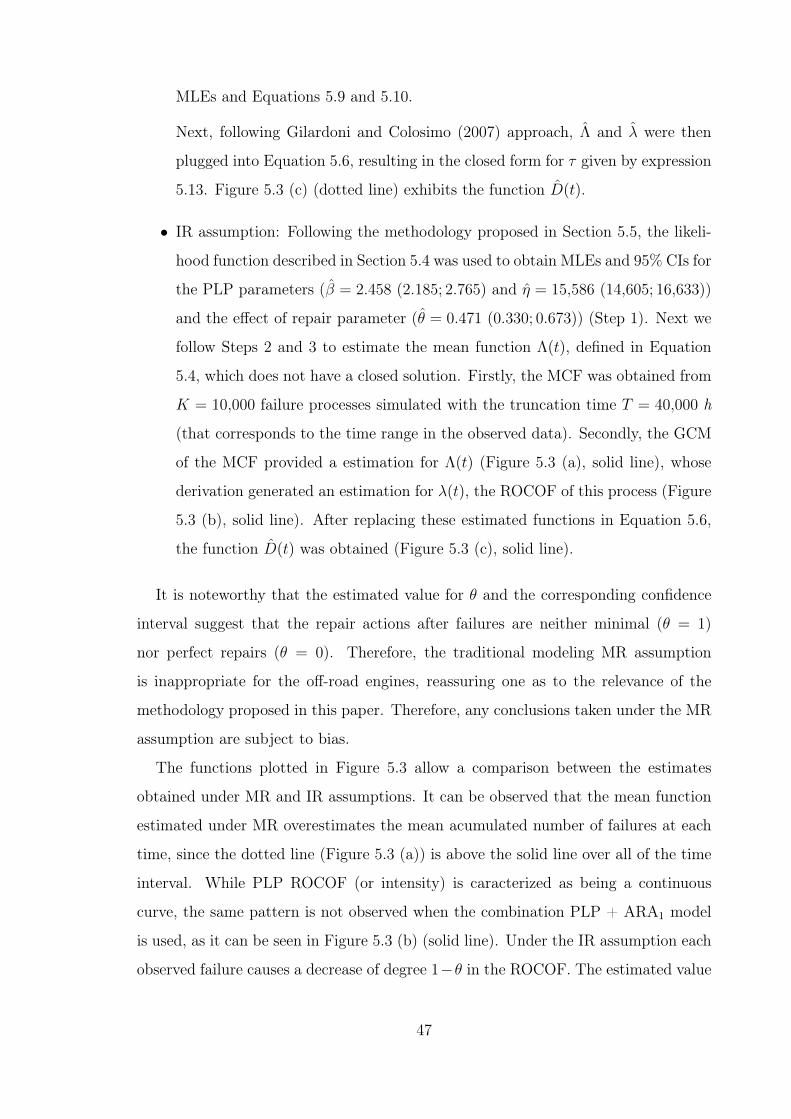
MLEs and Equations 5.9 and 5.10.
Next, following Gilardoni and Colosimo (2007) approach, Λ̂ and λ̂ were then
plugged into Equation 5.6, resulting in the closed form for τ given by expression
5.13. Figure 5.3 (c) (dotted line) exhibits the function D̂(t).
• IR assumption: Following the methodology proposed in Section 5.5, the likeli-
hood function described in Section 5.4 was used to obtain MLEs and 95% CIs for
the PLP parameters (β̂ = 2.458 (2.185; 2.765) and η̂ = 15,586 (14,605; 16,633))
and the effect of repair parameter (θ̂ = 0.471 (0.330; 0.673)) (Step 1). Next we
follow Steps 2 and 3 to estimate the mean function Λ(t), defined in Equation
5.4, which does not have a closed solution. Firstly, the MCF was obtained from
K = 10,000 failure processes simulated with the truncation time T = 40,000 h
(that corresponds to the time range in the observed data). Secondly, the GCM
of the MCF provided a estimation for Λ(t) (Figure 5.3 (a), solid line), whose
derivation generated an estimation for λ(t), the ROCOF of this process (Figure
5.3 (b), solid line). After replacing these estimated functions in Equation 5.6,
the function D̂(t) was obtained (Figure 5.3 (c), solid line).
It is noteworthy that the estimated value for θ and the corresponding confidence
interval suggest that the repair actions after failures are neither minimal (θ = 1)
nor perfect repairs (θ = 0). Therefore, the traditional modeling MR assumption
is inappropriate for the off-road engines, reassuring one as to the relevance of the
methodology proposed in this paper. Therefore, any conclusions taken under the MR
assumption are subject to bias.
The functions plotted in Figure 5.3 allow a comparison between the estimates
obtained under MR and IR assumptions. It can be observed that the mean function
estimated under MR overestimates the mean acumulated number of failures at each
time, since the dotted line (Figure 5.3 (a)) is above the solid line over all of the time
interval. While PLP ROCOF (or intensity) is caracterized as being a continuous
curve, the same pattern is not observed when the combination PLP + ARA1 model
is used, as it can be seen in Figure 5.3 (b) (solid line). Under the IR assumption each
observed failure causes a decrease of degree 1−θ in the ROCOF. The estimated value
47
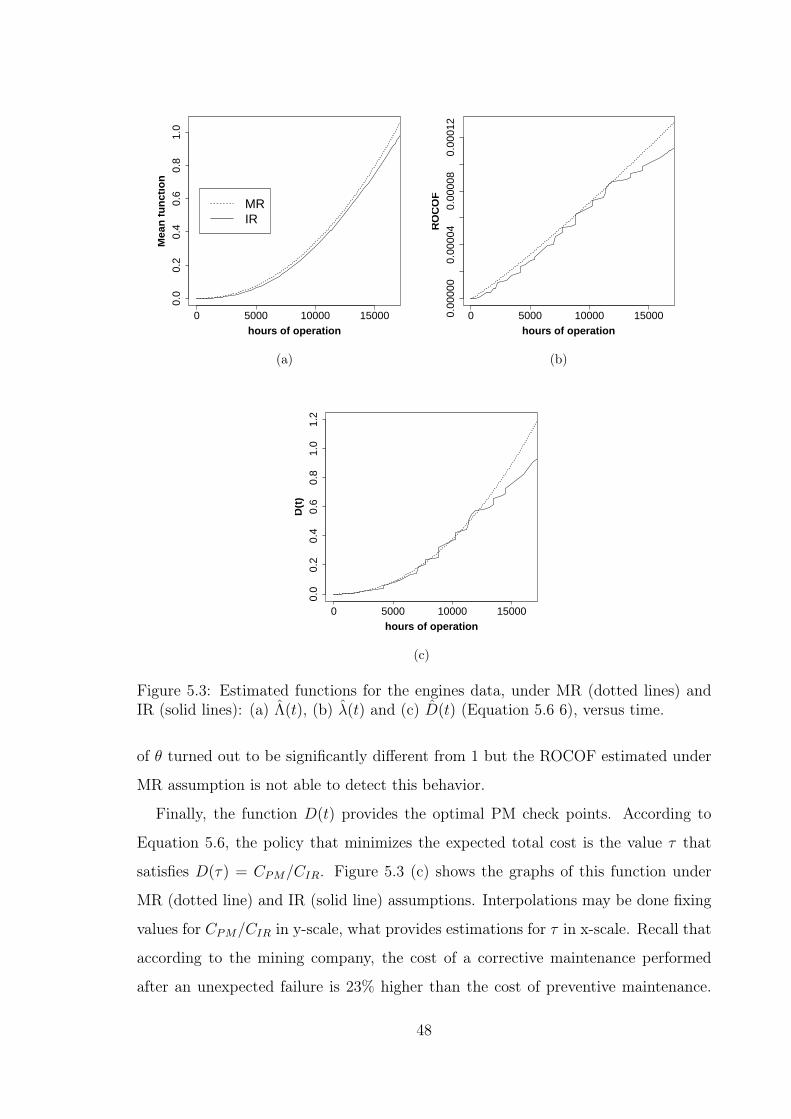
0 5000 10000 15000
0.0
0.2
0.4
0.6
0.8
1.0
hours of operation
Mea
n f
un
ctio
n
MRIR
(a)
0 5000 10000 150000.00
000
0.00
004
0.00
008
0.00
012
hours of operation
RO
CO
F
(b)
0 5000 10000 15000
0.0
0.2
0.4
0.6
0.8
1.0
1.2
hours of operation
D(t
)
(c)
Figure 5.3: Estimated functions for the engines data, under MR (dotted lines) andIR (solid lines): (a) Λ̂(t), (b) λ̂(t) and (c) D̂(t) (Equation 5.6 6), versus time.
of θ turned out to be significantly different from 1 but the ROCOF estimated under
MR assumption is not able to detect this behavior.
Finally, the function D(t) provides the optimal PM check points. According to
Equation 5.6, the policy that minimizes the expected total cost is the value τ that
satisfies D(τ) = CPM/CIR. Figure 5.3 (c) shows the graphs of this function under
MR (dotted line) and IR (solid line) assumptions. Interpolations may be done fixing
values for CPM/CIR in y-scale, what provides estimations for τ in x-scale. Recall that
according to the mining company, the cost of a corrective maintenance performed
after an unexpected failure is 23% higher than the cost of preventive maintenance.
48
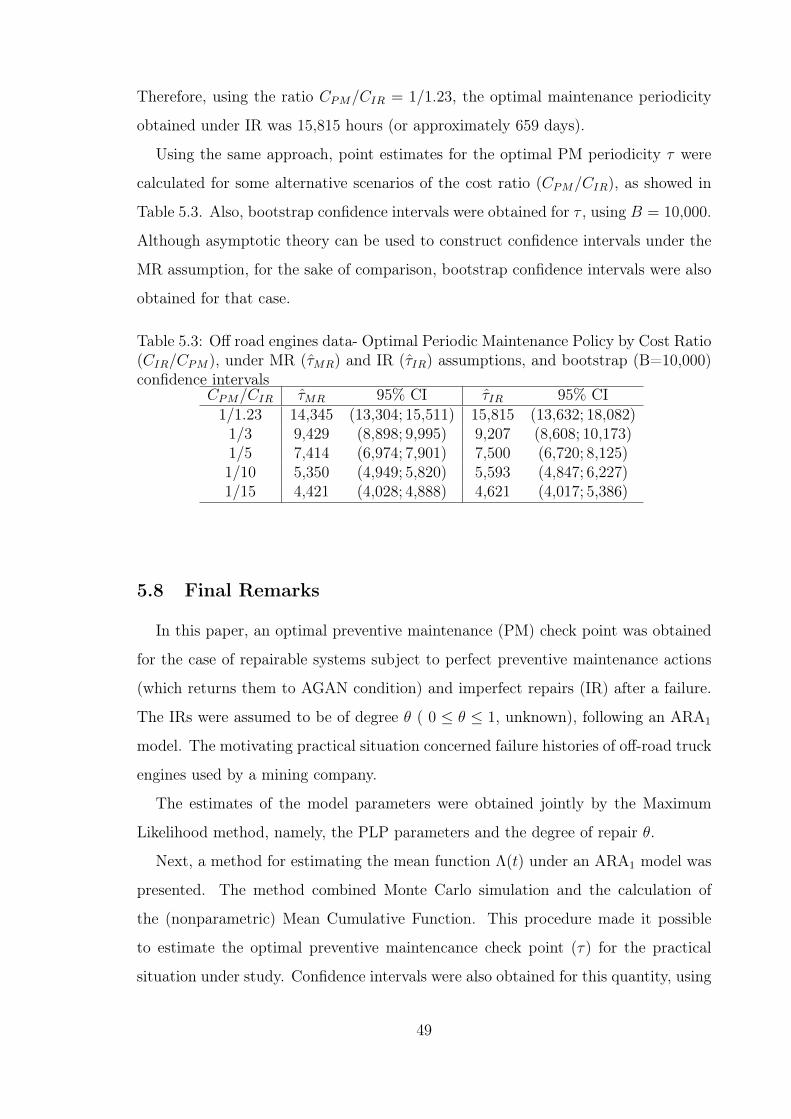
Therefore, using the ratio CPM/CIR = 1/1.23, the optimal maintenance periodicity
obtained under IR was 15,815 hours (or approximately 659 days).
Using the same approach, point estimates for the optimal PM periodicity τ were
calculated for some alternative scenarios of the cost ratio (CPM/CIR), as showed in
Table 5.3. Also, bootstrap confidence intervals were obtained for τ , using B = 10,000.
Although asymptotic theory can be used to construct confidence intervals under the
MR assumption, for the sake of comparison, bootstrap confidence intervals were also
obtained for that case.
Table 5.3: Off road engines data- Optimal Periodic Maintenance Policy by Cost Ratio(CIR/CPM), under MR (τ̂MR) and IR (τ̂IR) assumptions, and bootstrap (B=10,000)confidence intervals
CPM/CIR τ̂MR 95% CI τ̂IR 95% CI1/1.23 14,345 (13,304; 15,511) 15,815 (13,632; 18,082)
1/3 9,429 (8,898; 9,995) 9,207 (8,608; 10,173)1/5 7,414 (6,974; 7,901) 7,500 (6,720; 8,125)1/10 5,350 (4,949; 5,820) 5,593 (4,847; 6,227)1/15 4,421 (4,028; 4,888) 4,621 (4,017; 5,386)
5.8 Final Remarks
In this paper, an optimal preventive maintenance (PM) check point was obtained
for the case of repairable systems subject to perfect preventive maintenance actions
(which returns them to AGAN condition) and imperfect repairs (IR) after a failure.
The IRs were assumed to be of degree θ ( 0 ≤ θ ≤ 1, unknown), following an ARA1
model. The motivating practical situation concerned failure histories of off-road truck
engines used by a mining company.
The estimates of the model parameters were obtained jointly by the Maximum
Likelihood method, namely, the PLP parameters and the degree of repair θ.
Next, a method for estimating the mean function Λ(t) under an ARA1 model was
presented. The method combined Monte Carlo simulation and the calculation of
the (nonparametric) Mean Cumulative Function. This procedure made it possible
to estimate the optimal preventive maintencance check point (τ) for the practical
situation under study. Confidence intervals were also obtained for this quantity, using
49
bootstrap resampling. The results were compared with the ones obtained under a
minimal repair assumption.
Recall that, by using an ARA-1 type model, the main challenge here was not only
to come up with a good approximation to the g-renewal function involved in the
expression of the Mean Function (Λ(t)), but one that was differentiable. With this
in mind, one solution was to use the Greatest Convex Minorant (GCM) of the MCF
(Step 3 of the procedure).
In a previous analysis, a simpler and more intuitive alternative was implemented,
namely, the fitting of a polynomial curve to the MCF points. Unfortunately, simula-
tion results based on this approach turned out to be unsatisfying.
On the other hand, the simulation results presented in Section 5.6 showed that
GCM method seems to be a good candidate for approximating MCFs calculated
from failure processes with convex shaped intensity functions. In fact, these are the
cases where preventive maintenance is justified. In addition, since the MCF is a step
function, by using a large value of K in the Monte Carlo simulation, one garantees
the smoothness of the MCF curve, which in turn leads to a good GCM fitting.
As far as the practical results are concerned, two important pieces of information
were provided to the mining company:
1. the degree of repair: the estimated value of θ and the corresponding confidence
interval indicated that the repair actions after failures are neither minimal nor
perfect repairs
2. optimal preventive maintenance check points: in order to minimize the total
expected maintenance cost, the mining company needs to implement PM after
every 15,709 h, i.e., around 22 months.
Appendix
Algorithm used to generate K systems, under ARA1 and PLP (Step 2.1-
Section 4).
Use the estimated values β̂, η̂ and θ̂ to generate failure histories for K systems (K
large; here K=10,000) using the following procedure for each system:
1. Suppose the mth system failure ocurred at time tm.
50
2. Let x = tm+1 − tm be the elapsed time from the mth to the (m+ 1)th failure.
Hence,
FX|tm(x) = P (X ≤ x|tm) = 1− P (X > x|tm)
= 1− P (N(x+ tm)−N(tm) = 0|tm)
= 1− e−Λ(x+tm−(1−θ)tm)+Λ(θtm). (5.15)
3. Next, the (m+ 1)th failure time is obtained through the steps [i] to [iii] below:
i Generate u, a value of a random variable following a continuous Uniform(0,1)
distribution.
ii Solve FX|tm(x) = u.
iii Calculate tm+1 = tm + x.
Note that [ii] corresponds to
tm+1 = tm + x = Λ−1[Λ(θtm)− log(1− u)] + (1− θ)tm. (5.16)
In addition, since the PLP is being used (Equation 5.9) and the point estimates
(MLEs) β̂, η̂ and θ̂ have already been calculated in Step 2.1, then
Λ̂(t) =
(t
η̂
)β̂and Λ̂−1(t) = η̂t1/β̂. (5.17)
These expressions (along with the MLE θ̂) are then placed into Equation 5.16.
Note that by making m = 0 (t0 = 0) in Equation 5.15, x = t1, the time to the
first failure. In addition, since the PLP is used, Equation 5.15 takes the form
of a Weibull cumulative distribution function, as expected.
4. Finally, generate a failure history for a time truncated system (truncated at time
T ), by using steps [i]–[iii] recursively. Failure times t1,t2, . . . ,tn are generated
until tn+1 > T .
51
Algorithm used to calculate λ̂C−NPMLE(t).
Suppose that only one system is observed and let N(t) =∑n
j=1 I(t ≥ tj) be the
number of failures up to time t, where 0 < t1 < . . . < tn < T are the observed failure
times. For a time truncated system, the at risk process is Y (t) = I(0 ≤ t ≤ T ). In
practice, λ̂C−NPMLE(t) can be computed using the following algorithm:
• set i0 = 0;
• repeat until iE+1 = m+ 1. Set ih+1 to be the index which minimizes the slopes
between (iih ,ih − 1) and (ti, i− 1) (i = ih + 1, . . . , n+ 1);
• the constrained NPMLE is then given by λ̂C−NPMLE(t) = (ij+1− ij)/(tij+1− tj)
whenever tij < t ≤ tij+1.
52
6 Dynamics of the Optimal Maintenance Policy un-
der Imperfect Repair Models
6.1 Abstract
It is discussed both determination and practical implementation of an optimal
preventive maintenance policy under imperfect repair which takes into account the
information provided by observing the failure history of a repairable system. The
proposed policy is applied to a real situation involving maintenance in off-road engines
owned by a Brazilian mining company. A simulation study compares the performance
between the optimal maintenance policy presented and the periodicity policy from
Toledo et al. (2013), and concludes that the cost of maintaining a repairable system
is significantly lower when the proposed policy is considered.
6.2 Introduction
In this paper, in order to propose an optimal dynamic maintenance policy for
repairable systems, we will assume that at any time the operator of the repairable
system can decide to perform a (perfect) preventive maintenance (PM) action, which
leaves the system in AGAN condition. A PM policy specifies the moments at which
the system is maintained. On the other hand, every time the system fails between
two successive PM actions, it is necessary to perform a repair action to bring it
back to operating condition. Usually it is assumed that such action is a minimal
repair (MR), in the sense that it leaves the system at the same condition it was
immediately before failing (i.e., ABAO). Under MR, the optimal PM periodicity can
be determined after noting that, in this case, the failure history of the system follows
a nonhomogeneous Poisson process (NHPP) (Gilardoni and Colosimo, 2007). The
argument goes essentially as follows.
Let N(t) be the number of failures in (0,t] and define the mean function Λ(t) =
E[N(t)], the rate of occurrence of failures (ROCOF) function
λ(t) = limδt→0
P (N(t+ δt)−N(t) = 1)
δt, ∀t ≥ 0, (6.1)
53
and assume that λ(.) is increasing. Also, the intensity of failure function at time t
is defined by
λ(t|=(t−)) = limδt→0
P (N(t+ δt)−N(t) = 1|=−t )
δt, ∀t ≥ 0. (6.2)
where =t− is the minimal filtration defined by the history set of all failure times
occurred before t. It can be shown (Aalen, 1978) that Λ(t) =∫ t
0E[λ(s|=(s−))]ds =∫ t
0λ(s)ds. Under the MR assumption, the past of failure times is not taken into
account, so equations 6.1 and 6.2 are equal.
If the PM and MR actions have fixed costs CPM and CMR and one decides to
perform PMs at every τ units of time, the expected cost per unit of time would be
C(τ) = [CPM + CMRΛ(τ)]/τ. (6.3)
Differentiating, one finds the optimal periodicity τOPT as the solution of
D(τ) = τλ(τ)− Λ(τ) = CPM/CMR. (6.4)
In practice, λ and Λ are unknown and hence have to be estimated and plugged in
6.4 to obtain an estimate of τOPT (Gilardoni and Colosimo, 2007, 2011 or Gilardoni
et al., 2013).
Assuming MR actions at each failure may be to restrictive in practical applications.
More realistic models assume that, after each failure, an imperfect repair (IR) action
leaves the system at some point between the AGAN and ABAO conditions. For
instance, Kijima et al. (1988) introduced a class of virtual age models to describe the
operation of a system under IR. In its simplest form, the model assumes a ROCOF
λ(t) and that, after a failure, the repair reduces the actual age of the model by a
factor θ. Hence we have actual age t and virtual age V (t) = t− (1− θ)tN(t), so that
the intensity of failure at time t is actually λ(V (t)), where 0 < t1 < . . . < tn < . . . are
the failure times. The parameter θ measures the degree of the IR; θ = 0 and θ = 1
correspond respectively to PR and MR.
The problem of specifying an optimal PM periodicity under IR has already been
explored by Toledo et al. (2013) and Remy et al. (2013). However, this approach
54
may be somewhat shortsighted, in the sense that it does not take into account the
history of the process and hence makes sense only in the scenario where N(t) has
independent increments. If, on the other hand, the IR model results in a process with
dependent increments, then the history has to be considered when determining an
optimal policy. The use of the term “dynamic” in the definition of the optimal PM
policy proposed in this paper refers to this consideration.
The rest of this paper is organized as follows. Section 6.3 deals with the optimal
PM policy under any IR model. The main finding – see equation 6.8 below, states
there exists a constant, independent of the history of the process, such that a PM
action should be performed whenever the conditional intensity of the IR failure process
given the available information attains that constant. Section 6.4 deals briefly with
the associated inference problem (i.e., estimation of the optimal PM policy) in the
virtual age model. Section 6.5 presents the results of the proposed methodology when
applied to a real situation, involving maintenance in off-road engines. In Section 6.6
are discussed the results of a simulation study in order to compare the performance
of the proposed methodology, based on a dynamic PM policy, with a PM periodicity
policy. Finally, Section 6.7 ends the paper with some final comments.
6.3 Optimal PM policy under IR
As before, suppose a failure process N(t) subject exclusively to IR actions and
define Λ(t|s0) = Λ(t|=(s−0 )) = E[N(s0 + t)−N(s0)|=(s−0 )], where =(s−0 ) is the failure
history up to the moment immediately before s0. In other words, Λ(t|s0) is the
expected number of failures during the next t units of time given the history of the
process up to s0. We will consider the following assumptions: First, both PM and IR
actions are performed instantaneously. Second, the costs of the PM and IR actions
are independent of the history of the system and have expectation CPM and CIR
respectively. Third, for each s0, Λ(t|s0) is differentiable for every t and its derivative
λ(t|s0) = λ(t|=(s−0 )) is continuous and strictly increasing.
A maintenance policy for the time interval (s0,S) specifies the number of PMs n
and its moments s0 + τ1 < s0 + τ1 + τ2 < . . . < s0 + τ1 + . . . + τn, where τi > 0
and∑n
i=1 τi < S − s0. We will write M(s0,S) = (n; τ1, . . . ,τn). Given a maintenance
55
policy M(s0,S), its expected cost given =(s−0 ) is
C[M(s0,S)] = nCPM +CIR{Λ(τ1|s0)+n∑j=2
Λ(τi|0)+Λ(S−s0−τ1− . . .−τn|0)}. (6.5)
A maintenance policy MOPT (s0,S) is optimal if C[MOPT (s0,S)] ≤ C[M(s0,S)] for
every other M(s0,S). Since the first PM action renews the system, it should be clear
that, if MOPT (s0,S) = (n,τ1, . . . ,τn), then MOPT (0,S − s0 − τ1) = (n − 1,τ2, . . . ,τn).
This shows that, to solve the general case, it is important to understand the problem
with s0 = 0.
• The problem without information (s0 = 0)
In order to obtain the optimal policy we will proceed in two stages. First, we will
assume the number n of PMs fixed and will obtain the optimal PM moments.
Then, we will discuss how to obtain the optimal n for an infinite horizon (i.e.,
for S →∞).
Considering n fixed in 6.5 and differentiating with respect to τi we get that
λ(τi|0) = λ(S − τ1− . . .− τn) for i = 1, . . . ,n. Since λ(.|0) is strictly increasing,
this implies that τi = S/(n+ 1). In other words, in this case the optimal policy
specifies in fact an optimal period.
Now, to obtain the optimal n, we substitute the previous times again in 6.5 to
obtain c(n) = nCPM +(n+1)CIRΛ( Sn+1|0) = S n+1
S[CPM +CIRΛ( S
n+1|0)]−CPM .
Hence, to obtain the optimal n one should minimize c∗(n) = n+1S
[CPM +
CIRΛ( Sn+1|0)]– compare with 6.3. Since the function f(τ) = [CPM+CIRΛ(τ |0)]/τ
is convex, it follows that the optimal n is either nOPT = [S/τ ∗ − 1] or nOPT =
[S/τ ∗ − 1] + 1, where τ ∗ is the minimizer of f(τ) and [a] is the integer part of
a. Putting these considerations together and letting S →∞, it follows that the
optimal PM policy calls for PM actions at every
τOPT = limS→∞
S
nOPT + 1= B−1(CPM/CIR), (6.6)
where we have defined B(t) = tλ(t|0) − Λ(t|0) =∫ t
0uλ′(u|0)du. This is essen-
56
tially the same solution given in 6.4.
• The general case (s0 > 0).
Consider now an optimal policy M(s0,S) = (n,τ1, . . . ,τn). For large S it fol-
lows from 6.6 that τ2 = . . . = τn = B−1(CPM/CIR) and n = (S − s0 −
τ1)/B−1(CPM/CIR). Hence, to obtain the optimal policy we have now to op-
timize with respect to the remaining variable τ1. Substituting in 6.5 and dif-
ferentiating with respect to τ1 we get that the optimal policy M(s0,S) must
satisfy
λ(τ1,OPT |s0) = λ[B−1(CPM/CIR)|0], (6.7)
nOPT =S−s0−τ1,OPT
B−1(CPM/CIR)and τ2,OPT = . . . = τn,OPT = B−1(CPM/CIR).
Note that in purely dynamical implementation of this solution, the only relevant
equation is 6.7. This is because one monitors the history of the system (s0)
up to a time which solves 6.7, at which moment a PM action is performed
and a renewal occurs. Then, one monitors again the history of the renewed
system (again s0) and so on. In other words, we never get to apply the last
two equations. For this reason, we call equation 6.7 the fundamental law of
preventive maintenance.
Moreover, although 6.7 may suggest that in order to implement the optimal
policy one has to evaluate λ(t|s0) for every possible s0, if PM actions can be
scheduled without delay, one only need actually to evaluate λ(t|t). More pre-
cisely, denote by τOPT (s0) the solution of 6.7. In implementing the optimal
policy, the operator of the system monitors the failure history and at each s0
computes τOPT (s0). In general he or she would have that τOPT (s0) > s0 and
will keep going without performing a PM. In other words, the only way that
a PM action would be eventually performed is if for some s0 one has that
τOPT (s0) = s0. In other words, a PM action would be performed if and only
if lims0→τ1 λ(τ1|s0) = λ(B−1(CPM/CIR)|0). This is quite nice, because usually
λ(t|t) is much easier to compute than λ(t|s0). For instance, for the simple vir-
tual age model, it is easy to show that λ(t|t) == λ[t − (1 − θ)tN(t)] = λ[V (t)]
57
(see Kijima et al., 1988). Hence, 6.7 becomes now
λ[τ1,OPT − (1− θ)tN(τ1,OPT )] = λ[B−1(CPM/CIR)|0], (6.8)
or equivalently,
τ1,OPT − tN(τ1,OPT ) = λ−1{λ[B−1(CPM/CIR)|0]} − θtN(τ1,OPT ). (6.9)
In other words, a PM action will occur whenever the virtual age attains the
value λ−1{λ[B−1(CPM/CIR)|0]}.
6.4 Statistical inference for the virtual age model
Consider the virtual age model with a ROCOF modeled by a Power Law Process
(PLP), given by λ(t) = (β/η)(t/η)β−1 with β > 1. Suppose that the system is
observed up to time T with observed failure times 0 < t1 < . . . < tn < T . Let
V (ti) = θti and V (t−i ) = ti − (1− θ)ti−1. The likelihood is
L(β,η,θ) =
(n∏i=1
λ[V (t−i )]eΛ[V (ti)]−Λ[V (t−i )]
)eΛ[T−(1−θ)tn], (6.10)
where Λ(t) =∫ t
0λ(u)du = (t/η)β (see Toledo et al., 2013, for details).
In order to estimate the right hand side of 6.8 we proceed as follows. First, we
maximize numerically the likelihood 6.10 to obtain the maximum likelihood estimates
(MLEs) β̂, η̂ and θ̂. Then, to estimate Λ(t|0), we simulate many systems with the
estimated parameters and use a Nelson-Aalen estimator. Following Gilardoni and
Colosimo (2011), an estimate of λ(t|0) which takes into account the monotonicity
constraint can now be obtained as the derivative of the greatest convex minorant
(GCM) of the Nelson-Aalen estimate Λ̂(t|0). The estimates Λ̂(t|0) and λ̂(t|0) can
now be used to obtain B̂(t) = tλ̂(t|0) − Λ̂(t|0). Inverting B̂(t) we get an estimate
of B−1(CPM/CIR). It is noteworthy that this procedure corresponds to the method
proposed in Toledo et al. (2013), where B−1(CPM/CIR) corresponds to the optimal
PM periodicity policy for the systems under study.
Since we have already computed λ̂(t|0), this means that we obtain an estimate
58
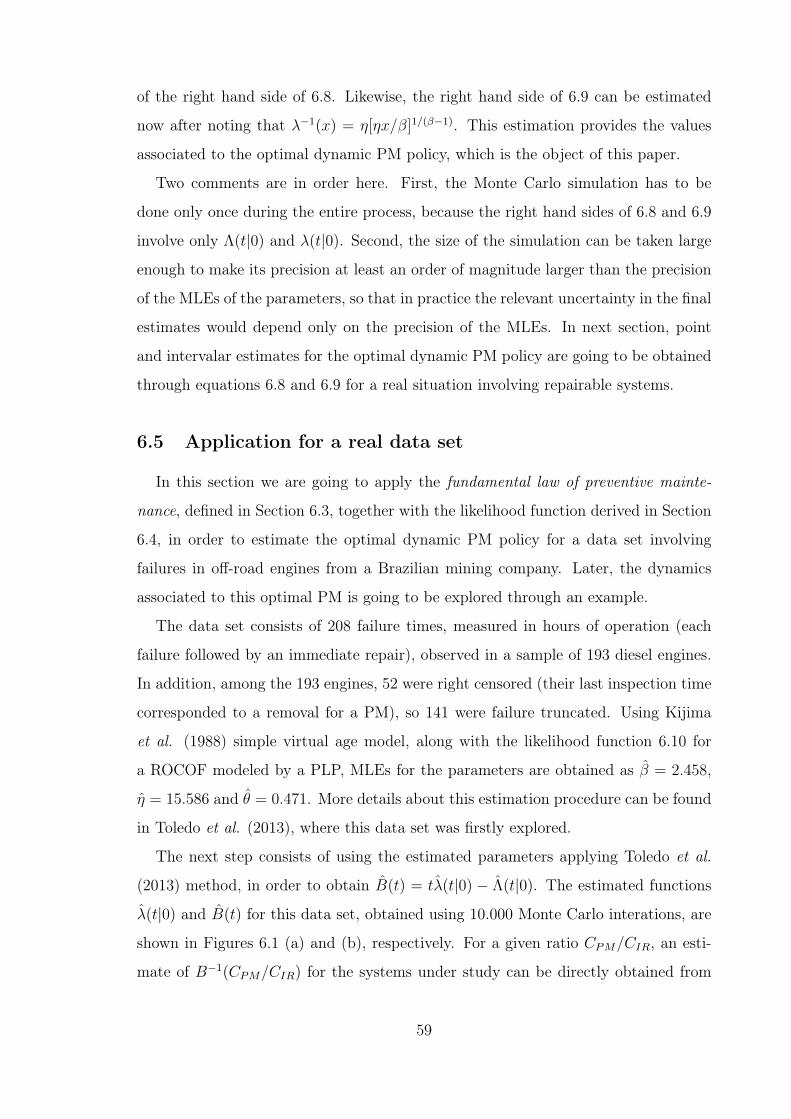
of the right hand side of 6.8. Likewise, the right hand side of 6.9 can be estimated
now after noting that λ−1(x) = η[ηx/β]1/(β−1). This estimation provides the values
associated to the optimal dynamic PM policy, which is the object of this paper.
Two comments are in order here. First, the Monte Carlo simulation has to be
done only once during the entire process, because the right hand sides of 6.8 and 6.9
involve only Λ(t|0) and λ(t|0). Second, the size of the simulation can be taken large
enough to make its precision at least an order of magnitude larger than the precision
of the MLEs of the parameters, so that in practice the relevant uncertainty in the final
estimates would depend only on the precision of the MLEs. In next section, point
and intervalar estimates for the optimal dynamic PM policy are going to be obtained
through equations 6.8 and 6.9 for a real situation involving repairable systems.
6.5 Application for a real data set
In this section we are going to apply the fundamental law of preventive mainte-
nance, defined in Section 6.3, together with the likelihood function derived in Section
6.4, in order to estimate the optimal dynamic PM policy for a data set involving
failures in off-road engines from a Brazilian mining company. Later, the dynamics
associated to this optimal PM is going to be explored through an example.
The data set consists of 208 failure times, measured in hours of operation (each
failure followed by an immediate repair), observed in a sample of 193 diesel engines.
In addition, among the 193 engines, 52 were right censored (their last inspection time
corresponded to a removal for a PM), so 141 were failure truncated. Using Kijima
et al. (1988) simple virtual age model, along with the likelihood function 6.10 for
a ROCOF modeled by a PLP, MLEs for the parameters are obtained as β̂ = 2.458,
η̂ = 15.586 and θ̂ = 0.471. More details about this estimation procedure can be found
in Toledo et al. (2013), where this data set was firstly explored.
The next step consists of using the estimated parameters applying Toledo et al.
(2013) method, in order to obtain B̂(t) = tλ̂(t|0) − Λ̂(t|0). The estimated functions
λ̂(t|0) and B̂(t) for this data set, obtained using 10.000 Monte Carlo interations, are
shown in Figures 6.1 (a) and (b), respectively. For a given ratio CPM/CIR, an esti-
mate of B−1(CPM/CIR) for the systems under study can be directly obtained from
59
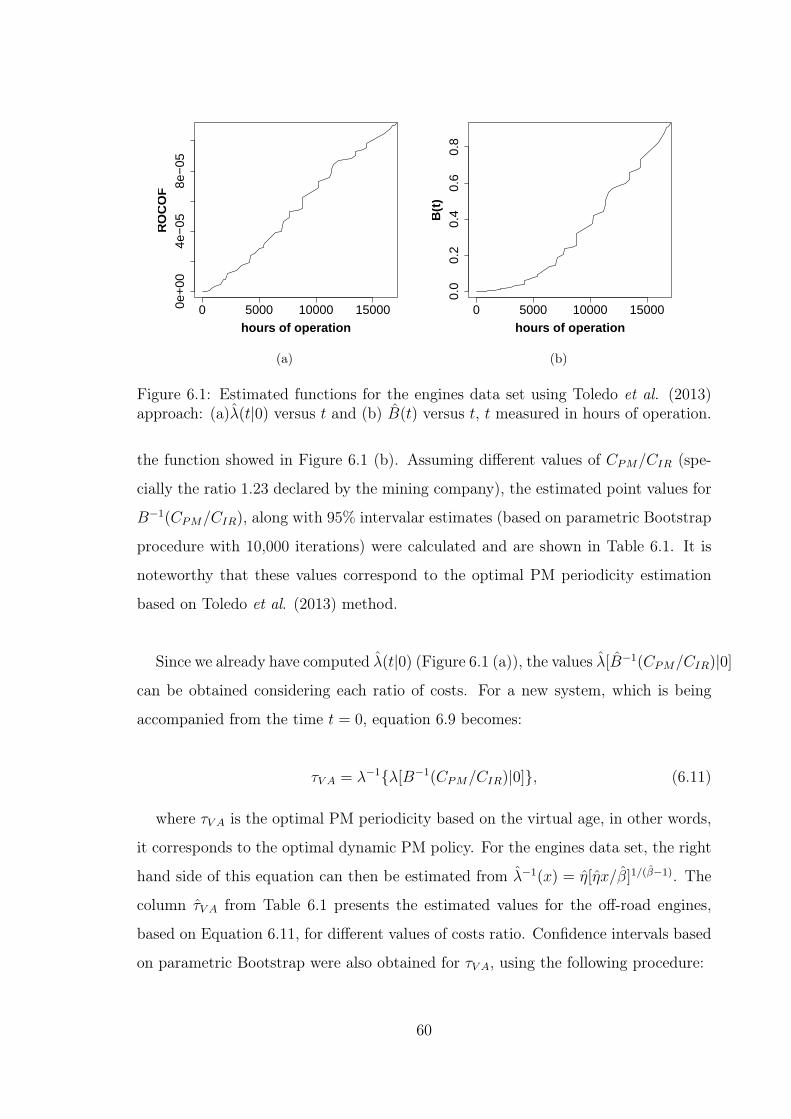
0 5000 10000 150000e+
004e
−05
8e−
05
hours of operation
RO
CO
F
(a)
0 5000 10000 15000
0.0
0.2
0.4
0.6
0.8
hours of operation
B(t
)
(b)
Figure 6.1: Estimated functions for the engines data set using Toledo et al. (2013)approach: (a)λ̂(t|0) versus t and (b) B̂(t) versus t, t measured in hours of operation.
the function showed in Figure 6.1 (b). Assuming different values of CPM/CIR (spe-
cially the ratio 1.23 declared by the mining company), the estimated point values for
B−1(CPM/CIR), along with 95% intervalar estimates (based on parametric Bootstrap
procedure with 10,000 iterations) were calculated and are shown in Table 6.1. It is
noteworthy that these values correspond to the optimal PM periodicity estimation
based on Toledo et al. (2013) method.
Since we already have computed λ̂(t|0) (Figure 6.1 (a)), the values λ̂[B̂−1(CPM/CIR)|0]
can be obtained considering each ratio of costs. For a new system, which is being
accompanied from the time t = 0, equation 6.9 becomes:
τV A = λ−1{λ[B−1(CPM/CIR)|0]}, (6.11)
where τV A is the optimal PM periodicity based on the virtual age, in other words,
it corresponds to the optimal dynamic PM policy. For the engines data set, the right
hand side of this equation can then be estimated from λ̂−1(x) = η̂[η̂x/β̂]1/(β̂−1). The
column τ̂V A from Table 6.1 presents the estimated values for the off-road engines,
based on Equation 6.11, for different values of costs ratio. Confidence intervals based
on parametric Bootstrap were also obtained for τV A, using the following procedure:
60
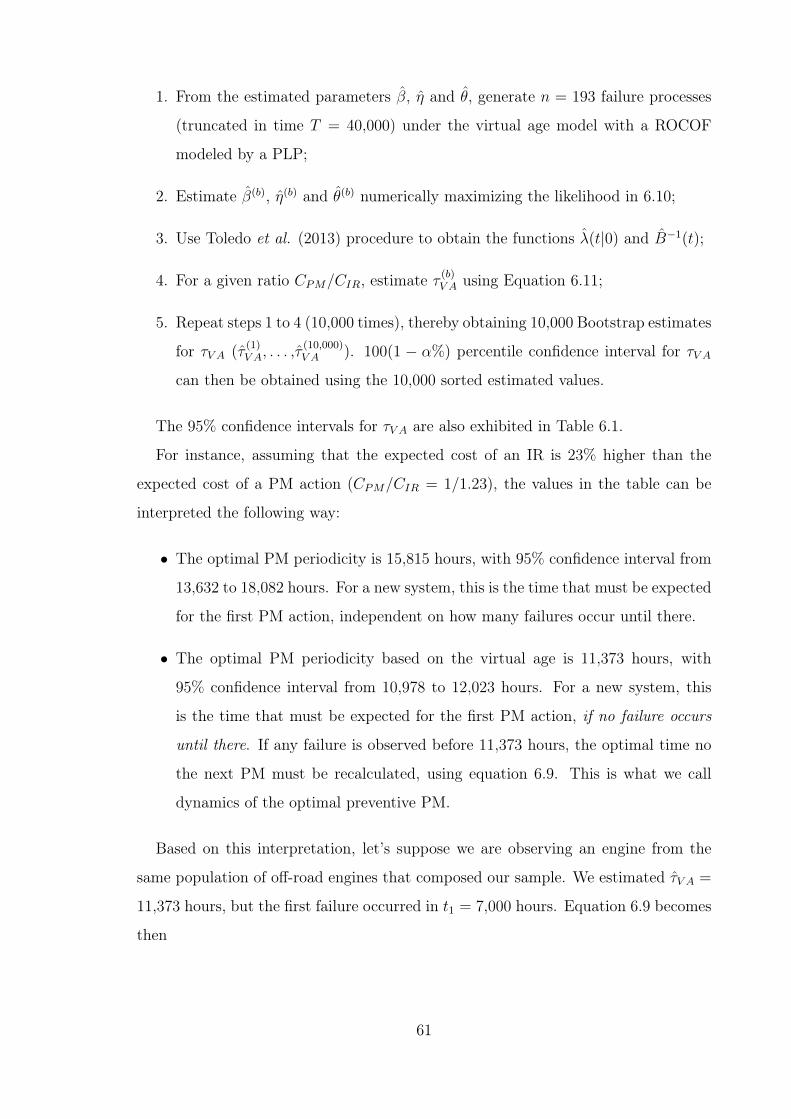
1. From the estimated parameters β̂, η̂ and θ̂, generate n = 193 failure processes
(truncated in time T = 40,000) under the virtual age model with a ROCOF
modeled by a PLP;
2. Estimate β̂(b), η̂(b) and θ̂(b) numerically maximizing the likelihood in 6.10;
3. Use Toledo et al. (2013) procedure to obtain the functions λ̂(t|0) and B̂−1(t);
4. For a given ratio CPM/CIR, estimate τ (b)V A using Equation 6.11;
5. Repeat steps 1 to 4 (10,000 times), thereby obtaining 10,000 Bootstrap estimates
for τV A (τ̂(1)V A, . . . ,τ̂
(10,000)V A ). 100(1 − α%) percentile confidence interval for τV A
can then be obtained using the 10,000 sorted estimated values.
The 95% confidence intervals for τV A are also exhibited in Table 6.1.
For instance, assuming that the expected cost of an IR is 23% higher than the
expected cost of a PM action (CPM/CIR = 1/1.23), the values in the table can be
interpreted the following way:
• The optimal PM periodicity is 15,815 hours, with 95% confidence interval from
13,632 to 18,082 hours. For a new system, this is the time that must be expected
for the first PM action, independent on how many failures occur until there.
• The optimal PM periodicity based on the virtual age is 11,373 hours, with
95% confidence interval from 10,978 to 12,023 hours. For a new system, this
is the time that must be expected for the first PM action, if no failure occurs
until there. If any failure is observed before 11,373 hours, the optimal time no
the next PM must be recalculated, using equation 6.9. This is what we call
dynamics of the optimal preventive PM.
Based on this interpretation, let’s suppose we are observing an engine from the
same population of off-road engines that composed our sample. We estimated τ̂V A =
11,373 hours, but the first failure occurred in t1 = 7,000 hours. Equation 6.9 becomes
then
61
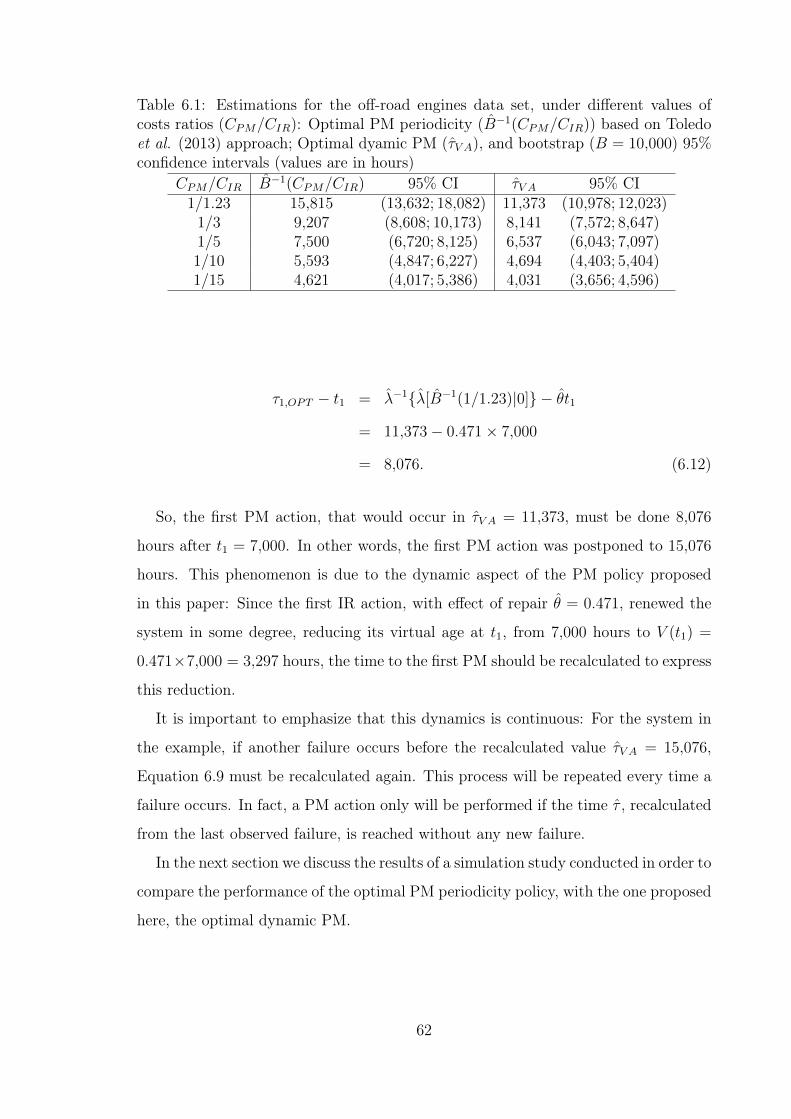
Table 6.1: Estimations for the off-road engines data set, under different values ofcosts ratios (CPM/CIR): Optimal PM periodicity (B̂−1(CPM/CIR)) based on Toledoet al. (2013) approach; Optimal dyamic PM (τ̂V A), and bootstrap (B = 10,000) 95%confidence intervals (values are in hours)
CPM/CIR B̂−1(CPM/CIR) 95% CI τ̂V A 95% CI1/1.23 15,815 (13,632; 18,082) 11,373 (10,978; 12,023)
1/3 9,207 (8,608; 10,173) 8,141 (7,572; 8,647)1/5 7,500 (6,720; 8,125) 6,537 (6,043; 7,097)1/10 5,593 (4,847; 6,227) 4,694 (4,403; 5,404)1/15 4,621 (4,017; 5,386) 4,031 (3,656; 4,596)
τ1,OPT − t1 = λ̂−1{λ̂[B̂−1(1/1.23)|0]} − θ̂t1
= 11,373− 0.471× 7,000
= 8,076. (6.12)
So, the first PM action, that would occur in τ̂V A = 11,373, must be done 8,076
hours after t1 = 7,000. In other words, the first PM action was postponed to 15,076
hours. This phenomenon is due to the dynamic aspect of the PM policy proposed
in this paper: Since the first IR action, with effect of repair θ̂ = 0.471, renewed the
system in some degree, reducing its virtual age at t1, from 7,000 hours to V (t1) =
0.471×7,000 = 3,297 hours, the time to the first PM should be recalculated to express
this reduction.
It is important to emphasize that this dynamics is continuous: For the system in
the example, if another failure occurs before the recalculated value τ̂V A = 15,076,
Equation 6.9 must be recalculated again. This process will be repeated every time a
failure occurs. In fact, a PM action only will be performed if the time τ̂ , recalculated
from the last observed failure, is reached without any new failure.
In the next section we discuss the results of a simulation study conducted in order to
compare the performance of the optimal PM periodicity policy, with the one proposed
here, the optimal dynamic PM.
62
6.6 Simulation study
In this section we describe a simulation study in order to compare the performance
of the two maintenance policies - the one proposed in Toledo et al. (2013), and the
one proposed in this paper, which for simplification will be called here, respectively,
periodic and dynamic. The simulations were done using a script written in R, a
language and environment for statistical computing (www.R-project.org, v.2.15). The
performance was defined as the mean cost per unit time with maintenance activities
(preventive - PM and corrective - IR) for systems subjected to such policies, denoted
by CP and CD, for the periodic and dynamic policy, respectively. Failure times were
generated using Monte Carlo method associated to PLP, according to the simple
virtual age model. Failure processes were generated under the combination of the
following parameters:
• β = 1.5, 2.0, 2.5 and 3.0
• η = 15,000
• θ = 0.1, 0.3, 0.5, 0.7, 0,9
where β and η are the shape and scale PLP parameters, respectively, and θ is
the effect of repair parameter. The η value remained fixed since it does not have an
impact on the comparative results.
On the other hand, the maintenance costs ratio (PM actions cost divided by IR
actions cost), denoted by CPM/CIR, does have an impact on the policies performance
results. The values 1/3, 1/5 and 1/15 were used on the simulations. So, successive
failure times were generated under 120 = 4×5×3×2 different scenarios. These were
defined considering (i) four β values, (ii) five θ values, (iii) three costs ratio values
and (iv) two policies (periodic and dynamic). The following procedure was then used
to run simulations for each maintenance policy:
1. Periodic Maintenance Policy
The method proposed in Toledo et. al. (2013), provides, for each scenario,
the optimal PM periodicity (τP ). Therefore, in the simulation study, failure
processes were generated for N systems under each scenario, up to τP . The
63
number of failures observed in the time interval (0,τP ] for each system was then
computed.
2. Dynamic Maintenance Policy
For a new system, this policy provides an initial time for PM (τV A), and recalcu-
lates this time if a failure occurs before the initial τV A, through the fundamental
law of preventive maintenance. In the simulation study, failure processes were
generated for N systems under each scenario. Every time a failure occurred
before τV A, this failure time was used to recalculate Equation 6.9, which in turn
provided a new perspective for τV A. For each system, the procedure ended when
the first PM was effectively conducted.
The mean maintenance costs per unit time for systems subject to periodic and
dynamic maintenance policies (CP and CD respectively) along with Monte Carlo
standard errors (SE), were obtained as follows.
• For the ith system (i = 1,2, . . . ,N) subject to policy j, j = P (Periodic), D
(Dynamic):
– the total number of failures (repairs) to the first PM, denoted by Nj,i, was
computed;
– the maintenance cost per unit time, given by:
Cj,i =CPM +Nj,i × CIR
tj,i(6.13)
was calculated, where tj,i corresponds to the time up to the first PM for
the ith system subjected to policy j.
• Finally, the mean cost per unit time for policy j (Cj) and the respective SE
(SEj) were calculated as the average and standard error for Cj,i (i = 1,2, . . . ,N),
respectively.
In this article, failure times for N = 10,000 systems were generated for each policy.
Table 6.2 shows CP and CD point estimates for each policy, along with the Monte
Carlo standard errors. In addition, Figure 6.2 exhibit the curves of the relationships
64
between the point estimates Cj (j = P,D) and the values of β and θ used in the
simulation, by scenario. The results obtained are listed below:
• the effect of the degree of repair parameter (θ): the degree of repair
does have an effect on the mean costs per unit time. It can be observed from
Figures 6.2(a) to 6.2(c) that, for both policies, the mean costs decrease along
with the decrease on the value of θ. In other words, the better the repair (i.e.,
θ closer to 0; a perfect repair) the lower the mean cost. However, this effect
is more evident for the dynamic policy. In addition, for the same degree of
repair, the mean costs for the dynamic policy are lower than the respective
ones for the Periodic policy. Note that we have assumed that repair actions
with different degrees have the same cost. In other words, the costs CIR were
assumed to be the same no matter which value of θ was used. Also, a very
important point to be observed from Table 6.2 values is that the differences
in costs between the two policies are inversely proportional to θ values. In
general, higher values of θ (closer to 1 - MR) are related to lower differences
between the costs under the two policies. This is an evidence that, under the
MR assumption (independent increments), the periodic policy is a reasonable
approach (although its associated costs are still higher than those related to
the dynamic policy). However, when each repair has a considerable effect of
renewing the system (θ < 1, dependent increments), the dynamic policy has a
substantial better performance.
• the effect of the cost ratios (CPM/CIR): if we analyze Figures 6.2(a) to
6.2(c) for each policy separately, we can see that for lower values of CPM/CIR
(i.e., higher values of CIR), the mean costs per unit time for a given policy
tend to be practically the same, no matter the effect of the repair. This pattern
can be observed for both policies. However, this effect is more evident for the
dynamic policy. In practice this result indicates that if one is dealing with much
higher CIR costs (see for example the case CPM/CIR = 1/15) there is not much
difference if one assumes IR (of any degree) or MR.
• the effect of the shape parameter PLP (β): in both policies, an increase
in β leads to a decrease in the mean cost. This can be explained by the fact that
65
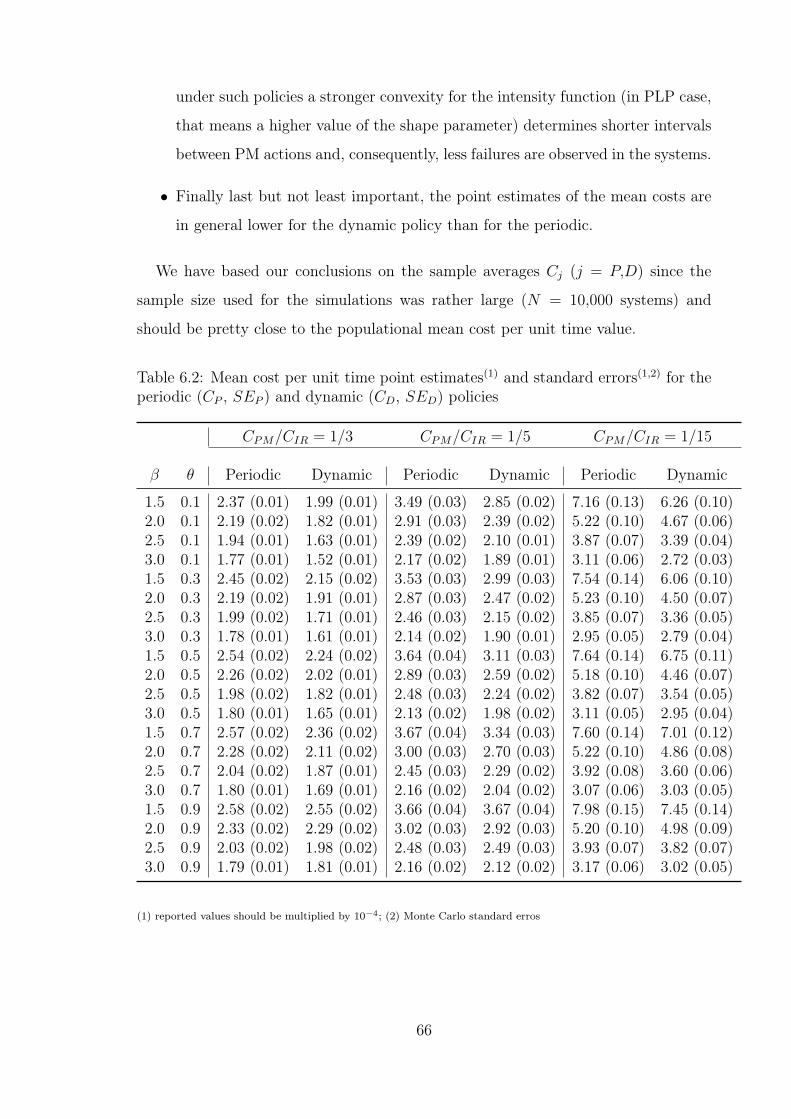
under such policies a stronger convexity for the intensity function (in PLP case,
that means a higher value of the shape parameter) determines shorter intervals
between PM actions and, consequently, less failures are observed in the systems.
• Finally last but not least important, the point estimates of the mean costs are
in general lower for the dynamic policy than for the periodic.
We have based our conclusions on the sample averages Cj (j = P,D) since the
sample size used for the simulations was rather large (N = 10,000 systems) and
should be pretty close to the populational mean cost per unit time value.
Table 6.2: Mean cost per unit time point estimates(1) and standard errors(1,2) for theperiodic (CP , SEP ) and dynamic (CD, SED) policies
CPM/CIR = 1/3 CPM/CIR = 1/5 CPM/CIR = 1/15
β θ Periodic Dynamic Periodic Dynamic Periodic Dynamic
1.5 0.1 2.37 (0.01) 1.99 (0.01) 3.49 (0.03) 2.85 (0.02) 7.16 (0.13) 6.26 (0.10)2.0 0.1 2.19 (0.02) 1.82 (0.01) 2.91 (0.03) 2.39 (0.02) 5.22 (0.10) 4.67 (0.06)2.5 0.1 1.94 (0.01) 1.63 (0.01) 2.39 (0.02) 2.10 (0.01) 3.87 (0.07) 3.39 (0.04)3.0 0.1 1.77 (0.01) 1.52 (0.01) 2.17 (0.02) 1.89 (0.01) 3.11 (0.06) 2.72 (0.03)1.5 0.3 2.45 (0.02) 2.15 (0.02) 3.53 (0.03) 2.99 (0.03) 7.54 (0.14) 6.06 (0.10)2.0 0.3 2.19 (0.02) 1.91 (0.01) 2.87 (0.03) 2.47 (0.02) 5.23 (0.10) 4.50 (0.07)2.5 0.3 1.99 (0.02) 1.71 (0.01) 2.46 (0.03) 2.15 (0.02) 3.85 (0.07) 3.36 (0.05)3.0 0.3 1.78 (0.01) 1.61 (0.01) 2.14 (0.02) 1.90 (0.01) 2.95 (0.05) 2.79 (0.04)1.5 0.5 2.54 (0.02) 2.24 (0.02) 3.64 (0.04) 3.11 (0.03) 7.64 (0.14) 6.75 (0.11)2.0 0.5 2.26 (0.02) 2.02 (0.01) 2.89 (0.03) 2.59 (0.02) 5.18 (0.10) 4.46 (0.07)2.5 0.5 1.98 (0.02) 1.82 (0.01) 2.48 (0.03) 2.24 (0.02) 3.82 (0.07) 3.54 (0.05)3.0 0.5 1.80 (0.01) 1.65 (0.01) 2.13 (0.02) 1.98 (0.02) 3.11 (0.05) 2.95 (0.04)1.5 0.7 2.57 (0.02) 2.36 (0.02) 3.67 (0.04) 3.34 (0.03) 7.60 (0.14) 7.01 (0.12)2.0 0.7 2.28 (0.02) 2.11 (0.02) 3.00 (0.03) 2.70 (0.03) 5.22 (0.10) 4.86 (0.08)2.5 0.7 2.04 (0.02) 1.87 (0.01) 2.45 (0.03) 2.29 (0.02) 3.92 (0.08) 3.60 (0.06)3.0 0.7 1.80 (0.01) 1.69 (0.01) 2.16 (0.02) 2.04 (0.02) 3.07 (0.06) 3.03 (0.05)1.5 0.9 2.58 (0.02) 2.55 (0.02) 3.66 (0.04) 3.67 (0.04) 7.98 (0.15) 7.45 (0.14)2.0 0.9 2.33 (0.02) 2.29 (0.02) 3.02 (0.03) 2.92 (0.03) 5.20 (0.10) 4.98 (0.09)2.5 0.9 2.03 (0.02) 1.98 (0.02) 2.48 (0.03) 2.49 (0.03) 3.93 (0.07) 3.82 (0.07)3.0 0.9 1.79 (0.01) 1.81 (0.01) 2.16 (0.02) 2.12 (0.02) 3.17 (0.06) 3.02 (0.05)
(1) reported values should be multiplied by 10−4; (2) Monte Carlo standard erros
66
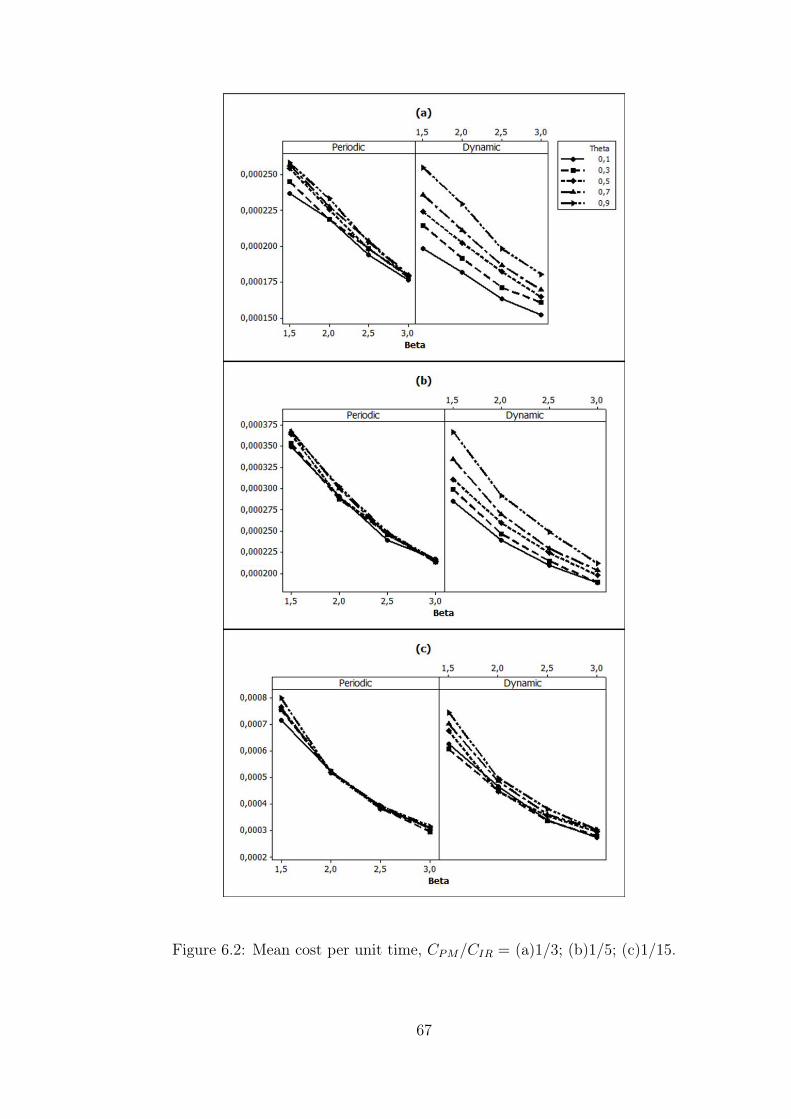
Figure 6.2: Mean cost per unit time, CPM/CIR = (a)1/3; (b)1/5; (c)1/15.
67
6.7 Conclusions and final remarks
In this paper, a dynamic method to estimate the optimal PM policy for repairable
systems was proposed. The method is based on the virtual age model presented by
Kijima et al. (1988), which considers the effect of repair actions taken after failures.
In constrast to optimal PM periodicity policies found in literature, the proposed
approach allows, when defining an optimal PM policy for a system, to incorporate
the information provided by any failure that may arise, updating the decision process
of when to perform PM.
The proposed approach was presented, including the derivation of the fundamental
law of preventive maintenance, which states there exists a constant, independent of
the history of the process, such that a PM action should be performed whenever the
conditional intensity of the IR failure process given the available information attains
that constant. Also, the associated inference problem to estimate the optimal PM
policy in the virtual age model was discussed.
The main result of the paper, Equation 6.9, states, for a new system, an optimal
time for the PM (τV A), based on its virtual age. Also, if any failure occur before
τV A, this equation can be used to update the optimal time, considering the wear-out
speed of the system, and also, the effect of repair actions taken after failures. When
applied to a real situation involving maintenance in off-road engines from a Brazilian
mining company, assuming a PLP process for the ROCOF, the involved parameters
were estimated as β̂ = 2.458, η̂ = 15.586 and θ̂ = 0.471. Assuming a costs ratio of
CPM/CIR = 1/1.23 for these systems, the estimated optimal PM periodicity based
on the virtual age was 11,373 hours. In other words, for a new system, this is the
time that must be expected for the first PM action, if no failures occur until there.
If any failure is observed before 11,373 hours, the optimal time no the next PM must
be recalculated, using equation 6.9. Confidence intervals were also obtained, and the
resulted values were compared to those related to the optimal PM periodicity policy
(Toledo et al. (2013) unpublished manuscript).
The simulation study conducted in order to compare the performance of the pro-
posed methodology (based on a dynamic PM policy) with a PM periodicity policy,
showed that the cost of maintenance (including PM and IR) actions is significantly
68

lower under the dynamic policy. This result is a strong evidence that the method pro-
posed in this paper has a better performance (in termos of costs) than the ones already
presented in literature. While the approach based on the optimal PM periodicity does
not take into account the history of the particular process under consideration, the
dynamic method presented here allows to use the virtual age of the system as the
reference for deciding when to run the next PM action, basing the decision-making
process with much more information.
69
7 Final remarks
The statistical models for repairable systems studied in this thesis make it possible
to deal with the general assumption of IR in the occurrence of failures. Optimal PM
policies are specified, either under the periodic perspective (Section 5) or dynamic
perspective (Section 6) and those are the main contributions of this work.
In the off-road trucks engines problem, while the manufacturer suggested PM ac-
tions at every 15,000 hours of operation, the obtained results in this work show that:
• The optimal PM periodicity is 15,815 hours, with 95% confidence interval from
13,632 to 18,082 hours. For a new system, this is the time that must be expected
for the first PM action, independent on how many failures occur until there.
• This estimation can be improved based on the optimal PM periodicity based
on the virtual age: 11,373 hours, with 95% confidence interval from 10,978 to
12,023 hours. For a new system, this is the time that must be expected for the
first PM action, if no failure occur until there. If any failure is observed, the
optimal time must be recalculated, using the method presented in Section 6.
Among the several possibilities for future work related to the topic, we highlight
the flexibilization of the studied models regarding the effect of PMs. In the practical
situation of diesel engines, a statistical analysis lead to conclude that the systems
that undergo PMs return to the AGAN condition, presenting the same behavior of
failure intensity of a new system. However, for many situations this assumption may
not be valid.
The development of IR models that also incorporate the PM effect is, therefore,
the main continuation point of this work. This effect can be modeled as a reduction
in either the age of the system, or the failure intensity. Therefore, it is expected that
the results presented in this thesis motivate future work in this direction.
70
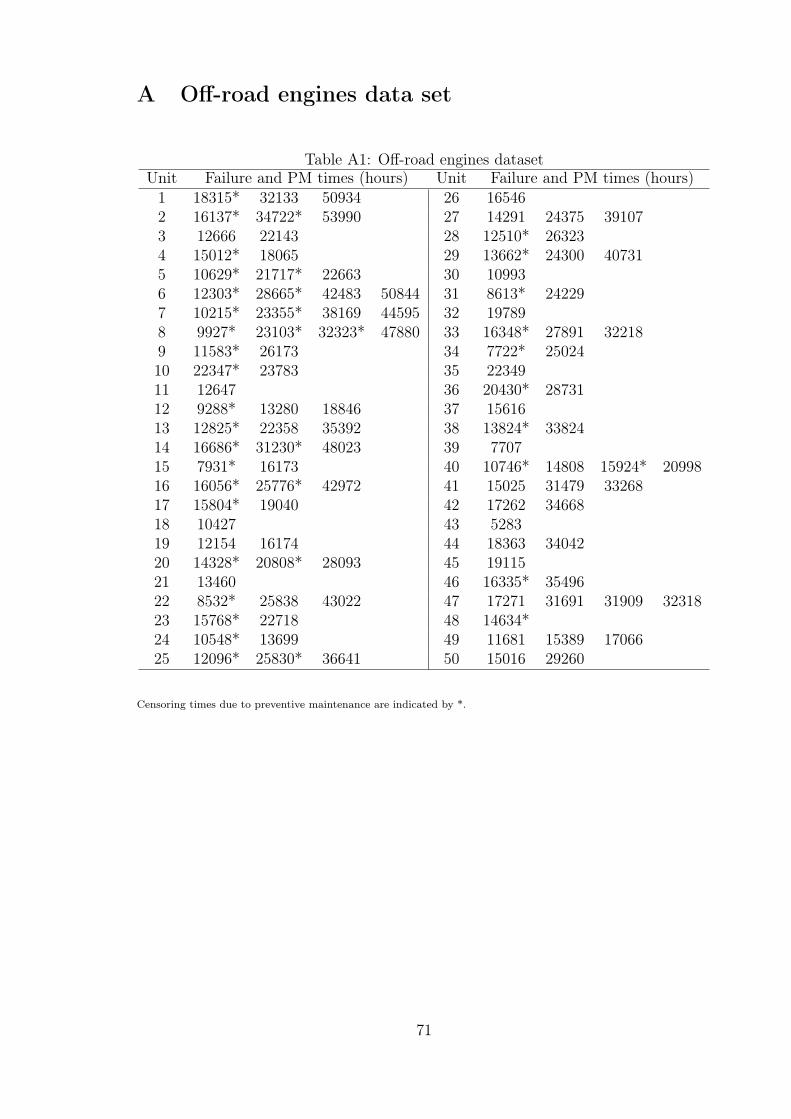
A Off-road engines data set
Table A1: Off-road engines datasetUnit Failure and PM times (hours) Unit Failure and PM times (hours)1 18315* 32133 50934 26 165462 16137* 34722* 53990 27 14291 24375 391073 12666 22143 28 12510* 263234 15012* 18065 29 13662* 24300 407315 10629* 21717* 22663 30 109936 12303* 28665* 42483 50844 31 8613* 242297 10215* 23355* 38169 44595 32 197898 9927* 23103* 32323* 47880 33 16348* 27891 322189 11583* 26173 34 7722* 2502410 22347* 23783 35 2234911 12647 36 20430* 2873112 9288* 13280 18846 37 1561613 12825* 22358 35392 38 13824* 3382414 16686* 31230* 48023 39 770715 7931* 16173 40 10746* 14808 15924* 2099816 16056* 25776* 42972 41 15025 31479 3326817 15804* 19040 42 17262 3466818 10427 43 528319 12154 16174 44 18363 3404220 14328* 20808* 28093 45 1911521 13460 46 16335* 3549622 8532* 25838 43022 47 17271 31691 31909 3231823 15768* 22718 48 14634*24 10548* 13699 49 11681 15389 1706625 12096* 25830* 36641 50 15016 29260
Censoring times due to preventive maintenance are indicated by *.
71
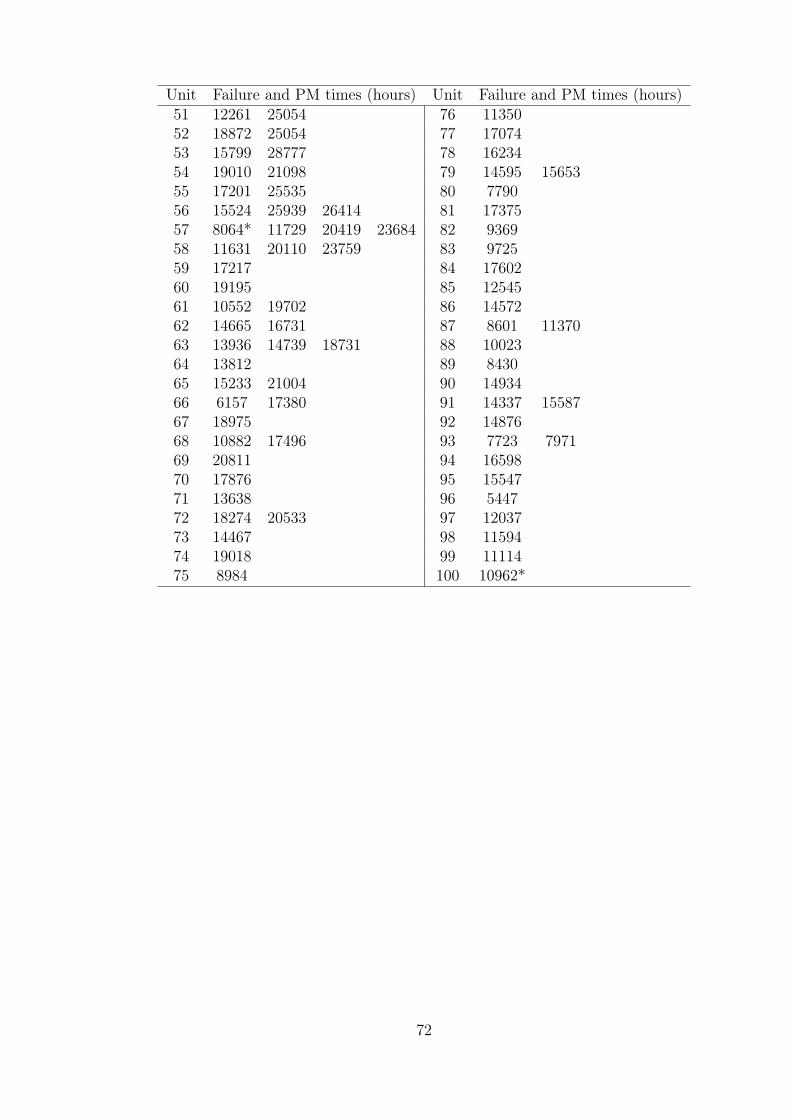
Unit Failure and PM times (hours) Unit Failure and PM times (hours)51 12261 25054 76 1135052 18872 25054 77 1707453 15799 28777 78 1623454 19010 21098 79 14595 1565355 17201 25535 80 779056 15524 25939 26414 81 1737557 8064* 11729 20419 23684 82 936958 11631 20110 23759 83 972559 17217 84 1760260 19195 85 1254561 10552 19702 86 1457262 14665 16731 87 8601 1137063 13936 14739 18731 88 1002364 13812 89 843065 15233 21004 90 1493466 6157 17380 91 14337 1558767 18975 92 1487668 10882 17496 93 7723 797169 20811 94 1659870 17876 95 1554771 13638 96 544772 18274 20533 97 1203773 14467 98 1159474 19018 99 1111475 8984 100 10962*
72
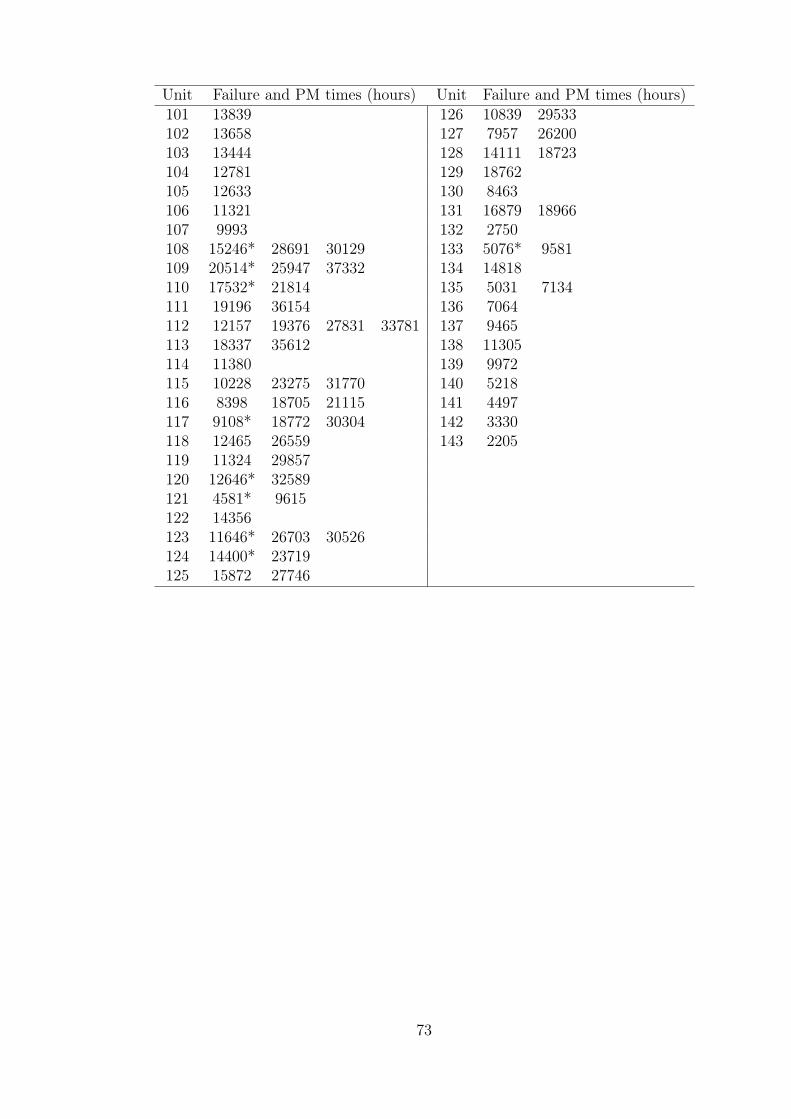
Unit Failure and PM times (hours) Unit Failure and PM times (hours)101 13839 126 10839 29533102 13658 127 7957 26200103 13444 128 14111 18723104 12781 129 18762105 12633 130 8463106 11321 131 16879 18966107 9993 132 2750108 15246* 28691 30129 133 5076* 9581109 20514* 25947 37332 134 14818110 17532* 21814 135 5031 7134111 19196 36154 136 7064112 12157 19376 27831 33781 137 9465113 18337 35612 138 11305114 11380 139 9972115 10228 23275 31770 140 5218116 8398 18705 21115 141 4497117 9108* 18772 30304 142 3330118 12465 26559 143 2205119 11324 29857120 12646* 32589121 4581* 9615122 14356123 11646* 26703 30526124 14400* 23719125 15872 27746
73
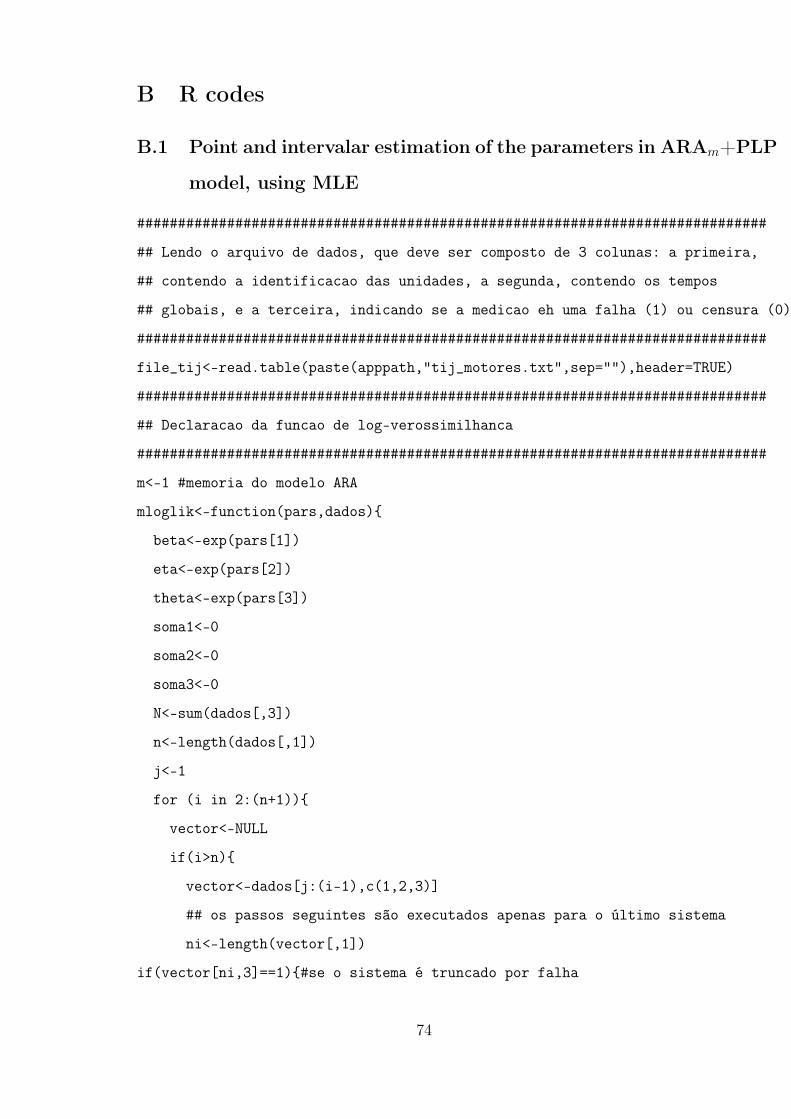
B R codes
B.1 Point and intervalar estimation of the parameters in ARAm+PLP
model, using MLE
#############################################################################
## Lendo o arquivo de dados, que deve ser composto de 3 colunas: a primeira,
## contendo a identificacao das unidades, a segunda, contendo os tempos
## globais, e a terceira, indicando se a medicao eh uma falha (1) ou censura (0)
#############################################################################
file_tij<-read.table(paste(apppath,"tij_motores.txt",sep=""),header=TRUE)
#############################################################################
## Declaracao da funcao de log-verossimilhanca
#############################################################################
m<-1 #memoria do modelo ARA
mloglik<-function(pars,dados){
beta<-exp(pars[1])
eta<-exp(pars[2])
theta<-exp(pars[3])
soma1<-0
soma2<-0
soma3<-0
N<-sum(dados[,3])
n<-length(dados[,1])
j<-1
for (i in 2:(n+1)){
vector<-NULL
if(i>n){
vector<-dados[j:(i-1),c(1,2,3)]
## os passos seguintes são executados apenas para o último sistema
ni<-length(vector[,1])
if(vector[ni,3]==1){#se o sistema é truncado por falha
74
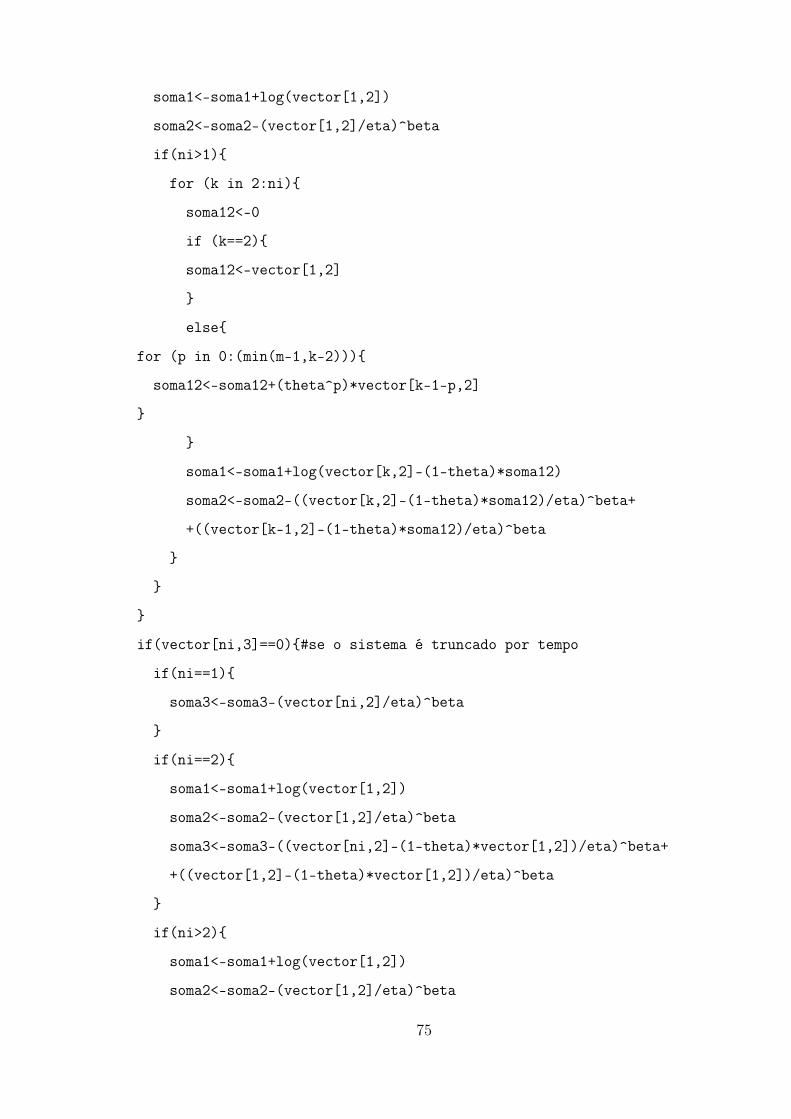
soma1<-soma1+log(vector[1,2])
soma2<-soma2-(vector[1,2]/eta)^beta
if(ni>1){
for (k in 2:ni){
soma12<-0
if (k==2){
soma12<-vector[1,2]
}
else{
for (p in 0:(min(m-1,k-2))){
soma12<-soma12+(theta^p)*vector[k-1-p,2]
}
}
soma1<-soma1+log(vector[k,2]-(1-theta)*soma12)
soma2<-soma2-((vector[k,2]-(1-theta)*soma12)/eta)^beta+
+((vector[k-1,2]-(1-theta)*soma12)/eta)^beta
}
}
}
if(vector[ni,3]==0){#se o sistema é truncado por tempo
if(ni==1){
soma3<-soma3-(vector[ni,2]/eta)^beta
}
if(ni==2){
soma1<-soma1+log(vector[1,2])
soma2<-soma2-(vector[1,2]/eta)^beta
soma3<-soma3-((vector[ni,2]-(1-theta)*vector[1,2])/eta)^beta+
+((vector[1,2]-(1-theta)*vector[1,2])/eta)^beta
}
if(ni>2){
soma1<-soma1+log(vector[1,2])
soma2<-soma2-(vector[1,2]/eta)^beta
75
for (k in 2:sum(vector[,3])){
soma12<-0
if (k==2){
soma12<-vector[1,2]
}
else{
for (p in 0:(min(m-1,k-2))){
soma12<-soma12+(theta^p)*vector[k-1-p,2]
}
}
soma1<-soma1+log(vector[k,2]-(1-theta)*soma12)
soma2<-soma2-((vector[k,2]-(1-theta)*soma12)/eta)^beta+
+((vector[k-1,2]-(1-theta)*soma12)/eta)^beta
}
soma32<-0
for (p in 0:(min(m-1,ni-2))){
soma32<-soma32+(theta^p)*vector[ni-1-p,2]
}
soma3<-soma3-((vector[ni,2]-(1-theta)*soma32)/eta)^beta+
+((vector[ni-1,2]-(1-theta)*soma32)/eta)^beta
}
}
####################################################################
j<-i
}
else if(dados[i,1]>dados[i-1,1]){#entra apenas quando identifica que
completou os dados de um sistema
vector<-dados[j:(i-1),c(1,2,3)]#constroi uma matriz contendo apenas
os dados de um sistema
## os passos seguintes são executados para cada sistema
ni<-length(vector[,1])
if(vector[ni,3]==1){#se o sistema é truncado por falha
76

soma1<-soma1+log(vector[1,2])
soma2<-soma2-(vector[1,2]/eta)^beta
if(ni>1){
for (k in 2:ni){
soma12<-0
if (k==2){
soma12<-vector[1,2]
}
else{
for (p in 0:(min(m-1,k-2))){
soma12<-soma12+(theta^p)*vector[k-1-p,2]
}
}
soma1<-soma1+log(vector[k,2]-(1-theta)*soma12)
soma2<-soma2-((vector[k,2]-(1-theta)*soma12)/eta)^beta+
+((vector[k-1,2]-(1-theta)*soma12)/eta)^beta
}
}
}
if(vector[ni,3]==0){#se o sistema é truncado por tempo
if(ni==1){
soma3<-soma3-(vector[ni,2]/eta)^beta
}
if(ni==2){
soma1<-soma1+log(vector[1,2])
soma2<-soma2-(vector[1,2]/eta)^beta
soma3<-soma3-((vector[ni,2]-(1-theta)*vector[1,2])/eta)^beta+
+((vector[1,2]-(1-theta)*vector[1,2])/eta)^beta
}
if(ni>2){
soma1<-soma1+log(vector[1,2])
soma2<-soma2-(vector[1,2]/eta)^beta
77
for (k in 2:sum(vector[,3])){
soma12<-0
if (k==2){
soma12<-vector[1,2]
}
else{
for (p in 0:(min(m-1,k-2))){
soma12<-soma12+(theta^p)*vector[k-1-p,2]
}
}
soma1<-soma1+log(vector[k,2]-(1-theta)*soma12)
soma2<-soma2-((vector[k,2]-(1-theta)*soma12)/eta)^beta+
+((vector[k-1,2]-(1-theta)*soma12)/eta)^beta
}
soma32<-0
for (p in 0:(min(m-1,ni-2))){
soma32<-soma32+(theta^p)*vector[ni-1-p,2]
}
soma3<-soma3-((vector[ni,2]-(1-theta)*soma32)/eta)^beta+
+((vector[ni-1,2]-(1-theta)*soma32)/eta)^beta
}
}
####################################################################
j<-i
}
}
###############
logl<-N*log(beta)-beta*N*log(eta)+(beta-1)*soma1+soma2+soma3
return(-1*logl)
# return(logl)
}
###########################################################################
78
## Otimizacao da funcao de de log-verossimilhanca:
###########################################################################
ml.fit<-optim(c(log(1.8),log(7),log(0.5)),mloglik,dados=file_tij,hessian=T)
###########################################################################
## Extraimos as EMV de log(beta), log(eta) e log(theta);
## Calculamos os DP’s estimados usando a informacao observada;
## Calculamos as estimativas pontuais dos parametros e seus respectivos
## IC de 95% (i.e. exponenciamos os ICs obtidos para o log dos parametros)
###########################################################################
hat.logbeta<-ml.fit$par[1]
hat.logeta<-ml.fit$par[2]
hat.logtheta<-ml.fit$par[3]
# Os desvios-padrao das estimativas dos parametros sao obtidos por:
# 1) Obtem-se a matriz hessiana. O negativo da hessiana eh a
# "informacao observada".
# 2) Usando a funcao ’solve’, calcula-se o inverso da hessiana, que eh a
# matriz de covariancia da aproximacao normal padrao.
# 3) Calcula-se a raiz quadrada usando-se ’sqrt’ das variancias.
sd.hat.logbeta<-sqrt(solve(ml.fit$hessian)[1,1])
sd.hat.logeta<-sqrt(solve(ml.fit$hessian)[2,2])
sd.hat.logtheta<-sqrt(solve(ml.fit$hessian)[3,3])
hat_beta<-exp(hat.logbeta)
hat_eta<-exp(hat.logeta)
hat_theta<-exp(hat.logtheta)
IC_beta<-exp(c(hat.logbeta-1.96*sd.hat.logbeta,hat.logbeta+
+1.96*sd.hat.logbeta))
IC_eta<-exp(c(hat.logeta-1.96*sd.hat.logeta,hat.logeta+1.96*sd.hat.logeta))
IC_theta<-exp(c(hat.logtheta-1.96*sd.hat.logtheta,hat.logtheta+
+1.96*sd.hat.logtheta))
hat_beta
IC_beta
hat_eta
79

IC_eta
hat_theta
IC_theta
ml.fit
80
B.2 Point and intervalar estimation of the parameters in ARIm+PLP
model, using MLE
file_tij<-read.table(paste(apppath,"tij_caminhoes.txt",sep=""),header=TRUE)
##########################################################################
## Declaracao da funcao de log-verossimilhanca
##########################################################################
m<-1 #memoria do modelo ARI
mloglik<-function(pars,dados){
beta<-exp(pars[1])
eta<-exp(pars[2])
theta<-exp(pars[3])
soma1<-0
soma2<-0
soma3<-0
N<-sum(dados[,3])
n<-length(dados[,1])
j<-1
for (i in 2:(n+1)){
vector<-NULL
if(i>n){
vector<-dados[j:(i-1),c(1,2,3)]
ni<-length(vector[,1])
if(vector[ni,3]==1){#se o sistema é truncado por falha
soma1<-soma1+log(vector[1,2]^(beta-1))
soma2<-soma2-(vector[1,2]^beta)
if(ni>1){
for (k in 2:ni){
soma12<-0
if (k==2){
soma12<-vector[1,2]^(beta-1)
}
81
else{
for (p in 0:(min(m-1,k-2))){
soma12<-soma12+(theta^p)*vector[k-1-p,2]^(beta-1)
}
}
soma1<-soma1+log(vector[k,2]^(beta-1)-(1-theta)*soma12)
soma2<-soma2+(-vector[k,2]^beta+vector[k-1,2]^beta+
+(1-theta)*beta*(vector[k,2]-vector[k-1,2])*soma12)
}
}
}
if(vector[ni,3]==0){#se o sistema é truncado por tempo
if(ni==1){
soma3<-soma3-(vector[ni,2]^beta)
}
if(ni==2){
soma1<-soma1+log(vector[1,2]^(beta-1))
soma2<-soma2-(vector[1,2]^beta)
soma3<-soma3+(-vector[ni,2]^beta+vector[1,2]^beta+
+(1-theta)*beta*(vector[ni,2]-vector[1,2])*vector[1,2]^(beta-1))
}
if(ni>2){
soma1<-soma1+log(vector[1,2]^(beta-1))
soma2<-soma2-(vector[1,2]^beta)
for (k in 2:sum(vector[,3])){
soma12<-0
if (k==2){
soma12<-vector[1,2]^(beta-1)
}
else{
for (p in 0:(min(m-1,k-2))){
soma12<-soma12+(theta^p)*vector[k-1-p,2]^(beta-1)
82

}
}
soma1<-soma1+log(vector[k,2]^(beta-1)-(1-theta)*soma12)
soma2<-soma2+(-vector[k,2]^beta+vector[k-1,2]^beta+
+(1-theta)*beta*(vector[k,2]-vector[k-1,2])*soma12)
}
soma32<-0
for (p in 0:(min(m-1,ni-2))){
soma32<-soma32+(theta^p)*vector[ni-1-p,2]
}
soma3<-soma3+(-vector[ni,2]^beta+vector[ni-1,2]^beta+
+(1-theta)*beta*(vector[ni,2]-vector[ni-1,2])*soma32)
}
}
j<-i
}
else if(dados[i,1]>dados[i-1,1]){
vector<-dados[j:(i-1),c(1,2,3)]
ni<-length(vector[,1])
if(vector[ni,3]==1){#se o sistema é truncado por falha
soma1<-soma1+log(vector[1,2]^(beta-1))
soma2<-soma2-(vector[1,2]^beta)
if(ni>1){
for (k in 2:ni){
soma12<-0
if (k==2){
soma12<-vector[1,2]^(beta-1)
}
else{
for (p in 0:(min(m-1,k-2))){
soma12<-soma12+(theta^p)*vector[k-1-p,2]^(beta-1)
}
83
}
soma1<-soma1+log(vector[k,2]^(beta-1)-(1-theta)*soma12)
soma2<-soma2+(-vector[k,2]^beta+vector[k-1,2]^beta+
+(1-theta)*beta*(vector[k,2]-vector[k-1,2])*soma12)
}
}
}
if(vector[ni,3]==0){#se o sistema é truncado por tempo
if(ni==1){
soma3<-soma3-(vector[ni,2]^beta)
}
if(ni==2){
soma1<-soma1+log(vector[1,2]^(beta-1))
soma2<-soma2-(vector[1,2]^beta)
soma3<-soma3+(-vector[ni,2]^beta+vector[1,2]^beta+
+(1-theta)*beta*(vector[ni,2]-vector[1,2])*vector[1,2]^(beta-1))
}
if(ni>2){
soma1<-soma1+log(vector[1,2]^(beta-1))
soma2<-soma2-(vector[1,2]^beta)
for (k in 2:sum(vector[,3])){
soma12<-0
if (k==2){
soma12<-vector[1,2]^(beta-1)
}
else{
for (p in 0:(min(m-1,k-2))){
soma12<-soma12+(theta^p)*vector[k-1-p,2]^(beta-1)
}
}
soma1<-soma1+log(vector[k,2]^(beta-1)-(1-theta)*soma12)
soma2<-soma2+(-vector[k,2]^beta+vector[k-1,2]^beta+
84
+(1-theta)*beta*(vector[k,2]-vector[k-1,2])*soma12)
}
soma32<-0
for (p in 0:(min(m-1,ni-2))){
soma32<-soma32+(theta^p)*vector[ni-1-p,2]
}
soma3<-soma3+(-vector[ni,2]^beta+vector[ni-1,2]^beta+
+(1-theta)*beta*(vector[ni,2]-vector[ni-1,2])*soma32)
}
}
j<-i
}
logl<-N*log(beta)-beta*N*log(eta)+soma1+(eta^(-beta))*soma2+(eta^(-beta))*soma3
return(-1*logl)
}
########################################################################
## Otimizacao da funcao de de log-verossimilhanca:
########################################################################
ml.fit<-optim(c(log(1.5),log(5),log(0.5)),mloglik,dados=file_tij,hessian=T)
########################################################################
hat.logbeta<-ml.fit$par[1]
hat.logeta<-ml.fit$par[2]
hat.logtheta<-ml.fit$par[3]
sd.hat.logbeta<-sqrt(solve(ml.fit$hessian)[1,1])
sd.hat.logeta<-sqrt(solve(ml.fit$hessian)[2,2])
sd.hat.logtheta<-sqrt(solve(ml.fit$hessian)[3,3])
hat_beta<-exp(hat.logbeta)
hat_eta<-exp(hat.logeta)
hat_theta<-exp(hat.logtheta)
IC_beta<-exp(c(hat.logbeta-1.96*sd.hat.logbeta,hat.logbeta+
+1.96*sd.hat.logbeta))
IC_eta<-exp(c(hat.logeta-1.96*sd.hat.logeta,hat.logeta+
85

+1.96*sd.hat.logeta))
IC_theta<-exp(c(hat.logtheta-1.96*sd.hat.logtheta,
,hat.logtheta+1.96*sd.hat.logtheta))
hat_beta
IC_beta
hat_eta
IC_eta
hat_theta
IC_theta
ml.fit
86
B.3 Point estimation of the optimal PM periodicity under
ARA1+PLP model
cost.ratio<-1/1.23
K<-10000 #tamanho do Monte Carlo
T<-40000 #tempo de truncamento
beta.hat<-2.458
eta.hat<-15586
theta.hat<-0.471
# GERAPLPRI toma T, beta, eta e theta e gera as falhas de um
PL+ARA1 truncado em T
GERAPLPRI<-function(beta,teta,eta,trunc){
tempos<-NULL
t<-0
while(t<trunc) {
tempos<-c(tempos,t)
u<-runif(1)
t<-(1-teta)*t+eta*((teta*t/eta)^beta-log(1-u))^(1/beta)
}
return(tempos[-1])
}
falhas<-NULL
for(k in 1:K){
falhas<-c(falhas,GERAPLPRI(beta=beta.hat,eta=eta.hat,teta=theta.hat,trunc=T))
}
falhas<-sort(falhas)
mcf.abs<-c(0,falhas,T)
mcf.ords<-c(0,0:(length(falhas)-1),length(falhas))/K
GCM1<-function(t,ords){
ext<-c(rep(0,length(t)-1),1)
indice<-1
while(indice<length(t)){
87
ext[indice]<-1
slopes<-(ords[-(1:indice)]-ords[indice])/(t[-(1:indice)]-t[indice])
indice<-indice+which.min(slopes)
}
return(list(tempos=t[ext==1],ords=ords[ext==1]))
}
gcm<-GCM1(mcf.abs,mcf.ords)
int.ords<-c(0,diff(gcm$ords)/diff(gcm$tempos))
B_t<-gcm$tempos*int.ords-gcm$ords
tau<-approx(x=B_t,y=gcm$tempos,xout=cost.ratio)$y
tau
88
B.4 Interval estimation (Bootstrap) of the optimal PM peri-
odicity under ARA1+PLP model
file_tij<-read.table(paste(apppath, "tij_motores.txt",sep=""),header=TRUE)
###########################################################################
## Reamostrando do arquivo de dados original para construir o Bootstrap
###########################################################################
reamostragem<-function(tij){
num_elem <-tij[length(tij[, 1]),1]
x<-sample(1:num_elem, num_elem, replace=T)
#tij_B<-matrix(ncol=3,nrow=0)
acc<-0
for(i in 1:num_elem) { # para cada elmento do resample
for(j in 1:length(tij[,1])){ # para cada elemento da matrix de dados
if(tij[j,1]==x[i]){
acc<-1+acc #acumular isso no vetor
}
}
}
patati<-1
tij_B<-matrix(ncol=3,nrow=acc)
for(i in 1:num_elem) { # para cada elmento do resample
for(j in 1:length(tij[,1])){ # para cada elemento da matrix de dados
if(tij[j,1]==x[i]){
tij_B[patati,1]<-i#tij[j,1] #bind value to the last array position
tij_B[patati,2]<-tij[j,2] #bind value to the last array position
tij_B[patati,3]<-tij[j,3] #bind value to the last array position
patati<-patati+1
}
}
}
return(tij_B)
89
}
## EMV para cada reamostra
mloglik<-function(pars,dados){
N<-0
beta<-exp(pars[1])
eta<-exp(pars[2])
theta<-exp(pars[3])
Total<-length(dados[, 1])
soma1<-0
soma2<-0
soma3<-0
soma4<-0
if (dados[1,3]==0){
soma3<-soma3+(dados[1,2]/eta)^beta
}
if (dados[1,3]==1 & dados[1,1]!=dados[2,1]){
soma3<-soma3+((theta*dados[1,2])/eta)^beta
}
if (dados[1,3]==1){
soma2<-soma2+(dados[1,2]/eta)^beta
soma4<-soma4+log(dados[1,2])
soma1<-soma1+((theta*dados[1,2])/eta)^beta
}
if(dados[1,3] == 1) {
N<-N+1
}
for(i in 2:Total) {
if (dados[i,3]==1 & dados[i,1]!=dados[(i-1),1]){
90
soma2<-soma2+(dados[i,2]/eta)^beta
}else if (dados[i,3]==1 & dados[i,1]==dados[(i-1),1]){
soma2<-soma2+((dados[i,2]-(1-theta)*dados[(i-1),2])/eta)^beta
}
#----
if (dados[i,3]==0 & dados[i,1]==dados[(i-1),1]){
soma3<-soma3+((dados[i,2]-(1-theta)*dados[(i-1),2])/eta)^beta
}else if (dados[i,3]==0 & dados[i,1]!=dados[(i-1),1]){
soma3<-soma3+(dados[i,2]/eta)^beta
}
#------
if (dados[i,3]==1 & dados[i,1]!=dados[(i-1),1]){
soma4<-soma4+log(dados[i,2])
}else if (dados[i,3]==1 & dados[i,1]==dados[(i-1),1]){
soma4<-soma4+log((dados[i,2]-(1-theta)*dados[(i-1),2]))
}
#------
if (dados[i,3]==1){
soma1<-soma1+((theta*dados[i,2])/eta)^beta
N<-N+1
}
}
for(i in 2:(Total-1)) {
if (dados[i,3]==1 & dados[i,1]!=dados[(i+1),1]){
soma3<-soma3+((theta*dados[i,2])/eta)^beta
}
}
if (dados[Total,3]==1){
soma3<-soma3+((theta*dados[Total,2])/eta)^beta
}
logl<-soma1-soma2-soma3+N*log(beta)-beta*N*log(eta)+(beta-1)*soma4
91
return(-1*logl)
}
bootstrap<-function(B){
ptm <- proc.time() #inicia contador de tempo de processamento
matparam<-matrix(ncol=3,nrow=B)
for(i in 1:B){
tryCatch({
tij_B<-reamostragem(file_tij)
ml.fit<-optim(c(log(2.45),log(15500),log(0.47)),
,mloglik,dados=tij_B,hessian=F)
hat_beta<-exp(ml.fit$par[1])
hat_eta<-exp(ml.fit$par[2])
hat_theta<-exp(ml.fit$par[3])
matparam[i,1]<-hat_beta
matparam[i,2]<-hat_eta
matparam[i,3]<-hat_theta
},error=function(err)
{
matparam[i,1]<-NA
matparam[i,2]<-NA
matparam[i,3]<-NA
})
}
cat("\n->Bootstrap: Tempo de processamento uso do CPU ",proc.time() - ptm)
return(matparam)
}
## Com base nos parametros estimados para cada reamostra de tij, ajusta a MCF e
## estima Lambda(t), lambda(t) e B(t) pelo Maximo Minorante Convexo (GCM)
GERAPLPRI<-function(beta,teta,eta,trunc){
tempos<-NULL
t<-0
while(t<trunc) {
92

tempos<-c(tempos,t)
u<-runif(1)
t<-(1-teta)*t+eta*((teta*t/eta)^beta-log(1-u))^(1/beta)
}
return(tempos[-1])
}
GCM1<-function(t,ords){
ext<-c(rep(0,length(t)-1),1)
indice<-1
while(indice<length(t)){
ext[indice]<-1
slopes<-(ords[-(1:indice)]-ords[indice])/(t[-(1:indice)]-t[indice])
indice<-indice+which.min(slopes)
}
return(list(tempos=t[ext==1],ords=ords[ext==1]))
}
mlgt<-function(B,K,T,cost.ratio,mat.parametros){
tau_gcm<-vector("numeric",B)
beta.hat<-vector("numeric",B)
eta.hat<-vector("numeric",B)
theta.hat<-vector("numeric",B)
saida<-matrix(ncol=4,nrow=B)
idx<-1
for(i in 1:B){
beta.hat[i]<-mat.parametros[i,1]
eta.hat[i]<-mat.parametros[i,2]
theta.hat[i]<-mat.parametros[i,3]
if(!( is.na(beta.hat[i]) || is.na(eta.hat[i]) || is.na(theta.hat[i]))){
###
falhas<-NULL
for(k in 1:K){
falhas<-c(falhas,GERAPLPRI(beta=beta.hat[i],eta=eta.hat[i],
93
,teta=theta.hat[i],trunc=T))
}
falhas<-sort(falhas)
mcf.abs<-NULL
mcf.abs<-c(0,falhas,T)
mcf.ords<-NULL
mcf.ords<-c(0,0:(length(falhas)-1),length(falhas))/K
gcm<-NULL
gcm<-GCM1(mcf.abs,mcf.ords)
int.ords<-NULL
int.ords<-c(0,diff(gcm$ords)/diff(gcm$tempos))
B_t<-NULL
B_t<-gcm$tempos*int.ords-gcm$ords
gcm$tempos
tau_gcm[i]<-approx(x=B_t,y=gcm$tempos,xout=cost.ratio)$y
idx<-idx+1
saida[i,1]<-beta.hat[i]
saida[i,2]<-eta.hat[i]
saida[i,3]<-theta.hat[i]
saida[i,4]<-tau_gcm[i]
###
}else{
#cat("\nNA’s encontrados, ignorando")
tau_gcm[i]<-NA
}
}
IC_gcm<-quantile(tau_gcm,probs=c(0.025,0.975),na.rm=TRUE)
print(saida)
return(IC_GCM=IC_gcm)
}
cost.ratio<-1/1.23
K<-10000
94

T<-40000
B<-10000
mat.parametros<-bootstrap(B)
mlgt(B,K,T,cost.ratio,mat.parametros)
95
B.5 Estimating the periodicity in virtual age (Dinamic Policy)
under the model ARA1+PLP and Bootstratp CIs
#################################################################
## Objetivo: Estimar a periodicidade de manutenção preventiva na
## idade virtual baseada na Politica Dinamica, para um conjunto
## de sistemas sob estudo que seguem o modelo ARA 1 + PLP com
## parâmetros estimados beta, eta e theta, dada uma razao de custos
## Cmp/Cmc. Fornece a estimativa pontual e IC Bootstrap parametrico:
## 1) Utilizando a Equacao Fundamental da Manutencao Preventiva,
## estima a periodicidade (tau) utilizando Monte Carlo com K sistemas.
## 2) O Bootstrap parametrico consiste em gerar n sistemas com os
## parametros beta, eta e theta, e estimar a periodicidade, B vezes.
## 3) O IC percentilico eh obtido com base nas B reamostras Bootstrap.
## 4) O resultado final a ser armazenado consiste na estimativa
## pontual da periodicidade, seu IC e os B valores de beta, eta,
theta e tau estimados para cada uma das B reamostras.
#################################################################
### Parametros de entrada #######################################
#Razão Cmp/Cmc
cost.ratio<-1/1.23
#Parametros ARA1+PLP
beta<-2.458
theta<-0.471
eta<-15586
#tempo de truncamento para gerar os sistemas
T<-60000
K<-10000 #Monte Carlo para estimar a MCF
96
B<-10000 #Bootstrap para construir ICs
n<-193 #Numero de sistemas simulados no Bootstrap parametrico
### Estimaçao tau pontual#########################################
GERAPLPRI<-function(beta,theta,eta,trunc){
tempos<-NULL
t<-0
while(t<trunc) {
tempos<-c(tempos,t)
u<-runif(1)
t<-(1-theta)*t+eta*((theta*t/eta)^beta-log(1-u))^(1/beta)
}
return(tempos[-1])
}
GCM<-function(t,ords){
ext<-c(rep(0,length(t)-1),1)
indice<-1
while(indice<length(t)){
ext[indice]<-1
slopes<-(ords[-(1:indice)]-ords[indice])/(t[-(1:indice)]-t[indice])
indice<-indice+which.min(slopes)
}
return(list(tempos=t[ext==1],ords=ords[ext==1]))
}
falhas<-NULL
for(i in 1:K){
falhas<-c(falhas,GERAPLPRI(beta,theta,eta,T))
}
falhas<-sort(falhas)
97
mcf.abs<-c(0,falhas,T)
mcf.ords<-c(0,0:(length(falhas)-1),length(falhas))/K
#plot(mcf.abs,mcf.ords)
gcm<-GCM(mcf.abs,mcf.ords)
#plot(gcm$tempos,gcm$ords)
int.ords<-c(0,diff(gcm$ords)/diff(gcm$tempos))
#plot(gcm$tempos,int.ords)
B_t<-gcm$tempos*int.ords-gcm$ords
#plot(gcm$tempos,B_t)
hat.tau_Periodica<-approx(x=B_t,y=gcm$tempos,xout=cost.ratio)$y
lambda<-approx(y=int.ords,x=gcm$tempos,xout=hat.tau_Periodica,
,method="constant")$y
Tau_pontual_VA<-eta*((lambda*eta)/beta)^(1/(beta-1)) #periodicidade
#na idade virtual (sob a politica dinamica)
### Estimaçao IC Bootstrap #####################################
mloglikRI<-function(parsRI,dadosRI){
N_RI<-0
betaRI<-exp(parsRI[1])
etaRI<-exp(parsRI[2])
thetaRI<-exp(parsRI[3])
TotalRI<-length(dadosRI[, 1])
soma1RI<-0
soma2RI<-0
soma3RI<-0
soma4RI<-0
if (dadosRI[1,3]==0){
soma3RI<-soma3RI+(dadosRI[1,2]/etaRI)^betaRI
}
if (dadosRI[1,3]==1 & dadosRI[1,1]!=dadosRI[2,1]){
soma3RI<-soma3RI+((thetaRI*dadosRI[1,2])/etaRI)^betaRI
98
}
if (dadosRI[1,3]==1){
soma2RI<-soma2RI+(dadosRI[1,2]/etaRI)^betaRI
soma4RI<-soma4RI+log(dadosRI[1,2])
soma1RI<-soma1RI+((thetaRI*dadosRI[1,2])/etaRI)^betaRI
}
if(dadosRI[1,3] == 1) {
N_RI<-N_RI+1
}
for(i in 2:TotalRI) {
if (dadosRI[i,3]==1 & dadosRI[i,1]!=dadosRI[(i-1),1]){
soma2RI<-soma2RI+(dadosRI[i,2]/etaRI)^betaRI
}else if (dadosRI[i,3]==1 & dadosRI[i,1]==dadosRI[(i-1),1]){
soma2RI<-soma2RI+((dadosRI[i,2]-(1-thetaRI)*
*dadosRI[(i-1),2])/etaRI)^betaRI
}
#----
if (dadosRI[i,3]==0 & dadosRI[i,1]==dadosRI[(i-1),1]){
soma3RI<-soma3RI+((dadosRI[i,2]-(1-thetaRI)*
*dadosRI[(i-1),2])/etaRI)^betaRI
}else if (dadosRI[i,3]==0 & dadosRI[i,1]!=dadosRI[(i-1),1]){
soma3RI<-soma3RI+(dadosRI[i,2]/etaRI)^betaRI
}
#------
if (dadosRI[i,3]==1 & dadosRI[i,1]!=dadosRI[(i-1),1]){
soma4RI<-soma4RI+log(dadosRI[i,2])
}else if (dadosRI[i,3]==1 & dadosRI[i,1]==dadosRI[(i-1),1]){
soma4RI<-soma4RI+log((dadosRI[i,2]-(1-thetaRI)*dadosRI[(i-1),2]))
}
#------
if (dadosRI[i,3]==1){
soma1RI<-soma1RI+((thetaRI*dadosRI[i,2])/etaRI)^betaRI
99
N_RI<-N_RI+1
}
}
for(i in 2:(TotalRI-1)) {
if (dadosRI[i,3]==1 & dadosRI[i,1]!=dadosRI[(i+1),1]){
soma3RI<-soma3RI+((thetaRI*dadosRI[i,2])/etaRI)^betaRI
}
}
if (dadosRI[TotalRI,3]==1){
soma3RI<-soma3RI+((thetaRI*dadosRI[TotalRI,2])/etaRI)^betaRI
}
loglRI<-soma1RI-soma2RI-soma3RI+N_RI*log(betaRI)-
-betaRI*N_RI*log(etaRI)+(betaRI-1)*soma4RI
return(-1*loglRI)
}
Bootstrap<-function(n){
#Gera n processos ARA 1 + PLP
falhas<-NULL
falhas<-c(GERAPLPRI(beta,theta,eta,T))
matriz_dados1<-matrix(ncol=3,nrow=(length(falhas)+1))
for (i in 1:(length(falhas))){
matriz_dados1[i,1]<-1
matriz_dados1[i,2]<-falhas[i]
matriz_dados1[i,3]<-1
}
matriz_dados1[length(falhas)+1,1]<-1
matriz_dados1[length(falhas)+1,2]<-T
matriz_dados1[length(falhas)+1,3]<-0
matriz_dados<-NULL
for (j in 2:n){
falhas<-c(GERAPLPRI(beta,theta,eta,T))
100
matriz_dados_prov<-NULL
matriz_dados_prov<-matrix(ncol=3,nrow=(length(falhas)+1))
for (i in 1:(length(falhas))){
matriz_dados_prov[i,1]<-j
matriz_dados_prov[i,2]<-falhas[i]
matriz_dados_prov[i,3]<-1
}
matriz_dados_prov[length(falhas)+1,1]<-j
matriz_dados_prov[length(falhas)+1,2]<-T
matriz_dados_prov[length(falhas)+1,3]<-0
matriz_dados<-rbind(matriz_dados,matriz_dados_prov)
}
file_tij<-rbind(matriz_dados1,matriz_dados)
#Estima os parametros sob RI e estima tau sob a politica dinamica
ml.fitRI<-optim(c(log(beta),log(eta),log(theta)),mloglikRI,
,dadosRI=file_tij,hessian=F)
beta_RI<-exp(ml.fitRI$par[1])
eta_RI<-exp(ml.fitRI$par[2])
theta_RI<-exp(ml.fitRI$par[3])
falhas<-NULL
for(i in 1:K){
falhas<-c(falhas,GERAPLPRI(beta_RI,theta_RI,eta_RI,T))
}
falhas<-sort(falhas)
mcf.abs<-c(0,falhas,T)
mcf.ords<-c(0,0:(length(falhas)-1),length(falhas))/K
gcm<-GCM(mcf.abs,mcf.ords)
int.ords<-c(0,diff(gcm$ords)/diff(gcm$tempos))
B_t<-gcm$tempos*int.ords-gcm$ords
hat.tau_Periodica<-approx(x=B_t,y=gcm$tempos,xout=cost.ratio)$y
lambda<-approx(y=int.ords,x=gcm$tempos,xout=hat.tau_Periodica,
,method="constant")$y
101
Tau_VA_B<-eta*((lambda*eta)/beta)^(1/(beta-1)) #periodicidade na
#idade virtual (sob a politica dinamica)
return(list(hat.beta=beta_RI,hat.eta=eta_RI,hat.theta=theta_RI,
,hat.tau_Periodica=hat.tau_Periodica,Tau_VA=Tau_VA_B))
}
beta_B<-NULL
eta_B<-NULL
theta_B<-NULL
Tau_periodica<-NULL
Tau_VA<-NULL
for (i in 1:B){
result<-Bootstrap(n)
C<-data.frame(result)
beta_B[i]<-C[1,1]
eta_B[i]<-C[1,2]
theta_B[i]<-C[1,3]
Tau_periodica[i]<-C[1,4]
Tau_VA[i]<-C[1,5]
}
IC_Tau_VA<-quantile(Tau_VA,probs=c(0.025,0.975),na.rm=TRUE)
Tau_pontual_VA
IC_Tau_VA
setwd("Desktop")
write.table(beta_B,"beta_Bootstrap.txt", sep = "\t",eol="\n\r",
,row.names=FALSE, col.names=FALSE)
write.table(eta_B,"eta_Bootstrap.txt", sep = "\t",eol="\n\r",
,row.names=FALSE, col.names=FALSE)
write.table(theta_B,"theta_Bootstrap.txt", sep = "\t",eol="\n\r",
,row.names=FALSE, col.names=FALSE)
102

write.table(Tau_periodica,"Tau_periodica_Bootstrap.txt", sep = "\t",
,eol="\n\r",row.names=FALSE, col.names=FALSE)
write.table(Tau_VA,"Tau_dinamica_Bootstrap.txt", sep = "\t",eol="\n\r",
,row.names=FALSE, col.names=FALSE)
103
References
Aalen, O. (1978). Nonparametric inference for a family of counting processes. The
Annals of Statistics, 6:701–726.
ABNT (1994). NBR 5462: Confiabilidade e mantenabilidade. Rio de Janeiro.
Abranches, E. F. N. (2013). Análise do intervalo ótimo ente manutenções preventivas
em motores de grande porte a diesel. Trabalho de Conclusão de Curso - Graduação
em Engenharia de Produção, UFOP.
Akaike, H. (1974). A new look at the statistical model identification. IEEE Transac-
tions on Automatic Control, 19:716–722.
Ascher, H. and Feingold, H. (1984). Repairable Systems Reliability: Modelling, infer-
ence, misconceptions and their causes. Marcel Dekker Inc.
Barlow, R. E. and Hunter, L. C. (1960). Optimum preventive maintenance policies.
Operations Research, 8:90–100.
Barlow, R. E. and Proschan, F. (1987). Mathematical Theory of Reliability. Society
for Industrial and Applied Mathematics.
Bartholomew-Biggs, M., Zuo, M. J., and Li, X. (2009). Modelling and optimizing
sequential imperfect preventive maintenance. Reliability Engineering and System
Safety, 94:53–62.
Block, H. W., Borges, W. S., and Savits, T. H. (1985). Age-dependent minimal repair.
Journal of Applied Probability, 22:370–385.
Boswell, M. T. (1966). Estimating and testing trend in a stochastic process of poisson
type. The Annals of Mathematical Statistics, 37:1564–1573.
Brown, M. and Proschan, F. (1983). Imperfect repair. Journal of Applied Probability,
20:851–859.
Burnham, K. P. and Anderson, D. R. (2004). Multimodel inference: Understanding
aic and bic in model selection. Sociological Methods and Research, 33:261–304.
104
Corset, F., Doyen, L., and Gaudoin, O. (2012). Bayesian analysis of ara imperfect
repair models. Communications in Statistics-Theory and Methods, 41:3915–3941.
Crow, L. R. (1974). Reliability and Biometry: Statistical Analysis of Lifelength,
chapter Reliability Analysis of Complex Systems. Proschan, F. and Serfling, J.,
SIAM, Philadelphia, PA.
Cui, L., Kou, W., Loh, H. T., and Xie, M. (2004). Optimal allocation of minimal
and perfect repairs under resource constraints. IEEE Transactions on Reliability,
53:193–199.
Doyen, L. and Gaudoin, O. (2004). Classes of imperfect repair models based on
reduction of failure intensity or virtual age. Reliability Engineering & System Safety,
84:45–56.
Doyen, L. and Gaudoin, O. (2006). Imperfect maintenance in a generalized competing
risks framework. Journal of Applied Probability, 43:825–839.
Doyen, L. and Gaudoin, O. (2011). Modeling and assessment of aging and efficiency of
corrective and planned preventive maintenance. IEEE Transactions on Reliability,
60:759–769.
Efron, B. and Tibshirani, R. (1986). Bootstrap methods for standard errors, confi-
dence intervals, and other measures for statistical accuracy. Biometrics, 72:45–58.
Gilardoni, G. L. and Colosimo, E. A. (2007). Optimal maintenance time for repairable
systems. Journal of Quality Technology, 39:48–53.
Gilardoni, G. L. and Colosimo, E. A. (2011). On the superposition of overlapping
poisson processes and nonparametric estimation of their intensity function. Journal
of Statistical Planning and Inference, 171:3075–3083.
Gilardoni, G. L., Oliveira, M. D., and Colosimo, E. A. (2013). Nonparametric esti-
mation and bootstrap confidence intervals for the optimal maintenance time of a
repairable system. Computational Statistics and Data Analysis, 63:113–124.
105
Jaturonnatee, J., Murthy, D. N. P., and Boondiskulchok, R. (2006). Optimal preven-
tive maintenance of leased equipment with corrective minimal repairs. European
Journal of Operational Research, 174:201–215.
Jayabalan, V. and Chaudhuri, D. (1992). Optimal maintenance and replacement
policy for a deteriorating system with increased mean downtime. Naval Research
Logistics, 39:67–78.
Kijima, M. (1989). Some results for repairable systems with general repair. Journal
of Applied Probability, 26:89–102.
Kijima, M., Morimura, H., and Suzuki, Y. (1988). Periodical replacement prob-
lem without assuming minimal repair. European Journal of Operational Research,
37:194–203.
Malik, M. A. K. (1979). Reliable preventive maintenance scheduling. AIIR Transac-
tions, 11:221–228.
Morimura, H. (1970). On some preventive maintenance policies for ifr. Journal of
Operations Research Society of Japan, 12:94–125.
Muralidharan, K. (2008). A review of repairable systems and point process models.
ProbStat Forum, 1:26–49.
Nakagawa, T. (1986). Periodic and sequential preventive maintenance policies. Jour-
nal of Applied Probability, 23:536–542.
Pan, R. and Rigdon, S. E. (2009). Bayes inference for general repairable systems.
Journal of Quality Technology, 41:82–93.
Park, D. H., Jung, G. M., and Yum, J. K. (2000). Cost minimization for periodic
maintenance policy of a system subject to slow degradation. Reliability Engineering
and System Safety, 68:105–112.
Park, K. S. (1979). Optimal number of minimal repairs before replacement. IEEE
Transactions on Reliability, 28:137–140.
106
Pham, H. and Wang, H. (1996). Imperfect maintenance. European Journal of Oper-
ational Research, 94:438–452.
Phelps, R. I. (1981). Replacement policies under minimal repair. The Journal of
Operational Research Society, 32:549–554.
Pulcini, G. (2001). A bounded intensity process for the reliability of repairable equip-
ment. Journal of Quality Technology, 33:480–492.
R (2012). A language and environment for statistical computing. The R Foundation
for Statistical Computing, ISBN 3-900051-07-0.
Remy, E., Corset, F., Despréaux, S., Doyen, L., and Gaudoin, O. (2013). An example
of integrated approach to technical and economic optimization of maintenance.
Reliability Engineering and System Safety, 116:8–19.
Schwarz, G. (1978). Estimating the dimension of a model. The Annals of Statistics,
6:461–464.
Sheu, S. and Griffith, W. (1992). Multivariate imperfect repair. Journal of Applied
Probability, 29:947–956.
Shin, I., Lim, T. J., and Lie, C. H. (1996). Estimating parameters of intensity function
and maintenance effect for repairable unit. Reliability Engineering and System
Safety, 56:1–10.
Toledo, M. L. G. d., Freitas, M. A., Colosimo, E. A., and Gilardoni, G. L. (2013).
Optimal periodic maintenance policy under imperfect repair: A case study on off-
road engines. Unpublished manuscript.
Wang, H. (2002). A survey of maintenance policies of deteriorating systems. European
Journal of Operational Research, 139:469–489.
Whitaker, L. R. and Samaniego, F. J. (1989). Estimating the reliability of systems
subject to imperfect repair. Journal of the American Statistical Association, 84:301–
309.
107
Wu, S. and Clements-Croome, D. (2005). Optimal maintenance policies under differ-
ent operational schedules. IEEE Transactions on Reliability, 54:338–346.
Wu, S. and Zuo, M. (2010). Linear and nonlinear preventive maintenance models.
IEEE Transactions on Reliability, 59:242–249.
Yanez, M., Joglar, F., and Modarres, M. (2002). Generalized renewal process for anal-
ysis of repairable systems with limited failure experience. Reliability Engineering
and System Safety, 77:167–180.
Yevkin, O. and Krivtsov, V. (2012). An approximate solution to the g-renewal equa-
tion with an underlying weibull distribution. IEEE Transaction on Reliability,
61:68–73.
Zhao, M. and Xie, M. (1996). On maximum likelihood estimation for a general non-
homogeneous poisson process. Scandinavian Journal of Statistics, 23:597–607.
108