
determination of steam quality and its - UM Students' Repository
41
DETERMINATION OF STEAM QUALITY AND ITS AFFECTING PARAMETERS ON A STEAM TURBINE JULIE NORAZREEN MAT AZAHAR FACULTY OF ENGINEERING UNIVERSITY OF MALAYA KUALA LUMPUR 2018 University of Malaya
-
Upload
khangminh22 -
Category
Documents
-
view
0 -
download
0
Transcript of determination of steam quality and its - UM Students' Repository

DETERMINATION OF STEAM QUALITY AND ITS AFFECTING PARAMETERS ON A STEAM TURBINE
JULIE NORAZREEN MAT AZAHAR
FACULTY OF ENGINEERING UNIVERSITY OF MALAYA
KUALA LUMPUR
2018Univers
ity of
Mala
ya
DETERMINATION OF STEAM QUALITY AND ITS AFFECTING PARAMETERS ON A STEAM TURBINE
JULIE NORAZREEN MAT AZAHAR
RESEARCH PROJECT SUBMITTED IN PARTIAL FULFILMENT OF THE REQUIREMENTS FOR THE
DEGREE OF MASTER OF MECHANICAL ENGINEERING
FACULTY OF ENGINEERING UNIVERSITY OF MALAYA
KUALA LUMPUR
2018 Univers
ity of
Mala
ya
ii
UNIVERSITY OF MALAYA
ORIGINAL LITERARY WORK DECLARATION
Name of Candidate: Julie Norazreen Mat Azahar
Matric No: KQK170020
Name of Degree: Master of Mechanical Engineering
Title of Project Paper/Research Report/Dissertation/Thesis (“this Work”):
Determination of Steam Quality and Its Affecting Parameters on a Steam Turbine
Field of Study: Powerplant Engineering
I do solemnly and sincerely declare that:
(1) I am the sole author/writer of this Work; (2) This Work is original; (3) Any use of any work in which copyright exists was done by way of fair dealing
and for permitted purposes and any excerpt or extract from, or reference to or reproduction of any copyright work has been disclosed expressly and sufficiently and the title of the Work and its authorship have been acknowledged in this Work;
(4) I do not have any actual knowledge nor do I ought reasonably to know that the making of this work constitutes an infringement of any copyright work;
(5) I hereby assign all and every rights in the copyright to this Work to the University of Malaya (“UM”), who henceforth shall be owner of the copyright in this Work and that any reproduction or use in any form or by any means whatsoever is prohibited without the written consent of UM having been first had and obtained;
(6) I am fully aware that if in the course of making this Work I have infringed any copyright whether intentionally or otherwise, I may be subject to legal action or any other action as may be determined by UM.
Candidate’s Signature Date:
Subscribed and solemnly declared before,
Witness’s Signature Date:
Name:
Designation:
Univers
ity of
Mala
ya
iii
DETERMINATION OF STEAM QUALITY AND ITS AFFECTING
PARAMETERS ON A STEAM TURBINE
ABSTRACT
More than 50% of the world’s electricity generation is coming from thermal
power plants. Thermal power plants used the heat energy from the steam exiting the boiler
to drive the turbine and cause the shaft to rotate which will generate electricity through
the generator coupled at the shaft end. The most common equipment added to the system
to improve the overall efficiency of the power plant are superheaters and reheaters.
Superheaters and reheaters basically improved the thermal efficiency by enhancing the
steam quality which means less water droplets in the steam exiting the boiler. Dry steam
is preferred to achieve a high enthalpy for higher thermal efficiency and to avoid
corrosion and erosion of the turbine blades which can lead to deteriorated thermal
efficiency over time. In this work, the steam quality will be measured along the high
energy steam flow in a small-scale steam power plant. The impact of the steam quality to
the overall performance of the power plant was also discussed. Results showed that the
steam temperature decreased as it leaves the boiler, increased when it enters the
superheater and decreased along the way between the superheater and turbine inlet. It was
also observed that the power output of turbine increased when both the boiler and turbine
inlet pressure increased.
Keyword: steam power plant, steam quality, turbine power output, efficiency
Univers
ity of
Mala
ya
iv
PENENTUAN KUALITI WAP DAN FAKTOR-FAKTOR YANG MEMBERI
KESAN PADA TURBIN WAP
ABSTRAK
Lebih daripada 50% penjanaan elektrik dunia adalah dari stesen janakuasa haba.
Stesen janakuasa haba menggunakan tenaga haba dari wap air yang keluar daripada
dandang untuk memacu turbin dan menyebabkan aci berputar yang seterusnya akan
menjana elektrik melalui penjana yang dipasang pada hujung aci. Alatan yang paling
biasa ditambah pada sistem untuk meningkatkan kecekapan keseluruhan stesen janakuasa
adalah pemanas-tinggi dan pemanas semula. Pemanas-tinggi dan pemanas-semula secara
asasnya meningkatkan kecekapan haba dengan menambahbaik kualiti wap yang mana
bermaksud kurang titisan air di dalam wap yang keluar daripada dandang. Wap kering
adalah lebih dikehendaki untuk mencapai entalpi yang tinggi bagi mendapatkan
kecekapan haba yang tinggi dan untuk mengelakkan karat dan hakisan pada bilah turbin
yang akan menyebabkan kemerosotan kecekapan haba untuk jangka panjang. Dalam
kajian ini, kualiti wap air akan ditentukan sepanjang laluan wap air bertenaga tinggi untuk
stesen janakuasa wap air berskala kecil. Kesan kualiti wap air kepada kecekapan
keseluruhan sistem juga dibincangkan. Hasil kajian menunjukkan suhu wap menurun
selepas meninggalkan dandang, menaik selepas memasuki pemanas-tinggi, dan menurun
di sepanjang laluan antara pemanas-tinggi dan masukan turbin. Pemerhatian lain ialah
kuasa yang dihasilkan oleh turbin meningkat apabila tekanan dalam dandang dan
masukan turbin meningkat.
Keywords: stesen janakuasa wap, kualiti wap, kuasa turbin, kecekapan
Univers
ity of
Mala
ya
v
ACKNOWLEDGEMENTS
First and foremost, my utmost gratefulness to Allah S.W.T for giving me the
perseverance in completing my journey of pursuing a master degree in Mechanical
Engineering.
My heartiest gratitude to my supervisor, Dr. Mohd. Zamri bin Zainon @ Baharom,
for his relentless support and guidance throughout the project.
I also revere the patronage and moral support extended with love by my mother
and also my husband, whose support and passionate encouragement made it possible for
me to complete the project.
My cordial gratitude also goes to all my friends who worked together in this
project directly and indirectly. The teamwork and guidance shared between us was what
keeping me on the right track.
Last but not least, my humble thanks to all persons who co-operated with me in
the project.
Univers
ity of
Mala
ya
vi
TABLE OF CONTENTS
Abstract ...................................................................................................................... iii
Abstrak ....................................................................................................................... iv
Acknowledgements ....................................................................................................... v
Table of Contents ......................................................................................................... vi
List of Figures............................................................................................................ viii
List of Tables ............................................................................................................... ix
List of Symbols and Abbreviations ............................................................................... x
CHAPTER 1: INTRODUCTION ............................................................................ 11
1.1 Background ....................................................................................................... 11
1.2 Problem Statement ............................................................................................. 14
1.3 Objective ........................................................................................................... 14
1.4 Scope……………………………………………………………………………..15
1.5 Organization of the Report ................................................................................. 15
CHAPTER 2: LITERATURE REVIEW ................................................................. 16
2.1 Components of a fossil-fueled steam power plant .............................................. 16
2.2 The thermodynamic cycle of a steam power plant .............................................. 17
2.3 Superheating the steam to high temperature ....................................................... 19
2.4 Definition of steam quality................................................................................. 19
2.5 Effect of steam quality to the life of turbine blade .............................................. 20
2.6 Effect of steam quality to the problem of steam/water hammer .......................... 21
2.7 Effect of turbine inlet temperature to turbine work / power output ..................... 23
2.8 Condensation of steam ....................................................................................... 25
Univers
ity of
Mala
ya
vii
CHAPTER 3: METHODOLOGY ........................................................................... 28
3.1 Experimental Setup ............................................................................................ 28
3.2 Experimental Conditions & Accuracies.............................................................. 30
CHAPTER 4: RESULTS AND DISCUSSIONS ...................................................... 31
4.1 Changes of temperature along the steam pipeline ............................................... 32
4.2 Effect of boiler and turbine inlet pressure to the steam quality ........................... 33
4.3 Effect of boiler and turbine inlet pressure to the power output of turbine ............ 34
4.4 Effect of boiler and turbine inlet pressure to mechanical efficiency of turbine .... 36
4.5 Effect of turbine inlet temperature to mechanical efficiency ............................... 37
CHAPTER 5: CONCLUSION ................................................................................. 38
References .................................................................................................................. 39
Univers
ity of
Mala
ya
viii
LIST OF FIGURES
Figure 1.1: World energy consumption by country grouping ....................................... 11
Figure 1.2: World energy consumption by energy source………………………………13
Figure 1.3: Processes in Power Generation Using Steam Power Plant…………………14
Figure 2.1: Main components of a fossil fuelled steam power plant…………………….17
Figure 2.2: Schematic diagram and T-s diagram of an ideal Rankine cycle…………….19
Figure 2.3: T-s diagram of superheated Rankine cycle………………………………….20
Figure 2.4: Schematic for the formation water droplet on steam turbine blade…….……22
Figure 2.5: Formation of slug of water in pipe………………………………….………23
Figure 2.6: Effect of turbine inlet temperature to power output of turbine……….…….24
Figure 2.7: Effect of turbine inlet temperature to thermal efficiency……………………25
Figure 2.8: Effect of turbine inlet temperature to thermal efficiency………….………..26
Figure 2.9: Comparison of fiberglass and calcium silicate as insulation material….…..27
Figure 2.10: Effect of insulation thickness to heat loss in pipe…………………………28
Figure 3.1: Configuration of the actual power plant…………………………………….29
Figure 3.2: Location of temperature measurement………………...……………………31
Figure 4.1: Temperature of steam along the steam pipeline……………………………34
Figure 4.2: Effect of boiler and turbine pressure to steam quality………………………36
Figure 4.3: Effect of boiler and turbine inlet pressure to the power output of turbine….37
Figure 4.4: Effect of boiler and turbine inlet pressure to the mechanical efficiency……38
Figure 4.5: Effect of turbine inlet temperature to turbine mechanical efficiency………39
Univers
ity of
Mala
ya
ix
LIST OF TABLES
Table 4.1: Experiment result……………………………………………………………33
Table 4.2: Temperature of steam along the steam pipeline……………………………..34
Table 4.3: Effect of boiler and turbine pressure to steam quality……………………….35
Table 4.4: Effect of boiler and turbine pressure to the power output of turbine………..37
Table 4.5: Effect of boiler and turbine pressure to the mechanical efficiency…………..38
Table 4.6: Effect of turbine inlet temperature to mechanical efficiency………………..39
Univers
ity of
Mala
ya
x
LIST OF SYMBOLS AND ABBREVIATIONS
P1 : Boiler pressure
P2 : Turbine inlet pressure
T1 : Boiler exit temperature
T2 : Superheater inlet temperature
T3 : Superheater outlet temperature
T4 : Turbine Inlet Temperature
Univers
ity of
Mala
ya
11
CHAPTER 1: INTRODUCTION
This chapter describes the background of the study, problem statement, objective,
scope, importance of the project, and organization of the report.
1.1 Background
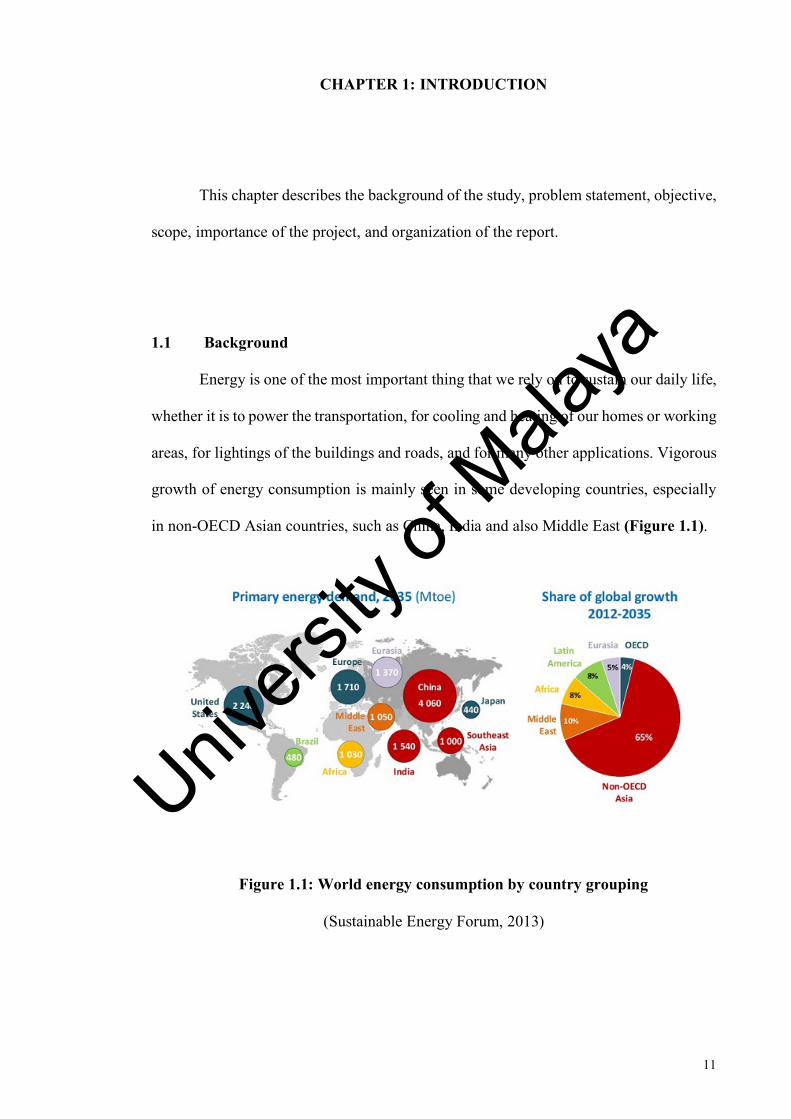
Energy is one of the most important thing that we rely on to sustain our daily life,
whether it is to power the transportation, for cooling and heating of our homes or working
areas, for lightings of the buildings and roads, and for many other applications. Vigorous
growth of energy consumption is mainly seen in some developing countries, especially
in non-OECD Asian countries, such as China, India and also Middle East (Figure 1.1).
Figure 1.1: World energy consumption by country grouping
(Sustainable Energy Forum, 2013)
Univers
ity of
Mala
ya
12
However, the concerns on the depletion of non-renewable energy resources and
the impact of energy production and consumption to the environment has becoming
increasingly threatening since the last three decades and has led the world to come to a
global long-term agreement, which is called Paris Agreement, to set the global warming
to below 2°C to avoid dangerous climate change should actions are not taken immediately
(Cozzi et al., 2015).
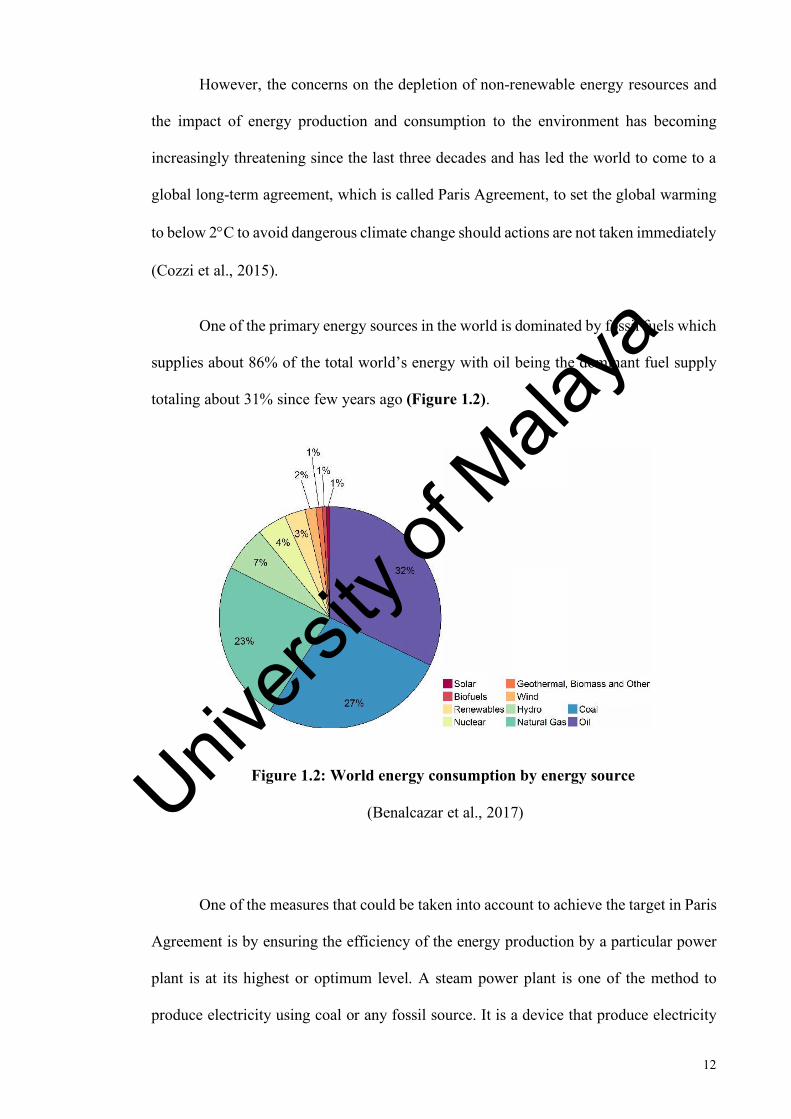
One of the primary energy sources in the world is dominated by fossil fuels which
supplies about 86% of the total world’s energy with oil being the dominant fuel supply
totaling about 31% since few years ago (Figure 1.2).
Figure 1.2: World energy consumption by energy source
(Benalcazar et al., 2017)
One of the measures that could be taken into account to achieve the target in Paris
Agreement is by ensuring the efficiency of the energy production by a particular power
plant is at its highest or optimum level. A steam power plant is one of the method to
produce electricity using coal or any fossil source. It is a device that produce electricity
Univers
ity of
Mala
ya
13
by converting the heat energy from the pressurized water to mechanical energy through
the rotational movement of the output shaft. The turbine is driven by the high-pressure
steam from the water which is heated by several means and using various sources of fuels
such as by the burning of fossil fuels (petroleum, natural gas, coal), geothermal power,
nuclear fission and also using heat from the solar energy.
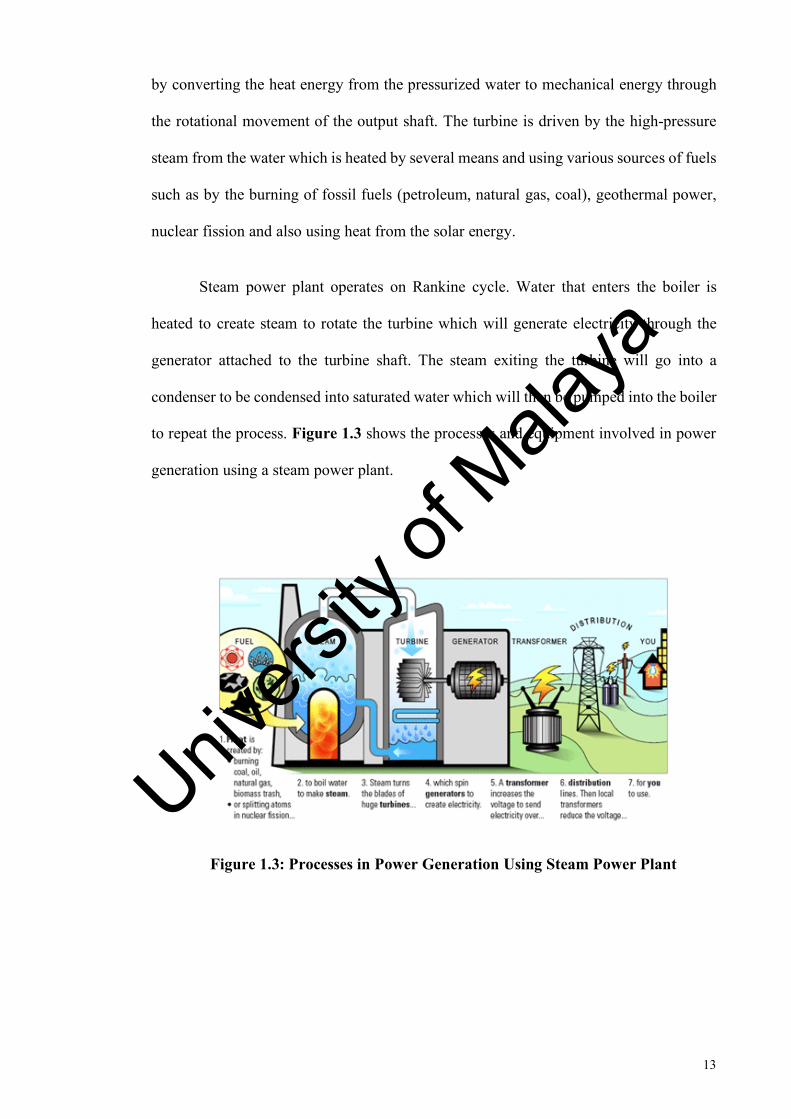
Steam power plant operates on Rankine cycle. Water that enters the boiler is
heated to create steam to rotate the turbine which will generate electricity through the
generator attached to the turbine shaft. The steam exiting the turbine will go into a
condenser to be condensed into saturated water which will then be pumped into the boiler
to repeat the process. Figure 1.3 shows the processes and equipment involved in power
generation using a steam power plant.
Figure 1.3: Processes in Power Generation Using Steam Power Plant
Univers
ity of
Mala
ya
14
1.2 Problem Statement
Although there are already numerous researches and works on power generation
using renewable energies, there is still a need for the operator of the non-renewable power
plant to play their role in addressing the concern on global warming and the depletion of
fossil fuel source since the majority of power generation worldwide still rely on fossil
fuels. One of the ways is by improving the overall efficiency of a steam power plant
which can be achieved by making sure that the steam along the pipeline before entering
the turbine is maintained at high quality so that more kinetic energy will be transferred to
the turbine for higher power generation at higher overall efficiency.
1.3 Objective
The objectives of the project are:
i. To study the steam condensation or the steam temperature changes along the
pipeline between the boiler and the turbine
ii. To study the effect of boiler and turbine pressure to steam quality, power output
of turbine & mechanical efficiency of turbine
iii. To study the effect of turbine inlet temperature to turbine mechanical efficiency
Univers
ity of
Mala
ya
15
1.4 Scope
The scope of the project acts as a guideline to ensure the project is conducted
within its intended boundary. The scopes are as follows:
i. Steam flow in the power plant will be until the turbine section with the valve
for the steam flow to the condenser closed and the steam released to the
atmosphere
ii. The power plant is considered as an experimental small-scaled plant therefore
the result may not be compared to full-scaled power plant
iii. Changes of steam quality is due to energy loss and condensation along the
piping system.
1.5 Organization of the Report
This report consists of six chapters. Chapter 1 is Introduction that describes
introduction to the study, problem statement, objectives, scopes, and the organization of
the report. Chapter 2 is the Literature Review section that describes the literature relevant
to the topic of study which is the behavior of steam along the pipeline and its effect on
the performance of the power plant, which include relevant and recent publications of
works that states the information on theories, techniques and findings of the work.
Chapter 3 is the Methodology section which describes the procedure of the experiments,
the parameter involved and any related information regarding the experiment that is used
to obtain the results and generate the findings of the report. Chapter 4 is the Results and
Discussion section that contains all the results obtained from the experiments which is
presented in tables and figures, along with the data analysis which discussed the
experiment result and also compared the findings with previous study and the theories
presented in the literature review. Chapter 5 is the Conclusion section that summarized
the findings from the study and also some recommendations for future work.
Univers
ity of
Mala
ya
16
CHAPTER 2: LITERATURE REVIEW
2.1 Components of a fossil-fueled steam power plant
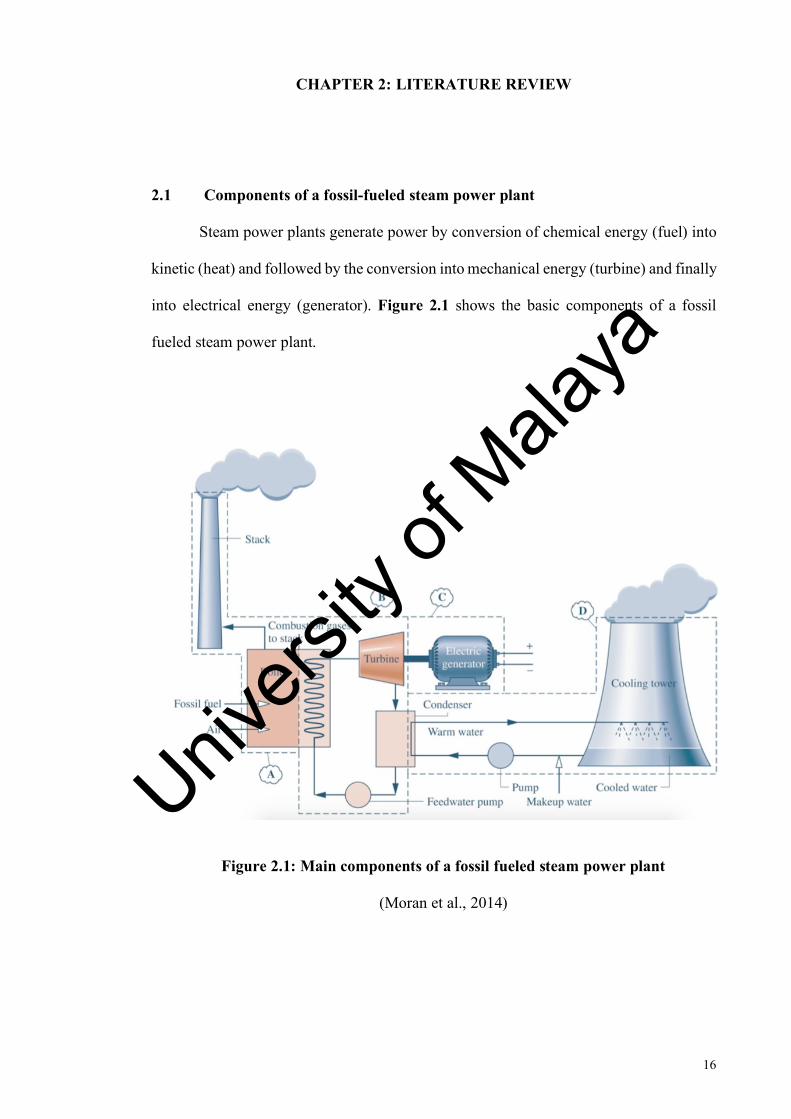
Steam power plants generate power by conversion of chemical energy (fuel) into
kinetic (heat) and followed by the conversion into mechanical energy (turbine) and finally
into electrical energy (generator). Figure 2.1 shows the basic components of a fossil
fueled steam power plant.
Figure 2.1: Main components of a fossil fueled steam power plant
(Moran et al., 2014)
Univers
ity of
Mala
ya
17
The power plant components can be divided into four sub-systems which can be
represented as a sub-system by the letter A, B, C and D. The function of sub-system A is
to supply the energy required to vaporize the working fluid used in the power plant. In
this sub-system A, the working fluid, which is usually the water, is heated up by the
combustion of the fuel to turn it into vapor which is then will be directed towards the
turbine (sub-system B) to generate energy. The turbine is connected to an electric
generator (sub-system C) with a shaft to convert the mechanical energy of the turbine into
electrical energy. After the expansion process in the turbine, the steam will be condensed
in the condenser by releasing heat to the cooling system. The cooling water that has
absorbed heat from the steam in the condenser will be transferred to the cooling tower to
be cooled again by releasing the heat to the atmosphere and will return back to the
condenser to repeat the cooling process. Finally, the cooled steam which has turned into
condensate will be pumped back into the boiler to repeat the process of generating power
(Moran et al., 2014).
2.2 The thermodynamic cycle of a steam power plant
The fundamentals for the thermodynamic analysis of a power plant include the
principles of conservation of mass and energy, and the second law of thermodynamics
which apply to each component of the power plant such as the pumps, turbine, heat
exchanger, as well as the overall power plant.
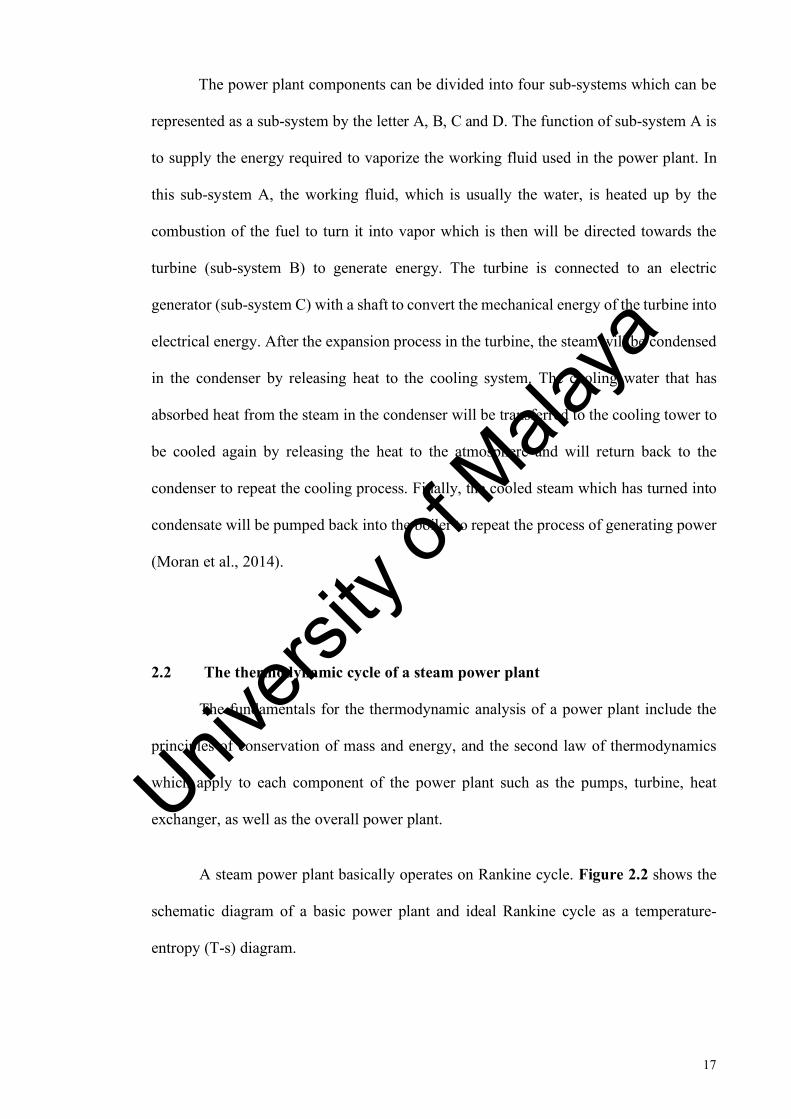
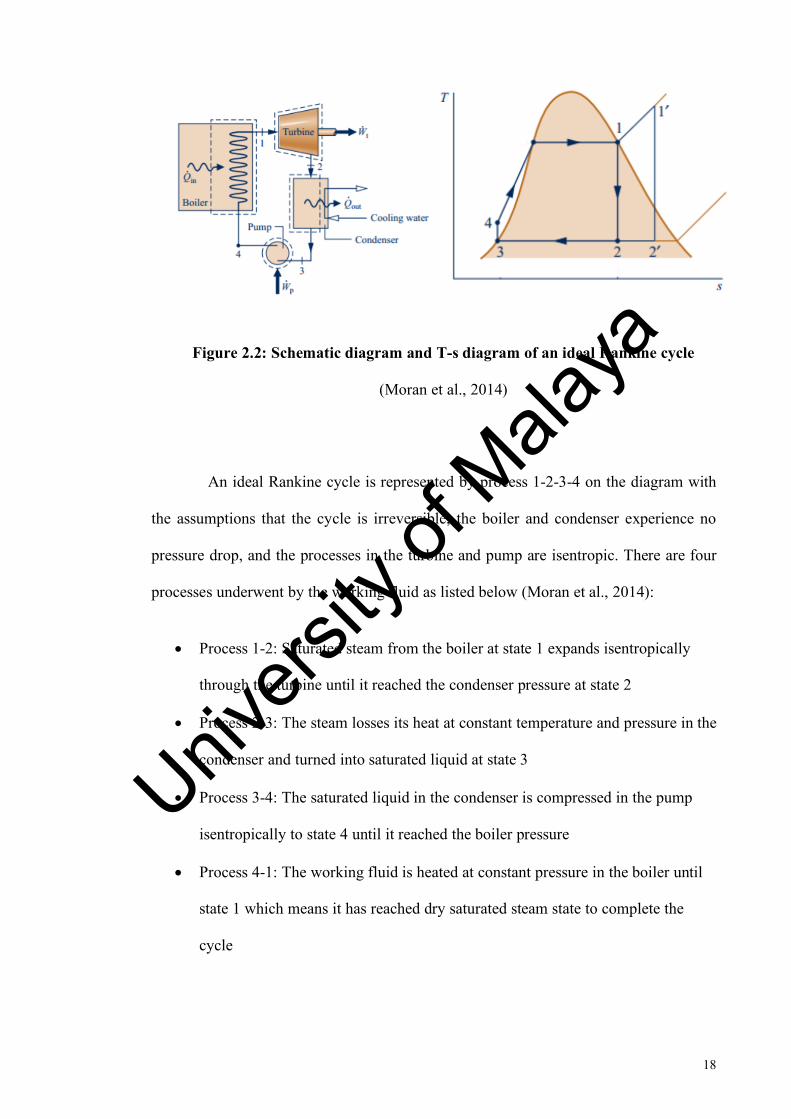
A steam power plant basically operates on Rankine cycle. Figure 2.2 shows the
schematic diagram of a basic power plant and ideal Rankine cycle as a temperature-
entropy (T-s) diagram.
Univers
ity of
Mala
ya
18
Figure 2.2: Schematic diagram and T-s diagram of an ideal Rankine cycle
(Moran et al., 2014)
An ideal Rankine cycle is represented by process 1-2-3-4 on the diagram with
the assumptions that the cycle is irreversible, the boiler and condenser experience no
pressure drop, and the processes in the turbine and pump are isentropic. There are four
processes underwent by the working fluid as listed below (Moran et al., 2014):
• Process 1-2: Saturated steam from the boiler at state 1 expands isentropically
through the turbine until it reached the condenser pressure at state 2
• Process 2-3: The steam losses its heat at constant temperature and pressure in the
condenser and turned into saturated liquid at state 3
• Process 3-4: The saturated liquid in the condenser is compressed in the pump
isentropically to state 4 until it reached the boiler pressure
• Process 4-1: The working fluid is heated at constant pressure in the boiler until
state 1 which means it has reached dry saturated steam state to complete the
cycle
Univers
ity of
Mala
ya
19
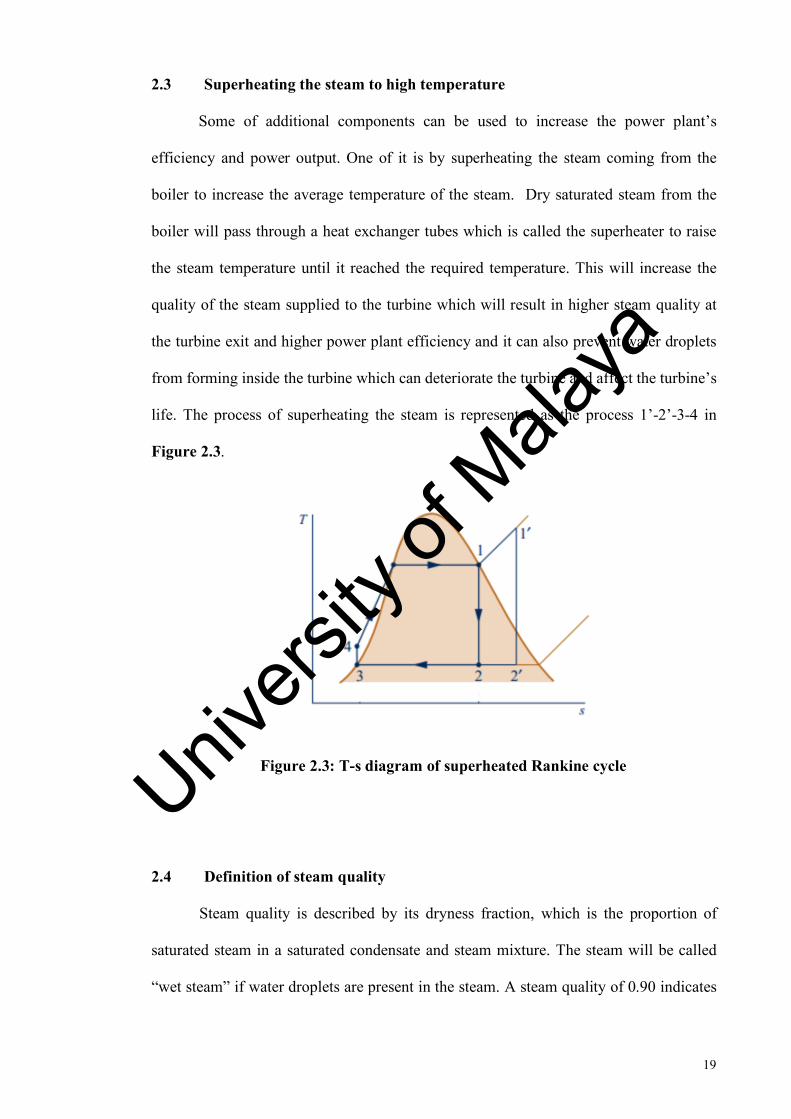
2.3 Superheating the steam to high temperature
Some of additional components can be used to increase the power plant’s
efficiency and power output. One of it is by superheating the steam coming from the
boiler to increase the average temperature of the steam. Dry saturated steam from the
boiler will pass through a heat exchanger tubes which is called the superheater to raise
the steam temperature until it reached the required temperature. This will increase the
quality of the steam supplied to the turbine which will result in higher steam quality at
the turbine exit and higher power plant efficiency and it can also prevent water droplets
from forming inside the turbine which can deteriorate the turbine and affect the turbine’s
life. The process of superheating the steam is represented as the process 1’-2’-3-4 in
Figure 2.3.
Figure 2.3: T-s diagram of superheated Rankine cycle
2.4 Definition of steam quality
Steam quality is described by its dryness fraction, which is the proportion of
saturated steam in a saturated condensate and steam mixture. The steam will be called
“wet steam” if water droplets are present in the steam. A steam quality of 0.90 indicates
Univers
ity of
Mala
ya
20
a mixture of 90% steam and 10% of liquid. The formula to determine the dryness fraction
is as shown below (Merritt, 2015):
𝐷𝑟𝑦𝑛𝑒𝑠𝑠𝑓𝑟𝑎𝑐𝑡𝑖𝑜𝑛, 𝑥 =𝑀𝑎𝑠𝑠𝑜𝑓𝑠𝑡𝑒𝑎𝑚,𝑚3
𝑀𝑎𝑠𝑠𝑜𝑓𝑠𝑡𝑒𝑎𝑚,𝑚3 +𝑀𝑎𝑠𝑠𝑜𝑓𝑤𝑎𝑡𝑒𝑟,𝑚6
Temperature, pressure and entrained liquid content need to be measured in order
to obtain the steam quality value. The higher the temperature, the more energy which is
called latent heat is carried by the steam which will result in faster rotation of turbine.
2.5 Effect of steam quality to the life of turbine blade
There have been many researches on water droplet erosion of steam turbine blade
in the past few decades. Continuous research efforts have been made to attempt to
mitigate the impact of this complex phenomenon. The problem of water droplet erosion
is encountered by many industries dealing with steam pipeline which include
pharmaceutical industries on the pipeline connections and elbows for its sterilization
steam line and also power generation industry using steam turbine. In steam turbine, the
last turbine or the low-pressure turbine blades are the one that will be most affected by
the mist droplets that were formed during steam expansion process (Lee et al., 2003). The
schematic for the formation of water droplets that leads to erosion of steam turbine blade
is shown in Figure 2.4.
Univers
ity of
Mala
ya
21
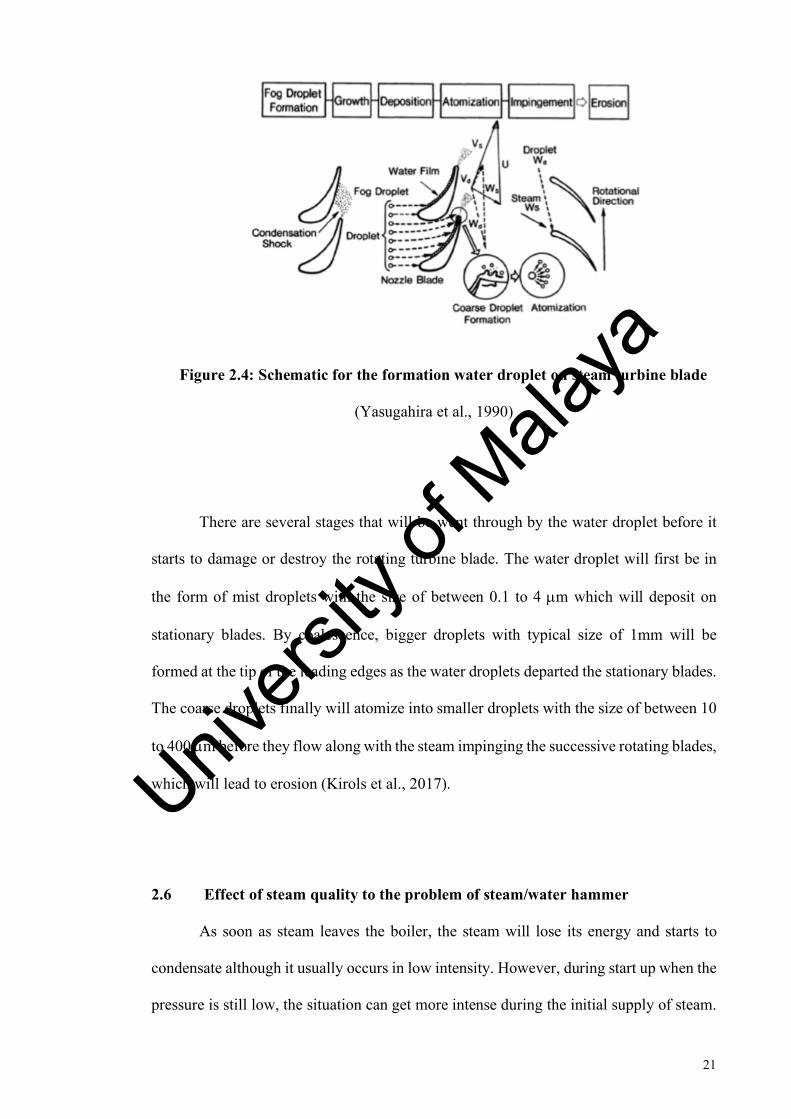
Figure 2.4: Schematic for the formation water droplet on steam turbine blade
(Yasugahira et al., 1990)
There are several stages that will be went through by the water droplet before it
starts to damage or destroy the rotating turbine blade. The water droplet will first be in
the form of mist droplets with the size of between 0.1 to 4 µm which will deposit on
stationary blades. By coalescence, bigger droplets with typical size of 1mm will be
formed at the tip of the leading edges as the water droplets departed the stationary blades.
The coarse droplets finally will atomize into smaller droplets with the size of between 10
to 400 µm before they flow along with the steam impinging the successive rotating blades,
which will lead to erosion (Kirols et al., 2017).
2.6 Effect of steam quality to the problem of steam/water hammer
As soon as steam leaves the boiler, the steam will lose its energy and starts to
condensate although it usually occurs in low intensity. However, during start up when the
pressure is still low, the situation can get more intense during the initial supply of steam.
Univers
ity of
Mala
ya
22
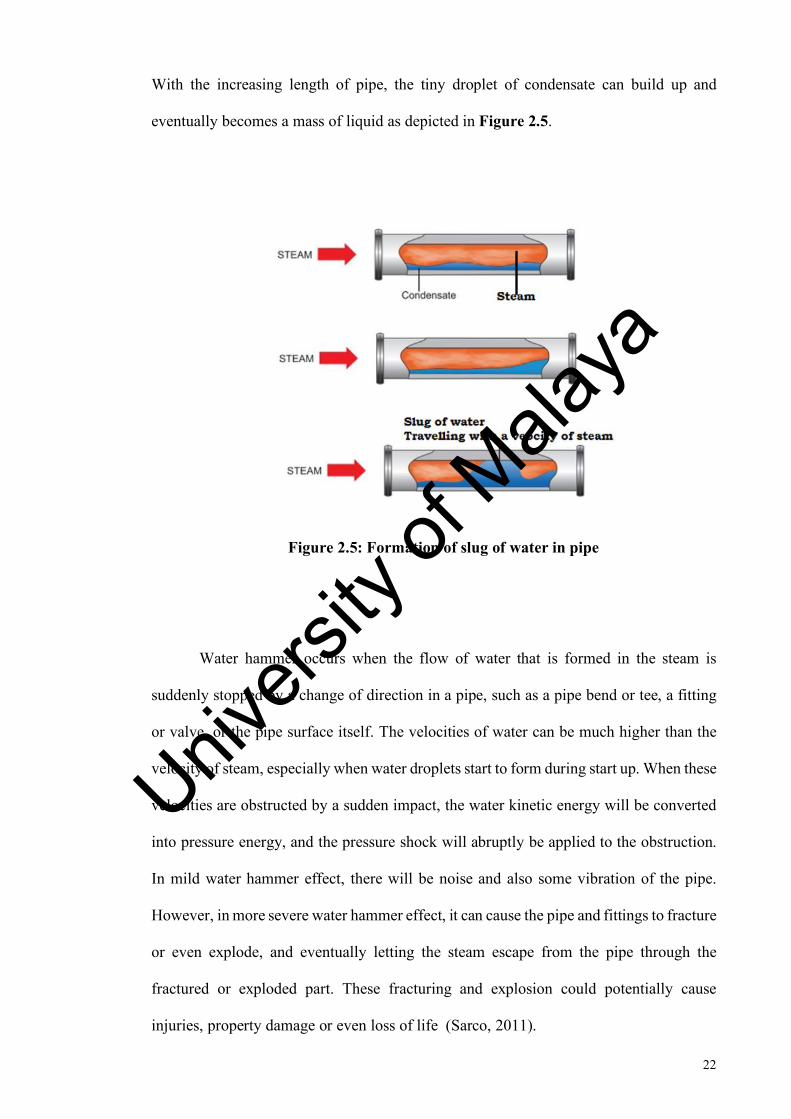
With the increasing length of pipe, the tiny droplet of condensate can build up and
eventually becomes a mass of liquid as depicted in Figure 2.5.
Figure 2.5: Formation of slug of water in pipe
Water hammer occurs when the flow of water that is formed in the steam is
suddenly stopped by a change of direction in a pipe, such as a pipe bend or tee, a fitting
or valve, or the pipe surface itself. The velocities of water can be much higher than the
velocity of steam, especially when water droplets start to form during start up. When these
velocities are obstructed by a sudden impact, the water kinetic energy will be converted
into pressure energy, and the pressure shock will abruptly be applied to the obstruction.
In mild water hammer effect, there will be noise and also some vibration of the pipe.
However, in more severe water hammer effect, it can cause the pipe and fittings to fracture
or even explode, and eventually letting the steam escape from the pipe through the
fractured or exploded part. These fracturing and explosion could potentially cause
injuries, property damage or even loss of life (Sarco, 2011).
Univers
ity of
Mala
ya
23
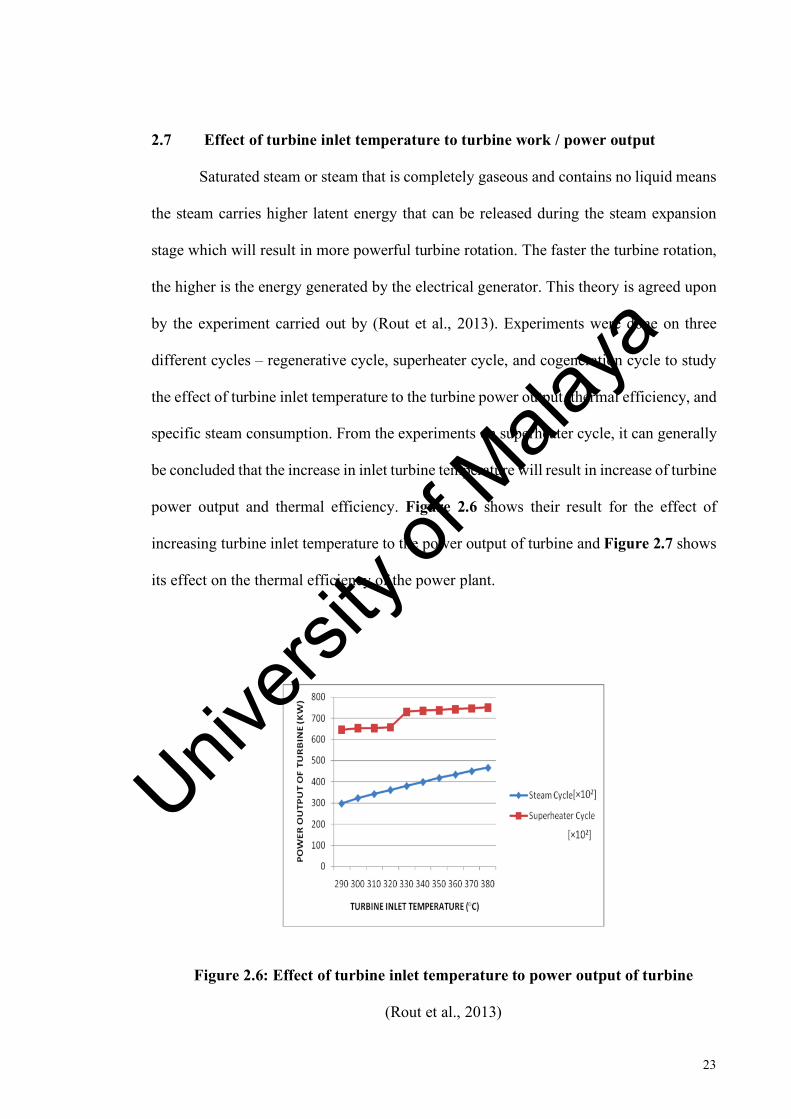
2.7 Effect of turbine inlet temperature to turbine work / power output
Saturated steam or steam that is completely gaseous and contains no liquid means
the steam carries higher latent energy that can be released during the steam expansion
stage which will result in more powerful turbine rotation. The faster the turbine rotation,
the higher is the energy generated by the electrical generator. This theory is agreed upon
by the experiment carried out by (Rout et al., 2013). Experiments were done on three
different cycles – regenerative cycle, superheater cycle, and cogeneration cycle to study
the effect of turbine inlet temperature to the turbine power output, thermal efficiency, and
specific steam consumption. From the experiments on superheater cycle, it can generally
be concluded that the increase in inlet turbine temperature will result in increase of turbine
power output and thermal efficiency. Figure 2.6 shows their result for the effect of
increasing turbine inlet temperature to the power output of turbine and Figure 2.7 shows
its effect on the thermal efficiency of the power plant.
Figure 2.6: Effect of turbine inlet temperature to power output of turbine
(Rout et al., 2013)
Univers
ity of
Mala
ya
24
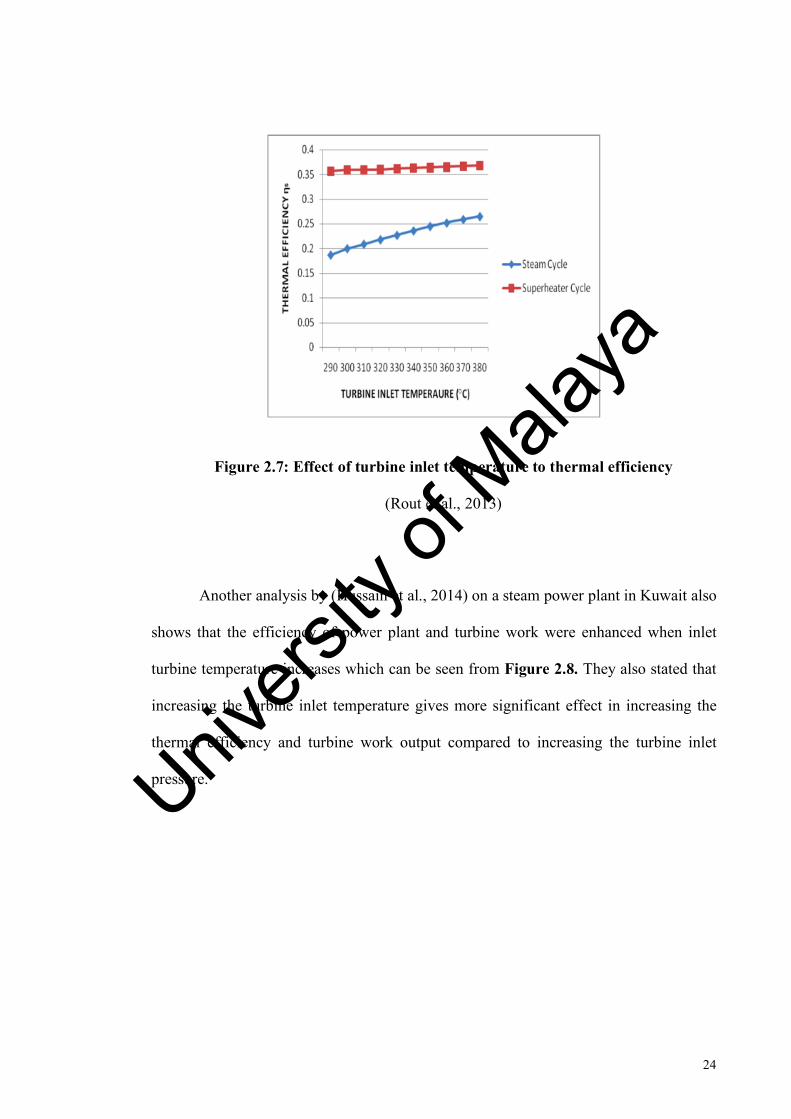
Figure 2.7: Effect of turbine inlet temperature to thermal efficiency
(Rout et al., 2013)
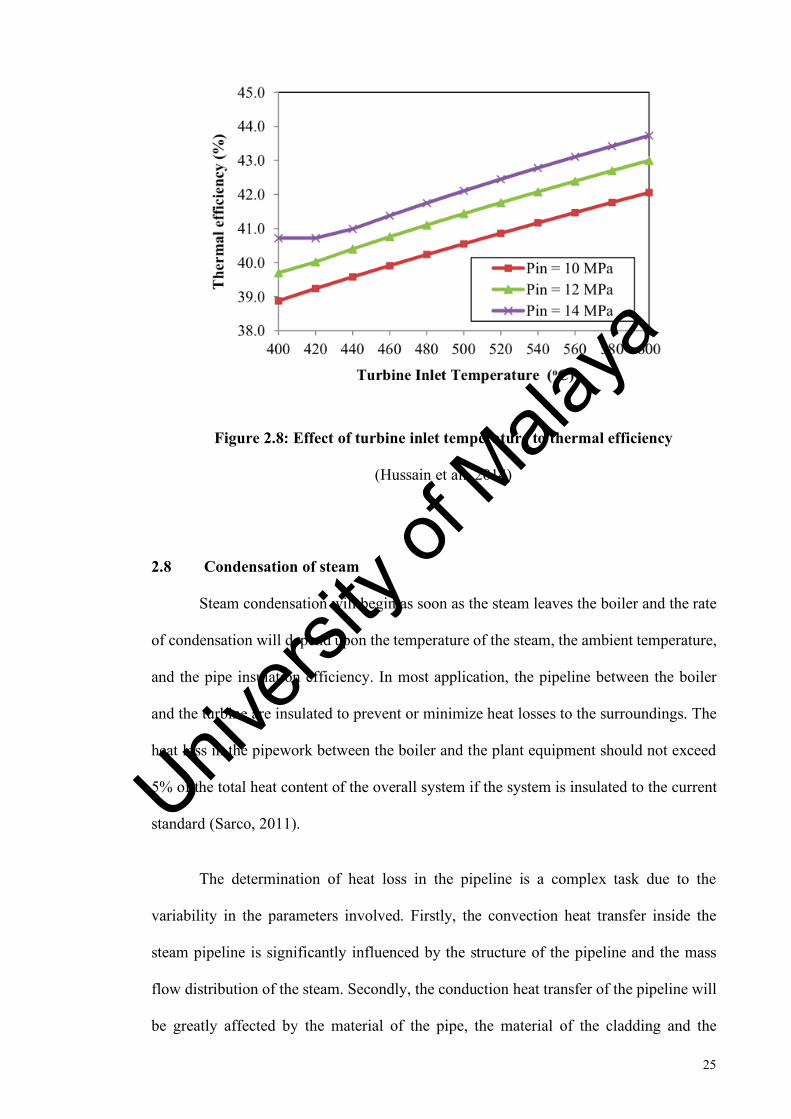
Another analysis by (Hussain et al., 2014) on a steam power plant in Kuwait also
shows that the efficiency of power plant and turbine work were enhanced when inlet
turbine temperature increases which can be seen from Figure 2.8. They also stated that
increasing the turbine inlet temperature gives more significant effect in increasing the
thermal efficiency and turbine work output compared to increasing the turbine inlet
pressure. Univers
ity of
Mala
ya
25
Figure 2.8: Effect of turbine inlet temperature to thermal efficiency
(Hussain et al., 2014)
2.8 Condensation of steam
Steam condensation will begin as soon as the steam leaves the boiler and the rate
of condensation will depend upon the temperature of the steam, the ambient temperature,
and the pipe insulation efficiency. In most application, the pipeline between the boiler
and the turbine are insulated to prevent or minimize heat losses to the surroundings. The
heat loss in the pipework between the boiler and the plant equipment should not exceed
5% of the total heat content of the overall system if the system is insulated to the current
standard (Sarco, 2011).
The determination of heat loss in the pipeline is a complex task due to the
variability in the parameters involved. Firstly, the convection heat transfer inside the
steam pipeline is significantly influenced by the structure of the pipeline and the mass
flow distribution of the steam. Secondly, the conduction heat transfer of the pipeline will
be greatly affected by the material of the pipe, the material of the cladding and the
Univers
ity of
Mala
ya
26
insulation on the pipeline. Thirdly, the convection heat transfer outside the pipeline will
be influenced by the variable condition of the environment (Zhu et al., 2013).
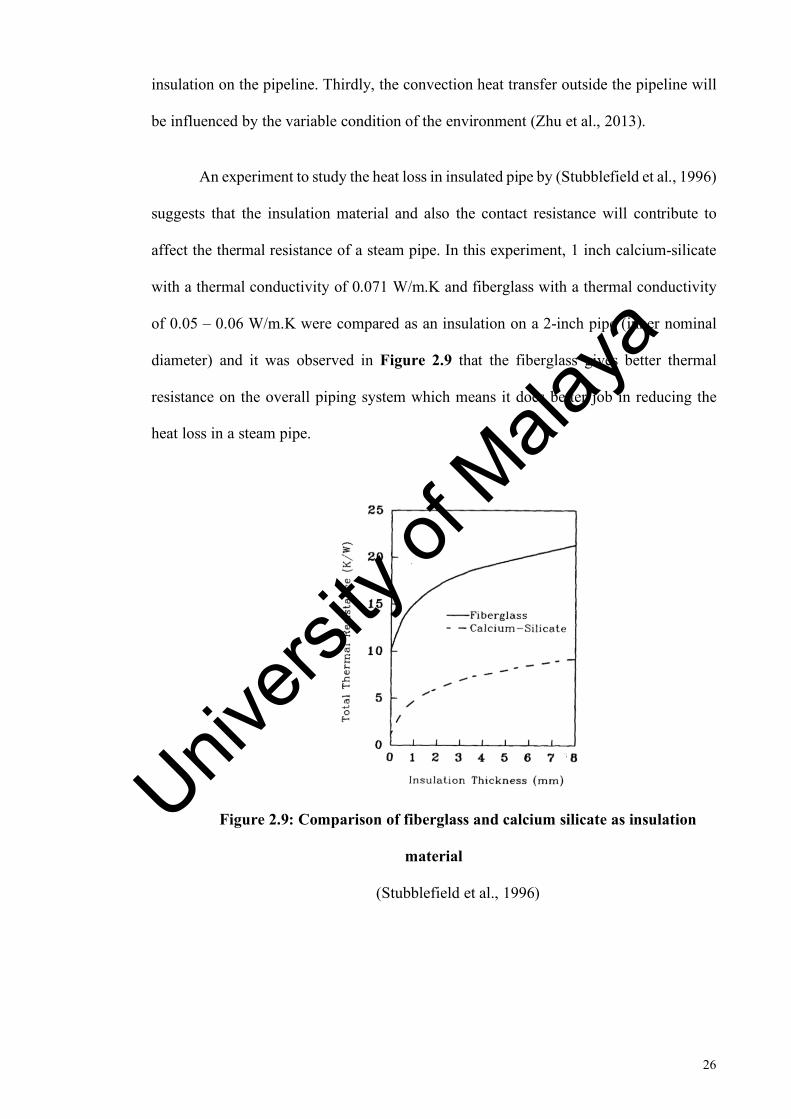
An experiment to study the heat loss in insulated pipe by (Stubblefield et al., 1996)
suggests that the insulation material and also the contact resistance will contribute to
affect the thermal resistance of a steam pipe. In this experiment, 1 inch calcium-silicate
with a thermal conductivity of 0.071 W/m.K and fiberglass with a thermal conductivity
of 0.05 – 0.06 W/m.K were compared as an insulation on a 2-inch pipe (inner nominal
diameter) and it was observed in Figure 2.9 that the fiberglass gives better thermal
resistance on the overall piping system which means it does better job in reducing the
heat loss in a steam pipe.
Figure 2.9: Comparison of fiberglass and calcium silicate as insulation
material
(Stubblefield et al., 1996)
Univers
ity of
Mala
ya
27
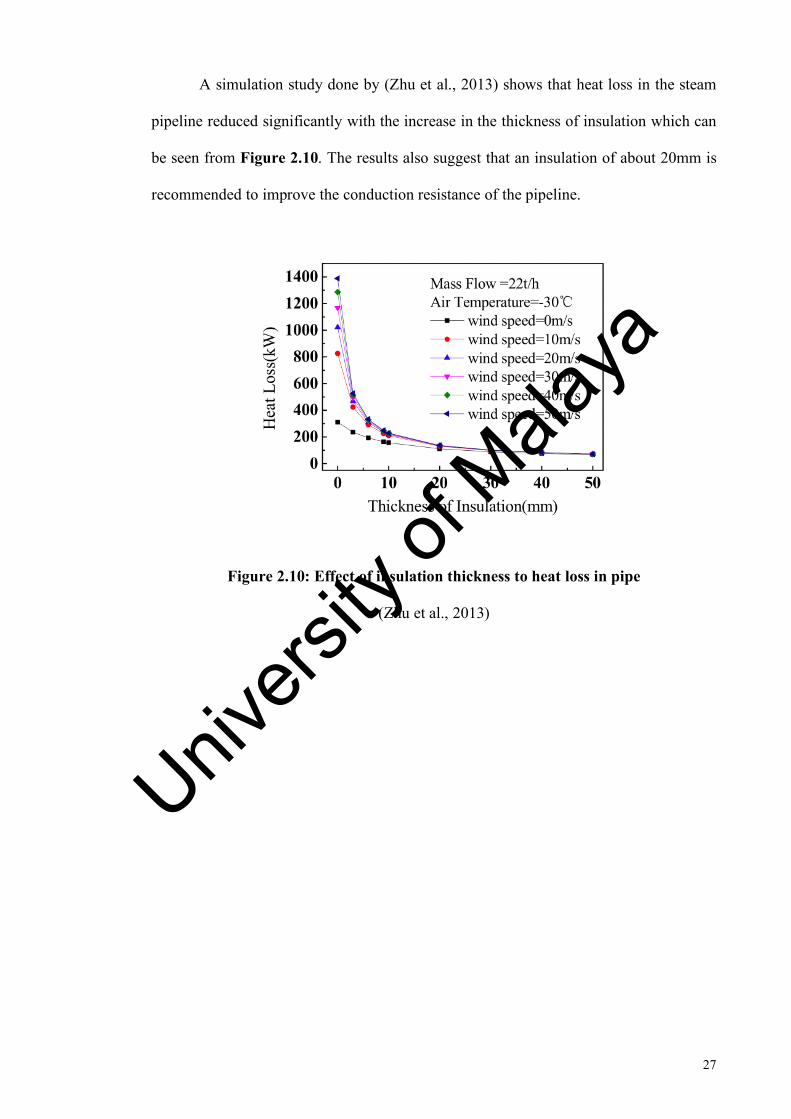
A simulation study done by (Zhu et al., 2013) shows that heat loss in the steam
pipeline reduced significantly with the increase in the thickness of insulation which can
be seen from Figure 2.10. The results also suggest that an insulation of about 20mm is
recommended to improve the conduction resistance of the pipeline.
Figure 2.10: Effect of insulation thickness to heat loss in pipe
(Zhu et al., 2013)
Univers
ity of
Mala
ya
28
CHAPTER 3: METHODOLOGY
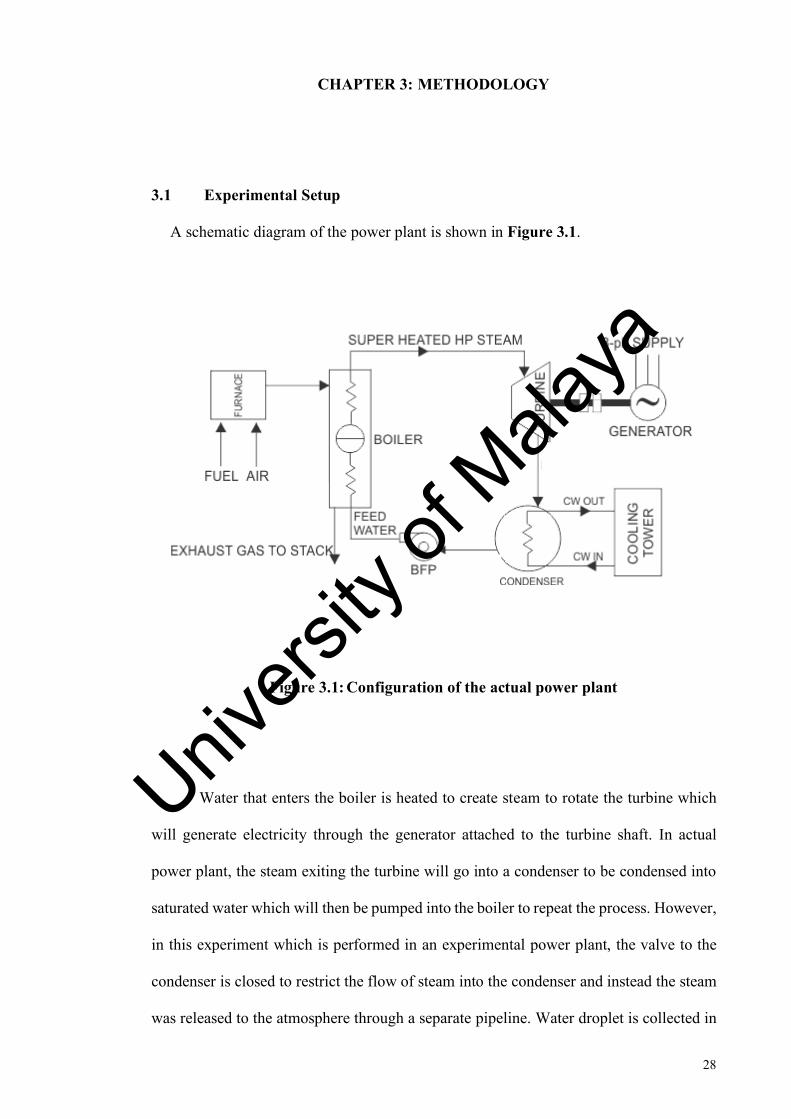
3.1 Experimental Setup
A schematic diagram of the power plant is shown in Figure 3.1.
Figure 3.1: Configuration of the actual power plant
Water that enters the boiler is heated to create steam to rotate the turbine which
will generate electricity through the generator attached to the turbine shaft. In actual
power plant, the steam exiting the turbine will go into a condenser to be condensed into
saturated water which will then be pumped into the boiler to repeat the process. However,
in this experiment which is performed in an experimental power plant, the valve to the
condenser is closed to restrict the flow of steam into the condenser and instead the steam
was released to the atmosphere through a separate pipeline. Water droplet is collected in
Univers
ity of
Mala
ya
29
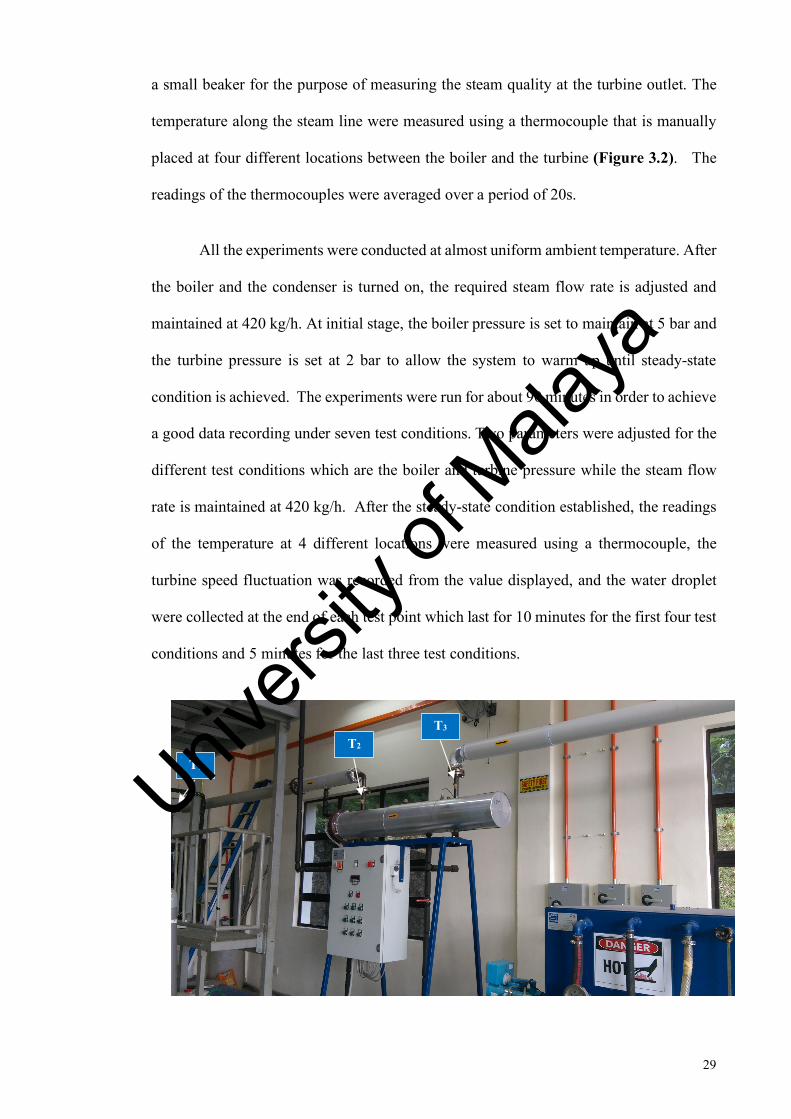
a small beaker for the purpose of measuring the steam quality at the turbine outlet. The
temperature along the steam line were measured using a thermocouple that is manually
placed at four different locations between the boiler and the turbine (Figure 3.2). The
readings of the thermocouples were averaged over a period of 20s.
All the experiments were conducted at almost uniform ambient temperature. After
the boiler and the condenser is turned on, the required steam flow rate is adjusted and
maintained at 420 kg/h. At initial stage, the boiler pressure is set to maintain at 5 bar and
the turbine pressure is set at 2 bar to allow the system to warm up until steady-state
condition is achieved. The experiments were run for about 90 minutes in order to achieve
a good data recording under seven test conditions. Two parameters were adjusted for the
different test conditions which are the boiler and turbine pressure while the steam flow
rate is maintained at 420 kg/h. After the steady-state condition established, the readings
of the temperature at 4 different locations were measured using a thermocouple, the
turbine speed fluctuation was recorded from the value displayed, and the water droplet
were collected at the end of each test point which last for 10 minutes for the first four test
conditions and 5 minutes for the last three test conditions.
T1 T2
T3
Univers
ity of
Mala
ya
30
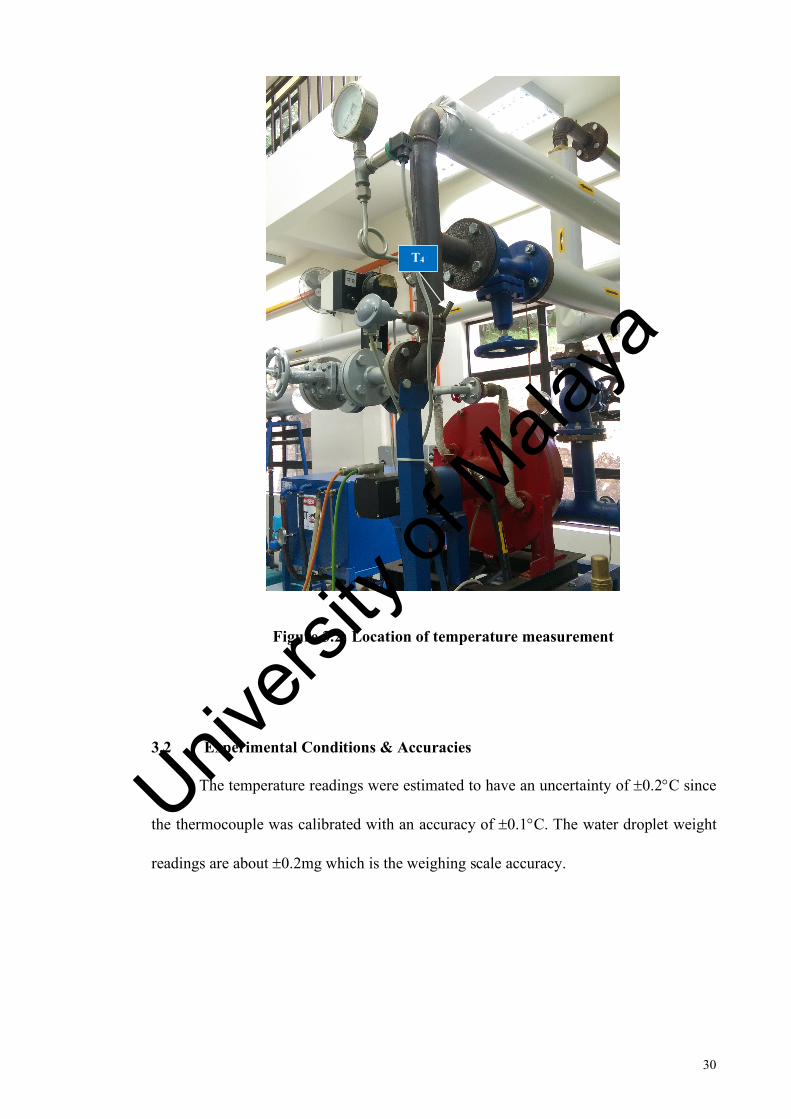
Figure 3.2: Location of temperature measurement
3.2 Experimental Conditions & Accuracies
The temperature readings were estimated to have an uncertainty of ±0.2°C since
the thermocouple was calibrated with an accuracy of ±0.1°C. The water droplet weight
readings are about ±0.2mg which is the weighing scale accuracy.
T4
Univers
ity of
Mala
ya
31
CHAPTER 4: RESULTS AND DISCUSSIONS
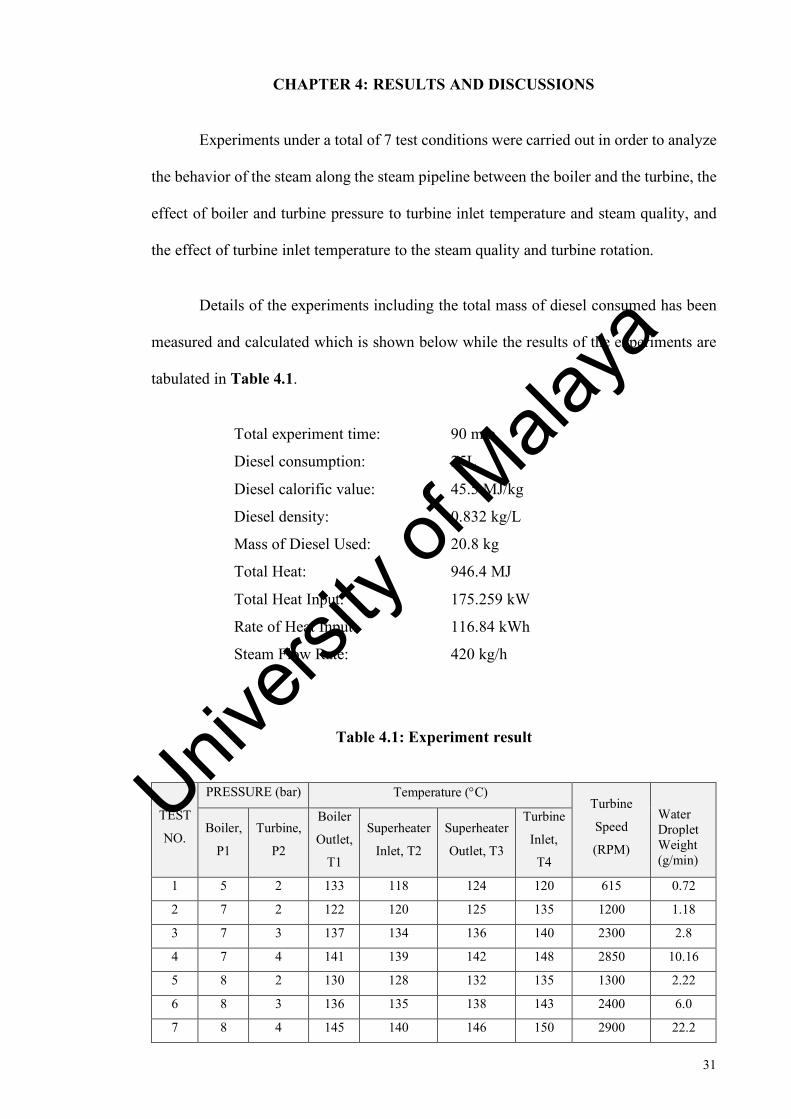
Experiments under a total of 7 test conditions were carried out in order to analyze
the behavior of the steam along the steam pipeline between the boiler and the turbine, the
effect of boiler and turbine pressure to turbine inlet temperature and steam quality, and
the effect of turbine inlet temperature to the steam quality and turbine rotation.
Details of the experiments including the total mass of diesel consumed has been
measured and calculated which is shown below while the results of the experiments are
tabulated in Table 4.1.
Total experiment time: 90 min
Diesel consumption: 25L
Diesel calorific value: 45.5 MJ/kg
Diesel density: 0.832 kg/L
Mass of Diesel Used: 20.8 kg
Total Heat: 946.4 MJ
Total Heat Input: 175.259 kW
Rate of Heat Input: 116.84 kWh
Steam Flow Rate: 420 kg/h
Table 4.1: Experiment result
TEST
NO.
PRESSURE (bar) Temperature (°C) Turbine
Speed
(RPM)
Water Droplet Weight (g/min)
Boiler,
P1
Turbine,
P2
Boiler
Outlet,
T1
Superheater
Inlet, T2
Superheater
Outlet, T3
Turbine
Inlet,
T4
1 5 2 133 118 124 120 615 0.72
2 7 2 122 120 125 135 1200 1.18
3 7 3 137 134 136 140 2300 2.8
4 7 4 141 139 142 148 2850 10.16
5 8 2 130 128 132 135 1300 2.22
6 8 3 136 135 138 143 2400 6.0
7 8 4 145 140 146 150 2900 22.2
Univers
ity of
Mala
ya
32
4.1 Changes of temperature along the steam pipeline
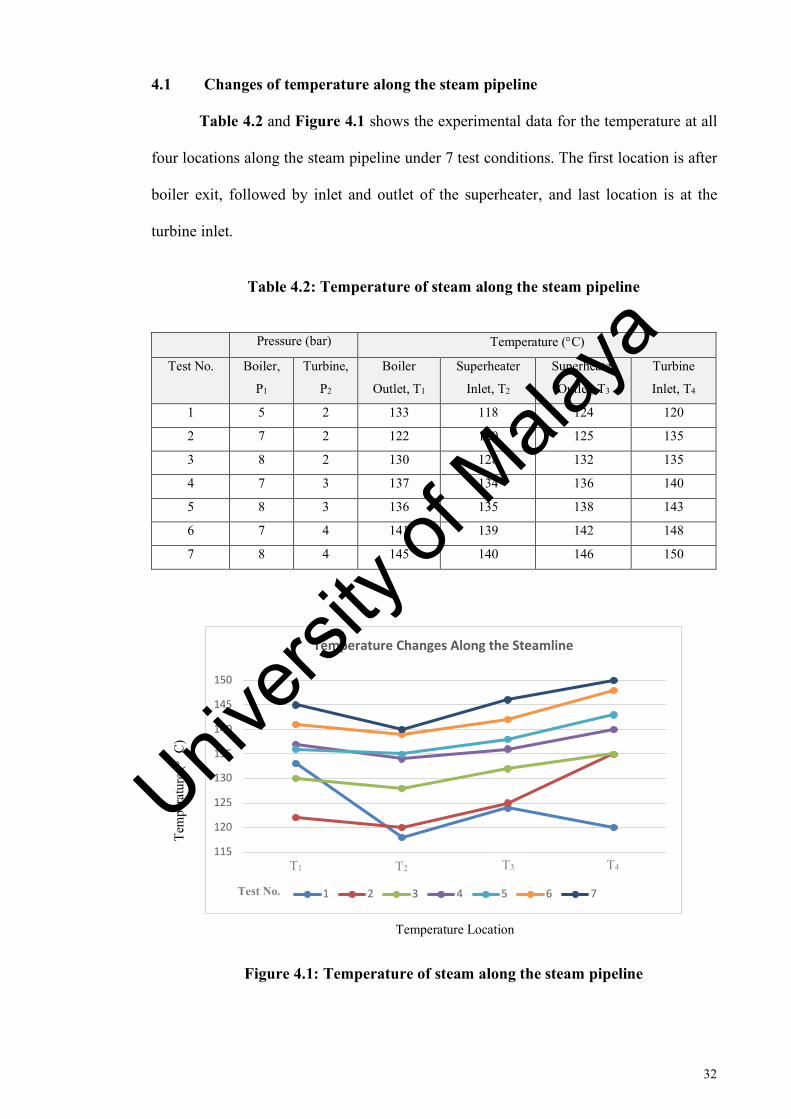
Table 4.2 and Figure 4.1 shows the experimental data for the temperature at all
four locations along the steam pipeline under 7 test conditions. The first location is after
boiler exit, followed by inlet and outlet of the superheater, and last location is at the
turbine inlet.
Table 4.2: Temperature of steam along the steam pipeline
Pressure (bar) Temperature (°C)
Test No. Boiler,
P1
Turbine,
P2
Boiler
Outlet, T1
Superheater
Inlet, T2
Superheater
Outlet, T3
Turbine
Inlet, T4
1 5 2 133 118 124 120
2 7 2 122 120 125 135
3 8 2 130 128 132 135
4 7 3 137 134 136 140
5 8 3 136 135 138 143
6 7 4 141 139 142 148
7 8 4 145 140 146 150
Figure 4.1: Temperature of steam along the steam pipeline
115
120
125
130
135
140
145
150
1 2 3 4
Temperature Changes Along the Steamline
1 2 3 4 5 6 7
T1 T2 T3 T4
Test No.
Tem
pera
ture
( °C
)
Temperature Location
Univers
ity of
Mala
ya
33
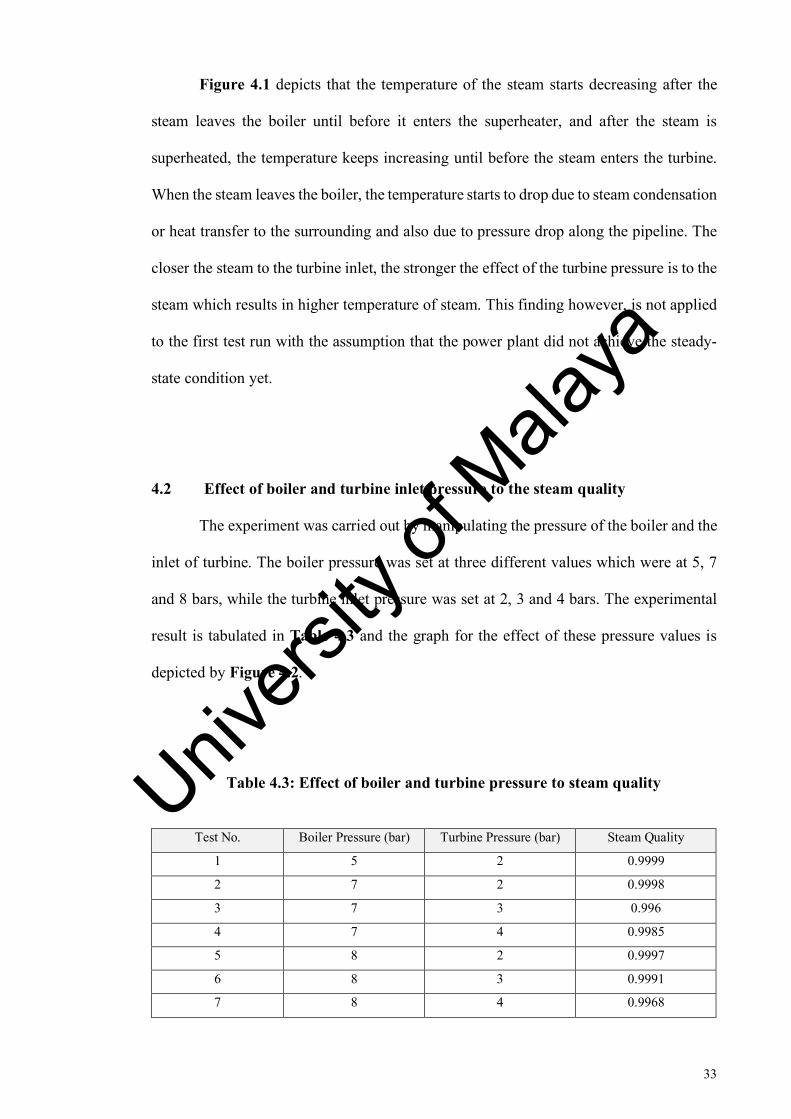
Figure 4.1 depicts that the temperature of the steam starts decreasing after the
steam leaves the boiler until before it enters the superheater, and after the steam is
superheated, the temperature keeps increasing until before the steam enters the turbine.
When the steam leaves the boiler, the temperature starts to drop due to steam condensation
or heat transfer to the surrounding and also due to pressure drop along the pipeline. The
closer the steam to the turbine inlet, the stronger the effect of the turbine pressure is to the
steam which results in higher temperature of steam. This finding however, is not applied
to the first test run with the assumption that the power plant did not achieve the steady-
state condition yet.
4.2 Effect of boiler and turbine inlet pressure to the steam quality
The experiment was carried out by manipulating the pressure of the boiler and the
inlet of turbine. The boiler pressure was set at three different values which were at 5, 7
and 8 bars, while the turbine inlet pressure was set at 2, 3 and 4 bars. The experimental
result is tabulated in Table 4.3 and the graph for the effect of these pressure values is
depicted by Figure 4.2.
Table 4.3: Effect of boiler and turbine pressure to steam quality
Test No. Boiler Pressure (bar) Turbine Pressure (bar) Steam Quality
1 5 2 0.9999
2 7 2 0.9998
3 7 3 0.996
4 7 4 0.9985
5 8 2 0.9997
6 8 3 0.9991
7 8 4 0.9968
Univers
ity of
Mala
ya
34
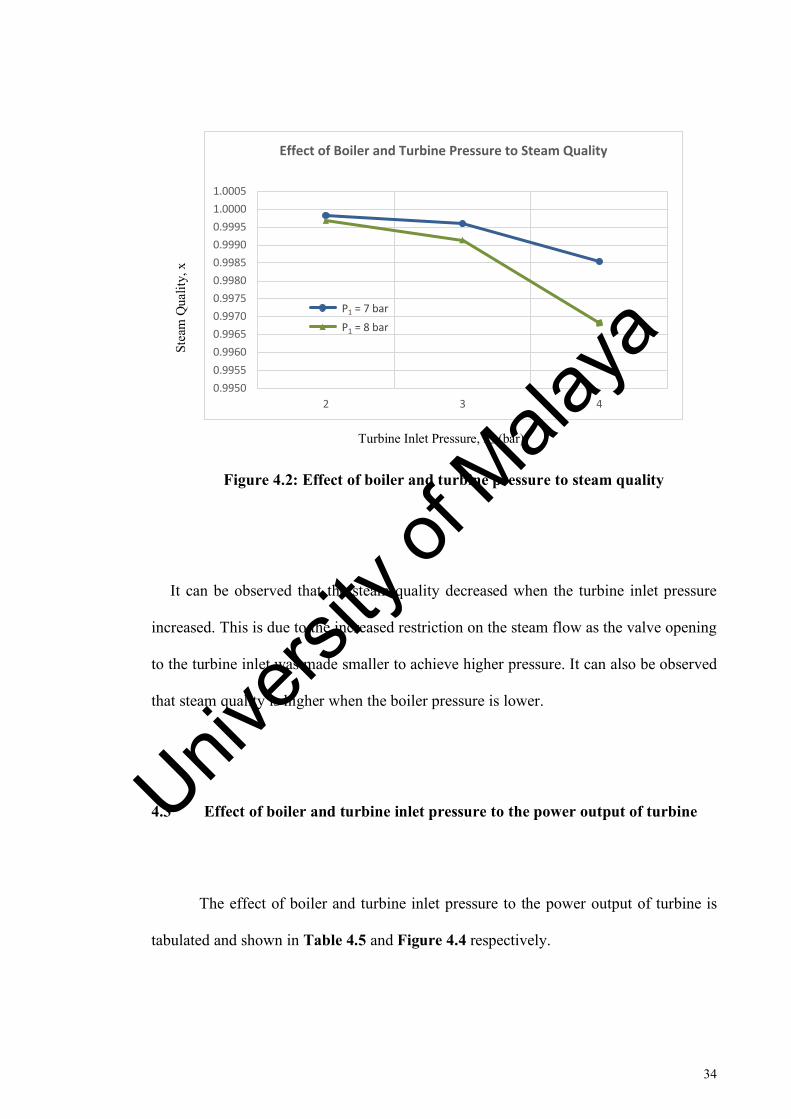
Figure 4.2: Effect of boiler and turbine pressure to steam quality
It can be observed that the steam quality decreased when the turbine inlet pressure
increased. This is due to the increased restriction on the steam flow as the valve opening
to the turbine inlet was made smaller to achieve higher pressure. It can also be observed
that steam quality is higher when the boiler pressure is lower.
4.3 Effect of boiler and turbine inlet pressure to the power output of turbine
The effect of boiler and turbine inlet pressure to the power output of turbine is
tabulated and shown in Table 4.5 and Figure 4.4 respectively.
P1 = 7 barP1 = 8 bar
0.99500.99550.99600.99650.99700.99750.99800.99850.99900.99951.00001.0005
2 3 4
Effect of Boiler and Turbine Pressure to Steam Quality
Turbine Inlet Pressure, P2 (bar)
Stea
m Q
ualit
y, x
Univers
ity of
Mala
ya
35
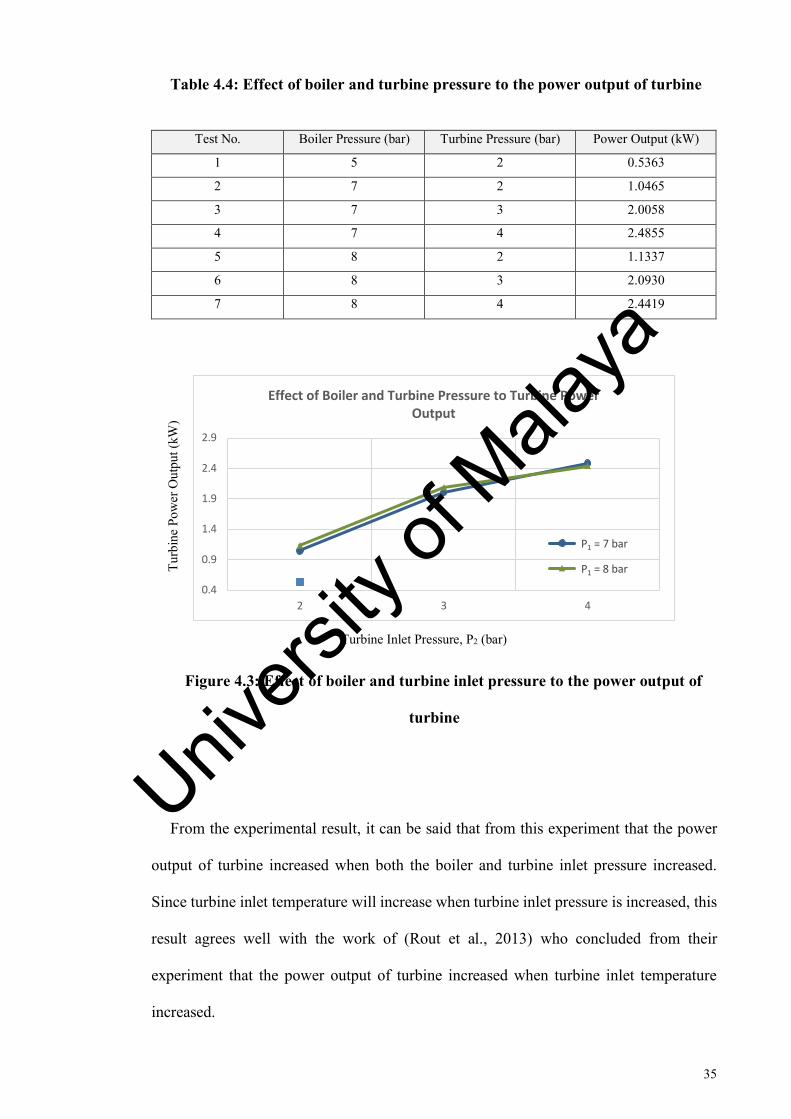
Table 4.4: Effect of boiler and turbine pressure to the power output of turbine
Test No. Boiler Pressure (bar) Turbine Pressure (bar) Power Output (kW)
1 5 2 0.5363
2 7 2 1.0465
3 7 3 2.0058
4 7 4 2.4855
5 8 2 1.1337
6 8 3 2.0930
7 8 4 2.4419
Figure 4.3: Effect of boiler and turbine inlet pressure to the power output of
turbine
From the experimental result, it can be said that from this experiment that the power
output of turbine increased when both the boiler and turbine inlet pressure increased.
Since turbine inlet temperature will increase when turbine inlet pressure is increased, this
result agrees well with the work of (Rout et al., 2013) who concluded from their
experiment that the power output of turbine increased when turbine inlet temperature
increased.
P1 = 7 bar
P1 = 8 bar
0.4
0.9
1.4
1.9
2.4
2.9
2 3 4
Effect of Boiler and Turbine Pressure to Turbine Power Output
Turb
ine
Pow
er O
utpu
t (kW
)
Turbine Inlet Pressure, P2 (bar)
Univers
ity of
Mala
ya
36
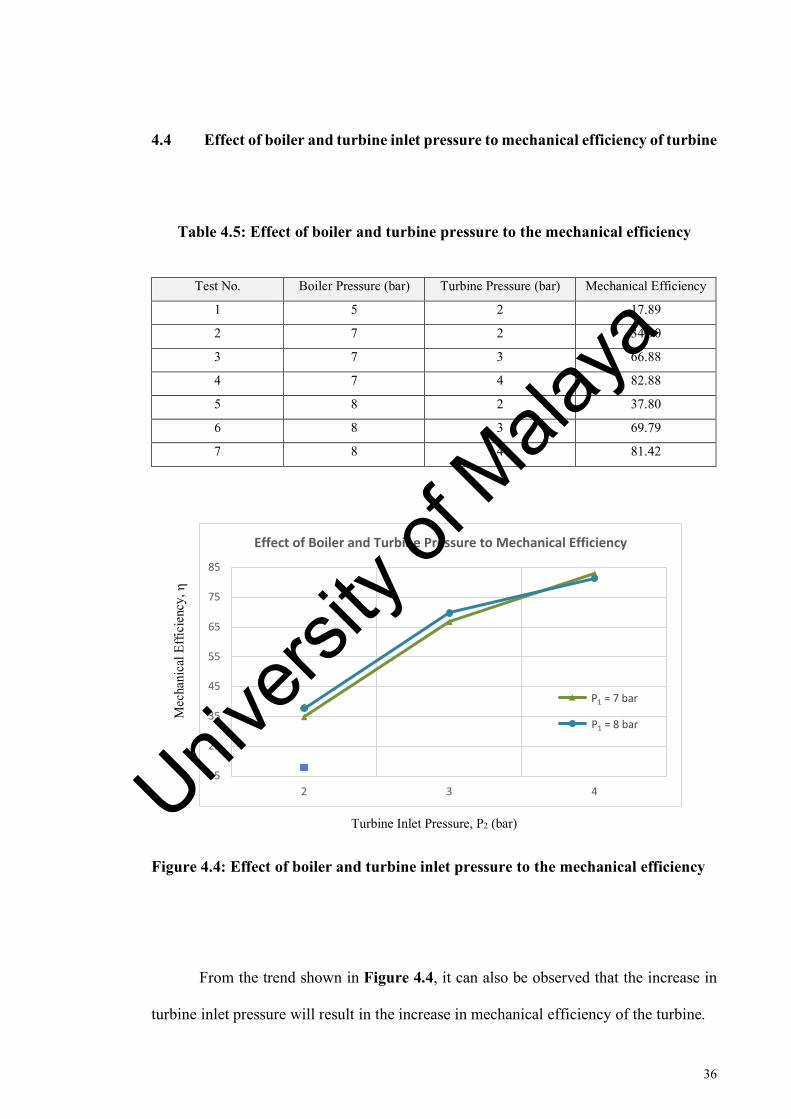
4.4 Effect of boiler and turbine inlet pressure to mechanical efficiency of turbine
Table 4.5: Effect of boiler and turbine pressure to the mechanical efficiency
Test No. Boiler Pressure (bar) Turbine Pressure (bar) Mechanical Efficiency
1 5 2 17.89
2 7 2 34.90
3 7 3 66.88
4 7 4 82.88
5 8 2 37.80
6 8 3 69.79
7 8 4 81.42
Figure 4.4: Effect of boiler and turbine inlet pressure to the mechanical efficiency
From the trend shown in Figure 4.4, it can also be observed that the increase in
turbine inlet pressure will result in the increase in mechanical efficiency of the turbine.
P1 = 7 bar
P1 = 8 bar
15
25
35
45
55
65
75
85
2 3 4
Effect of Boiler and Turbine Pressure to Mechanical Efficiency
Mec
hani
cal E
ffici
ency
, h
Turbine Inlet Pressure, P2 (bar) Univers
ity of
Mala
ya
37
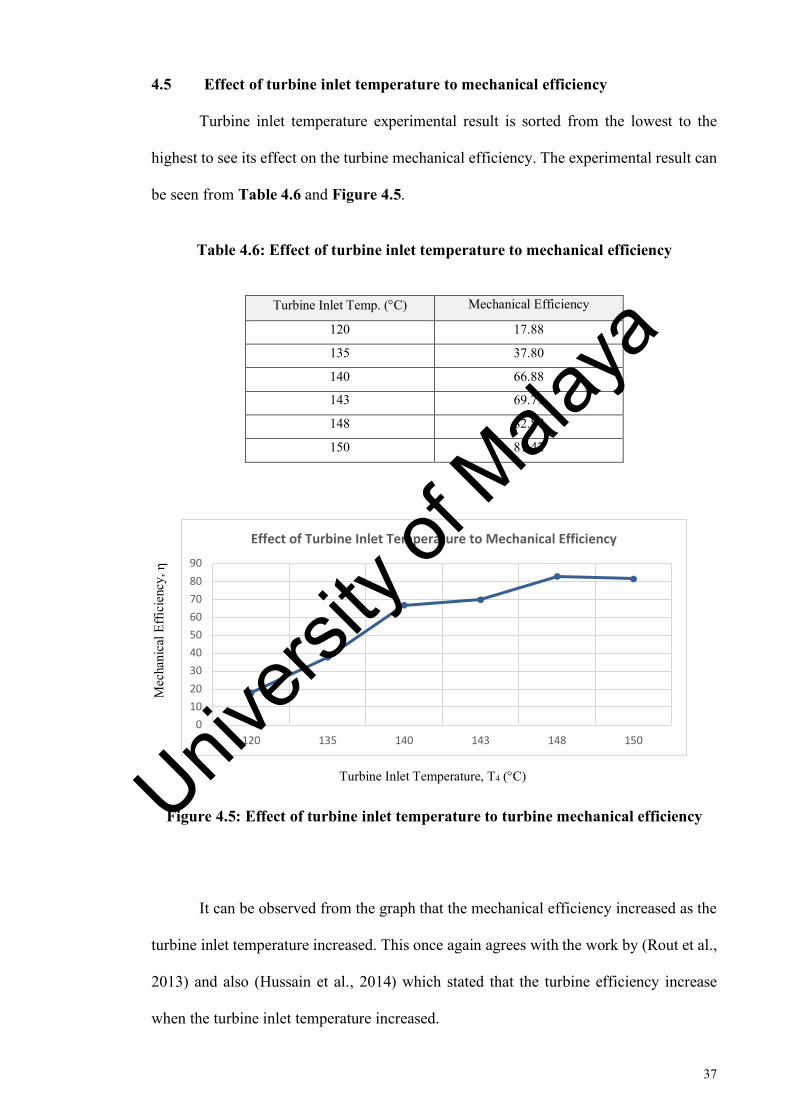
4.5 Effect of turbine inlet temperature to mechanical efficiency
Turbine inlet temperature experimental result is sorted from the lowest to the
highest to see its effect on the turbine mechanical efficiency. The experimental result can
be seen from Table 4.6 and Figure 4.5.
Table 4.6: Effect of turbine inlet temperature to mechanical efficiency
Turbine Inlet Temp. (°C) Mechanical Efficiency
120 17.88
135 37.80
140 66.88
143 69.79
148 82.87
150 81.42
Figure 4.5: Effect of turbine inlet temperature to turbine mechanical efficiency
It can be observed from the graph that the mechanical efficiency increased as the
turbine inlet temperature increased. This once again agrees with the work by (Rout et al.,
2013) and also (Hussain et al., 2014) which stated that the turbine efficiency increase
when the turbine inlet temperature increased.
0102030405060708090
120 135 140 143 148 150
Effect of Turbine Inlet Temperature to Mechanical Efficiency
Mec
hani
cal E
ffici
ency
, h
Turbine Inlet Temperature, T4 (°C) Univers
ity of
Mala
ya
38
CHAPTER 5: CONCLUSION
In this study, experiments with a total of 7 test conditions on an experimental steam
power plant with a superheater has been conducted, and analysis of the steam in the
pipeline have been carried out. It can be stated that turbine inlet temperature played a very
vital role on the power plant performance in terms of the steam quality and the power
output of the turbine. Thus, the conclusions that can be drawn from the experiment are
summarized into the following points:
i. The temperature of the steam decreased as it leaves the boiler due to steam
condensation or heat transfer to the surrounding. The steam achieved a higher
temperature after it was superheated and the temperature keeps increasing due
to the effect of turbine pressure at the inlet of the turbine.
ii. The steam quality decreased when the turbine inlet pressure increased. This is
due to the increased restriction on the steam flow as the valve opening to the
turbine inlet was made smaller to achieve higher pressure. It can also be
observed that steam quality is higher when the boiler pressure is lower.
iii. The power output of turbine increased when both the boiler and turbine inlet
pressure increased.
iv. The increase in turbine inlet pressure will result in the increase in mechanical
efficiency of the turbine.
v. The mechanical efficiency increased as the turbine inlet temperature increased.
For future work, it is suggested to carry out the experiments in a complete basic
cycle of a power plant which include the condenser and also conducting the experiment
by manipulating the superheater temperature at constant boiler and turbine inlet pressure.
Univers
ity of
Mala
ya
39
REFERENCES
(2018). Retrieved from https://en.wikipedia.org/wiki/World_energy_consumption
Benalcazar, P., Kaminski, J., & Krawczyk, M. (2017). Forecasting global coal
consumption: An artificial neural network approach. Gospodarka Surowcami
Mineralnymi. 33. 10.1515/gospo-2017-0042, 0042.
Cozzi, L., Dorner, D., & Gul, T. (2015). Retrieved from
https://www.iea.org/publications/freepublications/publication/WEO2015Special
ReportonEnergyandClimateChange.pdf
Hussain, H., Sebzali, M., & Ameer, B. (2014). Efficiency improvement of steam power
plants in Kuwait. WIT Transactions on Ecology and The Environment, Vol 186,
173-184.
Kirols, H., Kevorkov, D., Uihlein, A., & Medraj, M. (2017). Water droplet erosion of
stainless steel steam turbine blades. Material Research Express, Vol. 4, No. 8.
Lee, B.-E., Riu, K.-J., Shin, S.-H., & Kwon, S.-B. (2003). Development of a water
droplet erosion model for large steam turbine blades. KSME International
Journal, 114-121.
Merritt, C. (2015). Process Steam Systems: A Practical Guide for Operators,
Maintainers, and Designers. John Wiley & Sons.
Moran, M., Shapiro, H., Boettner, D., & Bailey, M. (2014). Fundamentals of
Engineering Thermodynamics, 8th Edition. Wiley.
Univers
ity of
Mala
ya
40
Rout, I., Gaikwad, A., Verma, V., & Tariq, M. (2013). Thermal Analysis of Steam
Turbine Power Plants. IOSR Journal of Mechanical and Civil Engineering, 28-
36.
Sarco, S. (2011). The Steam and Condensate Loop. Spirax Sarco.
Stubblefield, M., Pang, S.-s., & Cundy, V. (1996). Heat loss in insulated pipe thermal
contact resistance: a case study. Composites Part B: Engineering, Volume 27,
Issue 1, 85-93.
Sustainable Energy Forum. (2013). Retrieved from
https://sustainabletechnologyforum.com/world-faces-energy-trilemma-warns-
international-energy-agency_25623.html
Yasugahira, N., Namura, K., Kaneko, R., & Satoh, T. (1990). Erosion resistance of
titanium alloys for steam turbine blades as measured by water droplet
impingement Titanium Steam Turbine Blading. Workshop Proceedings (Palo
Alto, California, 9–10 November 1988), 385-402.
Zhu, X., Tang, H., Hong, J., Yang, S., & Li, H. (2013). Theoretical and Numerical
Analysis of Heat Transfer in Pipeline System . APCOM & ISCM, 11-14th
December.
Univers
ity of
Mala
ya