Determinants of the Method of Payment in Asset Sell‐Off Transactions
28
The Financial Review 46 (2011) 643–670 Determinants of the Method of Payment in Asset Sell-Off Transactions Kien Cao ∗ Florida Atlantic University Jeff Madura Florida Atlantic University Abstract Using a sample of asset sell-off transactions from January 1990 to April 2010, we find that the method of payment used in asset sell-off transactions is associated with several characteristics cited in the acquisitions research that reflect cash constraints of the bidder. Specifically, bidders facing more stringent cash constraints are more likely to use equity when purchasing assets, while sellers subjected to cash constraints prefer cash when selling assets. Second, we find that the variation in method of payment among asset sell-off transactions also is partially explained by variables representing asymmetric information. Third, we apply our model to an expanded sample that includes non-U.S. sellers of assets and find that an equity payment is more likely when sellers are based in countries that have relatively high country risk (more government restrictions), weak shareholder rights, and a weak legal system. Thus, it appears that bidders prefer that sellers share in the risk of the transaction under these conditions. Keywords: asset selloffs, method of payment, country risk and corporate governance JEL Classifications: G32, G34, G38 ∗ Corresponding author: Florida Atlantic University, Department of Finance, 777 Glades Road, Boca Raton, Florida 33431; Phone: (786) 395-9626; Fax: (561) 297-2542; E-mail: [email protected]. We wish to thank Robert Van Ness (the editor), two reviewers, Victor Kalafa, and seminar participants at Florida Atlantic University and at the 2011 Eastern Finance Association for their very helpful suggestions. C 2011, The Eastern Finance Association 643
-
Upload
independent -
Category
Documents
-
view
2 -
download
0
Transcript of Determinants of the Method of Payment in Asset Sell‐Off Transactions
The Financial Review 46 (2011) 643–670
Determinants of the Method of Paymentin Asset Sell-Off Transactions
Kien Cao∗Florida Atlantic University
Jeff MaduraFlorida Atlantic University
Abstract
Using a sample of asset sell-off transactions from January 1990 to April 2010, we findthat the method of payment used in asset sell-off transactions is associated with severalcharacteristics cited in the acquisitions research that reflect cash constraints of the bidder.Specifically, bidders facing more stringent cash constraints are more likely to use equity whenpurchasing assets, while sellers subjected to cash constraints prefer cash when selling assets.Second, we find that the variation in method of payment among asset sell-off transactionsalso is partially explained by variables representing asymmetric information. Third, we applyour model to an expanded sample that includes non-U.S. sellers of assets and find that anequity payment is more likely when sellers are based in countries that have relatively highcountry risk (more government restrictions), weak shareholder rights, and a weak legal system.Thus, it appears that bidders prefer that sellers share in the risk of the transaction under theseconditions.
Keywords: asset selloffs, method of payment, country risk and corporate governance
JEL Classifications: G32, G34, G38
∗Corresponding author: Florida Atlantic University, Department of Finance, 777 Glades Road, BocaRaton, Florida 33431; Phone: (786) 395-9626; Fax: (561) 297-2542; E-mail: [email protected].
We wish to thank Robert Van Ness (the editor), two reviewers, Victor Kalafa, and seminar participants atFlorida Atlantic University and at the 2011 Eastern Finance Association for their very helpful suggestions.
C© 2011, The Eastern Finance Association 643
644 K. Cao and J. Madura/The Financial Review 46 (2011) 643–670
1. Introduction
While numerous studies have tested valuation effects of asset sell-off trans-actions,1 there is very limited research on the method of payment used in thesetransactions. The method of payment in an asset sell-off transaction dictates the newcapital structure of the firm that is selling the assets, and the new capital structure ofthe firm that is buying the assets. While one might argue that sellers of assets maydemand cash, equity is used for partial or full payment in about 25% of all asset sell-off transactions that involve U.S. bidders. Our objective is to identify characteristicsthat explain the use of cash versus equity payment for asset sell-off transactions.
To develop our hypotheses for the characteristics that influence the method ofpayment for asset selloffs, we adapt theories on the method of payment for corporateacquisitions that can be categorized as cash constraints, or asymmetric information.However, since the dynamics of the asset selloffs differ from acquisitions, some ofthe characteristics that influence the method of payment for asset selloffs may differfrom what has been found for acquisitions. Asset selloffs are normally initiated bysellers, are subject to less disclosure, and allow the managers of sellers and buyersmore discretion in their negotiations (Hege, Love, Slovin, and Sushka, 2009). Mostimportantly, asset selloffs do not cause a change in corporate control. The bidder’sfocus in an asset sell-off transaction is on obtaining specific assets, not controllinganother firm. The seller’s focus in an asset sell-off transaction is on selling specificassets, not relinquishing control.
We test our hypotheses on characteristics that influence the method of paymentin asset sell-off transactions with a large sample over the period from January 1990to April 2010. We also address this issue from a global perspective so that our resultsoffer inferences about asset selloffs around the world. By including sellers fromvarious countries, we develop and test hypotheses regarding how the asset seller’scountry risk and governance characteristics influence the method of payment usedfor asset sell-off transactions.
For our sample of U.S. sellers, we find that several variables reflecting cashconstraints are related to the likelihood of using cash versus stock in asset sell-offtransactions by U.S. firms. Specifically, equity is more likely to be used as a methodof payment when the bidder has a higher level of financial leverage, a lower interestcoverage (INTCOV) ratio, a lower market capitalization, and is in the technologysector. In addition, two asymmetric information characteristics are related to the useof cash versus stock in asset sell-off transactions. Equity is more likely to be used as
1 For example, Jain (1985), Sicherman and Pettway (1987, 1992), Hite, Owers, and Rogers (1987), Johnand Ofek (1995), and Datta, Datta, and Raman (2003) suggest that asset selloffs are positive net presentvalue transactions. Studies by Afshar, Taffler, and Sudarsanam (1992), Tsetsekos and Gombola (1992),Borde, Madura, and Akhigbe (1998), Gleason, Mathur, and Singh (2000), Clubb and Stouraitis (2002),and Slovin, Sushka, and Polonchek (2005) find significant positive wealth effects for both bidders andsellers in domestic as well as international asset sell-off transactions.
K. Cao and J. Madura/The Financial Review 46 (2011) 643–670 645
a method of payment when the bidder has more growth prospects and when there ismore competition among bidders for the assets.
We also find that when we expand the sample to include sellers from non-U.S.countries, the method of payment used in asset sell-off transactions is related tocountry risk and governance characteristics. Specifically, the proportion of equitypayment for asset selloffs is higher in countries where the economic freedom index isrelatively weak, shareholder rights are relatively weak, and a noncommon legal systemis used. These results support our hypothesis that when U.S. bidder firms purchaseassets from firms based in countries with higher country risk and weaker governance,they force the asset sellers to share in the risk of the transaction. Furthermore, thosesellers in countries with weak shareholder rights that do not need cash and are willingto accept an equity payment from a U.S. buyer (rather than from a local buyer) cancircumvent the more limited local shareholder rights rules in their country.
2. Hypotheses
Since the terms of an asset sell-off transaction must satisfy both the bidder andthe seller of assets, we identify characteristics of both the bidder and the seller thatmay influence the preferred method of payment. We partition our hypotheses intothree categories:
1. Characteristics that reflect cash constraints imposed on bidders or on assetsellers.
2. Characteristics that reflect asymmetric information between bidders and assetsellers.
3. Characteristics that are country-specific (reflecting country risk and gover-nance) that can influence the method of payment used; we offer additionalhypotheses for the subsample of asset selloffs in which sellers are based innon-U.S. countries.
2.1. Characteristics that reflect cash constraints
Bidder financial constraints can have a major impact on method of paymentin acquisitions because the use of cash commonly requires more debt financing,which might subject the bidder to debt capacity constraints or higher debt costs.Moreover, a target’s need for cash can influence the method of payment. We adaptthese arguments to develop hypotheses for how the method of payment used in assetsell-off transactions is dependent on cash constraint characteristics.
2.1.1. Bidder’s cash holdings
According to Myers (1984), bidders with higher cash holdings are expected touse more cash to finance their investment because they prefer internal financing first.
646 K. Cao and J. Madura/The Financial Review 46 (2011) 643–670
Hence, when they have excessive cash available, they are more likely to use cash aspayment. Martin (1996) finds that bidders with less cash use more equity financing.In addition, Martin finds that bidders with higher growth opportunities tend to usemore equity financing, which could imply that bidders are more willing to use equitywhen they already have alternative practical ways to use their cash. We apply thesearguments to hypothesize that bidders with more cash are more likely to use cashin asset sell-off transactions. The variable CASH, defined as cash holdings of thebidder as a percentage of total capitalization, is used to investigate the effect of cashholdings on the method of payment.
2.1.2. Bidder’s financial leverage
According to Myers (1977), firms are more likely to finance their investmentsby cash when they have a sufficient debt capacity. Highly leveraged bidders are lesslikely to issue debt to finance their investments since it will raise their bankruptcycosts. As a consequence, we hypothesize that bidders with a high degree of financialleverage are more likely to use equity as their method of payment for asset selloffs. Thefinancial leverage (called DEBTRATIO) of the bidder is measured by total liabilities(based on the financial statement) divided by bidder’s market value of equity, as offour weeks prior to the announcement.
2.1.3. Bidder’s INTCOV ratio
The ability of a bidder to make interest payments on its debt can influence itswillingness to finance its purchase with cash. We use INTCOV ratio as a proxy,measured as the number of times a company could make the interest payments onits debt with its earnings before interest and taxes. We hypothesize that bidder firmswith a higher INTCOV ratio will use more cash in asset sell-off transactions.
2.1.4. Bidder’s size
Faccio and Masulis (2005) argue that larger firms have lower bankruptcy costs.Moreover, since larger firms normally have a better reputation, they may have betteraccess to the debt market. Larger firms should incur a lower cost of issuing debt, andthus may be more willing to borrow to obtain cash needed for capital expenditures.Therefore, we hypothesize that larger bidder firms are more likely to use cash topurchase assets of other firms. We measure the variable SIZE of the bidder as thelogarithm of bidder’s pre-transaction total market capitalization.
2.1.5. Bidder’s technology status
Because of heavy initial investment in research and development, some high-tech firms may have limited access to cash. Jung, Kim, and Stulz (1996) claim that
K. Cao and J. Madura/The Financial Review 46 (2011) 643–670 647
managers of firms with high growth opportunities prefer to finance their investmentswith equity as opposed to debt financing because equity financing gives them morediscretion over the funds raised. Martynova and Renneboog (2009) report that in themarket for corporate control, bidding firms that choose to finance their acquisitions byequity tend to have higher growth opportunities. Therefore, we hypothesize that high-tech bidders are more likely to offer equity for asset sell-off transactions. The dummyvariable TECHBIDDER, is set equal to one if the bidder has their primary StandardIndustrial Classification (SIC) codes as 3571, 3572, 3575, 3577, 3578 (computerhardware), 3661, 3663, 3669 (communications equipment), 3674 (electronics), 3812(navigation equipment), 3823, 3825, 3826, 3827, 3829 (measuring and controllingdevices), 4899 (communication services), and 7370, 7371, 7372, 7373, 7374, 7375,7379 (software). The TECHBIDDER variable represents a cash constraint that is notfully captured by the aforementioned variables.
2.1.6. Bidder’s credit constraints during weak economic conditions
During the weak economic conditions, bidders may be subject to credit con-straints. We use the variable CREDITCRISIS, set equal to one during recessionaryperiods in which access to credit might be more limited. We expect that equity will beused more to finance asset sell-off transaction during recessionary periods. However,equity values tend to be low in these periods, which might discourage bidders fromusing equity.
2.1.7. Seller’s bankruptcy status
When the sellers of assets are facing bankruptcy, they may prefer cash as paymentbecause they need cash to pay off their debt and other priority expenses. Under thebankruptcy situation, creditors of the seller firms could force the firms to acceptcash in order to reduce the creditors’ risk exposure. However, bankrupt firms maynot have much bargaining power when attempting to sell assets (Parnes, 2009), andmay be forced to accept equity even if they prefer cash. We use a dummy variable,BANKRUPT which equals one if the seller has filed for bankruptcy prior to thesell-off transaction, to capture the impact of bankruptcy status on the method ofpayment.
2.1.8. Seller’s sale of subsidiary
According to Faccio and Masulis (2005), firms that sell subsidiaries often aredealing with financial distress or desiring to refocus their operation on the mainbusiness line. As a result, they strongly prefer cash payment to overcome the financialdistress or to restructure the firms. While these firms do not fit the extreme bankruptcystatus classification described above, the motivation for the asset selloff may be toobtain cash. Therefore, we hypothesize that the proportion of cash used is higher

648 K. Cao and J. Madura/The Financial Review 46 (2011) 643–670
when the asset selloff represents a subsidiary. The dummy variable SUBSIDIARYis an indicator that equals one when the (unlisted) seller is a subsidiary of anotherfirm.
2.2. Characteristics that reflect asymmetric information
Since asymmetric information has an influence on the method of payment used inacquisitions, we adapt theories developed from acquisition studies to offer hypothesesregarding the method of payment for asset sell-off transactions. In an acquisition, atarget may be concerned about the true value of the bidder, and may prefer paymentin cash. Hansen (1987) and Travlos (1987) suggest that when a bidder finances anacquisition with equity, it emits a negative signal that it capitalizes on the use of itsovervalued stock. This result validates the target’s preference for cash in some caseswhen the bidder’s equity may be overvalued.
However, just as there is asymmetric information regarding the value of thebidder, there also is asymmetric information regarding the value of the seller. Thus,bidders may be concerned that they may overpay for the target. Hansen (1987) ar-gues that the transaction process between bidder and target should be treated as atwo-agent bargaining game under imperfect information. Under that situation, thebidder should offer stock payment rather than cash payment since stock paymenthas desirable contingent pricing characteristics. However, in an asset sell-off trans-action, the exposure of the seller to asymmetric information surrounding the bidderis different from the exposure of a target firm acquisition of the whole firm. Whilean equity payment in an acquisition is distributed to a diffuse set of shareholders, anequity payment in an asset sell-off transaction is distributed to a single entity, whichmotivates that entity to carefully assess the valuation of the bidder’s equity beforeaccepting it. An equity payment to a single entity in exchange for assets is somewhatsimilar to acquisitions of private targets financed by equity, as the recipient wouldonly accept such a large equity payment after careful scrutiny. Chang (1998) findsthat a private target’s acceptance of bidder equity emits a strong positive share priceresponse of the bidder, which reflects an implicit endorsement by the private firmowners in the bidder’s stock.
Moreover, Slovin, Sushka, and Polonchek (2005) document much larger gainsto selling firms from asset sell-off transactions when equity was used as a methodof payment. They conclude that an equity payment in an asset sell-off transactioncan serve as a positive signal about the assets that are sold, and about the value ofthe bidder. Given the distinct characteristics of asset selloffs and the distinct signalsresulting from equity payment in asset sell-off transactions, some characteristicsthat drive the method of payment for acquisitions will not necessarily have thesame impact on the method of payment used in sell-off transactions. We identifythe following characteristics related to asymmetric information that can affect themethod of payment decision.
K. Cao and J. Madura/The Financial Review 46 (2011) 643–670 649
2.2.1. Bidder’s growth opportunities
According to Warusawitharana (2008), more profitable firms are more likely tobuy assets. Bidders that experience strong performance and have more investmentopportunities may prefer to use less cash as payment in asset sell-off transactions. Inaddition, sellers of assets might be more willing to accept equity representing firmsthat have more investment opportunities. According to Martin (1996), firms withhigh growth opportunities usually use their equity as currency when acquiring targetsand the targets also accept their equity more frequently. We use Tobin’s q ratio asa measure of the bidder’s growth opportunities, and hypothesize that bidders with ahigh Tobin’s q ratio are less likely to use cash in asset sell-off transactions.
2.2.2. Bidder’s size of purchase
Faccio and Masulis (2005) argue that the exposure of bidders to an asymmetricinformation problem is more pronounced when the target value is relatively large.Thus, they suggest that bidders will be more likely to use equity financing for largedeals. In addition, the use of equity may allow them to more easily afford relativelylarge purchases of assets. We hypothesize that equity is more likely to be used forrelatively large purchases of assets by bidders. We proxy for this effect by a variable,RELSIZE, which equals the value of the divested assets being sold divided by totalmarket capitalization of the bidder.
2.2.3. Bidder’s competition with other bidders
If asset sellers are worried about asymmetric information, they may be in a bet-ter negotiating position to demand cash when there are multiple bidders. However,bidding competition for assets might cause bidders to offer part equity (an “equitykicker”) to outbid the other existing or potential bidders.2 Furthermore, some assetsellers may prefer to receive the bidder’s equity as payment when they expect synergybetween the assets they are selling and the bidder (Slovin, Sushka, and Polonchek,2005). Thus, a competitive bidding situation may increase the likelihood of such spe-cial opportunities for asset sellers, in which they may even prefer equity as payment.We use the dummy variable COMPETITIVE, set equal to one if there are multiplebidders.
One can argue that there always is some degree of competition for divestedassets, so that the COMPETITIVE variable does not necessarily capture the level ofinterest in a particular asset. A bidder’s high bid for particular assets might discourageother bidders from competing. For this reason, we include an alternative proxy calledMAACTIVITY that measures the natural logarithm of the total dollar volume of theworld market for mergers.
2 See “AOL & Yahoo! Merger?” by Rick Aristotle Munariz, The Motely Fool, October 5, 2010.
650 K. Cao and J. Madura/The Financial Review 46 (2011) 643–670
2.2.4. Seller’s technology status
High technology firms have high growth opportunities, and need a substantialamount of cash to finance their future investments. However, a counter hypothesisis that since the assets of high-tech firms may be less transparent, bidders mayprefer to use a greater proportion of equity to induce risk sharing. This can solvethe asymmetric information problem described by Hansen (1987). We include adummy variable, TECHSELLER, to examine the effect of tech sellers on the methodof payment used in selloffs. The variable TECHSELLER equals one if the seller iscategorized in primary SIC codes 3571, 3572, 3575, 3577, 3578 (computer hardware),3661, 3663, 3669 (communications equipment), 3674 (electronics), 3812 (navigationequipment), 3823, 3825, 3826, 3827, 3829 (measuring and controlling devices), 4899(communication services), or 7370, 7371, 7372, 7373, 7374, 7375, 7379 (software).
2.2.5. Relatedness between bidder and seller
According to Chemmanur, Paeglis, and Simonyan (2009), relatedness betweenbidder and target can reduce information asymmetry between the two parties. Thus,the degree of asymmetric information surrounding the seller’s assets may be lowerwhen bidders are in the same industry as the sellers. Bidders may be more willing touse cash under these conditions. In this study, the relatedness of the bidder and sellerof an asset selloff is captured by the dummy variable RELATED, which equals oneif both parties have the same four-digit SIC code.
2.3. Country characteristics that could influence the method of payment
2.3.1. Cross-border transactions
When U.S. bidders engage in cross-border asset sell-off transactions, they facegreater challenges because of institutional and cultural differences. A cross-borderasset sell-off transaction that involves an equity payment is more complicated thana cash transaction. Some sellers who may have been willing to consider equity aspayment may be less willing to accept ownership in a foreign security in which theywould need to monitor the bidder firm. Therefore, we expect that cash is more likelyto be used as the method of payment for cross-border asset selloffs. We introduce adummy variable, CROSSBORDER, to distinguish selloffs by sellers based in othercountries from selloffs by sellers based in the United States.
2.3.2. Seller’s country risk and governance characteristics
Beyond the general expectation regarding cross-border transactions we statedabove, the method of payment among cross-border asset sell-off transactions mayvary with country risk and governance characteristics. Bidders may be more likelyto use equity to purchase assets in countries with weaker governance, so that theycan induce risk sharing. This argument, developed by Hansen (1987) for bidders
K. Cao and J. Madura/The Financial Review 46 (2011) 643–670 651
purchasing targets subject to much asymmetric information, also should be applicableto bidders purchasing assets that are subject to much uncertainty because of countryconditions. Stiglitz (2000) argues that the greater lever of uncertainty in cross-bordertransactions can reduce the value of assets being exchanged and can cause valuedestruction for bidders. Moreover, Henisz (2000) suggests that multinational firmsthat do business in risky foreign markets are more likely to share ownership withlocal partners, because such behavior will shift some of the risk to foreign investorswho can bear the risk in a less costly manner. This argument is somewhat similarto that of Hansen (1987) about how bidders use equity to induce risk-sharing whena target’s asymmetric information is high, but is applied to investments in foreigncountries. Furthermore, Guedhami and Mishra (2009) find that firms located in betterprotective environments have higher equity valuation. Hence, bidders from betterprotective environments such as the United States might use more equity to purchaseassets in weaker protective environments.
However, the U.S. bidders only are able to exercise the choice of an equitypayment if sellers are willing to accept equity. Rossi and Volpin (2004) find thatbidders more commonly use equity in cross-border acquisitions in which the targetcountry’s investor protection is weaker than the bidder country’s investor protection.Targets in weak investor protection countries may have to accept equity in order toattract bidders from other foreign countries. For our sample of asset selloffs by non-U.S. firms to U.S. bidders, we expect a similar relationship between their country riskcharacteristics and the method of payment used. Asset sellers based in countries withweak country risk ratings or governance may be more willing to accept an equitypayment from a U.S. buyer in order to extend their reach to additional prospectivebuyers.
To test our hypotheses regarding how country risk characteristics affect themethod of payment used for cross-border asset sell-off transactions, we consider thefollowing measures of country risk and governance.
(i) Economic Freedom and Development. The economic freedom of the worldrating (Gwartney, Lawson, and Norton, 1996) is assigned to each countryof the firm engaged in asset selloffs, based on trade policy, taxation, gov-ernment intervention, foreign investment policy, banking, pricing controls,property rights, and regulation. A higher score proxies for a less restrictiveenvironment. Based on the Heritage website,3 we collect the rating for eachasset seller’s country in the sample and include those ratings in the analysisto investigate the effect of the seller country’s economic environment on thefinancing decision. The variable in the analysis is FREEDOM, which is mea-sured as the natural logarithm of the economic freedom rating of the sellercountry.
3 http://www.heritage.org/index/ranking.
652 K. Cao and J. Madura/The Financial Review 46 (2011) 643–670
(ii) Shareholder Rights. We use an index of the rights that shareholders have withrespect to management team (antidirector rights) introduced by La Porta,Lopez-de-Silanes, Shleifer, and Vishny (1997) to find the impact of share-holder protection in the seller country on the method of payment decision.Antidirector rights index is an index that aggregates shareholder rights. Theindex ranges from zero to five, in which a higher number reflects bettershareholder protection.
Following Moeller and Schlingemann (2005), we also use a dummy vari-able for high versus low shareholder rights. The variable RIGHTS equals oneif the antidirector rights index is three or above.
(iii) Legal System. We also consider the legal system as a broad indicator ofinvestor protection, as it is commonly used as a proxy for shareholder rightsand degree of corporate governance. Common law systems are consideredto have the best shareholder rights. Civil law–based systems are consideredto have the weakest shareholder rights. We use a dummy variable calledCOMMON set equal to one for common law countries.
3. Methodology and sample
3.1. Methodology
Following Faccio and Masulis (2005), we apply a Tobit multivariate model toinvestigate the weight of various explanatory and control variables on the methodof payment decision in asset sell-off transactions. In the Tobit regression model, thedependent variable is the cash proportion of the payment for the sell-off transaction,which must be in the interval [0, 100]. In our sample, all values of the dependentvariable are within the [0, 100] interval. We apply the model:
y∗i = βX′
i + ui,
where yi = y∗i if 0 < y∗
i < 100, X′i is the vector of explanatory and control variables.
ui is an independently distributed error term assumed to be normal with zero meanand variance σ 2.
When applying this model to our sample, the quasi-maximum likelihood(QML) White/Huber standard errors are used to correct for heteroskedasticity.For each hypothesis of a characteristic that we believe affects the proportion ofcash used versus stock used, an independent variable is used to proxy for thatcharacteristic.
First, we apply our model to a sample of all sellers based in the United States.Then, we apply our model to an expanded sample that includes non-U.S. sellers sothat we can assess the impact of country risk and governance characteristics on themethod of payment in asset sell-off transactions. Next, we isolate specific subsetsof the sample of non-U.S. sellers in order to test for robustness as applied to thatsample. In addition to the above analyses, we conduct a variety of robustness tests,

K. Cao and J. Madura/The Financial Review 46 (2011) 643–670 653
Table 1
Definition of variablesSummary of the variables that are used to explain the financing decisions in asset sell-off transactions.
ExpectedVariable name Variable definition sign
CASH cash holdings of the bidder scaled by bidder’s market value of equity,as of four weeks prior to the announcement
+
DEBTRATIO the bidder’s total liabilities divided by market value of equity, as of fourweeks prior to the announcement
−
INTCOV interest coverage ratio of the bidder +SIZE logarithm of bidder’s pre-transaction total market capitalization +TECHBIDDER equals one if the bidder is a high-tech firm −CREDITCRISIS equals one if the transactions happen during 2001–2002 and 2007 crisis
(from Q1/2001 to Q4/2002 and from Q3/2007 to Q4/2010)−
BANKRUPT equals one if the seller company is bankrupt or goes bankrupt duringthe transaction
−/+
SUBSIDIARY equals one if the seller is a subsidiary of another company +TOBINQ Tobin’s q ratio of the bidder −RELSIZE the relative size of the transaction to bidder’s market value of equity, as
of four weeks prior to the announcement−
COMPETITIVE equals one when multiple bidders exist −MAACTIVITY equals the logarithm of total value of the world mergers and
acquisitions market in the previous year−
TECHSELLER equals one if the seller is a high-tech firm −/+RELATED equals one if the bidder and seller have the same four-digit SIC code +CROSSBORDER equals one if the deal is a cross-border deal −FREEDOM natural logarithm of the economic freedom rating of the seller country +RIGHTS equals one if the antidirector rights index is three or above +COMMON equals one if the seller is from a country with a common law system +
such as Logit regressions for the three aforementioned subsamples. Table 1 providesthe summary of the variables that are included in the model to explain the method ofpayment decision in asset selloffs, along with their definitions, and the expected signfor each variables.
3.2. Sample
Our initial sample consists of all asset sell-off transactions from January 1990to April 2010 obtained from the Thomson Financial SDC Platinum (SDC) database.Only transactions that satisfy certain screening criteria are included in the investiga-tion. First, bidders of the assets must be U.S. publicly traded corporations. However,there is no restriction on seller country and seller listing status. Second, only suc-cessful transactions that have value greater than $1 million and are worth more than5% of the market value of equity of the bidders are investigated. Third, we eliminate
654 K. Cao and J. Madura/The Financial Review 46 (2011) 643–670
all transactions that belong to the regulated industries. There are 1,740 asset sell-offtransactions that satisfy our criteria.
We use the SDC database to collect various characteristics of the transactions,such as cross-border deal and competitive deal. This database also is used to gatherinformation about the assets being purchased, such as whether it is a subsidiaryof another firm or whether the seller firm is going bankrupt. In addition, financialvariables for the bidder and seller are collected from SDC, CRSP, and Compustat.There are 1,263 transactions with complete information that we can use in the analysis.Moreover, the information about antidirector index is from La Porta, Lopez-de-Silanes, Shleifer, and Vishny (1997); the facts about economic freedom rating arefrom the Heritage website; and the news about the origin of the legal system is fromthe Yale law school website.4
4. Data description and results of univariate analysis
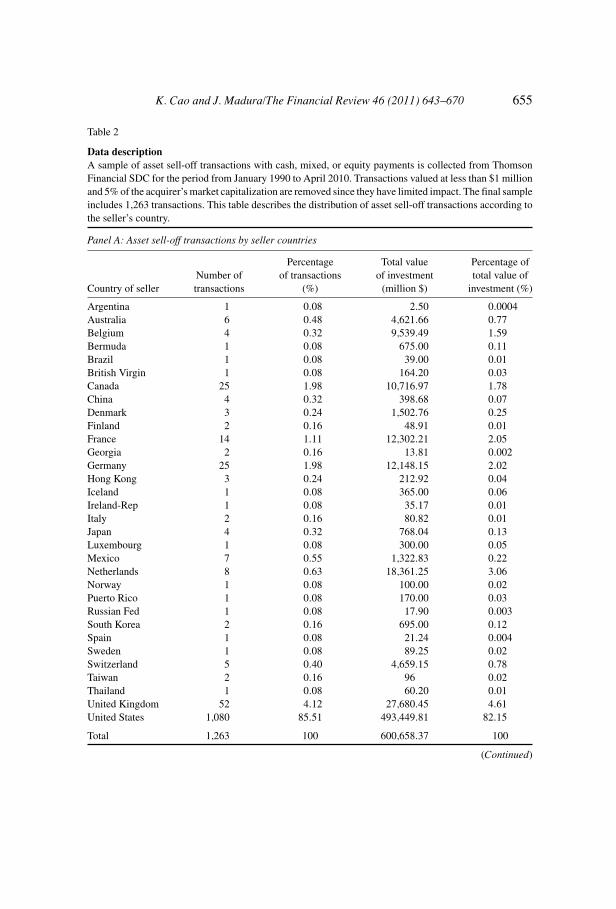
Table 2 shows some useful information regarding the asset sell-off mar-ket. Panel A shows the distribution of asset by country of the seller. The to-tal value of asset sell-off transactions in the entire sample is about $601 billion.Eight-two percent of the transaction value represents U.S. sellers, and 18% ofthe transaction value represents non-U.S. sellers. Selloffs commonly occur in as-sets in other developed countries, such as the United Kingdom, Germany, France,Netherlands, and Canada. However, asset selloffs also occur in some developingcountries.
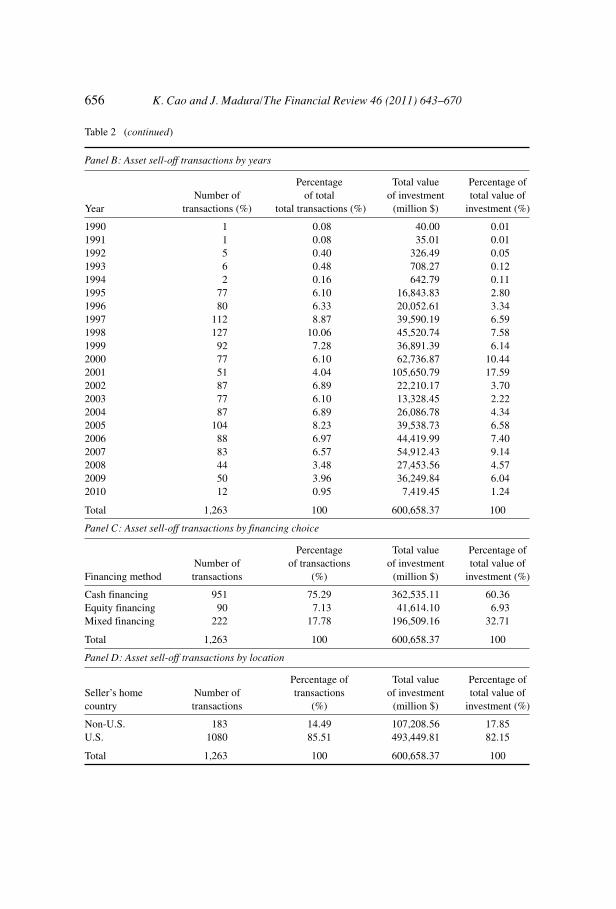
Panel B shows the volume of asset sell-off transactions over time.5 Asset sell-off activity has dramatically increased since the early 1990s in terms of the numberof transactions and the value of those transactions. The peak of the asset sell-offactivity occurred in 2001, with the total transaction value of almost $106 billion.There was a decline in asset selloffs during the financial crisis in 2008 and 2009.Panel C shows that about 25% of the asset sell-off transactions involve a completeor partial equity payment. Our study is intended to identify the characteristics thatinfluence the decision to use equity versus cash as payment.
The mean and median deal values of asset sell-off transactions are $475.58million and $92.20 million, respectively, while the bidder’s mean and median totalcapitalization is $2.15 billion and $461 million, respectively.
Table 3 discloses univariate results for the seller country’s risk factors. It showsthat the proportion of equity that U.S. bidder firms use as payment is higher whenpurchasing assets in countries that have a relatively low economic freedom ratingand relatively weak shareholder rights. In addition, the proportion and the likelihood
4 http://library.law.yale.edu/world-legal-systems.
5 The information for 2010 is just about the first quarter of 2010.
K. Cao and J. Madura/The Financial Review 46 (2011) 643–670 655
Table 2
Data descriptionA sample of asset sell-off transactions with cash, mixed, or equity payments is collected from ThomsonFinancial SDC for the period from January 1990 to April 2010. Transactions valued at less than $1 millionand 5% of the acquirer’s market capitalization are removed since they have limited impact. The final sampleincludes 1,263 transactions. This table describes the distribution of asset sell-off transactions according tothe seller’s country.
Panel A: Asset sell-off transactions by seller countries
Percentage Total value Percentage ofNumber of of transactions of investment total value of
Country of seller transactions (%) (million $) investment (%)
Argentina 1 0.08 2.50 0.0004Australia 6 0.48 4,621.66 0.77Belgium 4 0.32 9,539.49 1.59Bermuda 1 0.08 675.00 0.11Brazil 1 0.08 39.00 0.01British Virgin 1 0.08 164.20 0.03Canada 25 1.98 10,716.97 1.78China 4 0.32 398.68 0.07Denmark 3 0.24 1,502.76 0.25Finland 2 0.16 48.91 0.01France 14 1.11 12,302.21 2.05Georgia 2 0.16 13.81 0.002Germany 25 1.98 12,148.15 2.02Hong Kong 3 0.24 212.92 0.04Iceland 1 0.08 365.00 0.06Ireland-Rep 1 0.08 35.17 0.01Italy 2 0.16 80.82 0.01Japan 4 0.32 768.04 0.13Luxembourg 1 0.08 300.00 0.05Mexico 7 0.55 1,322.83 0.22Netherlands 8 0.63 18,361.25 3.06Norway 1 0.08 100.00 0.02Puerto Rico 1 0.08 170.00 0.03Russian Fed 1 0.08 17.90 0.003South Korea 2 0.16 695.00 0.12Spain 1 0.08 21.24 0.004Sweden 1 0.08 89.25 0.02Switzerland 5 0.40 4,659.15 0.78Taiwan 2 0.16 96 0.02Thailand 1 0.08 60.20 0.01United Kingdom 52 4.12 27,680.45 4.61United States 1,080 85.51 493,449.81 82.15
Total 1,263 100 600,658.37 100
(Continued)
656 K. Cao and J. Madura/The Financial Review 46 (2011) 643–670
Table 2 (continued)
Panel B: Asset sell-off transactions by years
Percentage Total value Percentage ofNumber of of total of investment total value of
Year transactions (%) total transactions (%) (million $) investment (%)
1990 1 0.08 40.00 0.011991 1 0.08 35.01 0.011992 5 0.40 326.49 0.051993 6 0.48 708.27 0.121994 2 0.16 642.79 0.111995 77 6.10 16,843.83 2.801996 80 6.33 20,052.61 3.341997 112 8.87 39,590.19 6.591998 127 10.06 45,520.74 7.581999 92 7.28 36,891.39 6.142000 77 6.10 62,736.87 10.442001 51 4.04 105,650.79 17.592002 87 6.89 22,210.17 3.702003 77 6.10 13,328.45 2.222004 87 6.89 26,086.78 4.342005 104 8.23 39,538.73 6.582006 88 6.97 44,419.99 7.402007 83 6.57 54,912.43 9.142008 44 3.48 27,453.56 4.572009 50 3.96 36,249.84 6.042010 12 0.95 7,419.45 1.24
Total 1,263 100 600,658.37 100
Panel C: Asset sell-off transactions by financing choice
Percentage Total value Percentage ofNumber of of transactions of investment total value of
Financing method transactions (%) (million $) investment (%)
Cash financing 951 75.29 362,535.11 60.36Equity financing 90 7.13 41,614.10 6.93Mixed financing 222 17.78 196,509.16 32.71
Total 1,263 100 600,658.37 100
Panel D: Asset sell-off transactions by location
Percentage of Total value Percentage ofSeller’s home Number of transactions of investment total value ofcountry transactions (%) (million $) investment (%)
Non-U.S. 183 14.49 107,208.56 17.85U.S. 1080 85.51 493,449.81 82.15
Total 1,263 100 600,658.37 100

K. Cao and J. Madura/The Financial Review 46 (2011) 643–670 657
Table 3
Country risk factorsThis table provides information about the likelihood and mean of cash proportion in the payment of assetsell-off transactions. The t-statistic shows the difference in mean of cash proportion payment of differentcountry risks’ characteristics.
Likelihood ofU.S. bidders thatuse 100% cashpayment (%)
Likelihood ofU.S. bidders that
use equity tomake full or
partial payment(%)
Mean of cashproportion in the
payment (%)
t-statistic for thedifference
between higherrisk and lowerrisk countries
Country governance or riskcharacteristic
Low economic freedom rating 65.73 34.27 80.9 −2.49∗∗∗High economic freedom rating 70.77 29.23 87.7Weak shareholder rights 63.04 36.96 81.7 −2.13∗∗Strong shareholder rights 70.87 29.13 87.7Noncommon law legal origin 59.83 40.17 80.9 −2.72∗∗∗Common law legal origin 70.91 29.09 87.8
∗∗∗ and ∗∗ indicate statistical significance at the 0.01 and 0.05 level, respectively.
of U.S. bidder firms that use equity as full or partial payment also are higher whenpurchasing assets in noncommon law countries.
Overall, Table 3 offers preliminary evidence that when U.S. bidder firms pur-chase assets from firms based in countries with high country risk factors or withweak governance, they tend to use a higher proportion of equity as payment. Theseresults are consistent with the hypothesis that U.S. bidder firms purchasing assets inrelatively high-risk countries may want to use a method of payment that forces theasset sellers to share in the risk of the transaction.
5. Results of multivariate analysis
5.1. Results of multivariate analysis applied to sample of U.S. sellers
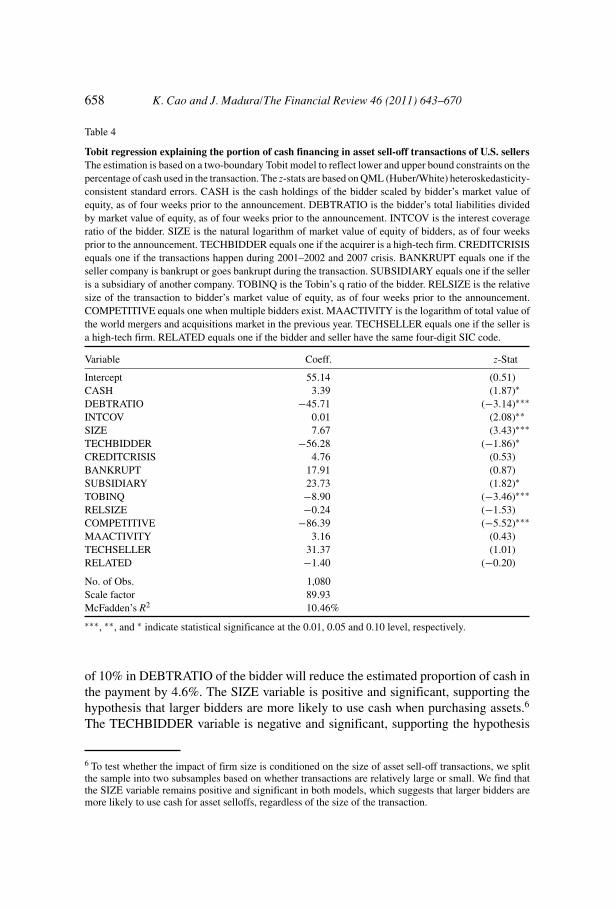
Table 4 shows the results from applying the Tobit model to the sample of U.S.sellers to test variables that may influence the method of payment used for assetselloffs. The dependent variable is measured as the percentage of the asset sell-offtransaction value that is paid in cash.
The results show that several variables measuring cash constraints are significant,and support hypotheses regarding how cash constraints can influence the method ofpayment used for asset sell-off transactions. The CASH and INTCOV variables arepositive and significant at the 0.10 and 0.05 level, respectively, offering evidencethat the bidders with more cash and in a better position to cover their debt paymentsare more likely to use cash when purchasing assets. The DEBTRATIO variable isnegative and significant, supporting the hypothesis that bidders with a lower degreeof financial leverage are more likely to use cash when purchasing assets. An increase
658 K. Cao and J. Madura/The Financial Review 46 (2011) 643–670
Table 4
Tobit regression explaining the portion of cash financing in asset sell-off transactions of U.S. sellersThe estimation is based on a two-boundary Tobit model to reflect lower and upper bound constraints on thepercentage of cash used in the transaction. The z-stats are based on QML (Huber/White) heteroskedasticity-consistent standard errors. CASH is the cash holdings of the bidder scaled by bidder’s market value ofequity, as of four weeks prior to the announcement. DEBTRATIO is the bidder’s total liabilities dividedby market value of equity, as of four weeks prior to the announcement. INTCOV is the interest coverageratio of the bidder. SIZE is the natural logarithm of market value of equity of bidders, as of four weeksprior to the announcement. TECHBIDDER equals one if the acquirer is a high-tech firm. CREDITCRISISequals one if the transactions happen during 2001–2002 and 2007 crisis. BANKRUPT equals one if theseller company is bankrupt or goes bankrupt during the transaction. SUBSIDIARY equals one if the selleris a subsidiary of another company. TOBINQ is the Tobin’s q ratio of the bidder. RELSIZE is the relativesize of the transaction to bidder’s market value of equity, as of four weeks prior to the announcement.COMPETITIVE equals one when multiple bidders exist. MAACTIVITY is the logarithm of total value ofthe world mergers and acquisitions market in the previous year. TECHSELLER equals one if the seller isa high-tech firm. RELATED equals one if the bidder and seller have the same four-digit SIC code.
Variable Coeff. z-Stat
Intercept 55.14 (0.51)CASH 3.39 (1.87)∗DEBTRATIO −45.71 (−3.14)∗∗∗INTCOV 0.01 (2.08)∗∗SIZE 7.67 (3.43)∗∗∗TECHBIDDER −56.28 (−1.86)∗CREDITCRISIS 4.76 (0.53)BANKRUPT 17.91 (0.87)SUBSIDIARY 23.73 (1.82)∗TOBINQ −8.90 (−3.46)∗∗∗RELSIZE −0.24 (−1.53)COMPETITIVE −86.39 (−5.52)∗∗∗MAACTIVITY 3.16 (0.43)TECHSELLER 31.37 (1.01)RELATED −1.40 (−0.20)
No. of Obs. 1,080Scale factor 89.93McFadden’s R2 10.46%
∗∗∗, ∗∗, and ∗ indicate statistical significance at the 0.01, 0.05 and 0.10 level, respectively.
of 10% in DEBTRATIO of the bidder will reduce the estimated proportion of cash inthe payment by 4.6%. The SIZE variable is positive and significant, supporting thehypothesis that larger bidders are more likely to use cash when purchasing assets.6
The TECHBIDDER variable is negative and significant, supporting the hypothesis
6 To test whether the impact of firm size is conditioned on the size of asset sell-off transactions, we splitthe sample into two subsamples based on whether transactions are relatively large or small. We find thatthe SIZE variable remains positive and significant in both models, which suggests that larger bidders aremore likely to use cash for asset selloffs, regardless of the size of the transaction.
K. Cao and J. Madura/The Financial Review 46 (2011) 643–670 659
that bidder firms in the technology field are less likely to use cash to purchase assets.The impact of TECHBIDDER is significant; if the bidder is a high-tech firm, theestimated proportion of cash payment decreases 56%. The SUBSIDIARY variable ispositive and significant at the 0.10 level, suggesting that bidders are more likely touse cash when purchasing a subsidiary. If the seller sells its subsidiary, the estimatedproportion of cash in the payment increases approximately 24%. Overall, the cashconstraint variables appear to have a major influence on the method of payment usedfor asset sell-off transactions.
Next, we discuss the results for the variables representing asymmetric infor-mation in the sample focused on U.S. sellers. Results for two of these variables aresignificant. The TOBINQ variable is negative and significant, which supports thehypothesis that bidders with better growth prospects are more likely to use equity.In addition, the COMPETITION variable is negative and significant, which suggeststhat bidders are more likely to use at least partial equity when engaged in a biddingcontest.7 The existence of multiple bidders significantly decreases the proportion ofcash in the payment; there is a decrease of 86% of cash in the payment when thereare multiple bidders.
About the power of the Tobit regression, the McFadden’s R2 is 10.46% andthe likelihood ratio indicates that the model is significant at the 1% level. The aboveresults show that the cash constraints and information asymmetric variables are jointlysignificant and have reasonable explanatory power.
5.2. Results of multivariate analysis applied to international sample
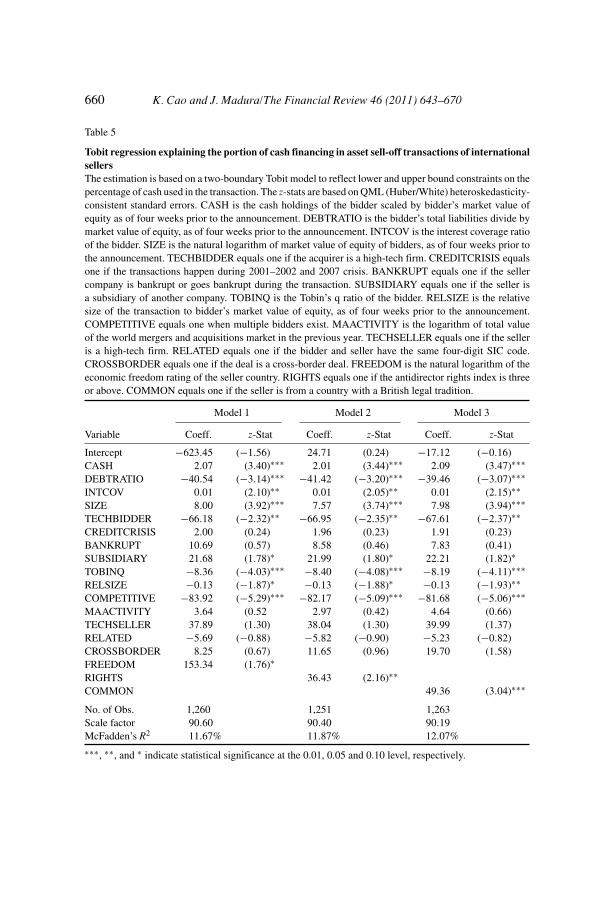
Table 5 shows the results from applying the Tobit model to test variables thatmay influence the method of payment used for asset selloffs for the expanded samplethat includes non-U.S. sellers.8
7 We also divide the sample of U.S. sellers into two subsamples, one subsample in which the equityproportion of the payment is less than 5% of the market capitalization of the buyer (sample size =883) and one subsample in which the equity proportion of the payment is more than 5% of the marketcapitalization of the buyer (sample size = 197). The results for the subsample of transactions in whichthe equity proportion of payment is less than 5% are similar to those shown for the entire sample of U.S.sellers. However, for the subsample of transactions in which the equity proportion of payment exceeds5%, results for the DEBTRATIO, INTCOV, and SIZE variables are not significant. Thus, when sellersare willing to accept an equity payment large enough to make them blockholders, the influence of cashconstraint variables on the method of payment is eliminated. For this unique subsample, it appears thatthe potential influence of bidder cash constraint characteristics is overwhelmed by the desire of sellers toreceive equity. Slovin, Sushka, and Polonchek (2005) suggest that sellers may recognize potential synergiesbetween the assets sold and the bidder, and therefore may prefer to receive equity. Such a preference mightbe especially pronounced when the portion of equity received will make them a blockholder.
8 The number of observations in each model varies based on the availability of the country characteristicvariables.
660 K. Cao and J. Madura/The Financial Review 46 (2011) 643–670
Table 5
Tobit regression explaining the portion of cash financing in asset sell-off transactions of internationalsellersThe estimation is based on a two-boundary Tobit model to reflect lower and upper bound constraints on thepercentage of cash used in the transaction. The z-stats are based on QML (Huber/White) heteroskedasticity-consistent standard errors. CASH is the cash holdings of the bidder scaled by bidder’s market value ofequity as of four weeks prior to the announcement. DEBTRATIO is the bidder’s total liabilities divide bymarket value of equity, as of four weeks prior to the announcement. INTCOV is the interest coverage ratioof the bidder. SIZE is the natural logarithm of market value of equity of bidders, as of four weeks prior tothe announcement. TECHBIDDER equals one if the acquirer is a high-tech firm. CREDITCRISIS equalsone if the transactions happen during 2001–2002 and 2007 crisis. BANKRUPT equals one if the sellercompany is bankrupt or goes bankrupt during the transaction. SUBSIDIARY equals one if the seller isa subsidiary of another company. TOBINQ is the Tobin’s q ratio of the bidder. RELSIZE is the relativesize of the transaction to bidder’s market value of equity, as of four weeks prior to the announcement.COMPETITIVE equals one when multiple bidders exist. MAACTIVITY is the logarithm of total valueof the world mergers and acquisitions market in the previous year. TECHSELLER equals one if the selleris a high-tech firm. RELATED equals one if the bidder and seller have the same four-digit SIC code.CROSSBORDER equals one if the deal is a cross-border deal. FREEDOM is the natural logarithm of theeconomic freedom rating of the seller country. RIGHTS equals one if the antidirector rights index is threeor above. COMMON equals one if the seller is from a country with a British legal tradition.
Model 1 Model 2 Model 3
Variable Coeff. z-Stat Coeff. z-Stat Coeff. z-Stat
Intercept −623.45 (−1.56) 24.71 (0.24) −17.12 (−0.16)CASH 2.07 (3.40)∗∗∗ 2.01 (3.44)∗∗∗ 2.09 (3.47)∗∗∗DEBTRATIO −40.54 (−3.14)∗∗∗ −41.42 (−3.20)∗∗∗ −39.46 (−3.07)∗∗∗INTCOV 0.01 (2.10)∗∗ 0.01 (2.05)∗∗ 0.01 (2.15)∗∗SIZE 8.00 (3.92)∗∗∗ 7.57 (3.74)∗∗∗ 7.98 (3.94)∗∗∗TECHBIDDER −66.18 (−2.32)∗∗ −66.95 (−2.35)∗∗ −67.61 (−2.37)∗∗CREDITCRISIS 2.00 (0.24) 1.96 (0.23) 1.91 (0.23)BANKRUPT 10.69 (0.57) 8.58 (0.46) 7.83 (0.41)SUBSIDIARY 21.68 (1.78)∗ 21.99 (1.80)∗ 22.21 (1.82)∗TOBINQ −8.36 (−4.03)∗∗∗ −8.40 (−4.08)∗∗∗ −8.19 (−4.11)∗∗∗RELSIZE −0.13 (−1.87)∗ −0.13 (−1.88)∗ −0.13 (−1.93)∗∗COMPETITIVE −83.92 (−5.29)∗∗∗ −82.17 (−5.09)∗∗∗ −81.68 (−5.06)∗∗∗MAACTIVITY 3.64 (0.52 2.97 (0.42) 4.64 (0.66)TECHSELLER 37.89 (1.30) 38.04 (1.30) 39.99 (1.37)RELATED −5.69 (−0.88) −5.82 (−0.90) −5.23 (−0.82)CROSSBORDER 8.25 (0.67) 11.65 (0.96) 19.70 (1.58)FREEDOM 153.34 (1.76)∗RIGHTS 36.43 (2.16)∗∗COMMON 49.36 (3.04)∗∗∗
No. of Obs. 1,260 1,251 1,263Scale factor 90.60 90.40 90.19McFadden’s R2 11.67% 11.87% 12.07%
∗∗∗, ∗∗, and ∗ indicate statistical significance at the 0.01, 0.05 and 0.10 level, respectively.
K. Cao and J. Madura/The Financial Review 46 (2011) 643–670 661
There are three models applied, as the three country governance proxies arecorrelated and only one of them is included in any model. Yet, all three models yieldqualitatively similar results for all other variables.
Several variables representing cash constraints are significant, and support hy-potheses regarding how the method of payment is influenced by the cash constraintsof the bidder or seller. The CASH variable is positive and significant, which supportsthe hypothesis that bidders with higher cash holdings are more likely to use cashfinancing in asset selloffs. This supports Martin’s (1996) theory that firms with largeamounts of cash holdings tend to use cash to finance their investments.
The DEBTRATIO variable is negative and significant, which supports the hy-pothesis that bidders with lower leverage finance their investment with a higherproportion of cash. The INTCOV variable is positive and significant, which supportsthe hypothesis that bidders who are in a better position to cover their interest pay-ments rely more heavily on cash to finance their investment. The SIZE variable ispositive and significant, which supports the hypothesis that larger bidders tend torely on a higher proportion of cash, presumably because they have easier access tofunding. The coefficient for TECHBIDDER is significantly negative, which supportsthe hypothesis that bidders in high-tech industries are more likely to use equity asthe method of payment than bidders based in other industries.9 The coefficient of theSUBSIDIARY variable is positive and significant (at the 0.10 level), which offersmodest support for the hypothesis that a greater proportion of cash is used when theassets sold are subsidiaries of other firms. The result is in line with the argument fromFaccio and Masulis (2005) that firms that are selling subsidiaries need cash sincethey often are in financial distress or refocusing their operation in the main businessline.
Next, we focus on results for the variables that reflect asymmetric information.The TOBINQ variable is negative and significant, which supports our hypothesis thatbidders with better growth opportunities are more likely to finance with cash. TheRELSIZE variable is negatively associated with the proportion of cash payment, asexpected. The COMPETITIVE variable is negative and significant, which supportsthe hypothesis that competitive bidding may force or encourage the winning bidderto use equity.
Overall, the results for the expanded sample (including non-U.S. sellers) arevery similar to the sample of U.S. sellers for variables that are tested in both samples.The only exception is that the RELSIZE variable falls short of significant in the
9 We also considered a control variable representing insider ownership of the bidder. Stulz (1988) claimsthat since bidder managers have the desire to maintain corporate control, they prefer to use cash, and willobtain more debt if necessary to finance the cash payment for the target. Martin (1996) and Martynovaand Renneboog (2009) find that cash is more commonly used in acquisitions when the bidder is subjectto greater insider control. We have inside ownership data on the bidder for 426 asset sell-off transactions,and apply our model to the subsample for which data are available. We find that the variable representinginsider ownership is not significant related to the method of payment used for asset sell-off transactions.
662 K. Cao and J. Madura/The Financial Review 46 (2011) 643–670
model applied to the subsample of U.S. sellers (p-value = 0.12), but is significantwhen applied to the sample that includes non-U.S. sellers.
We now turn to the country governance variables that can explain variation in themethod of payment for assets by sellers based in different countries. In model 1, weemploy economic-freedom-rating index in seller countries as an alternative measureof shareholder rights and economic restrictiveness. The coefficient for FREEDOMis positive and significant, and indicates that the bidders are more likely to use equitywhen investing in assets based in countries where the economic freedom rating isrelatively weak. If the value of the logarithm of the economic freedom rating of theseller country increases by 0.1, the estimated proportion of cash payment increasesby 15.3%. In model 2, we use antidirector index as a proxy for shareholder rightsin seller countries. The variable RIGHTS is positively and significantly related tothe proportion of cash used in the payment of the transactions, which suggests thatbidders are more likely to use equity when investing in assets based in countrieswhere the shareholder rights are relatively weak. If the antidirector rights index in theseller country is three or above, there is an increase of 36% in the proportion of cashin the payment. In model 3, the origins of the legal system in seller countries are usedto evaluate the effect of different regulation systems on the method of payment. Thevariable COMMON is positive and significant, which implies a higher proportion ofcash used in common law countries, and therefore a higher proportion of equity usedin noncommon law countries. If the legal system in the seller country is common law,there is a 49% increase in the payment’s proportion of cash. Overall, bidders are morelikely to use equity when sellers are in countries with weak governance, which maysuggest their propensity to induce risk-sharing under those conditions. Furthermore,sellers in countries with weak governance are willing to accept equity from the U.S.bidders, perhaps because it allows them to extend their reach to additional prospectivebidders for their assets.
Overall, we can see that the country characteristic variables have significantimpact on the structure of payment of asset sell-off transactions. The results from theinternational sample indicate that by including the country characteristic variables, theMcFadden’s R2 increases (to 12%). Moreover, the cash constraints, the informationasymmetric, and the country characteristic variables still are significant in explainingthe method of payment in asset sell-off transactions.
The results for the country governance variables primarily could be drivenby differences between the non-U.S. countries and the United States. We want todetermine whether these country governance variables are relevant in explaining themethod of payment among the non-U.S. countries (when excluding the sellers in theUnited States from the sample). Hence, we also apply the model to the non-U.S.seller subsample. The results are reported in Table 6.10
10 The variables COMPETITIVE and BANKRUPT are removed from analysis because there is no obser-vation with multiple bidders in the non-U.S. seller subsample.

K. Cao and J. Madura/The Financial Review 46 (2011) 643–670 663
Table 6
Tobit regression explaining the portion of cash financing in asset sell-off transactions of non-U.S.sellersThe estimation is based on a two-boundary Tobit model to reflect lower and upper bound constraints on thepercentage of cash used in the transaction. The z-stats are based on QML (Huber/White) heteroskedasticity-consistent standard errors. CASH is the cash holdings of the bidder scaled by bidder’s market value ofequity, as of four weeks prior to the announcement. DEBTRATIO is the bidder’s total liabilities divide bymarket value of equity, as of four weeks prior to the announcement. INTCOV is the interest coverage ratioof the bidder. SIZE is the natural logarithm of market value of equity of bidders, as of four weeks prior tothe announcement. TECHBIDDER equals one if the acquirer is a high-tech firm. CREDITCRISIS equalsone if the transactions happen during 2001–2002 and 2007 crisis. SUBSIDIARY equals one if the selleris a subsidiary of another company. TOBINQ is the Tobin’s q ratio of the bidder. RELSIZE is the relativesize of the transaction to bidder’s market value of equity, as of four weeks prior to the announcement.MAACTIVITY is the logarithm of total value of the world mergers and acquisitions market in the previousyear. TECHSELLER equals one if the seller is a high-tech firm. RELATED equals one if the bidder andseller have the same four-digit SIC code. FREEDOM is the natural logarithm of the economic freedomrating of the seller country. RIGHTS equals one if the antidirector rights index is three or above. COMMONequals one if the seller is from a country with a British legal tradition.
Model 1 Model 2 Model 3
Variable Coeff. z-Stat Coeff. z-Stat Coeff. z-Stat
Intercept −907.10 (−1.70)∗ −114.40 (−0.38) −271.87 (−0.91)CASH 10.22 (2.59)∗∗∗ 8.30 (1.96)∗∗ 8.66 (2.39)∗∗DEBTRATIO −26.25 (−0.83) −27.50 (−0.88) −21.94 (−0.72)INTCOV 0.01 (0.05) −0.05 (−0.22) 0.04 (0.25)SIZE 6.87 (1.32) 4.57 (0.93) 7.61 (1.52)TECHBIDDER −73.73 (−1.46) −77.40 (−1.45) −88.19 (−1.76)∗CREDITCRISIS −20.29 (−0.97) −15.02 (−0.71) −16.20 (−0.80)SUBSIDIARY 26.47 (0.98) 28.92 (1.03) 28.22 (1.06)TOBINQ −7.23 (−4.40)∗∗∗ −7.85 (−4.57)∗∗∗ −6.63 (−4.13)∗∗∗RELSIZE −65.20 (−2.76)∗∗∗ −52.97 (−2.06)∗∗ −55.02 (−2.56)∗∗∗MAACTIVITY 22.33 (1.11) 17.85 (0.87) 26.31 (1.31)TECHSELLER 22.16 (0.41) 18.21 (0.32) 39.65 (0.76)RELATED −24.96 (−1.51) −26.28 (−1.55) −22.30 (−1.43)FREEDOM 170.14 (2.08)∗∗RIGHTS 28.94 (1.72)∗COMMON 44.54 (2.63)∗∗∗
No. of Obs. 181 178 183Scale factor 60.53 59.26 59.44McFadden’s R2 46.69% 47.81% 47.65%
∗∗∗, ∗∗, and ∗ indicate statistical significance at the 0.01, 0.05 and 0.10 level, respectively.
For this subsample of asset selloffs in which all sellers are based in non-U.S.countries, we find that country risk variables is significant, which is consistent withresults from the full sample. Again, the results reinforce how bidders prefer that thesellers share in the risk of the transaction when they are based in countries withrelatively weak country governance.
664 K. Cao and J. Madura/The Financial Review 46 (2011) 643–670
Table 7
Tobit regression explaining the portion of cash financing of asset sell-off transactions for Canada,Germany, and U.K. sellersThe estimation is based on a two-boundary Tobit model to reflect lower and upper bound constraints on thepercentage of cash used in the transaction. The z-stats are based on QML (Huber/White) heteroskedasticity-consistent standard errors. CASH is the cash holdings of the bidder scaled by bidder’s market value ofequity, as of four weeks prior to the announcement. DEBTRATIO is the bidder’s total liabilities divide bymarket value of equity, as of four weeks prior to the announcement. INTCOV is the interest coverage ratioof the bidder. SIZE is the natural logarithm of market value of equity of bidders, as of four weeks prior tothe announcement. TECHBIDDER equals one if the acquirer is a high-tech firm. CREDITCRISIS equalsone if the transactions happen during 2001–2002 and 2007 crisis. SUBSIDIARY equals one if the selleris a subsidiary of another company. TOBINQ is the Tobin’s q ratio of the bidder. RELSIZE is the relativesize of the transaction to bidder’s market value of equity, as of four weeks prior to the announcement.MAACTIVITY is the logarithm of total value of the world mergers and acquisitions market in the previousyear. TECHSELLER equals one if the seller is a high-tech firm. RELATED equals one if the bidder andseller have the same four-digit SIC code. FREEDOM is the natural logarithm of the economic freedomrating of the seller country. RIGHTS equals one if the antidirector rights index is three or above. COMMONequals one if the seller is from a country with a British legal tradition.
Model 1 Model 2 Model 3
Variable Coeff. z-Stat Coeff. z-Stat Coeff. z-Stat
Intercept −1944.98 (−1.57) −343.79 (−0.92) −343.79 (−0.92)CASH 7.58 (0.77) 7.26 (1.50) 7.26 (1.50)DEBTRATIO −34.29 (−0.86) −35.34 (−0.88) −35.34 (−0.88)INTCOV −0.40 (−1.62) −0.40 (−1.60) −0.40 (−1.60)SIZE 7.20 (0.76) 7.50 (0.79) 7.50 (0.79)TECHBIDDER −60.92 (−0.69) −60.48 (−0.68) −60.48 (−0.68)CREDITCRISIS 21.51 (0.64) 21.19 (0.63) 21.19 (0.63)SUBSIDIARY −0.50 (−0.01) −0.05 (0.01) −0.05 (0.01)TOBINQ −16.77 (−2.67)∗∗∗ −17.13 (−2.72)∗∗∗ −17.13 (−2.72)∗∗∗RELSIZE −68.14 (−2.50)∗∗ −67.71 (−2.49)∗∗ −67.71 (−2.49)∗∗MAACTIVITY 34.90 (1.29) 34.56 (1.28) 34.56 (1.28)TECHSELLER 4.13 (0.05) 4.03 (0.04) 4.03 (0.04)RELATED −7.01 (−0.30) −7.18 (−0.31) −7.18 (−0.31)FREEDOM 375.94 (1.53)RIGHTS 38.49 (1.45)COMMON 38.49 (1.45)
No. of Obs. 102 102 102Scale factor 55.82 55.80 55.80McFadden’s R2 22.93% 22.96% 22.96%
∗∗∗ and ∗∗ indicate statistical significance at the 0.01 and 0.05 level, respectively.
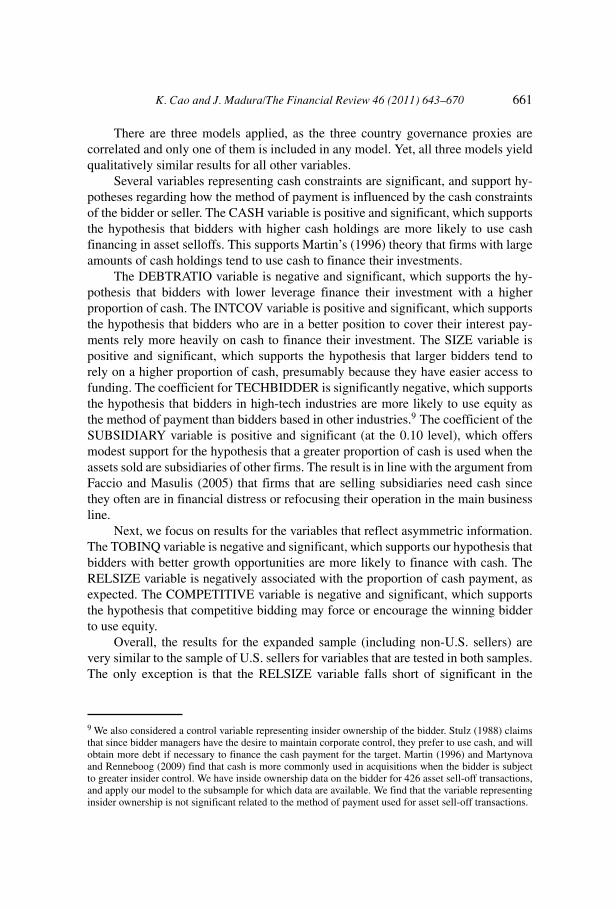
As an additional robustness check, we partition the subsample of non-U.S.sellers into countries with very strong governance versus the other countries. For thesubsample of non-U.S. sellers in countries with very strong governance, each of thethree country risk variables becomes nonsignificant. Thus, the significant impact of
K. Cao and J. Madura/The Financial Review 46 (2011) 643–670 665
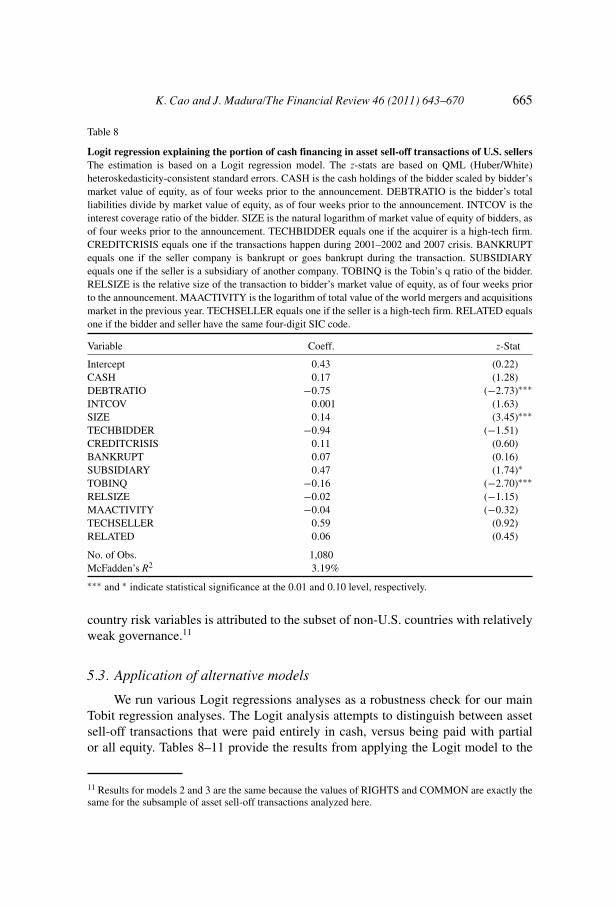
Table 8
Logit regression explaining the portion of cash financing in asset sell-off transactions of U.S. sellersThe estimation is based on a Logit regression model. The z-stats are based on QML (Huber/White)heteroskedasticity-consistent standard errors. CASH is the cash holdings of the bidder scaled by bidder’smarket value of equity, as of four weeks prior to the announcement. DEBTRATIO is the bidder’s totalliabilities divide by market value of equity, as of four weeks prior to the announcement. INTCOV is theinterest coverage ratio of the bidder. SIZE is the natural logarithm of market value of equity of bidders, asof four weeks prior to the announcement. TECHBIDDER equals one if the acquirer is a high-tech firm.CREDITCRISIS equals one if the transactions happen during 2001–2002 and 2007 crisis. BANKRUPTequals one if the seller company is bankrupt or goes bankrupt during the transaction. SUBSIDIARYequals one if the seller is a subsidiary of another company. TOBINQ is the Tobin’s q ratio of the bidder.RELSIZE is the relative size of the transaction to bidder’s market value of equity, as of four weeks priorto the announcement. MAACTIVITY is the logarithm of total value of the world mergers and acquisitionsmarket in the previous year. TECHSELLER equals one if the seller is a high-tech firm. RELATED equalsone if the bidder and seller have the same four-digit SIC code.
Variable Coeff. z-Stat
Intercept 0.43 (0.22)CASH 0.17 (1.28)DEBTRATIO −0.75 (−2.73)∗∗∗INTCOV 0.001 (1.63)SIZE 0.14 (3.45)∗∗∗TECHBIDDER −0.94 (−1.51)CREDITCRISIS 0.11 (0.60)BANKRUPT 0.07 (0.16)SUBSIDIARY 0.47 (1.74)∗TOBINQ −0.16 (−2.70)∗∗∗RELSIZE −0.02 (−1.15)MAACTIVITY −0.04 (−0.32)TECHSELLER 0.59 (0.92)RELATED 0.06 (0.45)
No. of Obs. 1,080McFadden’s R2 3.19%
∗∗∗ and ∗ indicate statistical significance at the 0.01 and 0.10 level, respectively.
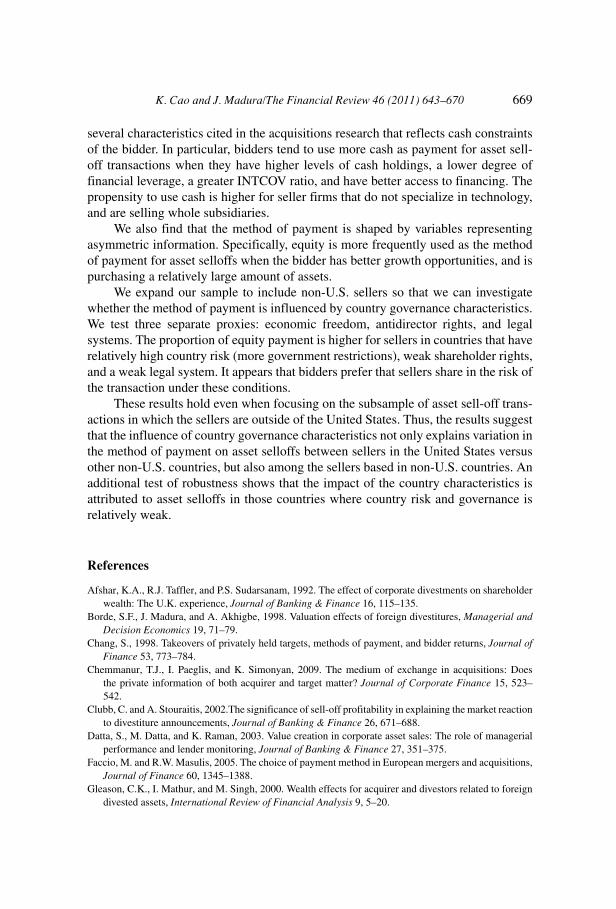
country risk variables is attributed to the subset of non-U.S. countries with relativelyweak governance.11
5.3. Application of alternative models
We run various Logit regressions analyses as a robustness check for our mainTobit regression analyses. The Logit analysis attempts to distinguish between assetsell-off transactions that were paid entirely in cash, versus being paid with partialor all equity. Tables 8–11 provide the results from applying the Logit model to the
11 Results for models 2 and 3 are the same because the values of RIGHTS and COMMON are exactly thesame for the subsample of asset sell-off transactions analyzed here.

666 K. Cao and J. Madura/The Financial Review 46 (2011) 643–670
Table 9
Logit regression explaining the portion of cash financing in asset sell-off transactions of internationalsellersThe estimation is based on a Logit regression model. The z-stats are based on QML (Huber/White)heteroskedasticity-consistent standard errors. CASH is the cash holdings of the bidder scaled by bidder’smarket value of equity, as of four weeks prior to the announcement. DEBTRATIO is the bidder’s totalliabilities divide by market value of equity, as of four weeks prior to the announcement. INTCOV is theinterest coverage ratio of the bidder. SIZE is the natural logarithm of market value of equity of bidders,as of 4 weeks prior to the announcement. TECHBIDDER equals one if the acquirer is a high-tech firm.CREDITCRISIS equals one if the transactions happen during 2001–2002 and 2007 crisis. BANKRUPTequals one if the seller company is bankrupt or goes bankrupt during the transaction. SUBSIDIARYequals one if the seller is a subsidiary of another company. TOBINQ is the Tobin’s q ratio of the bidder.RELSIZE is the relative size of the transaction to bidder’s market value of equity, as of four weeks priorto the announcement. MAACTIVITY is the logarithm of total value of the world mergers and acquisitionsmarket in the previous year. TECHSELLER equals one if the seller is a high-tech firm. RELATED equalsone if the bidder and seller have the same four-digit SIC code, 0 otherwise. CROSSBORDER equals oneif the deal is a cross-border deal. FREEDOM is the natural logarithm of the economic freedom rating ofthe seller country. RIGHTS equals one if the antidirector rights index is three or above. COMMON equalsone if the seller is from a country with a British legal tradition.
Model 1 Model 2 Model 3
Variable Coeff. z-Stat Coeff. z-Stat Coeff. z-Stat
Intercept −12.32 (−1.69)∗ −0.60 (−0.32) −1.15 (−0.62)CASH 0.04 (1.68)∗ 0.04 (1.72)∗ 0.04 (1.67)∗DEBTRATIO −0.76 (−2.99)∗∗∗ −0.77 (−3.01)∗∗∗ −0.74 (−2.95)∗∗∗INTCOV 0.001 (1.62) 0.001 (1.58) 0.001 (1.64)SIZE 0.14 (3.71)∗∗∗ 0.14 (3.59)∗∗∗ 0.14 (3.76)∗∗∗TECHBIDDER −1.01 (−1.79)∗ −1.01 (−1.78)∗ −1.03 (−1.82)∗CREDITCRISIS 0.08 (0.47) 0.08 (0.50) 0.08 (0.46)BANKRUPT −0.13 (−0.31) −0.16 (−0.38) −0.17 (−0.39)SUBSIDIARY 0.40 (1.62) 0.43 (1.74)∗ 0.41 (1.68)∗TOBINQ −0.15 (−3.04)∗∗∗ −0.15 (−3.04)∗∗∗ −0.16 (−3.15)∗∗∗RELSIZE −0.003 (−1.07) −0.003 (−1.08) −0.003 (−1.07)MAACTIVITY −0.001 (−0.01) −0.01 (−0.09) 0.02 (0.13)TECHSELLER 0.58 (1.00) 0.56 (0.97) 0.60 (1.04)RELATED −0.02 (−0.18) −0.02 (−0.16) −0.01 (−0.09)CROSSBORDER 0.20 (0.89) 0.27 (1.25) 0.37 (1.61)FREEDOM 2.81 (1.76)∗RIGHTS 0.73 (2.36)∗∗COMMON 0.85 (2.84)∗∗∗
No. of Obs. 1,260 1,251 1,263McFadden’s R2 3.34% 3.47% 3.68%
∗∗∗, ∗∗, and ∗ indicate statistical significance at the 0.01, 0.05 and 0.10 level, respectively.
various samples. These four tables correspond to the same samples for which theTobit model was applied, and those results were reported in the same order in Tables4–7. When applying the Logit model to our samples, the fit of the model is lower thanwhen applying the Tobit model, as the dependent variable used in the Tobit models is

K. Cao and J. Madura/The Financial Review 46 (2011) 643–670 667
Table 10
Logit regression explaining the portion of cash financing in asset sell-off transactions of non-U.S.sellersThe estimation is based on a Logit regression model. The z-stats are based on QML (Huber/White)heteroskedasticity-consistent standard errors. CASH is the cash holdings of the bidder scaled by bidder’smarket value of equity, as of four weeks prior to the announcement. DEBTRATIO is the bidder’s totalliabilities divide by market value of equity, as of four weeks prior to the announcement. INTCOV is theinterest coverage ratio of the bidder. SIZE is the natural logarithm of market value of equity of bidders, asof four weeks prior to the announcement. TECHBIDDER equals one if the acquirer is a high-tech firm.CREDITCRISIS equals one if the transactions happen during 2001–2002 and 2007 crisis. SUBSIDIARYequals one if the seller is a subsidiary of another company. TOBINQ is the Tobin’s q ratio of the bidder.RELSIZE is the relative size of the transaction to bidder’s market value of equity, as of four weeks priorto the announcement. MAACTIVITY is the logarithm of total value of the world mergers and acquisitionsmarket in the previous year. TECHSELLER equals one if the seller is a high-tech firm. RELATED equalsone if the bidder and seller have the same four-digit SIC code. FREEDOM is the natural logarithm of theeconomic freedom rating of the seller country. RIGHTS equals one if the antidirector rights index is threeor above. COMMON equals one if the seller is from a country with a British legal tradition.
Model 1 Model 2 Model 3
Variable Coeff. z-Stat Coeff. z-Stat Coeff. z-Stat
Intercept −19.21 (−1.86)∗ −3.89 (−0.63) −7.52 (−1.26)CASH 0.20 (1.69)∗ 0.16 (1.41) 0.19 (1.63)DEBTRATIO −0.86 (−1.07) −0.94 (−1.21) −0.76 (−1.06)INTCOV 0.001 (0.08) −0.001 (−0.32) 0.001 (0.11)SIZE 0.10 (0.94) 0.06 (0.56) 0.11 (1.06)TECHBIDDER −0.54 (−0.51) −0.58 (−0.52) −0.59 (−0.56)CREDITCRISIS −0.37 (−0.87) −0.30 (−0.67) −0.38 (−0.86)SUBSIDIARY 0.36 (0.62) 0.49 (0.77) 0.44 (0.77)TOBINQ −0.14 (−1.80)∗ −0.15 (−1.87)∗ −0.17 (−2.05)∗∗RELSIZE −1.32 (−1.80)∗ −1.04 (−1.46) −1.22 (−1.74)∗MAACTIVITY 0.41 (1.03) 0.33 (0.78) 0.54 (1.33)TECHSELLER −0.53 (−0.47) −0.57 (−0.48) −0.40 (−0.36)RELATED −0.39 (−1.12) −0.48 (−1.32) −0.33 (−0.94)FREEDOM 3.30 (1.94)∗∗RIGHTS 0.52 (1.43)COMMON 0.78 (2.19)∗∗
No. of Obs. 181 178 183McFadden’s R2 10.11% 9.77% 11.21%
∗∗ and ∗ indicate statistical significance at the 0.05 and 0.10 level, respectively.
more precise. When the Logit model is applied to the sample of U.S. sellers and to theexpanded sample that includes non-U.S. sellers, the INTCOV and COMPETITIVEvariables become nonsignificant. The three country characteristics remain significantin the expanded sample when applying the Logit model.
When applying Logit to the sample of non-U.S. sellers, the results are verysimilar to results from applying the Tobit model, although one country variable(RIGHTS) falls short of being significant (z-stat = 1.43). When applying Logitto the subsample of asset sell-off transactions in countries with good governance,

668 K. Cao and J. Madura/The Financial Review 46 (2011) 643–670
Table 11
Logit regression explaining the portion of cash financing of asset sell-off transactions for Canada,Germany, and U.K. sellersThe estimation is based on a Logit regression model. The z-stats are based on QML (Huber/White)heteroskedasticity-consistent standard errors. CASH is the cash holdings of the bidder scaled by bidder’smarket value of equity, as of four weeks prior to the announcement. DEBTRATIO is the bidder’s totalliabilities divide by market value of equity, as of four weeks prior to the announcement. INTCOV is theinterest coverage ratio of the bidder. SIZE is the natural logarithm of market value of equity of bidders, asof four weeks prior to the announcement. TECHBIDDER equals one if the acquirer is a high-tech firm.CREDITCRISIS equals one if the transactions happen during 2001–2002 and 2007 crisis. SUBSIDIARYequals one if the seller is a subsidiary of another company. TOBINQ is the Tobin’s q ratio of the bidder.RELSIZE is the relative size of the transaction to bidder’s market value of equity, as of four weeks priorto the announcement. MAACTIVITY is the logarithm of total value of the world mergers and acquisitionsmarket in the previous year. TECHSELLER equals one if the seller is a high-tech firm. RELATED equalsone if the bidder and seller have the same four-digit SIC code. FREEDOM is the natural logarithm of theeconomic freedom rating of the seller country. RIGHTS equals one if the antidirector rights index is threeor above. COMMON equals one if the seller is from a country with a British legal tradition.
Model 1 Model 2 Model 3
Variable Coeff. z-Stat Coeff. z-Stat Coeff. z-Stat
Intercept −16.50 (−1.17) −3.91 (−0.82) −3.91 (−0.82)CASH 0.10 (0.08) 0.08 (1.42) 0.08 (1.42)DEBTRATIO −0.74 (−1.01) −0.74 (−1.07) −0.74 (−1.07)INTCOV −0.01 (−1.33) −0.01 (−1.33) −0.01 (−1.33)SIZE 0.08 (0.72) 0.08 (0.73) 0.08 (0.73)TECHBIDDER −0.21 (−0.22) −0.19 (−0.19) −0.19 (−0.19)CREDITCRISIS 0.30 (0.75) 0.30 (0.75) 0.30 (0.75)SUBSIDIARY −0.21 (−0.34) −0.21 (−0.34) −0.21 (−0.34)TOBINQ −0.23 (−1.94)∗ −0.23 (−1.99)∗∗ −0.23 (−1.99)∗∗RELSIZE −0.79 (−1.67)∗ −0.79 (1.67)∗ −0.79 (1.67)∗MAACTIVITY 0.35 (1.07) 0.34 (1.04) 0.34 (1.04)TECHSELLER −0.55 (−0.54) −0.56 (−0.55) −0.56 (−0.55)RELATED −0.15 (−0.46) −0.15 (−0.47) −0.15 (−0.47)FREEDOM 2.93 (1.00)RIGHTS 0.27 (0.86)COMMON 0.27 (0.86)
No. of Obs. 102 102 102McFadden’s R2 17.50% 17.36% 17.36%
∗∗ and ∗ indicate statistical significance at the 0.05 and 0.10 level, respectively.
the results are very similar to those found when applying Tobit analysis to thatsubsample. Overall, the results reinforce our findings regarding the characteristicsthat significantly impact the method of payment in asset sell-off transactions.
6. Conclusions
Using a sample of asset sell-off transactions from January 1990 to April 2010, wefind that the method of payment used in asset sell-off transactions is associated with
K. Cao and J. Madura/The Financial Review 46 (2011) 643–670 669
several characteristics cited in the acquisitions research that reflects cash constraintsof the bidder. In particular, bidders tend to use more cash as payment for asset sell-off transactions when they have higher levels of cash holdings, a lower degree offinancial leverage, a greater INTCOV ratio, and have better access to financing. Thepropensity to use cash is higher for seller firms that do not specialize in technology,and are selling whole subsidiaries.
We also find that the method of payment is shaped by variables representingasymmetric information. Specifically, equity is more frequently used as the methodof payment for asset selloffs when the bidder has better growth opportunities, and ispurchasing a relatively large amount of assets.
We expand our sample to include non-U.S. sellers so that we can investigatewhether the method of payment is influenced by country governance characteristics.We test three separate proxies: economic freedom, antidirector rights, and legalsystems. The proportion of equity payment is higher for sellers in countries that haverelatively high country risk (more government restrictions), weak shareholder rights,and a weak legal system. It appears that bidders prefer that sellers share in the risk ofthe transaction under these conditions.
These results hold even when focusing on the subsample of asset sell-off trans-actions in which the sellers are outside of the United States. Thus, the results suggestthat the influence of country governance characteristics not only explains variation inthe method of payment on asset selloffs between sellers in the United States versusother non-U.S. countries, but also among the sellers based in non-U.S. countries. Anadditional test of robustness shows that the impact of the country characteristics isattributed to asset selloffs in those countries where country risk and governance isrelatively weak.
References
Afshar, K.A., R.J. Taffler, and P.S. Sudarsanam, 1992. The effect of corporate divestments on shareholderwealth: The U.K. experience, Journal of Banking & Finance 16, 115–135.
Borde, S.F., J. Madura, and A. Akhigbe, 1998. Valuation effects of foreign divestitures, Managerial andDecision Economics 19, 71–79.
Chang, S., 1998. Takeovers of privately held targets, methods of payment, and bidder returns, Journal ofFinance 53, 773–784.
Chemmanur, T.J., I. Paeglis, and K. Simonyan, 2009. The medium of exchange in acquisitions: Doesthe private information of both acquirer and target matter? Journal of Corporate Finance 15, 523–542.
Clubb, C. and A. Stouraitis, 2002.The significance of sell-off profitability in explaining the market reactionto divestiture announcements, Journal of Banking & Finance 26, 671–688.
Datta, S., M. Datta, and K. Raman, 2003. Value creation in corporate asset sales: The role of managerialperformance and lender monitoring, Journal of Banking & Finance 27, 351–375.
Faccio, M. and R.W. Masulis, 2005. The choice of payment method in European mergers and acquisitions,Journal of Finance 60, 1345–1388.
Gleason, C.K., I. Mathur, and M. Singh, 2000. Wealth effects for acquirer and divestors related to foreigndivested assets, International Review of Financial Analysis 9, 5–20.

670 K. Cao and J. Madura/The Financial Review 46 (2011) 643–670
Guedhami, O. and D. Mishra, 2009. Excess control, corporate governance and implied cost of equity:International evidence, The Financial Review 44, 489–524.
Gwartney, J.D., R.A. Lawson, and S. Norton, 1996. Economic freedom of the world: 1996 annual report.The Fraser Institute, Vancouver.
Hansen, R.G, 1987. A theory for the choice of exchange medium in mergers and acquisitions, Journal ofBusiness 60, 75–95.
Hege, U., S. Love, M.B. Slovin, and M.E. Sushka, 2009. Equity and cash in intercorporate asset sales:Theory and evidence, Review of Financial Studies 22, 681–714.
Henisz, W., 2000. The institutional environment for multinational investment, Journal of Law, Economics,and Organization 16, 334–364.
Hite, G.L., J.E. Owers, and R.C. Rogers, 1987. The market for interim asset sales: Partial sell-offs andtotal liquidations, Journal of Financial Economics 18, 229–252.
Jain, P.C., 1985. The effect of voluntary sell-off announcements on shareholder wealth, Journal of Finance40, 209–224.
John, K. and E. Ofek, 1995. Asset sales and increase in focus, Journal of Financial Economics 37, 105–126.Jung, K., Y.C. Kim, and R.M. Stulz, 1996. Timing, investment opportunities, managerial discretion, and
the security issue decision, Journal of Financial Economics 42, 159–185.La Porta, R., F. Lopez-de-Silanes, A. Shleifer, and R.W. Vishny, 1997. Legal determinants of external
finance, Journal of Finance 52, 1131–1150.Martin, K.J., 1996. The method of payment in corporate acquisitions, investment opportunities, and
management ownership, Journal of Finance 51, 1227–1246.Martynova, M. and L. Renneboog, 2009. What determines the financing decision in corporate takeovers:
Cost of capital, agency problems, or the means of payment? Journal of Corporate Finance 15, 290–315.Moeller, S.B. and F.P. Schlingemann, 2005. Global diversification and bidder gains: A comparison between
cross-border and domestic acquisitions, Journal of Banking & Finance 29, 533–564.Myers, S.C., 1977. Determinants of corporate borrowing, Journal of Financial Economics 5, 147–175.Myers, S.C., 1984. The capital structure puzzle, Journal of Finance 39, 575–592.Parnes, D., 2009. The corporate acquisition policy of financially distressed firms, The Financial Review
44, 603–623.Rossi, S. and F. Volpin, 2004. Cross-country determinants of mergers and acquisitions, Journal of Financial
Economics 74, 277–304.Sicherman, N.W. and R.H. Pettway, 1987. Acquisition of divested assets and shareholders’ wealth, Journal
of Finance 42, 1261–1273.Sicherman, N.W. and R.H. Pettway, 1992. Wealth effects for buyers and sellers of the same divested assets,
Financial Management 21, 119–128.Slovin, M., M. Sushka, and J. Polonchek, 2005. Methods of payment in asset sales: Contracting with
equity versus cash, Journal of Finance 60, 2385–2407.Stiglitz, J.E., 2000. The contributions of the economics of information to twentieth century economics,
Quarterly Journal of Economics 115, 1441–1478.Stulz, R.M., 1988. Managerial control of voting rights: Financing policies and the market for corporate
control, Journal of Financial Economics 20, 25–54.Travlos, N.G., 1987. Corporate takeover bids, method of payment, and bidding firms’ stock returns,
Journal of Finance 42, 943–963.Tsetsekos, G.P. and M.J. Gombola, 1992. Foreign and domestic divestments: Evidence on valuation effects
of plant closings, Journal of International Business Studies 23, 203–223.Warusawitharana, M., 2008. Corporate asset purchases and sales: Theory and evidence, Journal of Finan-
cial Economics 87, 471–497.