Determinación del efecto antidiarreico en ratones albinos del ...
Upload
khangminh22Category
view
2download
0
Determinación del efecto de la deficiencia de vitamina A sobre la homeostasis del hierro y su estado en modelo murino
Mauricio Restrepo Gallego, MSc
Director: Luis Eduardo Díaz Barrera, PhD
Universidad de La Sabana Doctorado en Biociencias
Facultad de Medicina / Facultad de Ingeniería Julio de 2020
Determinación del efecto de la deficiencia de vitamina A sobre la homeostasis del hierro y su estado en modelo murino
Mauricio Restrepo Gallego, MSc
Director: Luis Eduardo Díaz Barrera, PhD
Trabajo de tesis, presentado como requisito para optar al título de Doctor en Biociencias
Universidad de La Sabana Doctorado en Biociencias
Facultad de Medicina / Facultad de Ingeniería Julio de 2020

A Gustavo y Estela, mis padres, que siempre han creído en mí
y me han apoyado en todos mis proyectos por más descabellados que parezcan.
AGRADECIMIENTOS
Si, otra vez a mis padres, ellos se merecen dedicatorias, agradecimientos y todo lo bueno que pueda existir, soy quien soy por ellos, por su dedicación, amor y entrega incondicional. A Dios, por iluminarme y enviarme su Espíritu para infundirme sabiduría, entendimiento, inspiración y paciencia, mucha paciencia. A toda mi familia, paterna y materna, por su compañía, su preocupación y su cercanía. A mis amigos del alma por entender esta pasión por el estudio que, a veces, me tuvo un poco ausente de sus vidas. A mis maestros, a todos, especialmente Ángela, Isabel y Laura que me hicieron enamorar más de la Química; Ana María y Miguel, mis “padrinos mágicos” durante mi camino por Chile y mi formación en Nutrición; Patrícia por sua ajuda durante o meu estágio. A mis alumnos, actuales y antiguos, porque han sido, son y espero sigan siendo ese motor que me anima a mantenerme actualizado y vigente, y porque me siguen demostrando que nunca se pierde lo que se hace. A María Consuelo Tarazona, por insistir hasta que me convenció de embarcarme en esta tarea de formarme como Doctor en Biociencias y por sembrar la semilla para el tema de investigación. A mi director y amigo, Luis Eduardo Díaz por su paciencia y acompañamiento en todos los momentos, especialmente en los más complejos durante esta etapa de formación. A mi jefe, John Jaime Restrepo, por brindarme el tiempo y espacio necesarios para cumplir con todos los objetivos de esta etapa de mi vida. A mis compañeros de Ingredientes y Productos Funcionales, IPF, por su comprensión cuando mis obligaciones académicas no me permitían responder a tiempo con mis responsabilidades laborales. A Colciencias y la Universidad de La Sabana por el apoyo financiero para la realización de este Doctorado.

CONTENIDO RESUMEN .................................................................................................................................................... 10
ABSTRACT .................................................................................................................................................... 12
LISTA DE ABREVIATURAS ............................................................................................................................. 14
1. INTRODUCCIÓN ................................................................................................................................... 15
1.1. ESTADO DEL ARTE........................................................................................................................ 16
1.1.1. Hierro ................................................................................................................................... 16
1.1.1.1. Generalidades .............................................................................................................. 16
1.1.1.2. Digestión, absorción y eflujo ....................................................................................... 17
1.1.1.3. Proteínas asociadas al metabolismo del hierro........................................................... 18
1.1.1.4. Regulación ................................................................................................................... 21
1.1.1.5. Interacción con otros nutrientes ................................................................................. 25
1.1.2. Vitamina A ........................................................................................................................... 25
1.1.2.1. Generalidades .............................................................................................................. 25
1.1.2.2. Digestión, absorción y eflujo ....................................................................................... 26
1.1.3. Anemia................................................................................................................................. 27
1.1.3.1. Definición ..................................................................................................................... 27
1.1.3.2. Epidemiología .............................................................................................................. 28
1.1.3.3. Anemia por deficiencia de hierro ................................................................................ 29
1.1.4. Vitamina A, hierro y anemia ................................................................................................ 30
1.1.4.1. Vitamina A y marcadores de homeostasis del hierro .................................................. 34
1.1.5. El modelo animal en investigaciones sobre nutrición ......................................................... 35
1.2. JUSTIFICACIÓN Y PREGUNTA DE INVESTIGACIÓN ....................................................................... 36
1.3. OBJETIVOS ................................................................................................................................... 37
1.3.1. General ................................................................................................................................ 37
1.3.2. Específicos ........................................................................................................................... 37
1.4. METODOLOGÍA ............................................................................................................................ 37
1.4.1. Materiales y métodos .......................................................................................................... 37
1.4.1.1. Animales y dietas ......................................................................................................... 37
1.4.1.2. Parámetros bioquímicos .............................................................................................. 39
1.4.1.3. Parámetros hematológicos ......................................................................................... 39
1.4.1.4. qRT-PCR ....................................................................................................................... 40
1.4.1.5. Western-Blot ............................................................................................................... 42
1.4.1.6. Análisis estadístico ...................................................................................................... 44
1.5. PRODUCCIÓN CIENTÍFICA DERIVADA DE LA INVESTIGACIÓN ..................................................... 44
2. INFLUENCIA DE LA VITAMINA DIETARIA Y LA DEFICIENCIA DE HIERRO SOBRE LA GANANCIA DE PESO Y ALGUNOS PARÁMETROS HEMATOLÓGICOS EN RATAS WISTAR MACHO JÓVENES ................................ 46
2.1. RESULTADOS................................................................................................................................ 46
2.1.1. Parámetros bioquímicos...................................................................................................... 46
2.1.2. Parámetros hematológicos ................................................................................................. 47
2.1.3. Ingesta de alimento y peso corporal ................................................................................... 48
2.2. DISCUSIÓN ................................................................................................................................... 49
2.2.1. Parámetros bioquímicos...................................................................................................... 49
2.2.2. Parámetros hematológicos ................................................................................................. 49
2.2.3. Peso corporal ....................................................................................................................... 52
2.3. CONCLUSIONES ........................................................................................................................... 53
3. EFECTO DE LAS VARIACIONES DIETARIAS DE HIERRO Y VITAMINA A SOBRE LA EXPRESIÓN DEL RNAm DE LA HORMONA HEPCIDINA Y OTROS MARCADORES DEL METABOLISMO DEL HIERRO EN RATAS WISTAR MACHO JÓVENES ........................................................................................................................................ 55
3.1. RESULTADOS................................................................................................................................ 55
3.2. DISCUSIÓN ................................................................................................................................... 58
3.3. CONCLUSIÓN ............................................................................................................................... 62
4. EXPRESIÓN DE FERRITINA Y RECEPTOR DE TRANSFERRINA EN RATAS WISTAR MACHO JÓVENES BAJO DIFERENTES NIVELES DIETARIOS DE HIERRO Y VITAMINA A ...................................................................... 63
4.1. RESULTADOS................................................................................................................................ 63
4.2. DISCUSIÓN ................................................................................................................................... 65
4.3. CONCLUSIÓN ............................................................................................................................... 67
5. DISCUSIÓN GENERAL ........................................................................................................................... 68
5.1. RECOMENDACIONES ................................................................................................................... 71
REFERENCIAS ............................................................................................................................................... 72
LISTA DE TABLAS Tabla 1. Puntos de corte de los valores de hemoglobina y ferritina para definir anemia, ID e IDA. .......... 27 Tabla 2. Prevalencia de anemia en 2011 por región ................................................................................... 28 Tabla 3. Prevalencias de ID, anemia nutricional y VAD en niños en Colombia entre 2010 y 2015 ............. 29 Tabla 4. Clasificación de la ID y la IDA ......................................................................................................... 29 Tabla 5. Composición y perfil nutricional de las dietas empleadas ............................................................ 39 Tabla 6. Genes analizados por tejido .......................................................................................................... 41 Tabla 7. Primers empleados para la qRT-PCR ............................................................................................. 41 Tabla 8. Anticuerpos primarios ................................................................................................................... 43 Tabla 9. Anticuerpos secundarios ............................................................................................................... 43 Tabla 10. Resultados de los parámetros bioquímicos ................................................................................. 47 Tabla 11. Resultados de los parámetros hematológicos ............................................................................. 47 Tabla 12. Clasificación de ratas Wistar macho de nueve semanas según su peso corporal ....................... 52
LISTA DE FIGURAS
Figura 1. Absorción de hierro en el enterocito y su transporte al torrente sanguíneo. ............................. 18 Figura 2. Representación esquemática de la regulación del hierro (Fe) por hepcidina (Hep) y su efecto sobre ferroportina (FPN) ............................................................................................................................. 22 Figura 3. Regulación de la expresión de hepcidina ..................................................................................... 23 Figura 4. Representación de la regulación de la homeostasis del hierro por el sistema IRE/IRP ............... 24 Figura 5. Estructuras de la vitamina A (retinol), sus principales derivados y betacaroteno ....................... 25 Figura 6. Absorción y transporte de la vitamina A ...................................................................................... 26 Figura 7. Protocolo de extracción de mRNA con reactivo TRIzol. ............................................................... 40 Figura 8. Condiciones de la qRT-PCR en el equipo CFX96 Touch™ ............................................................. 42 Figura 9. Curvas de ganancia en peso de las ratas bajo las dietas experimentales comparadas con el grupo control. .............................................................................................................................................. 48 Figura 10. Expresión relativa de los niveles de Il6 en hígado. ..................................................................... 55 Figura 11. Expresión relativa de los niveles de Hamp en hígado. ............................................................... 56 Figura 12. Expresión relativa de los niveles de Ireb2 en duodeno. ............................................................. 56 Figura 13. Expresión relativa de los niveles de Ireb2 en bazo..................................................................... 57 Figura 14. Expresión relativa de los niveles de FTH1 en duodeno. ............................................................. 57 Figura 15. Expresión relativa de los niveles de FTH1 en bazo. .................................................................... 58 Figura 16. Expresión relativa de los niveles de Tfrc en bazo. ...................................................................... 58 Figura 17. Mapa de calor para la expresión relativa de todos los genes en los grupos experimentales. ... 61 Figura 18. Efecto combinado de un adecuado suministro de hierro y vitamina A sobre la expresión del RNAm de algunos marcadores de la homeostasis del hierro ..................................................................... 61 Figura 19. Expresión relativa de interleukina-6 (IL6) (a), ferritina (Fn) (b), receptor de transferrina (TfR) (c) en hígado ..................................................................................................................................................... 64 Figura 20. Expresión relativa de ferritina (Fn) (a) y receptor de transferrina (TfR) (b) en bazo ................ 65 Figura 21. Expresión relativa de ferritina (Fn) en duodeno ........................................................................ 65 Figura 22. Representación del efecto de la VAD sobre la expresión de las principales proteínas asociadas al almacenamiento y transporte del hierro. ............................................................................................... 70
LISTA DE ANEXOS
ANEXO 1. Influence of Dietary Vitamin A and Iron Deficiency on Hematologic Parameters and Body
Weight of Young Male Wistar Rats .................................................................................................... 78
ANEXO 2. Vitamin A does not influence mRNA expression of hormone hepcidin but other
biomarkers of iron homeostasis in young male Wistar rats .............................................................. 85
ANEXO 3. Classic and emergent indicators for the assessment of human iron status ...................... 94
ANEXO 4. Vitamin A deficiency influences expression of ferritin in young male Wistar rats .......... 109
ANEXO 5. Certificado de participación en el VII Congreso Internacional del Colegio Colombiano de
Gastroenterología,Hepatología y Nutrición Pediátrica .................................................................... 120

10
RESUMEN
La anemia por deficiencia de hierro (IDA) y la deficiencia de vitamina A (VAD) hacen parte del grupo de las
deficiencias por micronutrientes definidas por la OMS como de interés mundial. En el caso de Colombia,
la prevalencia de IDA en niños de 1 a 4 años es de 14.8% y la anemia está en 24.7% para niños entre 6 y 59
meses, algo paradójico si se tiene en cuenta que desde 1996 es obligatorio fortificar la harina de trigo con
hierro. De otro lado, la prevalencia de VAD es de 27.3% para el mismo grupo poblacional, en este caso
hasta el día de hoy no existe ningún tipo de fortificación obligatoria en el país.
Las interacciones entre nutrientes no son algo desconocido en el campo de la salud y la nutrición, la más
reconocida es la existente entre calcio y vitamina D; además, existe evidencia desde el punto de vista
epidemiológico de que la VAD y la ID tienen algún tipo de relación, hecho que ha sido soportado por
algunos estudios en modelos celulares y animales.
Este estudio parte de la hipótesis de que la vitamina A regula de alguna forma la homeostasis del hierro y
su rol metabólico, y aborda tres enfoques: ganancia de peso, parámetros bioquímicos y hematológicos y
biomarcadores de la homeostasis del hierro.
Para abordar el problema, se diseñó un estudio con cuatro dietas experimentales con diferentes relaciones
de hierro y vitamina A (suficiencia, insuficiencia y deficiencia) y una dieta control que brindaba un aporte
suficiente a los animales. Estadísticamente se determinó el tamaño apropiado de grupos, resultando en
siete animales por grupo para un total de 35 animales. Las ratas iniciaron el experimento al momento del
destete (21 días) y recibieron alimentación y agua ad libitum durante seis semanas, durante este tiempo
se registraron los consumos del alimento y el peso de los animales cada semana. Posteriormente fueron
sacrificados y se tomaron muestras de sangre y de los tejidos de interés (hígado, bazo y duodeno) para los
11
análisis posteriores de: parámetros bioquímicos y hematológicos en sangra y pruebas de PCR y Western
Blot en los tejidos con el fin de analizar las proteínas de interés (hepcidina, ferritina, receptores de
transferrina, transferrina e interleucina-6).
Se encontró que, efectivamente, la VAD, aún con un adecuado suministro de hierro tiene un efecto
deletéreo sobre la ganancia de peso, los niveles de hierro sérico, el recuento de reticulocitos, la proteína
reguladora de hierro 2 (IRP2) y los receptores de transferrina en un nivel post-transcripcional y ferritina
en un nivel post-traduccional.
Si bien no es suficiente evidencia para soportar un cambio de políticas públicas en fortificación con
micronutrientes, se espera que estos resultados alienten más investigaciones y atraigan la mirada del
sector público para diseñar nuevas estrategias que permitan la reducción de la IDA y la VAD en población
infantil en los próximos años.
12
ABSTRACT
Iron deficiency anemia (IDA) and vitamin A deficiency (VAD) belong to the micronutrient deficiencies
defined by the WHO as worldwide concern. In Colombia, IDA prevalence for children from 1 to 4 years old
is 14.8% and anemia is 24.7% for children from 6 to 59 months old, it is remarkable in a country where is
mandatory to fortify wheat flour with iron since 1996. On the other hand, VAD prevalence for children
from 1 to 4 years old is 27.3% and, in this case, there is no mandatory fortification programs in the country.
Interactions between micronutrients are not unknown on health and nutrition field, the most recognized
is that between calcium and vitamin D; besides, there is evidence from an epidemiological perspective
that VAD and ID are linked in some way, fact supported for some studies using cellular and animal models.
This study has the hypothesis that vitamin A regulates in some way the iron homeostasis and its metabolic
role, and has three approaches: weight gain, biochemical and hematological parameters and molecular
markers of iron homeostasis.
We designed a study with four experimental diets with different ratios of iron and vitamin A (sufficient,
insufficient and deficient) and a control diet with a sufficient supply of both micronutrients. The quantity
of animals was calculated statistically giving seven animals per group for 35 animals. The rats started the
experiment at weaning (21 days-old) and received food and water at libitum for six weeks, during this time
food intake and weight were recorded each week. At sixth week the animals were euthanized and samples
from blood and tissues of interest (liver, spleen and duodenum) were taken for analysis of biochemical
and hematological indicators in blood and PCR and Western Blot test in tissues for the analysis of hepcidin,
ferritin, transferrin receptors, transferrin and interleukin-6 as proteins of interest.
13
We found that, indeed, even with an adequate supply of iron, VAD has a deleterious effect on weight gain,
serum iron levels, reticulocyte count, iron regulatory protein 2 and transferrin receptors at post-
transcriptional level and ferritin at post-translational level.
Even is not enough evidence to support changes in public policies for micronutrient fortification programs,
is expected that those results encourage more research and attract the attention of the public sector to
design new strategies that allow to reduce IDA and VAD in children in the next years.

14
LISTA DE ABREVIATURAS AI Adequate Intake (Ingesta Adecuada) ARAT Acil CoA Retinil Acil Transferasa Cp Ceruloplasmina Dcytb Citocromo B duodenal DMT1 Divalent Metal Transporter-1 (Transportador de Metales Divalentes-1) EAR Estimated Average Requirement (Requerimiento Estimado Medio) ENSIN Encuesta Nacional de Situación Nutricional (Colombia) Fn Ferritina FPN Ferroportina GDF15 Growth Differentiation Factor 15 (Factor de Diferenciación de Crecimiento 15) HAMP Hepcidin Antimicrobial Peptide Hb Hemoglobina HCP1 Heam Carrier Protein 1 (Proteína Transportadora de Grupo Hemo 1) HEMOX-1 Hemo-oxigenase 1 (Hemo-oxigenasa 1) HEPH Hephaestin (Hefestina) ID Deficiencia de hierro (por sus iniciales en inglés Iron Deficiency) IDA Anemia por deficiencia de hierro (por sus iniciales en inglés Iron Deficiency Anemia) IRE Iron Responsive Element (Elemento de Respuesta al Hierro) IRP Iron Regulatory Protein (Proteína Reguladora de Hierro) LRAT Lecitin Retinil Acil Transferasa NTBI Non transferrin bound iron (Hierro no ligado a transferrina) OMS Organización Mundial de la Salud RALDH Retinal Deshidrogenasa RDA Recommended Dietary Allowance (Ingesta Dietética Recomendada) RDH Retinol Deshidrogenasa RE Equivalente de Retinol RIEN Recomendaciones de Ingesta de Energía y Nutrientes SPF Specific Pathogen Free Tf Transferrina TfR Receptores de transferrina UI Unidades Internacionales UL Upper Limit (Límite Superior) VAD Deficiencia de Vitamina A (por sus iniciales en inglés Vitamin A Deficiency)

15
1. INTRODUCCIÓN
La principal motivación para estudiar debería estar siempre sustentada en dos pilares fundamentales:
compartir lo aprendido y aplicarlo en experiencias reales para tratar de solucionar o, por lo menos,
disminuir la incidencia de problemas que afecten a determinadas comunidades.
Después de varios años de ejercicio docente y profesional en áreas como Química Orgánica, Bioquímica,
Nutrición y Desarrollo de Productos, el autor decidió profundizar aún más sus conocimientos para
entrelazarlos y plantear posibles soluciones a un problema que las estadísticas nacionales siempre
evidenciaban pero no parecían motivar la búsqueda de respuestas, al menos desde el ejercicio académico
y científico: la alta prevalencia de anemia infantil en un país donde es obligatorio fortificar la harina de
trigo con hierro.
Al ser una condición de origen multifactorial, el abordaje de las intervenciones para disminuir en alguna
cifra los casos de IDA, especialmente entre niños hasta los 4 años, representa un campo inmensamente
amplio como para pretender describirlo en un trabajo científico de algunos años; por tal razón se eligió un
enfoque desde la interacción de micronutrientes tomando como referencia la relación existente entre
vitamina D y calcio.
En el presente trabajo se aborda la importancia del suministro conjunto de hierro y vitamina A como
estrategia para la reducción de la anemia infantil, partiendo de evidencias previas sobre el efecto que tiene
la última sobre los mecanismos asociados a la homeostasis del primero. Si bien no se ha encontrado la
solución definitiva a la patología, se ha logrado mover un poco esa barrera del conocimiento que, tal vez,
permita motivar futuras profundizaciones sobre el tema y, por qué no, llegar en algún momento a elaborar
políticas públicas de fortificación obligatoria con vitamina A, mejorando de alguna manera la calidad de
vida de los niños y niñas de Colombia.

16
1.1. ESTADO DEL ARTE
1.1.1. Hierro
1.1.1.1. Generalidades
El hierro es un mineral esencial, perteneciente al grupo de los metales de transición que, gracias a sus
propiedades químicas y físicas particulares, posee un rol determinante en el metabolismo de la mayoría
de los seres vivos. Se encuentra presente en numerosas proteínas, especialmente aquellas asociadas al
transporte de oxígeno, de ahí su importancia en el sostenimiento de la vida, prácticamente podría decirse
que en ausencia de hierro la vida no sería posible (al menos para numerosos organismos) (1,2). El
requerimiento medio estimado (ingesta diaria de un nutriente, considerada adecuada, para cubrir las
necesidades de la mitad de los individuos sanos de un grupo etario definido, EAR por sus siglas en inglés)
para niños entre 7 y 12 meses es de 6.9 (niños) y 6.3 mg/día (niñas), para niños y niñas de 1 a 3 años es de
3 mg/día y en niños y niñas de 4 a 8 años es de 4.1 mg/día. La ingesta dietética recomendada (cantidad
recomendada del nutriente que permite cubrir las necesidades de la mayoría de la población de un grupo
etario determinado, RDA por sus siglas en inglés) es de 11 mg/día para niños y niñas de 7 a 12 meses, 7
mg/día para niños y niñas de 1 a 3 años y 10 mg/día para niños y niñas de 4 a 8 años. Debido a la
insuficiente evidencia científica para determinar EAR y RDA para niños de 0 a 6 meses se ha estimado la
cantidad de hierro que aporta la leche materna como único alimento en este rango de edad y se ha fijado
como valor de ingesta adecuada (AI), la cual es también un valor medio de ingesta del nutriente pero
basado en los valores observados del mismo en un grupo que se considera recibe la cantidad adecuada,
para el caso de hierro es de 0.27 mg/día (3). En cuanto a la posibilidad de presentar alguna clase de efecto
adverso o riesgo por sobreingesta del mineral, se ha fijado el nivel de ingesta máxima tolerable (nivel más
alto de ingesta que no representa un riesgo parala mayoría de la población de un grupo etario
determinado, UL) en 40 mg/día para niños hasta 13 años de edad (4,5). La Resolución 3803 de 2016
estableció en Colombia las Recomendaciones de Ingesta de Energía y Nutrientes – RIEN para la población
colombiana y fijó en 11 mg/día el EAR para niños y niñas entre siete meses y 3 años (6).
El contenido normal de hierro en el cuerpo es de 4-5 g, la mayoría se encuentra formando parte de las
proteínas pigmentantes de la sangre (hemoglobina) y el músculo (mioglobina), también está presente en
numerosas enzimas como catalasa, peroxidasa e hidroxilasas entre otras (7), adicionalmente los depósitos
de hierro en forma de ferritina y hemosiderina representan alrededor del 25% del hierro total del cuerpo
17
(8). Sus funciones están asociadas al transporte de oxígeno en los glóbulos rojos, cofactor en reacciones
enzimáticas y desempeña un rol activo en el transporte de electrones entre células (9).
1.1.1.2. Digestión, absorción y eflujo
Las principales fuentes de hierro dietario son la carne (hierro hemínico) y vegetales y leguminosas (hierro
no hemínico), el proceso de absorción del hierro dietario en la luz intestinal, es similar para ambos tipos
(10). El hierro hemínico se encuentra fuertemente ligado a proteínas globulares, las cuales deben ser
hidrolizadas mediante el pH del estómago y las proteasas gástricas e intestinales (9,11). De manera similar,
el hierro no hemínico requiere también del pH ácido generado en el estómago para favorecer la
solubilización y disociación de los componentes a los cuales se une covalentemente (12). Tanto el hierro
hemínico como el no hemínico se absorben en el duodeno (1), sin embargo, los mecanismos de absorción
del mineral por parte del enterocito, dependen del origen dietario del hierro (10).
El hierro no hemínico generalmente está en forma férrica (Fe3+), debe ser reducido a su forma ferrosa
(Fe2+) por una proteína citocromo duodenal de membrana (DcytB), proceso favorecido por el ácido
ascórbico (vitamina C), una vez reducido es llevado al interior del enterocito por una proteína ubicada en
la membrana apical conocida como DMT1 (Divalent Metal Transporter 1) (13). De otro lado el hierro
hemínico es captado por una proteína anclada a la membrana apical denominada HCP1 (Heam Carrier
Protein 1), que es específica para esta forma de hierro; luego, el hierro hemínico intacto pasa a un
endosoma en donde es degradado por acción de la enzima hemo-oxigenasa (HEMOX-1), mecanismo que
permite la liberación del hierro desde la protoporfirina. Finalmente, este es liberado al citosol del
enterocito mediante una isoforma del DMT1, presente en el endosoma y se hace indistinguible del hierro
no hemínico (14).
Una vez en el citosol del enterocito, el hierro tiene diferentes destinos: 1) formar parte de los citocromos
de la membrana mitocondrial, donde es utilizado para favorecer los procesos de óxido-reducción
necesarios en la cadena transportadora de electrones; 2) formar parte de un pool transitorio de hierro
intracelular libre, que auto regula, agudamente, la captación del mineral; 3) puede ser almacenado en la
proteína de reserva, la ferritina celular (1) y 4) ser exportado al torrente sanguíneo por medio de una
proteína localizada en la membrana basolateral, denominada ferroportina (FPN), después de lo cual
requiere de la actividad ferroxidasa (para ser convertido a hierro férrico) bien por una proteína de
membrana denominada hefestina o por una plasmática denominada ceruloplasmina, luego es ligado a la

18
transferrina, que es la proteína que lo transporta hacia diferentes órganos y tejidos, aunque se ha
encontrado también que puede circular de otra forma no unido a transferrina (non transferrin bound iron-
NTBI) (15). La
Figura 1 representa esquemáticamente la absorción de hierro en el enterocito y su transporte al torrente
sanguíneo (12,14).
DMT1: Transportador de metales divalentes 1. Dcytb: Citocromo B duodenal. HCP1: Proteína transportadora de grupo hemo 1. HemOX: Hemo-Oxigenasa. FN: Ferritina. FPN: Ferroportina. HEPH: Hefestina. Cp: Ceruloplasmina. Tf: Transferrina. NTBI: Hierro no ligado a transferrina. Hep: Hepcidina. EM: Médula eritroide. RBC: Glóbulos rojos. Hb: Hemoglobina
Figura 1. Absorción de hierro en el enterocito y su transporte al torrente sanguíneo. Adaptada de Silva y Faustino, 2015 (16)
1.1.1.3. Proteínas asociadas al metabolismo del hierro
1.1.1.3.1. Transportador de metales divalentes 1 (DMT-1)
El transportador de metal divalentes 1 (DMT1) es una proteína de membrana celular, fue la primera
proteína de este tipo asociada a la absorción del hierro identificada en mamíferos, en el enterocito se
expresa a nivel apical para permitir la absorción de los metales desde el lumen; consta de doce dominios
transmembrana y ambos extremos residen en el citoplasma (17,18).

19
Dada su naturaleza es un transportador no específico viable para cualquier metal divalente, sin embargo
se ha encontrado que tiene mayor afinidad por hierro en comparación con otros metales como zinc,
manganeso, níquel y cobalto (19), no se ha evidenciado que el cobre represente competencia para
absorber el hierro (20), tampoco se ha encontrado que el consumo de calcio, uno de los metales divalentes
dietarios de mayor abundancia e importancia, tenga un efecto negativo sobre la absorción del hierro (21).
Es importante mencionar que DMT1 también participa en la absorción de metales pesados tóxicos como
cadmio, plomo y mercurio (22).
1.1.1.3.2. Oxidorreductasas de membrana y plasmáticas
Para ser absorbido el hierro no-hemo debe estar en forma reducida, es decir Fe+2, si el hierro dietario está
en forma oxidada debe reducirse primero. La DcytB (duodenal cytocrome B) se expresa en la membrana
apical del enterocito y tiene un alta actividad reductasa para permitir que el hierro no-hemo sea absorbido
apropiadamente desde el lumen (12,23–25).
Una vez en el interior del enterocito el hierro puede permanecer en su forma reducida y emplearse para
el metabolismo celular o almacenarse en forma de ferritina; sin embargo, para poderse transportar debe
ser oxidado nuevamente, para ello se cuenta con dos proteínas, una de membrana y otra sérica (26). La
ceruloplasmina (Cp) es una proteína sérica descubierta en 1948 mientras se investigaba el transporte de
cobre, es una oxidasa dependiente de cobre. Se le atribuye la fuerte actividad ferroxidasa del suero y es,
junto con la hefestina, responsable por la oxidación el hierro en su forma ferrosa a su forma férrica para
que éste pueda ser incorporado posteriormente a la transferrina para su transporte (27). Se ha encontrado
que mutaciones que afecten la expresión de Cp están asociadas con deficiencias de hierro y disrupciones
en su homeostasis (28). La hefestina (HEPH) es una proteína de membrana expresada principalmente a
nivel basolateral en el enterocito. Al igual que la Cp, su función consiste en oxidar de nuevo el hierro de su
forma ferrosa a su forma férrica una vez sale del enterocito. Del mismo modo que con Cp, mutaciones
asociadas a su expresión se relacionan con deficiencias de hierro (28,29).
1.1.1.3.3. Transportador de grupo hemo 1 (HCP1)
Es una proteína de la membrana apical del enterocito identificada en 2005 como transportador del grupo
hemo, su expresión es principalmente a nivel de la mucosa duodenal de hecho, no se evidencia expresión
de su mRNA a nivel ileal o yeyunal (30). La regulación de esta proteína ocurre post-transduccional en
20
función de los depósitos de hierro intracelulares y del nivel de oxígeno plasmático; el comportamiento es
aparentemente lineal mostrando saturación a niveles muy altos del grupo hemo (14,31).
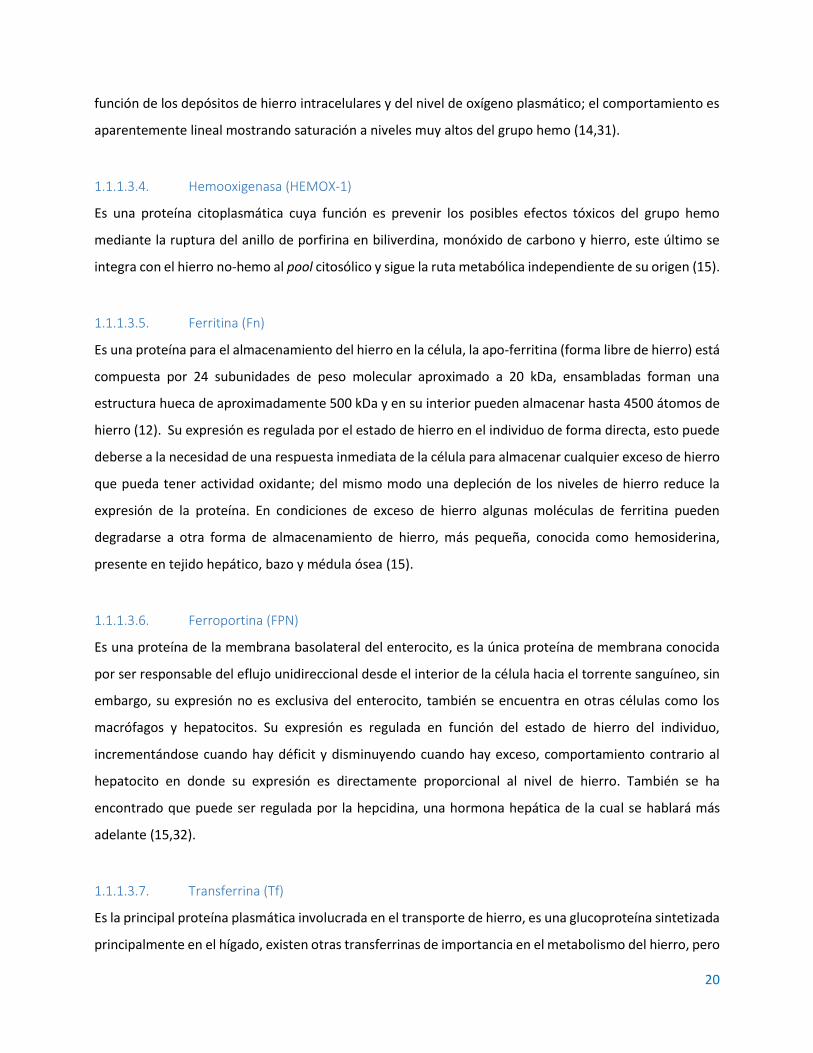
1.1.1.3.4. Hemooxigenasa (HEMOX-1)
Es una proteína citoplasmática cuya función es prevenir los posibles efectos tóxicos del grupo hemo
mediante la ruptura del anillo de porfirina en biliverdina, monóxido de carbono y hierro, este último se
integra con el hierro no-hemo al pool citosólico y sigue la ruta metabólica independiente de su origen (15).
1.1.1.3.5. Ferritina (Fn)
Es una proteína para el almacenamiento del hierro en la célula, la apo-ferritina (forma libre de hierro) está
compuesta por 24 subunidades de peso molecular aproximado a 20 kDa, ensambladas forman una
estructura hueca de aproximadamente 500 kDa y en su interior pueden almacenar hasta 4500 átomos de
hierro (12). Su expresión es regulada por el estado de hierro en el individuo de forma directa, esto puede
deberse a la necesidad de una respuesta inmediata de la célula para almacenar cualquier exceso de hierro
que pueda tener actividad oxidante; del mismo modo una depleción de los niveles de hierro reduce la
expresión de la proteína. En condiciones de exceso de hierro algunas moléculas de ferritina pueden
degradarse a otra forma de almacenamiento de hierro, más pequeña, conocida como hemosiderina,
presente en tejido hepático, bazo y médula ósea (15).
1.1.1.3.6. Ferroportina (FPN)
Es una proteína de la membrana basolateral del enterocito, es la única proteína de membrana conocida
por ser responsable del eflujo unidireccional desde el interior de la célula hacia el torrente sanguíneo, sin
embargo, su expresión no es exclusiva del enterocito, también se encuentra en otras células como los
macrófagos y hepatocitos. Su expresión es regulada en función del estado de hierro del individuo,
incrementándose cuando hay déficit y disminuyendo cuando hay exceso, comportamiento contrario al
hepatocito en donde su expresión es directamente proporcional al nivel de hierro. También se ha
encontrado que puede ser regulada por la hepcidina, una hormona hepática de la cual se hablará más
adelante (15,32).
1.1.1.3.7. Transferrina (Tf)
Es la principal proteína plasmática involucrada en el transporte de hierro, es una glucoproteína sintetizada
principalmente en el hígado, existen otras transferrinas de importancia en el metabolismo del hierro, pero

21
suelen llamarse por su nombre específico: lactoferrina, ovotransferrina y mielotransferrina, sin embargo,
cuando se habla de transferrina suele tratarse siempre de la plasmática. Es una cadena polipeptídica
simple de aproximadamente 80 kDa que liga dos átomos de hierro férrico, puede encontrarse circulando
en su forma libre (apo-Tf), en forma monoférrica o diférrica (holo-Tf) (15).
1.1.1.3.8. Receptores de transferrina (TfR)
Están directamente involucrados en la captación del hierro de la circulación, se han identificado dos tipos
TfR1 presente en casi todas las células proliferativas para captar el hierro para el ciclo celular y el TfR2
expresado principalmente en el hígado, existe también una forma soluble (15). Para captar el hierro, el
TfR se liga a Tf bien sea en forma monoférrica o diférrica, el complejo es luego endocitado y el hierro es
liberado en el citoplasma para su utilización por la célula.
1.1.1.4. Regulación
Dado que no hay mecanismos aún conocidos que regulen la excreción de hierro del cuerpo, se considera
que los procesos críticos a regular son su absorción, exportación, almacenamiento y transporte. A nivel
local, la absorción y transporte del hierro puede ser regulada desde el enterocito mediante la participación
del sistema IRE/IRP (iron responsive element/iron regulatory protein) el cual afecta la regulación post-
transcripcional de las proteínas clave en el transporte del hierro; bajo condiciones de déficit, la IRP se liga
al mRNA de DMT1 y del receptor de transferrina 1 (TFf1) estabilizándolo e incrementando la cantidad de
proteína traducida; como efecto regulador negativo, bajo las mismas condiciones deficitarias, la IRP se une
al mRNA de FPN y ferritina bloqueando su traducción (esto para garantizar disponibilidad de hierro para
el metabolismo del enterocito), sin embargo en una de las isoformas de FPN no se da esa unión de la IRP
y por lo tanto se puede mantener un nivel apropiado de hierro en el cuerpo aún en bajas concentraciones
del mismo (12).
1.1.1.4.1. Sistémica
A nivel sistémico y en sujetos sanos, el metabolismo del hierro es regulado principalmente por la
hepcidina, ésta es una hormona producida por el hígado, descubierto inicialmente como un péptido
antimicrobiano (de ahí su nombre: hep= hígado, cidin= con actividad antimicrobiana), también se ha
encontrado evidencia de expresión de la hormona en macrófagos, riñones, células beta pancreáticas y
tejido adiposo, sin embargo no está directamente relacionada con hierro sino con su función
antimicrobiana. Es codificada por el gen HAMP (hepcidine anti microbial peptide), el cual está localizado

22
en el brazo largo del cromosoma 19, es un gen de 2.5 kb que contiene dos intrones y tres exones y se
transcribe en un RNAm de 0.4 Kb el cual se traduce inicialmente como pre-pro-hepcidina, un péptido de
84 aminoácidos que por acción enzimática es recortado a 64 aa (pro-hepcidina) y exportado del citoplasma
al lumen del retículo endoplasmático para sufrir un nuevo clivaje que deja la hepcidina madura con una
longitud de 25 aa (33–35) .
Es considerada la hormona maestra de la regulación del hierro (36), el mecanismo general opera mediante
su unión a ferroportina para inducir su internalización y degradación lisosomal, de esta forma cuando hay
sobrecarga de hierro se aumenta la expresión de hepcidina y se reduce el eflujo desde el enterocito; en el
sentido opuesto, cuando hay deficiencia de hierro (bajos niveles de holo-Tf) se disminuye la expresión de
hepcidina y se incrementa el eflujo hacia la circulación puesto que no hay internalización de FPN (1,37,38);
este mecanismo no solo opera en el enterocito también se ha encontrado que la hepcidina cumple su rol
regulador en otros tejidos como el cardíaco en el cual también modula la expresión de FPN (32). En la
Figura 2 se representa la regulación en función del nivel de hierro plasmático a nivel del enterocito.
a.
b.
c.
Figura 2. Representación esquemática de la regulación del hierro (Fe) por hepcidina (Hep) y su efecto sobre ferroportina (FPN)
(a) Niveles normales de hierro (b) Deficiencia de hierro (c) Sobrecarga de hierro
Elaboración propia basada en Kwapisz, Slomka y Zekanowska, 2009 (36)
Dada su importancia como regulador de la homeostasis del hierro, es importante conocer mejor las vías
de regulación de su transcripción tanto en condiciones de salud normales o en otros como inflamación y
23
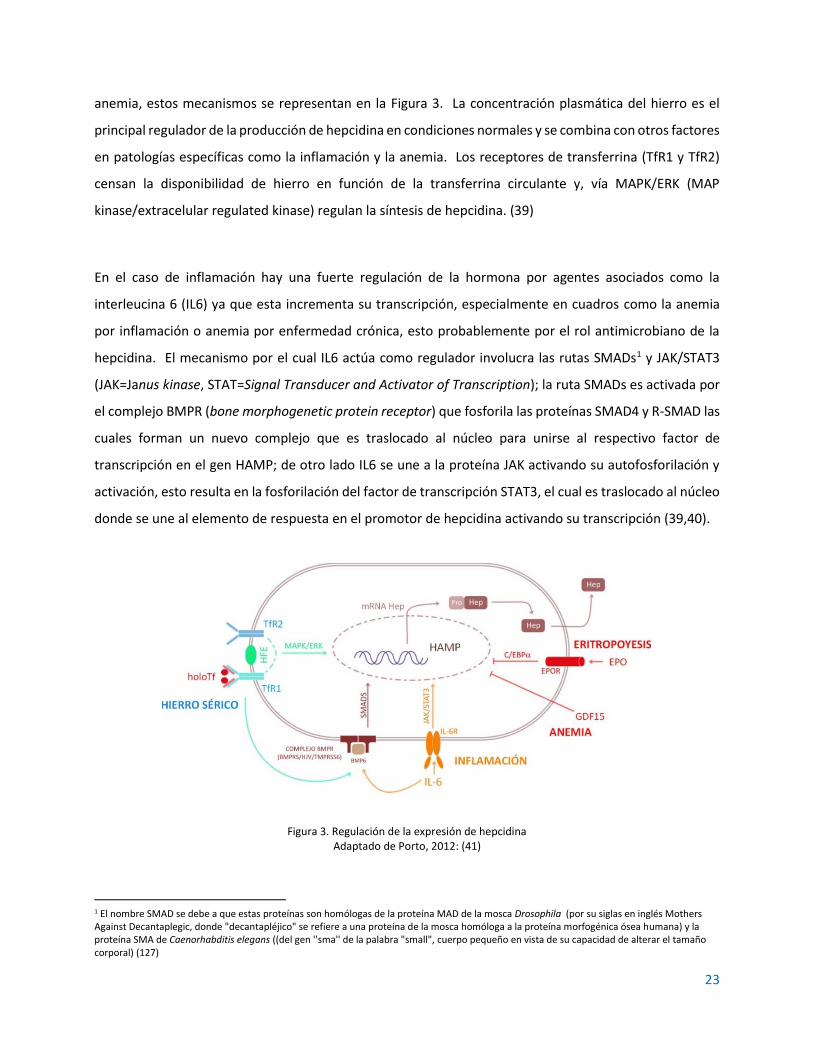
anemia, estos mecanismos se representan en la Figura 3. La concentración plasmática del hierro es el
principal regulador de la producción de hepcidina en condiciones normales y se combina con otros factores
en patologías específicas como la inflamación y la anemia. Los receptores de transferrina (TfR1 y TfR2)
censan la disponibilidad de hierro en función de la transferrina circulante y, vía MAPK/ERK (MAP
kinase/extracelular regulated kinase) regulan la síntesis de hepcidina. (39)
En el caso de inflamación hay una fuerte regulación de la hormona por agentes asociados como la
interleucina 6 (IL6) ya que esta incrementa su transcripción, especialmente en cuadros como la anemia
por inflamación o anemia por enfermedad crónica, esto probablemente por el rol antimicrobiano de la
hepcidina. El mecanismo por el cual IL6 actúa como regulador involucra las rutas SMADs1 y JAK/STAT3
(JAK=Janus kinase, STAT=Signal Transducer and Activator of Transcription); la ruta SMADs es activada por
el complejo BMPR (bone morphogenetic protein receptor) que fosforila las proteínas SMAD4 y R-SMAD las
cuales forman un nuevo complejo que es traslocado al núcleo para unirse al respectivo factor de
transcripción en el gen HAMP; de otro lado IL6 se une a la proteína JAK activando su autofosforilación y
activación, esto resulta en la fosforilación del factor de transcripción STAT3, el cual es traslocado al núcleo
donde se une al elemento de respuesta en el promotor de hepcidina activando su transcripción (39,40).
Figura 3. Regulación de la expresión de hepcidina Adaptado de Porto, 2012: (41)
1 El nombre SMAD se debe a que estas proteínas son homólogas de la proteína MAD de la mosca Drosophila (por su siglas en inglés Mothers Against Decantaplegic, donde "decantapléjico" se refiere a una proteína de la mosca homóloga a la proteína morfogénica ósea humana) y la proteína SMA de Caenorhabditis elegans ((del gen ''sma'' de la palabra "small", cuerpo pequeño en vista de su capacidad de alterar el tamaño corporal) (127)

24
Durante la eritropoyesis y en cuadros de anemia, se requiere disponer de la mayor cantidad de hierro
circulante, es de esperarse entonces que ambas situaciones regulen negativamente la expresión de Hep,
la eritropoyetina (ERO) lo hace mediante el factor de transcripción C/EBP (CCAATT-enhancer protein
binding alpha) y en anemia ocurre mediante el factor de transcripción GDF15 (growth differentiation factor
15) (41).
Existen otras condiciones que regulan la expresión de hepcidina como la hipoxia y el estrés del retículo
endoplasmático (42), sin embargo, no se detallan por no corresponder con el objetivo central de este
proyecto.
1.1.1.4.2. Celular
A nivel celular la homeostasis del hierro es regulada por las proteínas reguladoras de hierro (IRP1 y IRP2)
(2). IRP1 es ubicua y funciona bajo condiciones normales de concentración de oxígeno mientras que IRP2
se activa en hipoxia (43). Uno de los mecanismos más directos de regulación opera sobre la síntesis de
ferritina y receptores de transferrina en un sistema opuesto dependiente de las concentraciones de hierro
circulante (7). En ID, las IRP se unen al respectivo elemento de respuesta al hierro (IRE), para el caso de
ferritina bloquean la traducción (menos depósitos de hierro) y para receptor de transferrina estabilizan el
RNAm impidiendo que las endonucleasas lo degraden y permitiendo la traducción (mayor captación). En
suficiencia de hierro ocurre el mecanismo opuesto (44). En la Figura 4 se representan estos mecanismos.
Figura 4. Representación de la regulación de la homeostasis del hierro por el sistema IRE/IRP
Adaptado de Wilkinson y Pantopoulos, 2014 (44)

25
1.1.1.5. Interacción con otros nutrientes
Los nutrientes usualmente no ejercen su función biológica de manera aislada, existen interacciones entre
ellos que pueden potenciar su bioactividad (sinergias) o, por el contrario, reducirla e incluso inactivarla
(antagonismos) (45). En el caso particular del hierro se ha identificado que su homeostasis se ve
influenciada por la vitamina C (ácido ascórbico), el calcio, las proteínas, el zinc, la vitamina B12 y la vitamina
A (46,47). Concretamente el estudio sobre la interacción con la Vitamina A ha tenido varias
aproximaciones que se consideran en el siguiente apartado.
1.1.2. Vitamina A
1.1.2.1. Generalidades
La vitamina A es un nutriente esencial perteneciente al grupo de las vitaminas liposolubles, juega un rol
fundamental en diversos procesos metabólicos como la visión, la hematopoyesis, el desarrollo
embrionario, la diferenciación celular, las funciones del sistema inmune y la transcripción génica (48). El
término vitamina A es usualmente asociado con el retinol o con compuestos con actividad biológica de
retinol, todos ellos son carotenoides, si bien hay más de 600 carotenoides conocidos, aproximadamente
50 presentan algún tipo de actividad de vitamina A y son llamados provitaminas A (49), en la Figura 5 se
representan las estructuras moleculares del betacaroteno, la vitamina A (retinol) y sus principales
derivados.
Retinol (todo-trans) Retinal (todo-trans) Ácido retinoico (todo-trans)
Retinil éster Β-caroteno (todo-trans)
Figura 5. Estructuras de la vitamina A (retinol), sus principales derivados y betacaroteno Adaptado de Ball, 2006 (49)
La vitamina A se encuentra principalmente en alimentos de origen animal en forma de ésteres de retinol
(principalmente retinol palmitato), en alimentos de origen vegetal, se encuentra en forma de los
mencionados carotenoides con actividad de provitamina A (betacaroteno, alfacaroteno,
betacriptoxantina), éstos pueden ser hidrolizados y metabolizados a su forma de retinol luego de su
absorción (49).
OH O O
OH
O R
O

26
1.1.2.2. Digestión, absorción y eflujo
Las dos principales formas dietarias de la vitamina A (ésteres de retinol y carotenoides) tienen rutas de
absorción diferentes en el enterocito. Los ésteres de retinol son hidrolizados en el lumen intestinal por
una retinol hidrolasa del borde en ribete de la célula intestinal (BB-REH), produciendo retinol libre y el
respectivo ácido graso, luego de lo cual el retinol es absorbido. En el interior del enterocito, el retinol libre
puede tener tres destinos diferentes: (a) ser reesterificado nuevamente a éster de retinol gracias a la
acción de dos enzimas: Lecitin-retinol aciltransfera (LRAT) y acilCoA-retinol aciltransferasa (ARAT) para ser
exportado al torrente linfático en los quilomicrones, pasando luego a la sangre de donde puede dirigirse a
los hepatocitos o a las células extrahepáticas; (b) ser oxidado a retinal (retinaldehído) mediante la enzima
retinol deshidrogenasa (RDH) y nuevamente oxidado a ácido retinoico por la enzima retinal
deshidrogenasa (RALDH) forma en la cual sale del enterocito a la circulación sanguínea hacia las células
extrahepáticas; y (c) ser exportado en su forma de retinol al torrente sanguíneo igualmente hacia las
células extrahepáticas (50). La Figura 6 representa los principales mecanismos de absorción y transporte
de la vitamina A a través del enterocito y hacia los principales tejidos donde actúa.
RE: Éster de retinil. BB-REH: Retinil hidrolasa del borde en ribete. LRAT: Lecitin:retinol aciltransferas. ARAT: acilCoA-retinol aciltransferasa. CM: Quilomicrón. CMR: Remanente de quilomicrón. RDH: Retinol deshidrogenasa. 15,15’-DO: 15,15’-dioxigenasa. RA: Ácido retinoico. RALDH: Retinal deshidrogenasa. RARE: Elementos de respuesta al ácido retinoico. RARs: Receptores de ácido retinoico. RXRs: Receptores X para retinoides. RBP: Proteína ligante de retinol. TTR: Transtiretina. STRA6: Receptor de unión transmembrana (Stimulated by retinoic acid 6).
Figura 6. Absorción y transporte de la vitamina A
Adaptado de Reboul, 2013 (51) y Chen y Chen, 2014 (50)
27
1.1.3. Anemia
1.1.3.1. Definición
La Organización Mundial de la Salud (OMS) define la anemia como aquella condición en la cual el número
de glóbulos rojos o su capacidad para transportar oxígeno es insuficiente para cubrir las necesidades
fisiológicas. Particularmente, la anemia ferropénica impacta considerablemente a niños y adolescentes
con deficiencias en su capacidad cognitiva (impacto en el aprendizaje), desarrollo y rendimiento físico y
estado inmune (mayor propensión a infecciones) y en mujeres gestantes aumenta el riesgo de parto
prematuro, mortalidad perinatal y neonatal (52). Adicionalmente en el sujeto con anemia puede
incrementarse la captación de metales pesados elevando el riesgo de envenenamiento, especialmente en
lugares donde haya una alta exposición a los mismos (53). Si bien hay un alto impacto en grupos en riesgo
como niños menores de cinco años y mujeres en edad fértil, la anemia es una enfermedad que es crítica
para todos los grupos etarios y para ambos sexos, lo cual la convierte en un problema de salud pública de
alto impacto (54).
Desde un punto de vista fisiológico, la anemia es una enfermedad caracterizada por la presencia de bajos
niveles de hemoglobina en la sangre, relacionada con una deficiente calidad o cantidad de glóbulos rojos,
se suele asociar únicamente con deficiencia de hierro sin embargo aunque los bajos niveles de este mineral
son los responsables aproximadamente del 50% de los cuadros de anemia existente (IDA), hay otras causas
nutricionales (deficiencias de otros micronutrientes o factores antinutricionales) o no nutricionales
(infecciones, hemorragias, condiciones genéticas, entre otras) que la generan (55).
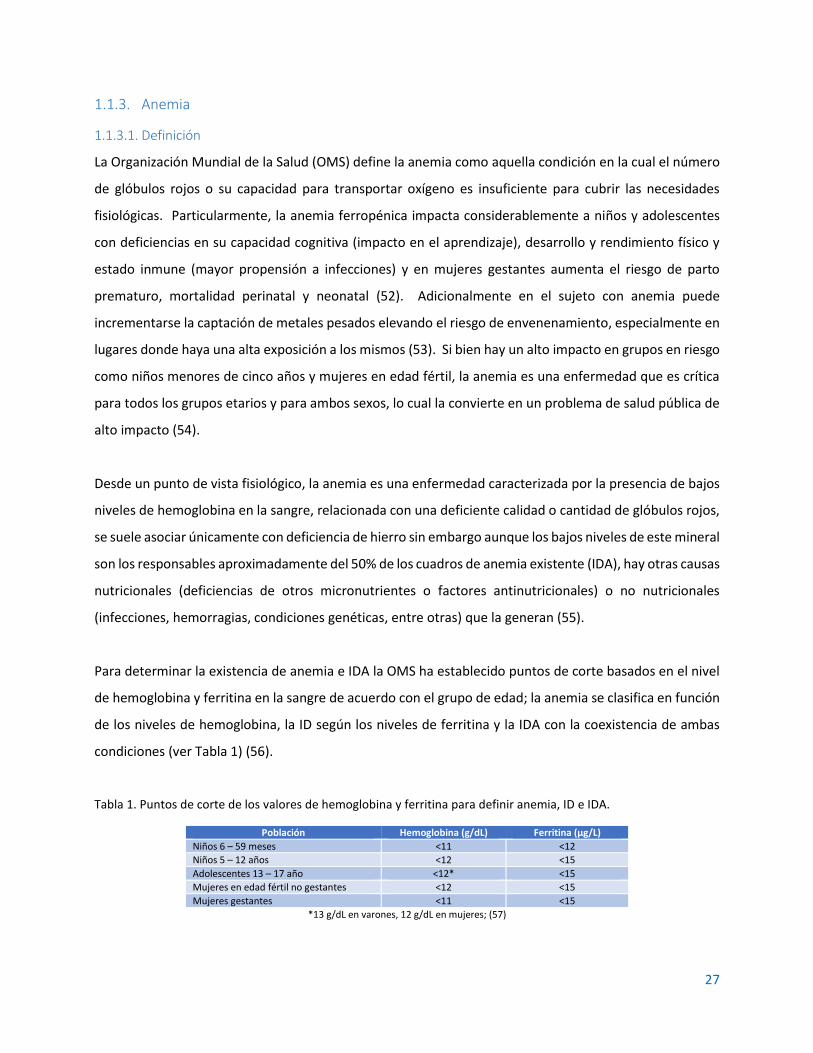
Para determinar la existencia de anemia e IDA la OMS ha establecido puntos de corte basados en el nivel
de hemoglobina y ferritina en la sangre de acuerdo con el grupo de edad; la anemia se clasifica en función
de los niveles de hemoglobina, la ID según los niveles de ferritina y la IDA con la coexistencia de ambas
condiciones (ver Tabla 1) (56).
Tabla 1. Puntos de corte de los valores de hemoglobina y ferritina para definir anemia, ID e IDA.
Población Hemoglobina (g/dL) Ferritina (µg/L)
Niños 6 – 59 meses <11 <12
Niños 5 – 12 años <12 <15
Adolescentes 13 – 17 año <12* <15
Mujeres en edad fértil no gestantes <12 <15
Mujeres gestantes <11 <15
*13 g/dL en varones, 12 g/dL en mujeres; (57)

28
1.1.3.2. Epidemiología
La anemia es considerada un problema de salud pública a nivel mundial, específicamente la anemia
ferropénica por el impacto previamente mencionado en la capacidad productiva de la población, el riesgo
aumentado de la mortalidad en niños y madres gestantes e incremento en los cuadros infecciosos entre
otros (58). Para clasificar el nivel de impacto en salud pública se han establecido los siguientes valores
basados en la prevalencia de la enfermedad en una población específica: <5% no es un problema de salud
pública; 5-19.9% es un problema leve; 20-39.9% es un problema moderado, >40% es un problema grave
(59). Definir estrategias para intervenir en los casos donde se supera el 20% de la prevalencia en la
población es de alta importancia independiente de que el abordaje sea social, económico, cultural o
político, pues además de reducir la mortalidad infantil, se reducen los costos por atención en salud a
madres gestantes, neonatos y niños, se incrementa la capacidad productiva de la población (cognitiva y
físicamente) y se disminuyen los costos generales por atención a enfermedades críticas (55).
De acuerdo con el reporte sobre la Prevalencia Mundial de Anemia en 2011, el 42.6% de los niños en edad
preescolar (0 a 5 años) estaba afectado, para el grupo de mujeres en edad fértil (15 a 50 años) el porcentaje
correspondía a 29.4% y para mujeres embarazadas (sin rango de edad) era del 38.2%, en la Tabla 2 se
detallan las prevalencias por regiones a nivel mundial (52).
Tabla 2. Prevalencia de anemia en 2011 por región
Región (52) Niños menores de cinco años Mujeres gestantes Mujeres no gestantes (en
edad fértil)
África 62.3% 46.3% 37.8%
Américas 22.3% 24.9% 16.5%
Sudeste asiático 53.8% 48.7% 41.5%
Europa 22.9% 25.8% 22.5%
Mediterráneo Oriental 48.6% 38.9% 37.7%
Pacífico Occidental 21.9% 24.3% 19.8%
Total 42.6% 38.2% 29.0%
Cruzando estos datos con los rangos establecidos por la OMS para clasificar el impacto en salud pública,
resulta claro entonces que, a nivel mundial, la anemia en mujeres en edad fértil representa un problema
moderado, mientras los niños en edad preescolar y las madres gestantes con anemia son un problema
severo que requiere de máxima atención.
En Colombia, las dos últimas Encuestas Nacionales de Situación Nutricional (ENSIN) de los años 2010 y
2015 han mostrado datos preocupantes en cuanto a anemia, ID y VAD (60,61) (Tabla 3), especialmente si

29
se considera el potencial efecto que puede jugar la VAD sobre la homeostasis del hierro tal como se
discutirá más adelante.
Tabla 3. Prevalencias de ID, anemia nutricional y VAD en niños en Colombia entre 2010 y 2015
Población Deficiencia de hierro (IC=95%)
Anemia (IC=95%)
Deficiencia de vitamina A (IC=95%)
2010 2015 2010 2015 2010 2015
Niños de 6 a 59 meses N.D. N.D. 27.5% (26.1-28.9)
24.7% (23.2-26.2)
N.D. N.D.
Niños de 1 a 4 años 10.6% (9.3-12.0)
14.8% (13.5-17.1)
N.D. 24.3% (22.5-26.1)
27.3% (25.4-29.2)
1.1.3.3. Anemia por deficiencia de hierro
La anemia por deficiencia de hierro se atribuye, fundamentalmente, a factores nutricionales y
antinutricionales presentes en la dieta que impiden la absorción del hierro en el intestino o la utilización
del mineral por el organismo (46,62). Si bien deficiencia de hierro (ID por sus siglas en inglés) y anemia por
deficiencia de hierro (IDA) no son lo mismo, la segunda es uno de los signos más evidentes de la primera;
sin embargo, la ID comprende un amplio rango de condiciones que, incluso, pueden no estar relacionadas
con anemia en sí (63).
La deficiencia de hierro está asociada principalmente con factores dietarios, la malnutrición es el más
relevante; también se considera el caso de prácticas dietarias como el veganismo y vegetarianismo donde
no se cuenta con un adecuado suministro de hierro en los alimentos y, unido a ello, se tiene la presencia
de factores antinutricionales presentes en alimentos de origen vegetal que disminuyen la
biodisponibilidad del mismo como los fitatos y oxalatos (64).
Dependiendo de sus causas y del enfoque, la ID y la IDA pueden clasificarse en diferentes grupos tal como
se muestra en la Tabla 4.
Tabla 4. Clasificación de la ID y la IDA
Enfoque Clasificación Mecanismos
Fisiopatología
ID relativa Depósitos de hierro reducidos
ID absoluta ID en tejidos específicos con depósitos de hierro normales o altos (p.e. ID en falla cardíaca, eritropoiesis con restricción de hierro
Basado en datos clínicos
ID Depósitos de hierro reducidos con ausencia de anemia
IDA ID + Hb baja Glóbulos rojos hipocrómicos y microcíticos
Herencia
Genética (rara): Anemia por deficiencia de hierro
refractaria al hierro (IRIDA)
Excesiva producción de hepcidina por mutación en el gen que codifica matriptasa-2
Adquirida (común) Demandas aumentadas de hierro, ingesta diminuída, perdidas sanguíneas, absorción reducida
Adaptado de Camaschella, 2017 (43)
30
1.1.4. Vitamina A, hierro y anemia
La vitamina A es uno de los factores nutricionales de la dieta que se cree modifica la utilización corporal
del hierro dietario, sin embargo, el mecanismo mediante el cual ejerce este tipo de efecto aún no está
claramente establecido aunque la poca evidencia con que se cuenta desde el punto de vista mecanístico,
indica que la acción es más sobre el metabolismo del hierro que sobre su absorción (40,65).
La interacción que existe entre la vitamina A y el metabolismo del hierro ha sido propuesta desde inicios
del siglo XX (66); la observación de la relación directa entre los niveles de retinol plasmático y hemoglobina
y hierro sérico ha sido estudiada encontrando que la vitamina A regula la abundancia del receptor de
transferrina y la ferritina modulando así la homeostasis del hierro; en 1979 se propuso el efecto de la
vitamina A sobre la hematopoyesis a partir de un estudio en humanos (n=8) en el cual se partió de una
dieta deficiente en vitamina A durante los primeros 500 días (en promedio) del estudio, de ellos los
primeros 400 días fueron normales en hierro y desde el día 100 hasta el final del estudio tuvieron una
suplementación con gluconato ferroso (310 mg/d), al finalizar el período de depleción se suministró una
dieta suplementada con vitamina A o betacaroteno durante aproximadamente 200 días más
comprobando que, si bien la suplementación con hierro incrementaba los niveles de hemoglobina, a
mayores niveles de retinol plasmático ésta también aumentaba, esto se evidenció comparando tres grupos
divididos en función del retinol, en el grupo bajo (RE < 10 µg/dL) la concentración de hemoglobina fue de
11.87 ± 0.72 g/dL, en el grupo adecuado (RE 20-30 µg/dL) fue de 12.92 ± 1.01 g/dL y en el grupo abundante
(RE > 30 µg/dL) fue de 15.64 ± 0.55, las diferencias entre los grupos fueron significativas (P < 0.01); el
mismo estudio analizó más de 30 encuestas en diferentes países entre 1954 y 1968, de ellas tomaron 8
países o regiones (Vietnam, Chile, noreste de Brasil, Uruguay, Ecuador, Venezuela, Guatemala y Etiopía) y
encontraron una correlación directa entre retinol plasmático hemoglobina (R = 0.777; P < 0.05; Hb = 10.81
+ 0.07 RE); por último en el mismo estudio se empleó modelo animal en ratas Sprague-Dawley (n=45)
divididas en tres grupos, dos de ellos (grupos control) recibían una dieta normal suplementada con
vitamina A (retinil palmitato 6500 UI/kg de dieta) a voluntad o controlada y el grupo de estudio tuvo la
dieta deficiente en vitamina A, al finalizar el estudio no se encontraron diferencias entre los grupos control
pero si se evidenció significativamente que había diferencias respecto del grupo de estudio en los niveles
de retinol hepático (µg/g en peso seco; 298 ± 70.5 y 307.9 ± 45.3 vs 7.3 ± 6.3; P < 0.01) y hemoglobina
(g/dL; 15.1 ± 1.4 y 15.0 ± 1.5 vs 13.1 ± 1.6; P < 0,05) (67).

31
Un estudio realizado en 1996 propuso la relación entre vitamina A y eritropoyesis, en él trabajaron con
once ratas Wistar macho deficientes en vitamina A (VAD), a la edad de 12 semanas 7 de ellas fueron
sacrificadas y las 4 restantes recibieron una dosis intraperitoneal de 5 mg de retinil acetato y
adicionalmente una dieta suplementada con vitamina A y a los tres días fueron sacrificadas, los resultados
mostraron que la suplementación con vitamina A podría mejorar la eritropoyesis al incrementar la
mielopoyesis pues encontraron una diferencia significativa entre el recuento de las células mielopoyeticas
del grupo VAD (44.3% ± 3.7%) y el grupo suplementado (57.5% ± 0.5%), P < 0.012, sin embargo no hallaron
un efecto claro directo sobre la eritropoyesis (68) . El mismo grupo en otro estudio con ratas Wistar macho
(n = 72) trabajó un grupo con dieta adecuada en vitamina A (1200 ER/kg) y hierro (35 mg/kg) y otro grupo
sin vitamina A pero adecuado en hierro, al día 25 ambos grupos entraron en depleción de hierro, al día 60
se comenzó a suministrar hierro a ambos grupos aunque cada uno se dividió a la mitad recibiendo uno la
dieta adecuada en vitamina A y otro la dieta deficiente, los animales se sacrificaron al día 72, se tomaron
muestras de sangre a los días 25, 39 y 60, se conservaron riñones, hígado, bazo y patas traseras; los análisis
reportaron que en animales con deficiencias de ambos micronutrientes, la suplementación conjunta
incrementó los niveles de hierro mucho más que cuando se suministraba el mineral solo, se demostró esto
al observar el incremento en la capacidad para ligar hierro (µmol/L, 72.39 vs 91.87, P < 0.05) y la
disminución en bazo (µmol/g peso seco, 23.4 vs 44.17, P < 0.05) y tibia (1.59 vs 1.07), señales de una
adecuada homeostasis (69); sin embargo el grupo de Roodenburg y colaboradores plantearon en el año
2000 que la vitamina A no tenía tal efecto sobre la eritropoyesis (algo que habían propuesto en 1996)
aunque si sobre la regulación de transferrina y el depósito de hierro en el bazo y en los huesos, para ello
trabajaron con ratas Wistar macho y compararon tres dietas (normal, deficiente de vitamina A [-VA] y
deficiente de hierro [-Fe]), a los doce días del experimento se observaron disminuciones significativas de
retinol plasmático de la dieta deficiente de vitamina A en comparación con el control (P < 0.05) y de la
dieta deficiente en hierro en comparación con la dieta control (P < 0.001), a los setenta días ambas dietas
presentaron diferencias significativas con el control al mismo nivel (P < 0.001); respecto de los niveles de
retinol hepático sólo se presentaron diferencias de la dieta deficiente en vitamina A con el control en el
día doce y en el día 70 no se detectó vitamina A (P < 0.001), únicamente se encontró aumento en el peso
del hígado (g) tanto en la dieta deficiente de vitamina A al día setenta (9.23 ± 0.29 vs 10.05 ± 0.20, P <
0.001) y en la dieta deficiente de hierro (8.51 ± 0.26 vs 11.34 ± 0.22, P < 0.05), uno de los hallazgos más
considerables se relacionó con el aumento de los depósitos de hierro (µmol/g, peso seco) cuando había

32
déficit de vitamina A al día setenta tanto en bazo (29.75 ± 1.77 vs 44.61 ± 6.35, P < 001) como en tibia
(1.28 ± 0.04 vs 1.55 ± 0.08, P < 0.01) (70).
El estudio realizado por Jiang y colaboradores demostró mediante el uso de modelo animal y cultivos
celulares de hepatocitos de rata, que la vitamina A está involucrada en la regulación de la proteína
reguladora de hierro 2 (IRP-2 por sus siglas en inglés) y de esta manera afecta subsecuentemente la
expresión de los genes de transferrina y ferritina, para ello emplearon 48 ratas Sprague-Dawley machos,
divididas en cuatro grupos para cuatro dietas diferentes: Control = 1200 µg/kg vA y 45 mg/kg Fe, +Fe0vA
= 0 µg/kg vA y 45 mg/kg Fe, +Fe-vA = 120 µg/kg vA y 45 mg/kg Fe, -Fe-vA = 120 µg/kg vA y 15 mg/kg Fe,
un quinto grupo de 20 ratas recibieron una dieta deficiente de ambos micronutrientes para obtener de
ellas los hepatocitos para el cultivo celular. Los resultados reportaron diferencias significativas (P < 0,05)
frente al control en las tres dietas para los niveles de hierro sérico, ferritina sérica y receptor de
transferrina sérico, al evaluar el efecto de ácido retinoico todo-trans (ARtt) sobre IRP-2 se encontró que
era inverso, es decir a mayores niveles de ARtt menores niveles de IRP-2 (65).
A nivel de estudios en humanos, se ha determinado la interacción entre vitamina A y hierro mediante
mediciones en plasma, tal como se hizo en las Islas Marshall entre noviembre de 1994 y marzo de 1995,
919 niños entre 1 y 5 años fueron seleccionados y se tomaron muestras de sangre venosa a las cuales se
les determinaron los niveles de hemoglobina, retinol y ferritina; se encontró que un 33.2% de los niños
presentaban simultáneamente deficiencia de hierro y de vitamina A (edad promedio 3.09 ± 1.30 años) y
un 23% de los niños tenía anemia y era deficiente de vitamina A (P = 0.0095), se trató de describir la
correlación existente entre retinol sérico y hemoglobina empleando el coeficiente de correlación de
Spearman, encontrando una leve asociación entre ambos marcadores (r = 0.159, P < 0.0001) (71).
Dado que las mujeres gestantes también son población vulnerable para anemia y deficiencia de vitamina
A, se ha evaluado el efecto que la combinación de ambos puede tener sobre la salud de la madre,
particularmente sobre su sistema inmune se llevó a cabo un estudio en China durante dos meses con 186
mujeres gestantes anémicas, divididas en cuatro grupos, uno recibió 60 mg de hierro diariamente como
sulfato ferroso, un segundo grupo recibió adicionalmente 0.4 mg de ácido fólico, un tercero tuvo adición
de 2.0 mg de retinol y un cuarto grupo se tomó como placebo; el grupo que recibió los tres micronutrientes
presentó incrementos significativos en hemoglobina y ferritina en comparación con el placebo (18.4 g/L,
95% CI: 15.5, 21.4) y se encontró un incremento significativo también en los niveles de IL-2 igualmente en

33
comparación con el placebo (206 ng/L, 95% CI: 160-253). En Egipto se hizo un estudio con 200 mujeres
gestantes sanas, se encontró que el 23.5% presentaban deficiencia de vitamina A ( 0.56 ± 0.14 𝜇mol/L
retinol) y para ellas los valores de hemoglobina fueron significativamente más bajos en comparación con
las madres que no eran deficientes en vitamina A, el estudio reportó una positiva correlación entre el
retinol sérico y los niveles de hemoglobina (r = 0.487, P<0.001) y un riesgo relativo para anemia de 2.7 (CI
= 2.12−3.3) cuando las pacientes presentaban déficit de vitamina A en relación con aquellas que no lo
presentaban (72).
Esta interacción ha sido validada en ensayos clínicos con poblaciones vulnerables, como se hizo en China
con 226 niños en edad preescolar (2-6 años) en un estudio doble ciego aleatorizado entre diciembre de
2005 y junio de 2006, a los niños divididos en tres grupos diferentes, se les suministró durante seis meses
una dieta fortificada con vitamina A, vitamina A con hierro y vitamina A, hierro y otros micronutrientes, se
empleó la forma de adición directa o sprinkles; se encontró que la fortificación conjunta con hierro mejoró
notablemente los marcadores nutricionales y disminuyó las incidencias en cuadros infecciosos (73). Un
estudio realizado en Irán entre febrero de 2008 y mayo de 2009, seleccionó un grupo de 1242 mujeres en
edad fértil no gestantes para realizar mediciones de marcadores bioquímicos que dieran indicios de la
asociación entre vitamina A y hierro, se hicieron mediciones de ferritina sérica, receptores de transferrina
séricos, retinol sérico y α-tocoferol; se encontró una prevalencia de anemia de 8.7% (P=0.934), deficiencia
de hierro de 25.4% (P=0.728), anemia por deficiencia de hierro 4.6% (P=0.487) y deficiencia de vitamina A
de 1.2% (P=0.208), aunque en términos generales la población no mostró datos para considerar una
prevalencia de deficiencia de ambos nutrientes, se encontró que el grupo anémico presentó valores de
retinol inferiores a los del grupo sano (2.13 ± 0.66 µmol/L vs 2.41 ± 0.64 µmol/L; P < 0.0001);
adicionalmente el análisis de regresión múltiple ajustado para la edad encontró una correlación positiva
entre retinol sérico y hemoglobina (β=0.18, P < 0.0001) que respalda la importancia de contar con niveles
adecuados de ambos micronutrientes (74).
La participación de un nuevo marcador bioquímico ha sido hallada en un estudio reciente realizado sobre
muestras de sangre de mujeres gestantes de Nepal, las muestras habían sido tomadas entre 1994 y 1997
e hicieron parte del Proyecto de Intervención Nutricional en Nepal (NNIPS), de las muestras conservadas
se seleccionaron 589 para medir los niveles de IGF-1 (factor de crecimiento similar a insulina-1),
betacaroteno, retinol y ferritina sérica; el estudio propuso las vías mediante las cuales el IGF-1 podía ser
un indicador para la disminución del riesgo de anemia por deficiencia de hierro luego de la administración

34
de vitamina A, efectivamente se encontró que, clasificando por cuartiles según los niveles de IGF-1, a
medida que éste aumentaba también lo hacían los niveles de hemoglobina y estaba directamente
relacionado con los niveles de retinol, por cada 0.1 mol/L de retinol sérico había un incremento de 2.6 g/L
de IGF-1 (R2=0.18, P<0.0001) (75).
En Colombia no se han realizado estudios que correlacionen las deficiencias de ambos nutrientes, aunque
hay datos estadísticos de las Encuestas Nacionales de Situación Nutricional (ENSIN) y hay dos estudios
sobre el estado de micronutrientes en niños donde se abordan hierro y vitamina A, uno de ellos realizado
por Poveda et al en 2007 hizo una valoración de estado de hierro y vitamina A en niños preescolares del
municipio de Funza pero no se realizó ningún tipo de relación entre ellos para validar un posible efecto del
uno sobre el otro (76). El otro fue realizado por Villamor et al en 2017 y analizó, entre otros marcadores,
hemoglobina, ferritina y vitamina A, pero sin abordar análisis de interacciones entre ellos (77).
1.1.4.1. Vitamina A y marcadores de homeostasis del hierro
La acumulación de hierro en un tejido puede desencadenar un efecto altamente oxidativo, para evitar esto
se almacena el mineral en forma de ferritina, usualmente se ha encontrado que bajo niveles adecuados
de vitamina A y sobrecarga de hierro se estimula la síntesis de ferritina validando de esta forma la
capacidad antioxidante del retinol; sin embargo es posible que exista otro mecanismo molecular para
controlar los excesos de hierro por causas nutricionales, un estudio con modelo animal demostró que la
deficiencia de vitamina A, bajo concentraciones normales de hierro, parece incrementar la producción de
hepcidina y no tiene ningún efecto en la expresión de ferroportina, HEPH y DMT1 (78,79).
Estudios posteriores empleando modelos in vitro (Caco-2) e in vivo (ratones BALB/c macho y ratas Wistar
macho), encontró que la deficiencia de vitamina A regula indirectamente la acción de la ferroportina
mediante la regulación de le expresión de hepcidina, aunque el mecanismo no es completamente claro,
adicionalmente se encontró que los niveles de ferritina y la expresión de DMT1, Dctyb y TfR no se veían
afectados, por lo tanto el efecto de vitamina A sobre los niveles de hierro se relaciona directamente con
su metabolismo y no con su absorción o transporte (80).
El estudio realizado por da Cunha et al en 2014, encontró igualmente un efecto de regulación negativa de
vitamina A sobre hepcidina pero como un efecto indirecto de una completa cascada de señalización y
35
regulación que parte de una elevada eritrofagocitosis lo que ocasiona un incremento del hierro en el tejido
esplénico y una deficiencia del reciclaje del mineral en el cuerpo por acumulación de grupo hemo (40).
De acuerdo con los hallazgos de la búsqueda realizada, aún son pocos los trabajos realizados para describir
el rol que tiene la vitamina sobre la anemia aún en condiciones de suplementación normal de hierro y su
relación con los marcadores de su homeostasis, por lo tanto, se requiere profundizar más en este tema
para tratar de identificar el mecanismo exacto mediante el cual la vitamina A es un micronutriente
fundamental para una adecuada utilización del hierro y la reducción de anemia.
1.1.5. El modelo animal en investigaciones sobre nutrición
Si bien ya se ha hecho alusión a varios estudios sobre el metabolismo del hierro y vitamina A en los cuales
se empleó el modelo murino, es importante finalizar esta sección resaltando la validez de éste,
especialmente cuando la experimentación en humanos reviste dificultades de índole ético, metodológico
y financiero.
En los estudios previamente mencionados se habla con frecuencia del uso del modelo in vitro en células
Caco-2, este modelo resulta bastante útil cuando se desean estudiar algunos elementos del metabolismo
del hierro en relación únicamente con el comportamiento del enterocito, sin embargo cuando se requiere
evaluar la interacción con otro tipo de tejidos, como el hepático, el uso de co-cultivos, aunque parece ser
una buena herramienta, aún no está totalmente estandarizado y no permite describir el comportamiento
global en términos de interacciones con otros metabolitos como, por ejemplo, algunas hormonas (81).
El empleo del modelo murino frente al in vitro presenta entonces la gran ventaja de la disponibilidad de
diferentes tejidos para estudiar la expresión de numerosas proteínas asociadas al nutriente de interés,
particularmente en relación a la homeostasis del hierro la rata es un animal que presenta un mecanismo
de absorción similar al humano, aunque es importante destacar que hay diferencias entre la forma como
se emplea el hierro hemínico y el no-hemínico (82) para efectos de comparación en este estudio se
enfocará específicamente en hierro no-hemínico.
36
1.2. JUSTIFICACIÓN Y PREGUNTA DE INVESTIGACIÓN
El suministro conjunto de ambos micronutrientes, hierro y vitamina A, podría ser una estrategia para
abordar la problemática de la IDA desde un punto de vista de salud pública. En Colombia, desde 1996
gracias al decreto 1944, es obligatoria la fortificación de harina de trigo con vitamina B1, vitamina B2,
niacina, ácido fólico y hierro (83). De otro lado en 1998 mediante el decreto 1324 se estableció la
fortificación de azúcar con vitamina A (84) y se le otorgó a los fabricantes un plazo de ocho meses para dar
cumplimiento al mismo, al cabo de los cuales se dió una prórroga de otros ocho meses para, finalmente,
sancionar un nuevo decreto que establecía la necesidad de “adelantar otros estudios de factibilidad que
reporten nuevas opciones de fortificación, en cuanto a varias alternativas de alimentos de consumo básico,
para fortificarlos con vitamina A, a menores costos de producción” y derogaba completamente el decreto
1324 de 1998 dejando al país sin una estrategia de suministro de vitamina A para la población,
especialmente la más vulnerable (85).
Debido a las limitaciones propias de la experimentación en humanos, particularmente en niños, el modelo
murino se convierte en una alternativa válida para evaluar el metabolismo del hierro y los efectos de otros
nutrientes sobre éste. En el presente proyecto, se propuso utilizar el modelo murino (ratas Wistar SPF)
como aproximación al estudio del efecto de la deficiencia de vitamina A sobre la homeostasis el hierro.
Los resultados de este estudio brindaron argumentos científicos que respalden el diseño de estudios en
humanos que permitan evaluar las mismas variables y a largo plazo permitir el diseño de alimentos
fortificados o suplementos que contribuyan, en parte, a mejorar el problema de anemia nutricional en el
país.
Basados en la evidencia teórica sobre la relación existente entre la vitamina A y el metabolismo del hierro
y partiendo del hecho de que la fortificación de harina de trigo con hierro no parece tener un impacto
sensible en la disminución de anemia en Colombia unido a una ausencia de planes de fortificación con
vitamina A, la pregunta que nos planteamos fue: ¿Tiene la deficiencia de vitamina A (VAD) algún efecto
sobre la homeostasis del hierro en un modelo murino, evidenciado en variaciones en sus biomarcadores
y, debido a esto, alguna relación con la anemia por deficiencia de hierro (IDA)?

37
1.3. OBJETIVOS
1.3.1. General
Determinar el efecto de la vitamina A sobre la homeostasis del hierro en ratas Wistar macho recién
destetados.
1.3.2. Específicos
• Determinar el efecto de las deficiencias simples y combinadas de hierro y vitamina sobre la ganancia
de peso en ratas Wistar macho recién destetadas.
• Determinar el efecto de la deficiencia de vitamina A sobre los principales parámetros hematológicos
en ratas Wistar macho recién destetadas.
• Determinar el efecto de la deficiencia de vitamina A sobre algunos de los principales marcadores del
metabolismo del hierro, a nivel post-transcripcional y post-traduccional en ratas Wistar macho recién
destetadas.
1.4. METODOLOGÍA
1.4.1. Materiales y métodos
1.4.1.1. Animales y dietas
La primera parte del experimento se desarrolló en el Bioterio de la Sede de Investigación Universitaria –
SIU de la Universidad de Antioquia en Medellín. Para determinar tamaño muestral que garantizara el
máximo de información con el mínimo de animales, se realizó una prueba de potencia que arrojó, para
cinco grupos, un número de 7 animales por grupo, con una potencia del 80% y un nivel de confianza del
95%; se empleó información previa donde se obtuvo una diferencia de 4 g/dL de hemoglobina con una
desviación estándar de 2.39 g/dL (86). En total la muestra comprendió 35 ratas Wistar SPF macho recién
destetados (21 días de nacidos).
Al comenzar el estudio el peso promedio de los animales fue de 62.5 ± 6.1 g y fueron alojados en jaulas de
policarbonato con cubiertas tipo malla en acero inoxidable. Las condiciones ambientales comprendieron
un ciclo de luz de 12 horas, a una temperatura ambiente controlada de 22 ± 2°C y una humedad relativa,
controlada también entre 55% y 65%, el aire se renovaba cada 4 minutos.

38
Los animales tuvieron libre acceso al alimento y a agua desmineralizada de dispensadores de
policarbonato y fueron pesados cada dos semanas empleando una balanza digital con resolución de 0.1 g
(Precisa BJ2100D). Todo el procedimiento fue aprobado por los Comités de Ética de la Universidad de
Antioquia (#108.090217) y de la Universidad de La Sabana ((#55.170516).
Los animales fueron asignados aleatoriamente a cinco grupos con dietas diferentes, siete animales por
grupo cada grupo en una jaula. El grupo control fue alimentado con una dieta estándar AIN-93G para
roedores en crecimiento, la cual fue modificada para proveer suficiente hierro (como citrato férrico, 45
mg/kg) y suficiente vitamina A (como retinol acetato, 1200 µg /kg). Los cuatro grupos experimentales
fueron alimentados con dietas AIN-93G modificadas de la siguiente forma: grupo FesvAd (45 mg/kg de
hierro; sin vitamina A), grupo FesvAi (45 mg/kg de hierro; 120 µg/kg de vitamina A), grupo FeivAs (15
mg/kg de hierro, 1200 µg/kg de vitamina A), y grupo FeivAi (15 mg/kg de hierro, 120 µg/kg de vitamina
A). En la Tabla 5 se detalla la composición y el perfil nutricional de las dietas. La ingesta de alimento fue
medida semanalmente para cada grupo durante el período experimental, pesando la comida remanente
en las jaulas, dividiendo luego la ingesta total por el número de animales por jaula para obtener un
estimado por animal. Todas las dietas fueron producidas por Research Diets Inc. (New Brunswick, NJ) –
(https://www.researchdiets.com/)
Después de seis semanas de alimentación con las dietas correspondientes, los animales fueron
anestesiados con isoflurano por inhalación (Piramal Critical Care, Inc.) y se obtuvo una muestra de 500 µL
de sangre completa por punción cardíaca en tubos MicroTainer con EDTA-K2 (Impromini, Guangzhou
Improve Medical Instruments Co. Ltd.), esta muestra se conservó para los análisis de parámetros
hematológicos. También se recolectaron 2 mL de sangre completa en tubos de suero (Vacutest gel con
activador de coagulación, Vacutest Kima S.r.l.) para analizar los niveles de hierro y retinol sérico. Luego del
muestreo de la sangre, los animales fueron sacrificados en cámara de CO2 (70%) asegurando la muerte por
dislocación cervical. El hígado, bazo y duodeno fueron conservados en nitrógeno líquido para posteriores
análisis.
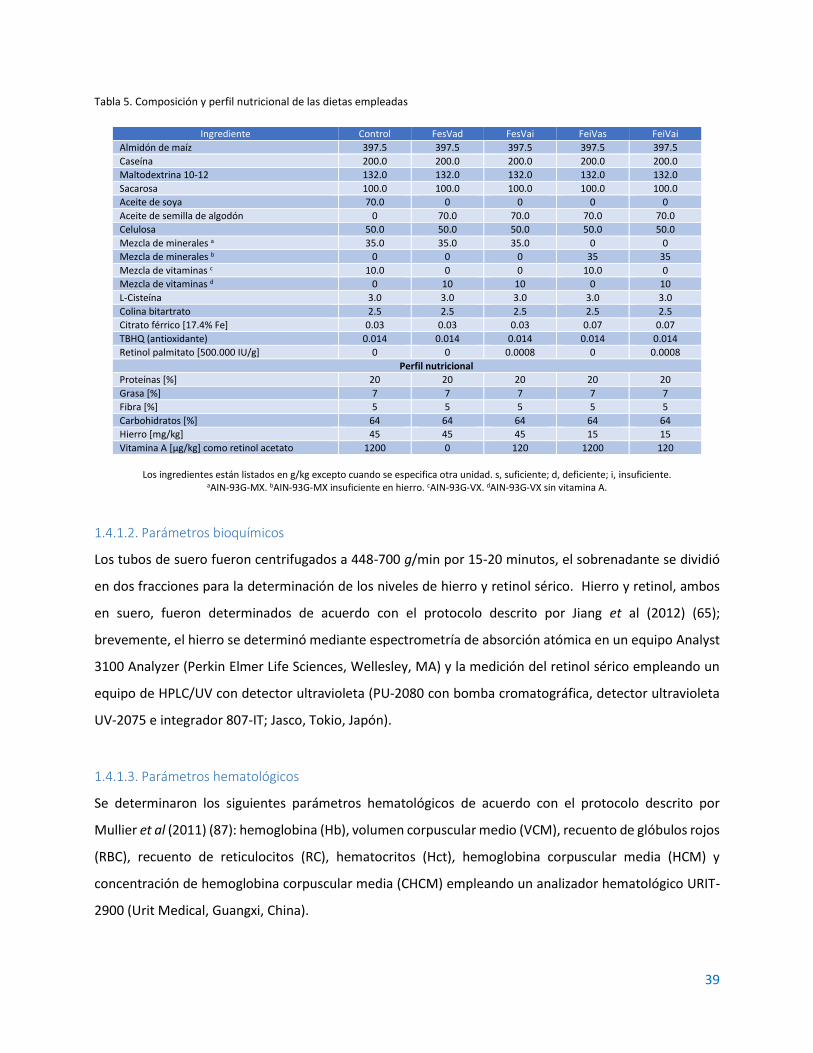
39
Tabla 5. Composición y perfil nutricional de las dietas empleadas
Ingrediente Control FesVad FesVai FeiVas FeiVai
Almidón de maíz 397.5 397.5 397.5 397.5 397.5
Caseína 200.0 200.0 200.0 200.0 200.0
Maltodextrina 10-12 132.0 132.0 132.0 132.0 132.0
Sacarosa 100.0 100.0 100.0 100.0 100.0
Aceite de soya 70.0 0 0 0 0
Aceite de semilla de algodón 0 70.0 70.0 70.0 70.0
Celulosa 50.0 50.0 50.0 50.0 50.0
Mezcla de minerales a 35.0 35.0 35.0 0 0
Mezcla de minerales b 0 0 0 35 35
Mezcla de vitaminas c 10.0 0 0 10.0 0
Mezcla de vitaminas d 0 10 10 0 10
L-Cisteína 3.0 3.0 3.0 3.0 3.0
Colina bitartrato 2.5 2.5 2.5 2.5 2.5
Citrato férrico [17.4% Fe] 0.03 0.03 0.03 0.07 0.07
TBHQ (antioxidante) 0.014 0.014 0.014 0.014 0.014
Retinol palmitato [500.000 IU/g] 0 0 0.0008 0 0.0008
Perfil nutricional
Proteínas [%] 20 20 20 20 20
Grasa [%] 7 7 7 7 7
Fibra [%] 5 5 5 5 5
Carbohidratos [%] 64 64 64 64 64
Hierro [mg/kg] 45 45 45 15 15
Vitamina A [µg/kg] como retinol acetato 1200 0 120 1200 120
Los ingredientes están listados en g/kg excepto cuando se especifica otra unidad. s, suficiente; d, deficiente; i, insuficiente.
aAIN-93G-MX. bAIN-93G-MX insuficiente en hierro. cAIN-93G-VX. dAIN-93G-VX sin vitamina A.
1.4.1.2. Parámetros bioquímicos
Los tubos de suero fueron centrifugados a 448-700 g/min por 15-20 minutos, el sobrenadante se dividió
en dos fracciones para la determinación de los niveles de hierro y retinol sérico. Hierro y retinol, ambos
en suero, fueron determinados de acuerdo con el protocolo descrito por Jiang et al (2012) (65);
brevemente, el hierro se determinó mediante espectrometría de absorción atómica en un equipo Analyst
3100 Analyzer (Perkin Elmer Life Sciences, Wellesley, MA) y la medición del retinol sérico empleando un
equipo de HPLC/UV con detector ultravioleta (PU-2080 con bomba cromatográfica, detector ultravioleta
UV-2075 e integrador 807-IT; Jasco, Tokio, Japón).
1.4.1.3. Parámetros hematológicos
Se determinaron los siguientes parámetros hematológicos de acuerdo con el protocolo descrito por
Mullier et al (2011) (87): hemoglobina (Hb), volumen corpuscular medio (VCM), recuento de glóbulos rojos
(RBC), recuento de reticulocitos (RC), hematocritos (Hct), hemoglobina corpuscular media (HCM) y
concentración de hemoglobina corpuscular media (CHCM) empleando un analizador hematológico URIT-
2900 (Urit Medical, Guangxi, China).
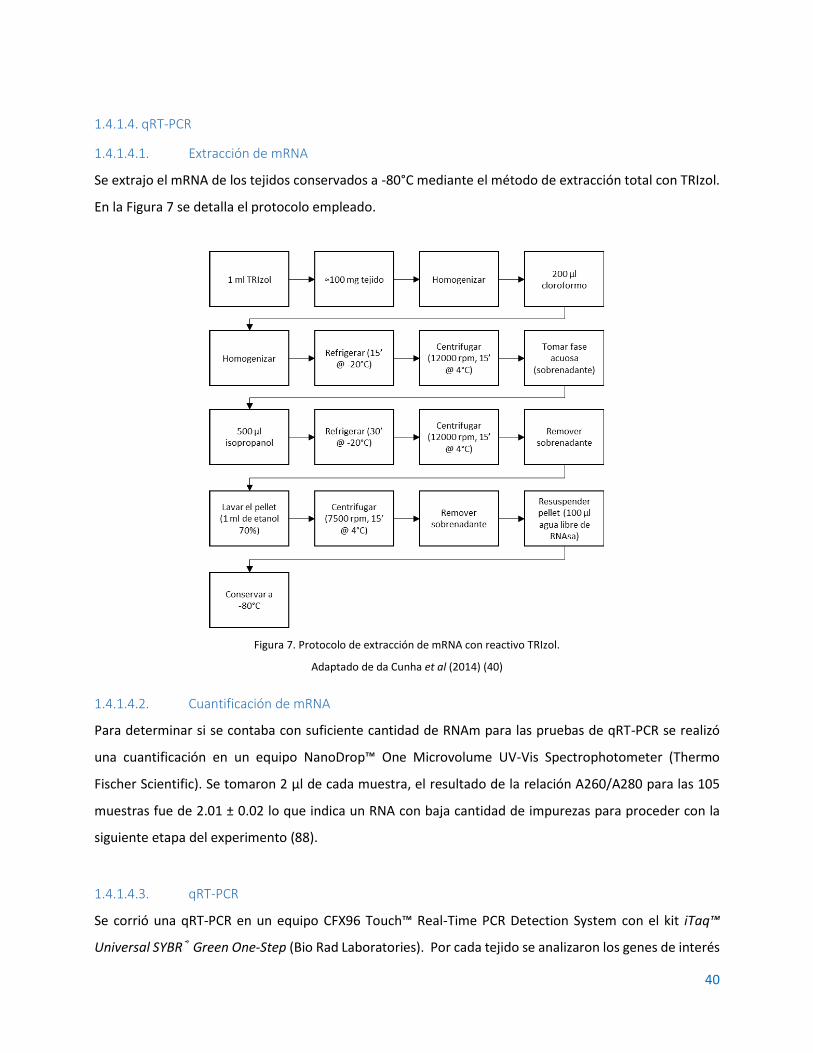
40
1.4.1.4. qRT-PCR
1.4.1.4.1. Extracción de mRNA
Se extrajo el mRNA de los tejidos conservados a -80°C mediante el método de extracción total con TRIzol.
En la Figura 7 se detalla el protocolo empleado.
Figura 7. Protocolo de extracción de mRNA con reactivo TRIzol.
Adaptado de da Cunha et al (2014) (40)
1.4.1.4.2. Cuantificación de mRNA
Para determinar si se contaba con suficiente cantidad de RNAm para las pruebas de qRT-PCR se realizó
una cuantificación en un equipo NanoDrop™ One Microvolume UV-Vis Spectrophotometer (Thermo
Fischer Scientific). Se tomaron 2 µl de cada muestra, el resultado de la relación A260/A280 para las 105
muestras fue de 2.01 ± 0.02 lo que indica un RNA con baja cantidad de impurezas para proceder con la
siguiente etapa del experimento (88).
1.4.1.4.3. qRT-PCR
Se corrió una qRT-PCR en un equipo CFX96 Touch™ Real-Time PCR Detection System con el kit iTaq™
Universal SYBR® Green One-Step (Bio Rad Laboratories). Por cada tejido se analizaron los genes de interés

41
tal como se indica en la Tabla 6 y los primers empleados se detallan en la Tabla 7, los cuales previamente
fueron resuspendidos siguiendo las instrucciones del fabricante y conservados a -20°C para su uso. De
cada muestra de RNAm se tomó una alícuota en función del contenido cuantificado en el equipo NanoDrop
y se prepararon soluciones de trabajo estandarizadas a 100 ng/µl.
Tabla 6. Genes analizados por tejido
Gen Bazo Duodeno Hígado
Hamp (Hepcidina) +
FTH1 (Ferritina) + +
Ireb2 (IRP2) + +
Il6 (IL-6) +
TFRC (Receptor de transferrina 1) +
Actb (β-Actina) + + +
Tabla 7. Primers empleados para la qRT-PCR
Gen (proteina) Forward primer Reverse primer Referencia
Hamp (Hepcidina) 5’-GAAGGCAAGATGGCACTAAGCA-3’ 5’-TCTCGTCTGTTGCCGGAGATAG-3’ (89)
FTH1 (Ferritina) 5’-GCCCTGAAGAACTTTGCCAAAT-3’ 5’-TGCAGGAAGATTCGTCCACCT-3’ (90)
Ireb2 (IRP2) 5’-CTGCATCCCAGCCTATTGAAAA-3’ 5’-GCACTGCTCCTAGCAATGCTTC-5’ (90)
Il6 (IL-6) 5’-GTCAACTCCATCTGCCCTTCAG-3’ 5’-GGCAGTGGCTGTCAACAACAT-3’ (90)
TFRC (Receptor de transferrina 1) 5’-ATACGTTCCCCGTTGTTGAGG-3’ 5’-GGCGGAAACTGAGTATGGTTGA-3’ (90)
Actb (β-Actina) 5’-TGTCACCAACTGGGACGATA-3’ 5’-AACACAGCCTGGATGGCTAC-3’ (91)
Se preparó una MasterMix con el kit SYBR® Green y los primers considerando el número de reacciones
para cada gen por tejido de tal modo que cada pozo contuviera: 5 µl de SYBR® Green, 0.125 µL de
transcriptasa reversa, 1 µl de primer Forward, 1 µl de primer Reverse y 1.775 µl de agua libre de nucleasas.
Luego en cada pozo se depositaron 1 µl de muestra de RNAm y 9 µl de MasterMix.
Las condiciones de la qRT-PCR fueron: 50°C por 1 minuto, posteriormente 95°C por 1 minuto para
activación de la polimerasa y denaturación de DNA, luego desnaturalización a 95°C por 10 segundos,
alineamiento a 60°C por 10 segundos, extensión a 60°C por 30 segundos, se emplearon 40 ciclos para cada
gen. La Figura 8 resume las condiciones de operación en el equipo CFX96 Touch™. Todas las expresiones
fueron normalizadas empleando beta actina como gen de referencia. Toda la información fue analizada
empleando el módulo de Estudio de Genes del software Bio-Rad CFX Maestro v.1.1.

42
Figura 8. Condiciones de la qRT-PCR en el equipo CFX96 Touch™
1.4.1.5. Western-Blot
1.4.1.5.1. Extracción y cuantificación de proteínas
Para la obtención de proteínas totales de los diferentes tejidos (hígados, bazos y duodenos) se preparó
buffer de lisis (NaCl 150mM, PMSF 1mM, Triton X-100 1%, Tris-HCL 50mM, DTT 200mM, EDTA 1mM).
Posteriormente se pesaron aproximadamente 200 mg de tejido que se introdujo en tubos con perlas de
vidrio de 1 mm de diámetro. previamente preparados. Se adicionaron 500 µl de Buffer de lisis y 50 µl de
inhibidores de proteasas (cOmplete™ ULTRA Tablets – Roche, número de catálogo 05892970001). Luego
se homogenizó a 4000 rpm por 90 sg en el homogenizador BeadBug (Benchmark Scientific).
Posteriormente se dejaron las muestras en agitación constante a 4°C por 2 horas en un agitador orbital
IKA KS260 (Fisher Scientific SL). Luego se centrifugaron a 12000 rpm por 20 min en una microcentrífuga
MiniSpin® Plus (Eppendorf) y se recuperó el sobrenadante. Las proteínas totales obtenidas fueron
cuantificadas en el equipo Qiaxpert 200630 (Qiagen). Luego fueron fraccionadas y almacenadas a -20°C.
1.4.1.5.2. Separación de proteínas por electroforesis en gel de poliacrilamida y transferencia a
membranas
Las proteínas totales obtenidas previamente fueron separadas de acuerdo con su peso molecular por
medio de electroforesis vertical en geles de poliacrilamida SDS-PAGE al 12%, excepto las muestras
destinadas a la detección de hepcidina que fueron separadas en geles SDS-PAGE al 20% debido a su bajo
peso molecular (2.7 kDa).
Se usaron membranas de fluoruro de polivinilideno (PVDF) (Inmobilion-P, Millipore) que fueron
previamente activadas en metanol al 100% por 1 min. Luego se procedió a realizar la electrotransferencia

43
usando el método de transferencia húmeda por 2 horas a 100mA. El buffer de transferencia usado
contiene; Tris base 25mM, glicina 190mM, metanol al 20%, pH 8.3, preparado al momento de usar.
1.4.1.5.3. Inmunoblotting
Una vez transferidas las proteínas a la membrana se procedió a bloquearla con leche en polvo descremada
al 5% en TBST (mezcla de solución salina tamponada con Tris y polisorbato 20) de pH 7.4 por 1 hora a
temperatura ambiente. Luego se realizaron 4 lavados con TBST pH 7.4 de 5 minutos cada uno y se procedió
a incubar con el anticuerpo primario 1 hora a temperatura ambiente. Nuevamente se lavaron las
membranas 4 veces con TBST pH 7.4 y se añadió el anticuerpo secundario 1 hora a temperatura ambiente.
Finalmente se realizaron 4 lavados con TBST pH 7.4. En la Tabla 8 se relacionan los anticuerpos primarios
y en la Tabla 9 los anticuerpos secundarios.
Tabla 8. Anticuerpos primarios
Proteína Anticuerpo primario Dilución Procedencia o huésped Proveedor
β-actina beta-Actin Antibody (AC-15) NB600-501 1:2000 Ratón Novus Biologicals
Ferritina Ferritin Antibody NBP1-31944 1:100 Conejo Novus Biologicals
Receptor de transferrina
TfR (Transferrin R) Antibody NB100-92243 1:100 Ratón Novus Biologicals
IL6 IL-6 Antibody NB600-1131 1:500 Conejo Novus Biologicals
Tabla 9. Anticuerpos secundarios
Anticuerpo Dilución Procedencia o huésped Proveedor
anti-Mouse IgG1 Secondary Antibody [HRP] NB7511 1:2000 Cabra Novus Biologicals
anti-Rabbit IgG (H+L) Secondary Antibody [HRP] NB7160 1:500 Cabra Novus Biologicals
Las membranas fueron reveladas por medio de un método colorimétrico utilizando 3,3'-Diaminobenzidine
(DAB) así: Se añadió 250 µl de DAB 1% y 250 µl de H2O2 al 0.3% a 10 ml de TBS 1X, la membrana se sumergió
en esta solución de trabajo y se agitó en un agitador orbital IKA KS260 (Fisher Scientific SL) a temperatura
ambiente durante 3 minutos. La reacción se detiene añadiendo agua destilada. Las membranas se dejan
secar sobre una toalla a temperatura ambiente y después fueron escaneadas en un equipo C-DiGit™
(Bonsai Lab) para su posterior análisis. Se utilizó un marcador de peso molecular como referencia del
tamaño de las bandas en cada una de las membranas (FastGene® BlueEasy Protein Ladder – Nippon
genetics).

44
1.4.1.5.4. Cuantificación relativa de las proteínas
Las membranas escaneadas fueron luego analizadas utilizando el software ImageJ (National Institutes of
Health), donde se realizó un análisis densitométrico de las bandas obtenidas. Cabe resaltar que los
resultados se expresan en términos relativos, usando el grupo control como estándar para comparar los
demás grupos.
1.4.1.6. Análisis estadístico
La Información se analizó empleando el software SPSS (IBM SPSS Statistics for Windows, Version 25.0.
Armonk, NY) y se examinaron los datos para distribución normal mediante la prueba de Kolmogorov-
Smirnov. Los resultados se expresaron como media ± desviación estándar y luego se realizó el análisis de
medias entre los grupos experimentales mediante la prueba de la mínima diferencia significativa. La
ganancia de peso se analizó mediante análisis de varianza de medidas repetidas. Se consideraron
significativos valores P menores a 0.05.
Para el Western Blot se calculó la media, desviación estándar, el intervalo de confianza y análisis de
varianza de una vía (ANOVA) usando el software GraphPad Prism 7.04 (GraphPad, San Diego, CA, USA). Se
realizaron por lo menos 3 réplicas biológicas para cada experimento. Seguido del ANOVA de una vía se
realizaron comparaciones múltiples con el método de Tukey entre el grupo control y los grupos
experimentales para buscar diferencias significativas (P<0.05). Los resultados fueron graficados como
valores de expresión relativa a β-actina donde el grupo control siempre es igual a 1.
1.5. PRODUCCIÓN CIENTÍFICA DERIVADA DE LA INVESTIGACIÓN
Como resultado de esta investigación se tienen tres artículos originales, dos de ellos publicados y uno
sometido actualmente, adicional un artículo de revisión, publicado también, resultado de la pasantía en la
Universidad de São Paulo. Los documentos completos se anexan al final y esta es la relación de las
publicaciones:
• Influence of Dietary Vitamin A and Iron Deficiency on Hematologic Parameters and Body Weight of
Young Male Wistar Rats. Mauricio Restrepo-Gallego and Luis E Díaz. Journal of the American
Association for Laboratory Animal Science. Vol 59, No 1. January 2020. Pages 1–7.
45
• Vitamin A does not influence mRNA expression of hormone hepcidin but other biomarkers of iron
homeostasis in young male Wistar rats. Mauricio Restrepo-Gallego, and Luis E. Díaz. Int J Vitam Nutr
Res (2020), 1–9.
• Vitamin A deficiency influences the expression of ferritin in young male Wistar rats. Mauricio Restrepo-
Gallego, Luis Eduardo Díaz, Juan David Ospina-Villa and Danny Chinchilla-Cárdenas. {SOMETIDO}
Nutrients Special Issue "Dietary Iron for Human Health"
• Classic and emergent indicators for the assessment of human iron status. Mauricio Restrepo-Gallego,
Luis E. Díaz & Patrícia H.C Rondó. Critical Reviews in Food Science and Nutrition. Published online: 03
Jul 2020.
También se participó en el VII Congreso Internacional del Colegio Colombiano de Gastroenterología,
Hepatología y Nutrición Pediátrica, con la ponencia: “Anemia: El modelo animal como herramienta para
estudiar el efecto de la vitamina A sobre algunos parámetros hematológicos y marcadores del estado
nutricional del hierro”.
46
2. INFLUENCIA DE LA VITAMINA DIETARIA Y LA DEFICIENCIA DE
HIERRO SOBRE LA GANANCIA DE PESO Y ALGUNOS PARÁMETROS
HEMATOLÓGICOS EN RATAS WISTAR MACHO JÓVENES2
2.1. RESULTADOS
2.1.1. Parámetros bioquímicos
Todas las comparaciones entre grupos indicaron diferencias significativas en el contenido de hierro sérico.
Ambos grupos con bajos niveles dietarios de hierro (FeivAs y FeivAi) tuvieron diferencias significativas
respecto del grupo control (P<0.001 para ambos grupos). Los grupos con algún déficit de vitamina A y
suficiente hierro (FesvAi y FesvAd) también mostraron un impacto sobre el contenido total de hierro sérico
(P=0.024 y 0.001 respectivamente), el grupo con carencia total de vitamina A (FesvAd) mostró los valores
más bajos.
En términos de retinol sérico los grupos con alguna carencia o privación de vitamina A (FesvAi, FeivAi y
FesvAd) presentaron valores significativamente inferiores a los del grupo control (P<0.001 para todos los
grupos). En la comparación múltiple los grupos insuficientes, más no deficientes, en vitamina A (FesvAi y
FeivAi) no mostraron diferencias significativas entre ellos (P=0,980). En la Tabla 10 se resumen los
resultados de ambos parámetros bioquímicos.
2 Esta sección corresponde al artículo “Influence of Dietary Vitamin A and Iron Deficiency on Hematologic Parameters and Body Weight of Young
Male Wistar Rats” publicado en el Journal of the American Association for Laboratory Animal Science – JAALAS (Vol 59, No 1, Enero 2020) DOI: 10.30802/AALAS-JAALA-19-000020
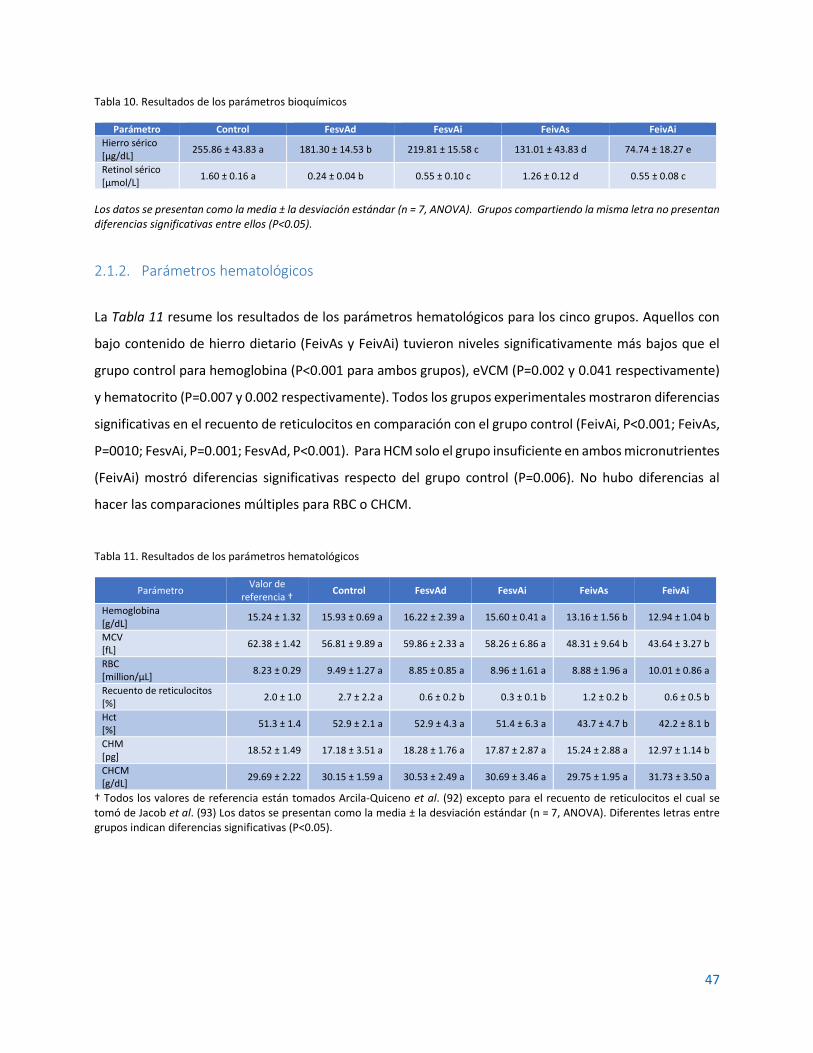
47
Tabla 10. Resultados de los parámetros bioquímicos
Parámetro Control FesvAd FesvAi FeivAs FeivAi
Hierro sérico [µg/dL]
255.86 ± 43.83 a 181.30 ± 14.53 b 219.81 ± 15.58 c 131.01 ± 43.83 d 74.74 ± 18.27 e
Retinol sérico [µmol/L]
1.60 ± 0.16 a 0.24 ± 0.04 b 0.55 ± 0.10 c 1.26 ± 0.12 d 0.55 ± 0.08 c
Los datos se presentan como la media ± la desviación estándar (n = 7, ANOVA). Grupos compartiendo la misma letra no presentan diferencias significativas entre ellos (P<0.05).
2.1.2. Parámetros hematológicos
La Tabla 11 resume los resultados de los parámetros hematológicos para los cinco grupos. Aquellos con
bajo contenido de hierro dietario (FeivAs y FeivAi) tuvieron niveles significativamente más bajos que el
grupo control para hemoglobina (P<0.001 para ambos grupos), eVCM (P=0.002 y 0.041 respectivamente)
y hematocrito (P=0.007 y 0.002 respectivamente). Todos los grupos experimentales mostraron diferencias
significativas en el recuento de reticulocitos en comparación con el grupo control (FeivAi, P<0.001; FeivAs,
P=0010; FesvAi, P=0.001; FesvAd, P<0.001). Para HCM solo el grupo insuficiente en ambos micronutrientes
(FeivAi) mostró diferencias significativas respecto del grupo control (P=0.006). No hubo diferencias al
hacer las comparaciones múltiples para RBC o CHCM.
Tabla 11. Resultados de los parámetros hematológicos
Parámetro Valor de
referencia † Control FesvAd FesvAi FeivAs FeivAi
Hemoglobina [g/dL]
15.24 ± 1.32 15.93 ± 0.69 a 16.22 ± 2.39 a 15.60 ± 0.41 a 13.16 ± 1.56 b 12.94 ± 1.04 b
MCV [fL]
62.38 ± 1.42 56.81 ± 9.89 a 59.86 ± 2.33 a 58.26 ± 6.86 a 48.31 ± 9.64 b 43.64 ± 3.27 b
RBC [million/µL]
8.23 ± 0.29 9.49 ± 1.27 a 8.85 ± 0.85 a 8.96 ± 1.61 a 8.88 ± 1.96 a 10.01 ± 0.86 a
Recuento de reticulocitos [%]
2.0 ± 1.0 2.7 ± 2.2 a 0.6 ± 0.2 b 0.3 ± 0.1 b 1.2 ± 0.2 b 0.6 ± 0.5 b
Hct [%]
51.3 ± 1.4 52.9 ± 2.1 a 52.9 ± 4.3 a 51.4 ± 6.3 a 43.7 ± 4.7 b 42.2 ± 8.1 b
CHM [pg]
18.52 ± 1.49 17.18 ± 3.51 a 18.28 ± 1.76 a 17.87 ± 2.87 a 15.24 ± 2.88 a 12.97 ± 1.14 b
CHCM [g/dL]
29.69 ± 2.22 30.15 ± 1.59 a 30.53 ± 2.49 a 30.69 ± 3.46 a 29.75 ± 1.95 a 31.73 ± 3.50 a
† Todos los valores de referencia están tomados Arcila-Quiceno et al. (92) excepto para el recuento de reticulocitos el cual se tomó de Jacob et al. (93) Los datos se presentan como la media ± la desviación estándar (n = 7, ANOVA). Diferentes letras entre grupos indican diferencias significativas (P<0.05).

48
2.1.3. Ingesta de alimento y peso corporal
El peso corporal de los cinco grupos fue comparable en la línea de base. A la semana 5 el peso promedio
del grupo suficiente en hierro dietario e insuficiente en vitamina A (FesvAi) fue significativamente inferior
que el del grupo control. Luego de la semana 7, todos los grupos experimentales mostraron pesos
promedio significativamente menores que los del grupo control. Las comparaciones entre los grupos
experimentales luego de la semana siete no mostraron diferencias significativas entre ellos. Al final del
experimento la diferencia media en peso respecto del grupo control fue de 29.8 ± 10.0 g. El efecto de las
dietas en el peso corporal de los animales se muestra en la Figura 9. Los cinco grupos no mostraron
diferencias significativas entre ellos al comparar la ingesta de alimento (P=0.126), y la ingesta media por
animal fue de 15.5 g/día, lo cual es consistente con la ingesta esperada para ratas Wistar macho en
crecimiento (94).
Figura 9. Curvas de ganancia en peso de las ratas bajo las dietas experimentales comparadas con el grupo control. Las gráficas se construyeron con el promedio y las barras de error indican la desviación estándar (n = 7, ANOVA de medidas
repetidas).

49
2.2. DISCUSIÓN
2.2.1. Parámetros bioquímicos
Todas las diferencias entre los grupos para hierro sérico fueron significativas, esto permitió ordenarlos de
mayor a menor según esta variable de respuesta así: Control > FesvAi > FesvAd > FeivAs > FeivAi. Los tres
primeros grupos tuvieron suficiente hierro dietario, pero el nivel de vitamina A decrece del primero
(Control, vAs) al tercero (vAd); esto sugiere que, aún con un adecuado suministro de hierro dietario,
insuficiencia o deficiencia de vitamina A puede causar un decrecimiento proporcional en los niveles de
hierro sérico. Estos resultados son consistentes con los hallazgos de Saraiva et al. (95), quienes
encontraron una asociación positiva entre la deficiencia de retinol sérico y la deficiencia de hierro sérico
en una muestra de la ciudad de Vitoria (Brasil). Otros autores también han encontrado vínculos entre la
VAD y la ID a través de numerosos estudios epidemiológicos. Por ejemplo, Alfaro-Calvo and Carvajal-
Fernandez (96) encontraron que las probabilidades de anemia entre niños con VAD eran 2.5 veces mayores
(OR = 2.5; 95% IC, 0.027-0.049; P < 0.001) que aquellas para niños con niveles adecuados de vitamina A.
Sales et al. (97) encontraron que la VAD está relacionada con bajos niveles de hierro sérico aunque esto
no implicaba cambios en los niveles de ferritina sérica, situación característica de la anemia por VAD. (98)
La mayoría de las diferencias entre grupos para retinol sérico fueron también significativas y, al igual que
con el hierro sérico, permiten hacer una ordenación de los grupos de mayor a menor así: Control > FeivAs
> (FesvAi = FeivAi) > FesvAd. Se nota que la única variable que parece influenciar el contenido de retinol
sérico es el contenido dietario de vitamina A independientemente del contenido de hierro, por lo tanto,
bajo las condiciones de este experimento, el hierro no tiene influencia sobre los niveles de retinol sérico.
2.2.2. Parámetros hematológicos
Las investigaciones previas sobre el efecto de la vitamina A en el metabolismo del hierro no han producido
resultados en relación con el efecto específico de dietas con restricción de vitamina A sobre la
concentración de hemoglobina. Arruda et al.(78) encontraron que la VAD puede incrementar la
concentración de Hb pero no hallaron evidencia si era por causa de alguna carencia de
hemoconcentración. De otro lado, Ameny et al.(99) encontraron casos de anemia leve tanto en animales
como en humanos cuando la vitamina A era deficiente en la dieta. Los resultados obtenidos en este estudio
son más consistentes con los hallazgos de Jiang et al.,(65) quien encontró que no hay relación entre el
estado de la vitamina A y la concentración de Hb cuando los niveles de hierro son normales. Basados en
50
estas situaciones, las condiciones del experimento sugieren que no hay relación directa entre la
concentración de Hb y los niveles de vitamina A dietaria a menos que los niveles de hierro dietario tengan
algún tipo de deficiencia.
El volumen corpuscular medio (MCV) permite la clasificación de la anemia basados en una aproximación
morfológica: microcítica (por debajo de lo normal), normocítica (dentro del rango normal), y macrocítica
(por encima de lo normal) (100). En comparación con el grupo control, únicamente los grupos que fueron
bajos en hierro dietario tuvieron valores significativamente diferentes para MCV; una comparación
múltiple mostró que los grupos con suficiente hierro dietario (FesvAs, FesvAi, y FesvAd) tuvieron valores
significativamente más altos que los grupos con deficiencia de hierro (FeivAs, FeivAi). Adicionalmente
cuando fueron comparados con los valores de referencia (62.38 ± 1.42 fL), los grupos sin deficiencia de
hierro fueron normocíticos pero aquellos con deficiencia de hierro fueron clasificados como microcíticos
(87). Los resultados también mostraron que únicamente la deficiencia de hierro influencia el MCV,
mientras que la VAD parece no tener efecto alguno.
Todos los grupos experimentales estuvieron dentro del rango normal para recuento de glóbulos rojos
(RBC) o ligeramente por encima del mismo, lo cual indica que, en las condiciones de nuestro estudio, el
RBC puede ser normal independientemente de la concentración de Hb, aún en casos de deficiencia de
hierro. Sin embargo, debe tenerse en cuenta que el simple valor de RBC no puede interpretarse sin hacer
referencia a otros parámetros hematológicos para poder hacer un diagnóstico completo.
En el año 2000, el estudio de Roodenburg et al propuso que no hay evidencia entre VAD y una eritropoiesis
inefectiva, aunque en su estudio el análisis de la dinámica de la homeostasis del hierro fue indirecto y
cualitativo, reconociendo que un estudio enfocado cinética y cuantitativamente podría arrojar más
información, de hecho reconocen que algunos niveles de acumulación de hierro en médula ósea y bazo
podrían deberse a la VAD (70). Esto parece haber sido considerado en los estudios posteriores en 2014 y
2016 realizados por da Cunha et al (40), Dewamitta et al (101) y Honda et al (102) quienes propusieron un
modelo en el cual la eritropoyesis inefectiva en VAD se debe a un mecanismo de regulación negativa de la
hepcidina y disminución de la expresión de eritropoyetina a nivel renal, lo que desencadena una
acumulación del grupo hemo en hígado y bazo, disminuyendo su disponibilidad y, por lo tanto, su
reutilización en la síntesis de hemoglobina. Los resultados de nuestro estudio con consistentes con estos
51
últimos resultados corroborando que tanto hierro como vitamina A son necesarios para una adecuada
eritropoiesis.
El hematocrito (Hct) es el porcentaje de RBC (por volumen) en la sangre. Se determina multiplicando RBC
por MCV. Dado que los resultados de RBC fueron similares para todos los grupos y únicamente los grupos
con deficiencia de hierro mostraron valores bajos de MCV, era de esperarse que el Hct fuera bajo
(51.3% ± 1.4%) solamente en los grupos deficientes de hierro. Bajos valores de Hct son indicadores de
anemia (103). Al igual que para Hb y MCV, los valores de Hct estuvieron por debajo del rango de referencia
en los grupos deficientes de hierro, algo que también se esperaba.
La hemoglobina corpuscular media (MCH) es una medida de la masa media de Hb por RBC, y se calcula
como Hb × 10 / RBC (100). El estado en el cual las células individuales contienen menos Hb de la que
usualmente contienen en condiciones óptimas se conoce como anemia hipocrómica (104). Los resultados
de MCH indicaron la presencia de anemia hipocrómica para el grupo insuficiente en ambos
micronutrientes (FeivAi) pero no para el grupo insuficiente en hierro y suficiente en vitamina A (FeivAs),
esto corrobora la importancia de la vitamina A para una adecuada incorporación de hierro en los glóbulos
rojos aún bajo un estado de deficiencia marginal de hierro, lo cual corrobora con lo descrito por Amine et
al (1970) en cuanto a que la deficiencia combinada de ambos micronutrientes genera anemia hipocrómica
(105).
La concentración de hemoglobina corpuscular media (MCHC) es un indicador de la concentración media
de Hb en un volumen dado de glóbulos rojos, y se calcula dividiendo el contenido de Hb (g/100 ml) por el
hematocrito (%) (100). Como se trata de una fracción, la MCHC disminuye o aumenta erróneamente
cuando se altera una medición precisa de Hb y hematocrito, y los valores aumentados siempre son una
mala interpretación porque los glóbulos rojos no pueden contener más hemoglobina de lo normal. El
MCHC verdaderamente aumentado generalmente ocurre en la esferocitosis hereditaria y el MCHC
reducido es un representante confiable de la deficiencia funcional de hierro, incluso en ausencia de anemia
(106,107). De acuerdo con los resultados del estudio, ni la VAD ni la ID tienen algún efecto sobre la MCHC,
pero esta conclusión no es consistente con los resultados para Hb y Hct, por lo tanto, es necesario
considerar múltiples parámetros para un adecuado diagnóstico del estado nutricional del hierro.
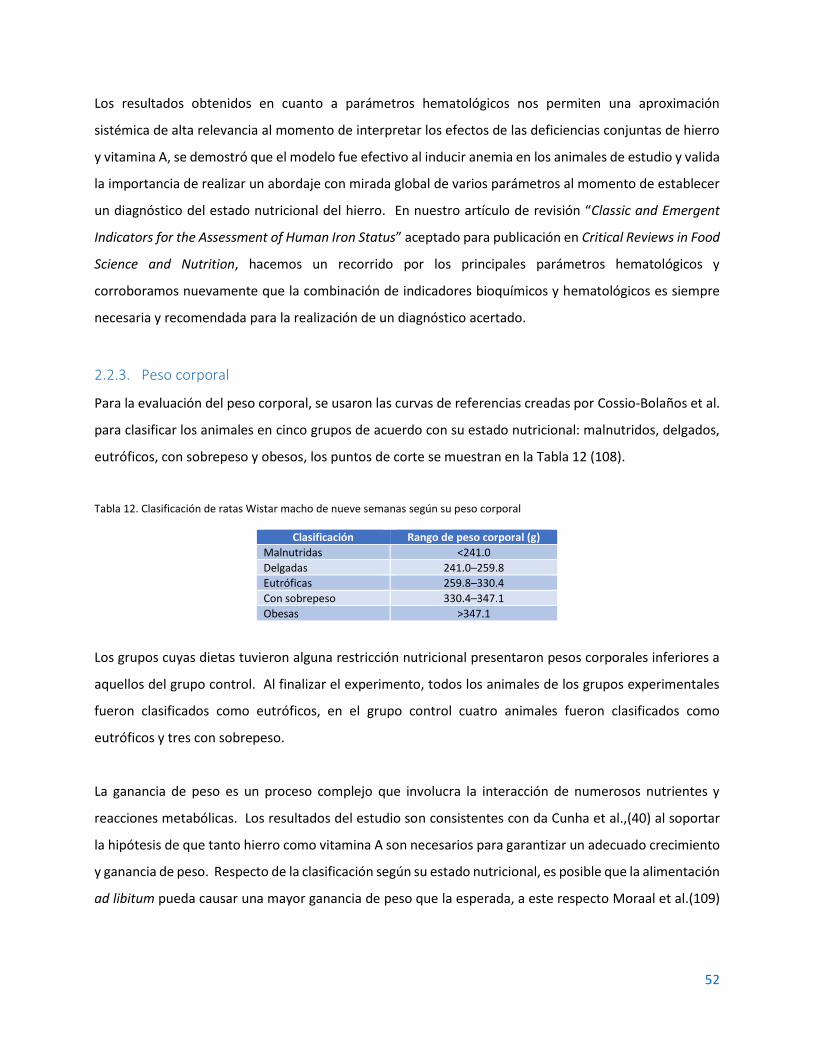
52
Los resultados obtenidos en cuanto a parámetros hematológicos nos permiten una aproximación
sistémica de alta relevancia al momento de interpretar los efectos de las deficiencias conjuntas de hierro
y vitamina A, se demostró que el modelo fue efectivo al inducir anemia en los animales de estudio y valida
la importancia de realizar un abordaje con mirada global de varios parámetros al momento de establecer
un diagnóstico del estado nutricional del hierro. En nuestro artículo de revisión “Classic and Emergent
Indicators for the Assessment of Human Iron Status” aceptado para publicación en Critical Reviews in Food
Science and Nutrition, hacemos un recorrido por los principales parámetros hematológicos y
corroboramos nuevamente que la combinación de indicadores bioquímicos y hematológicos es siempre
necesaria y recomendada para la realización de un diagnóstico acertado.
2.2.3. Peso corporal
Para la evaluación del peso corporal, se usaron las curvas de referencias creadas por Cossio-Bolaños et al.
para clasificar los animales en cinco grupos de acuerdo con su estado nutricional: malnutridos, delgados,
eutróficos, con sobrepeso y obesos, los puntos de corte se muestran en la Tabla 12 (108).
Tabla 12. Clasificación de ratas Wistar macho de nueve semanas según su peso corporal
Clasificación Rango de peso corporal (g)
Malnutridas <241.0
Delgadas 241.0–259.8
Eutróficas 259.8–330.4
Con sobrepeso 330.4–347.1
Obesas >347.1
Los grupos cuyas dietas tuvieron alguna restricción nutricional presentaron pesos corporales inferiores a
aquellos del grupo control. Al finalizar el experimento, todos los animales de los grupos experimentales
fueron clasificados como eutróficos, en el grupo control cuatro animales fueron clasificados como
eutróficos y tres con sobrepeso.
La ganancia de peso es un proceso complejo que involucra la interacción de numerosos nutrientes y
reacciones metabólicas. Los resultados del estudio son consistentes con da Cunha et al.,(40) al soportar
la hipótesis de que tanto hierro como vitamina A son necesarios para garantizar un adecuado crecimiento
y ganancia de peso. Respecto de la clasificación según su estado nutricional, es posible que la alimentación
ad libitum pueda causar una mayor ganancia de peso que la esperada, a este respecto Moraal et al.(109)
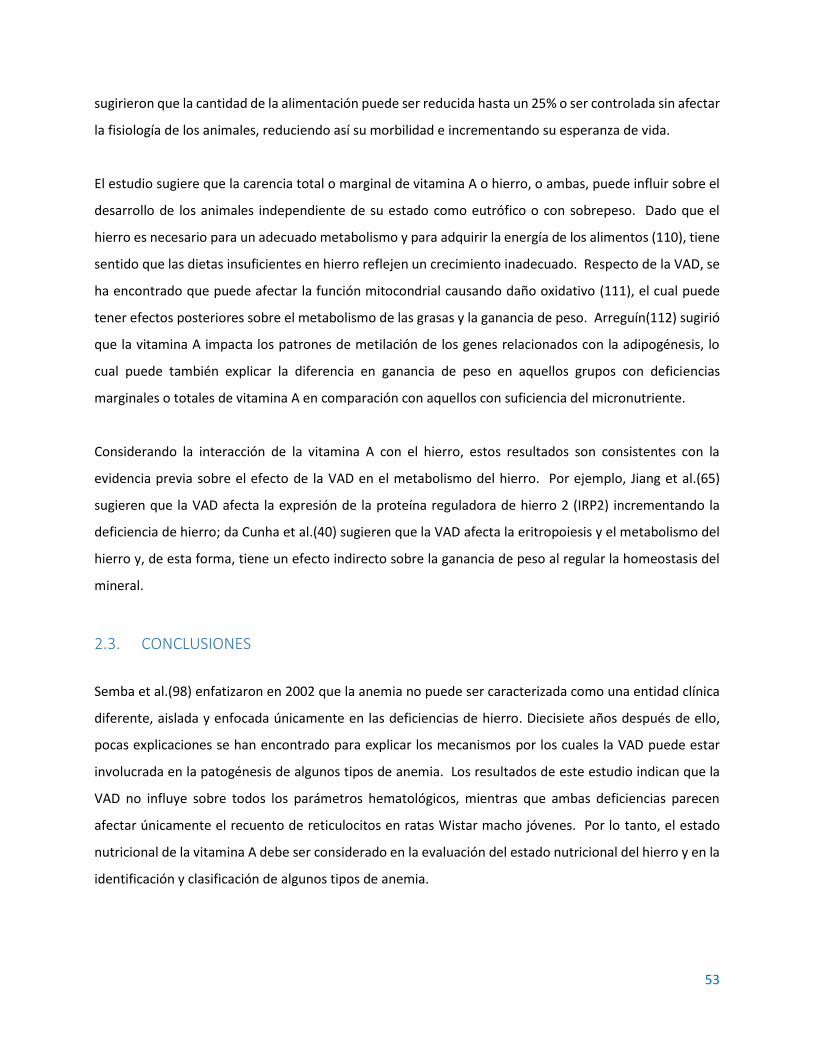
53
sugirieron que la cantidad de la alimentación puede ser reducida hasta un 25% o ser controlada sin afectar
la fisiología de los animales, reduciendo así su morbilidad e incrementando su esperanza de vida.
El estudio sugiere que la carencia total o marginal de vitamina A o hierro, o ambas, puede influir sobre el
desarrollo de los animales independiente de su estado como eutrófico o con sobrepeso. Dado que el
hierro es necesario para un adecuado metabolismo y para adquirir la energía de los alimentos (110), tiene
sentido que las dietas insuficientes en hierro reflejen un crecimiento inadecuado. Respecto de la VAD, se
ha encontrado que puede afectar la función mitocondrial causando daño oxidativo (111), el cual puede
tener efectos posteriores sobre el metabolismo de las grasas y la ganancia de peso. Arreguín(112) sugirió
que la vitamina A impacta los patrones de metilación de los genes relacionados con la adipogénesis, lo
cual puede también explicar la diferencia en ganancia de peso en aquellos grupos con deficiencias
marginales o totales de vitamina A en comparación con aquellos con suficiencia del micronutriente.
Considerando la interacción de la vitamina A con el hierro, estos resultados son consistentes con la
evidencia previa sobre el efecto de la VAD en el metabolismo del hierro. Por ejemplo, Jiang et al.(65)
sugieren que la VAD afecta la expresión de la proteína reguladora de hierro 2 (IRP2) incrementando la
deficiencia de hierro; da Cunha et al.(40) sugieren que la VAD afecta la eritropoiesis y el metabolismo del
hierro y, de esta forma, tiene un efecto indirecto sobre la ganancia de peso al regular la homeostasis del
mineral.
2.3. CONCLUSIONES
Semba et al.(98) enfatizaron en 2002 que la anemia no puede ser caracterizada como una entidad clínica
diferente, aislada y enfocada únicamente en las deficiencias de hierro. Diecisiete años después de ello,
pocas explicaciones se han encontrado para explicar los mecanismos por los cuales la VAD puede estar
involucrada en la patogénesis de algunos tipos de anemia. Los resultados de este estudio indican que la
VAD no influye sobre todos los parámetros hematológicos, mientras que ambas deficiencias parecen
afectar únicamente el recuento de reticulocitos en ratas Wistar macho jóvenes. Por lo tanto, el estado
nutricional de la vitamina A debe ser considerado en la evaluación del estado nutricional del hierro y en la
identificación y clasificación de algunos tipos de anemia.

54
Este estudio también sugiere que, en relación con el peso corporal, tanto hierro como vitamina A son
esenciales para un adecuado crecimiento y ganancia de peso y, por lo tanto, deben ser considerados
conjuntamente en programas de recuperación nutricional. También destacamos que, bajo condiciones
experimentales, ratas Wistar macho con carencias en uno o lo dos micronutrientes pueden tener una
ganancia de peso por debajo de los parámetros regulares bajo alimentación ad libitum.
Finalmente, es necesario profundizar aún más sobre cómo la patogénesis de la anemia está vinculada a
deficiencias de otros nutrientes diferentes al hierro, en este caso particular a la vitamina A. Las técnicas
analíticas moleculares como PCR y Western Blot pueden proveer información adicional sobre los
mecanismos a través de los cuales la vitamina A regula el metabolismo del hierro causando algún tipo de
anemia no deficiente de hierro a nivel celular.

55
3. EFECTO DE LAS VARIACIONES DIETARIAS DE HIERRO Y VITAMINA A SOBRE LA EXPRESIÓN DEL RNAm DE LA HORMONA HEPCIDINA Y OTROS
MARCADORES DEL METABOLISMO DEL HIERRO EN RATAS WISTAR MACHO JÓVENES3
3.1. RESULTADOS
La Figura 10 muestra que, bajo las condiciones de este experimento, no se evidenciaron diferencias
significativas en la expresión relativa a nivel hepático del gen de interleucina-6 (IL6) normalizado a Actb
cuando fueron comparados con el grupo control.
Figura 10. Expresión relativa de los niveles de Il6 en hígado. La expresión fue normalizada a Actb (beta actina). Los datos representan la media ± DE. (n=7). *Diferencias significativas (P<0.05, ANOVA de una
vía) en comparación con el grupo control. Las barras de error representan un IC del 95%. UA: Unidades Arbitrarias
La Figura 11 muestra los niveles de transcripción relativa del gen Hamp (hepcidina) normalizados a la
expresión del gen beta actina (Actb), el cual se utilizó como gen casero. En comparación con el grupo
3 Esta sección corresponde al artículo “Vitamin A does not influence mRNA expression of hormone hepcidin but other biomarkers of iron
homeostasis in young male Wistar rats” aceptado para publicación en el International Journal for Vitamin and Nutrition Research.
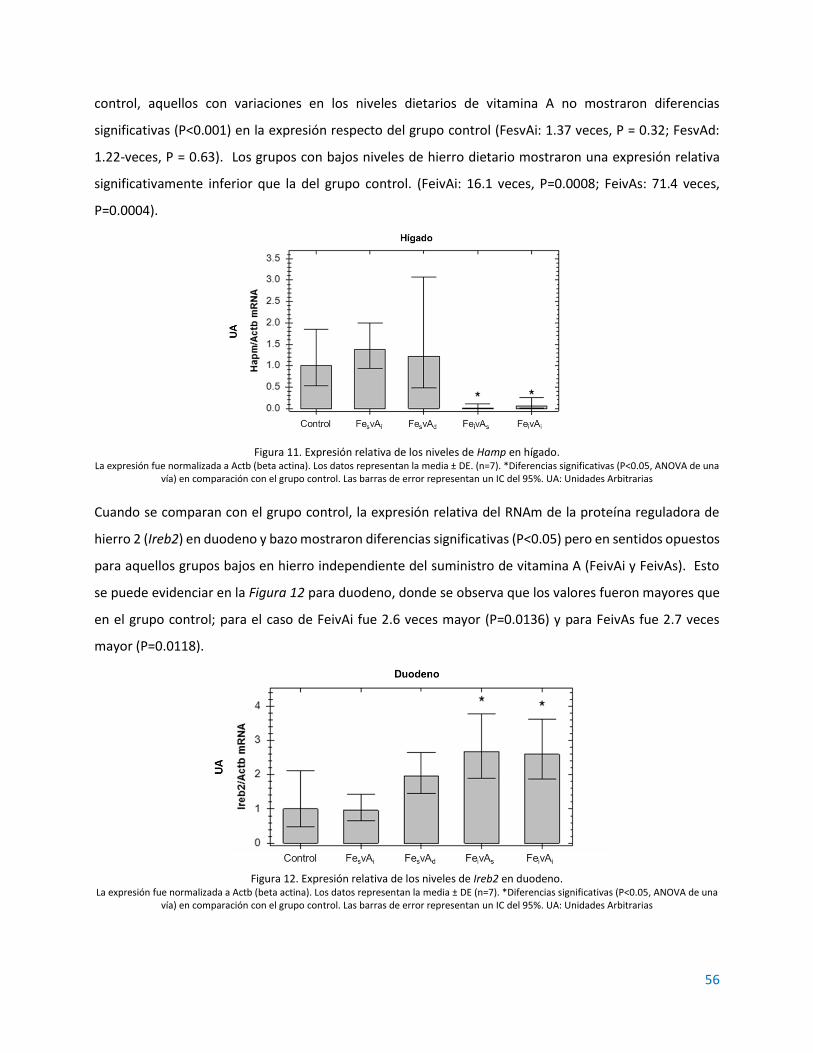
56
control, aquellos con variaciones en los niveles dietarios de vitamina A no mostraron diferencias
significativas (P<0.001) en la expresión respecto del grupo control (FesvAi: 1.37 veces, P = 0.32; FesvAd:
1.22-veces, P = 0.63). Los grupos con bajos niveles de hierro dietario mostraron una expresión relativa
significativamente inferior que la del grupo control. (FeivAi: 16.1 veces, P=0.0008; FeivAs: 71.4 veces,
P=0.0004).
Figura 11. Expresión relativa de los niveles de Hamp en hígado. La expresión fue normalizada a Actb (beta actina). Los datos representan la media ± DE. (n=7). *Diferencias significativas (P<0.05, ANOVA de una
vía) en comparación con el grupo control. Las barras de error representan un IC del 95%. UA: Unidades Arbitrarias
Cuando se comparan con el grupo control, la expresión relativa del RNAm de la proteína reguladora de
hierro 2 (Ireb2) en duodeno y bazo mostraron diferencias significativas (P<0.05) pero en sentidos opuestos
para aquellos grupos bajos en hierro independiente del suministro de vitamina A (FeivAi y FeivAs). Esto
se puede evidenciar en la Figura 12 para duodeno, donde se observa que los valores fueron mayores que
en el grupo control; para el caso de FeivAi fue 2.6 veces mayor (P=0.0136) y para FeivAs fue 2.7 veces
mayor (P=0.0118).
Figura 12. Expresión relativa de los niveles de Ireb2 en duodeno.
La expresión fue normalizada a Actb (beta actina). Los datos representan la media ± DE (n=7). *Diferencias significativas (P<0.05, ANOVA de una vía) en comparación con el grupo control. Las barras de error representan un IC del 95%. UA: Unidades Arbitrarias

57
En la Figura 13 se observa que, en bazo, los mismos grupos muestran diferencias significativas pero
menores que el grupo control. En el grupo FeivAi fue 2.9 veces menor (P<0.001) y en el grupo FeivAs fue
3.7 veces menor (P<0.001).
Figura 13. Expresión relativa de los niveles de Ireb2 en bazo.
La expresión fue normalizada a Actb (beta actina). Los datos representan la media ± DE (n=7). *Diferencias significativas (P<0.05, ANOVA de una vía) en comparación con el grupo control. Las barras de error representan un IC del 95%. UA: Unidades Arbitrarias
Sobre la expresión del RNAm de ferritina (FTH1) en el duodeno (Figura 14), el grupo suficiente en hierro y
carente de vitamina A (FesvAd) mostró diferencias significativas al compararse con el grupo control, los
valores normalizados fueron 5.1 veces mayores (P=0.0017). Por el contrario, la expresión del mismo gen
en bazo fue significativamente menor respecto del grupo control únicamente para el mismo grupo, con
3.5 veces menos expresión relativa (P=0.0018) tal como se observa en la Figura 15.
Figura 14. Expresión relativa de los niveles de FTH1 en duodeno. La expresión fue normalizada a Actb (beta actina). Los datos representan la media ± DE (n=7). *Diferencias significativas (P<0.05, ANOVA de una
vía) en comparación con el grupo control. Las barras de error representan un IC del 95%. UA: Unidades Arbitrarias
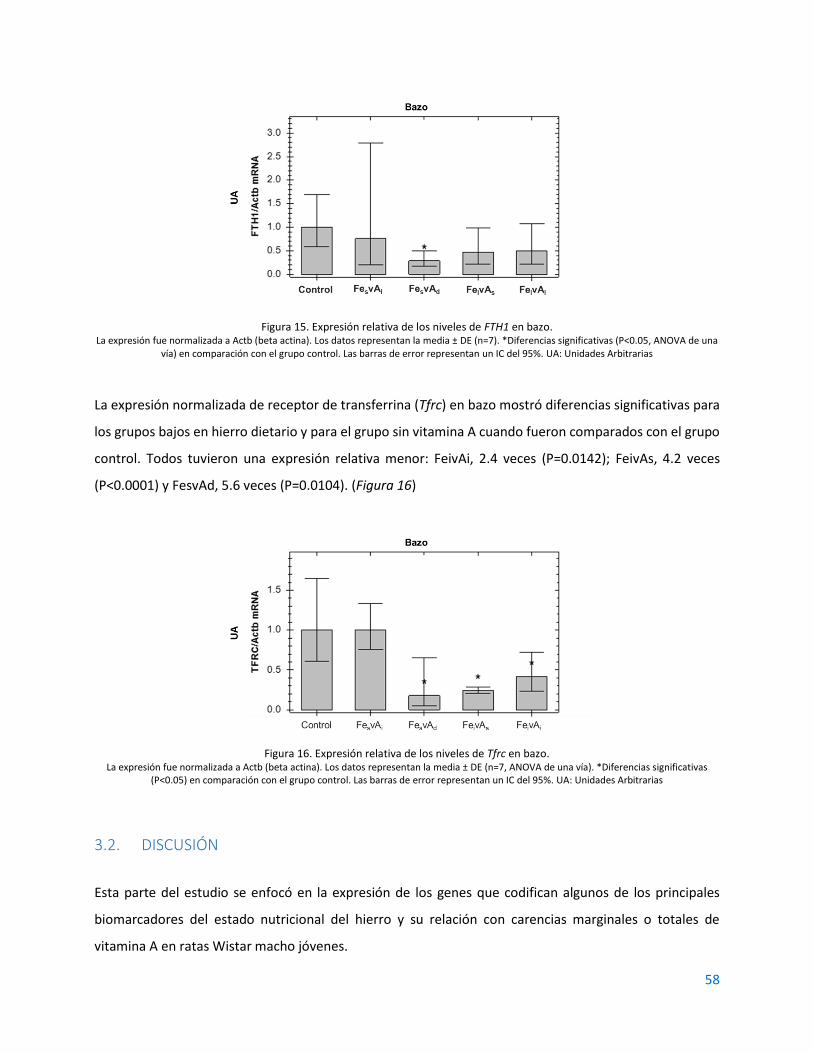
58
Figura 15. Expresión relativa de los niveles de FTH1 en bazo. La expresión fue normalizada a Actb (beta actina). Los datos representan la media ± DE (n=7). *Diferencias significativas (P<0.05, ANOVA de una
vía) en comparación con el grupo control. Las barras de error representan un IC del 95%. UA: Unidades Arbitrarias
La expresión normalizada de receptor de transferrina (Tfrc) en bazo mostró diferencias significativas para
los grupos bajos en hierro dietario y para el grupo sin vitamina A cuando fueron comparados con el grupo
control. Todos tuvieron una expresión relativa menor: FeivAi, 2.4 veces (P=0.0142); FeivAs, 4.2 veces
(P<0.0001) y FesvAd, 5.6 veces (P=0.0104). (Figura 16)
Figura 16. Expresión relativa de los niveles de Tfrc en bazo. La expresión fue normalizada a Actb (beta actina). Los datos representan la media ± DE (n=7, ANOVA de una vía). *Diferencias significativas
(P<0.05) en comparación con el grupo control. Las barras de error representan un IC del 95%. UA: Unidades Arbitrarias
3.2. DISCUSIÓN
Esta parte del estudio se enfocó en la expresión de los genes que codifican algunos de los principales
biomarcadores del estado nutricional del hierro y su relación con carencias marginales o totales de
vitamina A en ratas Wistar macho jóvenes.
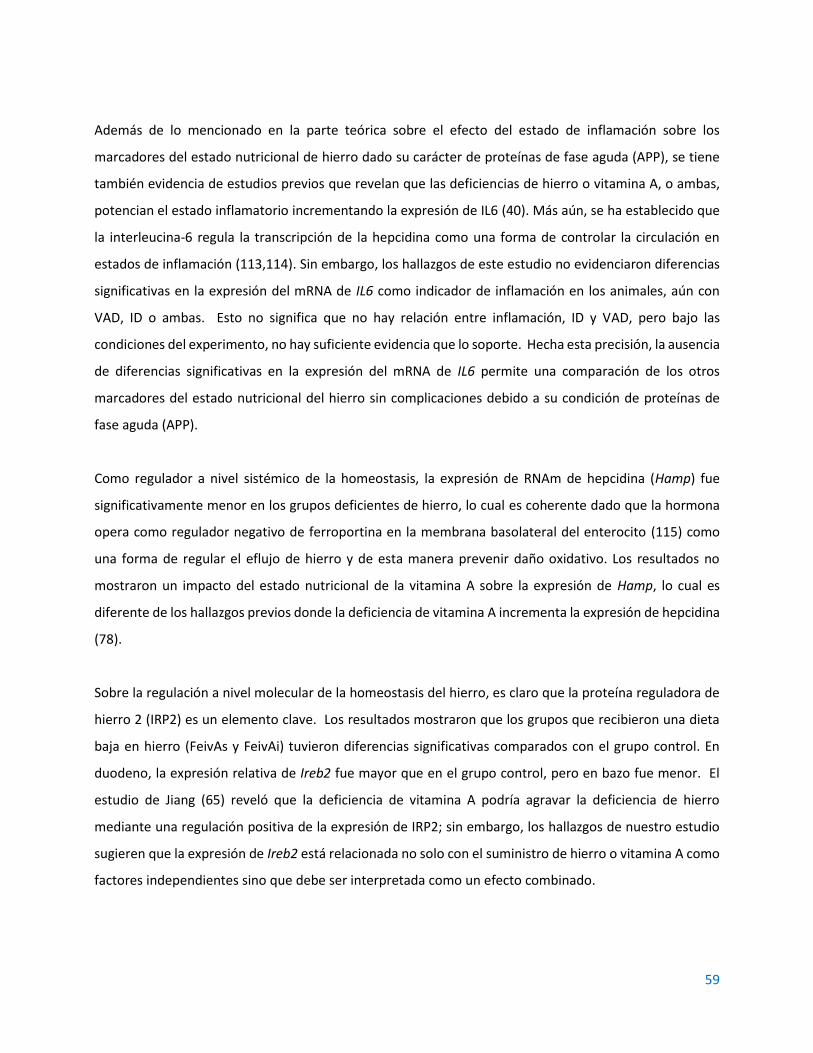
59
Además de lo mencionado en la parte teórica sobre el efecto del estado de inflamación sobre los
marcadores del estado nutricional de hierro dado su carácter de proteínas de fase aguda (APP), se tiene
también evidencia de estudios previos que revelan que las deficiencias de hierro o vitamina A, o ambas,
potencian el estado inflamatorio incrementando la expresión de IL6 (40). Más aún, se ha establecido que
la interleucina-6 regula la transcripción de la hepcidina como una forma de controlar la circulación en
estados de inflamación (113,114). Sin embargo, los hallazgos de este estudio no evidenciaron diferencias
significativas en la expresión del mRNA de IL6 como indicador de inflamación en los animales, aún con
VAD, ID o ambas. Esto no significa que no hay relación entre inflamación, ID y VAD, pero bajo las
condiciones del experimento, no hay suficiente evidencia que lo soporte. Hecha esta precisión, la ausencia
de diferencias significativas en la expresión del mRNA de IL6 permite una comparación de los otros
marcadores del estado nutricional del hierro sin complicaciones debido a su condición de proteínas de
fase aguda (APP).
Como regulador a nivel sistémico de la homeostasis, la expresión de RNAm de hepcidina (Hamp) fue
significativamente menor en los grupos deficientes de hierro, lo cual es coherente dado que la hormona
opera como regulador negativo de ferroportina en la membrana basolateral del enterocito (115) como
una forma de regular el eflujo de hierro y de esta manera prevenir daño oxidativo. Los resultados no
mostraron un impacto del estado nutricional de la vitamina A sobre la expresión de Hamp, lo cual es
diferente de los hallazgos previos donde la deficiencia de vitamina A incrementa la expresión de hepcidina
(78).
Sobre la regulación a nivel molecular de la homeostasis del hierro, es claro que la proteína reguladora de
hierro 2 (IRP2) es un elemento clave. Los resultados mostraron que los grupos que recibieron una dieta
baja en hierro (FeivAs y FeivAi) tuvieron diferencias significativas comparados con el grupo control. En
duodeno, la expresión relativa de Ireb2 fue mayor que en el grupo control, pero en bazo fue menor. El
estudio de Jiang (65) reveló que la deficiencia de vitamina A podría agravar la deficiencia de hierro
mediante una regulación positiva de la expresión de IRP2; sin embargo, los hallazgos de nuestro estudio
sugieren que la expresión de Ireb2 está relacionada no solo con el suministro de hierro o vitamina A como
factores independientes sino que debe ser interpretada como un efecto combinado.

60
IRP2 también se relaciona con la regulación de la expresión de ferritina y del receptor de transferrina.
Cuando IRP2 es baja, Trfc es reducida y ferritina es potenciada, de esta forma se favorece el
almacenamiento y movilización del hierro en el organismo (44). Los resultados mostraron que la vitamina
A fue el único factor que tuvo algún efecto sobre la expresión de ferritina; en el duodeno solo el grupo con
carencia total de vitamina A fue significativamente mayor en ferritina que los demás mientras que lo
contrario ocurrió en el bazo. Estos resultados indica que la vitamina A es necesaria para estimular la
movilización de hierro desde el enterocito, reduciendo su almacenamiento en la ferritina. Estos hallazgos
son consistentes con estudios previos donde la VAD puede afectar la movilización del hierro llegando a un
estrés oxidativo a nivel duodenal (80). Respecto del bazo la reducción de la expresión de ferritina también
se mostró en el trabajo de Jiang y la relación entre VAD e IRP2.
Sobre la expresión del RNAm del receptor de transferrina (Tfrc) en bazo, los resultados son consistentes
con lo esperado a partir de los resultados de IRP2 (65). Al hacer las comparaciones entre los grupos con
suficiente suministro de hierro dietario, solo el grupo sin vitamina A mostró diferencias significativamente
inferiores, esto indica que, aún con un adecuado suministro de hierro, la vitamina A es necesaria para
potenciar la expresión de Tfrc en el bazo. Cuando los grupos bajos en hierro dietario fueron comparados
con el grupo control, ambos fueron significativamente inferiores, independiente del suministro de
vitamina A. Estos resultados indican un efecto combinado de ambos nutrientes sobre la expresión de Tfrc
en el bazo.
Para presentar una imagen completa de los resultados de la expresión génica, se construyó un mapa de
calor (116), donde el aumento o la disminución de la regulación como efecto combinado de hierro y
vitamina A puede ser visualizado (Figura 17). Y al considerar todos los resultados como un conjunto, los
datos muestran un efecto simple de la vitamina A en la expresión de ferritina en duodeno y bazo, de hierro
en la expresión de hepcidina en hígado y un efecto combinado de ambos nutrientes sobre receptor de
transferrina 1 y proteína reguladora de hierro 2 en bazo y duodeno, lo que nos permite construir el
diagrama que se presenta en la Figura 18.
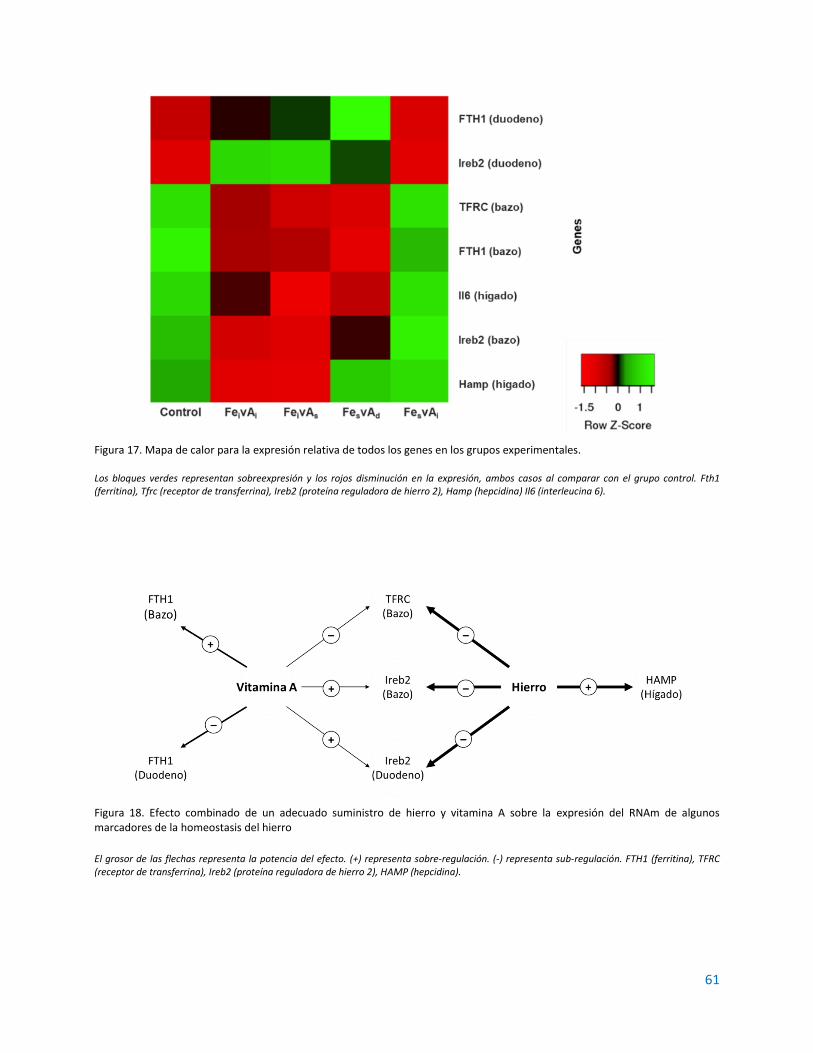
61
Figura 17. Mapa de calor para la expresión relativa de todos los genes en los grupos experimentales. Los bloques verdes representan sobreexpresión y los rojos disminución en la expresión, ambos casos al comparar con el grupo control. Fth1 (ferritina), Tfrc (receptor de transferrina), Ireb2 (proteína reguladora de hierro 2), Hamp (hepcidina) Il6 (interleucina 6).
Figura 18. Efecto combinado de un adecuado suministro de hierro y vitamina A sobre la expresión del RNAm de algunos marcadores de la homeostasis del hierro
El grosor de las flechas representa la potencia del efecto. (+) representa sobre-regulación. (-) representa sub-regulación. FTH1 (ferritina), TFRC (receptor de transferrina), Ireb2 (proteína reguladora de hierro 2), HAMP (hepcidina).

62
3.3. CONCLUSIÓN
Continuando con los hallazgos de la primera parte del estudio, se sigue validando la importancia del
suministro conjunto de hierro con vitamina A como una estrategia para la reducción de la prevalencia de
deficiencia de hierro y anemia por deficiencia de hierro. Si bien, la mayoría de estudios previos se han
enfocado en hepcidina, es interesante encontrar otras posibles rutas que describan el mecanismo
mediante el cual la vitamina A puede tener un efecto regulador indirecto sobre la homeostasis del hierro,
especialmente en lo relacionado con sus depósitos como se evidencia en el efecto sobre la expresión del
gen de ferritina en bazo y duodeno; y sobre los fenómenos de captación y transporte a nivel celular
regulando la expresión del gen de receptor de transferrina en bazo.
Los resultados encontrados en el análisis de expresión del ARNm de TFRC en bazo, regulada por la
deficiencia combinada de ambos nutrientes, permiten establecer una nueva vía de regulación de la
homeostasis del hierro por la vitamina A que podría indicar un efecto deletéreo sobre los mecanismos de
reciclaje de los eritrocitos por los macrófagos del bazo. Además, debe considerarse el efecto adicional de
la VAD sobre la expresión de FTH1 en bazo, independiente del estado de hierro, y esto unido a que en el
bazo se encuentran los mayores depósitos de hierro después del hígado.

63
4. EXPRESIÓN DE FERRITINA Y RECEPTOR DE TRANSFERRINA EN RATAS WISTAR
MACHO JÓVENES BAJO DIFERENTES NIVELES DIETARIOS DE HIERRO Y VITAMINA A4
Una vez analizados los resultados del análisis de expresión del RNAm de algunos marcadores de la
homeostasis del hierro se seleccionaron aquellos asociados con su transporte y almacenamiento,
específicamente ferritina y receptor de transferrina.
4.1. RESULTADOS
Se realizaron ensayos de Western Blot de las muestras obtenidas (proteínas totales) de los hígados de cada
uno de los grupos para determinar la expresión relativa de las siguientes proteínas: ferritina, receptor de
transferrina, e IL-6. Los resultados se muestran en la Figura 19. Al igual que lo encontrado en las pruebas
de PCR, se observa que, bajo las condiciones del estudio, no hay diferencias significativas entre los grupos
experimentales y el grupo control para IL6. Adicionalmente se observa que tampoco hay diferencias
significativas entre los grupos experimentales y el grupo control para TfR, mientras que para Fn se
observan diferencias significativas entre el grupo deficiente de vitamina A y el control (mayor expresión)
y entre los grupos insuficientes en hierro y el grupo insuficiente en vitamina A y suficiente hierro y el
control (menor expresión).
4 Esta sección corresponde al artículo “Vitamin A deficiency influences expression of ferritin in young male Wistar rats” sometido en el Journal of
Nutrition and Metabolism
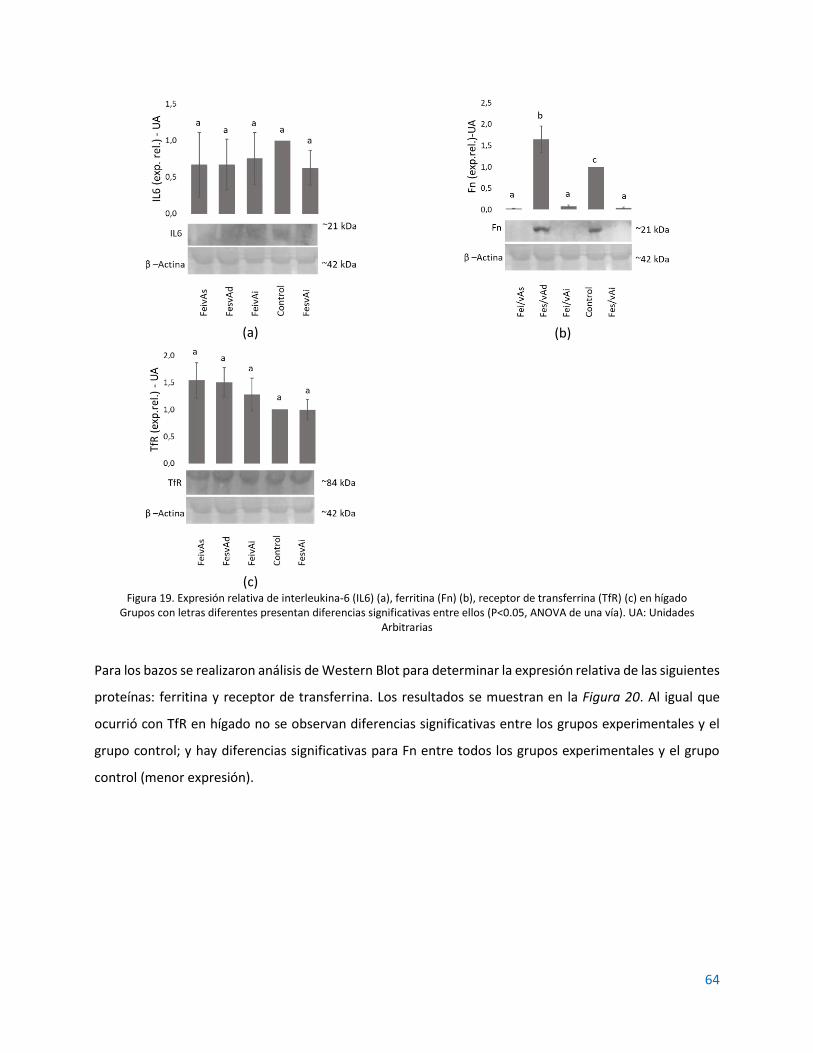
64
(a)
(b)
(c)
Figura 19. Expresión relativa de interleukina-6 (IL6) (a), ferritina (Fn) (b), receptor de transferrina (TfR) (c) en hígado Grupos con letras diferentes presentan diferencias significativas entre ellos (P<0.05, ANOVA de una vía). UA: Unidades
Arbitrarias
Para los bazos se realizaron análisis de Western Blot para determinar la expresión relativa de las siguientes
proteínas: ferritina y receptor de transferrina. Los resultados se muestran en la Figura 20. Al igual que
ocurrió con TfR en hígado no se observan diferencias significativas entre los grupos experimentales y el
grupo control; y hay diferencias significativas para Fn entre todos los grupos experimentales y el grupo
control (menor expresión).

65
(a)
(b)
Figura 20. Expresión relativa de ferritina (Fn) (a) y receptor de transferrina (TfR) (b) en bazo Grupos con letras diferentes presentan diferencias significativas entre ellos (P<0.05, ANOVA de una vía). UA: Unidades
Arbitrarias
Para los duodenos se realizaron Western Blot para determinar la expresión relativa de ferritina. Los
resultados se muestran en la Figura 21. Se observan diferencias significativas entre los grupos insuficientes
en hierro y el grupo suficiente en hierro, pero insuficiente en vitamina A.
Figura 21. Expresión relativa de ferritina (Fn) en duodeno
Grupos con letras diferentes presentan diferencias significativas entre ellos (P<0.05, ANOVA de una vía). UA: Unidades Arbitrarias
4.2. DISCUSIÓN
Al igual que en la PCR se observa que no hay diferencias significativas entre los grupos experimentales
para la proteína IL-6 en hígado (Figura 19a), se concluye de la misma manera que, bajo las condiciones del
experimento, no hay suficiente evidencia para detectar cuadros de inflamación en alguno de los grupos y,
para nuestro análisis, se considera que no hay interferencia de este factor en los marcadores por su
66
condición de proteínas de fase aguda (APP) y la necesidad de realizar algún tipo de ajuste a los resultados
de los mismos (117). Es importante recordar que hay una estrecha relación entre el estado inflamatorio y
la homeostasis del hierro, la mayoría de las proteínas involucradas en el metabolismo de este mineral son
proteínas de fase aguda , tal es el caso de hepcidina, ferritina, ferroportina, hemojuvelina, receptores de
transferrina, y su expresión debe analizarse siempre teniendo en cuenta si hay cuadros de inflamación
para realizar ajustes pertinentes tal como lo indicamos en nuestro artículo de revisión “Classic and
emergent indicators for the assessment of human iron status” (118).
Los resultados de Western Blot para ferritina en hígado (Figura 19b) muestran que todos los grupos
experimentales difieren del grupo control. En el caso del grupo deficiente en vitamina A (FesvAd) hay
sobreexpresión, lo cual indica que la carencia total de vitamina A, aún con un adecuado suministro de
hierro induce algún tipo de daño o efecto a nivel del hepatocito, ocasionando una retención o reabsorción
del hierro en forma de ferritina, impidiendo su movilización hacia otros tejidos de interés (90). Respecto
de los grupos con carencia marginal de hierro (FeivAs y FeivAi) y el grupo con carencia marginal de vitamina
A (FesvAi) se observa una subexpresión de ferritina hepática; para el caso de carencia de hierro es de
esperar, pues se privilegia la circulación de hierro sérico en lugar de retenerlo en el hepatocito, pero la
carencia marginal de vitamina A aún con cantidades adecuadas de hierro parece estar estimulando una
baja expresión de ferritina lo que podría inducir algún tipo de stress oxidativo por sobrecarga de hierro
sérico (65,119).
Los resultados de ferritina en bazo (Figura 20a) mostraron que solo el grupo sin vitamina A (FesvAd) no
tuvo diferencias significativas con respecto del grupo control (P=0.1076); este es un hallazgo interesante
que demuestra una relación entre la ausencia total de vitamina A y algún tipo de cuadro inflamatorio que
puede incrementar la expresión de ferritina como proteína de fase aguda y marcador de inflamación (120),
independiente del estado nutricional del hierro.
Sobre ferritina en duodeno (Figura 21) se encontró que no hay diferencias significativas (P<0.05) entre los
grupos experimentales y el grupo control. Al realizar las comparaciones entre grupos, se encontró que el
grupo suficiente en hierro y con deficiencia marginal de vitamina A (FesvAi) fue significativamente superior
en expresión de ferritina que el grupo FeivAi (P=0.0351) y el grupo FeivAs (P=0.0487) esto sugiere que, a
nivel duodenal, solamente el hierro dietario parece influenciar la expresión de ferritina como un
mecanismo para regular el hierro circulante y prevenir estrés oxidativo, estos resultados son consistentes

67
con los hallazgos de Vanoica et al (121) que demostraron que no solo la hepcidina, también la ferritina
actúan como reguladores del eflujo de hierro hacia el torrente sanguíneo.
Finalmente, sobre el efecto de la VAD en la expresión del receptor de transferrina en el hígado (Figura 19c)
y en bazo (Figura 20b), este estudio no mostró ninguna diferencia entre el grupo control y los grupos
experimentales para ambos tejidos. Estos resultados concuerdan con los hallazgos de Citelli et al
(40,80,95) que indican que la VAD puede afectar el metabolismo del hierro pero no su absorción o
transporte.
4.3. CONCLUSIÓN
Nuevamente, y como respaldo final a los hallazgos de las secciones previas, se sigue resaltando la
importancia del suministro conjunto de vitamina A y hierro como una estrategia para reducir la prevalencia
de anemia por deficiencia de hierro. En esta sección hay hallazgos interesantes respecto del efecto de las
deficiencias combinadas sobre la homeostasis del hierro, especialmente en lo relacionado con su
almacenamiento, situación que se evidencia en las alteraciones encontradas en los depósitos de ferritina
tanto a nivel hepático como en bazo, algo que se había identificado en la sección anterior también para
duodeno.

68
5. DISCUSIÓN GENERAL
El estudio se abordó con dos aproximaciones diferentes, una enfocada en lo sistémico que se centró en el
efecto de las variaciones en el estatus de ambos micronutrientes sobre la ganancia de peso y los
parámetros hematológicos de los animales; la segunda aproximación se enfocó en el efecto de las mismas
variaciones a un nivel post-transcripcional (RNAm) y post-traduccional (proteínas) de algunos de los
principales marcadores de la homeostasis del hierro en los animales de experimentación.
Los hallazgos previos se habían enfocado principalmente en las alteraciones de la hormona hepcidina, en
este estudio se encontraron otras posibles vías de explicación para los casos de anemia por deficiencia de
hierro y su relación con la deficiencia de vitamina A.
Lo más relevante para destacar es la necesidad de una aproximación multifactorial al problema y un
modelo de explicación que no aborde un único efecto o biomarcador para explicar los mecanismos de
regulación del metabolismo del hierro en carencia de vitamina A. Los estudios que se han hecho al
respecto comenzaron su recorrido desde análisis epidemiológicos que, como en el estudio de Hodges en
1978 (67) proponían que al menos un porcentaje de los niveles de hemoglobina podían estar explicados
por los niveles de retinol sérico, hasta estudios más recientes como los de Jiang et al y el efecto sobre la
proteína reguladora de hierro 2 (65), da Cunha et al y la relación de la VAD con la eritropoiesis (40), Citelli
et al y el completo análisis sobre diferentes genes implicados en la biodisponibilidad del hierro (80), Arruda
et al y la relación VAD y hepcidina (78) y finalmente Han et al quienes también abordaron los efectos de
la VAD con hepcidina y ferroportina (122). Puede verse entonces que hay suficiente evidencia, tal vez no
basada en los mismos marcadores, pero si enfocada hacia un mismo efecto final, de la necesidad del
suministro de vitamina A para reducir la prevalencia de anemia por deficiencia de hierro.
69
Los resultados son contundentes respecto del efecto combinado de ambos micronutrientes sobre la
ganancia de peso en ratas Wistar macho jóvenes en cuanto a que son necesarios para garantizar un
adecuado desarrollo de los animales. Este estudio valida entonces la importancia de la vitamina A y el
hierro en un nivel más general, es claro que en un estado nutricional saludable, evidenciado entre otros
por un adecuado crecimiento, es requisito para la disminución de otras prevalencias como la abordada en
este estudio: anemia por deficiencia de hierro (123).
Otros estudios se han realizado al respecto, pero en animales con propósitos productivos como aves de
corral, ganado lechero, cerdos y peces. Es el caso del estudio de Feng et al (124) quienes demostraron que
la deficiencia de vitamina A puede llevar a una reducción de la tasa de crecimiento en patos pekineses,
asociada a baja retención de retinol sérico o hepático como marcadores del estado nutricional de la
vitamina A. En el caso de peces, el grupo de Koch et al (125) encontraron que un suministro de 8.800 UI/kg
de vitamina A era el óptimo para garantizar una adecuada ganancia de peso en dorado (Salminus
brasiliensis), destacando que dosis superiores, si bien no tenían impacto sobre la salud o desempeño de
los animales, no eran recomendadas para evitar algún cuadro de hipervitaminosis.
En cuanto a parámetros hematológicos, definitivamente la deficiencia de vitamina A tiene un efecto
negativo sobre la eritropoiesis independiente del estado nutricional de hierro. Esto refuerza nuestro
planteamiento de que los programas de fortificación de harina de trigo con hierro como estrategia para
disminuir la prevalencia de anemia no son completamente efectivos, cosa que ya había sido discutida por
Hurrel et al (126), aunque sus conclusiones no abordaron interacciones con otros micronutrientes sino
posibles deficiencias de las formas químicas empleadas.
Finalmente, tanto el análisis por PCR como el Western Blot, mostraron que la deficiencia de vitamina A
tiene un efecto de regulación negativa sobre algunos de los principales marcadores de la homeostasis del
hierro, concretamente se observaron alteraciones en aquellos relacionados con el almacenamiento
(ferritina) y transporte (receptores de transferrina). Uno de los aspectos más interesantes del estudio fue
que no se encontraron evidencias significativas que respaldaran los estudios previos sobre el impacto de
la VAD sobre la hormona hepcidina, esto no quiere decir que tal relación no exista, sino que, en las
condiciones en que se realizó nuestro experimento, no hay evidencia suficiente que la respalde.
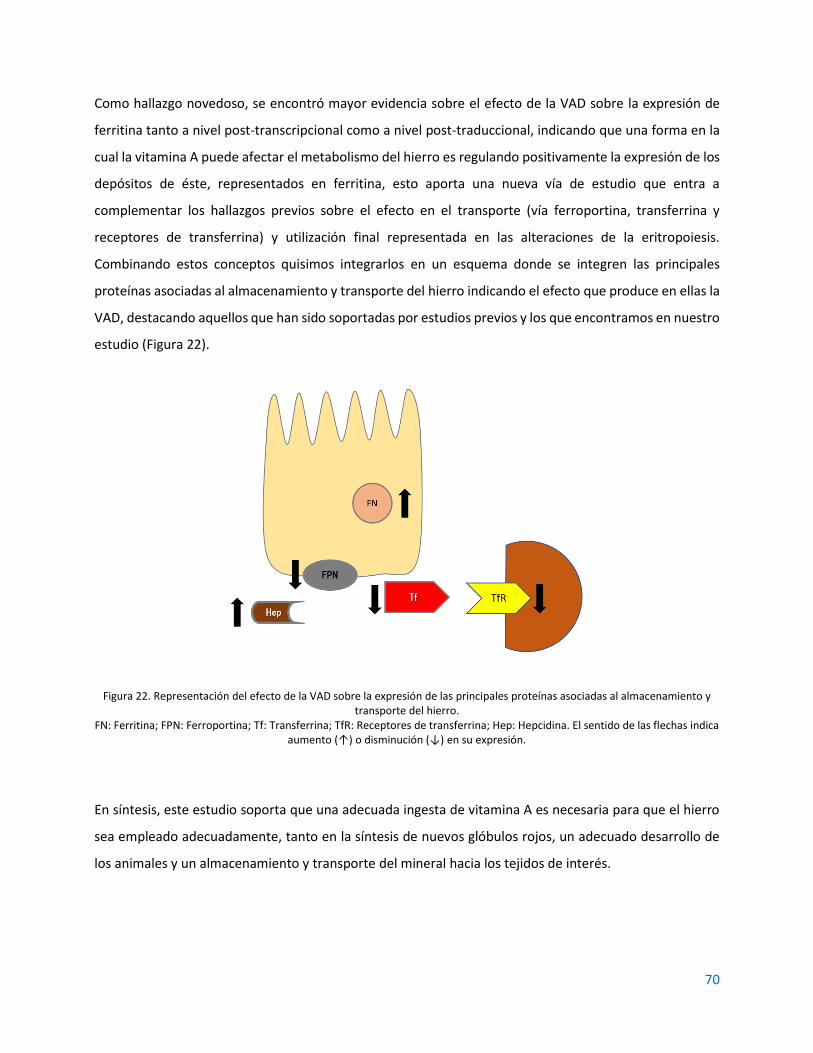
70
Como hallazgo novedoso, se encontró mayor evidencia sobre el efecto de la VAD sobre la expresión de
ferritina tanto a nivel post-transcripcional como a nivel post-traduccional, indicando que una forma en la
cual la vitamina A puede afectar el metabolismo del hierro es regulando positivamente la expresión de los
depósitos de éste, representados en ferritina, esto aporta una nueva vía de estudio que entra a
complementar los hallazgos previos sobre el efecto en el transporte (vía ferroportina, transferrina y
receptores de transferrina) y utilización final representada en las alteraciones de la eritropoiesis.
Combinando estos conceptos quisimos integrarlos en un esquema donde se integren las principales
proteínas asociadas al almacenamiento y transporte del hierro indicando el efecto que produce en ellas la
VAD, destacando aquellos que han sido soportadas por estudios previos y los que encontramos en nuestro
estudio (Figura 22).
Figura 22. Representación del efecto de la VAD sobre la expresión de las principales proteínas asociadas al almacenamiento y transporte del hierro.
FN: Ferritina; FPN: Ferroportina; Tf: Transferrina; TfR: Receptores de transferrina; Hep: Hepcidina. El sentido de las flechas indica aumento (↑) o disminución (↓) en su expresión.
En síntesis, este estudio soporta que una adecuada ingesta de vitamina A es necesaria para que el hierro
sea empleado adecuadamente, tanto en la síntesis de nuevos glóbulos rojos, un adecuado desarrollo de
los animales y un almacenamiento y transporte del mineral hacia los tejidos de interés.
71
5.1. RECOMENDACIONES
Para destacar del estudio su principal fortaleza consistió en la comparación de cinco diferentes relaciones
de hierro y vitamina A y su efecto sobre la homeostasis del hierro. Otra gran fortaleza residió en su diseño
estadístico que permitió obtener resultados de calidad con un número apropiado de animales, estando así
conforme con los principios centrales de la ética del trabajo con animales de laboratorio.
Sin embargo, se reconocen también limitaciones importantes como la falta de análisis de marcadores
adicionales como médula ósea, ferroportina desde la PCR, DMT-1 y marcadores adicionales de inflamación
que podrían haber brindado información adicional para soportar los principales hallazgos. También se
evidenció una limitación de índole metodológico que fue la ausencia de medición de pérdidas de hierro y
retinol que podrían haberse detectado analizando heces fecales y orina.
Finalmente, a modo de recomendaciones para futuros estudios es importante considerar la
implementación de:
• Estudios de localización de proteínas por inmunohistoquímica en los mismos tejidos: hígado, bazo y
duodeno que permitan identificar la efectiva utilización de estas por sus tejidos diana.
• Nuevos enfoques de la anemia por deficiencia de vitamina A que aborden efectos a nivel molecular de
los diferentes marcadores del metabolismo de la vitamina A y su posible interacción con la
homeostasis del hierro.
• Estudios con marcadores e indicadores del estado de hierro adicionales como eritropoyetina, DMT1,
eritroferrona, ferritina sérica, zinc protoporfirina, que aporten elementos adicionales a una mirada de
conjunto del impacto de la VAD sobre la IDA.
• Otros tejidos de interés como médula ósea (por ser considerado el gold standard en el análisis del
estado nutricional del hierro) y riñón (para profundizar en la relación con eritripoyetina).
• Estudios clínicos en población infantil que validen el suministro conjunto de vitamina A y hierro en
recuperación de pacientes con IDA.
• Evaluación de matrices alimentarias fortificadas con ambos micronutrientes (p.e. leche).
72
REFERENCIAS
1. Ganz T. Iron homeostasis: fitting the puzzle pieces together. Cell Metab. 2008;7(4):288–90. 2. Waldvogel-Abramowski S, Waeber G, Gassner C, Buser A, Frey BM, Favrat B, et al. Physiology of
iron metabolism. Transfus Med Hemotherapy. 2014;41(3):213–21. 3. Institute of Medicine. Dietary reference intakes for vitamin A, vitamin K, arsenic, boron,
chromium, copper, iodine, iron, manganese, molybdenum, nickel, silicon, vanadium, and zinc. In: Dietary Reference Intakes for Vitamin A, Vitamin K, Arsenic, Boron, Chromium, Copper, Iodine, Iron, Manganese, Molybdenum, Nickel, Silicon, Vanadium, and Zinc. Washington DC: The National Academies Press; 2001. p. 290–393.
4. Mesías M, Seiquer I, Navarro MP. Iron nutrition in adolescence. Crit Rev Food Sci Nutr. 2013;53(11):1226–37.
5. Ke C, Lan Z, Hua L, Ying Z, Humina X, Jia S, et al. Iron metabolism in infants: Influence of bovine lactoferrin from iron-fortified formula. Nutrition. 2015;31(2):304–9.
6. Ministerio de Salud Pública (Colombia). Recomendaciones de ingesta de energía y nutrientes – RIEN para la población colombiana. Resolución 3803 de 2016. Vol. 2016. 2016.
7. Grotto HZW. Fisiologia e metabolismo do ferro. Rev Bras Hematol Hemoter. 2010;32:08–17. 8. Saito H. Metabolism of iron stores. Nagoya J Med Sci. 2014;76(3–4):235–54. 9. Muñoz M, Villar I, García-Erce JA. An update on iron physiology. World J Gastroenterol.
2009;15(37):4617–26. 10. Gaitán D, Olivares M, Arredondo M, Pizarro F. Biodisponibilidad de hierro en humanos. Rev Chil
Nutr. 2006;33(2). 11. Cediel G, Olivares M, Gaitán D, Flores S, Brito A, Pizarro F. Effect of trypsin and mucin on heme
iron bioavailability in humans. Biol Trace Elem Res. 2012;150(1–3):37–41. 12. Fuqua BK, Vulpe CD, Anderson GJ. Intestinal iron absorption. J Trace Elem Med Biol. 2012;26:115–
9. 13. Brasselagnel C, Karim Z, Letteron P, Bekri S, Bado A, Beaumont C. Intestinal DMT1 cotransporter is
down-regulated by hepcidin via proteasome internalization and degradation. Gastroenterology. 2011;140(4):1261–71.
14. Shayeghi M, Latunde-Dada GO, Oakhill JS, Laftah AH, Takeuchi K, Halliday N, et al. Identification of an intestinal heme transporter. Cell. 2005;122(5):789–801.
15. Leong W-I, Lönnerdal B. Iron nutrition. In: Iron Physiology and Pathophysiology in Humans. New York: Humana Press; 2012. p. 81–99.
16. Silva B, Faustino P. An overview of molecular basis of iron metabolism regulation and the associated pathologies. Biochim Biophys Acta - Mol Basis Dis [Internet]. 2015;1852(7):1347–59. Available from: http://dx.doi.org/10.1016/j.bbadis.2015.03.011
17. Andrews NC. The iron transporter DMT1. Int J Biochem Cell Biol. 1999;31(10):991–4.

73
18. Garrick MD, Dolan KG, Horbinski C, Ghio AJ, Higgins D, Porubcin M, et al. DMT1: A mammalian transporter for multiple metals. BioMetals. 2003;16(1):41–54.
19. Illing AC, Shawki A, Cunningham CL, Mackenzie B. Substrate profile and metal-ion selectivity of human divalent metal-ion transporter-1. J Biol Chem. 2012;287(36):30485–96.
20. Wiedeman A, Olivares G. M, Pizarro A. F, Araya Q. M. Suplementación con cobre entre comidas no tiene efecto sobre la nutrición de hierro en hombres. Rev Chil Nutr. 2009;36(4):1114–9.
21. Ríos-Castillo I, Olivares M, Brito A, de Romaña DL, Pizarro F. One-month of calcium supplementation does not affect iron bioavailability: a randomized controlled trial. Nutrition. 2014;30(1):44–8.
22. Vázquez M, Vélez D, Devesa V, Puig S. Participation of divalent cation transporter DMT1 in the uptake of inorganic mercury. Toxicology. 2015;331:119–24.
23. Latunde-Dada GO, Van der Westhuizen J, Vulpe CD, Anderson GJ, Simpson RJ, McKie AT. Molecular and functional roles of duodenal cytochrome B (Dcytb) in iron metabolism. Blood Cells, Mol Dis. 2002;29(3):356–60.
24. Oakhill JS, Marritt SJ, Gareta EG, Cammack R, McKie AT. Functional characterization of human duodenal cytochrome b (Cybrd1): Redox properties in relation to iron and ascorbate metabolism. Biochim Biophys Acta - Bioenerg. 2008;1777(3):260–8.
25. Luo X, Hill M, Johnson A, Latunde-Dada GO. Modulation of Dcytb (Cybrd 1) expression and function by iron, dehydroascorbate and Hif-2α in cultured cells. Biochim Biophys Acta - Gen Subj. 2014;1840(1):106–12.
26. Lane DJR, Merlot AM, Huang MLH, Bae DH, Jansson PJ, Sahni S, et al. Cellular iron uptake, trafficking and metabolism: Key molecules and mechanisms and their roles in disease. Biochim Biophys Acta - Mol Cell Res [Internet]. 2015;1853(5):1130–44. Available from: http://dx.doi.org/10.1016/j.bbamcr.2015.01.021
27. White KN, Conesa C, Sánchez L, Amini M, Farnaud S, Lorvoralak C, et al. The transfer of iron between ceruloplasmin and transferrins. Biochim Biophys Acta - Gen Subj. 2012;1820(3):411–6.
28. Xu E, Chen M, Zheng J, Maimaitiming Z, Zhong T, Chen H. Deletion of hephaestin and ceruloplasmin induces a serious systemic iron deficiency and disrupts iron homeostasis. Biochem Biophys Res Commun. 2018;503(3):1905–10.
29. Chen M, Zheng J, Liu G, Xu E, Wang J, Fuqua BK, et al. Ceruloplasmin and hephaestin jointly protect the exocrine pancreas against oxidative damage by facilitating iron efflux. Redox Biol. 2018;17(May):432–9.
30. Mendiburo MJ, Le Blanc S, Espinoza A, Pizarro F, Arredondo M. Transepithelial heme-iron transport: Effect of heme oxygenase overexpression. Eur J Nutr. 2011;50(5):363–71.
31. Krishnamurthy P, Xie T, Schuetz JD. The role of transporters in cellular heme and porphyrin homeostasis. Pharmacol Ther. 2007;114(3):345–58.
32. Ge XH, Wang Q, Qian ZM, Zhu L, Du F, Yung WH, et al. The iron regulatory hormone hepcidin reduces ferroportin 1 content and iron release in H9C2 cardiomyocytes. J Nutr Biochem. 2009;20(11):860–5.
33. Viatte L, Vaulont S. Hepcidin, the iron watcher. Biochimie. 2009;91:1223–8. 34. Singh B, Arora S, Agrawal P, Gupta SK. Hepcidin: A novel peptide hormone regulating iron
metabolism. Clin Chim Acta. 2011;412:823–30. 35. Vyoral D. Hepcidin : A direct link between iron metabolism and immunity. 2005;37:1768–73. 36. Kwapisz J, Slomka A, Zekanowska E. Hepcidin and its role in iron homeostasis. J Int Fed Clin Chem
Lab Med. 2009;20(2):124–8. 37. Tussing-Humphreys L, Pustacioglu C, Nemeth E, Braunschweig C. Rethinking iron regulation and
assessment in iron deficiency, anemia of chronic disease, and obesity: introducing hepcidin. J Acad Nutr Diet. 2012;112(3):391–400.

74
38. Przybyszewska J, Żekanowska E. The role of hepcidin, ferroportin, HCP1, and DMT1 protein in iron absorption in the human digestive tract. Gastroenterol Rev. 2014;4(4):208–13.
39. Ganz T, Nemeth E. Iron homeostasis in host defence and inflammation. Nat Rev Immunol. 2015;15(8):500–10.
40. da Cunha MSB, Siqueira EMA, Trindade LA, Arruda SF. Vitamin A deficiency modulates iron metabolism via ineffective erythropoiesis. J Nutr Biochem. 2014;25(10):1035–44.
41. Porto G, Oliveira S, Pinto JP. Hepcidina: a molécula-chave na regulação do metabolismo do ferro. J Port Gastrenterologia. 2012;18:26–32.
42. Raha-Chowdhury R, Raha AA, Forostyak S, Zhao JW, Stott SRW, Bomford A. Expression and cellular localization of hepcidin mRNA and protein in normal rat brain. BMC Neurosci [Internet]. 2015;16(1):1–12. Available from: ???
43. Camaschella C. New insights into iron deficiency and iron deficiency anemia. Blood Rev. 2017;31(4):225–33.
44. Wilkinson N, Pantopoulos K. The IRP/IRE system in vivo: Insights from mouse models. Front Pharmacol. 2014;5 JUL(July):1–15.
45. Bhutta ZA, Salam RA, Das JK. Meeting the challenges of micronutrient malnutrition in the developing world. Br Med Bull. 2013;106(1):7–17.
46. Lynch SR. Interaction of iron with other nutrients. Nutr Rev. 1997;55(4):102–10. 47. Lynch S, Pfeiffer CM, Georgieff MK, Brittenham G, Fairweather-Tait S, Hurrell RF, et al. Biomarkers
of nutrition for development (BOND)-iron review. J Nutr. 2018;148:1001S-1067S. 48. WHO/ FAO. Vitamin and mineral requirements in human nutrition. 2004;139. 49. Ball GFM. Vitamin A: retinoids and the provitamin A carotenoids. In: Vitamins in Food Analysis,
Bioavailability, and Stability. CRC Press - Taylor & Francis; 2006. p. 39–92. 50. Chen W, Chen G. The Roles of Vitamin A in the Regulation of Carbohydrate, Lipid, and Protein
Metabolism. J Clin Med. 2014;3(2):453–79. 51. Reboul E. Absorption of vitamin A and carotenoids by the enterocyte: Focus on transport
proteins. Nutrients. 2013;5(9):3563–81. 52. WHO. The global prevalence of anaemia in 2011. Geneva: World Health Organization; 2015. 53. Lozoff B, Georgieff MK. Iron Deficiency and Brain Development. Semin Pediatr Neurol.
2006;13(3):158–65. 54. Stoltzfus RJ. Iron-deficiency anemia: reexamining the nature and magnitude of the public health
problem. Summary: implications for research and programs. J Nutr. 2001;131(2S-2):697S-700S; discussion 700S-701S.
55. WHO. Iron deficiency anaemia: assessment, prevention, and control. 2001. 56. WHO. Serum ferritin concentrations for the assessment of iron status and iron deficiency in
populations. 2011. 57. WHO. Haemoglobin concentrations for the diagnosis of anaemia and assessment of severity.
Geneva, Switz World Heal Organ. 2011;1–6. 58. Grantham-Mcgregor S, Baker-Henningham H. Iron deficiency in childhood: Causes and
consequences for child development. Ann Nestle. 2010;68(3):105–19. 59. WHO. Worldwide prevalence of anaemia. [Internet]. 2008 [cited 2018 Mar 28]. Available from:
whqlibdoc.who.int/publications/2008/9789241596657_eng.pdf 60. Instituto Colombiano de Bienestar Familiar, Profamilia, Instituto Nacional de Salud, Ministerio de
la Protección Social. Encuesta nacional de la situación nutricional en Colombia 2010. Ensi. Bogotá: ICBF; 2011.
61. Ministerio de Salud, Instituto Nacional de Salud, Instituto Colombiano de Bienestar Familiar. Encuesta nacional de la situación nutricional ENSIN 2015: nota de política. Bogotá D.C.; 2018.
62. Sandström B. Micronutrient interactions: effects on absorption and bioavailability. Br J Nutr.

75
2001;85 Suppl 2:S181–5. 63. Camaschella C. Iron deficiency. Blood. 2019;133(1):30–9. 64. Lopez A, Cacoub P, Macdougall IC, Peyrin-Biroulet L. Iron deficiency anaemia. Lancet.
2016;387:907–16. 65. Jiang S, Wang C, Lan L, Zhao D. Vitamin A deficiency aggravates iron deficiency by upregulating
the expression of iron regulatory protein-2. Nutrition. 2012;28(3):281–7. 66. Koessler KK, Maurer S, Loughlin R. The relation of anemia, primary and secondary, to vitamin A
deficiency. JAMA. 1926;87(7):476–82. 67. Hodges RE, Sauberlich HE, Canham JE, Wallace DL, Rucker RB, Mejia LA, et al. Hematopoietic
studies in Vitamin A deficiency. Am J Clin Nutr. 1978;(May):876–85. 68. Roodenburg AJC, Van Pelt AMM, West CE, Beynen AC. Effect of vitamin A supplementation for 3
days on iron metabolism, liver function indicator enzymes and differential cell counts in bone marrow of rats with severe vitamin A deficiency. Nutr Res. 1996;16(11–12):1933–41.
69. Roodenburg AJC, West CE, Beynen AC. Vitamin A status affects the efficacy of iron repletion in rats with mild iron deficiency. J Nutr Biochem. 1996;7(2):99–105.
70. Roodenburg AJC, West CE, Beguin Y, Van Dijk JE, Van Eijk HG, Marx JJM, et al. Indicators of erythrocyte formation and degradation in rats with either vitamin A or iron deficiency. J Nutr Biochem. 2000;11(4):223–30.
71. Palafox NA, Gamble M V., Dancheck B, Ricks MO, Briand K, Semba RD. Vitamin A deficiency, iron deficiency, and anemia among preschool children in the Republic of the Marshall Islands. Nutrition. 2003;19(5):405–8.
72. Hamdy a M, Abdel Aleem MM, El-Shazly a a. Maternal vitamin A deficiency during pregnancy and its relation with maternal and neonatal hemoglobin concentrations among poor Egyptian families. ISRN Pediatr. 2013;2013:652148.
73. Chen K, Zhang X, Li T yu, Chen L, Wei X ping, Qu P, et al. Effect of vitamin A, vitamin A plus iron and multiple micronutrient-fortified seasoning powder on infectious morbidity of preschool children. Nutrition. 2011;27(4):428–34.
74. Jafari SM, Heidari G, Nabipour I, Amirinejad R, Assadi M, Bargahi A, et al. Serum retinol levels are positively correlated with hemoglobin concentrations, independent of iron homeostasis: A population-based study. Nutr Res. 2013;33(4):279–85.
75. Arguello MA, Schulze KJ, Wu LSF, Dreyfuss ML, Khatry SK, Christian P, et al. Circulating IGF-1 may mediate improvements in haemoglobin associated with vitamin A status during pregnancy in rural Nepalese women. Asia Pac J Clin Nutr. 2015;24(1):128–37.
76. Poveda E, Cuartas A, Guarín S, Forero Y, Villarreal E. Estado de los micronutrientes hierro y vitamina A, factores de riesgo para las deficiencias y valoración antropométrica en niños preescolares del municipio de Funza, Colombia. Biomédica. 2007;27:76–93.
77. Villamor E, Marín C, Mora-Plazas M, Oliveros H. Micronutrient status in middle childhood and age at menarche: Results from the Bogotá School Children Cohort. Br J Nutr. 2017;118(12):1097–105.
78. Arruda SF, Siqueira EM de A, de Valência FF. Vitamin A deficiency increases hepcidin expression and oxidative stress in rat. Nutrition. 2009;25(4):472–8.
79. Rodrigues FL. Deficiência de vitamina A leva ao aumento de transcritos de hepcidina no fígado e acumulo de ferro no baço de ratos machos recém-desmamados. Universidade de Brasília; 2012.
80. Citelli M, Bittencourt LL, Da Silva SV, Pierucci APT, Pedrosa C. Vitamin a modulates the expression of genes involved in iron bioavailability. Biol Trace Elem Res. 2012;149(1):64–70.
81. García Y, Díaz-Castro J. Advantages and disadvantages of the animal models v. in vitro studies in iron metabolism: a review. Animal. 2013;7(10):1651–8.
82. Cao C, Thomas CE, Insogna KL, Brien KOO. Duodenal absorption and tissue utilization of dietary heme and non-heme iron differ in rats. J Nutr. 2014;144(C):1710–7.

76
83. Ministerio de Salud Pública (Colombia). Fortificación de harina de trigo. Decreto 1944 de 1996. 1996.
84. Ministerio de Salud Pública (Colombia). Fortificación de azúcar con vitamina A. Decreto 1324 de 1998. 1998.
85. Ministerio de Salud Pública (Colombia). Derogación de la fortificación de vitamina A con azúcar. Decreto 1615 de 2000. 2018 p. 1–2.
86. Charan J, Kantharia N. How to calculate sample size in animal studies? J Pharmacol Pharmacother. 2013;4(4):303.
87. Mullier F, Lainey E, Fenneteau O, da Costa L, Schillinger F, Bailly N, et al. Additional erythrocytic and reticulocytic parameters helpful for diagnosis of hereditary spherocytosis: Results of a multicentre study. Ann Hematol. 2011;90:759–68.
88. Thermo Scientific. NanoDrop Nucleic Acid Technical Guide. 2010;Revised 11:1–30. Available from: https://tools.thermofisher.com/content/sfs/brochures/Thermo-Scientific-NanoDrop-Products-Nucleic-Acid-Technical-Guide-EN.pdf
89. Kong WN, Niu QM, Ge L, Zhang N, Yan SF, Chen W Bin, et al. Sex differences in iron status and hepcidin expression in rats. Biol Trace Elem Res. 2014;160(2):258–67.
90. Malik IA, Wilting J, Ramadori G, Naz N. Reabsorption of iron into acutely damaged rat liver: A role for ferritins. World J Gastroenterol. 2017;23(41):7347–58.
91. Sheikh N, Batusic DS, Dudas J, Tron K, Neubauer K, Saile B, et al. Hepcidin and hemojuvelin gene expression in rat liver damage: in vivo and in vitro studies. Am J Physiol Liver Physiol. 2006;291(3):G482–90.
92. Arcila-Quinceno VH, Conde-Cotes CA, Nieto-Pico JE, García-Prada FH. Comparación de los valores de referencia hematológicos en ratas wistar / UIS ( Rattus norvergicus ) con parámetros establecidos en laboratorios de altos estándares. Rev Spei Domus. 2009;6(12):45–51.
93. Jacob Filho W, Lima CC, Paunksnis MRR, Silva AA, Perilhão MS, Caldeira M, et al. Reference database of hematological parameters for growing and aging rats. Aging Male. 2018;21(2):145–8.
94. National Research Council. Nutrient requirements of laboratory animals,. Nutrient Requirements of Laboratory Animals,. 2015.
95. Saraiva BC, Soares MC, dos Santos LC, Pereira SCL, Horta PM. Iron deficiency and anemia are associated with low retinol levels in children aged 1 to 5 years. J Pediatr (Rio J). 2014;90(6):593–9.
96. Alfaro-Calvo T, Carvajal-Fernández D. Influencia de la deficiencia de vitamina A sobre la anemia en niños(as) preescolares de Costa Rica. Acta Pediátr Costarric. 2001;15(2):9–12.
97. Sales MC, de Azevedo Paiva A, de Queiroz D, França Costa RA, Lins da Cunha MA, Pedraza DF. Nutritional status of iron in children from 6 to 59 months of age and its relation to vitamin A deficiency. Nutr Hosp. 2013;28(3):734–40.
98. Semba RD, Bloem MW. The anemia of vitamin A deficiency: epidemiology and pathogenesis. Eur J Clin Nutr. 2002;56(4):271–81.
99. Ameny MA, Raila J, Walzel E, Schweigert FJ. Effect of iron and/or vitamin A re-supplementation on vitamin A and iron status of rats after a dietary deficiency of both components. J Trace Elem Med Biol. 2002;16(3):175–8.
100. Buttarello M. Laboratory diagnosis of anemia: are the old and new red cell parameters useful in classification and treatment, how? Int J Lab Hematol. 2016;38(Suppl 1):123–32.
101. Dewamitta SR, Joseph C, Purton LE, Walkley CR. Erythroid-extrinsic regulation of normal erythropoiesis by retinoic acid receptors. Br J Haematol. 2014;164(2):280–5.
102. Honda H, Kobayashi Y, Onuma S, Shibagaki K, Yuza T, Hirao K, et al. Associations among erythroferrone and biomarkers of erythropoiesis and iron metabolism, and treatment with long-term erythropoiesis-stimulating agents in patients on hemodialysis. PLoS One. 2016;11(3):1–10.
103. Hoofnagle AN. Harmonization of blood-based indicators of iron status: making the hard work
77
matter. Am J Clin Nutr. 2017;106(Id):1615S-1619S. 104. Aulakh R, Sohi I, Singh T, Kakkar N. Red cell distribution width (RDW) in the diagnosis of iron
deficiency with microcytic hypochromic anemia. Indian J Pediatr. 2009;76(3):265–8. 105. Amine EK, Corey J, Hegsted DM, Hayes KC. Comparative Hematology during Deficiencies of Iron
and Vitamin A in the Rat. J Nutr. 1970;100(9):1033–40. 106. Okonko DO, Mandal AKJ, Missouris CG, Poole-Wilson PA. Disordered iron homeostasis in chronic
heart failure: Prevalence, predictors, and relation to anemia, exercise capacity, and survival. J Am Coll Cardiol. 2011;58(12):1241–51.
107. Berda-Haddad Y, Faure C, Boubaya M, Arpin M, Cointe S, Frankel D, et al. Increased mean corpuscular haemoglobin concentration: artefact or pathological condition? Int J Lab Hematol. 2017;39(1):32–41.
108. Cossio-Bolaños M, Campos RG, Vitoria RV, Hochmuller Fogaça RT, de Arruda M. Reference curves for assessing the physical growth of male Wistar rats. Nutr Hosp. 2013;28(6):2151–6.
109. Moraal M, Leenaars PPAM, Arnts H, Smeets K, Savenije BS, Curfs JHAJ, et al. The influence of food restriction versus ad libitum feeding of chow and purified diets on variation in body weight, growth and physiology of female wistar rats. Lab Anim. 2012;46(2):101–7.
110. Petranovic D, Batinac T, Petranovic D, Ruzic A, Ruzic T. Iron deficiency anaemia influences cognitive functions. Med Hypotheses. 2008;70(1):70–2.
111. Barber T, Borrás E, Torres L, García C, Cabezuelo F, Lloret A, et al. Vitamin A deficiency causes oxidative damage to liver mitochondria in rats. Free Radic Biol Med. 2000;29(1):1–7.
112. Arreguín A, Ribot J, Mušinović H, von Lintig J, Palou A, Bonet ML. Dietary vitamin A impacts DNA methylation patterns of adipogenesis-related genes in suckling rats. Arch Biochem Biophys. 2018;650:75–84.
113. Lee P, Peng H, Gelbart T, Wang L, Beutler E. Regulation of hepcidin transcription by interleukin-1 and interleukin-6. Proc Natl Acad Sci. 2005;102(6):1906–10.
114. Babitt JL, Lin HY. Molecular Mechanisms of Hepcidin Regulation: Implications for the Anemia of CKD. Am J Kidney Dis. 2010;55(4):726–41.
115. Schmidt PJ, Fleming MD. Modulation of hepcidin as therapy for primary and secondary iron overload disorders: Preclinical models and approaches. Hematol Oncol Clin North Am. 2014;28(2):387–401.
116. Babicki S, Arndt D, Marcu A, Liang Y, Grant JR, Maciejewski A, et al. Heatmapper: web-enabled heat mapping for all. Nucleic Acids Res. 2016;44(W1):W147–53.
117. Namaste SML, Rohner F, Huang J, Bhushan NL, Flores-Ayala R, Kupka R, et al. Adjusting ferritin concentrations for inflammation: Biomarkers Reflecting Inflammation and Nutritional Determinants of Anemia (BRINDA) project. Am J Clin Nutr. 2017;106:359S-71S.
118. Restrepo-Gallego M, Díaz LE, Rondó PHC. Classic and emergent indicators for the assessment of human iron status. Crit Rev Food Sci Nutr [Internet]. 2020;0(0):1–14. Available from: https://doi.org/10.1080/10408398.2020.1787326
119. Chiou YL, Chen YH, Ke T, Ko WS. The effect of increased oxidative stress and ferritin in reducing the effectiveness of therapy in chronic hepatitis C patients. Clin Biochem. 2012;45(16–17):1389–93.
120. Kell DB, Pretorius E. Serum ferritin is an important inflammatory disease marker, as it is mainly a leakage product from damaged cells. Metallomics. 2014;6(4):748–73.
121. Vanoaica L, Darshan D, Richman L, Schümann K, Kühn LC. Intestinal ferritin H is required for an accurate control of iron absorption. Cell Metab. 2010;12(3):273–82.
122. Han L, Liu Y, Lu M, Wang H, Tang F. Retinoic acid modulates iron metabolism imbalance in anemia of inflammation induced by LPS via reversely regulating hepcidin and ferroportin expression. Biochem Biophys Res Commun. 2018;507(1–4):280–5.
78
123. Vuralli D, Tumer L, Hasanoglu A, Biberoglu G, Pasaoglu H. Vitamin A status and factors associated in healthy school-age children. Clin Nutr. 2014;33(3):509–12.
124. Feng YL, Xie M, Tang J, Huang W, Zhang Q, Hou SS. Effects of vitamin A on growth performance and tissue retinol of starter White Pekin ducks. Poult Sci. 2019;98(5):2189–92.
125. Koch JFA, Sabioni RE, Aguilar Aguilar FA, Lorenz EK, Cyrino JEP. Vitamin A requirements of dourado (Salminus brasiliensis): Growth performance and immunological parameters. Aquaculture [Internet]. 2018;491(September 2017):86–93. Available from: https://doi.org/10.1016/j.aquaculture.2018.03.017
126. Hurrell R, Ranum P, De Pee S, Biebinger R, Hulthen L, Johnson Q, et al. Revised recommendations for iron fortification of wheat flour and an evaluation of the expected impact of Current national wheat flour fortification programs. Food Nutr Bull. 2010;31(1 SUPPL.):7–21.
127. Malhotra N, Kang J. SMAD regulatory networks construct a balanced immune system. Immunology. 2013;139(1):1–10.

79

1
Journal of the American Association for Laboratory Animal Science Vol 59, No 1Copyright 2020 January 2020by the American Association for Laboratory Animal Science Pages 1–7
Micronutrient deficiency is a major public health concern in developing countries.9 Vitamin A deficiency (VAD) and iron deficiency (ID) anemia are determinants for the cognitive, physical, and behavioral development of children.40,43 Iron is an essential mineral that belongs to the group of transition met-als; because of its chemical and physical properties, iron plays a major role in the metabolisms of most living beings. Iron is found in numerous proteins, particularly those associated with oxygen transport. Therefore, in practical terms, for many organ-isms, life would not be possible without iron.32
Anemia is a health condition that is linked to an inadequate supply of oxygen to the tissues. In children and young adults, anemia is expressed as reduced cognitive performance,35 inad-equate physical development, and immune system problems;25 therefore, anemia is a high-impact public health matter in developing countries. Approximately 42.6% of preschool-age children are anemic, as are is 38.2% of pregnant women and 29.0% of nonpregnant women. Thus, overall, 496.3 million people are anemic.45
Often anemia is linked only to ID; however, although ID is responsible for 35% of anemia cases, there are other causes—both nutritional and otherwise. The nutritional causes include other micronutrient deficiencies and antinutritional factors, and other common causes are bleeding, infection, and genetic conditions.27 ID anemia occurs when ferritin levels are below 12
µg/L and when Hgb levels are below established cutoff points (11 g/dL for children younger than 5 y and pregnant women; 12 g/dL for children 5 to 12 y old, nonpregnant women, and teenage males; and 13 g/dL for teenage females).17 The main causes of ID anemia are nutritional and antinutritional dietary factors that block the body’s absorption or use of iron.29,39
Sources of dietary iron include meat (which provides heme iron), vegetables, and legumes (both of which provide nonheme iron). The absorption of most dietary iron occurs in the duode-num and proximal jejunum; the exact location depends on the physical state of the iron atom. Heme iron is strongly bound to globular proteins that must be hydrolyzed through gastric pH and both gastric and intestinal proteases. 18
Nonheme iron requires gastric pH to promote its solubiliza-tion and release from natural components.18 Both heme and nonheme iron are absorbed in the duodenum;42, however, the enterocyte’s absorption mechanisms depend on the dietary source. Nonheme iron mainly starts in the ferric form (Fe3+) and must be reduced to the ferrous form (Fe2+). The duodenal cytochrome B mediates this process, and ascorbic acid (vitamin C) enhances it; once reduced, the iron is taken into the entero-cyte through apical-side membrane proteins, divalent metal transporter 1 and heme carrier protein 1, which is specific to that form of iron.10 In addition, heme carrier protein 1 takes in heme iron on the other side. Then, the intact heme iron nucleus is sent to an endosome, where a heme-oxygenase enzyme de-grades it by releasing iron from the protoporphyrin. Finally, in the endosome, an isoform of divalent metal transporter 1 releases the iron into the cytosol.
Influence of Dietary Vitamin A and Iron Deficiency on Hematologic Parameters and Body
Weight of Young Male Wistar Rats
Mauricio Restrepo-Gallego and Luis E Díaz*
Micronutrient deficiency is one of the most prominent public health concerns; in particular, vitamin A and iron are deter-minants of appropriate development, and vitamin A influences iron homeostasis and metabolism. Here we compared the effects of diets that were sufficient and insufficient in vitamin A and iron on the hematologic parameters and body weight of rats. Male Wistar rats were randomly divided into 5 dietary groups (n = 7 per group): adequate in iron and vitamin A (control); adequate in iron but low in vitamin A (FesvAi); adequate in iron but lacking vitamin A (FesvAd); low in iron but adequate in vitamin A (FeivAs); and low in both iron and vitamin A (FeivAi). After 6 wk, rats showed significant differences in serum iron relative to the control diet (control, 256 ± 44 µg/dL; FesvAi, 220± 16 µg/dL; FesvAd, 181 ± 15 µg/dL; FeivAs, 131 ± 44 µg/dL; FeivAi, 75 ± 19 µg/dL). Rats on iron-deficient diets showed reduced Hgb values relative to the control diet (control, 15.9 ± 0.7 g/dL; FeivAs, 13.2 ± 1.6 g/dL; FeivAi, 12.9 ± 1.0 g/dL), MCV (control: 57 ± 10 fL; FeivAs, 48 ± 10 fL; FeivAi, 44 ± 3 fL), and Hct (control, 53% ± 2%; FeivAs, 44% ± 5%; FeivAi, 42% ± 8%). All of the experimental dietary groups showed significant differences in reticulocyte count when compared with the control group (control, 2.7% ± 2.2%; FesvAd, 0.6% ± 0.2%; FesvAi, 0.3% ± 0.1%; FeivAs, 1.2% ± 0.2%; FeivAi, 0.6% ± 0.5%). The mean difference in body weight for the experimental groups, relative to the control group, was 30 ± 10 g. These results suggested that, in young male Wistar rats, both iron and vitamin A are essential to cause increases in body weight and various hematologic parameters.
Abbreviations: ID, iron deficiency; VAD, vitamin A deficiency
DOI: 10.30802/AALAS-JAALAS-19-000020
Received: 07 Feb 2019. Revision requested: 17 Apr 2019. Accepted: 26 Jun 2019.Doctoral Program in Bioscience, La Sabana University, Chía, Cundinamarca, Colombia
*Corresponding author. Email: [email protected]
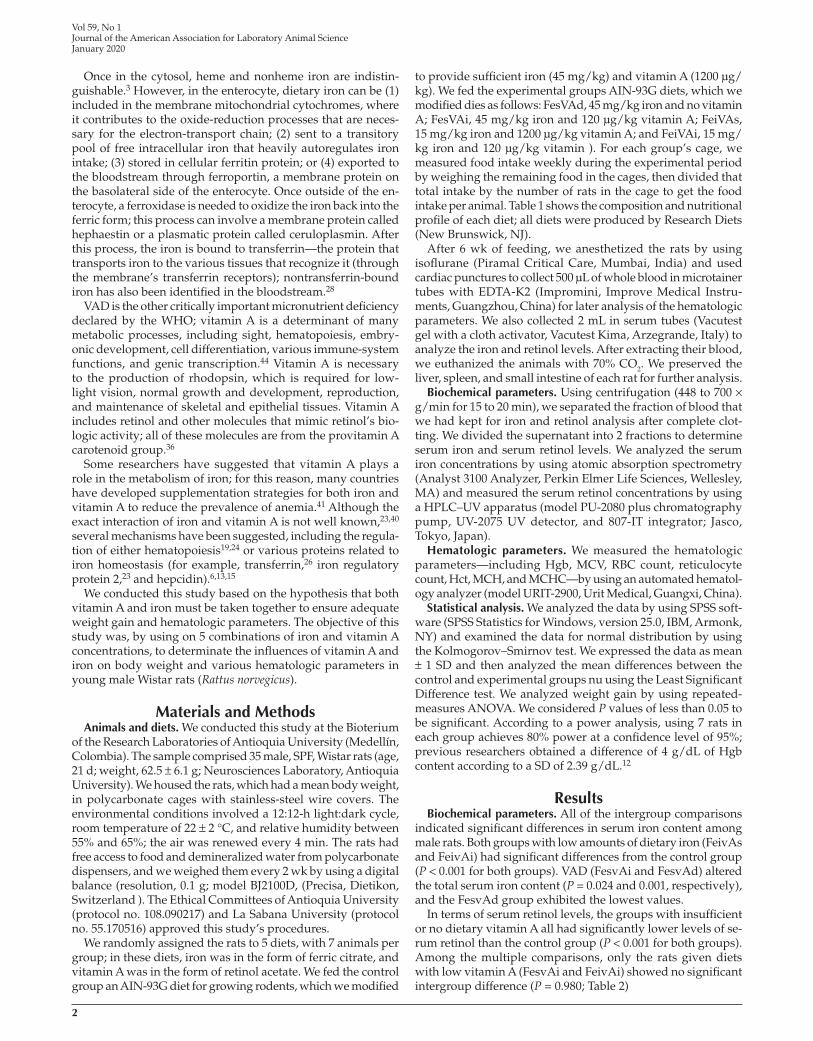
2
Vol 59, No 1Journal of the American Association for Laboratory Animal ScienceJanuary 2020
Once in the cytosol, heme and nonheme iron are indistin-guishable.3 However, in the enterocyte, dietary iron can be (1) included in the membrane mitochondrial cytochromes, where it contributes to the oxide-reduction processes that are neces-sary for the electron-transport chain; (2) sent to a transitory pool of free intracellular iron that heavily autoregulates iron intake; (3) stored in cellular ferritin protein; or (4) exported to the bloodstream through ferroportin, a membrane protein on the basolateral side of the enterocyte. Once outside of the en-terocyte, a ferroxidase is needed to oxidize the iron back into the ferric form; this process can involve a membrane protein called hephaestin or a plasmatic protein called ceruloplasmin. After this process, the iron is bound to transferrin—the protein that transports iron to the various tissues that recognize it (through the membrane’s transferrin receptors); nontransferrin-bound iron has also been identified in the bloodstream.28
VAD is the other critically important micronutrient deficiency declared by the WHO; vitamin A is a determinant of many metabolic processes, including sight, hematopoiesis, embry-onic development, cell differentiation, various immune-system functions, and genic transcription.44 Vitamin A is necessary to the production of rhodopsin, which is required for low-light vision, normal growth and development, reproduction, and maintenance of skeletal and epithelial tissues. Vitamin A includes retinol and other molecules that mimic retinol’s bio-logic activity; all of these molecules are from the provitamin A carotenoid group.36
Some researchers have suggested that vitamin A plays a role in the metabolism of iron; for this reason, many countries have developed supplementation strategies for both iron and vitamin A to reduce the prevalence of anemia.41 Although the exact interaction of iron and vitamin A is not well known,23,40 several mechanisms have been suggested, including the regula-tion of either hematopoiesis19,24 or various proteins related to iron homeostasis (for example, transferrin,26 iron regulatory protein 2,23 and hepcidin).6,13,15
We conducted this study based on the hypothesis that both vitamin A and iron must be taken together to ensure adequate weight gain and hematologic parameters. The objective of this study was, by using on 5 combinations of iron and vitamin A concentrations, to determinate the influences of vitamin A and iron on body weight and various hematologic parameters in young male Wistar rats (Rattus norvegicus).
Materials and MethodsAnimals and diets. We conducted this study at the Bioterium
of the Research Laboratories of Antioquia University (Medellín, Colombia). The sample comprised 35 male, SPF, Wistar rats (age, 21 d; weight, 62.5 ± 6.1 g; Neurosciences Laboratory, Antioquia University). We housed the rats, which had a mean body weight, in polycarbonate cages with stainless-steel wire covers. The environmental conditions involved a 12:12-h light:dark cycle, room temperature of 22 ± 2 °C, and relative humidity between 55% and 65%; the air was renewed every 4 min. The rats had free access to food and demineralized water from polycarbonate dispensers, and we weighed them every 2 wk by using a digital balance (resolution, 0.1 g; model BJ2100D, (Precisa, Dietikon, Switzerland ). The Ethical Committees of Antioquia University (protocol no. 108.090217) and La Sabana University (protocol no. 55.170516) approved this study’s procedures.
We randomly assigned the rats to 5 diets, with 7 animals per group; in these diets, iron was in the form of ferric citrate, and vitamin A was in the form of retinol acetate. We fed the control group an AIN-93G diet for growing rodents, which we modified
to provide sufficient iron (45 mg/kg) and vitamin A (1200 µg/kg). We fed the experimental groups AIN-93G diets, which we modified dies as follows: FesVAd, 45 mg/kg iron and no vitamin A; FesVAi, 45 mg/kg iron and 120 µg/kg vitamin A; FeiVAs, 15 mg/kg iron and 1200 µg/kg vitamin A; and FeiVAi, 15 mg/kg iron and 120 µg/kg vitamin ). For each group’s cage, we measured food intake weekly during the experimental period by weighing the remaining food in the cages, then divided that total intake by the number of rats in the cage to get the food intake per animal. Table 1 shows the composition and nutritional profile of each diet; all diets were produced by Research Diets (New Brunswick, NJ).
After 6 wk of feeding, we anesthetized the rats by using isoflurane (Piramal Critical Care, Mumbai, India) and used cardiac punctures to collect 500 µL of whole blood in microtainer tubes with EDTA-K2 (Impromini, Improve Medical Instru-ments, Guangzhou, China) for later analysis of the hematologic parameters. We also collected 2 mL in serum tubes (Vacutest gel with a cloth activator, Vacutest Kima, Arzegrande, Italy) to analyze the iron and retinol levels. After extracting their blood, we euthanized the animals with 70% CO2. We preserved the liver, spleen, and small intestine of each rat for further analysis.
Biochemical parameters. Using centrifugation (448 to 700 × g/min for 15 to 20 min), we separated the fraction of blood that we had kept for iron and retinol analysis after complete clot-ting. We divided the supernatant into 2 fractions to determine serum iron and serum retinol levels. We analyzed the serum iron concentrations by using atomic absorption spectrometry (Analyst 3100 Analyzer, Perkin Elmer Life Sciences, Wellesley, MA) and measured the serum retinol concentrations by using a HPLC–UV apparatus (model PU-2080 plus chromatography pump, UV-2075 UV detector, and 807-IT integrator; Jasco, Tokyo, Japan).
Hematologic parameters. We measured the hematologic parameters—including Hgb, MCV, RBC count, reticulocyte count, Hct, MCH, and MCHC—by using an automated hematol-ogy analyzer (model URIT-2900, Urit Medical, Guangxi, China).
Statistical analysis. We analyzed the data by using SPSS soft-ware (SPSS Statistics for Windows, version 25.0, IBM, Armonk, NY) and examined the data for normal distribution by using the Kolmogorov–Smirnov test. We expressed the data as mean ± 1 SD and then analyzed the mean differences between the control and experimental groups nu using the Least Significant Difference test. We analyzed weight gain by using repeated-measures ANOVA. We considered P values of less than 0.05 to be significant. According to a power analysis, using 7 rats in each group achieves 80% power at a confidence level of 95%; previous researchers obtained a difference of 4 g/dL of Hgb content according to a SD of 2.39 g/dL.12
ResultsBiochemical parameters. All of the intergroup comparisons
indicated significant differences in serum iron content among male rats. Both groups with low amounts of dietary iron (FeivAs and FeivAi) had significant differences from the control group (P < 0.001 for both groups). VAD (FesvAi and FesvAd) altered the total serum iron content (P = 0.024 and 0.001, respectively), and the FesvAd group exhibited the lowest values.
In terms of serum retinol levels, the groups with insufficient or no dietary vitamin A all had significantly lower levels of se-rum retinol than the control group (P < 0.001 for both groups). Among the multiple comparisons, only the rats given diets with low vitamin A (FesvAi and FeivAi) showed no significant intergroup difference (P = 0.980; Table 2)

3
Vitamin A and iron in young male Wistar rats
Hematologic parameters. Table 3 summarizes the results re-garding hematologic parameters for the 5 groups. The groups with low dietary iron (FeivAs and FeivAi) had decreased levels of Hgb (P < 0.001 for both groups), MCV (P = 0.002 and 0.041 respectively), and Hct (P = 0.007 and 0.002 respectively) than the control group had. All of the experimental groups showed significant differences in reticulocyte count when compared with the control group (FeivAi, P < 0.001; FeivAs, P = 0.010; FesvAi, P = 0.001; FesvAd, P < 0.001). For MCH, only the FeiVai group was significantly (P = 0.006) different from the control group. There were no significant intergroup differences in RBC count or MCHC.
Body weight and food intake. Body weight at baseline was comparable among the 5 groups of rats (Figure 1) By week 5, rats fed the FesVai diet weighed significantly less than the control group (P = 0.005). After week 7, all experimental groups showed significantly less weight gain than the control group (FeivAi, P < 0.001; FeivAs, P = 0.030; FesvAi, P < 0.001; FesvAd, P = 0.006). The comparisons among the experimental groups after week 7 revealed no significant differences between them. At the end of the experiment, the mean difference in body weight for the
experimental groups, relative to the control group, was 29.8 ± 10.0 g. The groups showed no significant differences in food intake (P = 0.126); the average daily food intake per rat was 15.5 g/d, which is consistent with the expected food intake for growing animals of this type.33
DiscussionAmong the groups of rats fed diets containing differing
amounts of iron and vitamin D, all of the intergroup differ-ences in serum iron were significant, running from highest to lowest as: Control > FesvAi > FesvAd > FeivAs > FeivAi. The first 3 groups in this list had sufficient iron, with decreasing vitamin A from the first through the third groups; our finding suggests that, even with an adequate amount of iron in the diet, insufficient vitamin A can cause serum iron levels to decrease proportionally. These results are consistent with previous find-ings40 regarding a positive association between serum retinol deficiency and serum ID in people from Vitoria, Brazil. Other authors have similarly linked VAD with ID across many epi-demiologic studies. For example, the odds anemia in children
Table 1. Ingredient composition and nutritional profile for each diet
Ingredient Control FesvAd FesvAi FeivAs FeivAi
Corn starch 397.5 397.5 397.5 397.5 397.5Casein 200.0 200.0 200.0 200.0 200.0Maltodextrin 10 132.0 132.0 132.0 132.0 132.0Sucrose 100.0 100.0 100.0 100.0 100.0Soybean oil 70.0 0 0 0 0Cotton Seed Oil 0 70.0 70.0 70.0 70.0Cellulose 50.0 50.0 50.0 50.0 50.0Mineral mixa 35.0 35.0 35.0 0 0Mineral mixb 0 0 0 35 35Vitamin mixc 10.0 0 0 10.0 0Vitamin mixd 0 10 10 0 10l-Cysteine 3.0 3.0 3.0 3.0 3.0Choline bitartrate 2.5 2.5 2.5 2.5 2.5Ferric citrate [17.4% Fe] 0.03 0.03 0.03 0.07 0.07t-Butylhydroquinone 0.014 0.014 0.014 0.014 0.014Vitamin A palmitate [500.000 IU/g] 0 0 0.0008 0 0.0008Protein [%] 20 20 20 20 20Fat [%] 7 7 7 7 7Fiber [%] 5 5 5 5 5Carbohydrate [%] 64 64 64 64 64Iron [mg/kg] 45 45 45 15 15Vitamin A [µg/kg] as retinol acetate
1200 0 120 1200 120
d, deficient; i, insufficient; s, sufficient Ingredients are listed as g/kg except when noted.aAIN-93G-MX.bAIN-93G-MX deficient in iron.cAIN-93G-VX.dAIN-93G-VX without vitamin A
Table 2. Biochemical parameters.
Parameter Control FesvAd FesvAi FeivAs FeivAi
Serum iron [µg/dL] 256 ± 44a 181 ± 15b 220 ± 16c 131 ± 44d 75 ± 18eSerum retinol [µmol/L] 1.60 ± 0.16a 0.24 ± 0.04b 0.55 ± 0.10c 1.26 ± 0.12d 0.65 ± 0.08c
n = 7 rats per group; values with different superscripted letters differ significantly (P < 0.05).

4
Vol 59, No 1Journal of the American Association for Laboratory Animal ScienceJanuary 2020
with VAD are 2.5 times higher (odds ratio = 2.5; 95% CI, 0.027 to 0.049; P < 0.001) than those for children with adequate vitamin A levels. Furthermore, VAD is related to low serum iron levels38 but does not lead to changes in serum ferritin levels; that situ-ation is characteristic of VAD anemia.41
In addition, most of the intergroup differences in serum reti-nol were significant; from highest to lowest as follows: control > FeivAs > FesvAi = FeivAi > FesvAd. Dietary vitamin A content decreased in that order regardless of the dietary iron content. Therefore, under the conditions of this experiment, iron content does not influence serum retinol levels.
Previous research on the effect of vitamin A on iron me-tabolism has not produced consistent results with regard to the specific effect that vitamin-A-restricted diets have on Hgb
concentration. In one study,6 VAD increased Hgb concentration, but there was no evidence that this change was because of a lack of hemoconcentration. In contrast, another study2 found mild anemia in both animals and humans when vitamin A was deficient. The current study’s results are more consistent with those of still other authors,23 who found no relationship between vitamin A status and Hgb concentration when iron status is normal. Given these 3 situations, one suggestion is that there is no direct relationship between Hgb concentration and vitamin A unless iron is deficient.
MCV allows for the classification of anemia intro 3 groups based on the morphologic approach: microcytic (below normal), normocytic (within the normal range), and macrocytic (above normal).11 In comparison to the control group, only the groups that were low in dietary iron had significantly different MCV values; multiple comparisons showed that the groups with sufficient dietary iron (FesvAs, FesvAi, and FesvAd) had signifi-cantly higher MCV values than did the groups with ID (FeivAs, FeivAi). In addition, when compared with the reference value of 62.38 ± 1.42 fL, the groups without dietary ID were normocytic, but those with dietary ID were microcytic.31 In addition, the results showed that only ID (not VAD) influences MCV.
All the groups were within or slightly above the normal range for RBC count, which means that the RBC count can be normal, regardless of the Hgb concentration in the blood, even in ID.
Reticulocyte count is an indicator of erythropoiesis. The current study’s results suggested that both iron and vitamin A are necessary for adequate erythropoiesis, as da Cunha and colleagues15 suggested. Researchers recently have found that vitamin A has a negative effect on hepcidin and an indirect negative effect on erythropoiesis.16,20 These results are the op-posite of the findings of other authors,37 who suggested that there was no evidence of a relationship between VAD and ineffective erythropoiesis.
Hct is the percentage of RBC (by volume) in the blood. It is determined by multiplying the RBC count by the MCV. Because the RBC counts were similar for all groups and because only the ID groups showed low MCV values, Hct was low (51.3% ± 1.4%) only for the ID groups, as expected. Low Hct values are an indicator of anemia.21 As with Hgb and MCV, Hct was below the reference range for the iron-deficient groups, again as expected.
MCH is a measure of the average mass of Hgb per RBC, and it is calculated as Hgb × 10 / RBC count.1,11 Our study’s results indicated the presence of hypochromic anemia for the FeivAi group but not for the FeivAs group. Hypochromic anemia oc-curs when individual cells contain less Hgb than they would have under optimal conditions. Therefore, the results for the iron-insufficient groups showed no direct relationship between Hgb and dietary vitamin A; only the group with insufficiencies
Table 3. Hematologic parameters
ParameterReference
value
Group
Control FesvAd FesvAi FeivAs FeivAi
Hgb [g/dL] 15.2 ± 1.3 15.9 ± 0.7a 16.2 ± 2.4a 15.6 ± 0.4a 13.2 ± 1.6b 12.9 ± 1.0b
MCV [fL] 62.4 ± 1.4 56.8 ± 9.9a 59.9 ± 2.3a 58.2 ± 6.9a 48.3 ± 9.6b 43.6 ± 3.3 b
RBC count [×106/µL] 8.2 ± 0.3 9.5 ± 1.3a 8.9 ± 0.9a 9.0 ± 1.6a 8.9 ± 2.0a 10.0 ± 0.9 a
Reticulocyte count [%] 2.0 ± 1.0 2.7 ± 2.2a 0.6 ± 0.2b 0.3 ± 0.1b 1.2 ± 0.2b 0.6 ± 0.5b
Hct [%] 51.3 ± 1.4 52.9 ± 2.1a 52.9 ± 4.3a 51.4 ± 6.3a 43.7 ± 4.7b 42.2 ± 8.1b
MCH [pg] 18.5 ± 1.5 17.2 ± 3.5a 18.3 ± 1.8a 17.9 ± 2.9a 15.2 ± 2.9a 13.0 ± 1.1b
MCHC [g/dL] 29.7 ± 2.2 30.2 ± 1.6a 30.5 ± 2.5a 30.7 ± 3.5a 29.8 ± 2.0a 31.7 ± 3.5a
n = 7 rats per group. Reference values are according to reference 4 except for reticulocyte count, which is according to reference 22. Data are given as mean ± 1 SD; values with different superscripted letters differ significantly (P < 0.05).
Figure 1. Growth curves of the (A) iron-sufficient and (B) iron-insuffi-cient diets, as compared with the control diet. Data are given as means ± 1 SD (error bars).

5
Vitamin A and iron in young male Wistar rats
in both vitamin A and iron was hypochromic. Therefore, the results demonstrated vitamin A’s effect on the Hgb content of individual cells.
MCHC is an indicator of the average concentration of Hgb in a given volume of packed red blood cells, and it is calculated by dividing Hgb content (in g/100 mL) by Hct (as %). As a fraction, MCHC is spuriously decreased or increased when an accurate measurement of Hgb and hematocrit is disturbed, and increased values are always an artifact because RBC cannot contain more Hgb than normal. Truly increased MCHC usually occurs in hereditary spherocytosis, and reduced MCHC is a reliable representative of functional iron deficiency, even in the absence of anemia.8,34
According to our study’s results, neither VAD nor ID influenc-es MCHC, but this conclusion is inconsistent with the results for Hgb and Hct, so it is necessary to consider multiple parameters to ensure an adequate assessment of iron’s nutritional status. One group of researchers32 proposed a complete algorithm for diagnosing and classifying anemia by using varying biochemi-cal and erythrocytic parameters, stating that a combination of indicators is necessary for such an assessment.
To assess body weight, we used previously established ref-erence curves14 that were created to classify the animals into 5 groups according to their nutritional status: malnourished, thin, eutrophic, overweight, and obese (Figure 2) The rats whose diets had any type of nutritional restriction had lower body weights than did those in the control group. At the end of the experi-ment, we classified all the animals in the experimental groups as eutrophic; in the control group, 4 animals were eutrophic, and the remaining 3 animals were overweight.
Weight gain is a complex process that involves the interac-tion of many nutrients and metabolic reactions. This study’s results are consistent with previous findings,15 in support of the hypothesis that both iron and vitamin A are required to ensure adequate growth and weight gain. Regarding the classification of nutritional status, the unrestricted use of feeding caused the potential for weight gain, as expected. As one group of research-ers30 suggested, the amount of feed could be reduced by 25% without affecting the animals’ physiology; this would reduce their morbidity and increase their life span.
Our current study’s results suggested that the lack of either vitamin A or iron can influence animals’ growth, regardless of their status as eutrophic or overweight. Because iron is necessary for adequate metabolism and for acquiring energy from foods,35 it makes sense that iron-insufficient diets reflect inadequate growth. Regarding VAD, researchers have shown that it can affect the function of the mitochondria by causing oxidative damage,7 which causes further effects in terms of fat metabolism and weight gain. One author5 suggested that vitamin A influ-ences the methylation patterns of adipogenesis-related genes, thus also potentially explaining the difference in weight gain between the groups with deficient or insufficient vitamin A (FesVAd, FesVAi, FeiVAi) and those with sufficient vitamin A.
Considering the interaction of vitamin A and iron, our results are consistent with the previous evidence regarding the effect of VAD on iron metabolism. For example, some colleagues23 have suggested that VAD affects the expression of iron regulatory protein 2 and increases ID. In addition, others15 suggested that VAD affects erythropoiesis and iron metabolism; thus, VAD has an indirect effect on weight gain by regulating iron metabolism.
In conclusion, VAD anemia was not characterized as a dis-tinct clinical entity in 2002.41 In the 17 y since then, scholars have provided little explanation regarding the mechanisms by which VAD could be involved in the pathogenesis of this kind
of anemia. The results of our current study indicate that VAD does not influence all hematologic parameters, because both deficiencies seem to affect only reticulocyte count in young male Wistar rats. Therefore, vitamin A must be considered in the assessment of iron-related nutritional status and in the identification of some types of anemia.
Our current results also suggest that, with regard to body weight, both iron and vitamin A are essential to adequate growth and weight gain; therefore these nutrients must be considered together in nutritional recovery programs. We also remark that, under experimental conditions, Wistar male rats with a regu-lar supply of iron and vitamin A can gain body weight under regular conditions with free-choice feeding.
Finally, formulating a more detailed explanation of the patho-genesis of anemia that is linked to deficiencies in nutrients other than iron (specifically, VAD anemia) might be possible by using analytical techniques such as PCR analysis, Western blotting, and immunohistochemistry. Such techniques might be used to provide additional information about the mechanism through which vitamin A regulates iron metabolism, as well as the cause of nonID anemia at the cellular level.
AcknowledgmentsThis work was funded by grants from La Sabana University’s Grant
System and the Colombian Department of Science, Technology, and In-novation (Colciencias) through a National Doctoral Grant (no. 567-2012).
References 1. Alfaro-Calvo T, Carvajal-Fernández D. 2001. Influency of the
deficiency of A vitamin on the anemia in preschool children in Costa Rica. Acta pediatrica costarricense. 15:9–12 [[Influencia de la deficiencia de vitamina A sobre la anemia en niños(as) preescolares de Costa Rica]].
2. Ameny MA, Raila J, Walzel E, Schweigert FJ. 2002. Effect of iron and/or vitamin A re-supplementation on vitamin A and iron status of rats after a dietary deficiency of both components. J Trace Elem Med Biol 16:175–178. https://doi.org/10.1016/S0946-672X(02)80021-9.
3. Anderson GJ, Frazer DM, McKie AT, Vulpe CD, Smith A. 2005. Mechanisms of haem and non-haem iron absorption: lessons from inherited disorders of iron metabolism. Biometals 18:339–348. https://doi.org/10.1007/s10534-005-3708-8.
4. Arcila-Quinceno VH, Conde-Cotes CA, Nieto-Pico JE, García-Prada FH. 2009. Comparison of hematology reference values of strain wistar/UIS (Rattus norvergicus) with parameters established in standards laboratories. Revista Spei Domus 6:45–51 [[Compar-ación de los valores de referencia hematológicos en ratas wistar/UIS (Rattus norvergicus) con parametros establecidos en labora-torios de altos estandares]].
5. Arreguín A, Ribot J, Mušinović H, von Lintig J, Palou A, Bonet ML. 2018. Dietary vitamin A impacts DNA methylation patterns of adipogenesis-related genes in suckling rats. Arch Biochem Biophys 650:75–84. https://doi.org/10.1016/j.abb.2018.05.009.
6. Arruda SF, Siqueira EM, de Valência FF. 2009. Vitamin A deficiency increases hepcidin expression and oxidative stress in rat. Nutrition 25:472–478. https://doi.org/10.1016/j.nut.2008.11.030.
7. Barber T, Borrás E, Torres L, García C, Cabezuelo F, Lloret A, Pallardó FV, Viña JR. 2000. Vitamin A deficiency causes oxidative
Figure 2. Classification of 9-wk-old male Wistar rats by body weight.14
6
Vol 59, No 1Journal of the American Association for Laboratory Animal ScienceJanuary 2020
damage to liver mitochondria in rats. Free Radic Biol Med 29:1–7. https://doi.org/10.1016/S0891-5849(00)00283-5.
8. Berda-Haddad Y, Faure C, Boubaya M, Arpin M, Cointe S, Frankel D, Lacroix R, Dignat-George F. 2017. Increased mean corpuscular haemoglobin concentration: artefact or pathological condition? Int J Lab Hematol 39:32–41. https://doi.org/10.1111/ijlh.12565.
9. Bhutta ZA, Salam RA, Das JK. 2013. Meeting the challenges of micronutrient malnutrition in the developing world. Br Med Bull 106:7–17. https://doi.org/10.1093/bmb/ldt015.
10. Brasse-Lagnel C, Karim Z, Letteron P, Bekri S, Bado A, Beaumont C. 2011. Intestinal DMT1 cotransporter is down-regulated by hepcidin via proteasome internalization and degradation. Gastroenterology 140:1261–1271.e.1. https://doi.org/10.1053/j.gastro.2010.12.037.
11. Buttarello M. 2016. Laboratory diagnosis of anemia: are the old and new red cell parameters useful in classification and treat-ment, how? Int J Lab Hematol 38 Suppl 1:123–132. https://doi.org/10.1111/ijlh.12500.
12. Charan J, Kantharia N. 2013. How to calculate sample size in animal studies? J Pharmacol Pharmacother 4:303–306. https://doi.org/10.4103/0976-500X.119726.
13. Citelli M, Bittencourt LL, Da Silva SV, Pierucci APT, Pedrosa C. 2012. Vitamin a modulates the expression of genes involved in iron bioavailability. Biol Trace Elem Res 149:64–70. https://doi.org/10.1007/s12011-012-9397-6.
14. Cossio-Bolaños M, Campos RG, Vitoria RV, Hochmuller Fogaça RT, de Arruda M. 2013. [Reference curves for assessing the physi-cal growth of male Wistar rats.] Nutr Hosp 28:2151–2156.[Article in Spanish].
15. da Cunha MSB, Siqueira EMA, Trindade LS, Arruda SF. 2014. Vitamin A deficiency modulates iron metabolism via ineffec-tive erythropoiesis. J Nutr Biochem 25:1035–1044. https://doi.org/10.1016/j.jnutbio.2014.05.005.
16. Dewamitta SR, Joseph C, Purton LE, Walkley CR. 2014. Erythroid-extrinsic regulation of normal erythropoiesis by retinoic acid receptors. Br J Haematol 164:280–285. https://doi.org/10.1111/bjh.12578.
17. Fonseca Centeno Z, Heredia Vargas AP, Ocampo Téllez PR. [In-ternet]. 2010. [Encuesta Nacional de Situación Nutricional 2010]. [Cited 13 February 2019]. Available at: https://www.minsalud.gov.co/sites/rid/Lists/BibliotecaDigital/RIDE/VS/ED/GCFI/Base%20de%20datos%20ENSIN%20-%20Protocolo%20Ensin%202010.pdf
18. Fuqua BK, Vulpe CD, Anderson GJ. 2012. Intestinal iron absorp-tion. J Trace Elem Med Biol 26:115–119. https://doi.org/10.1016/j.jtemb.2012.03.015.
19. Garg A, Abrol P, Tewari AD, Sen R, Lal H. 2005. Effect of vitamin A supplementation on hematopoiesis in children with anemia. Indian J Clin Biochem 20:85–86. https://doi.org/10.1007/BF02893048.
20. Honda H, Kobayashi Y, Onuma S, Shibagaki K, Yuza T, Hirao K, Yamamoto T, Tomosugi N, Shibata T. 2016. Associations among erythroferrone and biomarkers of erythropoiesis and iron me-tabolism, and treatment with long-term erythropoiesis-stimulating agents in patients on hemodialysis. PLoS One 11:1–10. https://doi.org/10.1371/journal.pone.0151601.
21. Hoofnagle AN. 2017. Harmonization of blood-based indicators of iron status: making the hard work matter. Am J Clin Nutr 106 Suppl 6:1615S–1619S. https://doi.org/10.3945/ajcn.117. 155895.
22. Jacob Filho W, Lima CC, Paunksnis MRR, Silva AA, Perilhão MS, Caldeira M, Bocalini D, de Souza RR. 2018. Reference da-tabase of hematological parameters for growing and aging rats. Aging Male 21:145–148. https://doi.org/10.1080/13685538.2017.1350156.
23. Jiang S, Wang CX, Lan L, Zhao D. 2012. Vitamin A deficiency aggravates iron deficiency by upregulating the expression of iron regulatory protein-2. Nutrition 28:281–287. https://doi.org/10.1016/j.nut.2011.08.015.
24. Karafin MS, Koch KL, Rankin AB, Nischik D, Rahhal G, Simpson P, Field JJ. 2015. Erythropoietic drive is the strongest
predictor of hepcidin level in adults with sickle cell disease. Blood Cells Mol Dis 55:304–307. https://doi.org/10.1016/j.bcmd.2015.07.010.
25. Kassebaum NJ, GBD 2013 Anemia Collaborators. 2016. The global burden of anemia. Hematol Oncol Clin North Am 30:247–308. https://doi.org/10.1016/j.hoc.2015.11.002.
26. Knutson MD. 2019. Non-transferrin-bound iron transporters. Free Radic Biol Med 133:101–111. https://doi.org/10.1016/j.freeradbi-omed.2018.10.413.
27. Kraemer K, Zimmermann MB. 2007. Nutritional anemia. Basel (Switzerland): Sight and Life press.
28. Leong W-I, Lönnerdal B. 2012. Iron nutrition. p 81–99. In: Anderson GJ, McLarnen GD, editors. Iron physiology and patho-physiology in humans. New York (NY): Humana Press. https://doi.org/10.1007/978-1-60327-485-2_5
29. Lynch SR. 1997. Interaction of iron with other nutrients. Nutr Rev 55:102–110. https://doi.org/10.1111/j.1753-4887.1997.tb06461.x.
30. Moraal M, Leenaars PP, Arnts H, Smeets K, Savenije BS, Curfs JHAJ, Ritskes-Hoitinga M. 2012. The influence of food restriction versus ad libitum feeding of chow and purified diets on variation in body weight, growth and physiology of female wistar rats. Lab Anim 46:101–107. https://doi.org/10.1258/la.2011.011011.
31. Mullier F, Lainey E, Fenneteau O, Da Costa L, Schillinger F, Bailly N, Cornet Y, Chatelain C, Dogne JM, Chatelain B. 2011. Additional erythrocytic and reticulocytic parameters helpful for diagnosis of hereditary spherocytosis: Results of a multicentre study. Ann Hematol 90:759–768. https://doi.org/10.1007/s00277-010-1138-3.
32. Muñoz M, Villar I, García-Erce JA. 2009. An update on iron physiology. World J Gastroenterol 15:4617–4626. https://doi.org/10.3748/wjg.15.4617.
33. National Research Council Subcommittee on Laboratory Animal Nutrition. 1995. Nutrient requirements of laboratory animals. Washington (DC): National Academies Press.
34. Okonko DO, Mandal AKJ, Missouris CG, Poole-Wilson PA. 2011. Disordered iron homeostasis in chronic heart failure: prevalence, predictors, and relation to anemia, exercise capacity, and sur-vival. J Am Coll Cardiol 58:1241–1251. https://doi.org/10.1016/j.jacc.2011.04.040.
35. Petranovic D, Batinac T, Petranovic D, Ruzic A, Ruzic T. 2008. Iron deficiency anaemia influences cognitive functions. Med Hypotheses 70:70–72. https://doi.org/10.1016/j.mehy.2007. 04.029.
36. Reboul E. 2013. Absorption of vitamin A and carotenoids by the enterocyte: focus on transport proteins. Nutrients 5:3563–3581. https://doi.org/10.3390/nu5093563.
37. Roodenburg AJ, West CE, Beguin Y, Van Dijk JE, Van Eijk HG, Marx JJ, Beynen AC. 2000. Indicators of erythrocyte for-mation and degradation in rats with either vitamin A or iron deficiency. J Nutr Biochem 11:223–230. https://doi.org/10.1016/S0955-2863(00)00070-X.
38. Sales MC, Paiva Ade A, de Queiroz D, Araújo França Costa R, Lins da Cunha MA, Figueroa Pedraza D. 2013. Nutritional status of iron in children from 6 to 59 months of age and its relation to vitamin A deficiency. Nutr Hosp 28:734–740.
39. Sandström B. 2001. Micronutrient interactions: effects on absorp-tion and bioavailability. Br J Nutr 85 Suppl 2:S181–S185. https://doi.org/10.1079/BJN2000312.
40. Saraiva BC, Soares MC, Santos LC, Pereira SCL, Horta PM. 2014. Iron deficiency and anemia are associated with low retinol levels in children aged 1 to 5 years. J Pediatr (Rio J) 90:593–599. https://doi.org/10.1016/j.jped.2014.03.003.
41. Semba RD, Bloem MW. 2002. The anemia of vitamin A deficiency: epidemiology and pathogenesis. Eur J Clin Nutr 56:271–281. https://doi.org/10.1038/sj.ejcn.1601320.
42. Shayeghi M, Latunde-Dada GO, Oakhill JS, Laftah AH, Takeuchi K, Halliday N, Khan Y, Warley A, McCann FE, Hider RC, Frazer DM, Anderson GJ, Vulpe CD, Simpson RJ, McKie AT. 2005. Identification of an intestinal heme transporter. Cell 122:789–801. https://doi.org/10.1016/j.cell.2005.06.025.

7
Vitamin A and iron in young male Wistar rats
43. Stevens GA, Finucane MM, De-Regil LM, Paciorek CJ, Flaxman SR, Branca F, Peña-Rosas JP, Bhutta ZA, Ezzati M, Nutrition Impact Model Study Group (Anaemia). 2013. Global, regional, and national trends in haemoglobin concentration and preva-lence of total and severe anaemia in children and pregnant and non-pregnant women for 1995-2011: A systematic analysis of population-representative data. Lancet Glob Health 1:e16–e25. https://doi.org/10.1016/S2214-109X(13)70001-9.
44. Tan L, Green MH, Ross AC. 2015. Vitamin A kinetics in neonatal rats vs. adult rats : comparisons from model-based compart-mental analysis. J Nutr 145:403–410. https://doi.org/10.3945/jn.114.204065.
45. World Health Organization. [Internet]. 2015. The global preva-lence of anaemia in 2011. [Cited 8 April 2018]. Available at: http://apps.who.int/iris/bitstream/10665/177094/1/9789241564960_eng.pdf
Original Communication
Vitamin A does not influencemRNA expression of hormonehepcidin but other biomarkers ofiron homeostasis in young maleWistar ratsMauricio Restrepo-Gallego, and Luis E. Díaz
Doctorate Program in Bioscience, La Sabana University, Campus del Puente del Común, Km. 7, Autopista Norte de Bogotá, Chía,
Cundinamarca, Colombia
Abstract: The effects of an adequate supply of vitamin A and iron, in comparison with diets low or absent in vitamin A and low in iron, on themRNA expression of some biomarkers of iron homeostasis as hepcidin (Hamp), transferrin receptor-1 (Tfrc), iron regulatory protein-2 (Ireb2)and ferritin (Fth1) in rats were investigated. 35 male Wistar rats were randomly divided into 5 dietary groups: control, sufficient in iron andinsufficient in vitamin A (FesvAi), sufficient in iron and depleted in vitamin A (FesvAd), insufficient in iron and sufficient in vitamin A (FeivAs) andinsufficient in both iron and vitamin A (FeivAi). After 6 weeks rats showed no significant effects of variations in vitamin A on the expression ofHamp relative to the control group (FesvAi: 1.37-fold; FesvAd: 1.22-fold); however, iron deficiency showed significant reduction on it relative tothe control group (FeivAs: 71.4-fold, P = 0.0004; FeivAi: 16.1-fold, P = 0.0008). Vitamin A deficiency (FesvAd) affects expression of Fth1independent of low dietary iron in spleen (0.29-fold, P = 0.002) and duodenum (5.15-fold, P = 0.02). Variations of dietary iron and vitamin Ashowed significant effects relative to the control group for expression of Tfrc in spleen (FesvAd: 0.18-fold, P = 0.01; FeivAs: 0.24-fold, P <0.0001; FeivAi: 0.42-fold, P = 0.014), Ireb2 in spleen (FeivAs: 3.7-fold, P < 0.0001; FeivAi: 2.9-fold, P < 0.0001) and Ireb2 in duodenum (FeivAs:2.68-fold, P = 0.012; FeivAi: 2.60-fold, P = 0.014). These results show that vitamin A and iron must be supplied together to regulate some of themain biomarkers of iron metabolism as a strategy to reduce prevalence of iron deficiency anemia.
Keywords: retinol, anemia, hepcidin, vitamin A deficiency
Introduction
Micronutrient malnutrition (MNM), or hidden hunger,occurs when the intake of micronutrients and vitamins isbelow theamount required. It is a commonproblemindevel-oping and developed countries, and it entails lack or defi-ciency of iron, vitamin A, iodine, zinc and folate, which areall critical micronutrients related to adequate development[1]. Indeed, MNM is believed to cause a more detrimentalimpact on cognitive and physical development than calorierestriction. Regarding their importance, iron and vitamin Aplay a fundamental role in children’s development, andhealth authorities worldwide remain vigilant for iron defi-ciency anemia (IDA) and vitamin A deficiency (VAD) [2].
According to theWorldHealthOrganization (WHO) in itsreport titled Global Prevalence of Anemia in 2011, the mostrecent official data source, 42.6% of preschool-age childrenare anemic; among pregnant women, the prevalence is
38.2%. The largest single group in terms of affected individ-uals is nonpregnant women; based on this group’s 29.0%rate of anemia, it includes496.3million affected individuals[3]. VAD is the main cause of preventable blindness in chil-dren and increases the risk of disease and death from severeinfections. In pregnant women, VAD causes night blindnessandmay increase the risk ofmaternalmortality [4]. VAD is apublic health problem, and it has a major impact on youngchildren and pregnant women in low-income countries [5].
Physiologically, anemia is a condition characterized bylow levels of hemoglobin in blood. It is also associated witha deficient quality or quantity of red blood cells. There area lot of factors that could influence iron absorption as itsstatus, bioavailability, interactions with other minerals,chemical form, enhancers and inhibitors of absorption[6] as plant-derived phytates and tannins [7] and othermicronutrient deficiencies. Bleeding, infections andgenetic conditions are considered non-nutritional causes
�2020 Hogrefe Int J Vitam Nutr Res (2020), 1–9https://doi.org/10.1024/0300-9831/a000666
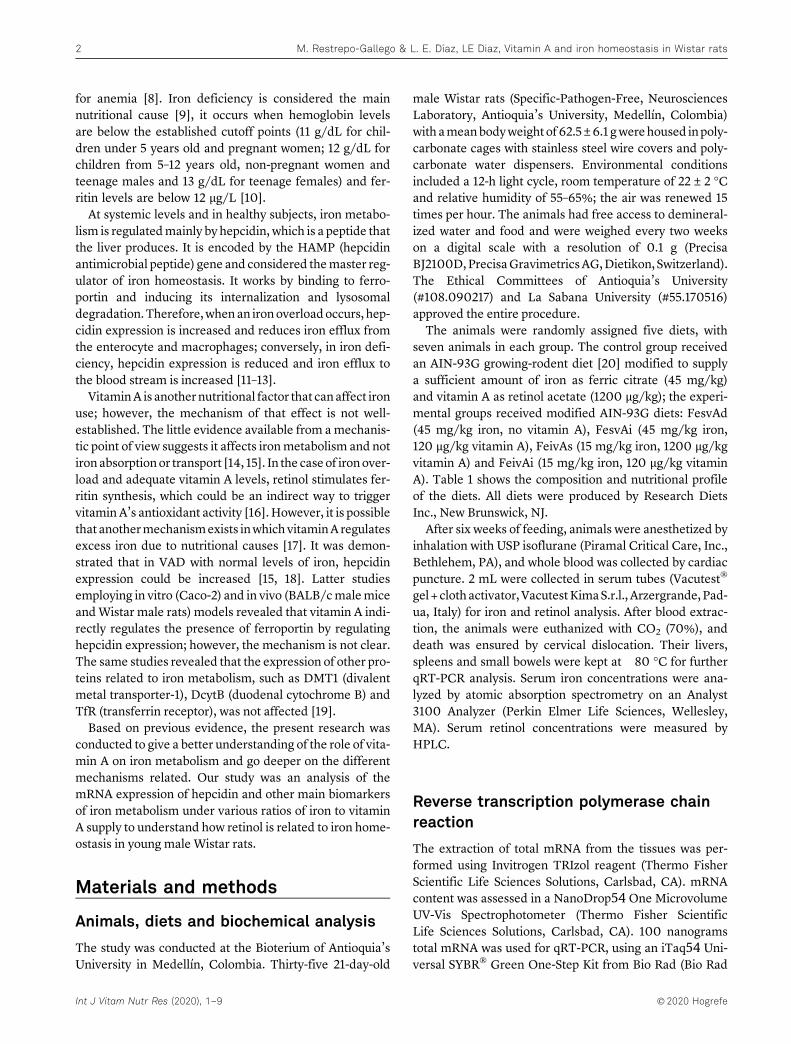
for anemia [8]. Iron deficiency is considered the mainnutritional cause [9], it occurs when hemoglobin levelsare below the established cutoff points (11 g/dL for chil-dren under 5 years old and pregnant women; 12 g/dL forchildren from 5–12 years old, non-pregnant women andteenage males and 13 g/dL for teenage females) and fer-ritin levels are below 12 μg/L [10].
At systemic levels and in healthy subjects, iron metabo-lism is regulatedmainly by hepcidin, which is a peptide thatthe liver produces. It is encoded by the HAMP (hepcidinantimicrobial peptide) gene and considered themaster reg-ulator of iron homeostasis. It works by binding to ferro-portin and inducing its internalization and lysosomaldegradation.Therefore,when an ironoverloadoccurs, hep-cidin expression is increased and reduces iron efflux fromthe enterocyte and macrophages; conversely, in iron defi-ciency, hepcidin expression is reduced and iron efflux tothe blood stream is increased [11–13].
VitaminA is another nutritional factor that canaffect ironuse; however, the mechanism of that effect is not well-established. The little evidence available from amechanis-tic point of view suggests it affects ironmetabolism and notiron absorptionor transport [14, 15]. In the case of ironover-load and adequate vitamin A levels, retinol stimulates fer-ritin synthesis, which could be an indirect way to triggervitaminA’s antioxidant activity [16]. However, it is possiblethat anothermechanismexists inwhich vitaminA regulatesexcess iron due to nutritional causes [17]. It was demon-strated that in VAD with normal levels of iron, hepcidinexpression could be increased [15, 18]. Latter studiesemploying in vitro (Caco-2) and in vivo (BALB/cmalemiceandWistar male rats) models revealed that vitamin A indi-rectly regulates the presence of ferroportin by regulatinghepcidin expression; however, the mechanism is not clear.The same studies revealed that the expression of other pro-teins related to iron metabolism, such as DMT1 (divalentmetal transporter-1), DcytB (duodenal cytochrome B) andTfR (transferrin receptor), was not affected [19].
Based on previous evidence, the present research wasconducted to give a better understanding of the role of vita-min A on iron metabolism and go deeper on the differentmechanisms related. Our study was an analysis of themRNA expression of hepcidin and other main biomarkersof iron metabolism under various ratios of iron to vitaminA supply to understand how retinol is related to iron home-ostasis in young male Wistar rats.
Materials and methods
Animals, diets and biochemical analysis
The study was conducted at the Bioterium of Antioquia’sUniversity in Medellín, Colombia. Thirty-five 21-day-old
male Wistar rats (Specific-Pathogen-Free, NeurosciencesLaboratory, Antioquia’s University, Medellín, Colombia)with ameanbodyweight of62.5±6.1gwerehoused inpoly-carbonate cages with stainless steel wire covers and poly-carbonate water dispensers. Environmental conditionsincluded a 12-h light cycle, room temperature of 22 ± 2 �Cand relative humidity of 55–65%; the air was renewed 15times per hour. The animals had free access to demineral-ized water and food and were weighed every two weekson a digital scale with a resolution of 0.1 g (PrecisaBJ2100D,PrecisaGravimetricsAG,Dietikon, Switzerland).The Ethical Committees of Antioquia’s University(#108.090217) and La Sabana University (#55.170516)approved the entire procedure.
The animals were randomly assigned five diets, withseven animals in each group. The control group receivedan AIN-93G growing-rodent diet [20] modified to supplya sufficient amount of iron as ferric citrate (45 mg/kg)and vitamin A as retinol acetate (1200 μg/kg); the experi-mental groups received modified AIN-93G diets: FesvAd(45 mg/kg iron, no vitamin A), FesvAi (45 mg/kg iron,120 μg/kg vitamin A), FeivAs (15 mg/kg iron, 1200 μg/kgvitamin A) and FeivAi (15 mg/kg iron, 120 μg/kg vitaminA). Table 1 shows the composition and nutritional profileof the diets. All diets were produced by Research DietsInc., New Brunswick, NJ.
After six weeks of feeding, animals were anesthetized byinhalation with USP isoflurane (Piramal Critical Care, Inc.,Bethlehem, PA), and whole blood was collected by cardiacpuncture. 2 mL were collected in serum tubes (Vacutest�
gel + clothactivator,VacutestKimaS.r.l., Arzergrande,Pad-ua, Italy) for iron and retinol analysis. After blood extrac-tion, the animals were euthanized with CO2 (70%), anddeath was ensured by cervical dislocation. Their livers,spleens and small bowels were kept at �80 �C for furtherqRT-PCR analysis. Serum iron concentrations were ana-lyzed by atomic absorption spectrometry on an Analyst3100 Analyzer (Perkin Elmer Life Sciences, Wellesley,MA). Serum retinol concentrations were measured byHPLC.
Reverse transcription polymerase chainreaction
The extraction of total mRNA from the tissues was per-formed using Invitrogen TRIzol reagent (Thermo FisherScientific Life Sciences Solutions, Carlsbad, CA). mRNAcontent was assessed in a NanoDrop54 One MicrovolumeUV-Vis Spectrophotometer (Thermo Fisher ScientificLife Sciences Solutions, Carlsbad, CA). 100 nanogramstotal mRNA was used for qRT-PCR, using an iTaq54 Uni-versal SYBR� Green One-Step Kit from Bio Rad (Bio Rad
Int J Vitam Nutr Res (2020), 1–9 �2020 Hogrefe
2 M. Restrepo-Gallego & L. E. Díaz, LE Diaz, Vitamin A and iron homeostasis in Wistar rats
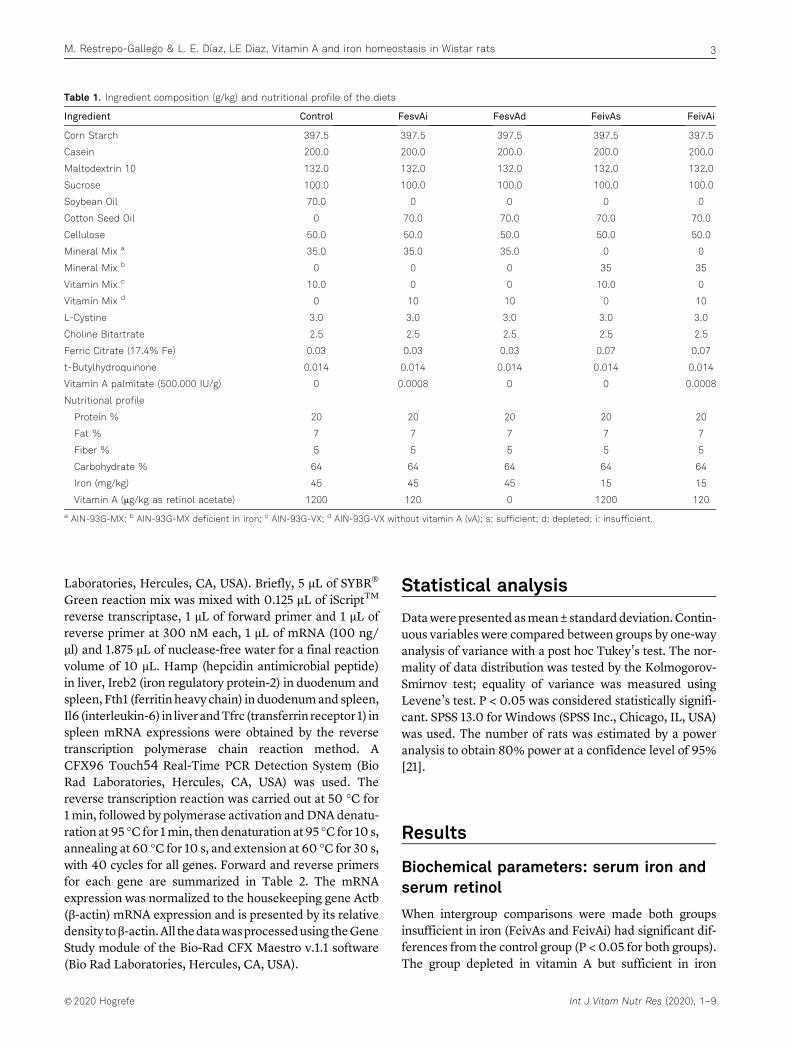
Laboratories, Hercules, CA, USA). Briefly, 5 μL of SYBR�
Green reaction mix was mixed with 0.125 μL of iScriptTM
reverse transcriptase, 1 μL of forward primer and 1 μL ofreverse primer at 300 nM each, 1 μL of mRNA (100 ng/μl) and 1.875 μL of nuclease-free water for a final reactionvolume of 10 μL. Hamp (hepcidin antimicrobial peptide)in liver, Ireb2 (iron regulatory protein-2) in duodenum andspleen, Fth1 (ferritin heavy chain) in duodenumand spleen,Il6 (interleukin-6) in liverandTfrc (transferrin receptor 1) inspleen mRNA expressions were obtained by the reversetranscription polymerase chain reaction method. ACFX96 Touch54 Real-Time PCR Detection System (BioRad Laboratories, Hercules, CA, USA) was used. Thereverse transcription reaction was carried out at 50 �C for1min, followed by polymerase activation andDNA denatu-ration at95 �C for 1min, thendenaturation at95 �C for 10 s,annealing at 60 �C for 10 s, and extension at 60 �C for 30 s,with 40 cycles for all genes. Forward and reverse primersfor each gene are summarized in Table 2. The mRNAexpression was normalized to the housekeeping gene Actb(β-actin) mRNA expression and is presented by its relativedensity toβ-actin.All thedatawasprocessedusing theGeneStudy module of the Bio-Rad CFX Maestro v.1.1 software(Bio Rad Laboratories, Hercules, CA, USA).
Statistical analysis
Datawere presented asmean± standard deviation. Contin-uous variables were compared between groups by one-wayanalysis of variance with a post hoc Tukey’s test. The nor-mality of data distribution was tested by the Kolmogorov-Smirnov test; equality of variance was measured usingLevene’s test. P < 0.05 was considered statistically signifi-cant. SPSS 13.0 for Windows (SPSS Inc., Chicago, IL, USA)was used. The number of rats was estimated by a poweranalysis to obtain 80% power at a confidence level of 95%[21].
Results
Biochemical parameters: serum iron andserum retinol
When intergroup comparisons were made both groupsinsufficient in iron (FeivAs and FeivAi) had significant dif-ferences from the control group (P < 0.05 for both groups).The group depleted in vitamin A but sufficient in iron
Table 1. Ingredient composition (g/kg) and nutritional profile of the diets
Ingredient Control FesvAi FesvAd FeivAs FeivAi
Corn Starch 397.5 397.5 397.5 397.5 397.5
Casein 200.0 200.0 200.0 200.0 200.0
Maltodextrin 10 132.0 132.0 132.0 132.0 132.0
Sucrose 100.0 100.0 100.0 100.0 100.0
Soybean Oil 70.0 0 0 0 0
Cotton Seed Oil 0 70.0 70.0 70.0 70.0
Cellulose 50.0 50.0 50.0 50.0 50.0
Mineral Mix a 35.0 35.0 35.0 0 0
Mineral Mix b 0 0 0 35 35
Vitamin Mix c 10.0 0 0 10.0 0
Vitamin Mix d 0 10 10 0 10
L-Cystine 3.0 3.0 3.0 3.0 3.0
Choline Bitartrate 2.5 2.5 2.5 2.5 2.5
Ferric Citrate (17.4% Fe) 0.03 0.03 0.03 0.07 0.07
t-Butylhydroquinone 0.014 0.014 0.014 0.014 0.014
Vitamin A palmitate (500.000 IU/g) 0 0.0008 0 0 0.0008
Nutritional profile
Protein % 20 20 20 20 20
Fat % 7 7 7 7 7
Fiber % 5 5 5 5 5
Carbohydrate % 64 64 64 64 64
Iron (mg/kg) 45 45 45 15 15
Vitamin A (μg/kg as retinol acetate) 1200 120 0 1200 120
a AIN-93G-MX; b AIN-93G-MX deficient in iron; c AIN-93G-VX; d AIN-93G-VX without vitamin A (vA); s: sufficient; d: depleted; i: insufficient.
�2020 Hogrefe Int J Vitam Nutr Res (2020), 1–9
M. Restrepo-Gallego & L. E. Díaz, LE Diaz, Vitamin A and iron homeostasis in Wistar rats 3

(FesvAd) showed significant differences when comparedwhen control group (P < 0.05) while the group insufficientin vitamin A but sufficient in iron (FesvAi) showed not sig-nificant differenceswhen comparedwith the control group;however, when both grupos with any deficiency of vitaminA (FesvAi and FesvAd) were compared, showed not signif-icant differences between them in terms of serum iron.
In terms of serum retinol levels all experimental groupswere significant lower than control grup (P < 0.05 for allof them). When both groups sufficient in dietary vitaminAwere compared, that onewithmarginal deficiencyof diet-ary iron (FeivAs) was significant lower than control group.When groups insufficient in dietary vitamin A (FesvAi andFeivAi) were compared, they exhibit the lowest value forserum retinol (0.55 umol.l�1) and no significant differencesbetween them. The results are summarized in Table 3.
Effect of vitamin A status on the mRNAexpression of genes related to ironhomeostasis in the liver, spleen andduodenum
When compared with the control group, mRNA expressionof iron regulatory protein 2 (Ireb2) toActb values in the duo-denum and spleen showed significant but opposite differ-ences (P < 0.05) for groups insufficient in iron regardlessof vitamin A supply (FeivAi and FeivAs). Figure 1C showsthe results in the duodenum, in which values were higherthan those of the control group. The amount of FeivAi was2.6 times the amount in the control group (P = 0.0136),and the amount of FeivAs was 2.7 times the amount in thecontrol group (P = 0.0118). In the spleen, as Figure 1Dshows, values were lower than in the control group. The
amount of FeivAi was 2.9 times the amount in the controlgroup (P <0.0001), and the amount of FeivAswas 3.7 timesthat in the control group (P < 0.0001).
Regarding duodenal ferritin heavy chain 1 (Fth1) mRNArelative expression normalized to Actb in the duodenum(Figure 1E), the group insufficient in iron but sufficient invitamin A (FeivAs) showed significant differences whencompared with the control group, exhibiting higher valuesof Fth1 mRNA relative expression (5.1-fold, P = 0.0017).Fth1mRNA relative expression in the spleen showed signif-icantly lower values (P < 0.05) in comparison with the con-trol group only for the group with sufficient iron anddepleted in vitamin A (FesvAd), (3.5-fold, P = 0.0018)(Figure 1F).
Transferrin receptor 1 (Tfrc) mRNA expression normal-ized to Actb in the spleen showed significant differences(P < 0.05) for groups insufficient in dietary iron and forgroup depleted in vitamin A when compared with the con-trol group (Figure 1G). These groups had lower values thanthe control group and the group with sufficient iron andinsufficient vitaminA: FeivAi,2.4-fold (P=0.0142); FeivAs,4.2-fold (P < 0.0001) and FesvAd, 5.6-fold (P = 0.0104).
Discussion
To explore how vitamin A deficiency alters some of themain biomarkers of iron-homeostasis expression, the pre-sent research was focused on the expression of the genesassociated with them in young male Wistar rats thatreceived diets with various doses of vitamin A and/or iron.Thecontrol groupreceivedsufficientamountsofbothnutri-ents according to the referencediets for laboratory animals,
Table 2. qRT-PCR Primers
Gene Forward primer Reverse primer Reference
Hamp 5’-GAAGGCAAGATGGCACTAAGCA-3’ 5’-TCTCGTCTGTTGCCGGAGATAG-3’ [35]
Fth1 5’-GCCCTGAAGAACTTTGCCAAAT-3’ 5’-TGCAGGAAGATTCGTCCACCT-3’ [36]
Ireb2 5’-CTGCATCCCAGCCTATTGAAAA-3’ 5’-GCACTGCTCCTAGCAATGCTTC-5’ [37]
Il6 5’-GTCAACTCCATCTGCCCTTCAG-3’ 5’-GGCAGTGGCTGTCAACAACAT-3’ [36]
Tfrc 5’-ATACGTTCCCCGTTGTTGAGG-3’ 5’-GGCGGAAACTGAGTATGGTTGA-3’ [37]
Actb 5’-TGTCACCAACTGGGACGATA-3’ 5’-AACACAGCCTGGATGGCTAC-3’ [38]
Hamp, hepcidin antimicrobial peptide; Fth1, ferritin heavy chain 1; Ireb2, iron regulatory protein 2; Tfrc, transferrin receptor 1; Actb, beta actin.
Table 3. Biochemical parameters
Parameter Control FesvAi FesvAd FeivAs FeivAi
Serum iron [μg�dl�1] 255.86 ± 43.83 a 219.81 ± 15.58 ab 181.30 ± 14.53 b 131.01 ± 43.83 c 74.74 ± 18.27 d
Serum retinol [umol�l�1] 1.60 ± 0.16 a 0.55 ± 0.10 b 0.24 ± 0.04 c 1.26 ± 0.12 d 0.55 ± 0.08 b
n = 7; different letters indicate significant differences between groups (P < 0.05). s: sufficient; d: depleted; i: insufficient.
Int J Vitam Nutr Res (2020), 1–9 �2020 Hogrefe
4 M. Restrepo-Gallego & L. E. Díaz, LE Diaz, Vitamin A and iron homeostasis in Wistar rats
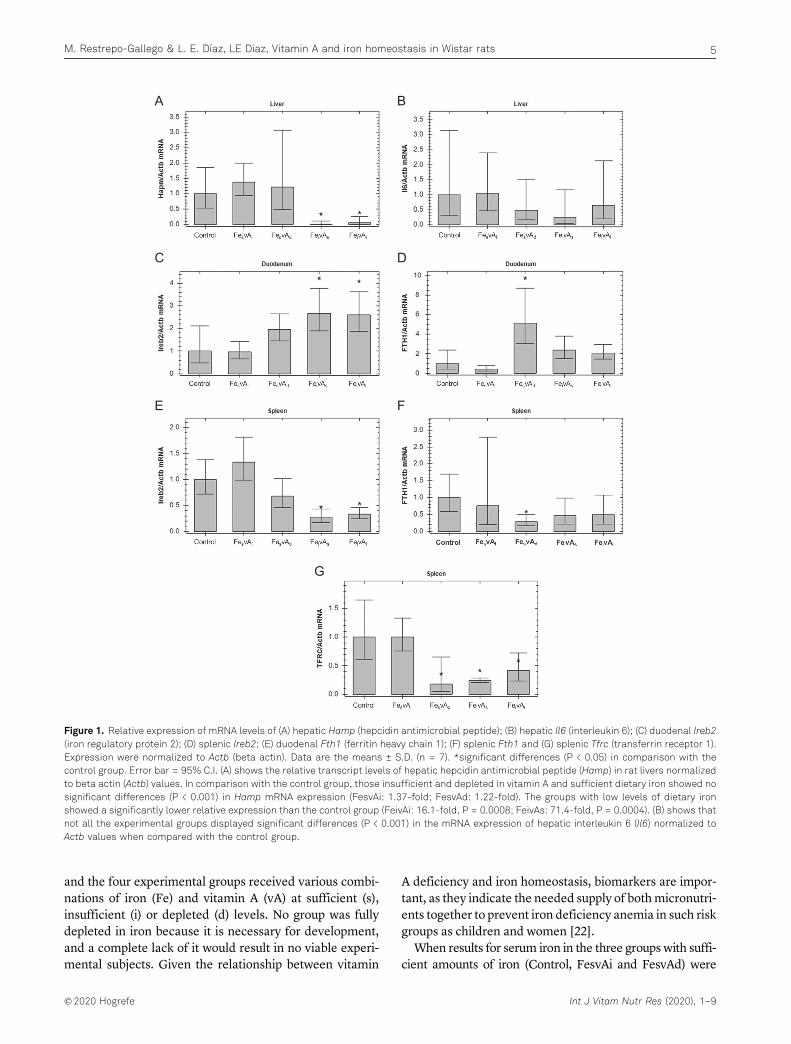
and the four experimental groups received various combi-nations of iron (Fe) and vitamin A (vA) at sufficient (s),insufficient (i) or depleted (d) levels. No group was fullydepleted in iron because it is necessary for development,and a complete lack of it would result in no viable experi-mental subjects. Given the relationship between vitamin
A deficiency and iron homeostasis, biomarkers are impor-tant, as they indicate the needed supply of bothmicronutri-ents together to prevent iron deficiency anemia in such riskgroups as children and women [22].
When results for serum iron in the three groups with suffi-cient amounts of iron (Control, FesvAi and FesvAd) were
A
C
E
B
D
F
G
Figure 1. Relative expression of mRNA levels of (A) hepatic Hamp (hepcidin antimicrobial peptide); (B) hepatic Il6 (interleukin 6); (C) duodenal Ireb2(iron regulatory protein 2); (D) splenic Ireb2; (E) duodenal Fth1 (ferritin heavy chain 1); (F) splenic Fth1 and (G) splenic Tfrc (transferrin receptor 1).Expression were normalized to Actb (beta actin). Data are the means ± S.D. (n = 7). *significant differences (P < 0.05) in comparison with thecontrol group. Error bar = 95% C.I. (A) shows the relative transcript levels of hepatic hepcidin antimicrobial peptide (Hamp) in rat livers normalizedto beta actin (Actb) values. In comparison with the control group, those insufficient and depleted in vitamin A and sufficient dietary iron showed nosignificant differences (P < 0.001) in Hamp mRNA expression (FesvAi: 1.37-fold; FesvAd: 1.22-fold). The groups with low levels of dietary ironshowed a significantly lower relative expression than the control group (FeivAi: 16.1-fold, P = 0.0008; FeivAs: 71.4-fold, P = 0.0004). (B) shows thatnot all the experimental groups displayed significant differences (P < 0.001) in the mRNA expression of hepatic interleukin 6 (Il6) normalized toActb values when compared with the control group.
�2020 Hogrefe Int J Vitam Nutr Res (2020), 1–9
M. Restrepo-Gallego & L. E. Díaz, LE Diaz, Vitamin A and iron homeostasis in Wistar rats 5
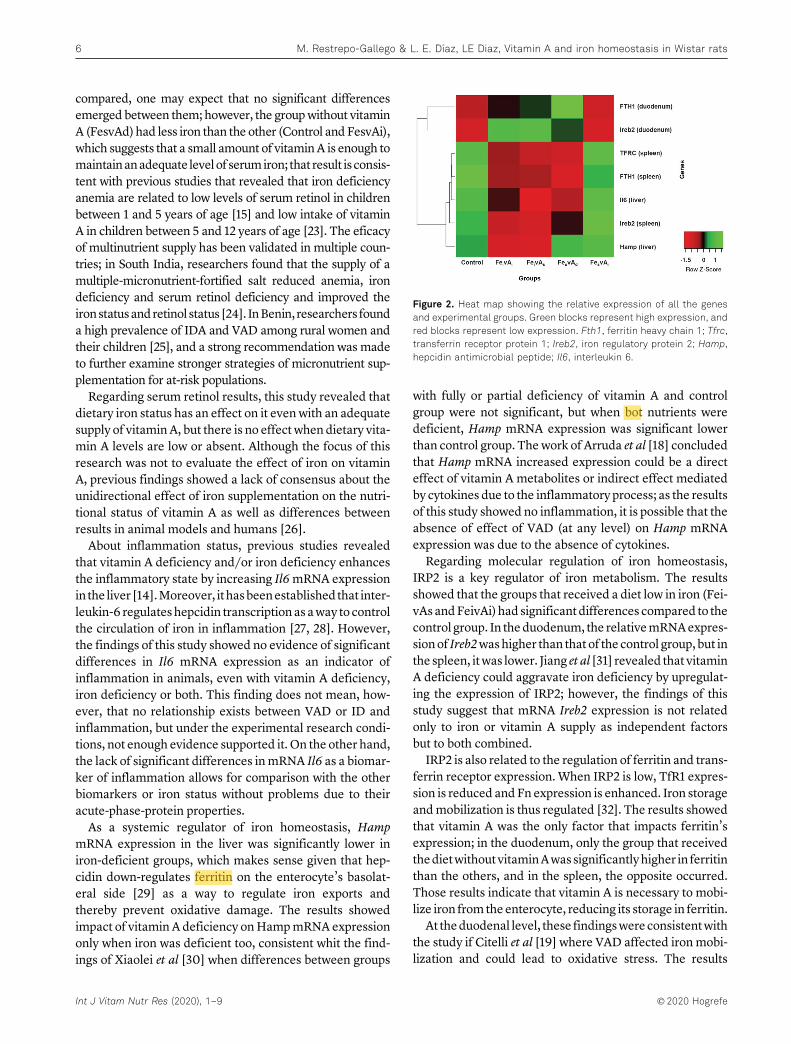
compared, one may expect that no significant differencesemerged between them; however, the groupwithout vitaminA (FesvAd) had less iron than the other (Control and FesvAi),which suggests that a small amount of vitaminA is enough tomaintainanadequate level of serumiron; that result is consis-tent with previous studies that revealed that iron deficiencyanemia are related to low levels of serum retinol in childrenbetween 1 and 5 years of age [15] and low intake of vitaminA in children between 5 and 12 years of age [23]. The eficacyof multinutrient supply has been validated in multiple coun-tries; in South India, researchers found that the supply of amultiple-micronutrient-fortified salt reduced anemia, irondeficiency and serum retinol deficiency and improved theironstatusandretinol status [24]. InBenin, researchers founda high prevalence of IDA and VAD among rural women andtheir children [25], and a strong recommendation was madeto further examine stronger strategies of micronutrient sup-plementation for at-risk populations.
Regarding serum retinol results, this study revealed thatdietary iron status has an effect on it even with an adequatesupply of vitaminA, but there is no effect when dietary vita-min A levels are low or absent. Although the focus of thisresearch was not to evaluate the effect of iron on vitaminA, previous findings showed a lack of consensus about theunidirectional effect of iron supplementation on the nutri-tional status of vitamin A as well as differences betweenresults in animal models and humans [26].
About inflammation status, previous studies revealedthat vitamin A deficiency and/or iron deficiency enhancesthe inflammatory state by increasing Il6mRNA expressionin the liver [14].Moreover, it hasbeenestablished that inter-leukin-6 regulates hepcidin transcription as away to controlthe circulation of iron in inflammation [27, 28]. However,the findings of this study showed no evidence of significantdifferences in Il6 mRNA expression as an indicator ofinflammation in animals, even with vitamin A deficiency,iron deficiency or both. This finding does not mean, how-ever, that no relationship exists between VAD or ID andinflammation, but under the experimental research condi-tions, not enough evidence supported it. On the other hand,the lack of significant differences inmRNA Il6 as a biomar-ker of inflammation allows for comparison with the otherbiomarkers or iron status without problems due to theiracute-phase-protein properties.
As a systemic regulator of iron homeostasis, HampmRNA expression in the liver was significantly lower iniron-deficient groups, which makes sense given that hep-cidin down-regulates ferritin on the enterocyte’s basolat-eral side [29] as a way to regulate iron exports andthereby prevent oxidative damage. The results showedimpact of vitamin A deficiency onHampmRNA expressiononly when iron was deficient too, consistent whit the find-ings of Xiaolei et al [30] when differences between groups
with fully or partial deficiency of vitamin A and controlgroup were not significant, but when bot nutrients weredeficient, Hamp mRNA expression was significant lowerthan control group. Thework of Arruda et al [18] concludedthat Hamp mRNA increased expression could be a directeffect of vitamin A metabolites or indirect effect mediatedby cytokines due to the inflammatory process; as the resultsof this study showed no inflammation, it is possible that theabsence of effect of VAD (at any level) on Hamp mRNAexpression was due to the absence of cytokines.
Regarding molecular regulation of iron homeostasis,IRP2 is a key regulator of iron metabolism. The resultsshowed that the groups that received a diet low in iron (Fei-vAs andFeivAi) had significant differences compared to thecontrol group. In theduodenum, the relativemRNAexpres-sionof Ireb2washigher than that of the control group, but inthe spleen, itwas lower. Jiang et al [31] revealed that vitaminA deficiency could aggravate iron deficiency by upregulat-ing the expression of IRP2; however, the findings of thisstudy suggest that mRNA Ireb2 expression is not relatedonly to iron or vitamin A supply as independent factorsbut to both combined.
IRP2 is also related to the regulation of ferritin and trans-ferrin receptor expression. When IRP2 is low, TfR1 expres-sion is reduced andFn expression is enhanced. Iron storageandmobilization is thus regulated [32]. The results showedthat vitamin A was the only factor that impacts ferritin’sexpression; in the duodenum, only the group that receivedthedietwithoutvitaminAwassignificantlyhigher in ferritinthan the others, and in the spleen, the opposite occurred.Those results indicate that vitamin A is necessary to mobi-lize iron from the enterocyte, reducing its storage in ferritin.
At theduodenal level, these findingswereconsistentwiththe study if Citelli et al [19] where VAD affected iron mobi-lization and could lead to oxidative stress. The results
Figure 2. Heat map showing the relative expression of all the genesand experimental groups. Green blocks represent high expression, andred blocks represent low expression. Fth1, ferritin heavy chain 1; Tfrc,transferrin receptor protein 1; Ireb2, iron regulatory protein 2; Hamp,hepcidin antimicrobial peptide; Il6, interleukin 6.
Int J Vitam Nutr Res (2020), 1–9 �2020 Hogrefe
6 M. Restrepo-Gallego & L. E. Díaz, LE Diaz, Vitamin A and iron homeostasis in Wistar rats

regarding the spleen showed a reduction in iron stores rep-resented by relative mRNA ferritin expression for the vita-min A deficient group. That reduction was alsodemonstrated in findings of Jiang et al [31] of the previouslydiscussed study on IRP2 and VAD.
Regarding Tfrc mRNA expression in the spleen, theresults were consistent with expectations in relation to theresults for IRP2 [31]. When comparisons between the diet-ary-iron sufficient groups were made, only the group with-out dietary vitamin A showed significant smallerdifferences, which indicates that, even with an adequatesupply of iron, vitamin A is necessary to enhance the TfrcmRNA expression in the spleen.When the low dietary-irongroupswere compared to the control group, both iron insuf-ficient groups showed significant smaller differences inde-pendent of the vitamin A supply. Those results indicate acombined effect of iron and vitamin A on the Tfrc mRNAexpression in the spleen.
To give a full picture of the gene expression results, webuilt a heat map (Figure 2) [33], with which the up-regula-tion or down-regulation combined effect of iron and vita-min A could be visualized.
When all the results are considered together, the datashow a single effect of vitamin A on the mRNA expressionof ferritin in theduodenumandspleen,of ironon themRNAexpression of hepcidin in the liver and a combined effect ofboth onmRNAexpression of transferrin receptor 1 and ironregulatory protein 2 in the spleen and duodenum, as seen inFigure 3.
Strengths and limitations
Overall, themain strength of the study is the comparison offive different ratios of iron and vitamin A and the effect ofthem on the iron homeostasis. Additionally, the study hasa strong statistical design adequate to give results of qualitywithout an excessive number of animals according to the
main principles of ethics for research with laboratory ani-mals. However, we recognize that the analysis of additionaltissues asbonemarrowandbiomarkers as ferroportin, diva-lent metal transporter 1 (DMT1) and C-reactive protein(CRP) would give complementary information to supportthe main findings. A direct measurement of IL6 and CRPas inflammation markers using an ELISA kit would bebetter to identify the inflammation status. Another limita-tion, from the methodological approach, was the absenceof information of losses of iron and retinol in feces andurine.
Conclusion
The results of the study reinforce the existent relationbetween vitamin A and iron as demonstrated by differentauthors as Jiang et al [31], da Cunha et al [14], Arruda et al[18], Mendes et al [34] and Xialoei et al [30]. This studydemonstrated that an adequate supply of dietary vitaminA could enhance the status of serum iron and, as conse-quence, helps to reduce the prevalence of iron deficiencyanemia and make the strategies of nutritional interventionmore effective, especially for at-risk populations, such aschildren and women of reproductive age. In addition, fur-ther and deeper research on anemia caused by VAD mustbe conducted to give awider explanation of the phenomenarelated to iron and vitamin A deficiencies.
References
1. Muthayya S, Rah JH, Sugimoto JD, Roos FF, Kraemer K, BlackRE. The global hidden hunger indices and maps: An advocacytool for action. PLoS One. 2013;8(6):1–12.
2. World Health Organization.. Health in 2015: From MDGs,Millennium Development Goals to SDGs, Sustainable Devel-opment Goals. Geneva: WHO; 2015.
3. World Health Organization.. The global prevalence of anaemiain 2011. Geneva: WHO; 2015.
Figure 3. Combined effect of sufficient supply of iron and vitamin A on the mRNA expression of selected biomarkers of iron homeostasis. Thearrows’ thickness represents the strength of the impact. (+) represents up-regulation. (–) represents down-regulation. Fth1, ferritin heavy chain 1;Tfrc, transferrin receptor protein 1; Ireb2, iron regulatory protein 2; Hamp, hepcidin antimicrobial peptide; Il6, interleukin 6.
�2020 Hogrefe Int J Vitam Nutr Res (2020), 1–9
M. Restrepo-Gallego & L. E. Díaz, LE Diaz, Vitamin A and iron homeostasis in Wistar rats 7
4. West KP. Vitamin A deficiency disorders in children andwomen. Food Nutr Bull. 2003;24(Suppl 4):78–90.
5. World Health Organization.. Global prevalence of vitamin Adeficiency in populations at risk 1995–2005: WHO globaldatabase on vitamin A deficiency. Geneva: WHO; 2009.
6. Hunt JR. Dietary and physiological factors that affect theabsorption and bioavailability of iron. Int J Vitam Nutr Res.2005;75(6):375–84.
7. Fuqua BK, Vulpe CD, Anderson GJ. Intestinal iron absorption.J Trace Elem Med Biol. 2012;26:115–9.
8. Vieth JT, Lane DR. Anemia. Hematol Oncol Clin North Am.2017;31(6):1045–60.
9. Wong C. Iron deficiency anaemia. Paediatr Child Health(Oxford). 2017;27(11):527–9.
10. Cascio MJ, DeLoughery TG. Anemia: Evaluation and diagnos-tic tests. Med Clin North Am. 2017;101(2):263–84.
11. Ganz T. Iron homeostasis: Fitting the puzzle pieces together.Cell Metab. 2008;7(4):288–90.
12. Singh B, Arora S, Agrawal P, Gupta SK. Hepcidin: A novelpeptide hormone regulating iron metabolism. Clin Chim Acta.2011;412:823–30.
13. Theurl I, Schroll A, Nairz M, Seifert M, Theurl M, Sonnweber T,et al. Pathways for the regulation of hepcidin expression inanemia of chronic disease and iron deficiency anemia in vivo.Haematologica. 2011;96(12):1761–9.
14. Da Cunha MSB, Siqueira EMA, Trindade LA, Arruda SF.Vitamin A deficiency modulates iron metabolism via ineffec-tive erythropoiesis. J Nutr Biochem. 2014;25(10):1035–44.
15. Saraiva BC, Soares MC, dos Santos LC, Pereira SCL, HortaPM. Iron deficiency and anemia are associated with lowretinol levels in children aged 1 to 5 years. J Pediatr (Rio J).2014;90(6):593–9.
16. Imam MU, Zhang S, Ma J, Wang H, Wang F. Antioxidantsmediate both iron homeostasis and oxidative stress. Nutri-ents. 2017;9(7):1–19.
17. Da Cunha MSB, Aboudib N, Arruda SF. Effect of vitamin Asupplementation on iron status in humans: A systematicreview and meta-analysis. Crit Rev Food Sci Nutr. 2019;59(11):1767–81.
18. Arruda SF, Siqueira EMA, De Valência FF. Vitamin A deficiencyincreases hepcidin expression and oxidative stress in rat.Nutrition. 2009;25(4):472–8.
19. Citelli M, Bittencourt LL, Da Silva SV, Pierucci APT, Pedrosa C.Vitamin a modulates the expression of genes involved in ironbioavailability. Biol Trace Elem Res. 2012;149(1):64–70.
20. Reeves PG. Components of the AIN-93 diets as improvementsin the AIN-76A diet. J Nutr. 1997;127:838S–841S.
21. Charan J, Kantharia N. How to calculate sample size in animalstudies? J Pharmacol Pharmacother 2013;4(4):303.
22. Pereira RC, Caroso Ferreiira LO, Da Silda Diniz A, Batista FilhoM, Natal Figueirôa J. Eficácia da suplementação de ferroassociado ou não à vitamina A no controle da anemia emescolares. Cad Saúde Pública. 2007;23(6):1415–21.
23. Visser M, Van Zyl T, Hanekom SM, Baumgartner J, Van derHoeven M, Taljaard-Krugell C, et al. Nutrient patterns and itsrelation to anaemia and iron status in 5–12-year-old childrenin South Africa. Nutrition. 2019;62:194–200.
24. Kumar MV, Nirmalan PK, Erhardt JG, Rahmathullah L, Rajago-palan S. An efficacy study on alleviating micronutrient deficien-cies through a multiple micronutrient fortified salt in children inSouth India. Asia Pac J Clin Nutr. 2014;23(3):413–22.
25. Alaofè H, Burney J, Naylor R, Taren D. Prevalence of anaemia,deficiencies of iron and vitamin A and their determinants inrural women and young children: A cross-sectional study in
Kalalé district of northern Benin. Public Health Nutr. 2017;20(7):1203–13.
26. Oliveira JM, Michelazzo FB, Stefanello J, Rondó PHC. Influ-ence of iron on vitamin a nutritional status. Nutr Rev. 2008;66(3):141–7.
27. Lee P, Peng H, Gelbart T, Wang L, Beutler E. Regulation ofhepcidin transcription by interleukin-1 and interleukin-6. ProcNatl Acad Sci. 2005;102(6):1906–10.
28. Babitt JL, Lin HY. Molecular mechanisms of hepcidin regu-lation: Implications for the anemia of CKD. Am J Kidney Dis.2010;55(4):726–41.
29. Schmidt PJ, Fleming MD. Modulation of hepcidin as therapyfor primary and secondary iron overload disorders: Preclinicalmodels and approaches. Hematol Oncol Clin North Am.2014;28(2):387–401.
30. Xiaolei X, Zhenting Q. Effect of vitamin A deficiency on ironmetabolism and hepcidin mRNA expression in rat. In Pro-ceedings 2011 International Conference on Human Healthand Biomedical Engineering. 2011;140–2.
31. Jiang S, Wang C, Lan L, Zhao D. Vitamin A deficiencyaggravates iron deficiency by upregulating the expression ofiron regulatory protein-2. Nutrition. 2012;28(3):281–7.
32. Wilkinson N, Pantopoulos K. The IRP/IRE system in vivo:Insights from mouse models. Front Pharmacol. 2014;5:1–15.
33. Babicki S, Arndt D, Marcu A, Liang Y, Grant JR, Maciejewski A,et al. Heatmapper: Web-enabled heat mapping for all. NucleicAcids Res. 2016;44(W1):W147–53.
34. Mendes JFR, De Almeida Siqueira EM, De Brito e Silva JGM,Arruda SF. Vitamin A deficiency modulates iron metabolismindependent of hemojuvelin (Hfe2) and bone morphogeneticprotein 6 (Bmp6) transcript levels. Genes Nutr. 2016;11(1):1–7. https://doi.org/10.1186/s12263-016-0519-4.
35. Kong WN, Niu QM, Ge L, Zhang N, Yan SF, Bin ChenW, et al.Sex differences in iron status and hepcidin expression in rats.Biol Trace Elem Res. 2014;160(2):258–67.
36. Malik IA, Wilting J, Ramadori G, Naz N. Reabsorption of ironinto acutely damaged rat liver: A role for ferritins. World JGastroenterol. 2017;23(41):7347–58.
37. Malik IA, Naz N, Sheikh N, Khan S, Moriconi F, Blaschke M,et al. Comparison of changes in gene expression of transferrinreceptor-1 and other iron-regulatory proteins in rat liver andbrain during acute-phase response. Cell Tissue Res. 2011;344(2):299–312.
38. Sheikh N, Batusic DS, Dudas J, Tron K, Neubauer K, Saile B,et al. Hepcidin and hemojuvelin gene expression in rat liverdamage: In vivo and in vitro studies. Am J Physiol LiverPhysiol. 2006;291(3):G482–90.
HistoryReceived June 28, 2019Accepted May 29, 2020Published online XX, 2020
AcknowledgementM.R.G. collected and analyzed the data and wrote the manuscript.L.D.B. read and made valuable comments about the text. Allauthors read and approved the final manuscript. This work wasfunded by grants from La Sabana University’s Grant System andthe Colombian Department of Science, Technology and Innovation(Colciencias) through a National Doctoral Grant in call 567-2012.
Conflict of interestThe authors declare that no known conflicts of interest areassociated with this publication.
Int J Vitam Nutr Res (2020), 1–9 �2020 Hogrefe
8 M. Restrepo-Gallego & L. E. Díaz, LE Diaz, Vitamin A and iron homeostasis in Wistar rats
Luis E. DíazCampus del Puente del ComúnKm. 7, Autopista Norte de BogotáChía, [email protected]
�2020 Hogrefe Int J Vitam Nutr Res (2020), 1–9
M. Restrepo-Gallego & L. E. Díaz, LE Diaz, Vitamin A and iron homeostasis in Wistar rats 9
Nutrients 2020, 12, x; doi: FOR PEER REVIEW www.mdpi.com/journal/nutrients
Article 1
Vitamin A Deficiency Influences the Expression of 2
Ferritin in Young Male Wistar Rats 3
Mauricio Restrepo-Gallego, MSc1, Luis Eduardo Díaz, PhD 2,*, Juan David Ospina-Villa, PhD3 4 and Danny Chinchilla-Cárdenas, MSc4 5
1 Student at Doctorate Program in Bioscience, La Sabana University, Chía, 140007, Cundinamarca, Colombia. 6 ORCID ID: 0000-0002-8631-3547 7 2 Associate Professor at Doctorate Program in Bioscience, La Sabana University, Chía, 140007, Cundinamarca, 8 Colombia. ORCID ID: 0000-0002-9588-9935 9 3 Independent Researcher, Medellín, 055421, Colombia. ORCID ID: 0000-0003-1679-3036 10 4 Scientific Director, Mascolab SAS, Medellín, 050021, Colombia. ORCID ID: 0000-0002-8439-9244 11 * Correspondence: [email protected] 12
Received: date; Accepted: date; Published: date 13
Abstract: Iron deficiency anemia (IDA) and vitamin A deficiency (VAD) are two of the main 14 micronutrient deficiencies. Both micronutrients are essential for human life and children’s 15 development, so authorities around the world are vigilant about IDA and VAD. IDA and VAD. The 16 aim of this study was to investigate the effect of VAD on the expression of ferritin and transferrin 17 receptor. Five diets with different ratios of vitamin A to iron where given to thirty-five 21-day-old 18 male Wistar rats (seven animals per group). The animals received the diet for six weeks before they 19 were euthanized. Serum iron and retinol levels were measured as biochemical parameters. 20 Duodenum, spleen, and liver were analysed for expression of ferritin and transferrin receptor by 21 Western Blotting. Regarding biochemical parameters, the results show that vitamin A is required to 22 enhance the serum iron content even with a sufficient iron supply. The results also show that VAD 23 does not influence the expression of transferrin receptor but ferritin. In conclusion, the study 24 demonstrates that VAD modifies the expression of ferritin which suggests that vitamin A could be 25 determinant in fortification programs joint with iron to reduce the prevalence of IDA. 26
Keywords: iron deficiency anemia; iron homeostasis; ferritin; transferrin receptor; vitamin A 27 deficiency 28
29
1. Introduction 30
Hidden hunger, also known as micronutrient malnutrition (MNM) occurs then the intake of 31 micronutrients is below the required quantity. MNM is common in developing and developed 32 countries and is specific for deficiencies of iron, iodine, folate, zinc and vitamin A, all considered as 33 critical nutrient for an adequate development 1. Is considered that MNM has a greater effect on 34 cognitive and physical development than calorie restriction 2. Regarding iron and vitamin A, both 35 are essential for human life and children’s development, so authorities around the world are vigilant 36 about iron deficiency anemia (IDA) and vitamin A deficiency (VAD) 3. 37
Regarding anemia and according to the most recent official data from the report Global 38 Prevalence of Anemia in 2011 (World Health Organization) the prevalence for risk groups were: 42.6% 39 (95% CI: 37-47) for children which represents 273.2 million individuals (95% CI: 241.8-303.7) and 40 29.4% (95% CI:24.5-35.0) for women in reproductive age covering a total of 528.7 million individuals 41 (95% CI: 440.3-629.4) 4. 42
About the consequences of VAD, it is considered as the main cause of blindness in children and 43 a risk factor of disease and death from serious infections 5. VAD also causes night blindness in 44
Nutrients 2020, 12, x FOR PEER REVIEW 2 of 10
pregnant women and may increase the risk of maternal mortality. According to the report Global 45 prevalence of vitamin A deficiency in populations at risk 1995–2005 (WHO), VAD is a severe public health 46 problem in children in preschool-age children (prevalence of 33.3%, 95% CI [31.1-35.4] and a 47 moderate public health problem in pregnant women (prevalence of 15.3%, 95% CI [7.4-23.2] 6 48
Anemia is a condition presented when the blood is deficient in healthy red blood cells or 49 hemoglobin 7. Anemia could be a consequence of nutritional causes as micronutrient deficiencies 50 and anti-nutritional factors that affect iron absorption; there are also non-nutritional causes leading 51 to anemia like bleeding, infections and genetic conditions 8. 52
Among the nutritional causes for anemia, iron deficiency is considered the main one 9,10; the 53 WHO has established cut-off values for hemoglobin (<11 g/dL for children under 5 years old and 54 pregnant women; <12 g/dL for children from 5-12 years old, non-pregnant women and teenage 55 males and <13 g/dL for teenage females) and ferritin (<12 µg/L) to diagnose IDA 7. There are different 56 studies and reviews that explored the relationship between other micronutrient deficiencies and 57 anemia like vitamin D 11, vitamin B12 and folate 12 and vitamin A that is the main focus of the present 58 study. 59
VAD is diagnosed based on serum retinol levels (SLR) and the following values has been 60 stablished to classify it, SRL between 0.36 and 0.70 mmol/L is considered as subclinical deficiency, 61 below 0.35 mmol/L is considered clinical deficiency, from 0.71 to 1.04 mmol/L is considered 62 suboptimal and above 1.05 mmol/L is considered as normal level of vitamin A 13. 63
The relationship between iron and vitamin A has been proposed since the early 20th century 14 64 and is considered that vitamin A is a nutrient that could regulate iron use 15, iron metabolism and 65 erythropoiesis and its deficiency should be considered as a risk factor for ID 16 even it is well known 66 that the precise relationship depends on many factors 17 but the mechanism of that effect is not 67 well-established. The few evidence available suggests that VAD affects iron metabolism and not its 68 absorption or transport 18,19. In cases of iron overload and normal vitamin A levels, retinol has an 69 antioxidant activity stimulating ferritin synthesis thus reducing circulating iron to avoid oxidative 70 stress 20. 71
The studies of Saraiva et al 19 and Arruda et al 21 proposed the effect of VAD upregulating the 72 expression of hepcidin and reducing the efflux of iron from the enterocyte as consequence of the 73 internalisation of ferroportin induced by hepcidin. That effect of the axis VAD:hepcidin:ferroportin 74 were validated by the work of and Citelli et al 22 employing in vitro (Caco-2) and in vivo (BALB/c male 75 mice and Wistar male rats) models, however, the mechanism is not clear; the same study revealed 76 that the expression of other proteins related to iron metabolism, such as DMT1, DcytB and TfR, was 77 not affected 22. 78
The present research was conducted with the hypothesis that vitamin A somehow regulates 79 iron metabolism, so both must be taken together. Our study was an analysis of the expression of 80 ferritin and transferrin receptor by Western Blotting under five diets with different ratios of iron to 81 vitamin A to identify how VAD is related to iron homeostasis in young male Wistar rats. 82
2. Materials and Methods 83
We followed the methods previously described (Restrepo-Gallego and Díaz) for animal 84 housing, diets and procedures 23. Briefly, thirty-five 21-day-old male Wistar rats were housed in 85 polycarbonate cages with polycarbonate water dispensers. Five groups of seven animals each were 86 randomly assigned to the different diets. Table 1 shows the composition and nutritional profile of 87 the diets. After six weeks of feeding, animals were anesthetized for whole blood extraction and 88 further biochemical analysis. Then the animals were euthanized, and their livers, spleens and small 89 bowels were kept at -80ºC for further Western Blot analysis. The Ethical Committees of Antioquia’s 90 University (#108.090217) and La Sabana University (#55.170516) approved the entire procedure. 91
Table 1. Ingredient composition and nutritional profile for each diet. 92
Ingredient Control Fes/vAd Fes/vAi Fei/vAs Fei/vAi
Corn starch 397.5 397.5 397.5 397.5 397.5

Nutrients 2020, 12, x FOR PEER REVIEW 3 of 10
Casein 200.0 200.0 200.0 200.0 200.0
Maltodextrin 10 132.0 132.0 132.0 132.0 132.0
Sucrose 100.0 100.0 100.0 100.0 100.0
Vegetable oil 70.0 70.0 70.0 70.0 70.0
Cellulose 50.0 50.0 50.0 50.0 50.0
Mineral mixa 35.0 35.0 35.0 0 0
Mineral mixb 0 0 0 35 35
Vitamin mixc 10.0 0 0 10.0 0
Vitamin mixd 0 10 10 0 10
L-Cysteine 3.0 3.0 3.0 3.0 3.0
Choline bitartrate 2.5 2.5 2.5 2.5 2.5
Ferric citrate [17.4% Fe] 0.03 0.03 0.03 0.07 0.07
t-Butylhydroquinone 0.014 0.014 0.014 0.014 0.014
Vitamin A palmitate [500.000
IU/g] 0 0 0.0008 0 0.0008
Protein [%] 20 20 20 20 20
Fat [%] 7 7 7 7 7
Fiber [%] 5 5 5 5 5
Carbohydrate [%] 64 64 64 64 64
Iron [mg/kg] 45 45 45 15 15
Vitamin A [µg/kg] as retinol
acetate 1200 0 120 1200 120
d, deficient; i, insufficient; s, sufficient; Ingredients are listed as g/kg except when noted; 93 aAIN-93G-MX; bAIN-93G-MX deficient in iron; cAIN-93G-VX; dAIN-93G-VX without vitamin A. 94
Cell lysates were obtained from the tissues using a lysis buffer (NaCl 150mM, PMSF 1mM, 95 Triton X-100 1%, Tris-HCl 50mM, DTT 200mM, EDTA 1mM) and protease inhibitor (cOmplete™ 96 ULTRA Tablets, Roche Diagnostics GmbH, Mannheim, Germany). The extraction was carried in a 97 BeadBug homogenizer (Benchmark Scientific, Edison, NJ, USA) at 4000 rpm with 1 mm glass beads. 98 The total protein content in the cell extracts was quantified in an equipment Qiaxpert 200,630 99 (Qiagen, Hilden, Germany). 100
Samples (50 μg of total protein) were subjected to 12% SDS-PAGE, transferred to 101 polyvinylidene membranes (PVDF Inmobilion-P, Millipore, Burlington, MA, USA) and blocked with 102 skimmed milk powder at 5% in with skimmed milk powder at 5% in tris-buffered saline and 103 polysorbate 20 (TBST). Primary and secondary anti-bodies used were obtained from Novus 104 Biologicals (Centennial, CO, USA) and are detailed in Table 2. Secondary antibodies used were 105 anti-Mouse IgG1 Secondary Antibody [HRP] NB7511 (1:2000) and anti-Rabbit IgG (H+L) Secondary 106 Antibody [HRP] NB7160 (1:500) both with goat as host and were obtained also from Novus 107 Biologicals. Immunoreactive proteins were visualized by 3,3′-diaminobenzidine staining (Sigma, St. 108 Louis, MO, USA). 109
Table 2. Primary antibodies used for Western Blotting tests. 110
Protein Primary antibody Dilution Host
β-actin beta-Actin Antibody (AC-15) NB600-501 1:2000 Mouse
Ferritin Ferritin Antibody NBP1-31944 1:100 Rabbit
Transferrin receptor TfR (Transferrin R) Antibody NB100-92243 1:100 Mouse
Il6 IL-6 Antibody NB600-1131 1:500 Rabbit
Data from biochemical parameters were presented as mean ± standard deviation. Continuous 111 variables were compared between groups by one-way analysis of variance with a post hoc 112 least-significant-difference t test (p < 0.05). The normality of data distribution was tested by the 113 Kolmogorov-Smirnov test; equality of variance was measured using Levene’s test. SPSS 13.0 for 114 Windows (SPSS Inc., Chicago, IL, USA) was used. The number of rats was estimated by a power 115 analysis to obtain 80% power at a confidence level of 95% 24. Western blot procedure was carried out 116 in triplicate for each sample. 117
Nutrients 2020, 12, x FOR PEER REVIEW 4 of 10
Western Blots information was analyzed with the software Prism 7.04 (GraphPad, San Diego, 118 CA, USA). The results were presented as relative expression of the respective protein to β-actin 119 giving a value of 1 to the control group and analyzed with Tukey method for multiple comparisons. 120 p < 0.05 was considered statistically significant. 121
3. Results 122
To explore how VAD alters the some of the main biomarkers associated to storage and iron 123 transport, the present research analyzed the expression of ferritin and transferrin receptor in five 124 groups of young male Wistar rats fed with diets with different ratios of vitamin A to iron. The 125 control group received a standard diet according to the reference diets for laboratory animals, and 126 the four experimental groups received different combinations of iron (Fe) and vitamin A (vA) at 127 sufficient (s), insufficient (i) or deficient (d) levels. No group was deficient in iron because it is 128 necessary for life sustain, thus a complete lack of it would result in no viable experimental subjects 25. 129 Given the known relationship between VAD and iron homeostasis, biomarkers are important, as 130 they indicate the needed supply of both micronutrients together to prevent IDA in children and 131 women at reproductive age 26. 132
3.1. Biochemical parameters: serum iron and serum retinol 133
All the intergroup comparisons indicated significant differences in serum iron content. Both 134 groups with low amounts of iron (Fei/vAs and Fei/vAi) had significant differences from the control 135 group (p < 0.001 for both groups). VAD (Fes/vAi and Fes/vAd) impacted the total serum iron content 136 (p = 0.024 and 0.001, respectively), as the Fes/vAd group exhibited the lowest values of both VAD 137 groups. 138
In terms of serum retinol levels, the groups with insufficient or deficient dietary vitamin A all 139 had significantly lower levels of serum retinol than the control group (p < 0.001 for both groups). In 140 the multiple comparison, only the groups with low dietary vitamin A (Fes/vAi and Fei/vAi) showed 141 no significant differences between them (p = 0.980). The results are summarized in Table 3. 142 Regarding the relationship about weight gain, food intake, hematological parameters and 143 nutritional status of vitamin A and iron, our previous findings suggested that, in young male Wistar 144 rats, both iron and vitamin A are essential to cause increases in body weight and various 145 hematologic parameters 23. 146
Table 3. Biochemical parameters of the different groups. 147
Parameter Control Fes/vAd Fes/vAi Fei/vAs Fei/vAi
Serum iron [µg/dL] 255.86±43.83 a 181.30±14.53 b 219.81±15.58 c 131.01±43.83 d 74.74±18.27 e
Serum retinol [µmol/L] 1.60±0.16 a 0.24±0.04 b 0.55±0.10 c 1.26±0.12 d 0.55±0.08 c
Data are given as mean ± 1 SD; n = 7; different letters indicate significant differences between groups (p<0.05). 148
3.2. Western Blot results 149
Ferritin is an acute-phase protein and inflammation status of the animals must be consider to 150 avoid misinterpretations and introduce adjustments, if necessary 27–29. Figure 1a shows that there 151 were no significant differences (p<0.05) in the expression of hepatic interleukin 6 (IL6) values when 152 the experimental groups were compared with the control group and also when the intergroup 153 comparisons were made; so, inflammation was not a critical factor for the study. 154

Nutrients 2020, 12, x FOR PEER REVIEW 5 of 10
(a)
(b)
(c)
(d)
(e)
(f)
Figure 1. Relative expression to β-actin of (a) interleukin-6 in liver; (b) ferritin in liver; (c) ferritin in 155 duodenum; (d) ferritin in spleen; (e) transferrin receptor in liver and (f) transferrin receptor in spleen. 156 Data are given as mean ± 1 SD; groups with different letters differ significantly (p < 0.05). 157
The results for ferritin in liver (Figure 1b) showed that fully lack of vitamin A with enough 158 amount of iron (Fes/vAd), seems to induce some level of holding or reabsorption of iron as ferritin, 159 reducing its mobilization to other tissues, maybe due to a damage at the hepatocyte 30, this is 160
Nutrients 2020, 12, x FOR PEER REVIEW 6 of 10
demonstrated by the significant higher expression of Fn in Fes/vAd group in comparison with the 161 control group (p = 0.0017). Those results are consistent with previous findings about the 162 relationship between VAD and oxidative stress by overload of serum iron related to an increase of 163 ferritin and IRP2 31,32. 164
Regarding ferritin in duodenum (Figure 1c) we found that there were no significant differences 165 between the experimental groups and the control group. Ferritin in spleen (Figure 1d) showed that 166 only the group without vitamin A (Fes/vAd) does not have significant differences in comparison 167 with the control group (p = 0.1076). 168
About the effect of VAD on the expression of transferrin receptor in liver (Figure 1e) and spleen 169 (Figure 1f), our study does not show any differences between the experimental groups and the 170 control group for both tissues. 171
4. Discussion 172
When results in the three groups with enough iron (Control, Fes/vAi and Fes/vAd) are 173 compared for serum iron, the group without vitamin A (Fes/vAd) showed lower results for serum 174 iron, that suggests that at least a small amount of vitamin A is required to support an adequate level 175 of serum iron; that results agrees with previous studies that demonstrated that IDA are related to 176 low intake of vitamin A in children between 5 and 12 years of age 33. The use of multinutrients as 177 strategy to improve the iron status and retinol status has been successful in regions and countries 178 as South India 34, Tanzania 35, Brazil 36 and Benin 37. 179
The focus of this research was not to evaluate the effect of iron deficiency on vitamin A status, 180 however it is important to remark that dietary iron changes have no effect on serum retinol amounts 181 when dietary vitamin A levels are low or absent; previous findings showed a lack of consensus 182 about the unidirectional effect of iron supplementation on the nutritional status of vitamin A as well 183 as differences between results in animal models and humans 38. 184
The findings of this study showed no significant differences in IL6 expression as an indicator of 185 inflammation in the animals, even with VAD, ID or both. Previous works showed that VAD and/or 186 IDA enhances the inflammatory state by increasing IL6 expression in the liver 18, regarding hepcidin 187 it has been established that IL6 regulates its transcription thus regulating circulation of iron in 188 inflammation 39,40. So, our findings do not mean that no relationship exists between VAD or ID and 189 inflammation, but under the experimental research conditions, there is not enough evidence to 190 support it. 191
When groups insufficient in iron (Fei/vAs and Fei/vAi) were compared there is a subexpression 192 of ferritin in comparison with control group (p<0.001 for both groups) due to the marginal deficiency 193 of iron, however, is interesting find that the group with sufficient iron but marginal deficiency of 194 vitamin A also showed subexpression of hepatic ferritin in comparison with control group (p<0.001) 195 due to the fact that vitamin A induces the expression of ferroportin (Fpn1) gene to promote the 196 export of iron to the bloodstream 22,41 which means that both nutrients must be in adequate quantities 197 to maintain the appropriate levels of iron storage in liver. 198
When intergroup comparisons were made, we found that the group with enough iron and a 199 marginal deficiency of vitamin A (Fes/vAi) was significantly higher than Fei/vAi (p = 0.0351) and 200 Fei/vAs (p = 0.0487). That suggests that at duodenal level, only dietary iron seems to influence the 201 expression of ferritin as a mechanism to regulate the circulating iron and prevent oxidative stress, 202 our results are consistent with the findings of Vanoaica et al 42 that demonstrated that not only 203 hepcidin but ferritin are necessary to regulate iron efflux to the bloodstream. 204
Ferritin in spleen results showed an interesting finding that denotes a relationship between the 205 fully absence of vitamin A and some kind of inflammatory disease which increases the expression of 206 splenic ferritin as marker of inflammation 43, in this case it seems that there is no relationship with 207 the iron status on the body. 208
Our results for transferrin receptor in liver and spleen agree with the findings of Citelli et al 209 18,19,22 that indicates that VAD impairs iron metabolism and may not affect iron absorption or 210 transport. 211

Nutrients 2020, 12, x FOR PEER REVIEW 7 of 10
The results of this study give a new approach to the relationship between VAD and IDA on the 212 expression of ferritin, previous findings had been focused on the effect on the expression of hepcidin 213 19,21, iron regulatory protein 2 31, ferroportin 44. Our findings do not indicate that the previous ones are 214 wrong but give a new approach based on ferritin supported by the review and meta-analysis made 215 by da Cunha et al 45 where suggests that supplementation with vitamin A alone may reduce the risk 216 of anemia, by improving ferritin levels in individuals with low serum retinol levels; our study also 217 reinforce the concept that the vitamin A acts in different ways as a regulator of the iron homeostasis 218 and metabolism and must be studied in deeper to understand all the mechanisms that are related 219 with IDA or anemia by VAD. 220
Finally, the development of improved technologies for the diagnosis of VAD and ID could lead 221 to a better understanding of the relationship between them and a better interpretations of the results 222 considering variables as inflammation status, interaction with other micronutrients and general 223 health status of the individuals 46. 224
5. Conclusions 225
The results of the study allow to propose that VAD influences the expression of the proteins 226 associated to iron storage and could be another mechanism to explain anemia by VAD even with 227 adequate levels of dietary iron. Based on our findings we consider that the joint supply of iron and 228 vitamin A must be considered as a strategy to reduce the prevalence of IDA, especially for women at 229 reproductive age and children. Further and deeper research at clinical level will give more 230 information about the relationship of both nutrients in a more realistic scenario and could explain 231 somehow the mechanism behind that interaction. 232
233
Author Contributions: Conceptualization, M.R. and L.D..; methodology, M.R., J.O. and D.C.; formal analysis, 234 M.R.; investigation, M.R.; writing original draft preparation, M.R. and J.O. All authors agree with the 235 manuscript and declare that the content has not been published elsewhere. 236
Funding: This work was funded by grants from La Sabana University’s Grant System (# ING-174-2016) and the 237 Colombian Ministry of Science, Technology, and Innovation (Colciencias) through a National Doctoral Grant (# 238 567-2012). 239 Conflicts of Interest: The authors declare that no known conflicts of interest are associated with this 240 publication. 241
References 242
1. Muthayya S, Rah JH, Sugimoto JD, Roos FF, Kraemer K, Black RE. The global hidden hunger indices 243
and maps: an advocacy tool for action. PLoS One. 2013;8(6):1-12. 244
2. Arcanjo FPN, Arcanjo CPC, Santos PR. Schoolchildren with Learning Difficulties Have Low Iron Status 245
and High Anemia Prevalence. J Nutr Metab. 2016;2016. doi:10.1155/2016/7357136 246
3. WHO. Health in 2015: From MDGs, Millennium Development Goals to SDGs, Sustainable Development Goals. 247
Geneva: World Health Organization; 2015. 248
4. WHO. The Global Prevalence of Anaemia in 2011. Geneva: World Health Organization; 2015. 249
5. Rubino P, Mora P, Ungaro N, Gandolfi SA, Orsoni JG. Anterior Segment Findings in Vitamin A 250
Deficiency: A Case Series. Case Rep Ophthalmol Med. 2015;2015:1-6. doi:10.1155/2015/181267 251
6. WHO. Global Prevalence of Vitamin A Deficiency in Populations at Risk 1995-2005 : WHO Global Database on 252
Vitamin A Deficiency. Geneva: World Health Organization; 2009. 253
7. Cascio MJ, DeLoughery TG. Anemia: Evaluation and Diagnostic Tests. Med Clin North Am. 254
2017;101(2):263-284. 255
8. Vieth JT, Lane DR. Anemia. Hematol Oncol Clin North Am. 2017;31(6):1045-1060. 256
9. Wong C. Iron deficiency anaemia. Paediatr Child Health (Oxford). 2017;27(11):527-529. 257

Nutrients 2020, 12, x FOR PEER REVIEW 8 of 10
10. Rasul I, Kandel GP. An approach to iron-deficiency anemia. Can J Gastroenterol Hepatol. 258
2001;15(11):739-748. 259
11. De La Cruz-Góngora V, Salinas-Rodríguez A, Villalpando S, Flores-Aldana M. Serum retinol but not 260
25(OH)D status is associated with serum hepcidin levels in older Mexican adults. Nutrients. 261
2019;11(5):1-15. 262
12. Green R, Datta Mitra A. Megaloblastic Anemias: Nutritional and Other Causes. Med Clin North Am. 263
2017;101(2):297-317. 264
13. Vuralli D, Tumer L, Hasanoglu A, Biberoglu G, Pasaoglu H. Vitamin A status and factors associated in 265
healthy school-age children. Clin Nutr. 2014;33(3):509-512. 266
14. Koessler KK, Maurer S, Loughlin R. The relation of anemia, primary and secondary, to vitamin A 267
deficiency. JAMA. 1926;87(7):476-482. 268
15. Sun YY, Ma AG, Yang F, et al. A combination of iron and retinol supplementation benefits iron status, 269
IL-2 level and lymphocyte proliferation in anemic pregnant women. Asia Pac J Clin Nutr. 270
2010;19(4):513-519. 271
16. Villalpando S, de la Cruz V, Shamah-Levy T, Rebollar R, Contreras-Manzano A. Nutritional status of 272
iron, vitamin B12, folate, retinol and anemia in children to 11 years old. Results of the Ensanut 2012. 273
Salud Publica Mex. 2015;57(5):372-384. 274
17. Michelazzo FB, Oliveira JM, Stefanello J, Luzia LA, Rondó PHC. The influence of vitamin A 275
supplementation on iron status. Nutrients. 2013;5(11):4399-4413. 276
18. da Cunha MSB, Siqueira EMA, Trindade LA, Arruda SF. Vitamin A deficiency modulates iron 277
metabolism via ineffective erythropoiesis. J Nutr Biochem. 2014;25(10):1035-1044. 278
19. Saraiva BC, Soares MC, dos Santos LC, Pereira SCL, Horta PM. Iron deficiency and anemia are 279
associated with low retinol levels in children aged 1 to 5 years. J Pediatr (Rio J). 2014;90(6):593-599. 280
20. Imam MU, Zhang S, Ma J, Wang H, Wang F. Antioxidants mediate both iron homeostasis and oxidative 281
stress. Nutrients. 2017;9(7):1-19. 282
21. Arruda SF, Siqueira EM de A, de Valência FF. Vitamin A deficiency increases hepcidin expression and 283
oxidative stress in rat. Nutrition. 2009;25(4):472-478. 284
22. Citelli M, Bittencourt LL, Da Silva SV, Pierucci APT, Pedrosa C. Vitamin a modulates the expression of 285
genes involved in iron bioavailability. Biol Trace Elem Res. 2012;149(1):64-70. 286
23. Restrepo-Gallego M, Díaz LE. Influence of Dietary Vitamin A and Iron Deficiency on Hematologic 287
Parameters and Body Weight of Young Male Wistar Rats. J Am Assoc Lab Anim Sci. 2020;59(1):17-23. 288
doi:10.30802/AALAS-JAALAS-19-000020 289
24. Charan J, Kantharia N. How to calculate sample size in animal studies? J Pharmacol Pharmacother. 290
2013;4(4):303. 291
25. Mesías M, Seiquer I, Navarro MP. Iron Nutrition in Adolescence. Crit Rev Food Sci Nutr. 292
2013;53(11):1226-1237. 293
26. Pereira RC, Caroso Ferreiira LO, da Silda Diniz A, Batista Filho M, Natal Figueirôa J. Eficácia da 294
suplementação de ferro associado ou não à vitamina A no controle da anemia em escolares. Cad Saúde 295
Pública. 2007;23(6):1415-1421. 296
27. Namaste SML, Rohner F, Huang J, et al. Adjusting ferritin concentrations for inflammation: Biomarkers 297
Reflecting Inflammation and Nutritional Determinants of Anemia (BRINDA) project. Am J Clin Nutr. 298
2017;106:359S-71S. 299
28. Rohner F, Namaste SML, Larson LM, et al. Adjusting soluble transferrin receptor concentrations for 300
Nutrients 2020, 12, x FOR PEER REVIEW 9 of 10
inflammation: Biomarkers Reflecting Inflammation and Nutritional Determinants of Anemia 301
(BRINDA) project. Am J Clin Nutr. 2017;106:372S-82S. 302
29. Cichon B, Ritz C, Fabiansen C, et al. Assessment of Regression Models for Adjustment of Iron Status 303
Biomarkers for Inflammation in Children with Moderate Acute Malnutrition in Burkina Faso. J Nutr. 304
2016:126-132. 305
30. Malik IA, Wilting J, Ramadori G, Naz N. Reabsorption of iron into acutely damaged rat liver: A role for 306
ferritins. World J Gastroenterol. 2017;23(41):7347-7358. 307
31. Jiang S, Wang C, Lan L, Zhao D. Vitamin A deficiency aggravates iron deficiency by upregulating the 308
expression of iron regulatory protein-2. Nutrition. 2012;28(3):281-287. 309
32. Chiou YL, Chen YH, Ke T, Ko WS. The effect of increased oxidative stress and ferritin in reducing the 310
effectiveness of therapy in chronic hepatitis C patients. Clin Biochem. 2012;45(16-17):1389-1393. 311
33. Visser M, Van Zyl T, Hanekom SM, et al. Nutrient patterns and its relation to anaemia and iron status in 312
5-12-year-old children in South Africa. Nutrition. 2019;62:194-200. 313
34. Kumar MV, Nirmalan PK, Erhardt JG, Rahmathullah L, Rajagopalan S. An efficacy study on alleviating 314
micronutrient deficiencies through a multiple micronutrient fortified salt in children in South India. 315
Asia Pac J Clin Nutr. 2014;23(3):413-422. 316
35. Makola D, Ash DM, Tatala SR, Latham MC, Ndossi G, Mehansho H. A micronutrient-fortified beverage 317
prevents iron deficiency, reduces anemia and improves the hemoglobin concentration of pregnant 318
Tanzanian women. J Nutr. 2003;133(5):1339-1346. doi:10.1093/jn/133.5.1339 319
36. Castro LCV, Costa NMB, Sant’Anna HMP, Ferreira CLDLF, Franceschini SDCDC. Improvement the 320
nutritional status of pre-school children following intervention with a supplement containing iron, zinc, 321
copper, vitamin A, vitamin C and prebiotic. Cienc e Saude Coletiva. 2017;22(2):359-368. 322
doi:10.1590/1413-81232017222.15902015 323
37. Alaofè H, Burney J, Naylor R, Taren D. Prevalence of anaemia, deficiencies of iron and Vitamin A and 324
their determinants in rural women and young children: A cross-sectional study in Kalalé district of 325
northern Benin. Public Health Nutr. 2017;20(7):1203-1213. 326
38. Oliveira JM, Michelazzo FB, Stefanello J, Rondó PHC. Influence of iron on vitamin a nutritional status. 327
Nutr Rev. 2008;66(3):141-147. 328
39. Lee P, Peng H, Gelbart T, Wang L, Beutler E. Regulation of hepcidin transcription by interleukin-1 and 329
interleukin-6. Proc Natl Acad Sci. 2005;102(6):1906-1910. 330
40. Babitt JL, Lin HY. Molecular Mechanisms of Hepcidin Regulation: Implications for the Anemia of CKD. 331
Am J Kidney Dis. 2010;55(4):726-741. 332
41. Katz O, Reifen R, Lerner A. β-Carotene can reverse dysregulation of iron protein in an in vitro model of 333
inflammation. Immunol Res. 2014;61(1-2):70-78. 334
42. Vanoaica L, Darshan D, Richman L, Schümann K, Kühn LC. Intestinal ferritin H is required for an 335
accurate control of iron absorption. Cell Metab. 2010;12(3):273-282. 336
43. Kell DB, Pretorius E. Serum ferritin is an important inflammatory disease marker, as it is mainly a 337
leakage product from damaged cells. Metallomics. 2014;6(4):748-773. 338
44. Han L, Liu Y, Lu M, Wang H, Tang F. Retinoic acid modulates iron metabolism imbalance in anemia of 339
inflammation induced by LPS via reversely regulating hepcidin and ferroportin expression. Biochem 340
Biophys Res Commun. 2018;507(1-4):280-285. 341
45. da Cunha MSB, Aboudib N, Arruda SF. Effect of vitamin A supplementation on iron status in humans: 342
A systematic review and meta-analysis. Crit Rev Food Sci Nutr. 2019;59(11):1767-1781. 343
Nutrients 2020, 12, x FOR PEER REVIEW 10 of 10
46. Lu Z, O’Dell D, Srinivasan B, et al. Rapid diagnostic testing platform for iron and Vitamin A deficiency. 344
Proc Natl Acad Sci U S A. 2017;114(51):13513-13518. 345
346
© 2020 by the authors. Submitted for possible open access publication under the terms
and conditions of the Creative Commons Attribution (CC BY) license
(http://creativecommons.org/licenses/by/4.0/).
347
Full Terms & Conditions of access and use can be found athttps://www.tandfonline.com/action/journalInformation?journalCode=bfsn20
Critical Reviews in Food Science and Nutrition
ISSN: 1040-8398 (Print) 1549-7852 (Online) Journal homepage: https://www.tandfonline.com/loi/bfsn20
Classic and emergent indicators for theassessment of human iron status
Mauricio Restrepo-Gallego, Luis E. Díaz & Patrícia H.C Rondó
To cite this article: Mauricio Restrepo-Gallego, Luis E. Díaz & Patrícia H.C Rondó (2020): Classicand emergent indicators for the assessment of human iron status, Critical Reviews in Food Scienceand Nutrition, DOI: 10.1080/10408398.2020.1787326
To link to this article: https://doi.org/10.1080/10408398.2020.1787326
Published online: 03 Jul 2020.
Submit your article to this journal
Article views: 7
View related articles
View Crossmark data

REVIEW
Classic and emergent indicators for the assessment of human iron status
Mauricio Restrepo-Gallegoa , Luis E. D�ıaza , and Patr�ıcia H.C Rond�ob
aDoctorate Program in Bioscience, La Sabana University, Ch�ıa, Colombia; bDepartment of Nutrition, School of Public Health, University ofS~ao Paulo, S~ao Paulo, Brazil
ABSTRACTIron deficiency is the leading cause of anemia, a significant global public health problem. Differentmethods exist for assessing iron nutritional status, including laboratory tests that focus on storage,transportation, and iron functional compartment parameters. Classical markers such as bone mar-row, serum iron, ferritin, hemoglobin, erythrocyte parameters, transferrin, transferrin receptors, andzinc protoporphyrin are discussed in this review. Additional parameters calculated from these indi-cators, including transferrin saturation, ferritin index and Thomas plot, and some emergent param-eters such as hepcidin, erythroferrone, and low hemoglobin density are also discussed. There is noa single indicator for assessing iron nutritional status. Therefore, the use of more than one indica-tor may be the best practice to obtain the correct diagnosis, also considering the influence ofinflammation/infection on many of these indicators. The constant validation of the current param-eters, the improvement of assessment methods, and the identification of new indicators will bethe key to refine the assessment of iron nutritional status and the right choice of treatment for itsimprovement.
KEYWORDSAnemia; hepcidin; irondeficiency; iron replacementtherapy; iron status
Introduction
Iron is an essential mineral that belongs to the group oftransition metals. It is found in numerous proteins, espe-cially those associated with the transport of oxygen; henceits importance for the sustenance of multiple living organ-isms (Kim and Nemeth 2015).
Iron is an essential micronutrient for all ages but is crit-ical for the growth and development of children. TheEstimated Average Requirement (EAR) for children agedbetween 7 and 12months is 6.9mg/day for boys and 6.3mg/day for girls. The EAR for boys and girls aged between1–3 years and 4–8 years is 3mg/day and 4.1mg/day, respect-ively. Recommended Dietary Allowances (RDA) are 11mg/day for boys and girls aged between 7 and 12months, 7mg/day for boys and girls aged between 1–3 years, and 10mg/day for boys and girls aged between 4 and 8 years. Sinceovereating this mineral can cause adverse effects or bearsome risk, the tolerable upper intake level (UL) has beenestablished at 40mg/day for children up to 13 years of age(L€onnerdal 2017).
The average iron content in the body is 4–5 g, and mostof it is found in the pigment proteins of blood (hemoglobin)and muscle (myoglobin). Iron is also present in numerousenzymes such as catalase, peroxidase, and hydroxylase. Itsmain functions are the transportation of oxygen in redblood cells and cofactor in enzymatic reactions and the elec-tron transport chain (Lamy, Durigova, and Jacot 2014).
Physiologically, anemia is a condition characterized bylow levels of hemoglobin in the blood. It is also associated
with a deficient quality or quantity of red blood cells.Micronutrient deficiencies and anti-nutritional factors areamong the nutritional causes leading to anemia. Bleeding,infections and genetic conditions are non-nutritional causes(Vieth and Lane 2017). Iron deficiency (ID) is consideredthe leading nutritional cause of anemia worldwide (Wong2017). Anemia occurs when hemoglobin levels are below theestablished cutoff points (11 g/dL for children under 5 yearsof age and pregnant women; 12 g/dL for children aged5–12 years, non-pregnant women and adolescent males, and13 g/dL for adolescent females) and ferritin levels are below12 mg/L (Cascio and DeLoughery 2017). The World HealthOrganization (WHO) defines a prevalence of anemia lessthan 5% not to be a public health problem, 5% to 19.9% asa mild public health problem, 20% to 39.9% as a moderatepublic health problem, and over 40% as a severe publichealth problem (WHO 2001). According to the latest officialWHO data, the prevalence among risk groups was 42.6% forchildren (95% CI: 37–47, severe public health problem), cor-responding to 273.2 million children, and 29.4% for allwomen of reproductive age (95% CI: 24.5–35.0, moderatepublic health problem), corresponding to 528.7 million indi-viduals (WHO 2015).
Iron nutritional status can be determined by clinicalevaluation, dietary intake, or laboratory tests. Laboratorytests focus on the storage status, transport, and functionaliron compartments. However, the sensitivity and specificityof these tests is affected by inflammatory or infectious states(Urrechaga et al. 2012). In 2018, the Biomarkers of
CONTACT Mauricio Restrepo-Gallego [email protected] Doctorate Program in Bioscience, La Sabana University, Ch�ıa, Cundinamarca, Colombia.� 2020 Taylor & Francis Group, LLC
CRITICAL REVIEWS IN FOOD SCIENCE AND NUTRITIONhttps://doi.org/10.1080/10408398.2020.1787326
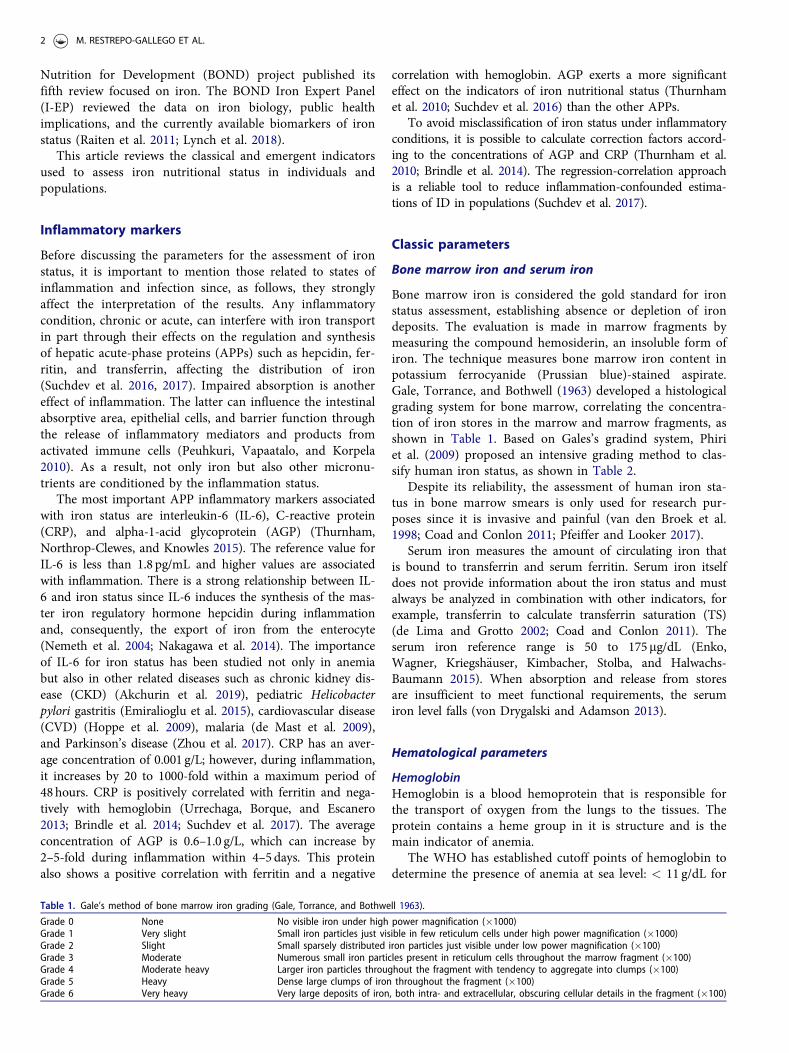
Nutrition for Development (BOND) project published itsfifth review focused on iron. The BOND Iron Expert Panel(I-EP) reviewed the data on iron biology, public healthimplications, and the currently available biomarkers of ironstatus (Raiten et al. 2011; Lynch et al. 2018).
This article reviews the classical and emergent indicatorsused to assess iron nutritional status in individuals andpopulations.
Inflammatory markers
Before discussing the parameters for the assessment of ironstatus, it is important to mention those related to states ofinflammation and infection since, as follows, they stronglyaffect the interpretation of the results. Any inflammatorycondition, chronic or acute, can interfere with iron transportin part through their effects on the regulation and synthesisof hepatic acute-phase proteins (APPs) such as hepcidin, fer-ritin, and transferrin, affecting the distribution of iron(Suchdev et al. 2016, 2017). Impaired absorption is anothereffect of inflammation. The latter can influence the intestinalabsorptive area, epithelial cells, and barrier function throughthe release of inflammatory mediators and products fromactivated immune cells (Peuhkuri, Vapaatalo, and Korpela2010). As a result, not only iron but also other micronu-trients are conditioned by the inflammation status.
The most important APP inflammatory markers associatedwith iron status are interleukin-6 (IL-6), C-reactive protein(CRP), and alpha-1-acid glycoprotein (AGP) (Thurnham,Northrop-Clewes, and Knowles 2015). The reference value forIL-6 is less than 1.8 pg/mL and higher values are associatedwith inflammation. There is a strong relationship between IL-6 and iron status since IL-6 induces the synthesis of the mas-ter iron regulatory hormone hepcidin during inflammationand, consequently, the export of iron from the enterocyte(Nemeth et al. 2004; Nakagawa et al. 2014). The importanceof IL-6 for iron status has been studied not only in anemiabut also in other related diseases such as chronic kidney dis-ease (CKD) (Akchurin et al. 2019), pediatric Helicobacterpylori gastritis (Emiralioglu et al. 2015), cardiovascular disease(CVD) (Hoppe et al. 2009), malaria (de Mast et al. 2009),and Parkinson’s disease (Zhou et al. 2017). CRP has an aver-age concentration of 0.001 g/L; however, during inflammation,it increases by 20 to 1000-fold within a maximum period of48hours. CRP is positively correlated with ferritin and nega-tively with hemoglobin (Urrechaga, Borque, and Escanero2013; Brindle et al. 2014; Suchdev et al. 2017). The averageconcentration of AGP is 0.6–1.0 g/L, which can increase by2–5-fold during inflammation within 4–5 days. This proteinalso shows a positive correlation with ferritin and a negative
correlation with hemoglobin. AGP exerts a more significanteffect on the indicators of iron nutritional status (Thurnhamet al. 2010; Suchdev et al. 2016) than the other APPs.
To avoid misclassification of iron status under inflammatoryconditions, it is possible to calculate correction factors accord-ing to the concentrations of AGP and CRP (Thurnham et al.2010; Brindle et al. 2014). The regression-correlation approachis a reliable tool to reduce inflammation-confounded estima-tions of ID in populations (Suchdev et al. 2017).
Classic parameters
Bone marrow iron and serum iron
Bone marrow iron is considered the gold standard for ironstatus assessment, establishing absence or depletion of irondeposits. The evaluation is made in marrow fragments bymeasuring the compound hemosiderin, an insoluble form ofiron. The technique measures bone marrow iron content inpotassium ferrocyanide (Prussian blue)-stained aspirate.Gale, Torrance, and Bothwell (1963) developed a histologicalgrading system for bone marrow, correlating the concentra-tion of iron stores in the marrow and marrow fragments, asshown in Table 1. Based on Gales’s gradind system, Phiriet al. (2009) proposed an intensive grading method to clas-sify human iron status, as shown in Table 2.
Despite its reliability, the assessment of human iron sta-tus in bone marrow smears is only used for research pur-poses since it is invasive and painful (van den Broek et al.1998; Coad and Conlon 2011; Pfeiffer and Looker 2017).
Serum iron measures the amount of circulating iron thatis bound to transferrin and serum ferritin. Serum iron itselfdoes not provide information about the iron status and mustalways be analyzed in combination with other indicators, forexample, transferrin to calculate transferrin saturation (TS)(de Lima and Grotto 2002; Coad and Conlon 2011). Theserum iron reference range is 50 to 175mg/dL (Enko,Wagner, Kriegsh€auser, Kimbacher, Stolba, and Halwachs-Baumann 2015). When absorption and release from storesare insufficient to meet functional requirements, the serumiron level falls (von Drygalski and Adamson 2013).
Hematological parameters
HemoglobinHemoglobin is a blood hemoprotein that is responsible forthe transport of oxygen from the lungs to the tissues. Theprotein contains a heme group in it is structure and is themain indicator of anemia.
The WHO has established cutoff points of hemoglobin todetermine the presence of anemia at sea level: < 11 g/dL for
Table 1. Gale’s method of bone marrow iron grading (Gale, Torrance, and Bothwell 1963).
Grade 0 None No visible iron under high power magnification (�1000)Grade 1 Very slight Small iron particles just visible in few reticulum cells under high power magnification (�1000)Grade 2 Slight Small sparsely distributed iron particles just visible under low power magnification (�100)Grade 3 Moderate Numerous small iron particles present in reticulum cells throughout the marrow fragment (�100)Grade 4 Moderate heavy Larger iron particles throughout the fragment with tendency to aggregate into clumps (�100)Grade 5 Heavy Dense large clumps of iron throughout the fragment (�100)Grade 6 Very heavy Very large deposits of iron, both intra- and extracellular, obscuring cellular details in the fragment (�100)
2 M. RESTREPO-GALLEGO ET AL.
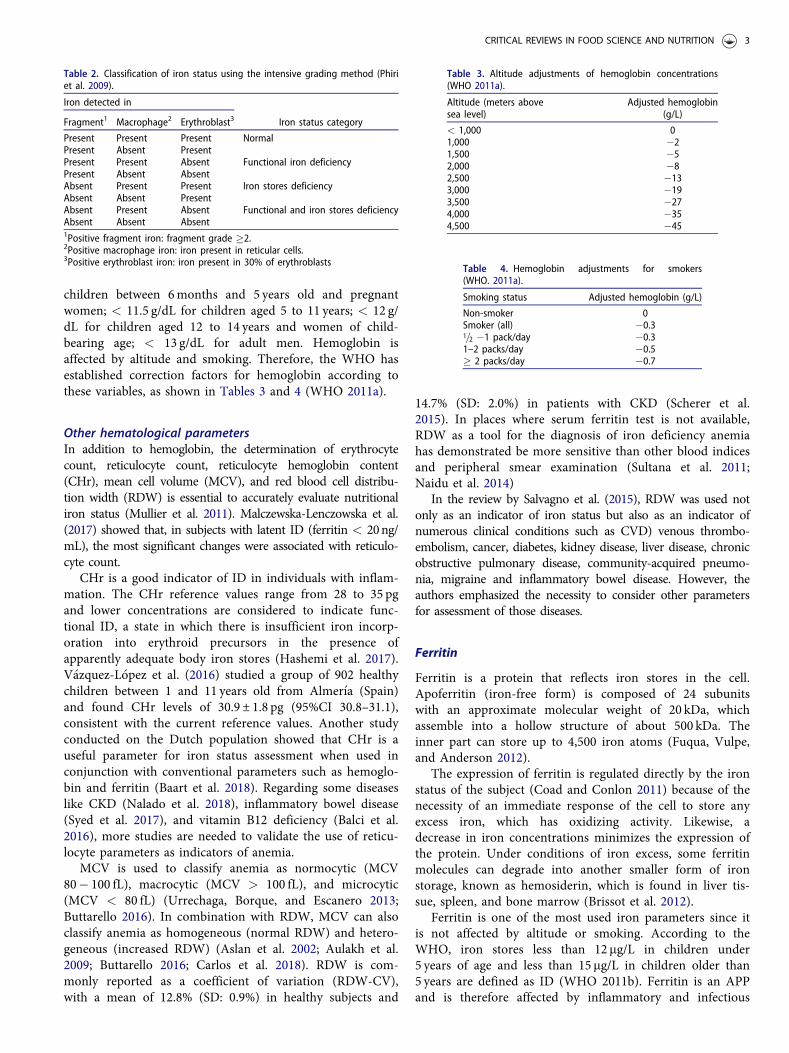
children between 6months and 5 years old and pregnantwomen; < 11.5 g/dL for children aged 5 to 11 years; < 12 g/dL for children aged 12 to 14 years and women of child-bearing age; < 13 g/dL for adult men. Hemoglobin isaffected by altitude and smoking. Therefore, the WHO hasestablished correction factors for hemoglobin according tothese variables, as shown in Tables 3 and 4 (WHO 2011a).
Other hematological parametersIn addition to hemoglobin, the determination of erythrocytecount, reticulocyte count, reticulocyte hemoglobin content(CHr), mean cell volume (MCV), and red blood cell distribu-tion width (RDW) is essential to accurately evaluate nutritionaliron status (Mullier et al. 2011). Malczewska-Lenczowska et al.(2017) showed that, in subjects with latent ID (ferritin < 20ng/mL), the most significant changes were associated with reticulo-cyte count.
CHr is a good indicator of ID in individuals with inflam-mation. The CHr reference values range from 28 to 35 pgand lower concentrations are considered to indicate func-tional ID, a state in which there is insufficient iron incorp-oration into erythroid precursors in the presence ofapparently adequate body iron stores (Hashemi et al. 2017).V�azquez-L�opez et al. (2016) studied a group of 902 healthychildren between 1 and 11 years old from Almer�ıa (Spain)and found CHr levels of 30.9 ± 1.8 pg (95%CI 30.8–31.1),consistent with the current reference values. Another studyconducted on the Dutch population showed that CHr is auseful parameter for iron status assessment when used inconjunction with conventional parameters such as hemoglo-bin and ferritin (Baart et al. 2018). Regarding some diseaseslike CKD (Nalado et al. 2018), inflammatory bowel disease(Syed et al. 2017), and vitamin B12 deficiency (Balci et al.2016), more studies are needed to validate the use of reticu-locyte parameters as indicators of anemia.
MCV is used to classify anemia as normocytic (MCV80� 100 fL), macrocytic (MCV > 100 fL), and microcytic(MCV < 80 fL) (Urrechaga, Borque, and Escanero 2013;Buttarello 2016). In combination with RDW, MCV can alsoclassify anemia as homogeneous (normal RDW) and hetero-geneous (increased RDW) (Aslan et al. 2002; Aulakh et al.2009; Buttarello 2016; Carlos et al. 2018). RDW is com-monly reported as a coefficient of variation (RDW-CV),with a mean of 12.8% (SD: 0.9%) in healthy subjects and
14.7% (SD: 2.0%) in patients with CKD (Scherer et al.2015). In places where serum ferritin test is not available,RDW as a tool for the diagnosis of iron deficiency anemiahas demonstrated be more sensitive than other blood indicesand peripheral smear examination (Sultana et al. 2011;Naidu et al. 2014)
In the review by Salvagno et al. (2015), RDW was used notonly as an indicator of iron status but also as an indicator ofnumerous clinical conditions such as CVD) venous thrombo-embolism, cancer, diabetes, kidney disease, liver disease, chronicobstructive pulmonary disease, community-acquired pneumo-nia, migraine and inflammatory bowel disease. However, theauthors emphasized the necessity to consider other parametersfor assessment of those diseases.
Ferritin
Ferritin is a protein that reflects iron stores in the cell.Apoferritin (iron-free form) is composed of 24 subunitswith an approximate molecular weight of 20 kDa, whichassemble into a hollow structure of about 500 kDa. Theinner part can store up to 4,500 iron atoms (Fuqua, Vulpe,and Anderson 2012).
The expression of ferritin is regulated directly by the ironstatus of the subject (Coad and Conlon 2011) because of thenecessity of an immediate response of the cell to store anyexcess iron, which has oxidizing activity. Likewise, adecrease in iron concentrations minimizes the expression ofthe protein. Under conditions of iron excess, some ferritinmolecules can degrade into another smaller form of ironstorage, known as hemosiderin, which is found in liver tis-sue, spleen, and bone marrow (Brissot et al. 2012).
Ferritin is one of the most used iron parameters since itis not affected by altitude or smoking. According to theWHO, iron stores less than 12 mg/L in children under5 years of age and less than 15 mg/L in children older than5 years are defined as ID (WHO 2011b). Ferritin is an APPand is therefore affected by inflammatory and infectious
Table 2. Classification of iron status using the intensive grading method (Phiriet al. 2009).
Iron detected in
Iron status categoryFragment1 Macrophage2 Erythroblast3
Present Present Present NormalPresent Absent PresentPresent Present Absent Functional iron deficiencyPresent Absent AbsentAbsent Present Present Iron stores deficiencyAbsent Absent PresentAbsent Present Absent Functional and iron stores deficiencyAbsent Absent Absent1Positive fragment iron: fragment grade �2.2Positive macrophage iron: iron present in reticular cells.3Positive erythroblast iron: iron present in 30% of erythroblasts
Table 3. Altitude adjustments of hemoglobin concentrations(WHO 2011a).
Altitude (meters abovesea level)
Adjusted hemoglobin(g/L)
< 1,000 01,000 �21,500 �52,000 �82,500 �133,000 �193,500 �274,000 �354,500 �45
Table 4. Hemoglobin adjustments for smokers(WHO. 2011a).
Smoking status Adjusted hemoglobin (g/L)
Non-smoker 0Smoker (all) �0.31=2 �1 pack/day �0.31–2 packs/day �0.5� 2 packs/day �0.7
CRITICAL REVIEWS IN FOOD SCIENCE AND NUTRITION 3

states. In these cases, the WHO has established a higher cut-off of 30 mg/L for children under 5 years of age as an indica-tor of ID (Brindle et al. 2014). Due to its role as an APP,ferritin loses strength as an indicator of ID. In the study car-ried out by Enko, Wagner, Kriegsh€auser, Kimbacher, Stolba,and Halwachs-Baumann (2015) involving 455 subjects, dif-ferent iron status indicators were compared. Ferritin levels< 30 mg/L classified 105 patients (23.6%) with ID, whereasthe Thomas-Plot indicator (discussed below) classified 153patients (34.38%) with ID.
It is important to note that elevated ferritin levels are notalways linked to iron overload. Hyperferritinemia, besidesinflammation and infection, is related to critical conditionssuch as liver disease, renal failure, metabolic syndrome, acutemyocardial infarction, and thyrotoxicosis (Koperdanova andCullis 2015).
To control for the effect of inflammation and to correctlyclassify a subject, the Biomarkers Reflecting Inflammationand Nutritional Determinants of Anemia (BRINDA) Projectproposes different methods to measure ferritin in the pres-ence of inflammation, always taking into account the con-centrations of CRP and AGP (Namaste et al. 2017). Themost striking method consists of stratification of the subjectsinto four groups to define internal correction factors (ICF).A first group called “without inflammation” or referenceincludes subjects with CRP � 5 mg/dL and AGP � 1 g/L.The second group, “incubation period”, considers CRP >5 mg/dL and AGP � 1 g/L. The third group, “early con-valescence”, includes subjects with CRP � 5 mg/dL and AGP> 1 g/L. The fourth group, “late convalescence”, includessubjects with CRP � 5 mg/dL and AGP > 1 (Thurnham,Northrop-Clewes, and Knowles 2015). The ICF of eachgroup with inflammation is generated by dividing the corre-sponding ferritin geometric mean by the geometric mean ofthe group without inflammation. Each ferritin concentrationof the groups with inflammation is then multiplied by thecorresponding ICF and is compared to reference values toclassify the subject (Suchdev et al. 2016).
Transferrin
Transferrin is the specific serum iron transport protein, aglycoprotein synthesized mainly in the liver. There are otherkinds of transferrin in the human body, including lactoferrin,and melanotransferrin. Transferrin is a simple polypeptidechain of approximately 80 kDa that binds two ferric ironatoms. It can be found in its iron-free form (apo-transferrin)or in the monoferric or diferric form (holo-transferrin) (Brissotet al. 2012). Lactoferrin is present mainly in colostrum, milkand other biological fluids such as tears, saliva, vaginal secre-tion, seminal fluid, plasma, and joint fluid (Rosa et al. 2017).The main functions of lactoferrin are the regulation of intes-tinal iron homeostasis and host protection against microbialinfection (Ward and Conneely 2004). Some applications oflactoferrin are related to its use as an iron carrier in nutritionalsupplements (Paesano et al. 2009). Melanotransferrin is moreassociated with tumoral processes and different studies haveshown that it is not essential for iron metabolism (Baker et al.
1992; Sekyere and Richardson 2000; Sekyere et al. 2006;Lambert 2012).
Transferrin is important as a marker of ID since its con-centrations increase proportionally to the iron requirements(Podmore et al. 2016). However, it is a negative APP and itslevels decrease during inflammation, affecting its reliabilityas an indicator of iron status. The reference range is200–400mg/dL (Guerra et al. 2009).
Transferrin saturation
Transferrin saturation (TS) is an indicator of functional ironfor erythropoiesis (Urrechaga, Borque, and Escanero 2013)and is calculated by the following equation:
% TS ¼ serum iron lgdL
� �� 70, 9
transferrin mgdL
� �A cutoff point < 20% has been established as an indica-
tor of ID (Urrechaga et al. 2012; Thomas et al. 2013).However, based on the reference values of serum iron(50–175mg/dL) and transferrin (200–360mg/dL), a referencerange of TS of 18–35% might be established and a morecomprehensive range of 20–50% should be considered as areference for healthy adults (Gropper and Smith 2013).
In the study of Enko, Wagner, Kriegsh€auser, Kimbacher,Stolba, and Halwachs-Baumann (2015), this indicator wasable to classify correctly 215 out of 445 patients (48.31%).However, it is not expected to be reliable in inflammatorystates since its denominator contains transferrin, an APP.High levels of non-transferrin bound iron and high %TShave been described to be associated with iron overload(Coad and Conlon 2011) and possible oxidative damage(Brissot et al. 2012).
Soluble transferrin receptor
The transferrin receptors (TfR) are directly involved in theacquisition of iron from the circulation. Two types of TfRhave been identified: TfR1 is present in almost all prolifera-tive cells and mediates the uptake of iron for the cell cycle,while TfR2 is mainly expressed in the liver (Marijn MSpeeckaert, Speeckaert, and Delanghe 2010). For iron acqui-sition, TfR bind transferrin in the monoferric or diferricform, the complex is endocytosed, and iron is released intothe cytoplasm to be utilized by the cell. Another form of thereceptor found in plasma is soluble or serum transferrinreceptor (sTfR). It is a cleaved form of the tissue receptorthat is present as a transferrin-receptor complex (Punnonen,Irjala, and Rajam€aki 1997).
The use of sTfR as an indicator of iron status has gainedrelevance because it shows the functional iron status anderythropoietin activity (Enko, Wagner, Kriegsh€auser,Kimbacher, Stolba, and Halwachs-Baumann 2015). Increasedconcentrations indicate early ID and the onset of store emp-tying (Suchdev et al. 2016). sTfR is not affected by inflam-mation or is less affected by high exposure to it than ferritin(Northrop-Clewes and Thurnham 2013; Rohner et al. 2017).Only in specific cases of high infection or inflammation
4 M. RESTREPO-GALLEGO ET AL.

must some adjustments be made for the correct interpret-ation of sTfR (Righetti et al. 2013; Thurnham, Northrop-Clewes, and Knowles 2015; Turgeon O’Brien et al. 2016).
Despite the small number of studies that established refer-ence and cutoff points for sTfR, a reference range can be setat 0.76–1.76mg/L for the healthy population (B€uy€ukkarag€ozet al. 2017). V�azquez-L�opez et al. (2016) established a meanvalue of 1.22± 0.28mg/L (95%CI 1.2–1.23) for healthy chil-dren. However, measurement techniques of sTfR have notbeen standardized and its values will always depend on themethod applied (Uijterschout et al. 2014). In addition, sTfRlacks specificity to determine ID since its levels increase inthe presence of symptoms of hemolytic and sickle-cell anemia(Drakesmith 2016).
Ferritin index
The ferritin index is a mathematical indicator proposed byPunnonen, Irjala, and Rajam€aKi (1997) that provides infor-mation about functional iron and its stores. It also covers thefull range of iron status from normality to ID. The ferritinindex is calculated by dividing the value of sTfR by the deci-mal logarithm of ferritin: ferritin index¼ sTfR/log ferritin.
This index is a good marker that shows high sensitivityand specificity, but its utility is affected by the lack of astandardized method for the determination of sTfR(Drakesmith 2016). Few studies have established referencevalues and cutoff points. Since the concentration of ferritinis affected by inflammation, Enko, Wagner, Kriegsh€auser,Kimbacher, Stolba, and Halwachs-Baumann (2015) proposedthe following cutoff points: 0.8 (CRP > 0.5mg/dL) and 1.5(CRP � 0.5mg/dL). V�azquez-L�opez et al. (2016) proposed0.87 ± 0.25 (95% CI 0.85–0.88) as a cutoff point.
Zinc protoporphyrin
In ID, protoporphyrin is bound to zinc during the synthesis ofthe heme group. Zinc protoporphyrin (ZPP) is considered asensitive indicator of iron status (Chung et al. 2012). However,it is generally used in conjunction with other biomarkers such
as reticulocyte count or hematocrit (Syed et al. 2017). It hasbeen established that amounts higher than 80mg/dL indicateID. However, ZPP can be affected by lead intoxication, inflam-mation, or thalassemia (Coad and Conlon 2011).
The zinc protoporphyrin-to-heme ratio (ZPP/H) has beenused in studies involving children and adults. ZPP/H meas-ures zinc relative to iron incorporation into protoporphyrinIX in red blood cells. When iron is insufficient, the propor-tion of incorporated zinc increases, with a consequentincrease in ZnPP/H (Mwangi et al. 2014).
Figure 1. Thomas plot (Thomas and Thomas 2002; Enko, Wagner, Kriegsh€auser,Kimbacher, Stolba, and Halwachs-Baumann 2015). CHr, reticulocyte hemoglobincontent; ACD, anemia of chronic disease; CRP, C-reactive protein; ID,iron deficiency.
Figure 2. Schematic representation of the regulation of iron efflux by hepcidin.(A) Normal iron status. (B) Iron overload. (C) Iron deficiency. Fe, iron; FPN, ferro-portin; Hep, hepcidin.
CRITICAL REVIEWS IN FOOD SCIENCE AND NUTRITION 5

Thomas plot
The Thomas plot is a model suggested by Christian Thomasand Lothar Thomas (2002), which combines hematologicaland biochemical markers and specifically creates a relationalmatrix between CHr and the ferritin index. The ferritinindex is plotted on the x-axis and CHr values are plotted onthe y-axis. Cutoff points are set at 28 pg for CHr and at 0.8(CRP > 0.5mg/dL) and 1.5 (CRP � 0.5mg/dL) for the fer-ritin index. Quadrants are defined to determine the iron sta-tus, as shown in Figure 1.
Emergent parameters
Hepcidin
At the systemic level and in healthy individuals, iron metab-olism is mainly regulated by hepcidin. This hormone wasdiscovered in 2000 and initially identified as an antimicro-bial peptide (hence its name: hep ¼ liver, cidin ¼ withmicrobial activity). Hepcidin is produced in the liver, butthere is evidence of its expression in macrophages, kidneys,pancreatic beta-cells, and fat tissues. However, its role inthese tissues is not directly related to iron but to its anti-microbial function (Kemna et al. 2008).
Hepcidin is encoded by the hepcidin antimicrobial peptide(HAMP) gene, which is located on the long arm of chromo-some 19. It is initially translated as pre-pro-hepcidin (84 aa),enzymatically cleaved into pro-hepcidin (64 aa), and exportedfrom the cytoplasm to the endoplasmic reticulum where it istransformed into its mature form (25 aa) (Petrak and Vyoral2005; Viatte and Vaulont 2009; B. Singh et al. 2011).
Hepcidin is considered the master hormone of iron regula-tion. The general mechanism consists of binding to ferropor-tin (FPN) and inducing its internalization and lysosomaldegradation. Thus, in the presence of iron overload, hepcidinexpression increases and reduces iron efflux from enterocytes(Figure 2). Oppositely, in the presence of ID, hepcidin expres-sion decreases and iron efflux into the circulation increasesbecause of the absence of FPN internalization (Ganz 2008;
Tussing-Humphreys et al. 2012; Przybyszewska and_Zekanowska 2014). This mechanism does not only occur inthe enterocyte but has also been found in other tissues suchas cardiac tissue (Ge et al. 2009).
In view of the importance of hepcidin as a regulator ofiron homeostasis, it is necessary to know more about its tran-scription regulatory pathways not only under normal healthconditions but in specific situations such as inflammation andanemia. These mechanisms are illustrated in Figure 3. Plasmairon concentration is the master regulator of hepcidin pro-duction under normal conditions. Nevertheless, hepcidin hasto be used in combination with other parameters in the pres-ence of inflammation and anemia. TfR1 and TfR2 sense ironavailability according to circulating concentrations of transfer-rin and regulate hepcidin synthesis through the mitogen-activated protein kinase/extracellular regulated kinase(MAPK/ERK) pathway (Ganz and Nemeth 2015).
During inflammation, there is strong regulation of hepci-din by factors associated with IL-6 that increase its tran-scription, especially in anemia of chronic disease. Thatregulation probably occurs due to the antimicrobial activityof hepcidin. The mechanism used by IL-6 to regulate hepci-din involves the transducers and transcription modulatorssimilar to the Drosophila gene mothers against decapenta-plegic – MAD (SMADs) and Janus kinase/signal transducerand activator of transcription 3 (JAK/STAT3) pathways. TheSMAD pathway is activated by the bone morphogenetic pro-tein receptor (BMPr) complex, which phosphorylates pro-teins SMAD4 and receptor-regulated SMAD (R-SMAD).The complex enters the nucleus and stimulates the tran-scription of HAMP. In another pathway, IL-6 binds to inter-leukin receptors (IL-Rs) and signals through JAK-inducedphosphorylation of STAT3 and the binding of phosphory-lated STAT3 to cognate motifs in the HAMP promoter (daCunha et al. 2014; Ganz and Nemeth 2015)
Erythropoiesis and anemia require high concentrations ofcirculating iron. It is therefore expected that both situationsnegatively regulate hepcidin expression. Erythropoietin actsas a negative regulator through the C/EBPa transcription
Figure 3. Regulation of the expression of hepcidin. Hep, hepcidin; IL-6, interleukin 6; IL-6R, interleukin 6 receptor; STAT3, signal transducer and activator of tran-scription 3; JAK, Janus kinase; BMPR, bone morphogenetic protein; BMP6, bone morphogenetic protein 6 receptor; SMADS, transducers and transcription modulatorssimilar to the Drosophila gene mothers against decapentaplegic (MAD); C/EBPa, CCAATT-enhancer protein binding alpha; GDF15, growth differentiation factor 15;EPO, erythropoietin; EPOr, erythropoietin receptor; TfR, transferrin receptor; MAPK/ERK, MAP kinase/extracellular regulated kinase; HJV, hemojuvelin; HAMP, hepcidinantimicrobial peptide.
6 M. RESTREPO-GALLEGO ET AL.
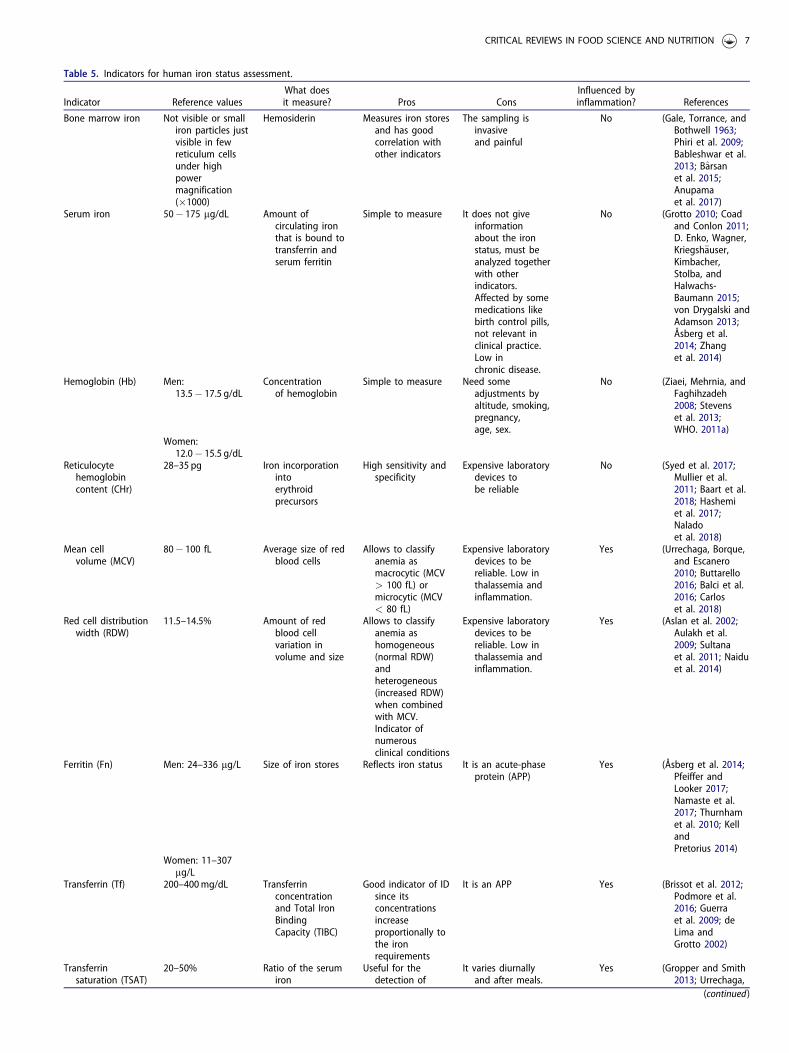
Table 5. Indicators for human iron status assessment.
Indicator Reference valuesWhat doesit measure? Pros Cons
Influenced byinflammation? References
Bone marrow iron Not visible or smalliron particles justvisible in fewreticulum cellsunder highpowermagnification(�1000)
Hemosiderin Measures iron storesand has goodcorrelation withother indicators
The sampling isinvasiveand painful
No (Gale, Torrance, andBothwell 1963;Phiri et al. 2009;Bableshwar et al.2013; Barsanet al. 2015;Anupamaet al. 2017)
Serum iron 50� 175 mg/dL Amount ofcirculating ironthat is bound totransferrin andserum ferritin
Simple to measure It does not giveinformationabout the ironstatus, must beanalyzed togetherwith otherindicators.Affected by somemedications likebirth control pills,not relevant inclinical practice.Low inchronic disease.
No (Grotto 2010; Coadand Conlon 2011;D. Enko, Wagner,Kriegsh€auser,Kimbacher,Stolba, andHalwachs-Baumann 2015;von Drygalski andAdamson 2013;Åsberg et al.2014; Zhanget al. 2014)
Hemoglobin (Hb) Men:13.5� 17.5 g/dL
Concentrationof hemoglobin
Simple to measure Need someadjustments byaltitude, smoking,pregnancy,age, sex.
No (Ziaei, Mehrnia, andFaghihzadeh2008; Stevenset al. 2013;WHO. 2011a)
Women:12.0� 15.5 g/dL
Reticulocytehemoglobincontent (CHr)
28–35 pg Iron incorporationintoerythroidprecursors
High sensitivity andspecificity
Expensive laboratorydevices tobe reliable
No (Syed et al. 2017;Mullier et al.2011; Baart et al.2018; Hashemiet al. 2017;Naladoet al. 2018)
Mean cellvolume (MCV)
80� 100 fL Average size of redblood cells
Allows to classifyanemia asmacrocytic (MCV> 100 fL) ormicrocytic (MCV< 80 fL)
Expensive laboratorydevices to bereliable. Low inthalassemia andinflammation.
Yes (Urrechaga, Borque,and Escanero2010; Buttarello2016; Balci et al.2016; Carloset al. 2018)
Red cell distributionwidth (RDW)
11.5–14.5% Amount of redblood cellvariation involume and size
Allows to classifyanemia ashomogeneous(normal RDW)andheterogeneous(increased RDW)when combinedwith MCV.Indicator ofnumerousclinical conditions
Expensive laboratorydevices to bereliable. Low inthalassemia andinflammation.
Yes (Aslan et al. 2002;Aulakh et al.2009; Sultanaet al. 2011; Naiduet al. 2014)
Ferritin (Fn) Men: 24–336 mg/L Size of iron stores Reflects iron status It is an acute-phaseprotein (APP)
Yes (Åsberg et al. 2014;Pfeiffer andLooker 2017;Namaste et al.2017; Thurnhamet al. 2010; KellandPretorius 2014)
Women: 11–307mg/L
Transferrin (Tf) 200–400mg/dL Transferrinconcentrationand Total IronBindingCapacity (TIBC)
Good indicator of IDsince itsconcentrationsincreaseproportionally tothe ironrequirements
It is an APP Yes (Brissot et al. 2012;Podmore et al.2016; Guerraet al. 2009; deLima andGrotto 2002)
Transferrinsaturation (TSAT)
20–50% Ratio of the serumiron
Useful for thedetection of
It varies diurnallyand after meals.
Yes (Gropper and Smith2013; Urrechaga,
(continued)
CRITICAL REVIEWS IN FOOD SCIENCE AND NUTRITION 7

factor in erythropoiesis and the transcription growth/differ-entiation factor 15 (GDF15) in anemia (Porto, Oliveira, andPinto 2012; Uijterschout et al. 2014).
Hepcidin is affected by inflammation (Coad and Conlon2011). Rubab et al. (2015) confirmed this association in astudy involving renal patients on hemodialysis. The authorsfound a positive correlation between hepcidin and CRP(rPearson ¼ 0.304, p< 0.05). In that study, a reference rangeof 8.1 ± 2.3 ng/mL for hepcidin was determined in a controlgroup of 42 subjects aged 18 and 60 years, homogeneous interms of gender (Rubab et al. 2015). In a similar group,Ford et al. (2010) found that hepcidin is not an adequateparameter for iron status in patients on hemodialysis due to
its intra-individual variability. Additionally, the samplesmust be taken in the morning since the results are moreconsistent than those obtained with samples taken in theevening or at night due to the diurnal variation of serumiron (Ganz et al. 2008). Hepcidin can also be measured inserum or urine by immunoassays or mass spectrometry.Nevertheless, the main deficiency relies on the standardiza-tion of the methods, differences between the assays (Pfeifferand Looker 2017), and the absence of therapeutic referenceranges (Ambroszkiewicz et al. 2017).
Although there is sufficient evidence to support the reli-ability of hepcidin as a marker of human iron status, thework of Enko, Wagner, Kriegsh€auser, Kimbacher, Stolba,
Table 5. Continued.
Indicator Reference valuesWhat doesit measure? Pros Cons
Influenced byinflammation? References
concentrationand the TIBCexpressed asa percentage
hereditaryhemochromatosis
As it depends onthe transferrinvalue, it is alsoaffected byinflammation
Boruqe, andEscanero 2013;Pfeiffer andLooker 2017;Martin-Cabreraet al. 2015)
Soluble transferrinreceptor (sTfR)
0.76–1.76mg/L Amount of solubletransferrinreceptors
It shows thefunctional ironstatus anderythropoietinactivity. Notaffected byinflammation.
Affected by the rateof erythropoiesis
No (de Lima and Grotto2002; Infusinoet al. 2012;Uijterschout et al.2014;B€uy€ukkarag€ozet al. 2017;Speeckaert,Speeckaert, andDelanghe 2010;Rohneret al. 2017)
Ferritin index (sTfR/LogFerritin Index)
0.62–1.12 Provides informationabout functionaliron andits stores
It shows highsensitivity andspecificity
As ferritin, it is anAPP and affectedby inflammation
Yes (Punnonen, Irjala,and Rajam€aki1997; Drakesmith2016; Enko et al.2015; V�azquez-L�opez et al. 2016;Infusinoet al. 2012)
ZincProtoporphyrin(ZPP)
<35mcg/dL Impact of lead onRBC synthesis
Low cost, but point-of-care testingand simplicity
Affected byinflammation.Increased duringexposure to lead.
Yes (Chung et al. 2012;Syed et al. 2017;Mwangiet al. 2014)
Hepcidin (Hep) 6.7–10.4 ng/mL Regulation of ironefflux fromthe enterocyte
Moreinformative than
Affected byinflammation.Influenced byvitaminA deficiency.
Yes (Zipperer et al.2013; Arruda, deAlmeida Siqueira,and de Valencia2009; Koliarakiet al. 2009;Delabyet al. 2014)
the traditionalmarkers ofiron status
Erythroferrone (EFE) Not establishedin humans
It describes theerythropoieticresponse torecombinanterythropoietin
The erythroferrone/hepcidin ratiomight be used todescribe therequest of ironfrom thebone marrow
Lack of studiesin humans
No (Kautz et al. 2014;Kim and Nemeth2015;Camaschella et al.2016; Lawen2015; Ganz 2019)
Low hemoglobindensity (LHD)
5.5% It is a sigmoidtransformation ofthe MCHC value
It improves theresolution of theresults, especiallyin blood sampleswith very lowMCHC levels
Requires furtherimprovement
No (Urrechaga et al.2012; Dopsajet al. 2012;Aulakh et al.2009; Singhet al. 2018)
8 M. RESTREPO-GALLEGO ET AL.

and Halwachs-Baumann (2015) showed that ferritin indexand sTfR are better predictors of functional ID in patientswith and without acute-phase reactions.
Erythroferrone
Erythroferrone (ERFE) is a protein discovered in 2014,which has been proposed to be the erythroid regulator ofiron metabolism. It is produced by erythroblasts in responseto erythropoietin. Once secreted, ERFE blocks hepcidinexpression, inducing the release of iron from the hepatocyteor enterocyte (Kautz et al. 2014; Kim and Nemeth 2015;Camaschella et al. 2016). In some pathologies like intermedi-ate thalassemia, it has been found that iron overloads corres-pond to high levels of ERFE. The use of ERFE as aparameter for human iron status assessment has not yetbeen accepted. Its discovery is too recent, its effect inhumans has not been confirmed, and it is necessary tostandardize a method for its determination. ERFE could bean essential indicator of iron status, describing the erythro-poietic response to recombinant erythropoietin in renalpathologies. In addition, the ERFE/hepcidin ratio might beused to describe the demand of iron from the bone marrowin other disorders such as thalassemia or inflammation(Lawen 2015; Drakesmith 2016; Honda et al. 2016).
Low hemoglobin density
Low hemoglobin density (LHD) is a parameter proposed byBeckman Coulter, which uses MCHC in its formula:
%LHD ¼ 100
ffiffiffiffiffiffiffiffiffiffiffiffiffiffiffiffiffiffiffiffiffiffiffiffiffiffiffiffiffiffiffiffiffiffiffiffiffiffiffiffiffiffiffiffiffiffiffiffi1� 1
1þ e1:8 30�MCHCð Þ
� �s
It is simply a sigmoid transformation of the MCHC valueand is useful to improve the resolution of the results, espe-cially in blood samples with very low MCHC levels. LHDhas been validated in a multicenter study in which a cutoffpoint of 5.5% was established with 88.6% sensitivity and76.9% specificity (Urrechaga 2010).
LHD could be used for ID assessment in cases of bothcyanotic and acyanotic congenital heart disease as demon-strated by Dopsaj et al. (2012). LHD has been validated asan indicator of ID when it is combined with the microcyticanemia factor (MAf) as a low-cost tool (Aulakh et al. 2009).This parameter has also been used in combination withother markers such as TS and bone marrow morphology forthe identification of treatable anemia presenting for cardiacsurgery (Martin-Cabrera et al. 2015). There is not sufficientevidence of its validity in other conditions like pregnancy(Crispin, Sinclair, and Andriolo 2016). The inconsistency inthe different studies allows us to conclude that further stud-ies are necessary to establish its use as a screening parameterfor iron status assessment (Singh et al. 2018). However,LHD could be useful to confirm ID when other indicatorsare not reliable, especially in inflammation or non-iron defi-ciency, and in cases in which it is necessary to differentiatebetween functional and absolute ID in children (Yildirim,Kaya, and Bakkaloglu 2019).
Conclusion
Human iron status assessment is essential both in healthypeople and in people with morbidity. Numerous indicatorshave been used for a long time, and as summarized in Table5, it is not possible to select a single indicator for a reliable,cost-effective, and easy diagnosis of iron status in humans.
Based on the information collected from the differentpublications, the most accurate procedure is the combin-ation of various indicators to avoid the influence of condi-tions such as inflammation, pregnancy, age, sex, andinfection. In this respect, the application of algorithms thatcombine different indicators, such as that proposed byMu~noz, Villar, and Garc�ıa-Erce (2009), might be useful(Figure 4). The adequate combination of various parameterscan improve the diagnosis of ID and distinguish it fromanemia of chronic disease.
As a general recommendation in the daily practice ofthose involved in human iron status assessment, a procedurefrom the basic to the more specific indicators is proposed.In a preliminary stage, indicators for a rapid screening ashemoglobin and ferritin could be used, both of them areeasy and low-cost and allow a quick classification of thepresence or absence of anemia. As a second step, it is neces-sary to conduct an assessment of the inflammatory status ofthe subject. If there is inflammation, then reticulocyte hemo-globin content (CHr) and soluble transferrin receptor (sTfR)are the best indicators or, an adjustment procedure must beconducted to give an appropriate interpretation of the fer-ritin values. To go more in-depth on the classification of thetype of anemia, when confirmed, additional hematologicaltests like CHr, MCV, RDW must be conducted. The com-bined use of CHr and ferritin index (with the correspondingadjustments for inflammation) in tools like Thomas Plotgives a reliable approach to the iron status and better infor-mation to choose the right treatment to improve it, togetherwith the emerging indicators hepcidin and erythroferrone,which have represented important advances in the
Figure 4. Algorithm for the diagnosis of iron deficiency suggested by Mu~noz,Villar, and Garc�ıa-Erce (2009). Hb, hemoglobin; TS, transferrin saturation; Fn, fer-ritin; MCH, mean corpuscular hemoglobin; IDA, iron deficiency anemia; ACD,anemia of chronic disease.
CRITICAL REVIEWS IN FOOD SCIENCE AND NUTRITION 9
pathophysiology of iron deficiency (Nielsen, Coskun, andWeiss 2016; Serati and Torella 2019).
The following step, after assessment of the iron nutri-tional status if any deficiency is diagnosed and classified, isthe choice of treatment. Dietary interventions have beenwidely used when the patient’s condition is not critical(Ribeiro Silva Neto et al. 2019; Sun et al. 2018; Hoppe et al.2013). In critical conditions, iron replacement therapy (IRT)has been practiced since the seventeenth century (Girelliet al. 2018), and represents, besides dietary interventions,the most indicated treatment for patients diagnosed withiron deficiency, with or without anemia (Girelli et al. 2018).The choice of the right IRT, oral or intravenous (IV), andthe best chemical form of iron to be used will depend onthe cause of iron deficiency and the physiological conditionsof the patient (Baird-Gunning and Bromley 2016; Auerbach2018). Oral iron administration is a commonly used andcost-effective option to treat iron-deficiency anemia, but thebioavailability of iron is relatively low. It is less effectivethan IV iron in patients with an additional condition likecancer, inflammatory bowel disease (IBD), Chron’s Disease(CD) or cardiac surgery and is not suitable for manypatients for its gastrointestinal side-effects which comprisenausea, abdominal discomfort, constipation, diarrhea anddyspepsia (Nielsen, Coskun, and Weiss 2016).
The constant validation of the current indicators, thedevelopment of standardized measurement methods, and thenew knowledge about emerging parameters will improveiron nutritional assessment according to each health condi-tion and the right choice or treatment for improve the ironstatus. Finally, it is relevant to emphasize that both classicaland emergent indicators must be under constant evaluationto obtain more reliable results.
Author contributions
M.R.G. interpreted and analyzed the data and wrote themanuscript. P.H.C. and L.D.B. interpreted the data and crit-ically revised the article. All authors have read and approvedthe final version of the document.
Declaration of interest
The authors declare no known conflicts of interest associ-ated with this publication.
Funding
Mauricio Restrepo-Gallego (M.R.G.) thanks the Colombian Ministry ofScience, Technology, and Innovation (Minciencias) for its supportthrough a national doctoral fellowship (grant 567 2012).
ORCID
Mauricio Restrepo-Gallego http://orcid.org/0000-0002-8631-3547Luis E. D�ıaz http://orcid.org/0000-0002-9588-9935Patr�ıcia H.C Rond�o http://orcid.org/0000-0002-8308-6393
References
Hashemi, S. M., M. A. Mashhadi, M. Mohammadi, M. Ebrahimi, andA. Allahyari. 2017. Absolute and functional iron deficiency anemiaamong different tumors in cancer patients in south part of Iran,2014. International Journal of Hematology-Oncology and Stem CellResearch 11 (3):192–8.
Stevens, G. A., M. M. Finucane, L. M. De-Regil, C. J. Paciorek, S. R.Flaxman, F. Branca, J. P. Pe~na-Rosas, Z. A. Bhutta, and M. Ezzati.2013. Global, regional, and national trends in haemoglobin concen-tration and prevalence of total and severe anaemia in children andpregnant and non-pregnant women for 1995–2011: A systematicanalysis of population-representative data. The Lancet. Global Health1 (1):e16. doi: 10.1016/S2214-109X(13)70001-9.
V�azquez-L�opez, M. A., E. L�opez-Ruzafa, F. Lendinez-Molinos, M.Ortiz-P�erez, L. Ruiz-Tudela, and M. Mart�ın-Gonz�alez. 2016.Reference values of serum transferrin receptor (STfR) and STfR/Logferritin index in healthy children. Pediatric Hematology andOncology 33 (2):109–20. doi: 10.3109/08880018.2015.1138007.
Akchurin, O., E. Patino, V. Dalal, K. Meza, D. Bhatia, S. Brovender,Y.-S. Zhu, S. Cunningham-Rundles, E. Perelstein, J. Kumar, et al.2019. Interleukin-6 contributes to the development of anemia injuvenile CKD. Kidney International Reports 4 (3):470–83. doi: 10.1016/j.ekir.2018.12.006.
Ambroszkiewicz, J., W. Klemarczyk, J. Mazur, J. Gajewska, G. Rowicka,M. Struci�nska, and M. Chełchowska. 2017. Serum hepcidin and sol-uble transferrin receptor in the assessment of iron metabolism inchildren on a vegetarian diet. Biological Trace Element Research 180(2):182–90. doi: 10.1007/s12011-017-1003-5.
Anupama, K. V., S. R. Purnima, S. Adappa, P. Balanthimogru, and C.Mahabala. 2017. Correlation between serum ferritin and bone mar-row iron stores. Tropical Doctor 47 (3):217–21. doi: 10.1177/0049475516678478.
Arruda, S. F., E. M. de Almeida Siqueira, and F. F. de Valencia. 2009.Vitamin A deficiency increases hepcidin expression and oxidativestress in rat. Nutrition (Burbank, Los Angeles County, Calif.) 25 (4):472–8. doi: 10.1016/j.nut.2008.11.030.
Åsberg, A. E., G. Mikkelsen, M. W. Aune, and A. Åsberg. 2014. Emptyiron stores in children and young adults-the diagnostic accuracy ofMCV, MCH, and MCHC. International Journal of LaboratoryHematology 36 (1):98–104. doi: 10.1111/ijlh.12132.
Aslan, D., F. G€umr€uk, A. G€urgey, and C. Altay. 2002. Importance ofRDW value in differential diagnosis of hypochrome anemias.American Journal of Hematology 69 (1):31–3. doi: 10.1002/ajh.10011.
Auerbach, M. 2018. New paradigms and therapies for iron replacementin iron deficiency anemia. Clinical Advances in Hematology &Oncology : H&O 16 (11):712–5.
Aulakh, R., I. Sohi, T. Singh, and N. Kakkar. 2009. Red cell distributionwidth (RDW) in the diagnosis of iron deficiency with microcytichypochromic anemia. The Indian Journal of Pediatrics 76 (3):265–8.doi: 10.1007/s12098-009-0014-4.
Baart, A. M., M. G. J. Balvers, M. T. E. Hopman, T. M. H. Eijsvogels,J. M. T. Klein-Gunnewiek, and C. A. van Kampen. 2018.Reticulocyte hemoglobin content in a large sample of the generalDutch population and its relation to conventional iron status param-eters. Clinica Chimica Acta 483:20–4. doi: 10.1016/j.cca.2018.04.018.
Bableshwar, R. S., M. Roy, A. Bali, P. V. Patil, and S. Inumella. 2013.Intensive method of assessment and classification of the bone mar-row iron status: A study of 80 patients. Indian Journal of Pathology& Microbiology 56 (1):16–9. doi: 10.4103/0377-4929.116142.
Baird-Gunning, J., and J. Bromley. 2016. Correcting iron deficiency.Australian Prescriber 39 (6):193–9. doi: 10.18773/austprescr.2016.069.
Baker, E. N., H. M. Baker, C. A. Smith, M. R. Stebbins, M. Kahn, K. E.Hellstr€om, and I. Hellstr€om. 1992. Human melanotransferrin (P97)has only one functional iron-binding site. FEBS Letters 298 (2–3):215–8. doi: 10.1016/0014-5793(92)80060-T.
Balci, Y. I., F. O. Akpinar, A. Polat, U. Uzun, and A. Ergin. 2016.Evaluation of reticulocyte parameters in iron deficiency, vitamin B12
10 M. RESTREPO-GALLEGO ET AL.
deficiency and mixed anemia. Clinical Laboratory 62 (3):343–7. doi:10.7754/Clin.Lab.2015.150616.
Barsan, L., A. Stanciu, S. Stancu, C. C�apus�a, L. Br�atescu, E. Mandache,E. Radu, and G. Mircescu. 2015. Bone marrow iron distribution,hepcidin, and ferroportin expression in renal anemia. Hematology20 (9):543–52. doi: 10.1179/1607845415Y.0000000004.
Brindle, E., D. Stevens, C. Crudder, C. E. Levin, D. Garrett, C. Lyman,and D. S. Boyle. 2014. A multiplex immunoassay method for simul-taneous quantification of iron, vitamin A and inflammation statusmarkers. PLoS One. 9 (12):e115164. doi: 10.1371/journal.pone.0115164.
Brissot, P., M. Ropert, C. L. Lan, and O. Lor�eal. 2012. Non-transferrinbound iron: A key role in iron overload and iron toxicity.Biochimica et Biophysica Acta 1820 (3):403–10. doi: 10.1016/j.bba-gen.2011.07.014.
Buttarello, M. 2016. Laboratory diagnosis of anemia: Are the old andnew red cell parameters useful in classification and treatment, how?International Journal of Laboratory Hematology 38 (Suppl 1):123–32.doi: 10.1111/ijlh.12500.
B€uy€ukkarag€oz, B., N. A. Akgun, A. D. Bulus, S. D. Aydogdu, and C.Bal. 2017. Can soluble transferrin receptor be used in diagnosingiron deficiency anemia and assessing iron response in infants withmoderate acute malnutrition? Archivos Argentinos de Pediatria 115(2):125–31.
Camaschella, C., A. Pagani, A. Nai, and L. Silvestri. 2016. The mutualcontrol of iron and erythropoiesis. International Journal ofLaboratory Hematology 38 (Suppl 1):20–6. doi: 10.1111/ijlh.12505.
Carlos, A. M., B. M. B. de Souza, R. A V. de Souza, G. A. D. Resende,G. A. Pereira, and H. Moraes-Souza. 2018. Causes of microcyticanaemia and evaluation of conventional laboratory parameters inthe differentiation of erythrocytic microcytosis in blood donors can-didates. Hematology (Amsterdam, Netherlands) 23 (9):705–11. doi:10.1080/10245332.2018.1446703.
Cascio, M. J., and T. G. DeLoughery. 2017. Anemia: Evaluation anddiagnostic tests. The Medical Clinics of North America 101 (2):263–84. doi: 10.1016/j.mcna.2016.09.003.
Chung, M., D. Moorthy, N. Hadar, N. Salvi, R. C. Iovin, and J. Lau.2012. Biomarkers for assessing and managing iron deficiency anemiain late-stage chronic kidney disease. Rockville (MD): Agency forHealthcare Research and Quality (US).
Coad, J., and C. Conlon. 2011. Iron deficiency in women: Assessment,causes and consequences. Current Opinion in Clinical Nutrition andMetabolic Care 14 (6):625–34. doi: 10.1097/MCO.0b013e32834be6fd.
Crispin, P., F. Sinclair, and K. Andriolo. 2016. Low haemoglobin dens-ity for detecting iron deficiency across a large population, includingpregnancy. International Journal of Laboratory Hematology 38 (4):397–402. doi: 10.1111/ijlh.12510.
da Cunha, M. S. B., E. M. A. Siqueira, L. A. Trindade, and S. F.Arruda. 2014. Vitamin A deficiency modulates iron metabolism viaineffective erythropoiesis. The Journal of Nutritional Biochemistry 25(10):1035–44. doi: 10.1016/j.jnutbio.2014.05.005.
de Lima, G. A. F. M., and H. Z. W. Grotto. 2002. Laboratory assess-ment of iron status and reticulocyte parameters in differential diag-nosis of iron deficiency anemia and heterozygous beta-thalassemia.Jornal Brasileiro de Patologia e Medicina Laboratorial 38 (4):273–80.doi: 10.1590/S1676-24442002000400005.
de Mast, Q., E. C. van Dongen-Lases, D. W. Swinkels, A.-E. Nieman,M. Roestenberg, P. Druilhe, T. A. Arens, A. J. Luty, C. C. Hermsen,R. W. Sauerwein, et al. 2009. Mild increases in serum hepcidin andinterleukin-6 concentrations impair iron incorporation in haemoglo-bin during an experimental human malaria infection. BritishJournal of Haematology 145 (5):657–64. doi: 10.1111/j.1365-2141.2009.07664.x.
Delaby, C., J. Vialaret, P. Bros, A. Gabelle, T. Lefebvre, H. Puy, C.Hirtz, and S. Lehmann. 2014. Clinical measurement of hepcidin-25in human serum: Is quantitative mass spectrometry up to the job?EuPA Open Proteomics 3:60–7. doi: 10.1016/j.euprot.2014.02.004.
Dopsaj, V., G. Mikovic-Golubovic, J. Martinovic, and D.Kalimanovska-Ostric. 2012. Evaluation of derived coulter red bloodcell parameters for the assessment of iron deficiency in adults with
congenital heart disease. International Journal of LaboratoryHematology 34 (5):461–72. doi: 10.1111/j.1751-553X.2012.01417.x.
Drakesmith, H. 2016. Next-generation biomarkers for iron status.Nestl�e Nutrition Institute Workshop 84:59–69.
Emiralioglu, N., I. Yenicesu, S. Sari, O. Egritas, A. Poyraz, O. T.Pasaoglu, B. Celik, and B. Dalgic. 2015. An insight into the relation-ships between prohepcidin, iron deficiency anemia, and interleukin-6 values in pediatric helicobacter pylori gastritis. European Journalof Pediatrics 174 (7):903–10. doi: 10.1007/s00431-014-2482-4.
Enko, D., H. Wagner, G. Kriegsh€auser, C. Kimbacher, R. Stolba, andG. Halwachs-Baumann. 2015. Assessment of human iron status: Across-sectional study comparing the clinical utility of differentlaboratory biomarkers and definitions of iron deficiency in dailypractice. Clinical Biochemistry 48 (13-14):891–6. doi: 10.1016/j.clin-biochem.2015.05.008.
Enko, D., H. Wagner, G. Kriegsh€auser, C. Kimbacher, R. Stolba, E.Worf, and G. Halwachs-Baumann. 2015. Hepcidin-25 vs. conven-tional clinical biomarkers in the diagnosis of functional iron defi-ciency. European Journal of Haematology 95 (6):507–13. doi: 10.1111/ejh.12523.
Ford, B. A., C. S. Eby, M. G. Scott, and D. W. Coyne. 2010. Intra-indi-vidual variability in serum hepcidin precludes its use as a marker ofiron status in hemodialysis patients. Kidney International 78 (8):769–73. doi: 10.1038/ki.2010.254.
Fuqua, B. K., C. D. Vulpe, and G. J. Anderson. 2012. Intestinal ironabsorption. Journal of Trace Elements in Medicine and Biology :Organ of the Society for Minerals and Trace Elements (GMS) 26(2–3):115–9. doi: 10.1016/j.jtemb.2012.03.015.
Gale, E., J. Torrance, and T. Bothwell. 1963. The quantitative estima-tion of total iron stors in human bone marrow. Journal of ClinicalInvestigation 42 (7):1076–82. doi: 10.1172/JCI104793.
Ganz, T. 2008. Iron homeostasis: Fitting the puzzle pieces together.Cell Metabolism 7 (4):288–90. doi: 10.1016/j.cmet.2008.03.008.
Ganz, T. 2019. Erythropoietic regulators of iron metabolism. FreeRadical Biology & Medicine 133:69–74. doi: 10.1016/j.freeradbiomed.2018.07.003.
Ganz, T., and E. Nemeth. 2015. Iron homeostasis in host defence andinflammation. Nature Reviews. Immunology 15 (8):500–10. doi: 10.1038/nri3863.
Ganz, T., G. Olbina, D. Girelli, E. Nemeth, and M. Westerman. 2008.Immunoassay for human serum hepcidin immunoassay for humanserum hepcidin. Blood 112 (10):4292–7. doi: 10.1182/blood-2008-02-139915.
Ge, X. H., Q. Wang, Z. M. Qian, L. Zhu, F. Du, W. H. Yung, L. Yang,and Y. Ke. 2009. The iron regulatory hormone hepcidin reduces fer-roportin 1 content and iron release in H9C2 cardiomyocytes. TheJournal of Nutritional Biochemistry 20 (11):860–5. doi: 10.1016/j.jnutbio.2008.07.014.
Girelli, D., S. Ugolini, F. Busti, G. Marchi, and A. Castagna. 2018.Modern iron replacement therapy: Clinical and pathophysiologicalinsights. International Journal of Hematology 107 (1):16–30. doi: 10.1007/s12185-017-2373-3.
Gropper, S., and J. L. Smith. 2013. Advanced nutrition and humanmetabolism. United States: Cengage Learning.
Grotto, H. Z. W. 2010. Fisiologia e metabolismo do ferro. RevistaBrasileira de Hematologia e Hemoterapia 32:08–17. doi: 10.1590/S1516-84842010005000050.
Guerra, L. T., A. R. Rosa, R. F. Romani, R. R. Gurski, C. C. Schirmer,and C. D. P. Kruel. 2009. Serum transferrin and serum prealbuminas markers of response to nutritional support in patients withesophageal cancer. Nutricion Hospitalaria 24 (2):241–2.
Honda, H., Y. Kobayashi, S. Onuma, K. Shibagaki, T. Yuza, K. Hirao,T. Yamamoto, N. Tomosugi, and T. Shibata. 2016. Associationsamong erythroferrone and biomarkers of erythropoiesis and ironmetabolism, and treatment with long-term erythropoiesis-stimulat-ing agents in patients on hemodialysis. PLoS ONE 11 (3):e0151601.doi: 10.1371/journal.pone.0151601.
Hoppe, M., B. Br€un, M. P. Larsson, L. Moraeus, and L. Hulth�en. 2013.Heme iron-based dietary intervention for improvement of iron
CRITICAL REVIEWS IN FOOD SCIENCE AND NUTRITION 11
status in young women. Nutrition (Burbank, Los Angeles County,Calif.) 29 (1):89–95. doi: 10.1016/j.nut.2012.04.013.
Hoppe, M., B. L€onnerdal, B. Hossain, S. Olsson, F. Nilsson, P. A.Lundberg, S. R€odjer, and L. Hulth�en. 2009. Hepcidin, interleukin-6and hematological iron markers in males before and after heart sur-gery. The Journal of Nutritional Biochemistry 20 (1):11–6. doi: 10.1016/j.jnutbio.2007.11.008.
Infusino, I., F. Braga, A. Dolci, and M. Panteghini. 2012. Soluble trans-ferrin receptor (STfR) and STfR/log ferritin index for the diagnosis ofiron-deficiency anemia: A meta-analysis. American Journal of ClinicalPathology 138 (5):642–9. doi: 10.1309/AJCP16NTXZLZFAIB.
Kautz, L., G. Jung, E. Valore, S. Rivella, E. Nemeth, and T. Ganz. 2014.Identification of erythroferrone as an erythroid regulator of ironmetabolism. Nature Genetics 46 (7):678–84. doi: 10.1038/ng.2996.
Kell, D. B., and E. Pretorius. 2014. Serum ferritin is an importantinflammatory disease marker, as it is mainly a leakage product fromdamaged cells. Metallomics : Integrated Biometal Science 6 (4):748–73. doi: 10.1039/C3MT00347G.
Kemna, E. H. J. M., H. Tjalsma, H. L. Willems, and D. W. Swinkels.2008. Hepcidin: From discovery to differential diagnosis.Haematologica 93 (1):90–7. doi: 10.3324/haematol.13095.
Kim, A., and E. Nemeth. 2015. New insights into iron regulation anderythropoiesis airie. Current Opinion in Hematology 22 (3):199–205.
Koliaraki, V., M. Marinou, T. P. Vassilakopoulos, E. Vavourakis, E.Tsochatzis, G. A. Pangalis, G. Papatheodoridis, A. Stamoulakatou,D. W. Swinkels, G. Papanikolaou, et al. 2009. A novel immuno-logical assay for hepcidin quantification in human serum. PLoSONE 4 (2):e4581. doi: 10.1371/journal.pone.0004581.
Koperdanova, M., and J. Cullis. 2015. Interpreting raised serum ferritinlevels. The BMJ 351:9–11.
Lambert, L. A. 2012. Molecular evolution of the transferrin family andassociated receptors. Biochimica et Biophysica Acta (Bba) - GeneralSubjects 1820 (3):244–55. doi: 10.1016/j.bbagen.2011.06.002.
Lamy, P. J., A. Durigova, and W. Jacot. 2014. Iron homeostasis andanemia markers in early breast cancer. Clinica Chimica Acta;International Journal of Clinical Chemistry 434:34–40. doi: 10.1016/j.cca.2014.04.011.
Lawen, A. 2015. Is erythroferrone finally the long sought-after systemicerythroid regulator of iron? World Journal of Biological Chemistry 6(3):78–82. doi: 10.4331/wjbc.v6.i3.78.
L€onnerdal, B. 2017. Development of iron homeostasis in infants andyoung children. The American Journal of Clinical Nutrition 106(Suppl 6):1575S–80S. nodoi: 10.3945/ajcn.117.155820.
Lynch, S., C. M. Pfeiffer, M. K. Georgieff, G. Brittenham, S.Fairweather-Tait, R. F. Hurrell, H. J. McArdle, and D. J. Raiten.2018. Biomarkers of Nutrition for Development (BOND)-ironreview. The Journal of Nutrition 148 (suppl_1):1001S–67S. doi: 10.1093/jn/nxx036.
Malczewska-Lenczowska, J., J. Orysiak, B. Szczepa�nska, D. Turowski, K.Burkhard-Jagodzi�nska, and J. Gajewski. 2017. Reticulocyte anderythrocyte hypochromia markers in detection of iron deficiency inadolescent female athletes. Biology of Sport 2 (2):111–8. doi: 10.5114/biolsport.2017.64584.
Martin-Cabrera, P., M. Hung, E. Ortmann, T. Richards, M. Ghosh, F.Bottrill, T. Collier, A. A. Klein, and M. W. Besser. 2015. Clinical useof low haemoglobin density, transferrin saturation, bone marrowmorphology, Perl’s stain and other plasma markers in the identifica-tion of treatable anaemia presenting for cardiac surgery in a pro-spective cohort study. Journal of Clinical Pathology 68 (11):923–30.doi: 10.1136/jclinpath-2015-203024.
Mullier, F., E. Lainey, O. Fenneteau, L. da Costa, F. Schillinger, N.Bailly, Y. Cornet, C. Chatelain, J. M. Dogne, and B. Chatelain. 2011.Additional erythrocytic and reticulocytic parameters helpful fordiagnosis of hereditary spherocytosis: Results of a multicentrestudy. Annals of Hematology 90 (7):759–68. doi: 10.1007/s00277-010-1138-3.
Mu~noz, M., I. Villar, and J. A. Garc�ıa-Erce. 2009. An update on ironphysiology. World Journal of Gastroenterology 15 (37):4617–26. doi:10.3748/wjg.15.4617.
Mwangi, M. N., S. Maskey, P. E. Andang’o, N. K. Shinali, J. M. Roth,L. Trijsburg, A. M. Mwangi, H. Zuilhof, B. van Lagen, H. F.Savelkoul, et al. 2014. Diagnostic utility of zinc protoporphyrin todetect iron deficiency in Kenyan pregnant women. BMC Medicine12 (1):1–13. doi: 10.1186/s12916-014-0229-8.
Naidu, R. V., R. Desai, A. M. Dorle, and I. Shivanand. 2014. Red celldistribution width (RDW) in the diagnosis of iron deficiencyanaemia in children between 6 months to 2 years. UPDATE 3 (1):61–5. .
Nakagawa, H., T. Tamura, Y. Mitsuda, Y. Goto, Y. Kamiya, T. Kondo,K. Wakai, and N. Hamajima. 2014. Inverse correlation betweenserum interleukin-6 and iron levels among Japanese adults: A cross-sectional study. BMC Hematology 14 (1):6. doi: 10.1186/2052-1839-14-6.
Nalado, A. M., J. N. Mahlangu, R. Duarte, G. Paget, G. Olorunfemi,B. F. Jacobson, and S. Naicker. 2018. Utility of reticulocyte haemo-globin content and percentage hypochromic red cells as markers ofiron deficiency anaemia among Black CKD patients in South Africa.PLoS ONE 13 (10):e0204899. doi: 10.1371/journal.pone.0204899.
Namaste, S. M. L., F. Rohner, J. Huang, N. L. Bhushan, R. Flores-Ayala, R. Kupka, Z. Mei, et al. 2017. Adjusting ferritin concentra-tions for inflammation: Biomarkers reflecting inflammation andnutritional determinants of anemia (BRINDA) project. TheAmerican Journal of Clinical Nutrition 106:359S–71S.
Nemeth, E., S. Rivera, V. Gabayan, C. Keller, S. Taudorf, B. K.Pedersen, and T. Ganz. 2004. IL-6 mediates hypoferremia of inflam-mation by inducing the synthesis of the iron regulatory hormonehepcidin. The Journal of Clinical Investigation 113 (9):1271–6. doi:10.1172/JCI200420945.
Nielsen, O. H., M. Coskun, and G. Weiss. 2016. Iron replacement ther-apy: Do we need new guidelines? Current Opinion inGastroenterology 32 (2):128–35. doi: 10.1097/MOG.0000000000000247.
Northrop-Clewes, C. A., and D. I. Thurnham. 2013. Biomarkers for thedifferentiation of anemia and their clinical usefulness. Journal ofBlood Medicine 2013 (4):11–22. doi:10.2147/JBM.S29212
Paesano, R., M. Pietropaoli, S. Gessani, and P. Valenti. 2009. The influ-ence of lactoferrin, orally administered, on systemic iron homeosta-sis in pregnant women suffering of iron deficiency and irondeficiency anaemia. Biochimie 91 (1):44–51. doi: 10.1016/j.biochi.2008.06.004.
Petrak, J., and D. Vyoral. 2005. Hephaestin—A ferroxidase of cellulariron export. The International Journal of Biochemistry & Cell Biology37 (6):1173–8. doi: 10.1016/j.biocel.2004.12.007.
Peuhkuri, K., H. Vapaatalo, and R. Korpela. 2010. Even low-gradeinflammation impacts on small intestinal function. World Journal ofGastroenterology 16 (9):1057–62. doi: 10.3748/wjg.v16.i9.1057.
Pfeiffer, C. M., and A. C. Looker. 2017. Laboratory methodologies forindicators of iron status: Strengths, limitations, and analytical chal-lenges. The American Journal of Clinical Nutrition 106 (Suppl 6):1606S–14S. doi: 10.3945/ajcn.117.155887.
Phiri, K. S., J. C. J. Calis, D. Kachala, E. Borgstein, J. Waluza, I. Bates,B. Brabin, and M. Boele Van Hensbroek. 2009. Improved methodfor assessing iron stores in the bone marrow. Journal of ClinicalPathology 62 (8):685–9. doi: 10.1136/jcp.2009.064451.
Podmore, C., K. Meidtner, M. B. Schulze, R. A. Scott, A. Ramond,A. S. Butterworth, E. Di Angelantonio, J. Danesh, L. Arriola, A.Barricarte, et al. 2016. The association of multiple biomarkers ofiron metabolism and type 2 diabetes: The EPIC-InterAct study.Diabetes Care 39 (4):572–81. doi: 10.2337/dc15-0257.
Porto, G., S. Oliveira, and J. P. Pinto. 2012. Hepcidina: A mol�ecula-chave na regulac~ao do metabolismo do ferro. Jornal Portugues deGastrenterologia 18:26–32.
Przybyszewska, J., and E. _Zekanowska. 2014. The role of hepcidin, fer-roportin, HCP1, and DMT1 protein in iron absorption in thehuman digestive tract. Gastroenterology Review 4 (4):208–13. doi: 10.5114/pg.2014.45102.
Punnonen, K., K. Irjala, and A. Rajam€aKi. 1997. Serum transferrinreceptor and its ratio to serum ferritin in the diagnosis of iron defi-ciency. Blood 89 (3):1052–7. doi: 10.1182/blood.V89.3.1052.
12 M. RESTREPO-GALLEGO ET AL.
Raiten, D. J., S. M. L. Namaste, B. Brabin, G. Combs, Jr, M. R. L.Abbe, E. Wasantwisut, and I. Darnton-Hill. 2011. Executive sum-mary-biomarkers of nutrition for development: Building a consen-sus. The American Journal of Clinical Nutrition 94 (2):633S–50S.doi: 10.3945/ajcn.110.008227.
Ribeiro Silva Neto, L. G., J. E. dos Santos Neto, N. Bezerra Bueno, S. L.de Oliveira, and T. da Rocha Ataide. 2019. Effects of iron supple-mentation versus dietary iron on the nutritional iron status:Systematic review with meta-analysis of randomized controlled tri-als. Critical Reviews in Food Science and Nutrition 59 (16):2553–61.doi: 10.1080/10408398.2018.1459469.
Righetti, A. A., R. Wegm€uller, D. Glinz, M. Ouattara, L. G. Adiossan,E. K. N’Goran, J. Utzinger, and R. F. Hurrell. 2013. Effects ofinflammation and plasmodium falciparum infection on solubletransferrin receptor and plasma ferritin concentration in differentage groups: A prospective longitudinal study in Cote d’Ivoire.American Journal of Clinical Nutrition 97:I354–74.
Rohner, F., S. M. L. Namaste, L. M. Larson, O. Y. Addo, Z. Mei, P. S.Suchdev, and A. M. Williams. 2017. Adjusting soluble transferrinreceptor concentrations for inflammation: Biomarkers reflectinginflammation and nutritional determinants of anemia (BRINDA)project. The American Journal of Clinical Nutrition 106:372S–82S.
Rosa, L., A. Cutone, M. S. Lepanto, R. Paesano, and P. Valenti. 2017.Lactoferrin: A natural glycoprotein involved in iron and inflamma-tory homeostasis. International Journal of Molecular Sciences 18 (9):1985. doi: 10.3390/ijms18091985.
Rubab, Z., H. Amin, K. Abbas, S. Hussain, M. I. Ullah, and S. Mohsin.2015. Serum hepcidin levels in patients with end-stage renal diseaseon hemodialysis. Saudi Journal of Kidney Diseases andTransplantation 26 (1):19–25. doi: 10.4103/1319-2442.148716.
Salvagno, G. L., F. Sanchis-Gomar, A. Picanza, and G. Lippi. 2015. Redblood cell distribution width: A simple parameter with multiple clin-ical applications. Critical Reviews in Clinical Laboratory Sciences 52(2):86–105. doi: 10.3109/10408363.2014.992064.
Scherer, P. S., D. Moraes, T. P. Munhoz, and V. Sgnaolin. 2015. Newred blood cell and reticulocyte parameters and reference values forhealthy individuals and in chronic kidney disease. Jornal Brasileirode Patologia e Medicina Laboratorial 51 (2):77–84. doi: 10.5935/1676-2444.20150014.
Sekyere, E., L. Dunn, Y. Rahmanto, and D. Richardson. 2006. Role ofmelanotransferrin in iron metabolism: Studies using targeted genedisruption in vivo. Blood 107 (7):2599–601. doi: 10.1182/blood-2005-10-4174.
Sekyere, E., and D. Richardson. 2000. The membrane-bound transferrinhomologue melanotransferrin: Roles other than iron transport?FEBS Letters 483 (1):11–6. doi: 10.1016/S0014-5793(00)02079-2.
Serati, M., and M. Torella. 2019. Preventing complications by persist-ence with iron replacement therapy: A comprehensive literaturereview. Current Medical Research and Opinion 35 (6):1065–72. doi:10.1080/03007995.2018.1552850.
Singh, B., S. Arora, P. Agrawal, and S. K. Gupta. 2011. Hepcidin: Anovel peptide hormone regulating iron metabolism. Clinica ChimicaActa; International Journal of Clinical Chemistry 412 (11–12):823–30. doi: 10.1016/j.cca.2011.02.014.
Singh, A., R. Chaudhary, H. Pandey, and A. Sonker. 2018.Identification of iron status of blood donors by using low hemoglo-bin density and microcytic anemia factor. Asian Journal ofTransfusion Science 12 (1):46–50. doi: 10.4103/ajts.AJTS_30_17.
Speeckaert, M. M., R. Speeckaert, and J. R. Delanghe. 2010. Biologicaland clinical aspects of soluble transferrin receptor. Critical Reviewsin Clinical Laboratory Sciences 47 (5–6):213–28. nodoi: 10.3109/10408363.2010.550461.
Suchdev, P., S. Namaste, G. Aaron, D. Raiten, K. Brown, and R.Flores-Ayala. 2016. Overview of the biomarkers reflecting inflamma-tion and nutritional determinants. Advances in Nutrition (Bethesda,Md.) 7 (2):349–56. 2016, nodoi: 10.3945/an.115.010215.
Suchdev, P. S., A. M. Williams, Z. Mei, R. Flores-Ayala, S.-R. Pasricha,L. M. Rogers, and S. M. Namaste. 2017. Assessment of iron status insettings of inflammation: Challenges and potential approaches. The
American Journal of Clinical Nutrition 106 (Suppl 6):1626S–33S. doi:10.3945/ajcn.117.155937.
Sultana, G. S., S. A. Haque, T. Sultana, Q. Rahman, and A. N. N.Ahmed. 2011. Role of red cell distribution width (RDW) in thedetection of iron deficiency anaemia in pregnancy within the first20 weeks of gestation. Bangladesh Medical Research Council Bulletin37 (3):102–5. doi: 10.3329/bmrcb.v37i3.9122.
Sun, J., L. Zhang, J. Cui, S. Li, H. Lu, Y. Zhang, H. Li, J. Sun, and Z.Baloch. 2018. Effect of dietary intervention treatment on childrenwith iron deficiency anemia in China: A meta-analysis. Lipids inHealth and Disease 17 (1):1–7. doi: 10.1186/s12944-018-0749-x.
Syed, S., S. Kugathasan, A. Kumar, J. Prince, B. Schoen, C. McCracken,T. R. Ziegler, and P. S. Suchdev. 2017. Use of reticulocyte hemoglo-bin content in the assessment of iron deficiency in children withinflammatory bowel disease. Journal of Pediatric Gastroenterologyand Nutrition 64 (5):713–20.
Thomas, D. W., R. F. Hinchliffe, C. Briggs, I. C. Macdougall, T.Littlewood, and I. Cavill. 2013. Guideline for the laboratory diagno-sis of functional iron deficiency. British Journal of Haematology 161(5):639–48. doi: 10.1111/bjh.12311.
Thomas, C., and L. Thomas. 2002. Biochemical markers and hemato-logic indices in the diagnosis of functional iron deficiency. ClinicalChemistry 48 (7):1066–76. doi: 10.1093/clinchem/48.7.1066.
Thurnham, D. I., L. D. McCabe, S. Haldar, F. T. Wieringa, C. A.Northrop-Clewes, and G. P. McCabe. 2010. Adjusting plasma fer-ritin concentrations to remove the effects of subclinical inflamma-tion in the assessment of iron deficiency: A meta-analysis. TheAmerican Journal of Clinical Nutrition 92 (3):546–55. doi: 10.3945/ajcn.2010.29284.
Thurnham, D. I., C. A. Northrop-Clewes, and J. Knowles. 2015. Theuse of adjustment factors to address the impact of inflammation onvitamin A and iron status in humans. The Journal of Nutrition 145(5):1137S–43S. doi: 10.3945/jn.114.194712.
Turgeon O’Brien, H., R. Blanchet, D. Gagn�e, J. Lauzi�ere, and C.V�ezina. 2016. Using soluble transferrin receptor and taking inflam-mation into account when defining serum ferritin cutoffs improvedthe diagnosis of iron deficiency in a group of Canadian preschoolInuit children from Nunavik. Anemia 2016:1–10. doi: 10.1155/2016/6430214.
Tussing-Humphreys, L., C. Pusatcioglu, C. Pustacioglu, E. Nemeth, andC. Braunschweig. 2012. Rethinking iron regulation and assessmentin iron deficiency, anemia of chronic disease, and obesity:Introducing hepcidin. Journal of the Academy of Nutrition andDietetics 112 (3):391–400. doi: 10.1016/j.jada.2011.08.038.
Uijterschout, L., D. W. Swinkels, M. D. Akkermans, T. Zandstra, M.Nuijsink, D. Hendriks, C. Hudig, H. Tjalsma, R. Vos, J. B. vanGoudoever, et al. 2014. The value of soluble transferrin receptor andhepcidin in the assessment of iron status in children with cysticfibrosis. Journal of Cystic Fibrosis : Official Journal of the EuropeanCystic Fibrosis Society 13 (6):639–44. doi: 10.1016/j.jcf.2014.03.007.
Urrechaga, E. 2010. The new mature red cell parameter, low haemoglo-bin density of the Beckman-Coulter LH750: Clinical utility in thediagnosis of iron deficiency. International Journal of LaboratoryHematology 32 (1p1):e144–e150. doi: 10.1111/j.1751-553X.2008.01127.x.
Urrechaga, E., L. Borque, and J. F. Escanero. 2010. Erythrocyte andreticulocyte indices on the LH 750 as potential markers of functionaliron deficiency. Anemia 2010:1–7. doi: 10.1155/2010/625919.
Urrechaga, E., L. Borque, and J. F. Escanero. 2013. Biomarkers ofhypochromia: The contemporary assessment of iron status anderythropoiesis. BioMed Research International 2013:603786–8. doi:10.1155/2013/603786.
Urrechaga, E., M. Unceta, L. Borque, and J. F. Escanero. 2012. Lowhemoglobin density potential marker of iron availability.International Journal of Laboratory Hematology 34 (1):47–51. doi:10.1111/j.1751-553X.2011.01355.x.
van den Broek, N. R., E. A. Letsky, S. A. White, and A. Shenkin. 1998.Iron status in pregnant women: Which measurements are valid?British Journal of Haematology 103 (3):817–24. doi: 10.1046/j.1365-2141.1998.01035.x.
CRITICAL REVIEWS IN FOOD SCIENCE AND NUTRITION 13

Viatte, L., and S. Vaulont. 2009. Hepcidin, the iron watcher. Biochimie91 (10):1223–8. doi: 10.1016/j.biochi.2009.06.012.
Vieth, J. T., and D. R. Lane. 2017. Anemia. Hematology/Oncology Clinicsof North America 31 (6):1045–60. doi: 10.1016/j.hoc.2017.08.008.
von Drygalski, A., and J. W. Adamson. 2013. Iron metabolism in man.JPEN. Journal of Parenteral and Enteral Nutrition 37 (5):599–606.doi: 10.1177/0148607112459648.
Ward, P. P., and O. M. Conneely. 2004. Lactoferrin: Role in ironhomeostasis and host defense against microbial infection. Biometals: An International Journal on the Role of Metal Ions in Biology,Biochemistry, and Medicine 17 (3):203–8. doi: 10.1023/B:BIOM.0000027693.60932.26.
WHO. 2001. Iron deficiency anaemia: assessment, prevention, and con-trol. Geneva, Switzerland.
WHO. 2011a. Haemoglobin concentrations for the diagnosis ofanaemia and assessment of severity. Geneva, Switzerland: WorldHealth Organization: 1–6.
WHO. 2011b. Serum ferritin concentrations for the assessment of ironstatus and iron deficiency in populations. Geneva, Switzerland.
WHO. 2015. The Global Prevalence of Anaemia in 2011. Geneva:World Health Organization.
Wong, C. 2017. Iron deficiency anaemia. Paediatrics and Child Health27 (11):527–9. doi: 10.1016/j.paed.2017.08.004.
Yildirim, D. G., Z. Kaya, and S. A. Bakkaloglu. 2019. Utility of new redcell parameters for distinguishing functional iron deficiency fromabsolute iron deficiency in children with familial mediterraneanfever. International Journal of Laboratory Hematology 41 (2):293–7.doi: 10.1111/ijlh.12971.
Zhang, S., Y. Chen, W. Guo, L. Yuan, D. Zhang, Y. Xu, E. Nemeth, T.Ganz, and S. Liu. 2014. Disordered hepcidin-ferroportin signalingpromotes breast cancer growth. Cellular Signalling 26 (11):2539–50.doi: 10.1016/j.cellsig.2014.07.029.
Zhou, S., X. Du, J. Xie, and J. Wang. 2017. Interleukin-6 regulatesiron-related proteins through c-Jun N-terminal kinase activation inBV2 microglial cell lines. PLoS ONE 12 (7):e0180464. doi: 10.1371/journal.pone.0180464.
Ziaei, S., M. Mehrnia, and S. Faghihzadeh. 2008. Iron status markers innonanemic pregnant women with and without iron supplementa-tion. International Journal of Gynecology & Obstetrics 100 (2):130–2.doi: 10.1016/j.ijgo.2007.07.027.
Zipperer, E., J. G. Post, M. Herkert, A. K€undgen, F. Fox, R. Haas, N.Gattermann, and U. Germing. 2013. Serum hepcidin measured withan improved ELISA correlates with parameters of iron metabolismin patients with myelodysplastic syndrome. Annals of Hematology 92(12):1617–23. doi: 10.1007/s00277-013-1839-5.
14 M. RESTREPO-GALLEGO ET AL.

Participo en
"Anemia: El modelo animal como herramienta para estudiar el efecto de la vitamina A sobre algunos parámetros hematológicos y marcadores del estado nutricional del hierro"
Mauricio Restrepo Gallego
XI Premio ACTA a la investigación
en ciencia y tecnología de
alimentos
VI Premio ACTA a la investigación
en inocuidad de alimentos
IV Premio ACTA/ACOFANUD a la
investigación en alimentación y
nutrición
V Premio ACTA a la contribución
de toda una vida en inocuidad
de alimentos
Bogotá, 14 de Junio de 2020 Investigadores: Mauricio Restrepo Gallego, Luis E. Díaz. Universidad de la Sabana. Estimados participantes, Con la presente le estamos confirmando que el Articulo del trabajo titulado: “Efecto de la deficiencia de vitamina A sobre las proteínas asociadas al almacenamiento y transporte del hierro en un modelo murino.”
Fue aceptado por el Comité Académico para participar en el IV Premio ACTA/ACOFANUD a la Investigación en alimentación y nutrición, en la modalidad de posgrado que se celebrará entre el 19 al 23 de octubre en Bogotá de manera Virtual, en el marco del XV Congreso Internacional de Ciencia y Tecnología de Alimentos -CONACTA 2020. De igual forma le recordamos que usted tiene derecho a exponer su trabajo en la sala de Investigaciones Universidades - Industria de CONACTA 2020 y presentación del poster en la Pagina web del congreso según las especificaciones disponibles en la página web https://conacta.org/premios
Le recordamos que para concursar por el Premio ACTA es indispensable estar inscrito en CONACTA 2020 Nos suscribimos de usted. Atentamente,
Jorge A. Cabrera L. Laura M. Serrato E.
Director Premios ACTA. Coordinadora Premios ACTA
Copyright © 2022 FDOKUMEN