Detection of Strong Millimeter Emission from the Circumstellar Dust Disk around V1094 Sco: Cold and...
18
arXiv:1011.0102v1 [astro-ph.SR] 30 Oct 2010 Detection of Strong Millimeter Emission from the Circumstellar Dust Disk Around V1094 Sco: Cold and Massive Disk around a T Tauri Star in a Quiescent Accretion Phase? Takashi TSUKAGOSHI 1 Masao SAITO 2 Yoshimi KITAMURA 3 Munetake MOMOSE 4 Yoshito SHIMAJIRI 5,6 Masaaki HIRAMATSU 7,8 Norio IKEDA 3 Kazuhisa KAMEGAI 3 Grant WILSON 9 Min S. YUN 9 Kimberly SCOTT 9 Jay AUSTERMANN 9 Thushara PERERA 9 David HUGHES 10 Itziar ARETXAGA 10 Philip MAUSKOPF 11 Hajime EZAWA 5 Kotaro KOHNO 1,12 and Ryohei KAWABE 5 ABSTRACT We present the discovery of a cold massive dust disk around the T Tauri star V1094 Sco in the Lupus molecular cloud from the 1.1 millimeter continuum observations with AzTEC on ASTE. A compact (r 320 AU) continuum emission coincides with the stellar position having a flux density of 272 mJy which is largest 1 Institute of Astronomy, Faculty of Science, University of Tokyo, Osawa2-21-1, Mitaka, Tokyo, 181-0015, Japan: [email protected] 2 National Astronomical Observatory of Japan, Osawa 2-21-1, Mitaka, Tokyo 181-8588, Japan 3 Institute of Space and Astronautical Science, Japan Aerospace Exploration Agency, Yoshinodai 3-1-1, Sagamihara, Kanagawa 229-8510, Japan 4 Institute of Astrophysics and Planetary Sciences, Ibaraki University, Bunkyo 2-1-1, Mito 310-8512, Japan 5 Nobeyama Radio Observatory, Nobeyama 462-2, Minamimaki, Minamisaku, Nagano 384-1305, Japan. Nobeyama Radio Observatory (NRO) is a branch of the National Astronomical Observatory of Japan (NAOJ) 6 Department of Astronomy, School of Science, University of Tokyo, Hongo 7-3-1, Bunkyo, Tokyo 113-0033, Japan 7 Academia Sinica Institute for Astronomy and Astrophysics, P.O. Box 23-141, Taipei 10617, Taiwan 8 Institute of Astronomy, National Tsing Hua University, 101 Section 2 Kuang Fu Road, Hsinchu 30013, Taiwan 9 Department of Astronomy, University of Massachusetts, Amherst, MA 01003 10 Instituto Nacional de Astrof´ ısica, ´ Optica y Electr´onica, Luis Enrique Erro #1, Tonantzintla, Puebla, M´ exico 11 Department of Physics and Astronomy, Cardiff University, Cardiff CF24 3YB, Wales, UK 12 Research Center for the Early Universe, School of Science, University of Tokyo, 7-3-1 Hongo, Bunkyo, Tokyo 113-0033, Japan
-
Upload
independent -
Category
Documents
-
view
0 -
download
0
Transcript of Detection of Strong Millimeter Emission from the Circumstellar Dust Disk around V1094 Sco: Cold and...
arX
iv:1
011.
0102
v1 [
astr
o-ph
.SR
] 3
0 O
ct 2
010
Detection of Strong Millimeter Emission from the Circumstellar
Dust Disk Around V1094 Sco: Cold and Massive Disk around a T
Tauri Star in a Quiescent Accretion Phase?
Takashi TSUKAGOSHI1 Masao SAITO2 Yoshimi KITAMURA3 Munetake MOMOSE4
Yoshito SHIMAJIRI5,6 Masaaki HIRAMATSU7,8 Norio IKEDA3 Kazuhisa KAMEGAI3
Grant WILSON9 Min S. YUN9 Kimberly SCOTT9 Jay AUSTERMANN9 Thushara
PERERA9 David HUGHES10 Itziar ARETXAGA10 Philip MAUSKOPF11 Hajime
EZAWA5 Kotaro KOHNO1,12 and Ryohei KAWABE5
ABSTRACT
We present the discovery of a cold massive dust disk around the T Tauri
star V1094 Sco in the Lupus molecular cloud from the 1.1 millimeter continuum
observations with AzTEC on ASTE. A compact (r .320 AU) continuum emission
coincides with the stellar position having a flux density of 272 mJy which is largest
1Institute of Astronomy, Faculty of Science, University of Tokyo, Osawa 2-21-1, Mitaka, Tokyo, 181-0015,
Japan: [email protected]
2National Astronomical Observatory of Japan, Osawa 2-21-1, Mitaka, Tokyo 181-8588, Japan
3Institute of Space and Astronautical Science, Japan Aerospace Exploration Agency, Yoshinodai 3-1-1,
Sagamihara, Kanagawa 229-8510, Japan
4Institute of Astrophysics and Planetary Sciences, Ibaraki University, Bunkyo 2-1-1, Mito 310-8512, Japan
5Nobeyama Radio Observatory, Nobeyama 462-2, Minamimaki, Minamisaku, Nagano 384-1305, Japan.
Nobeyama Radio Observatory (NRO) is a branch of the National Astronomical Observatory of Japan (NAOJ)
6Department of Astronomy, School of Science, University of Tokyo, Hongo 7-3-1, Bunkyo, Tokyo 113-0033,
Japan
7Academia Sinica Institute for Astronomy and Astrophysics, P.O. Box 23-141, Taipei 10617, Taiwan
8Institute of Astronomy, National Tsing Hua University, 101 Section 2 Kuang Fu Road, Hsinchu 30013,
Taiwan
9Department of Astronomy, University of Massachusetts, Amherst, MA 01003
10Instituto Nacional de Astrofısica, Optica y Electronica, Luis Enrique Erro #1, Tonantzintla, Puebla,
Mexico
11Department of Physics and Astronomy, Cardiff University, Cardiff CF24 3YB, Wales, UK
12Research Center for the Early Universe, School of Science, University of Tokyo, 7-3-1 Hongo, Bunkyo,
Tokyo 113-0033, Japan
– 2 –
among T Tauri stars in Lupus. We also present the detection of molecular gas
associated with the star in the five-point observations in 12CO J=3–2 and 13CO
J=3–2. Since our 12CO and 13CO observations did not show any signature of a
large-scale outflow or a massive envelope, the compact dust emission is likely to
come from a disk around the star. The observed SED of V1094 Sco shows no
distinct turnover from near infrared to millimeter wavelengths, which can be well
described by a flattened disk for the dust component, and no clear dip feature
around 10 µm suggestive of absence of an inner hole in the disk. We fit a simple
power-law disk model to the observed SED. The estimated disk mass ranges from
0.03 to &0.12M⊙, which is one or two orders of magnitude larger than the median
disk mass of T Tauri stars in Taurus. The resultant temperature is lower than
that of a flared disk with the well-mixed dust in hydrostatic equilibrium, and is
probably attributed to the flattened disk geometry for the dust which the central
star can not illuminate efficiently. From these results together with the fact
that there is no signature of an inner hole in the SED, we suggest that the dust
grains in the disk around V1094 Sco sank into the midplane with grain growth
by coalescence and is in the evolutional stage just prior to or at the formation of
planetesimals.
Subject headings: stars: circumstellar matter — stars: individual(V1094 Sco —
solar system: formation
1. Introduction
Protoplanetary disk around pre-main sequence stars are potential sites for planet for-
mation. In the standard model (e.g. Hayashi et al. 1985), after settling into equilibrium, the
gas and solid components in the disk are separated and dust grains begin sinking to the mid-
plane to form a thin dust layer which eventually fragments into planetesimals, ingredients of
planets. The radial profile of the surface density structure at this stage is likely one of the
most important parameters to control what kinds of planets form in the disk (Kokubo & Ida
2002).
Since the gas and dust are well mixed in the beginning, the grain growth and sedimen-
tation are key processes to separate dust from gas. Theoretical studies have suggested that
dust grains are removed from the flaring surface and will sink to the midplane with growing
by coalescence along the disk evolution (Dullemond & Dominik 2004; Tanaka et al. 2005).
One way to find such evolved disks is to carefully examine the Spectral Energy Distribution
(SED) of young stars as well as detection of (sub)millimeter continuum emission, because
– 3 –
the shape of the SED of young stars is sensitive to its temperature structure mainly deter-
mined by the vertical distribution of dust grains (Chiang & Goldreich 1997). Tanaka et al.
(2005) studied the dust growth and settling in passive disks to investigate the evolution of
disk structure and SEDs. Their numerical results indicated that the flux densities at mid-
infrared (MIR) from a disk get lower as a result of dust grain growth and settling from the
surface layer.
In the last two decades, extensive observations from optical to millimeter wavelengths
have been conducted to study disk properties ultimately determining the nature of forming
planets. Pre-main sequence stars, particularly in the quiescent phase such as weak line T
Tauri stars (WTTSs) or Class III stars are good candidates for searching such evolved dusty
disks in the process of sedimentation. A pioneer survey in (sub)millimeter continuum emis-
sion of the circumstellar dust around young stars was conducted by Beckwith et al. (1990)
and followed by many other groups (Andre & Montmerle 1994; Osterloh & Beckwith 1995;
Nuernberger et al. 1997; Kitamura et al. 2002; Andrews & Williams 2005, 2007). Kitamura et al.
(2002) made an imaging survey of single T Tauri stars in Taurus and derived the physical
properties of the disks combined with the SEDs. They found the radial expansion of the
disks attributed to outward transport of angular momentum with decreasing Hα line lumi-
nosity, a measure of disk evolution. Andrews & Williams (2005) made a large survey of disk
emission of more than 100 young stars in Taurus and found that there is a distinct difference
in detection rates between classical T Tauri star (CTTS; 90%) and WTTS (15±5%). No
massive evolved disk around WTTS, however, was found.
In the present paper, we report the discovery of an unusual cold massive disk around
the T Tauri star, V1094 Sco, at the southern tip of Lupus 3 at a distance of 150 pc. The
source has a quiescent accretion disk presumably in the transient stage from CTTS to WTTS
because its equivalent width of Hα ranged 7–14 A (Krautter et al. 1997; Wichmann et al.
1999). V1094 Sco is known as a single star whose spectral type, mass, and age are K6, 0.78
M⊙, and 3 Myr, respectively (Wichmann et al. 1997).
2. Observations
Our observations have been performed with the Atacama Submillimeter Telescope Ex-
periment (ASTE), the 10 m submillimeter telescope operated by Nobeyama Radio Observa-
tory (NRO), a branch of National Astronomical Observatory Japan (NAOJ), in collaboration
with University of Chile, and Japanese institutes including University of Tokyo, Nagoya Uni-
versity, Osaka Prefecture University, Ibaraki University, and Hokkaido University. The tele-
scope is located at Pampa la Bola, Chile, an altitude of 4860m, and is remotely operated from
– 4 –
the ASTE operation facilities in Chile and Japan through the network observation system
N-COSMOS3 (Kamazaki et al. 2005). We employed two receivers, AzTEC 1.1 mm camera
(Wilson et al. 2008) and CATS345 receiver (Inoue et al. 2008), for millimeter continuum
observations and molecular line observations at submillimeter wavelengths, respectively.
2.1. Millimeter Continuum Observations with AzTEC
AzTEC is a 144-element bolometer array camera installed on the ASTE between April
2007 and December 2008 (Wilson et al. 2008). In this period, the array was configured to
operate at a wavelength of 1.1 mm. The angular resolution and field of view of AzTEC on
ASTE were 28′′and 7.′8, respectively.
We have made wide-field (40′×40′) millimeter continuum observations of the Lupus 3
molecular cloud including the target, V1094 Sco, in July 2007. The individual on-the-fly
maps were obtained in the raster-scan mode with a scanning velocity of 100′′ s−1. The
telescope was scanned along the AZ-EL coordinates with a spacing of 1.′95, a quarter of
the field of view. All the data were taken at night or early morning and the average 270
GHz radiometric opacity at zenith was ∼ 0.05 during the observation period. Telescope
pointing was checked by mapping the quasar J1517-243 every one and half, or two hours.
The pointing corrections are applied during the data analysis. The flux conversion factor
from optimal loading to source flux density of the AzTEC array was calibrated by observing
Uranus, Neptune, or 3C279 every night.
The AzTEC data set was reduced by using the AzTEC Data Reduction Pipeline (Scott et al.
2008) for the identification of point sources. Following Scott et al. (2008), we employed the
Principle Component Analysis (PCA) cleaning method to remove the atmospheric emission.
The pixel size of the final map was set to be 3′′, 10 % of AzTEC beam size. The noise level
and effective resolution of the final map are 5.0 mJy beam−1 and 35′′, respectively.
2.2. Sub-Millimeter Molecular Line Observations with CATS345
12CO and 13CO J=3–2 line observations were performed in March 2008 with a 2 sideband-
separating (2SB) receiver, CATS345, on ASTE. The half power beam widths (HPBWs) at
345.79 and 330.59 GHz were 22′′ and 23′′, respectively, which corresponds to 3300 and 3450
AU at the distance to the target. The main beam efficiency was about 60 % around these
frequencies. The system noise temperatures were typically 400 and 350 K for 12CO and13CO, respectively. For the backend, we used a 1024 channel digital auto-correlator, which

– 5 –
has a band width of 128 MHz and a resolution of 125 kHz, corresponding to 111 and 0.11
km s−1, respectively, at 345 GHz. The telescope pointing calibration was performed every
1.5-2 hours by observing CRL 4211, and the resulting pointing accuracy was typically 3′′.
For the absolute flux calibration, the integrated intensities of M17 SW and IRC 10216 were
measured two or three times per day and compared with those by Wang et al. (1994). Data
reduction and analysis were made with the NEWSTAR software package developed in NRO,
which is a frontend of the Astronomical Image Processing System (AIPS) developed in the
National Radio Astronomy Observatory (NRAO).
We employed the five-point observation method in which spectra are obtained not only
at a stellar position but also at four adjacent points 22′′ apart from the stellar position in
the R.A. or Dec. direction. This method enables us to deduce the excess emission toward
the central star by subtracting the average spectrum of the surrounding four spectra from
the central spectrum, even if the star is located in extended components, such as an ambient
cloud.
3. Results of the Continuum Observations
The 1.1 mm continuum map around V1094 Sco is shown in Figure 1a. Strong compact
continuum emission was detected towards the stellar position. From the 2-d Gaussian fitting,
the peak position of the emission is obtained to be 16h08m36.s1, −39◦23′1.′′6 in J2000, which
agrees well with the 2MASS position of V1094 Sco within 1.′′5. The total flux density at
1.1 mm was measured to be 272.1±7.6 mJy from the deconvolved cleaned map (see below),
which is one of the strongest 1.1 mm emission among T Tauri stars in the Lupus molecular
cloud. The negative contours around the emission are due to a point spread function (i.e., a
beam; see Figure 1c) with a negative hole generated from the PCA cleaning method.
Figure 1b shows a deconvolved map by subtracting the measured point spread function
(PSF) from the emission via the clean algorithm. The PSF of the AzTEC map for V1094 Sco
is shown in Figure 1c. From the deconvolved map, we found that the emission is composed
largely of a spatially unresolved component. The derived clean components are located
around the star over two pixels (3′′ ×√2 ∼ 4.′′2 in size) with its separation comparable to
the pointing uncertainty estimated from the pointing measurements (Figure 1b). Therefore,
we consider that the strong millimeter emission comes from a compact (r ≤ 4.′′2/2 = 320
AU) circumstellar dusty disk associated with V1094 Sco. This is supported by the fact that,
unlike the case of a stellar type flare seen in WTTS (Gudel 2002), V1094 Sco did not show
any time variation of the flux density at millimeter wavelengths during the observing period.
– 6 –
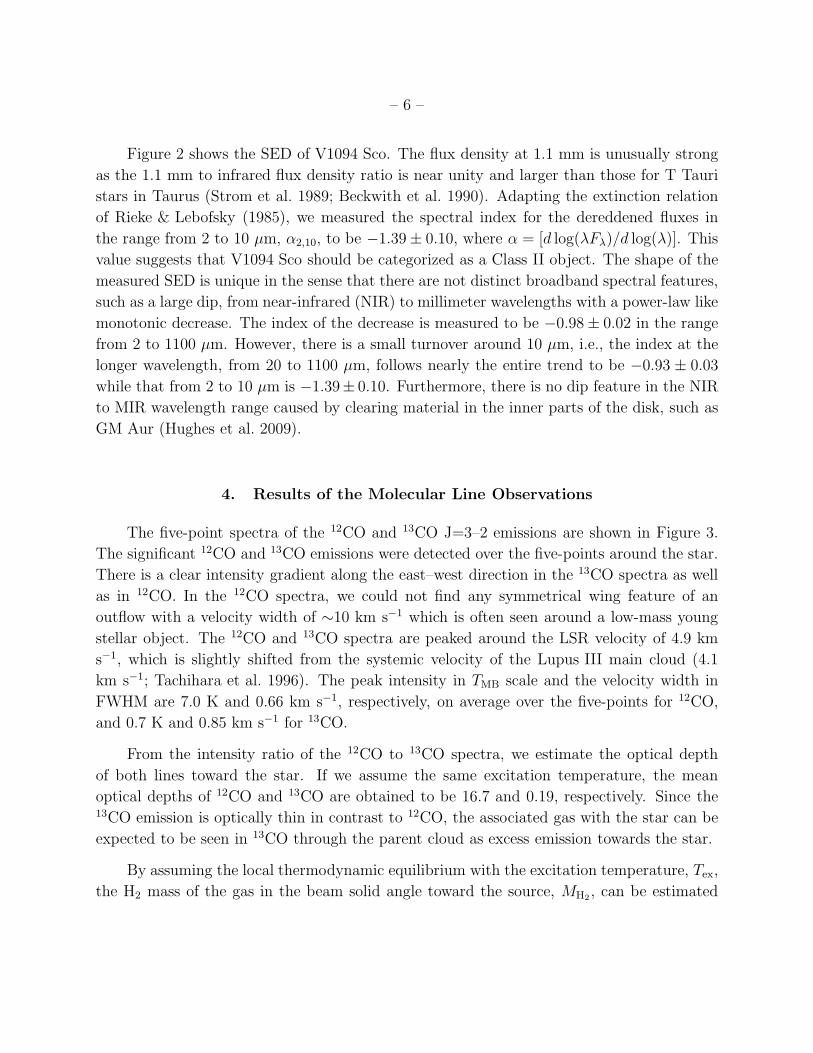
Figure 2 shows the SED of V1094 Sco. The flux density at 1.1 mm is unusually strong
as the 1.1 mm to infrared flux density ratio is near unity and larger than those for T Tauri
stars in Taurus (Strom et al. 1989; Beckwith et al. 1990). Adapting the extinction relation
of Rieke & Lebofsky (1985), we measured the spectral index for the dereddened fluxes in
the range from 2 to 10 µm, α2,10, to be −1.39± 0.10, where α = [d log(λFλ)/d log(λ)]. This
value suggests that V1094 Sco should be categorized as a Class II object. The shape of the
measured SED is unique in the sense that there are not distinct broadband spectral features,
such as a large dip, from near-infrared (NIR) to millimeter wavelengths with a power-law like
monotonic decrease. The index of the decrease is measured to be −0.98± 0.02 in the range
from 2 to 1100 µm. However, there is a small turnover around 10 µm, i.e., the index at the
longer wavelength, from 20 to 1100 µm, follows nearly the entire trend to be −0.93 ± 0.03
while that from 2 to 10 µm is −1.39± 0.10. Furthermore, there is no dip feature in the NIR
to MIR wavelength range caused by clearing material in the inner parts of the disk, such as
GM Aur (Hughes et al. 2009).
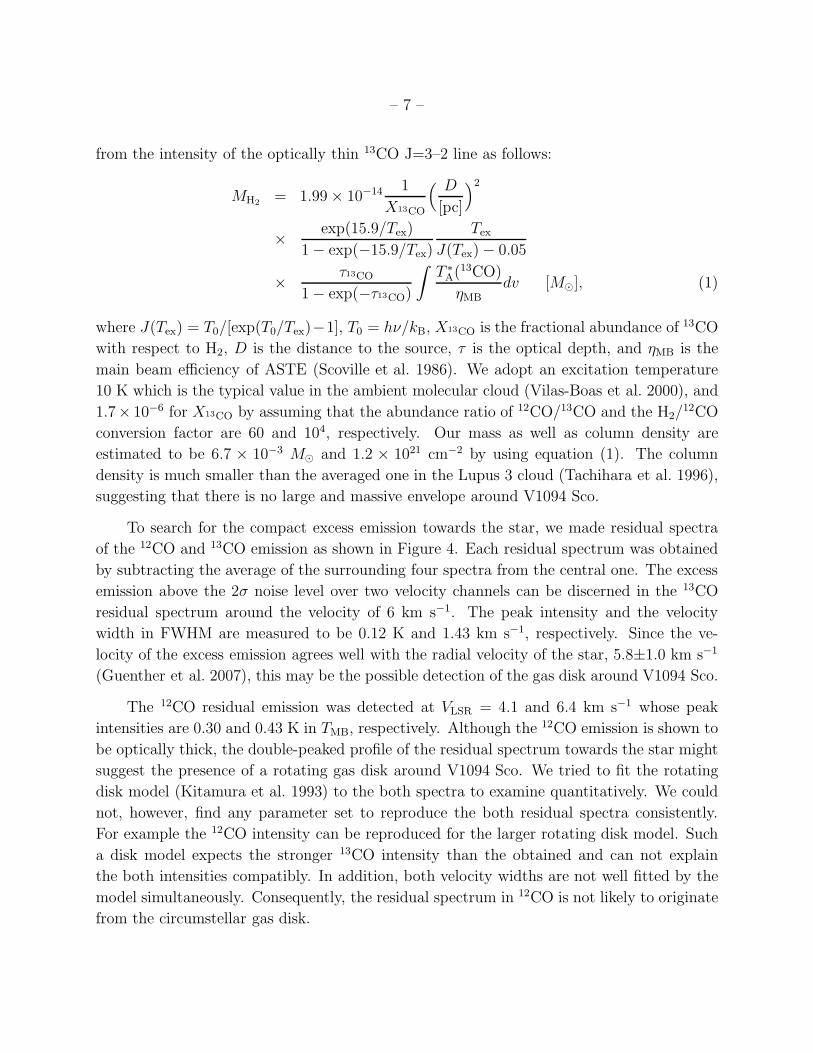
4. Results of the Molecular Line Observations
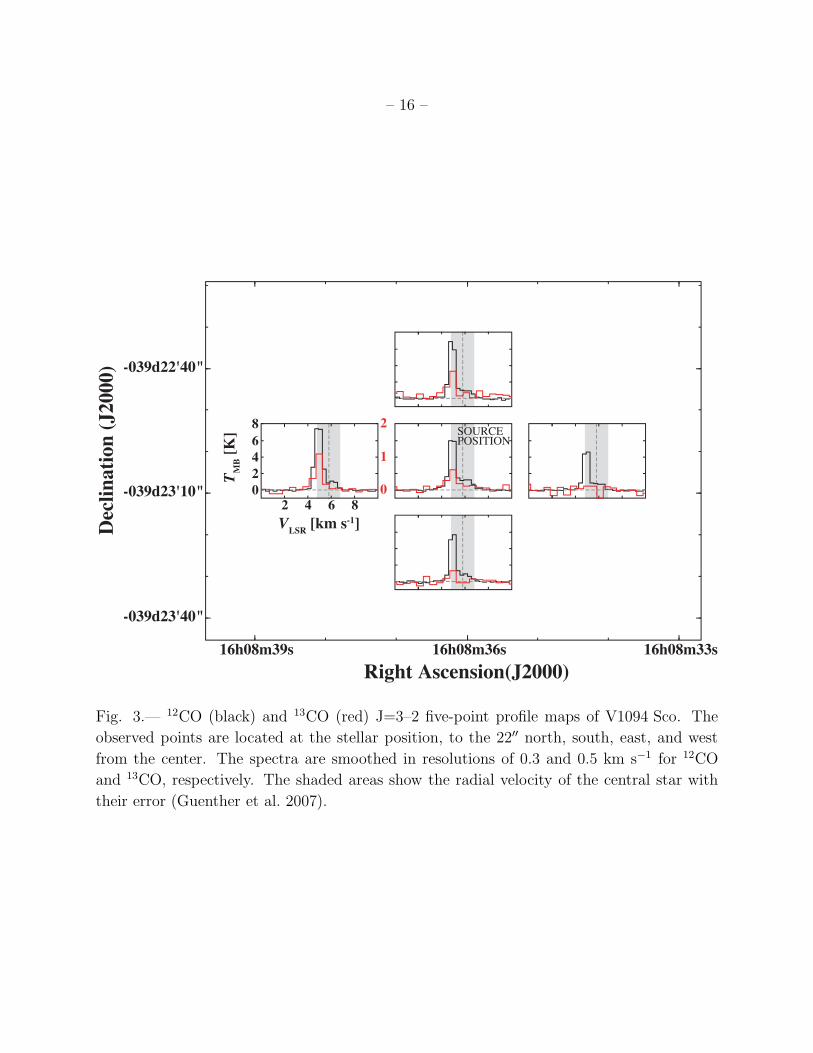
The five-point spectra of the 12CO and 13CO J=3–2 emissions are shown in Figure 3.
The significant 12CO and 13CO emissions were detected over the five-points around the star.
There is a clear intensity gradient along the east–west direction in the 13CO spectra as well
as in 12CO. In the 12CO spectra, we could not find any symmetrical wing feature of an
outflow with a velocity width of ∼10 km s−1 which is often seen around a low-mass young
stellar object. The 12CO and 13CO spectra are peaked around the LSR velocity of 4.9 km
s−1, which is slightly shifted from the systemic velocity of the Lupus III main cloud (4.1
km s−1; Tachihara et al. 1996). The peak intensity in TMB scale and the velocity width in
FWHM are 7.0 K and 0.66 km s−1, respectively, on average over the five-points for 12CO,
and 0.7 K and 0.85 km s−1 for 13CO.
From the intensity ratio of the 12CO to 13CO spectra, we estimate the optical depth
of both lines toward the star. If we assume the same excitation temperature, the mean
optical depths of 12CO and 13CO are obtained to be 16.7 and 0.19, respectively. Since the13CO emission is optically thin in contrast to 12CO, the associated gas with the star can be
expected to be seen in 13CO through the parent cloud as excess emission towards the star.
By assuming the local thermodynamic equilibrium with the excitation temperature, Tex,
the H2 mass of the gas in the beam solid angle toward the source, MH2, can be estimated
– 7 –
from the intensity of the optically thin 13CO J=3–2 line as follows:
MH2= 1.99× 10⁻¹⁴
1
X13CO
( D
[pc]
)2
×exp(15.9/Tex)
1− exp(−15.9/Tex)
Tex
J(Tex)− 0.05
×τ13CO
1− exp(−τ13CO)
∫
T ∗
A(13CO)
ηMB
dv [M⊙], (1)
where J(Tex) = T0/[exp(T0/Tex)−1], T0 = hν/kB, X13CO is the fractional abundance of 13CO
with respect to H2, D is the distance to the source, τ is the optical depth, and ηMB is the
main beam efficiency of ASTE (Scoville et al. 1986). We adopt an excitation temperature
10 K which is the typical value in the ambient molecular cloud (Vilas-Boas et al. 2000), and
1.7× 10−6 for X13CO by assuming that the abundance ratio of 12CO/13CO and the H2/12CO
conversion factor are 60 and 104, respectively. Our mass as well as column density are
estimated to be 6.7 × 10⁻³ M⊙ and 1.2 × 1021 cm−2 by using equation (1). The column
density is much smaller than the averaged one in the Lupus 3 cloud (Tachihara et al. 1996),
suggesting that there is no large and massive envelope around V1094 Sco.
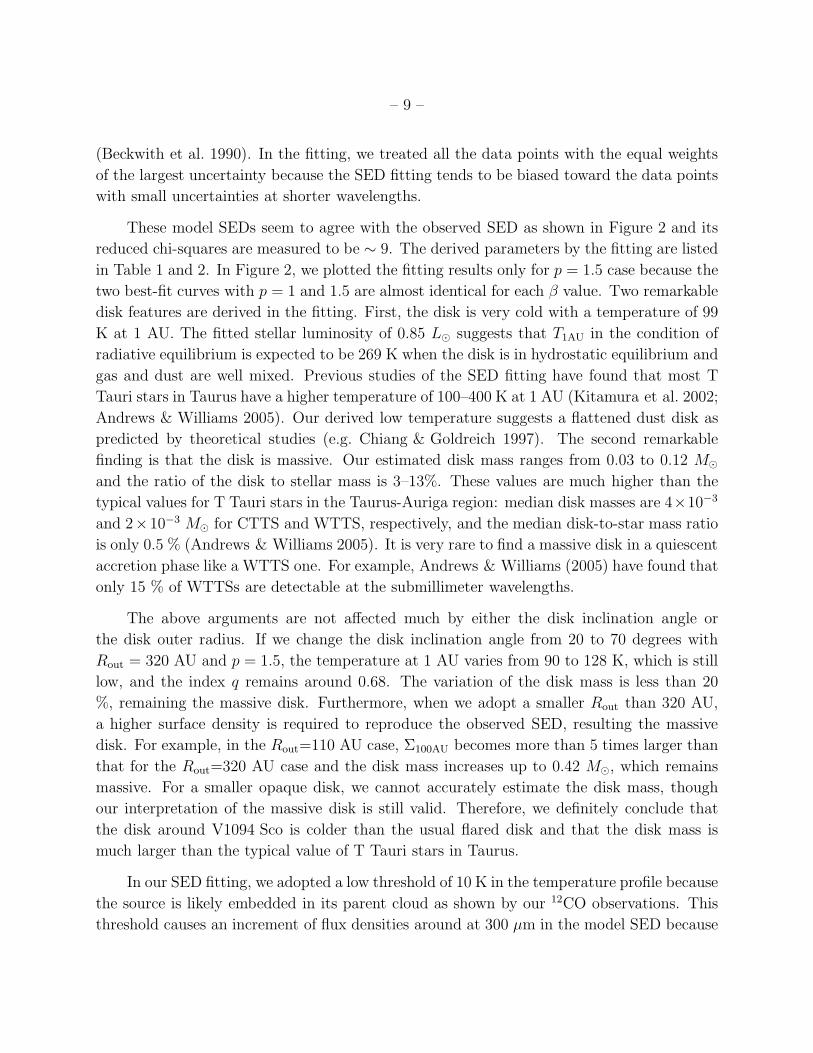
To search for the compact excess emission towards the star, we made residual spectra
of the 12CO and 13CO emission as shown in Figure 4. Each residual spectrum was obtained
by subtracting the average of the surrounding four spectra from the central one. The excess
emission above the 2σ noise level over two velocity channels can be discerned in the 13CO
residual spectrum around the velocity of 6 km s−1. The peak intensity and the velocity
width in FWHM are measured to be 0.12 K and 1.43 km s−1, respectively. Since the ve-
locity of the excess emission agrees well with the radial velocity of the star, 5.8±1.0 km s−1
(Guenther et al. 2007), this may be the possible detection of the gas disk around V1094 Sco.
The 12CO residual emission was detected at VLSR = 4.1 and 6.4 km s−1 whose peak
intensities are 0.30 and 0.43 K in TMB, respectively. Although the 12CO emission is shown to
be optically thick, the double-peaked profile of the residual spectrum towards the star might
suggest the presence of a rotating gas disk around V1094 Sco. We tried to fit the rotating
disk model (Kitamura et al. 1993) to the both spectra to examine quantitatively. We could
not, however, find any parameter set to reproduce the both residual spectra consistently.
For example the 12CO intensity can be reproduced for the larger rotating disk model. Such
a disk model expects the stronger 13CO intensity than the obtained and can not explain
the both intensities compatibly. In addition, both velocity widths are not well fitted by the
model simultaneously. Consequently, the residual spectrum in 12CO is not likely to originate
from the circumstellar gas disk.
– 8 –
5. Discussion
5.1. Analysis of Spectral Energy Distribution
The measured SED of V1094 Sco has the unique feature: there is no significant turnover
and a monotonic decrease from NIR to millimeter. This feature is well described by a flat-
tened disk for the dust component. According to Chiang & Goldreich (1997), the flattened
disk has a lower temperature than that of a flared disk with the well-mixed dust because
the central star can not illuminate the flattened disk efficiently. In this case, the SED is
predicted to have an asymptotic power-law slope with an index of n = 4/3 from 30 µm to
1 mm. The MIR to millimeter continuum radiation mainly comes from the optically thick
interior of the disk. On the other hand, the SED of a flared disk rises in the MIR to far-
infrared (FIR) regime owing to the strong emission from a hot surface layer and gradually
falls down toward the millimeter regime, mainly tracing the cooler interior.
To deduce disk parameters, we performed the least square fitting to the SED of V1094 Sco
using a simple power-law disk model (same as model 1 case in Kitamura et al. 2002). Our
disk model is assumed to have a power-law form of the surface density and temperature
variations over the entire area of the disk, Σ(r) and T (r), respectively:
Σ(r) = Σ100AU
(
r
[100AU]
)−p
(2)
and
T (r) = T1AU
(
r
[1AU]
)−q
. (3)
Here, r is the radial distance in units of AU, Σ100AU is the surface density at 100 AU, and
T1AU is the temperature at 1 AU. We applied the model to the data without the extinction
correction because it was corrected in the model by calculating the mass opacity at each
frequency from Av with the extinction curve (figure 1 of Adams et al. 1988). The lower limit
of the temperature is fixed at 10 K which is the typical temperature of the Lupus 3 cloud
(Vilas-Boas et al. 2000). We adopt the effective temperature of the star of 4255 K, the stellar
mass of 0.78 M⊙ and the visual extinction toward the star of 1.75 mag (Wichmann et al.
1997). The outer radius of the disk, Rout, and the disk inclination angle, i, are fixed to be
320 AU and 45 degree, respectively. The outer radius is derived from the pixel size of 3′′
as an upper limit because the emission was not spatially resolved. Stellar radius, R∗, inner
radius of the disk, Rin, T1AU, q and Σ100AU are the free parameters of the disk model. The
model SEDs are computed and fitted to the observational data for the following four cases:
p = 1 and 1.5 (minimum mass solar nebula by Hayashi et al. 1985) and β = 0 and 1, where
β is the power-law index of the dust mass opacity coefficient, κν = 0.1 × ( ν1012Hz
)β cm2 g−1
– 9 –
(Beckwith et al. 1990). In the fitting, we treated all the data points with the equal weights
of the largest uncertainty because the SED fitting tends to be biased toward the data points
with small uncertainties at shorter wavelengths.
These model SEDs seem to agree with the observed SED as shown in Figure 2 and its
reduced chi-squares are measured to be ∼ 9. The derived parameters by the fitting are listed
in Table 1 and 2. In Figure 2, we plotted the fitting results only for p = 1.5 case because the
two best-fit curves with p = 1 and 1.5 are almost identical for each β value. Two remarkable
disk features are derived in the fitting. First, the disk is very cold with a temperature of 99
K at 1 AU. The fitted stellar luminosity of 0.85 L⊙ suggests that T1AU in the condition of
radiative equilibrium is expected to be 269 K when the disk is in hydrostatic equilibrium and
gas and dust are well mixed. Previous studies of the SED fitting have found that most T
Tauri stars in Taurus have a higher temperature of 100–400 K at 1 AU (Kitamura et al. 2002;
Andrews & Williams 2005). Our derived low temperature suggests a flattened dust disk as
predicted by theoretical studies (e.g. Chiang & Goldreich 1997). The second remarkable
finding is that the disk is massive. Our estimated disk mass ranges from 0.03 to 0.12 M⊙
and the ratio of the disk to stellar mass is 3–13%. These values are much higher than the
typical values for T Tauri stars in the Taurus-Auriga region: median disk masses are 4×10⁻³
and 2×10⁻³ M⊙ for CTTS and WTTS, respectively, and the median disk-to-star mass ratio
is only 0.5 % (Andrews & Williams 2005). It is very rare to find a massive disk in a quiescent
accretion phase like a WTTS one. For example, Andrews & Williams (2005) have found that
only 15 % of WTTSs are detectable at the submillimeter wavelengths.
The above arguments are not affected much by either the disk inclination angle or
the disk outer radius. If we change the disk inclination angle from 20 to 70 degrees with
Rout = 320 AU and p = 1.5, the temperature at 1 AU varies from 90 to 128 K, which is still
low, and the index q remains around 0.68. The variation of the disk mass is less than 20
%, remaining the massive disk. Furthermore, when we adopt a smaller Rout than 320 AU,
a higher surface density is required to reproduce the observed SED, resulting the massive
disk. For example, in the Rout=110 AU case, Σ100AU becomes more than 5 times larger than
that for the Rout=320 AU case and the disk mass increases up to 0.42 M⊙, which remains
massive. For a smaller opaque disk, we cannot accurately estimate the disk mass, though
our interpretation of the massive disk is still valid. Therefore, we definitely conclude that
the disk around V1094 Sco is colder than the usual flared disk and that the disk mass is
much larger than the typical value of T Tauri stars in Taurus.
In our SED fitting, we adopted a low threshold of 10 K in the temperature profile because
the source is likely embedded in its parent cloud as shown by our 12CO observations. This
threshold causes an increment of flux densities around at 300 µm in the model SED because
– 10 –
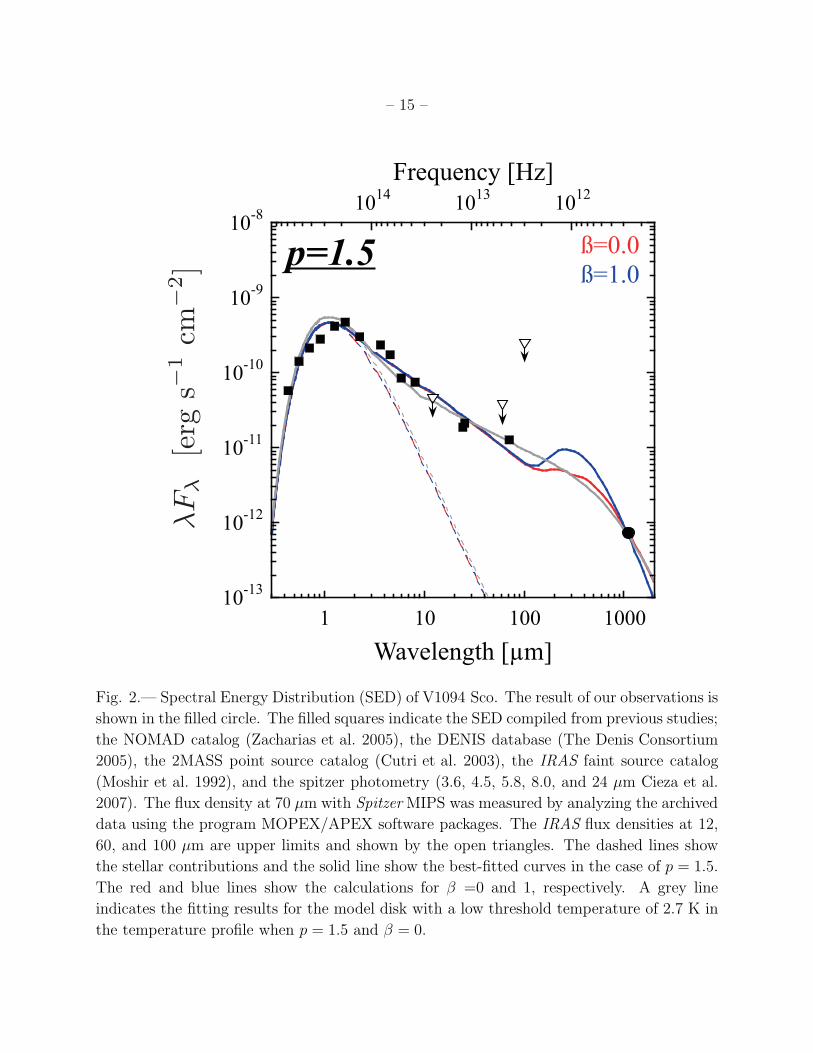
the temperature of 10 K corresponds to 290 µm by Wien’s law (see Figure 2). To investigate
the effect of the temperature threshold, we also analyzed the SED by using a disk model with
a threshold of 2.7 K, the temperature for the cosmic background radiation. In this case, the
observed SED can be well fitted only when the disk inclination angle is less than 30 degree.
The fitted SED for p = 1.5 and β = 0.0 case is shown by a gray line in Figure 2; the best-fit
curve can also explain the observed SED, and the disk mass becomes four times larger than
that in the 10 K threshold case. Note that such a massive disk relative to the stellar mass
is likely to be gravitationally unstable. On the other hand, T1AU and q decrease only by 2 %
and 11 %, respectively. Consequently, the threshold in the temperature profile of the disk
model does not change our interpretation of a cold massive disk around V1094 Sco.
5.2. Rare Object to Provide the Initial Conditions of Planet Formation
The cold and massive disk we found around V1094 Sco strongly suggests the presence of
a flattened disk where a large number of small dust grains are settling. Since V1094 Sco seems
to be in the quiescent phase of disk accretion, the majority of dust particles are expected
to just settle into the midplane with dust growth through coalescence. Theoretically, the
thin dust layer in the midplane fragments into numerous planetesimals by its gravitational
instability, and as a result, a hole appears at the inner part of the disk to produce a dip
feature at ∼ 10 µm in SED. However, we could not find such a feature at the IR wavelengths
in the SED of V1094 Sco, indicating that there is no inner hole created by the formation of
planetesimals. Indeed, the strong continuum emission toward V1094 Sco that we detected
suggests that a large number of small particles rather than larger planetesimals with sizes
of ∼ 10 km is the dominant component in the circumstellar disk. Consequently, the disk
around V1094 Sco is most likely in the quiescent stage after the dust sedimentation in the
midplane, but just prior to the planetesimal formation.
V1094 Sco is a rare object in terms of the shape of its SED. To find a similar object with
a massive cold disk to V1094 Sco, we checked the available photometric data at the MIR and
millimeter wavelengths (Strom et al. 1989; Beckwith et al. 1990) and measured the flux ratio
of MIR flux to millimeter flux. We found that only CY Tau, a Class II CTTS in Taurus, has
a high intensity ratio of the 1 mm to 70 µm as well as to 25 µm (> 0.5), suggesting the strong
millimeter flux despite its weak MIR flux and the SED with a monotonic slope from MIR to
millimeter. The temperature at 1 AU and the disk mass of CY Tau are estimated to be 87 K
and 0.13 M⊙, respectively (Kitamura et al. 2002). We can roughly estimate the timescale for
the duration of a cold and massive disk like those around V1094 Sco and CY Tau as follows.
Given about 30 samples in Taurus whose flux densities at 1 mm and MIR were previously

– 11 –
determined, the timescale of the cold massive disk is estimated to be at least one order of
magnitude shorter than the typical age of a T Tauri star (∼ 1 × 10⁶−7 yr), if we assume
that new stars randomly form with a constant rate. Such a short timescale is consistent
with the gravitational instability of the thin dust layer after the dust sedimentation at the
midplane. It is suggested that the dust layer produced by settling to the equatorial plane
becomes gravitationally unstable and rapidly fragments into numerous planetesimal (≪105
yrs; Dominik et al. 2007).
It is very interesting that the physical properties of such a quiescent disk provide the
initial conditions of the successive formation of planets (e.g. Kokubo & Ida 2002). In partic-
ular, it is crucial to reveal the radial variation of the disk surface density with high-resolution
and high-sensitive observations in future. For the dust coagulation, it is theoretically ex-
pected that the index of the dust opacity coefficient, β, is lower than unity as a result of
dust growth (Miyake & Nakagawa 1993). We treated β as fixed parameter in the SED fitting
because the photometric data at the millimeter and sub-millimeter wavelengths are limited.
More (sub-)millimeter data are required to determine the β value accurately. Additionally,
high-resolution molecular line observations will reveal the disk kinematics and the initial
conditions of the planet forming disk more quantitatively.
6. Summary
We have detected the strong 1.1 mm continuum emission toward the T Tauri star,
V1094 Sco, in the Lupus molecular cloud with AzTEC on ASTE. In addition, we have
obtained the 12CO and 13CO J=3–2 spectra at the five positions around the source. The
main results of our observations are summarized in the following.
• Significant continuum emission was detected just toward the stellar position. The
emission is not spatially resolved with the effective ASTE beam size of 35′′, indicating
that a dust disk is associated with the star. The total flux density is 272 mJy at 1.1
mm which is the strongest among T Tauri stars in the Lupus molecular cloud.
• The 12CO and 13CO emissions were detected over the five-points around the star. The
five-points spectra show no signature of a large-scale molecular outflow or a massive
envelope. We made residual spectra by subtracting the average spectrum of the sur-
rounding four spectra from the central spectra. The 12CO excess emission was found
and the 13CO one was marginally discerned towards the star. The 13CO excess may
come from the gas disk while the 12CO excess emission detected can not be explained
by the gas disk.
– 12 –
• The observed SED shows two prominent features. First, there is no significant turnover
with a constant slope from NIR to millimeter which is well reproduced by a flattened
disk. Second, there is no signature of a dip at around 10 µm suggesting no inner hole
in the disk.
• We fit a power-law disk model to the SED when p is fixed to be 1.0 and 1.5, and β
is 0.0 and 1.0. The best fit parameters of the disk are Σ100AU =(1.25–4.97) g cm−2,
T1AU =99 K, q = 0.68, and Mdisk =(0.03–0.12) M⊙. The disk temperature at 1 AU
is lower than that of a flared disk in hydrostatic equilibrium. The disk mass is much
higher than the typical values for T Tauri stars.
• The cold and massive disk around V1094 Sco can be well interpreted as a partially
settled disk of a large number of small dust grains. Together with no signature of an
inner hole in the SED, it is most likely that the disk is in the quiescent phase after the
dust sedimentation in the midplane, but just prior to the planetesimal formation. The
V1094 Sco may be a rare sample to investigate the initial conditions for the formation
of a planetary system.
We appreciate the referee for the constructive comments that have helped to improve this
manuscript. We acknowledge the ASTE and AzTEC staff for the operation and maintenance
of the observing instruments. We are grateful to S. Komugi, T. Minamidani, and K. Fukue
for testing the data reduction software. We thank N. Ukita, B. Hatsukade, and S. Ikarashi
for the pointing model correction of AzTEC on ASTE. Observations with ASTE were in part
carried out remotely from Japan by using NTT’s GEMnet2 and its partner R&E (Research
and Education) networks, which are based on AccessNova collaboration of University of
Chile, NTT Laboratories, and NAOJ. This work is supported in part by a Grant-in-Aid
for Scientific Research (A) from the Ministry of Education, Culture, Sports, Science and
Technology of Japan (No. 19204020) and by JSPS (No. 18204017).

– 13 –
REFERENCES
Adams, F. C., Shu, F. H., & Lada, C. J. 1988, ApJ, 326, 865
Andre, P., & Montmerle, T. 1994, ApJ, 420, 837
Andrews, S. M., & Williams, J. P. 2005, ApJ, 631, 1134
Andrews, S. M., & Williams, J. P. 2007, ApJ, 671, 1800
Beckwith, S. V. W., Sargent, A. I., Chini, R. S., & Guesten, R. 1990, AJ, 99, 924
Chiang, E. I., & Goldreich, P. 1997, ApJ, 490, 368
Cieza, L., et al. 2007, ApJ, 667, 308
Cutri, R. M., et al. 2003, The IRSA 2MASS All-Sky Point Source Catalog, NASA/IPAC
Infrared Science Archive. http://irsa.ipac.caltech.edu/applications/Gator/,
The Denis Consortium 2005, VizieR Online Data Catalog, 1, 2002
Dominik, C., Blum, J., Cuzzi, J. N., & Wurm, G. 2007, Protostars and Planets V, 783
Dullemond, C. P., & Dominik, C. 2004, A&A, 421, 1075
Gudel, M. 2002, ARA&A, 40, 217
Guenther, E. W., Esposito, M., Mundt, R., Covino, E., Alcala, J. M., Cusano, F., & Steck-
lum, B. 2007, A&A, 467, 1147
Hayashi, C., Nakazawa, K., & Nakagawa, Y. 1985, Protostars and Planets II, 1100
Hughes, A. M., et al. 2009, ApJ, 698, 131
Inoue, H., Muraoka, K., Sakai, T., Endo, A., Kohno, K., Asayama, S., Noguchi, T., &
Ogawa, H. 2008, Ninteenth International Symposium on Space Terahertz Technology,
281
Kamazaki, T., et al. 2005, Astronomical Data Analysis Software and Systems XIV, 347, 533
Kitamura, Y., Omodaka, T., Kawabe, R., Yamashita, T., & Handa, T. 1993, PASJ, 45, L27
Kitamura, Y., Momose, M., Yokogawa, S., Kawabe, R., Tamura, M., & Ida, S. 2002, ApJ,
581, 357
Kokubo, E., & Ida, S. 2002, ApJ, 581, 666
– 14 –
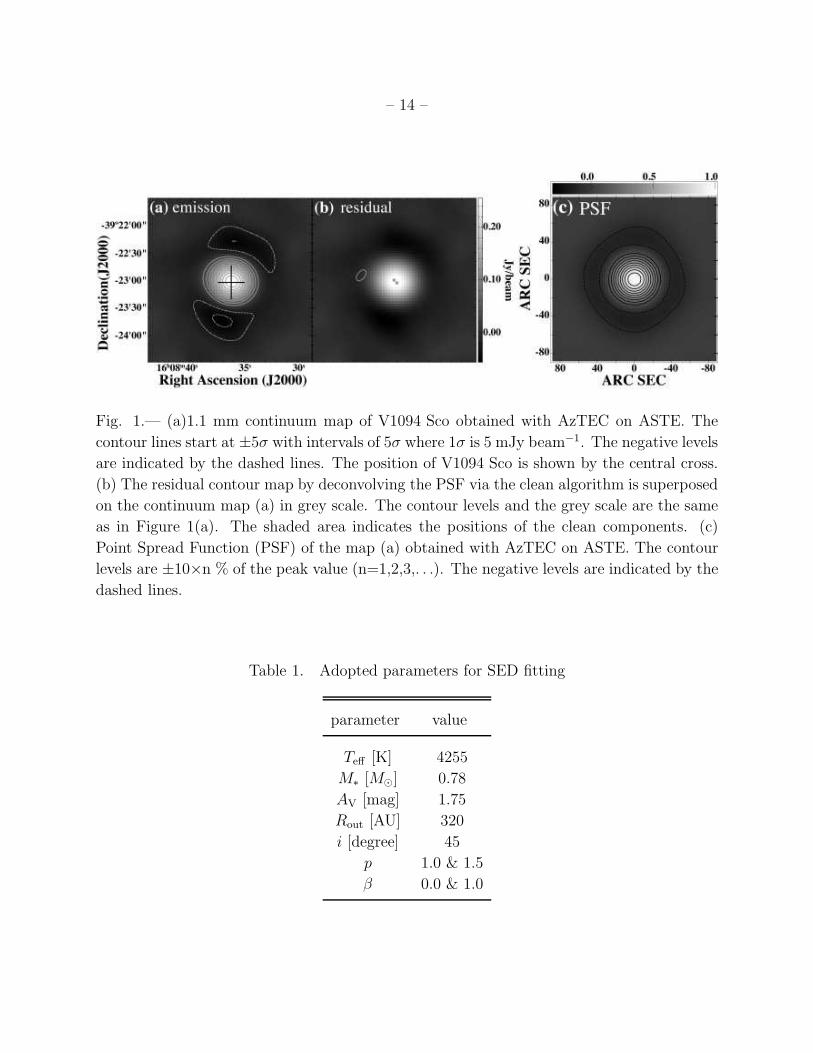
Fig. 1.— (a)1.1 mm continuum map of V1094 Sco obtained with AzTEC on ASTE. The
contour lines start at ±5σ with intervals of 5σ where 1σ is 5 mJy beam−1. The negative levels
are indicated by the dashed lines. The position of V1094 Sco is shown by the central cross.
(b) The residual contour map by deconvolving the PSF via the clean algorithm is superposed
on the continuum map (a) in grey scale. The contour levels and the grey scale are the same
as in Figure 1(a). The shaded area indicates the positions of the clean components. (c)
Point Spread Function (PSF) of the map (a) obtained with AzTEC on ASTE. The contour
levels are ±10×n % of the peak value (n=1,2,3,. . .). The negative levels are indicated by the
dashed lines.
Table 1. Adopted parameters for SED fitting
parameter value
Teff [K] 4255
M∗ [M⊙] 0.78
AV [mag] 1.75
Rout [AU] 320
i [degree] 45
p 1.0 & 1.5
β 0.0 & 1.0
– 15 –
10-13
10-12
10-11
10-10
10-9
10-8
1 10 100 1000
1012
1013
1014
Wavelength [µm]
Frequency [Hz]
ß=0.0
ß=1.0p=1.5
Fig. 2.— Spectral Energy Distribution (SED) of V1094 Sco. The result of our observations is
shown in the filled circle. The filled squares indicate the SED compiled from previous studies;
the NOMAD catalog (Zacharias et al. 2005), the DENIS database (The Denis Consortium
2005), the 2MASS point source catalog (Cutri et al. 2003), the IRAS faint source catalog
(Moshir et al. 1992), and the spitzer photometry (3.6, 4.5, 5.8, 8.0, and 24 µm Cieza et al.
2007). The flux density at 70 µm with Spitzer MIPS was measured by analyzing the archived
data using the program MOPEX/APEX software packages. The IRAS flux densities at 12,
60, and 100 µm are upper limits and shown by the open triangles. The dashed lines show
the stellar contributions and the solid line show the best-fitted curves in the case of p = 1.5.
The red and blue lines show the calculations for β =0 and 1, respectively. A grey line
indicates the fitting results for the model disk with a low threshold temperature of 2.7 K in
the temperature profile when p = 1.5 and β = 0.
– 16 –
16h08m33s16h08m36s16h08m39s
Right Ascension(J2000)
-039d23'40"
-039d23'10"
-039d22'40"
Dec
lin
ati
on
(J
20
00
)
2 4 6 8
VLSR
[km s-1]
0
2
4
6
8
TM
B [
K]
0
1
2SOURCEPOSITION
Fig. 3.— 12CO (black) and 13CO (red) J=3–2 five-point profile maps of V1094 Sco. The
observed points are located at the stellar position, to the 22′′ north, south, east, and west
from the center. The spectra are smoothed in resolutions of 0.3 and 0.5 km s−1 for 12CO
and 13CO, respectively. The shaded areas show the radial velocity of the central star with
their error (Guenther et al. 2007).

– 17 –
-0.1
0
0.1
0.2
0.3
0.4
0.5
0.6
0 2 4 6 8 10
VLSR
[km s-1
]
12CO(3-2)a)
-0.1
0
0.1
0.2
0.3
0.4
0 2 4 6 8 10
VLSR
[km s-1
]
13CO(3-2)b)
Fig. 4.— Residual spectra of 12CO and 13CO towards V1094 Sco. The vertical dotted lines
and the shaded areas show the radial velocity of the star and its uncertainty (Guenther et al.
2007).
Table 2. Results of SED fitting
parameter value
β 0.0 1.0
p 1.0 1.5 1.0 1.5
R∗ [AU] 0.008
L∗ [L⊙] 0.85
Rin [AU] 0.02
Σ100AU [g cm−2] 1.25 1.47 4.31 4.97
T1AU [K] 99.0 99.0 99.3 99.4
q 0.68
Mdisk [M⊙] 0.03 0.04 0.10 0.12
– 18 –
Krautter, J., Wichmann, R., Schmitt, J. H. M. M., Alcala, J. M., Neuhauser, R., & Terrane-
gra, L. 1997, A&AS, 123, 329
Miyake, K., & Nakagawa, Y. 1993, Icarus, 106, 20
Moshir, M., Kopman, G., & Conrow, T. A. O. 1992, Pasadena: Infrared Processing and
Analysis Center, California Institute of Technology, 1992, edited by Moshir, M.; Kop-
man, G.; Conrow, T. a.o.,
Nuernberger, D., Chini, R., & Zinnecker, H. 1997, A&A, 324, 1036
Osterloh, M., & Beckwith, S. V. W. 1995, ApJ, 439, 288
Papaloizou, J. C. B., Nelson, R. P., Kley, W., Masset, F. S., & Artymowicz, P. 2007, Proto-
stars and Planets V, 655
Rieke, G. H., & Lebofsky, M. J. 1985, ApJ, 288, 618
Scott, K. S., et al. 2008, MNRAS, 385, 2225
Scoville, N. Z., Sargent, A. I., Sanders, D. B., Claussen, M. J., Masson, C. R., Lo, K. Y., &
Phillips, T. G. 1986, ApJ, 303, 416
Strom, K. M., Strom, S. E., Edwards, S., Cabrit, S., & Skrutskie, M. F. 1989, AJ, 97, 1451
Tachihara, K., Dobashi, K., Mizuno, A., Ogawa, H., & Fukui, Y. 1996, PASJ, 48, 489
Tanaka, H., Himeno, Y., & Ida, S. 2005, ApJ, 625, 414
Vilas-Boas, J. W. S., Myers, P. C., & Fuller, G. A. 2000, ApJ, 532, 1038
Wang, Y., Jaffe, D. T., Graf, U. U., & Evans, N. J., II 1994, ApJS, 95, 503
Wichmann, R., Krautter, J., Covino, E., Alcala, J. M., Neuhaeuser, R., & Schmitt,
J. H. M. M. 1997, A&A, 320, 185
Wichmann, R., Covino, E., Alcala, J. M., Krautter, J., Allain, S., & Hauschildt, P. H. 1999,
MNRAS, 307, 909
Wilson, G. W., et al. 2008, MNRAS, 386, 807
Zacharias, N., Monet, D. G., Levine, S. E., Urban, S. E., Gaume, R., & Wycoff, G. L. 2005,
VizieR Online Data Catalog, 1297, 0
This preprint was prepared with the AAS LATEX macros v5.2.