
Detection of organizations in large graphs: Application on risk management
16
DETECTION OF ORGANIZATIONS IN LARGE GRAPHS : APPLICATION ON RISK MANAGEMENT Cyrille Bertelle, Antoine Dutot, Michel Nabaa 1 , Damien Olivier LITIS Université du Havre F-76085 Le Havre 25, rue Phillipe Lebon {Cyrille.Bertelle; Antoine.Dutot; Michel.Nabaa; Damien.Olivier; }@univ-lehavre.fr Pascal Mallet CODAH F-76085 Le Havre 19, Rue Georges Braque [email protected] Abstract Recent events have shown that our agglomerations are vulnerable in front of emergency situations. There are a lot of factors to consider and one of them is the structure of towns generated by road networks. One way to study these structures is to modelize the networks by graphs and to use the theory developed on them. Recently, some works have studied the de- tection of communities in large graphs. A community in a graph is a set of connected nodes strongly connected to each other and less connected to nodes from other communities. The aim of detection is to identify commu- nities according to a predefined criteria but without specifying the number of communities and the size of communites. The known algorithms find com- munities but without taking into account the time. We propose a dynamic algorithm of communities detection and we explain how it can be applied on Le Havre agglomeration, for example, to estimate the vulnerability related to the road network use by vehicles. 1 Introduction Modeling the population flow aims to provide a simplified representation of the population displacement, which is a complex phenomena. It must take into ac- 1 Corresponding author. Authors are alphabetically ordered. Michel Nabaa research is sup- ported by Haute-Normandie Region. 1
-
Upload
univ-lehavre -
Category
Documents
-
view
2 -
download
0
Transcript of Detection of organizations in large graphs: Application on risk management
DETECTION OF ORGANIZATIONS IN LARGE GRAPHS :APPLICATION ON RISK MANAGEMENT
Cyrille Bertelle, Antoine Dutot, Michel Nabaa1, Damien OlivierLITIS
Université du HavreF-76085 Le Havre
25, rue Phillipe Lebon{Cyrille.Bertelle; Antoine.Dutot; Michel.Nabaa;
Damien.Olivier; }@univ-lehavre.frPascal Mallet
CODAHF-76085 Le Havre
19, Rue Georges [email protected]
AbstractRecent events have shown that our agglomerations are vulnerable in
front of emergency situations. There are a lot of factors to consider andone of them is the structure of towns generated by road networks. One wayto study these structures is to modelize the networks by graphs and to usethe theory developed on them. Recently, some works have studied the de-tection of communities in large graphs. A community in a graph is a setof connected nodes strongly connected to each other and less connected tonodes from other communities. The aim of detection is to identify commu-nities according to a predefined criteria but without specifying the number ofcommunities and the size of communites. The known algorithms find com-munities but without taking into account the time. We propose a dynamicalgorithm of communities detection and we explain how it can be applied onLe Havre agglomeration, for example, to estimate the vulnerability relatedto the road network use by vehicles.
1 IntroductionModeling the population flow aims to provide a simplified representation of thepopulation displacement, which is a complex phenomena. It must take into ac-
1Corresponding author. Authors are alphabetically ordered. Michel Nabaa research is sup-ported by Haute-Normandie Region.
1
count the displacement of individuals in their normal daily activities or under ex-ceptional activities requiring an evacuation in a danger case. Models must eventu-ally allow a better understanding of the parameters influencing the flow evolutionand provide decision making tools to know the spatial and temporal distributionof people in a given urban zone. The objective is therefore to realize a simulationthat can be used to define a strategy for evacuation planning and crisis manage-ment. Different types of models exist and may be used depending on the level ofaccuracy and representation of the flow we search for. But we can identify threemain families of flow modelling : microscopic, macroscopic and hybrid models.In Le Havre Agglomeration (CODAH), we are faced to different types of naturaland industrial hazards; 33 establishments are classified SEVESO2. In this context,the Major Risk Management Direction team (DIRM) of CODAH has developeda model which estimates the nocturnal and diurnal exposed population allocationPRET-RESSE (Bourcier and Mallet, 2006). So, we have ventilated the day / nightpopulation inside buildings. The model was able to locate people during the dayboth in their workplace and their residence (the unemployed and retirees). Al-though the model is able to locate the diurnal and nocturnal population, it remainsstatic because it does not take into account the daily movement of people and theroad network utilization.The using of road network by vehicles with diffrent behaviors can generate a dan-ger especially in case of evacuation situations. So, it is important to us to detectcongested areas that may be more vulnerable than others. In the literature, manyclustering algorithms have been applied on a graph to detect organisations accord-ing to a predefined criteria as the connectivity, the distance or capacity of edgesbetween adjacent nodes. Most of these models are static and do not meet the dy-namic due to graph evolution.Since CODAH can be seen as a graph on which we have vehicles flow that evolveduring time, we develop a dynamic algorithm which dynamically detects organi-zations according to the traffic state. The algorithm belongs to collective intel-ligence algorithms and can be referred to as an ant algorithm. the result of thisalgorithm must be visualized, as a dynamic map, in the Geographical InformationSystem (GIS) of CODAH to help decision makers in assessing the danger relatedto road network use by vehicles.
2Directive SEVESO is an European directive, it lays down to the states to identify potentialdangerous site. It intends to prevent major accidents involving dangerous substances and limittheir consequences for man and the environment, with a view to ensuring high levels of protectionthroughout the Community.
2
2 CODAH as a complex systemWe are intersted in detecting vulnerability related to the road network use in CO-DAH and we are working with DIRM team to setup a decision making tool as-sessing this vulnerability. In this context, it is very important to understand thedynamic related to the road network use by vehicles. In fact, a vehicle tends tofollow the same path taken by other vehicles to evacuate a dangerous area. In thiscase, any perturbation (accident...) may cause traffic jams causing serious prob-lem to evacuees. So, we can see CODAH as a system in which the environemntmay influence on evacuation to reduce or not the flow fluidity(existence or not ofsafe refuge and emergency exits, routes traffic direction) and vice versa (a fire oran accident may cause damages and change the environment).For us, CODAH can be seen as a complex system in perpetual evolution, in whichvehicles interact between them and with environment (vehicles acts on environ-ment which in turn influences vehicles).
Complex system CODAHA big number of entities interactingwith some others (dispersed inter-actions)
Vehicles on the same route interactbut not necessarily with vehicles onother routes
Absence of global control We have some local rules (trafficlights, priorities on intersections)but no global control
There are cross-hierarchical organi-zations with many interactions
An organization of rescue serviceinteracts with vehicles in a danger-ous area
Continual adaptation, learning andthus evolution
Vehicles learn about congestions insome zones at peak hours in thejourney and try to avoid them
Perpetual evolution with appearingand disappearing of organizations
Traffic jams can appear and disap-pear in time and at different places
The system is far from equilibriumdynamics (no equilibrium or transi-tion from an equilibrium to anotherone.
Passing from a normal situation to atraffic jam and vice versa
Table 1: CODAH meets complex system properties defined by Arthur et al.
A complex system is characterized by numerous entities of the same or dif-ferent nature that interact in a non-trivial way (non-linear, feedback loop ...); theglobal emergence of new properties not seen in these entities : Properties or evo-
3
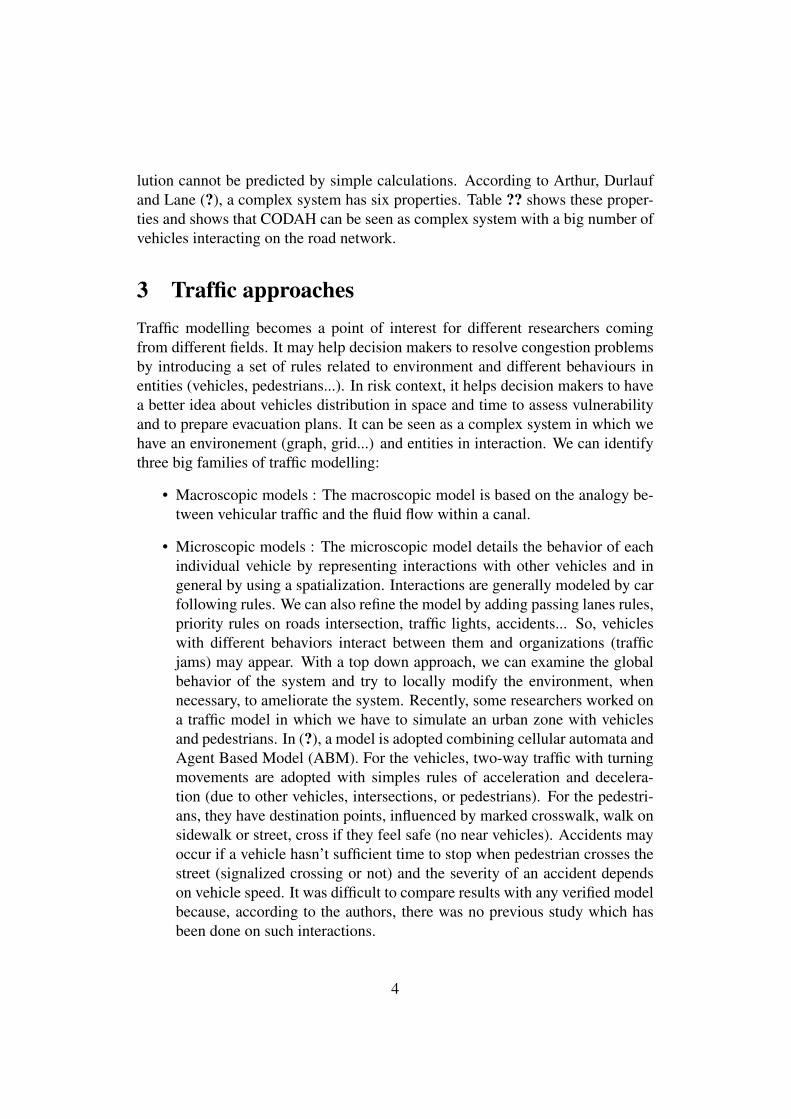
lution cannot be predicted by simple calculations. According to Arthur, Durlaufand Lane (?), a complex system has six properties. Table ?? shows these proper-ties and shows that CODAH can be seen as complex system with a big number ofvehicles interacting on the road network.
3 Traffic approachesTraffic modelling becomes a point of interest for different researchers comingfrom different fields. It may help decision makers to resolve congestion problemsby introducing a set of rules related to environment and different behaviours inentities (vehicles, pedestrians...). In risk context, it helps decision makers to havea better idea about vehicles distribution in space and time to assess vulnerabilityand to prepare evacuation plans. It can be seen as a complex system in which wehave an environement (graph, grid...) and entities in interaction. We can identifythree big families of traffic modelling:
• Macroscopic models : The macroscopic model is based on the analogy be-tween vehicular traffic and the fluid flow within a canal.
• Microscopic models : The microscopic model details the behavior of eachindividual vehicle by representing interactions with other vehicles and ingeneral by using a spatialization. Interactions are generally modeled by carfollowing rules. We can also refine the model by adding passing lanes rules,priority rules on roads intersection, traffic lights, accidents... So, vehicleswith different behaviors interact between them and organizations (trafficjams) may appear. With a top down approach, we can examine the globalbehavior of the system and try to locally modify the environment, whennecessary, to ameliorate the system. Recently, some researchers worked ona traffic model in which we have to simulate an urban zone with vehiclesand pedestrians. In (?), a model is adopted combining cellular automata andAgent Based Model (ABM). For the vehicles, two-way traffic with turningmovements are adopted with simples rules of acceleration and decelera-tion (due to other vehicles, intersections, or pedestrians). For the pedestri-ans, they have destination points, influenced by marked crosswalk, walk onsidewalk or street, cross if they feel safe (no near vehicles). Accidents mayoccur if a vehicle hasn’t sufficient time to stop when pedestrian crosses thestreet (signalized crossing or not) and the severity of an accident dependson vehicle speed. It was difficult to compare results with any verified modelbecause, according to the authors, there was no previous study which hasbeen done on such interactions.
4
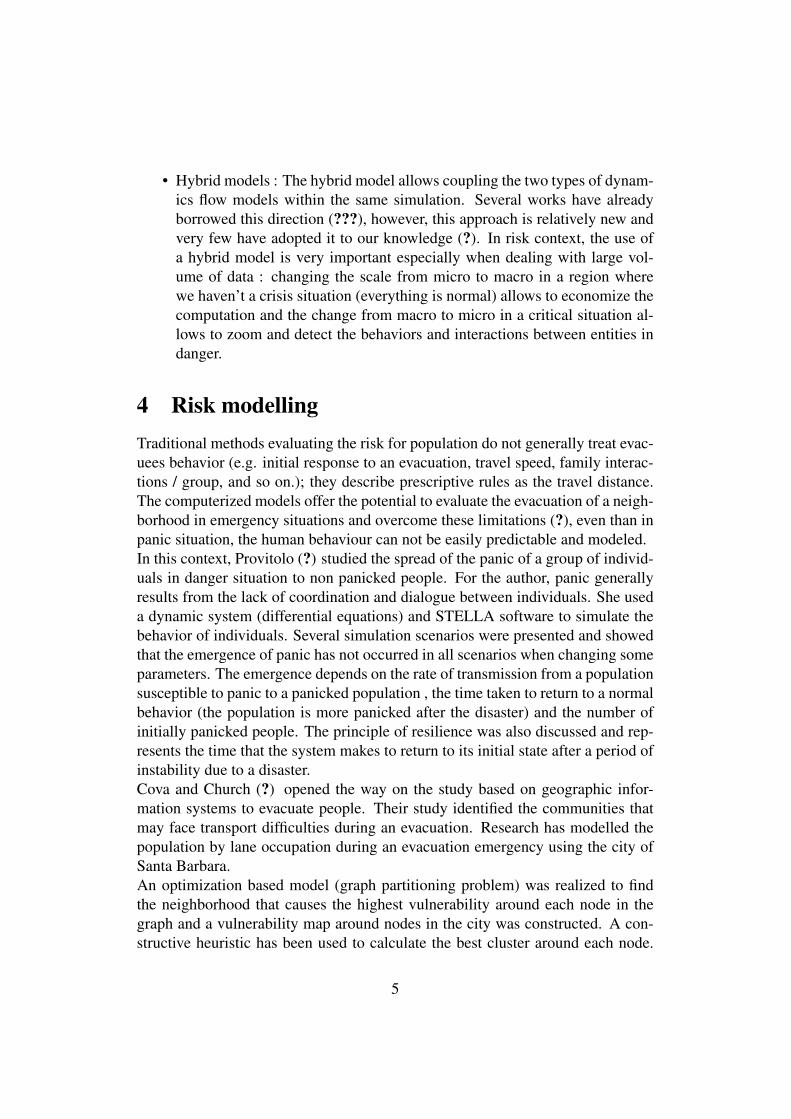
• Hybrid models : The hybrid model allows coupling the two types of dynam-ics flow models within the same simulation. Several works have alreadyborrowed this direction (???), however, this approach is relatively new andvery few have adopted it to our knowledge (?). In risk context, the use ofa hybrid model is very important especially when dealing with large vol-ume of data : changing the scale from micro to macro in a region wherewe haven’t a crisis situation (everything is normal) allows to economize thecomputation and the change from macro to micro in a critical situation al-lows to zoom and detect the behaviors and interactions between entities indanger.
4 Risk modellingTraditional methods evaluating the risk for population do not generally treat evac-uees behavior (e.g. initial response to an evacuation, travel speed, family interac-tions / group, and so on.); they describe prescriptive rules as the travel distance.The computerized models offer the potential to evaluate the evacuation of a neigh-borhood in emergency situations and overcome these limitations (?), even than inpanic situation, the human behaviour can not be easily predictable and modeled.In this context, Provitolo (?) studied the spread of the panic of a group of individ-uals in danger situation to non panicked people. For the author, panic generallyresults from the lack of coordination and dialogue between individuals. She useda dynamic system (differential equations) and STELLA software to simulate thebehavior of individuals. Several simulation scenarios were presented and showedthat the emergence of panic has not occurred in all scenarios when changing someparameters. The emergence depends on the rate of transmission from a populationsusceptible to panic to a panicked population , the time taken to return to a normalbehavior (the population is more panicked after the disaster) and the number ofinitially panicked people. The principle of resilience was also discussed and rep-resents the time that the system makes to return to its initial state after a period ofinstability due to a disaster.Cova and Church (?) opened the way on the study based on geographic infor-mation systems to evacuate people. Their study identified the communities thatmay face transport difficulties during an evacuation. Research has modelled thepopulation by lane occupation during an evacuation emergency using the city ofSanta Barbara.An optimization based model (graph partitioning problem) was realized to findthe neighborhood that causes the highest vulnerability around each node in thegraph and a vulnerability map around nodes in the city was constructed. A con-structive heuristic has been used to calculate the best cluster around each node.
5
This heuristic was developed in C and the result was displayed on a map (withArcInfo).Nevertheless, in this approach, we predefine the maximum number of nodes in aneighborhood (or a community), which may not always be realistic and does nottake into account the traffic evolution during the calculation of critical neighbor-hoods. So, the vulnerable neighborhoods don’t evolve according to traffic state.
5 Communities detectionOur aim is to identify communities in graphs according to a predefined criteriaand without any fixing of number of communities and the number of nodes percommunity.
5.1 Some definitionsFor Newman et al, a community is a set of nodes strongly linked to each other andmore weakly linked to the outside world, according to a predefined criteria, butwithout any fixing of the nodes number in each community (?).Radicchi (?) proposes two possible definitions to quantify Newman definition:
• Community C in a Strong Sense : doutC (i) > doutC̄
(i),∀i ∈ C.A node belongs to a strong community if it has more connections within thecommunity than outside.
• Community C in a Weak Sense :∑
i∈C doutC (i) >
∑i∈C d
outC̄
(i),∀i ∈ C. Acommunity is qualified as weak if sum of all degrees inside is more impor-tant than sum of degrees towards the rest of the graph.
doutC (i) is the exiting edges number from a node i belonging to the community Ctowards the nodes of the same community.doutC̄
(i) is the exiting edges number from a node i belonging to the community Ctowards the nodes of other communities. Finding organizations is a new field ofresearch (??). Recent works identify two big families in organization detection inlarge graphs.
• Graph partitioning : a NP-complete problem (?)which consists in groupingnodes in fixed number of partitions with a fixed size, while minimizing thenumber of inter-partitions connections.
• Data partitioning or hierarchical clustering : based on statistical methodsto analyse data and regroup similar data by using some similarity distance.Many of works used this type of models (??).
6
Stochastic approaches and collective explorations are generally based on randomwalk in graphs (?). A random walk is a simple stochastic process. It is a formal-ization of the intuitive idea that we can explore a graph if we walk from an initialnode and choose a next adjacent node randomly. To detect organizations, the mainidea lays on the fact that small random walks tend to be trapped into them (??).A dissimilarity index (?) between two nearest neighboring vertices of the graphis measured by a random walk. It is used to determine if nearest-neighboring ver-tices must be in the same organization. It integrates both the local and the globalstructural information of the given graph and bias can be introduced, injectingnumerical pheromones is an example.
5.2 Proposed algorithmOur aim is to identify communities in graphs, i.e. dense areas strongly linkedto each other and more weakly linked to the outside world. If the concept ofcommunities in a graph is difficult to define formally, it can be seen as a set ofnodes whose internal connections density is higher than the outside density with-out defining formal threshold (?). Thus the goal is to find a partition of nodes incommunities according to a certain predefined criteria without fixing the numberof such communities or the number of nodes in a community.Interesting works were developed in the literature on the detection of structure inlarge communities in graphs (????).In our problem, we look for a self-organization in networks with an algorithmclose to the detection of communities in large graphs and belonging to collectiveintelligence algorithms. Organizations connect elements, events or individuals byinterrelations so that they become components of a whole. They assume the soli-darity and robustness of these links, and ensure that the system will eventually belong lasting despite random perturbations. The organizations, therefore : trans-form, produce, tie and maintain. Time is present generating the dynamic and wewill try to fight against these organizations, in the case of risk management, toavoid bottlenecks which do not facilitate the evacuations.
Thus we will considered the graph at time t, G(t) = (V (t), E(t)) where theedges are weighted, this weight being noted |e| for the edge e and represents theneeded time to cross this arc, depending on the current load of the traffic and wetry to define a colored dynamic graph G(t) = (E(t), V (t), C(t)).
The algorithm used can be referred to as an ant algorithm (?). Our ant algo-rithm use several colonies of ants, each of a distinct color. Ants travel inside thegraph an lay down pheromones, information that can be detected by other ants.Pheromones are also colored. Ants tend to be repulsed by pheromones of othercolors. Furthermore, ants tend to favor edges with important weights.
7
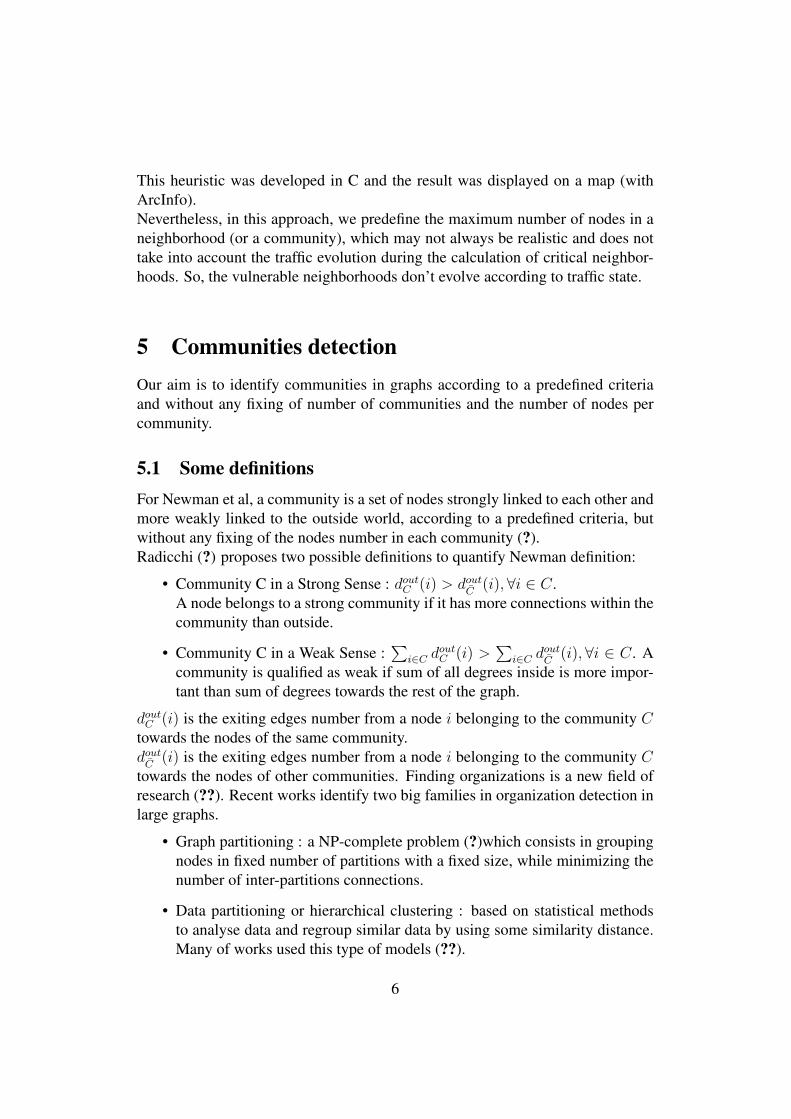
Figure 1: Communities detection in a graph extracted from Amazon website
The colored dynamic graph previously mentionned is defined such that:
• V (t) is the set of vertices at time t. Each vertex v is characterized by:
– a color c ∈ C(t),
• E(t) is the set of edges at time t. Each edge e is characterized by:
– a weight |e| ∈ N+ that corresponds to interaction importance betweenthe elements at each end of edge e.
– a quantity of pheromones of each color.
• C(t) is a set of colors representing the ant colonies at time t.
The algorithm principle is to color the graph using pheromones. Each colonywill collaborate to colonize zones, whereas colonies compete to maintain theirown colored zone (see figure ??). Solutions will therefore emerge and be main-tained by the ant behavior. The solutions will be the color of each vertex in thegraph. Indeed, colored pheromones are deposited by ants on edges. The color of
8
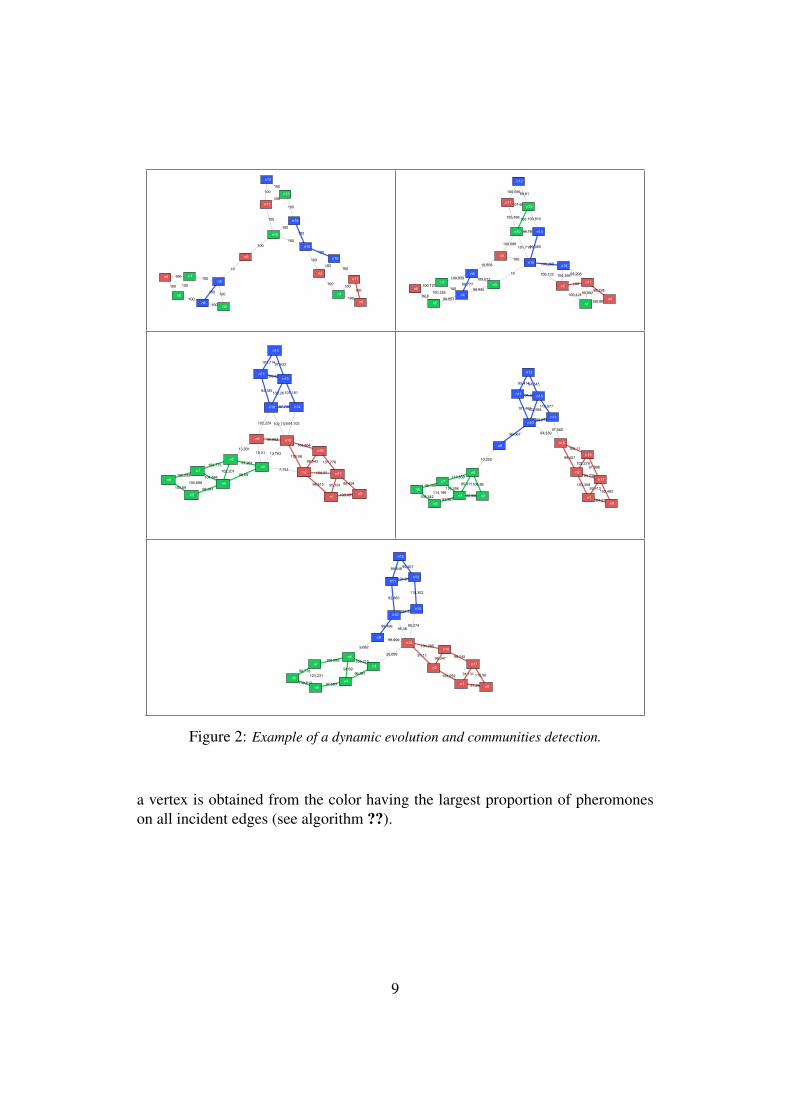
Figure 2: Example of a dynamic evolution and communities detection.
a vertex is obtained from the color having the largest proportion of pheromoneson all incident edges (see algorithm ??).
9
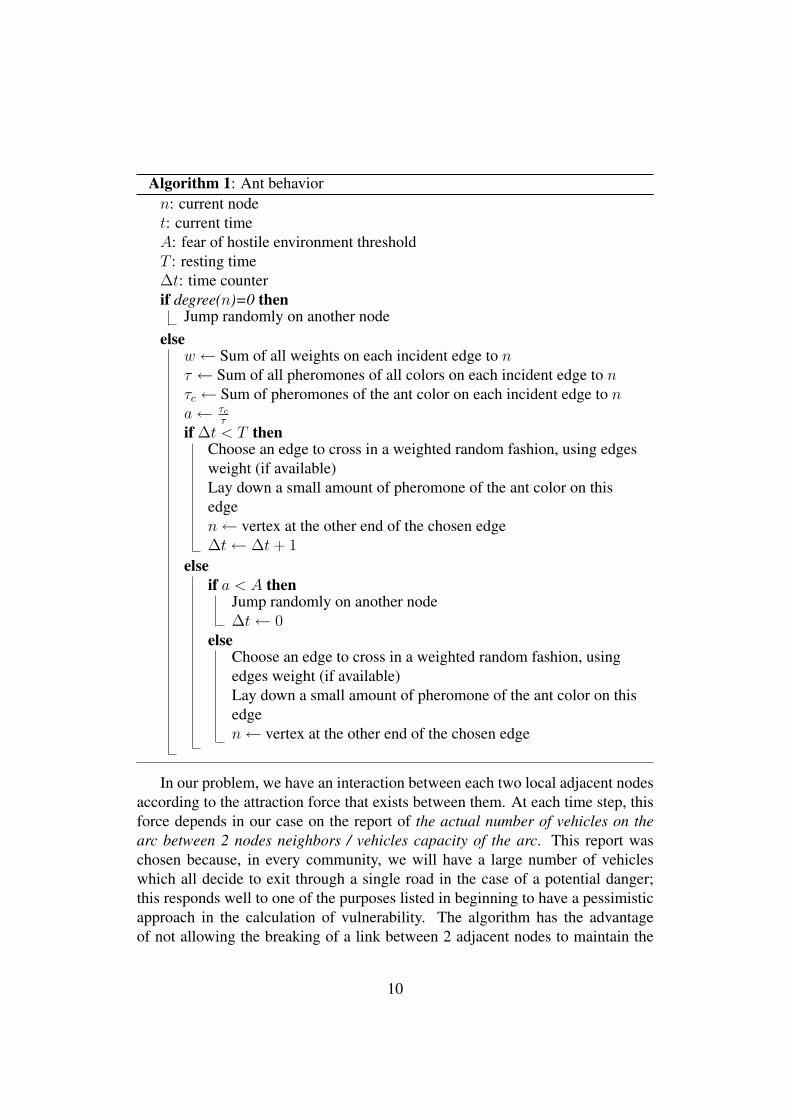
Algorithm 1: Ant behaviorn: current nodet: current timeA: fear of hostile environment thresholdT : resting time∆t: time counterif degree(n)=0 then
Jump randomly on another nodeelse
w ← Sum of all weights on each incident edge to nτ ← Sum of all pheromones of all colors on each incident edge to nτc ← Sum of pheromones of the ant color on each incident edge to na← τc
τ
if ∆t < T thenChoose an edge to cross in a weighted random fashion, using edgesweight (if available)Lay down a small amount of pheromone of the ant color on thisedgen← vertex at the other end of the chosen edge∆t← ∆t+ 1
elseif a < A then
Jump randomly on another node∆t← 0
elseChoose an edge to cross in a weighted random fashion, usingedges weight (if available)Lay down a small amount of pheromone of the ant color on thisedgen← vertex at the other end of the chosen edge
In our problem, we have an interaction between each two local adjacent nodesaccording to the attraction force that exists between them. At each time step, thisforce depends in our case on the report of the actual number of vehicles on thearc between 2 nodes neighbors / vehicles capacity of the arc. This report waschosen because, in every community, we will have a large number of vehicleswhich all decide to exit through a single road in the case of a potential danger;this responds well to one of the purposes listed in beginning to have a pessimisticapproach in the calculation of vulnerability. The algorithm has the advantageof not allowing the breaking of a link between 2 adjacent nodes to maintain the
10
structure of the road network. When the traffic evolves, the algorithm detects thatand communities can change or disappear as a result of local forces that changebetween the nodes locally.In previous work, we applied this algorithm on the Amazon website. Most of thetime, when we are on a page that describes some product, several other items arerecommended by the site. We see something like "customers that bought itemA also bought B, C, D...". The algorithm has detected and separated items incommunities depending on their similarity. Currently, we work on the applicationof the algorithm on a graph with a dynamic flow model (see figure ??).
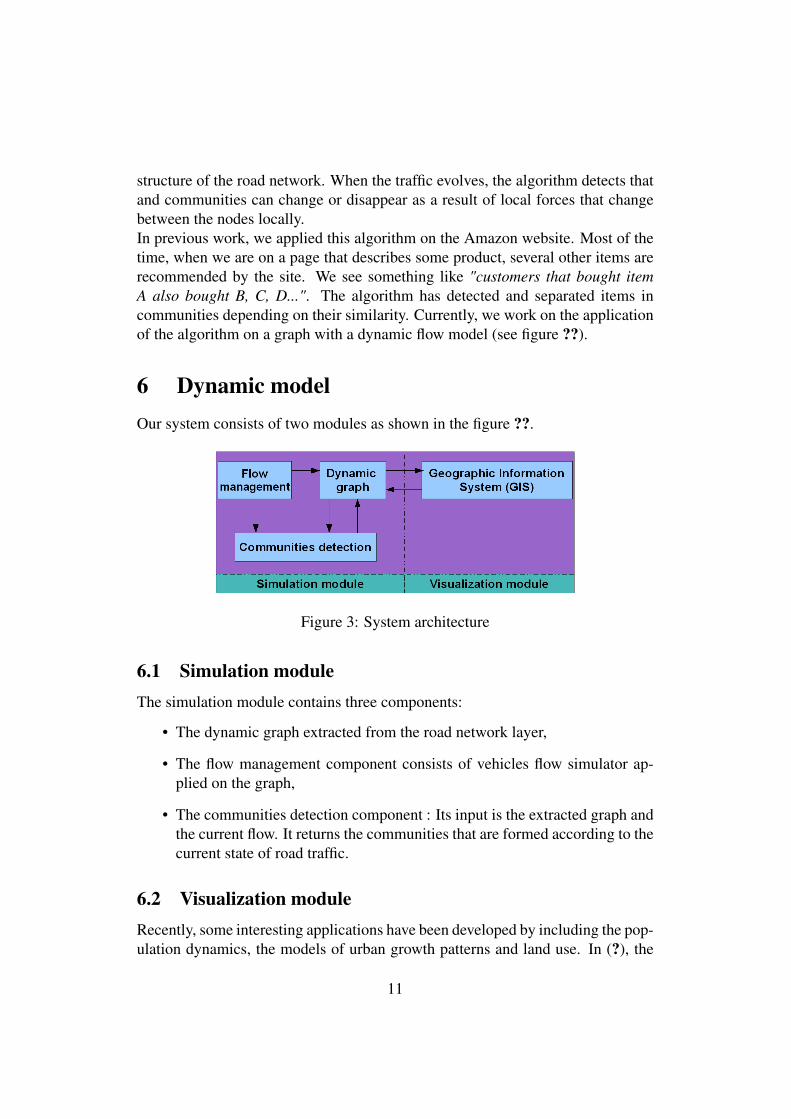
6 Dynamic modelOur system consists of two modules as shown in the figure ??.
Figure 3: System architecture
6.1 Simulation moduleThe simulation module contains three components:
• The dynamic graph extracted from the road network layer,
• The flow management component consists of vehicles flow simulator ap-plied on the graph,
• The communities detection component : Its input is the extracted graph andthe current flow. It returns the communities that are formed according to thecurrent state of road traffic.
6.2 Visualization moduleRecently, some interesting applications have been developed by including the pop-ulation dynamics, the models of urban growth patterns and land use. In (?), the
11
authors emphasize the importance of the collaboration between geographers andmulti agents system community to model spatial urban systems. They also un-derline some conceptual and practical difficulties to such coupling. For computermodelers, this integration provides the ability to have computing entities as agentsthat are linked to real geographical locations. For GIS users, it provides the abil-ity to model the emergence of phenomena by various interactions of agents intime and space by using a GIS (?). So, combining several layers as houses, roadnetwork, population... allows us to model different types of agents into a GISenvironment. Many researchers have emphasized the need to create vector basedMulti Agents System (MAS), which may require the topological data structureprovided by using a GIS (?). In geography, the representation of a MAS coexistsn levels of organizations and use several classes of agents (e.g. Level 1: individ-uals or companies, Level 2 and three: economic, urban communities).There willbe rules at every level and the approach is not necessarily a bottom up one (as inthe models of self-organization). . .) (?).
In this paper, the visualization module consists of the road network layer in-tegrated into the GIS. This layer represents CODAH network layer. This modulecommunicates with the simulation module: the graph is constructed from thismodule, which in turn get the simulation result and visualize it as a dynamic vul-nerability map.
6.3 Environment modelingThe road network is integrated as a layer in the Geographic Information System(GIS). From this layer, we extract the data by using the open source java GIStoolkit Geotools. This toolkit provides several methods to manipulate geospatialdata and implements Open Geospatial Consortium (OGC) specifications, so wecan read and write to ESRI shapefile format. Once data road network are ex-tracted, we use the GraphStream tool (?) developed within LITIS laboratory ofLe Havre to construct a graph corresponding to the GIS network layer. This toolis designed for modeling; processing and visualizing graphs.The data extracted from network layer contains the roads circulation direction,roads id, roads type, their lengths and geometry.The extracted multigraph G (t) = (V (t), E (t)) represents the road network at timet where V (t) is the set of nodes at t and E (t) the set of arcs at t. We deal witha multigraph because we have sometimes more than one oriented arc in the samedirection between two adjacent nodes due to multiple routes between two pointsin CODAH road network. GraphStream facilitates this task because it is adaptedto model and visualize multigraphs. In the constructed multigraph:
12
• The nodes represent roads intersections,
• The arcs represent the roads taken by vehicles,
• The weight on each arc represents the needed time to cross this arc, depend-ing on the current load of the traffic
• Dynamic aspect relates to the weights of the arcs, which can evolve in time,according to the evolution of the fluidity of circulation.
We have also constructed a Voronoi tessellation (Thiessen polygon) around nodesand projected the population in buildings on these nodes. The population in build-ings is extracted from PRET-RESS model.
6.4 Vehicles flowWe have adopted a macroscopic model in which flows circulate normally (with-out accidents) in order to establish a dynamic pessimistic vulnerability map. Inevacuation situations (when an accident occurs), this macroscopic model is notrelevant to the reality because most of people panic and take the same road to exitthe dangerous area. Hence, it is important to develop a micro approach with multi-scale description (from micro to macro and vice versa during the simulation) tosimulate scenarios of danger in real time (accidents, behavior of drivers, vehiclesinteractions. . . ).
7 ConclusionThe proposed method allowed us to dynamically detect organization in large graphs.We will apply this algorithm on the graph extracted from CODAH road networklayer. It will serve decision makers to estimate the risk due to the use of the roadnetwork by vehicles and categorize CODAH areas by their vulnerability. We willcomplete our work by using real traffic data retrieved from a displacements surveywith CODAH population which will help us to better locate people during the dayand therefore having a more realistic vulnerability dynamic map.
ReferencesR Albert and A L Barabasi. Statistical mechanics of complex networks. Reviews
of Modern Physics, 74:47–97, 2002.
13
W.B Arthur, S. Durlauf, and D.A. Lane. The Economy as an Evolving ComplexSystem II, chapter Introduction : Process and Emergence in the Economy, pages1–14. Addison-Wesley, Reading, Mass., 1997.
E. Bourrel and V. Henn. Mixing micro and macro representation of trafic flow :a first theoretical step. In Proceeding of the 9th Meeting of the Euro Work-ingGroup on transportation, 2002.
A. Bretagnole, E. Daude, and D. Pumain. From theory to modelling : urbansystems as complex systems. Cybergeo : Revue européenne de géographie,335:26p, 2006.
C.J.E Castel. Developing a prototype agent-based pedestrian evacuation modelto explore the evacuation of king’s cross st pancras underground station. pages427–437, London, 2006. Center for advanced spatial analysis (university col-lege London): working paper 108, ACM.
R.L. Church and T.J. Cova. Modelling community evacuation vulnerability usinggis. International Journal of Geographical Information Science, 11(8):763–784, 1997.
A. Clauset, M. E. J. Newman, and Cristopher Moore. Finding community struc-ture in very large networks. Physical review. E 70, 6:066111.1–066111.6, 2004.
E. Daudé. Systèmes multi-agents pour la simulation en géographie : vers uneGéographie Artificielle, chapter 13, pages 355–382. in Y. Guermont (dir.),Modélisation en Géographie : déterminismes et complexités, Hermès, Paris,2005.
M Dorigo and T Stützle. Ant Colony Optimization. MIT Press, 2004.
Antoine Dutot, Frédéric Guinand, Damien Olivier, and Yoann Pigné. Graph-stream: A tool for bridging the gap between complex systems and dynamicgraphs. In EPNACS: Emergent Properties in Natural and Artificial ComplexSystems, 2007.
M.R. Garey and D.S. Johnson. Computers and Intractability : A Guide to the The-ory of NP-Completeness. W H Freeman and Company, New York-San Fran-cisco, 1979.
A. Godara, S. Lassarre, and A. Banos. Simulating pedestrian-vehicle interaction inan urban network using cellular automata and multi-agent models. In Springer,editor, Traffic and Granular Flow’05, pages 411–418, 2007.
14
A. Hennecke, M. Treiber, and D. Helbing. Macroscopic simulation of open sys-tems and micro-macro link. M. Schreckenberg, D. Helbing, H. J. Herrmann,editor, Traffic and Granular Flow: Social, Traffic, and Granular Dynamics, 2:383–388, 2000.
M.S. El Hman, H. Abouaäissa, D. Jolly, and A. Benasser. Simulation hybride deflux de trafic basée sur les systèmes multi-agents. In 6e Conférence Franco-phone de MOdélisation et SIMulation - MOSIM 06, 2006.
A.K. Jain and R.C. Dubes. Algorithms for Clustering Data. Prentice Hall, 1988.
A.K. Jain, M. N Murty, and J. Flynn. Data clustering : a review. ACM Comput.Surv., 31(3):264–323, September 1999.
L. Magne, S. Rabut, and J. F. Gabard. Toward an hybrid macro and micro trafficflow simulation model. In INFORMS spring 2000 meeting, 2000.
R. Najlis and M. J. North. Repast for gis. University of Chicago and ArgonneNational Laboratory, IL, USA, 2004. In Proceedings of Agent 2004 : SocialDynamics: Interaction, Reflexivity and Emergence.
M. E. J. Newman. Detecting community structure in networks. Eur. Phys. J., 38:321–330, 2004a.
M. E. J. Newman. Fast algorithm for detecting community structure in networks.Phys. Rev., 69:066133, 2004b.
M. E. J Newman and M. Girvan. Finding and evaluating community structure innetworks. Phys Rev E Stat Nonlin Soft Matter Phys, 74(3):036104, Sep 2004.
D. C. Parker. Integration of geographic information systems and agent-based mod-els of land use : Challenges and prospects. In Maguire, D., J. M. F., Goodchild,and M., Batty, (Eds), GIS, Spatial Analysis and Modelling, Redlands, CA: ESRIPress., 2004.
P. Pons. Détection de structures de communautés dans les grands réseauxd’interactions. Giens, France, 2005. Septièmes Rencontres Francophones surles aspects Algorithmiques des Télécommunications.
P. Pons and M. Latapy. Computing communities in large networks using randomwalks. In In Proceedings of the 20th International Symposium on Computerand Information Sciences (ISCIS’05) Vol. 3733 of Lecture Notes in ComputerScience Istanbul, Turkey, pages 284–293, October 2005.
15
P. Pons and M. Latapy. Computing communities in large networks using randomwalks. Journal of Graph Algorithms and Applications, 10(2):191–218, 2006.
D. Provitolo. A proposition for a classification of the catastrophe systems basedon complexity criteria. In European Conference Complex Systems-EPNACS’07,Emergent Properties in Natural and Artificial Complex Systems, Dresden, pages93–106, 2007.
F. Radicchi, C. Castellano, F. Cecconi, V. Loreto, and D. Parisi. Defining andidentifying communities in networks. In Proceedings of the National Academyof Sciences, volume 101, pages 2658–2663, 2004.
B. Tadic. Exploring complex graphs by random walks. In AIP Conference Pro-ceedings, volume 661, pages 24–27, 2003.
H. Zhou. Distance, dissimilarity index, and network community structure. Physi-cal Review E, 67:10, 2003.
16