Detection of Hg(II) amidst several heavy and toxic metal ions after their selective separation by...
16
This article was downloaded by: [Visva Bharati University] On: 19 September 2013, At: 05:23 Publisher: Taylor & Francis Informa Ltd Registered in England and Wales Registered Number: 1072954 Registered office: Mortimer House, 37-41 Mortimer Street, London W1T 3JH, UK Desalination and Water Treatment Publication details, including instructions for authors and subscription information: http://www.tandfonline.com/loi/tdwt20 Detection of Hg(II) amidst several heavy and toxic metal ions after their selective separation by chromatography: rationalization of separation factors in terms of Density Functional (hardness) Index Bhavya Srivastava a , Milan K. Barman a & Bhabatosh Mandal a a Department of Chemistry , Visva-Bharati University , Santiniketan , 731235 , India Phone: Tel. +91 3463 264935 Fax: Tel. +91 3463 264935 Published online: 18 Sep 2013. To cite this article: Bhavya Srivastava , Milan K. Barman & Bhabatosh Mandal , Desalination and Water Treatment (2013): Detection of Hg(II) amidst several heavy and toxic metal ions after their selective separation by chromatography: rationalization of separation factors in terms of Density Functional (hardness) Index, Desalination and Water Treatment, DOI: 10.1080/19443994.2013.841101 To link to this article: http://dx.doi.org/10.1080/19443994.2013.841101 PLEASE SCROLL DOWN FOR ARTICLE Taylor & Francis makes every effort to ensure the accuracy of all the information (the “Content”) contained in the publications on our platform. However, Taylor & Francis, our agents, and our licensors make no representations or warranties whatsoever as to the accuracy, completeness, or suitability for any purpose of the Content. Any opinions and views expressed in this publication are the opinions and views of the authors, and are not the views of or endorsed by Taylor & Francis. The accuracy of the Content should not be relied upon and should be independently verified with primary sources of information. Taylor and Francis shall not be liable for any losses, actions, claims, proceedings, demands, costs, expenses, damages, and other liabilities whatsoever or howsoever caused arising directly or indirectly in connection with, in relation to or arising out of the use of the Content. This article may be used for research, teaching, and private study purposes. Any substantial or systematic reproduction, redistribution, reselling, loan, sub-licensing, systematic supply, or distribution in any form to anyone is expressly forbidden. Terms & Conditions of access and use can be found at http:// www.tandfonline.com/page/terms-and-conditions
-
Upload
independent -
Category
Documents
-
view
1 -
download
0
Transcript of Detection of Hg(II) amidst several heavy and toxic metal ions after their selective separation by...
This article was downloaded by: [Visva Bharati University]On: 19 September 2013, At: 05:23Publisher: Taylor & FrancisInforma Ltd Registered in England and Wales Registered Number: 1072954 Registered office: Mortimer House,37-41 Mortimer Street, London W1T 3JH, UK
Desalination and Water TreatmentPublication details, including instructions for authors and subscription information:http://www.tandfonline.com/loi/tdwt20
Detection of Hg(II) amidst several heavy and toxicmetal ions after their selective separation bychromatography: rationalization of separation factorsin terms of Density Functional (hardness) IndexBhavya Srivastava a , Milan K. Barman a & Bhabatosh Mandal aa Department of Chemistry , Visva-Bharati University , Santiniketan , 731235 , India Phone:Tel. +91 3463 264935 Fax: Tel. +91 3463 264935Published online: 18 Sep 2013.
To cite this article: Bhavya Srivastava , Milan K. Barman & Bhabatosh Mandal , Desalination and Water Treatment(2013): Detection of Hg(II) amidst several heavy and toxic metal ions after their selective separation by chromatography:rationalization of separation factors in terms of Density Functional (hardness) Index, Desalination and Water Treatment, DOI:10.1080/19443994.2013.841101
To link to this article: http://dx.doi.org/10.1080/19443994.2013.841101
PLEASE SCROLL DOWN FOR ARTICLE
Taylor & Francis makes every effort to ensure the accuracy of all the information (the “Content”) containedin the publications on our platform. However, Taylor & Francis, our agents, and our licensors make norepresentations or warranties whatsoever as to the accuracy, completeness, or suitability for any purpose of theContent. Any opinions and views expressed in this publication are the opinions and views of the authors, andare not the views of or endorsed by Taylor & Francis. The accuracy of the Content should not be relied upon andshould be independently verified with primary sources of information. Taylor and Francis shall not be liable forany losses, actions, claims, proceedings, demands, costs, expenses, damages, and other liabilities whatsoeveror howsoever caused arising directly or indirectly in connection with, in relation to or arising out of the use ofthe Content.
This article may be used for research, teaching, and private study purposes. Any substantial or systematicreproduction, redistribution, reselling, loan, sub-licensing, systematic supply, or distribution in anyform to anyone is expressly forbidden. Terms & Conditions of access and use can be found at http://www.tandfonline.com/page/terms-and-conditions
Detection of Hg(II) amidst several heavy and toxic metal ions aftertheir selective separation by chromatography: rationalization ofseparation factors in terms of Density Functional (hardness) Index
Bhavya Srivastava, Milan K. Barman, Bhabatosh Mandal*
Department of Chemistry, Visva-Bharati University, Santiniketan, 731235, IndiaTel. +91 3463 264935; Fax: +91 3463 261526; +91 9474738517; email: [email protected]
Received 18 March 2013; Accepted 26 August 2013
ABSTRACT
Ascending paper chromatography of Hg+2 has been performed with mixed acids asdeveloping mobile phase. Effects of temperature, concentration, and composition of themobile phase on Rf values have been investigated. Hg+2 has been selectively separated fromseveral synthetic binary and multicomponent mixtures containing the toxic and heavy metalions. Often these metal ions remain associated with it in its ores and alloy samples. Hg+2 intrace level has been separated and detected from blood serum containing the congenersZn+2, Cd+2, Pb+2, Bi+3, Th+4, Tl+3, and Cu+2. On the basis of the difference in the migrationof the spots on the paper, twenty difficult separations have been achieved. Severalthermodynamic parameters, DG, DH, and DS have been determined by differential variationof radii of the spot with respect to temperature utilizing the thermodynamic relationship.The partition equilibrium constant was also determined. Metal ions were detected byborohydride reduction on the paper strip. Separation factors have been correlated in terms ofDesityFunctional (corrected hardness, g⁄) Index. From g⁄, hydrated radii of the metal ionshave been determined. A plausible mechanism for the differential migration of diverse metalions has been suggested.
Keywords: Hg(II); Paper chromatography; Selectivity factor; Hydrated radii; Sorption energy;Hardness index
1. Introduction
Mercury is a heavy and relatively rare element,but it is well known because of its multivariate techni-cal importance as well as its detrimental effects. It isused in thermometers, barometers, mercury vaporlamps, in electrical devices, as an amalgam with othermetals in dental fillings, in manufacturing somedrugs, paints, and explosives, and by hatters and
furriers [1]. Mercury compounds have been used ascatalysts, fungicides, herbicides, disinfectants,pigments and for other purposes. The world produc-tion was about 10,000 tonnes in 1973 [2] and about6,500 tonnes in 1980 [3]. In addition to the productionof pure mercury by industrial processes, mercury isreleased into the environment by human activitiessuch as the combustion of fossil fuels, waste disposaland by industry. Recent estimates of anthropogenicemissions are in the order of 2,000–3,000 tonnes peryear [4]. Mercury and its compounds are considered*Corresponding author.
1944-3994/1944-3986 � 2013 Balaban Desalination Publications. All rights reserved.
Desalination and Water Treatmentwww.deswater.com
doi: 10.1080/19443994.2013.841101
(2013) 1–15
Dow
nloa
ded
by [
Vis
va B
hara
ti U
nive
rsity
] at
05:
23 1
9 Se
ptem
ber
2013
health hazards, and reports of Hg poisoning becauseof industrial, agricultural, and laboratory exposure aswell as its suicidal/homicidal uses are numerous.Persons concerned are liable to get poisoned duringfingerprinting by gray powder (hydrargyrum cumcreta that contain 30% mercury), mining and in dead-ening during the manufacturing of mercurial ointmentand emplastrum [1]. Mercury accumulated in the tis-sues of fish is usually in the form of methylmercury, ahighly toxic form. Along with massive human intoxi-cation at Minamata, Japan, and in Iraq, new mercurypollution cases in developing countries have resultedfrom the use of amalgamation in gold mining andchanges of chemical form in the environment havebeen reported [5]. Thus, from this toxicological pointof view, separation and detection of mercury in all itsforms at micro level is warranted. However, absorp-tion spectroscopy [6], neutron activation analysis [7],anode stripping voltametry [8], colorimetry [9], poten-tiometry [10], laser-induced plasma spectroscopy [11],are the most effective and accurate methods for thedetection of mercury in trace level, but these are verymuch sophisticated, costly and not affordable indeveloping countries. Heavy metals have been sepa-rated from mercury in their multicomponent syntheticmixtures using extraction chromatography [12–14],but selective eluents are required for each metal ionsand these varied for different mixtures of metal ions,as well. Mercury has been separated from binary mix-tures by paper chromatography using organic solventsas one of the components [15–20], but these methodsare not selective in the presence of chemically corre-lated congeners of multicomponent versatile systemsand the metal ions are not detected by a unique detec-tor. Moreover, the separation factors (Rf values orselectivity factors) in linear solvation free-energy rela-tionships (LSERs) based on the solvatochromic param-eters [20], plate theory [21], rate theory [22] andKielland [23], affinity order have not been quantita-tively correlated with any Density Functional Index.Global hardness is a definite quantum mechanicaldescriptor and it is the cardinal index of chemicalreactivity as well as stability of atoms and ions [24].Paper chromatography is as an effective alternative,when the metals are in large volumes of relativelylow concentrations [15]. The present paper reports thesystematic investigation for the selective separationand detection of mercury from several synthetic multi-component mixtures containing toxic and heavy metalions like Zn+2, Cd+2, Pb+2, Bi+3, Th+4, Tl+3, Cu+2, Fe+3,Co+2, and Ni+2, associated with it in ores and alloysamples by paper chromatography utilizing a uniquemobile phase. It is an inexpensive and powerfulanalytical tool that requires very small quantities of
material usually present in real samples. Sorptionenergy, acid–base-binding energy and hydrated radiiin solution phase have been calculated from DensityFunctional Index. After separation, in most of thecases the detection of mercury and other metal ionshave been performed by the single detector, borohy-dride.
2. Experimental
2.1. Apparatus
Chromatographic paper (Whattman 1), 23� 1.5 cmand 28� 6 cm chromatography glass jar and pH meter(Digital Elico LI-120, India).
2.2. Test solutions
Standard aqueous (10�2M) of nitrate, sulfate, andchloride of Hg+2, Pb+2, Cu+2, Cd+2, Bi+3, Al+3, Fe+3,Cr+3, Ni+2, Co+2, Zn+2, Mn+2, In+3, Tl+3, and VO+2
were used for the present work.
2.3. Mobile phase
Different acid solutions (H2SO4, HNO3, CH3COOH,HCl, and HClO4) of different concentrations andCH3COCH3 were mixed in different proportions tohave the suitable mobile phase for clean separation ofHg+2 in multicomponent synthetic and real samples(Table 1).
2.4. Detection
Colored metals (Hg+2, Pb+2, Cu+2, Cd+2, Bi+3, Fe+3,Cr+3, Ni+2, Co+2, Mn+2, In+3, Tl+3, and VO+2) weredetected by sodium borohydride reduction (E. Merc,Bombay, India), and in other cases, Al+3, Zn+2 weredetected by xelynol orange (BDH, Bombay, India) asindicator.
2.5. Procedure
Test solutions (spiked or un-spiked metal ionsolutions) were spotted separately on paper strip(in lg) using micro capillary about 2 cm above thelower edge of the paper strip. The spots were-airdried (precaution was taken to minimize spreading ofapplied spots by frequent drying in air) and then thepaper strip developed in the chromatographic glassjars with chosen mobile phase by the ascendingtechnique up to the ascent of 20 cm from its point ofapplication. After development, the chromatogramswere taken off and air-dried. The positions of the
2 B. Srivastava et al. / Desalination and Water Treatment
Dow
nloa
ded
by [
Vis
va B
hara
ti U
nive
rsity
] at
05:
23 1
9 Se
ptem
ber
2013
analytes were detected using suitable detectors. TheRf values and the selectivity factors (a) for individual
analytes were determined. For the separation of Hg+2,equal volumes of metal ion solutions were mixed andwas taken (in lg) on the paper strip. The paper stripwas developed with suitable mobile phase, and the Rf
values were determined. The areas of spot on theChromatogram of Hg+2 at different temperatures weredetermined for the investigation of different thermo-dynamic parameters (DG, DH, and DS).
2.6. Analysis of real samples
(i) Different ternary mixtures of Hg+2 containingtoxic metal ions (Pb+2, Cu+2, Cd+2, Bi+3, Fe+3, Cr+3,
Ni+2, Co+2, Mn+2, In+3, Tl+3, and VO+2) in raw water(well, pond, and tap) were prepared for their separa-tion. (ii) In view of the forensic serological sampleanalysis, human blood samples were collected frompathological laboratory (PM Hospital, Visva-Bharati,India). Hg+2 and two other metal ions (such as Pb+2,Cu+2, Cd+2, Bi+3, Zn+2, Co+2, Mn+2, In+3, Tl+3, andVO+2) were added in to the blood samples to preparedifferent ternary mixtures. The blood samples werethen digested with 1:1 HNO3 and centrifuged at roomtemperature with the help of Laboratory Centrifuge(REMI R-4C DX,) at 10,000 rpm for 10min to obtainthe metal containing blood serum. The supernatants(blood serum) were collected in small vials, and theseparation of Hg+2 in different ternary mixtures wereobtained on chromatogram. The water samples (pond,well, and tap) were collected using a long glass tubefrom different places of Santiniketan, BirbhumDistrict, West Bengal, India (24˚32´30´´N-24˚35´´N and87˚01´´-87˚05´2´´E), and different multi-componentmixtures were prepared by adding metallic toxicant.The samples were stored in sample vials. Unlessotherwise stated, all chemicals and solvents used inthis work were of analytical grade (BDH/E Merck).
3. Results and discussion
3.1. SEM analysis
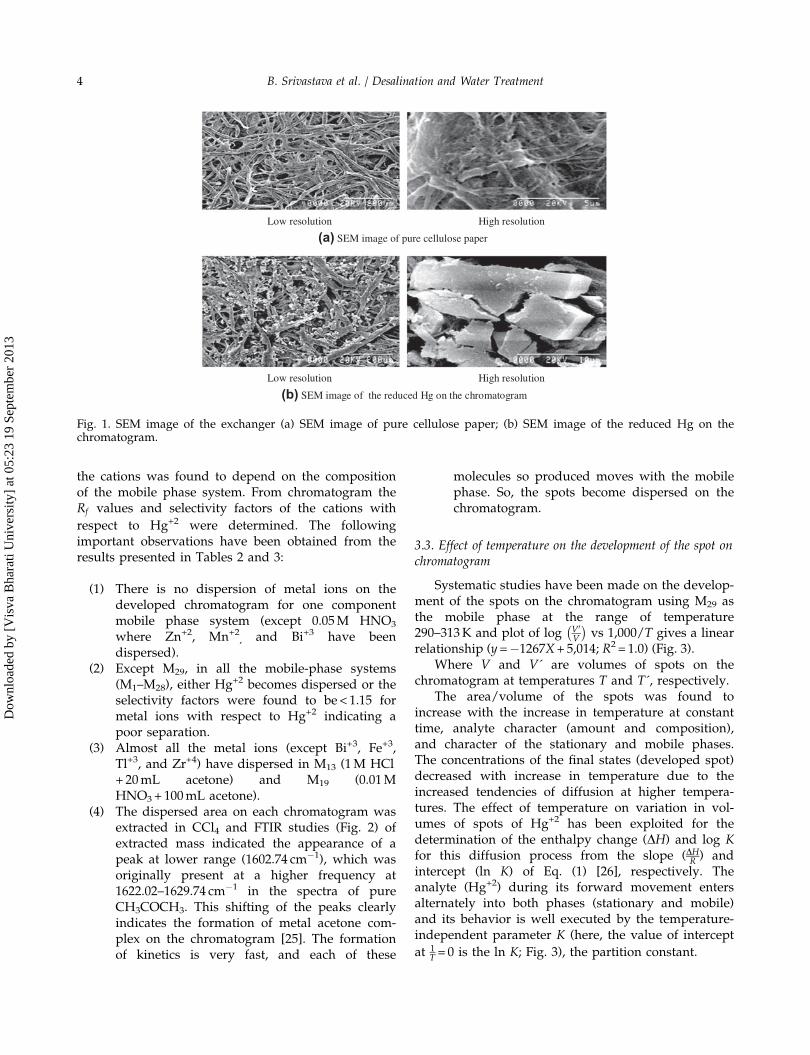
Scanning electron microscopy (SEM) images of theexchanger (cellulose paper, for both unloaded andloaded with Hg(II)) were taken by SEM-S-530 Hitachi,Japan using Image Management System Software ofQuartz PCI Version, shown in Fig. 1. The paper stripsand its loaded form were kept in vacuum for 2minand placed for gold coating in an ion coater, IB-2(EIKO Engineering, Hitachi, Japan) to prevent anyburning during its analysis. The photograph confirmsthat the material is porous (Fig. 1(a)). After reductionof the spot on the developed chromatogram withborohydride (Fig. 1(b)), the metallic Hg was found tobe present inside the pores of the exchanger. Here, theexchanger matrix consists of large number of poresconnected by channels. Sieve action of these channelscombined with surface adsorption activity of thematrix make it possible to separate the speciessmaller/bigger than the size of the channels.
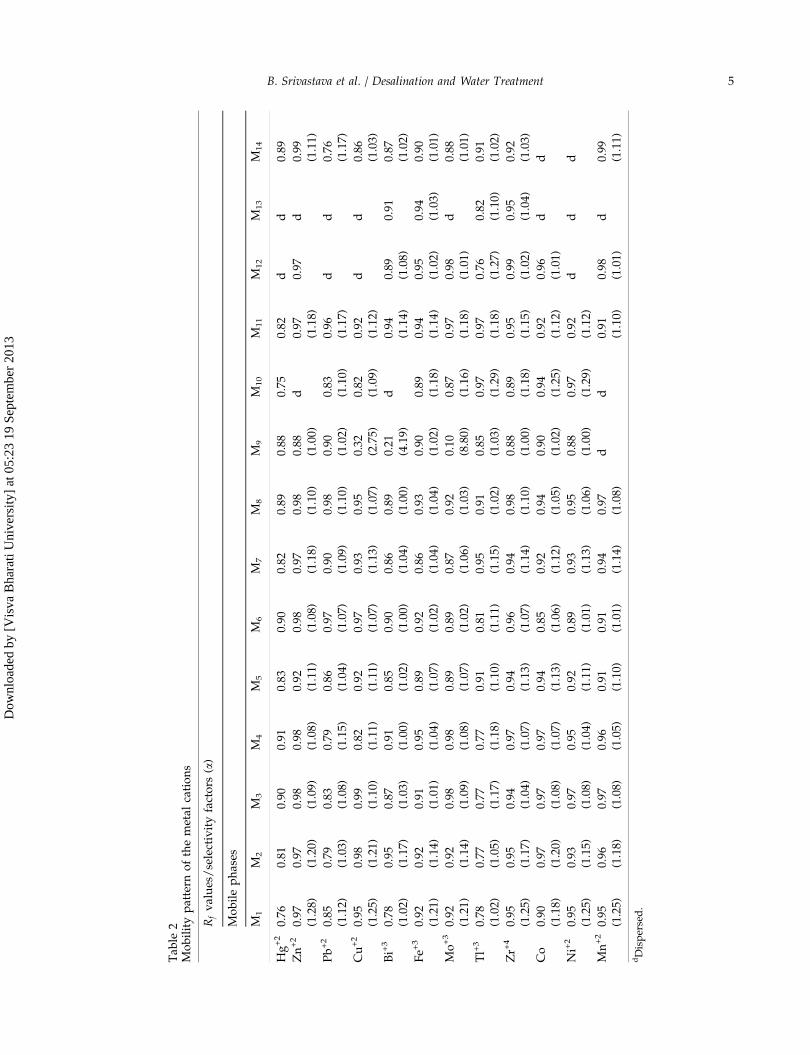
3.2. Effect of the nature of mobile phases on Rf values andselectivity factors
Chromatography of ten metal cations wasperformed using mono- and multicomponent mobile-phase system (M1–M29), and the mobility pattern of
Table 1Mobile phases of different compositions
Symbol Composition
One-component system
M1 0.1M HCl
M2 0.2M HCl
M3 0.5M HCl
M4 1M HCl
M5 0.01M H2SO4
M6 0.02M H2SO4
M7 0.04M H2SO4
M8 0.5M H2SO4
M9 0.005M HNO3
M10 0.05M HNO3
M11 0.2M HNO3
Two-component system
M12 1M HCl+ 10mL acetone
M13 1M HCl+ 20mL acetone
M14 1M HNO3+ 20mL acetone
M15 2M HNO3+ 20mL acetone
M16 0.01M HNO3+ 20mL acetone
M17 0.01M HNO3+ 40mL acetone
M18 0.01M HNO3+ 60mL acetone
M19 0.01M HNO3+ 100mL acetone
M20 0.5M H2SO4 + 0.1MCH3COOH
M21 0.5M H2SO4 + 0.2MCH3COOH
M22 0.1M H2SO4 + 0.3MCH3COOH
M23 0.1M H2SO4 + 1MCH3COOH
Three-component system
M24 1M HNO3+ 1M CH3COOH+40mL acetone
M25 0.1M H2SO4 + 1MCH3COOH+10mL acetone
M26 0.1M H2SO4 + 1MCH3COOH+20mL acetone
M27 0.1M H2SO4 + 1MCH3COOH+40mL acetone
M28 1M H2SO4+ 1MCH3COOH+50mL acetone
Four-component system
M29 0.1MHCl+ 0.1M H2SO4 + 0.1MHNO3+ 0.1MCH3COOH
B. Srivastava et al. / Desalination and Water Treatment 3
Dow
nloa
ded
by [
Vis
va B
hara
ti U
nive
rsity
] at
05:
23 1
9 Se
ptem
ber
2013
the cations was found to depend on the compositionof the mobile phase system. From chromatogram theRf values and selectivity factors of the cations with
respect to Hg+2 were determined. The followingimportant observations have been obtained from theresults presented in Tables 2 and 3:
(1) There is no dispersion of metal ions on thedeveloped chromatogram for one componentmobile phase system (except 0.05M HNO3
where Zn+2, Mn+2, and Bi+3 have beendispersed).
(2) Except M29, in all the mobile-phase systems(M1–M28), either Hg+2 becomes dispersed or theselectivity factors were found to be< 1.15 formetal ions with respect to Hg+2 indicating apoor separation.
(3) Almost all the metal ions (except Bi+3, Fe+3,Tl+3, and Zr+4) have dispersed in M13 (1M HCl+ 20mL acetone) and M19 (0.01MHNO3+ 100mL acetone).
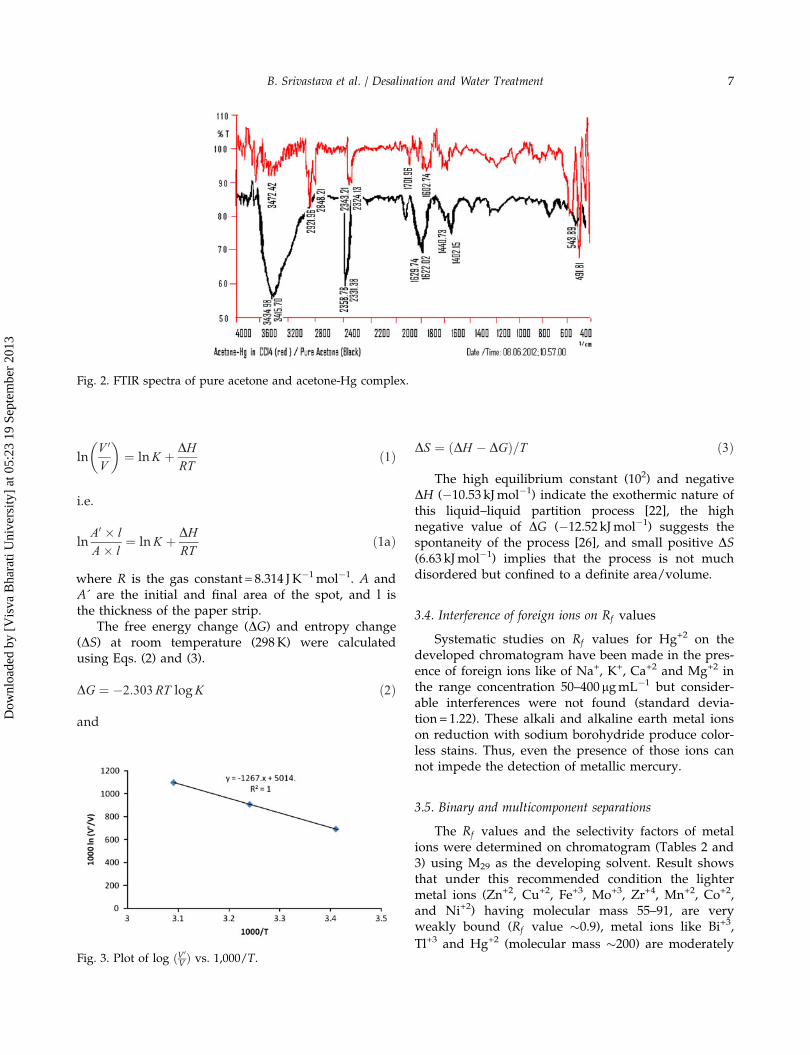
(4) The dispersed area on each chromatogram wasextracted in CCl4 and FTIR studies (Fig. 2) ofextracted mass indicated the appearance of apeak at lower range (1602.74 cm�1), which wasoriginally present at a higher frequency at1622.02–1629.74 cm�1 in the spectra of pureCH3COCH3. This shifting of the peaks clearlyindicates the formation of metal acetone com-plex on the chromatogram [25]. The formationof kinetics is very fast, and each of these
molecules so produced moves with the mobilephase. So, the spots become dispersed on thechromatogram.
3.3. Effect of temperature on the development of the spot onchromatogram
Systematic studies have been made on the develop-ment of the spots on the chromatogram using M29 asthe mobile phase at the range of temperature290–313K and plot of log V0
V
� �vs 1,000/T gives a linear
relationship (y=�1267X+ 5,014; R2 = 1.0) (Fig. 3).Where V and V´ are volumes of spots on the
chromatogram at temperatures T and T´, respectively.The area/volume of the spots was found to
increase with the increase in temperature at constanttime, analyte character (amount and composition),and character of the stationary and mobile phases.The concentrations of the final states (developed spot)decreased with increase in temperature due to theincreased tendencies of diffusion at higher tempera-tures. The effect of temperature on variation in vol-umes of spots of Hg+2 has been exploited for thedetermination of the enthalpy change (DH) and log Kfor this diffusion process from the slope (DHR ) andintercept (ln K) of Eq. (1) [26], respectively. Theanalyte (Hg+2) during its forward movement entersalternately into both phases (stationary and mobile)and its behavior is well executed by the temperature-independent parameter K (here, the value of intercept
at 1T = 0 is the ln K; Fig. 3), the partition constant.
High resolution
(a) SEM image of pure cellulose paper
(b) SEM image of the reduced Hg on the chromatogram
Low resolution
High resolutionLow resolution
Fig. 1. SEM image of the exchanger (a) SEM image of pure cellulose paper; (b) SEM image of the reduced Hg on thechromatogram.
4 B. Srivastava et al. / Desalination and Water Treatment
Dow
nloa
ded
by [
Vis
va B
hara
ti U
nive
rsity
] at
05:
23 1
9 Se
ptem
ber
2013
Tab
le2
Mobilitypattern
ofthemetal
cations
Rfvalues/selectivityfactors
(a)
Mobilephases
M1
M2
M3
M4
M5
M6
M7
M8
M9
M10
M11
M12
M13
M14
Hg+2
0.76
0.81
0.90
0.91
0.83
0.90
0.82
0.89
0.88
0.75
0.82
dd
0.89
Zn+2
0.97
(1.28)
0.97
(1.20)
0.98
(1.09)
0.98
(1.08)
0.92
(1.11)
0.98
(1.08)
0.97
(1.18)
0.98
(1.10)
0.88
(1.00)
d0.97
(1.18)
0.97
d0.99
(1.11)
Pb+2
0.85
(1.12)
0.79
(1.03)
0.83
(1.08)
0.79
(1.15)
0.86
(1.04)
0.97
(1.07)
0.90
(1.09)
0.98
(1.10)
0.90
(1.02)
0.83
(1.10)
0.96
(1.17)
dd
0.76
(1.17)
Cu+2
0.95
(1.25)
0.98
(1.21)
0.99
(1.10)
0.82
(1.11)
0.92
(1.11)
0.97
(1.07)
0.93
(1.13)
0.95
(1.07)
0.32
(2.75)
0.82
(1.09)
0.92
(1.12)
dd
0.86
(1.03)
Bi+3
0.78
(1.02)
0.95
(1.17)
0.87
(1.03)
0.91
(1.00)
0.85
(1.02)
0.90
(1.00)
0.86
(1.04)
0.89
(1.00)
0.21
(4.19)
d0.94
(1.14)
0.89
(1.08)
0.91
0.87
(1.02)
Fe+
30.92
(1.21)
0.92
(1.14)
0.91
(1.01)
0.95
(1.04)
0.89
(1.07)
0.92
(1.02)
0.86
(1.04)
0.93
(1.04)
0.90
(1.02)
0.89
(1.18)
0.94
(1.14)
0.95
(1.02)
0.94
(1.03)
0.90
(1.01)
Mo+3
0.92
(1.21)
0.92
(1.14)
0.98
(1.09)
0.98
(1.08)
0.89
(1.07)
0.89
(1.02)
0.87
(1.06)
0.92
(1.03)
0.10
(8.80)
0.87
(1.16)
0.97
(1.18)
0.98
(1.01)
d0.88
(1.01)
Tl+3
0.78
(1.02)
0.77
(1.05)
0.77
(1.17)
0.77
(1.18)
0.91
(1.10)
0.81
(1.11)
0.95
(1.15)
0.91
(1.02)
0.85
(1.03)
0.97
(1.29)
0.97
(1.18)
0.76
(1.27)
0.82
(1.10)
0.91
(1.02)
Zr+
40.95
(1.25)
0.95
(1.17)
0.94
(1.04)
0.97
(1.07)
0.94
(1.13)
0.96
(1.07)
0.94
(1.14)
0.98
(1.10)
0.88
(1.00)
0.89
(1.18)
0.95
(1.15)
0.99
(1.02)
0.95
(1.04)
0.92
(1.03)
Co
0.90
(1.18)
0.97
(1.20)
0.97
(1.08)
0.97
(1.07)
0.94
(1.13)
0.85
(1.06)
0.92
(1.12)
0.94
(1.05)
0.90
(1.02)
0.94
(1.25)
0.92
(1.12)
0.96
(1.01)
dd
Ni+2
0.95
(1.25)
0.93
(1.15)
0.97
(1.08)
0.95
(1.04)
0.92
(1.11)
0.89
(1.01)
0.93
(1.13)
0.95
(1.06)
0.88
(1.00)
0.97
(1.29)
0.92
(1.12)
dd
d
Mn+2
0.95
(1.25)
0.96
(1.18)
0.97
(1.08)
0.96
(1.05)
0.91
(1.10)
0.91
(1.01)
0.94
(1.14)
0.97
(1.08)
dd
0.91
(1.10)
0.98
(1.01)
d0.99
(1.11)
dDispersed.
B. Srivastava et al. / Desalination and Water Treatment 5
Dow
nloa
ded
by [
Vis
va B
hara
ti U
nive
rsity
] at
05:
23 1
9 Se
ptem
ber
2013
Tab
le3
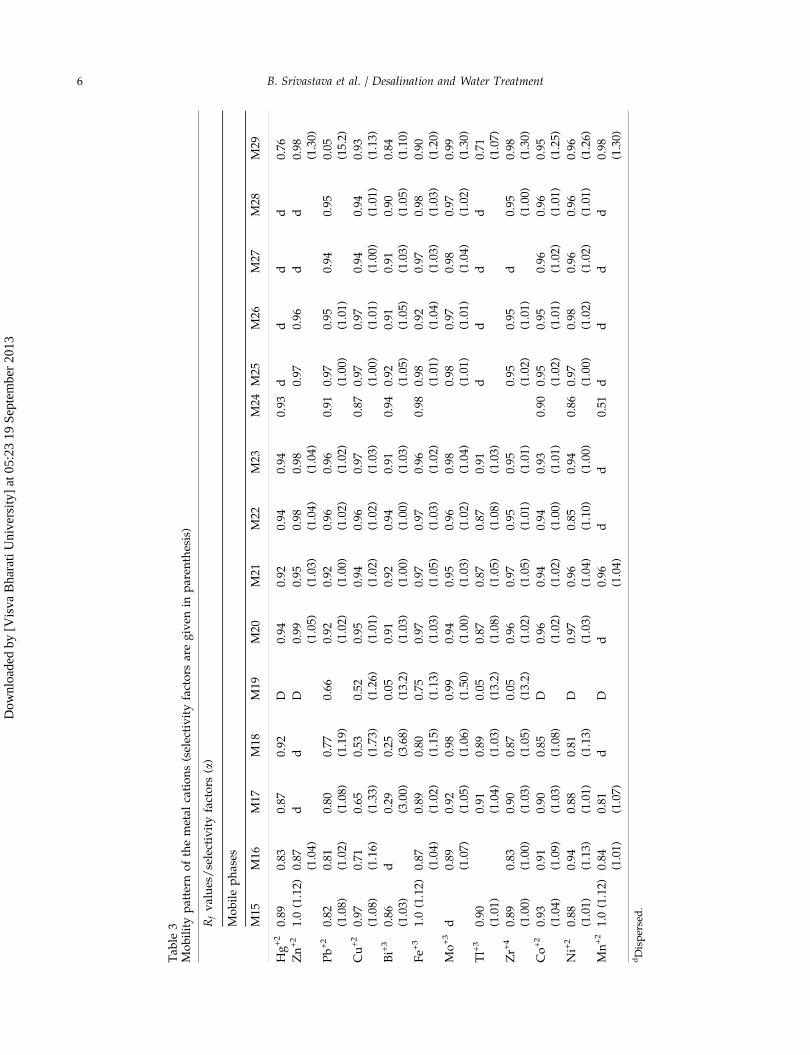
Mobilitypattern
ofthemetal
cations(selectivityfactors
aregiven
inparen
thesis)
Rfvalues/selectivityfactors
(a)
Mobilephases
M15
M16
M17
M18
M19
M20
M21
M22
M23
M24
M25
M26
M27
M28
M29
Hg+2
0.89
0.83
0.87
0.92
D0.94
0.92
0.94
0.94
0.93
dd
dd
0.76
Zn+2
1.0(1.12)
0.87
(1.04)
dd
D0.99
(1.05)
0.95
(1.03)
0.98
(1.04)
0.98
(1.04)
0.97
0.96
dd
0.98
(1.30)
Pb+2
0.82
(1.08)
0.81
(1.02)
0.80
(1.08)
0.77
(1.19)
0.66
0.92
(1.02)
0.92
(1.00)
0.96
(1.02)
0.96
(1.02)
0.91
0.97
(1.00)
0.95
(1.01)
0.94
0.95
0.05
(15.2)
Cu+2
0.97
(1.08)
0.71
(1.16)
0.65
(1.33)
0.53
(1.73)
0.52
(1.26)
0.95
(1.01)
0.94
(1.02)
0.96
(1.02)
0.97
(1.03)
0.87
0.97
(1.00)
0.97
(1.01)
0.94
(1.00)
0.94
(1.01)
0.93
(1.13)
Bi+3
0.86
(1.03)
d0.29
(3.00)
0.25
(3.68)
0.05
(13.2)
0.91
(1.03)
0.92
(1.00)
0.94
(1.00)
0.91
(1.03)
0.94
0.92
(1.05)
0.91
(1.05)
0.91
(1.03)
0.90
(1.05)
0.84
(1.10)
Fe+
31.0(1.12)
0.87
(1.04)
0.89
(1.02)
0.80
(1.15)
0.75
(1.13)
0.97
(1.03)
0.97
(1.05)
0.97
(1.03)
0.96
(1.02)
0.98
0.98
(1.01)
0.92
(1.04)
0.97
(1.03)
0.98
(1.03)
0.90
(1.20)
Mo+3
d0.89
(1.07)
0.92
(1.05)
0.98
(1.06)
0.99
(1.50)
0.94
(1.00)
0.95
(1.03)
0.96
(1.02)
0.98
(1.04)
0.98
(1.01)
0.97
(1.01)
0.98
(1.04)
0.97
(1.02)
0.99
(1.30)
Tl+3
0.90
(1.01)
0.91
(1.04)
0.89
(1.03)
0.05
(13.2)
0.87
(1.08)
0.87
(1.05)
0.87
(1.08)
0.91
(1.03)
dd
dd
0.71
(1.07)
Zr+
40.89
(1.00)
0.83
(1.00)
0.90
(1.03)
0.87
(1.05)
0.05
(13.2)
0.96
(1.02)
0.97
(1.05)
0.95
(1.01)
0.95
(1.01)
0.95
(1.02)
0.95
(1.01)
d0.95
(1.00)
0.98
(1.30)
Co+2
0.93
(1.04)
0.91
(1.09)
0.90
(1.03)
0.85
(1.08)
D0.96
(1.02)
0.94
(1.02)
0.94
(1.00)
0.93
(1.01)
0.90
0.95
(1.02)
0.95
(1.01)
0.96
(1.02)
0.96
(1.01)
0.95
(1.25)
Ni+2
0.88
(1.01)
0.94
(1.13)
0.88
(1.01)
0.81
(1.13)
D0.97
(1.03)
0.96
(1.04)
0.85
(1.10)
0.94
(1.00)
0.86
0.97
(1.00)
0.98
(1.02)
0.96
(1.02)
0.96
(1.01)
0.96
(1.26)
Mn+2
1.0(1.12)
0.84
(1.01)
0.81
(1.07)
dD
d0.96
(1.04)
dd
0.51
dd
dd
0.98
(1.30)
dDispersed.
6 B. Srivastava et al. / Desalination and Water Treatment
Dow
nloa
ded
by [
Vis
va B
hara
ti U
nive
rsity
] at
05:
23 1
9 Se
ptem
ber
2013
lnV 0
V
� �¼ lnK þ DH
RTð1Þ
i.e.
lnA0 � l
A� l¼ lnK þ DH
RTð1aÞ
where R is the gas constant = 8.314 JK�1mol�1. A andA´ are the initial and final area of the spot, and l isthe thickness of the paper strip.
The free energy change (DG) and entropy change(DS) at room temperature (298K) were calculatedusing Eqs. (2) and (3).
DG ¼ �2:303RT logK ð2Þ
and
DS ¼ ðDH � DGÞ=T ð3Þ
The high equilibrium constant (102) and negativeDH (�10.53 kJmol�1) indicate the exothermic nature ofthis liquid–liquid partition process [22], the highnegative value of DG (�12.52 kJmol�1) suggests thespontaneity of the process [26], and small positive DS(6.63 kJmol�1) implies that the process is not muchdisordered but confined to a definite area/volume.
3.4. Interference of foreign ions on Rf values
Systematic studies on Rf values for Hg+2 on thedeveloped chromatogram have been made in the pres-ence of foreign ions like of Na+, K+, Ca+2 and Mg+2 inthe range concentration 50–400lgmL�1 but consider-able interferences were not found (standard devia-tion = 1.22). These alkali and alkaline earth metal ionson reduction with sodium borohydride produce color-less stains. Thus, even the presence of those ions cannot impede the detection of metallic mercury.
3.5. Binary and multicomponent separations
The Rf values and the selectivity factors of metalions were determined on chromatogram (Tables 2 and3) using M29 as the developing solvent. Result showsthat under this recommended condition the lightermetal ions (Zn+2, Cu+2, Fe+3, Mo+3, Zr+4, Mn+2, Co+2,and Ni+2) having molecular mass 55–91, are veryweakly bound (Rf value �0.9), metal ions like Bi+3,
Tl+3 and Hg+2 (molecular mass �200) are moderately
Fig. 2. FTIR spectra of pure acetone and acetone-Hg complex.
Fig. 3. Plot of log ðV0V Þ vs. 1,000/T.
B. Srivastava et al. / Desalination and Water Treatment 7
Dow
nloa
ded
by [
Vis
va B
hara
ti U
nive
rsity
] at
05:
23 1
9 Se
ptem
ber
2013
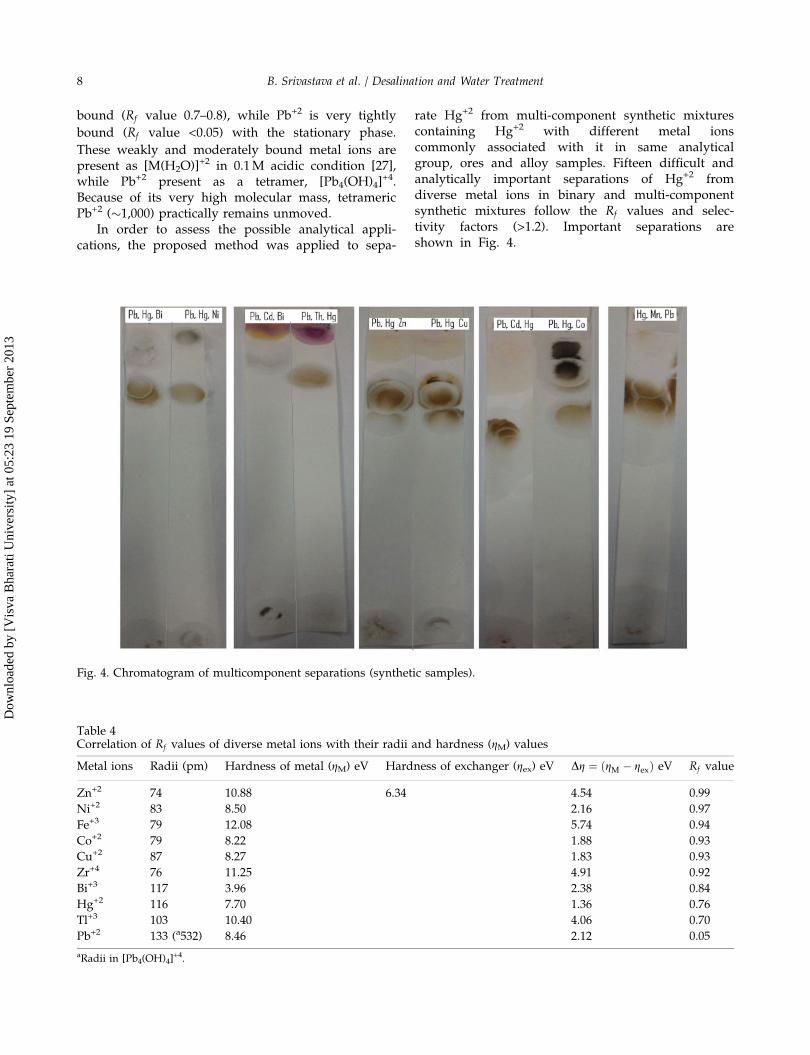
bound (Rf value 0.7–0.8), while Pb+2 is very tightly
bound (Rf value <0.05) with the stationary phase.
These weakly and moderately bound metal ions arepresent as [M(H2O)]+2 in 0.1M acidic condition [27],while Pb+2 present as a tetramer, [Pb4(OH)4]
+4.Because of its very high molecular mass, tetramericPb+2 (�1,000) practically remains unmoved.
In order to assess the possible analytical appli-cations, the proposed method was applied to sepa-
rate Hg+2 from multi-component synthetic mixturescontaining Hg+2 with different metal ionscommonly associated with it in same analyticalgroup, ores and alloy samples. Fifteen difficult andanalytically important separations of Hg+2 fromdiverse metal ions in binary and multi-componentsynthetic mixtures follow the Rf values and selec-tivity factors (>1.2). Important separations areshown in Fig. 4.
Fig. 4. Chromatogram of multicomponent separations (synthetic samples).
Table 4Correlation of Rf values of diverse metal ions with their radii and hardness (gM) values
Metal ions Radii (pm) Hardness of metal (gM) eV Hardness of exchanger (gex) eV Dg ¼ ðgM � gexÞ eV Rf value
Zn+2 74 10.88 6.34 4.54 0.99
Ni+2 83 8.50 2.16 0.97
Fe+3 79 12.08 5.74 0.94
Co+2 79 8.22 1.88 0.93
Cu+2 87 8.27 1.83 0.93
Zr+4 76 11.25 4.91 0.92
Bi+3 117 3.96 2.38 0.84
Hg+2 116 7.70 1.36 0.76
Tl+3 103 10.40 4.06 0.70
Pb+2 133 (a532) 8.46 2.12 0.05
aRadii in [Pb4(OH)4]+4.
8 B. Srivastava et al. / Desalination and Water Treatment
Dow
nloa
ded
by [
Vis
va B
hara
ti U
nive
rsity
] at
05:
23 1
9 Se
ptem
ber
2013
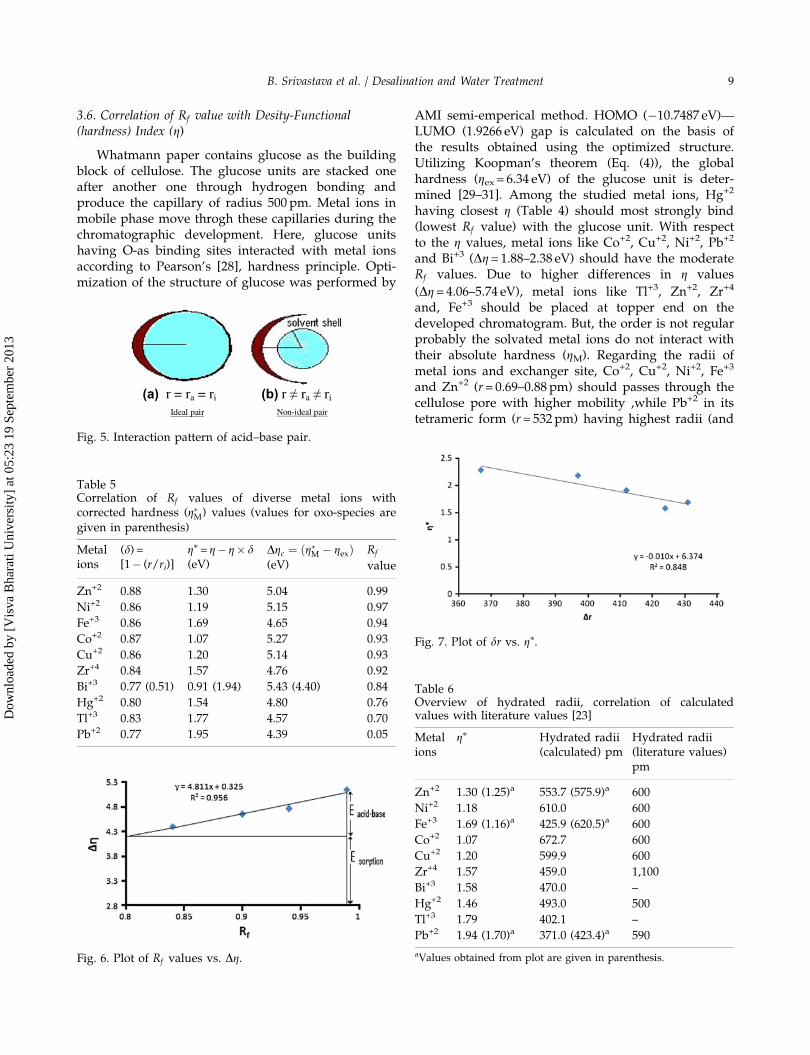
3.6. Correlation of Rf value with Desity-Functional(hardness) Index (g)
Whatmann paper contains glucose as the buildingblock of cellulose. The glucose units are stacked oneafter another one through hydrogen bonding andproduce the capillary of radius 500 pm. Metal ions inmobile phase move throgh these capillaries during thechromatographic development. Here, glucose unitshaving O-as binding sites interacted with metal ionsaccording to Pearson’s [28], hardness principle. Opti-mization of the structure of glucose was performed by
AMI semi-emperical method. HOMO (�10.7487 eV)—LUMO (1.9266 eV) gap is calculated on the basis ofthe results obtained using the optimized structure.Utilizing Koopman’s theorem (Eq. (4)), the globalhardness (gex = 6.34 eV) of the glucose unit is deter-mined [29–31]. Among the studied metal ions, Hg+2
having closest g (Table 4) should most strongly bind(lowest Rf value) with the glucose unit. With respectto the g values, metal ions like Co+2, Cu+2, Ni+2, Pb+2
and Bi+3 (Dg= 1.88–2.38 eV) should have the moderateRf values. Due to higher differences in g values
(Dg= 4.06–5.74 eV), metal ions like Tl+3, Zn+2, Zr+4
and, Fe+3 should be placed at topper end on thedeveloped chromatogram. But, the order is not regularprobably the solvated metal ions do not interact withtheir absolute hardness (gM). Regarding the radii ofmetal ions and exchanger site, Co+2, Cu+2, Ni+2, Fe+3
and Zn+2 (r= 0.69–0.88 pm) should passes through thecellulose pore with higher mobility ,while Pb+2 in itstetrameric form (r= 532pm) having highest radii (and
(a) (b)
Fig. 5. Interaction pattern of acid–base pair.
Fig. 6. Plot of Rf values vs. Dg.
Table 5Correlation of Rf values of diverse metal ions withcorrected hardness (g�M) values (values for oxo-species aregiven in parenthesis)
Metalions
(d) =[1� (r/ri)]
g⁄= g� g� d(eV)
Dgc ¼ ðg�M � gexÞ(eV)
Rf
value
Zn+2 0.88 1.30 5.04 0.99
Ni+2 0.86 1.19 5.15 0.97
Fe+3 0.86 1.69 4.65 0.94
Co+2 0.87 1.07 5.27 0.93
Cu+2 0.86 1.20 5.14 0.93
Zr+4 0.84 1.57 4.76 0.92
Bi+3 0.77 (0.51) 0.91 (1.94) 5.43 (4.40) 0.84
Hg+2 0.80 1.54 4.80 0.76
Tl+3 0.83 1.77 4.57 0.70
Pb+2 0.77 1.95 4.39 0.05
Fig. 7. Plot of dr vs. g⁄.
Table 6Overview of hydrated radii, correlation of calculatedvalues with literature values [23]
Metalions
g⁄ Hydrated radii(calculated) pm
Hydrated radii(literature values)pm
Zn+2 1.30 (1.25)a 553.7 (575.9)a 600
Ni+2 1.18 610.0 600
Fe+3 1.69 (1.16)a 425.9 (620.5)a 600
Co+2 1.07 672.7 600
Cu+2 1.20 599.9 600
Zr+4 1.57 459.0 1,100
Bi+3 1.58 470.0 –
Hg+2 1.46 493.0 500
Tl+3 1.79 402.1 –
Pb+2 1.94 (1.70)a 371.0 (423.4)a 590
aValues obtained from plot are given in parenthesis.
B. Srivastava et al. / Desalination and Water Treatment 9
Dow
nloa
ded
by [
Vis
va B
hara
ti U
nive
rsity
] at
05:
23 1
9 Se
ptem
ber
2013
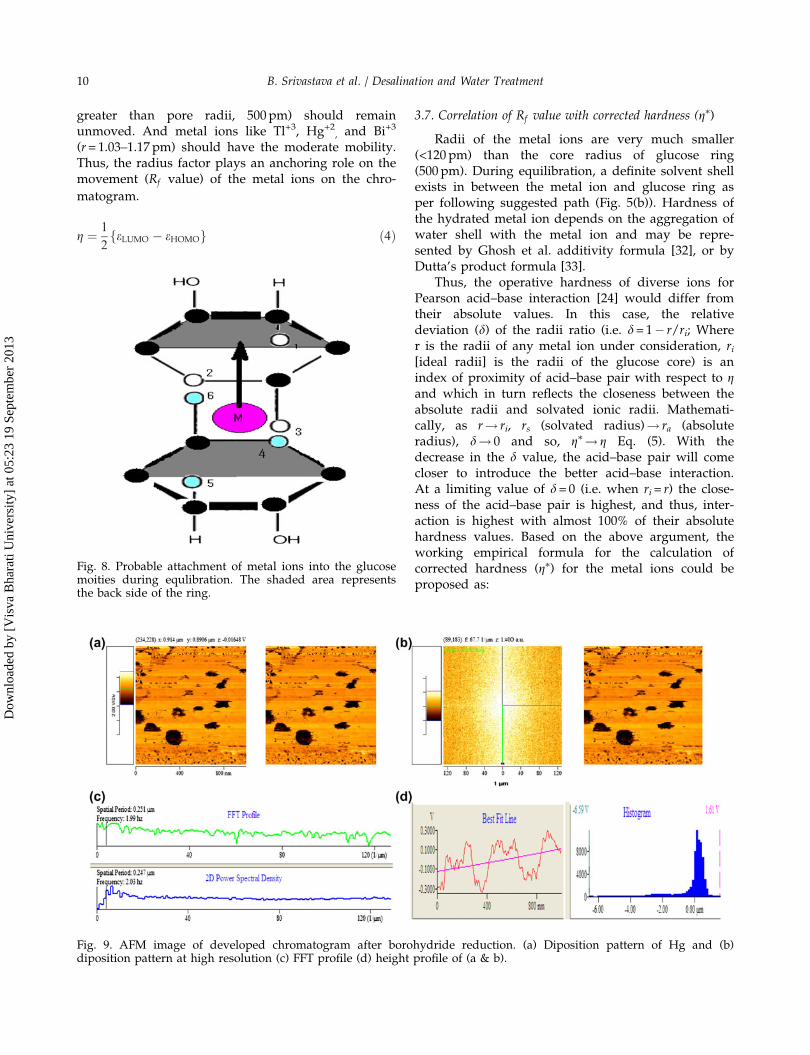
greater than pore radii, 500 pm) should remainunmoved. And metal ions like Tl+3, Hg+2, and Bi+3
(r= 1.03–1.17 pm) should have the moderate mobility.Thus, the radius factor plays an anchoring role on themovement (Rf value) of the metal ions on the chro-
matogram.
g ¼ 1
2feLUMO � eHOMOg ð4Þ
3.7. Correlation of Rf value with corrected hardness (g⁄)
Radii of the metal ions are very much smaller(<120 pm) than the core radius of glucose ring(500 pm). During equilibration, a definite solvent shellexists in between the metal ion and glucose ring asper following suggested path (Fig. 5(b)). Hardness ofthe hydrated metal ion depends on the aggregation ofwater shell with the metal ion and may be repre-sented by Ghosh et al. additivity formula [32], or byDutta’s product formula [33].
Thus, the operative hardness of diverse ions forPearson acid–base interaction [24] would differ fromtheir absolute values. In this case, the relativedeviation (d) of the radii ratio (i.e. d= 1� r/ri; Wherer is the radii of any metal ion under consideration, ri[ideal radii] is the radii of the glucose core) is anindex of proximity of acid–base pair with respect to gand which in turn reflects the closeness between theabsolute radii and solvated ionic radii. Mathemati-cally, as r! ri, rs (solvated radius)! ra (absoluteradius), d! 0 and so, g⁄! g Eq. (5). With thedecrease in the d value, the acid–base pair will comecloser to introduce the better acid–base interaction.At a limiting value of d= 0 (i.e. when ri= r) the close-ness of the acid–base pair is highest, and thus, inter-action is highest with almost 100% of their absolutehardness values. Based on the above argument, theworking empirical formula for the calculation ofcorrected hardness (g⁄) for the metal ions could beproposed as:
Fig. 8. Probable attachment of metal ions into the glucosemoities during equlibration. The shaded area representsthe back side of the ring.
Fig. 9. AFM image of developed chromatogram after borohydride reduction. (a) Diposition pattern of Hg and (b)diposition pattern at high resolution (c) FFT profile (d) height profile of (a & b).
10 B. Srivastava et al. / Desalination and Water Treatment
Dow
nloa
ded
by [
Vis
va B
hara
ti U
nive
rsity
] at
05:
23 1
9 Se
ptem
ber
2013
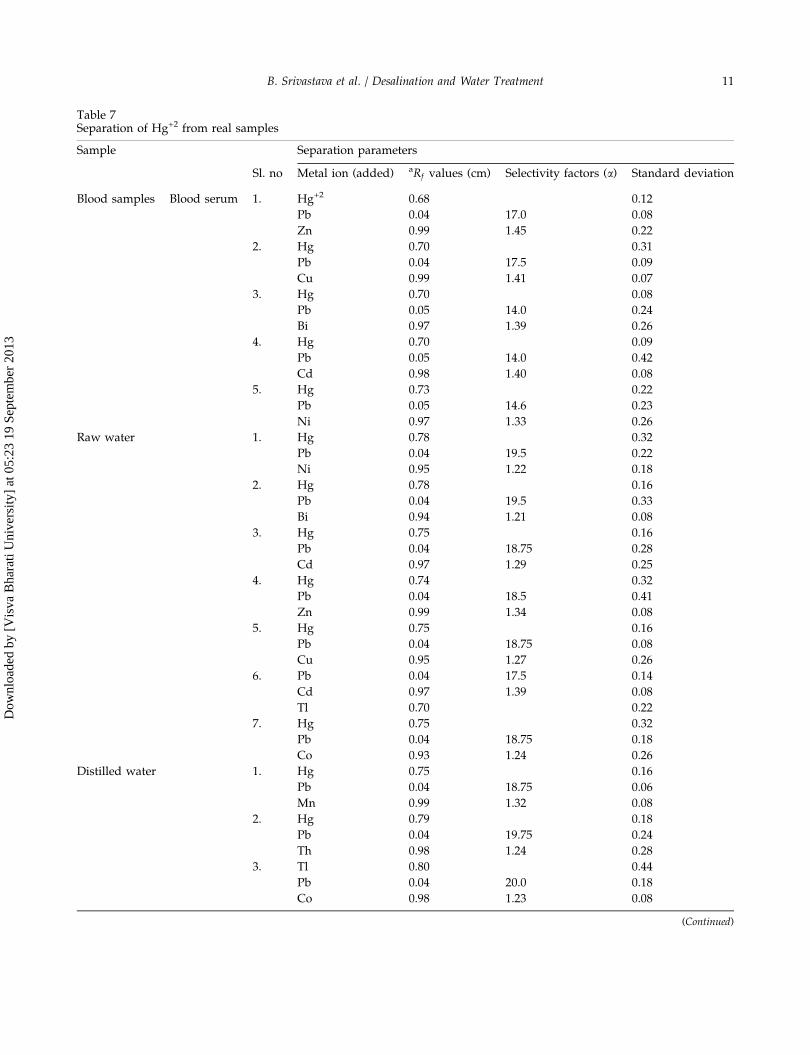
Table 7Separation of Hg+2 from real samples
Sample Separation parameters
Sl. no Metal ion (added) aRf values (cm) Selectivity factors (a) Standard deviation
Blood samples Blood serum 1. Hg+2 0.68 0.12
Pb 0.04 17.0 0.08
Zn 0.99 1.45 0.22
2. Hg 0.70 0.31
Pb 0.04 17.5 0.09
Cu 0.99 1.41 0.07
3. Hg 0.70 0.08
Pb 0.05 14.0 0.24
Bi 0.97 1.39 0.26
4. Hg 0.70 0.09
Pb 0.05 14.0 0.42
Cd 0.98 1.40 0.08
5. Hg 0.73 0.22
Pb 0.05 14.6 0.23
Ni 0.97 1.33 0.26
Raw water 1. Hg 0.78 0.32
Pb 0.04 19.5 0.22
Ni 0.95 1.22 0.18
2. Hg 0.78 0.16
Pb 0.04 19.5 0.33
Bi 0.94 1.21 0.08
3. Hg 0.75 0.16
Pb 0.04 18.75 0.28
Cd 0.97 1.29 0.25
4. Hg 0.74 0.32
Pb 0.04 18.5 0.41
Zn 0.99 1.34 0.08
5. Hg 0.75 0.16
Pb 0.04 18.75 0.08
Cu 0.95 1.27 0.26
6. Pb 0.04 17.5 0.14
Cd 0.97 1.39 0.08
Tl 0.70 0.22
7. Hg 0.75 0.32
Pb 0.04 18.75 0.18
Co 0.93 1.24 0.26
Distilled water 1. Hg 0.75 0.16
Pb 0.04 18.75 0.06
Mn 0.99 1.32 0.08
2. Hg 0.79 0.18
Pb 0.04 19.75 0.24
Th 0.98 1.24 0.28
3. Tl 0.80 0.44
Pb 0.04 20.0 0.18
Co 0.98 1.23 0.08
(Continued)
B. Srivastava et al. / Desalination and Water Treatment 11
Dow
nloa
ded
by [
Vis
va B
hara
ti U
nive
rsity
] at
05:
23 1
9 Se
ptem
ber
2013
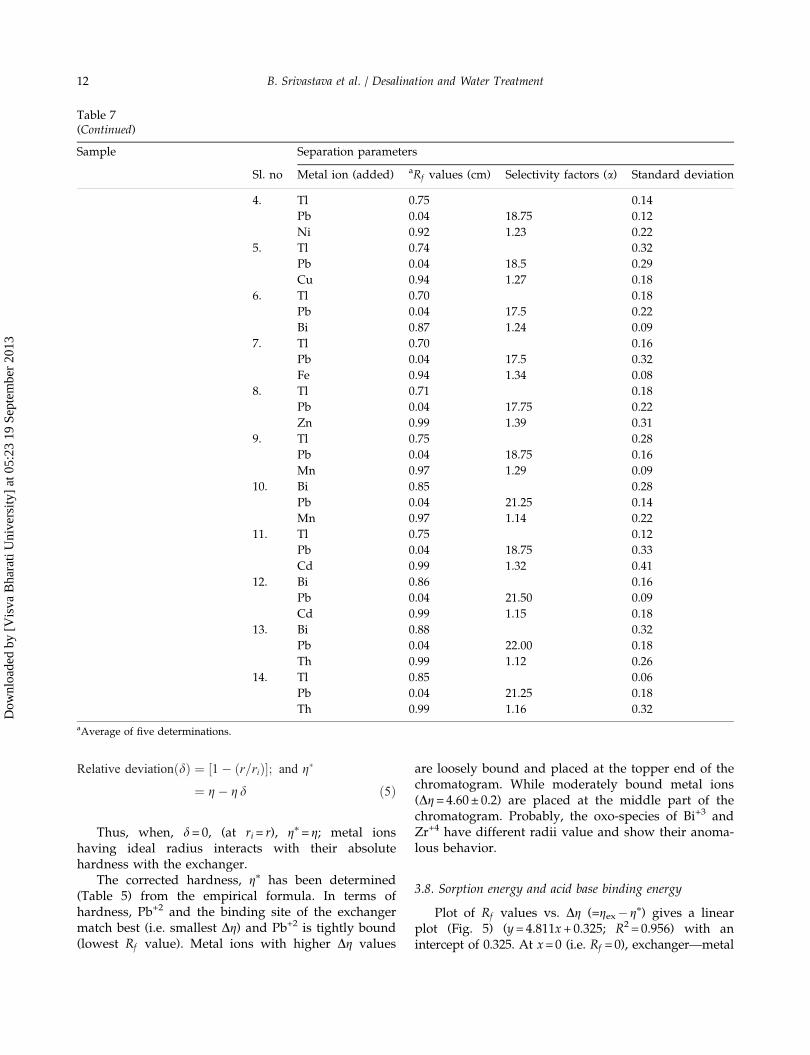
Relative deviationðdÞ ¼ ½1� ðr=riÞ�; and g�
¼ g� g d ð5Þ
Thus, when, d= 0, (at ri= r), g⁄= g; metal ionshaving ideal radius interacts with their absolutehardness with the exchanger.
The corrected hardness, g⁄ has been determined(Table 5) from the empirical formula. In terms ofhardness, Pb+2 and the binding site of the exchangermatch best (i.e. smallest Dg) and Pb+2 is tightly bound(lowest Rf value). Metal ions with higher Dg values
are loosely bound and placed at the topper end of thechromatogram. While moderately bound metal ions(Dg= 4.60 ± 0.2) are placed at the middle part of thechromatogram. Probably, the oxo-species of Bi+3 andZr+4 have different radii value and show their anoma-lous behavior.
3.8. Sorption energy and acid base binding energy
Plot of Rf values vs. Dg (=gex� g⁄) gives a linearplot (Fig. 5) (y= 4.811x+ 0.325; R2 = 0.956) with anintercept of 0.325. At x=0 (i.e. Rf =0), exchanger—metal
Table 7(Continued)
Sample Separation parameters
Sl. no Metal ion (added) aRf values (cm) Selectivity factors (a) Standard deviation
4. Tl 0.75 0.14
Pb 0.04 18.75 0.12
Ni 0.92 1.23 0.22
5. Tl 0.74 0.32
Pb 0.04 18.5 0.29
Cu 0.94 1.27 0.18
6. Tl 0.70 0.18
Pb 0.04 17.5 0.22
Bi 0.87 1.24 0.09
7. Tl 0.70 0.16
Pb 0.04 17.5 0.32
Fe 0.94 1.34 0.08
8. Tl 0.71 0.18
Pb 0.04 17.75 0.22
Zn 0.99 1.39 0.31
9. Tl 0.75 0.28
Pb 0.04 18.75 0.16
Mn 0.97 1.29 0.09
10. Bi 0.85 0.28
Pb 0.04 21.25 0.14
Mn 0.97 1.14 0.22
11. Tl 0.75 0.12
Pb 0.04 18.75 0.33
Cd 0.99 1.32 0.41
12. Bi 0.86 0.16
Pb 0.04 21.50 0.09
Cd 0.99 1.15 0.18
13. Bi 0.88 0.32
Pb 0.04 22.00 0.18
Th 0.99 1.12 0.26
14. Tl 0.85 0.06
Pb 0.04 21.25 0.18
Th 0.99 1.16 0.32
aAverage of five determinations.
12 B. Srivastava et al. / Desalination and Water Treatment
Dow
nloa
ded
by [
Vis
va B
hara
ti U
nive
rsity
] at
05:
23 1
9 Se
ptem
ber
2013
binding becomes maximum, and Dg should becomezero [28]. But, at x= 0; Dg= 0.325 eV (Fig. 6) indicatingthat at this recommended condition, exchanger—metalis not perfectly bound, and metal ion should be inmotion with an equivalent value of energy 0.325 eV.So, acid–base interaction behavior is not the sole fac-tor so far as the movement of the metal ions isconcerned. And, due to some sort of sorption behavior(act in opposite direction) it remains unmoved (Rf = 0)
with a threshold energy (sorption) of 0.325 eV(31.3 kJmol�1) and agreed well with literature values(45.67–68.72 kJmol�1 for the sorption of bivalent ionson single walled carbon nanotube having o-bindingsite) [34]. At x= 1 (i.e. Rf = 1), Dg= 5.136 eV is the
amount of total energy (Esorption +Eacid–base) requiredfor free movement of metal ions. The slope is thedesorption tendency (Kdesorption) with a constant valueof 0.048� 102. Here, Eacid–base is a function of move-ment of metal ions (Rf values) on the chromatogram.
3.9. Determination of hydrated radii from correctedhardness (g⁄)
The Eq. (5) can be represented as:
g� ¼ g� g� ðri � rÞ=ri; i:e:g� ¼ g� g� Dr=ri ð6Þ
where Dr represent the solvent shell as per Fig. 5.Thus, there is a linear relationship between Dr and
g⁄. Plot of Dr (difference between solvated radii and
absolute radii of metal ion, rs� ra) vs. g⁄ gives a linear
plot (y=�0.010x+ 6.374) with an intercept of 6.374(Fig. 7). Here, the variation of Dr has been made bychanging radii of the metal ion. At Dr= 0, solvatedradii is equal to absolute radii (Fig. 5) and at this rec-ommended condition, g⁄ should approach to g (abso-lute hardness). From the corrected g⁄, the hydratedradii of the metal ions have been determined by thefollowing relationship (Eq. (7)), and these calculatedvalues (Table 6) agreed well with the Kiland values[23],
g ¼ 1=2r ð7Þ
where g=hardness and r= radii.
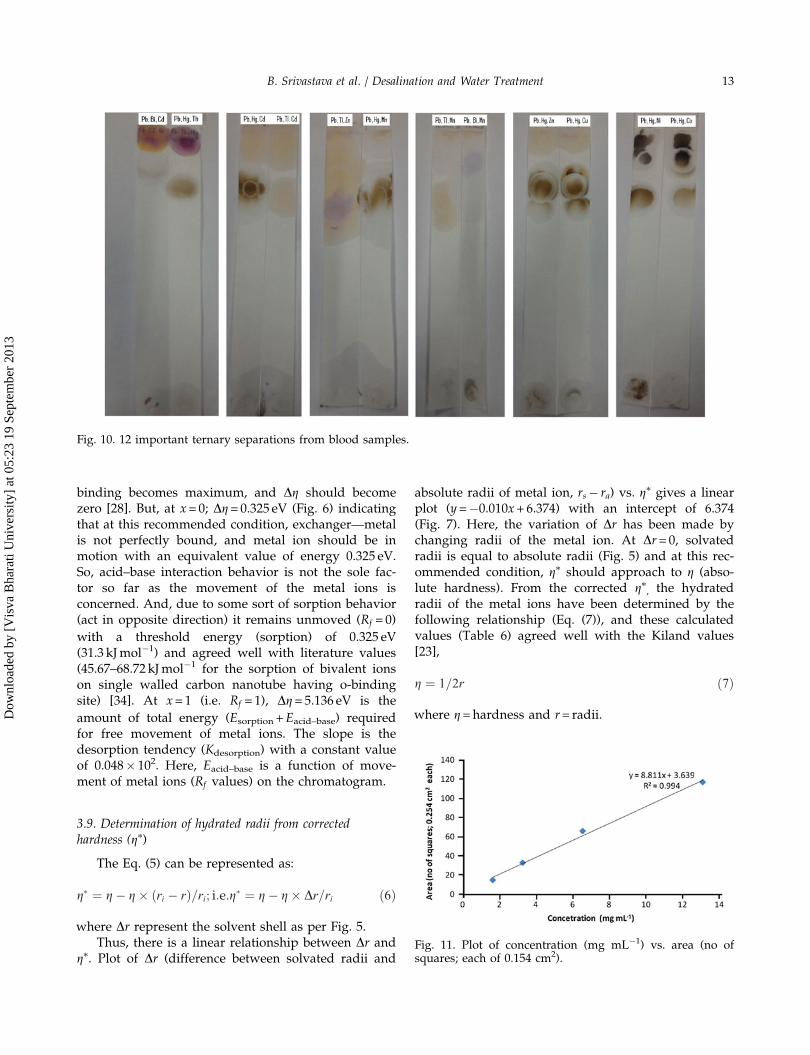
Fig. 10. 12 important ternary separations from blood samples.
Fig. 11. Plot of concentration (mg mL�1) vs. area (no ofsquares; each of 0.154 cm2).
B. Srivastava et al. / Desalination and Water Treatment 13
Dow
nloa
ded
by [
Vis
va B
hara
ti U
nive
rsity
] at
05:
23 1
9 Se
ptem
ber
2013
3.10. Probable mechanistic path
The morphological characters and sizes ofdiposited Hg on the chromatogram were determinedby SEM and atomic force microscopy (AFM, VEECO,dicpII). Solvated metal ions moves through the microcapillaries so produced by the stacking of glucosemolecules one after another one as per the probablemechanistic path (Fig. 8). During the movement metalions that which are present in between the twoglucose rings, interact through hard-soft nature ofbinding with the oxygen sites (1, 2, 3 of one glucosering and 4, 5, 6 of the second glucose ring) of theexchanger. Generally, metal ions are of lower in sizein comparison with the capillari size. In such cases,the solvent core that is present in between the metalion and exchange site is dragging the ions and keepsthem in motion. Differential migration of the ionscorrelates with the variation in solvent (mobile phase)core for the diverse ions. High-resolution AFM imagesof the chromatogram also unambiguously confirm thediscontinuous diposition of Hg (Fig. 9(a) and (d)) andsupports the probable mechanistic path.
3.11. Separation of mercury from real samples
The effectiveness of the proposed method wasjudged by separating Hg+2 from raw water (well,pond, and tap) samples. The feasibility of the processwas tested by separating Hg+2 from human blood sam-ples containing diverse congeners for its serologicalsample analysis. Results are given in Table 7. And theseparation profiles are given in Fig. 10.
3.12. Estimation of unknown concentration of Hg(II)
Systematic studies have been made on area of thespot on chromatogram at the range of concentration13.1–3.275mgmL�1 of Hg(II). The developed area onthe chromatogram was measured and plot of concen-tration vs. area generates a straight line (y= 8.811x+ 3.639; R2 = 0.994) (Fig. 11). The concentration of anunknown analyte was determined from the plot. Thevalues (synthetic solution: 4.38; raw water: 4.52; andtap water: 4.48mgmL�1) are compatible (relativeerror: 1.60 ± 0.66 and relative standard deviation: 2.63± 0.46) with standard values (4.42mgmL�1) obtainedcomplexometrically [35].
4. Conclusions
The proposed borohydride reduction method formetal ion detection on chromatogram is simple, rapid,selective, eco-friendly, and cost-effective. Alkali and
alkaline earths do not interfere the detection of Hg(II)by borohydride reduction on the chromatogram. Cleanseparations (aP 1.21) of Hg(II) have been achievedfrom several toxic and heavy metal ions like Pb(II), Fe(III), Cu(II), Zn(II), Ni(II), Bi(III), Tl(III), Zr(IV), and Cd(II) in synthetic multicomponent mixtures. Clean sepa-ration of Hg(II) has also been achieved from bloodserum and platelets containing chemical congenerswhich appear to be highly applicable to forensic sero-logical and toxicological analysis. Sorption energy,acid-base-binding energy and hydrated radii have beendetermined from Density Functional (hardness) Indexand their values agree well with the literature values.
Acknowledgments
The authors wish to thank UGC-SAP, New Delhi,India and Department of Chemistry, Visva-Bharati,Santiniketan, India for financial support.
References
[1] N.J. Modi, Modi’s Text Book of Medical Jurisprudence andToxicology, 20th ed., N. M. Tripathi Pvt. Ltd., Bookshellers,Mumbai, 1977.
[2] WHO, Environmental Health Criteria 86. Mercury—Environ-mental Aspects, World Health Organization, Geneva, 1989.
[3] Encyclopedia Britannica Yearbook, Yearbook of Science andthe Future, March, 1980.
[4] O. Lindquist, A. Jernelov, K. Johannson, R. Rodhe, Mercury inthe Swedish Environment, National, 1984. Global and localsources, report 1816, National Swedish EnvironmentalProtection Agency, Stockholm, 121. As cited by von Rein andHylander (2000).
[5] M. Morita, J. Yoshinaga, J.S. Edmonds, The determination ofmercury species in environmental and biological samples(technical report), Pure Appl. Chem. 70(8) (1998) 1585–1615.
[6] C.E. Oda, J.D. Ingle, Continuous flow cold vapor atomicabsorption determination of mercury, Anal. Chem. 53 (1981)2030–2033.
[7] M.J. Low, J.C. Wei, S. Yeh, Preconcentration of mercury, goldand copper in sea water with lead dithiocarbamate forneutron activation, J. Anal. Chem. 49 (1977) 1146–1150.
[8] T. Nedeltcheva, L. Kostadinova, N. Elenkova, M. Attannes-ova, K. Mineva, Determination of copper and cadmium traceelements in phosphates in stripping voltametry, Anal. Lab. 3(1994) 102–104.
[9] M. Tsubonchi, Spectrophotometric determination of traceamounts of mercury (II), Anal. Chem. 42 (1970) 1087–1090.
[10] R.E. Mansell, E. Hunemorder, A photometric method fortrace determination using Beckman, DU spectrophotometer,J. Anal. Chem. 35 (1963) 1981–1981.
[11] A. Ciucci, M. Corsi, V. Palleschi, S. Rastelli, A. Salvetti,E. Tognoni, New procedures for quantitative elemental analy-sis by laser-induced plasma spectroscopy, Appl. Spectrosc. 53(1999) 960–964.
[12] B. Mandal, U.S. Roy, D. Datta, N. Ghosh, Combined cation-exchange and extraction chromatographic method ofpre-concentration and concomitant separation of Cu(II) withhigh molecular mass liquid cation exchanger after its onlinedetection, J. Chromatogr. A 1218 (2011) 5644–5652.
[13] B. Mandal, N. Ghosh, Combined cation-exchange andextraction chromatographic method of pre-concentration andconcomitant separation of bismuth(III) with high molecularmass liquid cation exchanger, J. Hazard. Mater. 182 (2010)363–370.
14 B. Srivastava et al. / Desalination and Water Treatment
Dow
nloa
ded
by [
Vis
va B
hara
ti U
nive
rsity
] at
05:
23 1
9 Se
ptem
ber
2013
[14] B. Mandal, N. Ghosh, Extraction chromatographic method ofpreconcentration and separation of lead (II) with high molec-ular mass liquid cation exchanger, Desalination 250 (2010)506–514.
[15] L. Carrasco, S. Dı́ez, J.M. Bayona, Simultaneous determinationof methyl- and ethyl-mercury by solid-phase microextractionfollowed by gas chromatography atomic fluorescence detec-tion, J. Chromatogr. A 1216 (2009) 8828–8834.
[16] S.N. Tewari, Analysis of inorganic compounds by paperchromatography: The separation and detection Of Cu, Ni, Co,Hg, Ag and Pb, Colloid Polym. Sci. 135 (1954) 159–160.
[17] N.N. Hemanand, N.V. Nanda Kumar, Detection ofcompounds of mercury, cadmium and copper by baker’s dryyeast enzyme inhibition, MEJSR 6(2) (2010) 152–156.
[18] J.N. Bartlett, G.W. Curtis, Paper chromatography of organicmercury compounds, Anal. Chem. 34(1) (1962) 80–82.
[19] M. Qureshi, M.A. Khan, Fast paper chromatography of differ-ent valence states of mercury and antimony, Anal. Chem. 35(13) (1963) 2050–2052.
[20] J.G. Dorsey, Solvatochromic investigation of chromatographicretention mechanisms, J. Chromatogr. A 2(5) (1987) 37–41.
[21] A.J.P. Martin, R.L.M. Synge, A new form of chromatogramemploying two liquid phases, Biochem. J. 35 (1941) 1357–1368.
[22] J.J.V. Deemter, F.J. Zuiderweg, A. Klinkenberg, Longitudinaldiffusion and resistance to mass transfer as causes of nonide-ality in chromatography, Chem. Eng. Sci. 5 (1956) 271–289.
[23] J. Kielland, Activity coefficients of ions in aqueous solutions,J. Am. Chem. Soc. 59 (1937) 1675–1678.
[24] R.G. Pearson, Hard and soft acids and bases, J. Am. Chem.Soc. 85 (1963) 3533–3543.
[25] K. Nakamoto, Infrared and Raman Spectra of Inorganic andCoordination Compounds, Part B, 5th ed., (John Wiley). pp.59–61 1977.
[26] P. Atkins, J. Paula, Atkins’ Physical Chemistry, Interna-tional Student Edition, 8th ed., Oxford University Press,Oxford, 2006, pp. 77–117.
[27] F.A. Cotton, G. Wilkinson, Advanced Inorganic Chemistry,5th ed., John Wiley, New York, NY,. pp. 175–380, 598–607,692–920 1998.
[28] R.G. Pearson, Acids and bases, Science 151 (1966) 172–177.[29] R.S. Muliken, Molecular compounds and their spectra, J. Am.
Chem. Soc. 74 (1952) 811–824.[30] R.G. Pearson, Hard and Soft Acids and Bases, Dowden
(Ed.), Hutchinson and Ross, Stroudsville, PA, 1973.[31] R.G. Pearson, Absolute electronegativity and hardness: Appli-
cation to inorganic chemistry, Inorg. Chem. 27 (1988) 734–740.[32] W. Yang, C. Lee, S.K. Ghosh, Molecular softness as the
average of atomic softnesses: Companion principle to thegeometric mean principle for electronegativity equalization, J.Phys. Chem. 89 (1985) 5412–5415.
[33] D. Dutta, Geometric mean principle for hardness equaliza-tion, a corollary of Sanderson’s geometric mean principle ofelectronegativity equalization, J. Phys. Chem. 90 (1986)4216–4217.
[34] O. Moradi, K. Zare, M. Yari, Interaction of some heavy metalions with single walled carbon nanotube, Int. J. Nano Dim.1(3) (2011) 203–220.
[35] I. Persson, Hydrated metal ions in aqueous solution: Howregular are their structures? Pure Appl. Chem. 82(10) (2010)1901–1917.
B. Srivastava et al. / Desalination and Water Treatment 15
Dow
nloa
ded
by [
Vis
va B
hara
ti U
nive
rsity
] at
05:
23 1
9 Se
ptem
ber
2013