Environmental energy and evolutionary rates in flowering plants
Upload
khangminh22Category
view
1download
0
DETECTION OF ANCIENT GENOME DUPLICATIONS IN SEVERAL FLOWERING PLANT
LINEAGES AND SYNTE-MOLECULAR COMPARISON OF HOMOLOGOUS REGIONS
by
JINGPING LI
(Under the Direction of Andrew H. Paterson)
ABSTRACT
Flowering plants have evolved through repeated ancient genome duplications (or paleo-
polyploidies) for ~200 million years, a character distinct from other eukaryotic lineages. Paleo-duplicated
genomes returned to diploid heredity by means of extensive sequence loss and rearrangement. Therefore
repeated paleo-polyploidies have left multiple homeologs (paralogs produced in genome duplication) and
complex networks of homeology in modern flowering plant genomes. In the first part of my research
three paleo-polyploidy events are discussed. The Solanaceae “T” event was a hexaploidy making extant
Solanaceae species rare as having derived from two successive paleo-hexaploidies. The Gossypium “C”
event was the first paleo-(do)decaploidy identified. The sacred lotus (Nelumbo nucifera) was the first
sequenced basal eudicot, which has a lineage-specific “λ” paleo-tetraploidy and one of the slowest lineage
evolutionary rates. In the second part I describe a generalized method, GeDupMap, to simultaneously
infer multiple paleo-polyploidy events on a phylogeny of multiple lineages. Based on such inferences the
program systematically organizes homeologous regions between pairs of genomes into groups of
orthologous regions, enabling synte-molecular analyses (molecular comparison on synteny backbone) and
graph representation. Using 8 selected eudicot and monocot genomes I showed this framework of
multiple paleo-polyploidy detection and synte-molecular network facilitates genomic comparisons among
flowering plants and reveals deep correspondences among their genome structure.
INDEX WORDS: Ancient genome duplication, Paleo-polyploidy, Synteny, Synte-molecular comparison, Genome evolution, Flowering plants

DETECTION OF ANCIENT GENOME DUPLICATIONS IN SEVERAL FLOWERING PLANT
LINEAGES AND SYNTE-MOLECULAR COMPARISON OF HOMOLOGOUS REGIONS
by
JINGPING LI
B.S., Zhejiang University, China, 2005
A Dissertation Submitted to the Graduate Faculty of
The University of Georgia in Partial Fulfillment
of the Requirements for the Degree
DOCTOR OF PHILOSOPHY
ATHENS, GEORGIA
2014

© 2014
Jingping Li
All Rights Reserved

DETECTION OF ANCIENT GENOME DUPLICATIONS IN SEVERAL FLOWERING PLANT
LINEAGES AND SYNTE-MOLECULAR COMPARISON OF HOMOLOGOUS REGIONS
by
JINGPING LI
Major Professor: Andrew H. Paterson
Committee: Michael Arnold
Jessica Kissinger
Rodney Mauricio
Paul Schliekelman
Electronic Version Approved:
Julie Coffield
Interim Dean of the Graduate School
The University of Georgia
December 2014

!
!
iv
DEDICATION
To my parents.
.

!
!
v
ACKNOWLEDGEMENTS
I would like to thank generous support from the University of Georgia Graduate School
Assistantship for my first 21 months of study. I am deeply grateful to my advisor Dr. Andrew Paterson
for guiding me through the intellectual quest of graduate school, and providing me with precious funding
and opportunities to participate in several fascinating research projects. I would like to thank many
current and previous lab members, and fellow students for lots of direct and indirect help. I am also
thankful to many professors in the Institute of Bioinformatics whose wonderful courses prepared me with
both biological and computational skills necessary for my research. Last but not least I would like to
thank my great committee members for their valuable time and insights into my dissertation research.

!
!
vi
TABLE OF CONTENTS
Page
ACKNOWLEDGEMENTS ……………………………………………………………………………… v
LIST OF TABLES ………………………………………………………………………………………. ix
LIST OF FIGURES ……………………………………………………………………………………… x
CHAPTER 1 INTRODUCTION AND LITERATURE REVIEW …………………………………… 1
1.1 Dissertation structure and related publications ………………………………………………… 2
1.2 Brief overview of flowering plant phylogeny ………………………………………………… 4
1.3 Repeated ancient genome duplications prevalent in flowering plant evolution ……………… 6
1.4 Methodological development for homeologous region detection and ancient genome
duplication inference ………………………………………………………………………… 11
1.5 Ancient genome duplications identified in sequenced flowering plant lineages ……………… 13
1.6 Framework of plant genome comparison ……………………………………………………… 17
CHAPTER 2 TWO PALEO-HEXAPLOIDIES UNDERLIE FORMATION OF MODERN
SOLANACEAE GENOME STRUCTURE……………………………………………………………… 18
2.1 Preface ………………………………………………………………………………………… 19
2.2 Abstract………………………………………………………………………………………… 21
2.3 Introduction …………………………………………………………………………………… 21
2.4 Methods to identify paleo-polyploidy ………………………………………………………… 23
2.5 The paleo-hexaploidy T: triplication of the Solanaceae ancestral genome …………………… 24
2.6 Further circumscribing the T event using additional asterid genomes………………………… 26
2.7 A more ancient hexaploidy γ predated divergence of rosid and asterid plants………………… 34
2.8 The nature and consequences of the γ and T paleo-hexaploidy events………………………… 35
2.9 Summary and perspective……………………………………………………………………… 38

!
!
vii
CHAPTER 3 A WELL-RETAINED ANCIENT GENOME DUPLICATION IN THE SLOWLY
EVOLVING BASAL EUDICOT NELUMBO (LOTUS) LINEAGE …………………………………… 40
3.1 Introduction …………………………………………………………………………………… 40
3.2 A lineage-specific paleo-tetraploidy (λ) after divergence with core eudicots ………………… 41
3.3 Slow lineage evolutionary rate ………………………………………………………………… 44
3.4 Outgroup for core eudicot and monocot genome comparisons ……………………………… 45
3.5 Discussion……………………………………………………………………………………… 49
CHAPTER 4 THE PAN-GOSSYPIUM PALEO-POLYPLOIDY AND TWO NUMT REGIONS
IN TWO OF THE SUBGENOMES IN MODERN G. RAIMONDII ………………………………… 54
4.1 Abstract………………………………………………………………………………………… 54
4.2 Introduction …………………………………………………………………………………… 55
4.3 Methods………………………………………………………………………………………… 57
4.4 Results ………………………………………………………………………………………… 59
4.5 Discussion……………………………………………………………………………………… 67
4.6 Conclusion …………………………………………………………………………………… 73
CHAPTER 5 TWO PALEO-TETRAPLOIDIES IN ANCIENT GRASS AND MONOCOT
LINEAGES ……………………………………………………………………………………………… 75
5.1 Introduction …………………………………………………………………………………… 75
5.2 Overview of synteny conservation in studied genomes ……………………………………… 76
5.3 Circumscribing the pan-grass σ duplication event …………………………………………… 78
5.4 Circumscribing the pre-commelinid τ duplication event in early monocots ………………… 79
5.5 The value of ancestral gene order in genome comparisons …………………………………… 80
5.6 Variation of lineage nucleotide evolutionary rates and estimated ages of σ and τ …………… 81
5.7 Origins of high GC3 genes in grasses ………………………………………………………… 84
CHAPTER 6 GeDupMap: SIMULTANEOUS DETECTION OF MULTIPLE ANCIENT GENOME
DUPLICATIONS AND A SYNTE-MOLECULAR FRAMEWORK ………………………………… 87

!
!
viii
6.1 Abstract ……………………………………………………………………………………… 87
6.2 Introduction …………………………………………………………………………………… 88
6.3 Methods ……………………………………………………………………………………… 89
6.4 Results ………………………………………………………………………………………… 96
6.5 Discussion …………………………………………………………………………………… 102
6.6 Conclusion …………………………………………………………………………………… 104
CHAPTER 7 CONCLUSION AND PERSPECTIVE ……………………………………………… 106
7.1 Structural evolution of paleo-polyploid angiosperm genomes ……………………………… 106
7.2 Effective synte-molecular comparisons of related plant genomes …………………………… 108
7.3 Closing remarks ……………………………………………………………………………… 109
REFERENCES ………………………………………………………………………………………… 111

!
!
ix
LIST OF TABLES
Page
Table 1.1: Paleo-polyploidy events identified in sequenced angiosperm genomes……………………… 14
Table 3.1: Distribution of lotus loci at different paleo-polyploidy depths ……………………………… 43
Table 4.1: Mean synonymous substitution rate (Ks) values between syntenic gene pairs ……………… 66
Table 5.1: Sources and basic information of angiosperm genomes used in this study. ………………… 77
Table 5.2: Summary of synteny blocks in the six studied genomes. …………………………………… 78
Table 6.1: Sources and basic information of angiosperm genomes used in this study ………………… 96

!
!
x
LIST OF FIGURES
Page
Figure 1.1: Different models to form (paleo)hexaploidy. ………………………………………………… 8
Figure 2.1: The Solanum whole genome triplication …………………………………………………… 20
Figure 2.2: Histograms of Ks (nucleotide substitutions per synonymous site) between paralogous and
orthologous gene pairs in tomato, monkey flower, bladderwort, and grape ………………… 28
Figure 2.3: Simplified cladogram of some representative asterid and outgroup lineages ……………… 29
Figure 2.4: Alignment of tomato and kiwifruit genomes ……………………………………………… 30
Figure 2.5: Alignment of tomato and monkey flower genomes ………………………………………… 31
Figure 2.6: LASTZ alignment between the coffee BAC region and tomato genome…………………… 33
Figure 2.7: Schematic representation of orthologous and paralogous regions in tomato (S. lycopersicum)
and potato (S. tuberosum) genomes. ………………………………………………………… 37
Figure 3.1: Dot plot alignment of the lotus and grape genomes ………………………………………… 42
Figure 3.2: Distribution of synonymous substitution rate (Ks) between homeologous gene pairs in
intra- and inter- genomic comparisons ……………………………………………………… 44
Figure 3.3: Number and percentage of genes in the query genomes having homeologous genes in the
reference genome …………………………………………………………………………… 47
Figure 3.4: Multiple alignment of a set of syntenic regions in papaya, peach, grape and lotus ………… 48
Figure 3.5: Ks distributions between orthologous homeologs gene pairs comparing the lotus genome
to the grape genome (a) and sorghum genome (b) ………………………………………… 50
Figure 3.6: Differences in mRNA length, CDS length, intron length, and percentage mRNA length
difference attributable to intron length difference ………………………………………… 51
Figure 4.1: Example alignment showing syntenic relationships among five cotton subgenomic regions
and their single orthologous regions in cacao and grape, respectively ……………………… 60

!
!
xi
Figure 4.2: Box and whisker plots showing distributions of synteny block median Ks and block span… 62
Figure 4.3: Histograms of ancestral loci retention rates in the 5 C-subgenomes ……………………… 63
Figure 4.4: Box and whisker plots showing distributions of exon number, gene length, protein length,
and third codon GC content among genes in the 5 cotton subgenomes …………………… 64
Figure 4.5: Distributions of synonymous substitution rates (Ks) among groups of cotton homeologous
gene pairs, and orthologous gene pairs between cotton-Arabidopsis, cotton-cacao, cacao-
Arabidopsis ………………………………………………………………………………… 68
Figure 4.6: Cross tissue heatmap of gene expression levels in maize NUMT and control regions……… 72
Figure 5.1: Genome comparison on a phylogeny of paleo-polyploidized angiosperms ………………… 80
Figure 5.2: Distributions of synonymous substitution rates (Ks) among groups of orthologous or
paralogous (homeologous) gene pairs. ……………………………………………………… 83
Figure 5.3: Histograms of third codon position GC content (GC3) in rice genes. ……………………… 85
Figure 6.1: Overview of GeDupMap procedure ………………………………………………………… 90
Figure 6.2: Refinement of PAR groups ………………………………………………………………… 93
Figure 6.3: Paleo-polyploidy inference on each branch of input species phylogeny …………………… 98
Figure 6.4: Homeolog depths (paleo-polyploidy levels) of genomic regions in the eight genomes … 101
Figure 6.5: Size distributions of DupR (duplication resistant) and DelR (deletion resistant) regions
in studied genomes and simulated random genomes ……………………………………… 102

!
!
1
CHAPTER 1 INTRODUCTION AND LITERATURE REVIEW
Flowering plants, or angiosperms, the Earth’s most successful vegetation, dominate most terrestrial and
semiaquatic habitats, and inhabit many aquatic habitats. They form the most abundant group of all plants,
including more than 80% of known plant species. In total there are more than 270,000 recorded species of
angiosperms (for example compared to about 75,000 species of chordates). The enormous number and
ubiquitous distribution of flowering plants are equated with their astonishing diversity and adaptation,
such as those exhibited in ranges from Colobanthus quitensis (Antarctic pearlwort) to Lecythis ampla
(rainforest emergent), from cactus (desert specialist) to Zostera (marine eelgrass), from Wolffia (flower <
0.5mm in diameter) to Rafflesia (flower one meter in diameter), from Spartina alterniflora (salt mashes
specialist) to Saxifraga oppositifolia (blooming in highest mountains), from the “all-healing” Panax
ginseng to the carnivorous Nepenthes (pitcher plants). Diverse characters of flowering plants have been
associated with human society from its birth, and are now indispensable ingredients in almost all aspects
of human society. It is of great interest and efforts to study flowering plants.
Despite their tremendous diversity, the majority of research so far indicated that all modern
angiosperm species evolved from a crown group common ancestor, which likely lived in the Jurassic
period (Bell, Soltis, & Soltis, 2010; D. E. Soltis et al., 2009; Wikstrom, Savolainen, & Chase, 2001) about
200~145 MYA (million years ago). While evolutionary rates of different angiosperm lineages are variable
and generally more rapid than animals, this is nonetheless recent enough that comparative approaches are
especially useful to reveal homologous and unique characters across the flowering plant phylogeny.
An early and fundamental observation about plant genome structure is that most angiosperm
genomes are paleo-polyploid (V. Grant, 1981; Masterson, 1994; G. L. Stebbins, 1966). While having
disomic inheritance now, these genomes possess multiple homologous loci retained from one or more
paleo-polyploidy, or ancient genome duplication, events. In fact, many angiosperm genomes experienced
!
!
2
repeated paleo-polyploidies, followed by extensive gene loss and genome rearrangement in the
“diploidization” processes that restored them to disomy and generally low chromosome numbers. As a
result, there are high and variable levels of genomic redundancy and complex ‘networks’ of gene
synteny/colinearity among duplicated regions, making alignment of angiosperm genomes surprisingly
difficult. Accordingly, it is essential to know the paleo-polyploidy history as the prerequisite to
angiosperm genome comparisons and downstream analyses, for example, to study the evolution of
specific gene families, genomic architecture of some traits, or to transfer knowledge from model to non-
model organisms. These goals fully rely on accurate and sensitive paleo-polyploidy inference and
homologous loci mapping.
1.1 Dissertation structure and related publications
My dissertation describes two main results: 1. Identification and characterization of three paleo-
polyploidy (ancient genome duplication) events, including the first characterized paleo-polyploidy and
paleo-hexaploidy in asterid plants (Chapter 2), the first identified paleo-(do)decaploidy (Chapter 4), and
the first identified paleo-polyploidy in basal eudicots (Chapter 3), and circumscription of two paleo-
tetraploidies in monocots (Chapter 5); 2. The GeDupMap program (Chapter 6) for simultaneous detection
of multiple paleo-polyploidies in multiple lineages, and a synte-molecular framework for detailed
comparison of those genomes.
The dissertation starts with this introduction chapter to lay out the necessary background for my
research, and lead to the questions I aimed to answer. Then Chapters 2, 3, 4 discuss three newly identified
paleo-polyploidy events, which I contributed initially as part of their reference genome projects: the
Solanaceae “T” event (in the tomato genome sequencing project (Tomato Genome Consortium, 2012)),
the Gossypium “C” event (in the cotton genome sequencing project (Paterson et al., 2012)), and the
Nelumbo “λ” event (in the sacred lotus genome sequencing project (Ming et al., 2013)). These analyses
were done in collaboration with former and current lab members Haibao Tang (tomato, cotton, lotus),
Xiyin Wang (tomato, cotton), and John E. Bowers (lotus). It should be noted that Haibao Tang is

!
!
3
responsible for the initial discovery that the Solanaceae paleo-polyploidy is a hexaploidy rather than a
tetraploidy. Chapter 5 describes circumscription of two monocot paleo-tetraploidies using synteny
patterns of four monocot genomes (rice, sorghum, oil palm, banana) and two outgroup eudicot genomes
(grape, lotus). Chapter 6 is about a Python program GeDupMap I wrote which for the first time enables
simultaneous detection of multiple paleo-polyploidy events in multiple lineages. The algorithm is based
on mapping of syntenic regions between the input genomes, and also sorts out related regions across the
input genomes, which can then be represented in novel graph formats such as the A Bruijn graph. This
synte-molecular framework facilitates alignments of local regions, genes, and nucleotide sequences
among those genomes. Using this framework I also identified genomic regions that are ‘deletion-resistant’
or ‘duplication-resistant’ across repeated paleo-polyploidies. Finally Chapter 7 summarizes major results
of the dissertation and gives a short perspective.
Of this dissertation Chapters 1, 3, 5, 7 contain partial contents from my publications listed below.
In those papers only my sections were included here while those from other co-authors were excluded. In
many cases the contents have been re-organized to better fit in this dissertation. Chapter 2 is a re-print of a
to-be-published book chapter (J. Li, Tang, Wang, & Paterson), except the preface. Copyright permissions
have been requested from the respective journals. Chapters 4 and 6 are two manuscripts soon to be
submitted.
List of my publications related to this dissertation:
• Li, J., Tang, H., Wang, X., & Paterson, A. H. Two paleo-hexaploidies underlie formation of
modern Solanaceae genome structure. In M. Causse, J. Giovannoni, M. Bouzayen & M. Zouine
(Eds.), Compendium of Plant Genomes: The Tomato Genome: Springer. (in print)
• Li, J., Tang, H., Bowers, J. E., Ming, R., & Paterson, A. H. (2014). Insights into the Common
Ancestor of Eudicots. In A. H. Paterson (Ed.), Genomes of Herbaceous Land Plants (Vol. 69, pp.
137-174): Elsevier.
• Paterson, A. H., Wang, X., Li, J., & Tang, H. (2012). Ancient and Recent Polyploidy in

!
!
4
Monocots. In P. S. Soltis & D. E. Soltis (Eds.), Polyploidy and Genome Evolution (pp. 93-108):
Springer Berlin Heidelberg.
• Jiao, Y., Li, J., Tang, H., & Paterson, A. H. (2014). Integrated syntenic and phylogenomic
analyses reveal an ancient genome duplication in monocots. Plant Cell, 26(7), 2792-2802.
• Ming, R., Vanburen, R., Liu, Y., Yang, M., Han, Y., et al. (2013). Genome of the long-living
sacred lotus (Nelumbo nucifera Gaertn.). Genome Biol, 14(5), R41.
• Tomato Genome Consortium. (2012). The tomato genome sequence provides insights into fleshy
fruit evolution. Nature, 485(7400), 635-641.
• Paterson, A. H., Wendel, J. F., Gundlach, H., Guo, H., Jenkins, J., et al. (2012). Repeated
polyploidization of Gossypium genomes and the evolution of spinnable cotton fibres. Nature,
492(7429), 423-427.
• Wang, X., Wang, H., Wang, J., Sun, R., Wu, J., et al. (2011). The genome of the mesopolyploid
crop species Brassica rapa. Nat Genet, 43(10), 1035-1039.
1.2 Brief overview of flowering plant phylogeny
Flowering plants, or angiosperms, can be classified into six major clades including dicotyledons
(~198,000 species in ~336 families), monocotyledons (~62,000 species in ~93 families),
Ceratophyllaceae, magnoliids, Chloranthaceae, and basal angiosperms (Hedges & Kumar, 2009; Stevens,
2012; The Angiosperm Phylogeny Group, 2009). Eudicots and monocots together comprise ~96% of
living angiosperm species. Eudicot plants typically have two embryonic cotyledons (thus the name
“eudicotyledons”), most of which also have tricolpate pollen grains. In contrast, monocot plants typically
have one embryonic cotyledon (thus the name “monocotyledons”), most of which also have trimerous
flowers. Most sequenced plant genomes come from the two clades.
Many studies supported that living angiosperm lineages form a monophyletic clade, having
evolved from a common ancestor that diverged from other seed plants in the Triassic to Jurassic periods

!
!
5
about 240~145 MYA (Bell et al., 2010; Clarke, Warnock, & Donoghue, 2011; James A. Doyle, 2012; S.
A. Smith, Beaulieu, & Donoghue, 2010; D. E. Soltis et al., 2009; Wikstrom et al., 2001). Being the most
abundant and diverse group of all plants, angiosperms are also a young division: gymnosperms first
emerged at least ~340 MYA, other vascular ~420 MYA and non-vascular land plants ~450 MYA, and the
streptophyte algae ~725 MYA. Nonetheless, through several phases of morphological and functional
diversification, by the late Cretaceous angiosperms had successfully dominated many habitats across the
Earth (Crane & Lidgard, 1989; J. A. Doyle & Donoghue, 1993; Friis, Pedersen, & Crane, 2006). The
majority of extant angiosperm lineages emerged so suddenly in the evolutionary history that Darwin in
1879 once referred to it as “an abominable mystery”.
Early angiosperms diversified extensively and very rapidly in the early Cretaceous (Crane, Friis,
& Pedersen, 1995; Hickey & Doyle, 1977), perhaps within about 5 million years (Moore, Bell, Soltis, &
Soltis, 2007; D. E. Soltis, Bell, Kim, & Soltis, 2008). Molecular estimations suggested that basal
angiosperm lineages diverged from mesangiospermae around 170~140 MYA, after which the five clades
of mesangiospermae, Chloranthales, magnoliids, monocots, eudicots and Ceratophyllales, rapidly
separated, with the exact order of origins remaining uncertain (Bell et al., 2010; Magallón, 2009; Moore
et al., 2007). The two major angiosperm clades, eudicots and monocots, are estimated to have diverged
some time between 160~125 MYA (Bell et al., 2010; Clarke et al., 2011; Crane et al., 1995; S. A. Smith
et al., 2010; D. E. Soltis et al., 2008; K. H. Wolfe, Gouy, Yang, Sharp, & Li, 1989), in general
accordance with current fossil records (Friis, Pedersen, & Crane, 2010; Sun, Dilcher, Wang, & Chen,
2011). This is a time period overlapping with the Gondwanaland break-up (Ezcurra & Agnolin, 2012),
emergence of bees and a major radiation period of insects (Cardinal & Danforth, 2013; Grimaldi, 1999),
which may be important environmental factors driving rapid diversification of early angiosperms. The
first major diversification in the dicotyledon clade was estimated to have occurred in early to mid-
Cretaceous, involving many aspects of the organisms’ physiology such as floral structure, pollen
structure, leaves, and pollination type (Crane et al., 1995; Friis et al., 2006; Hickey & Doyle, 1977).
Evidence also revealed extensive diversifications of core eudicots and monocots respectively, beginning

!
!
6
in late Cretaceous (Crane et al., 1995; Friis et al., 2006). Episodic rapid diversification is a theme
throughout angiosperm evolution (Moore, Soltis, Bell, Burleigh, & Soltis, 2010; S. A. Smith et al., 2010;
D. E. Soltis et al., 2008).
This brief overview of the angiosperm phylogeny is intended as necessary background for my
research subject. For detailed discussions of morphological, phylogenetic characters and evolution of
angiosperm lineages the readers are referred to comprehensive review articles and books such as (Bell et
al., 2010; Crane et al., 1995; James A. Doyle, 2012; Friis, Crane, & Pedersen, 2011; Magallón, 2009; D.
E. Soltis et al., 2008; D. E. Soltis, Soltis, Endress, & Chase, 2005), and the Angiosperm Phylogeny
Website (http://www.mobot.org/MOBOT/research/APweb/welcome.html).
Many genes in floral development pathways appear to have been duplicated in parallel time
frames around early angiosperm and eudicot diversification events, implying that they may have been
produced in polyploidy events rather than individual gene duplications (reviewed in (D. E. Soltis et al.,
2008)). It is now known that all angiosperms are paleo-polyploids, having experienced one or more whole
genome duplications (WGDs) at some point(s) during their evolutionary histories (Blanc & Wolfe, 2004;
Bowers, Chapman, Rong, & Paterson, 2003; Jiao et al., 2011; Tang, Bowers, et al., 2008). Widespread
paleo-polyploidy events in angiosperms, and their trend of coincident occurrence with major species
radiations support the hypothesis that paleo-polyploidies were a major driving force in angiosperm
evolution and diversification (J. J. Doyle et al., 2008; Fawcett, Maere, & Van de Peer, 2009; Lynch &
Conery, 2000; Otto & Whitton, 2000; Paterson, Bowers, & Chapman, 2004; D. E. Soltis et al., 2009),
while the ultimate radiation of species and diversity in the affected lineages likely depends on many post-
WGD factors such as migration, environmental changes, and differential extinction rates (Schranz,
Mohammadin, & Edger, 2012).
1.3 Repeated ancient genome duplications prevalent in flowering plant evolution
Several seminal cytological and genetic studies revealed duplications of genes and chromosome segments
that were thought to be possibly ancient and of evolutionary importance (McClintock, 1941; Metz, 1947;

!
!
7
Rhoades, 1951; Stadler, 1929). On the other hand, plants with high haploid chromosome numbers were
hypothesized to have possibly originated via polyploidy, a major mechanism of plant speciation (V.
Grant, 1981; George Ledyard Stebbins, 1950, 1971). As genetic maps became available for some plant
genomes, regions of colinear markers were identified between different linkage groups, providing more
concrete support than ever before for possible paleo-polyploidies in several lineages (Ahn & Tanksley,
1993; Chittenden, Schertz, Lin, Wing, & Paterson, 1994; Helentjaris, Weber, & Wright, 1988; K. M.
Song, Suzuki, Slocum, Williams, & Osborn, 1991; Whitkus, Doebley, & Lee, 1992), and in some cases
multiple incidences in a single lineage (Kowalski, Lan, Feldmann, & Paterson, 1994; Shoemaker et al.,
1996). The first plant genome sequence (Arabidopsis Genome Initiative, 2000) confirmed that even the
compact 125 Mb genome of thale cress was indeed a paleo-polyploid, and further revealed surprising
multiple rounds of paleo-polyploidies (Blanc, Barakat, Guyot, Cooke, & Delseny, 2000; Blanc, Hokamp,
& Wolfe, 2003; Bowers et al., 2003; D. Grant, Cregan, & Shoemaker, 2000; Ku, Vision, Liu, &
Tanksley, 2000; Paterson et al., 2000; Simillion, Vandepoele, Van Montagu, Zabeau, & Van de Peer,
2002; Vision, Brown, & Tanksley, 2000). Since then, rapidly growing scale of genome sequencing has
nurtured paleo-polyploidy studies in expanding clades of the angiosperm phylogeny, opening the ‘big
data’ era of comparative studies in plant genome structure and evolution.
But for now let’s step back and look at the genetic basis of polyploid formation. Polyploid plant
cells, having more than one set of diploid chromosomes, are formed in two ways. Autopolyploids acquire
multiple sets of a single parent genome mainly through unreduced gametes, or less frequently through
somatic doubling. Examples of neo-autopolyploid plants include sugar cane in monocots and potato in
eudicots. On the other hand, allopolyploids are derived from fusion of different genomes usually through
hybridization of related species. Examples of neo-allopolyploid plants include bread wheat in monocots
and cultivated cotton in eudicots.
Polyploidies that involve more than doubling of a genome, for example hexaploidy (genome
triplication), can occur in several different ways (Figure 1.1). In panel 1 the auto-hexaploid (AAAAAA,
2n=6x) is formed by joining three identical diploid genomes (2n=2x). Two natural hexaploids, the ‘marsh

!
!
8
pea’, Lathyrus palustris (Khawaja, Ellis, & Sybenga, 1995) and the grass ‘timothy’, Phleum pretense
(NordenskiÖLd, 1953), were formed in this way. Panel 2 illustrates one-step allo-hexaploid formation. In
panel 3 the hexaploid organism (AAAABB, 2n=6x) is formed by a combination of an auto-
tetraploidization (resulting in AAAA, 2n=4x) and a subsequent allo-tetraploidization with a related
diploid (BB, 2n=2x) organism. The recent hexaploid wheat Triticum zhukovskyi and some synthetic
hexaploid cotton species (Brown & Menzel, 1952) were formed in this way. In panel 4 the hexaploid
(AABBCC, 2n=6x) is formed by two successive allo-tetraploidies. The bread wheat (Triticum aestivum)
(Matsuoka, 2011) and some synthetic hexaploid cottons (Brown & Menzel, 1952) were formed in this
way. In theory, the hexaploid organisms in panel 3 and 4 can also be formed in one step, as described in
panel 2, likely via processes similar to double fertilization.
Figure 1.1 Different models to form (paleo)hexaploidy. Panel 1 illustrates one-step auto-hexaploid
formation. Panel 2 illustrates one-step allo-hexaploid formation. Panel 3 illustrates a two-step auto-
tetraploidy and allo-tetraploidy hybrid model to form a hexaploidy organism. Panel 4 illustrates two-step

!
!
9
formation of an allo-hexaploid via two successive allo-tetraploidizations. The big dark circles represent
normal diploid cells (germline cells and embryos). The small light circles represent gametes.
Although having more than two genetic paths to form, from a phylogenetic point of view
autopolyploids arise from within a single species, while allopolyploids arise from hybridization of more
than one species. It should be noted that in terms of general post-duplication genomic adaptation and
long-term evolution there is no absolute boundary between auto- and allo- polyploidies (Ramsey &
Schemske, 1998; Douglas E. Soltis, Buggs, Doyle, & Soltis, 2010).
Once happened, polyploidy is arguably the most dramatic mutation experienced by a genome. In
fact most polyploids simply reach a dead end because of failure in reproduction or ecological
establishment. Surviving ancient polyploids experienced a subsequent process called ‘diploidization’,
during which the sister paleo-subgenomes extensively restructured and the species was ‘diploidized’, i.e.
restored diploid heredity. Genomic studies in the past decade have revealed at least six mechanisms
through which the evolutionary effects of ancient genome duplication operate. Firstly, increased
intragenomic homology promotes structural shuffling and rearrangements, resulting in re-organization of
genomic regions. Secondly, massive non-random gene deletion, also known as ‘fractionation’ (Langham
et al., 2004; Thomas, Pedersen, & Freeling, 2006), can result in subgenomic dominance (J. C. Schnable,
Springer, & Freeling, 2011; Tang et al., 2012), altered biochemical pathways and rewired connections in
the cellular interaction network (Arabidopsis Interactome Mapping Consortium, 2011; Bekaert, Edger,
Pires, & Conant, 2011). Thirdly, the newly created “redundant” copies are often relieved of selective
pressure and sometimes experience functional modifications via subfunctionalization or
neofunctionalization (Kellis, Birren, & Lander, 2004; M. Lynch & A. Force, 2000; Ohno, 1970).
Fourthly, the gene balance (or gene dosage) theory constrains changes in some duplicated genes coding
for interacting products to fulfill stoichiometric balance (Birchler, Bhadra, Bhadra, & Auger, 2001; Papp,
Pal, & Hurst, 2003; Thomas et al., 2006), possibly driving them to different post-WGD evolutionary
paths. Moreover, the cohort of whole genome duplicates greatly increases the “buffer capacity” of a
!
!
10
genome, perhaps making it more genetically robust (Chapman, Bowers, Feltus, & Paterson, 2006; Gu et
al., 2003; Paterson et al., 2006). Finally, polyploids often have increased regulatory and morphological
complexity (Freeling & Thomas, 2006), and a higher chance of obtaining new gene combinations and
hybrid vigor (De Bodt, Maere, & Van de Peer, 2005; Rieseberg et al., 2003). These changes, some of
which quickly follow WGDs, are believed to often underlie emergence of derived or novel phenotypes
and diversification of plant species (Otto & Whitton, 2000; Paterson et al., 2000; P. S. Soltis & Soltis,
2000).
When multiple incidences of paleo-polyploidies have occurred in a lineage, as is often the case in
flowering plants, some portions of the genome can acquire high copy numbers by compounding the
effects of individual duplications. For example, the TEOSINTE-LIKE1, CYCLOIDEA, and
PROLIFERATING CELL FACTOR1 (TCP) gene family, encoding a group of plant-specific transcription
factors, has 40 copies in B. rapa (4 paleo-polyploidies); 24 in A. thaliana (3 paleo-polyploidies); 19 in V.
vinifera and 21 in C. papaya (1 paleo-polyploidy), indicating that recursive WGDs have continually
contributed to this family’s expansion in B. rapa (X. Wang, Wang, et al., 2011). It has been observed that
some gene families repeatedly delete or retain new gene copies through multiple rounds of WGDs, and
some gene families can ‘prefer’ different directions in different lineages (Buggs et al., 2012; De Smet et
al., 2013; Paterson et al., 2006).
Genome structural mutations include insertions, deletions, inversions, translocations,
recombinations, chromosome fissions and fusions, all of which are often elevated after polyploidization
events (Leitch & Leitch, 2008; Mandakova, Joly, Krzywinski, Mummenhoff, & Lysak, 2010; Pecinka,
Fang, Rehmsmeier, Levy, & Mittelsten Scheid, 2011; Xiong, Gaeta, & Pires, 2011). Synteny detection
software developed in mammalian studies was typically designed to identify single best matching or
orthologous regions (Bray & Pachter, 2004; Brudno et al., 2003; Dubchak, Poliakov, Kislyuk, & Brudno,
2009; Kent, Baertsch, Hinrichs, Miller, & Haussler, 2003; Miller et al., 2007), and is not suitable for
comparing plant genomes. This is because mammalian genomes have been free of polyploidization for
over 500 million years (Nakatani, Takeda, Kohara, & Morishita, 2007; J. J. Smith et al., 2013), and have

!
!
11
much more conserved genome structure than in plants. In plants, for example, synteny conservation
patterns across eudicots and monocots, which are separated by 240~140 million years, are extremely
deteriorated (Salse et al., 2009) due in large part to repeated paleo-polyploidies and associated genome
restructuring. Even when aligning a plant genome which experienced a lineage specific paleopolyploidy
with the genome of its closely related sister species lacking this event, such as Arabidopsis thaliana
versus Brassica rapa, an additional paleo-hexaploidy in B. rapa has made their synteny map quite
complicated for two lineages separated only 17~13 MYA (X. Wang, Wang, et al., 2011). Therefore plant
genome structure comparisons demand methods appropriate to deal with recurring genome duplications.
1.4 Methodological development for homeologous region detection and ancient genome duplication
inference.
Early WGD studies at the dawning of the whole genome sequencing era mainly adopted two methods:
distribution of nucleotide substitution rate at synonymous sites (Ks) between paralogous gene pairs
(Blanc & Wolfe, 2004; Cui et al., 2006; Lynch & Conery, 2000), or topology of homologous gene family
phylogenetic trees (Bowers et al., 2003). Both methods work well in many cases, but also have different
limitations. Paralogous genes descendant from a single WGD are expected to have similar Ks values,
forming a single peak when genomic Ks distribution is plotted. WGD peaks are distinctive from the
background of continuous single gene duplications with exponential shape of loss. “Age grouping” of Ks
values for homologous genes can be calculated without prior information about gene order, and is the
only method for dating WGDs using transcriptome data alone. A major limitation of this method is that a
paleo-polyploidy event has to be of moderate antiquity for the paralogous Ks values to form a well-
behaved peak of distribution. For very recent WGD, Ks signals are usually masked by noise from
continuous single gene duplications and occasional artificial gene homologs from mis-annotation. For
very ancient WGD, base substitution can approach saturation and sequence-based methods become less
useful (Blanc & Wolfe, 2004). In addition, blending of gene families with different modes of Ks
divergence can create artificial separation of genes from single events, or blurring boundaries of Ks peaks

!
!
12
from different events. The original phylogenetic method for dating WGD (Bowers et al., 2003)
determines the coalescence order of speciation and polyploidy events by distinguishing tree topologies as
duplication-first (“external” topology) or speciation-first (“internal” topology) scenarios (Bowers et al.,
2003). Although tree classification avoided the heterogeneous sequence divergence limitation of Ks
methods, it still often suffers from taxon sampling limitation in early studies and lineage evolutionary rate
variation (Tang, Wang, et al., 2008).
Different from the often-confusing evolutionary signatures in individual gene sequences, patterns
of paleo-polyploidies are better preserved as conservation of local gene order, or ‘synteny’, between the
homeologous regions. Synteny-based WGD detection has powered the so far most reliable methods
(Paterson, Freeling, Tang, & Wang, 2010). Synteny comparison can be carried out in two directions. The
“bottom-up” approach iteratively interleaves gene positions on paralogous genomic segments to
compensate for loss of ancestral genes on either segment. The merged pre-duplicated segments can then
be used to look for additional duplication (Bowers et al., 2003). Automatic pairwise detection of synteny
blocks can be achieved through seed-and-extend algorithms such as LineUp (Hampson, McLysaght,
Gaut, & Baldi, 2003), map-based algorithms such as ADHoRe (Vandepoele, Saeys, Simillion, Raes, &
Van de Peer, 2002), DiagHunter (Cannon, Kozik, Chan, Michelmore, & Young, 2003), ColinearScan (X.
Wang et al., 2006), or graph algorithms such as DAGchainer (Haas, Delcher, Wortman, & Salzberg,
2004). A “top-down” approach implemented in MCscan (Tang, Bowers, et al., 2008; Tang, Wang, et al.,
2008) is able to align multiple gene orders (for example, A-B-C instead of A-B, B-C, A-C) in one pass by
taking advantage of the transitive property of synteny. A complementary PAR (putative ancestral region)
algorithm from the same author exhaustively identifies and groups homeologous regions in two genomes
by hierarchically clustering (Tang, Bowers, Wang, & Paterson, 2010). Some of the software has been
incorporated into user-friendly interfaces of online comparative genomics platforms such as PGDD (T. H.
Lee, Tang, Wang, & Paterson, 2013), PLAZA (Proost et al., 2009), and CoGe (Lyons & Freeling, 2008).
Although it has become routine to identify and align synteny blocks between angiosperm
genomes thanks to ingenious software developed in the last decade, it is so far not possible to: 1.

!
!
13
simultaneously infer multiple (often nested) paleo-polyploidy events in multiple lineages; 2. based on
such inferences systematically extract and align homologous regions in the studied genomes. These are
two greatly needed tasks, especially with growing sequencing efforts in wide samples of plant taxa.
Chapter 6 of this dissertation describes the GeDupMap program addressing these needs.
1.5 Ancient genome duplications identified in sequenced flowering plant lineages
After being first discussed by a few pioneering scientists as early as the 1920s~1970s, paleo-polyploidy
studies have greatly benefitted from advances in genome technology and rapid data growth in this
century. In the past decade about 15 paleo-tetraploidies, 3 paleo-hexaploidies, and 1 paleo-(do)decaploidy
have been identified in sequenced eudicot genomes, and 12 paleo-tetraploidies in sequenced monocot
genomes. These events are summarized in Table 1.1 below. Sequencing capacity has continued to
increase while cost decreases, promising that genome data from many more plant taxa will soon be
released, many of which are already under way. There are exciting opportunities and pressing challenges
to solve automatic paleo-polyploidy detection and systematic plant genome comparisons needed for both
basic and applied research.

! !
14
Tab
le 1
.1
Pal
eo-p
olyp
loid
y ev
ents
iden
tifie
d in
seq
uenc
ed a
ngio
sper
m g
enom
es.
Spec
ies
Com
mon
nam
e Fa
mily
1x
Pa
leo-
poly
ploi
dy
Gen
ome
size
(Mb)
Prot
ein
codi
ng
gene
s T
E (%
) A
ssem
bly
leve
l Sc
affo
ld
N50
(Kb)
R
elea
se p
ublic
atio
n
Eur
osid
s I
Cuc
umis
sat
ivus
cu
cum
ber
Cuc
urbi
tace
ae
7 γ
360
26,6
82
24
chro
mos
ome
1144
.7
(Hua
ng e
t al.,
200
9)
Cuc
umis
mel
o m
elon
C
ucur
bita
ceae
12
γ
450
27,4
27
19.7
ch
rom
osom
e 46
77.8
(G
arci
a-M
as e
t al.,
201
2)
Citr
ullu
s la
natu
s w
ater
mel
on
Cuc
urbi
tace
ae
11
γ 42
5 23
,440
45
.2
chro
mos
ome
2380
(G
uo e
t al.,
201
3)
Mal
us x
dom
estic
a ap
ple
Ros
acea
e 17
M
,γ
742
57,3
86
42.4
ch
rom
osom
e 15
42.7
(V
elas
co e
t al.,
201
0)
Pyru
s br
etsc
hnei
deri
pe
ar
Ros
acea
e 17
M
,γ
527
42,8
12
53.1
ch
rom
osom
e 54
0.8
(J. W
u et
al.,
201
3)
Prun
us p
ersi
ca
peac
h R
osac
eae
8 γ
265
27
,852
37
.1
chro
mos
ome
2680
0 (I
nter
natio
nal P
each
G
enom
e et
al.,
201
3)
Prun
us m
ume
mei
R
osac
eae
8 γ
280
31,3
90
45
chro
mos
ome
577.
8 (Z
hang
et a
l., 2
012)
Frag
aria
ves
ca
woo
dlan
d st
raw
berr
y R
osac
eae
7 γ
240
34,8
09
22.8
ch
rom
osom
e 13
61
(Shu
laev
et a
l., 2
011)
Can
nabi
s sa
tiva
hem
p C
anna
bace
ae
10
γ 82
0 30
,074
N
A
scaf
fold
16
.2
(van
Bak
el e
t al.,
201
1)
Med
icag
o tr
unca
tula
m
edic
ago
Faba
ceae
8
L,γ
480
47,8
45
30.5
ch
rom
osom
e 12
70
(You
ng e
t al.,
201
1)
Cic
er a
riet
inum
ch
ickp
ea
Faba
ceae
8
L,γ
740
28,2
55
58.1
ch
rom
osom
e 39
990
(Var
shne
y et
al.,
201
3)
27,5
71
40.4
ch
rom
osom
e 77
.3
(Jai
n et
al.,
201
3)
Lotu
s ja
poni
cus
Fa
bace
ae
6 L,γ
472
30,7
99
33
chro
mos
ome
92.3
(S
ato
et a
l., 2
008)
Gly
cine
max
so
ybea
n Fa
bace
ae
20
S,L,γ
1115
46
,430
59
ch
rom
osom
e 47
800
(Sch
mut
z et
al.,
201
0)
Phas
eolu
s vu
lgar
is
com
mon
bea
n Fa
bace
ae
11
L,γ
27
,197
45
.42
chro
mos
ome
5040
0 Sc
hmut
z et
al.,
201
4 C
ajan
us c
ajan
pi
geon
pea
Faba
ceae
11
L,γ
833
48
,680
51
.7
chro
mos
ome
516.
06
(Var
shne
y et
al.,
201
2)
Mal
pigh
iale
s
Popu
lus
tric
hoca
rpa
blac
k co
ttonw
ood
Salic
acea
e 19
P,γ
475~
550
45,5
55
42
chro
mos
ome
3100
(T
uska
n et
al.,
200
6)
Linu
m u
sita
tissi
mum
fla
x Li
nace
ae
15
F,γ
373
43,3
84
24.4
sc
affo
ld
693.
5 (Z
. Wan
g et
al.,
201
2)
Rici
nus
com
mun
is
cast
or b
ean
Euph
orbi
acea
e 10
γ
320
31,2
37
50.3
sc
affo
ld
496.
5 (C
han
et a
l., 2
010)
Man
ihot
esc
ulen
ta
cass
ava
Euph
orbi
acea
e 18
γ
770
30,6
66
37.5
sc
affo
ld
258.
1 (P
roch
nik
et a
l., 2
012)
Hev
ea b
rasi
liens
is
rubb
er tr
ee
Euph
orbi
acea
e 18
N
A
2150
68
,955
~7
8 ch
rom
osom
e N
A
(Rah
man
et a
l., 2
013)
Eur
osid
s II
Car
ica
papa
ya
papa
ya
Car
icac
eae
9 γ
372
24
,746
51
.9
scaf
fold
10
00
(Min
g et
al.,
200
8)
Arab
idop
sis
thal
iana
th
ale
cres
s B
rass
icac
eae
5 α,β,γ
135
27
,416
14
ch
rom
osom
e N
A
(AG
I, 20
00; S
war
brec
k et
al
., 20
08)
Arab
idop
sis
lyra
ta
B
rass
icac
eae
8 α,β,γ
207
32,6
70
29.7
ch
rom
osom
e 24
500
(Hu
et a
l., 2
011)
Cap
sella
rub
ella
Bra
ssic
acea
e 8
α,β,γ
219
26,5
21
~50
chro
mos
ome
1510
0 (S
lotte
et a
l., 2
013)

! !
15
Bras
sica
rap
a
Chi
nese
cab
bage
B
rass
icac
eae
10
B,α
,β,γ
28
4 41
,174
39
.5
chro
mos
ome
1971
.1
(Wan
g et
al.,
201
1)
Thel
lung
iella
pa
rvul
a sa
lt cr
ess
Bra
ssic
acea
e 7
α,β,γ
160
28,9
01
7.5
chro
mos
ome
5290
(D
assa
naya
ke e
t al.,
201
1)
Thel
lung
iella
sa
lsug
inea
sa
lt cr
ess
Bra
ssic
acea
e 7
α,β,γ
260
28,4
57
52
chro
mos
ome
403.
5 (H
. J. W
u et
al.,
201
2)
Gos
sypi
um r
aim
ondi
i co
tton
Mal
vace
ae
13
C,γ
63
0~88
0 37
,505
61
ch
rom
osom
e 18
800
(Pat
erso
n et
al.,
201
2)
40,9
76
57
chro
mos
ome
2284
(K
. Wan
g et
al.,
201
2)
Theo
brom
a ca
cao
caca
o M
alva
ceae
10
γ
430
28,7
98
24
chro
mos
ome
473.
8 (A
rgou
t et a
l., 2
011)
Azad
irac
hta
indi
ca
neem
M
elia
ceae
14
N
A
383
20,1
69
13
scaf
fold
45
2 (K
rishn
an e
t al.,
201
2)
Citr
us c
lem
entin
a cl
emen
tine
Rut
acea
e 9
γ ~3
00
24,5
33
45
chro
mos
ome
6800
W
u et
al.,
201
4 C
itrus
sin
ensi
s sw
eet o
rang
e R
utac
eae
9 γ
367
29
,445
20
.5
chro
mos
ome
1690
(X
u et
al.,
201
3)
Euca
lypt
us g
rand
is
rose
gum
M
yrta
ceae
11
EG
, γ
640
36,3
76
50.1
ch
rom
osom
e 53
900
Myb
urg
et a
l., 2
014
Bas
al r
osid
s
Vitis
vin
ifera
gr
ape
Vita
ceae
19
γ
475
26,3
46
41.4
ch
rom
osom
e 20
65
(Jai
llon
et a
l., 2
007)
Ast
erid
s - E
uast
erid
s I
Sola
num
ly
cope
rsic
um
tom
ato
Sola
nace
ae
12
T,γ
900
34,7
27
63.3
ch
rom
osom
e 16
467.
8 (T
omat
o G
enom
e C
onso
rtium
, 201
2)
Sola
num
tube
rosu
m
pota
to
Sola
nace
ae
12
T,γ
844
39,0
31
62.2
ch
rom
osom
e 13
18
(P. G
. S. C
onso
rtium
, 20
11)
Cof
fea
cane
phor
a co
ffee
R
ubia
ceae
11
γ
710
25,5
74
~50
chro
mos
ome
1261
D
enoe
ud e
t al.,
201
4
Mim
ulus
gut
tatu
s m
onke
y flo
wer
Sc
roph
ular
iace
ae
14
MG
a,γ
430
26,7
18-
28,1
40
49.8
sc
affo
ld
1100
H
ells
ten
et a
l., 2
013
Utr
icul
aria
gib
ba
blad
derw
ort
Lent
ibul
aria
ceae
14
U
a,U
b,U
c,γ
77
28,4
94
3 sc
affo
ld
80.8
(I
barr
a-La
clet
te e
t al.,
20
13)
Bas
al a
ster
ids
Actin
idia
chi
nens
is
kiw
ifrui
t A
ctin
idia
ceae
29
K
a,K
b,γ
758
39,0
40
36
chro
mos
ome
646.
786
Hua
ng e
t al.,
201
3 B
asal
cor
e-eu
dico
ts
Beta
vul
gari
s su
gar b
eet
Am
aran
thac
eae
9 γ
714~
758
27,4
21
63
chro
mos
ome
2010
D
ohm
et a
l., 2
013
Bas
al e
udic
ots
Nel
umbo
nuc
ifera
sa
cred
lotu
s N
elum
bona
ceae
8
λ 92
9 26
,685
57
m
egas
caff
old
3435
(M
ing
et a
l., 2
013)
Com
mel
inid
s
Phoe
nix
dact
ylife
ra
date
pal
m
Are
cace
ae
18
P,τ
658(
381)
28
,890
~4
.5
scaf
fold
30
.48
Al-D
ous
et a
l., 2
011
671
41,6
60
38.4
1 sc
affo
ld
329.
9 A
l-Mss
alle
m e
t al.,
201
3 El
aeis
gui
neen
sis
oil p
alm
A
reca
ceae
16
P,τ
1800
34
,802
50
ch
rom
osom
e 12
70
Sing
h et
al.,
201
3
Mus
a ac
umin
ata
bana
na
Mus
acea
e 11
Mα,
Mβ,
Mγ
,τ
523
36,5
42
43.7
ch
rom
osom
e 13
11.1
D
'Hon
t et a
l., 2
012
Sorg
hum
bic
olor
so
rghu
m
Poac
eae
10
ρ,σ,τ
818
33,0
32
62
chro
mos
ome
62,4
00
Pate
rson
et a
l., 2
009

! !
16
Ory
za sa
tiva
japo
nica
rice
Po
acea
e 12
ρ,σ,τ
420
32,0
00~
50,0
00
ch
rom
osom
e
Gof
f et a
l., 2
002
Ory
za sa
tiva
indi
ca ri
ce
Poac
eae
12
ρ,σ,τ
466
~53,
398
16
chro
mos
ome
11.7
6 Y
u et
al.,
200
2
Brac
hypo
dium
di
stac
hyon
pu
rple
fals
e br
ome
Poac
eae
5 ρ,σ,τ
~272
25
,532
21
.4
chro
mos
ome
59,3
00
Inte
rnat
iona
l B
rach
ypod
ium
Initi
ativ
e,
2010
Zea
may
s m
aize
Po
acea
e 10
Z,ρ,σ,τ
2300
39
,656
85
ch
rom
osom
e 76
Sc
hnab
le e
t al.,
200
9
Seta
ria
italic
a fo
xtai
l mill
et
Poac
eae
9 ρ,σ,τ
510
24,0
00
40
chro
mos
ome
47,3
00
Ben
netz
en e
t al.,
201
2
490
38,8
01
46
chro
mos
ome
1000
Zh
ang
et a
l., 2
012
Aegi
lops
taus
chii
whe
at D
ge
nom
e Po
acea
e 7
ρ,σ,τ
4360
43
,150
65
.9
chro
mos
ome
57.6
Ji
a et
al.,
201
3
Triti
cum
ura
rtu
eink
orn
whe
at
(A g
enom
e)
Poac
eae
7 ρ,σ,τ
4940
34
,879
66
.9
chro
mos
ome
63.6
9 Li
ng e
t al.,
201
3
Phyl
lost
achy
s he
tero
cycl
a m
oso
bam
boo
Poac
eae
24
Bm
,ρ,σ
,τ
2075
31
,987
59
sc
affo
ld
328.
698
Peng
et a
l., 2
013
othe
r m
onoc
ots
Spir
odel
a po
lyrh
iza
grea
ter
duck
wee
d A
race
ae
20
αSP,βS
P 15
8 19
,623
N
A
supe
rsca
ffol
d 3,
759
Wan
g et
al.,
201
4
Bas
al a
ngio
sper
ms
Ambo
rella
tr
icho
poda
am
bore
lla
Am
bore
llace
ae
13
74
8~87
0 26
,846
~5
7 sc
affo
ld
4900
A
GC
201
3
!
!
17
1.6 Framework of plant genome comparison
Abrupt origins, dynamic and often fast diversifications, prevailing paleo-polyploidies, and divergent
lineage evolutionary rates are four key factors shaping the paths to modern flowering plants. In particular,
compared to two rounds of WGDs (2R) followed by ~500 million years of quiescence in mammals
(Dehal & Boore, 2005; J. J. Smith et al., 2013), flowering plant lineages exhibit continuous propensity for
polyploidies in the past ~200 million years. As a result, modern flowering plant genomes are highly
variable in genome size, content and structure (Kejnovsky, Leitch, & Leitch, 2009; Salse et al., 2009; D.
E. Soltis, Soltis, Bennett, & Leitch, 2003). A direct multiple genome alignment, like the 28-way
vertebrate alignment (Miller et al., 2007), is not feasible in plants because the number of common anchors
soon diminishes with taxa from a few families added to the alignment, and numbers of homeologous
regions vary both within the same genome and across different genomes. Therefore, a framework of
systematic genome comparisons is key to accurately and effectively identifying the locations of functional
conservations and innovations among numerous flowering plant genomes.
Indeed, synteny-based molecular evolutionary analyses have started to show great power in
dissecting genome functions. For example, past inference of relationships among members of a gene
family based on sequence alignment can be complicated by many factors such as gene loss, different
mutation rates across taxa and domains, tandem duplication, gene conversion, and horizontal gene
transfer. Alternatively, evolutionary inferences based on genome-wide synteny patterns, making use of
additional position information, were shown to be less confusing and more accurate in both animal (Dehal
& Boore, 2005) and plant (Tang, Bowers, et al., 2008) studies. In addition, compared to sequence
evolution, synteny divergence is slower and seldom suffers from issues such as saturation and homoplasy,
thus it often provides more reliable phylogenetic signals (Rokas & Holland, 2000).
Therefore, as genome technology provides us with increasingly greater data sets to study, it is not
only beneficial but also necessary to establish the framework of plant genome comparison that will power
the best use of synte-molecular comparisons of homologous regions.

!
!
18
CHAPTER 2 TWO PALEO-HEXAPLOIDIES UNDERLIE FORMATION OF MODERN
SOLANACEAE GENOME STRUCTURE 1
1 Li, J., Tang, H., Wang, X., & Paterson, A. H. Accepted by Compendium of Plant Genomes: The Tomato Genome. Reprinted here with permission of the publisher.

!
!
19
2.1 Preface
Before the release of the tomato and potato genomes in 2011, there had been more than a dozen genomes
published of rosid plants, but zero from asteroid plants. Although previous research based on genetic
maps and ESTs indicated several possible paleo-polyloidy events in asterids, absence of complete genome
sequences precluded their confirmation and detailed studies. Therefore publishing of high quality tomato
and potato reference sequences was a milestone in plant paleo-polyploidy research. I fortunately had the
opportunity to participate in the international tomato genome sequencing project led by Drs. Dani Zamir
and Giovanni Giuliano. When tomato genome assembly was available to collaborators in 2011, Haibao
Tang immediately discovered syntenic patterns indicative of paleo-hexaploidy on the dot plot between
tomato and grape genomes. However, it was also clear on the dot plot that many regions of the tomato
genome only shows 1-to-1 or 2-to-1 correspondence to orthologous grape regions, rather than the
expected 3-to-1. Although high level of homeolog loss is not untypical for ancient polyploidy events,
detailed analysis of the genome structure is necessary to draw a conclusion. Meanwhile the potato paper
that just came out at that time only briefly noted a whole genome duplication in ancient potato that far
predated potato-tomato divergence. We needed clear dissection of the nature of this paleo-polyploidy,
which was my first task in the project. In order to prove that the event was a hexaploidy rather than a
tetraploidy I was able to divide the extant tomato genome into three subgenomes originated from this
ancient hexaploidy event (Figure 2.1, reprinted from (Tomato Genome Consortium, 2012)). Not only
does the comparable size of the three subgenomes strongly favors a paleo-hexaploidy versus a paleo-
tetraploidy (which typically leaves only two fractionated subgenomes in the present genome), but the
genome-wide distribution of the three subgenomes also indicated that they are much more likely to have
be produced in a polyploidy event rather than a large number of synchronous individual duplications.
Furthermore, same analyses were also performed on the potato genome, which clearly confirmed that this
shared event was a paleo-hexaploidy. Thus we confirmed the first case of paleo-hexaploidy in asterids.

!
!
20
Figure 2.1 The Solanum whole genome triplication. (a) Speciation and polyploidization in eudicot
lineages. Confirmed whole-genome duplications and triplications are shown with annotated circles,
including ‘T’ (this paper) and previously discovered events α, β, γ. Dashed circles represent one or more
suspected polyploidies reported in previous publications that need further support from genome
assemblies. Grey branches indicate unpublished genomes. Black and red error bars bracket indicate the
likely timings of divergence of major asterid lineages and of ‘T’, respectively. The post-‘T’ subgenomes
are designated T1, T2, and T3. (b) On the basis of alignments of multiple tomato genome segments to
single grape genome segments, the tomato genome is partitioned into three non-overlapping
‘subgenomes’ (T1, T2, T3), each represented by one axis in the three-dimensional plot. The ancestral
gene order of each subgenome is inferred according to orthologous grape regions, with tomato
chromosomal affinities shown by red (inner) bars. Segments tracing to pan-eudicot triplication (γ) are
shown by green (outer) bars with colours representing the seven putative pre-γ eudicot ancestral
chromosomes10, also coded a–g.

!
!
21
2.2 Abstract
Polyploidy, multiplication of whole genome content, is an important evolutionary force. Paleo-
polyploidies (ancient genome duplications) have been identified in early lineages of animals, yeasts, and
ciliates, but are particularly widespread in plants, with more than 32 events described. Deep impacts of
paleo-polyploidies on plant evolution and diversity are a research focus in recent years. There are three
unequivocally known paleo-hexaploidy (ancient genome triplication) events: one predated divergence of
core eudicots (‘γ’), one predated divergence of Solanaceae lineages (‘T’), and one predated divergence of
Brassica species. Two of the three events, γ and T, have affected the ancestors of all modern Solanaceae
species, which includes tomato (Solanum lycopersicum). Signatures of the paleo-hexaploidy T were first
described in the tomato genome, and confirmed in the potato (Solanum tuberosum) genome. Comparison
among several asterid genomes revealed that T likely occurred in the Solanaceae lineage, and may have
been chronologically close to the Solanaceae-Rubiaceae divergence. The successive γ and T paleo-
hexaploidies produced 9 theoretical copies of each ancestral locus in a modern Solanaceae haploid
genome, although only a fraction of these were retained. Following triplication, the paleo-genomes
underwent massive non-random gene loss and extensive structural rearrangement, resulting in adaptive
genetic changes and evolutionary novelties. In this chapter we will review recent research on the timing
and formation of the γ and T paleo-hexaploidies, and their evolutionary effects on the shaping of modern
Solanaceae genomes.
2.3 Introduction
The first two asterid plant genomes, those of tomato and potato from the Solanaceae (nightshade) family,
were sequenced about a decade after the first plant genome was published, that of Arabidopsis thaliana (a
rosid) (Arabidopsis Genome Initiative, 2000). They greatly expanded our knowledge of angiosperms
(flowering plants), the Earth’s dominant vegetation, which contain about 80% of known plant species.
Todays’ angiosperms consist of about 250,000 recorded species in about 450 families, of which about
75% or 198,000 species in about 336 families are eudicots (Hedges & Kumar, 2009; Stevens, 2012; The

!
!
22
Angiosperm Phylogeny Group, 2009). Eudicots, characterized by two embryonic cotyledons and
tricolpate pollen grains, contain two major crown clades of taxa, the rosids (~70,000 species) and the
asterids (~80,000 species), which diverged about 125~93 million years ago (MYA) in early- to mid-
Cretaceous (Bell et al., 2010; Bremer, Friis, & Bremer, 2004; Moore et al., 2010; H. Wang et al., 2009).
The asterid plants consist of ~102 families, many of which are very closely associated with humans, such
as tomatoes, potatoes, blueberries (Ericaceae family), coffee (Rubiaceae family), lavender (Lamiaceae
family), olives (Oleaceae family), elderberries (Adoxaceae family), dogwoods (Cornaceae family), and
sunflower (Asteraceae family).
One question that benefits greatly from whole-genome sequencing is the effects of paleo-
polyploidies, or ancient whole genome duplications (WGDs), on the evolution of plant genome structure
(see section 13.2). Paleo-polyploidy refers to ancient polyploidy (whole genome multiplication) events
that have subsequently been diploidized (returning to disomic inheritance), resulting in the present-day
haploid genome content containing more than one set of the ancestral genome. For example, a paleo-
tetraploid genome has 2 sets of haploid genomes each containing 2 sets of the pre-duplication ancestral
haploid genomes. Paleo-polyploidies have been reported in the eukaryotic kingdoms of Animalia (Dehal
& Boore, 2005; Ohno, 1970), Fungi (Kellis et al., 2004; K. H. Wolfe & Shields, 1997), and
Chromalveolata (Aury et al., 2006), but are most widespread in Plantae. All angiosperms are paleo-
polyploids, having experienced at least one, and usually more, WGDs in their lineage histories (Blanc &
Wolfe, 2004; Cui et al., 2006; Jiao et al., 2011; Masterson, 1994; D. E. Soltis et al., 2009; G. L. Stebbins,
1966; Tang, Bowers, et al., 2008). More than 32 paleo-polyploidy events have been identified in
sequenced angiosperm genomes.
Even before any plant genome was sequenced, comparative mapping of molecular markers
suggested that the small genome of Arabidopsis thaliana actually contains many paralogous regions,
which may be descended from paleo-polyploidy events (Kowalski et al., 1994; Paterson et al., 1996).
This inference was supported by later studies using sequence from the first plant genome of A. thaliana
(Bowers et al., 2003; D. Grant et al., 2000; Ku et al., 2000; Paterson et al., 2000; Simillion et al., 2002;

!
!
23
Vision et al., 2000). One of the key findings from the first sequenced plant genomes was the pan-core
eudicot paleo-hexaploidy (2n=6x) ‘γ’ (discussed in section 13.5). Paleo-hexaploidy (ancient genome
triplication) occurs or survives much less frequent than paleo-tetraploidy (ancient genome duplication, or
doubling). Before the sequencing of the tomato genome, the only two other paleo-hexaploidies identified
were one in the Brassica lineage estimated to have occurred 13~17 MYA (X. Wang, Wang, et al., 2011),
and γ. The tomato genome revealed the third case of paleo-hexaploidy (also the first case in asterids), the
T event (Tomato Genome Consortium, 2012), discussed in detail in sections 13.3 and 13.4 of this chapter.
This chapter focuses on the two paleo-hexaploidies experienced by Solanaceae ancestors. We will
start by a very brief methodological overview. Then we will first discuss the pan-Solanaceae T event
because it was the terminal WGD event in this lineage and therefore easier to study than the more ancient
γ event that was nested inside T. After that we will discuss the pan-core eudicot γ event by first profiling
it using the grape (rosids) genome where γ is a terminal WGD (grape genome experienced no re-
duplication following γ), and then prove that it was also shared by ancestral asterids. In the end we will
discuss the evolutionary effects of γ and T on the tomato genome structure, and raise a few questions for
future studies on these two and more paleo-hexaploidy events.
2.4 Methods to identify paleo-polyploidy
Paleo-polyploidy events are difficult to identify because they occurred in the ancient past, during which
time conservation of sequence and synteny between paralogous regions has been severely eroded.
Typically more than 70~80% of the genes duplicated in a paleo-polyploidy are subsequently lost. The
remaining loci are further shuffled by post-WGD genome rearrangements. Therefore it is necessary to
collect genome-wide signals for detection of WGDs. Because a paleo-polyploidy event duplicates all loci
in the progenitor genome at the same time, the histogram of their paralogous genes Ks (nucleotide
substitutions per synonymous site) values forms a peak corresponding to the event (Lynch & Conery,
2000). Those distributions can therefore be used to identify paleo-polyploidies, with the limitations that

!
!
24
Ks divergence cannot be resolved when it is either too small or too large, and that the rate of
accumulation of mutations varies among gene families.
When genome sequence is available, the most sensitive and accurate paleo-polyploidy detection
methods are synteny-based, which have been used in studies in yeasts (Kellis et al., 2004), vertebrates
(Dehal & Boore, 2005; J. J. Smith et al., 2013) and plants (Bowers et al., 2003; Tang, Bowers, et al.,
2008). In addition, synteny conservation is preserved across very long evolutionary distances, for example
across eudicot-monocot comparison, and is unaffected by DNA substitution rate variation. Two synteny
detection programs that are capable of aligning multiple genomes are MCscan (Tang, Bowers, et al.,
2008; Tang, Wang, et al., 2008; Y. Wang et al., 2012) and ADHoRe (Proost et al., 2012; Simillion,
Janssens, Sterck, & Van de Peer, 2008). On the other hand, because paralogous regions from a paleo-
polyploidy event usually undergo reciprocal gene loss, having a reference genome that did not experience
the paleo-polyploidy (and subsequent gene loss) under study is very helpful in recovering maximum
syntenic mapping between the regions. For example, in rosids some genomes have not experienced
additional WGDs after γ, such as grape (Jaillon et al., 2007), papaya (Ming et al., 2008), and peach
(Verde et al., 2013). These often serve as outgroups when studying more recent WGDs in other rosid
lineages. For more comprehensive reviews of the methods used in paleo-polyploidy identification, readers
are referred to (Paterson et al., 2010) and Chapter 8 in (Paterson, 2014).
2.5 The paleo-hexaploidy T: triplication of the Solanaceae ancestral genome
Paleo-polyploidy in Solanaceae was first detected from studies of genetic map data, and supported by
EST data. Early comparison of a 293 loci potato genetic map with the A. thaliana genome suggested
possible ancient segmental duplications (Gebhardt et al., 2003). Based on patterns of paralogous genes
synonymous (third codon position) substitutions (Ks) in tomato and potato EST sequences this event was
inferred to be a genome-wide duplication, and estimated to predate tomato-potato divergence (Blanc &
Wolfe, 2004; Cui et al., 2006; Schlueter et al., 2004). Using 1,392 duplicated gene families shared by 8
plant species Schlueter et al. (Schlueter et al., 2004) modeled a log normal Ks component (median 0.632)

!
!
25
in tomato corresponding to an inferred WGD ~52 MYA. Independent study by Blanc et al. (Blanc &
Wolfe, 2004) analyzed 7,963 tomato and 6,597 potato paralogs, and estimated a modal Ks peak of ~0.60.
Using constant-rate birth-death process as a null model Cui et al. (Cui et al., 2006) identified a significant
Ks peak (median ~0.79) in tomato paralogous genes from 10,028 EST and 5,303 Unigene sequences,
further supporting this paleo-polyploidy event.
Analysis of the tomato genome sequence revealed this WGD event to be a paleo-hexaploidy
(triplication) (Tomato Genome Consortium, 2012), which was called ‘T’ for easy reference. Distribution
of Ks values between syntenic tomato paralogs confirmed previous inferences of the paleo-polyploidy. To
dissect the patterns of homeology, syntenic regions, i.e. with matching gene content and order, were
aligned between the genomes of tomato and the rosid plant grape (Vitis vinifera) that has been free of
additional WGDs after the pan-core eudicot γ event (Jaillon et al., 2007; Tang, Bowers, et al., 2008;
Tang, Wang, et al., 2008), and is therefore a valuable reference in plant genome comparisons. This
comparison clearly showed the shared γ event between the two lineages and the unshared T event in
tomato (Tomato Genome Consortium, 2012). Because of massive gene loss following paleo-polyploidy,
most (~95.8%) T triplicates in tomato have lost 1~2 homeologs. However across the entire genome
signals of synteny are strong enough to allow detection of the triplication patterns. Genome-wide, 73% of
tomato gene loci are in blocks that are each orthologous to one grape region, collectively covering 84% of
the grape gene space. Among those grape regions, 26.8% map to one orthologous region in tomato,
47.4% to two, and 25.7% to three, a pattern most parsimoniously explained by a historical triplication in
tomato. By aligning against single orthologous grape genomic regions, the present-day tomato genome
can be partitioned into three nearly non-overlapping T ‘subgenomes’ (Figure 2 in (Tomato Genome
Consortium, 2012), also as Figure 2.1 in this chapter). Each of the three subgenomes now spans all 12
tomato chromosomes, indicating extensive genome rearrangement since the triplication. After
polyploidization, there is sometimes noticeable difference in the evolution of the subgenomes, known as
biased fractionation or subgenome dominance (Sankoff & Zheng, 2012; J. C. Schnable et al., 2011; Tang
et al., 2012; Thomas et al., 2006). The three paleo-subgenomes in the present-day tomato genome cover

!
!
26
45.5%, 21.5%, and 9.9% of gene loci, respectively, possibly reflecting this phenomenon.
The potato, another species in the genus Solanum that diverged from tomato ~7.3 MYA, was
sequenced at about the same time (Potato Genome Sequencing et al., 2011), and shared the T event. The
potato and tomato genomes are highly colinear (Figure 2.7). There is relatively small ~8.7% nucleotide
divergence and 9 major inversions between the two genomes (Tomato Genome Consortium, 2012).
Comparison of potato and grape genomes showed single grape regions corresponding to 1~3 potato
regions. Overall 27.8% of grape genes are in regions orthologous to one region in potato, 38.1% to two
regions, and 14.5% to three regions, collectively spanning 68% of the gene space in potato and 80% in
grape, consistent with the results between tomato and grape. Patterns of Ks distribution among triplicated
potato paralogs closely resemble those of tomato as well, and are clearly distinct from those of γ paralogs
(Tomato Genome Consortium, 2012). The only discrepancy lied in that the potato genome paper (Potato
Genome Sequencing et al., 2011) reported this event as a duplication instead of a triplication. However,
careful re-examination of Supplementary Figure 6b of the paper, which aligned syntenic regions between
grape, Arabidopsis, poplar, and potato, revealed that the figure missed the third T region on potato
chromosome 8. Therefore, both independent analysis of the potato genome and re-examination of
previous results support that T was a triplication that predated potato-tomato divergence.
2.6 Further circumscribing the T event using additional asterid genomes
Based on Ks distributions of paralogous tomato genes the triplication T was estimated to have occurred
90.4~51.6 MYA (Figure 2.2 and (Tomato Genome Consortium, 2012)). The divergence of ancestral
Euasterid I and II lineages is around 123~85 MYA (Hedges, Dudley, & Kumar, 2006), making it possible
that T was shared by those lineages. In order to evaluate these possibilities, newly published genomes of
asterid species monkey flower (Mimulus guttatus, Scrophulariaceae family), bladderwort (Utricularia
gibba, Lentibulariaceae family), kiwifruit (Actinidia chinensis, Actinidiaceae family), and 6 BACs from
coffee (Coffea Arabica, Rubiaceae family) were analyzed and compared to the tomato genome. The
circumscription of WGD events in these lineages is summarized in Figure 2.3.

!
!
27
Kiwifruit (Actinidia chinensis) belongs to the basal asterid order Ericales. The kiwifruit genome
experienced the γ triplication, after which it experienced two lineage-specific WGDs that were not shared
with the Euasterid I and II lineages (Huang et al., 2013). Comparing the kiwifruit genome to the tomato
genome revealed a synteny pattern of 4-to-3 correspondence (Figure 2.4), indicating that the T
triplication event was not shared by kiwifruit, as otherwise a 1-to-4 synteny correspondence would be
observed. This inference is consistent with dating of the relative WGD and speciation events on the two
lineages based on molecular data (not shown), and inferences from the kiwifruit genome paper (Huang et
al., 2013).
The recently published genomes of monkey flower (Mimulus guttatus) and bladderwort
(Utricularia gibba) helped confine the timing of T within the Euasterids. Bladderwort has one of the
smallest genomes among flowering plants (~82 Mb). However it has experienced the γ triplication as well
as three more WGDs in its lineage (Ibarra-Laclette et al., 2013) that were close in time (Figure 2.2).
Detailed synteny analysis revealed that the first of these three WGDs was shared with its sister lineage
Mimulus of the Lamiales (Ibarra-Laclette et al., 2013), which is also the only lineage-specific WGD in
Mimulus (Figure 2.3). Since ancestral linkages are preserved better in the monkey flower genome which
experienced fewer WGDs than bladderwort, the former is compared to the tomato genome (Figure 2.5).
Each set of T paralogous regions in tomato (up to 3 regions retained in the present-day genome)
correspond to up to two paralogous regions in monkey flower (Figure 2.5), collectively spanning 88.4%
of the monkey flower genome and 82.0% of the tomato genome. Distribution of the synteny blocks’
anchor gene pairs median Ks values (an approximation of evolutionary distance between the syntenic
regions) forms a single population, again suggesting that the tomato-monkey flower split predated their
lineage-specific WGDs. Therefore T is likely not shared with the Lamiales, an inference also supported in
the bladderwort genome paper (Ibarra-Laclette et al., 2013).

!
!
28
Figure 2.2 Histograms of Ks (nucleotide substitutions per synonymous site) between paralogous and
orthologous gene pairs in tomato, monkey flower, bladderwort, and grape. The x-axis is Ks values filtered
as [0, 3] since Ks < 0 reflects invalid calculation in PAML and Ks > 3 exceeds empirical threshold for
saturation of nucleotide divergence. The y-axis is percentage of gene pairs. The curves are plotted with
different colors, but also labeled by their peak order from left to right. Comparison among the Ks
distributions indicated that tomato has average nucleotide substitution rate slower than that of monkey
flower, while bladderwort has the highest rate.

!
!
29
Figure 2.3 Simplified cladogram of some representative asterid and outgroup lineages. The
phylogenetic relationships are according to APG III (The Angiosperm Phylogeny Group, 2009) and to our
current best knowledge are unambiguous. Branch length has no meaning. Paleo-polyploidy events
identified in those lineages are represented by circles, labeled with their names if given. The WGD event
in the ancestor of sunflower and lettuce may be a triplication (Truco et al., 2013). The main references for
the paleo-polyploidy events are: (Barker et al., 2008; Hellsten et al., 2013; Huang et al., 2013; Ibarra-
Laclette et al., 2013; Jaillon et al., 2007; Ming et al., 2013; Tang, Wang, et al., 2008; Tomato Genome
Consortium, 2012; Truco et al., 2013).
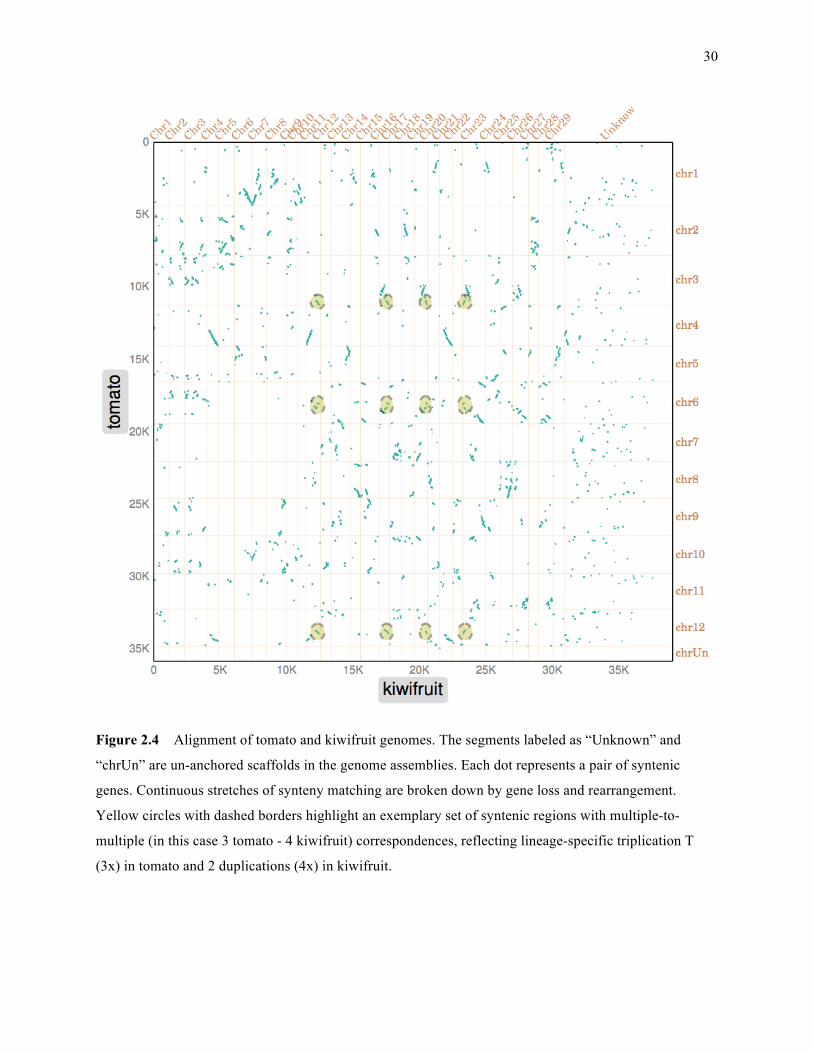
!
!
30
Figure 2.4 Alignment of tomato and kiwifruit genomes. The segments labeled as “Unknown” and
“chrUn” are un-anchored scaffolds in the genome assemblies. Each dot represents a pair of syntenic
genes. Continuous stretches of synteny matching are broken down by gene loss and rearrangement.
Yellow circles with dashed borders highlight an exemplary set of syntenic regions with multiple-to-
multiple (in this case 3 tomato - 4 kiwifruit) correspondences, reflecting lineage-specific triplication T
(3x) in tomato and 2 duplications (4x) in kiwifruit.

!
!
31
Figure 2.5 Alignment of tomato and monkey flower genomes. Segment labeled as “chrUn” in tomato
genome (y-axis) contains un-anchored scaffolds in the genome assembly. Each dot represents a pair of
syntenic genes. Continuous stretches of syntenic matching are broken down by gene loss and
rearrangement. Yellow circles with dashed borders highlight an exemplary set of syntenic regions with
multiple-to-multiple (in this case 3 tomato - 2 monkey flower) correspondences, reflecting lineage-
specific triplication T (3x) in tomato and duplication (2x) in monkey flower.

!
!
32
The coffee plant Coffea arabica belongs to the asterid order Gentianales, which is thought to have
separated with the Solanales after their common ancestor diverged from the Lamiales (Moore et al., 2010;
D. E. Soltis et al., 2011). As of this writing, there is no published genome sequence in Gentianales, but
there are 6 coffee BACs in NCBI (GU123894 ~ GU123899) coming from a contiguous region of ~900
Kb. Sequence alignment and colinearity analysis revealed that this region is syntenic to three tomato
regions triplicated in T: Chr3:0.13-0.35Mb, Chr6:33.0-33.4Mb, Chr9:63.7-64.7Mb (Figure 2.6). The
region on tomato Chr9 has significantly more hits to the coffee region than those on chr6 or chr3 (198, 86,
108 respectively, Chi-square test P=1.79e-11), favoring the `WGD shared` model, i.e. tomato-coffee
divergence postdated triplication T. Analysis of two additional BACs (MA29G21 and MA17P03) from a
pair of orthologous regions in a recent allo-tetraploid Coffea arabica strain also supported the model of
triplication shared, with both of the BACs showing differentiated distance to the tomato triplets, and
synteny between at least one pair of the homeologous regions lost or diminished beyond detection.
Although biased fractionation of the T paleo-subgenomes could be an alternative explanation, such levels
of difference in synteny retention as seen in the coffee-tomato comparisons are not usually seen among
orthologous regions, but often seen between orthologous and out-paralogous regions, hence favoring the
hypothesis that T was shared by ancestors of tomato and coffee. On the other hand, percentage identity of
hits is not significantly different among the three alignments (Figure 2.6, pairwise Wilcoxon rank sum
test P-values are: Chr3 hits and Chr6 hits: 0.277; Chr3 hits and Chr9 hits: 0.008; Chr6 hits and Chr9 hits:
0.212), supporting the alternative hypotheses that coffee did not share T, or that tomato and coffee
diverged shortly after sharing T. A definitive inference will be possible when the genome sequences of
coffee or other Gentianales become available.
In summary our current best inference is that the T event likely occurred near the Gentianales-
Solanales split, a rough estimation of which is 108~71 MYA (Hedges et al., 2006). The exact distribution
of asterid lineages that have experienced the paleo-hexaploidy T will become clear when more genomes
are sequenced from this clade.

!
!
33
Figure 2.6 LASTZ alignment between the coffee BAC region and tomato genome. The ~900 kb coffee
BAC sequenced region is from (Cenci, Combes, & Lashermes, 2010). It is aligned to three syntenic
regions on tomato chromosomes 3, 6, 9 (triplet from the paleo-hexaploidy T). The hits are represented by
stretches of lines on the plot, with colors coded by percent identity, and line width proportional to the
logarithm of hit length.

!
!
34
2.7 A more ancient hexaploidy γ predated divergence of rosid and asterid plants
When comparing the first plant genome of A. thaliana with a soybean genetic map (D. Grant et al., 2000)
and a 105 Kb tomato BAC region (Ku et al., 2000) it was suggested that the compact A. thaliana genome
may nonetheless contain more than two paleo-subgenomes, possibly resulting from two or more paleo-
polyploidies (Ku et al., 2000). Indeed, using a sensitive phylogenomic approach 34 paralogous regions
covering a total of 89% of the A. thaliana genome were circumscribed into three WGD events, named ‘γ’,
‘β’, and ‘α’ (Bowers et al., 2003), the first of which turned out to be a hexaploidy (Jaillon et al., 2007;
Tang, Wang, et al., 2008). Through several studies in recent years, the γ event has been found to be
shared by most or all core eudicot lineages.
Synteny comparison between tomato and grape revealed that γ predated the asterid-rosid
divergence. In an analysis of 72 tomato BACs and the sequenced grape genome, each individual tomato
BAC has primary association to only one of the triplicate regions rather than showing equal matches to
each of the three γ regions in grape, suggesting that γ likely predated tomato-grape divergence (Tang,
Wang, et al., 2008). This inference was later supported by analysis of the tomato genome, in which
individual regions correspond most closely to only one of the triplicated regions in grape, and no grape
region is orthologous to more than one set of re-triplicated regions in tomato (Tomato Genome
Consortium, 2012).
On the other hand, the genome of the first sequenced basal eudicots, Sacred lotus (Nelumbo
nucifera) of the order Proteales, did not share γ (but rather had a lineage-specific paleo-tetraploidy event
‘λ’) (Ming et al., 2013), placing γ somewhere on the basal eudicot branches after the Proteales lineage
branched off. Two recent studies have further confined the timing of the γ paleo-hexaploidy to a narrow
window shortly predating the divergence of the earliest core eudicot lineages. Phylogenetic analysis of
769 gene families from a large collection of angiosperm species dated γ after the divergence of the
Ranunculales (a basal eudicot) and core eudicots (Jiao et al., 2012). Phylogenetic analysis of subfamilies
of MADS-box genes and transcriptomes from several basal eudicot species further placed γ after the

!
!
35
divergence of two basal eudicot orders (Buxales and Trochodendrales) and the rest of eudicots, but before
the branching of the Gunnerales (basal core eudicots) (Vekemans et al., 2012).
2.8 The nature and consequences of the γ and T paleo-hexaploidy events
Subgenomes joined in a polyploidization event are typically ‘diploidized’, i.e. gradually restoring diploid
inheritance through processes of fractionation (loss of duplicated genes) (Force et al., 1999; Lynch &
Conery, 2000; Thomas et al., 2006) and structural rearrangement (Tang, Bowers, et al., 2008; K. H.
Wolfe, 2001). Substantial difference in the levels of fractionation among subgenomes is sometimes
indicative of possible ancient allo-polyploidy. Study of fractionation patterns in the three grape
subgenomes produced in the γ paleo-hexaploidy showed that two subgenomes are more fractionated with
respect to each other than to the third subgenome, suggesting that γ possibly involved hybridization
between two somewhat divergent species, one of which had been previously autotetraploidized (Lyons,
Pedersen, Kane, & Freeling, 2008). However, hybridization of differentiated progenitors is not a
necessary condition for differentiated fractionation patterns between subgenomes, which could also be the
results of post-polyploidy evolution. Phylogenetic trees constructed from triplets of γ paralogs and
outgroup genes lack one dominant topology, suggesting that γ may also have been an auto-hexaploidy
formed from a single progenitor, or an allo-hexaploidy formed from fusions of three moderately diverged
genomes (Tang, Wang, et al., 2008). More knowledge of the ancestral karyotypes will be needed to
distinguish between those evolutionary scenarios.
Much reminiscent of the case of γ, on one hand T triplets in tomato produce a mixed population
of phylogenetic trees with all the possible topologies, indicating lack of sequence divergence in the T
progenitor genomes. On the other hand there is fractionation difference between the three subgenomes:
T1 and T2 are less fractionated with respect to each other than to the third subgenome T3 (data not
shown). These results suggested that T was possibly an auto-hexaploidy or an allo-hexaploidy of two
closely related species and one more distant species. Allo-polyploidy is often thought to be more frequent
in nature due to advantages in the establishment of the polyploid strains resulting from factors such as

!
!
36
heterosis, homeostasis, and fewer meiotic irregularities. However, the frequency of natural auto-
polyploidy and its effects on species diversity may be higher than traditionally thought (Ramsey &
Schemske, 1998). As with γ, because of the antiquity of the T event, a definitive conclusion cannot be
drawn due to degradation of molecular signatures and loss of the progenitor genomes. However, current
data are in support of T having a higher possibility to have been an auto-polyploidy than the other two
paleo-hexaploidies, the γ event (discussed above) and the Brassica paleo-hexaploidy which appears to
have been an allo-hexaploidy (Tang et al., 2012). This would also be consistent with the fact that
Solanaceae species do form autopolyploids in agricultural and natural settings. If T were indeed a paleo-
autohexaploidy, it would be the only one known so far. Genome sequences from closely related sister taxa
will aid in the test of this hypothesis.
Comparison between the tomato and potato genomes showed that about 91% of post-T gene loss
is orthologous, indicating that these genes had been lost before tomato-potato divergence. Paleo-
polyploidy events are usually followed by a phase of rapid genome evolution, including structural,
sequence, and regulatory changes (Adams & Wendel, 2005b; Lynch & Conery, 2000; K. Song, Lu, Tang,
& Osborn, 1995). Therefore it is possible that many of the shared changes in tomato and potato occurred
in their common ancestor shortly after T. On the other hand, evolution of genetic content in the triplicated
paleo-genome of the Solanaceae ancestor continued long after the paleo-polyploidy event. The
xyloglucan endotransglucosylase/hydrolase (XTH) family gene XTH10 that was triplicated in the T event
showed differential loss between the tomato and potato genomes which diverged ~65 MY after T
(Tomato Genome Consortium, 2012). Although tomato and potato genomes have maintained very similar
karyotypes in ~7.3 MY of separate evolution, and 70~80% of their genes have remained orthologous
(Figure 2.7 left panels), there has been continuous rearrangement of the ancestral genome content in the
two lineages. The present-day tomato and potato chromosomes differ by 9 major and several smaller
inversions, and numerous local micro-synteny differences. About 4.8% (tomato) and 4.6% (potato) of the
orthologous loci triplicated in T have been differentially lost between tomato and potato after their
divergence. Ancestral subgenomes produced in the pan-core eudicot γ triplication had undergone

!
!
37
extensive rearrangement before tomato-potato divergence, but have continued to be restructured
independently in their recent independent lineage histories (Figure 2.7 right panels). Therefore paleo-
polyploidy poses both immediate and long-term effects on the evolution and diversity of genome
structure.
Figure 2.7 Schematic representation of orthologous and paralogous regions in tomato (S. lycopersicum)
and potato (S. tuberosum) genomes. On the left side of the chromosome bars the purple regions are
orthologous between tomato and potato. On the right side, 7 colors are used to paint genomic regions
corresponding to 7 chromosomes in the inferred pan-core eudicot ancestral genomes (pre-γ) using grape
genome data (Jaillon et al., 2007). Each of the γ-triplicated (3x) ancestral regions later underwent the T
triplication (3x), resulting in their dispersed and multiplied (up to 9x) pattern in today’s tomato and potato
genomes. The gray shades and dark gray circles mark estimated heterochromatin regions and
centromeres, respectively, from cytological experiments. Corresponding linkage groups (chromosomes)
between tomato and potato are labeled with same color.

!
!
38
In addition to the widespread effects of paleo-polyploidy, there are also important lineage-
specific effects of the individual events. For example, the two ancient genome triplications in tomato have
produced new gene family members that mediate important functions in its fruit ripening control, such as
some transcription factors and enzymes necessary for red light photoreceptors influencing fruit quality
(PHYB1/PHYB2) (expended in T), ethylene- and light-regulated genes mediating lycopene biosynthesis
(PSY1/PSY2) (expended in T), and ethylene biosynthesis (RIN, CNR, ACS) (expended in T) and
perception (ETR3/NR, ETR4) (expanded in γ) (Tomato Genome Consortium, 2012). More case studies
like this are a clear future research interest in revealing how the expanded genetic repertoire from paleo-
polyploidy events contribute to biological diversity and the evolution of unique characteristics of
individual lineages.
All paleo-hexaploidy events identified so far are in eudicot lineages, including one in the core
eudicot stem lineage (γ), one near the origin of the asterid Solanaceae family (T), one in the rosid
Brassica lineages (X. Wang, Wang, et al., 2011), possibly one in the Gossypium lineages (Paterson et al.,
2012) and one in the ancestral Compositae lineages (Truco et al., 2013). Although some wild monocot
plants such as the grass ‘Timothy’ (Phleum pratense) (NordenskiÖLd, 1953), and crops such as the bread
wheat (Triticum aestivum) are neo-hexaploids, paleo-hexaploidy has not been found in any monocot
genome studied so far. This raises curious questions about possible reasons and consequences associated
with these events in the evolutionary history of some or all eudicot lineages, or alternatively, possible
factors for suppressing such events in the evolution of other lineages.
2.9 Summary and perspective
Sequencing of the tomato genome was very valuable in many ways, as detailed elsewhere in this volume.
With regard to angiosperm evolution, the tomato genome sequence revealed the third paleo-hexaploidy
identified in plants, and the first one in asterids, adding an important sample to the small collection of
paleo-hexaploids. It confirmed that the γ event shared by all sequenced rosids was also shared by asterids,
unmasking a new clade for studying the effects and consequences of γ. The T paleo-hexaploidy is

!
!
39
possibly associated with the Solanaceae-Rubiaceae divergence, and divergence of early Solanaceae
lineages, by triplicating the whole ancestral genome content, creating great potentials for subsequent
diversification of homologous genomic associations and development of lineage-specific traits such as
fruit ripening in tomato. Comparison of the tomato and potato genomes, both currently included in the
genus Solanum, revealed continuous restructuring of paleo-triplicated ancestral loci long after the paleo-
polyploidy events. The Solanum lineage is the first identified angiosperm lineage experiencing two paleo-
hexaploidies but no paleo-tetraploidy. The consecutive paleo-hexaploidies γ and T are also valuable for
comparative studies of the mechanisms and effects of paleo-hexaploidy and paleo-tetraploidy. Many
questions about paleo-polyploidy have been answered, which nevertheless opened the door to more
interesting questions.

!
!
40
CHAPTER 3 A WELL-RETAINED ANCIENT GENOME DUPLICATION IN THE SLOWLY
EVOLVING BASAL EUDICOT NELUMBO (LOTUS) LINEAGE
3.1 Introduction
Nelumbo is the only genus in the Nelumbonaceae family, and has only two species: N. nucifera (sacred
lotus) and N. lutea (yellow lotus), both aquatic plants. Lotus plants are well known for their divine
flowers, seed longevity (more than 1000 years), self-cleaning leaf surface, and thermogenesis. They have
deep roots in Asian culture and agriculture, and are widely cultivated for many uses such as gardening,
food, and herbal medicine. Nelumbonaceae belongs to the basal eudicot order Proteales. Basal eudicots
include the Ranunculales, Sabiales, Proteales, Trochodendrales, and Buxales orders. Their phylogenetic
relationships have not been fully resolved, partly due to much diversity in their morphological and
reproductive characters, and more fundamentally due to the antiquity and closeness of their divergence
events and substantial variation in their lineage evolutionary rates. Nevertheless it is clear that Proteales
are an outgroup of core eudicots, which include all other eudicots sequenced to date. The Nelumbo
lineage originated around 135~125 MYA, and is considered a ‘living fossil’ because of both molecular
and morphological stasis (Moore et al., 2010; Michael J Sanderson & Doyle, 2001).
Sequencing of the sacred lotus (‘China Antique’ variety) genome (Ming et al., 2013) revealed
that Nelumbo diverged from the core eudicot crown group before the γ paleo-hexaploidy occurred in the
latter. Therefore lotus is not only the first basal eudicot genome sequenced, but also the only eudicot
genome sequenced so far that did not share γ, making it a natural reference for genome comparisons in
core eudicots. Analysis of evolutionary distance between homeologous genes revealed that average
nucleotide substitution rate in lotus is ~30% slower than that in grape (Vitis vinifera), another slowly
evolving lineage in basal rosids. Lotus has experienced a paleo-tetraploidy λ in its own lineage around
76~54 MYA. In accord with its slow lineage nucleotide substitution rate, more ancestral loci were

!
!
41
retained in lotus after λ than in many other paleo-polyploid genomes. Compared to grape, the widely used
reference in plant genome comparisons, the lotus genome aligns to more syntenic genes in both eudicots
(such as Arabidopsis) and monocots (such as rice and sorghum). These characters made lotus a good new
reference for comparisons of core eudicot genomes and monocot genomes.
3.2 A lineage-specific paleo-tetraploidy (λ) after divergence with core eudicots
Sacred lotus is a paleo-tetraploid. This whole genome duplication event, hereby named ‘λ’, is reliably
detected by both ab intra alignment within the genome itself (data not shown), or when comparing
against another genome such as grape (a rosid, Figure 3.1) and rice (a monocot, data not shown). When
aligning the lotus and grape genomes, up to three homeologous regions are clear in grape, as expected
from the γ triplication in grape. Reciprocally, each γ region in grape genome aligns about equally well to
up to two regions, λ paralogs, in the lotus genome.
Importantly, this implies that the Nelumbo lineage did not experience the pan-core eudicot paleo-
hexaploidy γ, at least not in its entirety. It has remained unclear whether γ is a single event or a series of
two nuclear fusion events (Lyons et al., 2008; Ming et al., 2013; Tang, Wang, et al., 2008). In the latter
case, it would be possible, albeit improbable, that only the first one was shared by the ancestors of lotus
(and perhaps some other basal eudicots), accounting for the low proportions of lotus loci with paleo-
polyploidy depth greater than 2 as expected from λ (Table 3.1). An alternative to this hypothesis is that
the extra depth could originate from additional duplication(s) much earlier than λ and different from γ.
Current data favor the second hypothesis as both syntenic patterns and sequence divergence indicated that
γ-paralogs in grape are equivalently distant to their lotus ortholog. However there is intrinsic uncertainty
associated with studies of ancient events occurring several to hundreds of millions of years ago, especially
if they are chronologically close to each other. Availability of more basal eudicot genomes will be helpful
to verify if γ indeed occurred completely after Proteales had diverged.

!
!
42
Figure 3.1 Dot plot alignment of the lotus and grape genomes. Each dot represents a pair of syntenic
genes. Yellow circles with dashed borders highlight an exemplary set of syntenic regions with multiple-
to-multiple (in this case 2 lotus - 3 grape) correspondences between the orthologs, reflecting lineage-
specific duplication λ (2x) in lotus and pan-core eudicot triplication γ (3x) in grape. Names of small
scaffolds in lotus are omitted for clarity.

!
!
43
Table 3.1 Distribution of lotus loci at different paleo-polyploidy depths.
Paleo-polyploidy depth 1 2 3 4 >4 All
# of ancestral loci 5279 4289 279 165 80 10092
# of genes 5279 (19.8%)
8578 (32.1%)
837 (3.1%)
660 (2.5%)
510 (1.9%)
15864 (59.4%)
Domain coverage (# of unique
domains)
2263 (1112)
1861 (689) 296 (20) 174 (15) 103 (1) 3046
* Singleton homeologs (depth=1) in the sacred lotus genome were compiled from inter-genomic
alignment with the grapevine and Arabidopsis genomes to be conservative in including sacred lotus
specific genes.
Overall, 92.3% of the lotus genic regions have detectable paleo-polyploid origin. Among the
homeologs (excluding tandem duplications) 5279 (33.3%) are singletons, 8578 (54.1%) are in duplex;
and 2007 (12.6%) have more than 2 homeologs (Table 3.1). Unlike the case of a quartet of regions on
rice chromosomes 11-12, and sorghum chromosomes 5-8 (Paterson et al., 2009), there does not appear to
be large blocks of the lotus genome experiencing concerted evolution. A total of 288 lotus genes are
contained in regions with no synteny to any of the genomes of grape, Arabidopsis, sorghum, and itself,
nor are they homologous to any other lotus genes. These single copy genes, if not accounted for by mis-
annotation or technical limits of homology search, may be either ancestral genes uniquely retained in the
lotus genome, or lineage-specific genes.
The λ-duplicates in lotus have a median synonymous substitution rate (Ks) distribution of 0.5428,
corresponding to an age of ~27 million years ago (MYA) on the basis of an average rate of ~1*10e-8 in
eudicots (Koch, Haubold, & Mitchell-Olds, 2000; Kenneth H. Wolfe, Sharp, & Li, 1989) or 54 MYA on
the basis of the grape lineage rate (Figure 3.2). The median Ks between the grape triplets produced in γ
(which we infer to have occurred after the Vitis- Nelumbo lineages diverged) is about 1.2208, which is
slightly higher than the Ks for grape-lotus (median is 1.1452) despite being a more recent event (Figure
3.2). This suggests that the mutation rate in Nelumbo is lower than in Vitis (Nelumbo-Vitis differentiation
reflecting an average of the two rates). Relative to the estimated 135~125 MYA (Moore et al., 2010)

!
!
44
divergence of Nelumbo from other eudicots, this implies that the Nelumbo duplication occurred about 65
MYA with a range between 76 and 54 MYA.
Figure 3.2 Distribution of synonymous substitution rate (Ks) between homeologous gene pairs in intra-
and inter- genomic comparisons. See figure legend for details.
3.3 Slow lineage evolutionary rate
Three lines of evidence suggested that the lineage nucleotide substitution rate in lotus is about 30%
slower than that of grape. First, since syntenic and phylogenetic evidence both dated the lotus-grape
divergence before the pan-core eudicot γ triplication (affecting grape but not lotus) (Ming et al., 2013), if
the lineage rate in lotus is equal to or higher than grape, lotus-grape orthologs should have average
synonymous substitution rates (Ks) greater than γ-paralogs in grape. Instead, Figure 3.2 showed average
0.0 0.5 1.0 1.5 2.0 2.5 3.0
0.00
0.05
0.10
0.15
Ks
Perc
enta
ge o
f gen
e pa
irs
lotus_grapesorghum_paralogslotus_paralogsgrape_paralogslotus_sorghumlotus_Arabidopsis
!
!
45
Ks between lotus-grape orthologs less than that between grape γ-paralogs. Second, the lotus lineage
mutation rate also appears slower (about 29.26% slower) than that of grape based on a maximum-
likelihood tree of 83 plastid genes (Moore et al., 2010) and expert dating of the respective speciation
events (Hedges et al., 2006) using the r8s program (Michael J. Sanderson, 2003) with penalized
likelihood. Third, the lotus genome has retained more ancestral loci following its lineage-specific WGD
(Figure 3.3 in next section).
Nucleotide substitution rates in plants seem to have a definite trend of negative association with
generation time and longevity, albeit with other complicating factors (such as breeding system, population
size, speciation rate, environment), and with still unclear mechanisms (Gaut, Yang, Takuno, & Eguiarte,
2011; S. A. Smith & Donoghue, 2008). This could be a major factor underlying the slow lineage rate in
Nelumbo.
Since its release in 2007 the grapevine genome has been widely used as a reference in angiosperm
comparative genomics because of its phylogenetic position in basal rosids, slow lineage nucleotide
substitution rate, and lack of reduplication. Lotus is a basal eudicot sister to all core eudicot lineages
including grape, not affected by γ, and has lineage nucleotide substitution rate ~30% slower than grape.
Lotus potentially represents a better reference than grape for comparative genomic studies involving
eudicots and monocots.
3.4 Outgroup for core eudicot and monocot genome comparisons
When analyzing synteny patterns in plant genomes with high paleo-polyploidy levels, reciprocal and
differentiated gene loss in the evolution of the paleo-subgenomes sometimes render the signals of synteny
elusive. In such cases an outgroup genome with few paleo-polyploidy events is used to take advantage of
the smaller evolutionary distances between orthologs, and better retained ancestral gene orders. An
example of such outgroup genomes is the grape genome, which has been widely used in plant genome
comparisons since its release in 2007 (Jaillon et al., 2007). Compared to grape, the newly sequenced lotus
genome has higher proportions of homeologous genes aligned with both eudicot and monocot genomes,

!
!
46
exemplified in Figure 3.3. The lotus genome also has a high level of ancestral loci retention (Figures 3.3,
3.4). Therefore lotus qualifies to be a new outgroup for core eudicot and monocot genome comparisons.
Because of reciprocal loss of duplicated ancestral loci during diploidization, inter-genomic
alignment (such as between the lotus and grape genomes) often recovers more synteny signals than intra-
genomic alignment (such as within the lotus or grape genome). This seems true both within eudicots, such
as grape-Arabidopsis vs. Arabidopsis-Arabidopsis; or grape-tomato VS tomato-tomato; and inside
monocots, such as sorghum-maize vs. maize-maize. While showing the same trend, the difference of
inter- and intra- genomic comparisons of lotus is much less dramatic (compare lotus-lotus vs. lotus-grape,
and grape-grape vs. grape-lotus in Figure 3.3) due to higher retention of homeologs after λ.
Therefore, extensive synteny within itself, as well as with other eudicot and monocot genomes
make the sacred lotus genome not only an evo-genomic reference potentially more informative than the
grape genome, but also a valuable candidate for the reconstruction of the pan-eudicot genome, and
improvement of distant genome comparisons between eudicots and monocots (Paterson, Bowers, &
Chapman, 2004; Tang et al., 2010). Such comparisons, and the critical phylogenetic position, relatively
simple evolutionary history, and slow evolution rate of the sacred lotus genome, are altogether valuable
for clarifying the so-far elusive relationships among the chronically close events of the pan-core eudicot γ
paleo-hexaploidy (Jaillon et al., 2007; Tang, Bowers, et al., 2008; Tang, Wang, et al., 2008), early
eudicot radiation, and a paleo-polyploidy in early monocot lineages (Tang et al., 2010).

!
!
47
Figure 3.3 Number and percentage of genes in the query genomes having homeologous genes in the
reference genome. Grape or sacred lotus genomes were used as reference. Arabidopsis, rice, and sorghum
genomes were used as queries. All pairwise differences are statistically significant.

!
!
48
Figure 3.4 Multiple alignment of a set of syntenic regions in papaya, peach, grape and lotus. Triangles
represent individual genes and their transcriptional orientations. Genes with no syntenic matches are not
plotted. The event γ is the paleo-hexaploidy that occurred in ancestral eudicots, and is shared by the
grape, peach, and papaya lineages. The event λ is the paleo-tetraploidy in the Nelumbo (sacred lotus)
lineage after it diverged from the rest of eudicot lineages. The γ regions are grouped into three γ-
subgenomes based on parsimony principles. Aligned genes within each γ subgenome are merged into a
consensus order (Con γA, γB, γC respectively). Ancestral genes with uncertain orientations are represented
by squares. The pair of sister λ regions in lotus is displayed at the bottom.
!
!
49
3.5 Discussion
Scrutiny of the sacred lotus genome revealed a paleo-tetraploidy event λ, with each of the duplicated λ
regions matched to the same set of γ triplet regions in grape, indicating 2-to-3 correspondence. Sacred
lotus genes are typically diverged to similar degrees from their (up to) three orthologous grape genes,
with the best matching orthologs distributed evenly among triplets of γ regions. Molecular dating based
on synonymous substitution rates between homeologous genes (Ks) positioned λ at about 76~54 MYA.
These results indicate that the ancestral Nelumbo lineage diverged from core eudicot ancestors before the
γ paleo-hexaploidy occurred in the latter around 125 MYA, and subsequently experienced a lineage
specific paleo-tetraploidy (Ming et al., 2013).
When two lineages diverged before paleo-polyploidy occurred in one of them, we would expect
similar divergence of paralogous genes in one genome when compared to their shared ortholog in the
other genome, as observed in previous studies (Tang, Wang, et al., 2008; X. Wang, Wang, et al., 2011).
Comparisons of two λ paralogs and their grape orthologs generally fit this prediction (Figure 3.5a).
Interestingly, when comparing sets of two λ paralogs with their common sorghum orthologs, there seem
to be consistent differentiation in the distance of the two branches (Figure 3.5b). Notice that the
singleton λ homeologs have overall averaged distance between the duplets, consistent with reciprocal
gene loss. This discrepancy in the lotus-cereal comparison could be explained by fast evolutionary rates in
cereals and/or slow evolutionary rate in Nelumbo and λ being older than it appears. Alternatively, this is
also consistent with genome structural compartmentalization, with genes within the same genome
undergoing different evolutionary trajectories (X. Wang, Wang, et al., 2011). Wider taxa sampling at
neighboring branches will help better distinguish the possibilities.

!
!
50
Figure 3.5 Ks distributions between orthologous homeologs gene pairs comparing the lotus genome to
the grape genome (a) and sorghum genome (b). Red lines represent single copy homeologs in the sacred
lotus genome. The pairs of homeologs in the lotus genome are arbitrarily assigned to the high Ks value
group (yellow lines) and low Ks group (green lines). If in all the duplets both sacred lotus genes are
equally distant from the grape/sorghum counterpart, it is expected the two sampling distributions should
be alike.
Subfunctionalization (M. Lynch & A. Force, 2000) is a major direction in the retention and
evolution of duplicated genes, where they undergo complementary divergence or loss of genic or
regulatory sequences leading to eventual functional complementation. The particularly high retention rate
of λ homeologs in the lotus genome suggested that subfunctionalization may have affected many of them.
In order to survey such effects, we have analyzed sequences of lotus homeologs from several aspects.
Comparison of pairs of homeologous genes showed that the majority have no difference in the
composition of PFAM domain families, while 453 (11.6% of) gene pairs differ by up to 5 domains. Those
unshared domains have mean length 17 aa in a range of 0~890 aa. The shared domains have mean bit
score difference 22.08 in a range of 0 to 871.7. Between homeologous lotus gene pairs, differences of
mRNA length (excluding 5’ and 3’ UTRs), CDS length, and intron length all follow geometric-like
distributions (Figure 3.6), consistent with independent accumulation of small indels. The changes of
length in exonic and intronic regions seem uncorrelated (Figure 3.6). While not an exhaustive analysis,

!
!
51
these results suggested that subfunctionalization of the lotus homeologs may have occurred at multiple
transcriptional and post-transcriptional levels, which is an interesting subject for future studies.
Figure 3.6 Differences in mRNA length, CDS length, intron length, and percentage mRNA length
difference attributable to intron length difference. Values were measured for each pair of homeologous
Sacred lotus genes. Extreme ranges on the X axes were trimmed for clarity.
Rates of molecular evolution often vary greatly among plant lineages (Gaut et al., 2011). For
example, nuclear gene nucleotide substitution rate in the Vitis lineage is estimated to be about 20% less
than in Populus (Tang, Wang, et al., 2008), while the Nelumbo rate is about 30% slower than Vitis (Ming
et al., 2013). Nucleotide substitution rates in plant organellar genomes also vary greatly, sometimes up to

!
!
52
100 fold or even more (Mower, Touzet, Gummow, Delph, & Palmer, 2007; K. H. Wolfe, Li, & Sharp,
1987). Although less explored, the frequency of genome rearrangements also varies among taxa, by at
least ten-fold (Paterson et al., 1996; Zuccolo et al., 2011). Some major reasons underlying these
variations are differences in generation time, life history, and environment of the organisms (Gaut et al.,
2011; S. A. Smith & Donoghue, 2008; Tuskan et al., 2006; Young et al., 2011).
In addition, it has been suspected that paleo-polyploidy events may accelerate lineage
evolutionary rates, such as rates of nucleotide substitutions, genome structural rearrangement at macro-
and micro- scales, and gene family size alteration (Adams & Wendel, 2005b; Lynch & Conery, 2000;
Otto & Whitton, 2000). However, the effects of polyploidy on the genome and organism is multi-layered,
including, in many instances, increased cell size, increased rate of early development, increased
illegitimate recombination, increased genetic and cellular instability, increased expression regulatory
complexity, transposable element expansion, nearly doubled effective population size after
autopolyploidy, and morphological changes (Adams & Wendel, 2005b; Otto, 2007; Otto & Whitton,
2000). Empirical observation shows that many lineages that have been identified with slow evolutionary
rate, such as grape, papaya, lotus, and poplar, have experienced relatively few WGDs. On the opposite
side, many lineages that have been identified with fast evolutionary rate, such as Arabidopsis,
bladderwort, and grasses, have experienced several WGDs. For example, the bladderwort genome, that
has experienced at least 4 WGDs, has higher average nucleotide substitution rate than tomato and monkey
flower, each having experienced 2 less WGDs (Jingping Li, Tang, Bowers, Ming, & Paterson, 2014).
There are also exceptions. For example, the soybean (Glycine max) lineage has experienced at least 3
WGDs but has slow molecular evolution rate (Schmutz et al., 2010); the banana (Musa acuminata)
lineage has experienced at least 4 WGDs but has slow molecular evolution rate (D'Hont et al., 2012).
Paleo-polyploidy events have also been associated with species expansion episodes (Otto & Whitton,
2000; D. E. Soltis et al., 2009; Van de Peer, Maere, & Meyer, 2009), and adaptation in changing
environmental conditions (Fawcett et al., 2009; Levin, 1983). Nonetheless, there have been very few
studies that directly measure evolutionary rates before and after polyploidy events. One study showed that

!
!
53
in the yeast Saccharomyces cerevisiae following chemical treatment mutation frequency may be elevated
in tetraploid but not diploid strains (Mayer, Goin, Arras, & Taylor-Mayer, 1992). At present it seems
likely that while paleo-polyploidy has the potential of increasing lineage evolutionary rate, the actual rate
is determined by complicated dynamic interactions of multiple biological and environmental factors.
Having preserved extensive synteny conservation from its single lineage specific paleo-
tetraploidy event λ, the sacred lotus genome has also retained high levels of homeology with other plant
genomes such as grape, Arabidopsis, rice, and sorghum. Lotus is a basal eudicot lineage and didn’t share
the pan-core eudicot paleo-hexaploidy. In addition, it has one of the slowest lineage evolutionary rates in
flowering plants (Ming et al., 2013). Lotus and the widely used reference grape genome both have high-
quality assemblies, grape with a chromosome-level assembly (scaffold N50=2.0 Mb) and lotus with a
megascaffold-level assembly (scaffold N50=3.4 Mb). Unique features of the lotus genome make it a
valuable additional and in some cases better reference than grape in outgrouping core eudicot and
monocot genome comparisons and bridging distant plant genome comparisons across eudicots and
monocots.

!
!
54
CHAPTER 4 THE PAN-GOSSYPIUM PALEO-POLYPLOIDY AND TWO NUMT REGIONS IN
TWO OF THE SUBGENOMES IN MODERN G. RAIMONDII
4.1 Abstract
Paleo-polyploidy (ancient whole genome duplication) events are a key evolutionary force of angiosperm
genome organization. Paralogous regions from one or more paleo-polyploidies are detectable in all
sequenced angiosperm genomes. In the lineages leading to Gossypium (cotton) species, a paleo-
hexaploidy (γ) was shared with other core eudicots. In addition, the newly sequenced G. raimondii
genome revealed an unusual paleopolyploidy (‘C’) dated to ~60 MYA, resulting in five- to six-fold
duplication of the ancestral Gossypium genome compared to an outgroup (Theobroma cacao) lacking this
event. Per site synonymous substitution between C-duplicates forms a bell-shaped curve with a single
peak, indicating that C consists of one event or several chronologically very close events. Our results here
showed that the five biggest subgenomes can be divided into two groups (SGI and SGII) based on
different subgenome structure. Synteny block size, fractionation level, and homeologous sequence
divergence are significantly different between the two groups. Estimated divergence based on
synonymous substitution rate corresponds to ~2.7 million years separation between SGI and SGII
subgenomes. On the other hand severe gene loss and complete loss of coverage in most regions of the
genome suggested that the hypothetical sixth subgenome was likely produced independent of the other
subgenomes. Ancestral reconstruction revealed that ancestral cotton loci tend to retain homeologs or
return to single copy repeatedly following the γ and C events. We also identified two multi-gene NUMT
regions on cotton chromosomes 1 and 13, belonging to SGI and SGII respectively. NUMT1 is longer and
better preserved than NUMT13, consistent with SGI-SGII comparison. Sequence conservation between
syntenic genes in the NUMT regions is far better than in other genomic regions. Our results revealed
evolutionary and functional compartmentation in the G. raimondii genome that is worth further studies.

!
!
55
4.2 Introduction
Gossypium raimondii is a wild diploid cotton species (2n=26) that resembles the D progenitor genome of
the domesticated tetraploid cottons. Gossypium (cotton) of the Malvaceae family includes 45 diploid, and
five allopolyploid species G. hirsutum, G. barbadense (two commercial cotton), G. tomentosum, G.
mustelinum, and G. darwinii. The tetraploid cottons each contain two divergent progenitor genomes, A
(African) and D (Mexican). The two progenitor genomes diverged about 5-10 MYA (million years ago)
and then reunited about 1-2 MYA in the New World (J. F. Wendel, 1989). Therefore sequencing its
genome (Paterson et al., 2012) is of interest to many basic and practical questions.
Analysis of the G. raimondii genomes revealed two paleo-polyploidy, or ancient whole genome
duplication (WGD) events in its lineage history, one in the core eudicot ancestral lineage, and one in the
Gossypium lineage shortly after it diverged from a common ancestor shared with the Theobroma lineage
(Paterson et al., 2012). Paleo-polyploidy events are duplications of whole genome content, commonly via
unreduced gametes or hybridization, which occurred millions to hundreds of millions of years ago.
Although polyploidized species experience dramatic mutations in the genome and often go extinct
(Arrigo & Barker, 2012), paleo-polyploids that have survived long evolution have been identified in the
eukaryotic kingdoms of Animalia (Dehal & Boore, 2005; Jaillon et al., 2004), Fungi (Kellis et al., 2004;
K. H. Wolfe & Shields, 1997), and Chromalveolata (Aury et al., 2006), and are widespread in Plantae,
especially in flowering plants. Paleo-polyploidies incur immediate effects such as increased genetic
content, increased cell volume, and altered chromosomal pairing; and long-term effects such as gene
family expansion, rewired biochemical networks, and karyotype change, usually through the
diploidization process. Therefore it is not surprising that paleo-polyploidies are associated with
origination, radiation, and evolution of a wide range of angiosperm taxa (for some recent reviews see (D.
E. Soltis et al., 2009; Van de Peer et al., 2009)).
The Gossypium lineage has experienced repeated paleo-polyploidies (Paterson et al., 2012).
Besides having shared the pan-core eudicot paleo-hexaploidy γ (Bowers et al., 2003; Jaillon et al., 2007;
Tang, Bowers, et al., 2008), it also had a lineage-specific paleo-polyploidy, herein called ‘C’. Particularly

!
!
56
interesting is that C is a paleo-(do)decaploidy (5~6x duplication) of the ancestral Gossypium genome
(Paterson et al., 2012). Homeologous genes duplicated in the C event all have similar sequence
divergence, indicating that C was a single polyploidy or several events close in time. The word
‘subgenome’ is sometimes used to refer to the A and D progenitor genome components in a tetraploid
cotton. We specifically note that in this paper ‘subgenome’ refers to pre-duplicated ancestral Gossypium
genome components that have been substantially restructured (during diploidization) in forming the
extant diploid genome, the same way as used in other such studies (J. C. Schnable et al., 2011).
We report here that the five major C-subgenomes can be divided into two groups (SGI and SGII)
based on different subgenome structure. Three subgenomes in SGI cover 75.13%, and two subgenomes in
SGII cover 15.34% of the cotton genome. Synteny block size, extent of fractionation (post-WGD gene
loss), and homeologous sequence divergence are significantly different between the two groups.
Difference in average synonymous substitution rates corresponds to about 2.7 million years separation
between SGI and SGII subgenomes. The hypothetical sixth subgenome has completely lost coverage in
most regions of the genome, suggesting that it may have been produced independent of the other
subgenomes. Using the aligned subgenomes and two outgroup genomes (cacao and grape) we
reconstructed the ancestral cotton gene order, which helped clarify synteny patterns from the nested γ
event in G. raimondii. It also helped reveal repeated tendency to retain or lose homeologs among
ancestral cotton loci following the γ and C events, respectively.
We also revealed two NUMT (nuclear mtDNA) regions on cotton chromosomes 1 and 13,
belonging to SGI and SGII respectively. NUMT-I is longer and better preserved than NUMT-II,
consistent with SGI-SGII comparison. NUMT-I is syntenic to two NUMT regions in cacao, while
NUMT-II is syntenic to no NUMT region in cacao but to the Arabidopsis thaliana NUMT region on
chromosome 2. Sequence conservation between syntenic genes in the NUMT regions is exceptionally
better than in other genomic regions. Our results will facilitate further analyses on the formation of the C
paleo-(do)decaploidy, and structural and functional compartmentation in the evolution of the G. raimondii
genome.

!
!
57
4.3 Methods
4.3.1 Data sources.
Nuclear genome assembly and annotation of Gossypium raimondii, Theobroma cacao, Vitis vinifera,
Arabidopsis thaliana were downloaded from Phytozome (http://phytozome.jgi.doe.gov/pz/portal.html#,
v10). The mitochondrial genome of Arabidopsis thaliana was downloaded from TAIR 10
(ftp://ftp.arabidopsis.org/home/tair/Sequences/). The mitochondrial genome of Gossypium hirsutum was
downloaded from NCBI with accession number JX065074.
4.3.2 Similarity search and synteny detection.
Matching gene pairs were identified by LASTZ (Harris, 2007) with default settings. Similarity between
nucleotide sequences was searched with LAST under default settings. Synteny blocks were identified and
quota screened by QUOTA-ALIGN (Tang et al., 2011) with block chaining distance 20, cotton-cacao
quota ratio 5:1. Only blocks with at least 5 anchor gene pairs were retained for further analysis.
4.3.3 Subgenome division.
Synteny blocks in the G. raimondii genome were chained by dynamic programming into 5 major
subgenomes based on structural constraints (no overlapping regions within a subgenome), and in favor of
longer blocks with more anchor genes, which are preferentially selected. The pairwise alignments were
resolved by a topological sorting algorithm to produce multiple alignment of the cotton subgenomic
regions (Supplementary File 1). The cacao genome from the sister clade was used as outgroup reference
of gene order to guide the chaining process.
4.3.4 Reconstruction of ancestral gene order before the C event.
The above aligned subgenomic regions were merged into pre-duplication segments by interpolation
following methods in previous studies (Bowers et al., 2003). We reconstructed the ancestral cotton
genome from two data sets. The high confidence ancestral genome contains 13,772 loci, each of which is

!
!
58
supported by 2 or more cotton homeologs, or 1 cotton homeolog with its ortholog retained in cacao or
grape (assuming independent syntenic duplications are unlikely). The low confidence ancestral genome
was reconstructed under relaxed criteria that permit including singleton cotton genes, which resulted in
25,651 loci. Because of the lack of outgroup genomes (cacao is the only other sequenced genome in
Malvales), we were not able to validate many loci in the low confidence ancestral genome. Therefore, we
used the high confidence ancestral cotton genome in downstream analyses. The reconstructed gene order
is provided in Supplementary File 1.
4.3.5 Fractionation level calculation.
The reconstructed ancestral gene order was divided into 200 gene sliding windows. Each sliding step is
100 genes. Then, fractionation level in each of the 5 subgenomes was calculated from the alignments in
each window as the proportion of ancestral loci retained.
4.3.6 Synonymous substitution rate (Ks) calculation.
Protein sequences of homologous gene pairs were aligned using CLUSTALW2 (Larkin et al., 2007),
which was then used to guide their CDS alignment by PAL2NAL (Suyama, Torrents, & Bork, 2006;
Yang, 2007). To calculate Ks, we used the Nei–Gojobori method implemented in the yn00 program in the
PAML package (Yang, 2007). A Python script was used to create a pipeline for all the calculations, as
described in (Tang, Wang, et al., 2008).
4.3.7 Phylogenetic analysis.
Genes within the same homeolog group were aligned using MUSCLE v3.8.31 (Edgar, 2004). Codon
alignments were edited with Gblocks (Talavera & Castresana, 2007) to remove poorly aligned regions.
Phylogenetic trees were constructed using RAxML v7.3.5 (Stamatakis, 2006) with the fast bootstrapping
algorithm, and cross validated with NEIGHBOR in PHYLIP (Felsenstein, 1989) with 100 bootstrapping
replicates. The procedure is pipelined by an in-house python script.

!
!
59
4.4 Results
4.4.1 An ancestral Gossypium genome experienced 5~6x lineage-specific duplication
Paleo-polyploidies produce multiple homeologous regions in extant diploid genomes. The number of
homeologous regions is called homeolog depth, duplication depth, or simply depth. For example, a paleo-
tetraploidy (ancient genome doubling, 2x) produces up to homeolog depth of 2 in an extant genome (with
some regions losing homeologs during evolution). We identified homeolog depth of 5~6 in the extant G.
raimondii genome. It is visible in ab intra cotton alignment, and in inter-genomic alignment with the
cacao (Theobroma cacao; diverged about 70-50 MYA) or grape (Vitis vinifera) genomes (diverged about
110 MYA). Both grape and cacao have not experienced lineage-specific paleo-polyploidy. Individual
grape or cacao regions have five (infrequently six) best-matching cotton regions (and secondary matches
resulting from the pan-core eudicot paleo-hexaploidy), supporting a paleo-(do)decaploidy in the
Gossypium lineage.
Using the cacao genome as a reference, inter-genomic aligned synteny blocks in cotton were
chained by dynamic programming into 5 major subgenomes based on structural constraints (no
overlapping regions within a subgenome), and in favor of longer blocks with more anchor genes, which
are preferentially selected. The pairwise alignments are then resolved by a topological sorting algorithm
to produce multiple alignment of the subgenomes threaded by the cacao genome (Supplementary File 1).
The majority of local alignments involve five different cotton chromosomes. A local alignment example
is shown in Figure 4.1.
The sixth hypothetical subgenome, which appeared to have suffered severe gene loss and lost
coverage completely in many regions of the genome, is of questionable existence. Alternatively the depth
6 regions may have been produced in independent segmental duplications. There are too few anchor
genes (179) in those regions to make confident inferences. The five ‘major’ subgenomes collectively
cover 90.48% of the cotton genome (total 37,505 genes) in 628 synteny blocks containing 21,390 anchor
genes. The blocks span ranges from 5 to 679 genes (not counting tandem and proximal duplications less
than 10 genes apart).

!
!
60
Figure 4.1 Example alignment showing syntenic relationships among five cotton subgenomic regions
and their single orthologous regions in cacao and grape, respectively. Three well-retained gene clusters
along these syntenic groups (highlighted by orange curves) are plotted to show overall consistency
between the gene phylogenies and the evolutionary history of the genomes. The pan-Gossypium paleo-
polyploidy is represented by the red ball. The sample trees were constructed by PhyML with aLRT SH-
like procedure using default parameters.
4.4.2 Differential evolution of subgenome structure following the paleo-(do)decaploidy
Among the 5 major cotton subgenomes, a one-way ANOVA test of the effect of subgenome on synteny
block size gave a p-value of 1.2e-4. The 5 subgenomes can be roughly divided into two groups,
subgenomes 1-2-3 (SGI) and 4-5 (SGII). SGI has average synteny block span (measured as number of
genes) 1.8x that of SGII (Figure 4.2). One-way ANOVA test of subgenome effect on synteny block

!
!
61
median synonymous substitution rate (Ks) gave a p-value of 0.0020. The block median Ks values of SGI
and SGII differ by 0.032, which is roughly equivalent to 2.7 million years separation using an estimated
Gossypium synonymous substitution rate of about 6e-9 (Kenneth H. Wolfe et al., 1989).
SGI and SGII have different average block size, 53.57 and 29.7 respectively (three SGI
subgenomes: 54.94, 58.10, 46.53; two SGII subgenomes: 32.52, 25.51), giving Mann-Whitney test p-
value 0.0055. We recognize that the subgenome chaining algorithm preferentially selects longer blocks
(when other criteria are equally met), which is one contributing factor to this observation. However this is
not the sole rule of chaining. In fact the first rule of the chaining process is non-overlapping regions
within a subgenome. Therefore although the chaining process may partially account for the differentiated
patterns, there is no simple causality between the chaining process and the block size difference in the two
groups. Furthermore, in addition to differential block sizes, the two groups are also different in their
median block Ks values, having median values 0.416 and 0.448, respectively (three SGI subgenomes:
0.416, 0.410, 0.423; two SGII subgenomes: 0.440, 0.465), with Mann-Whitney p-value of 2.88*10e-6
(Figure 4.2).

!
!
62
Figure 4.2 Box and whisker plots showing distributions of synteny block median Ks and block span.
On the left are synteny block median Ks values between cotton genes and their orthologs in cacao. On the
right are block spans (measured as gene counts) in cotton (right). Each dot represents measurement from
one synteny block. The p-values (red) are from two sample Mann-Whitney tests. Median (for Ks) and
mean (for span) values are shown in blue. Notches are centered at sample medians.
The two subgenome groups SGI and SGII have also retained different proportions of ancestral
cotton loci, averaging about 0.42 for SGI and 0.13 for SGII (two sample Student’s t-test p-value <2.2e-
16). The average retention rates of the inferred ancestral cotton genome are 0.5317, 0.4260, 0.3124,
0.1714, 0.0889 for the five subgenomes, respectively (Figure 4.3). Pairwise Mann-Whitney tests are all
significant. Such biased post-duplication gene loss (fractionation) observed in the 5 cotton subgenomes is
consistent with previous reports of lineage-specific paleo-polyploidies in Brassica rapa (X. Wang, Wang,
et al., 2011) and Zea mays (J. C. Schnable et al., 2011). The cotton C event (~60 MYA, see below) is also
much more ancient than the Brassica (17~13 MYA) and maize (12~5 MYA) events. The higher paleo-

!
!
63
polyploidy level and longer evolutionary history make the C-subgenomes a valuable addition to research
in biased evolution of paleo-subgenomes.
Figure 4.3 Histograms of ancestral loci retention rates in the 5 C-subgenomes. Ancestral gene order
was reconstructed using cacao as reference, and divided into 200-gene sliding windows. On the lower
right is a spider plot showing mode values of the distributions.
4.4.3 Differential subgenomic sequence divergence following the Gossypium paleo-polyploidy
In addition to differentiated structural evolution, SGI and SGII are also different in their sequence
divergence patterns. As shown above, median block Ks values are 0.416 in SGI and 0.448 in SGII,
respectively, which are significantly different between the two groups (Mann-Whitney test p-value

!
!
64
2.88*10e-6). Genes in the two subgenome groups also exhibit different distributions in exon number and
third codon GC content (GC3), but not gene or protein length (Figure 4.4). SGI genes on average have
fewer exons than SGII genes, with median values 3 and 4, and Mann-Whitney test p-value 0.018. SGI
genes on average also have slightly lower GC3 content than SGII genes, with mean values 41.5% and
42.0% respectively, and Mann-Whitney test p-value 1.6*10e-4. Such patterns of differentiated exon
number and GC3 content may indicate possible regulatory divergence, such as in expression levels (T.
Tatarinova, Elhaik, & Pellegrini, 2013), between SGI and SGII genes. On the other hand, gene length and
protein length show no significant difference between the two groups of subgenomes.
Figure 4.4 Box and whisker plots showing distributions of exon number, gene length, protein length,
and third codon GC content among genes in the 5 cotton subgenomes. Boxes display the data between the
first and third quartiles. The horizontal line inside the box represents the median. The two whiskers
represent 1.5 IQR extensions from the first and third quartiles, respectively. Beyond the whiskers, data are
considered outliers and are plotted as individual dots.

!
!
65
An attractive hypothesis to explain these differences is that the two groups of subgenomes were
joined in the ancestral Gossypium genome at slightly different times, and/or having evolved under
different constraints. These results provide directions to further dissect the pan-Gossypium (do)decaploidy
event C.
4.4.4 A highly conserved NUMT-containing synteny block between cotton (in SGI) and cacao, and a
less conserved one (in cotton SGII)
Plant organellar genomes have been actively rearranged, exchanging DNA with each other and
transferring DNA into the nucleus (Richardson & Palmer, 2007). Insertion of organellar DNA into the
nuclear genome is an important factor in reshaping plant genomes (Bock & Timmis, 2008; Hazkani-
Covo, Zeller, & Martin, 2010; Richly & Leister, 2004). While most previous studies focused on single
gene transfers across different taxa, when analyzing the G. raimondii nuclear (NU) genome we noticed
two synteny blocks, on chromosomes 1 and 13 respectively, that contains two arrays of genes with
homologs in plant mitochondrial (MT) genomes. The Chr1 block consists of 82 genes spanning 636,155
bp of sequence, and is called NUMT1 below. The Chr13 block consists of 8 genes spanning 105,934 bp
of sequence, and is called NUMT13 below.
LASTZ comparisons between the G. raimondii nuclear genome and 13 selected plant
mitochondrial genomes (G. hirsutum, Arabidopsis thaliana, Brassica rapa, watermelon, papaya, soybean,
grape, rice, sorghum, maize, date palm, moss and green algae) identified 757 matching gene pairs
involving a total of 188 G. raimondii nuclear genes. Among these genes 148 are dispersed throughout the
nuclear genome, while 40 genes are located in the two NUMT blocks. Of 82 NUMT1 genes, 20 have
homologs in the G. hirsutum mitochondrion, while 34 have homologs in at least one of the selected
mitochondrial genomes. Of 8 NUMT13 genes, 3 have homologs in the G. hirsutum mitochondrion, while
6 have homologs in one of the selected mitochondrial genomes. The remaining genes are aligned to non-
coding proportions of the G. hirsutum mitochondrial genome. Three genes in the G. hirsutum
mitochondrion have homologous genes on both NUMT1 and NUMT13.

!
!
66
NUMT1 locates on subgenome 1 of SGI, while NUMT13 locates on subgenome 4 of SGII.
NUMT1 has 92.6% sequence matched with 91.4% of G. hirsutum mitochondrial genome with 99.6%
average identity. NUMT13 has 56.8% sequence matched with 9.4% of G. hirsutum mitochondrial
genome with 97.5% average identity. These numbers are similar to the ~270 kb A. thaliana NUMT
region, ~99% of which has 99.0% average identity with ~75% of its mitochondrial genome, supporting a
recent insertion event (Lin et al., 1999). Average Ks between G. hirsutum mitochondrial and NUMT
regions (Table 4.1) are similar to those between A. thaliana mitochondrial and NUMT regions (0.047).
Therefore insertion of G. raimondii NUMT1 and NUMT13 likely occurred no more than a few million
years ago, similar to the A. thaliana NUMT. Insertion of NUMT13 was likely earlier than NUMT1.
The synonymous substitution rate between best matching NUMT regions in cotton and cacao is
substantially less than between average orthologous genomic regions (Table 4.1), reflecting slower
evolution rates in the mitochondrial genomes. The same is true between cotton and Arabidopsis. Cotton
NUMTs show better gene order conservation with cacao NUMTs than with the G. hirsutum
mitochondrial genome, with the proportion of anchor genes being 50.0% between NUMT1 and cacao Chr
5 NUMT versus 25.3% between NUMT1 and G. hirsutum MT. This likely reflects more structural
constraints in the nuclear genomes.
Table 4.1 Mean synonymous substitution rate (Ks) values between syntenic gene pairs. The genes
involved are located on G. raimondii NUMTs, G. raimondii, Theobroma cacao, Arabidopsis thaliana
nuclear genomes, and A. thaliana, G. hirsutum mitochondrial (MT) genomes. For comparisons between
nuclear genome regions (such as G. raimondii genomic – T. cacao genomic) orthologous gene pairs were
used.
G. hirsutum MT A. thaliana MT T. cacao genomic A. thaliana genomic
G. raimondii NUMT1 0.037 0.15 0.055 0.18
G. raimondii NUMT13 0.014 0.13 . 0.15
G. raimondii genomic - - 0.39 1.70
G. hirsutum MT - 0.086 0.045 0.18 .: no matches. -: not applicable.

!
!
67
4.5 Discussion
4.5.1 Inference on the cotton evolutionary rate and timing of the paleo-(do)decaploidy
The pan-Gossypium C event was estimated to be ~47 MY old based on descendant paralogs in cotton
having a Ks distribution of mode ~0.56 (Figure 4.5) and average plant evolutionary rate of 6e-9
substitutions per synonymous site per year (Kenneth H. Wolfe et al., 1989). This is likely an
underestimated age as Gossypium lineage rates in the past few million years were higher than 6e-9
(Senchina et al., 2003). Fossil records indicated that the Byttnerioideae lineage (containing cacao)
diverged from the Malvoideae (containing cotton) ~60 MYA (Carvalho, Herrera, Jaramillo, Wing, &
Callejas, 2011). Taking into consideration the uncertainties in molecular evolutionary rate estimation,
such as rate variations and availability of paleontological records, the cotton C event likely occurred
sometime in the late Cretaceous or early Paleogene, shortly following Byttnerioideae - Malvoideae
divergence. This event is almost certainly shared by all Gossypieae lineages, which originated about
40~20 MYA (Jonathan F Wendel & Cronn, 2003). More sequence data in the future will help
circumscribe the exact phylogenetic position of this event.
The Ks distributions of cotton-Arabidopsis and cacao-Arabidopsis orthologs (Figure 4.5)
revealed that average nuclear gene synonymous substitution rate in cotton is slightly higher than in cacao.
This is in accordance with previous study showing that Gossypium lineage has one of the fastest plastid
molecular evolution rates in the Malvaceae (Baum et al., 2004). Studies indicated that paleo-polyploidy
events may accelerate evolutionary rates, such as rates of nucleotide substitutions, genome structural
rearrangement at macro- and micro- scales, and gene family size alteration (Adams & Wendel, 2005b;
Lynch & Conery, 2000; Otto & Whitton, 2000). Empirical observation shows that many lineages with
slow evolutionary rates, such as grape, papaya, lotus, and poplar, have experienced relatively few WGDs.
Further, many lineages that have been identified with fast evolutionary rate, such as Arabidopsis,
bladderwort, grasses, and cotton, have experienced several WGDs. Paleo-polyploidy events have also
been associated with species expansion episodes (Otto & Whitton, 2000; D. E. Soltis et al., 2009; Van de
Peer et al., 2009), and adaptation to changing environmental conditions (Fawcett et al., 2009; Levin,
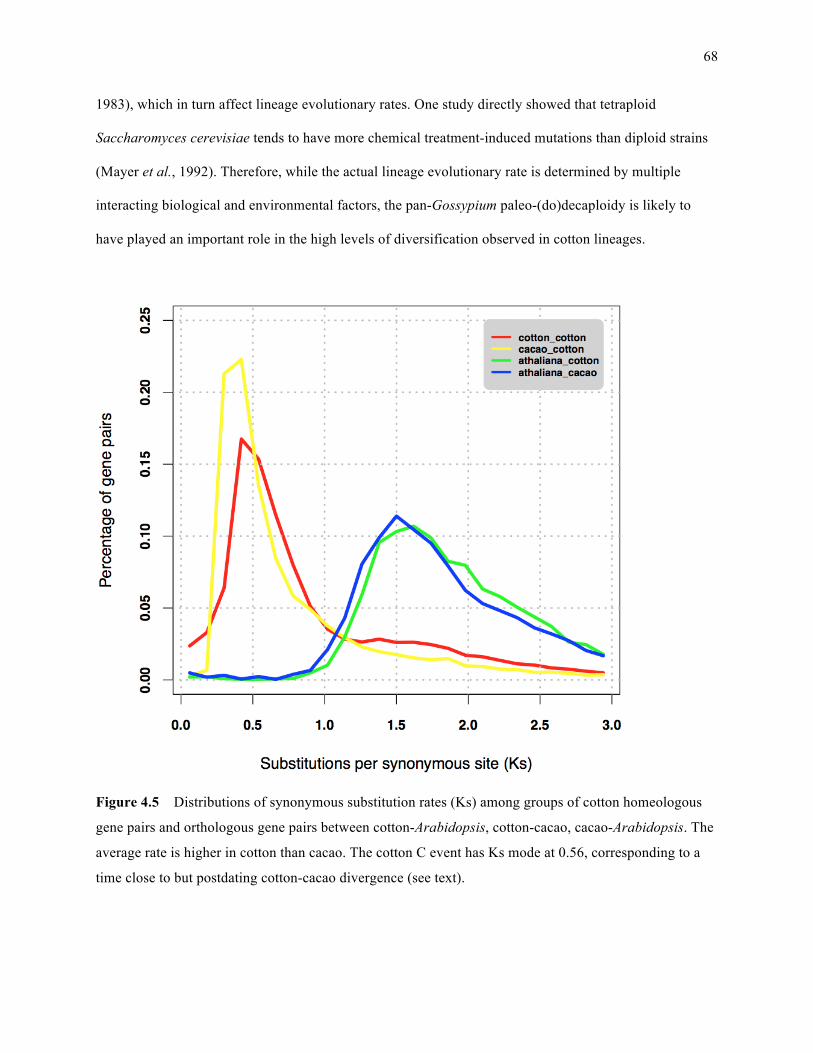
!
!
68
1983), which in turn affect lineage evolutionary rates. One study directly showed that tetraploid
Saccharomyces cerevisiae tends to have more chemical treatment-induced mutations than diploid strains
(Mayer et al., 1992). Therefore, while the actual lineage evolutionary rate is determined by multiple
interacting biological and environmental factors, the pan-Gossypium paleo-(do)decaploidy is likely to
have played an important role in the high levels of diversification observed in cotton lineages.
Figure 4.5 Distributions of synonymous substitution rates (Ks) among groups of cotton homeologous
gene pairs and orthologous gene pairs between cotton-Arabidopsis, cotton-cacao, cacao-Arabidopsis. The
average rate is higher in cotton than cacao. The cotton C event has Ks mode at 0.56, corresponding to a
time close to but postdating cotton-cacao divergence (see text).

!
!
69
4.5.2 Reconstruction of the pre-C ancestral cotton genome
By interleaving the gene orders in the 5 cotton subgenomes we reconstructed an approximation of the
ancestral cotton genome predating the C paleo-(do)decaploidy (methods, Supplementary File 1). This
reconstruction facilitates structural analysis of γ in cotton, the signals of which were substantially
obscured by the superimposed C event, a common problem with nested paleo-polyploidies. As expected,
the pan-core eudicot paleo-hexaploidy γ is more evident in the ancestral cotton genome with much post-C
gene loss mitigated by the reconstruction.
Interestingly we found that genes preferentially retained from γ were also more frequently
retained after C, and genes returned to single copy after γ were more likely to return to single copy after
C. Comparing ancestral cotton loci retained in 2 copies (2,124) and the full 3 copies (543) from γ, their
average retained loci following C is 1.67 and 1.77 respectively, giving Mann-Whitney test p-value (two-
sided) significant at 0.02355. The proportions of retained C homeolog number being 3 or more are 18.4%
and 14.8%, with p-value 0.04341 (two-sided test of equal proportions). Comparing ancestral cotton loci
retained in 2 or 3 copies (2,667) and 1 copy (11,105) from γ, their average retained loci following C is
1.69 and 1.51 respectively, giving Mann-Whitney test p-value (two-sided) significant at < 2.2e-16. The
proportions of retained C homeolog numbers being 1 are 50.0% and 61.2%, p-value < 2.2e-16 (two-sided
test of equal proportions).
4.5.3 Patterns of paleo-Gossypium genome evolution
The Malvaceae family, which contains cotton (Gossypium) and cacao (Theobroma), is a big eudicot
family with complicated phylogenetic relationships. Several biogeographic events happened in the time
frame of the paleo-(do)decaploidy C. In the late Cretaceous the first split within Malvaceae occurred
between Byttnerioideae (containing Theobroma), Grewioideae, and the core Malvaceae lineages, which
mainly include the Malvatheca lineages (including Malvaceae sensu stricto and Bombacaceae) and the
remaining lineages (Brownlowioideae, Dombeyoideae, Helicteroideae, Sterculioideae, and Tilioideae)
(Nyffeler et al., 2005; The Angiosperm Phylogeny Group, 2009). There are two models for the

!
!
70
subsequent divergence of Malvoideae (containing the ancestor of Gossypium) and Bombacoideae. The
Gondwana vicariance model (Pfeil, Brubaker, Craven, & Crisp, 2002) proposed a widely distributed
Malvoid ancestor which diverged into two lineages following the Gondwana breakup. The dispersal
model (Baum et al., 2004) proposed that an ancestral lineage in South America migrated across the
Pacific to Australasia and/or Southeast Asia, and then radiated into Malveae, Gossypieae, and Hibisceae.
More complete fossil records are needed to distinguish between the two models, while the time of the
divergence is likely to be before the mid-Cenozoic (Carvalho et al., 2011). The eumalvoideae clade
(including the Hibisceae, Malveae, and Gossypieae tribes) then experienced a boost in molecular
evolutionary rate, making them evolve up to nine-fold faster than other Malvaceae lineages (Baum et al.,
2004). These changes might be associated with or have interacted with the paleo-polyploidy C event.
In cotton-cacao comparison, genes in the two groups of C subgenomes, SGI and SGII, differ in
average Ks by 0.032, corresponding to about 2.7 million years. SGI and SGII also differ in structural and
sequence divergence patterns. Compared to SGI, SGII subgenomes in average contain shorter synteny
blocks with higher fractionation levels, and tend to host genes with more exons and slightly higher GC3
content. Although not proven, it has been suggested that paleo-allopolyploidy may be more likely than
paleo-autopolyploidy to cause subgenome dominance and biased fractionation (Garsmeur et al., 2014).
Our observations suggested that C was possibly a multi-step event with at least one allo-polyploidy
component. In addition, ancestral reconstruction revealed that many ancestral loci that had expanded after
γ further expanded after C. These and other effects of C in the late Cretaceous or early Paleogene may
have prepared the paleo-cotton lineages for later radiation and dispersal, such as following a proposed
lag-time model(Schranz et al., 2012).
If the C paleo-(do)decaploidy occurred in more than one step, as is likely the case according to
our analysis, the evolutionary transit genomes of intermediate ploidy nonetheless seem to have gone
extinct, because to our knowledge there is no Gossypium species of other paleo-polyploidy level.
Similarly, the pan-core eudicot hexaploidy γ has been suggested to have occurred in two steps (Lyons et
!
!
71
al., 2008), but no extant ‘intermediate’ paleo-tetraploid genomes have been found. Whether this indicates
evolutionary advantages in the highest paleo-polyploidy level lineages awaits further studies.
While there are studies on individually transferred NUMT genes across wide plant taxa (such as
(Adams, Qiu, Stoutemyer, & Palmer, 2002; Leister, 2005; Liu, Zhuang, Zhang, & Adams, 2009)), to our
knowledge only a few cases described multi-gene NUMT regions, including a ~270 kb region (or ~620 kb
(Stupar et al., 2001)) on Arabidopsis thaliana chromosome 2 consisting of 75% of its mitochondrial
genome (Arabidopsis Genome Initiative, 2000; Lin et al., 1999), and five NUMT regions in rice with size
ranging from 25~223 kb (Noutsos, Richly, & Leister, 2005). All NUMT regions currently identified seem
to have inserted relatively recently in evolution. Flanking regions of the NUMTs in cotton, cacao, and
Arabidopsis are not aligned to each other, favoring the hypothesis that the NUMTs in these taxa result
from independent insertions. Therefore it seems that ancient common insertions, if occurred, have already
been lost. On the other hand, comparison among several surveyed plant nuclear and mitochondrial
genomes revealed low copy NUMT regions across species from all major clades (data not shown),
indicating that this is a widespread phenomenon in plants. Structural and sequence comparisons suggested
multiple insertions of the NUMTs at different times.
Many orthologous NUMT genes are exceedingly conserved compared to genome-wide averages,
likely reflecting the low nucleotide mutation rates among plant mitochondrial genes. Gene order of the
NUMTs is more stable than that of their mitochondrial counterparts, reflecting frequent rearrangements in
angiosperm mitochondrial genomes resulting in highly variable gene order and genome size (Kubo &
Newton, 2008). Gene expression data in cotton (Paterson et al., 2012), Arabidopsis (Wada et al., 2012)
and maize (Figure 4.6) all supported coexpression of at least some of the NUMT region genes across
different tissues. In addition, our previous results showed that of 105 genes upregulated in 10 DPA fibre
of wild tetraploid G. barbadense, 30 (37%; P%<%0.001) are in the NUMT1 region, all of which are within
the QTL hotspot Dt01 that affects fiber fineness, length, and uniformity (Paterson et al., 2012). Based on
those results we propose that the low copy conserved NUMT regions were transferred from mitochondrial
to nuclear genomes multiple times during plant evolution, and possibly contain co-regulated genes.

!
!
72
Figure 4.6 Cross tissue heatmap of gene expression levels in maize NUMT and control regions. On the
y-axis, genes in two maize NUMT regions are colored in red and blue respectively. Also included in the
comparisons are 100 genes flanking each NUMT region, and first 100 genes on each maize chromosome.
On the x-axis are names of the tissue types. Maize expression data were downloaded from qTeller
(http://qteller.com/).

!
!
73
The effects of polyploidy on the genome and organism are multi-layered, including, in many
instances, increased cell size, increased rate of early development, increased illegitimate recombination,
increased genetic and cellular instability, increased expression and regulatory complexity, transposable
element expansion, nearly doubled effective population size after autopolyploidy, and morphological
changes (Adams & Wendel, 2005b; Freeling, 2009; Otto, 2007; Paterson et al., 2010; Schranz et al.,
2012; D. E. Soltis et al., 2009; Van de Peer et al., 2009). Those effects may be vital for lineage survival
under certain stressful conditions or environmental changes (Arrigo & Barker, 2012; Vanneste, Baele,
Maere, & Van de Peer, 2014). Detailed analysis of paleo-polyploidies is valuable and essential for
understanding plant genomes. In particular, paleo-polyploidies are a major factor in the evolution of plant
genome structure. There is increasing evidence for subgenomic biases in post-polyploidy (especially allo-
polyploidy) evolution (Sankoff & Zheng, 2012; J. C. Schnable et al., 2011; Thomas et al., 2006; X.
Wang, Wang, et al., 2011; Yoo, Szadkowski, & Wendel, 2013), which are supported by our results. In
addition, operon-like structures and co-regulated gene clusters have been identified in plants (Field et al.,
2011; Field & Osbourn, 2008) and animals (Boutanaev, Kalmykova, Shevelyov, & Nurminsky, 2002).
Our results also suggested that multiple incidences of multi-gene NUMT regions may indicate possible
advantages of such clustered transfer, while the NUMT regions seem affected by genomic context after
their integration into the nuclear genomes. More studies are needed to understand evolutionary and
functional compartmentation in paleo-polyploid plant genomes.
4.6 Conclusion
Based on structural patterns, we divided the cotton G. raimondii genome into 5~6 subgenomes
corresponding to the pan-Gossypium C (do)decaploidy event. A 6th hypothetical subgenome, of tiny size
compared to the other 5, is considered uncertain at this point. The 5 major subgenomes can be classified
into two groups SGI and SGII, which are differentiated in several structural and sequence features.
Compared to SGII subgenomes, SGI subgenomes have longer synteny blocks, smaller Ks values, higher
ancestral locus retention, fewer exons per gene, and slightly lower GC3 content. Average gene and
!
!
74
protein length are similar between the two groups. Using a reconstructed ancestral cotton genome we
found that duplicated genes retained from the pan-core eudicot γ were also more likely to be retained after
the Gossypium C event. We also identified two apparent NUMT blocks, on chromosome 1 of SGI and
chromosome 13 of SGII. NUMT1 is longer than NUMT13, and is more conserved with NUMT regions in
cacao and Arabidopsis. Our results provided direction for finer dissection of the Gossypium paleo-
polyploidy and suggested evolutionary and regulatory compartmentation in the G. raimondii genome.

!
!
75
CHAPTER 5 TWO PALEO-TETRAPLOIDIES IN ANCIENT GRASS AND MONOCOT LINEAGES
5.1 Introduction
In the ancestral lineage leading to modern cereals (Poaceae family) it has long been known that a whole
genome duplication (WGD) event, named “ρ”, occurred an estimated 70 MYA (million years ago)
(Paterson, Bowers, & Chapman, 2004). The Poaceae, or grass family, has evolved as separate lineages for
about two-thirds of the time since ρ. Nonetheless synteny conservation continues for hundreds to
thousands of genes between rice and sorghum, the first two sequenced grasses. The two genomes also
shared 97-98% of post-ρ gene loss in orthologous regions (Paterson et al., 2009). The relatively extensive
synteny conservation is typical of genome comparisons among cereals (Bennetzen et al., 2012; 2010; P.
S. Schnable et al., 2009). However, hidden behind the recent ρ-homeologous regions are additional
paralogies from more ancient paleo-polyploidy events that have been obscured by subsequent re-
duplications and re-diploidizations. Comparing rice with the grape genome (Tang et al., 2010), and
recently with the banana and oil palm genomes (Jiao, Li, Tang, & Paterson, 2014) revealed two additional
WGDs in early monocot lineages, designated as “σ” and “τ”, which are nested within the “ρ” duplication,
making rice and other grasses paleo-hexadecaploids (three rounds of ancient genome doubling). Lineage
specific paleo-polyploidies have been detected in several sequenced monocot genomes. The maize
genome has experienced an additional WGD about 5~12 MYA, after ρ and σ (P. S. Schnable et al., 2009).
The banana lineage has undergone three successive rounds of WGD after separation with grasses (D'Hont
et al., 2012). The oil palm genome has experienced one additional WGD in the palm lineage (Singh et al.,
2013).
In this chapter the two early WGD events in ancient monocot lineages, “τ” and “σ”, which
occurred before the divergence of Commelinids and Poaceae respectively, were circumscribed using
currently available monocot genomes, and studied in detail.

!
!
76
5.2 Overview of synteny conservation in studied genomes
We aligned six sequenced angiosperm genomes (Table 5.1) using gene markers. In total 97.66% (38,136)
of rice genes, 98.70% (34,046) of sorghum genes, 96.50% (35,272) of banana genes, 86.10% (27,746) of
oil palm genes, 95.76% (25,228) of grape genes, and 92.87% (24,782) of sacred lotus genes were in the
aligned regions.
Alignments of four monocot genomes (rice, sorghum, banana, oil palm) and two eudicot genomes
(grape, sacred lotus) revealed clear patterns of the “σ” and “τ” events (the two early monocot WGDs).
Table 5.2 summarizes multiplicity ratios between pairs of the studied genomes. The lotus and oil palm
genomes showed a 2-to-4 correspondence, indicative of the previously identified “λ” duplication in the
lotus lineage (Ming et al., 2013), and two paleo-tetraploidy events in the lineages leading to oil palm (the
more recent one being palm-specific (Singh et al., 2013)). On the other hand, 2-to-4 correspondence
between oil palm and rice genomes suggest one WGD in oil palm and two WGDs (the recent one being
“ρ”) in rice after their separation. Collectively, these findings indicated one additional WGD (“σ”) in the
lineages leading to rice, and one (“τ”) in the common ancestor of Poaceae and Arecaceae. These events
conferred a total of 8x paleo-multiplicity in the rice genome, confirmed by lotus-rice and grape-rice
comparisons. Using similar cross-species synteny comparisons we can also confirm the three WGDs
identified in the banana lineage (D'Hont et al., 2012), and the pan-core eudicot γ event that occurred after
their divergence with the sacred lotus (a basal eudicot) lineage (Jaillon et al., 2007; Ming et al., 2013;
Tang, Bowers, et al., 2008; Tang, Wang, et al., 2008).
With successive WGDs followed by loss of most duplicated genes, ancestral gene orders become
progressively more fragmented and discernible synteny blocks become smaller (Table 5.2). This is a
consequence of usually extensive gene loss and genome rearrangement in the post-WGD diploidization
process. The number of anchor genes also shows a tendency to decrease with increased species
divergence (Table 5.2), indicating that reciprocal gene loss is a continuous process on a large
evolutionary scale. Nonetheless, differential retention of ancestral loci in early Poales branches has
slowed down in the cereal genomes after the most recent WGD, ρ. About 4.68% of banana genes and

!
!
77
6.85% of oil palm genes have no homeologs in the studied monocot genomes, but are syntenic to some
grape and lotus (both eudicots) genes. This percentage is substantially smaller in rice and sorghum
(3.00% and 3.51% respectively). Because rice and sorghum are from the same taxonomic family we
excluded their mutual matches in this calculation. Therefore this indicates that different proportions of
angiosperm ancestral genes may have contributed to divergence of different monocot groups. The
majority (~ 80%) of ancestral loci that had been differentially retained in the lineage leading to cereals
(since their divergence from other Commelinids 120~83 MYA (The Angiosperm Phylogeny Group,
2009)) are still syntenic in present-day rice and sorghum genomes. The remaining ~ 20% have been
differentially lost or transposed since the divergence of the two species 80~50 MYA (The Angiosperm
Phylogeny Group, 2009). Therefore positional evolution of ancestral loci seems to be slower more
recently.
Table 5.1 Sources and basic information of angiosperm genomes used in this study.
Species Common name Family Order 1x
Genome size
(Mb)
Protein coding genes
Scaffold N50 (Kb)
Release
Oryza sativa rice Poaceae Poales 12 420 39,045 29,958 MSU7
Sorghum bicolor sorghum Poaceae Poales 10 818 33,032 62,400 JGI_2.1
Elaeis guineensis oil palm Arecaceae Arecales 16 1,800 34,802 1,270 Singh et
al., 2013 Musa acuminata banana Musaceae Zingiberales 11 523 36,542 1,311.1 D'Hont et
al., 2012 Vitis vinifera grape Vitaceae Vitales 19 475 26,346 2,065 Genoscope
12x Nelumbo nucifera
sacred lotus Nelumbonaceae Proteales 8 929 26,685 3,435 Ming et
al., 2013

!
!
78
Table 5.2 Summary of synteny blocks in the six studied genomes. Multiplicity ratios between pairs of
genomes resulting from independent WGDs are in lower triangle. Numbers of anchors (number of
synteny blocks) are in upper triangle.
rice sorghum banana oil palm grape sacred lotus rice - 18377 (57) 18871 (1779) 15879 (826) 10582 (956) 11518 (1015)
sorghum 1 : 1 - 18681 (1755) 15447 (802) 10242 (913) 11001 (958) banana 8 : 4 8 : 4 - 20481 (1546) 12718 (1363) 12725 (1327) oil palm 2 : 4 2 : 4 2 : 8 - 16504 (1007) 17798 (1056)
grape 3 : 8 3 : 8 3 : 16 3 : 4 - 18003 (685) sacred lotus 2 : 8 2 : 8 2 : 16 2 : 4 2 : 3 -
5.3 Circumscribing the pan-grass σ duplication event
Comparison between grape and rice genomes showed that there are more paralogous regions in rice than
those produced in the pan-grass ρ, indicating more ancient paleo-polyploidy events before ρ (Tang et al.,
2010). Such nested WGDs are often best revealed by ‘bottom-up’ approaches (Bowers et al., 2003),
attempting to reverse the changes resulting from more recent events (in this case ρ) superimposed on
them. Using such bottom-up reconstruction a total of 146 p (palm WGD) blocks covering 71.74% of the
oil palm genome were merged into pre-p ancestral gene orders. Similarly, 140 ρ (most recent grass WGD)
blocks covering 70.63% of the rice genome were merged into pre-ρ gene orders. Direct comparison
between the ancestral orders resulted in 209 synteny blocks covering 96.34% of the pre-p order and
72.77% of the pre-ρ order, each pre-p region aligning with up to two paralogous pre-ρ regions, as
exemplified in Figure 5.1B. This clearly revealed that the σ event occurred before the pan-Poaceae ρ
event (~70 MYA; (Paterson, Bowers, & Chapman, 2004)), but after the Poaceae-Arecaceae split (120~83
MYA; (The Angiosperm Phylogeny Group, 2009)).
As the second largest monocot family and fifth largest angiosperm family, the Poaceae is rich in
morphological and ecological diversity. Much of the underlying genetic diversity may have resulted from
σ and ρ WGDs. The events may also have contributed to some grass-specific characters. Genomes from
basal Poales species such as pineapple could be useful to further narrow the dating of ρ and σ.

!
!
79
5.4 Circumscribing the pre-commelinid τ duplication event in early monocots
It has been discovered that a paleo-tetraploidy (“p”) predated modern oil palm (Arecaceae family) (Singh
et al., 2013), and that the sacred lotus (Nelumbonaceae family) lineage had a paleo-tetraploidy (“λ”) after
it diverged from other eudicots (Ming et al., 2013). We merged 146 “p” synteny blocks covering 71.74%
of oil palm genome into pre-p gene order. Similarly 178 “λ” blocks covering 74.05% of lotus genome
were merged into pre-λ gene order. Alignment of the reconstructed genomes resulted in 203 ancestral
synteny blocks covering 69.44% of pre-λ order and 73.53% of pre-p order. Comparison between the
approximated ancestral pre-p and pre-λ orders reveals synteny structures consisting of one pre-λ region
and one to two orthologous pre-p regions. This indicated that an ancestor of oil palm experienced another
more ancient paleo-tetraploidy event before “p”, but after it diverged with the ancestral eudicots. Syntenic
regions with more than two homeologous copies retained are distributed over all 16 oil palm
chromosomes, indicating that this event was genome-wide. Since we have shown that oil palm did not
share “σ”, this additional paleo-tetraploidy is inferred to be the “τ” WGD event (Figure 5.1).
Traces of the “τ” paleo-tetraploidy were first discovered in the rice genome (Tang et al., 2010).
By comparing the rice genome a relatively clean outgroup genome of grape, which only had “γ” in its
own lineage, up to eight orthologous regions can be identified in rice, indicating three WGDs that have
occurred in the monocot lineages leading to rice. However, fast evolutionary rates and three WGDs have
severely increased paleo-paralog loss in the rice genome, with about 10,877 paralogous copies of pre-“τ”
loci retained (excluding tandem duplications) among 39,049 rice genes. In contrast, oil palm, whose
genome was recently published, has evolved at a much slower rate (about one half that of grasses on
average), and has had one less WGD in its lineage history. As a result about 16,092 paralogous copies of
pre-“τ” loci are retained (excluding tandem duplications) among its 32,225 genes. In both genomes
recurring WGDs severely eroded signals of paleo-paralogy produced in “τ”, with pre-“τ” loci retained at
1.40 of 8 possible copies on average in rice, and 1.49 of 4 possible copies on average in oil palm.

!
!
80
Figure 5.1 Genome comparison on a phylogeny of paleo-polyploidized angiosperms. (A) Paleo-
polyploidy events are represented by orange (duplication) or brown (triplication) circles on the
angiosperm phylogeny, filled with their name codes. Color shades on tree branches indicate positions of
genome comparison and whether they precede or postdate the adjacent polyploidies. (B) Dot plots (dots
represent matching genomic loci on two axes) of example regions from each of the designated genome
comparisons are shown, outlined by the same color as on the tree. Quota ratios of the alignments are
shown below the dot plots (detailed in the text). Paleo-polyploidy events underlying the alignment
patterns are detailed in the text. Geologic timing is based on molecular clock-based estimation rather than
values from physical evidence (which are usually unknown for ancient events).
5.5 The value of ancestral gene order in genome comparisons
Inferred or approximate ancestral gene order often provides the best reference to thread genomic
alignments in taxa with WGDs (Bowers et al., 2003; Kellis et al., 2004; Zheng, Chen, Albert, Lyons, &
Sankoff, 2013). While development of new algorithms provides increased sensitivity to detect ancient
nested paleopolyploidy events, approximated ancestral gene order provides the best reference to thread
inter-genomic alignments in such taxa for several reasons. Firstly, it compensates for gene loss, increasing
the alignability and proportion of aligned genes among homeologous regions. Secondly, it makes longer
synteny blocks as lineage specific breakpoints are removed. Thirdly, it “reverses” and therefore masks

!
!
81
more recent WGDs. Finally, it helps better reveal the interleaving pattern of gene loss (as illustrated in
Figure 1 (Kellis et al., 2004)). Therefore although paleopolyploidies can be unequivocally identified by
integrated detection of positional and sequence signals, ancestral gene order is necessary to recover full
syntenic mapping among homeologous regions. When a “clean” (having no WGD) outgroup genome is
not available, as is the case in many plant clades, ancestral gene order can be approximated through
reconstruction. Reconstructed ancestral genomes may not be the same as the true ancestral genome, but
likely will have high structural similarity (Tang, Bowers, et al., 2008; Zheng, Albert, Lyons, & Sankoff,
2012), and are an irreplaceable reference in whole genome alignments.
Recurring polyploidization and diploidization, ubiquitous in plant evolution, greatly obscure the
network of homology in plant genome comparisons. More than 20 ancestral and independent paleo-
polyploidies have been identified in ~50 sequenced angiosperms, collectively affecting 100% of lineages.
Consequently many angiosperm genomes contain populations of homeologous regions of different depth
resulting from combination of different levels of paleo-polyploidization and post-polyploidy gene loss.
Inter-genomic comparisons are complicated as well. Arabidopsis and rice, for example, have 829 synteny
blocks averaging 43 genes, resulting from 6 WGDs, 3 in each lineage. A comparison between diploid
Brassica rapa and banana genomes would involve as many as 52 copies involving 8 WGD events
(3x2x2x3=36 in Brassica and 2x2x2x2=16 in banana). It is beyond current technology to directly find and
align all the homeologous regions in such genomes. Instead, ancestral reconstruction based on an
established framework of historical WGDs is able to effectively recover the grand hierarchy of
homeology.
5.6 Variation of lineage nucleotide evolutionary rates and estimated ages of σ and τ
Nucleotide evolutionary rates can vary greatly among sites, gene families, nuclear and organellar
genomes (Gaut et al., 2011; Mower et al., 2007; K. H. Wolfe et al., 1987; Zhang, Vision, & Gaut, 2002),
and lineages with different life history traits and population characters (Gaut et al., 2011; S. A. Smith &
Donoghue, 2008). Shared paleo-polyploidy events provide inherent reference points to calibrate

!
!
82
evolutionary rates among affected lineages. Homeologs bearing synteny information are also intrinsically
more accurate phylogenetic markers for multi-copy gene families. By applying such reasoning, the Vitis
lineage nucleotide substitution rate is estimated to be less than half that of Arabidopsis (Tang, Wang, et
al., 2008), and the Nelumbo lineage rate is 30% slower than Vitis (Ming et al., 2013). The synonymous
site substitution rate between paralogs formed in the shared τ WGD (Figure 5.2) is ~1.7 times larger in
rice than oil palm. This is much less than the ~5 fold difference between grasses (faster) and palms
estimated from chloroplast rbcL genes (Gaut et al., 2011), and ~4 fold difference estimated from a
combination of rDNA, chloroplast, and mitochondrial genes (S. A. Smith & Donoghue, 2008). These
differences in rate estimates emphasize the heterogeneous nature of molecular evolution in plant
genomes. Reliable WGD and homeology identification is clearly essential for detailed evolutionary
analysis on a genome-wide scale.
The pan-grass ρ event was estimated to be ~70 MY old (Paterson, Bowers, & Chapman, 2004)
based on descendant paralogs in rice having a Ks distribution of mode ~0.86 and estimated rice lineage
rate of 6.5e-9 substitutions per synonymous site per year. Using the same rate estimate the age of σ
(paralogous Ks mode ~1.65) is approximately 127 MYA. The palm WGD p event was estimated to be
~75 MYA (D'Hont et al., 2012; Singh et al., 2013), with descendant paralogs in oil palm having a Ks
distribution of mode ~0.36, giving an estimated oil palm lineage rate of ~2.4e-9. Paralogs of τ have Ks
distributions of mode ~1.13 in oil palm and ~1.87 in rice. Taking the average rate of rice and oil palm
lineages (4.45e-9) to be the approximate substitution rate on their MRCA lineage, the age of τ can be
estimated to be ~73 MYA before Arecaceae-Poaceae split using Ks distribution of oil palm paralogs, or
~64 MYA using rice Ks distribution. Taking into consideration the uncertainties in molecular
evolutionary rate estimation, and availability of paleontological records, τ likely occurred in primitive
monocot branches. Due to a lack of fully sequenced early-diverging monocot genomes and limitation of
resolution in current sequence-based dating methods, further refinement of the exact timing of σ and τ
awaits future studies.

!
!
83
Figure 5.2 Distributions of synonymous substitution rates (Ks) among groups of orthologous or
paralogous (homeologous) gene pairs. Curves for paralogous gene pairs are not filled, while curves for
orthologous gene pairs are filled with colors. The orange dotted line is a fitted log-normal distribution for
the Ks values between oil palm paralogous gene pairs duplicated in the “τ” event, which has a modal
value of 1.13. The small peak near Ks=0.1 in rice “ρ” duplicates correspond to the gene conversion
regions on rice chromosomes 11-12 terminal regions (“ρ” paralogous regions) (X. Wang, Tang, &
Paterson, 2011). The Ks rate in the oil palm lineage is similar to or slightly higher than in the lotus
lineage, but much smaller than that of the rice lineage (see text for details). Therefore shared events in the
common ancestor of oil palm/lotus and rice are represented by shifted curves in the descendant genomes,
although in theory they should overlap if lineage rates were the same. For example, “τ” paralogous gene
pairs in oil palm (orange) and in rice (brown) have accumulated different amount of synonymous
substitutions in the same amount of time. Similarly, although rice and oil palm diverged with lotus at the
same time, oil palm-lotus orthologous gene pairs have smaller Ks values.

!
!
84
5.7 Origins of high GC3 genes in grasses
The frequency of genes with different G+C percentage at third codon positions (GC3) is not randomly
distributed in the genome. The GC3 distributions are also not random among different taxa. Grasses and
warm-blooded animals are known to have bimodal GC3 distributions, while cold-blooded animals and
most other plants have unimodal GC3 distributions. Previous studies showed that genes with high GC3
content (GC3 % > 0.75~0.8 in grasses) tend to have lower intron density, more methylation targets, more
variable expression, over-representation from certain gene families (such as electron transport, stress
response, signal transduction and transcription factors), and higher than average regulatory complexity
(Carels, Hatey, Jabbari, & Bernardi, 1998; Shi et al., 2006; T. Tatarinova et al., 2013; T. V. Tatarinova,
Alexandrov, Bouck, & Feldmann, 2010). We noticed that some of these characters are also exhibited in
post-WGD loci with preferentially retained homeologs. It is therefore one possible reason for the
observed enrichment of high GC3 genes among rice loci that have remained duplicated after ancient
WGDs (Chi-square test p-value is 1.8e-180).
Duplicated homeologous loci harbor about 80% of all high GC3 loci in syntenic regions in rice.
On the other hand, we also observed a significant enrichment of high GC3 genes in ancestral loci in rice
(loci that have homeologs in at least one of the sorghum, oil palm, banana, lotus and grape genomes)
(harboring about 80% of all high GC3 genes) versus the loci that appeared to be specific to the rice
lineage (Figure 5.3), with a Chi-square test p-value close to 0. This indicates that many of the high GC3
loci are ancient. Since the τ event was shared by grasses, palms, and bananas, while the increased high
GC3 gene fraction is specific to grasses, it is most likely that the grass lineage WGDs, σ and ρ, have
contributed more to the expansion of high GC3 genes in grasses. However, it has been known and also
observed in our study that Zingiberales and Arecales of the Commelinids have genomes with GC3
distributions intermediate between clear unimodality and clear bimodality. Consistent with evident
enrichment of high GC3 genes also in rice homeologous loci duplicated in the shared τ event, this
indicates that expansion of high GC3 loci likely started as early as the τ event. In addition, the average
GC3 difference between rice τ duplicates is 28.2% more than that between σ duplicates (0.157 versus

!
!
85
0.123), which is in turn 46.9% more than that between ρ duplicates (0.084). This indicates that
diversifying of paralogous GC3 content has been on-going in the rice genome for a very long time, a
trend not observed in the non-grass oil palm and eudicot lotus genomes. Major grass lineages have been
evolving independently for about 50 MYA. The parallel maintenance of high GC3 gene frequency in the
genomes of this widely distributed diverse group of species appears to argue against a hypothesis that
such patterns have been formed solely by chance.
Collectively, our findings suggested that many high GC3 genes are possibly ancient and
functionally important, and may have been involved in the diversification of ancestral grass and perhaps
Commelinid lineages. Further studies of GC3 gene evolution in grass genomes may increase our
knowledge particularly about the effects of the σ and ρ events on shaping the modern grass genomes and
diversity, as well as facilitating applications in grass genetic engineering.
Figure 5.3 Histograms of third codon position GC content (GC3) in rice genes. (A) Frequencies of GC3
in different types of rice genes maintained as duplicates or singletons from the ρ, σ, τ WGDs, tandem

!
!
86
duplicates at syntenic or non-syntenic regions, or other likely recently gained genes in the rice lineage.
(B) Overall GC3 distribution in rice genome, showing the grass-specific bimodal shape. Counts and
percentage decomposition of high and low GC3 genes are shown in the table. The cutoff between low
GC3 and high GC3 rice genes is 0.75 (Carels et al., 1998; Tang et al., 2010). Singletons, τ/σ/ρ duplicates,
and syntenic tandems are collectively called the ancestral loci, while non-syntenic tandems and other loci
are collectively called the rice lineage specific loci (see text for more details). High GC3 genes were
preferentially evolved from ancestral loci, especially duplicated ancestral loci.

!
!
87
CHAPTER 6 GeDupMap: SIMULTANEOUS DETECTION OF MULTIPLE ANCIENT GENOME
DUPLICATIONS AND A SYNTE-MOLECULAR FRAMEWORK
6.1 Abstract
Observations of paleo-polyploidy (ancient genome duplication) events in all sequenced flowering plant
lineages revealed their multifarious effects on genome and species evolution, from molecular to
populational. Rapidly accumulating genomic data make it an opportune time to exploit and dissect these
effects, some common and some lineage-specific. Because of abundant paleo-polyploidy derived paralogs
(homeologs) in flowering plant genomes, they must be correctly accounted in many studies such as
genome structure comparisons, ortholog identification, and gene family analyses. So far, paleo-polyploidy
detection and genome comparisons in flowering plants are largely manual and involve only two lineages
at a time. In this paper we describe the GeDupMap approach for simultaneous detection of all paleo-
polyploidies in multiple lineages. Inputs to GeDupMap are genome annotations and a phylogenetic tree
(topology only) of the studied taxa, both readily available for sequenced genomes. The program analyzes
synteny maps between the genomes and counts the numbers of homeologous regions after each speciation
event, which are integrated to estimate the paleo-polyploidy levels on branches of the species tree. The
program also compiles groups of putative orthologous regions (PORGs) after divergence of each pair of
genomes, forming a network of syntenic mappings to frame structural and molecular analyses in those
paleo-polyploid genomes. Most steps in the pipeline are accompanied by visualization to facilitate
inspection of the results. Such automatic paleo-polyploidy detection and a synte-molecular framework of
homeologous regions are useful in comparative studies involving several plant genomes. A set of 8
eudicot and monocot genomes were used to illustrate the functions of GeDupMap.

!
!
88
6.2 Introduction
The past century since the first discovery of polyploidy (whole genome duplication) (DeVries, 1915;
Lutz, 1907; Muller, 1914; Winge, 1917) marked greatly increased recognition of its frequency, breadth,
and importance, especially in the past 30 years with new large-scale genome mapping and sequencing
technology. Remarkably, not only are polyploids frequently formed in nature, some of the events have
survived several to hundreds of millions of years’ evolution, producing paleo-polyploid organisms which
were once polyploids but have been returned to diploid transmission genetics, as seen today. Among the
eukaryotic lineages that have been identified with paleo-polyploidies, including vertebrates (Dehal &
Boore, 2005; McLysaght, Hokamp, & Wolfe, 2002; Ohno, 1970; J. J. Smith et al., 2013), fungi (Kellis et
al., 2004; K. H. Wolfe & Shields, 1997) and ciliates (Aury et al., 2006; McGrath, Gout, Doak, Yanagi, &
Lynch, 2014), the angiosperms (flowering plants) are most affected. More than 50 paleo-polyploidy
events have been described across all studied angiosperm lineages (D. E. Soltis, Visger, & Soltis, 2014).
About 15% of angiosperm speciation events are estimated to be directly accompanied by polyploidy
(Wood et al., 2009). Moreover, most sequenced angiosperm lineages have experienced repeated paleo-
polyploidization. For example, Arabidopsis thaliana, the first sequenced model plant genome, had one
paleo-hexaploidy (genome triplication) and two paleo-tetraploidies (genome doubling) totaling 12x
duplication (Bowers et al., 2003; Tang, Bowers, et al., 2008). Realization of widespread paleo-
polyploidization has fundamental impacts on angiosperm genome comparison (Blanc & Wolfe, 2004;
Langham et al., 2004; Paterson, Bowers, Chapman, et al., 2004; Douglas E Soltis, Soltis, & Tate, 2004;
Van de Peer, 2004).
Paleo-polyploid genomes return to diploid heredity (and typically lower chromosome number)
during evolution, in the ‘diploidization’ process (M. Lynch & A. G. Force, 2000; K. H. Wolfe, 2001)
characterized by extensive sequence loss and structure rearrangement. Consequently, despite having
experienced varied paleo-polyploidy histories, contemporary angiosperm genomes often have similar
gene and chromosome numbers, typically varying less than five-fold. Zooming in, genome-wide
contraction of post-duplication genomes has created complex networks of homology and synteny

!
!
89
(conservation of gene order) among multiple restructured homeologous regions. Such networks
complicate both inter- and intra- genomic comparisons, especially the later ones due to frequent
reciprocal gene loss between paleo-duplicated regions (Freeling, 2009; Scannell, Byrne, Gordon, Wong,
& Wolfe, 2006).
GeDupMap (Genome Duplication Map) serves two purposes. One is to estimate all paleo-
polyploidy events on a phylogeny of species. The other is to organize putative orthologous regions in
those genomes in a systematic manner to form the synte-molecular framework for many comparative
genomic analyses. These tasks are currently not available in any other programs, and will facilitate
detailed analysis of multiple paleo-polyploid plant genomes.
6.3 Methods
The six steps of GeDupMap are illustrated in Figure 6.1. GeDupMap requires no more than the
annotations of the input genomes that are available for all sequenced species, and their species
phylogenetic tree (topology only) that can be easily obtained from the NCBI Taxonomy database, or from
literature. It is highly recommended to use genomes with chromosome or mega-scaffold level assemblies
because low contiguity compromises confidence in detecting synteny patterns, especially when
comparing multiple paleo-polyploid genomes.

!
!
90
Figure 6.1 Overview of GeDupMap procedure. Step one involves downloading annotated gene location
and sequence files (from Phytozome, genome portals, or project websites), and identification of synteny
blocks. Step two involves segmentation and clustering of synteny blocks using the PAR algorithm (Tang
et al., 2010). Step three involves refinement of PAR clusters by removing spurious regions and unaligned
boundary regions, and splitting conflict regions. Step four involves identification of putative orthologous
region groups (PORGs) containing regions duplicated after divergence of two species. Step five involves
collecting pairwise PORG counts into a distance matrix. Step six involves inference of paleo-polyploidy
levels using the Fitch-Margoliash algorithm. Finally the above steps form the synte-molecular framework
for downstream analyses. See more details in the text.

!
!
91
6.3.1 Matching gene sets and synteny blocks identification
Annotated gene sequences and location in the studied genomes can be downloaded from Phytozome
website or their respective genome project websites. LASTZ (Harris, 2007), LAST (Kielbasa, Wan, Sato,
Horton, & Frith, 2011), or BLAST (Altschul, Gish, Miller, Myers, & Lipman, 1990) can be used to search
sequence similarity between genes and identify matching gene pairs. The representative CDS sequence
from each gene locus is used. While for divergent homologous gene pairs BLASTP (using protein
sequences) is expected to be more sensitive than LASTZ/LAST (using CDS sequences) because of
synonymous mutations, in practice we observed that using BLASTP only resulted in a negligible increase
in syntenic anchors, while run time is several fold slower, and data pre-processing is more cumbersome
and prone to occasional frame-shift errors in annotations. In balancing benefits and cost for angiosperm
genome comparisons we decided that LASTZ/LAST search of CDS sequences is the recommended
approach. However, BLAST outputs are also fully compatible with the program.
Many studies suggested filtration of weak matches from raw BLAST/LASTZ output by applying
additional cutoffs, typically for hits identity, length, coverage, or c-score (Putnam et al., 2007; Tang et al.,
2010; Tang, Wang, et al., 2008; Vandepoele et al., 2002). These filters are available in GeDupMap. By
default the GeDupMap filters raw LASTZ output by identity >= 50%, coverage >= 30%, c-score >= 0.5,
which we found suitable for our studied genomes, and can be a good starting point for analyzing other
flowering plant genomes.
Identification of synteny blocks follows previous methods published by our lab (Tang et al.,
2010; Tang, Wang, et al., 2008). Tandem gene families, defined as clusters of genes within 10 intervening
genes from one another, were filtered out by keeping only one representative member with longest
peptide. LASTZ matches within 30~40 Manhattan distance units were clustered into synteny blocks, with
those blocks containing 5 or more anchor gene pairs retained for further analysis.

!
!
92
6.3.2 Chromosome segmentation and homologous region enrichment
Chromosome segmentation and PAR (putative ancestral regions) clustering follow (Tang et al., 2010).
For each pair of input genomes the chromosomes were cut into segments at boundaries of synteny blocks.
After segmentation the genomes are divided into regions less affected by genome rearrangements and are
therefore suitable for defining simple synteny patterns in next steps. Each segment in the query genome
was compared to subject genome segments, and profiled with the probability of the observed homeolog
number modeled with a Poisson distribution. The profile matrix was used as input of the CLUSTER
software (V3.0) (de Hoon, Imoto, Nolan, & Miyano, 2004; Eisen, Spellman, Brown, & Botstein, 1998),
which conducts two-way hierarchical clustering of the segments in the two genomes using Pearson
correlation coefficient (r) as distance and average linkage method. By default clusters were harvested at
r=0.3, which should be adjusted to ensure patterns of single cluster (no stacking clusters) on both axes of
the dot plot. Harvested clusters are further filtered by requiring that the probability of getting the total
observed number of homeologs by chance is less than 1e-30. As a result the “dense” (syntenic) portions
of the inter-genomic dot plot are concentrated into the PARs.
The collected PARs were then refined for three criteria: 1. Remove unaligned margins; 2. Split
conflicting regions; 3. Merge adjacent regions (Figure 6.2). Conflicting regions are those in a PAR
cluster but not syntenic to each other. Such PAR clusters can therefore be further split into several groups
that have no conflicting regions. Removal of unaligned region margins and merge of adjacent regions
ensure precise region boundary definition for further analysis.

!
!
93
Figure 6.2 Refinement of PAR groups. (a) Purposes of the refinement are to remove unaligned margins,
split conflicting regions, and merge adjacent regions. (b) After refinement the two groups of regions both
correctly reflect the 4: 2 ortholog ratio between Arabidopsis and rose gum.

!
!
94
6.3.3 Putative orthologous region groups (PORGs) identification
Paleo-polyploidy produces variation in ortholog ratios. When a paleo-polyploidy was shared by two
lineages, there is 1: 1 ortholog ratio. In cases of lineage-specific (post-speciation) paleo-polyploidies,
there are 1: multiple or multiple: multiple ortholog ratios. Those ratios can be used to estimate differences
of paleo-polyploidy levels between the two genomes.
We define a ‘synteny distance’ between two homeologous segments as -ln(nhits / alnlen), where
nhits is the number of hits (anchored gene pairs) between the two aligned segments, and alnlen is the
length of alignment. The synteny distance is derived as an analog to the Jukes-Cantor distance for
nucleotide alignment. This is because loss of one of the anchored genes is sufficient to cause loss of the
matching in the gene order alignment, a situation analogous to multiple substitutions in nucleotide
alignment. For each PAR group the regions in the query and subject genomes were aligned pairwise.
Their synteny distances were used as input to the PVCLUST program (Suzuki & Shimodaira, 2006)
which identifies statistically significant clusters in hierarchical clustering analysis. For each PORG,
paralogous regions in each genome are clustered by PVCLUST, from which the largest cluster that cannot
be further divided (containing two leaves or two insignificant nodes) is identified as the first duplication
node since speciation (FDN).
While we identify PORGs based on synteny patterns, GeDupMap also provides three additional
types of phylogenetic reconstruction based on homeologous gene families located in each PAR group,
including those that use concatenated full CDS sequence, synonymous substitution sites, or fourfold
degenerate sites. Outgroup genes are identified by BLASTN search against basal angiosperm mRNA
sequences in NCBI GenBank or a database of users’ choice. Such data are not all available for all region
groups because of severe post-WGD gene loss. But when available, the alternative sequence-based trees
may be used to cross-validate synteny-based trees.
6.3.4 Estimating the number of unshared paleo-polyploidies between two genomes
Using the PORGs, we then calculate copy number ratios as the number of paralogous segments under

!
!
95
each FDN (designated as nA and nB) divided by the ancestral copy number before speciation (n0=1 for
PORG). Assuming most paleopolyploidies are or consist of duplications (genome doublings), the number
of unshared WGDs between the two genomes can be calculated as log2[(nA/n0)*(nB/n0)]. Because of
typically extensive sequence loss following paleo-polyploidies, ortholog ratios in most PORGs are
expected to be smaller than their theoretical values. Because of potential small segmental duplications and
some uncertainties in synteny block and region tree inferences, occasionally ortholog ratios may also be
larger than the theoretical values. Therefore we empirically choose to use the 90th percentile of copy
number ratios from the population of PORGs between each pair of the genomes.
6.3.5 Inferring paleo-polyploidies on branches of the input phylogeny
The numbers of unshared paleo-polyploidies between the input genomes were compiled into a full
distance matrix. The distance matrix and the input species tree topology are then input to the Fitch-
Margoliash algorithm (Fitch & Margoliash, 1967) implemented in FITCH of PHYLIP package
(Felsenstein, 1989), which minimizes the difference between the tree and the distance matrix based on
sum of squares measurement. The resultant branch lengths are the paleo-polyploidy level estimation on
the branches. PORG ortholog ratios were bootstrapped 1000 times to estimate the 95% confidence
intervals of the paleo-polyploidy levels.
6.3.6 GeDupMap implementation
While this paper emphasizes more the procedure than a ‘black box’ software, our GeDupMap
implementation is available from https://github.com/Jingping/GeDupMap under BSD License. The code
was developed in Python programming language (v2.7). No compilation is needed, though third party
software and packages need to be installed separately (usually with a package manager). A README file
provides more details. The inputs are pairwise LASTZ (or BLAST, LAST) output files between studied
genomes in BLAST “—outfmt 6” format
(http://www.ncbi.nlm.nih.gov/books/NBK1763/#CmdLineAppsManual.Cookbook), BED files

!
!
96
(http://genome.ucsc.edu/FAQ/FAQformat.html#format1) of genome annotation coordinates, and
phylogeny of the taxa under study in NEWICK format
(http://evolution.genetics.washington.edu/phylip/newicktree.html). A run.sh file used for running analyses
in this study is also provided as an example.
6.4 Results
6.4.1 Simultaneous multiple paleo-polyploidy detection
For demonstration of GeDupMap functionality a set of 6 eudicot genomes (common bean, Arabidopsis
thaliana, cotton, rose gum, sugar beet) and 2 monocot genomes (oil palm, duckweed) were selected for
analysis (Table 6.1). All of these genomes have an assembly at chromosome or mega-scaffold level.
Table 6.1 Sources and basic information of angiosperm genomes used in this study.
species common name family 1x
protein coding genes
assembly level version publication
Phaseolus vulgaris
common bean Fabaceae 11 27,197 chromosome Phytozome
218 Schmutz et al., 2014
Arabidopsis thaliana thale cress Brassicaceae 5 27,416 chromosome TAIR 10
AGI, 2000; Swarbreck et
al., 2008 Gossypium raimondii cotton Malvaceae 13 37,505 chromosome Phytozome
221 Paterson et al., 2012
Eucalyptus grandis rose gum Myrtaceae 11 36,376 chromosome Phytozome
201 Myburg et al.,
2014
Vitis vinifera grape Vitaceae 19 26,346 chromosome Genoscope
12X Jaillon et al.,
2007
Beta vulgaris sugar beet Amaranthaceae 9 27,421 chromosome RefBeet 1.1 Dohm et al.,
2013
Elaeis guineensis oil palm Arecaceae 16 34,802 chromosome MPOB EG5 Singh et al.,
2013
Spirodela polyrhiza
greater duckweed Araceae 20 19,623 megascaffold Phytozome
290 Wang et al.,
2014
In total 4013 PORGs from 28 pairwise comparisons were analyzed. The paleo-polyploidy
inference is summarized in Figure 6.3. Inference from our automatic approach confirmed all the
!
!
97
previously described events in individual studies. Our results also showed that by comparing to each other
and to outgroup eudicot genomes, it is clear that the common ancestor of duckweed and oil palm did not
experience paleo-polyploidy, or the affected lineages did not survive, since monocot-eudicot divergence.
This indicated that there is no paleo-polyploidy in the monocot branch before the divergence of
Commelinids (containing oil palm) and Alismatales (containing duckweed), which spanned ~ 30 million
years in the early Cretaceous (Hedges et al., 2006). This is an interesting evolutionary time associated
with divergence of the two major flowering plant groups in the early days of angiosperms. Following
monocot-eudicot divergence both groups experienced one or more paleo-polyploidies in most or all of
their lineages.
A limitation of GeDupMap is that the paleo-polyploidy levels on the two oldest nodes of the
species tree (such as 11 and 14 in our dataset) cannot be separately inferred. This is however easily
resolved by directly looking at the dot plot alignments between the genomes, which clearly indicated that
the paleo-polyploidy inferred on 11+14 belongs to the eudicots. The ploidy level of the pan-core eudicot γ
event is estimated as 2, which is an under-estimate compared to its true ploidy level of 3 (Jaillon et al.,
2007; Tang, Bowers, et al., 2008). This is because of lack of a good outgroup to γ in our dataset. In a
dataset that include the genome of sacred lotus (Nelumbo nucifera), which is a basal eudicot having not
experienced the γ event, the ploidy level of γ is correctly inferred as 3 (data not shown). Inclusion of an
outgroup genome and careful selection of input taxa are important to GeDupMap results.

!
!
98
Figure 6.3 Paleo-polyploidy inference on each branch of input species phylogeny. Genome duplication
(doubling) has paleo-polyploidy level of 2. Genome triplication has paleo- polyploidy level of 3. (a) Tree
branches are named by blue numbers, which correspond to those in the table in panel (b). Yellow squares
represent estimated paleo- polyploidy levels on the individual branches. For example two squares
represent paleo-polyploidy level of 2 (resulted from a paleo-tetraploidy, or genome doubling). Numerical
values of mean, 95% CIs and estimate are given in (b). Branches 11 and 14 are currently not separable in
the tree due to lack of an outgroup. The last column in the table contains inferred paleo-polyploidy names
from the literature that described the events. See text for more details.

!
!
99
6.4.2 Putative orthologous region groups (PORGs) and synte-molecular comparison
With contributions from repeated paleo-polyploidies, angiosperm genomes are highly variable in genome
size, content and structure (Kejnovsky et al., 2009; Salse et al., 2009; D. E. Soltis et al., 2003). A direct
multiple genome alignment, like the 28-way vertebrate alignment (Miller et al., 2007), is not feasible in
plants because the number of common anchors soon diminishes with taxa from a few families added to
the alignment, and numbers of homeologous regions vary both within the same genome and across
different genomes (see next section). Therefore, a more fruitful way to formulate multiple genome
comparisons in angiosperms may be a system of pairwise comparisons, such as formed by GeDupMap.
The collection of putative orthologous region groups (PORGs) between each pair of the input genomes is
useful to many downstream analysis. It also forms the synteny backbone of a synte-molecular framework
of systematic genome comparison.
Once paleo-polyploidy levels on all species tree branches have been inferred, a combined use of
intergenomic and intragenomic synteny blocks will enable extraction of homeologous pairs on a given
branch. For example, grape and soybean (Glycine max) genomes have ortholog ratio of 1:4 due to two
paleo-tetraploidies (the Papilionoideae duplication (Young et al., 2011) and the Glycine duplication
(Schmutz et al., 2010)) in the lineages leading to soybean after the divergence with the grape lineage.
Soybean and common bean genomes have ortholog ratio of 2:1 due to the Glycine duplication
experienced by soybean. Therefore subtracting soybean-common bean comparison from the grape-
soybean comparison will produce soybean paralogs duplicated in the Papilionoideae duplication event.
6.4.3 Deletion-resistant and duplication-resistant regions
Following paleo-polyploidy gene and domain families from different functional groups are often
differentially retained, sometimes in the same direction repeatedly (Freeling & Thomas, 2006; Gout,
Duret, & Kahn, 2009; Paterson et al., 2006; Tang et al., 2010; Tang, Wang, et al., 2008). For example,
protein domains such as the Glycine-rich domain (PF07172), G-patch domain (PF01585), and SpoU
rRNA methylase (PF00588) are repeatedly restored to singleton state in both Arabidopsis and rice

!
!
100
(Paterson et al., 2006). Four functional groups (transcriptional factor activity (GO:0003700), ligand
binding (GO:0005488), DNA binding (GO:0003677), and transcriptional regulator activity
(GO:0030528)) remained the most enriched functional groups across both σ-duplicates and ρ-duplicates
in rice (Tang et al., 2010). In addition to “duplication-resistant” and “deletion-resistant” genes (Paterson
et al., 2006), paleo-duplicated genomic regions also show different propensity to be retained or lost. For
some regions this propensity may persist across multiple paleo-polyploidy events, resulting in higher
depth (homeolog copy number) in the extant genome than other regions without such property. The
differential post-duplication retention patterns among genomic regions produce a spectrum of homeolog
depth in the extant genomes (Figure 6.4), with regions of depth 1 being strict “duplication-resistant”
(DupR), and regions with high depths up to the genome’s paleo-multiplicity level being “deletion-
resistant” (DelR). For example, following a paleo-hexaploidy (γ) and a paleo-tetraploidy (L), an ancestral
common bean genomic region can retain all 6 copies (depth 6) at one extreme, or have repeatedly lost
homeologous regions and been restored to singleton (depth 1) at the other extreme.
The patterns of DelR and DupR regions seem specific to paleo-polyploidy, as simulation showed
that independent massive single gene duplications of similar scale are not likely to form such regions
(Figure 6.5). The size of DelR regions is often larger than the size of DupR regions, partly reflecting the
greater power to identify DelR regions as more of them are retained. Identification of DupR regions is
conservative because those DupR regions that were retained in only one sequenced genome are
indistinguishable from lineage-specific regions, and therefore cannot be classified. Available sequences
from more related genomes will help unmask those regions in future studies.

!
!
101
Figure 6.4 Homeolog depths (paleo-polyploidy levels) of genomic regions in the eight genomes. One
paleo-tetraploidy (doubling) without further loss leaves two homeologous regions (depth 2). Two paleo-
tetraploidies without further loss leave four homeologous regions (depth 4). Depth 0 represents lineage-
specific singleton regions that have no homeologous regions in the studied genomes. For example, in the
lineages leading to common bean there were 2 ancient WGDs: γ (3x), L (2x). Therefore differential gene
loss and lineage-specific gene gain together resulted in the extant common bean genome consisting of
regions having 0~6 homeologs. Additional depths greater than 6 are due to calculation artifacts or earlier
paleo-polyploidies in pre-angiosperm lineages.

!
!
102
Figure 6.5 Size distributions of DupR (duplication resistant) and DelR (deletion resistant) regions in
studied genomes and simulated random genomes. Regions identified in 20 simulated random genomes are
combined and used as control. Sizes are measured as gene counts. (a) In randomized control genomes
(green boxes on the right) typically only zero or a few short gene clusters were found, indicating lack of
DupR and DelR regions. (b) Number of regions identified in each of the studied genomes and 20 control
genomes. DupR regions are defined as having homeolog depth 1. DelR regions have high homeolog
depths in each of the genomes: Arabidopsis depth >= 5, common bean depth >= 5, cotton depth >=9, rose
gum depth >= 5, grape depth >= 3, sugar beet depth >= 3, oil palm depth >= 4, duckweed depth >= 4.
6.5 Discussion
Repeated paleo-polyploidization which is characteristic of angiosperm genome evolution, and
diploidization which is specific to the genomic ‘big bang’ (polyploidy) have made genome comparison in
angiosperms fundamentally different from other groups of organisms, such as mammals. Often one-to-
multiple or multiple-to-multiple ortholog ratios, and numtiple secondary associations form a network of
hierarchical synteny and homology mapping that make angiosperm genome comparisons one of the most
complex.

!
!
103
Knowledge of the timing (phylogenetic positioning) and ploidy levels of paleopolyploidy events
are essential in many plant studies. Conventionally this is usually done by investigating the individual
lineages. However, this approach will not scale well with rapidly expanding genome data. Therefore we
designed part of the GeDupMap pipeline to fill in this gap and automate simultaneous paleo-polyploidy
circumscription on multiple lineages. In addition, GeDupMap provides three levels of regions clustering:
PARs, Groups, PORGs. The PORGs are tentative and do not replace rigorous orthology definition by
phylogenetics, but they provide a starting and visualized solution that may be directly useful in some
studies.
Inter-genomic alignment is the fundamental method to reveal similarities and differences among
genomes. In particular, alignment with orthologous regions in the genomes of model organisms facilitates
accurate knowledge transfer to and accelerates studies of non-model organisms. Systematic multi-way
syntenic mapping provides an effective framework for genome alignment, with the unique advantage of
tolerating long evolutionary distance and extensive genome rearrangement. Nucleotide-level alignments
can in turn be conducted to enable more evolutionary analyses, such as nucleotide-level conservation,
categorization of indels in coding and regulatory regions, discovery of candidates for new and lineage
specific genes and other functional elements, recovery of ancestral functional elements that are lost in
extant sequences, and detection of genomic selection patterns. Phylogenetic trees of gene families are
often vulnerable to nucleotide substitution rate variation among lineages or different parts of gene, biased
sequence composition, saturation of sequence divergence, homoplasy, and gene loss. Largely exonerated
from these complications, synteny conservation or deviation is regarded as a more reliable phylogenetic
character (Rokas & Holland, 2000). The synte-molecular framework we proposed, also a flavor of
combined local and global (or glocal) alignment, is a naturally advantageous way to dissect fine structural
homology in divergent angiosperm genome comparisons.
Alignment of multiple gene order in homologous regions can be represented in several ways.
Traditional linear row-column alignment representation, although straightforward, does not store
information of micro-rearrangements of gene order. Partial order graph (POA) representation of multiple

!
!
104
alignments was developed to take advantage of directed acyclic graphs in handling gaps more naturally,
and incorporating more information than linear profiles (C. Lee, Grasso, & Sharlow, 2002). However,
POA is not useful in the presence of repeats or shuffled anchors, which create cycles in the graph and
void the acyclic property of POA. To mitigate this disadvantage, the A Bruijn graph, a weighted directed
graph related to the de Bruijn graph widely used in short read sequence assembly, was introduced in 2004
(Pevzner, Tang, & Tesler, 2004; Raphael, Zhi, Tang, & Pevzner, 2004). Different from the de Bruijn
graph which requires exact l-tuple matches, a situation seldom seen in the world of gene order alignment,
in the A Bruijn graph nodes represent individual loci, directed edges represent locus order, and “dark
edges” connect aligned loci. Cycles are allowed to represent local repeat, inversion, and shuffling. After
the A Bruijn graph representation of gene order alignment is constructed, heuristic procedures such as
“threading” (Raphael et al., 2004) and “modification” (Pham & Pevzner, 2010) work to simplify the
graph. Having the distinct advantage in handling local repeated and shuffled segments, A Bruijn graph
qualifies to be an ideal representation of homeologous region alignments that will provide a useful
interface for downstream analyses such as visualization, molecular evolution analyses, and ancestral
reconstruction. In addition, several other graphs related to the A Bruijn graph are discussed in depth in a
recent study (Kehr, Trappe, Holtgrewe, & Reinert, 2014). While graph representations of PORGs are not
part of GeDupMap, they can be reasonably easily applied to the program output.
6.6 Conclusion
We described a systematic approach, GeDupMap, to simultaneously infer all paleo-polyploidy events on
an input phylogeny of species with available genome assembly and annotation. This has great advantage
over previous manual inferences in view of rapidly increasing sequencing efforts on many taxa. The
analyses of synteny patterns behind the paleo-polyploidy inferences then form the synte-molecular
framework for downstream comparative analyses of the involved genomes. Such a framework will also
facilitate identification of high dimensional structural orthologs between the genomes. We demonstrated
the functions of GeDupMap using 8 eudicot and monocot genomes. Our results confirmed individually

!
!
105
identified paleo-polyploidy events in those lineages. We also identified groups of putative orthologous
regions, and duplication resistant (DupR) and deletion resistant (DelR) regions in the studied genomes.
The framework described here will facilitate studies of genome structure hierarchy in biochemical and
evolutionary settings.

!
!
106
CHAPTER 7 CONCLUSION AND PERSPECTIVE
7.1 Structural evolution of paleo-polyploid angiosperm genomes
Repeated paleo-polyploidies distinguish angiosperm genome evolution from that of other organisms.
Those dramatic whole genome events have been a key contributor to genetic changes underlying
phenotypic novelties and diversity in angiosperm lineages. Major findings of mechanisms by which
paleo-polyploidies affected angiosperm genome evolution include structural rearrangements (Kishimoto
et al., 1994; Kowalski et al., 1994; Shoemaker et al., 1996), fractionation (Thomas et al., 2006),
subfunctionalization and neofunctionalization (Kellis et al., 2004; M. Lynch & A. Force, 2000; Ohno,
1970), subgenomic dominance (J. C. Schnable et al., 2011; Tang et al., 2012), rewired biochemical
pathways (Arabidopsis Interactome Mapping Consortium, 2011; Bekaert et al., 2011), new gene
combinations (De Bodt et al., 2005; Rieseberg et al., 2003), favored gene retention explained by ‘gene
balance theory’ (Birchler et al., 2001; Papp et al., 2003; Thomas et al., 2006), increased genetic
robustness explained by the ‘functional buffering theory’ (Chapman et al., 2006; Gu et al., 2003; Paterson
et al., 2006), increased regulatory complexity (Freeling & Thomas, 2006), altered gene expression
(Adams & Wendel, 2005a; J. C. Schnable et al., 2011), and illegitimate/homeologous recombination
(Gaeta & Chris Pires, 2010; X. Y. Wang, Tang, Bowers, & Paterson, 2009) (for some reviews see (J. J.
Doyle et al., 2008; Freeling, 2009; Paterson et al., 2010; Van de Peer et al., 2009; K. H. Wolfe, 2001)).
Chapters 2-5 of this dissertation described several newly identified paleo-polyploidies, contributing to
knowledge of angiosperm paleo-polyploidies and genome evolution from several aspects.
There are also other aspects of plant paleo-polyploidies and genome evolution that will likely
benefit from more research in the near future. While paleo-tetraploidy events appear to be most common,
a few paleo-hexaploidy events have been identified in eudicots, including one in the core eudicot stem
lineage (“γ”), one in the rosid Brassica stem lineage, and one in the asterid Solanaceae stem lineage

!
!
107
(“T”). The Gossypium paleo-(do)decaploidy may also contain a hexaploidy component. The Solanum
genomes (such as tomato and potato) are the only ones identified so far that had two consecutive paleo-
hexaploidies but no paleo-tetraploidies. In contrast, although some wild monocots such as the grass
‘timothy’, and crops such as bread wheat are neo-hexaploids, paleo-hexaploidy has not been found in any
monocot genome studied so far. At present there are 3~4 cases of paleo-hexaploidy in 19 eudicot paleo-
polyploidies, while the 12 monocot paleo-polyploidies are all paleo-tetraploidy. If such bias is not due to
lack of sampling artifacts, this would raise curious questions about possible reasons and consequences
associated with these events through eudicot evolution, or alternatively, possible suppression of such
events in the evolution of other lineages.
The content of heterochromatin, which is rich in transposable elements (TEs), is well known to
account for a large proportion of the substantial genome size differences among angiosperm species
(Bennetzen, 2005; Bowers et al., 2005; Tenaillon, Hollister, & Gaut, 2010). Colinearity conservation is
much less in heterochromatin than in euchromatin regions (Bowers et al., 2005). TE content can vary
greatly between closely related genomes having similar genic fractions (Hawkins, Kim, Nason, Wing, &
Wendel, 2006; Hu et al., 2011; X. Wang, Wang, et al., 2011; Wu et al., 2013) or even from the same
species (Morgante, De Paoli, & Radovic, 2007). In plants much of the genome expansion and contraction
owing to retrotransposon activity seems to take place rapidly in the evolutionary timescale (Bennetzen,
2005; Morgante, 2006). TEs and heterochromatin have once been thought of as more or less dispensable
in genomes. However, TEs have also been found to stimulate genome rearrangements by mechanisms
such as chromosome-breaking, aborted transposition, and ectopic recombination (Bennetzen, 2005). After
polyploidization the genome restructuring effects of TEs may occur in a subgenome biased manner (D. E.
Soltis & Soltis, 1999). Increased heterochromatin restructuring after polyploidization may even be
selectively advantageous, and may occur in parallel in sister species (Bowers et al., 2005). Therefore,
better knowing the history and mechanisms of TE activity may facilitate understanding of genome
structure evolution.

!
!
108
One fundamental question about genome structure is whether gene order is random. Most
eukaryotic genomes lack the operon structures in prokaryotes, and therefore were suspected to have little
constraint in gene order. However, most studies so far seem to support the hypothesis that eukaryotic gene
order is non-random, especially at larger regional scales (Davila Lopez, Martinez Guerra, & Samuelsson,
2010; Hurst, Pal, & Lercher, 2004). In particular, studies in recent years reported evidence for operon-like
structures and functional gene clusters in Drosophila (Boutanaev et al., 2002) and plants (Field et al.,
2011; Field & Osbourn, 2008), large co-expression gene clusters (Boutanaev et al., 2002; Paterson et al.,
2012; Wada et al., 2012), and selection on local organization of human and mouse genome structure
(Boettger, Handsaker, Zody, & McCarroll, 2012; Singer, Lloyd, Huminiecki, & Wolfe, 2005). Our own
studies also suggested evolutionary and functional compartmentation in plant genomes. Like hierarchical
chromatin packaging, it is plausible to think that organization of genomic elements may also be
hierarchical. In angiosperms, ubiquitous retention of syntenic regions following tens to hundreds of
millions of years’ divergence argues against random gene organization. Indeed, repeated paleo-
polyploidies and diploidization are a logical favorable factor for structural compartmentation in
angiosperm genomes. Availability of more genomes in the near future may provide the opportunity to test
this hypothesis.
7.2 Effective synte-molecular comparisons of related plant genomes
Genes are the core functional units of the genome. Although essential, it is no easy task to study gene
function and regulation, and to transfer such knowledge between related species. Angiosperm species are
substantially variable in genome size, content, and arrangement, and have retained different levels of
conservation with one another and their ancestors. These observations form the basis, and a central
objective, of plant comparative genomic studies (Gale & Devos, 1998; Paterson et al., 1996). Knowledge
of genome structure conservation has two fundamental applications. It enables accurate transfer of hard-
won biological information from model organisms to many additional organisms. It also provides for
evolutionary inferences of ancestral and derived states of structure, sequence, and function.

!
!
109
However, as discussed above, the extent of large-scale structural conservation at chromosome and
region scales often does not correlate with the level of micro-synteny conservation over a few genes’
distance, the latter of which is often disrupted by local non-colinear elements. Therefore, global and local
alignments often complement each other in comparative studies. Combination of the two increases power
in identifying orthologous genes and delineating gene family genealogy.
On the other hand, compared to intra-genomic alignment, inter-genomic alignment is more
advantageous in revealing homology (and divergence) among genomes because of often smaller
evolutionary distance between orthologous regions. Concealing of homology due to reciprocal loss and
subfunctionalization between paralogs is often revealed by comparing to an orthologous region in a sister
lineage that lacked the duplication. Therefore, multi-way syntenic mapping aided by ‘intermediate’
genomes provides an effective backbone for genome alignments. Local and nucleotide-level alignments
can in turn be conducted to enable more evolutionary analyses, such as nucleotide-level conservation,
categorization of indels in coding and regulatory regions, discovery of candidates for new and lineage
specific genes and other functional elements, recovery of ancestral functional elements that are lost in
extant sequences, and detection of genomic selection patterns. The GeDupMap program (Chapter 6)
provides a starting solution to apply such synte-molecular comparisons among plant genomes.
7.3 Closing remarks
The past decade has seen exponential increase in the number of published genomes. Advancing
sequencing technology and plummeting cost assure continuing proliferation of genome data in the future.
The golden age of genome informatics is here with unprecedented challenges and opportunities. Novel
tools and deepened knowledge of paleo-polyploidy in recent years have greatly facilitated comparisons
among diverse plant genomes, including those that were once thought to be beyond the reach of such
comparisons. There is clear need and opportunity for future comparative genomic studies to take more
depth. For example, the frequency of structural alterations is not uniform throughout a genome. Hotspots
of micro-rearrangements are found near centromeres, telomeres, duplications, and interspersed repeats

!
!
110
(Eichler & Sankoff, 2003; Murphy et al., 2005). Rates of recombination vary along genomic regions of
different nucleotide composition, gene density, repeat content, chromatin packing, and other potential
factors (Cirulli, Kliman, & Noor, 2007; Giraut et al., 2011; McVean et al., 2004; Pal & Hurst, 2003).
Arrangement and diversification of functional elements in the genome are also different in organisms with
different reproductive types, life styles, habitats, and other factors. Systematic detailed studies of many
genomes are needed to fully understand the rules and consequences of genome organization in plants and
other organisms.
The biggest difference between plant and animal genome structure, biologically and
methodologically, is the extra duplicity in plant genomes due to repeated paleo-polyploidies.
Consequently essential genomic analyses, such as genome alignment, ortholog identification, and allelic
sequence mapping, are often more complicated or require separate tools in plants. However, by
systematically accounting for duplication in plant genomes, they can then be naturally connected with
genomic studies in other eukaryotic kingdoms, and therefore help unify and synergize knowledge of
genes and genomes across the eukaryotic phylogeny.

!
!
111
REFERENCES
Adams, K. L., Qiu, Y. L., Stoutemyer, M., & Palmer, J. D. (2002). Punctuated evolution of mitochondrial gene content: high and variable rates of mitochondrial gene loss and transfer to the nucleus during angiosperm evolution. Proc Natl Acad Sci U S A, 99(15), 9905-9912. doi: 10.1073/pnas.042694899
Adams, K. L., & Wendel, J. F. (2005a). Novel patterns of gene expression in polyploid plants. Trends Genet, 21(10), 539-543. doi: 10.1016/j.tig.2005.07.009
Adams, K. L., & Wendel, J. F. (2005b). Polyploidy and genome evolution in plants. Current Opinion in Plant Biology, 8(2), 135-141. doi: 10.1016/j.pbi.2005.01.001
Ahn, S., & Tanksley, S. D. (1993). Comparative Linkage Maps of the Rice and Maize Genomes. Proceedings of the National Academy of Sciences of the United States of America, 90(17), 7980-7984.
Altschul, S. F., Gish, W., Miller, W., Myers, E. W., & Lipman, D. J. (1990). Basic local alignment search tool. J Mol Biol, 215(3), 403-410.
Arabidopsis Genome Initiative. (2000). Analysis of the genome sequence of the flowering plant Arabidopsis thaliana. Nature, 408(6814), 796-815. doi: 10.1038/35048692
Arabidopsis Interactome Mapping Consortium. (2011). Evidence for network evolution in an Arabidopsis interactome map. Science, 333(6042), 601-607. doi: 10.1126/science.1203877
Arrigo, N., & Barker, M. S. (2012). Rarely successful polyploids and their legacy in plant genomes. Curr Opin Plant Biol, 15(2), 140-146. doi: 10.1016/j.pbi.2012.03.010
Aury, J. M., Jaillon, O., Duret, L., Noel, B., Jubin, C., Porcel, B. M., . . . Wincker, P. (2006). Global trends of whole-genome duplications revealed by the ciliate Paramecium tetraurelia. Nature, 444(7116), 171-178. doi: 10.1038/nature05230
Barker, M. S., Kane, N. C., Matvienko, M., Kozik, A., Michelmore, R. W., Knapp, S. J., & Rieseberg, L. H. (2008). Multiple paleopolyploidizations during the evolution of the Compositae reveal parallel patterns of duplicate gene retention after millions of years. Mol Biol Evol, 25(11), 2445-2455. doi: 10.1093/molbev/msn187
!
!
112
Baum, D. A., Dewitt Smith, S., Yen, A., Alverson, W. S., Nyffeler, R., Whitlock, B. A., & Oldham, R. L. (2004). Phylogenetic relationships of Malvatheca (Bombacoideae and Malvoideae; Malvaceae sensu lato) as inferred from plastid DNA sequences. Am J Bot, 91(11), 1863-1871. doi: 10.3732/ajb.91.11.1863
Bekaert, M., Edger, P. P., Pires, J. C., & Conant, G. C. (2011). Two-phase resolution of polyploidy in the Arabidopsis metabolic network gives rise to relative and absolute dosage constraints. Plant Cell, 23(5), 1719-1728. doi: 10.1105/tpc.110.081281
Bell, C. D., Soltis, D. E., & Soltis, P. S. (2010). The age and diversification of the angiosperms re-revisited. Am J Bot, 97(8), 1296-1303. doi: 10.3732/ajb.0900346
Bennetzen, J. L. (2005). Transposable elements, gene creation and genome rearrangement in flowering plants. Current Opinion in Genetics & Development, 15(6), 621-627. doi: 10.1016/j.gde.2005.09.010
Bennetzen, J. L., Schmutz, J., Wang, H., Percifield, R., Hawkins, J., Pontaroli, A. C., . . . Devos, K. M. (2012). Reference genome sequence of the model plant Setaria. Nat Biotechnol, 30(6), 555-561. doi: 10.1038/nbt.2196
Birchler, J. A., Bhadra, U., Bhadra, M. P., & Auger, D. L. (2001). Dosage-dependent gene regulation in multicellular eukaryotes: Implications for dosage compensation, aneuploid syndromes, and quantitative traits. Developmental Biology, 234(2), 275-288. doi: 10.1006/dbio.2001.0262
Blanc, G., Barakat, A., Guyot, R., Cooke, R., & Delseny, M. (2000). Extensive duplication and reshuffling in the Arabidopsis genome. Plant Cell, 12(7), 1093-1101.
Blanc, G., Hokamp, K., & Wolfe, K. H. (2003). A recent polyploidy superimposed on older large-scale duplications in the Arabidopsis genome. Genome Res, 13(2), 137-144. doi: 10.1101/gr.751803
Blanc, G., & Wolfe, K. H. (2004). Widespread paleopolyploidy in model plant species inferred from age distributions of duplicate genes. Plant Cell, 16(7), 1667-1678. doi: 10.1105/tpc.021345
Bock, R., & Timmis, J. N. (2008). Reconstructing evolution: gene transfer from plastids to the nucleus. Bioessays, 30(6), 556-566. doi: 10.1002/bies.20761
Boettger, L. M., Handsaker, R. E., Zody, M. C., & McCarroll, S. A. (2012). Structural haplotypes and recent evolution of the human 17q21.31 region. Nat Genet, 44(8), 881-885. doi: 10.1038/ng.2334

!
!
113
Boutanaev, A. M., Kalmykova, A. I., Shevelyov, Y. Y., & Nurminsky, D. I. (2002). Large clusters of co-expressed genes in the Drosophila genome. Nature, 420(6916), 666-669. doi: 10.1038/nature01216
Bowers, J. E., Arias, M. A., Asher, R., Avise, J. A., Ball, R. T., Brewer, G. A., . . . Paterson, A. H. (2005). Comparative physical mapping links conservation of microsynteny to chromosome structure and recombination in grasses. Proc Natl Acad Sci U S A, 102(37), 13206-13211. doi: 10.1073/pnas.0502365102
Bowers, J. E., Chapman, B. A., Rong, J., & Paterson, A. H. (2003). Unravelling angiosperm genome evolution by phylogenetic analysis of chromosomal duplication events. Nature, 422(6930), 433-438. doi: 10.1038/nature01521
Bray, N., & Pachter, L. (2004). MAVID: Constrained Ancestral Alignment of Multiple Sequences. Genome Research, 14(4), 693-699. doi: 10.1101/gr.1960404
Bremer, K., Friis, E. M., & Bremer, B. (2004). Molecular phylogenetic dating of asterid flowering plants shows early Cretaceous diversification. Syst Biol, 53(3), 496-505.
Brown, M. S., & Menzel, M. Y. (1952). Polygenomic Hybrids in Gossypium. I. Cytology of Hexaploids, Pentaploids and Hexaploid Combinations. Genetics, 37(3), 242-263.
Brudno, M., Malde, S., Poliakov, A., Do, C. B., Couronne, O., Dubchak, I., & Batzoglou, S. (2003). Glocal alignment: finding rearrangements during alignment. Bioinformatics, 19(Suppl 1), i54-i62. doi: 10.1093/bioinformatics/btg1005
Buggs, R. J., Chamala, S., Wu, W., Tate, J. A., Schnable, P. S., Soltis, D. E., . . . Barbazuk, W. B. (2012). Rapid, repeated, and clustered loss of duplicate genes in allopolyploid plant populations of independent origin. Curr Biol, 22(3), 248-252. doi: 10.1016/j.cub.2011.12.027
Cannon, S. B., Kozik, A., Chan, B., Michelmore, R., & Young, N. D. (2003). DiagHunter and GenoPix2D: programs for genomic comparisons, large-scale homology discovery and visualization. Genome Biol, 4(10), R68. doi: 10.1186/gb-2003-4-10-r68
Cardinal, S., & Danforth, B. N. (2013). Bees diversified in the age of eudicots. Proc Biol Sci, 280(1755), 20122686. doi: 10.1098/rspb.2012.2686
Carels, N., Hatey, P., Jabbari, K., & Bernardi, G. (1998). Compositional properties of homologous coding sequences from plants. J Mol Evol, 46(1), 45-53.

!
!
114
Carvalho, M. R., Herrera, F. A., Jaramillo, C. A., Wing, S. L., & Callejas, R. (2011). Paleocene Malvaceae from northern South America and their biogeographical implications. American Journal of Botany, 98(8), 1337-1355.
Cenci, A., Combes, M.-C., & Lashermes, P. (2010). Comparative sequence analyses indicate that Coffea (Asterids) and Vitis (Rosids) derive from the same paleo-hexaploid ancestral genome. Molecular Genetics and Genomics, 283(5), 493-501.
Chapman, B. A., Bowers, J. E., Feltus, F. A., & Paterson, A. H. (2006). Buffering of crucial functions by paleologous duplicated genes may contribute cyclicality to angiosperm genome duplication. Proceedings of the National Academy of Sciences of the United States of America, 103(8), 2730-2735. doi: 10.1073/pnas.0507782103
Chittenden, L. M., Schertz, K. F., Lin, Y. R., Wing, R. A., & Paterson, A. H. (1994). A detailed RFLP map of Sorghum bicolor x S. propinquum, suitable for high-density mapping, suggests ancestral duplication of Sorghum chromosomes or chromosomal segments. Theor Appl Genet, 87(8), 925-933. doi: 10.1007/BF00225786
Cirulli, E. T., Kliman, R. M., & Noor, M. A. (2007). Fine-scale crossover rate heterogeneity in Drosophila pseudoobscura. J Mol Evol, 64(1), 129-135. doi: 10.1007/s00239-006-0142-7
Clarke, J. T., Warnock, R. C., & Donoghue, P. C. (2011). Establishing a time-scale for plant evolution. New Phytol, 192(1), 266-301. doi: 10.1111/j.1469-8137.2011.03794.x
Crane, P. R., Friis, E. M., & Pedersen, K. R. (1995). The Origin and Early Diversification of Angiosperms. Nature, 374(6517), 27-33.
Crane, P. R., & Lidgard, S. (1989). Angiosperm diversification and paleolatitudinal gradients in cretaceous floristic diversity. Science, 246(4930), 675-678. doi: 10.1126/science.246.4930.675
Cui, L., Wall, P. K., Leebens-Mack, J. H., Lindsay, B. G., Soltis, D. E., Doyle, J. J., . . . dePamphilis, C. W. (2006). Widespread genome duplications throughout the history of flowering plants. Genome Res, 16(6), 738-749. doi: 10.1101/gr.4825606
D'Hont, A., Denoeud, F., Aury, J. M., Baurens, F. C., Carreel, F., Garsmeur, O., . . . Wincker, P. (2012). The banana (Musa acuminata) genome and the evolution of monocotyledonous plants. Nature, 488(7410), 213-217. doi: 10.1038/nature11241
Davila Lopez, M., Martinez Guerra, J. J., & Samuelsson, T. (2010). Analysis of gene order conservation in eukaryotes identifies transcriptionally and functionally linked genes. PLoS One, 5(5), e10654. doi: 10.1371/journal.pone.0010654

!
!
115
De Bodt, S., Maere, S., & Van de Peer, Y. (2005). Genome duplication and the origin of angiosperms. Trends Ecol Evol, 20(11), 591-597. doi: 10.1016/j.tree.2005.07.008
de Hoon, M. J., Imoto, S., Nolan, J., & Miyano, S. (2004). Open source clustering software. Bioinformatics, 20(9), 1453-1454. doi: 10.1093/bioinformatics/bth078
De Smet, R., Adams, K. L., Vandepoele, K., Van Montagu, M. C., Maere, S., & Van de Peer, Y. (2013). Convergent gene loss following gene and genome duplications creates single-copy families in flowering plants. Proc Natl Acad Sci U S A, 110(8), 2898-2903. doi: 10.1073/pnas.1300127110
Dehal, P., & Boore, J. L. (2005). Two rounds of whole genome duplication in the ancestral vertebrate. PLoS Biol, 3(10), e314. doi: 10.1371/journal.pbio.0030314
DeVries, H. (1915). The coefficient of mutation in Oenothera biennis L. Botanical Gazette, 169-196.
Doyle, J. A. (2012). Molecular and Fossil Evidence on the Origin of Angiosperms. Annual Review of Earth and Planetary Sciences, 40(1), 301-326. doi: 10.1146/annurev-earth-042711-105313
Doyle, J. A., & Donoghue, M. J. (1993). Phylogenies and angiosperm diversification. Paleobiology, 19, 141-167.
Doyle, J. J., Flagel, L. E., Paterson, A. H., Rapp, R. A., Soltis, D. E., Soltis, P. S., & Wendel, J. F. (2008). Evolutionary genetics of genome merger and doubling in plants. Annu Rev Genet, 42, 443-461. doi: 10.1146/annurev.genet.42.110807.091524
Dubchak, I., Poliakov, A., Kislyuk, A., & Brudno, M. (2009). Multiple whole-genome alignments without a reference organism. Genome Res, 19(4), 682-689. doi: 10.1101/gr.081778.108
Edgar, R. C. (2004). MUSCLE: multiple sequence alignment with high accuracy and high throughput. Nucleic Acids Res, 32(5), 1792-1797. doi: 10.1093/nar/gkh340
Eichler, E. E., & Sankoff, D. (2003). Structural dynamics of eukaryotic chromosome evolution. Science, 301(5634), 793-797.
Eisen, M. B., Spellman, P. T., Brown, P. O., & Botstein, D. (1998). Cluster analysis and display of genome-wide expression patterns. Proc Natl Acad Sci U S A, 95(25), 14863-14868.
Ezcurra, M. D., & Agnolin, F. L. (2012). A new global palaeobiogeographical model for the late Mesozoic and early Tertiary. Syst Biol, 61(4), 553-566. doi: 10.1093/sysbio/syr115

!
!
116
Fawcett, J. A., Maere, S., & Van de Peer, Y. (2009). Plants with double genomes might have had a better chance to survive the Cretaceous-Tertiary extinction event. Proc Natl Acad Sci U S A, 106(14), 5737-5742. doi: 10.1073/pnas.0900906106
Felsenstein, J. (1989). PHYLIP - Phylogeny Inference Package (Version 3.2). Cladistics(5), 164-166.
Field, B., Fiston-Lavier, A. S., Kemen, A., Geisler, K., Quesneville, H., & Osbourn, A. E. (2011). Formation of plant metabolic gene clusters within dynamic chromosomal regions. Proc Natl Acad Sci U S A, 108(38), 16116-16121. doi: 10.1073/pnas.1109273108
Field, B., & Osbourn, A. E. (2008). Metabolic diversification--independent assembly of operon-like gene clusters in different plants. Science, 320(5875), 543-547. doi: 10.1126/science.1154990
Fitch, W. M., & Margoliash, E. (1967). Construction of phylogenetic trees. Science, 155(3760), 279-284.
Force, A., Lynch, M., Pickett, F. B., Amores, A., Yan, Y. L., & Postlethwait, J. (1999). Preservation of duplicate genes by complementary, degenerative mutations. Genetics, 151(4), 1531-1545.
Freeling, M. (2009). Bias in plant gene content following different sorts of duplication: tandem, whole-genome, segmental, or by transposition. Annu Rev Plant Biol, 60, 433-453. doi: 10.1146/annurev.arplant.043008.092122
Freeling, M., & Thomas, B. C. (2006). Gene-balanced duplications, like tetraploidy, provide predictable drive to increase morphological complexity. Genome Res, 16(7), 805-814. doi: 10.1101/gr.3681406
Friis, E. M., Crane, P. R., & Pedersen, K. R. (2011). Early Flowers and Angiosperm Evolution: Cambridge University Press.
Friis, E. M., Pedersen, K. R., & Crane, P. R. (2006). Cretaceous angiosperm flowers: Innovation and evolution in plant reproduction. Palaeogeography, Palaeoclimatology, Palaeoecology, 232(2-4), 251-293. doi: 10.1016/j.palaeo.2005.07.006
Friis, E. M., Pedersen, K. R., & Crane, P. R. (2010). Diversity in obscurity: fossil flowers and the early history of angiosperms. Philos Trans R Soc Lond B Biol Sci, 365(1539), 369-382. doi: 10.1098/rstb.2009.0227
Gaeta, R. T., & Chris Pires, J. (2010). Homoeologous recombination in allopolyploids: the polyploid ratchet. New Phytol, 186(1), 18-28. doi: 10.1111/j.1469-8137.2009.03089.x

!
!
117
Gale, M. D., & Devos, K. M. (1998). Plant comparative genetics after 10 years. Science, 282(5389), 656-659.
Garsmeur, O., Schnable, J. C., Almeida, A., Jourda, C., D'Hont, A., & Freeling, M. (2014). Two evolutionarily distinct classes of paleopolyploidy. Mol Biol Evol, 31(2), 448-454. doi: 10.1093/molbev/mst230
Gaut, B., Yang, L., Takuno, S., & Eguiarte, L. E. (2011). The Patterns and Causes of Variation in Plant Nucleotide Substitution Rates. Annual Review of Ecology, Evolution, and Systematics, 42(1), 245-266. doi: doi:10.1146/annurev-ecolsys-102710-145119
Gebhardt, C., Walkemeier, B., Henselewski, H., Barakat, A., Delseny, M., & Stüber, K. (2003). Comparative mapping between potato (Solanum tuberosum) and Arabidopsis thaliana reveals structurally conserved domains and ancient duplications in the potato genome. The Plant Journal, 34(4), 529-541.
Giraut, L., Falque, M., Drouaud, J., Pereira, L., Martin, O. C., & Mezard, C. (2011). Genome-wide crossover distribution in Arabidopsis thaliana meiosis reveals sex-specific patterns along chromosomes. PLoS Genet, 7(11), e1002354. doi: 10.1371/journal.pgen.1002354
Gout, J. F., Duret, L., & Kahn, D. (2009). Differential retention of metabolic genes following whole-genome duplication. Mol Biol Evol, 26(5), 1067-1072. doi: 10.1093/molbev/msp026
Grant, D., Cregan, P., & Shoemaker, R. C. (2000). Genome organization in dicots: Genome duplication in Arabidopsis and synteny between soybean and Arabidopsis. Proceedings of the National Academy of Sciences of the United States of America, 97(8), 4168-4173.
Grant, V. (1981). Plant Speciation: Columbia University Press.
Grimaldi, D. (1999). The co-radiations of pollinating insects and angiosperms in the Cretaceous. Annals of the Missouri Botanical Garden, 373-406.
Gu, Z., Steinmetz, L. M., Gu, X., Scharfe, C., Davis, R. W., & Li, W. H. (2003). Role of duplicate genes in genetic robustness against null mutations. Nature, 421(6918), 63-66. doi: 10.1038/nature01198
Haas, B. J., Delcher, A. L., Wortman, J. R., & Salzberg, S. L. (2004). DAGchainer: a tool for mining segmental genome duplications and synteny. Bioinformatics, 20(18), 3643-3646. doi: 10.1093/bioinformatics/bth397

!
!
118
Hampson, S., McLysaght, A., Gaut, B., & Baldi, P. (2003). LineUp: statistical detection of chromosomal homology with application to plant comparative genomics. Genome Res, 13(5), 999-1010. doi: 10.1101/gr.814403
Harris, R. S. (2007). Improved pairwise alignment of genomic DNA: ProQuest.
Hawkins, J. S., Kim, H., Nason, J. D., Wing, R. A., & Wendel, J. F. (2006). Differential lineage-specific amplification of transposable elements is responsible for genome size variation in Gossypium. Genome Res, 16(10), 1252-1261. doi: 10.1101/gr.5282906
Hazkani-Covo, E., Zeller, R. M., & Martin, W. (2010). Molecular poltergeists: mitochondrial DNA copies (numts) in sequenced nuclear genomes. PLoS Genet, 6(2), e1000834. doi: 10.1371/journal.pgen.1000834
Hedges, S. B., Dudley, J., & Kumar, S. (2006). TimeTree: a public knowledge-base of divergence times among organisms. Bioinformatics, 22(23), 2971-2972. doi: 10.1093/bioinformatics/btl505
Hedges, S. B., & Kumar, S. (2009). The Timetree of Life: OUP Oxford.
Helentjaris, T., Weber, D., & Wright, S. (1988). Identification of the genomic locations of duplicate nucleotide sequences in maize by analysis of restriction fragment length polymorphisms. Genetics, 118(2), 353-363.
Hellsten, U., Wright, K. M., Jenkins, J., Shu, S., Yuan, Y., Wessler, S. R., . . . Rokhsar, D. S. (2013). Fine-scale variation in meiotic recombination in Mimulus inferred from population shotgun sequencing. Proc Natl Acad Sci U S A. doi: 10.1073/pnas.1319032110
Hickey, L. J., & Doyle, J. A. (1977). Early cretaceous fossil evidence for angiosperm evolution. The Botanical Review, 43(1), 3-104. doi: 10.1007/BF02860849
Hu, T. T., Pattyn, P., Bakker, E. G., Cao, J., Cheng, J. F., Clark, R. M., . . . Guo, Y. L. (2011). The Arabidopsis lyrata genome sequence and the basis of rapid genome size change. Nat Genet, 43(5), 476-481. doi: 10.1038/ng.807
Huang, S., Ding, J., Deng, D., Tang, W., Sun, H., Liu, D., . . . Liu, Y. (2013). Draft genome of the kiwifruit Actinidia chinensis. Nat Commun, 4, 2640. doi: 10.1038/ncomms3640
Hurst, L. D., Pal, C., & Lercher, M. J. (2004). The evolutionary dynamics of eukaryotic gene order. Nat Rev Genet, 5(4), 299-310. doi: 10.1038/nrg1319

!
!
119
Ibarra-Laclette, E., Lyons, E., Hernandez-Guzman, G., Perez-Torres, C. A., Carretero-Paulet, L., Chang, T. H., . . . Herrera-Estrella, L. (2013). Architecture and evolution of a minute plant genome. Nature. doi: 10.1038/nature12132
International Brachypodium, I. (2010). Genome sequencing and analysis of the model grass Brachypodium distachyon. Nature, 463(7282), 763-768. doi: 10.1038/nature08747
Jaillon, O., Aury, J. M., Brunet, F., Petit, J. L., Stange-Thomann, N., Mauceli, E., . . . Crollius, H. R. (2004). Genome duplication in the teleost fish Tetraodon nigroviridis reveals the early vertebrate proto-karyotype. Nature, 431(7011), 946-957.
Jaillon, O., Aury, J. M., Noel, B., Policriti, A., Clepet, C., Casagrande, A., . . . Wincker, P. (2007). The grapevine genome sequence suggests ancestral hexaploidization in major angiosperm phyla. Nature, 449(7161), 463-467. doi: 10.1038/nature06148
Jiao, Y., Leebens-Mack, J., Ayyampalayam, S., Bowers, J. E., McKain, M. R., McNeal, J., . . . Depamphilis, C. W. (2012). A genome triplication associated with early diversification of the core eudicots. Genome Biol, 13(1), R3. doi: 10.1186/gb-2012-13-1-r3
Jiao, Y., Li, J., Tang, H., & Paterson, A. H. (2014). Integrated syntenic and phylogenomic analyses reveal an ancient genome duplication in monocots. Plant Cell, 26(7), 2792-2802. doi: 10.1105/tpc.114.127597
Jiao, Y., Wickett, N. J., Ayyampalayam, S., Chanderbali, A. S., Landherr, L., Ralph, P. E., . . . dePamphilis, C. W. (2011). Ancestral polyploidy in seed plants and angiosperms. Nature, 473(7345), 97-100. doi: 10.1038/nature09916
Kehr, B., Trappe, K., Holtgrewe, M., & Reinert, K. (2014). Genome alignment with graph data structures: a comparison. Bmc Bioinformatics, 15, 99. doi: 10.1186/1471-2105-15-99
Kejnovsky, E., Leitch, I. J., & Leitch, A. R. (2009). Contrasting evolutionary dynamics between angiosperm and mammalian genomes. Trends Ecol Evol, 24(10), 572-582. doi: 10.1016/j.tree.2009.04.010
Kellis, M., Birren, B. W., & Lander, E. S. (2004). Proof and evolutionary analysis of ancient genome duplication in the yeast Saccharomyces cerevisiae. Nature, 428(6983), 617-624.
Kent, W. J., Baertsch, R., Hinrichs, A., Miller, W., & Haussler, D. (2003). Evolution's cauldron: duplication, deletion, and rearrangement in the mouse and human genomes. Proc Natl Acad Sci U S A, 100(20), 11484-11489. doi: 10.1073/pnas.1932072100

!
!
120
Khawaja, H. I., Ellis, J. R., & Sybenga, J. (1995). Cytogenetics of Lathyrus palustris, a natural autohexaploid. Genome, 38(4), 827-831.
Kielbasa, S. M., Wan, R., Sato, K., Horton, P., & Frith, M. C. (2011). Adaptive seeds tame genomic sequence comparison. Genome Res, 21(3), 487-493. doi: 10.1101/gr.113985.110
Kishimoto, N., Higo, H., Abe, K., Arai, S., Saito, A., & Higo, K. (1994). Identification of the duplicated segments in rice chromosomes 1 and 5 by linkage analysis of cDNA markers of known functions. Theoretical and Applied Genetics, 88, 722-726.
Koch, M. A., Haubold, B., & Mitchell-Olds, T. (2000). Comparative evolutionary analysis of chalcone synthase and alcohol dehydrogenase loci in Arabidopsis, Arabis, and related genera (Brassicaceae). Mol Biol Evol, 17(10), 1483-1498.
Kowalski, S. P., Lan, T. H., Feldmann, K. A., & Paterson, A. H. (1994). Comparative mapping of Arabidopsis thaliana and Brassica oleracea chromosomes reveals islands of conserved organization. Genetics, 138(2), 499-510.
Ku, H. M., Vision, T., Liu, J., & Tanksley, S. D. (2000). Comparing sequenced segments of the tomato and Arabidopsis genomes: large-scale duplication followed by selective gene loss creates a network of synteny. Proc Natl Acad Sci U S A, 97(16), 9121-9126. doi: 10.1073/pnas.160271297
Kubo, T., & Newton, K. J. (2008). Angiosperm mitochondrial genomes and mutations. Mitochondrion, 8(1), 5-14. doi: 10.1016/j.mito.2007.10.006
Langham, R. J., Walsh, J., Dunn, M., Ko, C., Goff, S. A., & Freeling, M. (2004). Genomic duplication, fractionation and the origin of regulatory novelty. Genetics, 166(2), 935-945.
Larkin, M. A., Blackshields, G., Brown, N. P., Chenna, R., McGettigan, P. A., McWilliam, H., . . . Higgins, D. G. (2007). Clustal W and Clustal X version 2.0. Bioinformatics, 23(21), 2947-2948. doi: 10.1093/bioinformatics/btm404
Lee, C., Grasso, C., & Sharlow, M. F. (2002). Multiple sequence alignment using partial order graphs. Bioinformatics, 18(3), 452-464.
Lee, T. H., Tang, H., Wang, X., & Paterson, A. H. (2013). PGDD: a database of gene and genome duplication in plants. Nucleic Acids Res, 41(Database issue), D1152-1158. doi: 10.1093/nar/gks1104
Leister, D. (2005). Origin, evolution and genetic effects of nuclear insertions of organelle DNA. Trends Genet, 21(12), 655-663. doi: 10.1016/j.tig.2005.09.004

!
!
121
Leitch, A. R., & Leitch, I. J. (2008). Genomic plasticity and the diversity of polyploid plants. Science, 320(5875), 481-483. doi: 10.1126/science.1153585
Levin, D. A. (1983). Polyploidy and Novelty in Flowering Plants. The American Naturalist, 122(1), 1-25. doi: 10.2307/2461003
Li, J., Tang, H., Bowers, J. E., Ming, R., & Paterson, A. H. (2014). Insights into the Common Ancestor of Eudicots. In A. H. Paterson (Ed.), Genomes of Herbaceous Land Plants (Vol. 69, pp. 137-174): Elsevier.
Li, J., Tang, H., Wang, X., & Paterson, A. H. (2015). Two paleo-hexaploidies underlie formation of modern Solanaceae genome structure. In M. Causse, J. Giovannoni, M. Bouzayen & M. Zouine (Eds.), Compendium of Plant Genomes: The Tomato Genome: Springer.
Lin, X. Y., Kaul, S. S., Rounsley, S., Shea, T. P., Benito, M. I., Town, C. D., . . . Venter, J. C. (1999). Sequence and analysis of chromosome 2 of the plant Arabidopsis thaliana. Nature, 402(6763), 761-+.
Liu, S.-L., Zhuang, Y., Zhang, P., & Adams, K. L. (2009). Comparative Analysis of Structural Diversity and Sequence Evolution in Plant Mitochondrial Genes Transferred to the Nucleus. Molecular Biology and Evolution, 26(4), 875-891. doi: 10.1093/molbev/msp011
Lutz, A. M. (1907). A PRELIMINARY NOTE ON THE CHROMOSOMES OF OEligNOTHERA LAMARCKIANA AND ONE OF ITS MUTANTS, O. GIGAS. Science, 26(657), 151-152. doi: 10.1126/science.26.657.151
Lynch, M., & Conery, J. S. (2000). The Evolutionary Fate and Consequences of Duplicate Genes. Science, 290(5494), 1151-1155. doi: 10.1126/science.290.5494.1151
Lynch, M., & Force, A. (2000). The probability of duplicate gene preservation by subfunctionalization. Genetics, 154(1), 459-473.
Lynch, M., & Force, A. G. (2000). The origin of interspecific genomic incompatibility via gene duplication. The American Naturalist, 156(6), 590-605.
Lyons, E., & Freeling, M. (2008). How to usefully compare homologous plant genes and chromosomes as DNA sequences. Plant J, 53(4), 661-673. doi: 10.1111/j.1365-313X.2007.03326.x
Lyons, E., Pedersen, B., Kane, J., & Freeling, M. (2008). The Value of Nonmodel Genomes and an Example Using SynMap Within CoGe to Dissect the Hexaploidy that Predates the Rosids. Trop Plant Biol, 1(3), 181-190. doi: doi: 10.1007/s12042-008-9017-y

!
!
122
Magallón, S. (2009). Flowering plants (Magnoliophyta). The timetree of life. Oxford University Press, New York, 161-165.
Mandakova, T., Joly, S., Krzywinski, M., Mummenhoff, K., & Lysak, M. A. (2010). Fast diploidization in close mesopolyploid relatives of Arabidopsis. Plant Cell, 22(7), 2277-2290. doi: 10.1105/tpc.110.074526
Masterson, J. (1994). Stomatal size in fossil plants: evidence for polyploidy in majority of angiosperms. Science, 264(5157), 421-424. doi: 10.1126/science.264.5157.421
Matsuoka, Y. (2011). Evolution of polyploid triticum wheats under cultivation: the role of domestication, natural hybridization and allopolyploid speciation in their diversification. Plant Cell Physiol, 52(5), 750-764. doi: 10.1093/pcp/pcr018
Mayer, V. W., Goin, C. J., Arras, C. A., & Taylor-Mayer, R. E. (1992). Comparison of chemically induced chromosome loss in a diploid, triploid, and tetraploid strain of Saccharomyces cerevisiae. Mutat Res, 279(1), 41-48.
McClintock, B. (1941). The Association of Mutants with Homozygous Deficiencies in Zea Mays. Genetics, 26(5), 542-571.
McGrath, C. L., Gout, J. F., Doak, T. G., Yanagi, A., & Lynch, M. (2014). Insights into Three Whole-Genome Duplications Gleaned from the Paramecium caudatum Genome Sequence. Genetics. doi: 10.1534/genetics.114.163287
McLysaght, A., Hokamp, K., & Wolfe, K. H. (2002). Extensive genomic duplication during early chordate evolution. Nat Genet, 31(2), 200-204. doi: 10.1038/ng884
McVean, G. A. T., Myers, S. R., Hunt, S., Deloukas, P., Bentley, D. R., & Donnelly, P. (2004). The Fine-Scale Structure of Recombination Rate Variation in the Human Genome. Science, 304(5670), 581-584. doi: 10.1126/science.1092500
Metz, C. W. (1947). Duplication of chromosome parts as a factor in evolution. Am Nat, 81(797), 81-103.
Miller, W., Rosenbloom, K., Hardison, R. C., Hou, M., Taylor, J., Raney, B., . . . Kent, W. J. (2007). 28-way vertebrate alignment and conservation track in the UCSC Genome Browser. Genome Res, 17(12), 1797-1808. doi: 10.1101/gr.6761107
Ming, R., Hou, S., Feng, Y., Yu, Q., Dionne-Laporte, A., Saw, J. H., . . . Alam, M. (2008). The draft genome of the transgenic tropical fruit tree papaya (Carica papaya Linnaeus). Nature, 452(7190), 991-996. doi: 10.1038/nature06856

!
!
123
Ming, R., Vanburen, R., Liu, Y., Yang, M., Han, Y., Li, L. T., . . . Shen-Miller, J. (2013). Genome of the long-living sacred lotus (Nelumbo nucifera Gaertn.). Genome Biol, 14(5), R41. doi: 10.1186/gb-2013-14-5-r41
Moore, M. J., Bell, C. D., Soltis, P. S., & Soltis, D. E. (2007). Using plastid genome-scale data to resolve enigmatic relationships among basal angiosperms. Proc Natl Acad Sci U S A, 104(49), 19363-19368. doi: 10.1073/pnas.0708072104
Moore, M. J., Soltis, P. S., Bell, C. D., Burleigh, J. G., & Soltis, D. E. (2010). Phylogenetic analysis of 83 plastid genes further resolves the early diversification of eudicots. Proc Natl Acad Sci U S A, 107(10), 4623-4628. doi: 10.1073/pnas.0907801107
Morgante, M. (2006). Plant genome organisation and diversity: the year of the junk! Curr Opin Biotechnol, 17(2), 168-173. doi: 10.1016/j.copbio.2006.03.001
Morgante, M., De Paoli, E., & Radovic, S. (2007). Transposable elements and the plant pan-genomes. Curr Opin Plant Biol, 10(2), 149-155. doi: 10.1016/j.pbi.2007.02.001
Mower, J. P., Touzet, P., Gummow, J. S., Delph, L. F., & Palmer, J. D. (2007). Extensive variation in synonymous substitution rates in mitochondrial genes of seed plants. BMC Evol Biol, 7, 135. doi: 10.1186/1471-2148-7-135
Muller, H. J. (1914). A new mode of segregation in Gregory's tetraploid primulas. American Naturalist, 508-512.
Murphy, W. J., Larkin, D. M., Everts-van der Wind, A., Bourque, G., Tesler, G., Auvil, L., . . . Lewin, H. A. (2005). Dynamics of mammalian chromosome evolution inferred from multispecies comparative maps. Science, 309(5734), 613-617. doi: 10.1126/science.1111387
Nakatani, Y., Takeda, H., Kohara, Y., & Morishita, S. (2007). Reconstruction of the vertebrate ancestral genome reveals dynamic genome reorganization in early vertebrates. Genome Res, 17(9), 1254-1265. doi: gr.6316407 [pii]
10.1101/gr.6316407
NordenskiÖLd, H. (1953). A GENETICAL STUDY IN THE MODE OF SEGREGATION IN HEXAPLOID PHLEUM PRATENSE. Hereditas, 39(3-4), 469-488. doi: 10.1111/j.1601-5223.1953.tb03431.x
Noutsos, C., Richly, E., & Leister, D. (2005). Generation and evolutionary fate of insertions of organelle DNA in the nuclear genomes of flowering plants. Genome Res, 15(5), 616-628. doi: 10.1101/gr.3788705

!
!
124
Nyffeler, R., Bayer, C., Alverson, W. S., Yen, A., Whitlock, B. A., Chase, M. W., & Baum, D. A. (2005). Phylogenetic analysis of the Malvadendrina clade (Malvaceae s.l.) based on plastid DNA sequences. Organisms Diversity & Evolution, 5(2), 109-123. doi: http://dx.doi.org/10.1016/j.ode.2004.08.001
Ohno, S. (1970). Evolution by gene duplication. Berlin: Springer.
Otto, S. P. (2007). The evolutionary consequences of polyploidy. Cell, 131(3), 452-462. doi: 10.1016/j.cell.2007.10.022
Otto, S. P., & Whitton, J. (2000). Polyploid incidence and evolution. Annu Rev Genet, 34, 401-437. doi: 10.1146/annurev.genet.34.1.401
Pal, C., & Hurst, L. D. (2003). Evidence for co-evolution of gene order and recombination rate. Nat Genet, 33(3), 392-395. doi: 10.1038/ng1111
Papp, B., Pal, C., & Hurst, L. D. (2003). Dosage sensitivity and the evolution of gene families in yeast. Nature, 424(6945), 194-197. doi: 10.1038/nature01771
Paterson, A. H. (2014). Advances in Botanical Research (A. H. Paterson Ed. 1 ed. Vol. 69): Elsevier.
Paterson, A. H., Bowers, J. E., Bruggmann, R., Dubchak, I., Grimwood, J., Gundlach, H., . . . Rokhsar, D. S. (2009). The Sorghum bicolor genome and the diversification of grasses. Nature, 457(7229), 551-556. doi: 10.1038/nature07723
Paterson, A. H., Bowers, J. E., Burow, M. D., Draye, X., Elsik, C. G., Jiang, C. X., . . . Wright, R. J. (2000). Comparative genomics of plant chromosomes. Plant Cell, 12(9), 1523-1540.
Paterson, A. H., Bowers, J. E., & Chapman, B. A. (2004). Ancient polyploidization predating divergence of the cereals, and its consequences for comparative genomics. Proc Natl Acad Sci U S A, 101(26), 9903-9908. doi: 10.1073/pnas.0307901101
Paterson, A. H., Bowers, J. E., Chapman, B. A., Peterson, D. G., Rong, J., & Wicker, T. M. (2004). Comparative genome analysis of monocots and dicots, toward characterization of angiosperm diversity. Curr Opin Biotechnol, 15(2), 120-125. doi: 10.1016/j.copbio.2004.03.001
Paterson, A. H., Chapman, B. A., Kissinger, J. C., Bowers, J. E., Feltus, F. A., & Estill, J. C. (2006). Many gene and domain families have convergent fates following independent whole-genome duplication events in Arabidopsis, Oryza, Saccharomyces and Tetraodon. Trends Genet, 22(11), 597-602. doi: 10.1016/j.tig.2006.09.003

!
!
125
Paterson, A. H., Freeling, M., Tang, H., & Wang, X. (2010). Insights from the comparison of plant genome sequences. Annu Rev Plant Biol, 61, 349-372. doi: 10.1146/annurev-arplant-042809-112235
Paterson, A. H., Lan, T. H., Reischmann, K. P., Chang, C., Lin, Y. R., Liu, S. C., . . . Wendel, J. F. (1996). Toward a unified genetic map of higher plants, transcending the monocot-dicot divergence. Nature Genetics, 14(4), 380-382. doi: 10.1038/ng1296-380
Paterson, A. H., Wendel, J. F., Gundlach, H., Guo, H., Jenkins, J., Jin, D., . . . Schmutz, J. (2012). Repeated polyploidization of Gossypium genomes and the evolution of spinnable cotton fibres. Nature, 492(7429), 423-427. doi: 10.1038/nature11798
Pecinka, A., Fang, W., Rehmsmeier, M., Levy, A. A., & Mittelsten Scheid, O. (2011). Polyploidization increases meiotic recombination frequency in Arabidopsis. BMC Biol, 9, 24. doi: 10.1186/1741-7007-9-24
Pevzner, P. A., Tang, H., & Tesler, G. (2004). De novo repeat classification and fragment assembly. Genome Res, 14(9), 1786-1796. doi: 10.1101/gr.2395204
Pfeil, B., Brubaker, C., Craven, L., & Crisp, M. (2002). Phylogeny of Hibiscus and the tribe Hibisceae (Malvaceae) using chloroplast DNA sequences of ndhF and the rpl16 intron. Systematic Botany, 333-350.
Pham, S. K., & Pevzner, P. A. (2010). DRIMM-Synteny: decomposing genomes into evolutionary conserved segments. Bioinformatics, 26(20), 2509-2516. doi: 10.1093/bioinformatics/btq465
Potato Genome Sequencing, C., Xu, X., Pan, S., Cheng, S., Zhang, B., Mu, D., . . . Visser, R. G. (2011). Genome sequence and analysis of the tuber crop potato. Nature, 475(7355), 189-195. doi: 10.1038/nature10158
Proost, S., Fostier, J., De Witte, D., Dhoedt, B., Demeester, P., Van de Peer, Y., & Vandepoele, K. (2012). i-ADHoRe 3.0--fast and sensitive detection of genomic homology in extremely large data sets. Nucleic Acids Res, 40(2), e11. doi: 10.1093/nar/gkr955
Proost, S., Van Bel, M., Sterck, L., Billiau, K., Van Parys, T., Van de Peer, Y., & Vandepoele, K. (2009). PLAZA: a comparative genomics resource to study gene and genome evolution in plants. Plant Cell, 21(12), 3718-3731. doi: 10.1105/tpc.109.071506
Putnam, N. H., Srivastava, M., Hellsten, U., Dirks, B., Chapman, J., Salamov, A., . . . Rokhsar, D. S. (2007). Sea anemone genome reveals ancestral eumetazoan gene repertoire and genomic organization. Science, 317(5834), 86-94. doi: 10.1126/science.1139158

!
!
126
Ramsey, J., & Schemske, D. W. (1998). PATHWAYS, MECHANISMS, AND RATES OF POLYPLOID FORMATION IN FLOWERING PLANTS. Annual Review of Ecology and Systematics, 29(1), 467-501. doi: doi:10.1146/annurev.ecolsys.29.1.467
Raphael, B., Zhi, D., Tang, H., & Pevzner, P. (2004). A novel method for multiple alignment of sequences with repeated and shuffled elements. Genome Res, 14(11), 2336-2346. doi: 10.1101/gr.2657504
Rhoades, M. (1951). Duplicate genes in maize. American Naturalist, 105-110.
Richardson, A. O., & Palmer, J. D. (2007). Horizontal gene transfer in plants. J Exp Bot, 58(1), 1-9. doi: 10.1093/jxb/erl148
Richly, E., & Leister, D. (2004). NUPTs in sequenced eukaryotes and their genomic organization in relation to NUMTs. Mol Biol Evol, 21(10), 1972-1980. doi: 10.1093/molbev/msh210
Rieseberg, L. H., Raymond, O., Rosenthal, D. M., Lai, Z., Livingstone, K., Nakazato, T., . . . Lexer, C. (2003). Major ecological transitions in wild sunflowers facilitated by hybridization. Science, 301(5637), 1211-1216. doi: 10.1126/science.1086949
Rokas, A., & Holland, P. W. (2000). Rare genomic changes as a tool for phylogenetics. Trends Ecol Evol, 15(11), 454-459. doi: S0169534700019674 [pii]
Salse, J., Abrouk, M., Bolot, S., Guilhot, N., Courcelle, E., Faraut, T., . . . Feuillet, C. (2009). Reconstruction of monocotelydoneous proto-chromosomes reveals faster evolution in plants than in animals. Proc Natl Acad Sci U S A, 106(35), 14908-14913. doi: 10.1073/pnas.0902350106
Sanderson, M. J. (2003). r8s: inferring absolute rates of molecular evolution and divergence times in the absence of a molecular clock. Bioinformatics, 19(2), 301-302. doi: 10.1093/bioinformatics/19.2.301
Sanderson, M. J., & Doyle, J. A. (2001). Sources of error and confidence intervals in estimating the age of angiosperms from rbcL and 18S rDNA data. American Journal of Botany, 88(8), 1499-1516.
Sankoff, D., & Zheng, C. (2012). Fractionation, rearrangement and subgenome dominance. Bioinformatics, 28(18), i402-i408. doi: 10.1093/bioinformatics/bts392
Scannell, D. R., Byrne, K. P., Gordon, J. L., Wong, S., & Wolfe, K. H. (2006). Multiple rounds of speciation associated with reciprocal gene loss in polyploid yeasts. Nature, 440(7082), 341-345. doi: 10.1038/nature04562

!
!
127
Schlueter, J., Dixon, P., Granger, C., Grant, D., Clark, L., Doyle, J., & Shoemaker, R. (2004). Mining EST databases to resolve evolutionary events in major crop species. Genome / National Research Council Canada = Génome / Conseil national de recherches Canada, 47(5), 868-876. doi: 10.1139/g04-047
Schmutz, J., Cannon, S. B., Schlueter, J., Ma, J., Mitros, T., Nelson, W., . . . Jackson, S. A. (2010). Genome sequence of the palaeopolyploid soybean. Nature, 463(7278), 178-183. doi: 10.1038/nature08670
Schnable, J. C., Springer, N. M., & Freeling, M. (2011). Differentiation of the maize subgenomes by genome dominance and both ancient and ongoing gene loss. Proc Natl Acad Sci U S A, 108(10), 4069-4074. doi: 10.1073/pnas.1101368108
Schnable, P. S., Ware, D., Fulton, R. S., Stein, J. C., Wei, F., Pasternak, S., . . . Wilson, R. K. (2009). The B73 maize genome: complexity, diversity, and dynamics. Science, 326(5956), 1112-1115. doi: 10.1126/science.1178534
Schranz, M. E., Mohammadin, S., & Edger, P. P. (2012). Ancient whole genome duplications, novelty and diversification: the WGD Radiation Lag-Time Model. Curr Opin Plant Biol, 15(2), 147-153. doi: 10.1016/j.pbi.2012.03.011
Senchina, D. S., Alvarez, I., Cronn, R. C., Liu, B., Rong, J. K., Noyes, R. D., . . . Wendel, J. F. (2003). Rate variation among nuclear genes and the age of polyploidy in Gossypium. Molecular Biology and Evolution, 20(4), 633-643. doi: 10.1093/molbev/msg065
Shi, X., Wang, X., Li, Z., Zhu, Q., Tang, W., Ge, S., & Luo, J. (2006). Nucleotide substitution pattern in rice paralogues: implication for negative correlation between the synonymous substitution rate and codon usage bias. Gene, 376(2), 199-206. doi: 10.1016/j.gene.2006.03.003
Shoemaker, R. C., Polzin, K., Labate, J., Specht, J., Brummer, E. C., Olson, T., . . . Boerma, H. R. (1996). Genome duplication in soybean (Glycine subgenus soja). Genetics, 144(1), 329-338.
Simillion, C., Janssens, K., Sterck, L., & Van de Peer, Y. (2008). i-ADHoRe 2.0: an improved tool to detect degenerated genomic homology using genomic profiles. Bioinformatics, 24(1), 127-128. doi: btm449 [pii]
10.1093/bioinformatics/btm449
Simillion, C., Vandepoele, K., Van Montagu, M. C., Zabeau, M., & Van de Peer, Y. (2002). The hidden duplication past of Arabidopsis thaliana. Proc Natl Acad Sci U S A, 99(21), 13627-13632.

!
!
128
Singer, G. A., Lloyd, A. T., Huminiecki, L. B., & Wolfe, K. H. (2005). Clusters of co-expressed genes in mammalian genomes are conserved by natural selection. Mol Biol Evol, 22(3), 767-775. doi: 10.1093/molbev/msi062
Singh, R., Ong-Abdullah, M., Low, E. T., Manaf, M. A., Rosli, R., Nookiah, R., . . . Sambanthamurthi, R. (2013). Oil palm genome sequence reveals divergence of interfertile species in Old and New worlds. Nature. doi: 10.1038/nature12309
Smith, J. J., Kuraku, S., Holt, C., Sauka-Spengler, T., Jiang, N., Campbell, M. S., . . . Li, W. (2013). Sequencing of the sea lamprey (Petromyzon marinus) genome provides insights into vertebrate evolution. Nat Genet. doi: 10.1038/ng.2568
Smith, S. A., Beaulieu, J. M., & Donoghue, M. J. (2010). An uncorrelated relaxed-clock analysis suggests an earlier origin for flowering plants. Proc Natl Acad Sci U S A, 107(13), 5897-5902. doi: 10.1073/pnas.1001225107
Smith, S. A., & Donoghue, M. J. (2008). Rates of molecular evolution are linked to life history in flowering plants. Science, 322(5898), 86-89. doi: 10.1126/science.1163197
Soltis, D. E., Albert, V. A., Leebens-Mack, J., Bell, C. D., Paterson, A. H., Zheng, C., . . . Soltis, P. S. (2009). Polyploidy and angiosperm diversification. Am J Bot, 96(1), 336-348. doi: 10.3732/ajb.0800079
Soltis, D. E., Bell, C. D., Kim, S., & Soltis, P. S. (2008). Origin and early evolution of angiosperms. Ann N Y Acad Sci, 1133, 3-25. doi: 10.1196/annals.1438.005
Soltis, D. E., Buggs, R. J. A., Doyle, J. J., & Soltis, P. S. (2010). What we still don't know about polyploidy. Taxon, 59(5), 1387-1403.
Soltis, D. E., Smith, S. A., Cellinese, N., Wurdack, K. J., Tank, D. C., Brockington, S. F., . . . Soltis, P. S. (2011). Angiosperm phylogeny: 17 genes, 640 taxa. Am J Bot, 98(4), 704-730. doi: 10.3732/ajb.1000404
Soltis, D. E., & Soltis, P. S. (1999). Polyploidy: recurrent formation and genome evolution. Trends Ecol Evol, 14(9), 348-352.
Soltis, D. E., Soltis, P. S., Bennett, M. D., & Leitch, I. J. (2003). Evolution of genome size in the angiosperms. Am J Bot, 90(11), 1596-1603. doi: 10.3732/ajb.90.11.1596
Soltis, D. E., Soltis, P. S., Endress, P. K., & Chase, M. W. (2005). Phylogeny and Evolution of Angiosperms. Sunderland MA: Sinauer Associates.

!
!
129
Soltis, D. E., Soltis, P. S., & Tate, J. A. (2004). Advances in the study of polyploidy since plant speciation. New Phytologist, 161(1), 173-191.
Soltis, D. E., Visger, C. J., & Soltis, P. S. (2014). The polyploidy revolution then...and now: Stebbins revisited. Am J Bot, 101(7), 1057-1078. doi: 10.3732/ajb.1400178
Soltis, P. S., & Soltis, D. E. (2000). The role of genetic and genomic attributes in the success of polyploids. Proc Natl Acad Sci U S A, 97(13), 7051-7057.
Song, K., Lu, P., Tang, K., & Osborn, T. C. (1995). Rapid genome change in synthetic polyploids of Brassica and its implications for polyploid evolution. Proc Natl Acad Sci U S A, 92(17), 7719-7723.
Song, K. M., Suzuki, J. Y., Slocum, M. K., Williams, P. M., & Osborn, T. C. (1991). A linkage map ofBrassica rapa (syn.campestris) based on restriction fragment length polymorphism loci. Theor Appl Genet, 82(3), 296-304. doi: 10.1007/BF02190615
Stadler, L. J. (1929). Chromosome number and the mutation rate in Avena and Triticum. Proceedings of the National Academy of Sciences of the United States of America, 15(12), 876.
Stamatakis, A. (2006). RAxML-VI-HPC: maximum likelihood-based phylogenetic analyses with thousands of taxa and mixed models. Bioinformatics, 22(21), 2688-2690. doi: 10.1093/bioinformatics/btl446
Stebbins, G. L. (1950). Variation and Evolution in Plants: Columbia University Press.
Stebbins, G. L. (1966). Chromosomal variation and evolution. Science, 152(3728), 1463-1469. doi: 10.1126/science.152.3728.1463
Stebbins, G. L. (1971). Chromosomal evolution in higher plants. Chromosomal evolution in higher plants.
Stevens, P. F. (2012, July 2012). Angiosperm Phylogeny Website. Version 12. from http://www.mobot.org/MOBOT/research/APweb/
Stupar, R. M., Lilly, J. W., Town, C. D., Cheng, Z., Kaul, S., Buell, C. R., & Jiang, J. (2001). Complex mtDNA constitutes an approximate 620-kb insertion on Arabidopsis thaliana chromosome 2: implication of potential sequencing errors caused by large-unit repeats. Proc Natl Acad Sci U S A, 98(9), 5099-5103. doi: 10.1073/pnas.091110398

!
!
130
Sun, G., Dilcher, D. L., Wang, H., & Chen, Z. (2011). A eudicot from the Early Cretaceous of China. Nature, 471(7340), 625-628. doi: 10.1038/nature09811
Suyama, M., Torrents, D., & Bork, P. (2006). PAL2NAL: robust conversion of protein sequence alignments into the corresponding codon alignments. Nucleic Acids Res, 34(Web Server issue), W609-612. doi: 10.1093/nar/gkl315
Suzuki, R., & Shimodaira, H. (2006). Pvclust: an R package for assessing the uncertainty in hierarchical clustering. Bioinformatics, 22(12), 1540-1542. doi: 10.1093/bioinformatics/btl117
Talavera, G., & Castresana, J. (2007). Improvement of phylogenies after removing divergent and ambiguously aligned blocks from protein sequence alignments. Syst Biol, 56(4), 564-577. doi: 10.1080/10635150701472164
Tang, H., Bowers, J. E., Wang, X., Ming, R., Alam, M., & Paterson, A. H. (2008). Synteny and collinearity in plant genomes. Science, 320(5875), 486-488. doi: 10.1126/science.1153917
Tang, H., Bowers, J. E., Wang, X., & Paterson, A. H. (2010). Angiosperm genome comparisons reveal early polyploidy in the monocot lineage. Proc Natl Acad Sci U S A, 107(1), 472-477. doi: 10.1073/pnas.0908007107
Tang, H., Lyons, E., Pedersen, B., Schnable, J. C., Paterson, A. H., & Freeling, M. (2011). Screening synteny blocks in pairwise genome comparisons through integer programming. Bmc Bioinformatics, 12, 102. doi: 10.1186/1471-2105-12-102
Tang, H., Wang, X., Bowers, J. E., Ming, R., Alam, M., & Paterson, A. H. (2008). Unraveling ancient hexaploidy through multiply-aligned angiosperm gene maps. Genome Res, 18(12), 1944-1954. doi: 10.1101/gr.080978.108
Tang, H., Woodhouse, M. R., Cheng, F., Schnable, J. C., Pedersen, B. S., Conant, G., . . . Pires, J. C. (2012). Altered patterns of fractionation and exon deletions in Brassica rapa support a two-step model of paleohexaploidy. Genetics, 190(4), 1563-1574. doi: 10.1534/genetics.111.137349
Tatarinova, T., Elhaik, E., & Pellegrini, M. (2013). Cross-species analysis of genic GC3 content and DNA methylation patterns. Genome Biol Evol, 5(8), 1443-1456. doi: 10.1093/gbe/evt103
Tatarinova, T. V., Alexandrov, N. N., Bouck, J. B., & Feldmann, K. A. (2010). GC3 biology in corn, rice, sorghum and other grasses. BMC Genomics, 11, 308. doi: 10.1186/1471-2164-11-308
Tenaillon, M. I., Hollister, J. D., & Gaut, B. S. (2010). A triptych of the evolution of plant transposable elements. Trends Plant Sci, 15(8), 471-478. doi: 10.1016/j.tplants.2010.05.003

!
!
131
The Angiosperm Phylogeny Group. (2009). An update of the Angiosperm Phylogeny Group classification for the orders and families of flowering plants: APG III. Botanical Journal of the Linnean Society, 161(2), 105-121. doi: 10.1111/j.1095-8339.2009.00996.x
Thomas, B. C., Pedersen, B., & Freeling, M. (2006). Following tetraploidy in an Arabidopsis ancestor, genes were removed preferentially from one homeolog leaving clusters enriched in dose-sensitive genes. Genome Research, 16(7), 934-946.
Tomato Genome Consortium. (2012). The tomato genome sequence provides insights into fleshy fruit evolution. Nature, 485(7400), 635-641. doi: 10.1038/nature11119
Truco, M. J., Ashrafi, H., Kozik, A., van Leeuwen, H., Bowers, J., Reyes Chin Wo, S., . . . Michelmore, R. W. (2013). An Ultra High-Density, Transcript-Based, Genetic Map of Lettuce. G3 (Bethesda). doi: 10.1534/g3.112.004929
Tuskan, G. A., DiFazio, S., Jansson, S., Bohlmann, J., Grigoriev, I., Hellsten, U., . . . Rokhsar, D. (2006). The genome of black cottonwood, Populus trichocarpa (Torr. & Gray). Science, 313(5793), 1596-1604.
Van de Peer, Y. (2004). Computational approaches to unveiling ancient genome duplications. Nat Rev Genet, 5(10), 752-763. doi: 10.1038/nrg1449
Van de Peer, Y., Maere, S., & Meyer, A. (2009). The evolutionary significance of ancient genome duplications. Nat Rev Genet, 10(10), 725-732. doi: 10.1038/nrg2600
Vandepoele, K., Saeys, Y., Simillion, C., Raes, J., & Van de Peer, Y. (2002). The automatic detection of homologous regions (ADHoRe) and its application to microcolinearity between Arabidopsis and rice. Genome Research, 12(11), 1792-1801.
Vanneste, K., Baele, G., Maere, S., & Van de Peer, Y. (2014). Analysis of 41 plant genomes supports a wave of successful genome duplications in association with the Cretaceous-Paleogene boundary. Genome Research. doi: 10.1101/gr.168997.113
Vekemans, D., Proost, S., Vanneste, K., Coenen, H., Viaene, T., Ruelens, P., . . . Geuten, K. (2012). Gamma paleohexaploidy in the stem lineage of core eudicots: significance for MADS-box gene and species diversification. Mol Biol Evol, 29(12), 3793-3806. doi: 10.1093/molbev/mss183
Verde, I., Abbott, A. G., Scalabrin, S., Jung, S., Shu, S., Marroni, F., . . . Rokhsar, D. S. (2013). The high-quality draft genome of peach (Prunus persica) identifies unique patterns of genetic diversity, domestication and genome evolution. Nat Genet, 45(5), 487-494. doi: 10.1038/ng.2586

!
!
132
Vision, T. J., Brown, D. G., & Tanksley, S. D. (2000). The origins of genomic duplications in Arabidopsis. Science, 290(5499), 2114-2117.
Wada, M., Takahashi, H., Altaf-Ul-Amin, M., Nakamura, K., Hirai, M. Y., Ohta, D., & Kanaya, S. (2012). Prediction of operon-like gene clusters in the Arabidopsis thaliana genome based on co-expression analysis of neighboring genes. Gene, 503(1), 56-64. doi: 10.1016/j.gene.2012.04.043
Wang, H., Moore, M. J., Soltis, P. S., Bell, C. D., Brockington, S. F., Alexandre, R., . . . Soltis, D. E. (2009). Rosid radiation and the rapid rise of angiosperm-dominated forests. Proc Natl Acad Sci U S A, 106(10), 3853-3858. doi: 10.1073/pnas.0813376106
Wang, X., Shi, X., Li, Z., Zhu, Q., Kong, L., Tang, W., . . . Luo, J. (2006). Statistical inference of chromosomal homology based on gene colinearity and applications to Arabidopsis and rice. Bmc Bioinformatics, 7, 447.
Wang, X., Tang, H., & Paterson, A. H. (2011). Seventy million years of concerted evolution of a homoeologous chromosome pair, in parallel, in major Poaceae lineages. Plant Cell, 23(1), 27-37. doi: 10.1105/tpc.110.080622
Wang, X., Wang, H., Wang, J., Sun, R., Wu, J., Liu, S., . . . Zhang, Z. (2011). The genome of the mesopolyploid crop species Brassica rapa. Nat Genet, 43(10), 1035-1039. doi: 10.1038/ng.919
Wang, X. Y., Tang, H. B., Bowers, J. E., & Paterson, A. H. (2009). Comparative inference of illegitimate recombination between rice and sorghum duplicated genes produced by polyploidization. Genome Research, 19(6), 1026-1032. doi: 10.1101/gr.087288.108
Wang, Y., Tang, H., Debarry, J. D., Tan, X., Li, J., Wang, X., . . . Paterson, A. H. (2012). MCScanX: a toolkit for detection and evolutionary analysis of gene synteny and collinearity. Nucleic Acids Res, 40(7), e49. doi: 10.1093/nar/gkr1293
Wendel, J. F. (1989). New World Tetraploid Cottons Contain Old-World Cytoplasm. Proceedings of the National Academy of Sciences of the United States of America, 86(11), 4132-4136.
Wendel, J. F., & Cronn, R. C. (2003). Polyploidy and the evolutionary history of cotton. Advances in Agronomy, 78, 139-186.
Whitkus, R., Doebley, J., & Lee, M. (1992). Comparative genome mapping of Sorghum and maize. Genetics, 132(4), 1119-1130.
Wikstrom, N., Savolainen, V., & Chase, M. W. (2001). Evolution of the angiosperms: calibrating the family tree. Proc Biol Sci, 268(1482), 2211-2220. doi: 10.1098/rspb.2001.1782

!
!
133
Winge, O. (1917). The Chromosomes. Their numbers and general importance. Compte Rendu des Travaux du Laboratoire de Carlsberg Copenhague, 13(2), 131-275.
Wolfe, K. H. (2001). Yesterday's polyploids and the mystery of diploidization. Nat Rev Genet, 2(5), 333-341. doi: 10.1038/35072009
Wolfe, K. H., Gouy, M., Yang, Y. W., Sharp, P. M., & Li, W. H. (1989). Date of the monocot-dicot divergence estimated from chloroplast DNA sequence data. Proc Natl Acad Sci U S A, 86(16), 6201-6205.
Wolfe, K. H., Li, W. H., & Sharp, P. M. (1987). Rates of nucleotide substitution vary greatly among plant mitochondrial, chloroplast, and nuclear DNAs. Proc Natl Acad Sci U S A, 84(24), 9054-9058.
Wolfe, K. H., Sharp, P. M., & Li, W.-H. (1989). Rates of synonymous substitution in plant nuclear genes. Journal of Molecular Evolution, 29(3), 208-211. doi: 10.1007/bf02100204
Wolfe, K. H., & Shields, D. C. (1997). Molecular evidence for an ancient duplication of the entire yeast genome. Nature, 387(6634), 708-713.
Wood, T. E., Takebayashi, N., Barker, M. S., Mayrose, I., Greenspoon, P. B., & Rieseberg, L. H. (2009). The frequency of polyploid speciation in vascular plants. Proc Natl Acad Sci U S A, 106(33), 13875-13879. doi: 10.1073/pnas.0811575106
Wu, J., Wang, Z., Shi, Z., Zhang, S., Ming, R., Zhu, S., . . . Zhang, S. (2013). The genome of the pear (Pyrus bretschneideri Rehd.). Genome Res, 23(2), 396-408. doi: 10.1101/gr.144311.112
Xiong, Z., Gaeta, R. T., & Pires, J. C. (2011). Homoeologous shuffling and chromosome compensation maintain genome balance in resynthesized allopolyploid Brassica napus. Proc Natl Acad Sci U S A, 108(19), 7908-7913. doi: 10.1073/pnas.1014138108
Yang, Z. (2007). PAML 4: phylogenetic analysis by maximum likelihood. Mol Biol Evol, 24(8), 1586-1591. doi: 10.1093/molbev/msm088
Yoo, M. J., Szadkowski, E., & Wendel, J. F. (2013). Homoeolog expression bias and expression level dominance in allopolyploid cotton. Heredity (Edinb), 110(2), 171-180. doi: 10.1038/hdy.2012.94
Young, N. D., Debelle, F., Oldroyd, G. E., Geurts, R., Cannon, S. B., Udvardi, M. K., . . . Roe, B. A. (2011). The Medicago genome provides insight into the evolution of rhizobial symbioses. Nature, 480(7378), 520-524. doi: 10.1038/nature10625

!
!
134
Zhang, L., Vision, T. J., & Gaut, B. S. (2002). Patterns of nucleotide substitution among simultaneously duplicated gene pairs in Arabidopsis thaliana. Mol Biol Evol, 19(9), 1464-1473.
Zheng, C., Albert, V. A., Lyons, E., & Sankoff, D. (2012, 23-25 Feb. 2012). Ancient angiosperm hexaploidy meets ancestral eudicot gene order. Paper presented at the Computational Advances in Bio and Medical Sciences (ICCABS), 2012 IEEE 2nd International Conference on.
Zheng, C., Chen, E., Albert, V. A., Lyons, E., & Sankoff, D. (2013). Ancient eudicot hexaploidy meets ancestral eurosid gene order. BMC Genomics, 14 Suppl 7, S3. doi: 10.1186/1471-2164-14-S7-S3
Zuccolo, A., Bowers, J. E., Estill, J. C., Xiong, Z., Luo, M., Sebastian, A., . . . Leebens-Mack, J. (2011). A physical map for the Amborella trichopoda genome sheds light on the evolution of angiosperm genome structure. Genome Biol, 12(5), R48. doi: 10.1186/gb-2011-12-5-r48
Copyright © 2022 FDOKUMEN