
Destination Endgame | Redington
32
DESTINATION ENDGAME Questions you need to ask today, and frameworks for navigating the options
-
Upload
khangminh22 -
Category
Documents
-
view
0 -
download
0
Transcript of Destination Endgame | Redington

DESTINATION ENDGAMEQuestions you need to ask today, and frameworks for navigating the options

2 Redington | Destination Endgame
Your endgame team ..............................................2
Executive summary: The game has changed but the promises remain ................4
Context: 2017 and the £35bn transfer ........6
Landscape: The challenges of choice.........8
Section 1: So what’s changed? ........................10
Section 2: Self-sufficiency ................................14
Section 3: Covenant risk ....................................16
Section 4: Cashflow-driven investment ....20
Section 5: Buy-in/buy-out decision framework ...............................................24
Section 6: SWOSS and why it matters .......26
In conclusion ..............................................................30
References ..................................................................31
CONTENTS
This report aims to bring our deep thinking and practical research under one banner. Research that embraces the detail, but always keeps the context in mind. So you can sink your teeth into the finer points and also see the wood for the trees.
The key to success is not trying to forecast the future, but to offer practical and usable content. It was with these ideals in mind that this report was born.
OUR PROMISE TO YOURedington will operate within these criteria to ensure content is of the highest standard:
• Original research• Grounded in fact• Not predicting markets• Not extrapolating the past• Beginning by setting the context• Clear & logical• Actionable outcomes
IT’S NOT OUR OPINION THAT MATTERS. KEY TO THE SUCCESS OF DESTINATION ENDGAME IS DELIVERING RESEARCH THAT IS VALUABLE TO YOU.
Redington | Destination Endgame 3
KAREN HEAVEN MD Investment Consulting
Karen is a lead investment consultant, providing advice around objectives, asset allocation, and endgame planning to 6 DB clients with £10bn of assets and 40,000 members. Karen joined Redington in 2010, and has been working in finance and pensions for 16 years, including previous roles in pensions advisory and capital markets within investment banking. Karen specialises in advice to DB schemes with sole trustees and with complex overseas parent/sponsor relationships.
MOHAMED FAZAL Head of Client Solutions
Mo heads our client solutions team, providing expert technical and modelling input into strategy formation and advice to DB schemes. Mo’s job is to bring the benefits of Redington’s detailed and technical modelling tools to our clients to help them make better investment strategy decisions. Mo has particular expertise in modelling de-risking and buy-in/buy-out strategies. Mo previously worked on the Structured Products team at HSBC where he helped to design multi-asset derivative-based investment products for financial institutions.
ALEX WHITE Head of ALM Research
Alex leads our ALM Research team, devising new models, approaches and strategies for clients – for example, developing the tools needed to measure POPP. He has similarly been involved with significant developments such as cash balance schemes and CDC. He is also on the LDI team, and has expertise with the growing array of endgame solutions, such as CDI.
Alex is a Fellow of the Institute & Faculty of Actuaries, is on the LPI working group, and is a member of Redington’s Investment Strategy Committee.
YOUR ENDGAME TEAM

4 Redington | Destination Endgame
Better-than-expected funding level progress since late 2016 has brought forward the time-line over which these might be implemented.
At the same time, a number of high profile corporate failures have highlighted the need to act swiftly and make the right choices in the context of a corporate event.
All this has caused the issue of endgame planning to move to the top of the agenda for many trustee boards and investment committees during the first half of 2018.
We argue that trustees most need a roadmap to guide them through the various options and products available and a framework for making the key decisions, helping decision-makers adjust course as the environment changes. This paper introduces such a framework and shows how elements of it can be used to guide key endgame decisions.
Whilst there are a multitude of products available to trustees, we believe what trustees most need is quality advice grounded in deep research to guide their decisions.
At the highest level this means DB trustees should ask themselves three simple questions at this point:
� Does your scheme have a clear objective in place which can guide decision making?
2 Do you have a good grasp of the full range of endgame options, what they offer your scheme, and how far away they are?
3 Do you have a reliable method for selecting the right endgame option for your scheme?
If the answer to any of the above is “no” then please get in touch. We’d love to help.
EXECUTIVE SUMMARY
THE GAME HAS CHANGED, THE PROMISES REMAIN
A raft of regulatory, competitive and market developments have changed the game for the trustees and sponsors of defined benefit (DB) pension schemes, offering substantially more options for how these schemes approach the “endgame” of running off the scheme and delivering pension promises to members.
£m
Opening game
Current position of pension scheme (Illustrative)
Fully funded on a conservative basis
Middle game Endgame
Liabilities
Asset Value
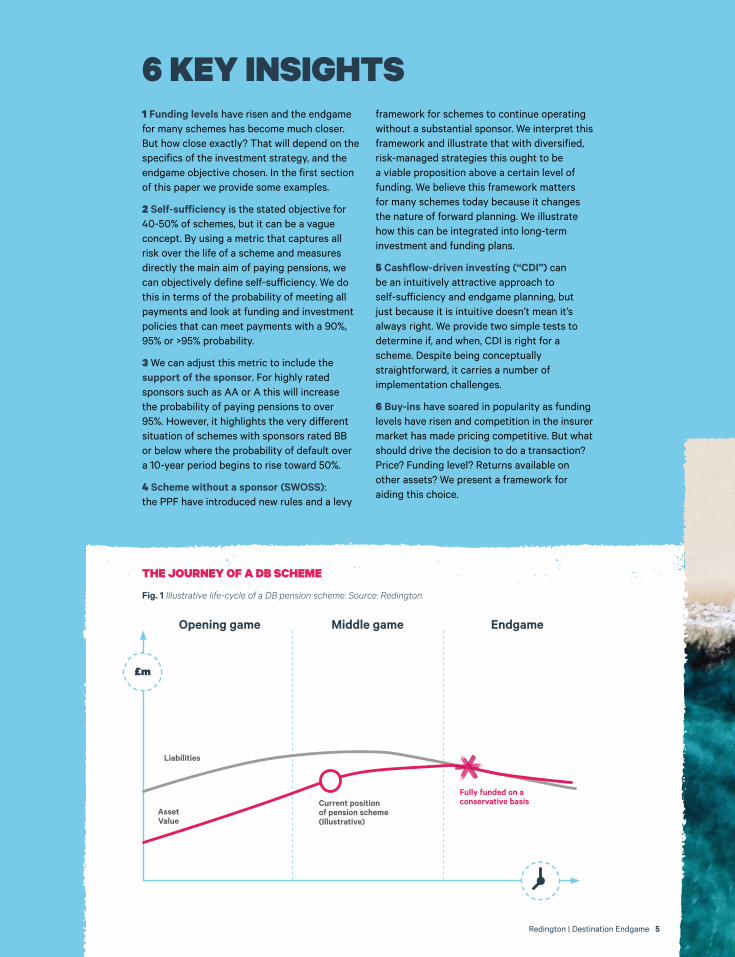
1 Funding levels have risen and the endgame for many schemes has become much closer. But how close exactly? That will depend on the specifics of the investment strategy, and the endgame objective chosen. In the first section of this paper we provide some examples.
2 Self-sufficiency is the stated objective for 40-50% of schemes, but it can be a vague concept. By using a metric that captures all risk over the life of a scheme and measures directly the main aim of paying pensions, we can objectively define self-sufficiency. We do this in terms of the probability of meeting all payments and look at funding and investment policies that can meet payments with a 90%, 95% or >95% probability.
3 We can adjust this metric to include the support of the sponsor. For highly rated sponsors such as AA or A this will increase the probability of paying pensions to over 95%. However, it highlights the very different situation of schemes with sponsors rated BB or below where the probability of default over a 10-year period begins to rise toward 50%.
4 Scheme without a sponsor (SWOSS): the PPF have introduced new rules and a levy
framework for schemes to continue operating without a substantial sponsor. We interpret this framework and illustrate that with diversified, risk-managed strategies this ought to be a viable proposition above a certain level of funding. We believe this framework matters for many schemes today because it changes the nature of forward planning. We illustrate how this can be integrated into long-term investment and funding plans.
5 Cashflow-driven investing (“CDI”) can be an intuitively attractive approach to self-sufficiency and endgame planning, but just because it is intuitive doesn’t mean it’s always right. We provide two simple tests to determine if, and when, CDI is right for a scheme. Despite being conceptually straightforward, it carries a number of implementation challenges.
6 Buy-ins have soared in popularity as funding levels have risen and competition in the insurer market has made pricing competitive. But what should drive the decision to do a transaction? Price? Funding level? Returns available on other assets? We present a framework for aiding this choice.
6 KEY INSIGHTS
THE JOURNEY OF A DB SCHEME
Fig. 1 Illustrative life-cycle of a DB pension scheme. Source: Redington.
Redington | Destination Endgame 5

Over the same period of time there have been a large number of other competitive, regulatory and structural developments which have all had an effect on the way DB pensions schemes operate and the way they approach the endgame – see time-line opposite.
The most significant among these are:
1 Freedom and Choice regulation leading to more transfers out of schemes (£35bn in 2017).
2 More providers of bulk annuity buy-in and buy-out products entering the market.
3 Alternative business models emerging from new consolidator vehicles that potentially offer more alternatives for trustees.
4 Changing regulation that allows DB schemes to continue to operate without a substantial sponsor (in certain circumstances), resulting in several high-profile cases.
5 Increasing availability of cashflow-driven investing (CDI) solutions offered by asset managers.
Given all these developments we believe the time is right for trustees and sponsors to put some serious thought into their endgame strategy, and how ultimately they can best fulfil the scheme’s purpose of delivering pension payments to members.
40% of our DB clients had endgame planning on their trustee or investment committee agenda in Q2 2018.
THE TIME IS RIGHT FOR TRUSTEES AND SPONSORS TO PUT SOME SERIOUS THOUGHT INTO THEIR ENDGAME STRATEGY
CONTEXT
IMPROVED FUNDING, IT’S NOT THE WHOLE STORY
6 Redington | Destination Endgame
Over the last two years funding levels for DB schemes have improved due to returns on growth assets, slightly higher gilt yields and changes to mortality tables. This is most easily seen in the PPF 7800 index data, which improved from an average funding level of 77.5% in August 2016 to 94.5% in May 2018.

2015 2016
2017
2018
2019
2014
April: 2014 BudgetFreedom and Choice announced
June:The Pension SuperFund announces first deal in progress
Autumn:DWP consolidation regulatory regime
April:Freedom and Choice comes into force
March: Consultation on British Steel Pension Scheme launched
January:DB Green Paper launched: Security and Sustainability
March:• IFoA issue 2017 update
to longevity models• DWP White Paper:
Protecting Defined Benefit Schemes
March:IFoA issue 2016 update to longevity models
April:PPF scheme without a sponsor regime comes into force
February:PPF launch consultation on scheme without a sponsor
August:BHS collapses leaving c£500m pension deficit
May:M&S pension scheme announces £1.4bn buy-ins with Aviva and Phoenix
January:• S&P 500
Index hits new high of 2,800
• Carillion files for administration. Members likely to transfer to PPF
June:EU Referendum
August:• 20-year gilt
rates hit low of 1.1%
• BoE cuts base rate to 0.25%
November:Scottish Widows enters bulk annuity market
Transfers out of schemes hit £35bn • Bulk annuity market hits £12.3bn
September:BA scheme announces record £4.4bn buy-in with L&G
Redington | Destination Endgame 7
8 Redington | Destination Endgame
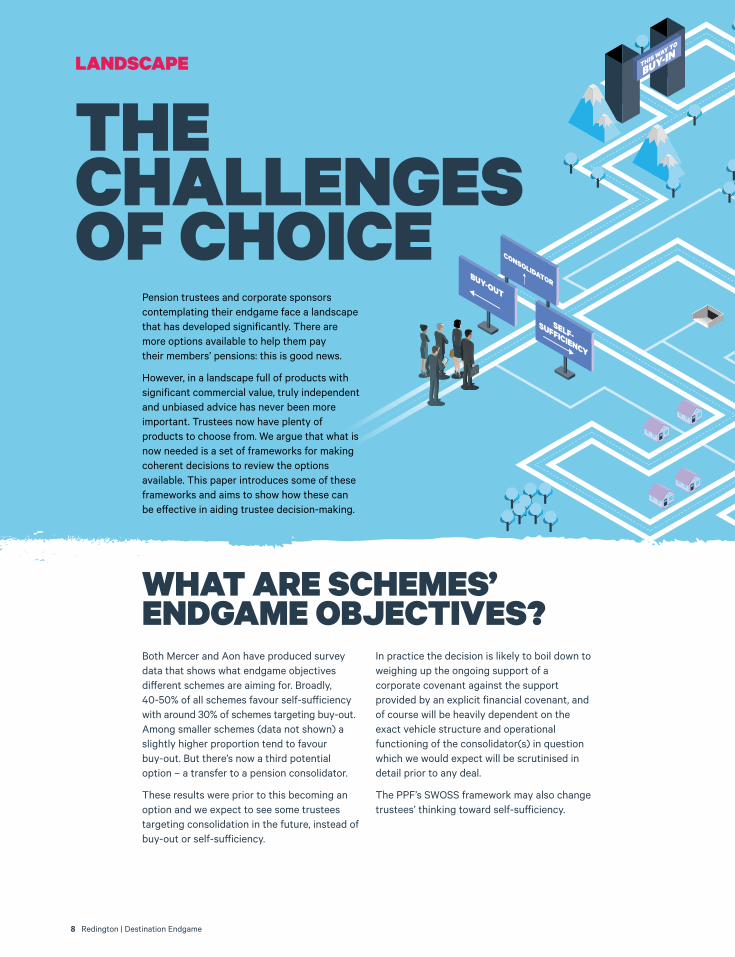
Pension trustees and corporate sponsors contemplating their endgame face a landscape that has developed significantly. There are more options available to help them pay their members’ pensions: this is good news.
However, in a landscape full of products with significant commercial value, truly independent and unbiased advice has never been more important. Trustees now have plenty of products to choose from. We argue that what is now needed is a set of frameworks for making coherent decisions to review the options available. This paper introduces some of these frameworks and aims to show how these can be effective in aiding trustee decision-making.
LANDSCAPE
THE CHALLENGES OF CHOICE
Both Mercer and Aon have produced survey data that shows what endgame objectives different schemes are aiming for. Broadly, 40-50% of all schemes favour self-sufficiency with around 30% of schemes targeting buy-out. Among smaller schemes (data not shown) a slightly higher proportion tend to favour buy-out. But there’s now a third potential option – a transfer to a pension consolidator.
These results were prior to this becoming an option and we expect to see some trustees targeting consolidation in the future, instead of buy-out or self-sufficiency.
In practice the decision is likely to boil down to weighing up the ongoing support of a corporate covenant against the support provided by an explicit financial covenant, and of course will be heavily dependent on the exact vehicle structure and operational functioning of the consolidator(s) in question which we would expect will be scrutinised in detail prior to any deal.
The PPF’s SWOSS framework may also change trustees’ thinking toward self-sufficiency.
WHAT ARE SCHEMES’ ENDGAME OBJECTIVES?

27% Buy-out
49% Self-sufficiency
16% Low risk
6% None2% Other
Aon 2015
27% Buy-out
52% Self-sufficiency
11% Low risk
8% None2% Other
Aon 2017 Mercer 2018
38% Technical provisions
38% Self-sufficiency
24% Buy-out
Redington | Destination Endgame 9
LANDSCAPE
THE CHALLENGES OF CHOICE
ENDGAME OBJECTIVES OF DB PENSION SCHEMES
Fig. 2 Selected survey data on DB pension scheme objective. Source: Aon Pension Risk Report 2015 & 2017, Mercer European Asset Allocation Survey 2018. Calculations: Redington.

60%
80%
70%
90%
100%
M16
J16
S16
N16
J17
M17
M17
J17
S17
N17
J18
M18
M18
J16
A16
O16
D16
F17
A17
J17
A17
O17
D17
F18
A18
J18
Fund
ing Le
vel
10 Redington | Destination Endgame
Overall funding levels have on average risen over the last two years, since the low point of late 2016, as shown in figure 3.
SECTION 1:
SO WHAT’S CHANGED?
BUT THE AGGREGATE NUMBERS ONLY TELL HALF THE STORY: THERE ARE BIG DIFFERENCES BETWEEN SCHEMES
THE IMPROVEMENT IN DB FUNDING SINCE 2016
Fig. 3 Aggregate DB pensions funding levels. Source: Professional Pensions, Mercer, Skyval, JLT, the PPF.
PPF 7800 uses s179 basis for all schemes; Skyval uses a gilts-flat measure for all schemes; JLT uses IAS 19 for all schemes; Mercer uses accounting figures for FTSE 350 schemes.

Redington | Destination Endgame 11
Below we track the journey of three illustrative schemes, their funding position and future prospects, over the last two years. For simplification they all start at the same gilts funding level of 70% in September 2016, and assume no sponsor contributions. Their asset allocations are quite different as described below. All have seen gains in funding and reductions in future returns needed.
ILLUSTRATIVE IMPROVEMENTS TO FUNDING SINCE 2016
Fig. 4 The evolution of key pension fund metrics for the three example schemes since 2016. Source: Redington long-term VaR model. Source: Redington.
Gilts funding
Future returns needed (%pa)� POPP2
Sept 2016 June 2018 Sept 2016 June 2018 Sept 2016 June 2018
TRADITIONALIST 70% 79% 1.45% 1.00% 52% 61%
SIMPLIFIER 70% 79% 1.45% 0.99% 58% 75%
DIVERSIFIER 70% 84% 1.45% 0.74% 75% 99%
�Future returns are in excess of gilts, over the future whole life of the scheme2 POPP measures the probability of meeting all future benefit payments with the assets held today, ignoring future contributions from the sponsor and ignoring the possibility of unrelated sponsor default
Future investment returns needed for our example schemes fell by between a third and a half. The probability of paying all pensions for our example schemes has risen by 10-20%.
TRADITIONALIST
A scheme that splits its allocation between equities and bonds.
SIMPLIFIER
A scheme that has hedged 60% of its liability risks using LDI and invested growth assets in Diversified Growth Funds (DGFs).
DIVERSIFIER
A scheme that has fully hedged its liability risks and invested growth assets in a range of strategies, including multi-asset credit, diversified risk premium and illiquid credit.1 2 3
We can see the funding levels of the schemes have improved by 9-14%, meaning that the future returns they need (in excess of gilts) to become fully funded on a conservative basis have fallen by between a third and a half. The probability of meeting all future payments with the assets they have has also increased meaningfully in all cases, by around ten or more percentage points. Given the gains in funding level, for the traditionalist scheme in particular the POPP could be improved further by implementing asset allocation changes in response to the improved position.
12 Redington | Destination Endgame
SECTION 1: SO WHAT’S CHANGED?
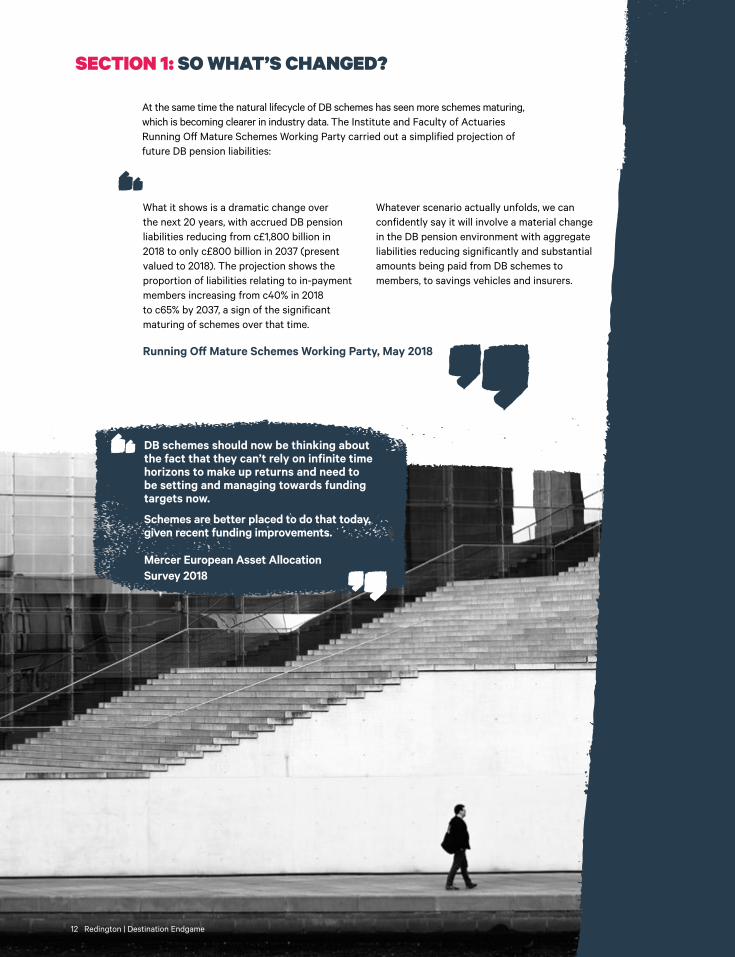
What it shows is a dramatic change over the next 20 years, with accrued DB pension liabilities reducing from c£1,800 billion in 2018 to only c£800 billion in 2037 (present valued to 2018). The projection shows the proportion of liabilities relating to in-payment members increasing from c40% in 2018 to c65% by 2037, a sign of the significant maturing of schemes over that time.
Whatever scenario actually unfolds, we can confidently say it will involve a material change in the DB pension environment with aggregate liabilities reducing significantly and substantial amounts being paid from DB schemes to members, to savings vehicles and insurers.
At the same time the natural lifecycle of DB schemes has seen more schemes maturing, which is becoming clearer in industry data. The Institute and Faculty of Actuaries Running Off Mature Schemes Working Party carried out a simplified projection of future DB pension liabilities:
Running Off Mature Schemes Working Party, May 2018
DB schemes should now be thinking about the fact that they can’t rely on infinite time horizons to make up returns and need to be setting and managing towards funding targets now.
Schemes are better placed to do that today, given recent funding improvements.
Mercer European Asset Allocation Survey 2018

Redington | Destination Endgame 13
Source: Mercer 2018 European Asset Allocation Report.Source: Mercer 2018 European Asset Allocation Report.
12%
15+ yrs
5%
11-15 yrs
34%
6-10 yrs
49%
0-5 yrs
EXPECTED TIME: CASHFLOW-POSTIVE TO CASHFLOW-NEGATIVE
56%
% PLANS THAT ARE CASHFLOW-NEGATIVE
None set
11%9%
15+ yrs
21%
11-15 yrs
24%
0-5 yrs
34%
6-10 yrs
TIME FRAME FOR DE-RISKING DB SCHEMES Mercer find that around 56% of DB schemes today are cashflow negative (with benefit expenses exceeding the contributions they receive from the sponsor). Additionally, Mercer find that a large proportion of schemes that are cashflow positive today are projected to mature and become cashflow negative in the next five years.
Of course, by itself becoming cashflow negative is not necessarily a bad thing. Indeed, it is entirely expected through time as DB schemes mature and paying out just slightly more than is received in contributions does not materially change things. Our previous research[8] suggests that when schemes become cashflow negative to the tune of 5-8% of assets each year, this can begin to affect the scheme’s risk position. Becoming cashflow negative can be a useful advance indicator of the structural maturing of a DB scheme, and a good time to review endgame objectives and plan ahead.
Mercer find that the timeframes being targeted for de-risking strategies have narrowed. The proportion of schemes with a de-risking target of less than 5 years has almost doubled from 13% to 24% since last year’s survey. With the majority (58%) of schemes targeting de-risking within 10 years.
The maturing of UK DB plans has led to a further reduction in equity exposures (from 29% to 25%, over the last year), a gradual increase in liability hedge ratios, greater use of alternatives and an increasingly urgent search for income-generative assets.
FINDINGS FROM THE MERCER 2018 EUROPEAN ASSET ALLOCATION REPORT:
ENDGAME LOOMING FOR UK DB PLANS

14 Redington | Destination Endgame
Self-sufficiency is the objective for some 40-50% of schemes. But it can be somewhat of a vague concept, often defined both in terms of funding and investment policies.
In practice there is a range of funding bases that are used to define self-sufficiency, of which gilts +0.5% is the most common. Gilts +0.25% is also a popular choice.
SECTION 2: SELF-SUFFICIENCY
NAVIGATING YOUR OWN PATH
New work from several consulting firms and the PLSA DB Taskforce has pointed toward the benefit of using a risk metric that can bring together funding, investment and covenant
considerations and quantify risk over the whole life of the scheme rather than just over a short period like a year.2, 3, 10
DISTRIBUTION OF SELF-SUFFICIENCY DISCOUNT RATES AMONG DB SCHEMES
Fig. 6 Source: Mercer 2018 European Asset Allocation Report.
Gilts
15%
Gilts +0.50%
41%
Gilts +0% to 0.25%
25%
Gilts +0.51% to 1%
7%
Gilts +0.26% to 0.49%
11%
Gilts+ >1%
2%

Redington | Destination Endgame 15
In our own report “Meeting Member Promises” (June 2017) we introduced POPP: the Probability of Paying all Pensions and showed how this was influenced by funding and investment policies.
POPP: PROBABILITY OF PAYING ALL PENSIONS
Fig. 7 Probability of Paying Pensions for a range of funding and investment policies. Source: Redington.
Funding level (gilt discount rate) 65% 70% 75% 80% 85% 90%
Asset Allocation
Liability matching portfolio 50% 50% 50% 50% 50% 50%
Liquid credit 0% 5% 33% 38% 43% 45%
Equity 50% 45% 18% 13% 8% 5%
POPP (%) 52% 62% 83% >95% >95% >95%
Expected return over gilts (%p.a.) 1.7% 1.6% 1.3% 1.3% 1.2% 1.2%
1 year value-at-risk for a £1bn scheme (£m) £69m £62m £45m £38m £32m £28m
By combining investment, funding and covenant into a single metric such as the Probability of Paying Pensions we can make progress on what self-sufficiency ought to look like.
We might choose to define it as an investment, funding and covenant policy that delivers a greater than 95% chance of paying all pensions without further contributions. This can also reflect any explicit security the pension scheme has over sponsor assets such as a Scottish Limited Partnership or Escrow.
By setting a target POPP, the scheme can work back to corresponding funding and investment policies to deliver this, and set a framework to generate triggers for actions which answers questions like:
1 Should we take more risk now to aim for superior funding on a more conservative basis, or reduce risk today on a slightly less conservative basis?
2 How should we adjust our investment and funding policies if there’s a deterioration in the sponsor covenant?
A METRIC LIKE POPP CAN HELP YOU PLAN FOR THE ENDGAME AND DEFINE WHAT SELF-SUFFICIENCY MEANS

HOW CORPORATE DEFAULT PROBABILITY INCREASES WITH TIME AND CREDIT RATING
Fig. 8 The probability of company default through time by rating band according to Moody’s historical data. Source: Moody’s.
70%
60%
50%
40%
30%
20%
10%
01 02 0603 0704 08 0905 1510 11 1612 1713 1814 19 20Time in years from today
Cum
ulativ
e defa
ult pr
obab
ility
AA A BBB BB B
16 Redington | Destination Endgame
Covenant risk can be very complex and idiosyncratic. Conversations around covenant risk with company stakeholders can also, understandably, be somewhat charged. It can be hard to integrate the advice provided on covenant with investment and funding policies, and to know how to react.
SECTION 3: COVENANT RISK
FACE UP TO THE ELEPHANT IN THE ROOM
We suggest trustees break down the process of integrating the different advice received, and planning strategy into the following two steps:
1 Integrating the advice on covenant with investment and funding policies – understanding where you are
We discussed in section 2 – Self-sufficiency – the use of metrics that capture all risk over the life of a scheme help to set investment and funding policies for the endgame (e.g. POPP). These same metrics can be adapted to incorporate sponsor considerations. The most helpful input from a covenant perspective is a long-term estimate of the probability of
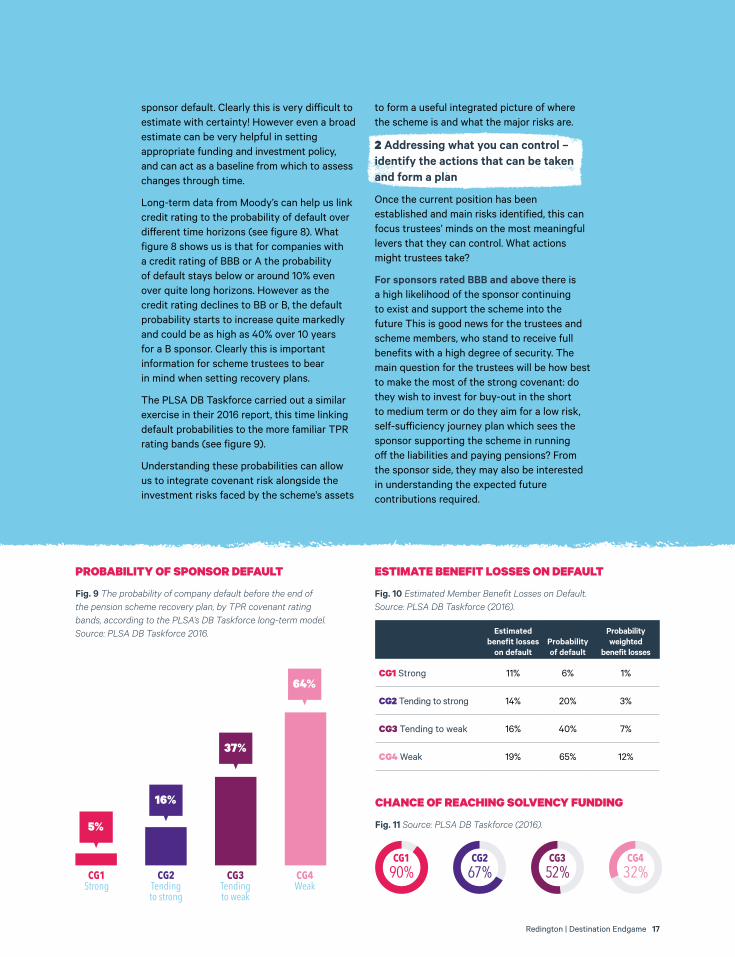
PROBABILITY OF SPONSOR DEFAULT
Fig. 9 The probability of company default before the end of the pension scheme recovery plan, by TPR covenant rating bands, according to the PLSA’s DB Taskforce long-term model. Source: PLSA DB Taskforce 2016.
ESTIMATE BENEFIT LOSSES ON DEFAULT
Fig. 10 Estimated Member Benefit Losses on Default. Source: PLSA DB Taskforce (2016).
CHANCE OF REACHING SOLVENCY FUNDING
Fig. 11 Source: PLSA DB Taskforce (2016).
CG190%
CG267%
CG352%
CG432% CG1
Strong
5%
CG2 Tending to strong
16%
CG3 Tending to weak
37%
CG4 Weak
64%
Estimated benefit losses
on defaultProbability of default
Probability weighted
benefit losses
CG1 Strong 11% 6% 1%
CG2 Tending to strong 14% 20% 3%
CG3 Tending to weak 16% 40% 7%
CG4 Weak 19% 65% 12%
Redington | Destination Endgame 17
sponsor default. Clearly this is very difficult to estimate with certainty! However even a broad estimate can be very helpful in setting appropriate funding and investment policy, and can act as a baseline from which to assess changes through time.
Long-term data from Moody’s can help us link credit rating to the probability of default over different time horizons (see figure 8). What figure 8 shows us is that for companies with a credit rating of BBB or A the probability of default stays below or around 10% even over quite long horizons. However as the credit rating declines to BB or B, the default probability starts to increase quite markedly and could be as high as 40% over 10 years for a B sponsor. Clearly this is important information for scheme trustees to bear in mind when setting recovery plans.
The PLSA DB Taskforce carried out a similar exercise in their 2016 report, this time linking default probabilities to the more familiar TPR rating bands (see figure 9).
Understanding these probabilities can allow us to integrate covenant risk alongside the investment risks faced by the scheme’s assets
to form a useful integrated picture of where the scheme is and what the major risks are.
2 Addressing what you can control – identify the actions that can be taken and form a plan
Once the current position has been established and main risks identified, this can focus trustees’ minds on the most meaningful levers that they can control. What actions might trustees take?
For sponsors rated BBB and above there is a high likelihood of the sponsor continuing to exist and support the scheme into the future This is good news for the trustees and scheme members, who stand to receive full benefits with a high degree of security. The main question for the trustees will be how best to make the most of the strong covenant: do they wish to invest for buy-out in the short to medium term or do they aim for a low risk, self-sufficiency journey plan which sees the sponsor supporting the scheme in running off the liabilities and paying pensions? From the sponsor side, they may also be interested in understanding the expected future contributions required.

18 Redington | Destination Endgame
FOR SPONSORS WITH A BB CREDIT RATING, THE PROBABILITY OF DEFAULT STARTS TO APPROACH 20% OVER A 10 YEAR HORIZON
A DOWNGRADE TO B INCREASES THE DEFAULT PROBABILITY OVER 10 YEARS TO 40%

1. CONTRIBUTION– Ask for higher sponsor contributions– Explore asset-backed contributions
2. TIME HORIZONAdjust flightplan length – achieve endgame over shorter or longer period
3. INVESTMENT RETURN (AND RISK)
– Adjust target investment returns (higher/lower)
– Change endgame target – e.g. from self-sufficiency to buy-out
1
23
Redington | Destination Endgame 19
THE LEVERS TRUSTEES CAN CONTROL
Fig. 11 Covenant risk itself will rarely be something trustees can control directly, but they do have a range of levers they can use to react to changes in covenant such as:
For sponsors in the BB-B range (or CG3 – CG4 category) the default probability starts to become quite material after 10 years (see figures 8 and 9). This is important to bear in mind for schemes when setting the length of their recovery plan, assessing how much investment risk to take in the short-term, and what funding policy to aim for. A long-term model that integrates these components can be helpful in evaluating trade-offs: more risk in the short-term to aim for better funding or not? Is there merit in pursuing asset-backed funding approaches?
While trustees usually cannot directly control the covenant the scheme has, there are five levers that trustees can control in response to changes in covenant, these are illustrated below. A thorough integrated approach across funding, investment and covenant can help inform the trade-offs between these options, and asses which are most meaningful to member benefit security.

20 Redington | Destination Endgame
SECTION 4: CASHFLOW-DRIVEN INVESTING
IS MATCHING THE RIGHT CHOICE?
Cashflow-driven investing is an investment approach which seeks to use mostly high-quality bonds (such as government and investment grade corporate bonds) to create a portfolio which meets the cash outflow needs of a defined benefit pension fund.
This is an intuitive approach with a theoretical backing that stretches back many years to the management of life company annuity books.9
If implemented correctly, this approach can give a scheme a high level of confidence and security, that it can meet future liabilities with a low level of exposure to investment related risk and fluctuating security prices. Longevity may remain as a risk, but this could also be addressed separately with suitable derivatives.
In very simple terms, Cashflow-driven investing (CDI) is about making sure the scheme’s assets generate cashflows that match the the pension payments, each year, so that assets don’t need to be sold. It’s a way of avoiding a pension scheme becoming a forced seller. That’s a good thing.
And because it feels intuitively very sensible, it’s easy to assume that it’s the best answer. But it isn’t always.
CDI is simply one of the possible approaches to managing a self-sufficiency endgame for a DB pension fund. The distinguishing feature of a CDI approach is that the benefit cashflows are matched more precisely by the asset portfolio, than may be the case for other ‘self-sufficiency’ portfolios.
Setting your asset portfolio up so that the cashflows generated match the cashflows you expect to pay out, means that you expect to have the cash you need, when you need it to pay benefits. You are therefore less likely to have to sell any of your assets at an inopportune time (i.e. become a ‘forced seller’). However, it also means that you will not be investing in a particularly well diversified portfolio and will have a concentration of risk centred around a single asset class.
CDI IS ABOUT MAKING SURE THE SCHEME’S ASSETS GENERATE CASHFLOWS THAT MATCH THE THE PENSION PAYMENTS

Long dated illiquid credit
Investment Grade Corporate Bonds
Contributions
Gilts
Multi Class Credit
Opportunistic Illiquid Credit
Liability Cash flows
100%
120%
140%
80%
60%
40%
20%
0%31/12/96 31/12/08 31/12/17
Redington | Destination Endgame 21
BECAUSE CDI FEELS INTUITIVELY VERY SENSIBLE, IT’S EASY TO ASSUME THAT IT’S THE BEST ANSWER. BUT IT ISN’T ALWAYS.
The question is whether the benefits of removing this ‘forced seller’ risk outweigh the benefits that can be offered by other approaches to constructing a ‘self-sufficiency’ portfolio. We think that sometimes it will be worth accepting a bit more of a cashflow mismatch in order to achieve a better diversified and more rounded portfolio.
FUNDAMENTALS OF CDIIt is important that investment and funding policies work together to deliver the solution that gives the best overall chance of success. This is particularly the case for CDI strategies as the yield on high-quality bonds will vary through time. In particular a key choice for CDI strategies will be the split between gilts and credit (corporate bonds), and as corporate bond spreads over gilts vary through time, the amount of investment in credit required to hit a particular funding target can vary quite a lot.
The chart opposite shows the proportion of assets that needed to be invested in credit to hit a self-sufficiency funding target of gilts
+0.5% at different points in time. When credit spreads were very high this target could be met with as little as 20-30% in corporate bonds (and the rest in gilts), when credit spreads were tighter this would have required the entire portfolio to be invested in credit.
EXAMPLE CDI PORTFOLIO
Fig. 12 A typical cashflow-driven investing portfolio to match liability cashflows. Source: Redington.
ALLOCATION TO CREDIT CHANGES
Fig. 13 The proportion of a CDI portfolio needed to be invested in credit through time to hit a gilts +0.5% return requirement. Source: Redington.

22 Redington | Destination Endgame
It can also be difficult to source the assets you need to construct the matching cashflows – particularly those which are very long-dated and inflation-linked. Usually, most of the very long dated cashflows will need to be met with gilts (as shown in figure 12) as enough corporate bonds of sufficient maturity are not available. This will depend on the duration of the liabilities in question.
A CDI portfolio may well contain allocations to some lower-quality and higher-returning assets as well, but the primary driver of the composition will likely be the spread available on higher-quality investment grade corporate bonds which will be used to match a large part of the liabilities, depending on the duration. (see figure 14).
If you don’t link your funding and investment approach very carefully, and select a portfolio which reflects the returns you need to reach full funding, you could ‘lock’ yourself into
an unfavourable funding position. Recovering from that position may then require additional contributions from the employer or unwinding some of the CDI portfolio to free up assets so that you can generate the additional return needed.
Whether a CDI strategy can meet a scheme’s endgame objective, and is the most risk-efficient strategy to meet the objectives will depend on three things:
• The yield available on high-quality corporate bonds (usually expressed as the spread over government bond yields) and how this compares to expected returns on other assets.
• The return required by the scheme, which will be related to its funding level and funding policy.
• The overall time horizon of the scheme (the longer the time horizon, the more CDI assets will need to be invested in gilts, and the lower the return of the CDI portfolio).
SECTION 4: CASHFLOW-DRIVEN INVESTING
IMPLEMENTATION CHECKLIST FOR CDICDI sounds simple, but it isn’t. There are a number of implementation nuances to CDI that can be quite significant in practice:
1 Diversification. The long-dated investment grade bond universe in the UK has only c200 issuers and is skewed toward the utility and property sectors. Getting sufficient diversification into the portfolio will often involve including other markets (such as US long-dated credit) that have a much larger and more diverse pool of issuers.
2 Currency and derivatives. To make sure that the US dollar bonds generate known cashflows in sterling terms requires cross-currency swap hedging, which necessitates a derivative programme with sufficient collateral in place.
3 Inflation. Most long-dated bonds will not be inflation-linked, whereas a scheme’s liabilities will be. Inflation protection can be put in place using inflation swaps, but again this necessitates a derivative programme and a collateral pool with the ability to rebalance
if derivative positions incur losses through time. Given the nature of a CDI portfolio this needs to be set up with sufficient buffers so as not to necessitate forced selling.
4 Monitoring and managing. In theory, CDI should be “set and forget” but the considerations above, combined with the inevitable market moves that will occur over time, will result in the need to rebalance and trade the portfolio. This can also benefit the scheme by capturing new opportunities that appear. However, the metrics needed to define the management and parameters of these mandates are very different to a standard active or passive mandate.
It’s important for trustees to ensure that their advisers and chosen CDI managers are on top of these issues.

FRAMEWORK: IS CDI RIGHT FOR YOUR SCHEME?
Fig. 14 How the attractiveness of a CDI strategy varies with the prevailing credit spread, and the returns required by the scheme. Source: Redington.
Required returns in excess of gilts (% p.a.)
Credit Spread over gilts
0.10% 0.20% 0.30% 0.40% 0.50% 0.60% 0.70% 0.80% 0.90% 1.00% 1.10%
2.00%
1.80%
1.60%
1.40%
1.20%
1.00%
0.80%
0.60%
0.40%
Efficient Inefficient Inadequate
Redington | Destination Endgame 23
Figure 14 above illustrates a framework for how a scheme can decide whether a CDI strategy is sufficient to meet their returns (allowing for defaults), and more or less efficient than possible alternative portfolios. At high levels of credit spreads (toward the top of the chart), a CDI strategy will both provide sufficient return and be more risk efficient than alternative strategies (in this case a diversified portfolio with a modest Sharpe ratio of 0.2). As credit spreads fall we reach a cross-over point where it may provide enough return but may
be less efficient than possible alternatives. As they fall further we reach a second cross-over point where it will no longer provide enough return for all but the most well-funded of schemes. As at the time of writing (October 2018) with long-dated investment grade UK credit spreads at around 1.4%, we believe we are close to the first of these crossover points: CDI will provide sufficient returns for some schemes but is likely to be less risk-efficient than the alternatives.
TWO QUESTIONS FOR CDI:
DOES IT PROVIDE ENOUGH RETURN?
IS IT RISK-EFFICIENT COMPARED TO ALTERNATIVES?

24 Redington | Destination Endgame
SECTION 5: BUY-IN/BUY-OUT
WHEN IS IT RIGHT FOR THE SCHEME?
For around a quarter of schemes, the ultimate objective is to buy-out with an insurance company. A key question then is whether it makes most sense to wait until the scheme is fully funded and buy-out all in one go, or whether to phase a series of buy-ins over time. How do trustees go about deciding this? It may feel like you should buy-in as much as you can as quickly as you can – but that usually isn’t the best answer.
For example, executing too large a buy-in too early can lead to the following problems:
• Insufficient free assets to effectively manage other risks, such as interest rate and inflation on the residual liabilities.
• A required return on the residual assets that’s too high to be achieved in a diversified manner (e.g. forcing you to invest more in equities than is prudent).
• An inability to access attractive illiquid investment opportunities because the fund has used all its “illiquidity budget” on the buy-in.
SO HOW SHOULD YOU MAKE THIS IMPORTANT DECISION?We think the best way is to treat a buy-in as you would any other asset and to consider its impact on risk, return and liquidity.
Importantly, to do this you need to ensure the comparison is a fair one, which means you need to make sure that you’re allowing for longevity risk in a consistent way with all the other investment risks. All the tools exist for you to do this – longevity risk can be quantified in a model, just like investment risks. And the buy-in’s “investment yield” can
be derived in (broadly) the same way as a corporate bond’s – so we can model it in the same way as we would a bond.
Buy-ins do have a small amount of credit risk to the insurer inherent in them, so we suggest making a small 0.05% adjustment to the buy-in yield when comparing with other assets.
SO SHOULD YOU PULL THE TRIGGER? We think you should do so only if you can answer “yes” to the following questions.
1. Will the scheme still have sufficient free assets after the buy-in to fully hedge interest rate and inflation risks in respect of the residual liabilities?
2. Will the scheme retain sufficient liquid assets after the buy-in to be able to effectively manage all its cash needs over the long-term?
3. Will the buy-in allow you to target your required level of return with a lower level of risk than would be without it?
It’s important to note that question 3 isn’t about looking to see if the buy-in reduces risk compared to the current strategy – it’s about seeing if it’s the best possible action.

FRAMEWORK: IS A BUY-IN RIGHT FOR YOUR SCHEME?
Fig. 15 Required return over gilts (% p.a.) of residual assets post-buy-in, for a range of buy-in sizes and funding levels. Source: Redington.
Funding level on a gilts basis
Pensioner buy-in 70.0% 75.0% 80.0% 85.0% 90.0% 95.0% 100.0%
0% 4.5% 3.5% 2.7% 1.8% 1.1% 0.4% -0.2%
20% 5.3% 4.1% 3.1% 2.1% 1.3% 0.5% -0.2%
40% 6.5% 4.9% 3.7% 2.5% 1.5% 0.5% -0.3%
60% 8.2% 6.2% 4.6% 3.1% 1.8% 0.7% -0.3%
80% 11.3% 8.4% 5.9% 4.0% 2.3% 0.9% -0.4%
100% 18.4% 12.7% 8.7% 5.7% 3.3% 1.2% -0.5%
It’s clear from this analysis that this scheme shouldn’t be thinking about a buy-in at around a 70% funding level, but could easily buy-in all its pensioners before it gets to 100% funded.
Given the improvements in funding shown back in figure 3, this framework helps explain the record buy-in transaction volumes seen in 2017 and early 2018.
Redington | Destination Endgame 25
The comparison needs to be against a strategy that is risk-efficient and in line with the return target, subject to governance constraints. Simply comparing to the current strategy risks confusing the effects of other changes in asset allocation and the implementation of a buy-in.
It’s worth noting that the cheaper the buy-in is, the more likely it is that the answer to all three questions above will be yes, and the larger the buy-in the less likely it is.
So our framework can be used to answer two questions:
A Should we implement a buy-in; and
B If so, how large should it be?
For example, the chart below shows what the required return (in excess of liabilities) would be on the residual assets for different sized buy-ins at different gilts-flat funding levels, based on current buy-in pricing. The vertical axis shows the size of buy-in being considered, as a percentage of the scheme’s pensioners. The horizontal axis shows the funding level of the scheme. Broadly, we think the returns in blue would be achievable with a well-diversified portfolio, whilst still retaining sufficient assets to hedge residual interest rate and inflation risks.
WE THINK THE BEST WAY IS TO TREAT A BUY-IN AS YOU WOULD ANY OTHER ASSET AND TO CONSIDER ITS IMPACT ON RISK, RETURN AND LIQUIDITY

26 Redington | Destination Endgame
SECTION 6: SWOSS
WHY THE NEW REGIME MATTERS
This new regime is acting as a catalyst for various new pension consolidation vehicles to come to market. We believe this new regime is significant for all pensions trustees, and not just those of very weak sponsors who may be contemplating using the new regime in the short term. This is because it fundamentally changes the long-term planning options available to pension trustees, in that continuing to run the scheme post-insolvency of the sponsor is now a potential option. This means that the continuation of the pension scheme is not necessarily contingent on the continuation of the sponsor.
We believe this is good news for members of schemes, our modelling shows that the existence of this regime can increase the probability of all benefits being paid for weaker sponsors by up to 20%, compared to a regime which forced schemes to wind up on sponsor insolvency.
It is important to note that the probability of paying pensions does not capture all relevant risk here. Clearly failing to pay the final £1 of pensions is very different to defaulting with a £1bn deficit.
However, POPP does not distinguish between the two. An additional measure of benefits at risk needs to be added to a POPP measure for a full picture, this ought to be possible using the same models that calculate POPP. There may well be scenarios where it is right to go for a strategy with a higher chance of not meeting all pensions, if it carries a lower risk of large benefit losses. This is an important trade-off that the right models can help illuminate for trustees.
Without the SWOSS framework the scheme is dependent on a very binary event (the default of the sponsor), and when this occurs there are either enough assets to secure full pensions or not. With the SWOSS framework in place the scheme is no longer beholden to this binary event.
In February 2017 the PPF released a consultation13 on a new regulatory framework for DB “Schemes Without a Substantial Sponsor (SWOSS)”. This regime allows schemes to continue outside of the PPF, without having to buy-out benefits, following the insolvency of a sponsoring employer. This work was completed by March 2017 and came into force for the new PPF levy year commencing April 2017. This regime is now being used by at least one scheme.
OUR MODELLING SHOWS THAT THE EXISTENCE OF THIS REGIME CAN INCREASE THE PROBABILITY OF ALL BENEFITS BEING PAID FOR WEAKER SPONSORS BY UP TO 20%

70%
75%
80%
85%
90%
95%
100%
Gilt
s fla
t fun
ding
leve
l
HOW SWOSS CAN IMPROVE POPP
Fig. 16 Example POPP scores by funding level, including sponsor support (BBB rated sponsor). With and without framework. Source: Redington long-term risk model. Source: Redington.
Redington | Destination Endgame 27
This chart shows the same scheme but with the SWOSS framework in place. In this scenario, the scheme can continue beyond the default of the sponsor if sufficiently well-funded at that point. This takes away the binary risk associated with sponsor default, and we can see that POPP now increases substantially as the scheme becomes better funded, getting close to 100% when the scheme is fully funded on a gilts basis.
This shows that the SWOSS framework – according to our modelling – by allowing schemes to continue after the default of the sponsoring company can increase the probability of paying full pensions.
This chart shows the POPP (probability of paying pensions) for a scheme taking into account the support of a BBB-rated sponsor who is assumed to fund the scheme to a technical provisions basis of gilts +1%. A range of funding levels are illustrated, in this example the scheme de-risks its investment strategy to stay just ahead of the required return needed as the funding level improves. The scheme invests in equities and gilts and hedges interest rate risk up to the funding level.
In practice what this means for this example is that the sponsor covenant is the dominant factor in driving POPP: if the sponsor defaults pensions will likely not be paid in full, if the sponsor continues then they will. This remains the case even when the scheme is very well funded. POPP may even decline slightly as the scheme becomes better funded but de-risks, taking some investment upside off the table, but leaving sponsor covenant downside on the table (this finding is consistent with some of the findings in the PLSA DB Taskforce interim report). One important consideration here is that POPP does not take into account the extent to which pensions are not met in full, which is clearly important. We suggest using additional risk metrics alongside POPP to quantify the size of benefits at risk. POPP by itself does not fully capture risk to benefits.
POPP
81%
78%
78%
75%
77%
79%
83%
WITHOUT SWOSS
POPP
99%
99%
95%
92%
92%
90%
87%
WITH SWOSS

28 Redington | Destination Endgame
Above a certain level of annual risk-based levy payments, it would no longer make sense to continue running the scheme in a SWOSS situation. For example, if the majority of the expected investment returns were consumed by levy payments, it would no longer make sense to continue taking investment risk in that way. By modelling a range of funding levels and investment strategies we can see what the associated levy payments would be and hence begin to get a handle on the viable levels of funding and investment strategy in a SWOSS world.
What Figure 17 shows is that for S179 (PPF basis) funding levels below 110% (in this case, roughly equivalent to 77% on a buy-out basis), the annual PPF risk levy would begin to exceed 0.5%p.a. for most investment strategies, and will quite quickly exceed 1% for slightly lower levels of funding or higher levels of investment risk. At these levels it is likely that the levy would be consuming an unsustainable amount of the expected excess returns of an investment strategy, and it wouldn’t be deemed feasible to continue to run a scheme without a sponsor at this point.
SECTION 6: ‘SWOSS’ AND WHY IT MATTERS
“We are simply setting out for consultation a charging methodology that would appropriately price the risk that such a scheme would pose to PPF levy payers and members. However, in doing so, we assume that it is established within a structure that allows for appropriate controls over the scheme’s operation and governing its wind-up in the event of poor investment performance, since we consider these to be essential minimum requirements.”
The PPF March 201713
FRAMEWORK TO UNDERSTAND SWOSS LEVY SIZE
Fig. 17 Illustrative estimate of annual risk-based PPF levy under new framework at different funding levels and investment risk levels. Source: Redington long-term risk model.
Funding level Investment risk funding level volatility
Buy-out PPF basis 1% 2% 3% 4% 5% 6% 7% 8% 9% 10%
72% 100% 1.0% 1.1% 1.2% 1.3% 1.5% 1.7% 1.9% 2.2% 2.4% 2.7%
75% 105% 0.4% 0.5% 0.5% 0.6% 0.7% 0.8% 1.0% 1.2% 1.4% 1.6%
79% 110% 0.2% 0.2% 0.2% 0.3% 0.3% 0.4% 0.5% 0.6% 0.7% 0.9%
82% 115% 0.1% 0.1% 0.1% 0.1% 0.2% 0.2% 0.3% 0.3% 0.4% 0.5%
86% 120% 0.0% 0.0% 0.0% 0.1% 0.1% 0.1% 0.1% 0.2% 0.2% 0.3%
90% 125% 0.0% 0.0% 0.0% 0.0% 0.0% 0.0% 0.1% 0.1% 0.1% 0.2%
93% 130% 0.0% 0.0% 0.0% 0.0% 0.0% 0.0% 0.0% 0.0% 0.1% 0.1%
For PPF basis funding levels above 110%, the risk-based levy starts to come down to what might be considered reasonable levels in the context of the expected investment returns. It is important to bear in mind that even for an all-gilt cashflow-matching scheme there will still be a volatility for assumed longevity risk. These figures do not include running costs, which may be a significant consideration for many smaller schemes.
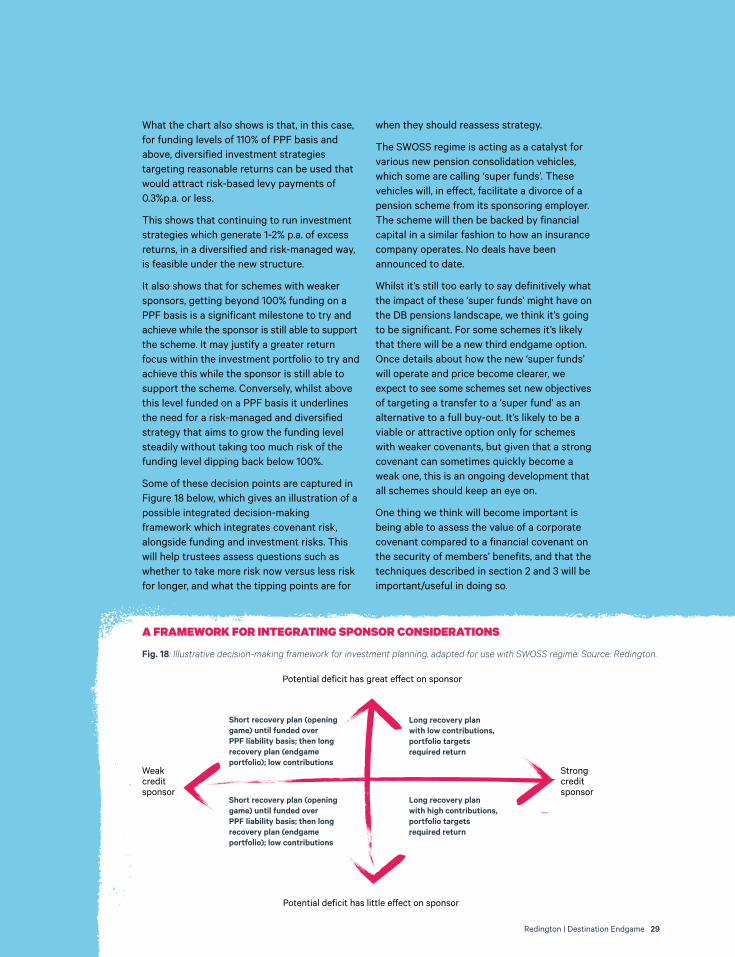
Potential deficit has great effect on sponsor
Potential deficit has little effect on sponsor
Weak credit sponsor
Strong credit sponsor
Short recovery plan (opening game) until funded over PPF liability basis; then long recovery plan (endgame portfolio); low contributions
Short recovery plan (opening game) until funded over PPF liability basis; then long recovery plan (endgame portfolio); low contributions
Long recovery plan with high contributions, portfolio targets required return
Long recovery plan with low contributions, portfolio targets required return
A FRAMEWORK FOR INTEGRATING SPONSOR CONSIDERATIONS
Fig. 18: Illustrative decision-making framework for investment planning, adapted for use with SWOSS regime. Source: Redington.
Redington | Destination Endgame 29
What the chart also shows is that, in this case, for funding levels of 110% of PPF basis and above, diversified investment strategies targeting reasonable returns can be used that would attract risk-based levy payments of 0.3%p.a. or less.
This shows that continuing to run investment strategies which generate 1-2% p.a. of excess returns, in a diversified and risk-managed way, is feasible under the new structure.
It also shows that for schemes with weaker sponsors, getting beyond 100% funding on a PPF basis is a significant milestone to try and achieve while the sponsor is still able to support the scheme. It may justify a greater return focus within the investment portfolio to try and achieve this while the sponsor is still able to support the scheme. Conversely, whilst above this level funded on a PPF basis it underlines the need for a risk-managed and diversified strategy that aims to grow the funding level steadily without taking too much risk of the funding level dipping back below 100%.
Some of these decision points are captured in Figure 18 below, which gives an illustration of a possible integrated decision-making framework which integrates covenant risk, alongside funding and investment risks. This will help trustees assess questions such as whether to take more risk now versus less risk for longer, and what the tipping points are for
when they should reassess strategy.
The SWOSS regime is acting as a catalyst for various new pension consolidation vehicles, which some are calling ‘super funds’. These vehicles will, in effect, facilitate a divorce of a pension scheme from its sponsoring employer. The scheme will then be backed by financial capital in a similar fashion to how an insurance company operates. No deals have been announced to date.
Whilst it’s still too early to say definitively what the impact of these ‘super funds’ might have on the DB pensions landscape, we think it’s going to be significant. For some schemes it’s likely that there will be a new third endgame option. Once details about how the new ‘super funds’ will operate and price become clearer, we expect to see some schemes set new objectives of targeting a transfer to a ‘super fund’ as an alternative to a full buy-out. It’s likely to be a viable or attractive option only for schemes with weaker covenants, but given that a strong covenant can sometimes quickly become a weak one, this is an ongoing development that all schemes should keep an eye on.
One thing we think will become important is being able to assess the value of a corporate covenant compared to a financial covenant on the security of members’ benefits, and that the techniques described in section 2 and 3 will be important/useful in doing so.

30 Redington | Destination Endgame
In this piece we set out to illuminate the changing landscape facing DB trustees and their choices for the endgame.
Funding positions have generally improved, and trustees have many options at their disposal in pursuing the goal of meeting all pension payments. We argue that what is most needed is a decision-making framework to assess the different options available against each other fairly, in the context of the specific scheme’s circumstances.
We hope we have been able to shed some light on what such a framework looks like.
SO WHERE NEXT?
We finish by posing the same three questions for trustees that we started with:
1 Does your scheme have a clear objective in place which can guide decision making?
2 Do you have a good grasp of the full range of endgame options, what they offer your scheme, and how far away they are?
3 Do you have a reliable method for selecting the right endgame option for your scheme?
If the answer to any of the above is “no” then please get in touch. We’d love to help.
START AT THE END
PATRICK OSULLIVANHead of Investment Consulting
CAROLYN SCHUSTER-WOLDANMD Investment Consulting
KAREN HEAVEN MD Investment Consulting

REFERENCES & CREDITS
1 DB schemes ‘may have hit fully-funded’ in May, June 2018, Professional Pensions. Retrieved from https://www.professionalpensions.com
2 DB Taskforce Interim Report, October 2016, Pensions and Lifetime Savings Association. Retrieved from https://www.plsa.co.uk
3 Endgame Portfolios and the Role of Credit, March 2016, Legal and General Investment Management. Retrieved from http://www.lgim.com
4 European Asset Allocation Survey, 2018, Mercer. Retrieved from https://www.mercer.com
5 Global Risk Pensions Survey, 2015, Aon. Retrieved from http://www.aon.com
6 GlobalRisk Pensions Survey, 2017, Aon. Retrieved from http://www.aon.com
7 Measuring Corporate Default Rates, November 2006, Moody’s Investors Service. Retrieved from https://www.moodys.com
8 Meeting Member Promises, July 2017, Ampersand Institute. Retrieved from http://www.ampersand.redington.co.uk
9 Review of the principles of life-office valuations. The Journal of the Institute of Actuaries, 78, 286–340, 1952, Redington, F. M.
10 Risk of Ruin, July 2017, Punter Southall Transaction Services. Retrieved from http://www.xpsgroup.com
11 Running off mature schemes Working Party, May 2018, Institute and Faculty of Actuaries. Retrieved from https://www.actuaries.org.uk
12 The financial structure of a life office. The Journal of The Institute of Actuaries, 18, 141–197, 1952, Haynes, A. T., & Kirton, R. J.
13 The 2017/18 Levy Policy Statement, March 2017, Payment Protection Fund. Retrieved from http://www.pensionprotectionfund.org.uk
PRODUCTION SUPPORTHugo Nuttall
CREATIVE TEAMNick Martin Oliver Whittall

Redington Ltd. Floor 6 One Angel Court London EC2R 7HJTel: 020 7250 3331Email us: [email protected]