Designing screen layout in multimedia applications through ...
19
RAIRO-Oper. Res. 55 (2021) 3379–3397 RAIRO Operations Research https://doi.org/10.1051/ro/2021160 www.rairo-ro.org DESIGNING SCREEN LAYOUT IN MULTIMEDIA APPLICATIONS THROUGH INTEGER PROGRAMMING AND METAHEURISTIC Pedro Henrique Gonz´ alez 1,* , Glauco Amorim 1 , Ueverton S. Souza 2 , Igor Morais 1 , Joel dos Santos 1 , Vanessa de A. Guimar˜ aes 1 and Glaydston M. Ribeiro 3 Abstract. Binding audiovisual content into multimedia applications requires the specification of each media item, including its size and position, to define a screen layout. The multimedia application author must plan the application’s screen layout (ASL), considering a variety of screen sizes where the application shall be executed. An ASL that maximizes the area occupied by media items on the screen is essential, given that screen space is a valuable asset for media broadcasters. In this paper, we introduce the Application Screen Layout Optimization Problem, and present its -hardness. Besides, two integer programming formulations and an Iterated Local Search (ILS) metaheuristic are proposed to solve it. The efficiency of the proposed methods is evaluated, showing that the metaheuristic achieves better results and is at least 12 times faster, on average, than the mathematical formulations. Also, the proposed approaches were compared to a layout design algorithm, showing their effectiveness. Mathematics Subject Classification. 90-05. Received April 12, 2021. Accepted October 18, 2021. 1. Introduction In multimedia applications an application’s screen layout (ASL) consists of the disposition of visual content on the screen. It is usually defined by indicating the position of each media item relative to the screen, where for each media item its attributes are set in relation to the screen top-left corner. In general, languages enable the application author to define such values either in pixels or percentage [1]. The multimedia application author, usually a content producer, has to plan the ASL and, possibly, consider a variety of screen sizes where the application shall be executed. Analyzing different interactive multimedia applications transmitted in real applications and/or stored in an application repository called Clube NCL [7], we can find presentation characteristics common to most. It was noticed that the media objects were arranged using a grid structure to determine candidate positions. These structure is important because all the media objects arrangement use these points as candidates to create the application layout. Keywords. Screen layout planning, integer programming, ILS. 1 CEFET/RJ - Federal Center for Technological Education of Rio de Janeiro, Rio de Janeiro, Brazil. 2 UFF - Fluminense Federal University, Rio de Janeiro, Brazil. 3 UFRJ - Rio de Janeiro Federal University, Rio de Janeiro, Brazil. * Corresponding author: [email protected] c ○ The authors. Published by EDP Sciences, ROADEF, SMAI 2021 This is an Open Access article distributed under the terms of the Creative Commons Attribution License (https://creativecommons.org/licenses/by/4.0), which permits unrestricted use, distribution, and reproduction in any medium, provided the original work is properly cited.
-
Upload
khangminh22 -
Category
Documents
-
view
0 -
download
0
Transcript of Designing screen layout in multimedia applications through ...
RAIRO-Oper. Res. 55 (2021) 3379–3397 RAIRO Operations Researchhttps://doi.org/10.1051/ro/2021160 www.rairo-ro.org
DESIGNING SCREEN LAYOUT IN MULTIMEDIA APPLICATIONS THROUGHINTEGER PROGRAMMING AND METAHEURISTIC
Pedro Henrique Gonzalez1,* , Glauco Amorim1 , Ueverton S. Souza2 ,Igor Morais1 , Joel dos Santos1 , Vanessa de A. Guimaraes1 and
Glaydston M. Ribeiro3
Abstract. Binding audiovisual content into multimedia applications requires the specification of eachmedia item, including its size and position, to define a screen layout. The multimedia applicationauthor must plan the application’s screen layout (ASL), considering a variety of screen sizes where theapplication shall be executed. An ASL that maximizes the area occupied by media items on the screen isessential, given that screen space is a valuable asset for media broadcasters. In this paper, we introducethe Application Screen Layout Optimization Problem, and present its 𝒩𝒫-hardness. Besides,two integer programming formulations and an Iterated Local Search (ILS) metaheuristic are proposedto solve it. The efficiency of the proposed methods is evaluated, showing that the metaheuristic achievesbetter results and is at least 12 times faster, on average, than the mathematical formulations. Also, theproposed approaches were compared to a layout design algorithm, showing their effectiveness.
Mathematics Subject Classification. 90-05.
Received April 12, 2021. Accepted October 18, 2021.
1. Introduction
In multimedia applications an application’s screen layout (ASL) consists of the disposition of visual contenton the screen. It is usually defined by indicating the position of each media item relative to the screen, wherefor each media item its attributes are set in relation to the screen top-left corner. In general, languages enablethe application author to define such values either in pixels or percentage [1].
The multimedia application author, usually a content producer, has to plan the ASL and, possibly, considera variety of screen sizes where the application shall be executed. Analyzing different interactive multimediaapplications transmitted in real applications and/or stored in an application repository called Clube NCL [7],we can find presentation characteristics common to most. It was noticed that the media objects were arrangedusing a grid structure to determine candidate positions. These structure is important because all the mediaobjects arrangement use these points as candidates to create the application layout.
Keywords. Screen layout planning, integer programming, ILS.
1 CEFET/RJ - Federal Center for Technological Education of Rio de Janeiro, Rio de Janeiro, Brazil.2 UFF - Fluminense Federal University, Rio de Janeiro, Brazil.3 UFRJ - Rio de Janeiro Federal University, Rio de Janeiro, Brazil.*Corresponding author: [email protected]
c The authors. Published by EDP Sciences, ROADEF, SMAI 2021
This is an Open Access article distributed under the terms of the Creative Commons Attribution License (https://creativecommons.org/licenses/by/4.0),
which permits unrestricted use, distribution, and reproduction in any medium, provided the original work is properly cited.
3380 P.H. GONZALEZ ET AL.
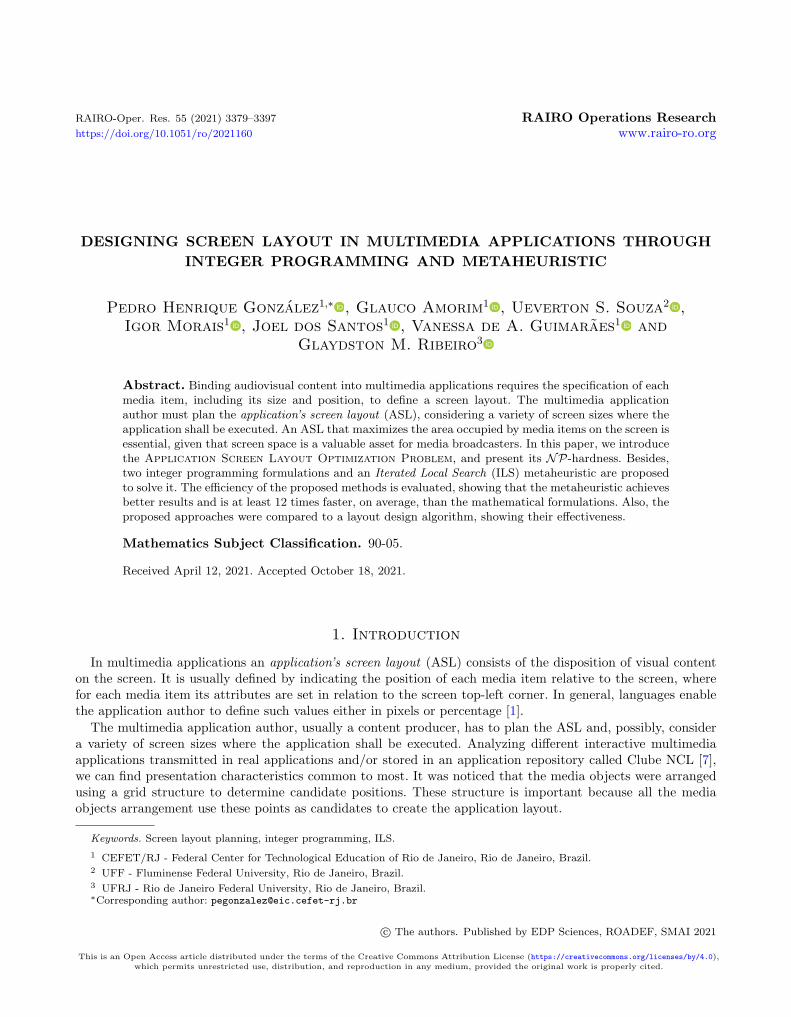
Figure 1. An application’s screen layout for a screen 𝑅 with a grid of center points 𝐺𝐶 .
Although several tools have been used to rearrange media objects on a screen [3, 9, 10], whether on thesmartphone or television, these techniques are not intended to create an optimized layout. The literature’sknown tools do not guarantee that the layout produced will be maximized concerning the display screen’soccupation. Since an ASL that maximizes the area occupied on the screen by media items is essential, duescreen space is a valuable asset for media broadcasters, in this paper, we introduce and study the ApplicationScreen Layout Optimization Problem (ASLOP), the problem of finding an ASL (a subset of items and theirpositions) from a set of media items that, when distributed on the screen, maximize the occupied area andavoids overlap of items. This problem is especially difficult when the number of media items to be distributedon the screen grows. Its description is as follows.
Input: A large rectangle 𝑅 (the application screen) with integer dimensions, a set of smallerrectangles 𝑀 (set of media items) also having integer dimensions, and a set 𝐶 ofpoints within the screen 𝑅 forming a grid 𝐺𝐶 (candidate central points of mediaitems) where the distance between consecutive points of 𝐺𝐶 on the 𝑥-axis and the𝑦-axis are not necessarily the same.
Goal: Find a subset 𝑆 of pairs (𝑟, 𝑐), 𝑟 ∈ 𝑀 , 𝑐 ∈ 𝐶 (media items and their center’sposition) which fits inside the screen, maximizing the covered area of 𝑅 withoutoverlapping items.
Application Screen Layout Optimization Problem
Figure 1 illustrates an application’s screen layout obtained from a set of media items for a screen 𝑅 with agrid of central points 𝐺𝐶 .
Following the typology defined in [38], from a combinatorial optimization point of view, ASLOP can becategorized respectively as (i) two-dimensional, since it considers both axes 𝑥 and 𝑦; with a (ii) strongly hetero-geneous assortment, since there are many items of many different shapes or sizes; it has (iii) one large object(the screen); and (iv) regular small items, given that media items are rectangles.
In fact, ASLOP fits in the Cutting and Packing class of problems. Cutting and Packing (C&P) is a classof optimization problems with a wide range of applications in resource management, such as wood or glassindustries, warehousing context, newspaper paging and, most recently, web browser layout [13,38,39].
In particular, ASLOP is closely related to widely studied optimization problems such as Two-dimensionalknapsack, Rectangle Packing, and Guillotine Cut problem.
Although there are several problems related to fitting rectangles within a larger one, due to the constraintsconcerning the grid of central points, none of these classical problems correctly model the Application Screen
DESIGNING SCREEN LAYOUT IN MULTIMEDIA APPLICATIONS 3381
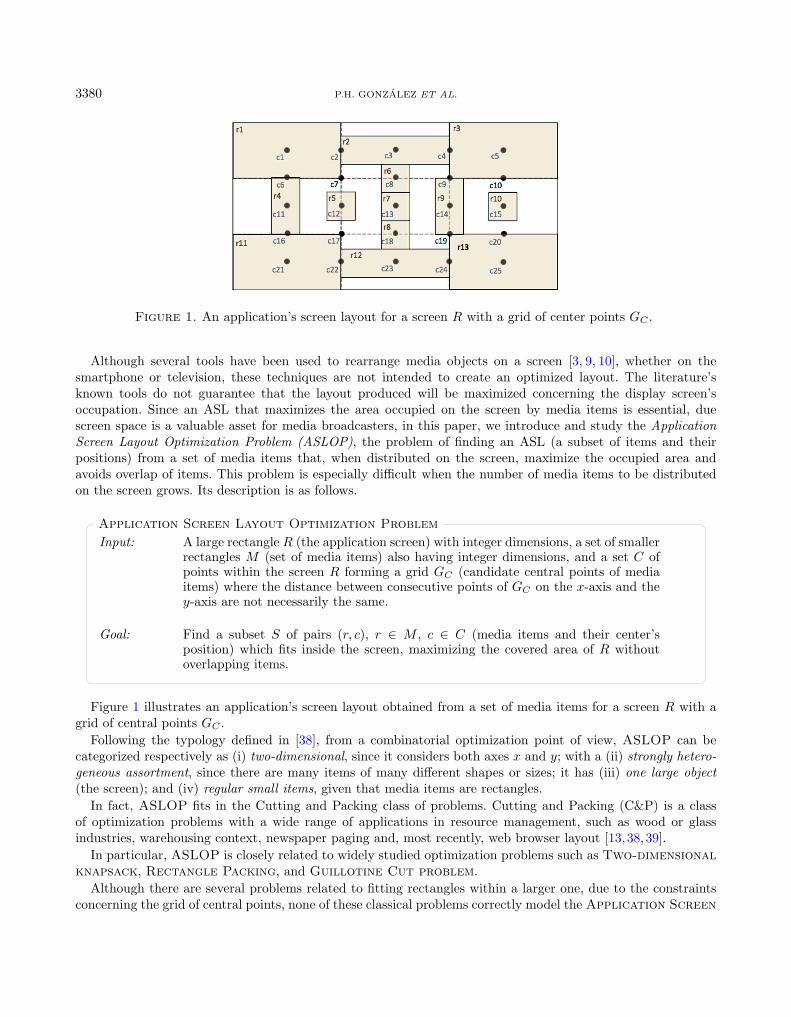
Figure 2. (A) A feasible solution for Two-dimensional Knapsack/Rectangle Packing;(B) an optimal solution for ASLOP considering only media items having the same shape.
Layout Optimization Problem. The classical problems do not consider that each rectangle in the solu-tion needs to be assigned to a candidate center. Once this characteristic is clear, it is not difficult to verifythat ASLOP behaves differently than Two-dimensional Knapsack, Rectangle Packing, and Guillo-tine Cut problem, for example. Figure 2 shows that a solution for Rectangle Packing as well as Two-dimensional Knapsack may not be a solution for ASLOP.
In addition, Figure 1 shows that a solution for ASLOP, may not be a solution for the Guillotine CutProblem as well as Figure 2 illustrates that an optimal solution for Guillotine Cut Problem may not bea solution for ASLOP.
Therefore, one may conclude that although ASLOP belongs to the same class of problems such as Two-dimensional Knapsack, Rectangle Packing and Guillotine Cut Problem, none of them can be used tosolve ASLOP. Other researches that work with problems similar to ASLOP can be found in [4,6,11,18,19,23,36].However, given its specific characteristics, previous techniques may not be directly applied to solve it.
Motivated by its real applicability in the area of Webmedia, as well as its challenging combinatorial naturefrom the point of view of the Optimization field, in this paper, we analyze the complexity of the ASLOP problemas well as develop tools to solve it. First, we prove that the problem is 𝒩𝒫-hard then, from a parameterizedcomplexity perspective, we show that the problem is fixed-parameter tractable with respect to the area to becovered. Next, we present two integer programming formulations. Moreover, considering the limitations of thetwo proposed integer programming formulations to find high quality solutions and prove optimatility, an IteratedLocal Search (ILS) metaheuristic was also proposed to solve the ASLOP. The efficiency of both formulationsand the ILS was evaluated and compared through the analyzes of the covered area for several data sets.
The remaining of this paper is organized as follows. Section 1.1 presents the problem’s motivation inspiredby multimedia applications and related works to solve the applied problem in practice. Section 2 shows an 𝒩𝒫-hardness proof for ASLOP, and present a kernelization algorithm which allows us to observe that the problem isfixed-parameter tractable (ℱ𝒫𝒯 ) concerning the area to be covered by the media items as parameter. Section 3presents two integer programming formulations to solve ASLOP and an ILS metaheuristic. Section 4 presentsexperiments using the proposed formulations and a comparison between them. Finally, Section 5 concludes thispaper and presents future work.
1.1. Motivation and related works
The multimedia production pipeline for digital TV and IPTV includes steps from the planning of the audio-visual content to be presented, their capture and binding into an application latter deployed to the spectator [5].Binding audiovisual content into a multimedia application is usually performed using specific domain languages,such as HTML5 (HyperText Markup Language) [33], SMIL (Synchronized Multimedia Integration Language) [32]and NCL (Nested Context Language) [20]. Those languages focus on presenting audiovisual content, such as
3382 P.H. GONZALEZ ET AL.
videos, audios, and images, synchronized in time and distributed along the exhibition device screen. Recently,some languages are able to provide synchronization between audiovisual content and sensory effects [27].
Initiatives such as Hybrid broadcast broadband TV (HbbTv) [17] and Integrated broadcast-broadband sys-tems [21] indicates that Digital TV marketplace is an interesting research area. In this scenario, some studiessuch as [24, 25] present that broadcasted television shows are becoming more interactive allowing even homeviewers to be part of them. Therefore, interactive TV applications with enjoyable layouts are desirable for users.
Many research attempts to address the designing of screen layouts in multimedia applications in differentways. One approach is to provide authoring tools to ease the creation of the ASL, such as [3,9,10], where toolsare proposed to represent media items and enable the author to rearrange such medias in the tool interface.Once the ASL is created, the tool generates the corresponding code in the language used for the applicationcreation.
CSS Flexible Box Layout enables the author to define a region on the screen (called flex container and flexitems) composed of a set of spatial properties, such as direction, wrap, and justify-content, and alignment [34].It focuses on space distribution in a primary axis using a bottom-up approach to arrange items. It can alsouse a content-sizebased line-wrapping system to control its secondary axis. CSS Grid Layout controls the sizingand positioning of regions and their contents [35]. Unlike CSS Flexible Box Layout, it works considering thearrangement of items in both dimensions. Using CSS Grid Layout authors can adapt the ASL to changes in thepresentation device, such as factors, orientation, and available space. It combines CSS media queries with CSSproperties that control the disposition of the grid container and its children during a presentation.
Adaptive layouts are templates where the author defines the ASL by means of predefined arrangements, suchas grids and flows1 [1]. At processing time, media items are distributed on the screen according to the chosenarrangement definition, such as its size, its items size and so on. Such approach works associating media itemswith a given layout arrangement (grid or flow) in the order they are declared in the document. Therefore, whilerendering the layout, presentation characteristics are created according to the number of media items associatedwith each layout arrangement, following a similar approach to CSS [35].
Depending on the approach used for providing an adaptive layout, some media items may not be displayedbecause the screen size was not sufficient to accommodate them. W3C [34, 35] requires the presentation of allavailable items on the available screen. When the available screen area is not sufficient for presenting all items,it does not provide a solution. Amorim et al. [1] creates a partition considering the media item’s order in thedocument. CSS uses scroll bars to enable the presentation of all media items.
Although several tools have been used to rearrange media objects on a screen, whether on the smartphoneor on television, these techniques are not intended to create an optimized layout. These tools do not guaranteethat the layout produced will be maximized in relation to the occupation of the display screen.
To summarize, we propose tools to support multimedia application authors to create an ASL that maximizesthe occupied area on the screen, thus solving the ASLOP. We follow an alternative approach where we neitheruse the order of media items declared in the document to create the spatial arrangement nor create mediaitem partitions when the available space is not sufficient to accommodate them all [1]. Instead, the proposedapproach uses integer programming formulations to choose media items that maximize the occupied area. Somemedia items may not be displayed because the screen size was not sufficient to accommodate them. However,it is possible to perform a second round to choose the next subset of media items to be displayed.
From a practical standpoint, the rational use of the screen becomes even more relevant during the COVID-19 pandemic, since most parts of the daily activities are being performed online. These activities are diverse,including from e-commerce to home-office. As a result, platforms used to work meetings grew vertiginously:Google Hangout, for instance, grew to 60% daily in March, while Zoom jumped from 10M to 220M users from12/2019 to 03/2020 [28].
Regarding trade, according to a Brazilian report about Economy and Consumption during the pandemic,although the Trade Sales Index of Brazilian Retailer registered 25.1% retraction in the same month of the
1The paper also proposes other predefined arrangements, but for simplicity, we do not address them here.
DESIGNING SCREEN LAYOUT IN MULTIMEDIA APPLICATIONS 3383
previous year, the e-commerce has grown 32.6% in the number of orders [28]. Then, considering that themaximization of the screen use could promote a more significant number of ads incentivizing e-commerce, thisresearch becomes relevant to help, albeit indirectly, in the marketing and sales areas.
2. Computational complexity
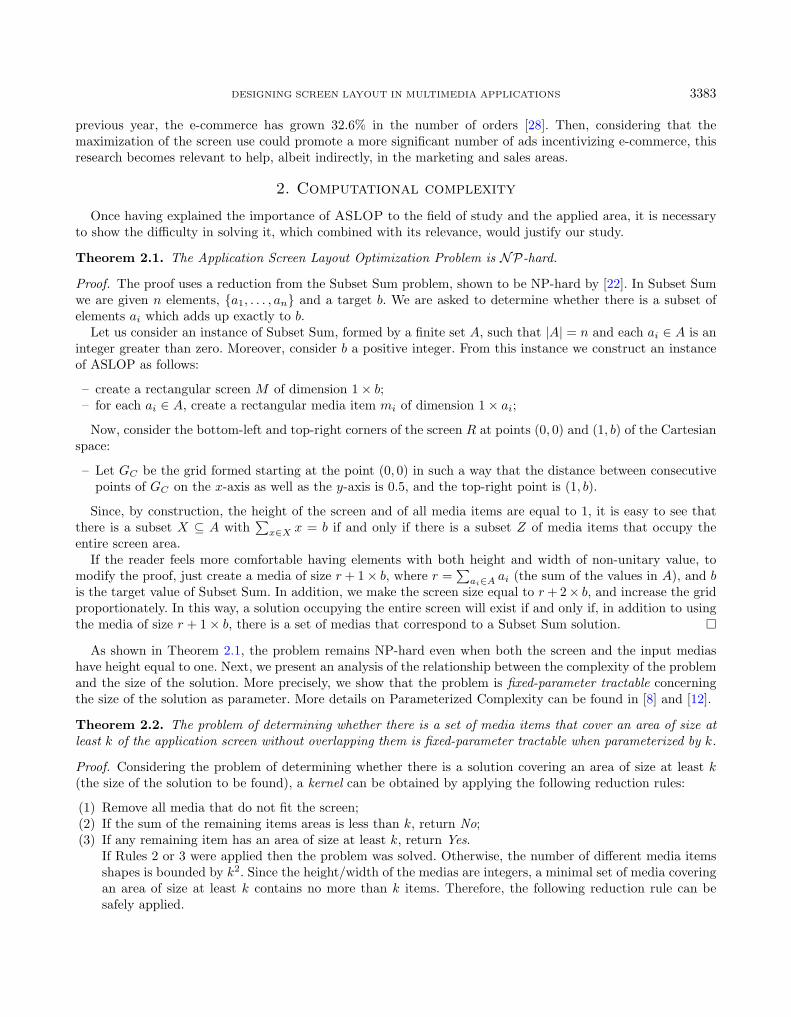
Once having explained the importance of ASLOP to the field of study and the applied area, it is necessaryto show the difficulty in solving it, which combined with its relevance, would justify our study.
Theorem 2.1. The Application Screen Layout Optimization Problem is 𝒩𝒫-hard.
Proof. The proof uses a reduction from the Subset Sum problem, shown to be NP-hard by [22]. In Subset Sumwe are given 𝑛 elements, 𝑎1, . . . , 𝑎𝑛 and a target 𝑏. We are asked to determine whether there is a subset ofelements 𝑎𝑖 which adds up exactly to 𝑏.
Let us consider an instance of Subset Sum, formed by a finite set 𝐴, such that |𝐴| = 𝑛 and each 𝑎𝑖 ∈ 𝐴 is aninteger greater than zero. Moreover, consider 𝑏 a positive integer. From this instance we construct an instanceof ASLOP as follows:
– create a rectangular screen 𝑀 of dimension 1× 𝑏;– for each 𝑎𝑖 ∈ 𝐴, create a rectangular media item 𝑚𝑖 of dimension 1× 𝑎𝑖;
Now, consider the bottom-left and top-right corners of the screen 𝑅 at points (0, 0) and (1, 𝑏) of the Cartesianspace:
– Let 𝐺𝐶 be the grid formed starting at the point (0, 0) in such a way that the distance between consecutivepoints of 𝐺𝐶 on the 𝑥-axis as well as the 𝑦-axis is 0.5, and the top-right point is (1, 𝑏).
Since, by construction, the height of the screen and of all media items are equal to 1, it is easy to see thatthere is a subset 𝑋 ⊆ 𝐴 with
∑𝑥∈𝑋 𝑥 = 𝑏 if and only if there is a subset 𝑍 of media items that occupy the
entire screen area.If the reader feels more comfortable having elements with both height and width of non-unitary value, to
modify the proof, just create a media of size 𝑟 + 1× 𝑏, where 𝑟 =∑
𝑎𝑖∈𝐴 𝑎𝑖 (the sum of the values in 𝐴), and 𝑏is the target value of Subset Sum. In addition, we make the screen size equal to 𝑟 + 2× 𝑏, and increase the gridproportionately. In this way, a solution occupying the entire screen will exist if and only if, in addition to usingthe media of size 𝑟 + 1× 𝑏, there is a set of medias that correspond to a Subset Sum solution.
As shown in Theorem 2.1, the problem remains NP-hard even when both the screen and the input mediashave height equal to one. Next, we present an analysis of the relationship between the complexity of the problemand the size of the solution. More precisely, we show that the problem is fixed-parameter tractable concerningthe size of the solution as parameter. More details on Parameterized Complexity can be found in [8] and [12].
Theorem 2.2. The problem of determining whether there is a set of media items that cover an area of size atleast 𝑘 of the application screen without overlapping them is fixed-parameter tractable when parameterized by 𝑘.
Proof. Considering the problem of determining whether there is a solution covering an area of size at least 𝑘(the size of the solution to be found), a kernel can be obtained by applying the following reduction rules:
(1) Remove all media that do not fit the screen;(2) If the sum of the remaining items areas is less than 𝑘, return No;(3) If any remaining item has an area of size at least 𝑘, return Yes.
If Rules 2 or 3 were applied then the problem was solved. Otherwise, the number of different media itemsshapes is bounded by 𝑘2. Since the height/width of the medias are integers, a minimal set of media coveringan area of size at least 𝑘 contains no more than 𝑘 items. Therefore, the following reduction rule can besafely applied.
3384 P.H. GONZALEZ ET AL.
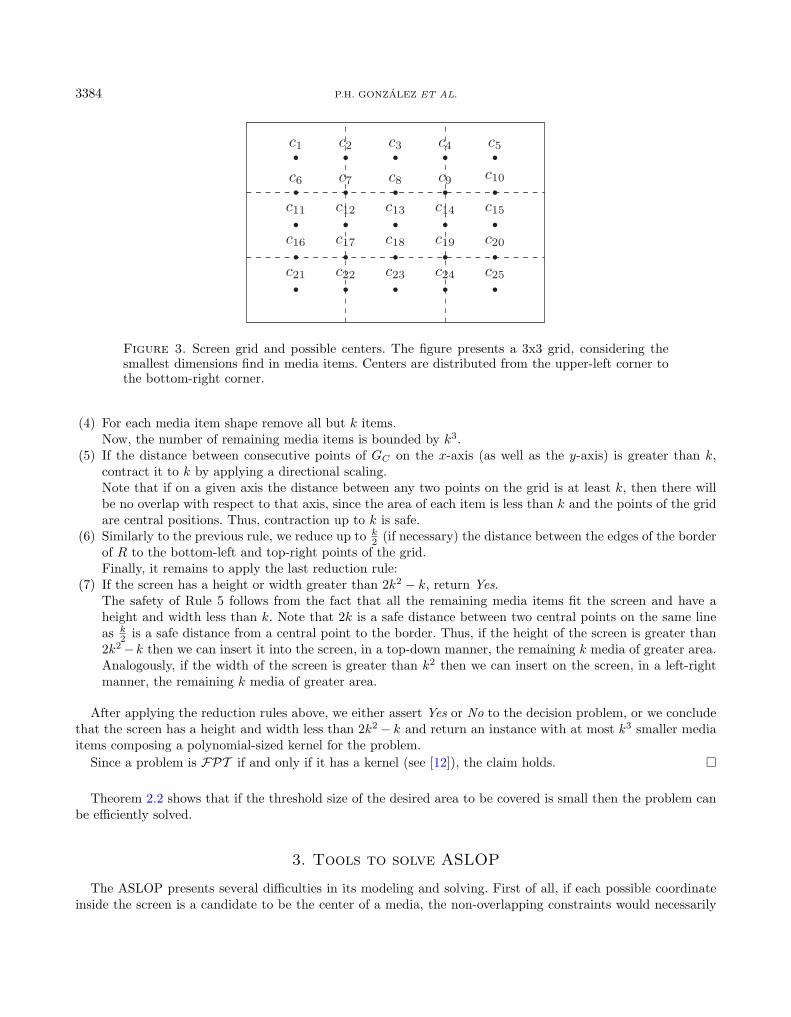
Figure 3. Screen grid and possible centers. The figure presents a 3x3 grid, considering thesmallest dimensions find in media items. Centers are distributed from the upper-left corner tothe bottom-right corner.
(4) For each media item shape remove all but 𝑘 items.Now, the number of remaining media items is bounded by 𝑘3.
(5) If the distance between consecutive points of 𝐺𝐶 on the 𝑥-axis (as well as the 𝑦-axis) is greater than 𝑘,contract it to 𝑘 by applying a directional scaling.Note that if on a given axis the distance between any two points on the grid is at least 𝑘, then there willbe no overlap with respect to that axis, since the area of each item is less than 𝑘 and the points of the gridare central positions. Thus, contraction up to 𝑘 is safe.
(6) Similarly to the previous rule, we reduce up to 𝑘2 (if necessary) the distance between the edges of the border
of 𝑅 to the bottom-left and top-right points of the grid.Finally, it remains to apply the last reduction rule:
(7) If the screen has a height or width greater than 2𝑘2 − 𝑘, return Yes.The safety of Rule 5 follows from the fact that all the remaining media items fit the screen and have aheight and width less than 𝑘. Note that 2𝑘 is a safe distance between two central points on the same lineas 𝑘
2 is a safe distance from a central point to the border. Thus, if the height of the screen is greater than2𝑘2−𝑘 then we can insert it into the screen, in a top-down manner, the remaining 𝑘 media of greater area.Analogously, if the width of the screen is greater than 𝑘2 then we can insert on the screen, in a left-rightmanner, the remaining 𝑘 media of greater area.
After applying the reduction rules above, we either assert Yes or No to the decision problem, or we concludethat the screen has a height and width less than 2𝑘2 − 𝑘 and return an instance with at most 𝑘3 smaller mediaitems composing a polynomial-sized kernel for the problem.
Since a problem is ℱ𝒫𝒯 if and only if it has a kernel (see [12]), the claim holds.
Theorem 2.2 shows that if the threshold size of the desired area to be covered is small then the problem canbe efficiently solved.
3. Tools to solve ASLOP
The ASLOP presents several difficulties in its modeling and solving. First of all, if each possible coordinateinside the screen is a candidate to be the center of a media, the non-overlapping constraints would necessarily
DESIGNING SCREEN LAYOUT IN MULTIMEDIA APPLICATIONS 3385
be non-convex constraints, which is not a good thing when working with integer programming problems [37]. Inorder to avoid that kind of situation, it was decided to use a discretization of the screen, creating a grid whereeach point would be a center candidate. Figure 3 represent this idea for a 3x3 grid.
Considering that each media item 𝑟 ∈ 𝑅 has an associated width 𝑤𝑟 and height ℎ𝑟, the generated grid hasits points created using 𝛥𝑤 and 𝛥ℎ, which are, respectively, the smallest width and the smallest height of thecandidate media items.
𝛥𝑤 = 𝑤𝑟 | 𝑤𝑟 ≤ 𝑤𝑟 ∀ 𝑟, 𝑟 ∈ 𝑅 (3.1)
𝛥ℎ = ℎ𝑟 | ℎ𝑟 ≤ ℎ𝑟 ∀ 𝑟, 𝑟 ∈ 𝑅. (3.2)
This means that after centering the origin (0, 0) in the upper-left corner of the screen, every candidate centercan be found through the expression (ℎ1
𝛥𝑤
2 , ℎ2𝛥ℎ
2 ), where ℎ1 ∈ [1, 2 𝑚𝛥𝑤
− 1] ∩ Z and ℎ2 ∈ [1, 2 𝑛𝛥ℎ
− 1] ∩ Z.Having defined the grid and consequently a set 𝐶 of possible centers, the two integer programming formulationscan be defined.
The remainder of this section is organized as follow: Subsection 3.1 presents the first formulation proposed,called Distance Formulation. In Subsection 3.2, a second integer programming formulation based on the inde-pendent set problem [31] is presented. At last, Subsection 3.3 presents the soft computing techniques.
3.1. Distance formulation
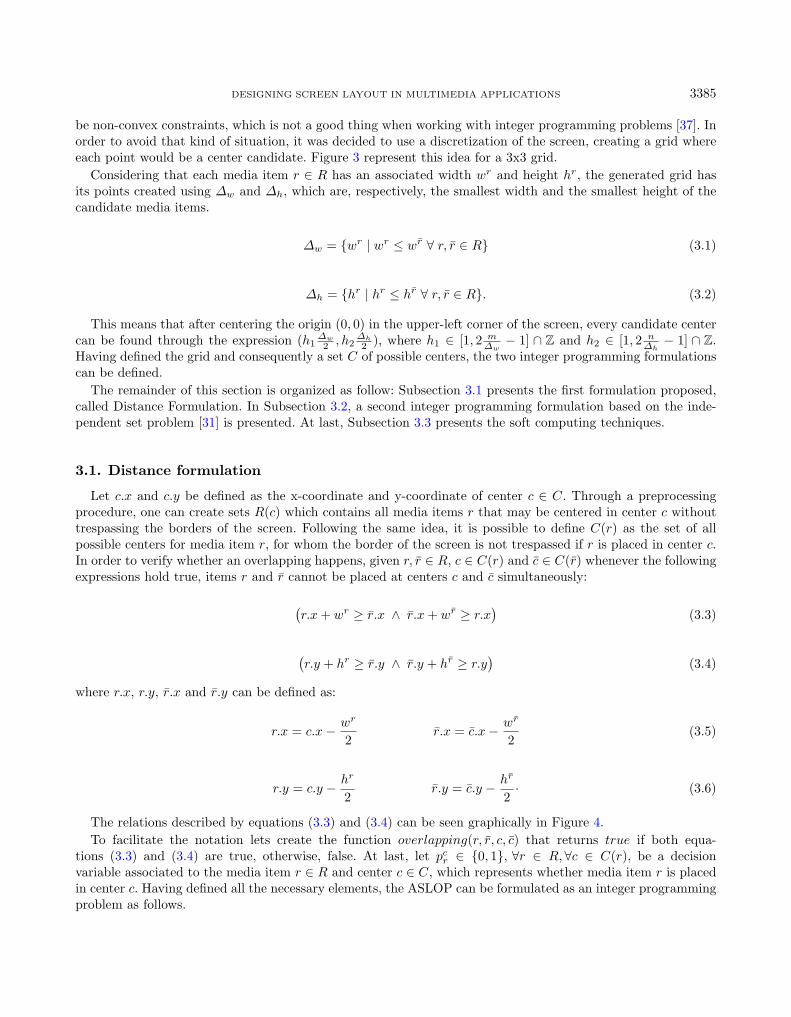
Let 𝑐.𝑥 and 𝑐.𝑦 be defined as the x-coordinate and y-coordinate of center 𝑐 ∈ 𝐶. Through a preprocessingprocedure, one can create sets 𝑅(𝑐) which contains all media items 𝑟 that may be centered in center 𝑐 withouttrespassing the borders of the screen. Following the same idea, it is possible to define 𝐶(𝑟) as the set of allpossible centers for media item 𝑟, for whom the border of the screen is not trespassed if 𝑟 is placed in center 𝑐.In order to verify whether an overlapping happens, given 𝑟, 𝑟 ∈ 𝑅, 𝑐 ∈ 𝐶(𝑟) and 𝑐 ∈ 𝐶(𝑟) whenever the followingexpressions hold true, items 𝑟 and 𝑟 cannot be placed at centers 𝑐 and 𝑐 simultaneously:
(𝑟.𝑥 + 𝑤𝑟 ≥ 𝑟.𝑥 ∧ 𝑟.𝑥 + 𝑤𝑟 ≥ 𝑟.𝑥
)(3.3)
(𝑟.𝑦 + ℎ𝑟 ≥ 𝑟.𝑦 ∧ 𝑟.𝑦 + ℎ𝑟 ≥ 𝑟.𝑦
)(3.4)
where 𝑟.𝑥, 𝑟.𝑦, 𝑟.𝑥 and 𝑟.𝑦 can be defined as:
𝑟.𝑥 = 𝑐.𝑥− 𝑤𝑟
2𝑟.𝑥 = 𝑐.𝑥− 𝑤𝑟
2(3.5)
𝑟.𝑦 = 𝑐.𝑦 − ℎ𝑟
2𝑟.𝑦 = 𝑐.𝑦 − ℎ𝑟
2· (3.6)
The relations described by equations (3.3) and (3.4) can be seen graphically in Figure 4.To facilitate the notation lets create the function 𝑜𝑣𝑒𝑟𝑙𝑎𝑝𝑝𝑖𝑛𝑔(𝑟, 𝑟, 𝑐, 𝑐) that returns 𝑡𝑟𝑢𝑒 if both equa-
tions (3.3) and (3.4) are true, otherwise, false. At last, let 𝑝𝑐𝑟 ∈ 0, 1, ∀𝑟 ∈ 𝑅,∀𝑐 ∈ 𝐶(𝑟), be a decision
variable associated to the media item 𝑟 ∈ 𝑅 and center 𝑐 ∈ 𝐶, which represents whether media item 𝑟 is placedin center 𝑐. Having defined all the necessary elements, the ASLOP can be formulated as an integer programmingproblem as follows.
3386 P.H. GONZALEZ ET AL.
Figure 4. Graphical representation of two overlapping media items 𝑟 and 𝑟. Overlapping iscalculated in both axes 𝑥 and 𝑦 using equations (3.3) and (3.4). Initial points (𝑟.𝑥, 𝑟.𝑦) and(𝑟.𝑥, 𝑟.𝑦) are obtained using equations (3.5) and (3.6).
max∑𝑟∈𝑅
∑𝑐∈𝐶
𝐴𝑟𝑝𝑐𝑟
s.t. 𝑝𝑐𝑟 + 𝑝𝑐
𝑟 ≤ 1, ∀𝑟 = 𝑟 ∈ 𝑅, 𝑐 ∈ 𝐶(𝑟), 𝑐 ∈ 𝐶(𝑟)|𝑜𝑣𝑒𝑟𝑙𝑎𝑝𝑝𝑖𝑛𝑔(𝑟, 𝑟, 𝑐, 𝑐) = 𝑡𝑟𝑢𝑒∑
𝑟∈𝑅(𝑐)
𝑝𝑐𝑟 ≤ 1, ∀𝑐 ∈ 𝐶
∑𝑐∈𝐶(𝑟)
𝑝𝑐𝑟 ≤ 1, ∀𝑟 ∈ 𝑅
𝑝𝑐𝑟 ∈ 0, 1, ∀𝑟 ∈ 𝑅,∀𝑐 ∈ 𝐶(𝑟).
(3.7)
(3.8)
(3.9)
(3.10)
(3.11)
The objective function (3.7) states the maximization of the sum of the chosen media items’ area. In thisfunction, 𝐴𝑟 is the area of a rectangle. Constraints (3.8) ensure that no overlapping is allowed between chosenmedia items. Constraints (3.9) ensure that each center 𝑐 can have assigned to it at most one media item𝑟. Constraints (3.10) ensure that one media item 𝑟 can be used at most one time in the solution. At last,Constraint (3.11) define the domain of the decision variables.
3.2. Independent set formulation
In order to use this formulation one must build a conflict graph [2] 𝐺 = (𝑉,𝐸), such that each vertex 𝑖 ∈ 𝑉 isassociated to a pair (𝑟, 𝑐) and has a cost 𝑣𝑖 = 𝐴𝑟, where 𝐴𝑟 remains the area of a rectangle. In this graph, giventwo vertex 𝑖 ∼ (𝑟, 𝑐) and 𝑗 ∼ (𝑟, 𝑐), whenever at least one of the expressions 𝑜𝑣𝑒𝑟𝑙𝑎𝑝𝑝𝑖𝑛𝑔(𝑟, 𝑟, 𝑐, 𝑐), or 𝑟 = 𝑟,or 𝑐 = 𝑐 is true, an edge (𝑖, 𝑗) is added to 𝐸. Let 𝜋 ∈ 0, 1|𝑉 | be decision variables which represent whethera vertex is in the solution. Once this graph was build and the decision variables were defined, another integerprogramming formulation to represent the ASLOP can be defined as follows.
max∑𝑖∈𝑉
𝑣𝑖𝜋𝑖
s.t. 𝜋𝑖 + 𝜋𝑗 ≤ 1, ∀(𝑖, 𝑗) ∈ 𝐸
𝜋 ∈ 0, 1|𝑉 |.
(3.12)
(3.13)
(3.14)
DESIGNING SCREEN LAYOUT IN MULTIMEDIA APPLICATIONS 3387
The objective function (3.12) states the maximization of the sum of the chosen media item’s area. Con-straints (3.13) ensure that overlapping and multiple use of the same media item is not allowed. At last, Con-straints (3.14) define the domain of the decision variables.
3.3. Soft computing techniques
In this section an Iterated Local Search [26] to solve the ASLOP is presented. This subsection is organized insuch way that the following three subsection present the components of the ILS and the last one present howthese components are combined in the proposed approach.
3.3.1. Constructive heuristic
Soft computing techniques are being used to deal with many layout optimization problems [16,40]. The con-structive heuristic applied here uses the black-box LocalSolver framework2, which has been used successfully incovering problems [16]. The LocalSolver framework has a hybrid approach of neighborhood search, which allowsit to combine different optimization techniques in a dynamic way during the resolution process. As describedin their website, this framework may combine local search techniques, constraint propagation and inferencetechniques, linear mixed-integer programming techniques, as well as non-linear programming techniques. Sinceit is a black-box, how these techniques are combined is not available to general public.
Given a valid representation of the problem, the black-box LocalSolver framework applies several techniques inorder to find high quality solutions. In this paper, the Independent Set Formulation (as described in Sect. 3.2)was used as a representation of the problem in the LocalSolvers’ API for C++. This was done since theIndependent Set Formulation provided better results than the ones obtained when using Distance Formulationtogether with LocalSolver. An important remark is that, since LocalSolver is dependent of the representationused, a better representation may lead to better solutions. In the following sections, LSH is used to refer to theuse of LocalSolver as a constructive heuristic.
3.3.2. Perturbation
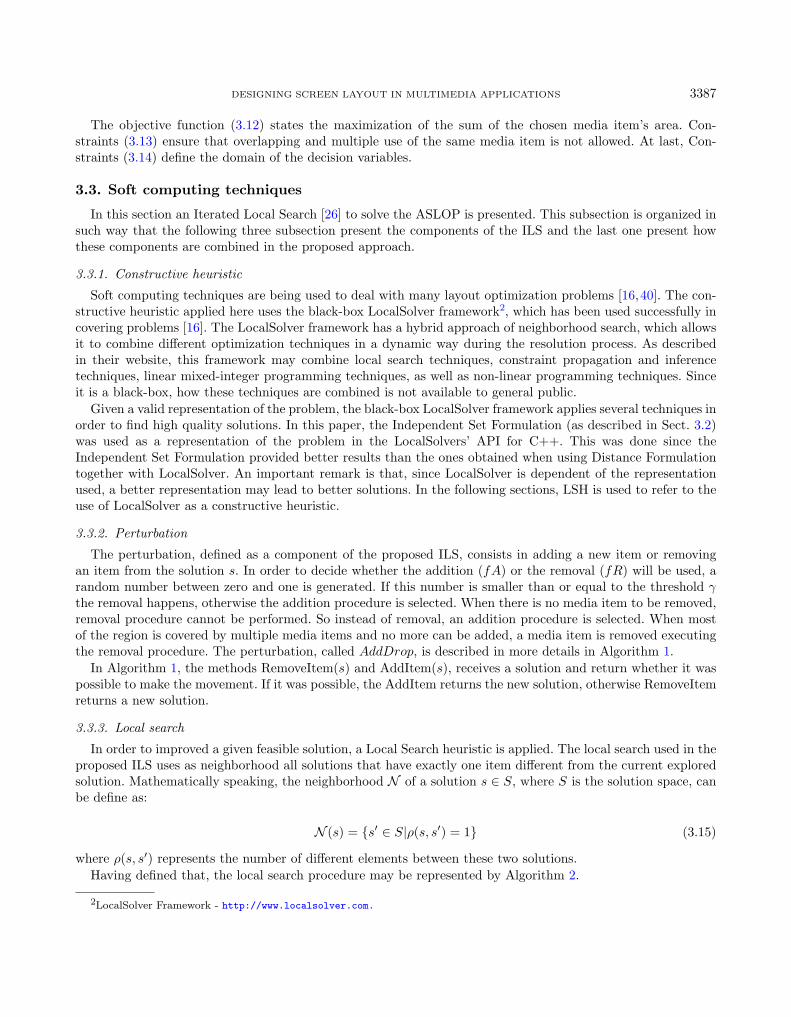
The perturbation, defined as a component of the proposed ILS, consists in adding a new item or removingan item from the solution 𝑠. In order to decide whether the addition (𝑓𝐴) or the removal (𝑓𝑅) will be used, arandom number between zero and one is generated. If this number is smaller than or equal to the threshold 𝛾the removal happens, otherwise the addition procedure is selected. When there is no media item to be removed,removal procedure cannot be performed. So instead of removal, an addition procedure is selected. When mostof the region is covered by multiple media items and no more can be added, a media item is removed executingthe removal procedure. The perturbation, called 𝐴𝑑𝑑𝐷𝑟𝑜𝑝, is described in more details in Algorithm 1.
In Algorithm 1, the methods RemoveItem(𝑠) and AddItem(𝑠), receives a solution and return whether it waspossible to make the movement. If it was possible, the AddItem returns the new solution, otherwise RemoveItemreturns a new solution.
3.3.3. Local search
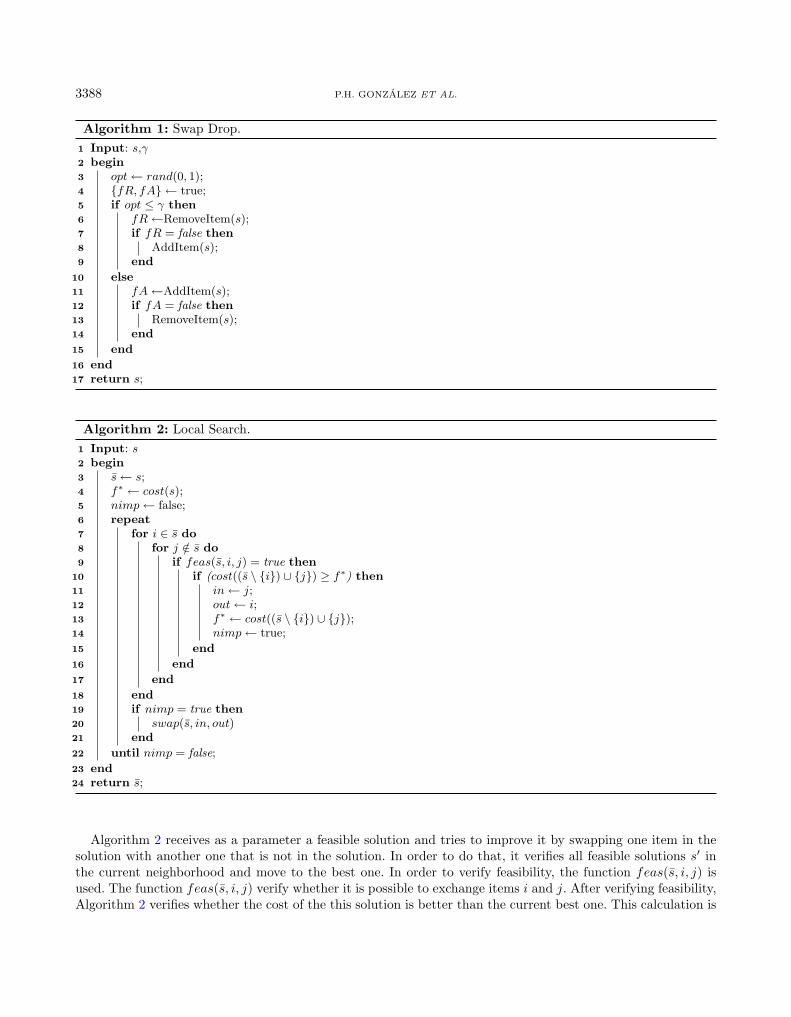
In order to improved a given feasible solution, a Local Search heuristic is applied. The local search used in theproposed ILS uses as neighborhood all solutions that have exactly one item different from the current exploredsolution. Mathematically speaking, the neighborhood 𝒩 of a solution 𝑠 ∈ 𝑆, where 𝑆 is the solution space, canbe define as:
𝒩 (𝑠) = 𝑠′ ∈ 𝑆|𝜌(𝑠, 𝑠′) = 1 (3.15)
where 𝜌(𝑠, 𝑠′) represents the number of different elements between these two solutions.Having defined that, the local search procedure may be represented by Algorithm 2.
2LocalSolver Framework - http://www.localsolver.com.
3388 P.H. GONZALEZ ET AL.
Algorithm 1: Swap Drop.1 Input: 𝑠,𝛾2 begin3 𝑜𝑝𝑡← 𝑟𝑎𝑛𝑑(0, 1);4 𝑓𝑅, 𝑓𝐴 ← true;5 if 𝑜𝑝𝑡 ≤ 𝛾 then6 𝑓𝑅←RemoveItem(𝑠);7 if 𝑓𝑅 = false then8 AddItem(𝑠);9 end
10 else11 𝑓𝐴←AddItem(𝑠);12 if 𝑓𝐴 = false then13 RemoveItem(𝑠);14 end
15 end
16 end17 return 𝑠;
Algorithm 2: Local Search.1 Input: 𝑠2 begin3 𝑠← 𝑠;4 𝑓* ← 𝑐𝑜𝑠𝑡(𝑠);5 𝑛𝑖𝑚𝑝← false;6 repeat7 for 𝑖 ∈ 𝑠 do8 for 𝑗 /∈ 𝑠 do9 if 𝑓𝑒𝑎𝑠(𝑠, 𝑖, 𝑗) = true then
10 if (𝑐𝑜𝑠𝑡((𝑠 ∖ 𝑖) ∪ 𝑗) ≥ 𝑓*) then11 𝑖𝑛← 𝑗;12 𝑜𝑢𝑡← 𝑖;13 𝑓* ← 𝑐𝑜𝑠𝑡((𝑠 ∖ 𝑖) ∪ 𝑗);14 𝑛𝑖𝑚𝑝← true;
15 end
16 end
17 end
18 end19 if 𝑛𝑖𝑚𝑝 = true then20 𝑠𝑤𝑎𝑝(𝑠, 𝑖𝑛, 𝑜𝑢𝑡)21 end
22 until 𝑛𝑖𝑚𝑝 = false;
23 end24 return 𝑠;
Algorithm 2 receives as a parameter a feasible solution and tries to improve it by swapping one item in thesolution with another one that is not in the solution. In order to do that, it verifies all feasible solutions 𝑠′ inthe current neighborhood and move to the best one. In order to verify feasibility, the function 𝑓𝑒𝑎𝑠(𝑠, 𝑖, 𝑗) isused. The function 𝑓𝑒𝑎𝑠(𝑠, 𝑖, 𝑗) verify whether it is possible to exchange items 𝑖 and 𝑗. After verifying feasibility,Algorithm 2 verifies whether the cost of the this solution is better than the current best one. This calculation is
DESIGNING SCREEN LAYOUT IN MULTIMEDIA APPLICATIONS 3389
done through function 𝑐𝑜𝑠𝑡(𝑠) =∑𝑟∈𝑠
𝐴𝑟, which receives a solution 𝑠 as parameter and returns the covered area.
At last, after completely exploring the neighborhood, the 𝑠𝑤𝑎𝑝(., ., .) function is called, in order to move to thenewly best solution found, if one was found (𝑛𝑖𝑚𝑝 = true). This procedure repeats until no further improvementcan be done.
3.3.4. Iterated local search - ASLOP
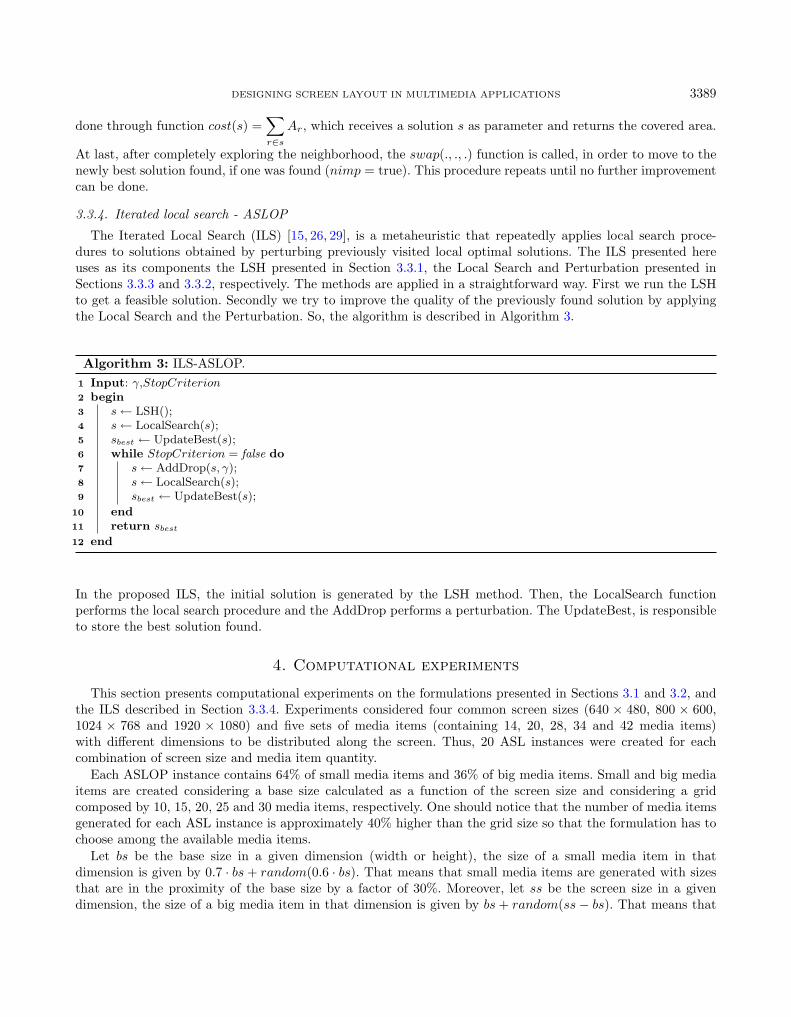
The Iterated Local Search (ILS) [15, 26, 29], is a metaheuristic that repeatedly applies local search proce-dures to solutions obtained by perturbing previously visited local optimal solutions. The ILS presented hereuses as its components the LSH presented in Section 3.3.1, the Local Search and Perturbation presented inSections 3.3.3 and 3.3.2, respectively. The methods are applied in a straightforward way. First we run the LSHto get a feasible solution. Secondly we try to improve the quality of the previously found solution by applyingthe Local Search and the Perturbation. So, the algorithm is described in Algorithm 3.
Algorithm 3: ILS-ASLOP.1 Input: 𝛾,𝑆𝑡𝑜𝑝𝐶𝑟𝑖𝑡𝑒𝑟𝑖𝑜𝑛2 begin3 𝑠← LSH();4 𝑠← LocalSearch(𝑠);5 𝑠𝑏𝑒𝑠𝑡 ← UpdateBest(𝑠);6 while 𝑆𝑡𝑜𝑝𝐶𝑟𝑖𝑡𝑒𝑟𝑖𝑜𝑛 = false do7 𝑠← AddDrop(𝑠, 𝛾);8 𝑠← LocalSearch(𝑠);9 𝑠𝑏𝑒𝑠𝑡 ← UpdateBest(𝑠);
10 end11 return 𝑠𝑏𝑒𝑠𝑡
12 end
In the proposed ILS, the initial solution is generated by the LSH method. Then, the LocalSearch functionperforms the local search procedure and the AddDrop performs a perturbation. The UpdateBest, is responsibleto store the best solution found.
4. Computational experiments
This section presents computational experiments on the formulations presented in Sections 3.1 and 3.2, andthe ILS described in Section 3.3.4. Experiments considered four common screen sizes (640 × 480, 800 × 600,1024 × 768 and 1920 × 1080) and five sets of media items (containing 14, 20, 28, 34 and 42 media items)with different dimensions to be distributed along the screen. Thus, 20 ASL instances were created for eachcombination of screen size and media item quantity.
Each ASLOP instance contains 64% of small media items and 36% of big media items. Small and big mediaitems are created considering a base size calculated as a function of the screen size and considering a gridcomposed by 10, 15, 20, 25 and 30 media items, respectively. One should notice that the number of media itemsgenerated for each ASL instance is approximately 40% higher than the grid size so that the formulation has tochoose among the available media items.
Let 𝑏𝑠 be the base size in a given dimension (width or height), the size of a small media item in thatdimension is given by 0.7 · 𝑏𝑠 + 𝑟𝑎𝑛𝑑𝑜𝑚(0.6 · 𝑏𝑠). That means that small media items are generated with sizesthat are in the proximity of the base size by a factor of 30%. Moreover, let 𝑠𝑠 be the screen size in a givendimension, the size of a big media item in that dimension is given by 𝑏𝑠 + 𝑟𝑎𝑛𝑑𝑜𝑚(𝑠𝑠 − 𝑏𝑠). That means that
3390 P.H. GONZALEZ ET AL.
Table 1. Results obtained by the mathematical formulations.
Distance Independent SetInstances Formulation Formulation
BSF Time GAP(%) BSF Time GAP(%)
640 480 1 76.597 65.010 0.000 76.597 501.260 0.000640 480 2 72.183 3600.000 0.780 67.420 3600.000 25.174640 480 3 84.551 3600.000 1.830 73.262 3600.000 50.930640 480 4 71.156 3600.000 4.799 0.000 3600.000 –640 480 5 66.374 2400.000 7.141 0.000 3600.000 –800 600 1 76.415 39.940 0.000 76.415 117.040 0.000800 600 2 74.543 3600.000 0.714 74.543 3600.000 12.859800 600 3 71.631 3600.000 3.321 71.631 3600.000 46.704800 600 4 85.117 3600.000 2.734 0.000 3600.000 –800 600 5 82.503 3600.000 6.929 0.000 3600.000 –1024 780 1 81.214 19.380 0.000 81.214 360.710 0.0001024 780 2 75.523 3600.000 0.858 76.733 3600.000 18.2401024 780 3 74.186 3600.000 3.741 73.458 3600.000 48.0301024 780 4 74.434 2787.534 6.437 63.198 3600.000 152.1201024 780 5 79.715 3600.000 6.156 0.000 3600.000 –1920 1080 1 69.423 26.880 0.000 69.423 41.430 0.0001920 1080 2 73.503 3600.000 0.646 70.235 3600.000 20.7901920 1080 3 75.528 3600.000 3.185 74.360 3600.000 34.7771920 1080 4 77.873 3600.000 3.850 0.000 3600.000 –1920 1080 5 78.832 3600.000 6.490 78.832 3600.000 174.854Average 76.065 2786.937 2.981 51.366 2931.022 41.748
big media items have its size between the base size and the screen size. All generated instances are available athttps://github.com/oca-cefetrj.
This section is organized as follows. The first subsection presents and analyze the results obtained by bothmathematical formulations. The second subsection presents the results obtained by the proposed ILS andcompare them with the results obtained by the mathematical formulation.
4.1. Mathematical formulation experiments
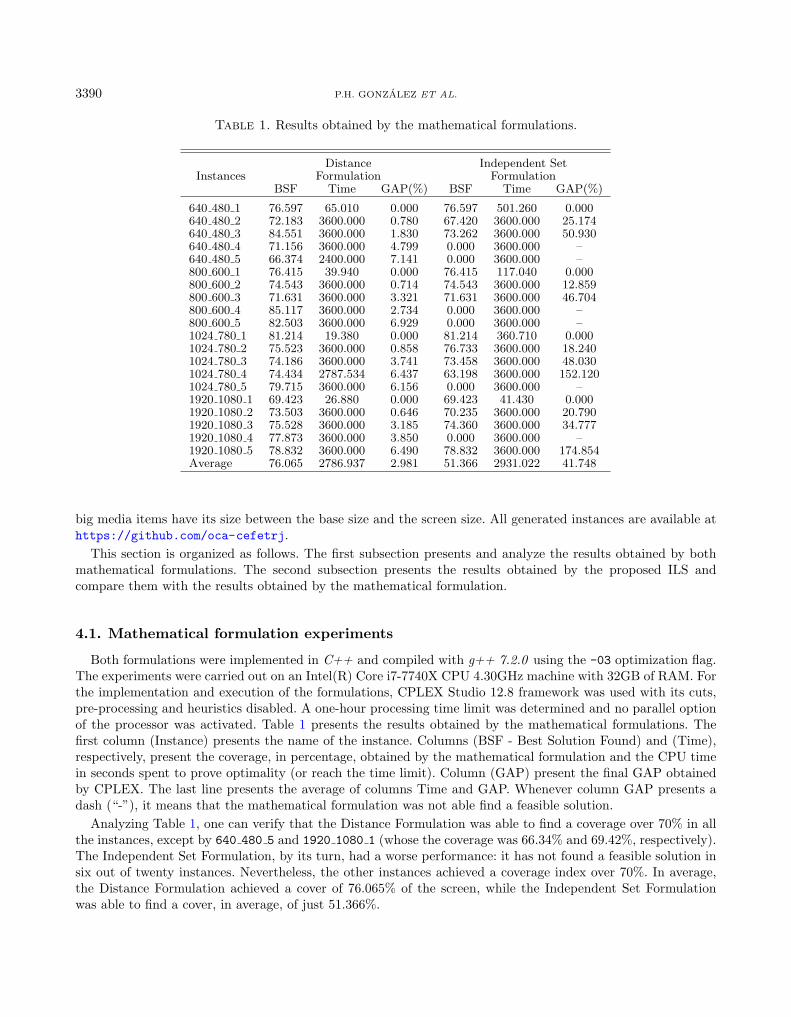
Both formulations were implemented in C++ and compiled with g++ 7.2.0 using the -03 optimization flag.The experiments were carried out on an Intel(R) Core i7-7740X CPU 4.30GHz machine with 32GB of RAM. Forthe implementation and execution of the formulations, CPLEX Studio 12.8 framework was used with its cuts,pre-processing and heuristics disabled. A one-hour processing time limit was determined and no parallel optionof the processor was activated. Table 1 presents the results obtained by the mathematical formulations. Thefirst column (Instance) presents the name of the instance. Columns (BSF - Best Solution Found) and (Time),respectively, present the coverage, in percentage, obtained by the mathematical formulation and the CPU timein seconds spent to prove optimality (or reach the time limit). Column (GAP) present the final GAP obtainedby CPLEX. The last line presents the average of columns Time and GAP. Whenever column GAP presents adash (“-”), it means that the mathematical formulation was not able find a feasible solution.
Analyzing Table 1, one can verify that the Distance Formulation was able to find a coverage over 70% in allthe instances, except by 640 480 5 and 1920 1080 1 (whose the coverage was 66.34% and 69.42%, respectively).The Independent Set Formulation, by its turn, had a worse performance: it has not found a feasible solution insix out of twenty instances. Nevertheless, the other instances achieved a coverage index over 70%. In average,the Distance Formulation achieved a cover of 76.065% of the screen, while the Independent Set Formulationwas able to find a cover, in average, of just 51.366%.
DESIGNING SCREEN LAYOUT IN MULTIMEDIA APPLICATIONS 3391
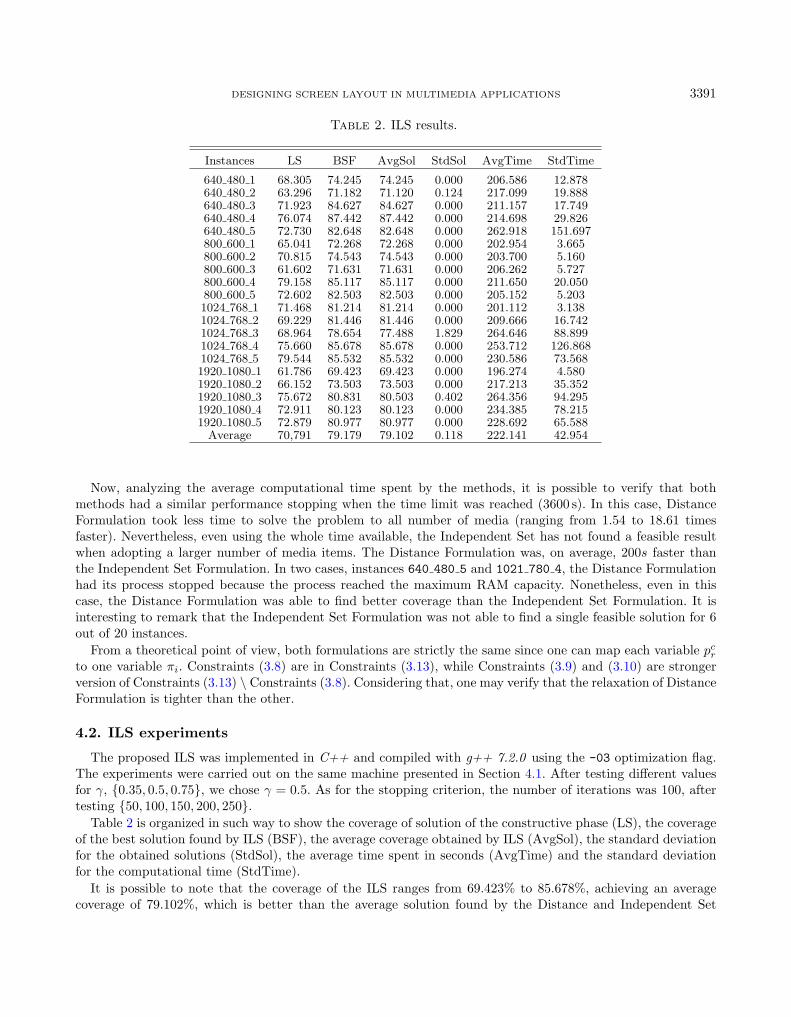
Table 2. ILS results.
Instances LS BSF AvgSol StdSol AvgTime StdTime
640 480 1 68.305 74.245 74.245 0.000 206.586 12.878640 480 2 63.296 71.182 71.120 0.124 217.099 19.888640 480 3 71.923 84.627 84.627 0.000 211.157 17.749640 480 4 76.074 87.442 87.442 0.000 214.698 29.826640 480 5 72.730 82.648 82.648 0.000 262.918 151.697800 600 1 65.041 72.268 72.268 0.000 202.954 3.665800 600 2 70.815 74.543 74.543 0.000 203.700 5.160800 600 3 61.602 71.631 71.631 0.000 206.262 5.727800 600 4 79.158 85.117 85.117 0.000 211.650 20.050800 600 5 72.602 82.503 82.503 0.000 205.152 5.2031024 768 1 71.468 81.214 81.214 0.000 201.112 3.1381024 768 2 69.229 81.446 81.446 0.000 209.666 16.7421024 768 3 68.964 78.654 77.488 1.829 264.646 88.8991024 768 4 75.660 85.678 85.678 0.000 253.712 126.8681024 768 5 79.544 85.532 85.532 0.000 230.586 73.5681920 1080 1 61.786 69.423 69.423 0.000 196.274 4.5801920 1080 2 66.152 73.503 73.503 0.000 217.213 35.3521920 1080 3 75.672 80.831 80.503 0.402 264.356 94.2951920 1080 4 72.911 80.123 80.123 0.000 234.385 78.2151920 1080 5 72.879 80.977 80.977 0.000 228.692 65.588
Average 70,791 79.179 79.102 0.118 222.141 42.954
Now, analyzing the average computational time spent by the methods, it is possible to verify that bothmethods had a similar performance stopping when the time limit was reached (3600 s). In this case, DistanceFormulation took less time to solve the problem to all number of media (ranging from 1.54 to 18.61 timesfaster). Nevertheless, even using the whole time available, the Independent Set has not found a feasible resultwhen adopting a larger number of media items. The Distance Formulation was, on average, 200𝑠 faster thanthe Independent Set Formulation. In two cases, instances 640 480 5 and 1021 780 4, the Distance Formulationhad its process stopped because the process reached the maximum RAM capacity. Nonetheless, even in thiscase, the Distance Formulation was able to find better coverage than the Independent Set Formulation. It isinteresting to remark that the Independent Set Formulation was not able to find a single feasible solution for 6out of 20 instances.
From a theoretical point of view, both formulations are strictly the same since one can map each variable 𝑝𝑐𝑟
to one variable 𝜋𝑖. Constraints (3.8) are in Constraints (3.13), while Constraints (3.9) and (3.10) are strongerversion of Constraints (3.13) ∖ Constraints (3.8). Considering that, one may verify that the relaxation of DistanceFormulation is tighter than the other.
4.2. ILS experiments
The proposed ILS was implemented in C++ and compiled with g++ 7.2.0 using the -03 optimization flag.The experiments were carried out on the same machine presented in Section 4.1. After testing different valuesfor 𝛾, 0.35, 0.5, 0.75, we chose 𝛾 = 0.5. As for the stopping criterion, the number of iterations was 100, aftertesting 50, 100, 150, 200, 250.
Table 2 is organized in such way to show the coverage of solution of the constructive phase (LS), the coverageof the best solution found by ILS (BSF), the average coverage obtained by ILS (AvgSol), the standard deviationfor the obtained solutions (StdSol), the average time spent in seconds (AvgTime) and the standard deviationfor the computational time (StdTime).
It is possible to note that the coverage of the ILS ranges from 69.423% to 85.678%, achieving an averagecoverage of 79.102%, which is better than the average solution found by the Distance and Independent Set
3392 P.H. GONZALEZ ET AL.
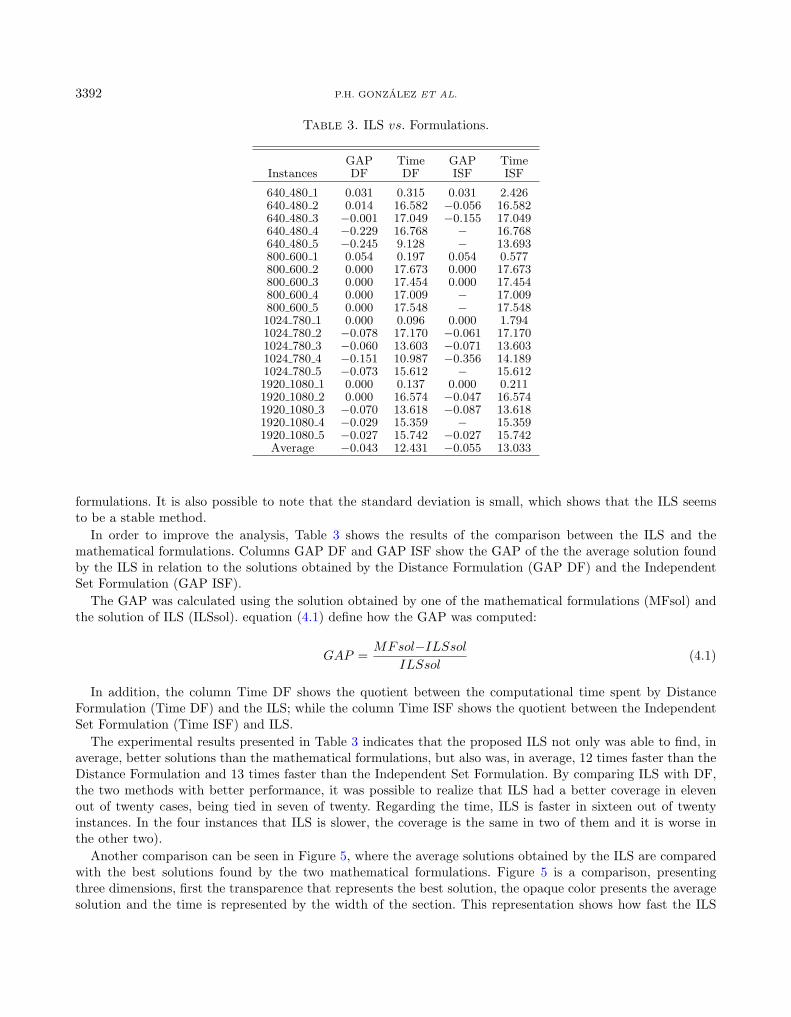
Table 3. ILS 𝑣𝑠. Formulations.
GAP Time GAP TimeInstances DF DF ISF ISF
640 480 1 0.031 0.315 0.031 2.426640 480 2 0.014 16.582 −0.056 16.582640 480 3 −0.001 17.049 −0.155 17.049640 480 4 −0.229 16.768 − 16.768640 480 5 −0.245 9.128 − 13.693800 600 1 0.054 0.197 0.054 0.577800 600 2 0.000 17.673 0.000 17.673800 600 3 0.000 17.454 0.000 17.454800 600 4 0.000 17.009 − 17.009800 600 5 0.000 17.548 − 17.5481024 780 1 0.000 0.096 0.000 1.7941024 780 2 −0.078 17.170 −0.061 17.1701024 780 3 −0.060 13.603 −0.071 13.6031024 780 4 −0.151 10.987 −0.356 14.1891024 780 5 −0.073 15.612 − 15.6121920 1080 1 0.000 0.137 0.000 0.2111920 1080 2 0.000 16.574 −0.047 16.5741920 1080 3 −0.070 13.618 −0.087 13.6181920 1080 4 −0.029 15.359 − 15.3591920 1080 5 −0.027 15.742 −0.027 15.742
Average −0.043 12.431 −0.055 13.033
formulations. It is also possible to note that the standard deviation is small, which shows that the ILS seemsto be a stable method.
In order to improve the analysis, Table 3 shows the results of the comparison between the ILS and themathematical formulations. Columns GAP DF and GAP ISF show the GAP of the the average solution foundby the ILS in relation to the solutions obtained by the Distance Formulation (GAP DF) and the IndependentSet Formulation (GAP ISF).
The GAP was calculated using the solution obtained by one of the mathematical formulations (MFsol) andthe solution of ILS (ILSsol). equation (4.1) define how the GAP was computed:
𝐺𝐴𝑃 =𝑀𝐹𝑠𝑜𝑙−𝐼𝐿𝑆𝑠𝑜𝑙
𝐼𝐿𝑆𝑠𝑜𝑙(4.1)
In addition, the column Time DF shows the quotient between the computational time spent by DistanceFormulation (Time DF) and the ILS; while the column Time ISF shows the quotient between the IndependentSet Formulation (Time ISF) and ILS.
The experimental results presented in Table 3 indicates that the proposed ILS not only was able to find, inaverage, better solutions than the mathematical formulations, but also was, in average, 12 times faster than theDistance Formulation and 13 times faster than the Independent Set Formulation. By comparing ILS with DF,the two methods with better performance, it was possible to realize that ILS had a better coverage in elevenout of twenty cases, being tied in seven of twenty. Regarding the time, ILS is faster in sixteen out of twentyinstances. In the four instances that ILS is slower, the coverage is the same in two of them and it is worse inthe other two).
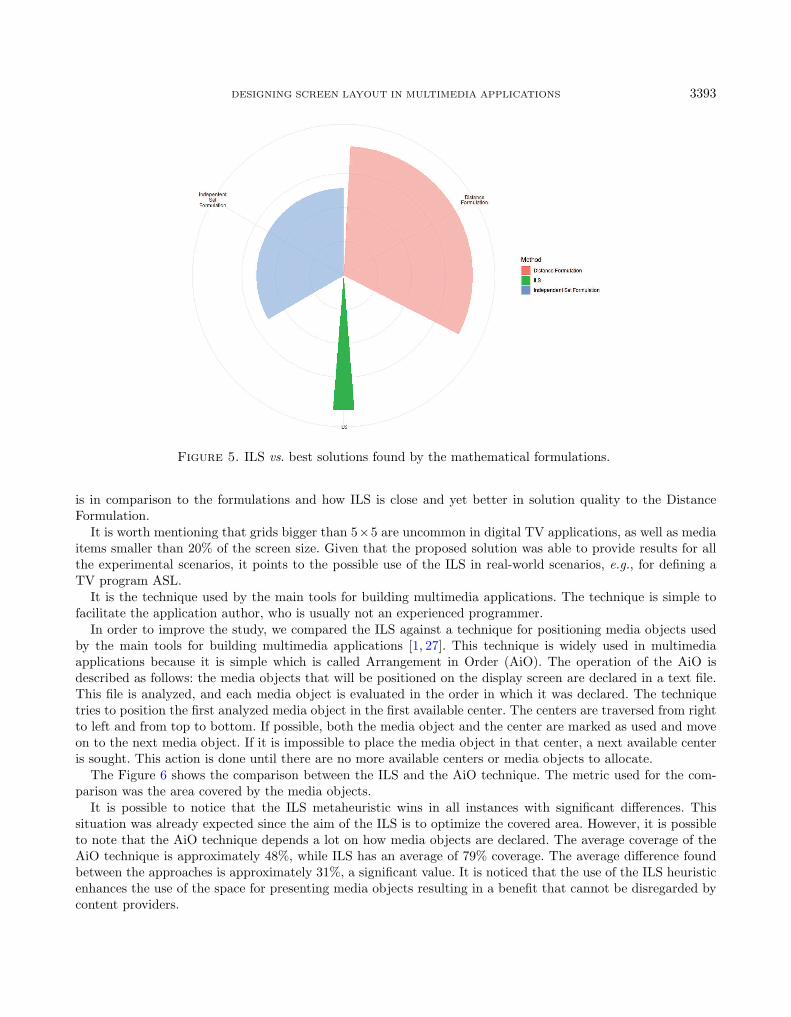
Another comparison can be seen in Figure 5, where the average solutions obtained by the ILS are comparedwith the best solutions found by the two mathematical formulations. Figure 5 is a comparison, presentingthree dimensions, first the transparence that represents the best solution, the opaque color presents the averagesolution and the time is represented by the width of the section. This representation shows how fast the ILS
DESIGNING SCREEN LAYOUT IN MULTIMEDIA APPLICATIONS 3393
Figure 5. ILS vs. best solutions found by the mathematical formulations.
is in comparison to the formulations and how ILS is close and yet better in solution quality to the DistanceFormulation.
It is worth mentioning that grids bigger than 5×5 are uncommon in digital TV applications, as well as mediaitems smaller than 20% of the screen size. Given that the proposed solution was able to provide results for allthe experimental scenarios, it points to the possible use of the ILS in real-world scenarios, e.g., for defining aTV program ASL.
It is the technique used by the main tools for building multimedia applications. The technique is simple tofacilitate the application author, who is usually not an experienced programmer.
In order to improve the study, we compared the ILS against a technique for positioning media objects usedby the main tools for building multimedia applications [1, 27]. This technique is widely used in multimediaapplications because it is simple which is called Arrangement in Order (AiO). The operation of the AiO isdescribed as follows: the media objects that will be positioned on the display screen are declared in a text file.This file is analyzed, and each media object is evaluated in the order in which it was declared. The techniquetries to position the first analyzed media object in the first available center. The centers are traversed from rightto left and from top to bottom. If possible, both the media object and the center are marked as used and moveon to the next media object. If it is impossible to place the media object in that center, a next available centeris sought. This action is done until there are no more available centers or media objects to allocate.
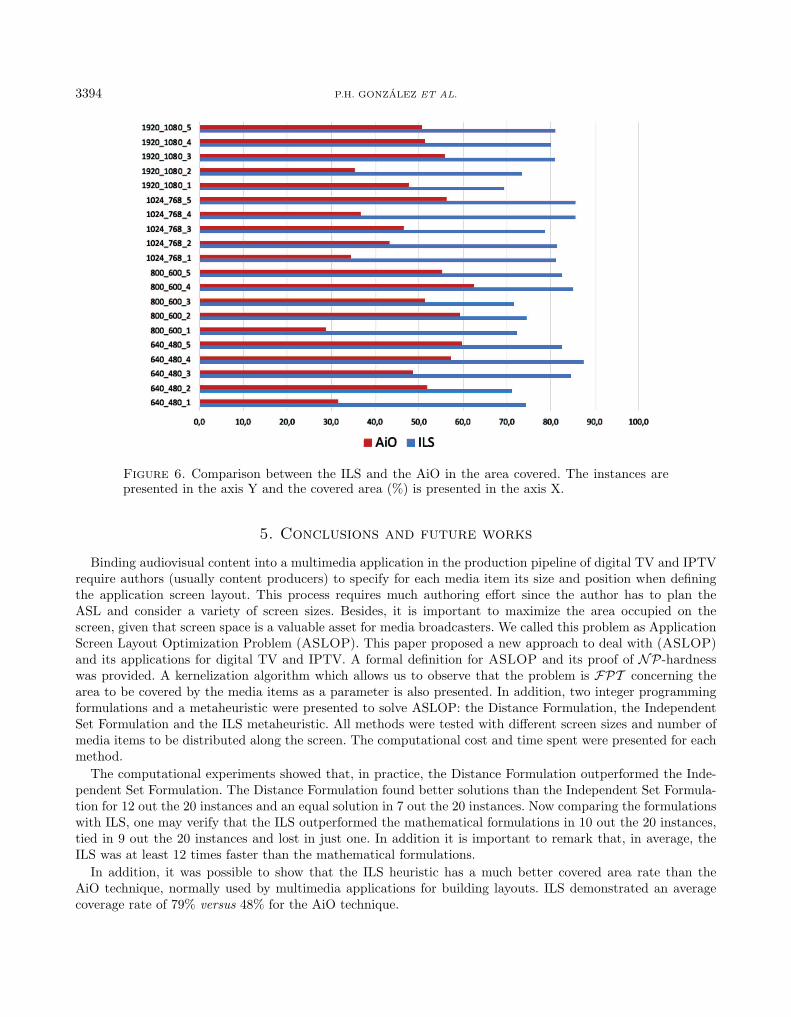
The Figure 6 shows the comparison between the ILS and the AiO technique. The metric used for the com-parison was the area covered by the media objects.
It is possible to notice that the ILS metaheuristic wins in all instances with significant differences. Thissituation was already expected since the aim of the ILS is to optimize the covered area. However, it is possibleto note that the AiO technique depends a lot on how media objects are declared. The average coverage of theAiO technique is approximately 48%, while ILS has an average of 79% coverage. The average difference foundbetween the approaches is approximately 31%, a significant value. It is noticed that the use of the ILS heuristicenhances the use of the space for presenting media objects resulting in a benefit that cannot be disregarded bycontent providers.
3394 P.H. GONZALEZ ET AL.
Figure 6. Comparison between the ILS and the AiO in the area covered. The instances arepresented in the axis Y and the covered area (%) is presented in the axis X.
5. Conclusions and future works
Binding audiovisual content into a multimedia application in the production pipeline of digital TV and IPTVrequire authors (usually content producers) to specify for each media item its size and position when definingthe application screen layout. This process requires much authoring effort since the author has to plan theASL and consider a variety of screen sizes. Besides, it is important to maximize the area occupied on thescreen, given that screen space is a valuable asset for media broadcasters. We called this problem as ApplicationScreen Layout Optimization Problem (ASLOP). This paper proposed a new approach to deal with (ASLOP)and its applications for digital TV and IPTV. A formal definition for ASLOP and its proof of 𝒩𝒫-hardnesswas provided. A kernelization algorithm which allows us to observe that the problem is ℱ𝒫𝒯 concerning thearea to be covered by the media items as a parameter is also presented. In addition, two integer programmingformulations and a metaheuristic were presented to solve ASLOP: the Distance Formulation, the IndependentSet Formulation and the ILS metaheuristic. All methods were tested with different screen sizes and number ofmedia items to be distributed along the screen. The computational cost and time spent were presented for eachmethod.
The computational experiments showed that, in practice, the Distance Formulation outperformed the Inde-pendent Set Formulation. The Distance Formulation found better solutions than the Independent Set Formula-tion for 12 out the 20 instances and an equal solution in 7 out the 20 instances. Now comparing the formulationswith ILS, one may verify that the ILS outperformed the mathematical formulations in 10 out the 20 instances,tied in 9 out the 20 instances and lost in just one. In addition it is important to remark that, in average, theILS was at least 12 times faster than the mathematical formulations.
In addition, it was possible to show that the ILS heuristic has a much better covered area rate than theAiO technique, normally used by multimedia applications for building layouts. ILS demonstrated an averagecoverage rate of 79% versus 48% for the AiO technique.
DESIGNING SCREEN LAYOUT IN MULTIMEDIA APPLICATIONS 3395
5.1. Future works
Future researches could focus on strengthening the formulations and developing efficient cutting-plane algo-rithms, so a branch and cut technique could be developed. Considering the structure of the problem, one mayfocus on using clique cuts to do the above proposed. It is also possible to combine the ILS with the formulationsin a way to improve the starting solution generating a positive effect on branch and bound and branch and cutprunes’, decreasing the computational time. In order to do combine heuristics and exact methods investigatinghybrid methods that combine exact methods, meta-heuristics and data mining seems to be a suited path topursue [14,16,30].
Also recalling that ASLOP generalizes classical combinatorial optimization problems like Subset Sum andKnapsack, and as shown in Theorem 2.1, the problem remains NP-hard even when both the screen and theinput media have some of the dimensions equal to one. This implies that combinatorial explosions are inherent insolving the problem, even for instances that intuitively should be “easy”, for example, instances with simplifiedshapes (i.e., having both media and media items with just one dimension). To try to unravel characteristicsthat make instances of the problem difficult, we should go into deeper computational complexity issues. Moreprecisely, there is a branch of Computing Theory called Parameterized Complexity Theory that aims to mapthe parameters that are sources of the intractability of a problem. An analysis of the Parameterized Complexityof ASLOP is also a potential future work.
5.2. Some generalizations of the problem
As one can see, the ASLOP problem is a simple version of the real problem having three structural restrictions:fitting in the screen dimension, overlap avoidance, positioning items in candidate central points of the given grid.Having said that, several variants could be proposed. The first one, instead of considering the area coverage,one must decide that it should be interesting to weigh the media and maximize the summation of the weight ofthe used items instead of maximizing the covered area. Note that ASLOP is a particular case of this problemwhere the weight of each item corresponds to its area. This variant can be explained when different enterpriseshave different marketing budgets and are willing to pay different amounts for their advertising. Recall that onecan handle this variant using the methods proposed in this paper.
One possible second variant would deal with conflict sets of items, where items from such sets are not allowedtogether in the solution. This can be easily seen whenever two competing brands decide to try to advertiseon the same platform. In other words, in addition to the screen 𝑅, the set of media items 𝑀 , and the grid𝐺𝐶 , we are given sets 𝐿1, 𝐿2, . . . 𝐿ℓ of items and asked to find a conflict-free solution 𝑆 for the problem where|𝑆∩𝐿𝑖| ≤ 1 for each 1 ≤ 𝑖 ≤ ℓ, representing that a solution 𝑆 contains at most one item by a group of conflictingelements. To deal with this variant, both presented mathematical formulations will need one more constraintfor each conflict set. These constraints will ensure that at most one item in the set is selected. From the ILSperspective, to adapt it to this variant, one should keep an auxiliary data structure to remove/add candidateswhenever one item of a conflict set is selected or removed from the current solution.
Another path to pursue consists of considering multiple media with different shapes, for example, rectangularand circular media altogether, which leads to the necessity of adjustments in equations (3.3) and (3.4). Besidesthese adjustments, the proposed methods are also able to deal with this variant.
Another point that may be investigated as future work is the choice of the centers as well as considering thatthe candidate centers are not positioned according to a grid.
Acknowledgements. This work was partially supported by the National Council for Scientific and Technological Develop-ment - CNPq, under grants #307835/2017-0, #303726/2017-2 and #309832/2020-9 and by the Fundacao Carlos ChagasFilho de Amparo a Pesquisa do Estado do Rio de Janeiro - FAPERJ, grants #233926 and E-26/203.272/2017.
References
[1] G.F. Amorim, J.A.F. dos Santos and D.C. Muchaluat-Saade, Providing adjustable and dynamic spatial layouts for multimediaapplications with style. Multimed. Tools. Appl. 79 (2020) 25989–26021.
3396 P.H. GONZALEZ ET AL.
[2] A. Atamturk, G.L. Nemhauser and M.W.P. Savelsbergh, Conflict graphs in solving integer programming problems. Eur. J.Oper. Res. 121 (2000) 40–55.
[3] R.G.A. Azevedo, E.C. Araujo, B. Lima, L.F.G. Soares and M.F. Moreno, Composer: meeting non-functional aspects of hyper-media authoring environment. Multimed. Tools Appl. 70 (2014) 1199–1228.
[4] J.E. Beasley, An exact two-dimensional non-guillotine cutting tree search procedure. Oper. Res. 33 (1985) 49–64.
[5] D. Bulterman, P. Cesar and R.L. Guimaraes, Socially-aware multimedia authoring: Past, present, and future. ACM Trans.Multimedia Comput. Commun. Appl. (TOMCCAP) 9 (2013) 35.
[6] A. Caprara and M. Monaci, On the two-dimensional knapsack problem. Oper. Res. Lett. 32 (2004) 5–14.
[7] N. Clube, A liberdade de desenvolver e compartilhar conteudo interativo (2011). http://clube.ncl.org.br/
[8] M. Cygan, F.V. Fomin, L. Kowalik, D. Lokshtanov, D. Marx, M. Pilipczuk, M. Pilipczuk and S. Saurabh, Parameterizedalgorithms, Vol. 4. Springer (2015).
[9] R.S. de Abreu, D. Mattos, Jd. Santos, G. Ghinea and D.C. Muchaluat-Saade, Toward content-driven intelligent authoring ofmulsemedia applications. IEEE MultiMed. 28 (2021) 7–16.
[10] D.P. de Mattos and D.C. Muchaluat-Saade, Steve: Spatial-temporal view editor for authoring hypermedia documents. In:Proceedings of the 22Nd Brazilian Symposium on Multimedia and the Web, ACM, New York, NY, USA, Webmedia ’16 (2016)63–70. DOI: 10.1145/2976796.2976865
[11] A.M. Del Valle, T.A. de Queiroz, F.K. Miyazawa and E.C. Xavier, Heuristics for two-dimensional knapsack and cutting stockproblems with items of irregular shape. Expert Syst. Appl. 39 (2012) 12589–12598.
[12] R.G. Downey and M.R. Fellows, Fundamentals of parameterized complexity, vol 4. Springer (2013).
[13] K.A. Dowsland and W.B. Dowsland, Packing problems. Eur. J. Oper. Res. 56 (1992) 2–14.
[14] P.H. Gonzalez and J. Brandao, A biased random key genetic algorithm to solve the transmission expansion planning problemwith re-design. In: 2018 IEEE Congress on Evolutionary Computation (CEC), IEEE (2018) 1–7.
[15] P.H. Gonzalez, L. Simonetti, P. Michelon, C. Martinhon and E. Santos, A variable fixing heuristic with local branching for thefixed charge uncapacitated network design problem with user-optimal flow. Comput. Oper. Res. 76 (2016) 134–146.
[16] P.H. Gonzalez, A.F.U.S. Macambira, R.V. Pinto, L. Simonetti, M. Maculan and P. Michelon, New proposals for modelling andsolving the problem of covering solids using spheres of different radii. RAIRO-Oper. Res. 54 (2020) 873–882.
[17] HbbTV Association (2018) HbbTV 2.0.2 Specification. https://www.hbbtv.org/resource\discretionary-library/#specifications Accessed 20 July (2018).
[18] K. He, Y. Jin and W. Huang, Heuristics for two-dimensional strip packing problem with 90 rotations. Expert Syst. Appl. 40(2013) 5542–5550.
[19] E. Huang and R.E. Korf, Optimal rectangle packing: An absolute placement approach. J. Artif. Intell. Res. 46 (2013) 47–87.
[20] ITU, Nested Context Language (NCL) and Ginga-NCL for IPTV services. http://www.itu.int/rec/T-REC-H.761-200904-S,iTU-T Recommendation H.761 Accessed Mar. 13, 2018 (2009).
[21] ITU, Integrated broadcast-broadband systems. https://www.itu.int/pub/R-REP-BT.2267-8-2018, Report ITU-R BT.2267-8Accessed 15 December, 2018 (2018).
[22] R.M. Karp, Reducibility among combinatorial problems. In: Complexity of computer computations, Springer (1972) 85–103.
[23] S.C.H. Leung and D. Zhang, A fast layer-based heuristic for non-guillotine strip packing. Expert Syst. Appl. 38 (2011) 13032–13042.
[24] J. Li, T. Roggla, M. Glancy , J. Jansen and P. Cesar, A new production platform for authoring object-based multiscreen tvviewing experiences. In: Proceedings of the 2018 ACM International Conference on Interactive Experiences for TV and OnlineVideo (2018) 115–126.
[25] J. Li, Z. Zheng, B. Meixner, T. Roggla, M. Glancy and P. Cesar, Designing an object-based preproduction tool for multiscreentv viewing. In: Extended Abstracts of the 2018 CHI Conference on Human Factors in Computing Systems (2018) 1–6.
[26] H. Lourenco, O. Martin and T. Stutzle, Iterated local search. In “handbook of metaheuristics”, edited by F. glover andG. kochenberger. isorms 57 (2002) 321–353.
[27] D.P.D. Mattos, D.C. Muchaluat-Saade and G. Ghinea, Beyond multimedia authoring: On the need for mulsemedia authoringtools. IEEE MultiMed. 54 (2021) 1–31.
[28] R. Meirelles, C. Julio and A.M. Dias, Economia e Consumo na Era da Pandemia. Tech. rep., Locomotiva - Pesquisa e Estrategia(2020). DOI: 10.1017/CBO9781107415324.004
[29] E. Santos, L.S. Ochi, L. Simonetti and P.H. Gonzalez, A hybrid heuristic based on iterated local search for multivehicleinventory routing problem. Electron. Notes Discrete Math. 52 (2016) 197–204.
[30] G. Souto, I. Morais, G.R. Mauri, G.M. Ribeiro and P.H. Gonzalez, A hybrid matheuristic for the two-stage capacitated facilitylocation problem. Expert Syst. Appl. 185 (2021) 115501.
[31] R.E. Tarjan and A.E. Trojanowski, Finding a maximum independent set. SIAM J. Comput. 6 (1977) 537–546.
[32] W3C, Synchronized Multimedia Integration Language - SMIL 3.0 Specification. http://www.w3c.org/TR/SMIL3, world-WideWeb Consortium Recommendation Accessed Fev. 15, 2018 (2008).
[33] W3C, HTML5: A vocabulary and associated APIs for HTML and XHTML. https://www.w3.org/TR/2010/WD-html5-20100624/, world-Wide Web Consortium Recommendation Accessed Mar. 12, 2018 (2014).
[34] W3C, CSS Flexible Box Layout Module Level 1. https://www.w3.org/TR/css-flexbox-1/, w3C Candidate RecommendationAccessed Apr. 05, 2018 (2017).
[35] W3C, CSS Grid Layout Module Level 1. https://www.w3.org/TR/css-grid/, w3C Candidate Recommendation Accessed Apr.05, 2018 (2017).
DESIGNING SCREEN LAYOUT IN MULTIMEDIA APPLICATIONS 3397
[36] Y. Wang and L. Chen, Two-dimensional residual-space-maximized packing. Expert Syst. Appl. 42 (2015) 3297–3305.
[37] L. Wolsey, Integer Programming. Wiley Series in Discrete Mathematics and Optimization, Wiley (1998).
[38] G. Wascher, H. Haußner and H. Schumann, An improved typology of cutting and packing problems. Eur. J. Oper. Res. 183(2007) 1109–1130.
[39] Z.Z. Zeng, X.G. Yu , K. He and Z.H. Fu, Adaptive tabu search and variable neighborhood descent for packing unequal circlesinto a square. Appl. Soft Comput. J. 65 (2018) 196–213.
[40] B. Zhang, H.F. Teng, Y.J. Shi, Layout optimization of satellite module using soft computing techniques. Appl. Soft Comput.8 (2008) 507–521.
This journal is currently published in open access under a Subscribe-to-Open model (S2O). S2O is a transformativemodel that aims to move subscription journals to open access. Open access is the free, immediate, online availability ofresearch articles combined with the rights to use these articles fully in the digital environment. We are thankful to oursubscribers and sponsors for making it possible to publish this journal in open access, free of charge for authors.
Please help to maintain this journal in open access!
Check that your library subscribes to the journal, or make a personal donation to the S2O programme, by [email protected]
More information, including a list of sponsors and a financial transparency report, available at: https://www.edpsciences.org/en/maths-s2o-programme