Designing Process Improvement of Finished Good On Time Release and Performance Indicator Tool in...
11
This content has been downloaded from IOPscience. Please scroll down to see the full text. Download details: IP Address: 50.17.10.133 This content was downloaded on 06/04/2014 at 07:40 Please note that terms and conditions apply. Designing Process Improvement of Finished Good On Time Release and Performance Indicator Tool in Milk Industry Using Business Process Reengineering Method View the table of contents for this issue, or go to the journal homepage for more 2014 J. Phys.: Conf. Ser. 495 012011 (http://iopscience.iop.org/1742-6596/495/1/012011) Home Search Collections Journals About Contact us My IOPscience
Transcript of Designing Process Improvement of Finished Good On Time Release and Performance Indicator Tool in...
This content has been downloaded from IOPscience. Please scroll down to see the full text.
Download details:
IP Address: 50.17.10.133
This content was downloaded on 06/04/2014 at 07:40
Please note that terms and conditions apply.
Designing Process Improvement of Finished Good On Time Release and Performance
Indicator Tool in Milk Industry Using Business Process Reengineering Method
View the table of contents for this issue, or go to the journal homepage for more
2014 J. Phys.: Conf. Ser. 495 012011
(http://iopscience.iop.org/1742-6596/495/1/012011)
Home Search Collections Journals About Contact us My IOPscience
Designing Process Improvement of Finished Good On Time
Release and Performance Indicator Tool in Milk Industry
Using Business Process Reengineering Method
M Dachyar, E Christy
Department of Industrial Engineering University of Indonesia, Depok 16424, Indonesia
E-mail: [email protected]
Abstract. To maintain position as a major milk producer, the Indonesian milk industry should do some business development with the purpose of increasing customer service level. One strategy is to create on time release conditions for finished goods which will be distributed to customers and distributors. To achieve this condition, management information systems of finished goods on time release needs to be improved. The focus of this research is to conduct business process improvement using Business Process Reengineering (BPR). The deliverable
key of this study is a comprehensive business strategy which is the solution of the root problems. To achieve the goal, evaluation, reengineering, and improvement of the ERP system
are conducted. To visualize the predicted implementation, a simulation model is built by Oracle
BPM. The output of this simulation showed that the proposed solution could effectively reduce the process lead time and increase the number of quality releases.
1. Introduction
Increasing number of baby birth has made many FMCG (Fast Moving Consumer Good) companies for the baby willing to expand their market share by meeting the demand of baby products, one of the products is the baby milk. The demand for baby milk is increased by 6.6% (in volume) annually; from 37.300 tonnes in 2004 to 47.140 tons in 2008 [1].
Market growth, market competitive, and increased demand urged dairy industry to implement some strategies to maintain the position as a major dairy. One of the strategies is to increase customer service levels by increasing performance on quality releases – known as the finished good on time release. However, in one of multinational dairy companies its release has not been stable and on time. There is also no mapping of process information flow and no measurement for on time release process.
In this strategy, quality division has the most important role. The performance of QFS (Quality Food Safety) Division is needed to be improved in order to achieve the strategy.
ScieTech 2014 IOP PublishingJournal of Physics: Conference Series 495 (2014) 012011 doi:10.1088/1742-6596/495/1/012011
Content from this work may be used under the terms of the Creative Commons Attribution 3.0 licence. Any further distributionof this work must maintain attribution to the author(s) and the title of the work, journal citation and DOI.
Published under licence by IOP Publishing Ltd 1
2. Literature Review
2.1. Business Process Reengineering
Business process reengineering (BPR) is a business management strategy that focuses on the analysis and design of material and information workflows and processes in an organization [2]. It recommended that the old process system should be removed and replaced with a new system which is more innovative and effective.
There are several opinions about Business Process Reengineering. BPR is radical rethinking and redesign of business processes to achieve dramatic improvements modern measures of performance [3]. Business process reengineering introduces of new work strategies, actual process design, and implementation of the change in all its complex dimensions [4]. Reengineering process is a radical scrutiny, questioning, redefinition, and redesign of business processes with the aim of eliminating all activities not central to the process goals [2]. BPR is the methodology focused on the process and directly performed by the top management by performing the changes radical in order to make a better performance [5]. The four main reasons why companies need to develop business process reengineering are to fix and improve the customer service, to reduce cycle time by reducing non-added value activity, to reduce production costs and/or services, and to improve quality [3].
2.2. BPR Methods
Variuos methods of BPR have been introduced to facilitate the process of the reengineering. There are four methods that could be applied in the implementation of BPR [3]. Below are the list of BPR methods could be applied: � Mayer Method: Motivating reengineering, Justifying reengineering, Planning reengineering,
Setting up for reengineering, As-is description and validation, To-be design and validation, andImplementation� Feldman Method: Develop vision and strategy, Create desired culture, Integrate and improve
enterprise, and Develop technology solutions� Harrison Method: Determine customer requirements and goals for the process, Map and measure
the existing process, Analyze and modify existing process, Design a reengineered process, andImplement the reengineered process� Muthu, Whitman, and Cheraghi Method: Prepare for Business Process Reengineering, Map and
Analyze As-Is Process, Design To-Be Process, Reengineered Process, and Improve Continuously.
2.3. BPR Characteristic
Four main characteristics of BPR [6] ; fundamental, radical, dramatic, and processes. Fundamental – The analysis is based on two aspects: “what” (focus on gaining the objectives of company) and “how” (focus on the order of activities in each process). Radical – The method is undertaken by obtaining the root problem and ignoring all the structures and proce-dures that already exist to create a new process to be run. In some BPR approaches, existing systems may not be changed in radical way because of considering some factors such as the need to do change management, build an integrated system, project management, and select stakeholders. Dramatic – The purpose of BPR is to achieve the improved performance dramatically, so that the ambitious and aggressive goal can be created. Processes – A process is a set of activities that requires a few input and produces an output that gives value to customer.
2.4. BPR Tools and Techniques
There are several tools and techniques of BPR [7]. � Process visualization ; The successful key of reengineering is based on the development of the
process’ vision.� Process mapping and modeling ; Process flowcharting, IDEF, role activity diagram, SIPOC
diagram, and others tools can be used to map and model the process.
ScieTech 2014 IOP PublishingJournal of Physics: Conference Series 495 (2014) 012011 doi:10.1088/1742-6596/495/1/012011
2
� Change management ; Human elements are needed to be combined with reengineering processdue to the big influence of human’s work and work method
� Benchmarking ; This tool displays the process visually and its development in the operations ofother organizations.
� Process and customer focus ; Main purpose of BPR is to redesign the process due to increase theperformance by customer’s perspective.
� Problem solving and diagnosis : Pareto diagram, cognitive map, and other problems solving toolscan be used.
� Process prototyping and simulation ; By doing simulation, BPR project team would be easier todetermine the process needed to be reengineered and the effects of its. Simulation provides thestructural visual model which is easier to be understood, analyzed, and improved.
� Project management ; By this tool, budgeting, project scheduling, and others project indicator canbe known.
� Process measurement ; Activity-based costing, statistic process control, and others measurementcan be used.
2.5. Information Technology
The use of information technology is one of factors that give a big contribution to the company. Information technology has an important role in business process reengineering [8]. The new technology allows the creation and redesign of business processes. By using technology, the modeling and simulation of systems and processes, will ease the implementation process.
There are many situations that randomly affect the simulation so that simulations cannot be modeled by using others analytical technique. Simulation is the last tool that can be used when it is found that all methods of modeling cannot be done [8]. The technology is also needed in process mapping. A simple process mapping simply cannot give an enough explanation and understanding to know what the things needed to be redesigned are though it is done by big project [8]. Process map helps project teams to understand the framework of existing problems. However, the process should be supported by numerical analysis due to the team knows the things that need to be changed. Therefore, some programs and software can be used to make the process map and simulation of the as-is model and to-be engineered.
2.6. Enterprise Resource Planning
ERP systems have been considered as an important development in information technology in the company since the 1990s. By using the ERP system, all of the information that flows within a company can be integrated so that it will improve the efficiency and effectiveness of the organizational cross-functional [3].
ERP is a cross-functional enterprise systems that integrate and automize a lot of company's internal business processes, especially in the fields of manufacturing, logistic, distribution, accounting, finance, and human resource. ERP helps companies to achieve efficiency, agility, and responsiveness that are necessary to be succeess in a dynamic business environment [3]. ERP software typically consists of integrated modules that give the appearance of a real-time cross-functional in a company’s core business process – such as production, order processing, and sales – and its resources – such as cash flow, raw materials, production capacity, and people.
The lack of conformity between the strategy, structure, organization process, and the selection of the ERP application often give a problem or risk. ERP literature and business process reengineering indicate that ERP system could not be alone to increase company’s performance except the organization restructures the operational process. This is usually achieved through a business process reengineering [3].
ScieTech 2014 IOP PublishingJournal of Physics: Conference Series 495 (2014) 012011 doi:10.1088/1742-6596/495/1/012011
3
3. Research Methodology
This research was conducted based on the Business Process Reengineering (BPR) method which has five steps such as Prepare for Business Process Reengineering, Map and analyze As-Is process, Design to-be process, Re-engineered process, and Improve Continuously.
In the first step – Prepare for Engineering – the start preparation of BPR was done by identifying the company’s purpose or objective of the case and developing the strategies. In the second step – Map and Analyze As-Is Process – the flow of business processes related was mapped, then the investigation and evaluation of business processes were conducted. In the third step – Design To-Be Process – the best solutions and innovation for business process improvement was discussed. In the fourth step – Reengineered Process – the draft and development of implementation plans. In the fifth step – Improve Continuously – the monitoring and controlling of the new system were being run so the new system’s performance can be evaluated and measured in order to make continuous improvement. Some scenarios would be performed to test the as-is and to-be process. To do simulation, Oracle BPM software is used. The two simulations were compared to see each performance.
Data is collected by using secondary and primary data. Secondary data is data that is derived from QFS Division (Quality Food Safety) in the form of its historical record data of quality release or finished goods on time release process. Primary data is data that is gained by directly doing observation and interview with the supervisor, the staff of QFS Division, and operators.
Secondary data is the record of 418 data. The variable note is time which is called as a lead time of quality releases or release time. The lead time is determined by the production order number, the date of quality release report, and the date of sample received.
4. Analysis Result
4.1. Step 1: Prepare for Engineering
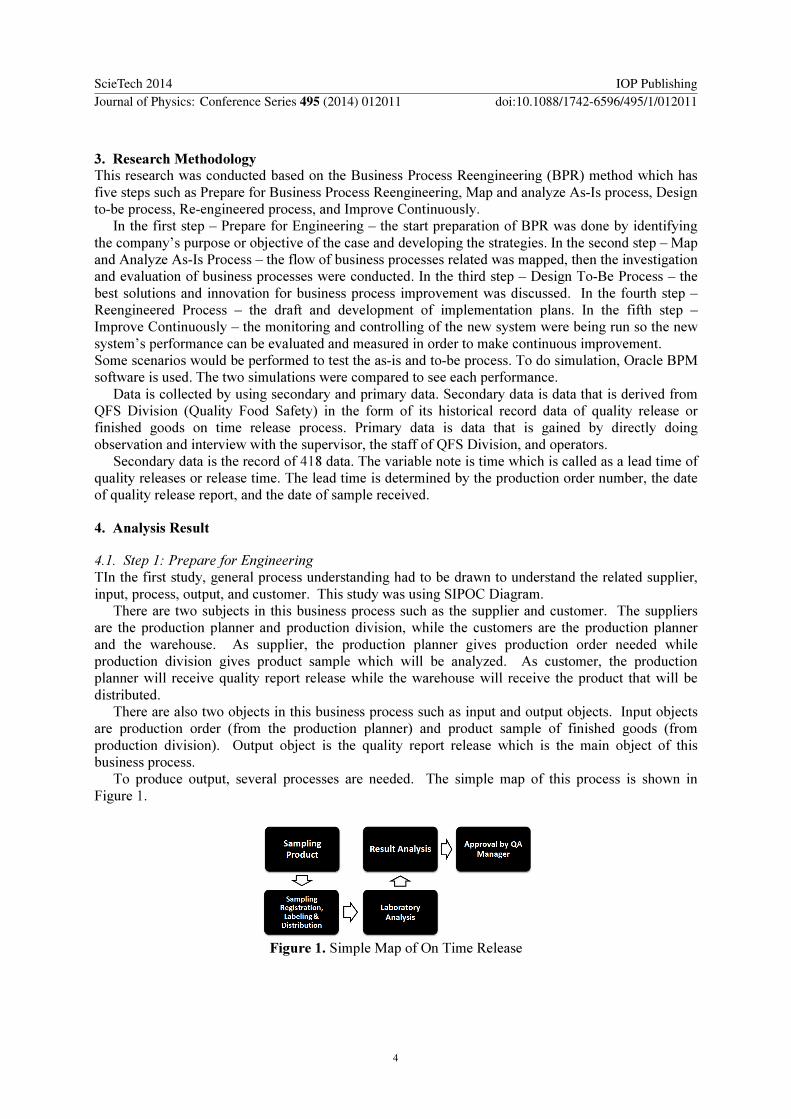
TIn the first study, general process understanding had to be drawn to understand the related supplier, input, process, output, and customer. This study was using SIPOC Diagram.
There are two subjects in this business process such as the supplier and customer. The suppliers are the production planner and production division, while the customers are the production planner and the warehouse. As supplier, the production planner gives production order needed while production division gives product sample which will be analyzed. As customer, the production planner will receive quality report release while the warehouse will receive the product that will be distributed.
There are also two objects in this business process such as input and output objects. Input objects are production order (from the production planner) and product sample of finished goods (from production division). Output object is the quality report release which is the main object of this business process.
To produce output, several processes are needed. The simple map of this process is shown in Figure 1.
Figure 1. Simple Map of On Time Release
ScieTech 2014 IOP PublishingJournal of Physics: Conference Series 495 (2014) 012011 doi:10.1088/1742-6596/495/1/012011
4
4.2. Step 2: Map and Analyze As-Is Process
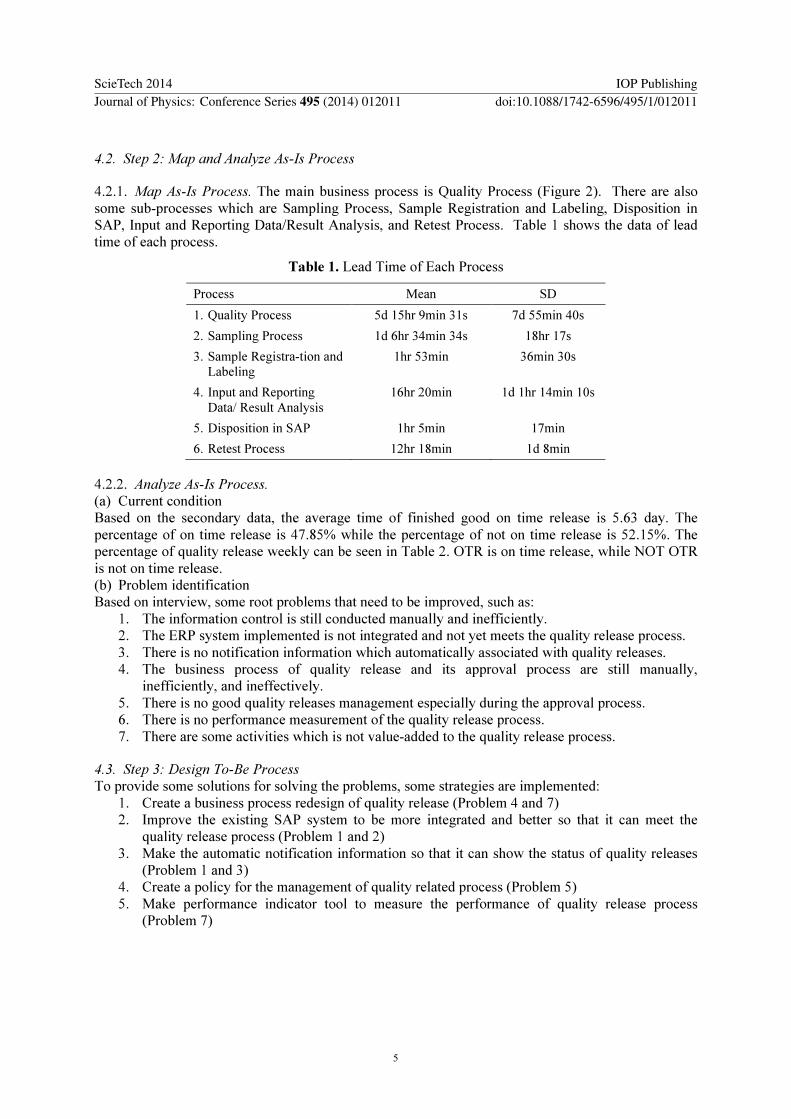
4.2.1. Map As-Is Process. The main business process is Quality Process (Figure 2). There are also some sub-processes which are Sampling Process, Sample Registration and Labeling, Disposition in SAP, Input and Reporting Data/Result Analysis, and Retest Process. Table 1 shows the data of lead time of each process.
Table 1. Lead Time of Each Process
Process Mean SD
1. Quality Process 5d 15hr 9min 31s 7d 55min 40s
2. Sampling Process 1d 6hr 34min 34s 18hr 17s
3. Sample Registra-tion and
Labeling
1hr 53min 36min 30s
4. Input and Reporting
Data/ Result Analysis
16hr 20min 1d 1hr 14min 10s
5. Disposition in SAP 1hr 5min 17min
6. Retest Process 12hr 18min 1d 8min
4.2.2. Analyze As-Is Process. (a) Current condition Based on the secondary data, the average time of finished good on time release is 5.63 day. The percentage of on time release is 47.85% while the percentage of not on time release is 52.15%. The percentage of quality release weekly can be seen in Table 2. OTR is on time release, while NOT OTR is not on time release. (b) Problem identification Based on interview, some root problems that need to be improved, such as:
1. The information control is still conducted manually and inefficiently.2. The ERP system implemented is not integrated and not yet meets the quality release process.3. There is no notification information which automatically associated with quality releases.4. The business process of quality release and its approval process are still manually,
inefficiently, and ineffectively.5. There is no good quality releases management especially during the approval process.6. There is no performance measurement of the quality release process.7. There are some activities which is not value-added to the quality release process.
4.3. Step 3: Design To-Be Process
To provide some solutions for solving the problems, some strategies are implemented: 1. Create a business process redesign of quality release (Problem 4 and 7)2. Improve the existing SAP system to be more integrated and better so that it can meet the
quality release process (Problem 1 and 2)3. Make the automatic notification information so that it can show the status of quality releases
(Problem 1 and 3)4. Create a policy for the management of quality related process (Problem 5)5. Make performance indicator tool to measure the performance of quality release process
(Problem 7)
ScieTech 2014 IOP PublishingJournal of Physics: Conference Series 495 (2014) 012011 doi:10.1088/1742-6596/495/1/012011
5
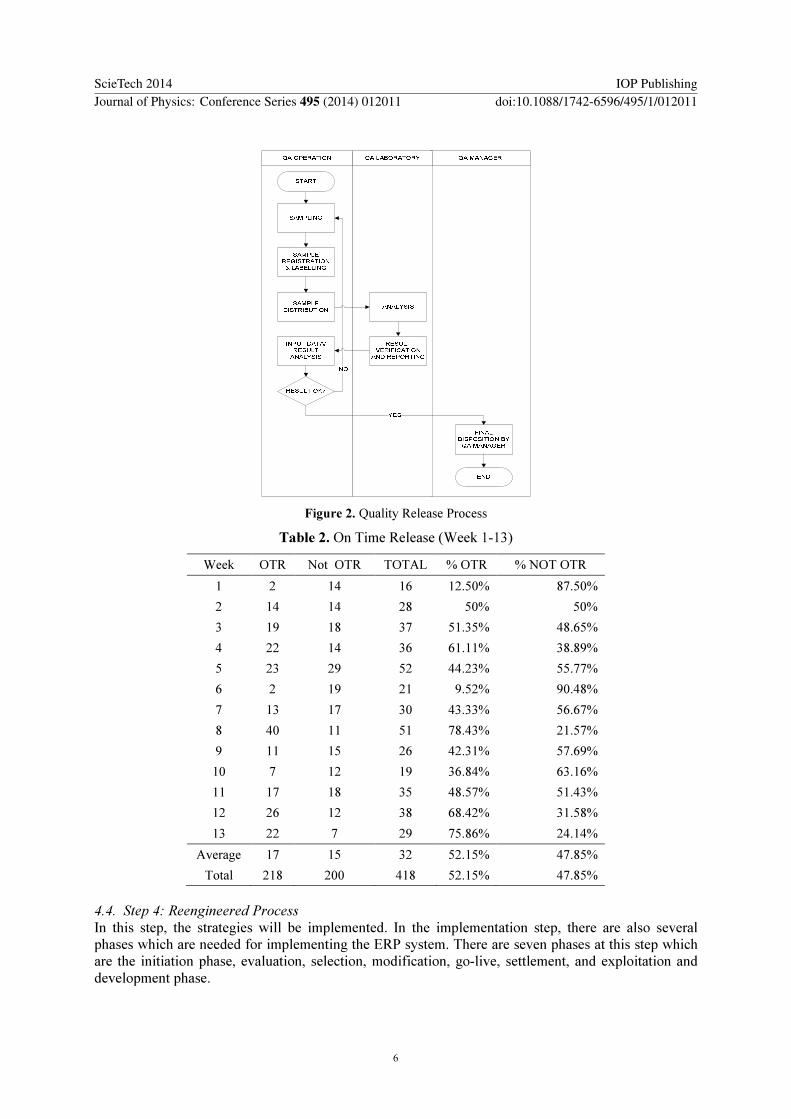
Figure 2. Quality Release Process
Table 2. On Time Release (Week 1-13)
Week OTR Not OTR TOTAL % OTR % NOT OTR
1 2 14 16 12.50% 87.50%
2 14 14 28 50% 50%
3 19 18 37 51.35% 48.65%
4 22 14 36 61.11% 38.89%
5 23 29 52 44.23% 55.77%
6 2 19 21 9.52% 90.48%
7 13 17 30 43.33% 56.67%
8 40 11 51 78.43% 21.57%
9 11 15 26 42.31% 57.69%
10 7 12 19 36.84% 63.16%
11 17 18 35 48.57% 51.43%
12 26 12 38 68.42% 31.58%
13 22 7 29 75.86% 24.14%
Average 17 15 32 52.15% 47.85%
Total 218 200 418 52.15% 47.85%
4.4. Step 4: Reengineered Process
In this step, the strategies will be implemented. In the implementation step, there are also several phases which are needed for implementing the ERP system. There are seven phases at this step which are the initiation phase, evaluation, selection, modification, go-live, settlement, and exploitation and development phase.
ScieTech 2014 IOP PublishingJournal of Physics: Conference Series 495 (2014) 012011 doi:10.1088/1742-6596/495/1/012011
6
4.5. Step 5: Improve Continuously
To be able to control the quality and system as well as make continuous improvements, monitoring and controlling the performance of the new system is necessary. This can be done by creating and using key performance indicator (KPI) tool, so that the performance of the system can be indicated.
4.6. Comparing Simulation of As-Is and To-Be Process
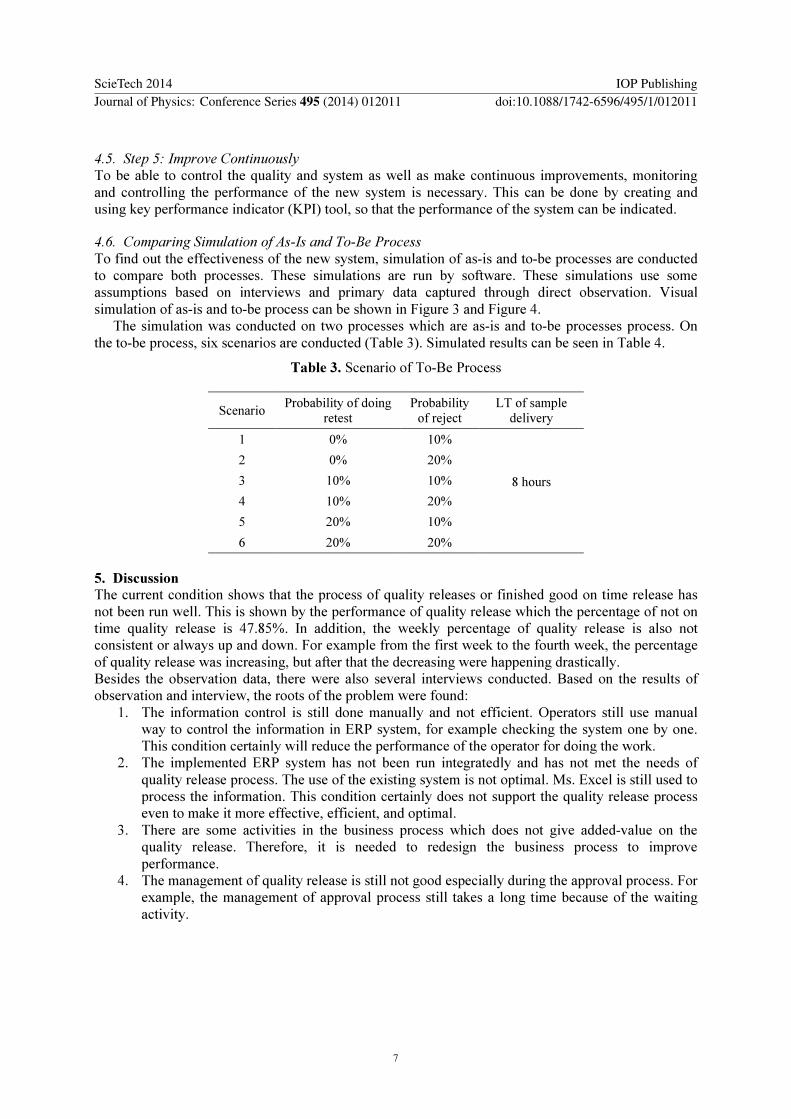
To find out the effectiveness of the new system, simulation of as-is and to-be processes are conducted to compare both processes. These simulations are run by software. These simulations use some assumptions based on interviews and primary data captured through direct observation. Visual simulation of as-is and to-be process can be shown in Figure 3 and Figure 4.
The simulation was conducted on two processes which are as-is and to-be processes process. On the to-be process, six scenarios are conducted (Table 3). Simulated results can be seen in Table 4.
Table 3. Scenario of To-Be Process
Scenario Probability of doing
retest
Probability
of reject
LT of sample
delivery
1 0% 10%
8 hours
2 0% 20%
3 10% 10%
4 10% 20%
5 20% 10%
6 20% 20%
5. Discussion
The current condition shows that the process of quality releases or finished good on time release has not been run well. This is shown by the performance of quality release which the percentage of not on time quality release is 47.85%. In addition, the weekly percentage of quality release is also not consistent or always up and down. For example from the first week to the fourth week, the percentage of quality release was increasing, but after that the decreasing were happening drastically. Besides the observation data, there were also several interviews conducted. Based on the results of observation and interview, the roots of the problem were found:
1. The information control is still done manually and not efficient. Operators still use manualway to control the information in ERP system, for example checking the system one by one.This condition certainly will reduce the performance of the operator for doing the work.
2. The implemented ERP system has not been run integratedly and has not met the needs ofquality release process. The use of the existing system is not optimal. Ms. Excel is still used toprocess the information. This condition certainly does not support the quality release processeven to make it more effective, efficient, and optimal.
3. There are some activities in the business process which does not give added-value on thequality release. Therefore, it is needed to redesign the business process to improveperformance.
4. The management of quality release is still not good especially during the approval process. Forexample, the management of approval process still takes a long time because of the waitingactivity.
ScieTech 2014 IOP PublishingJournal of Physics: Conference Series 495 (2014) 012011 doi:10.1088/1742-6596/495/1/012011
7
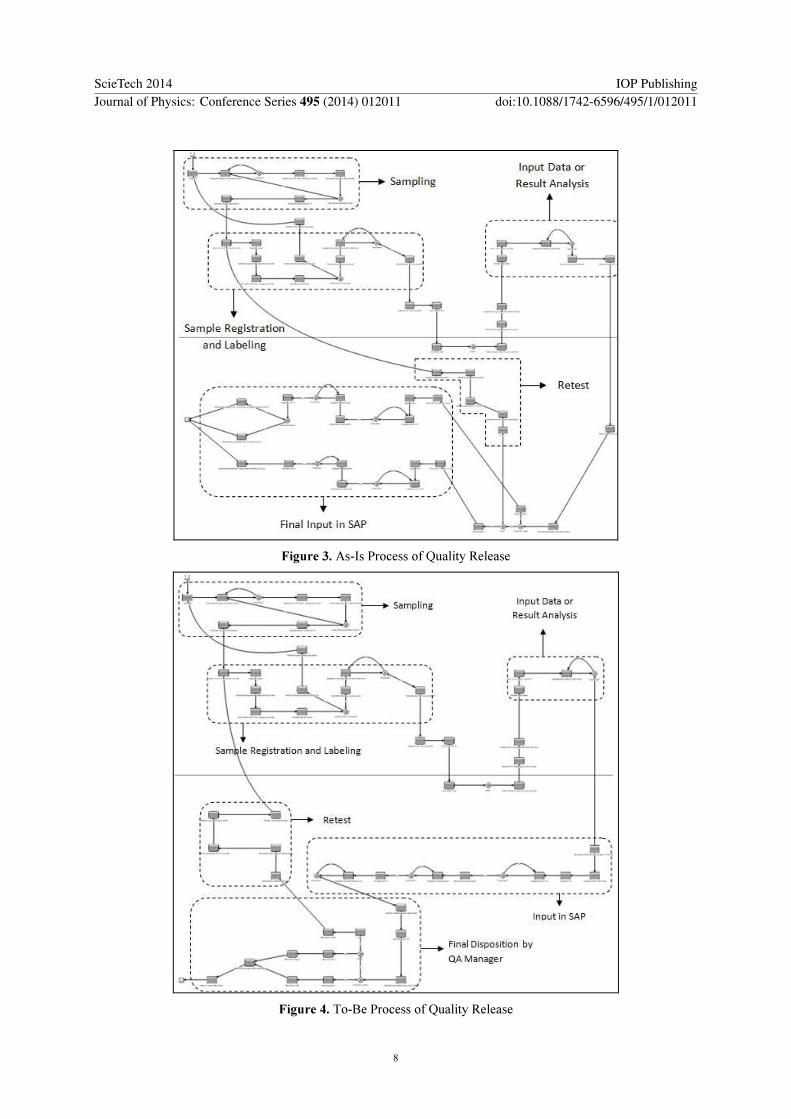
Figure 3. As-Is Process of Quality Release
Figure 4. To-Be Process of Quality Release
ScieTech 2014 IOP PublishingJournal of Physics: Conference Series 495 (2014) 012011 doi:10.1088/1742-6596/495/1/012011
8
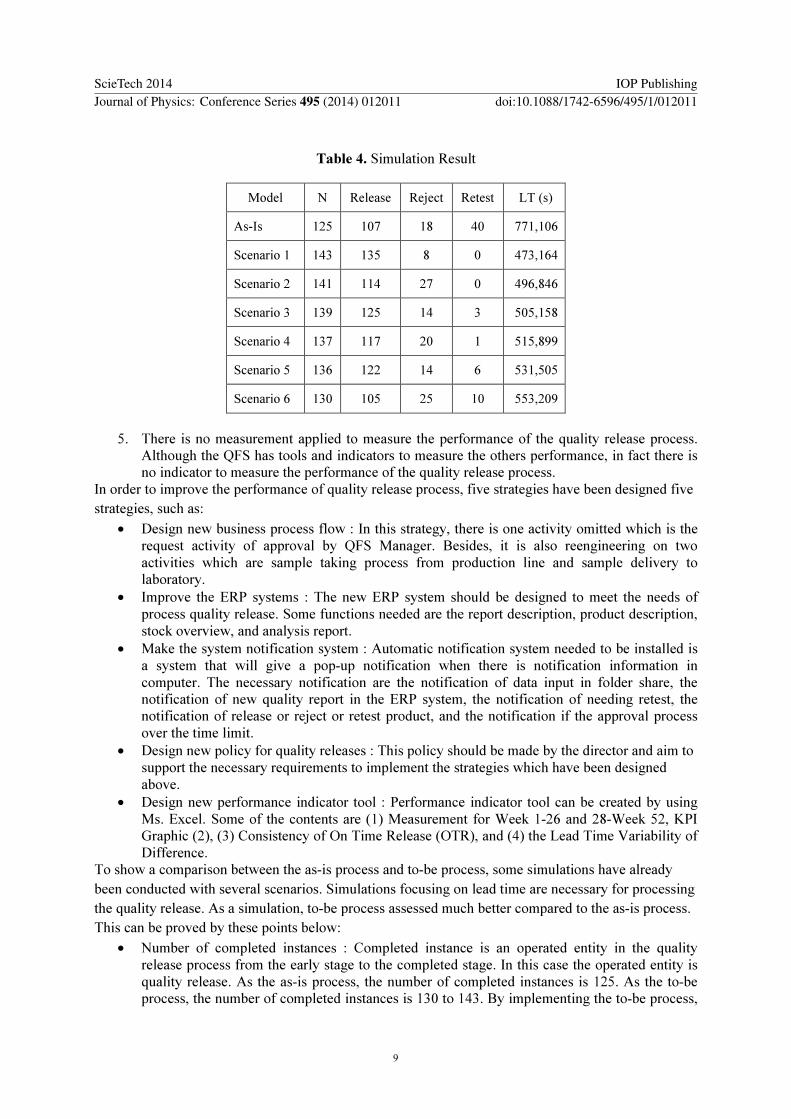
Table 4. Simulation Result
Model N Release Reject Retest LT (s)
As-Is 125 107 18 40 771,106
Scenario 1 143 135 8 0 473,164
Scenario 2 141 114 27 0 496,846
Scenario 3 139 125 14 3 505,158
Scenario 4 137 117 20 1 515,899
Scenario 5 136 122 14 6 531,505
Scenario 6 130 105 25 10 553,209
5. There is no measurement applied to measure the performance of the quality release process.Although the QFS has tools and indicators to measure the others performance, in fact there isno indicator to measure the performance of the quality release process.
In order to improve the performance of quality release process, five strategies have been designed five
strategies, such as:
• Design new business process flow : In this strategy, there is one activity omitted which is therequest activity of approval by QFS Manager. Besides, it is also reengineering on twoactivities which are sample taking process from production line and sample delivery tolaboratory.
• Improve the ERP systems : The new ERP system should be designed to meet the needs ofprocess quality release. Some functions needed are the report description, product description,stock overview, and analysis report.
• Make the system notification system : Automatic notification system needed to be installed isa system that will give a pop-up notification when there is notification information incomputer. The necessary notification are the notification of data input in folder share, thenotification of new quality report in the ERP system, the notification of needing retest, thenotification of release or reject or retest product, and the notification if the approval processover the time limit.
• Design new policy for quality releases : This policy should be made by the director and aim tosupport the necessary requirements to implement the strategies which have been designedabove.
• Design new performance indicator tool : Performance indicator tool can be created by usingMs. Excel. Some of the contents are (1) Measurement for Week 1-26 and 28-Week 52, KPIGraphic (2), (3) Consistency of On Time Release (OTR), and (4) the Lead Time Variability ofDifference.
To show a comparison between the as-is process and to-be process, some simulations have already
been conducted with several scenarios. Simulations focusing on lead time are necessary for processing
the quality release. As a simulation, to-be process assessed much better compared to the as-is process.
This can be proved by these points below:
• Number of completed instances : Completed instance is an operated entity in the qualityrelease process from the early stage to the completed stage. In this case the operated entity isquality release. As the as-is process, the number of completed instances is 125. As the to-beprocess, the number of completed instances is 130 to 143. By implementing the to-be process,
ScieTech 2014 IOP PublishingJournal of Physics: Conference Series 495 (2014) 012011 doi:10.1088/1742-6596/495/1/012011
9
the number of quality release is increased by as much as 5 to 18. This shows that the to-be process is more effective and efficient than the as-is process.
• Average process time : Average lead time used to complete a quality release is the main focusin this research. On the as-is process, the process time used was 777.106 seconds. On the to-beprocess, as the optimum result of six scenarios, it was found that process time of qualityrelease was 473.164 seconds. Process time has been declined by 43.74%. This shows that theto-be process is more effective and efficient than the as-is process.
• Number of retest and reject product : The greater the probability of retest and reject product,the amount of products released become less. This shows that, in order to increase the numberof quality report which passes the test quality, the number of retest and reject has to besuppressed by improving the performance of the production process and the process ofanalysis in the laboratory.
In each scenario, the number of completed instances and the average process time was different. This
is because of the difference scenario of retest and rejected probability. If the retest and rejected
probability is smaller, the number of completed instances will be higher and the average processing
time will be shorter.
6. Conclusion
Based on the research that has been conducted, there are some findings. The as-is process is ineffective and inefficient. As an analysis result, some of the root problems are the control of information is still conducted manually, the ERP system that is used is not integrated and does not meet the requirements of the process, there are some non-added-value activities in quality release process, the management of quality release is still not good, and there is no measurement applied to measure the performance and set the standard for doing improvement.
The to-be process is included the business process redesign of quality release process, implementation of ERP system to fit the needs of a new business process, implementation of the automatic notification information, creating policy related management process in quality release, and designing performance indicator tool as a reference to see the performance of the process so that it can always make improvement.
By the six scenarios, the best condition in the quality release process is on the first scenario. In this scenario, the process runs with the lowest retest and rejected probability which is 0% and 10%. As a result, the process time is reduced by 43.74% and the number of quality release is increased by 18 quality release. This scenario shows that these strategies can improve the effectiveness and efficiency of process quality release. Nevertheless, this scenario is supported by the condition of the good and qualified production process as well as a good performance during the test analysis in the laboratory.
References
[1] World Bank 2011 Dairy industry development in Indonesia, final report March 20, 2013 http://www.ifc.org/
[2] Harvey S and Millet B 2009 Aust. J. Manag. Org. Behav. 2 30-42 [3] Erkan T 2009 World Acad. Sci. Eng. Tech. 30 1508-11 [4] Dodaro G and Crowley B 1997 Business process re-engineering assessment guide 3rd version
(United States General Accounting Office) [5] Olalla M 2010 Int. Adv. Eco. Res. 6 581-9 [6] Chan S and Choi C 1997 Int. J. Prod. Eco. 50 213-24 [7] Goksoy A, Ozsoy B, and Vayvay O 2012 Int. J Busi. Manag. 7 89-112 [8] Gupta A and Dogra P 2010 J.Theor. Appl. Inf. Tech. 102-106
ScieTech 2014 IOP PublishingJournal of Physics: Conference Series 495 (2014) 012011 doi:10.1088/1742-6596/495/1/012011
10