Designing Data Mining Droplets: New Interface Objects for the Humanities Scholar
11
1 DHQ: Digital Humanities Quarterly 2009 Volume 3 Number 3 Designing Data Mining Droplets: New Interface Objects for the Humanities Scholar Stan Ruecker <sruecker_at_ualberta_dot_ca>, University of Alberta, Canada Milena Radzikowska <mradzikowska_at_gmail_dot_com>, Mount Royal College, Canada Stéfan Sinclair <sgs_at_mcmaster_dot_edu>, McMaster University, Canada Abstract In this paper, we describe the design of a number of alternative interface "droplets" that are intended for use by humanities scholars interested in applying data mining and information visualization tools to the task of hypothesis formulation. The trained droplets provide several functions. Their primary purpose is to encapsulate the results of the software training phase. They can be saved for future re-use against other collections or combinations of collections. They can be modified by having the user accept or reject features identified by the data mining software. Finally, they can also contain choices for how to display and organize items in the collection. The opportunity to develop a new interface object presents the designer with the challenge of effectively communicating what the tool is good for and how it is used. This paper outlines the design process we followed in creating the visual representations of these interface objects, describes the communicative strengths and weaknesses of a number of alternative designs, and discusses the importance of the study of new interface objects as the means of providing the user with new interface affordances. Introduction The goal of this paper is to address some of the conceptual issues that arise in the design of a new kind of interface object for a specific domain — data mining for the humanities. In that context, we describe one component of our research: the design of a form of visual representation that would provide humanities scholars with some insight into the data mining process, while at the same time making the activity of data mining attractive and easy to carry out.
-
Upload
independent -
Category
Documents
-
view
1 -
download
0
Transcript of Designing Data Mining Droplets: New Interface Objects for the Humanities Scholar
1
DHQ: Digital Humanities Quarterly2009Volume 3 Number 3
Designing Data Mining Droplets: New Interface Objects for theHumanities ScholarStan Ruecker <sruecker_at_ualberta_dot_ca>, University of Alberta, CanadaMilena Radzikowska <mradzikowska_at_gmail_dot_com>, Mount Royal College, CanadaStéfan Sinclair <sgs_at_mcmaster_dot_edu>, McMaster University, Canada
Abstract
In this paper, we describe the design of a number of alternative interface "droplets" thatare intended for use by humanities scholars interested in applying data mining andinformation visualization tools to the task of hypothesis formulation. The trained dropletsprovide several functions. Their primary purpose is to encapsulate the results of thesoftware training phase. They can be saved for future re-use against other collections orcombinations of collections. They can be modified by having the user accept or rejectfeatures identified by the data mining software. Finally, they can also contain choices forhow to display and organize items in the collection. The opportunity to develop a newinterface object presents the designer with the challenge of effectively communicatingwhat the tool is good for and how it is used. This paper outlines the design process wefollowed in creating the visual representations of these interface objects, describes thecommunicative strengths and weaknesses of a number of alternative designs, anddiscusses the importance of the study of new interface objects as the means of providingthe user with new interface affordances.
IntroductionThe goal of this paper is to address some of the conceptual issues that arise in the design of a new kind ofinterface object for a specific domain — data mining for the humanities. In that context, we describe onecomponent of our research: the design of a form of visual representation that would provide humanitiesscholars with some insight into the data mining process, while at the same time making the activity of datamining attractive and easy to carry out.

2
3
Figure 1. An early sketch of the data mining environment (in this case for the NORA project) showssomeone using a droplet trained for identifying the erotic in a set of poems from the Emily Dickinsoncollection in the Institute for Advanced Technology in the Humanities (IATH) at the University of Virginia.Note that the preliminary droplet design shown here (bottom right) has no specifically communicativemorphology.
Our strategy in this interface was to provide the user with a variety of empty "droplets" which would be filledwith the results of the software training phase [Ruecker et al.]. Each droplet would contain or encapsulate anentire working state of the system, including the algorithmic consequences of a particular training exercise,combined with some parameters for organizing and selecting the form of the display. The choice of the properword to identify the droplets is in itself a subject of design. Other terms that have been suggested include"magnet," "crystal," "capsule," "lens," "charm," "filter," "system state," "kernel," and the very Canadian "hockeypuck." Whatever these objects are eventually called, for the time being we are using the term "droplet," whichsuggests to us a densely compressed item that can unpack in an organic way to influence the entiresurroundings. Once a droplet has been trained for data mining, it can be saved and applied to the entirecollection, or to a different collection. A droplet is applied to a collection by dragging and dropping it onto adisplay representing each item, after which the display organizes itself in a series of "oil and water" effects.
Of vital significance to the success of this strategy is the design of the droplets. The droplets need to be able torepresent the relevant information about the data mining process in a form that is readily interpretable byhumanities scholars. The droplet serves in one sense like an icon — a person looking at it will hopefullyremember what system state it contains. This iconic function should work at different scales, at least one ofwhich is quite small. The droplets therefore need to be easily visually differentiable one from another, at everyscale. Finally, the droplets need to be visually appealing. We describe here our initial attempts to design theseinterface objects, based on a set of metaphors to real-world items that combine complex visual appearancewith a compact form.
Background
4
5
6
7
8
9
10
11
The online availability of a wide range of digital data has resulted in a corresponding increase in various kindsof tools for retrieving and manipulating the items in a collection [Hockey 2000]. Interface design researchershave worked on systems intended to help users access digital images, work with electronic text files, and applydata mining algorithms to a variety of problems, both in the sciences and in the humanities.
In the area of digital images, [Bederson 2001] describes a zoomable browser, [Bumgardner et al. 2005]provides an experimental search tool that uses a colour wheel as its interface, and [Hascoët et al. 1998]discuss the use of maps in accessing a digital library. Other examples include [Rodden et al. 2001], whostudied the use of similarity clustering for browsing tasks, and [Ruecker et al. 2005], who developed a prototypeimage browser for pill identification.
For tools related to text files, [Pirolli et al. 1996] describe a system for visualizing documents which allows theuser to form dynamic groups. [Small 1996] developed a 3D prototype for text navigation, where the readermoved between columns of text from Shakespeare’s plays. A variety of researchers have worked in the area ofdata mining for text collections of various kinds. For example, [Feldman et al. 1997] discuss early efforts in thisarea, and [Weiss et al. 2005] provide a recent update on methods.
Some researchers have pointed out that the potential for applying data mining tools to questions in thehumanities lies largely in the capacity of such tools to contribute, not primarily to hypothesis testing, but insteadto hypothesis formulation [Shneiderman 2001]; [Ramsay 2003]; [Unsworth 2004]. The standard approach inhumanities research is not to solve a problem by testing one hypothesis against another, but rather to enrichthe object of study by repeated observation and reporting. Data mining tools and their accompanyingvisualizations, which facilitate pattern finding across a wide range of data, can definitely play a role in thisprocess.
With respect to the design of interfaces for data mining, it is important to remember that each new online toolrepresents a new opportunity for action, or affordance [Gibson 1979]; [Vicente 2002]. For instance, in a moreconventional approach to the interface for data mining, it would be possible to create a history palette thatrecords previous states of the system. However, it is not necessarily straightforward to repurpose an item fromthat history to a new collection. By encapsulating the history states as droplets, we make the repurposingsimpler.
Another significant feature of the droplets is their role in interactivity. By providing the user with an item to dragand drop to trigger a series of dynamic responses from the system, the droplets help facilitate an instructionalaspect: the user can see the steps carried out by system, which correspond to the steps associated with thedroplet. While visually dynamic responses are not reliant on the presence of droplets as objects, their existenceas part of the user interaction helps to suggest to the designer these various new forms of feedback, which area kind of affordance.
Studying these new affordances presents a challenge, in that the researcher by definition does not always havean existing object with a similar affordance — otherwise it would be a case of a redesign rather than a new tool[Ruecker 2003]. Though opinions vary, the current dominant perspective is that interface research requires acomponent of usability study [Nielsen 2000], but that usability study alone is probably not enough. Attentionshould also be paid to other factors, such as aesthetics [Karvonen 2000], effect [Dillon 2001], and sustaineduse over time [Plaisant 2004].
MethodologyWe began by identifying the kinds of information the user might want to know while working with the system.These included an overview of the process, suggestions about the kinds of tasks that could be performed usingthe system, reassurance at each point that the right things were happening, and assistance in interpreting the

12
13
14
15
16
results of each stage and moving successfully to the next stage. With the droplets, we hoped to be able tocommunicate what had been done to create them, in order to suggest how they might be successfully deployedonce they were created.
To construct the droplets, we generated a candidate list of real-world items that have a sufficiently complexphysical shape to serve as possible metaphors for the complexities of the data mining process. We determinedearly in the process that it would be difficult and probably not helpful to attempt to communicate for thisdemographic the actual algorithms involved, as for example by superimposing an equation on a geometricshape. Instead, we hoped to be able to visually express the following information:
There are also other pieces of information that could be useful for understanding what has been happening.These items need to be communicated somehow but could be difficult to associate with the visual appearanceof the droplets. These include:
Some strategies involving droplet morphology might include using the size of the droplet to indicate the size ofthe training set or of the collection the set was drawn from. Internal and external lines can also be thickened orlightened as a way of suggesting robustness of the training set. Finally, depending on the visual kind of droplet,it may be possible to nest one droplet inside another, as a way of indicating their use in combination.
It may also be possible to associate this information with the droplets using strategies that do not involve thedroplet morphology per se, but instead rely on the combination of text and image. Combining these methods isseen by some theorists as an important approach to the design of technical communications [Horn 1998]. Wewill provide this connection in the case of the prototype by refreshing an information panel about the dropletdetails whenever the user selects a droplet. This panel will also provide the opportunity to adjust some of thesettings stored by the droplet.
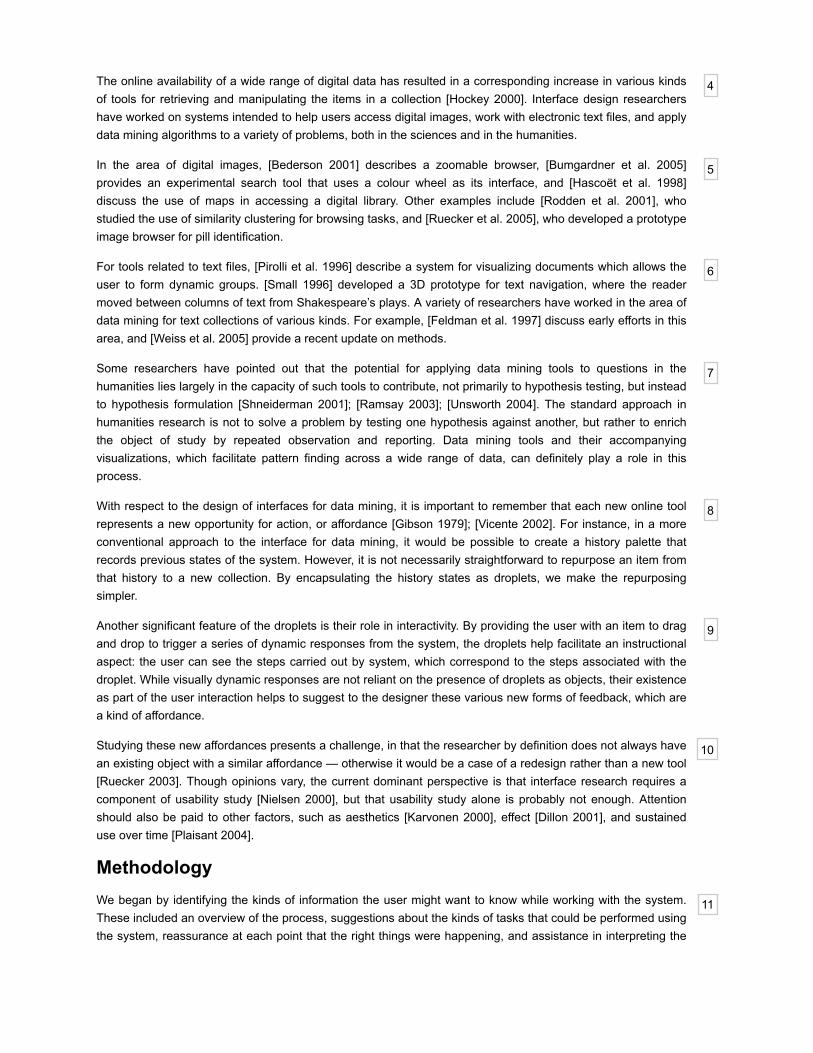
ResultsWorking from our original map of over a dozen potential metaphors (Figure 2), we selected the following shortlist for further investigation. We wanted to have a variety of items that were distinct from each other but werealso visually complex in a way that could communicate the stages in droplet training. We thought we shouldinclude examples that covered points on a terrain that included the organic and the mechanical, with referenceto several disciplines. Finally, we tried to choose examples that could be contained by a common perimeter.Our working list contained the following items:
Is this a trained droplet or an empty one?For trained droplets, has the user accepted the features recommended by the system or has the listof features been modified?What kinds of features were included?How many features were included?What options for display have been associated with the droplet?What choices for organizing the display have been applied?
The name of the collection or collections used in training.The size of the collection.The size of the training set.The name and goals of the person responsible for training the droplet.
Ferns — configurations of individual organic pieces that form larger itemsSnowflakes — a single solid unique configuration that relies on symmetrySolar system — individual items in relations suggested by a larger structure
17
18
19
20
For each of these metaphors, we developed sketches for four different states of the droplet: untrained, trained,trained with multiple display options chosen, and trained with multiple display and two different organizationoptions. Our goal in each case was to make the different states visually distinct at every level of magnification,and to make the number of display and organization options obvious at the largest size.
Figure 2. Our concept map of possible droplet metaphors shows a wide range of candidate real-worldobjects that combine visual complexity with a compact form.
We chose these various states because they represent significant choices made by the user. It would also bepossible to consider visually representing choices the user makes about what collection to work with in the firstplace, which may be one of the most significant choices the user makes. However, visually representingcollections is definitely a challenge, and it may be preferable to provide information about the collection in theform of text labels.
Ferns
A fern is a fractal, which means it repeats its morphology at increasing scales (Figure 3). We might adopt thisstrategy for two scales, where in the unfolding fern leaf, the individual leaflets represent functions and the entireleaf represents the complete, organized droplet.
We can use the stem to represent the software training, and the leaflets to represent the other functions. Thisstrategy has the benefit of looking minimal when no display or organization functions are chosen, which mayprompt the user to want to choose more sophisticated configurations of options.
Atoms — individual items connected in a more elaborate geometric frameworkCells — complex interiors composed of pieces that associate by juxtapositionClockwork — complex interiors consisting of structures that interconnectLego™ — geometric shapes with complex surfaces that interconnect

21
22
23
24
25
If we also assume that the two sides of the stem represent two kinds of organization, then having all the displayitems on one side of the stem would indicate only one kind of sorting, while dividing display items on both sidesof the stem would indicate two kinds of sorting.
Figure 3. The placement of leaflets along the stem of the fern leaf allows us to express the user choicesstarting with an empty droplet (left), then sequentially adding training data, display choices, thenorganization in one way and in two ways.
Reading the sequence from left to right, we show first an untrained or empty droplet. The next version shows adroplet that has been trained by the user. Taking one of the demonstration projects as an example, this seconddroplet might contain the results of training the system to recognize poems by Emily Dickinson with an eroticcharge, using a naïve Bayesian algorithm. The third version shows this same trained droplet with seven itemschosen for display. In the case of the Dickinson collection, these items might include the poem’s title (often thefirst line), the date of first publication, the place of publication, the name of the publisher, the number of lines inthe poem, the number of words in the poem, the number of key features found in the poem related to eroticism,and the numeric score assigned by the system for the poem in terms of its erotic charge. The fourth versionwould represent the same information about each poem, but organize the results in some way — perhaps bythe numeric rating assigned by the system. The fifth and final version would show the items arranged in twoways — first by numeric rating, and chronologically within that.
The organic nature of the fern droplet may lead to some difficulties for the user in that a growth process for afern is not the same as selection among various options by a user defining a droplet. The use of this organicmetaphor, however, does suggest another possibility — would it be interesting to indicate how long it has beensince someone used a droplet? Do the droplets visibly age when they aren’t used? Does new use refresh theappearance of the droplet? Would people be encouraged to experiment with strange droplets because they areobviously drying up or deteriorating?
Snowflakes
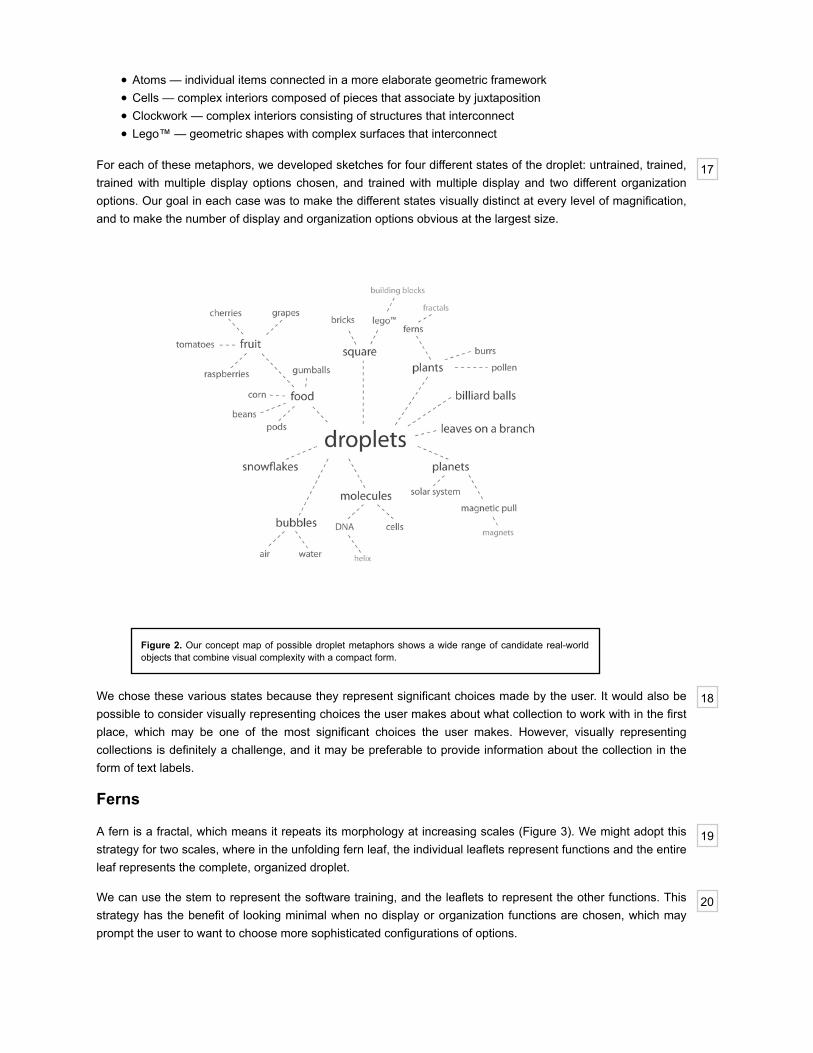
Ferns suggest quite a regular form of arrangement, which means there is little meaningful variation possiblebetween different droplets. Snowflakes also tend to symmetry, but each is unique. They combine a complexsilhouette with a compact form (Figure 4). Variations in the details comprising the silhouette could therefore beused to communicate a wide range of functions.
However, the strong visual language of the snowflake may prove to be difficult to repurpose as a meaningfulchannel of communication. The fact that each snowflake is supposed to be unique also means that there is nobasic, restricted vocabulary of shapes to draw on in their construction.
26
27
28
29
Figure 4. Each snowflake is a unique visual object, which allows us to differentiate one droplet fromanother, but introduces a difficulty in that there is no simple method of re-using recognizablecomponents.
Our draft solution in this case is to treat the visual complexity of the interior of the object as the measure of thestate of the droplet. Unlike our other designs, which involve composites of countable objects, the snowflakedroplets indicate each condition by filling in spaces that are otherwise unarticulated.
Solar System
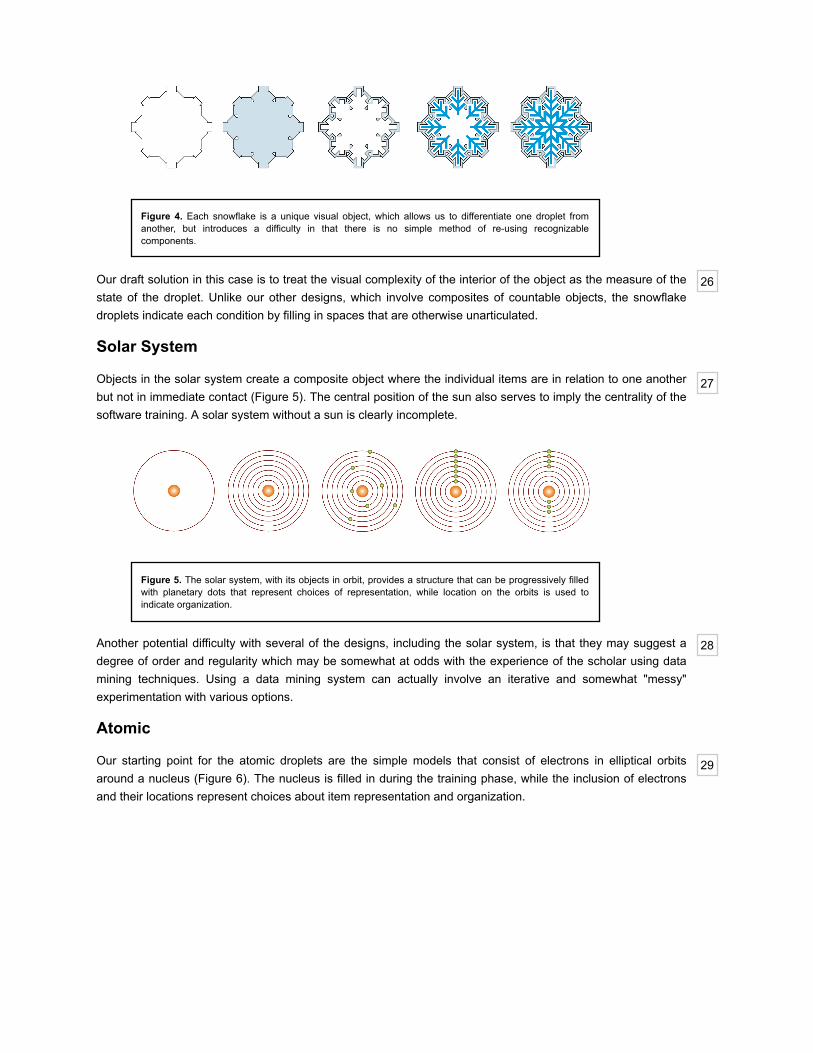
Objects in the solar system create a composite object where the individual items are in relation to one anotherbut not in immediate contact (Figure 5). The central position of the sun also serves to imply the centrality of thesoftware training. A solar system without a sun is clearly incomplete.
Figure 5. The solar system, with its objects in orbit, provides a structure that can be progressively filledwith planetary dots that represent choices of representation, while location on the orbits is used toindicate organization.
Another potential difficulty with several of the designs, including the solar system, is that they may suggest adegree of order and regularity which may be somewhat at odds with the experience of the scholar using datamining techniques. Using a data mining system can actually involve an iterative and somewhat "messy"experimentation with various options.
Atomic
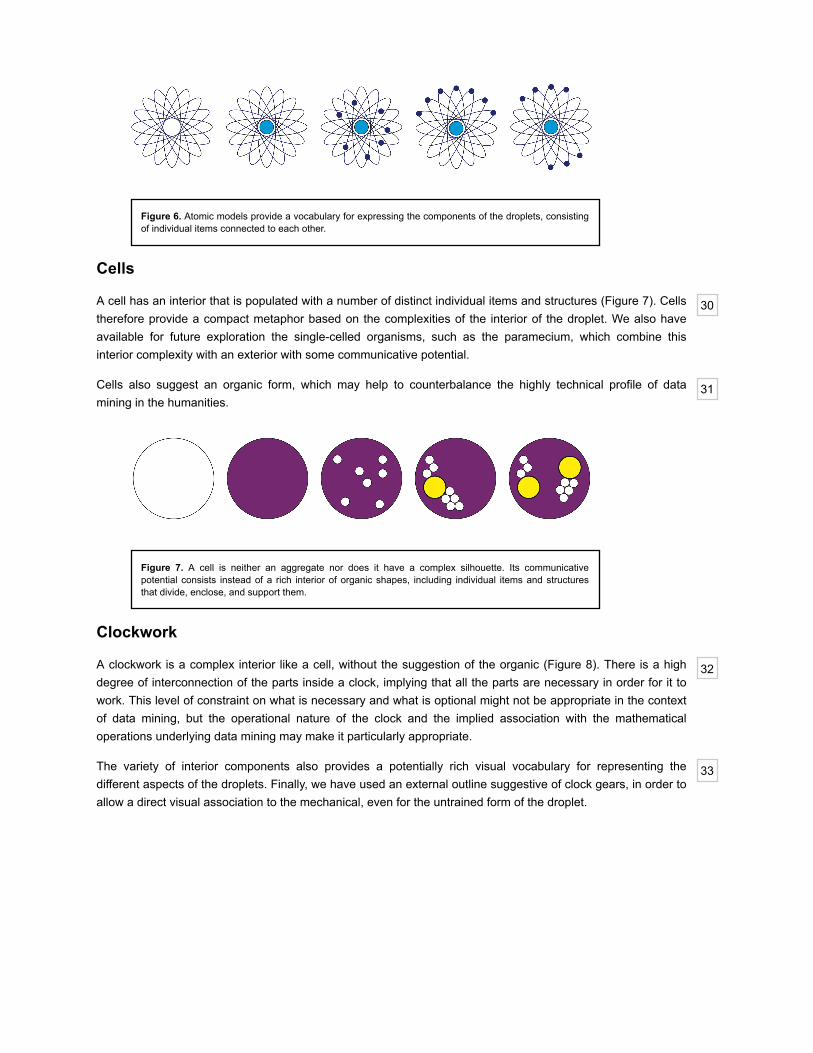
Our starting point for the atomic droplets are the simple models that consist of electrons in elliptical orbitsaround a nucleus (Figure 6). The nucleus is filled in during the training phase, while the inclusion of electronsand their locations represent choices about item representation and organization.
30
31
32
33
Figure 6. Atomic models provide a vocabulary for expressing the components of the droplets, consistingof individual items connected to each other.
Cells
A cell has an interior that is populated with a number of distinct individual items and structures (Figure 7). Cellstherefore provide a compact metaphor based on the complexities of the interior of the droplet. We also haveavailable for future exploration the single-celled organisms, such as the paramecium, which combine thisinterior complexity with an exterior with some communicative potential.
Cells also suggest an organic form, which may help to counterbalance the highly technical profile of datamining in the humanities.
Figure 7. A cell is neither an aggregate nor does it have a complex silhouette. Its communicativepotential consists instead of a rich interior of organic shapes, including individual items and structuresthat divide, enclose, and support them.
Clockwork
A clockwork is a complex interior like a cell, without the suggestion of the organic (Figure 8). There is a highdegree of interconnection of the parts inside a clock, implying that all the parts are necessary in order for it towork. This level of constraint on what is necessary and what is optional might not be appropriate in the contextof data mining, but the operational nature of the clock and the implied association with the mathematicaloperations underlying data mining may make it particularly appropriate.
The variety of interior components also provides a potentially rich visual vocabulary for representing thedifferent aspects of the droplets. Finally, we have used an external outline suggestive of clock gears, in order toallow a direct visual association to the mechanical, even for the untrained form of the droplet.

34
35
36
Figure 8. Like a cell, a clockwork shows a rich internal landscape that can be used to represent a varietyof functions. Clockworks are mechanical rather than organic, and therefore suggest interconnection,rather than isolation of the functions.
Lego™
With Lego, there are a set number of individual shapes that are aggregated. With this metaphor, we can usethe external contour of the composite droplet (Figure 9). We can distinguish by size between more and lessimportant functions, so the central training can be indicated by large Lego piece, while the display functions aresecondary and the organization functions tertiary.
Lego also comes with the affordance of assembling the separate pieces into different configurations. The usercould distinguish between similar droplets by taking advantage of different kinds of arrangement.
Figure 9. Lego™ suggests a method of combining separate items to create a new whole. For ourpurposes, each individual piece of Lego would stand either for the result of software training or for achoice of representation or organization.
Conclusions and Future ResearchHaving identified a range of possibilities, our next step will be to present them to potential users in order tocollect measures of performance and preference. By placing them in the interactive context of a prototypeenvironment, we will be able to examine how humanities scholars respond to the various affordances. Thegoals of this phase will be to determine whether participants are able to make the necessary intuitive leaps tounderstand the intended communicative aspects of each of the droplet designs. Once we’ve established asmaller subset of droplets, we will proceed by expanding the visual positioning or skinning of each droplet type,in order to determine how humanities scholars respond to various semantic differentials such as glossy/rough,technological/natural, geometric/organic, and colour/grey scale. By determining how potential users of the datamining system perceive the design dimensions of the droplets, we will be able to decide to what extent thisstrategy can prove beneficial in removing barriers to them adopting the system. One possibility may consist ofthe use of a hybrid form of droplets, where different visual components are assembled in a kind of toolkit. Oureventual decisions with respect to the design of the droplets may also be usefully repurposed to inform thevisual aspects of the design of the entire system.
Acknowledgements

37The authors wish to thanks the many members of the NORA project research team for their contributions to thiswork. Their names can be found at http://www.noraproject.org/team.php. We would also like to acknowledgethe generous support of the Andrew W. Mellon Foundation, the Social Sciences and Humanities ResearchCouncil of Canada, the Natural Sciences and Engineering Council of Canada, and the Canadian Foundation forInnovation.
Works Cited
Bederson 2001 B. B. Bederson. "PhotoMesa: a zoomable image browser using quantum treemaps andbubblemaps." Proceedings of the 14th annual ACM symposium on User interface software and technology. pp.71-80, 2001.
Bumgardner et al. 2005 J. Bumgardner. Flickr Colour Fields Experimental Colr Pickr, 2005.
Dillon 2001 A. Dillon. "Beyond usability: process, outcome and affect in human-computer interactions." CanadianJournal of Library and Information Science, 26(4), 57-69, 2001.
Feldman et al. 1997 R. Feldman and H. Hirsh. "Finding Associations in Collections of Text." In Michalski, R.S.,Bratko, I. and Kubat, M., Machine Learning and Data Mining: Methods and Applications. NY: J. Wiley, 223-240.1997.
Gibson 1979 J. J. Gibson. The Ecological Approach to Visual Perception. Boston: Houghton-Mifflin, 1979.
Hascoët et al. 1998 M. Hascoët and X. Soinard. "Using maps as a user interface to a digital library." Proceedingsof the 21st annual international ACM SIGIR conference on Research and development in information retrieval,339-340. http://doi.acm.org/10.1145/290941.291028, 1998.
Hockey 2000 S. Hockey Electronic Texts in the Humanities. Oxford: Oxford University Press, 2000.
Horn 1998 R. E. Horn. Visual Language: Global Communication for the 21st Century. MacroVU, Inc. BainbridgeIsland, WA, 1998.
Horton et al. 2006 T. Horton, K. Taylor, B. Yu, and X. Xiang. " Quite right, dear, and interesting: Seeking theSentimental in Nineteenth Century American Fiction." Digital Humanities 2006. Paris. Sorbonne, 5-9 July, 2006,81-82.
Karvonen 2000 K. Karvonen. "The beauty of simplicity." Proceedings of the 2000 conference on UniversalUsability. November, 2000.
Kirschenbaum et al. 2006 M. Kirschenbaum, C. Plaisant, M. N. Smith, L. Auvil, J. Rose, B. Yu, and T. Clement. "Undiscovered Public Knowledge: Mining for Patterns of Erotic Language in Emily Dickinson's Correspondencewith Susan Huntington (Gilbert) Dickinson". Digital Humanities 2006. Paris. Sorbonne, 5-9 2006, 252-255.
Nielsen 2000 J. Nielsen. Designing web usability: The practice of simplicity. Indianapolis, IN: New Riders, 2000.
Pirolli et al. 1996 P. Pirolli, P. Schank, M. Hearst, and C. Diehl. "Scatter/Gather Browsing Communicates theTopic Structure of a Very Large Text Collection." Proceedings of the SIGCHI conference on Human factors incomputing systems: common ground, 213-220. 1996.
Plaisant 2004 C. Plaisant. "The Challenge of Information Visualization Evaluation." IEEE Proc. of AVI 2004.,2004.
Ramsay 2003 S. Ramsay. "Toward an Algorithmic Criticism." Literary and Linguistic Computing. (18) 2, 167-174,2003.
Ramsay and Steger 2006 S. Ramsay and S. Steger. "Distinguished Speakers: Keyword Extraction and CriticalAnalysis with Virginia Woolf's The Waves." Digital Humanities 2006. Paris. Sorbonne, 5-9 July, 2006, 255-257.
Rodden et al. 2001 K. Rodden, W. Basalaj, D. Sinclair, and K. Wood. "Does Organisation by Similarity AssistImage Browsing." In Proceedings of Human Factors in Computing Systems (CHI 2001) ACM Press, pp.
190-197, 2001.
Ruecker 2003 S. Ruecker. Affordances of prospect for academic users of interpretively-tagged text collections.Unpublished doctoral dissertation. University of Alberta, Edmonton, Alberta, Canada, 2003.
Ruecker et al. S. Ruecker, M. Radzikowska, and S. Sinclair. "Communicating Process with Form: Designing theVisual Morphology of the Nora Data Mining Kernels." Proceedings of CaSTA 2006. Breadth of Text: A JointComputer Science and Humanities Computing Conference. Fredericton, New Brunswick. October 11-14. 57-68,2006.
Ruecker et al. 2005 S. Ruecker, L. M. Given, B. Sadler, and A. Ruskin. "Building Accessible Web Interfaces forSeniors: Similarity Clustering of Pill Images." Include 2005. London. Helen Hamlyn Institute. Royal College ofArt. April 5-8, 2005, 2005.
Shneiderman 2001 B. Shneiderman. "Inventing Discovery Tools: Combining Information Visualization with DataMining." Keynote for Discovery Science 2001 Conference, November 25-28, Washington, DC, 2001.
Small 1996 D. Small. "Navigating large bodies of text." IBM Systems Journal. 35:3–4, 1996.
Unsworth 2004 J. Unsworth. "Forms of Attention: Digital Humanities Beyond Representation." A paper deliveredat The Face of Text: Computer-Assisted Text Analysis in the Humanities. The third conference of the CanadianSymposium on Text Analysis (CaSTA), McMaster University, November 19-21, 2004.
Unsworth 2005 J. Unsworth. "New Methods for Humanities Research." The 2005 Lyman Award Lecture.November 11. National Humanities Center. Research Triangle Park, NC. http://www3.isrl.uiuc.edu/~unsworth/lyman.htm, 2005.
Vicente 2002 K.J. Vicente. "Ecological Interface Design: Progress and Challenges." Human Factors. 44.1:62–78,2002.
Weiss et al. 2005 S. Weiss, N. Indurkhya, T. Zhang, and F. Damerau. Text Mining: Predictive Methods forAnalyzing Unstructured Information. New York: Springer, 2005.