design of extended shear tabs - American Institute of Steel ...
148
Final Report AMERICAN INSTITUTE OF STEEL CONSTRUCTION DESIGN OF EXTENDED SHEAR TABS By Donald R. Sherman and Al Ghorbanpoor University of Wisconsin-Milwaukee October 2002
-
Upload
khangminh22 -
Category
Documents
-
view
2 -
download
0
Transcript of design of extended shear tabs - American Institute of Steel ...
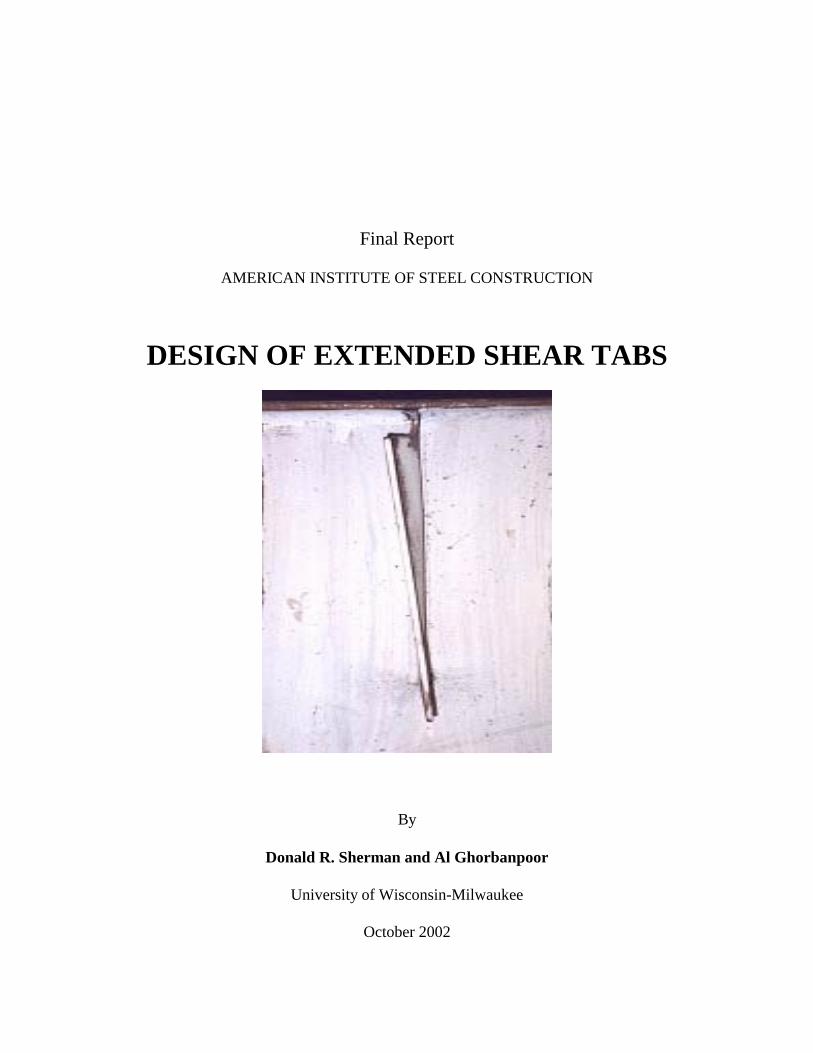
Final Report
AMERICAN INSTITUTE OF STEEL CONSTRUCTION
DESIGN OF EXTENDED SHEAR TABS
By
Donald R. Sherman and Al Ghorbanpoor
University of Wisconsin-Milwaukee
October 2002
ii
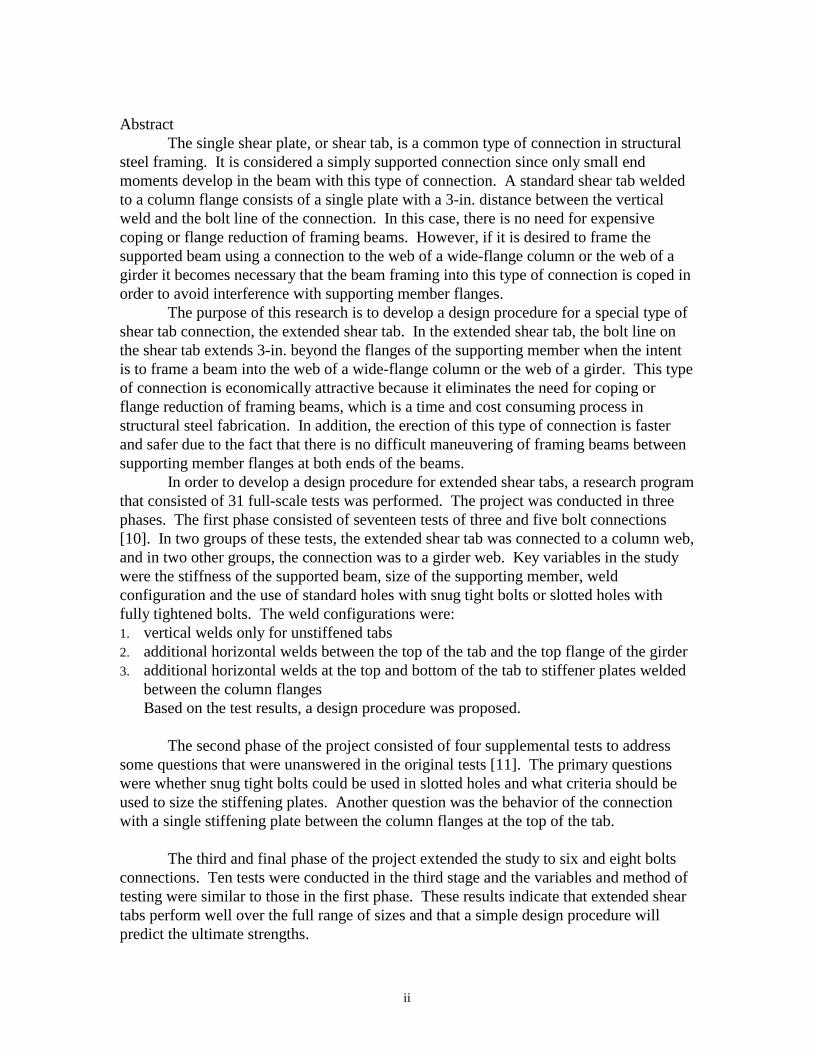
Abstract
The single shear plate, or shear tab, is a common type of connection in structural steel framing. It is considered a simply supported connection since only small end moments develop in the beam with this type of connection. A standard shear tab welded to a column flange consists of a single plate with a 3-in. distance between the vertical weld and the bolt line of the connection. In this case, there is no need for expensive coping or flange reduction of framing beams. However, if it is desired to frame the supported beam using a connection to the web of a wide-flange column or the web of a girder it becomes necessary that the beam framing into this type of connection is coped in order to avoid interference with supporting member flanges. The purpose of this research is to develop a design procedure for a special type of shear tab connection, the extended shear tab. In the extended shear tab, the bolt line on the shear tab extends 3-in. beyond the flanges of the supporting member when the intent is to frame a beam into the web of a wide-flange column or the web of a girder. This type of connection is economically attractive because it eliminates the need for coping or flange reduction of framing beams, which is a time and cost consuming process in structural steel fabrication. In addition, the erection of this type of connection is faster and safer due to the fact that there is no difficult maneuvering of framing beams between supporting member flanges at both ends of the beams. In order to develop a design procedure for extended shear tabs, a research program that consisted of 31 full-scale tests was performed. The project was conducted in three phases. The first phase consisted of seventeen tests of three and five bolt connections [10]. In two groups of these tests, the extended shear tab was connected to a column web, and in two other groups, the connection was to a girder web. Key variables in the study were the stiffness of the supported beam, size of the supporting member, weld configuration and the use of standard holes with snug tight bolts or slotted holes with fully tightened bolts. The weld configurations were: 1. vertical welds only for unstiffened tabs 2. additional horizontal welds between the top of the tab and the top flange of the girder 3. additional horizontal welds at the top and bottom of the tab to stiffener plates welded
between the column flanges Based on the test results, a design procedure was proposed.
The second phase of the project consisted of four supplemental tests to address
some questions that were unanswered in the original tests [11]. The primary questions were whether snug tight bolts could be used in slotted holes and what criteria should be used to size the stiffening plates. Another question was the behavior of the connection with a single stiffening plate between the column flanges at the top of the tab.
The third and final phase of the project extended the study to six and eight bolts connections. Ten tests were conducted in the third stage and the variables and method of testing were similar to those in the first phase. These results indicate that extended shear tabs perform well over the full range of sizes and that a simple design procedure will predict the ultimate strengths.

iii
This report is inclusive of all phases and includes all the tests data. It expands
upon and supersedes the previous interim reports of the first two phases. The conclusions are based on the results of all the tests.

iv
ACKNOWLEDGEMENTS
The research study reported herein was supported by the American Institute of Steel Construction and the Department of Civil Engineering and Mechanics at the University of Wisconsin-Milwaukee (UWM). The authors wish to acknowledge the Ace Iron & Steel, Inc. of Milwaukee, Wisconsin, and Havens-SPI, Kansas City, Missouri, for fabricating and providing the required laboratory samples for the study.

v
TABLE OF CONTENTS
PAGE ABSTRACT ii ACKNOWLEDGEMENTS iv TABLE OF CONTENTS v LIST OF FIGURES vii LIST OF TABLES viii 1. INTRODUCTION 1 2. OBJECTIVE 3 3. BACKGROUND 7
3.1 Types of Connections 7 3.2 Load Transfer to Shear Tabs 7
3.2.1 Shear 7 3.2.2 Moment 8
3.3 Design of Shear Tabs 9 3.4 AISC Shear Tab Design Procedure 9 3.5 Additional Failure Modes for Extended Shear Tabs 10
4. EXPERIMENTAL PROGRAM 12 4.1 Test Beam Selection 12 4.2 Test Program 14 4.2.1 Far end beam reaction 14 4.2.2 Beam loading mechanism 14
4.2.3 Girder and column supports 17 4.3 Test Variables 19 4.3.1 Phase I 19 4.3.2 Phase II. 20 4.3.3 Phase III 20 4.4 Instrumentation 25 4.4.1 Load cells 25 4.4.2 LVDTs 25 4.4.3 Tiltmeters 26 4.4.4 Strain gages 26 4.4.5 Whitewash 28 4.4.6 Data acquisition 28 4.5 Test Procedure 30 5. TEST RESULTS 31 5.1 Material Properties 31 5.2 Displacement, Twist, and Rotation Results 32 5.2.1 Shear-displacement results 32 5.2.2 Shear-twist results 32 5.2.3 Shear-rotation results 33 5.3 Eccentricity, Ultimate Shear Forces, and Failure Modes 35 5.3.1 Shear force eccentricity 35
vi
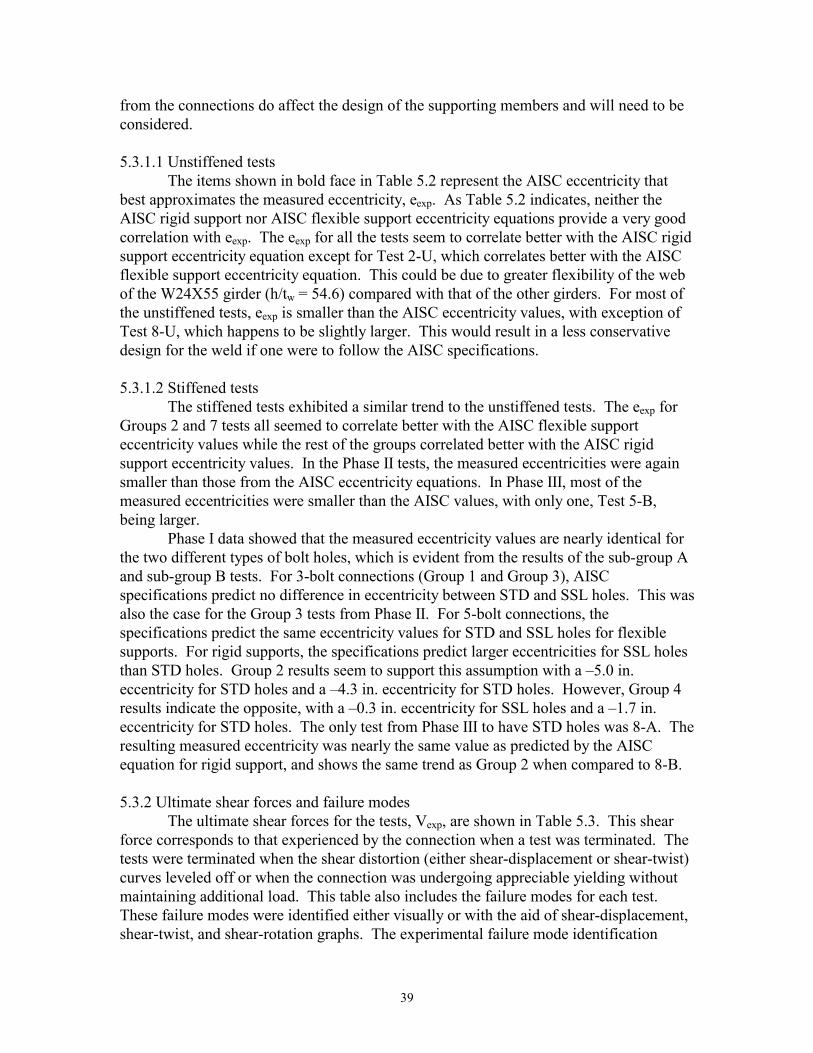
5.3.1.1 Unstiffened tests 39 5.3.1.2 Stiffened tests 39 5.3.2 Ultimate shear forces and failure modes 39 5.3.2.1 Web mechanism failure 43 5.4 Observations and Conclusions 44 6. CONNECTION BEHAVIOR 46 6.1 Nonlinear Behavior 46
6.2 Twisting 47 6.2.1 Discussion on twisting 48 6.3 Discussion of Stiffeners 49 7. DESIGN PROCEDURE AND CONCLUSIONS 51 7.1 Limits of Applicability 51
7.2 Design Procedure and Example 52 7.3 Determination of Eccentricity 56 7.4 Nominal Strengths 58 7.5 Conclusions 58
APPENDICES 59 Appendix A: TEST BEAM SELECTION 60 Appendix B: PHOTOGRAPHS OF TEST SETUP 63 Appendix C: TAB THICKNESS DETERMINATION (PART 1) 71 Appendix D: SHEAR-DISPLACEMENT GRAPHS 72 Appendix E: SHEAR-TWIST GRAPHS 83 Appendix F: SHEAR-ROTATION GRAPHS 94 Appendix G: SHEAR-ECCENTRICITY GRAPHS 105 Appendix H: AISC CRITICAL CAPACITIES 116 Appendix I: PHOTOGRAPHS OF FAILURE MODES 121 Appendix J: TWIST LIMIT STATE EQUATION
(F.E.A. Results) 127 Appendix K: Derivation of Twist Limit State Equation 131 Appendix L: CALCULATION OF NOMINAL SHEAR
STRENGTH 133 Appendix M: DETAIL SKETCH OF BRACING 136 Appendix N: CONNECTION LOAD CAPACITIES AT 0.25-IN
DEFLECTION 139 REFERENCES 140
vii
LIST OF FIGURES FIGURE TITLE PAGE 1.1 Typical shear tab connection to column flange 1 2.1 Unstiffened extended shear tabs 3 2.2 Stiffened extended shear tabs 4 3.1 Determination of connection moment 8 3.2 Web bending failure 11 4.1 Test beam selection variables 12
4.2a Setups for beam and support member combinations in Phases I and II 15
4.2b Setups for beam and support member combinations in Phase III 16
4.3 Far end reaction 17 4.4 Beam loading apparatus 17 4.5a Test column and girder supports 18 4.5b Test girder supports for Phase III 19
4.6 Schematic for tab thickness determination for the unstiffened tests 21
4.7a Bracing locations for Phase I and II Tests 24 4.7b Bracing locations for Phase III Tests 24 4.8 LVDT locations 25 4.9 Location of tiltmeters 26 4.10a Strain gage locations on shear tabs 27 4.10b Strain gage locations on stiffeners 28 5.1 Shear vs. displacement 33 5.2 Shear vs. twist 33 5.3 Shear vs. rotation 34 5.4 Sign convention for shear force eccentricity 35 5.5 Shear force vs. eccentricity (All Data) 36 5.6 Shear force vs. eccentricity (5000 lb. load increments) 36 A Eccentricities for Girder Connections 57 B Eccentricities for Column Connections 57

viii
LIST OF TABLES TABLE TITLE PAGE 4.1 Test variables for unstiffened tests 21 4.2 Test variables for stiffened tests 22 4.3 Strain gages for all tests 29 5.1 Material properties 31 5.2 Shear eccentricities relative to the bolt line 38 5.3 Ultimate shear forces, failure modes, and limit states 41 6.1 Loads related to linearity 46 6.2 Shear at yield for torsion 49 7.1 Comparison of design shear strengths 58

1
DESIGN OF EXTENDED SHEAR TABS
1. INTRODUCTION A common type of simple framing connection is the single plate shear connection
in which a single plate is shop welded to the support member and field bolted to the supported beam. In the early-to-mid 1980s the single plate shear connections, also known as shear tabs, for the transfer of simply supported beam end reactions became more popular based on the ease of fabrication and the ease of field erection of this type of connection. A shear tab is considered a simply supported connection because only small end moments develop at the connection due to the small distance that exists between weld and bolt lines (typically 3-in.). The plate has prepunched bolt holes. In the field, the supported beam, also with prepunched bolt holes, is moved into position and field bolted to the framing plate. When the objective is to frame a beam into a support column flange, the shear tab can be a very simple and effective framing connection (see Fig. 1.1). The fabrication and field erection are both quick and cost effective.
Figure 1.1: Typical shear tab connection to column flange However, when the desire is to frame into the web of a support column or web of
a support girder, both the fabrication and field erection become more cumbersome and time consuming. This is due to the fact that the supported beam must have either its top flange or both top and bottom flanges coped depending on whether framing into a girder or column. In addition, the drop-and-bolt method used in field erection for connection to a column flange can no longer be employed because the supported beam must be
2
maneuvered between the supporting member flanges for connection to the shear tab. To alleviate these problems, it is possible to use an extended shear tab. With the extended shear tab, the bolt line extends 3-in. beyond the flanges of the supporting member. This type of connection is analogous to the standard shear tab in terms of steel fabrication and field erection which makes the extended shear tab a very economical alternative for simple framing connections. There are three possible weld configurations for connection of an extended shear tab to a support member. In either columns or girders, it is possible to connect the shear tab with only a pair of vertical fillet welds. For girders, a pair of horizontal welds between the top of the tab and the top flange of the support girder can be used in addition to the vertical welds. For columns, stiffening plates are welded between the column flanges at both the top and bottom of the tab. Horizontal welds between stiffening plates and tabs are placed at the top and bottom of the shear tab in addition to the vertical welds to the column web. Although all three of these weld configurations have been used in practice, there has been no uniform design procedure available until this study.
3
2. OBJECTIVES The purpose of this research was to study the behavior of and to develop a design procedure for extended shear tabs welded to the webs of support girders or columns. Specific objectives of this testing and evaluation program were:
1) To evaluate the capacity of extended shear tabs. 2) To determine which limit states, commonly associated with standard shear tabs,
may be the critical limit state for unstiffened and stiffened extended shear tabs. These limit states are bolt shear, bolt bearing, shear yield of the tab plate, shear rupture of the tab plate, block shear of the tab plate and weld fracture.
3) To identify any additional limit states (support web failure, twisting) that may result due to the large weld to bolt line distance that is present in an extended shear tab.
4) Determine the location of the shear reaction eccentricity relative to the bolt and weld lines.
5) To recommend a uniform design procedure for extended shear tabs, including a provision for stiffener plates.
This research was separated into three phases: Phase I: Seventeen tests were conducted in Phase I. The experimental study in this Phase included:
1) The investigation of “unstiffened” extended shear tabs - This part of the
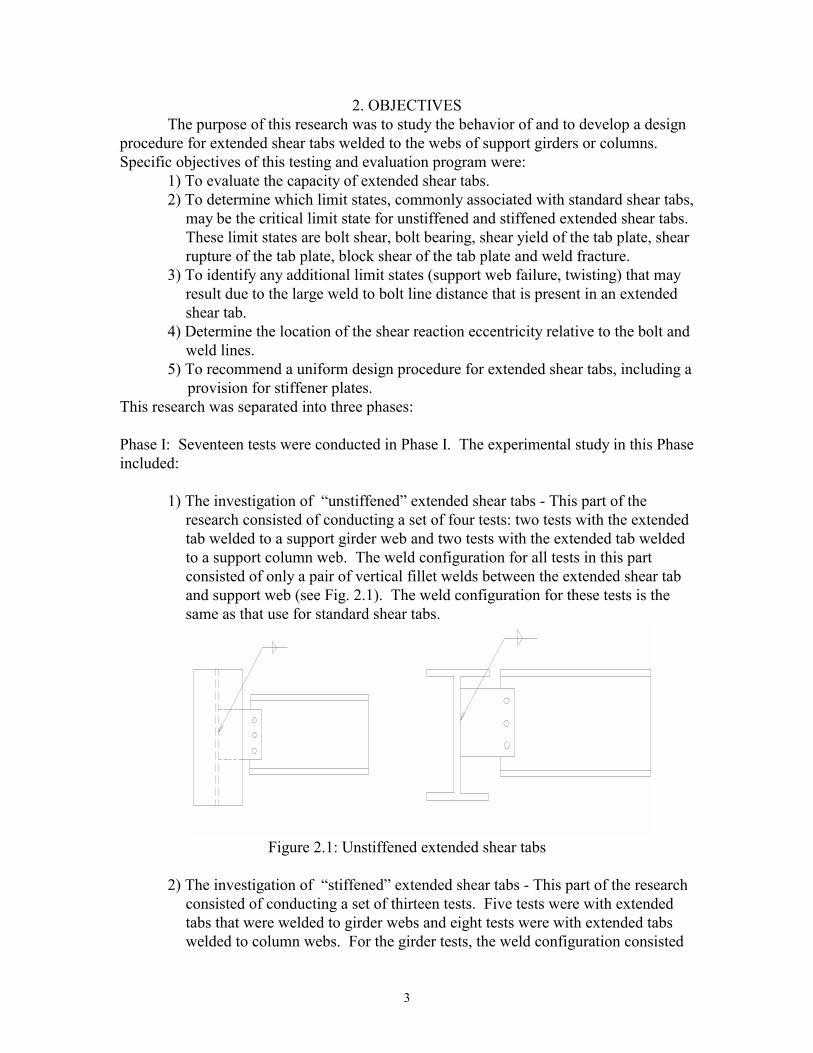
research consisted of conducting a set of four tests: two tests with the extended tab welded to a support girder web and two tests with the extended tab welded to a support column web. The weld configuration for all tests in this part consisted of only a pair of vertical fillet welds between the extended shear tab and support web (see Fig. 2.1). The weld configuration for these tests is the same as that use for standard shear tabs.
Figure 2.1: Unstiffened extended shear tabs
2) The investigation of “stiffened” extended shear tabs - This part of the research consisted of conducting a set of thirteen tests. Five tests were with extended tabs that were welded to girder webs and eight tests were with extended tabs welded to column webs. For the girder tests, the weld configuration consisted
4
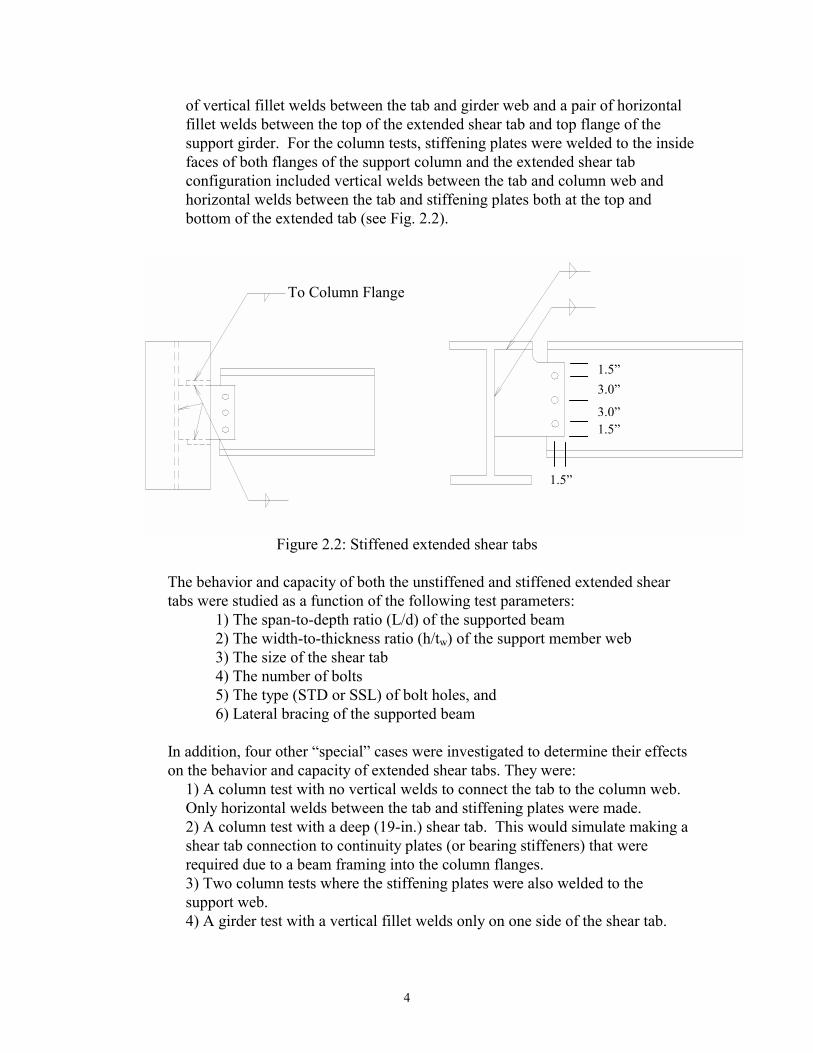
of vertical fillet welds between the tab and girder web and a pair of horizontal fillet welds between the top of the extended shear tab and top flange of the support girder. For the column tests, stiffening plates were welded to the inside faces of both flanges of the support column and the extended shear tab configuration included vertical welds between the tab and column web and horizontal welds between the tab and stiffening plates both at the top and bottom of the extended tab (see Fig. 2.2).
Figure 2.2: Stiffened extended shear tabs
The behavior and capacity of both the unstiffened and stiffened extended shear tabs were studied as a function of the following test parameters:
1) The span-to-depth ratio (L/d) of the supported beam 2) The width-to-thickness ratio (h/tw) of the support member web 3) The size of the shear tab 4) The number of bolts 5) The type (STD or SSL) of bolt holes, and 6) Lateral bracing of the supported beam
In addition, four other “special” cases were investigated to determine their effects on the behavior and capacity of extended shear tabs. They were:
1) A column test with no vertical welds to connect the tab to the column web. Only horizontal welds between the tab and stiffening plates were made. 2) A column test with a deep (19-in.) shear tab. This would simulate making a shear tab connection to continuity plates (or bearing stiffeners) that were required due to a beam framing into the column flanges. 3) Two column tests where the stiffening plates were also welded to the support web. 4) A girder test with a vertical fillet welds only on one side of the shear tab.
To Column Flange
1.5”
3.0” 1.5”
1.5”
3.0”
5
Phase II: Four tests were conducted in Phase II. The experimental study in this Phase included:
1) The investigation of using snug tightened bolts in short slotted holes – In the earlier phase of the research, any specimen having short slotted holes used
bolts that were fully tightened. The test samples in this phase were W8X31columns and W12X87 beams, same as those used for part of Phase I tests. In the Phase I tests, these specimens and their test parameters were identified as Group 3 tests. This allowed a direct comparison of data to determine the effect of bolt
tightening. 2) The investigation of having one stiffener plate vs. two plates – Each column
from Phase I incorporated two stiffener plates. One test was performed with a stiffener plate being welded to the column flanges and the shear tab at the top of the tab so that a conclusion may be drawn as to whether this configuration would function adequately.
3) The investigation of stiffener plate behavior – Strain gages were placed on the stiffener plates to monitor the behavior of the plates during loading. This was to develop provisions to include in the overall design procedure of the extended shear tab.
Since the Phase II specimens were classified as Group 3, the test parameters in this phase stayed mostly the same. The only differences were as follows: 1) Snug tight bolts in short slotted holes 2) Lateral bracing included on each test 3) One test having only one stiffener plate at the top of the connection
Phase III: Ten tests were performed in Phase III. The experimental study in this Phase included:
1) The investigation of deeper connections – Phase I tests were limited to a maximum number of five bolts in the connection. Phase III tested connections having six and eight bolts. Test specimens in this Phase were divided into four types. There were three tests of columns having a six-bolt connection. There were three tests of columns having an eight-bolt connection. Two girder tests with a six-bolt connection were performed, and finally, two more girders with an eight-bolt connection were tested. Column specimens included both stiffened and unstiffened connections. Each girder specimen was stiffened at the top by extending the tab and welding it to the top flange of the girder as shown in Figure 2.2. Two girder specimens also had the tab extended and welded to the bottom flange to investigate the possible effect introduced by extra stiffening.

6
Test parameters similar to those in Phase I were included in the study. These test parameters were as follows: 1) The span-to-depth ratio (L/d) of the supported beam 2) The width-to-thickness ratio (h/tw) of the support member web 3) The size of the shear tab 4) The number of bolts 5) The type (STD or SSL) of bolt holes, and 6) Lateral bracing of the supported beam
7
3. BACKGROUND 3.1 Types of Connections
The American Institute of Steel Construction (AISC) categorizes steel frames by the amount of restraint developed by their connections. Based on this amount of restraint, steel frames are divided into one of three types. These types include type FR (fully restrained), PR (partially restrained), and simple framing that are outlined in Section A2.2 of the Load and Resistance Factor Design (LRFD) Specification, and reproduced in Part 6 of the AISC Manual [1]. Shear tabs are considered as simple framing connections with the following characteristics.
Simple Framing: This type assumes that “for the transmission of gravity loads the ends of the beams and girders are connected for shear only and are free to rotate”. For simple framing, the following requirements (LRFD A2.2) apply:
a) The connections and connected members shall be adequate to resist the factored gravity loads as simple beams,
b) The connections and connected members shall be adequate to resist the factored lateral loads, and
c) The connections shall have sufficient inelastic rotation capacity to avoid overload of fasteners or welds under combined factored gravity and lateral loading.
3.2 Load Transfer to Shear Tabs
The shear tab connection is well suited to beams that have a relatively moderate or light end shear. The supported beam reaction, or shear load, is assumed to be distributed equally among the bolts in the connection. Also, it is assumed that relatively free rotation is allowed to occur between the end of the supported member and the supporting beam or column. The connection achieves this relatively free rotation from: bolt slip if the bolts are not in bearing at the time loading is initiated, bolt hole distortion in the beam web and/or the shear tab, bolt deformation in shear, and the flexibility of the supporting elements. However, due to eccentricities of the shear force, these connections can develop some connection moments at the bolt line and weld. The magnitude of these connection moments is dependant on the number and size of the bolts and their arrangement, the span-to-depth ratio of the beam, the type of loading, the flexibility of the supporting elements, and the thickness of the connection plate. The bolt tightening force can also have an effect on these connection moments at service loads, but does not appear to be a major factor at ultimate loads. When symmetry is used and a shear tab connection is made on both sides of a supporting member, the flexibility of the connection is reduced due to the stiffening of the support web by the shear tab on either side. This would increase connection moments by increasing the connection flexural restraint. In general, the supported beam shear is transferred to tab in the form of shear and moment. 3.2.1 Shear As previously discussed, the shear tab is considered a simple framing connection. As a result, the shear tab is proportioned only for shear. The AISC-LRFD Specification outlines the general provisions regarding simple connections as follows:

8
“Except as otherwise indicated in the design documents, connections of beams, girders or trusses shall be designed as flexible and ordinarily may be proportioned for the reaction shear only. Flexible beam connections shall accommodate end rotations of unrestrained (simple) beams. To accomplish this, inelastic deformation in the connection is permitted.”
The connection must be designed to meet these general AISC provisions. 3.2.2 Moment
The magnitude of the moment relative to the bolt line or weld developed in a simple connection, such as the shear tab, can be approximated by M = R*e, where R is the shear reaction and e is the reaction eccentricity. Although simple connections are normally designed exclusively for shear transfer, significant connection moments do affect the proportioning of bolt and weld sizes. The reaction eccentricity is defined as the distance from a reference point to the point of zero moment. That reference point is usually taken as the bolt line (see Fig. 3.1) or the weld line for design purposes. The reaction eccentricity is dependent on a number of factors including the number of bolts, the relative flexibility or rigidity of the supporting member, the thickness and proportions of the shear tab, the extent of bolt tightening, and the amount of rotation at the end of the supported beam (which is dependent on the stiffness or L/d ratio of that beam.)
Figure 3.1: Determination of connection moment
R
Moment at Bolt Line
e
Eccentricity

9
3.3 Design of Shear Tabs In the design of standard shear tabs, various limit states need to be investigated.
The relevant limit states are bolt shear, bolt bearing, gross shear yield of the tab, net shear rupture of the tab, block shear of the tab, and weld failure. The number of bolts and weld size is based on ultimate analysis with the effect of the eccentricity included. Three other limit states need to be investigated when the flanges of beams need to be coped in order to make the shear tab connection. The first of these is the block shear of the supported beam web. In addition, copes of the flanges may affect local web buckling, as reported by Cheng and Yura [2], and lateral-torsional buckling, as reported by Cheng, Yura, and Johnson [3]. Based on observed buckled shapes in their experimental study and a theoretical parametric study, Cheng and Yura determined that the buckling capacity of a coped beam is governed not only by the buckling strength of the uncoped length but also by the buckling strength of the coped region. For beams with long and deep copes, the buckling capacity was controlled by the coped region and was nearly independent of the uncoped region. This explained why short beams with coped sections had a significantly reduced buckling capacity. 3.4 AISC Shear Tab Design Procedure Richard [4] and Astaneh [5, 6] have performed research on standard shear tabs. These studies included investigations of the shear tab welded to the flange of wide-flange columns. Each of the studies developed a design procedure for the connection, but the current AISC procedure is primarily based on Astaneh’s procedure. Based on the experimental results, the failure modes to be considered are the following.
Shear failure of bolts Yield of gross area of plate Fracture of net area of plate Fracture of welds, and Bearing failure of beam web or plate.
The steps taken in the design adopted by AISC for a shear tab are as follows: 1) Calculate the number of bolts, n, needed to resist the combined effects of shear and moment R*eb.
For a rotationally rigid support: STD holes eb = (n-1) - a SSL holes eb = 2n/3 – a For a rotationally flexible support: STD holes eb = (n-1) - a≥ a SSL holes eb = 2n/3 - a ≥ a
where a is the distance between the centroid of the weld group lines and the bolt line 2) Calculate the gross area of the plate, dimension the plate, and check the plate
for shear yielding of the gross area, fracture of the effective net section and block shear rupture.
3) Check a rotational ductility requirement to insure that the tab is not too stiff t ≤ dh + 1/16-in.
10
where t = tab thickness and dh = bolt hole diameter 4) Check for buckling of the tab
t ≥ L/64 ≥ ¼-in. where L = tab length
5) Design the fillet welds for the combined effect of shear and moment. Here, the weld eccentricity, ew, must be taken as:
a) ew = n, or b) ew = a (whichever is larger)
However, the AISC Manual conservatively recommends a weld size that is ¾ of the plate thickness.
6) Check the bearing capacity of the bolt group in the tab and beam web. 3.5 Additional Failure Modes for Extended Shear Tabs
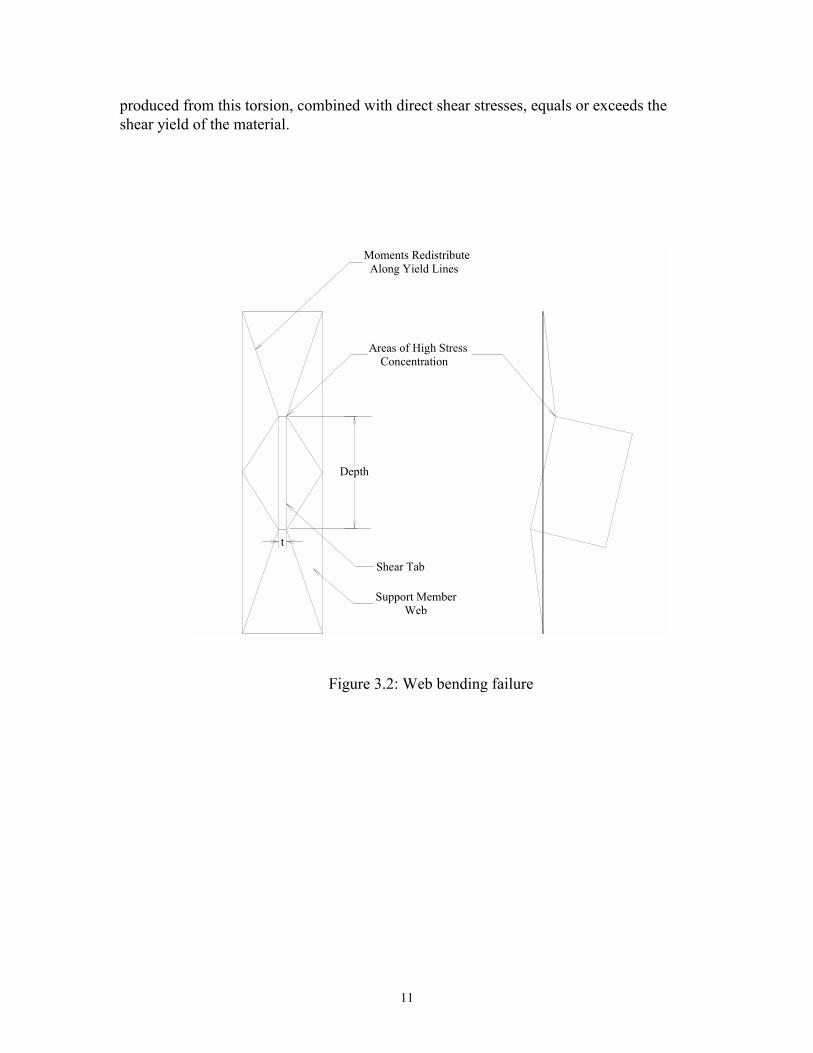
The extended shear tab is a shear tab that extends 3-in. beyond the supporting member flanges. Due to the large distance between the weld line and bolt line for this type of connection there are other possible failure modes that need to be considered. The flexibility of the support web is of particular concern when the extended shear tab is connected only to the web of a support column. Different boundary conditions exist when connecting the shear tab to a girder web or a column web with stiffening plates. For these cases, the flexibility of the support web is not a concern. Sherman and Ales [7] conducted research to develop a design procedure for shear tabs connected to tubular columns. The research investigated the evaluation of the tube wall strength. It identified two failure modes for the tube wall. The tube wall could experience either a bending failure or punching shear failure. The bending failure limit state is determined from the yield line theory and plastic analysis. The bending failure is a result of the tube wall producing plastic moments along yield lines. When a sufficient number of plastic hinges have developed as a result of these yield lines, the tube wall can turn into a mechanism and fail (see Fig. 3.2). The punching shear limit state takes place when the applied load exceeds the shear resistance of the tube wall around the perimeter of the shear tab. This failure mode can be avoided if the shear tab is proportioned so that the shear tab yields before the tube wall fractures in shear. The web of the supporting column is analogous to the tube wall for these two failure modes and hence needs to be investigated for bending failure and punching shear failure in the design of extended shear tabs. Punching shear is also a possibility for thin girder webs.
Another failure mode that needs to be investigated in the design of extended shear tabs is the twisting of the shear tab, especially when deep extended shear tabs are to be used (5 or more bolts). This twisting is caused by the eccentricity of the reaction shear with respect to the centroid of the shear tab. This eccentricity is due to the fact that the supported beam web is connected only on one side of the shear tab. For standard shear tabs, this eccentric loading is not of concern but for extended shear tabs this eccentricity can cause torsional shear stresses in the shear tab as a result of pure torsion of the rectangular shear tab cross section. Failure is predicted to occur when the shear stress
11
produced from this torsion, combined with direct shear stresses, equals or exceeds the shear yield of the material.
Figure 3.2: Web bending failure
Depth
t
Shear Tab
Support Member Web
Moments Redistribute Along Yield Lines
Areas of High Stress Concentration
12
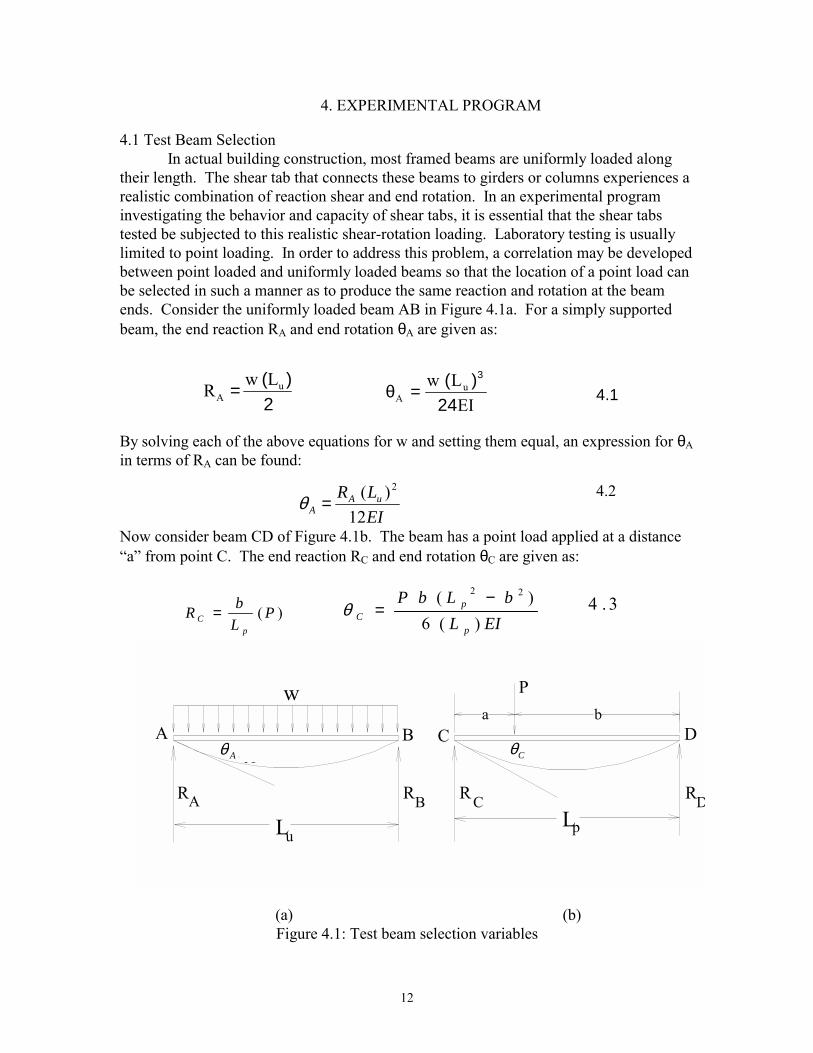
4. EXPERIMENTAL PROGRAM 4.1 Test Beam Selection In actual building construction, most framed beams are uniformly loaded along their length. The shear tab that connects these beams to girders or columns experiences a realistic combination of reaction shear and end rotation. In an experimental program investigating the behavior and capacity of shear tabs, it is essential that the shear tabs tested be subjected to this realistic shear-rotation loading. Laboratory testing is usually limited to point loading. In order to address this problem, a correlation may be developed between point loaded and uniformly loaded beams so that the location of a point load can be selected in such a manner as to produce the same reaction and rotation at the beam ends. Consider the uniformly loaded beam AB in Figure 4.1a. For a simply supported beam, the end reaction RA and end rotation θA are given as:
By solving each of the above equations for w and setting them equal, an expression for θA in terms of RA can be found:
Now consider beam CD of Figure 4.1b. The beam has a point load applied at a distance “a” from point C. The end reaction RC and end rotation θC are given as:
(a) (b)
Figure 4.1: Test beam selection variables
)( PLbR
pC = EIL
bLbP
p
pC )(6
)( 22 −=θ 3.4
2)( u
ALwR =
EILw u
A 24)( 3
=θ 1.4
EILR uA
A 12)( 2
=θ2.4
L L
υ υ
A B C D
A C
u p
w
A B C D
P
R R R R
ba
Aθ Cθ
13
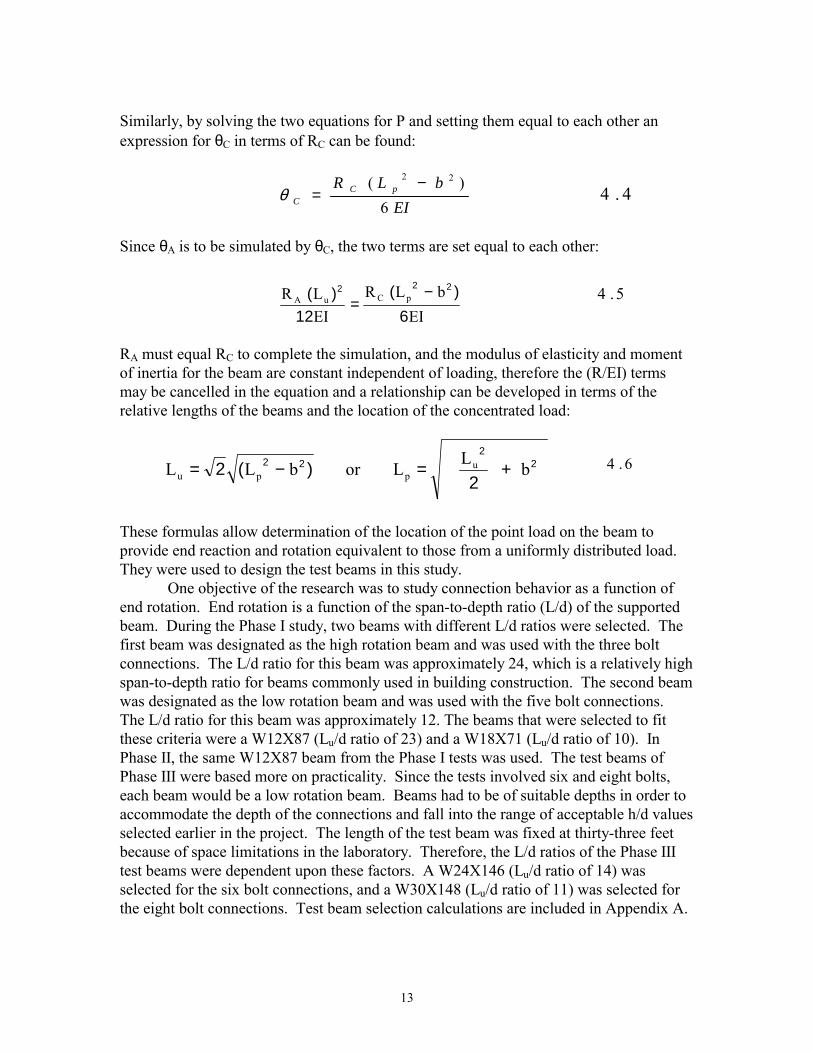
Similarly, by solving the two equations for P and setting them equal to each other an expression for θC in terms of RC can be found:
Since θA is to be simulated by θC, the two terms are set equal to each other:
RA must equal RC to complete the simulation, and the modulus of elasticity and moment of inertia for the beam are constant independent of loading, therefore the (R/EI) terms may be cancelled in the equation and a relationship can be developed in terms of the relative lengths of the beams and the location of the concentrated load:
These formulas allow determination of the location of the point load on the beam to provide end reaction and rotation equivalent to those from a uniformly distributed load. They were used to design the test beams in this study. One objective of the research was to study connection behavior as a function of end rotation. End rotation is a function of the span-to-depth ratio (L/d) of the supported beam. During the Phase I study, two beams with different L/d ratios were selected. The first beam was designated as the high rotation beam and was used with the three bolt connections. The L/d ratio for this beam was approximately 24, which is a relatively high span-to-depth ratio for beams commonly used in building construction. The second beam was designated as the low rotation beam and was used with the five bolt connections. The L/d ratio for this beam was approximately 12. The beams that were selected to fit these criteria were a W12X87 (Lu/d ratio of 23) and a W18X71 (Lu/d ratio of 10). In Phase II, the same W12X87 beam from the Phase I tests was used. The test beams of Phase III were based more on practicality. Since the tests involved six and eight bolts, each beam would be a low rotation beam. Beams had to be of suitable depths in order to accommodate the depth of the connections and fall into the range of acceptable h/d values selected earlier in the project. The length of the test beam was fixed at thirty-three feet because of space limitations in the laboratory. Therefore, the L/d ratios of the Phase III test beams were dependent upon these factors. A W24X146 (Lu/d ratio of 14) was selected for the six bolt connections, and a W30X148 (Lu/d ratio of 11) was selected for the eight bolt connections. Test beam selection calculations are included in Appendix A.
EIbLR pC
C 6)( 22 −
=θ 4.4
5.4
6.4
EIbLR
EILR pCuA
6)(
12)( 222 −
=
+=−= 22
22
2)(2 bLLorbLL u
ppu
14
4.2 Test Program Another objective of the research was to study connection behavior as a function
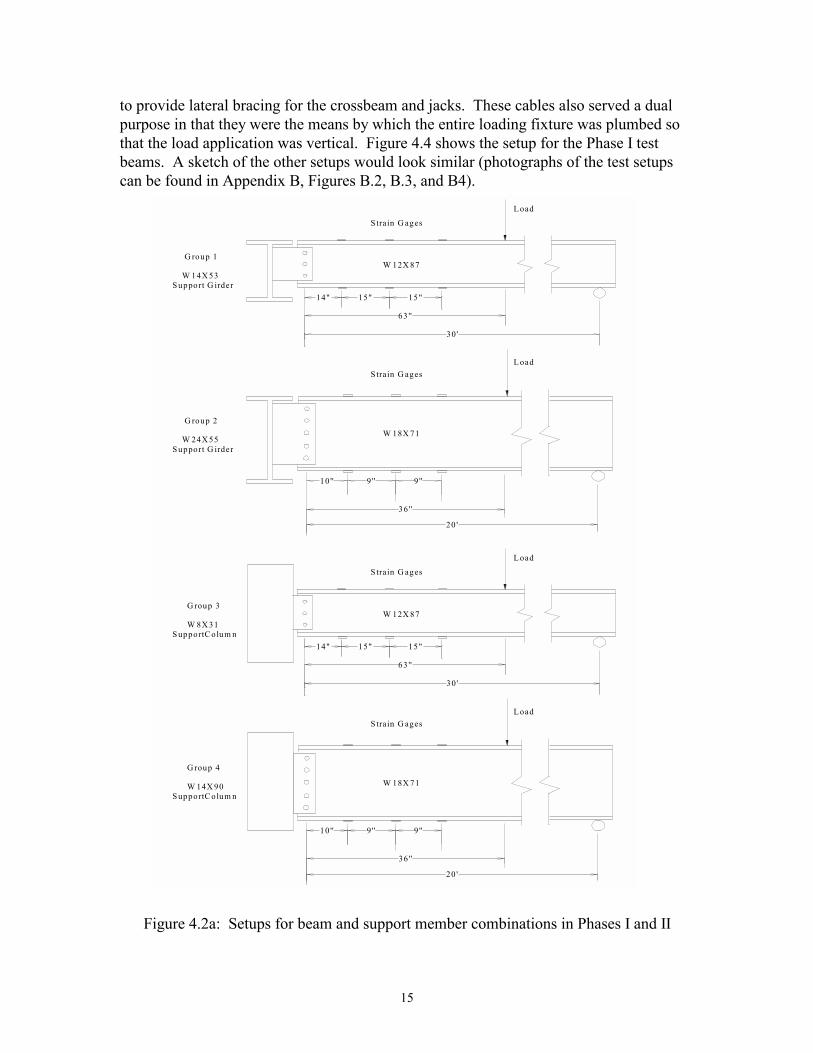
of the h/tw of the supporting member webs. A range of h/tw ratios for the supporting member webs was selected. This range was from 22 to 54. There were eight combinations of supporting members and supported beams used in the experimental program. Four of these groups used support girders and four used support columns. They are: Group 1: W14X53 support girder (h/tw = 30.8) with 30-ft. long W12X87 beam Group 2: W24X55 support girder (h/tw = 54.6) with a 20-ft. long W18X71 beam Group 3: W8X31 support column (h/tw = 22.2) with a 30-ft. long W12X87 beam Group 4: W14X90 support column (h/tw = 25.9) with a 20-ft. long W18X71 beam Group 5: W30X173 support girder (h/tw = 41.2) with a 33-ft. long W24X146 beam Group 6: W14X90 support column (h/tw = 25.9) with a 33-ft. long W24X146 beam Group 7: W33X152 support girder (h/tw = 47.2) with a 33-ft. long W30X148 beam Group 8: W14X90 support column (h/tw = 25.9) with a 33-ft. long W30X148 beam All supporting and supported members were ASTM A572Grade 50 steel. All tab plates were ordered to be ASTM A36 Grade 36 steel. All tab plates were delivered as A36 steel except two ¼” plate (used in Phase II) that were Grade 50. For all of the tests, the column segments were 8-ft. long and the girder segments were 10-ft. long. See Figures 4.2a and 4.2b for the test setups for each support member and beam combinations. Calculations for the locations of the point loads are in Appendix A. 4.2.1 Far end beam reaction
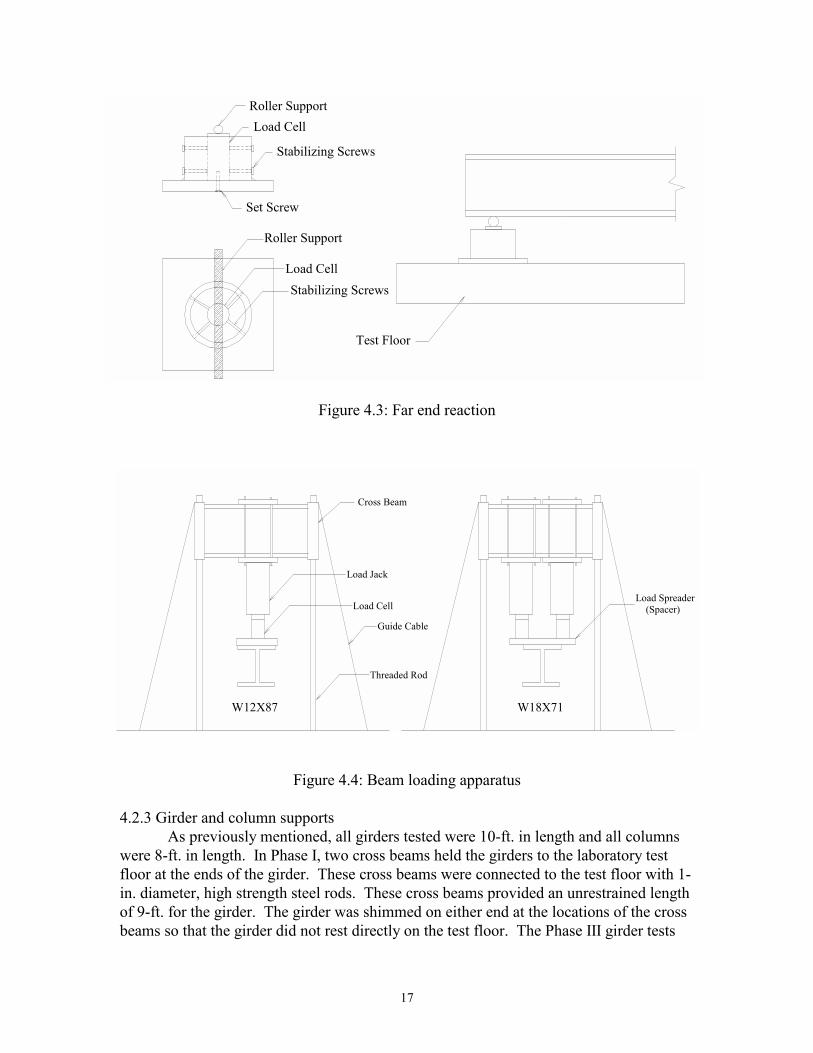
The far end beam support consists of a load cell, a roller bar placed directly on top of the load cell, and a support fixture used to stabilize the load cell. The load cell is used to measure the far end reaction. For the Phase I column tests, the support fixture was placed on top of two large steel crates and shimmed in order to bring the support fixture and load cell up to a height capable of measuring the far end beam reaction (approximately 4-ft. off of the laboratory’s test floor). Phase II and III utilized a pedestal constructed from a 10”x10” square tube and two bearing plates in order to bring the far support to the correct elevation. For the girder tests, the support fixture was placed directly onto the test floor. A schematic of the far end reaction is shown in Figure 4.3 (a photograph of the actual far end reaction can be found in Appendix B, Figure B.1). 4.2.2 Beam loading mechanism The jacks used to load the test beams had a capacity of 120 kips each. Tests involving the W12X87 beam with three bolts required only one jack. For tests using the W18X71 beam with five bolts, two jacks were needed and were placed side-by-side to apply the load. Tests with the W24X146 beam and six bolts required three jacks to reach the ultimate load, while the W30X148 beam having an eight-bolt connection needed four jacks. The jacks were mounted to a cross beam which was secured to the laboratory test floor using 2-in. diameter high strength steel threaded rods (capacity of 150 kips each). Small diameter steel cables were strung from the crossbeam and secured to the test floor
15
to provide lateral bracing for the crossbeam and jacks. These cables also served a dual purpose in that they were the means by which the entire loading fixture was plumbed so that the load application was vertical. Figure 4.4 shows the setup for the Phase I test beams. A sketch of the other setups would look similar (photographs of the test setups can be found in Appendix B, Figures B.2, B.3, and B4).
Figure 4.2a: Setups for beam and support member combinations in Phases I and II
L oad
G roup 1 W 14X 53 S upport G irder
14" 15" 15"
63 ''
30'
S train G ages
L oadS train G ages
G roup 2 W 24X 55 S upport G irder
10 '' 9 '' 9 ''
36 ''
20 '
S train G ages
30'
63 ''
15"
G roup 3 W 8X 31 S upportC olum n
14" 15"
L oad
W 18X 71
W 12X 87
W 12X 87
W 18X 71
9 ''
S train G ages
20 '
36 ''
10 '' 9 ''
L oad
G roup 4 W 14X 90S upportC olum n
16
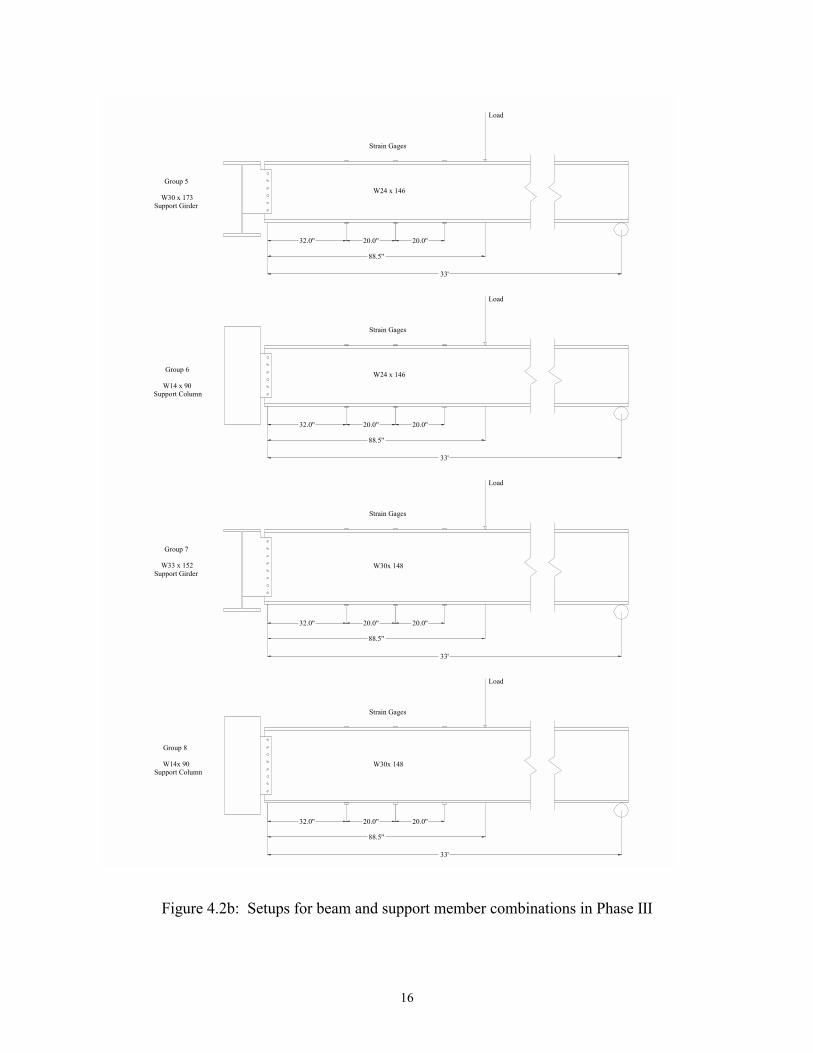
Figure 4.2b: Setups for beam and support member combinations in Phase III
Load
Strain Gages
W24 x 146Group 6
W14 x 90Support Column
20.0" 20.0"
88.5"
33'
W30 x 173Support Girder
33'
20.0"
88.5"
20.0"
Group 5
Load
Strain Gages
W24 x 146
33'
Group 7
W33 x 152Support Girder
W30x 148
Strain Gages
20.0"
88.5"
20.0"
Load
33'
88.5"
W30x 148
20.0" 20.0"
Strain Gages
Load
W14x 90
Group 8
Support Column
32.0"
32.0"
32.0"
32.0"
17
Figure 4.3: Far end reaction
Figure 4.4: Beam loading apparatus 4.2.3 Girder and column supports As previously mentioned, all girders tested were 10-ft. in length and all columns were 8-ft. in length. In Phase I, two cross beams held the girders to the laboratory test floor at the ends of the girder. These cross beams were connected to the test floor with 1-in. diameter, high strength steel rods. These cross beams provided an unrestrained length of 9-ft. for the girder. The girder was shimmed on either end at the locations of the cross beams so that the girder did not rest directly on the test floor. The Phase III girder tests
Roller Support
Set Screw
Load Cell
Stabilizing Screws
Roller Support
Load CellStabilizing Screws
Test Floor
W18X71W12X87
Cross Beam
Load Jack
Load Cell
Guide Cable
Threaded Rod
Load Spreader (Spacer)
18
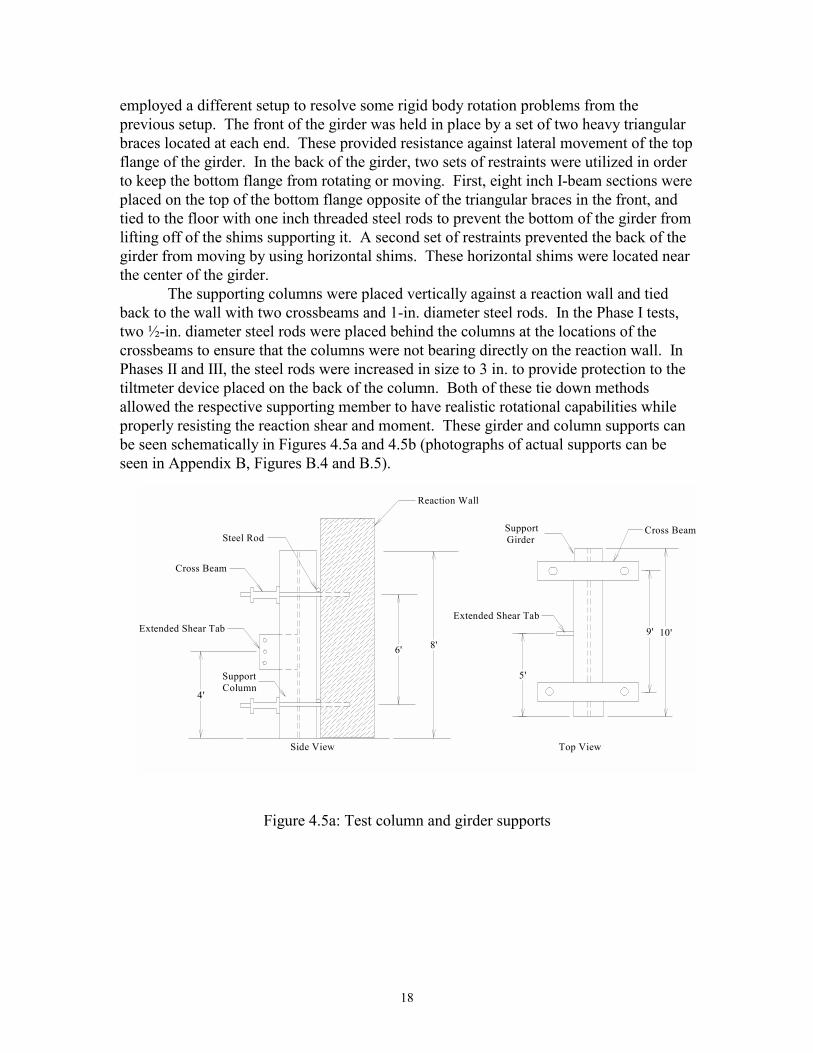
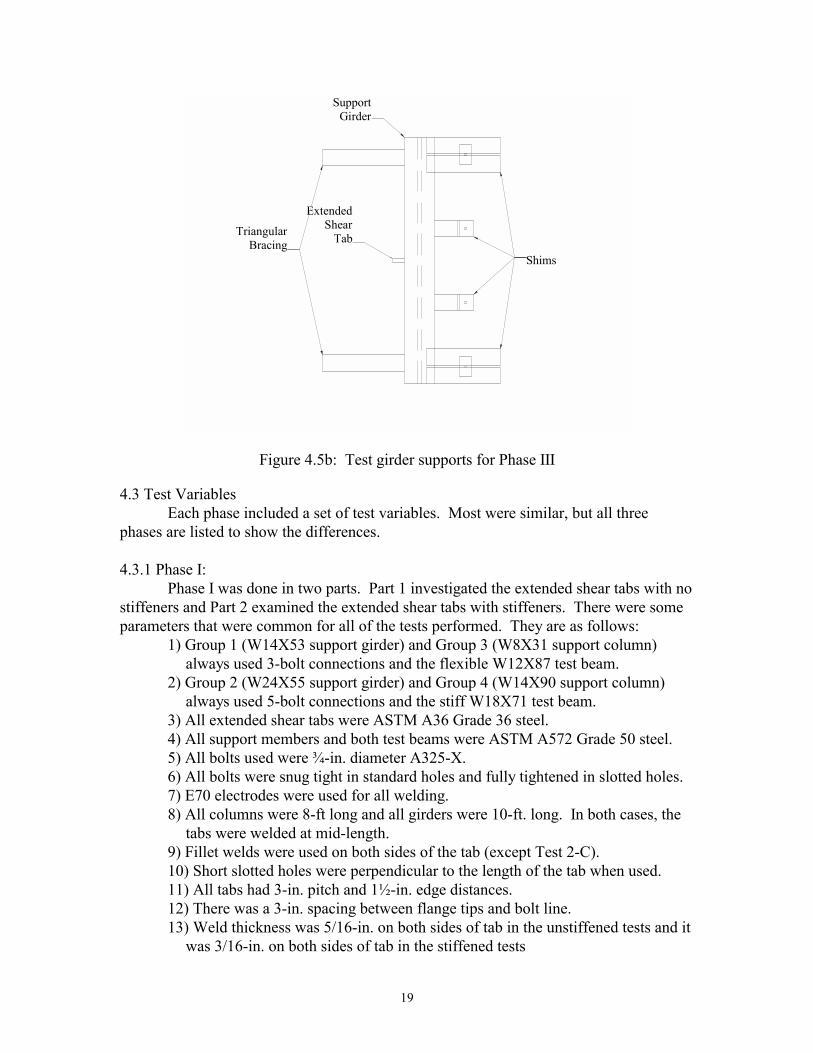
employed a different setup to resolve some rigid body rotation problems from the previous setup. The front of the girder was held in place by a set of two heavy triangular braces located at each end. These provided resistance against lateral movement of the top flange of the girder. In the back of the girder, two sets of restraints were utilized in order to keep the bottom flange from rotating or moving. First, eight inch I-beam sections were placed on the top of the bottom flange opposite of the triangular braces in the front, and tied to the floor with one inch threaded steel rods to prevent the bottom of the girder from lifting off of the shims supporting it. A second set of restraints prevented the back of the girder from moving by using horizontal shims. These horizontal shims were located near the center of the girder. The supporting columns were placed vertically against a reaction wall and tied back to the wall with two crossbeams and 1-in. diameter steel rods. In the Phase I tests, two ½-in. diameter steel rods were placed behind the columns at the locations of the crossbeams to ensure that the columns were not bearing directly on the reaction wall. In Phases II and III, the steel rods were increased in size to 3 in. to provide protection to the tiltmeter device placed on the back of the column. Both of these tie down methods allowed the respective supporting member to have realistic rotational capabilities while properly resisting the reaction shear and moment. These girder and column supports can be seen schematically in Figures 4.5a and 4.5b (photographs of actual supports can be seen in Appendix B, Figures B.4 and B.5).
Figure 4.5a: Test column and girder supports
Reaction Wall
Cross Beam
Extended Shear Tab
Steel Rod
Support Column
Side View
6' 8'
4'
Top View
10'9'
5'
Extended Shear Tab
Support Girder
Cross Beam
19
Figure 4.5b: Test girder supports for Phase III
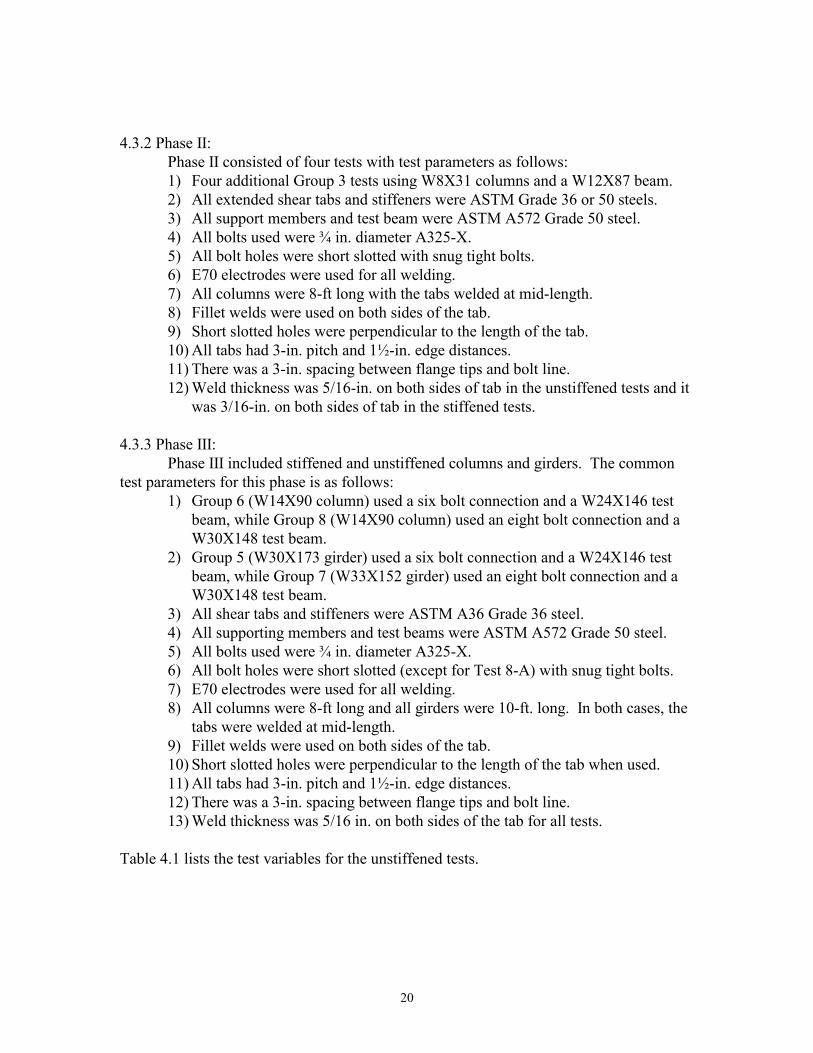
4.3 Test Variables Each phase included a set of test variables. Most were similar, but all three phases are listed to show the differences. 4.3.1 Phase I: Phase I was done in two parts. Part 1 investigated the extended shear tabs with no stiffeners and Part 2 examined the extended shear tabs with stiffeners. There were some parameters that were common for all of the tests performed. They are as follows:
1) Group 1 (W14X53 support girder) and Group 3 (W8X31 support column) always used 3-bolt connections and the flexible W12X87 test beam.
2) Group 2 (W24X55 support girder) and Group 4 (W14X90 support column) always used 5-bolt connections and the stiff W18X71 test beam.
3) All extended shear tabs were ASTM A36 Grade 36 steel. 4) All support members and both test beams were ASTM A572 Grade 50 steel. 5) All bolts used were ¾-in. diameter A325-X. 6) All bolts were snug tight in standard holes and fully tightened in slotted holes. 7) E70 electrodes were used for all welding. 8) All columns were 8-ft long and all girders were 10-ft. long. In both cases, the
tabs were welded at mid-length. 9) Fillet welds were used on both sides of the tab (except Test 2-C). 10) Short slotted holes were perpendicular to the length of the tab when used. 11) All tabs had 3-in. pitch and 1½-in. edge distances. 12) There was a 3-in. spacing between flange tips and bolt line. 13) Weld thickness was 5/16-in. on both sides of tab in the unstiffened tests and it
was 3/16-in. on both sides of tab in the stiffened tests
ExtendedShear
Tab
SupportGirder
Shims
TriangularBracing
20
4.3.2 Phase II: Phase II consisted of four tests with test parameters as follows:
1) Four additional Group 3 tests using W8X31 columns and a W12X87 beam. 2) All extended shear tabs and stiffeners were ASTM Grade 36 or 50 steels. 3) All support members and test beam were ASTM A572 Grade 50 steel. 4) All bolts used were ¾ in. diameter A325-X. 5) All bolt holes were short slotted with snug tight bolts. 6) E70 electrodes were used for all welding. 7) All columns were 8-ft long with the tabs welded at mid-length. 8) Fillet welds were used on both sides of the tab. 9) Short slotted holes were perpendicular to the length of the tab. 10) All tabs had 3-in. pitch and 1½-in. edge distances. 11) There was a 3-in. spacing between flange tips and bolt line. 12) Weld thickness was 5/16-in. on both sides of tab in the unstiffened tests and it
was 3/16-in. on both sides of tab in the stiffened tests. 4.3.3 Phase III: Phase III included stiffened and unstiffened columns and girders. The common test parameters for this phase is as follows:
1) Group 6 (W14X90 column) used a six bolt connection and a W24X146 test beam, while Group 8 (W14X90 column) used an eight bolt connection and a W30X148 test beam.
2) Group 5 (W30X173 girder) used a six bolt connection and a W24X146 test beam, while Group 7 (W33X152 girder) used an eight bolt connection and a W30X148 test beam.
3) All shear tabs and stiffeners were ASTM A36 Grade 36 steel. 4) All supporting members and test beams were ASTM A572 Grade 50 steel. 5) All bolts used were ¾ in. diameter A325-X. 6) All bolt holes were short slotted (except for Test 8-A) with snug tight bolts. 7) E70 electrodes were used for all welding. 8) All columns were 8-ft long and all girders were 10-ft. long. In both cases, the
tabs were welded at mid-length. 9) Fillet welds were used on both sides of the tab. 10) Short slotted holes were perpendicular to the length of the tab when used. 11) All tabs had 3-in. pitch and 1½-in. edge distances. 12) There was a 3-in. spacing between flange tips and bolt line. 13) Weld thickness was 5/16 in. on both sides of the tab for all tests.
Table 4.1 lists the test variables for the unstiffened tests.

21
Table 4.1 - Test variables for unstiffened tests
Test Support Member
Tab t (in.)
Weld Size (in.) Web h/tw
# of Bolts
Tab Length
(in.)
Weld-Bolt
Distance (in.) Bracing
1-U W14x53 3/8 5/16 30.8 3 9 6.85 NO 2-U W24x55 3/8 5/16 54.6 5 15 6.30 NO 3-U W8x31 3/8 5/16 22.2 3 9 6.86 NO
3-UM W8x31 3/8 5/16 22.2 3 9 6.86 Lat 4-U W14x90 1/2 5/16 25.9 5 15 10.04 NO 6-U W14x90 1/2 5/16 25.9 6 18 10.04 Lat & Rot
6-UB W14x90 1/2 5/16 25.9 6 18 10.04 None 8-U W14x90 1/2 5/16 25.9 8 24 10.04 Lat & Rot
All the unstiffened tests used short slotted holes in the tab. The tab thickness was chosen to meet stability limit states under the anticipated maximum shear. If the extended shear tab is considered a short cantilevered beam with a narrow rectangular cross section and with a concentrated load applied to the centroid of the section at the location of the bolt holes (see Fig. 4.6), the limiting end load is given by [10]:
Figure 4.6: Schematic for tab thickness determination for the unstiffened tests For common proportions of a shear tab, the thickness to length ratio (t/L) found in Equation 4.7 is very small and the second radical term is approximately unity. The equation can be solved approximately for the required thickness when the applied shear is known:
t ≥ (Va2/12000L)1/3 4.8
2
3 /63.01669.0a
LtLtEGVcr
−=
7.4V cr V cr
Support Web
Extended Shear Tab
L
a
t E = 29,000 ksi (STEEL)
G = 11,200 ksi (STEEL)
22
A sample calculation of shear tab thickness determination for unstiffened tabs can be found in Appendix C. In addition, the tab thickness should meet the stability criteria in the AISC Manual [1] for single plate shear connections:
t ≥ L/64 ≥ ¼-in. 4.9
AISC recommended weld sizes of approximately ¾ t were used for the unstiffened tabs of this study to ensure that weld failures did not precede shear yielding of the plate’s gross section.
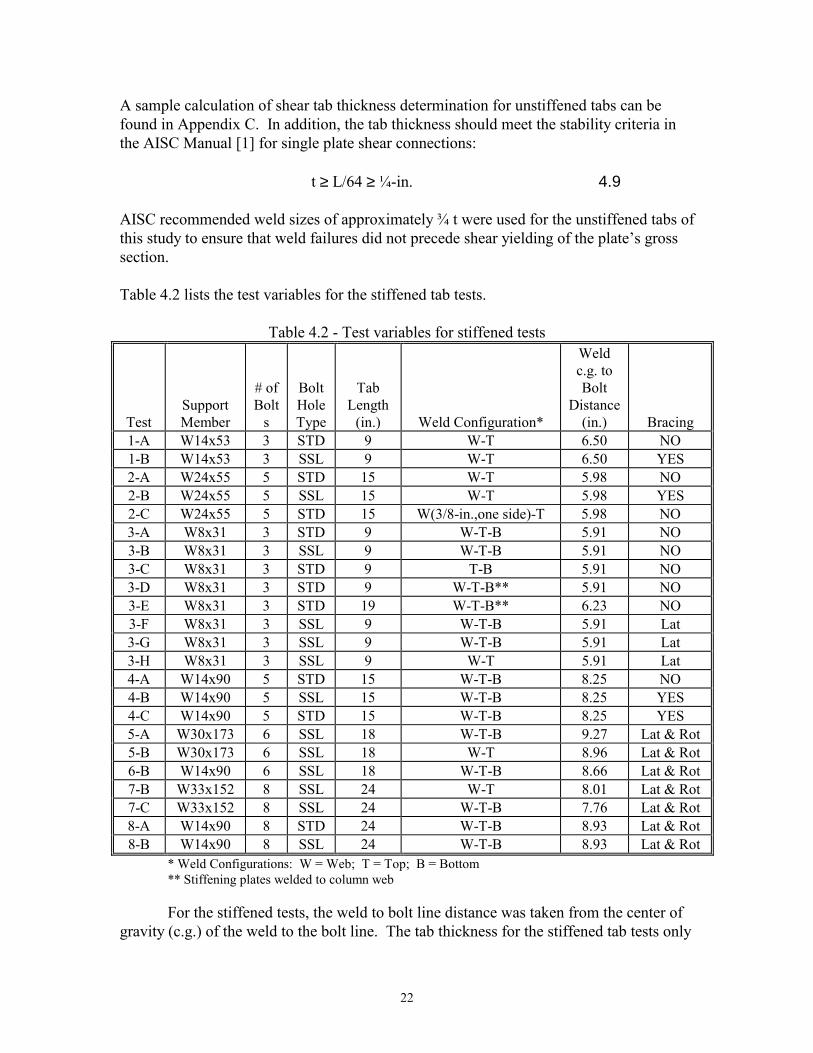
Table 4.2 lists the test variables for the stiffened tab tests.
Table 4.2 - Test variables for stiffened tests
Test Support Member
# of Bolt
s
Bolt Hole Type
Tab Length
(in.) Weld Configuration*
Weld c.g. to Bolt
Distance (in.) Bracing
1-A W14x53 3 STD 9 W-T 6.50 NO 1-B W14x53 3 SSL 9 W-T 6.50 YES 2-A W24x55 5 STD 15 W-T 5.98 NO 2-B W24x55 5 SSL 15 W-T 5.98 YES 2-C W24x55 5 STD 15 W(3/8-in.,one side)-T 5.98 NO 3-A W8x31 3 STD 9 W-T-B 5.91 NO 3-B W8x31 3 SSL 9 W-T-B 5.91 NO 3-C W8x31 3 STD 9 T-B 5.91 NO 3-D W8x31 3 STD 9 W-T-B** 5.91 NO 3-E W8x31 3 STD 19 W-T-B** 6.23 NO 3-F W8x31 3 SSL 9 W-T-B 5.91 Lat 3-G W8x31 3 SSL 9 W-T-B 5.91 Lat 3-H W8x31 3 SSL 9 W-T 5.91 Lat 4-A W14x90 5 STD 15 W-T-B 8.25 NO 4-B W14x90 5 SSL 15 W-T-B 8.25 YES 4-C W14x90 5 STD 15 W-T-B 8.25 YES 5-A W30x173 6 SSL 18 W-T-B 9.27 Lat & Rot 5-B W30x173 6 SSL 18 W-T 8.96 Lat & Rot 6-B W14x90 6 SSL 18 W-T-B 8.66 Lat & Rot 7-B W33x152 8 SSL 24 W-T 8.01 Lat & Rot 7-C W33x152 8 SSL 24 W-T-B 7.76 Lat & Rot 8-A W14x90 8 STD 24 W-T-B 8.93 Lat & Rot 8-B W14x90 8 SSL 24 W-T-B 8.93 Lat & Rot
* Weld Configurations: W = Web; T = Top; B = Bottom ** Stiffening plates welded to column web For the stiffened tests, the weld to bolt line distance was taken from the center of
gravity (c.g.) of the weld to the bolt line. The tab thickness for the stiffened tab tests only

23
needed to meet the AISC stability criteria of Equation 4.9 and not the cantilever model criteria of Equation 4.8 because the distance to the bolt line from the end of the horizontal weld was only 3-in. Therefore, all Phase I and II stiffened tabs were 1/4-in. thick and weld sizes were 3/16-in. The stiffened tabs in Phase III were increased in size to 5/16 in. with exception of Group 8, where the stiffened tab thickness was 3/8 in.
In Phase I, each group in the stiffened tab tests had two base tests (designated by the A and B suffixes in Table 4.2). Those tests consisted of the standard connection details. Tests “A” were with standard holes and tests “B” were with short-slotted holes. Additional variations on these base tests were performed in tests designated with C, D, and E suffixes in Table 4.2. In Test 2-C, the fillet weld to the column web was doubled in size and placed on only one side of the tab. In Test 3-C, no weld was used between the tab and column web, the tab was welded only to the top and bottom stiffening plates. Tests 3-D and 3-E had the stiffening plates welded to the column web analogous to a case where the continuity plates (or stiffeners) could be used for orthogonal framing. Test 3-E also incorporated an extra long tab (19-in. compared to 9-in.) for the case where the continuity plate spacing is considerably larger than required for the 9-in. tab length. With the introduction of Phase II came three new designations. Test 3-F was a column with two stiffeners of ¼ in. thickness. Test 3-G also had two stiffeners, but with a thickness of ½ in. Test 3-H was the test with one ¼ in. stiffener at the top of the shear tab.
Phase III continued having test designations of A and B for some of the groups. Group 8 was the only group that kept the same designation as Phase I, with 8-A having standard bolt holes and 8B having short slotted holes. Group 6 stayed with the designation trend, but only consisted of one stiffened test, a specimen with short slotted holes labeled as 6-B. Group 5 had an A and B, but neither of the tests employed standard bolt holes, so the designations changed. 5-A was a girder with a tab extension being welded to the bottom flange of the girder, while 5-B was without the extension. Group 7 included a B and C designation. Test 7-B was similar to 5-B, a girder without the shear tab extending to the bottom flange. Test 7-C included the tab extension.
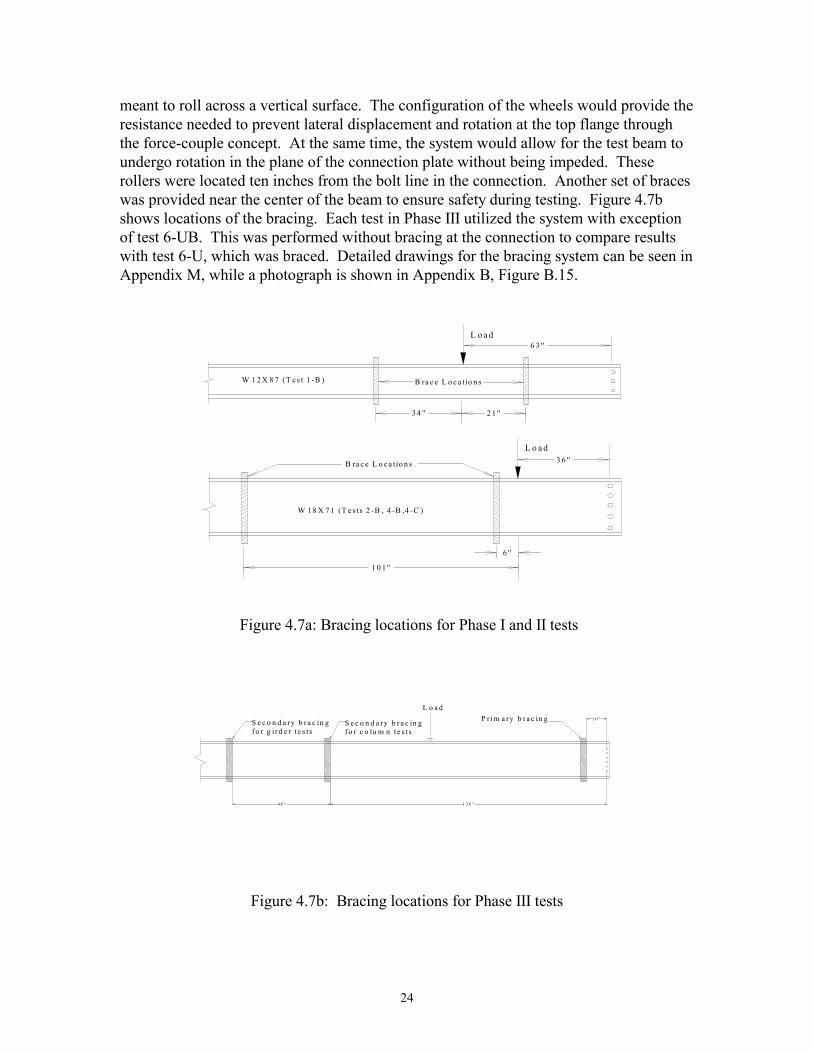
The unstiffened tab test results indicated that there was some twisting of the extended shear tabs. Therefore, lateral bracing elements at two positions along the length of the supported beams were provided in Phase I for tests 1-B, 2-B, 4-B, and 4-C, see Figure 4.7a. The first bracing element was positioned at 42 inches from the connection bolt line for each beam. The same bracing locations were used for lateral bracing in Phase II. The bracing elements were designed to provide lateral restraining for both the top and bottom flanges of the supported beams, except for the four Phase II tests in which the bottom flange was not connected to the bracing. This in-effect prevented the twisting of the section at the positions of the bracing elements. The bracing elements did not inhibit the beams from undergoing vertical displacement. It must be noted that in real structures, a lateral restraining effect from the deck is normally present for only the top flange of supported beams. No significant restraining effect against twisting of the section is normally provided by the deck. Photographs of the bracing system used for these phases are shown in Appendix B, Figures B.6 and B.7. The beginning of Phase III introduced a new type of bracing for the beam. Concerns that the previous bracing did not realistically simulate the actual restraint of a floor deck at the top flange of the beam led to a more sophisticated system. The new bracing consisted of a steel yoke with two steel wheels
24
meant to roll across a vertical surface. The configuration of the wheels would provide the resistance needed to prevent lateral displacement and rotation at the top flange through the force-couple concept. At the same time, the system would allow for the test beam to undergo rotation in the plane of the connection plate without being impeded. These rollers were located ten inches from the bolt line in the connection. Another set of braces was provided near the center of the beam to ensure safety during testing. Figure 4.7b shows locations of the bracing. Each test in Phase III utilized the system with exception of test 6-UB. This was performed without bracing at the connection to compare results with test 6-U, which was braced. Detailed drawings for the bracing system can be seen in Appendix M, while a photograph is shown in Appendix B, Figure B.15.
Figure 4.7a: Bracing locations for Phase I and II tests
Figure 4.7b: Bracing locations for Phase III tests
L o a d
W 1 2 X 8 7 (T es t 1 -B )
6 3 ''
3 4 '' 2 1 ''
L o a d3 6 ''
W 1 8 X 7 1 (T e s ts 2 -B , 4 -B ,4 -C )
B ra c e L o c a tio n s
6 ''
1 0 1 ''
B ra c e L o c a tio n s
L o a dP r im a r y b r a c in gS e c o n d a r y b r a c in g
f o r c o lu m n t e s tsS e c o n d a r y b r a c in gf o r g i r d e r t e s t s
1 0 "
1 3 6 "4 8 "
25
4.4 Instrumentation A variety of instrumentation to measure load, distortions and strains were used. 4.4.1 Load cells
Load cells were used to measure the applied load and the far end reaction of the supported beam. The difference between the two is the shear force in the connection. Experimental setups for the load cells are shown in Figures 4.3 and 4.4 (a photograph can be found in Appendix B, Figure B.8). 4.4.2 LVDTs
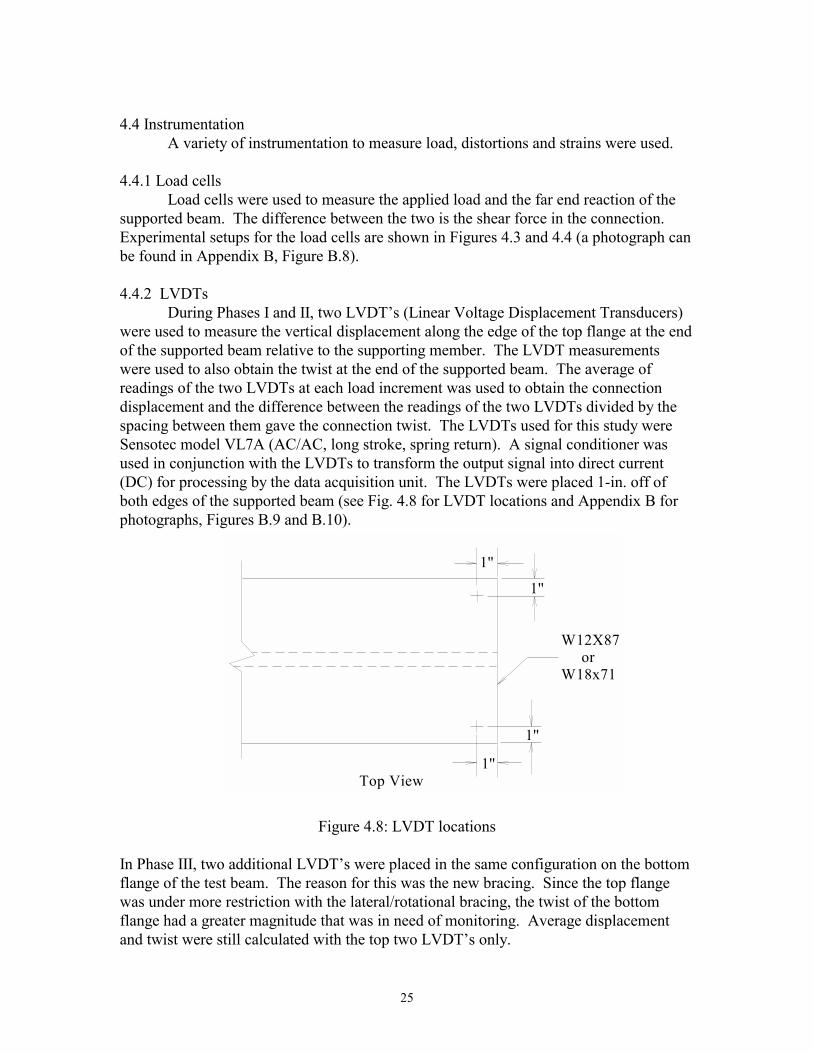
During Phases I and II, two LVDT’s (Linear Voltage Displacement Transducers) were used to measure the vertical displacement along the edge of the top flange at the end of the supported beam relative to the supporting member. The LVDT measurements were used to also obtain the twist at the end of the supported beam. The average of readings of the two LVDTs at each load increment was used to obtain the connection displacement and the difference between the readings of the two LVDTs divided by the spacing between them gave the connection twist. The LVDTs used for this study were Sensotec model VL7A (AC/AC, long stroke, spring return). A signal conditioner was used in conjunction with the LVDTs to transform the output signal into direct current (DC) for processing by the data acquisition unit. The LVDTs were placed 1-in. off of both edges of the supported beam (see Fig. 4.8 for LVDT locations and Appendix B for photographs, Figures B.9 and B.10).
Figure 4.8: LVDT locations In Phase III, two additional LVDT’s were placed in the same configuration on the bottom flange of the test beam. The reason for this was the new bracing. Since the top flange was under more restriction with the lateral/rotational bracing, the twist of the bottom flange had a greater magnitude that was in need of monitoring. Average displacement and twist were still calculated with the top two LVDT’s only.
W12X87 orW18x71
Top View
1''
1''
1''
1''
26
4.4.3 Tiltmeters
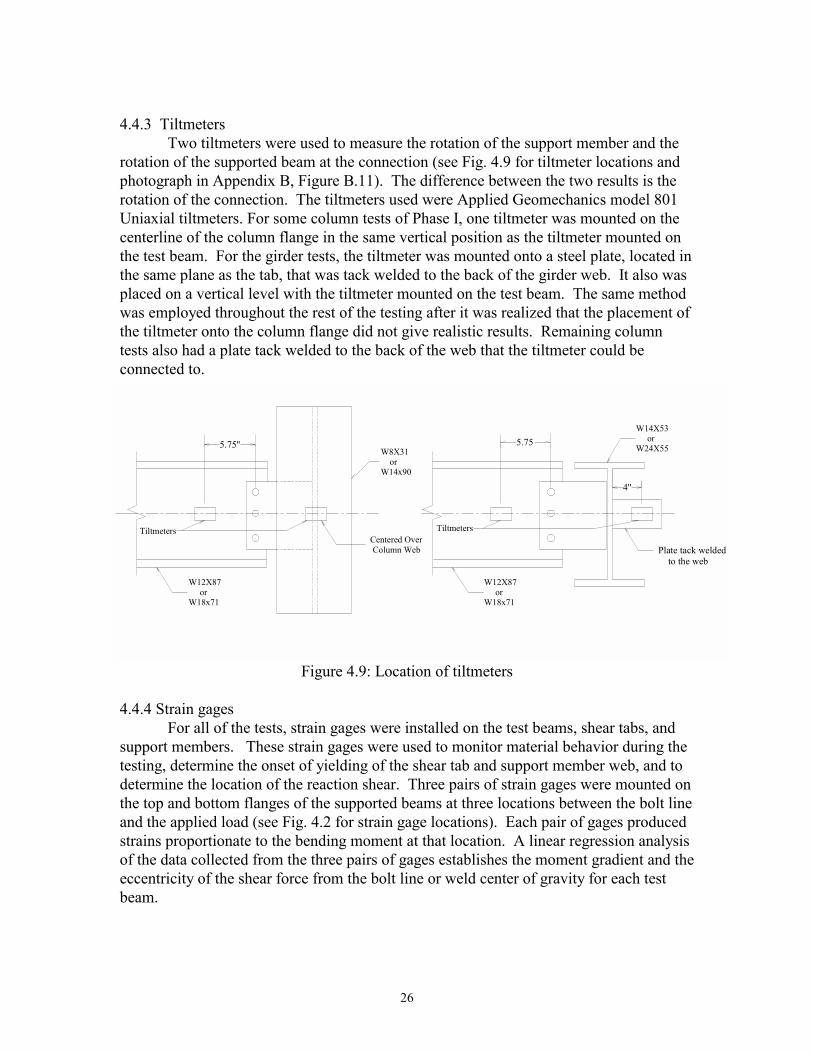
Two tiltmeters were used to measure the rotation of the support member and the rotation of the supported beam at the connection (see Fig. 4.9 for tiltmeter locations and photograph in Appendix B, Figure B.11). The difference between the two results is the rotation of the connection. The tiltmeters used were Applied Geomechanics model 801 Uniaxial tiltmeters. For some column tests of Phase I, one tiltmeter was mounted on the centerline of the column flange in the same vertical position as the tiltmeter mounted on the test beam. For the girder tests, the tiltmeter was mounted onto a steel plate, located in the same plane as the tab, that was tack welded to the back of the girder web. It also was placed on a vertical level with the tiltmeter mounted on the test beam. The same method was employed throughout the rest of the testing after it was realized that the placement of the tiltmeter onto the column flange did not give realistic results. Remaining column tests also had a plate tack welded to the back of the web that the tiltmeter could be connected to.
Figure 4.9: Location of tiltmeters 4.4.4 Strain gages
For all of the tests, strain gages were installed on the test beams, shear tabs, and support members. These strain gages were used to monitor material behavior during the testing, determine the onset of yielding of the shear tab and support member web, and to determine the location of the reaction shear. Three pairs of strain gages were mounted on the top and bottom flanges of the supported beams at three locations between the bolt line and the applied load (see Fig. 4.2 for strain gage locations). Each pair of gages produced strains proportionate to the bending moment at that location. A linear regression analysis of the data collected from the three pairs of gages establishes the moment gradient and the eccentricity of the shear force from the bolt line or weld center of gravity for each test beam.
W12X87 or W18x71
W8X31 or W14x90
TiltmetersCentered Over Column Web
W12X87 or W18x71
W14X53 or W24X55
Tiltmeters
5.75'' 5.75
4''
Plate tack welded to the web
27
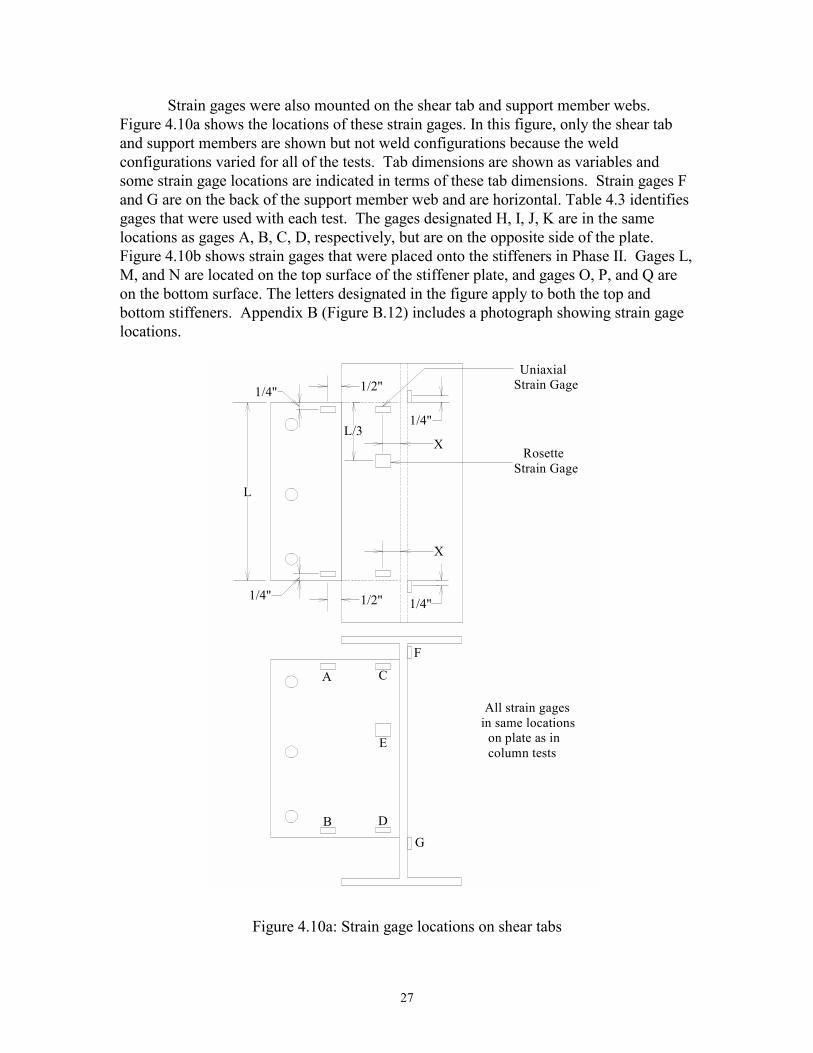
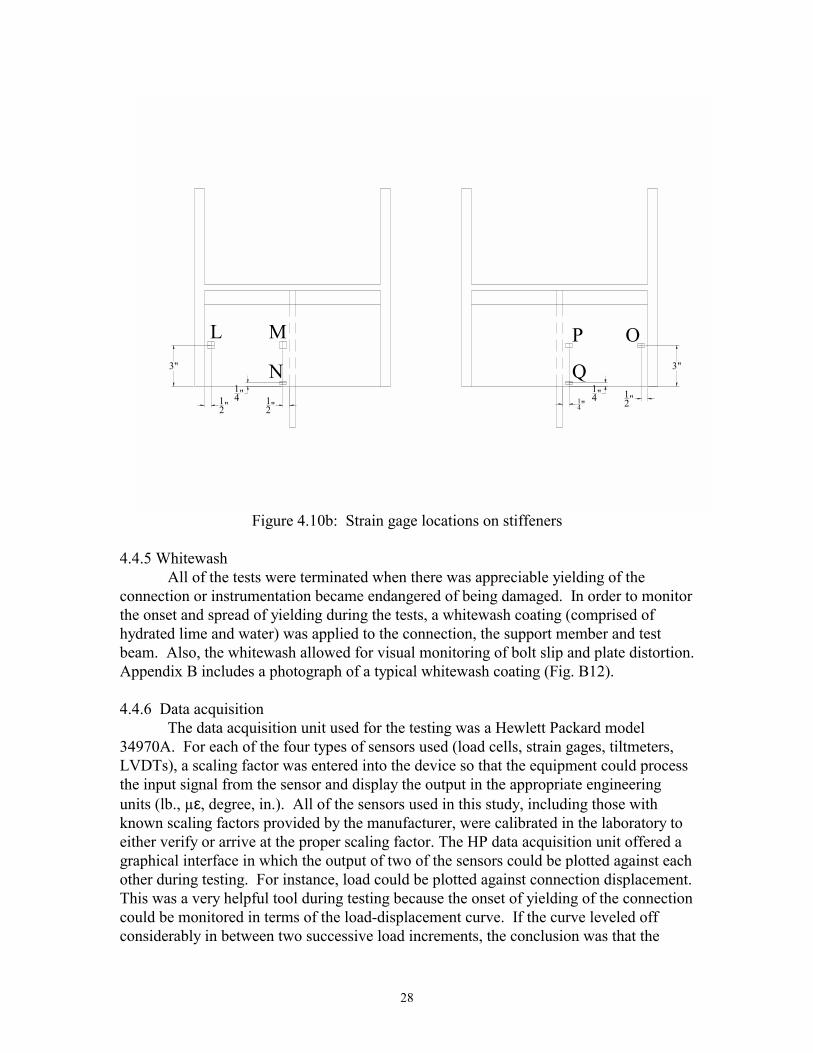
Strain gages were also mounted on the shear tab and support member webs. Figure 4.10a shows the locations of these strain gages. In this figure, only the shear tab and support members are shown but not weld configurations because the weld configurations varied for all of the tests. Tab dimensions are shown as variables and some strain gage locations are indicated in terms of these tab dimensions. Strain gages F and G are on the back of the support member web and are horizontal. Table 4.3 identifies gages that were used with each test. The gages designated H, I, J, K are in the same locations as gages A, B, C, D, respectively, but are on the opposite side of the plate. Figure 4.10b shows strain gages that were placed onto the stiffeners in Phase II. Gages L, M, and N are located on the top surface of the stiffener plate, and gages O, P, and Q are on the bottom surface. The letters designated in the figure apply to both the top and bottom stiffeners. Appendix B (Figure B.12) includes a photograph showing strain gage locations.
Figure 4.10a: Strain gage locations on shear tabs
L
1/2''
1/2''
1/4''
1/4''
X
X
L/3
Uniaxial Strain Gage
Rosette Strain Gage
1/4''
A
B
C
D
E
F
G
All strain gages in same locations on plate as in column tests
1/4''
28
Figure 4.10b: Strain gage locations on stiffeners 4.4.5 Whitewash
All of the tests were terminated when there was appreciable yielding of the connection or instrumentation became endangered of being damaged. In order to monitor the onset and spread of yielding during the tests, a whitewash coating (comprised of hydrated lime and water) was applied to the connection, the support member and test beam. Also, the whitewash allowed for visual monitoring of bolt slip and plate distortion. Appendix B includes a photograph of a typical whitewash coating (Fig. B12). 4.4.6 Data acquisition
The data acquisition unit used for the testing was a Hewlett Packard model 34970A. For each of the four types of sensors used (load cells, strain gages, tiltmeters, LVDTs), a scaling factor was entered into the device so that the equipment could process the input signal from the sensor and display the output in the appropriate engineering units (lb., µε, degree, in.). All of the sensors used in this study, including those with known scaling factors provided by the manufacturer, were calibrated in the laboratory to either verify or arrive at the proper scaling factor. The HP data acquisition unit offered a graphical interface in which the output of two of the sensors could be plotted against each other during testing. For instance, load could be plotted against connection displacement. This was a very helpful tool during testing because the onset of yielding of the connection could be monitored in terms of the load-displacement curve. If the curve leveled off considerably in between two successive load increments, the conclusion was that the
12"1
2" 12"
3"
14"
3"
14"
14"
L M
N Q
P O
29
connection had yielded and the test could be terminated. A permanent record of all test data was made after completion of each test.
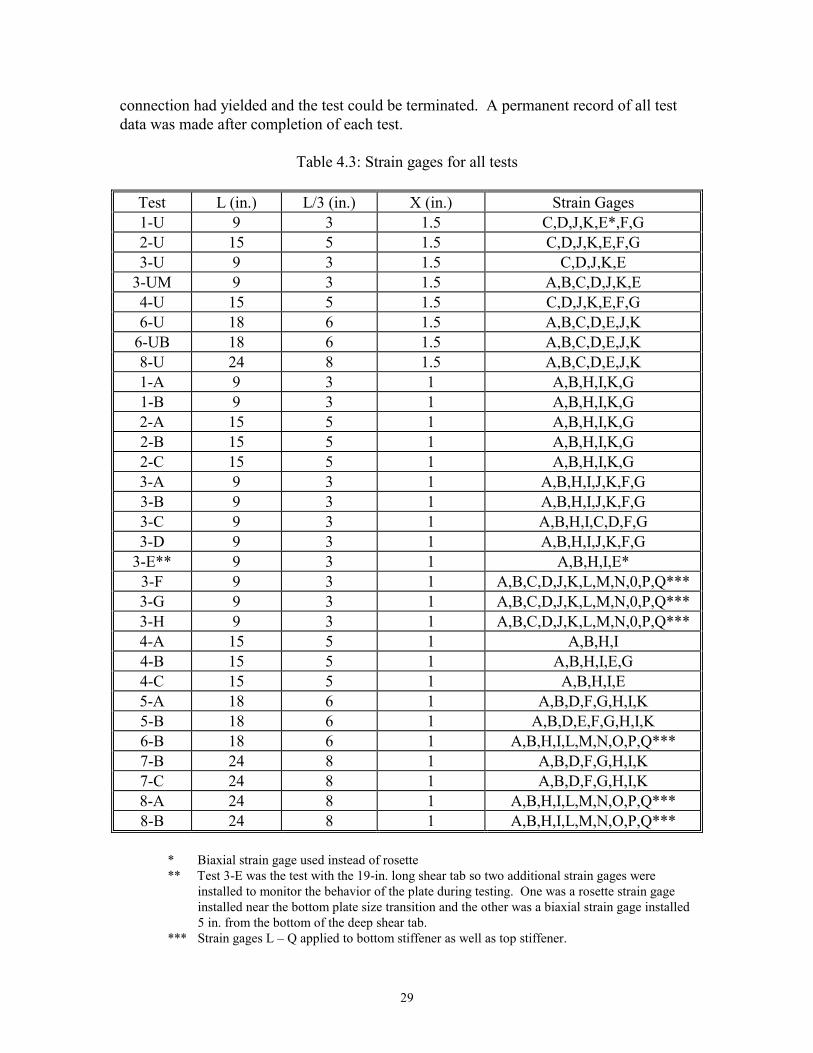
Table 4.3: Strain gages for all tests
Test L (in.) L/3 (in.) X (in.) Strain Gages 1-U 9 3 1.5 C,D,J,K,E*,F,G 2-U 15 5 1.5 C,D,J,K,E,F,G 3-U 9 3 1.5 C,D,J,K,E
3-UM 9 3 1.5 A,B,C,D,J,K,E 4-U 15 5 1.5 C,D,J,K,E,F,G 6-U 18 6 1.5 A,B,C,D,E,J,K
6-UB 18 6 1.5 A,B,C,D,E,J,K 8-U 24 8 1.5 A,B,C,D,E,J,K 1-A 9 3 1 A,B,H,I,K,G 1-B 9 3 1 A,B,H,I,K,G 2-A 15 5 1 A,B,H,I,K,G 2-B 15 5 1 A,B,H,I,K,G 2-C 15 5 1 A,B,H,I,K,G 3-A 9 3 1 A,B,H,I,J,K,F,G 3-B 9 3 1 A,B,H,I,J,K,F,G 3-C 9 3 1 A,B,H,I,C,D,F,G 3-D 9 3 1 A,B,H,I,J,K,F,G
3-E** 9 3 1 A,B,H,I,E* 3-F 9 3 1 A,B,C,D,J,K,L,M,N,0,P,Q*** 3-G 9 3 1 A,B,C,D,J,K,L,M,N,0,P,Q*** 3-H 9 3 1 A,B,C,D,J,K,L,M,N,0,P,Q*** 4-A 15 5 1 A,B,H,I 4-B 15 5 1 A,B,H,I,E,G 4-C 15 5 1 A,B,H,I,E 5-A 18 6 1 A,B,D,F,G,H,I,K 5-B 18 6 1 A,B,D,E,F,G,H,I,K 6-B 18 6 1 A,B,H,I,L,M,N,O,P,Q*** 7-B 24 8 1 A,B,D,F,G,H,I,K 7-C 24 8 1 A,B,D,F,G,H,I,K 8-A 24 8 1 A,B,H,I,L,M,N,O,P,Q*** 8-B 24 8 1 A,B,H,I,L,M,N,O,P,Q***
* Biaxial strain gage used instead of rosette ** Test 3-E was the test with the 19-in. long shear tab so two additional strain gages were
installed to monitor the behavior of the plate during testing. One was a rosette strain gage installed near the bottom plate size transition and the other was a biaxial strain gage installed 5 in. from the bottom of the deep shear tab.
*** Strain gages L – Q applied to bottom stiffener as well as top stiffener.
30
4.5 Test Procedure The following test procedure was used for all 31 tests performed: 1) Three pairs of strain gages were installed on the test beam. 2) Strain gages were installed on the test specimen according to Table 4.3. 3) The support member was properly secured either to the reaction wall or
laboratory test floor and the test beam was brought into place, bolted, and leveled.
4) The remaining sensors (LVDTs, tiltmeters, and load cells) were attached to the test setup. This process included making sure the loading apparatus and LVDTs were exactly vertical.
5) All of the sensors were connected to the data acquisition unit and their initial reading was zeroed out. This was done so that beam self-weight and other factors, such as bolt tightening, did not influence test results.
6) The test was initiated by activating the data acquisition unit that began to scan, record, and display the sensor measurements on a computer screen. The data acquisition unit scanned all of the sensors approximately every 4 seconds.
7) Loading commenced. Load was controlled by a hydraulic pump, and the rate of loading was approximately 5000 lb/minute.
8) Loading was paused every 5000 lb for the 3-bolt connection tests, every 10000 lb for the 5-bolt connection tests, every 15000 lb for the 6-bolt tests, and every 20000 lb for the 8-bolt tests. This pause allowed for multiple measurements to be taken at the same load and for visual inspection of the connection.
9) Loading was terminated when the connection could not sustain increasing load or when appreciable yielding occurred.
10) A permanent record of all test data was created. 11) All of the sensors were removed and the test setup was disassembled. 12) The support member, shear tab, and bolts were visually inspected. This
included checking for bolt shear, bolt bearing in bolt holes, flaking of whitewash coating.
31
5. TEST RESULTS 5.1 Material Properties
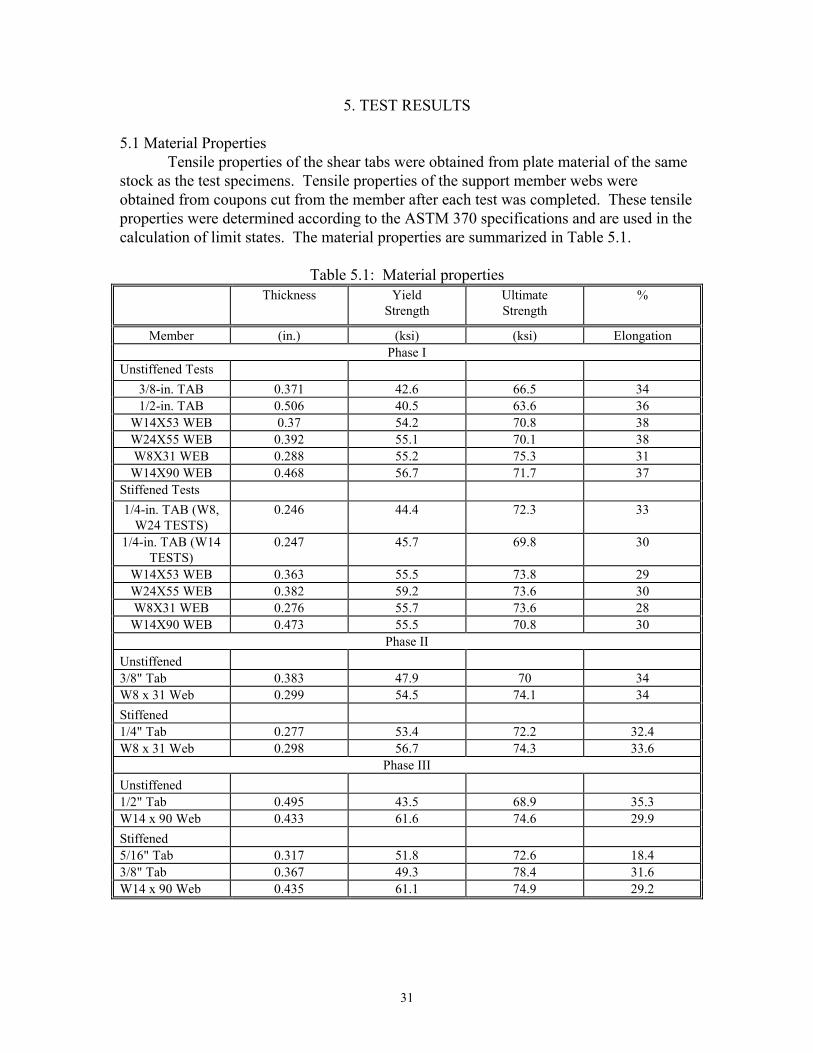
Tensile properties of the shear tabs were obtained from plate material of the same stock as the test specimens. Tensile properties of the support member webs were obtained from coupons cut from the member after each test was completed. These tensile properties were determined according to the ASTM 370 specifications and are used in the calculation of limit states. The material properties are summarized in Table 5.1.
Table 5.1: Material properties
Thickness Yield Strength
Ultimate Strength
%
Member (in.) (ksi) (ksi) Elongation Phase I
Unstiffened Tests 3/8-in. TAB 0.371 42.6 66.5 34 1/2-in. TAB 0.506 40.5 63.6 36
W14X53 WEB 0.37 54.2 70.8 38 W24X55 WEB 0.392 55.1 70.1 38 W8X31 WEB 0.288 55.2 75.3 31
W14X90 WEB 0.468 56.7 71.7 37 Stiffened Tests 1/4-in. TAB (W8,
W24 TESTS) 0.246 44.4 72.3 33
1/4-in. TAB (W14 TESTS)
0.247 45.7 69.8 30
W14X53 WEB 0.363 55.5 73.8 29 W24X55 WEB 0.382 59.2 73.6 30 W8X31 WEB 0.276 55.7 73.6 28
W14X90 WEB 0.473 55.5 70.8 30 Phase II
Unstiffened 3/8" Tab 0.383 47.9 70 34 W8 x 31 Web 0.299 54.5 74.1 34 Stiffened 1/4" Tab 0.277 53.4 72.2 32.4 W8 x 31 Web 0.298 56.7 74.3 33.6
Phase III Unstiffened 1/2" Tab 0.495 43.5 68.9 35.3 W14 x 90 Web 0.433 61.6 74.6 29.9 Stiffened 5/16" Tab 0.317 51.8 72.6 18.4 3/8" Tab 0.367 49.3 78.4 31.6 W14 x 90 Web 0.435 61.1 74.9 29.2
32
For the stiffened tests, the 1/4-in. shear tabs came from two separate stocks. The same material was used for the W8X31 column tests and W24X55 girder tests, and different steels were used for the W14X53 girder tests and W14X90 column tests. Also for the stiffened tests, the values for the material properties reported in the table are an average for all of the tests in that group. Group 1 consisted of two tests, Group 2 of three tests, Group 3 of five tests and Group 4 of three tests. For each group, material properties varied by less than 4% so the average was reported for each group and the average was used for calculation of limit states for each test in each group. The Phase II and III materials are averaged for each group since most of the material came from the same stock. For calculation purposes, the actual properties were used for any material coming from different stock. Material data is not included for the webs of the ten-foot support girders since the raw data was not included in any calculations. 5.2 Displacement, Twist, and Rotation Results
For each test, a graph was constructed for shear vs. displacement, shear vs. twist and shear vs. rotation, where shear is defined as the shear force in the connection, taken as the difference between the applied load and the far end reaction of the beam. 5.2.1 Shear-displacement results
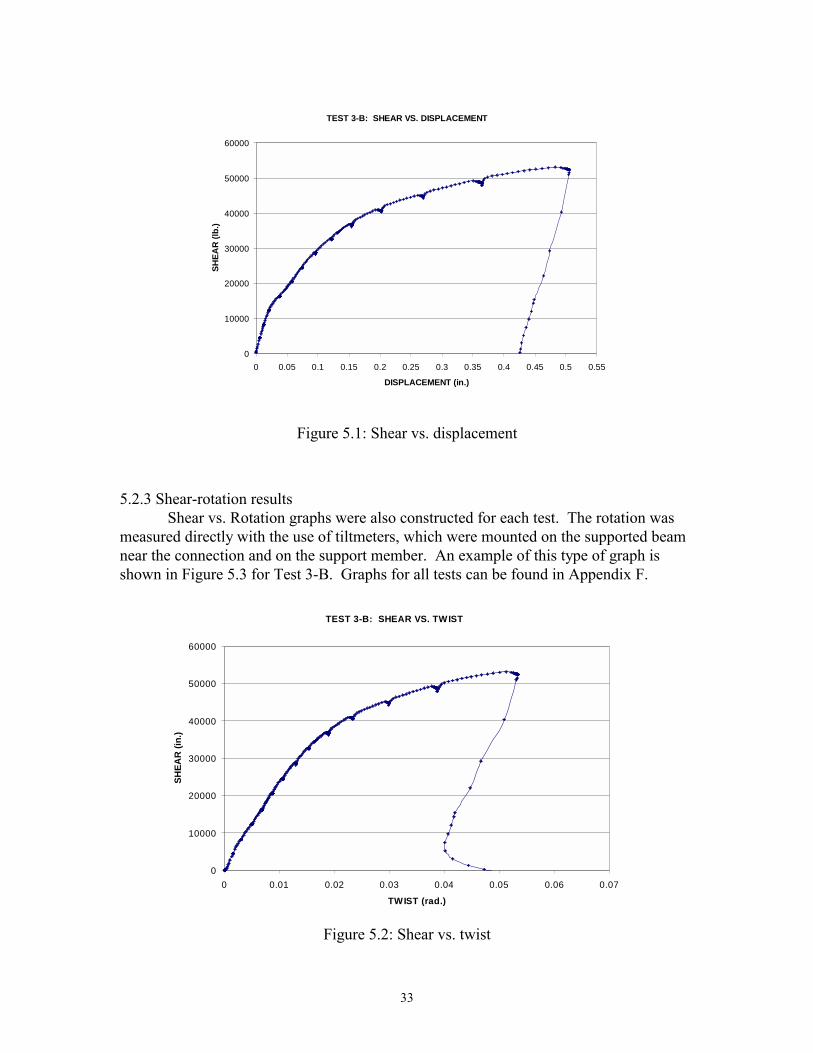
To identify the point at which connection behavior became nonlinear and to determine ultimate shear forces, a graph of shear vs. displacement was constructed for all tests. In each graph, the vertical axis is the shear force in the connection and the horizontal axis is the vertical displacement of the connection. An example of this type of graph is shown in Figure 5.1 for Test 3-B. The shear-displacement graphs for all tests can be found in Appendix D. 5.2.2 Shear-twist results
To identify the point at which connection behavior became nonlinear and to determine ultimate shear force in the connection, a graph of shear vs. twist was constructed for all tests. In each graph, the vertical axis is the shear force in the connection and the horizontal axis is the twist of the connection. An example of this type of graph is shown in Figure 5.2 for Test 3-B. Graphs for all tests can be found in Appendix E.
33
Figure 5.1: Shear vs. displacement
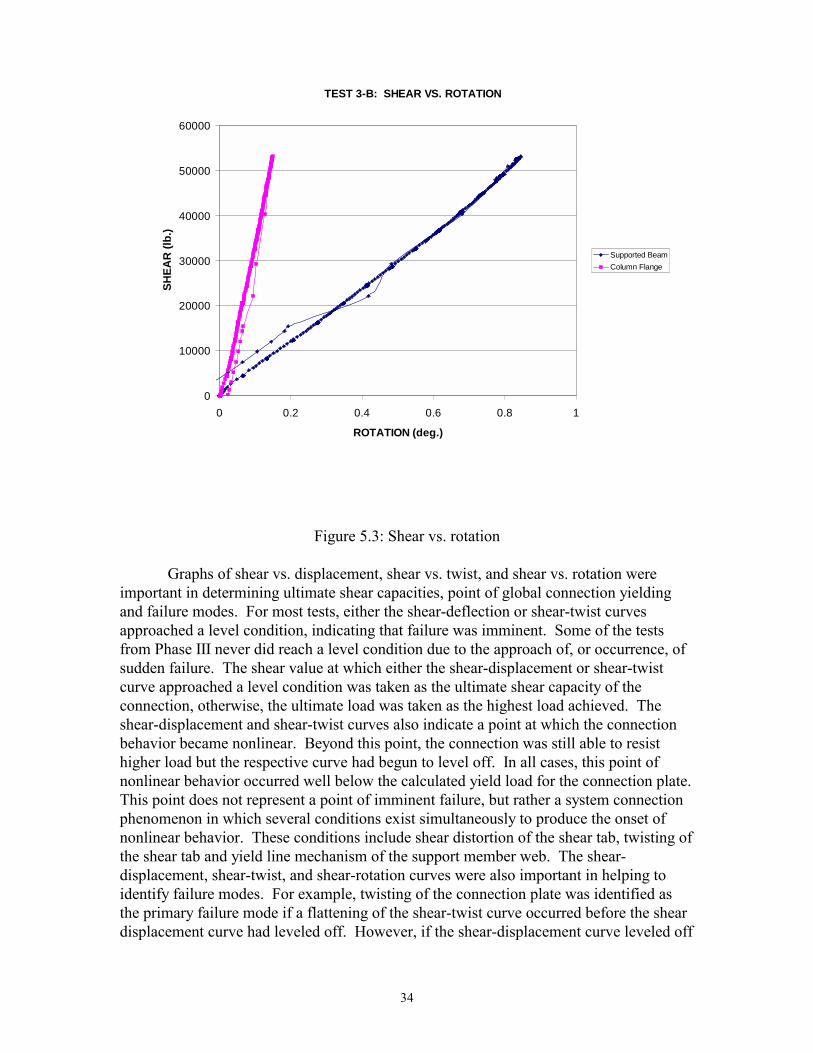
5.2.3 Shear-rotation results
Shear vs. Rotation graphs were also constructed for each test. The rotation was measured directly with the use of tiltmeters, which were mounted on the supported beam near the connection and on the support member. An example of this type of graph is shown in Figure 5.3 for Test 3-B. Graphs for all tests can be found in Appendix F.
Figure 5.2: Shear vs. twist
TEST 3-B: SHEAR VS. TWIST
0
10000
20000
30000
40000
50000
60000
0 0.01 0.02 0.03 0.04 0.05 0.06 0.07
TWIST (rad.)
SHEA
R (i
n.)
TEST 3-B: SHEAR VS. DISPLACEMENT
0
10000
20000
30000
40000
50000
60000
0 0.05 0.1 0.15 0.2 0.25 0.3 0.35 0.4 0.45 0.5 0.55
DISPLACEMENT (in.)
SHEA
R (l
b.)
34
Figure 5.3: Shear vs. rotation Graphs of shear vs. displacement, shear vs. twist, and shear vs. rotation were
important in determining ultimate shear capacities, point of global connection yielding and failure modes. For most tests, either the shear-deflection or shear-twist curves approached a level condition, indicating that failure was imminent. Some of the tests from Phase III never did reach a level condition due to the approach of, or occurrence, of sudden failure. The shear value at which either the shear-displacement or shear-twist curve approached a level condition was taken as the ultimate shear capacity of the connection, otherwise, the ultimate load was taken as the highest load achieved. The shear-displacement and shear-twist curves also indicate a point at which the connection behavior became nonlinear. Beyond this point, the connection was still able to resist higher load but the respective curve had begun to level off. In all cases, this point of nonlinear behavior occurred well below the calculated yield load for the connection plate. This point does not represent a point of imminent failure, but rather a system connection phenomenon in which several conditions exist simultaneously to produce the onset of nonlinear behavior. These conditions include shear distortion of the shear tab, twisting of the shear tab and yield line mechanism of the support member web. The shear-displacement, shear-twist, and shear-rotation curves were also important in helping to identify failure modes. For example, twisting of the connection plate was identified as the primary failure mode if a flattening of the shear-twist curve occurred before the shear displacement curve had leveled off. However, if the shear-displacement curve leveled off
TEST 3-B: SHEAR VS. ROTATION
0
10000
20000
30000
40000
50000
60000
0 0.2 0.4 0.6 0.8 1
ROTATION (deg.)
SHEA
R (l
b.)
Supported BeamColumn Flange

35
before the shear-twist curve, shear yield of the shear tab was identified as the primary failure mode. If the shear-rotation curves indicated large values for rotation of the support member web then a yield line mechanism of the support member web identified as the primary failure mode. 5.3 Eccentricity, Ultimate Shear Forces, and Failure Modes
The three most important test results were the values of the shear force eccentricity, the ultimate shear force in the connection, and the failure mode of the connection. These items are important in developing a connection design procedure. 5.3.1 Shear force eccentricity
Measured eccentricities were determined from the three pairs of strain gages mounted on the supported beam as shown in Figure 5.4. A linear regression analysis was used to determine the point of zero strain, or zero moment, at each load increment applied to the connection. Although the method used is an extrapolation of collected data, and therefore not precise, the results of the method agree well with observed failure modes. The sign convention used for the shear force eccentricity can be seen schematically in Figure 5.4. The reference line is taken as the bolt line of the connection.
Figure 5.4: Sign convention for shear force eccentricity
36
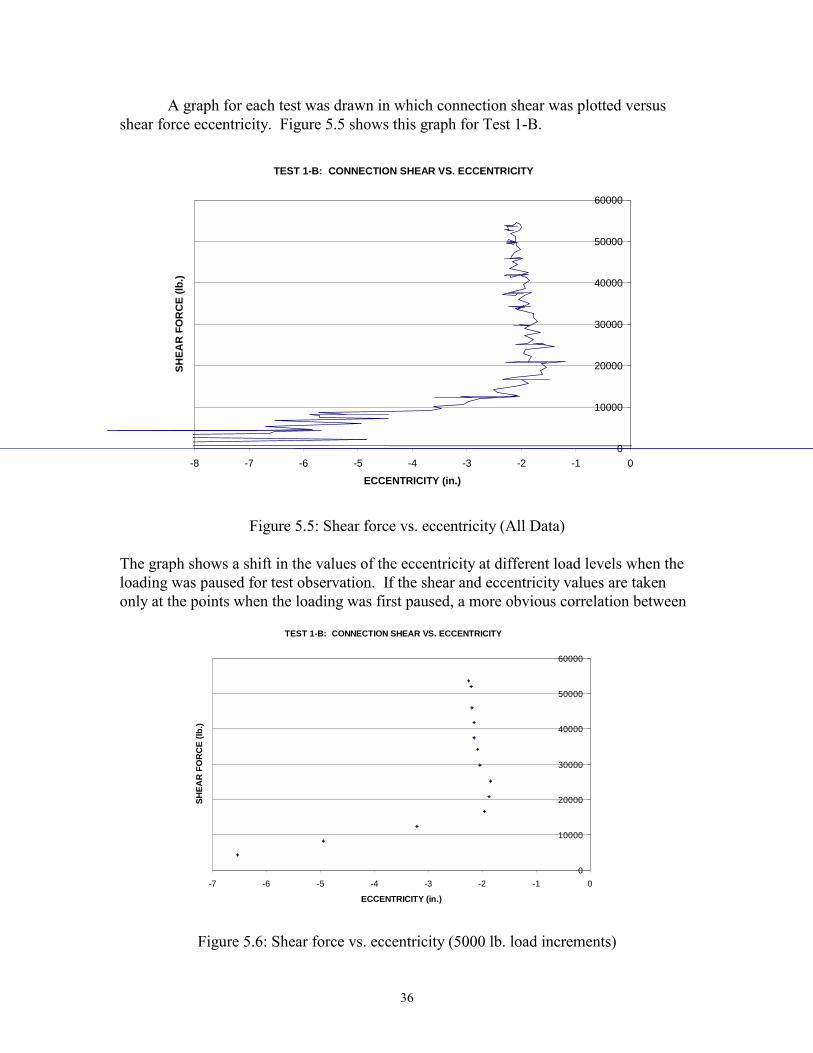
A graph for each test was drawn in which connection shear was plotted versus shear force eccentricity. Figure 5.5 shows this graph for Test 1-B.
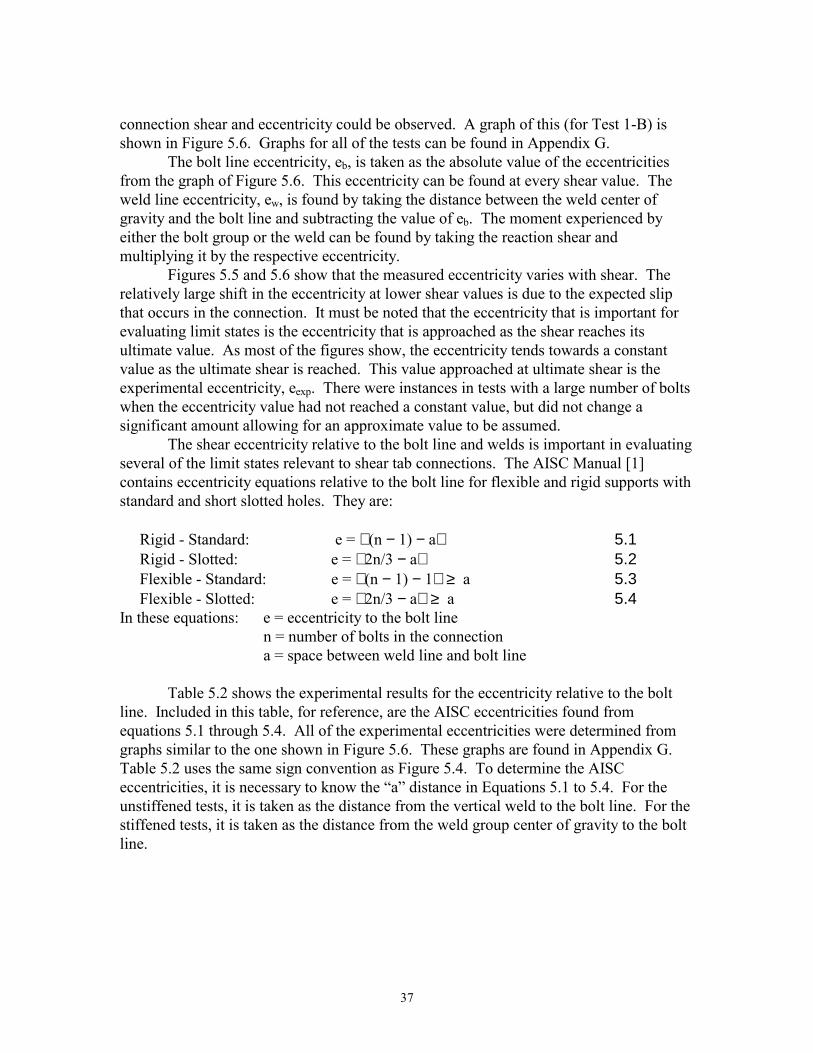
Figure 5.5: Shear force vs. eccentricity (All Data) The graph shows a shift in the values of the eccentricity at different load levels when the loading was paused for test observation. If the shear and eccentricity values are taken only at the points when the loading was first paused, a more obvious correlation between
Figure 5.6: Shear force vs. eccentricity (5000 lb. load increments)
TEST 1-B: CONNECTION SHEAR VS. ECCENTRICITY
0
10000
20000
30000
40000
50000
60000
-8 -7 -6 -5 -4 -3 -2 -1 0
ECCENTRICITY (in.)
SHEA
R F
OR
CE
(lb.)
TEST 1-B: CONNECTION SHEAR VS. ECCENTRICITY
0
10000
20000
30000
40000
50000
60000
-7 -6 -5 -4 -3 -2 -1 0
ECCENTRICITY (in.)
SHEA
R F
OR
CE
(lb.)
37
connection shear and eccentricity could be observed. A graph of this (for Test 1-B) is shown in Figure 5.6. Graphs for all of the tests can be found in Appendix G.
The bolt line eccentricity, eb, is taken as the absolute value of the eccentricities from the graph of Figure 5.6. This eccentricity can be found at every shear value. The weld line eccentricity, ew, is found by taking the distance between the weld center of gravity and the bolt line and subtracting the value of eb. The moment experienced by either the bolt group or the weld can be found by taking the reaction shear and multiplying it by the respective eccentricity.
Figures 5.5 and 5.6 show that the measured eccentricity varies with shear. The relatively large shift in the eccentricity at lower shear values is due to the expected slip that occurs in the connection. It must be noted that the eccentricity that is important for evaluating limit states is the eccentricity that is approached as the shear reaches its ultimate value. As most of the figures show, the eccentricity tends towards a constant value as the ultimate shear is reached. This value approached at ultimate shear is the experimental eccentricity, eexp. There were instances in tests with a large number of bolts when the eccentricity value had not reached a constant value, but did not change a significant amount allowing for an approximate value to be assumed.
The shear eccentricity relative to the bolt line and welds is important in evaluating several of the limit states relevant to shear tab connections. The AISC Manual [1] contains eccentricity equations relative to the bolt line for flexible and rigid supports with standard and short slotted holes. They are: Rigid - Standard: e = (n − 1) − a 5.1 Rigid - Slotted: e = 2n/3 − a 5.2 Flexible - Standard: e = (n − 1) − 1 ≥ a 5.3 Flexible - Slotted: e = 2n/3 − a ≥ a 5.4 In these equations: e = eccentricity to the bolt line n = number of bolts in the connection a = space between weld line and bolt line
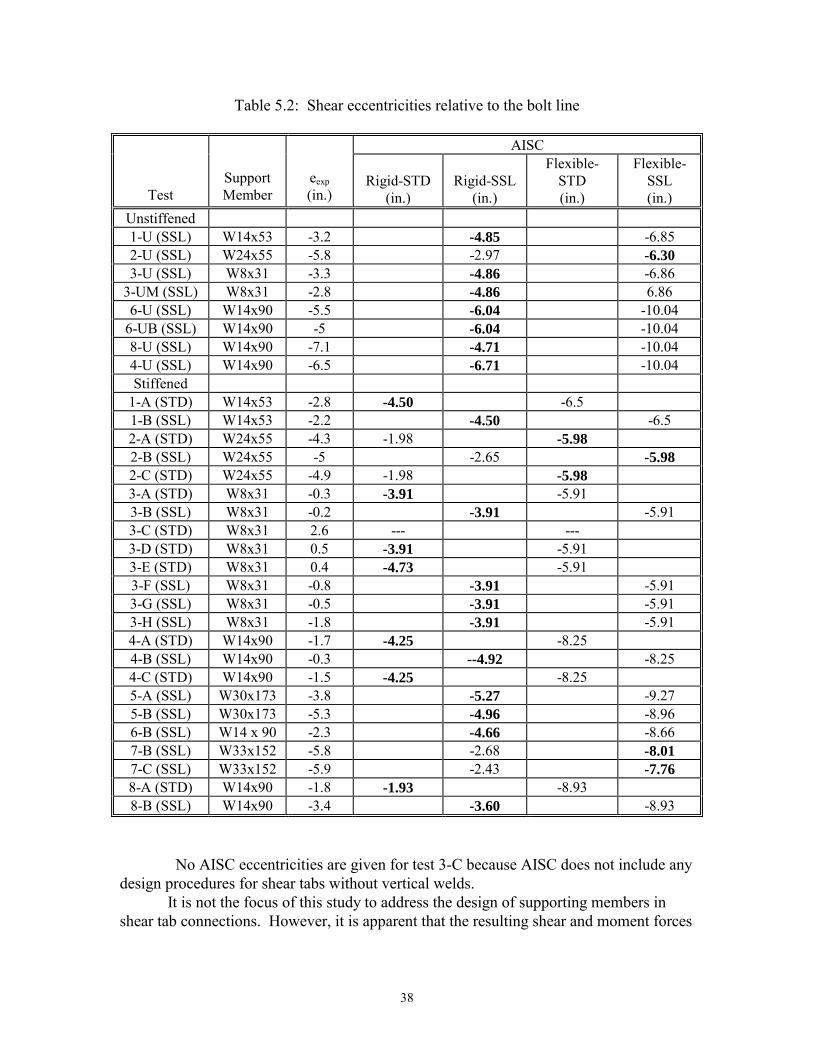
Table 5.2 shows the experimental results for the eccentricity relative to the bolt line. Included in this table, for reference, are the AISC eccentricities found from equations 5.1 through 5.4. All of the experimental eccentricities were determined from graphs similar to the one shown in Figure 5.6. These graphs are found in Appendix G. Table 5.2 uses the same sign convention as Figure 5.4. To determine the AISC eccentricities, it is necessary to know the “a” distance in Equations 5.1 to 5.4. For the unstiffened tests, it is taken as the distance from the vertical weld to the bolt line. For the stiffened tests, it is taken as the distance from the weld group center of gravity to the bolt line.
38
Table 5.2: Shear eccentricities relative to the bolt line
AISC
Test Support Member
eexp (in.)
Rigid-STD (in.)
Rigid-SSL (in.)
Flexible-STD (in.)
Flexible-SSL (in.)
Unstiffened 1-U (SSL) W14x53 -3.2 -4.85 -6.85 2-U (SSL) W24x55 -5.8 -2.97 -6.30 3-U (SSL) W8x31 -3.3 -4.86 -6.86
3-UM (SSL) W8x31 -2.8 -4.86 6.86 6-U (SSL) W14x90 -5.5 -6.04 -10.04
6-UB (SSL) W14x90 -5 -6.04 -10.04 8-U (SSL) W14x90 -7.1 -4.71 -10.04 4-U (SSL) W14x90 -6.5 -6.71 -10.04 Stiffened
1-A (STD) W14x53 -2.8 -4.50 -6.5 1-B (SSL) W14x53 -2.2 -4.50 -6.5 2-A (STD) W24x55 -4.3 -1.98 -5.98 2-B (SSL) W24x55 -5 -2.65 -5.98 2-C (STD) W24x55 -4.9 -1.98 -5.98 3-A (STD) W8x31 -0.3 -3.91 -5.91 3-B (SSL) W8x31 -0.2 -3.91 -5.91 3-C (STD) W8x31 2.6 --- --- 3-D (STD) W8x31 0.5 -3.91 -5.91 3-E (STD) W8x31 0.4 -4.73 -5.91 3-F (SSL) W8x31 -0.8 -3.91 -5.91 3-G (SSL) W8x31 -0.5 -3.91 -5.91 3-H (SSL) W8x31 -1.8 -3.91 -5.91 4-A (STD) W14x90 -1.7 -4.25 -8.25 4-B (SSL) W14x90 -0.3 --4.92 -8.25 4-C (STD) W14x90 -1.5 -4.25 -8.25 5-A (SSL) W30x173 -3.8 -5.27 -9.27 5-B (SSL) W30x173 -5.3 -4.96 -8.96 6-B (SSL) W14 x 90 -2.3 -4.66 -8.66 7-B (SSL) W33x152 -5.8 -2.68 -8.01 7-C (SSL) W33x152 -5.9 -2.43 -7.76 8-A (STD) W14x90 -1.8 -1.93 -8.93 8-B (SSL) W14x90 -3.4 -3.60 -8.93
No AISC eccentricities are given for test 3-C because AISC does not include any design procedures for shear tabs without vertical welds.
It is not the focus of this study to address the design of supporting members in shear tab connections. However, it is apparent that the resulting shear and moment forces
39
from the connections do affect the design of the supporting members and will need to be considered. 5.3.1.1 Unstiffened tests
The items shown in bold face in Table 5.2 represent the AISC eccentricity that best approximates the measured eccentricity, eexp. As Table 5.2 indicates, neither the AISC rigid support nor AISC flexible support eccentricity equations provide a very good correlation with eexp. The eexp for all the tests seem to correlate better with the AISC rigid support eccentricity equation except for Test 2-U, which correlates better with the AISC flexible support eccentricity equation. This could be due to greater flexibility of the web of the W24X55 girder (h/tw = 54.6) compared with that of the other girders. For most of the unstiffened tests, eexp is smaller than the AISC eccentricity values, with exception of Test 8-U, which happens to be slightly larger. This would result in a less conservative design for the weld if one were to follow the AISC specifications. 5.3.1.2 Stiffened tests
The stiffened tests exhibited a similar trend to the unstiffened tests. The eexp for Groups 2 and 7 tests all seemed to correlate better with the AISC flexible support eccentricity values while the rest of the groups correlated better with the AISC rigid support eccentricity values. In the Phase II tests, the measured eccentricities were again smaller than those from the AISC eccentricity equations. In Phase III, most of the measured eccentricities were smaller than the AISC values, with only one, Test 5-B, being larger.
Phase I data showed that the measured eccentricity values are nearly identical for the two different types of bolt holes, which is evident from the results of the sub-group A and sub-group B tests. For 3-bolt connections (Group 1 and Group 3), AISC specifications predict no difference in eccentricity between STD and SSL holes. This was also the case for the Group 3 tests from Phase II. For 5-bolt connections, the specifications predict the same eccentricity values for STD and SSL holes for flexible supports. For rigid supports, the specifications predict larger eccentricities for SSL holes than STD holes. Group 2 results seem to support this assumption with a –5.0 in. eccentricity for STD holes and a –4.3 in. eccentricity for STD holes. However, Group 4 results indicate the opposite, with a –0.3 in. eccentricity for SSL holes and a –1.7 in. eccentricity for STD holes. The only test from Phase III to have STD holes was 8-A. The resulting measured eccentricity was nearly the same value as predicted by the AISC equation for rigid support, and shows the same trend as Group 2 when compared to 8-B. 5.3.2 Ultimate shear forces and failure modes
The ultimate shear forces for the tests, Vexp, are shown in Table 5.3. This shear force corresponds to that experienced by the connection when a test was terminated. The tests were terminated when the shear distortion (either shear-displacement or shear-twist) curves leveled off or when the connection was undergoing appreciable yielding without maintaining additional load. This table also includes the failure modes for each test. These failure modes were identified either visually or with the aid of shear-displacement, shear-twist, and shear-rotation graphs. The experimental failure mode identification

40
process was subjective, however, due to the fact that several conditions usually existed simultaneously. The table lists primary failure modes that are followed by secondary failure modes in parentheses.
Table 4-2 of the AISC Hollow Structural Sections (HSS) Connections Manual [8] lists the standard limit states for various connections, including the single plate connections. For the single plate connections in this study, they are:
1) Bolt shear by ultimate analysis (includes the effects of eccentricity) 2) Bolt bearing (in the tab - based on the bolt shear analysis) 3) Gross shear at yield (of the tab) 4) Net section shear rupture (of the tab through the bolt line) 5) Block shear rupture (of the tab) 6) Weld shear by ultimate analysis (includes the effects of eccentricity)
Also listed in Table 5.3 among the Phase III tests are some other failure modes not listed above as limit states. These were observations made either during or after testing of each specimen.
1) Weld failure by tearing occurred in the two unstiffened six bolt columns. There is the possibility that the tears occurred from impact of the test beam onto the shear tab because these are the tests that suffered sudden bolt failure.
2) Plate buckling. This occurred in the two girder tests with the plate extension to the bottom flange of the girder, and in Test 8-A as a secondary effect of twist.
3) Tearing of the extended shear tab. A girder test experienced a tear near the top of the shear tab when nearing ultimate load.
4) Bolt fracture occurred in the Tests 6-U and 6-UB. 5) Web shear. It was observed that the web of some tests experienced shear
yielding along the vertical welds connecting the extended shear tab to the supporting member.
Photographs of the failure modes appear in Appendix I. A recommended design procedure is presented in this report that is based on
considering the results of tests on connections that included stiffeners at top and/or bottom of the shear tabs. Test results for connections that did not include these stiffeners generally showed excessive deformation at the ultimate load level. In order to demonstrate the connection load carrying capacities at a reasonable level of deformation, a table of load capacity at a total connection deflection of 0.25 inch is prepared for all test and is presented in Appendix N.
41
Table 5.3: Ultimate shear forces, failure modes, and limit states Experimental AISC Critical AISC
Typical Vth Ve
Test Vexp
(kips) Failure*
Mode (AISC e)
(kips) Limit State
(Exp. e) (kips)
Limit State
V3 (kips)
Unstiffene
d
1-U 58.7 B (A,D) 45.1 A 65.4 C 85.3 2-U 82.9 F (A,B,E) 94.8 A 100.6 C 142.2 3-U 54.8 E (A) 45.2 A 41.0 E 69.5
3-UM 58.6 E(B,D) 45.0 A 38.3 E 68.5 4-U 98.7 F (A,E) 89.9 A 92.2 A 178.4 6-U 138.0 E,J(B,F,C,K,G) 151.2 A 143.2 E 186.1
6-UB 135.8 E,J(B,F,C,K,G) 151.2 A 151.2 E 186.1 8-U 173.6 E(B,C,K) 213.0 E 194.2 A 279.5
Stiffened 1-A 58.3 C (F,B) 39.9 B 58.3 C 61.0 1-B 54.6 C (F,B) 39.9 B 61.0 C 61.0 2-A 89.0 C (F,B) 98.3 B 98.3 C 98.3 2-B 92.6 C (F,B) 98.3 B 94.0 C 98.3 2-C 83.3 C (F,B) 98.3 B 95.3 --- --- 3-A 53.2 C,F 47.0 B 59.0 C 59.0 3-B 53.1 C,F 47.0 B 59.0 C 59.0 3-C 22.1 C,F --- --- --- --- --- 3-D 51.1 C,F 47.0 B 59.0 C 59.0 3-E 48.1 C,F 39.1 B 59.0 --- --- 3-F 68.4 C,B(D) 53.0 B 76.5 D 76.5 3-G 65.1 C,B 53.0 B 76.5 D 76.5 3-H 67.8 C,E 53.0 B 76.5 D 76.5 4-A 103.0 C,F 101.0 B 102.0 C 101.6 4-B 107.0 C,F 92.1 B 102.0 C 101.6 4-C 107.0 C,F 101.0 B 102.0 C 101.6 5-A 122.9 H(B,C,) 146.7 A 171.0 D 176.1 5-B 140.7 B,C,A(E,) 151.6 A 146.3 D 176.1 6-B 124.5 F,B 156.4 A 176.0 D 176.1 7-B 224.2 F,C (B,E,K) 236.0 D,C 218.0 D 235.5 7-C 204.2 H,F(B,C,I,K) 236.0 D,C 218.0 D 235.5 8-A 196.3 B(H,C,K) 260.0 C 261.0 A 250.2 8-B 227.4 F(C,B,K) 260.0 A,C 261.0 C 260.5
* Limit States and other failure modes: A = bolt shear B = bolt bearing C = shear yield
D = shear rupture E = web mechanism F = twist G = weld H = plate buckling I = tearing J = bolt fracture K = web shear
42
Table 4-2 of the HSS Manual provides provisions for beam web limit states. They are not considered here because they generally do not control. Table 4-2 of the HSS Manual also provides, in addition to the strength limit states, two limitations on the tab thickness. They are:
tmax ≤ dh/2 + 1/16-in. (Ensures Rotational Ductility) tmin ≥ L/64 ≥ 1/4-in. (Prevents Local Buckling)
The 1/4-in. and 3/8-in. shear tabs used in this study satisfy both of these tab thickness requirements. The 1/2-in. tabs selected for Tests 4-U, 6-U, 6-UB, and 8-U did not satisfy the rotational ductility requirement. The 1/2-in. thickness is slightly larger than the 0.4375-in. limit. This tab thickness was determined from equation 4.8.
Calculations were made for each of the six standard limit states for each test and the critical shear and limit state values are included in Table 5.3. The limit states were calculated for two different eccentricities. The first is the AISC eccentricity highlighted in Table 5.2. The results of these calculations are tabulated as Vth (theoretical shear). The second is the experimental eccentricity from Table 5.2. These results are tabulated as Ve (experimental shear). Also included in Table 5.3 is the shear capacity for all of the tests if the standard 3-in. bolt-to-weld line space had been used in the tests, V3. This value is used merely as a comparison as to the amount of strength reduction when extended shear tabs are used instead of standard shear tabs. For the unstiffened tests, the connection capacities for Ve are much smaller than V3 (between 51% and 81% depending on which test is considered). However, for the stiffened tests, connection capacities for Ve vary between 83% and 104% of V3. The stiffening of the tab with horizontal welds to provide a 3-in. distance form a bolt line to end of horizontal weld is the reason that the connection capacity for the stiffened tests approach that of standard shear tabs with a 3-in. bolt line to vertical weld distance. Furthermore, the values of Ve for stiffened girder tests (Groups 1, 2, 5, and 7) are generally smaller than the values for V3 whereas the values for Ve for stiffened column tests (Groups 3, 4, and 8) are mostly very close to the V3 values. The reason most of the stiffened columns matched V3 is due to the fact that column tests having tabs stiffened top and bottom closely resemble the stiffening of a standard shear tab. Meanwhile, most of the girders were stiffened at the top only so the relation to a standard shear tab was not as close. The girders that did receive “stiffening” at the bottom again did not have as much capacity as the other girders due to premature buckling of the extended portion of the tab.
It must be noted that for the Phase III tests, the bolt strength for the used bolts was given a higher value than listed by AISC manuals. The loads reached during testing proved to be higher than expected according to the bolt shear limit state. The value of bolt strength used in design of connections is normally 60 ksi. A higher value was calibrated using the results obtained during Tests 6-U and 6-UB, in which the bolts suffered failure by fracture. An assumption was made that each of the bolts carried an even amount of the shear load. The magnitude of the shear carried overall in the connection was found by subtracting the reaction load from the applied load, and dividing it by the number of bolts to obtain a bolt strength of 86 ksi. This value was used in the calculations in Table 5.3 for all specimens.
43
Some comments should be made on Table 5.3:
1) AISC critical capacities are calculated using actual thickness and material properties of tabs and support members. These can be found in Table 5.1.
2) AISC critical capacities are calculated using the bolt to weld line spacing in Tables 4.1 and 4.2. This spacing is taken as the distance from bolt line to the vertical weld for unstiffened tests and from the bolt line to the center of gravity of the weld group for stiffened tests.
3) AISC critical capacities and experimental capacities do not include connection resistance factors. These capacities are nominal capacities and not design capacities.
4) Appendix H includes sample calculations for determining AISC critical capacities and Appendix I includes sample photographs of the various failure modes identified in Table 5.3:
Figure I.1: Bolt Shear Figure I.2: Bolt Bearing Figure I.3: Shear Yield Figure I.4: Web Mechanism Figure I.5: Twist
Shear Rupture was also identified as a failure mode in Table 5.3 for one test, Test 1-U, but no photograph is included. 5.3.2.1 Web mechanism failure
For the unstiffened tabs welded to column webs, substantial distortions of the column web were observed. Therefore, an additional limit state of a yield line mechanism (see discussion of this limit state under section 3.5) has been included. The equation for moment capacity of this mechanism is taken from Abolitz and Warner [9] in combination with Equation 4-21 (a) of the HSS Connections Manual:
Vew = ((2h/L) + (4L/h) + 4*(3)1/2)(Fywtw
2/4)(L) / ew 5.5
Where: ew = shear eccentricity to the weld h = depth of the column web (h/tw*tw) tw = column web thickness
Fyw = column web yield strength L = tab length
This yield line mechanism does not apply to the stiffened tests. For the unstiffened girder tests, differing boundary conditions existed with the top of the tab being very near to the top flange of the support girder. This flange acted as a stiffener to the support web. For the unstiffened girder tests, the distortion of the support web was not nearly as severe as the column tests so the yield line mechanism of the web was not considered.
44
5.4 Observations and Conclusions (refer to Table 5.3) 1) Phase I tests showed no difference in connection capacity between using snug
bolts in STD holes or fully tightened bolts in SSL holes. This is evident from the comparison of connection capacities for the A and B stiffened tests. Upon Phase II testing, the results showed that using snug tight bolts in SSL holes also presented no difference in connection capacity. It was assumed that no significant effect from the bolt tightening type would be present in the deeper connections. No additional tests involving fully tightened bolts in the deeper connections were conducted.
2) It was seen that for three and five bolt connections that calculated connection ultimate capacities based on measured eccentricities correlate better with experimental results than capacities calculated using eccentricity values of AISC equations (with the exception of Test 4-U). AISC eccentricities always produced bolt shear as the critical limit state where measured eccentricities often times produced shear yield as the critical limit state which was the observed limit state for many tests. This changed somewhat when the connections increased to six and eight bolts. Comparing capacities with AISC
eccentricity equations versus using experimental values provided a different observation. For several tests, use of AISC equations for eccentricity drew closer results to actual experimental capacities. Beyond five bolts, the dominant limit state determined with experimental eccentricity became bolt
shear rather than shear yield. 3) Using current AISC eccentricities for extended shear tabs produce conservative
results for three and five bolt extended shear tab design. This is evident from the fact that capacities using the AISC eccentricities are much lower than experimental results whereas capacities using experimental eccentricities correlate much better with experimental results. Once again, when the number of bolts increased to six and eight, the results of the current method became non-conservative. This is evident since the experimental capacities are exceeded by the theoretical capacities.
4) The change in eccentricity associated with extended shear tabs can change the critical limit state. This is evident from the fact that AISC eccentricities mostly indicate bolt shear and bearing as the governing limit state while experimental eccentricities indicate that bolt shear, shear yield, and web mechanism failure can all be the governing limit state depending on the test configuration. These results more closely represent experimentally observed limit states.
5) Laterally bracing the test beam near the point of load application does not affect the capacity. This is evident from comparing capacities for tests 1A-1B, 2A-2B, 4A-4B-4C, and 6U-6UB.
6) An additional limit state, web mechanism failure, must be considered for columns with high h/tw. This is evident from Tests 3-U, 3-UM, 6-U, 6-UB, and 8-U in which the web mechanism failure limit state was both the observed and predicted primary failure mode and from Test 4-U in which the web mechanism limit state was observed as a secondary failure mode.
45
7) For stiffened tab tests, the vertical weld between shear tab and support web is essential. Test 3-C, the test with no vertical weld, failed at less than half the shear capacity as Test 3-A. Using large stiffener plates and stiffener-to-support member welds could slightly increase the capacity of the connection but would not be as time and cost effective as simply using the vertical weld between tab and support member web.
8) Unstiffened tabs can be used for small beam reactions. Compared to the AISC typical 3-in. bolt to weld line spacing, the capacities are greatly reduced for the unstiffened extended shear tabs. The capacity reduction is not as great for the stiffened tests (on the order of only 10%). The use of one stiffener at the top of a column connection, as in Test 3-H, is adequate for strength, but undergoes an amount of displacement much more significant than fully stiffened columns. This is due to a web mechanism developing at the bottom of the extended shear tab.
9) Using one vertical weld of twice the size on one size of the shear tab did not make much difference in connection capacity compared to using two vertical welds on either side of the shear tab. This is evident from comparing the capacity of Test 2-C to the capacity of Test 2-A.
10) An additional limit state, twisting of the shear tab, was identified as either a primary or secondary failure mode for all of the tests except the 3-bolt unstiffened tests. For the 3-bolt unstiffened tests, differences in strain gage data from strain gages mounted on either side of the tab indicate that some twisting of the tab did occur but other failure modes were more prominent (such as bolt shear and bolt bearing for Test 1-U and web mechanism failure for Test 3-U) before twisting became visually evident. Test 3-UM showed a significant amount of twist in Phase II, but this mode of failure was secondary to the web mechanism. Phase III utilized the lateral/rotational bracing which controlled a large amount of twist as shown by comparing tests 6-U and 6-UB. Test 6-UB was without the bracing and suffered a large amount deformation due to twist. Even with the bracing, twist was considered an important consideration as a mode of failure. The twist is the result of the offset of the shear forces in the tab and beam web.
11) Welding the stiffening plates to the column web does not have a significant affect on connection capacity. This is evident from the capacity of Test 3-D as compared to Test 3-A.
12) Increasing the thickness of the stiffener plates did not have a significant effect in the behavior. In tests 3-F and 3-G, the stiffeners experienced local yielding at low loads as shown by strain gage data.
13) Tests 5-A and 7-C showed that extension and welding of the connection plate down to the bottom flange of the girder does not increase stiffness, but rather decreases the shear capacity of the connection. The introduction of the extension created a compressive strut within the plate that buckled under load and caused severe distortion of the tab.
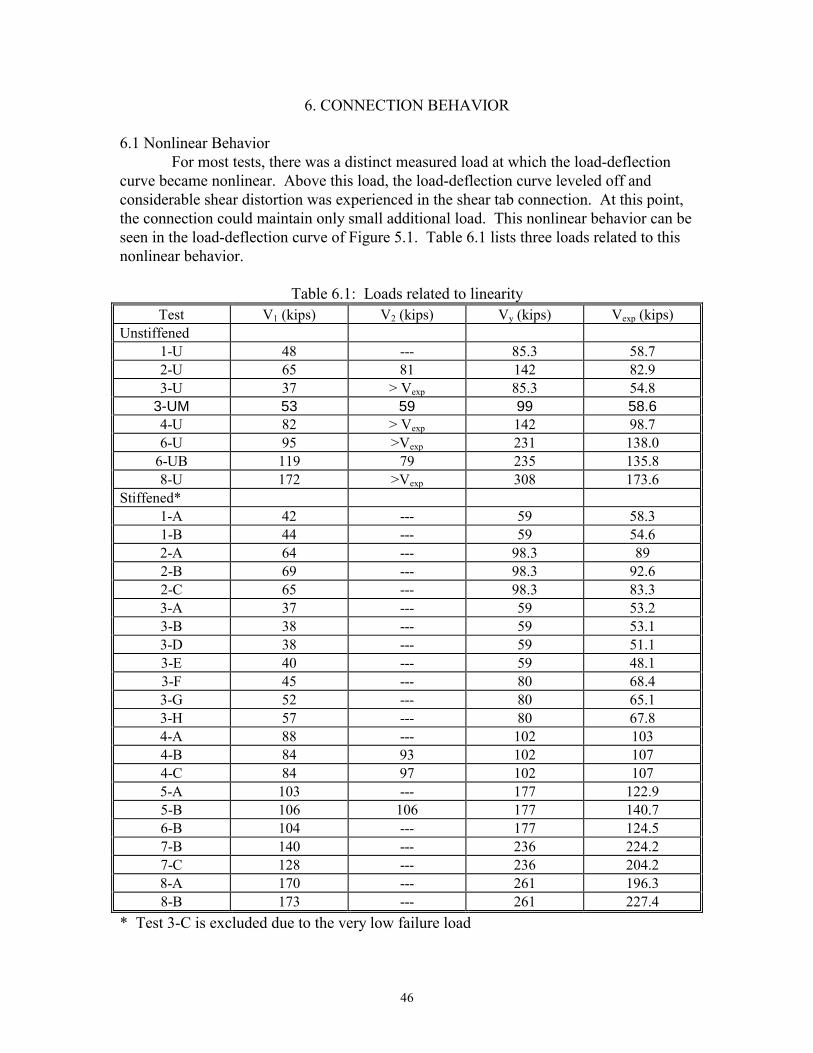
46
6. CONNECTION BEHAVIOR 6.1 Nonlinear Behavior
For most tests, there was a distinct measured load at which the load-deflection curve became nonlinear. Above this load, the load-deflection curve leveled off and considerable shear distortion was experienced in the shear tab connection. At this point, the connection could maintain only small additional load. This nonlinear behavior can be seen in the load-deflection curve of Figure 5.1. Table 6.1 lists three loads related to this nonlinear behavior.
Table 6.1: Loads related to linearity Test V1 (kips) V2 (kips) Vy (kips) Vexp (kips)
Unstiffened 1-U 48 --- 85.3 58.7 2-U 65 81 142 82.9 3-U 37 > Vexp 85.3 54.8
3-UM 53 59 99 58.6 4-U 82 > Vexp 142 98.7 6-U 95 >Vexp 231 138.0
6-UB 119 79 235 135.8 8-U 172 >Vexp 308 173.6
Stiffened* 1-A 42 --- 59 58.3 1-B 44 --- 59 54.6 2-A 64 --- 98.3 89 2-B 69 --- 98.3 92.6 2-C 65 --- 98.3 83.3 3-A 37 --- 59 53.2 3-B 38 --- 59 53.1 3-D 38 --- 59 51.1 3-E 40 --- 59 48.1 3-F 45 --- 80 68.4 3-G 52 --- 80 65.1 3-H 57 --- 80 67.8 4-A 88 --- 102 103 4-B 84 93 102 107 4-C 84 97 102 107 5-A 103 --- 177 122.9 5-B 106 106 177 140.7 6-B 104 --- 177 124.5 7-B 140 --- 236 224.2 7-C 128 --- 236 204.2 8-A 170 --- 261 196.3 8-B 173 --- 261 227.4
* Test 3-C is excluded due to the very low failure load

47
V1 is the measured load where the load-deflection curve became nonlinear. In some of the graphs, many from Phase III for example, it can be seen that the load-deflection curve became nonlinear at low loads. This was attributed to bolt slip in the connection. Inspection shows after the initial bolt slip, linear deflection still takes place. V2 is when strain gage data from a rosette gage indicates that shear yielding had occurred in the tab. This value is only listed for certain tests because these are the only tests that had rosette strain gages mounted on the tab. When the principal stress from the measured strain equaled the shear yield stress of the material, 0.6Fy, the shear in the connection was recorded and listed as V2 in Table 6.1. The value of V2 for tests 3-U, 4-U, 6-U, and 8-U are not listed because strain gage data indicated that the test was terminated before shear yield had occurred in the tab. Vy is the calculated load for shear yielding through the depth of the tab. The ultimate experimental load, Vexp, is also included for reference. Nonlinear behavior began at approximately the same load level for the majority of stiffened tests in a Group. Phase II, Group 3 tests show a higher load than the rest of the Group 3 tests because the yield strength of the shear tabs was higher. These shear tabs were fabricated from Grade 50 steel as opposed to A36 steel for the Phase I tests. The two Group 7 tests show a significant difference in load for V1. A possible factor influencing this discrepancy is the extension. Tests with the extension of the shear tab proved to have a lower capacity than ones without the extension. Test 7-C exhibited a sudden buckling of the extension, which preceded the nonlinear behavior. There was similar behavior with the Group 5 tests, but the load levels for each are comparable. For all cases, nonlinear behavior was observed well below the calculated load for shear yielding through the depth of the tab and well below when strain gage data indicated the shear yield stress of the material had been reached, with the exception of Test 6-UB. Therefore, the onset of nonlinear connection behavior can be considered a global connection phenomenon. The point when nonlinear behavior is reached does not necessarily indicate impending failure of the connection. For most cases, the calculated load for shear yielding through the depth of the tab is larger than the ultimate test load. However, local distortion of the tab and flaking of the whitewash coating on the tab were observed at lower load levels. This observation and the initiation of nonlinear behavior at lower load levels indicates that yielding had occurred in the tab and that the yielding cannot be attributed to direct shear yielding alone but rather a combination of shear yielding from direct shear and shear stresses developed from twisting of the extended shear tab. 6.2 Twisting
Twisting of the shear tab was also observed in a majority of the tests. The twisting was of special concern for the deep tab tests using connections having 5 bolts or more. The twisting of the tab was visually apparent by an out-of-levelness of the supported beam’s top flange and by a separation between the shear tab and supported beam’s web. This separation usually occurred at the bottom of the tab and was large enough so that a shim could be inserted and pushed into the gap all the way to contact with the bottom bolt. The twisting of the tab was also observed by discrepancies in strain gage data. Strain gages mounted on opposite sides (gages A-D and H-K in Figure 4.10) of the tab were monitored during testing. The magnitude and sign convention of these
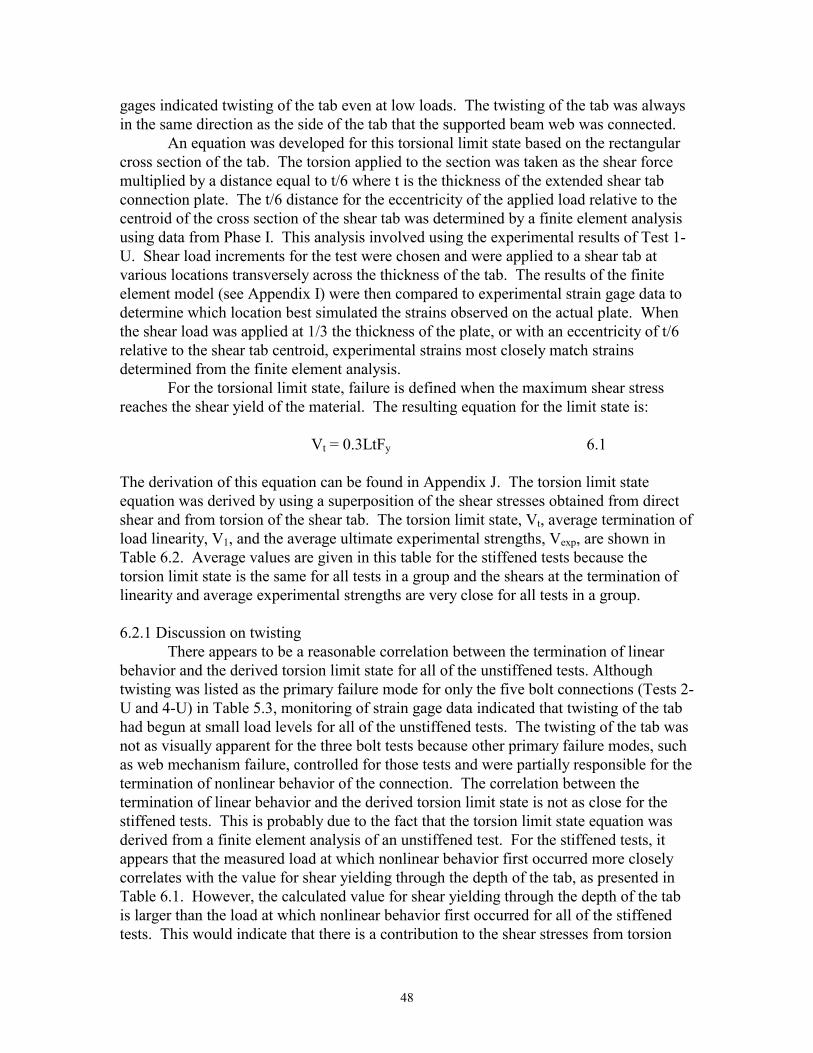
48
gages indicated twisting of the tab even at low loads. The twisting of the tab was always in the same direction as the side of the tab that the supported beam web was connected.
An equation was developed for this torsional limit state based on the rectangular cross section of the tab. The torsion applied to the section was taken as the shear force multiplied by a distance equal to t/6 where t is the thickness of the extended shear tab connection plate. The t/6 distance for the eccentricity of the applied load relative to the centroid of the cross section of the shear tab was determined by a finite element analysis using data from Phase I. This analysis involved using the experimental results of Test 1-U. Shear load increments for the test were chosen and were applied to a shear tab at various locations transversely across the thickness of the tab. The results of the finite element model (see Appendix I) were then compared to experimental strain gage data to determine which location best simulated the strains observed on the actual plate. When the shear load was applied at 1/3 the thickness of the plate, or with an eccentricity of t/6 relative to the shear tab centroid, experimental strains most closely match strains determined from the finite element analysis.
For the torsional limit state, failure is defined when the maximum shear stress reaches the shear yield of the material. The resulting equation for the limit state is:
Vt = 0.3LtFy 6.1
The derivation of this equation can be found in Appendix J. The torsion limit state equation was derived by using a superposition of the shear stresses obtained from direct shear and from torsion of the shear tab. The torsion limit state, Vt, average termination of load linearity, V1, and the average ultimate experimental strengths, Vexp, are shown in Table 6.2. Average values are given in this table for the stiffened tests because the torsion limit state is the same for all tests in a group and the shears at the termination of linearity and average experimental strengths are very close for all tests in a group. 6.2.1 Discussion on twisting
There appears to be a reasonable correlation between the termination of linear behavior and the derived torsion limit state for all of the unstiffened tests. Although twisting was listed as the primary failure mode for only the five bolt connections (Tests 2-U and 4-U) in Table 5.3, monitoring of strain gage data indicated that twisting of the tab had begun at small load levels for all of the unstiffened tests. The twisting of the tab was not as visually apparent for the three bolt tests because other primary failure modes, such as web mechanism failure, controlled for those tests and were partially responsible for the termination of nonlinear behavior of the connection. The correlation between the termination of linear behavior and the derived torsion limit state is not as close for the stiffened tests. This is probably due to the fact that the torsion limit state equation was derived from a finite element analysis of an unstiffened test. For the stiffened tests, it appears that the measured load at which nonlinear behavior first occurred more closely correlates with the value for shear yielding through the depth of the tab, as presented in Table 6.1. However, the calculated value for shear yielding through the depth of the tab is larger than the load at which nonlinear behavior first occurred for all of the stiffened tests. This would indicate that there is a contribution to the shear stresses from torsion
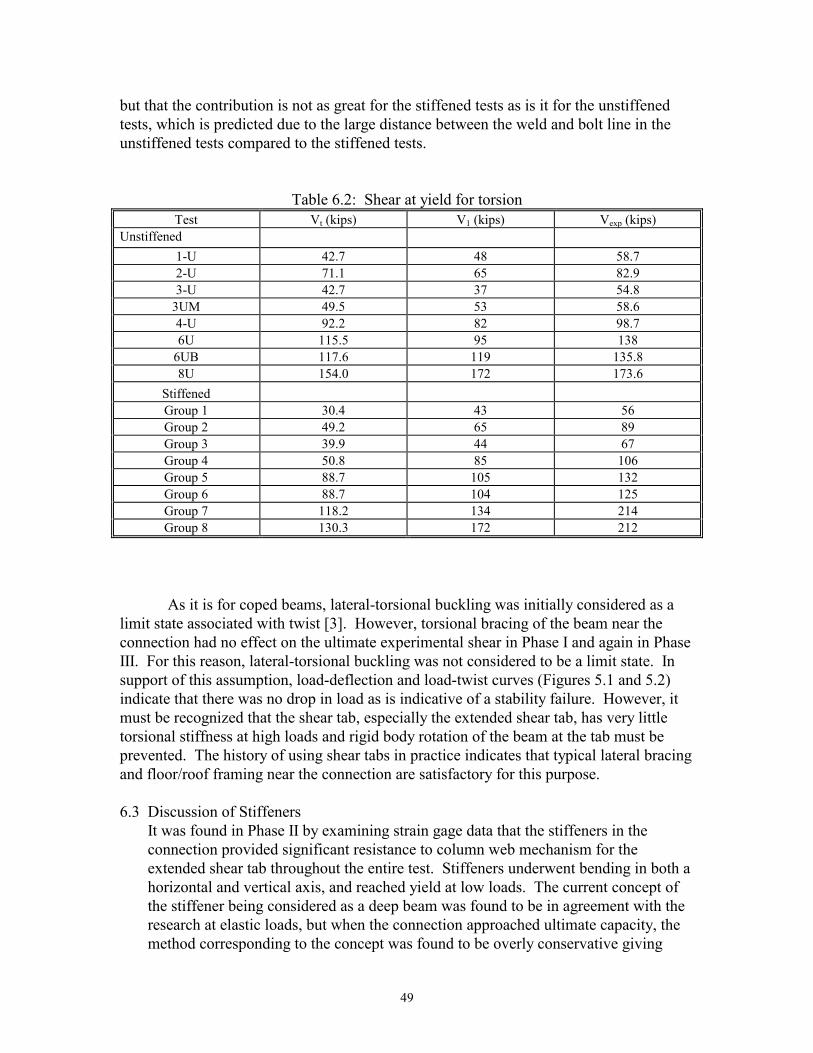
49
but that the contribution is not as great for the stiffened tests as is it for the unstiffened tests, which is predicted due to the large distance between the weld and bolt line in the unstiffened tests compared to the stiffened tests.
Table 6.2: Shear at yield for torsion Test Vt (kips) V1 (kips) Vexp (kips)
Unstiffened 1-U 42.7 48 58.7 2-U 71.1 65 82.9 3-U 42.7 37 54.8
3UM 49.5 53 58.6 4-U 92.2 82 98.7 6U 115.5 95 138
6UB 117.6 119 135.8 8U 154.0 172 173.6
Stiffened Group 1 30.4 43 56 Group 2 49.2 65 89 Group 3 39.9 44 67 Group 4 50.8 85 106 Group 5 88.7 105 132 Group 6 88.7 104 125 Group 7 118.2 134 214 Group 8 130.3 172 212
As it is for coped beams, lateral-torsional buckling was initially considered as a limit state associated with twist [3]. However, torsional bracing of the beam near the connection had no effect on the ultimate experimental shear in Phase I and again in Phase III. For this reason, lateral-torsional buckling was not considered to be a limit state. In support of this assumption, load-deflection and load-twist curves (Figures 5.1 and 5.2) indicate that there was no drop in load as is indicative of a stability failure. However, it must be recognized that the shear tab, especially the extended shear tab, has very little torsional stiffness at high loads and rigid body rotation of the beam at the tab must be prevented. The history of using shear tabs in practice indicates that typical lateral bracing and floor/roof framing near the connection are satisfactory for this purpose.
6.3 Discussion of Stiffeners
It was found in Phase II by examining strain gage data that the stiffeners in the connection provided significant resistance to column web mechanism for the extended shear tab throughout the entire test. Stiffeners underwent bending in both a horizontal and vertical axis, and reached yield at low loads. The current concept of the stiffener being considered as a deep beam was found to be in agreement with the research at elastic loads, but when the connection approached ultimate capacity, the method corresponding to the concept was found to be overly conservative giving

50
stiffener plates too thick to be practical. Upon comparison of the strain gage data from Tests 3-F and 3-G, which had similar weld configurations but different stiffener thickness, a conclusion was drawn that the extra thickness provided by Test 3-G did not improve the performance of the connection as a whole. Therefore, the thickness of the stiffener could be the same as the extended shear tab itself.
51
7. DESIGN PROCEDURE AND CONCLUSIONS 7.1 Limits of Applicability
The limits of applicability are based on the range of variables in the experimental program.
1) The number of bolts in connections used in the experimental program of this study was from 3 to 8. The recommended design procedure is based on the number of bolts that were included in the program. Since no significant differences in behavior of connections with larger number of bolts (6 or 8 bolts compared with 3 or 5 bolts), the recommended design procedure may be extended to connections with 2, 9 or 10 bolts. If the limits of applicability are extended to 2, 9 and 10 bolt connections, the expression for the eccentricity to the bolt line, eb, must be extrapolated from those obtained for connections with 3 to 8 bolts which were included in this study’s test program. The bolt spacing should be 3 in. with 1 ½ in. edge distance.
2) There should be vertical welds to the web of the supporting member. For girder connections, there should be a horizontal weld between the top of the tab and the top flange of the girder. For column connections, both ends of the tab should be welded to stiffener or continuity plates between the column flanges. All welds should be in pairs.
3) The bolt line should be from 2.5 in to 3.5 in. beyond the tips of the supporting member flanges.
4) Either STD or SSL holes may be used, and the bolts may either be snug or fully tightened. Results from tests in Phases I and II showed no significant difference when snug tight or fully tensioned bolts were used in the connections. Therefore, it was assumed that the bolt tightening type would have no significant effect on connections with 9 or 10 bolts. It was also assumed that the limits of applicability may be extended to include ASTM A490 bolts.
5) Stiffeners between column flanges do not have to be welded to the column web, but they may be if they are used as continuity plates.
6) Any extension of the shear tab between continuity plates in column connections should not exceed twice the length of the tab needed for the number of bolts in the connection. The tab in the girder connections should not be extended and welded to the bottom flange.
7) Lateral displacement of the beam (top flange) near the connection must be prevented by bracing or floor/roof framing. Preventing flange rotation is not critical.
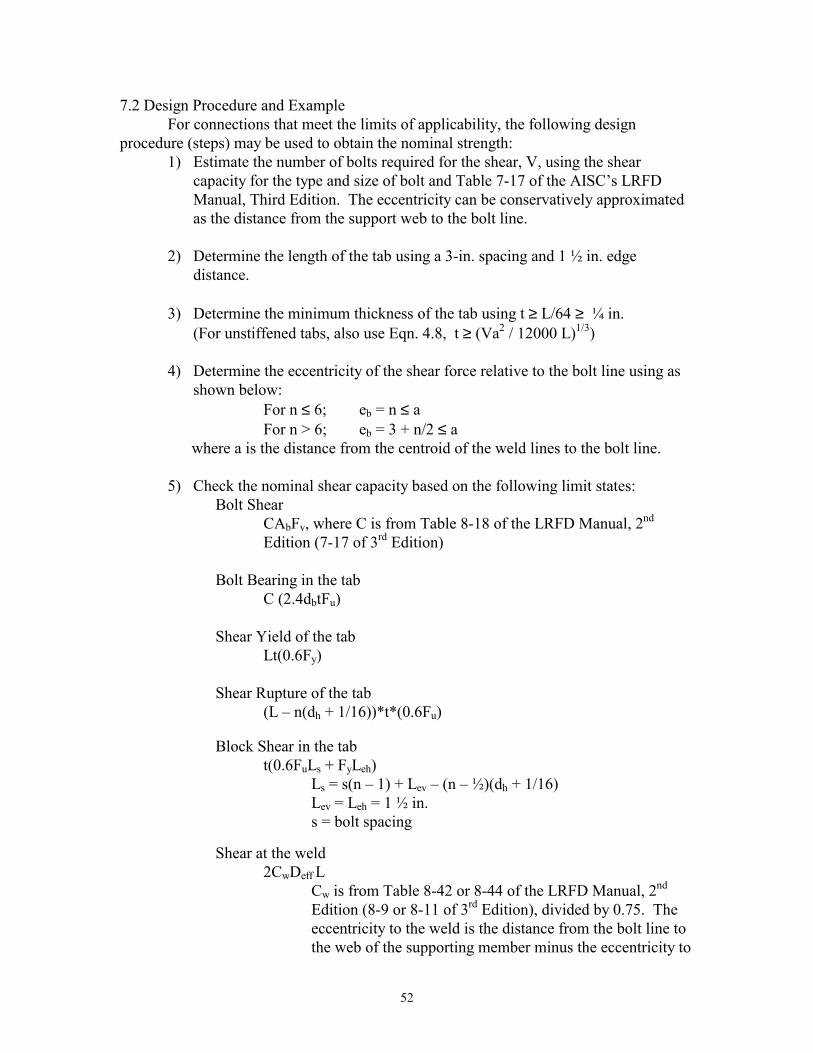
52
7.2 Design Procedure and Example For connections that meet the limits of applicability, the following design procedure (steps) may be used to obtain the nominal strength:
1) Estimate the number of bolts required for the shear, V, using the shear capacity for the type and size of bolt and Table 7-17 of the AISC’s LRFD Manual, Third Edition. The eccentricity can be conservatively approximated as the distance from the support web to the bolt line.
2) Determine the length of the tab using a 3-in. spacing and 1 ½ in. edge distance.
3) Determine the minimum thickness of the tab using t ≥ L/64 ≥ ¼ in.
(For unstiffened tabs, also use Eqn. 4.8, t ≥ (Va2 / 12000 L)1/3) 4) Determine the eccentricity of the shear force relative to the bolt line using as
shown below: For n ≤ 6; eb = n ≤ a For n > 6; eb = 3 + n/2 ≤ a
where a is the distance from the centroid of the weld lines to the bolt line.
5) Check the nominal shear capacity based on the following limit states: Bolt Shear
CAbFv, where C is from Table 8-18 of the LRFD Manual, 2nd Edition (7-17 of 3rd Edition)
Bolt Bearing in the tab C (2.4dbtFu)
Shear Yield of the tab Lt(0.6Fy) Shear Rupture of the tab (L – n(dh + 1/16))*t*(0.6Fu) Block Shear in the tab t(0.6FuLs + FyLeh) Ls = s(n – 1) + Lev – (n – ½)(dh + 1/16) Lev = Leh = 1 ½ in. s = bolt spacing Shear at the weld 2CwDeff L
Cw is from Table 8-42 or 8-44 of the LRFD Manual, 2nd Edition (8-9 or 8-11 of 3rd Edition), divided by 0.75. The eccentricity to the weld is the distance from the bolt line to the web of the supporting member minus the eccentricity to

53
the bolt line and minus the distance from the web of the supporting member to the centroid of the weld pattern.
ew =
−−_xea b
Deff = Exx
y
FtF
28
6) Apply the appropriate resistance factors or factor of safety for the various limit states. 7) Determine the weld size - Use a weld size equal to ¾ of the tab thickness
following the current AISC standards. Alternatively, one may use the procedure for consideration of shear at the weld (as shown in step 5) to solve for the weld size given the shear force.
8) Shear at the vertical weld for column connection
Deff = Exx
wy
FtF
216 ≥ weld size
9) Examine the beam web for bolt bearing (if top flange is coped, check block shear).
10) The thickness of column stiffeners should be the larger of the requirements for
the continuity plates for orthogonal framing or the thickness of the tab. In the latter case, the welds to the column flanges should be ¾ of the thickness.
Nomenclature: Ab: cross-sectional area of the bolt C: constant from tables for eccentric shear on bolts Cw: constant from tables for eccentric shear on welds db: nominal diameter of the bolt dh: nominal diameter of the bolt hole Deff: effective weld size Dweld: number of 1/16 in. of weld size FExx: weld strength Fu: ultimate strength of the shear tab Fv: shear strength of the bolts Fy: yield strength of the shear tab L: length of the shear tab Leh: horizontal edge distance Lev: vertical edge distance Ls: shear rupture length n: number of bolts s: bolt spacing t: thickness of the shear tab tw: thickness of the supporting web

54
Design Example: Design an extended shear tab connection for a W21x68 beam with 60 kips end shear framing into the web of a W12x72 column. Both members are A992 material. Use ¾-in. diameter A325-X bolts in standard hole and E70 weld electrodes. W21x68 beam 12x72 column tw = 0.430 in. tw= 0.430 in. bf = 8.27 in. bf = 12.0 in. T = 18.375 in. T = 12.5 in.
1. Estimate the number of bolts φrn = 19.1 kips, Crqud = 60/19.1 = 3.14 approximate eb = (12.0 - 0.430)/2 + 3 = 8.8 in from Tale 7-17, Try 6 bolts
2. Determine the tab length with 3 in. pitch and 1.5 in. edge distance L = 3x5 + 2x 1.5 = 18 in. < T = 18.375 in. 3. Minimum tab thickness t ≥ L/64 = 18/64 = .281 in. ≥ ¼ in. use 5/16 in. tab 4. Determine the eccentricity to the bolt line horizontal weld length = (12.0 – 0.430)/2 = 5.78 in. use Table 8-9
k = 5.78/18 = 0.321 x = 0.056 + (0.089 – 0.056) x 0.21 = 0.063 xL = 0.063 x 18 = 1.13 in.
a = 5.78 – 1.13 +3 = 7.65 in. eb = 6 in. < 7.65 in., use eb = 6 in.
5. & 6. Check limit states with resistance factors Bolt Shear from Table 7-17 C = 3.55 in. φRn =C(φrn) = 3.55 x 19.1 = 67.8 kips > 60 kips Bolt bearing of the tab Rn = C(2.4 dbtFu) = 3.55(2.4 x (3/4 + 1/16) x 5/16 x 65 = 141 kips φRn = 0.75 x 141 = 105 kips > 60 kips Shear yield of the tab Rn = Lt(0.6Fy) = 18x 5/16x (0.6x 50) = 169 kips φRn = 0.9 x 169 = 152 kips > 60 kips
55
Shear Rupture of the tab Rn = (L – n(dh + 1/16))t(0.6Fu) = (18 – 6(.75 + .125)) x 5/16 x (0.6 x 65) = 156 kips φRn = 0.75 x 156 = 117 kips > 60 kips Block Shear of the tab Rn = t(0.6FuLs + FyLeh)
Ls = 3 x(6 – 1) + 1.5 – (6 - .5)(.75 + .125) = 11.7 in. Rn = 5/16 x (0.6 x 65 x 11.7 + 50 x 1.5) = 166 kips φRn = 0.75 x 166= 125 kip > 60 kips Shear at the weld φRn = 2CwDeffL ew = 7.65 – 6- 1.13 = 0.52 in. from Table 8.9 k = 0.321 a = 0.52/18 = 0.029 Cw = 274 Deff = 11.3 x 50 x (5/16)/70 = 2.52 in. φRn = 2 x 2.74 x 2.52 x 18= 248 kips > 60 kips 7. Determine the weld size weld size = 0.75t = 0.75 x 5/16 = 0.234 in., use ¼ in. weld alternatively use a weld size larger than Deff for shear at the weld Deff = 2.52 in., use 3/16 in. weld 8. Check shear at the vertical weld for the column connection Deff = 22.6 x50 x 0.430/70 = 6.94 in. > 3 or 4 9. Bolt bearing in the beam web φrb = φ(2.4dtFu) = 0.75(2.4 x 0.75 x0.430 x 65) = 37.7 kips > φrv =19.1 kips bolt shear controls 10. Column stiffeners are designed as 5/16 in. with ¼ in. weld (assumed no continuity plates for orthogonal framing). Note: It is not the focus of this study to address the design of supporting members in shear tab connections. However, it is apparent that the resulting shear and moment forces from the connections do affect the design of the supporting members and will need to be considered.
56
7.3 Determination of Eccentricity Since the eccentricity of the shear force, or point of zero moment, is important in the design of shear tabs, a study was made to determine the eccentricities that best correlated with the experimental strengths in the test program. The evaluation was made for stiffened column and girder connections with 3, 5, 6, and 8 bolts. The connections were modeled with the actual geometric and material properties and the shear capacities based on the various limit states were determined at varying eccentricities. Eccentricities relative to the bolt line were varied in 1-in. increments from negative 1-in. to 7-in. Positive eccentricities correspond to locations between the bolt line and the web of the supporting member. The resulting curves are plotted in Figures A and B. The dots in Figures A and B show the capacities for the various eccentricities for girder and column connections respectively for each of the four groups of number of bolts in the pattern. The letter near each dot indicates the critical limit state that determined the capacity. A - bolt shear B - bolt bearing in the tab C - shear yield on the gross area of the tab D - shear rupture on the net section through the bolt holes E - block shear in the tab (never controlled) F - failure at the weld H – Tab extension buckling Weld failure was not a critical limit state since the welds were always 3/4 of the tab thickness. Therefore, failure at the weld represents an effective weld size based on the thickness of the tab or supporting web adjacent to the weld. The cross marks in Figures A and B are the experimental strength values that are marked on the graphs of the calculated capacities vs. eccentricities. The failure mode is also indicated. The appropriate eccentricities used for design are determined by reading the eccentricity values on the horizontal axis that corresponds with the cross marks on the graphs. The symbol H appears for the lower experimental capacities for the 6 and 8 bolt girder connections. In these tests, the tab was extended to the bottom flange and the portion of the tab below the lowest bolt buckled causing severe distortion and premature failure of the connection. These data points were not considered in determining the appropriate eccentricity. By comparing the positions of dot symbols and cross marks, the most appropriate eccentricities can be determined. These are plotted in the insert to the right in Figures A and B. The eccentricity to the bolt line is always positive and increases with the number of bolts in the pattern. For six or less bolts, the appropriate eccentricity in inches is equal to the number of bolts. For eight bolts, it is close to 7-in. Therefore, the following eccentricities are recommended for connections with 2 to 10 bolts.
For n < 6; eb = n < a For n > 6; eb = 3 + n/2 < a
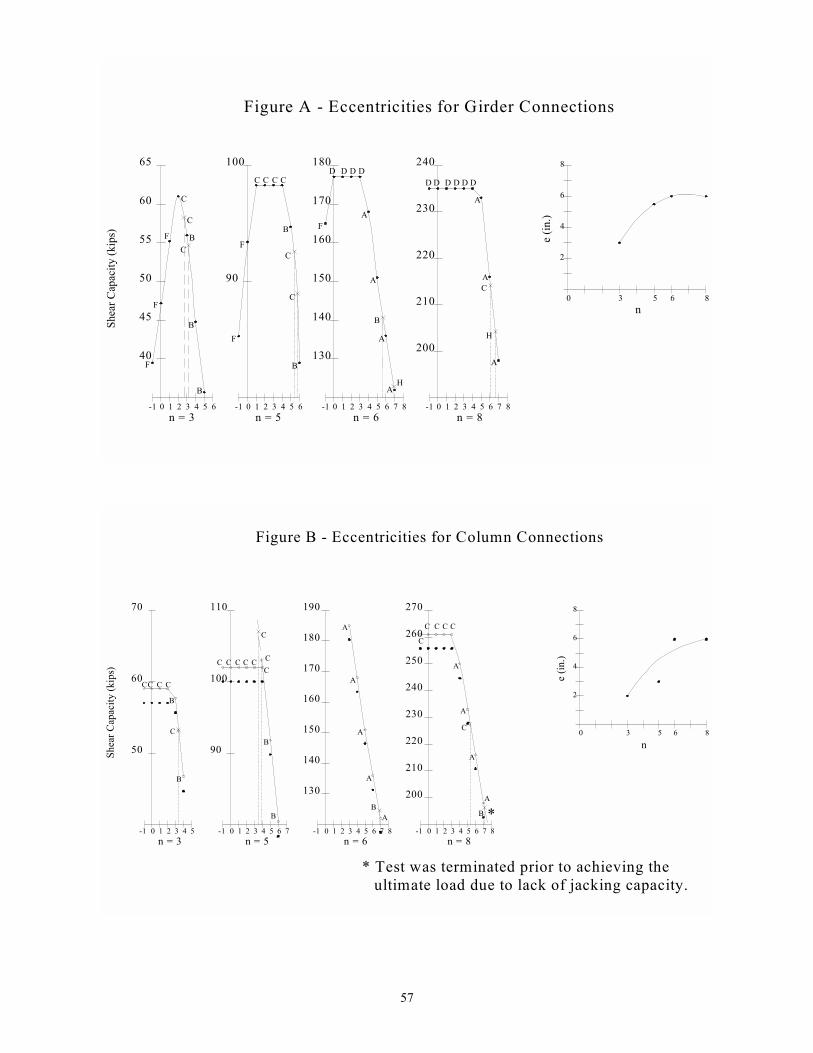
57
40
45
50
55
60
65
-1 0 1 2 3 4 5 6 0-1 1 2 3 4 65
90
100 180
170
160
150
140
130
0-1 1 2 3 4 65 7 8 3-1 0 1 2 54 6 7 8
240
230
220
210
200
n = 3 n = 5 n = 6 n = 8
86530
2
4
6
8
F
F
F
C
B
C
C
B
B
F
F
C C C C
B
B
C
C
F
D D D D
A
A
A
A
B
H
D D D D D D
A
A
A
H
C
Shea
r Cap
acity
(kip
s) e (in
.)
n
Figure A - Eccentricities for Girder Connections
50
60
70
90
100
110
130
140
150
160
170
180
190
200
210
220
230
240
250
260
270
-1 0 1 2 3 4 5 -1 0 21 3 4 5 6 7 4-1 0 1 2 3 5 6 7 8 0-1 1 2 843 5 6 7n = 3 n = 5 n = 6 n = 8
0 3 5 6 8
2
4
8
6
CC C C
B
B
C
CC C C C C C
C
B
BB
A
A
A
A
A
A
A
A
A
B
C
C C C C
C
e (in
.)
n
Shea
r Cap
acity
(kip
s)
Figure B - Eccentricities for Column Connections
*
* Test was terminated prior to achieving the ultimate load due to lack of jacking capacity.
58
7.4 Nominal Strengths Table 7.1 compares the nominal strengths, Vn, determined by the proposed design
procedure with the average value of the stiffened experimental strengths for each group. It was decided by the AISC committee overseeing the project that unstiffened connections should no longer be considered a part of the pending design procedure. Therefore, Table 7.1 shows only nominal strengths for stiffened connections
Table 7.1: Comparison of design shear strengths Group Vn (kips) Vexp (kips) Vn/Vexp
1 56 56 1.00 2 98.3 91 1.08 3 64.9 60 1.08 4 101.6 105 0.97 5 135.8 132 1.03 6 135.8 125 1.09 7 198.4 214 0.93 8 198.4 212 0.94
The design strengths of Table 7.1 show results that are conservative for Groups 4, 7, and 8. But the other groups have nominal capacities that are higher than or equal to the experimental capacities (by a maximum of 9%). When these values are compared to the theoretical capacities from Table 5.3, it can be seen that the Groups 1 – 4 correlate with the predicted capacities using both AISC eccentricity and measured eccentricity. The groups involving the deeper connections fare differently than the other groups, each having a nominal capacity lower than those listed in Table 5.3. A sample calculation is shown in Appendix L. It must be noted that all calculations used a bolt strength of 86 ksi as explained earlier in the report. Also of note, calculation of Vn for the Group 3 capacity utilizes material properties from the Phase II W8x31 column tests, so the capacity shown is of a somewhat higher magnitude. 7.5 Conclusions A design procedure for extended shear tabs has been developed as a result of this study. The design procedure is based on a series of 31 full-scale tests having both beam-to-column and beam-to-girder connections, and various weld configurations to the supporting member. The design procedure is a modification of the existing AISC criteria for single plate shear connections. A yield line mechanism of the web of a supporting column was identified as new limit state for unstiffened extended shear tabs, but was ultimately ruled out of the design procedure with the decision to include only stiffened extended shear tabs. As of now, it is recommended that the design procedure only be used anywhere from 2-10 bolts in a single row.

59
Appendices
60
APPENDIX A: TEST BEAM SELECTION
High Rotation Beam:
Beam Size: W12X87
Properties: Sx = 118 in3
Fy = 36 ksi
Rmax = 60 kips
Calculations: Mmax = FyS/12 = 36(118)/12 = 354 ft-k
For a uniformly loaded beam: R = 1/2wLu or w = 2R/Lu
Mmax = w(Lu)2/8 or Lu = Mmax(8)/2R = 354(8)/2(60) = 23.6 ft
Use Lu = 24 ft
Test Beam: Lp = 30 ft
b = (Lp2 - (Lu
2/2))1/2 = (302 - (242/2))1/2 = 24.75 ft
Use a = 5.25 ft = 63 in.
Summary: The 30-ft. long test beam with a concentrated load placed 63 in. from the
shear tab exactly simulates the same reaction shear and end rotation as a
24 ft long uniformly loaded beam.
Low Rotation Beam:
Beam Size: W18X71
Properties: Sx = 127 in3
Fy = 36 ksi
Rmax = 100 kips
Calculations: Mmax = FyS/12 = 36(127)/12 = 381 ft-k
61
For a uniformly loaded beam: R = 1/2wLu or w = 2R/Lu
Mmax = w(Lu)2/8 or Lu = Mmax(8)/2R = 381(8)/2(100) = 15.3 ft
Use Lu = 15 ft
Test Beam: Lp = 20 ft
b = (Lp2 - (Lu
2/2))1/2 = (202 - (152/2))1/2 = 16.96 ft
Use a = 3ft = 36 in.
Summary: The 20-ft. long test beam with a concentrated load placed 36 in. from the
shear tab exactly simulates the same reaction shear and end rotation as a
15 ft long uniformly loaded beam. Six Bolt Test Beam: Properties: Fy = 50 ksi Calculations: Vmax assumed to be 150 kips for 6 bolt connection with eb = 4 in. Lmax = 33 ft Ltab = 3*5+3 = 18 ≤ T, therefore W24 section required L/d ≈ (33*12)/24 ≈ 16.5 (ok) a = 88.5 in. Distance to roller support on free end = 6 in. b = (33*12) – 88.5 – 6 = 301.5 in.
)(2 22 bLL pu −= = 350 in., or a uniformly loaded beam of L = 29’-2” Mmax = Va = 150*88.5 = 13275 ft-in f = M/S < 50 ksi, S > 13275/50 = 265.5 in3 Choose W24x146: Sx = 371 in3
62
Summary: A 33-ft. long test beam, the maximum length that could fit into the laboratory, with the load centered at 88.5 in. from the bolt line of the connection simulates the same reaction shear and end rotation as a uniformly loaded beam of approximately 29 ft.
Eight Bolt Test Beam: Properties: Fy = 50 ksi Calculations: Vmax assumed to be 176 kips for 8 bolt connection with eb = 4 in. Lmax = 33 ft Ltab = 3*7+3 = 24 ≤ T, therefore W27 section required L/d ≈ (33*12)/27 ≈ 15 (ok) a = 88.5 in. Distance to roller support on free end = 6 in. b = (33*12) – 88.5 – 6 = 301.5 in.
)(2 22 bLL pu −= = 350 in., or a uniformly loaded beam of L = 29’-2” Mmax = Va = 176*88.5 = 15576 ft-in f = M/S < 50 ksi, S > 15576/50 = 311.5 in3 Choose W30x148: Sx = 436 in3 Summary: A 33-ft. long test beam, the maximum length that could fit into the
laboratory, with the load centered at 88.5 in. from the bolt line of the connection simulates the same reaction shear and end rotation as a uniformly loaded beam of approximately 29 ft.
Note: A distance of 88.5 inches was chosen for the Phase III tests in order to
maximize the shear at the connection while simultaneously fitting the loading assembly into the overall test setup.
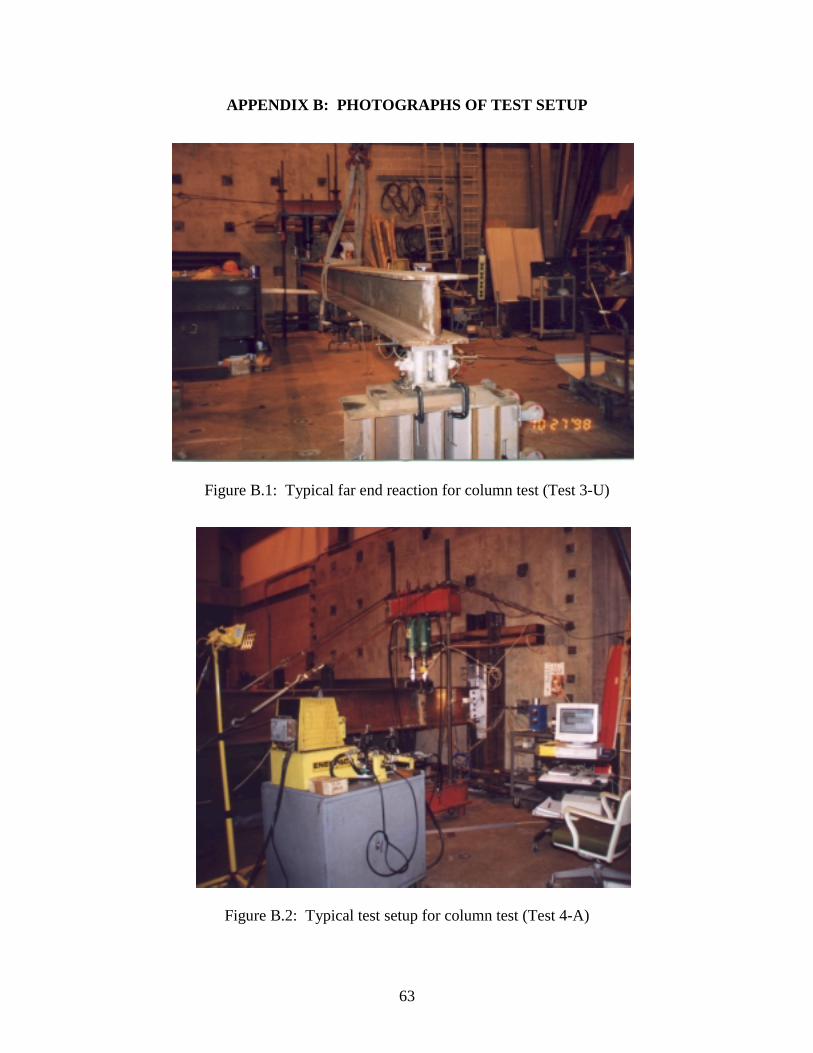
63
APPENDIX B: PHOTOGRAPHS OF TEST SETUP
Figure B.1: Typical far end reaction for column test (Test 3-U)
Figure B.2: Typical test setup for column test (Test 4-A)

64
Figure B.3: Typical test setup for Phase I girder test (Test 1-B)
Figure B.4: Typical test setup for Phase III girder test (Test 5-A)
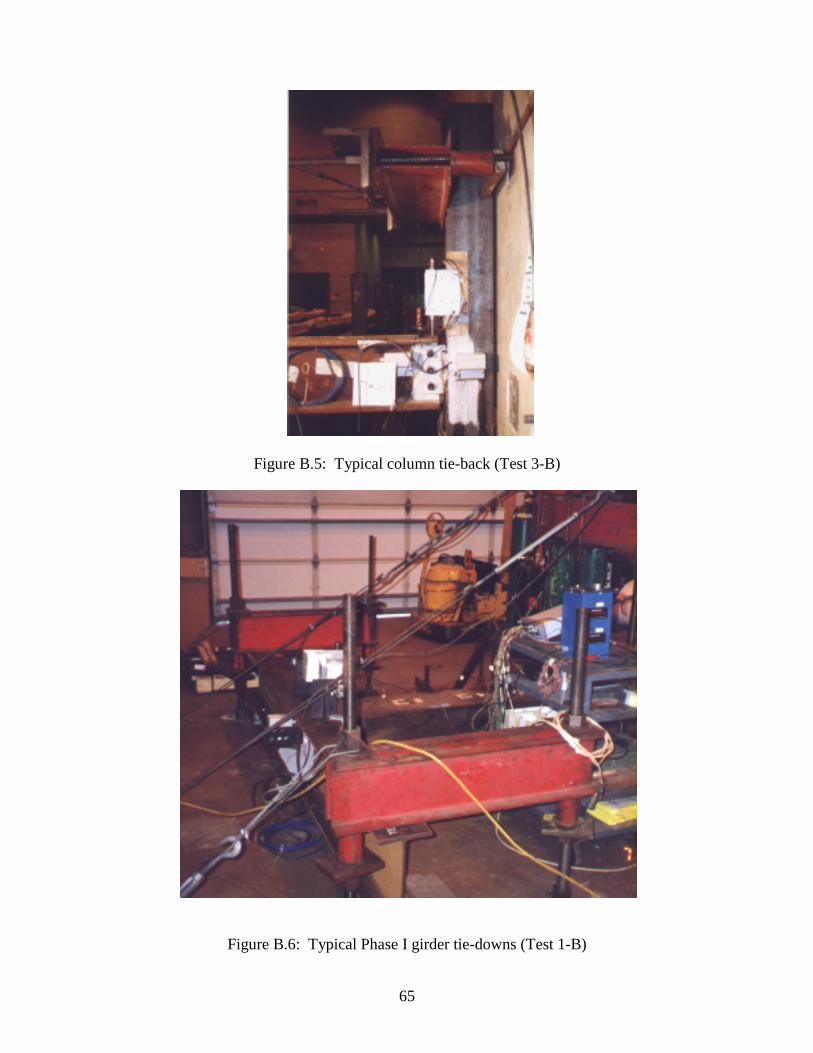
65
Figure B.5: Typical column tie-back (Test 3-B)
Figure B.6: Typical Phase I girder tie-downs (Test 1-B)
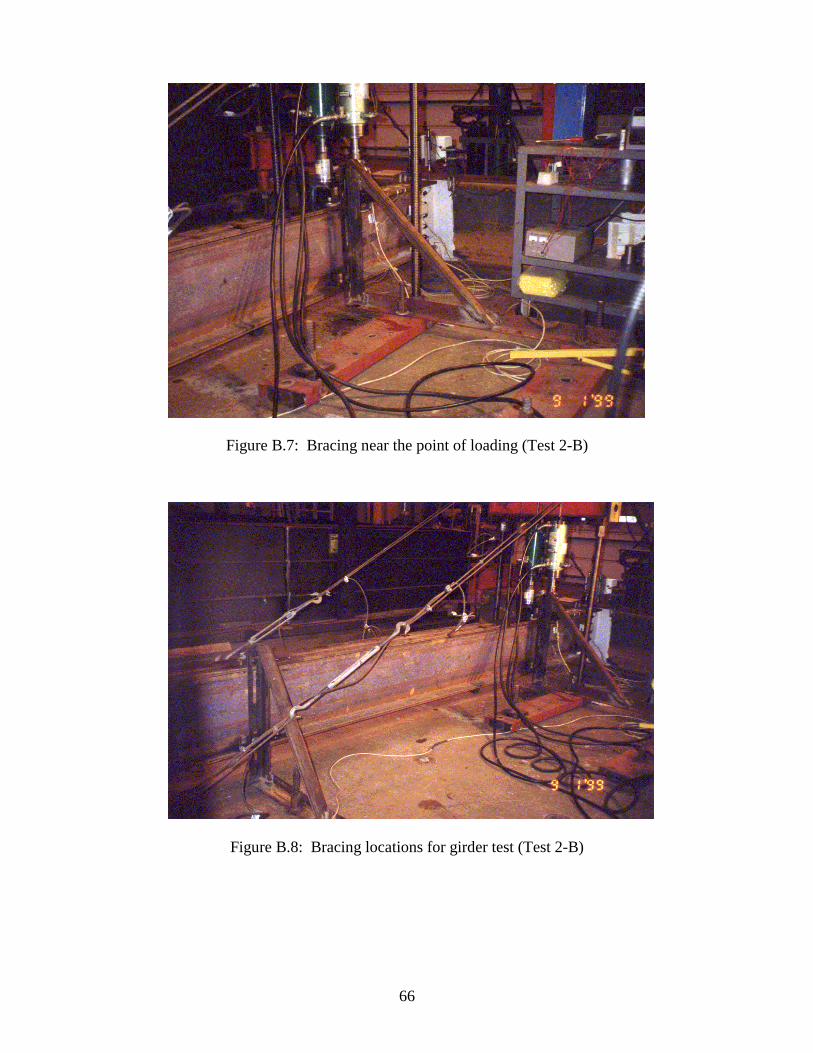
66
Figure B.7: Bracing near the point of loading (Test 2-B)
Figure B.8: Bracing locations for girder test (Test 2-B)
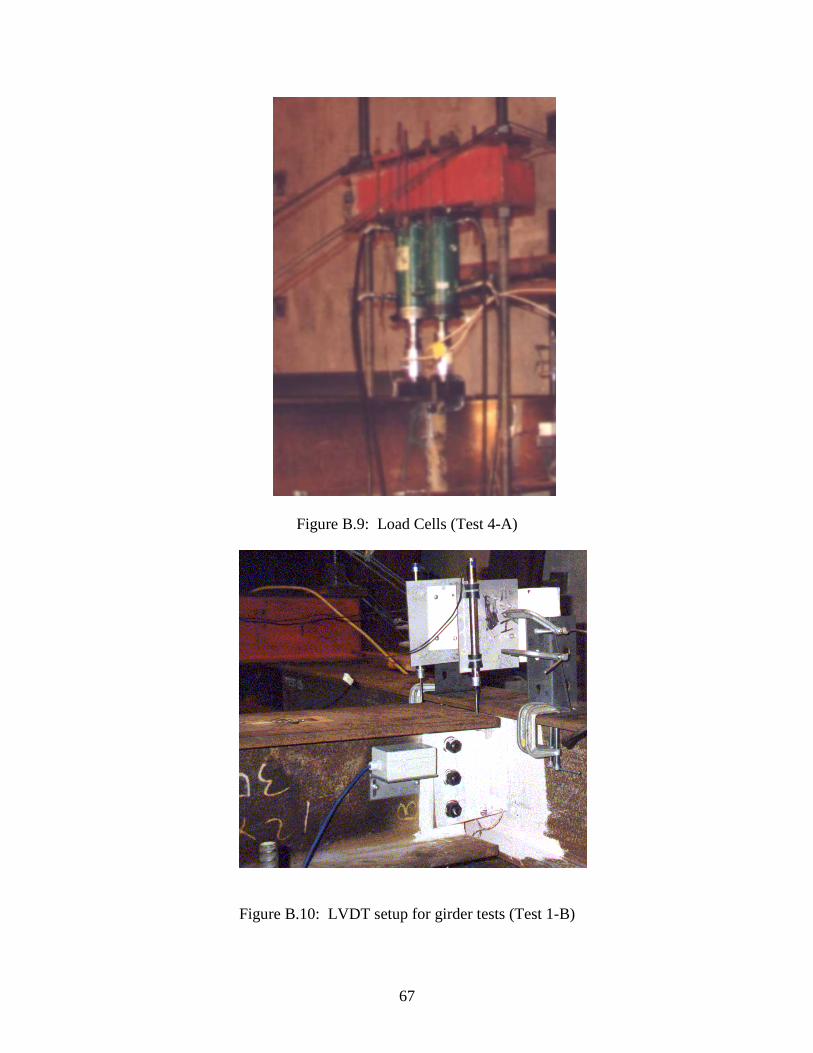
67
Figure B.9: Load Cells (Test 4-A)
Figure B.10: LVDT setup for girder tests (Test 1-B)
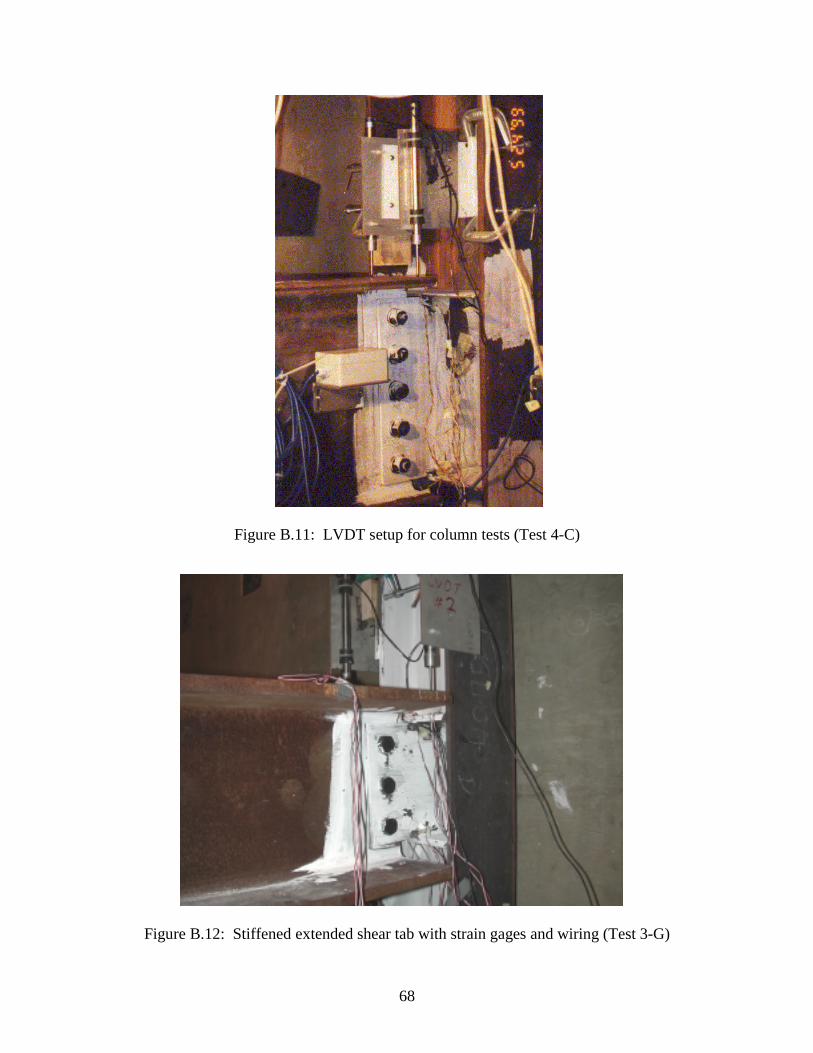
68
Figure B.11: LVDT setup for column tests (Test 4-C)
Figure B.12: Stiffened extended shear tab with strain gages and wiring (Test 3-G)
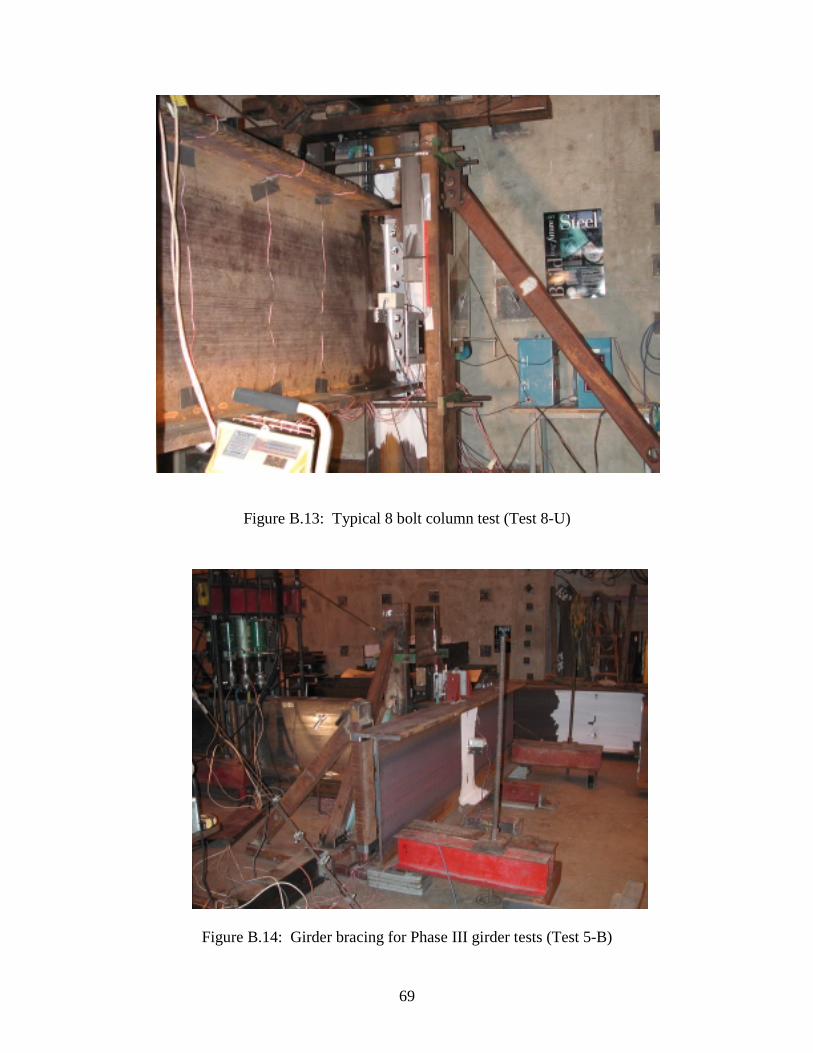
69
Figure B.13: Typical 8 bolt column test (Test 8-U)
Figure B.14: Girder bracing for Phase III girder tests (Test 5-B)

70
Figure B.15: View of rotational-lateral bracing roller system
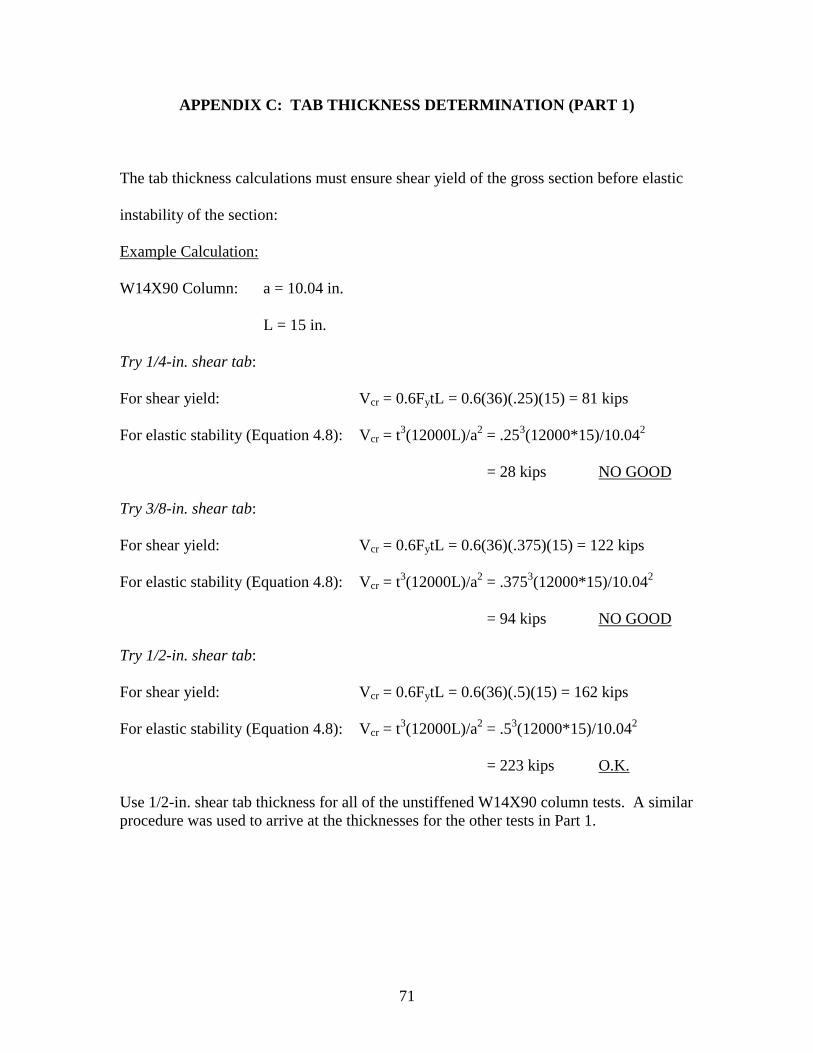
71
APPENDIX C: TAB THICKNESS DETERMINATION (PART 1)
The tab thickness calculations must ensure shear yield of the gross section before elastic
instability of the section:
Example Calculation:
W14X90 Column: a = 10.04 in.
L = 15 in.
Try 1/4-in. shear tab:
For shear yield: Vcr = 0.6FytL = 0.6(36)(.25)(15) = 81 kips
For elastic stability (Equation 4.8): Vcr = t3(12000L)/a2 = .253(12000*15)/10.042
= 28 kips NO GOOD
Try 3/8-in. shear tab:
For shear yield: Vcr = 0.6FytL = 0.6(36)(.375)(15) = 122 kips
For elastic stability (Equation 4.8): Vcr = t3(12000L)/a2 = .3753(12000*15)/10.042
= 94 kips NO GOOD
Try 1/2-in. shear tab:
For shear yield: Vcr = 0.6FytL = 0.6(36)(.5)(15) = 162 kips
For elastic stability (Equation 4.8): Vcr = t3(12000L)/a2 = .53(12000*15)/10.042
= 223 kips O.K.
Use 1/2-in. shear tab thickness for all of the unstiffened W14X90 column tests. A similar procedure was used to arrive at the thicknesses for the other tests in Part 1.
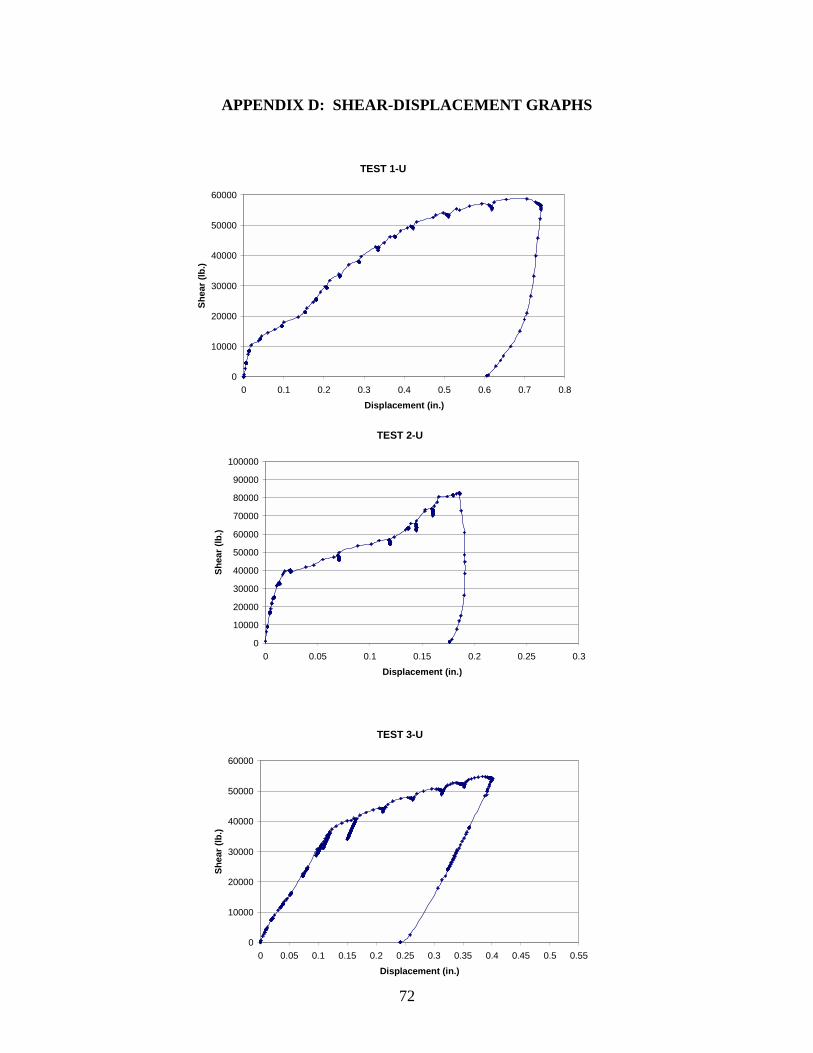
72
APPENDIX D: SHEAR-DISPLACEMENT GRAPHS
TEST 1-U
0
10000
20000
30000
40000
50000
60000
0 0.1 0.2 0.3 0.4 0.5 0.6 0.7 0.8Displacement (in.)
Shea
r (lb
.)
TEST 2-U
0
10000
20000
30000
40000
50000
60000
70000
80000
90000
100000
0 0.05 0.1 0.15 0.2 0.25 0.3Displacement (in.)
Shea
r (lb
.)
TEST 3-U
0
10000
20000
30000
40000
50000
60000
0 0.05 0.1 0.15 0.2 0.25 0.3 0.35 0.4 0.45 0.5 0.55Displacement (in.)
Shea
r (lb
.)
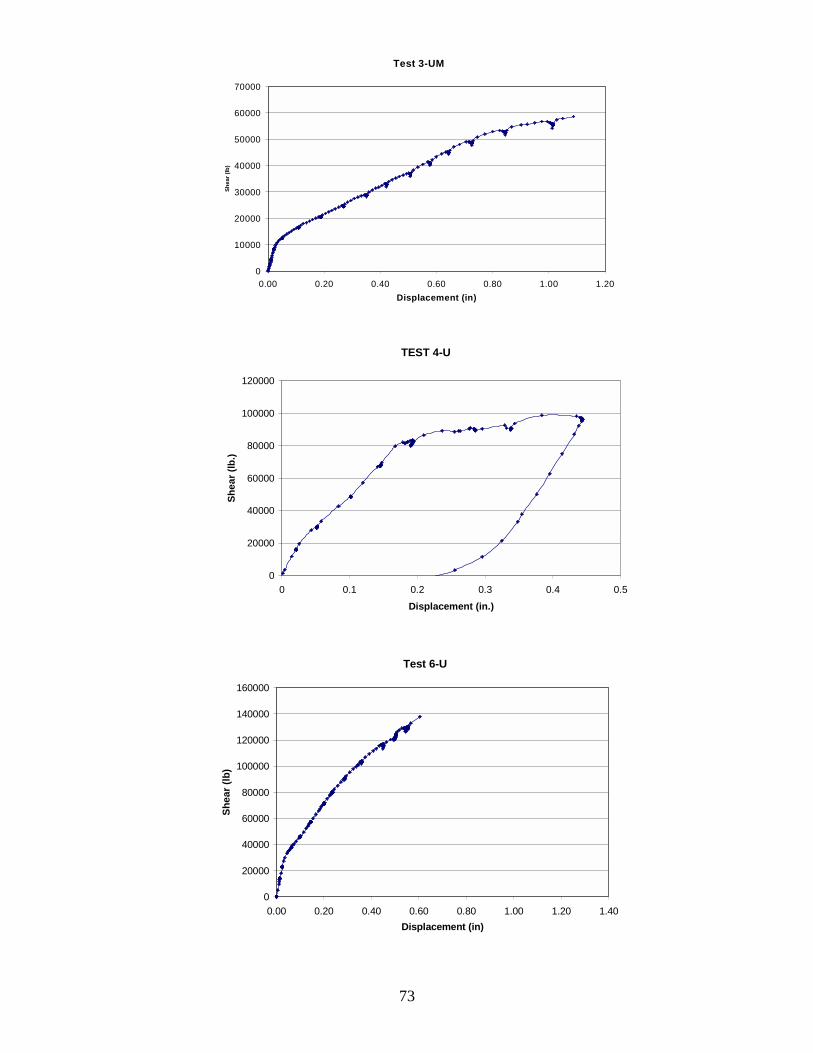
73
Test 3-UM
0
10000
20000
30000
40000
50000
60000
70000
0.00 0.20 0.40 0.60 0.80 1.00 1.20Displacement (in)
Shea
r (lb
)
TEST 4-U
0
20000
40000
60000
80000
100000
120000
0 0.1 0.2 0.3 0.4 0.5Displacement (in.)
Shea
r (lb
.)
Test 6-U
0
20000
40000
60000
80000
100000
120000
140000
160000
0.00 0.20 0.40 0.60 0.80 1.00 1.20 1.40Displacement (in)
Shea
r (lb
)

74
Test 6-UB
0
20000
40000
60000
80000
100000
120000
140000
160000
0.00 0.20 0.40 0.60 0.80 1.00 1.20 1.40Displacement (in)
Shea
r (lb
)
Test 8-U
0
50000
100000
150000
200000
250000
0.00 0.20 0.40 0.60 0.80 1.00 1.20 1.40Displacement (in.)
Shea
r (lb
)
TEST 1-A
0
10000
20000
30000
40000
50000
60000
0 0.1 0.2 0.3 0.4 0.5 0.6 0.7 0.8Displacement (in.)
Shea
r (lb
.)
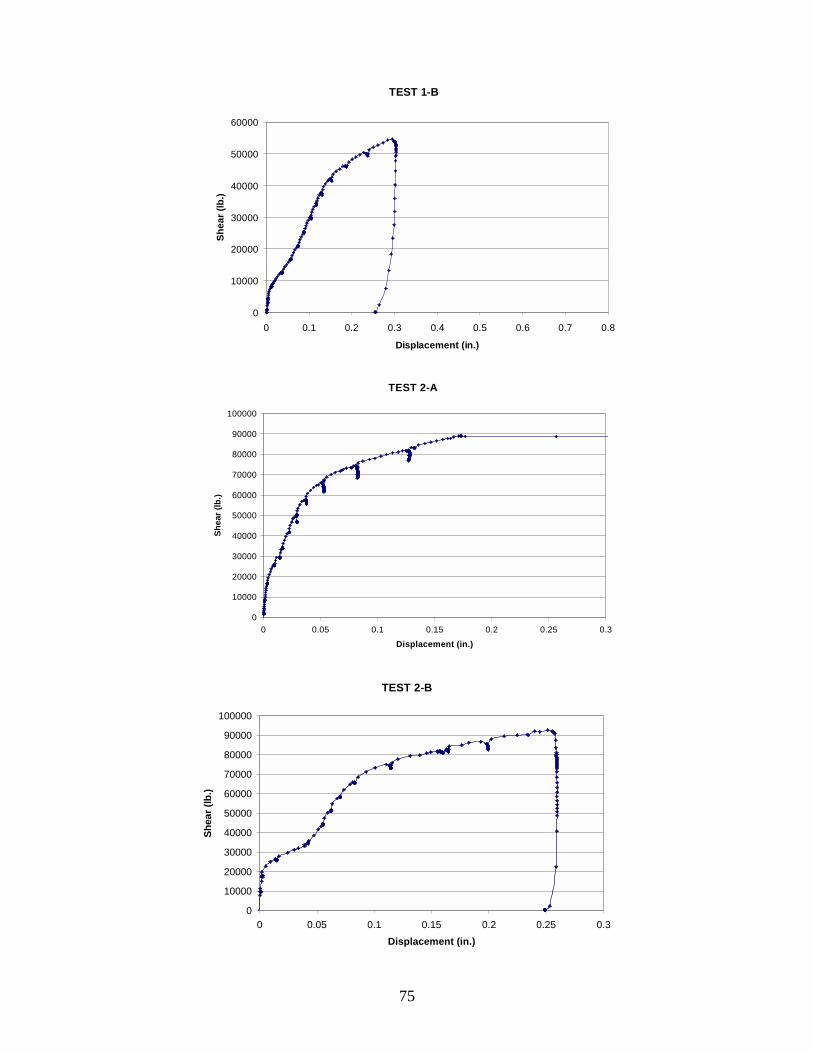
75
TEST 1-B
0
10000
20000
30000
40000
50000
60000
0 0.1 0.2 0.3 0.4 0.5 0.6 0.7 0.8
Displacement (in.)
Shea
r (lb
.)
TEST 2-A
0
10000
20000
30000
40000
50000
60000
70000
80000
90000
100000
0 0.05 0.1 0.15 0.2 0.25 0.3Displacement (in.)
Shea
r (lb
.)
TEST 2-B
0
10000
20000
30000
40000
50000
60000
70000
80000
90000
100000
0 0.05 0.1 0.15 0.2 0.25 0.3Displacement (in.)
Shea
r (lb
.)

76
TEST 2-C
0
10000
20000
30000
40000
50000
60000
70000
80000
90000
100000
0 0.05 0.1 0.15 0.2 0.25 0.3Displacement (in.)
Shea
r (lb
.)
TEST 3-A
0
10000
20000
30000
40000
50000
60000
0 0.05 0.1 0.15 0.2 0.25 0.3 0.35 0.4 0.45 0.5 0.55Displacement (in.)
Shea
r (lb
.)
TEST 3-B
0
10000
20000
30000
40000
50000
60000
0 0.05 0.1 0.15 0.2 0.25 0.3 0.35 0.4 0.45 0.5 0.55
Displacement (in.)
Shea
r (lb
.)
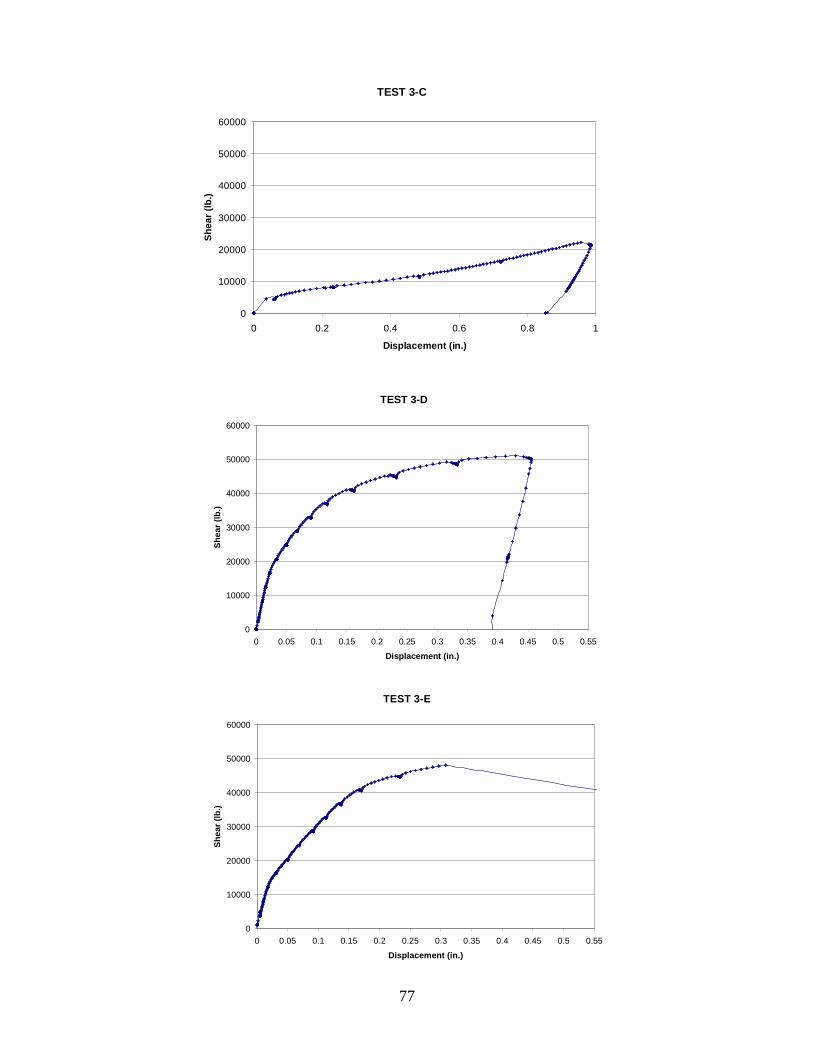
77
TEST 3-C
0
10000
20000
30000
40000
50000
60000
0 0.2 0.4 0.6 0.8 1
Displacement (in.)
Shea
r (lb
.)
TEST 3-D
0
10000
20000
30000
40000
50000
60000
0 0.05 0.1 0.15 0.2 0.25 0.3 0.35 0.4 0.45 0.5 0.55Displacement (in.)
Shea
r (lb
.)
TEST 3-E
0
10000
20000
30000
40000
50000
60000
0 0.05 0.1 0.15 0.2 0.25 0.3 0.35 0.4 0.45 0.5 0.55Displacement (in.)
Shea
r (lb
.)
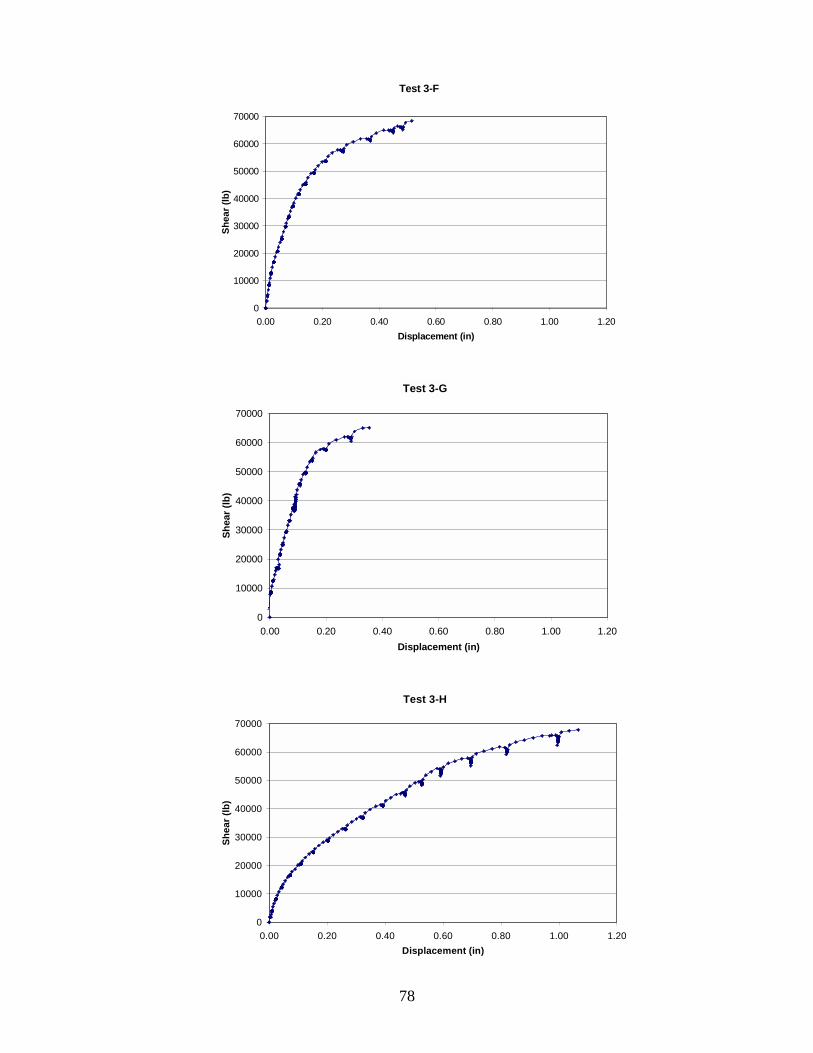
78
Test 3-F
0
10000
20000
30000
40000
50000
60000
70000
0.00 0.20 0.40 0.60 0.80 1.00 1.20Displacement (in)
Shea
r (lb
)
Test 3-G
0
10000
20000
30000
40000
50000
60000
70000
0.00 0.20 0.40 0.60 0.80 1.00 1.20Displacement (in)
Shea
r (lb
)
Test 3-H
0
10000
20000
30000
40000
50000
60000
70000
0.00 0.20 0.40 0.60 0.80 1.00 1.20Displacement (in)
Shea
r (lb
)

79
TEST 4-A
0
20000
40000
60000
80000
100000
120000
0 0.05 0.1 0.15 0.2 0.25 0.3 0.35 0.4 0.45 0.5Displacement (in.)
Shea
r (lb
.)
TEST 4-B
0
20000
40000
60000
80000
100000
120000
0.00 0.10 0.20 0.30 0.40 0.50Displacement (in.)
Shea
r (lb
.)
TEST 4-C
0
20000
40000
60000
80000
100000
120000
0.00 0.05 0.10 0.15 0.20 0.25 0.30 0.35 0.40 0.45 0.50Displacement (in.)
Shea
r (lb
.)
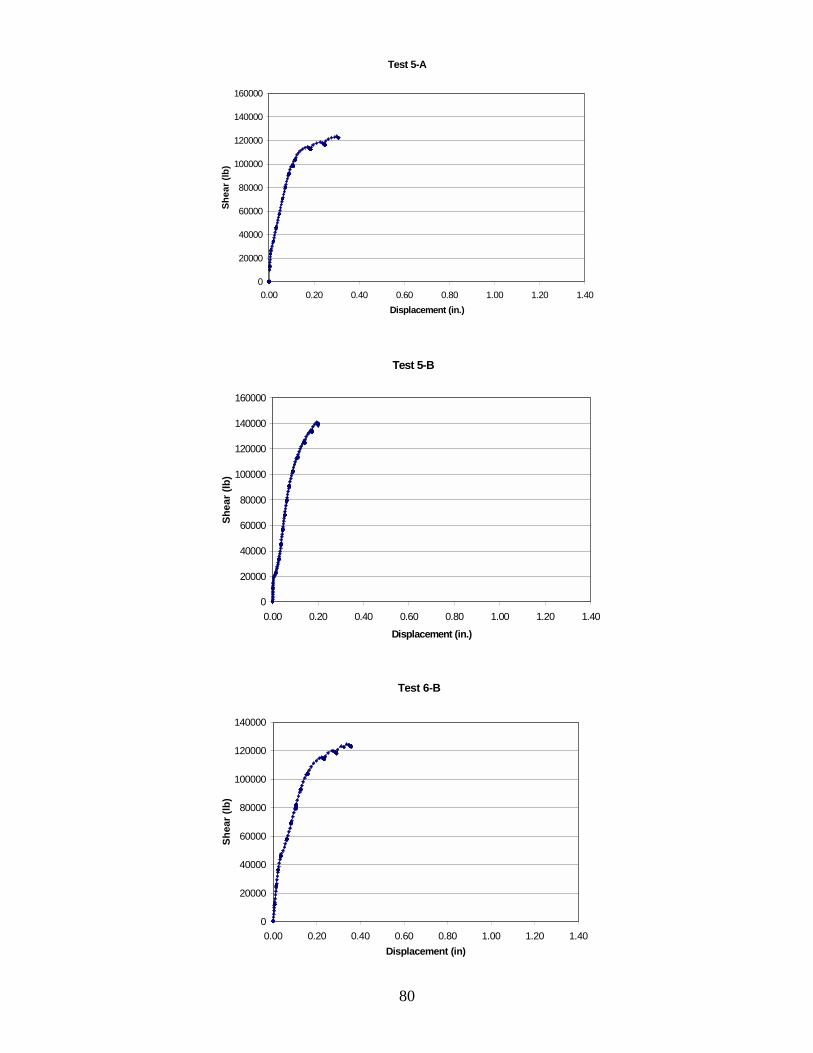
80
Test 5-A
0
20000
40000
60000
80000
100000
120000
140000
160000
0.00 0.20 0.40 0.60 0.80 1.00 1.20 1.40Displacement (in.)
Shea
r (lb
)
Test 5-B
0
20000
40000
60000
80000
100000
120000
140000
160000
0.00 0.20 0.40 0.60 0.80 1.00 1.20 1.40
Displacement (in.)
Shea
r (lb
)
Test 6-B
0
20000
40000
60000
80000
100000
120000
140000
0.00 0.20 0.40 0.60 0.80 1.00 1.20 1.40Displacement (in)
Shea
r (lb
)
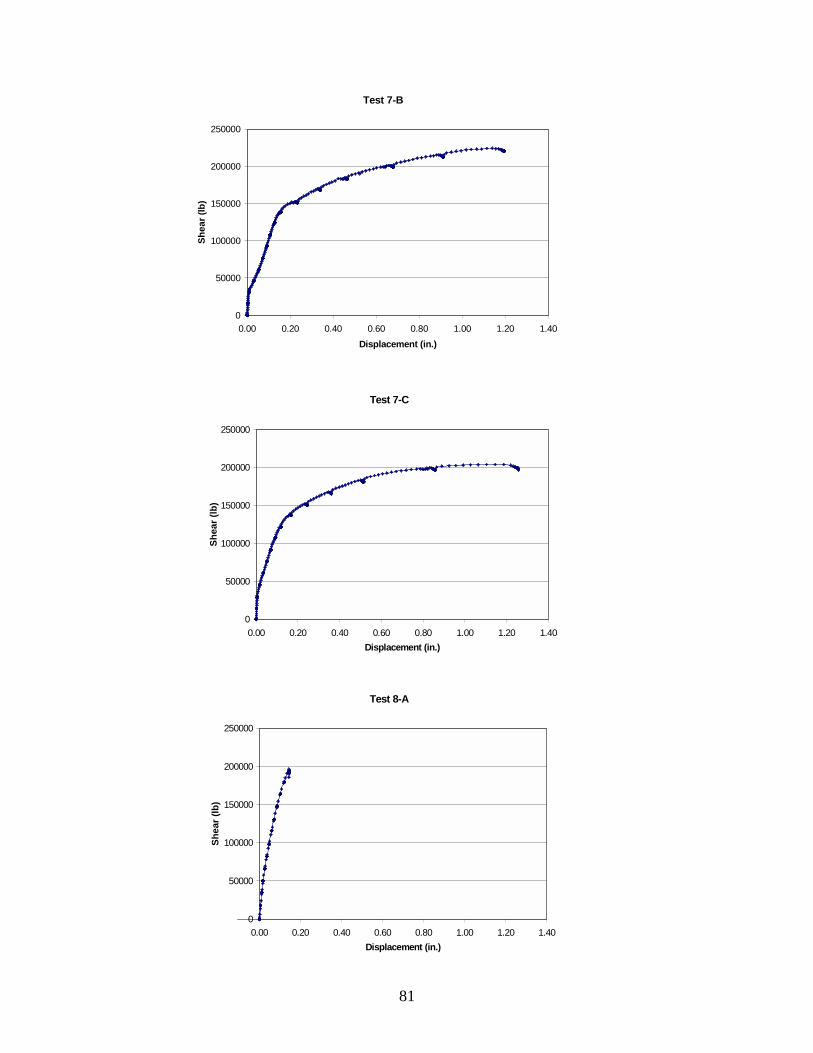
81
Test 7-B
0
50000
100000
150000
200000
250000
0.00 0.20 0.40 0.60 0.80 1.00 1.20 1.40Displacement (in.)
Shea
r (lb
)
Test 7-C
0
50000
100000
150000
200000
250000
0.00 0.20 0.40 0.60 0.80 1.00 1.20 1.40Displacement (in.)
Shea
r (lb
)
Test 8-A
0
50000
100000
150000
200000
250000
0.00 0.20 0.40 0.60 0.80 1.00 1.20 1.40Displacement (in.)
Shea
r (lb
)
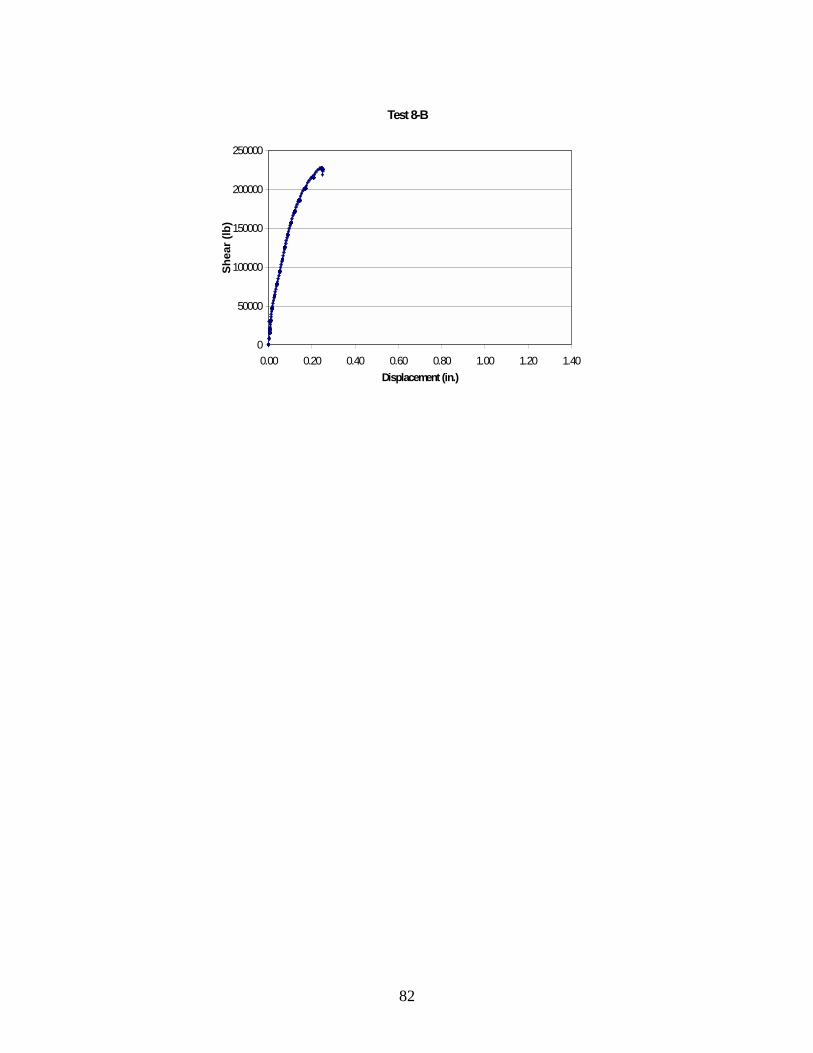
82
Test 8-B
0
50000
100000
150000
200000
250000
0.00 0.20 0.40 0.60 0.80 1.00 1.20 1.40Displacement (in.)
Shea
r (lb
)
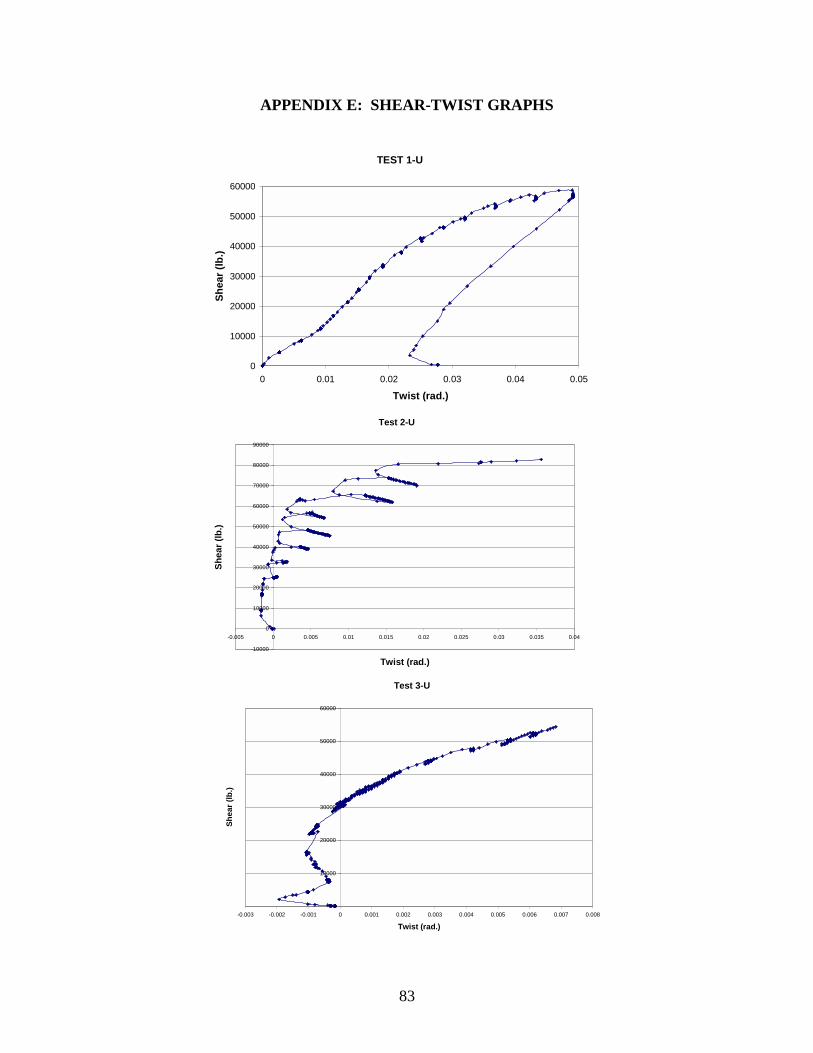
83
APPENDIX E: SHEAR-TWIST GRAPHS
TEST 1-U
0
10000
20000
30000
40000
50000
60000
0 0.01 0.02 0.03 0.04 0.05
Twist (rad.)
Shea
r (lb
.)
Test 2-U
-10000
0
10000
20000
30000
40000
50000
60000
70000
80000
90000
-0.005 0 0.005 0.01 0.015 0.02 0.025 0.03 0.035 0.04
Twist (rad.)
Shea
r (lb
.)
Test 3-U
0
10000
20000
30000
40000
50000
60000
-0.003 -0.002 -0.001 0 0.001 0.002 0.003 0.004 0.005 0.006 0.007 0.008
Twist (rad.)
Shea
r (lb
.)
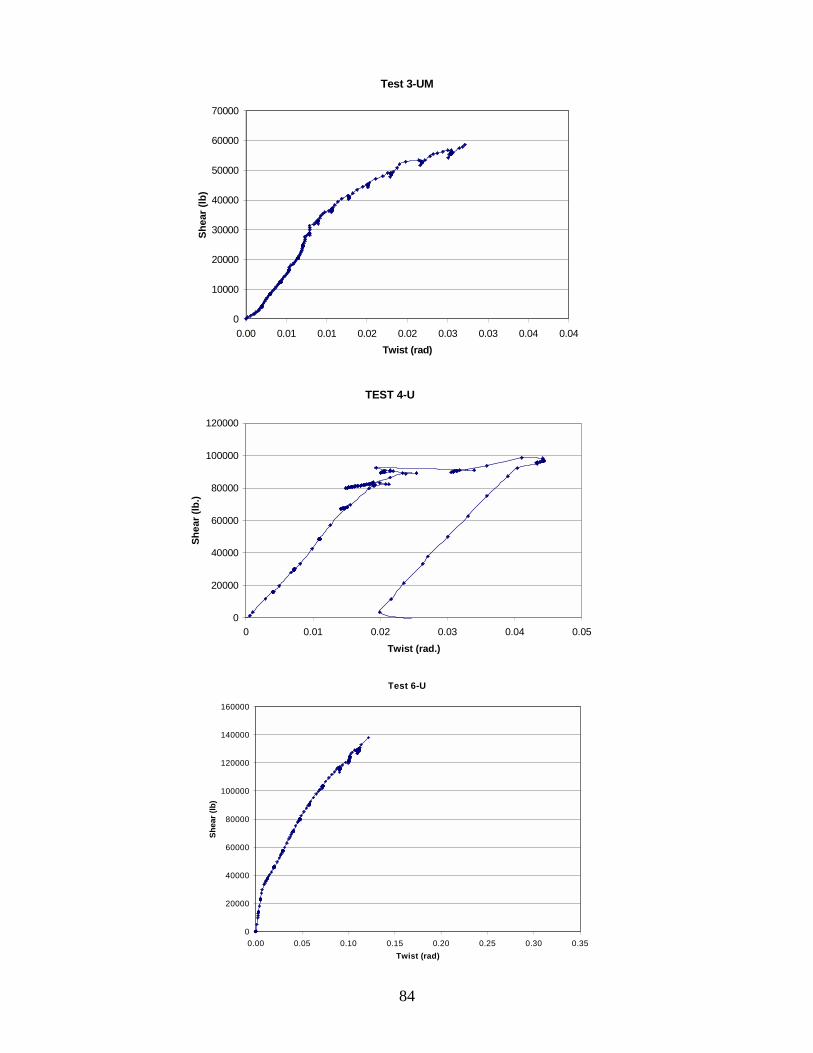
84
TEST 4-U
0
20000
40000
60000
80000
100000
120000
0 0.01 0.02 0.03 0.04 0.05Twist (rad.)
Shea
r (lb
.)
Test 3-UM
0
10000
20000
30000
40000
50000
60000
70000
0.00 0.01 0.01 0.02 0.02 0.03 0.03 0.04 0.04Twist (rad)
Shea
r (lb
)
Test 6-U
0
20000
40000
60000
80000
100000
120000
140000
160000
0.00 0.05 0.10 0.15 0.20 0.25 0.30 0.35Twist (rad)
Shea
r (lb
)
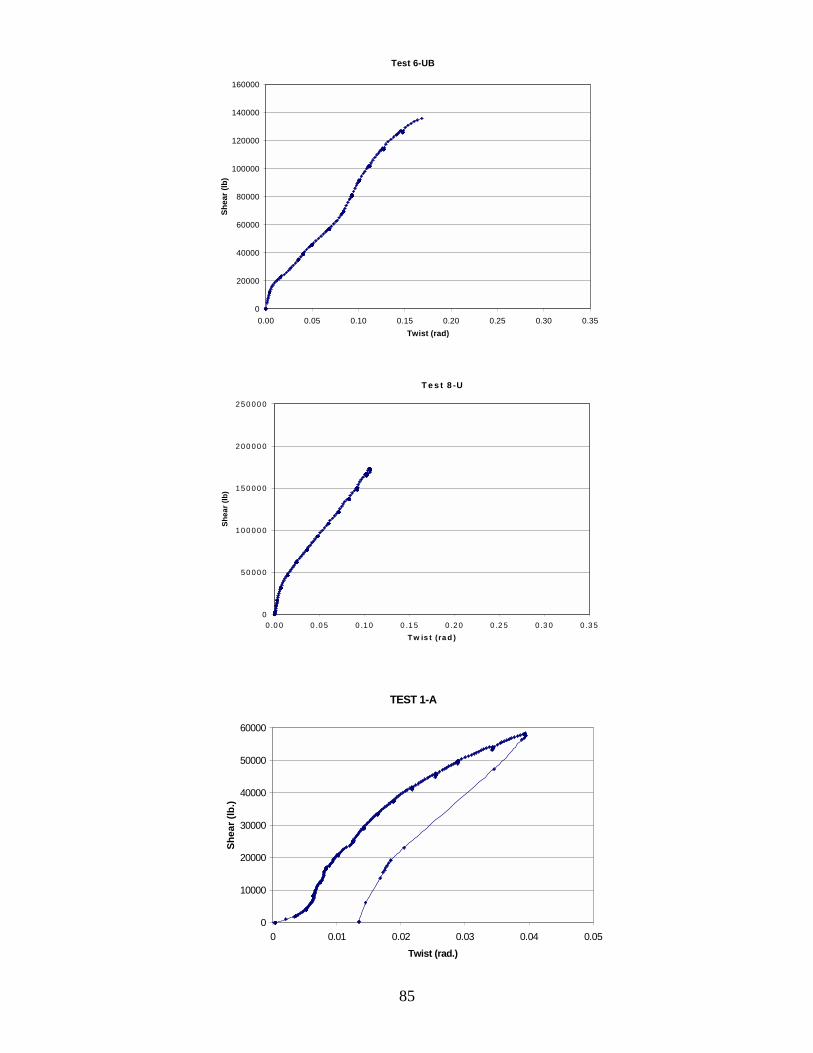
85
Test 6-UB
0
20000
40000
60000
80000
100000
120000
140000
160000
0.00 0.05 0.10 0.15 0.20 0.25 0.30 0.35Twist (rad)
Shea
r (lb
)
T e s t 8 -U
0
50 00 0
100 00 0
150 00 0
200 00 0
250 00 0
0 .0 0 0 .05 0 .10 0 .15 0 .20 0 .2 5 0 .3 0 0 .3 5T w is t (ra d )
Shea
r (lb
)
TEST 1-A
0
10000
20000
30000
40000
50000
60000
0 0.01 0.02 0.03 0.04 0.05Twist (rad.)
Shea
r (lb
.)
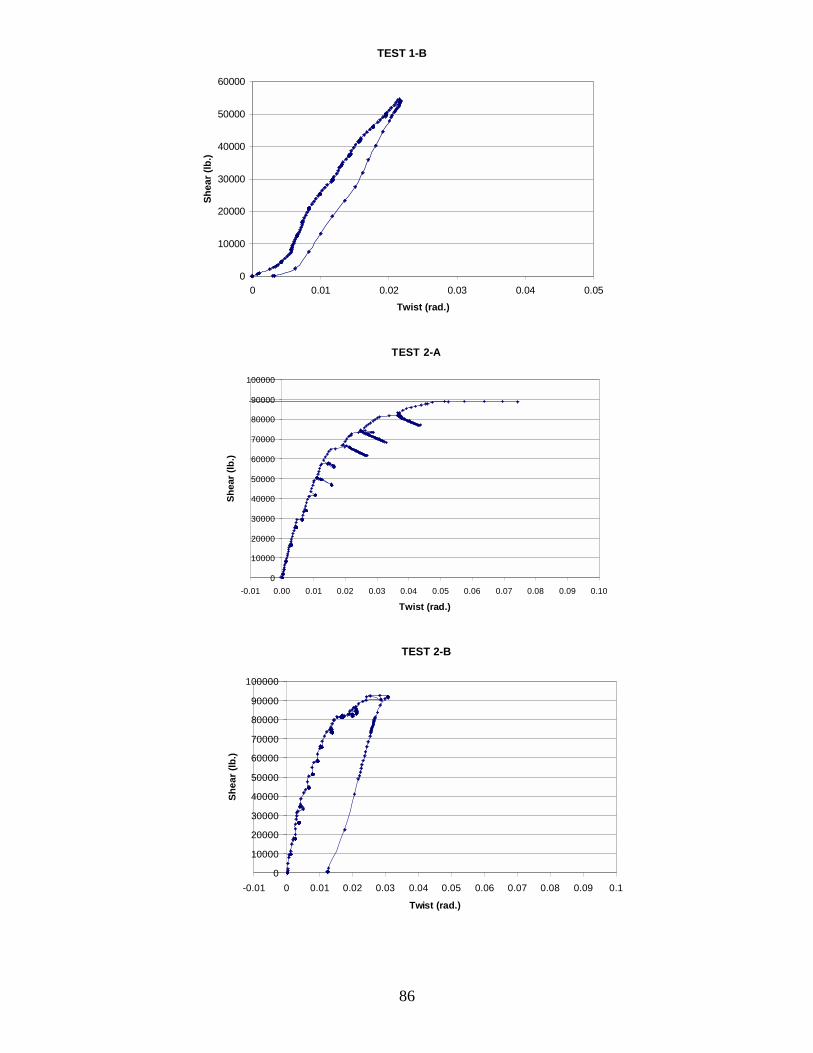
86
TEST 1-B
0
10000
20000
30000
40000
50000
60000
0 0.01 0.02 0.03 0.04 0.05Twist (rad.)
Shea
r (lb
.)
TEST 2-A
0
10000
20000
30000
40000
50000
60000
70000
80000
90000
100000
-0.01 0.00 0.01 0.02 0.03 0.04 0.05 0.06 0.07 0.08 0.09 0.10
Twist (rad.)
Shea
r (lb
.)
TEST 2-B
0
10000
20000
30000
40000
50000
60000
70000
80000
90000
100000
-0.01 0 0.01 0.02 0.03 0.04 0.05 0.06 0.07 0.08 0.09 0.1
Twist (rad.)
Shea
r (lb
.)

87
TEST 2-C
0
10000
20000
30000
40000
50000
60000
70000
80000
90000
100000
-0.01 0.01 0.03 0.05 0.07 0.09Twist (rad.)
Shea
r (lb
.)
TEST 3-A
0
10000
20000
30000
40000
50000
60000
0 0.01 0.02 0.03 0.04 0.05 0.06 0.07Twist (rad.)
Shea
r (lb
.)
TEST 3-B
0
10000
20000
30000
40000
50000
60000
0 0.01 0.02 0.03 0.04 0.05 0.06 0.07
Twist (rad.)
Shea
r (in
.)
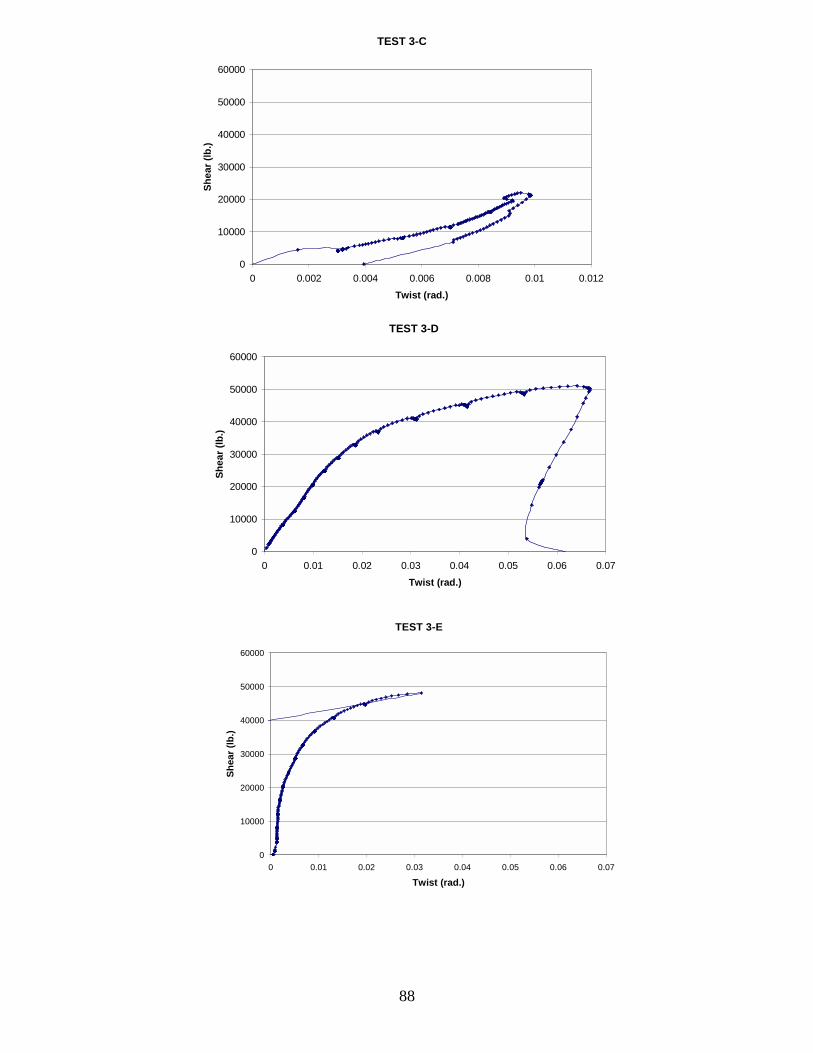
88
TEST 3-C
0
10000
20000
30000
40000
50000
60000
0 0.002 0.004 0.006 0.008 0.01 0.012Twist (rad.)
Shea
r (lb
.)
TEST 3-D
0
10000
20000
30000
40000
50000
60000
0 0.01 0.02 0.03 0.04 0.05 0.06 0.07Twist (rad.)
Shea
r (lb
.)
TEST 3-E
0
10000
20000
30000
40000
50000
60000
0 0.01 0.02 0.03 0.04 0.05 0.06 0.07
Twist (rad.)
Shea
r (lb
.)

89
Test 3-F
0
10000
20000
30000
40000
50000
60000
70000
80000
90000
0.00 0.01 0.01 0.02 0.02 0.03 0.03Twist (rad)
Shea
r (lb
)
Test 3-G
0
10000
20000
30000
40000
50000
60000
70000
0 0.005 0.01 0.015 0.02 0.025 0.03 0.035 0.04Twist (rad)
Shea
r (lb
)
Test 3-H
0
10000
20000
30000
40000
50000
60000
70000
0.00 0.01 0.01 0.02 0.02 0.03 0.03 0.04 0.04Twist (rad)
Shea
r (lb
)
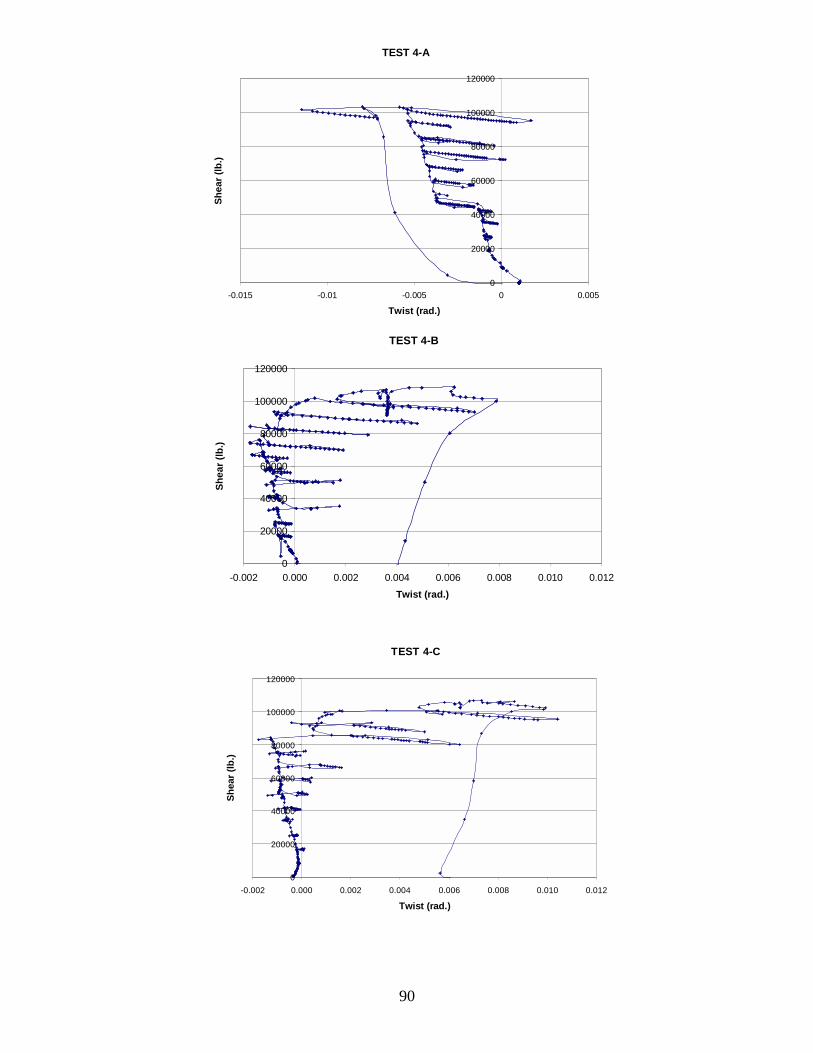
90
TEST 4-A
0
20000
40000
60000
80000
100000
120000
-0.015 -0.01 -0.005 0 0.005
Twist (rad.)
Shea
r (lb
.)
TEST 4-B
0
20000
40000
60000
80000
100000
120000
-0.002 0.000 0.002 0.004 0.006 0.008 0.010 0.012Twist (rad.)
Shea
r (lb
.)
TEST 4-C
0
20000
40000
60000
80000
100000
120000
-0.002 0.000 0.002 0.004 0.006 0.008 0.010 0.012
Twist (rad.)
Shea
r (lb
.)

91
Test 5-B
0
20000
40000
60000
80000
100000
120000
140000
160000
0.00 0.05 0.10 0.15 0.20 0.25 0.30 0.35Tw ist (rad)
Shea
r (lb
)
Test 5-A
0
20000
40000
60000
80000
100000
120000
140000
160000
0.00 0.05 0.10 0.15 0.20 0.25 0.30 0.35Twist (rad)
Shea
r (lb
)
Test 6-B
0
20000
40000
60000
80000
100000
120000
140000
160000
0.00 0.05 0.10 0.15 0.20 0.25 0.30 0.35Twist (rad)
Shea
r (lb
)
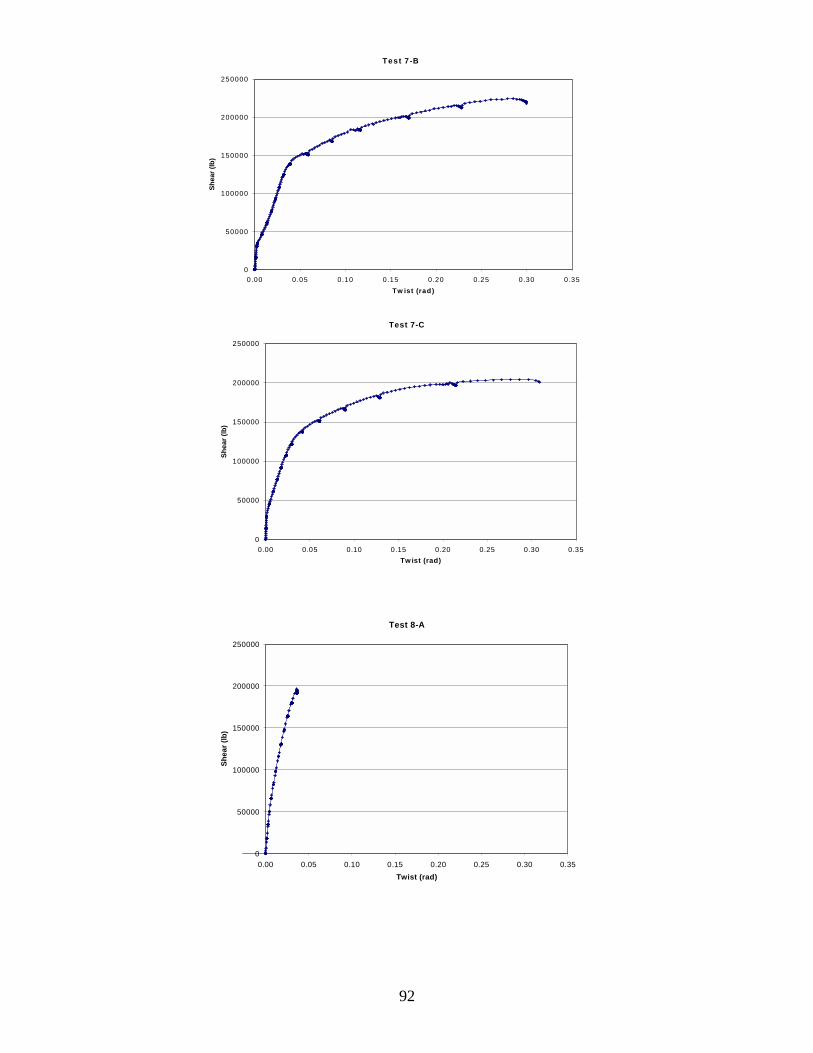
92
Test 8-A
0
50000
100000
150000
200000
250000
0.00 0.05 0.10 0.15 0.20 0.25 0.30 0.35Twist (rad)
Shea
r (lb
)
Test 7 -B
0
50000
100000
150000
200000
250000
0.00 0.05 0.10 0.15 0.20 0.25 0.30 0.35Tw ist (rad)
Shea
r (lb
)
Test 7-C
0
50000
100000
150000
200000
250000
0.00 0.05 0.10 0.15 0.20 0.25 0.30 0.35Tw ist (rad)
Shea
r (lb
)

93
Test 8-B
0
50000
100000
150000
200000
250000
0.00 0.05 0.10 0.15 0.20 0.25 0.30 0.35Twist (rad)
Shea
r (lb
)

94
APPENDIX F: SHEAR-ROTATION GRAPHS
*NOTE: Tiltmeter mounted to column flange gives unrealistic web rotation for this test.
TEST 1-U
0
10000
20000
30000
40000
50000
60000
0 1 2 3 4 5 6 7 8 9 10
Rotation (deg.)
Shea
r (lb
.)
Supported BeamGirder Web
TEST 2-U
0
10000
20000
30000
40000
50000
60000
70000
80000
90000
100000
0 0.5 1 1.5 2 2.5 3 3.5 4
Rotation (deg.)
Shea
r (lb
.)
Suppoted BeamGirder Web
TEST 3-U
0
10000
20000
30000
40000
50000
60000
0 0.1 0.2 0.3 0.4 0.5 0.6 0.7 0.8 0.9 1
Rotation (deg.)
Shea
r (lb
.)
Supported BeamCol. Flange
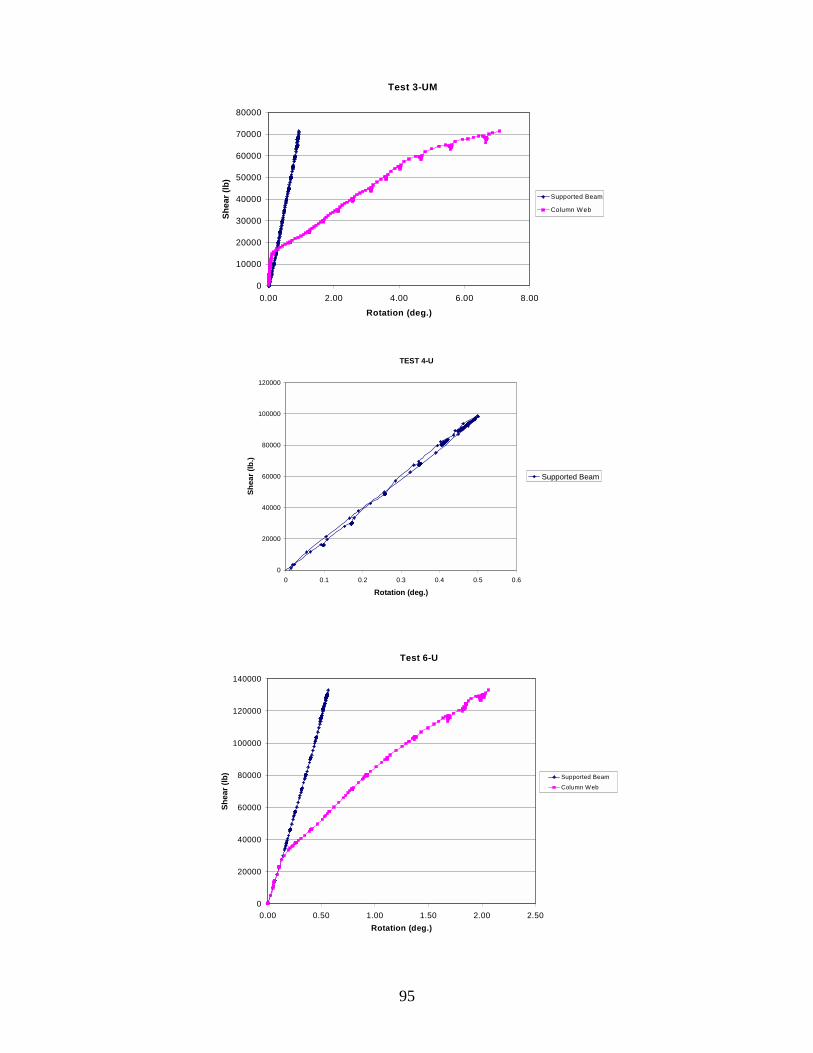
95
Test 3-UM
0
10000
20000
30000
40000
50000
60000
70000
80000
0.00 2.00 4.00 6.00 8.00Rotation (deg.)
Shea
r (lb
)
Supported Beam
Column Web
TEST 4-U
0
20000
40000
60000
80000
100000
120000
0 0.1 0.2 0.3 0.4 0.5 0.6
Rotation (deg.)
Shea
r (lb
.)
Supported Beam
Test 6-U
0
20000
40000
60000
80000
100000
120000
140000
0.00 0.50 1.00 1.50 2.00 2.50Rotation (deg.)
Shea
r (lb
) Supported Beam
Column Web

96
Test 6-UB
0
20000
40000
60000
80000
100000
120000
140000
160000
0.00 0.50 1.00 1.50 2.00 2.50 3.00 3.50 4.00Rotation (deg.)
Shea
r (lb
)
Supported BeamColumn Web
Test 8-U
0
20000
40000
60000
80000
100000
120000
140000
160000
180000
200000
0.00 0.50 1.00 1.50 2.00Rotation (deg.)
Shea
r (lb
)
Supported BeamColumn Web
TEST 1-A
0
10000
20000
30000
40000
50000
60000
0 2 4 6 8 10
Rotation (deg.)
Shea
r (lb
.)
Supported BeamGirder web
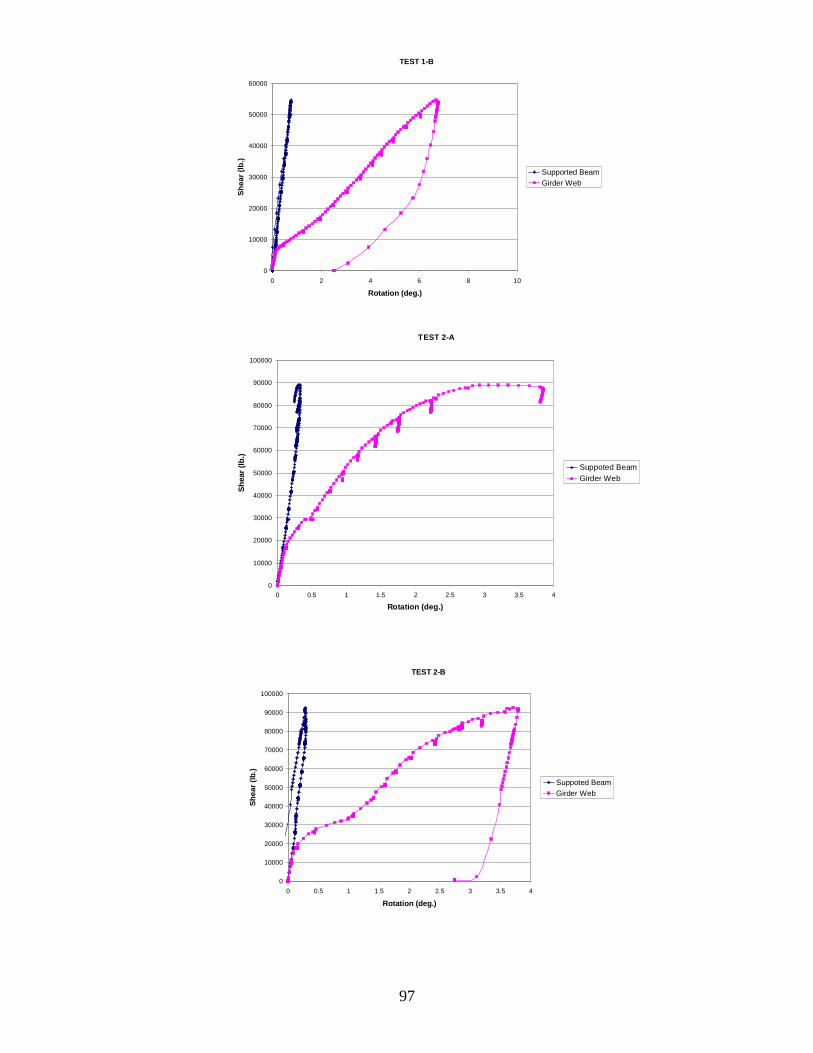
97
TEST 1-B
0
10000
20000
30000
40000
50000
60000
0 2 4 6 8 10
Rotation (deg.)
Shea
r (lb
.)
Supported BeamGirder Web
TEST 2-A
0
10000
20000
30000
40000
50000
60000
70000
80000
90000
100000
0 0.5 1 1.5 2 2.5 3 3.5 4
Rotation (deg.)
Shea
r (lb
.)
Suppoted BeamGirder Web
TEST 2-B
0
10000
20000
30000
40000
50000
60000
70000
80000
90000
100000
0 0.5 1 1.5 2 2.5 3 3.5 4
Rotation (deg.)
Shea
r (lb
.)
Suppoted BeamGirder Web
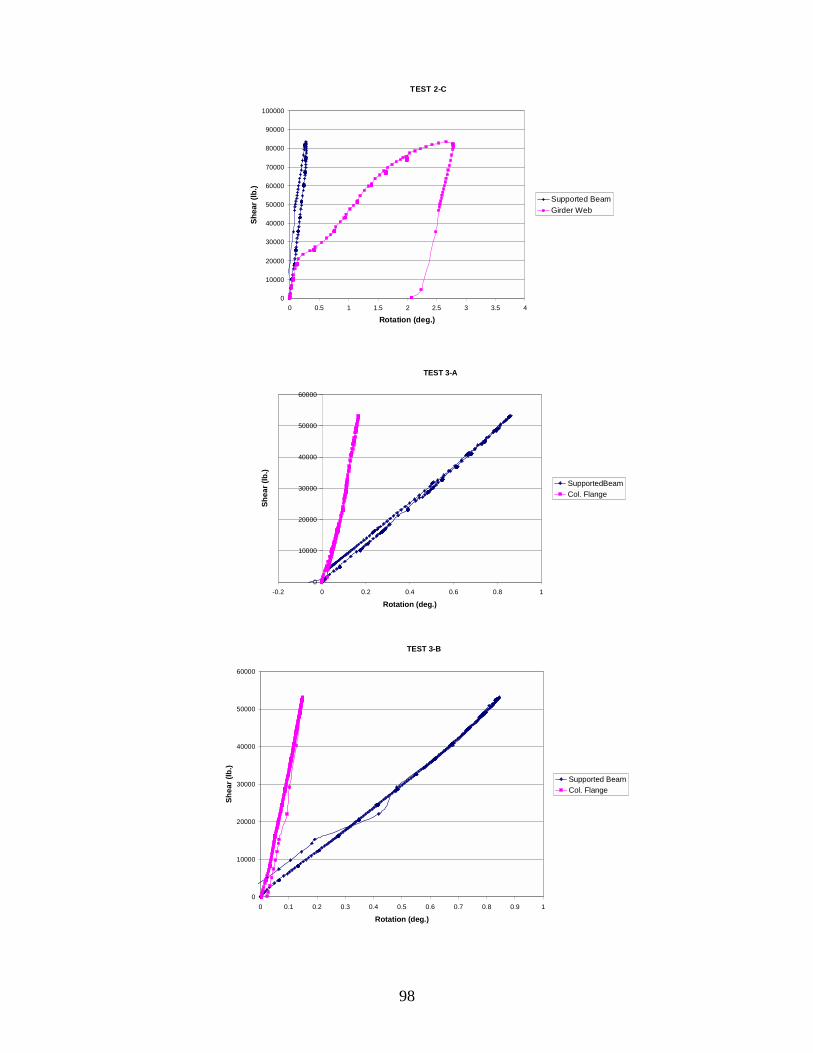
98
TEST 2-C
0
10000
20000
30000
40000
50000
60000
70000
80000
90000
100000
0 0.5 1 1.5 2 2.5 3 3.5 4
Rotation (deg.)
Shea
r (lb
.)
Supported BeamGirder Web
TEST 3-A
0
10000
20000
30000
40000
50000
60000
-0.2 0 0.2 0.4 0.6 0.8 1
Rotation (deg.)
Shea
r (lb
.)
SupportedBeamCol. Flange
TEST 3-B
0
10000
20000
30000
40000
50000
60000
0 0.1 0.2 0.3 0.4 0.5 0.6 0.7 0.8 0.9 1
Rotation (deg.)
Shea
r (lb
.)
Supported BeamCol. Flange
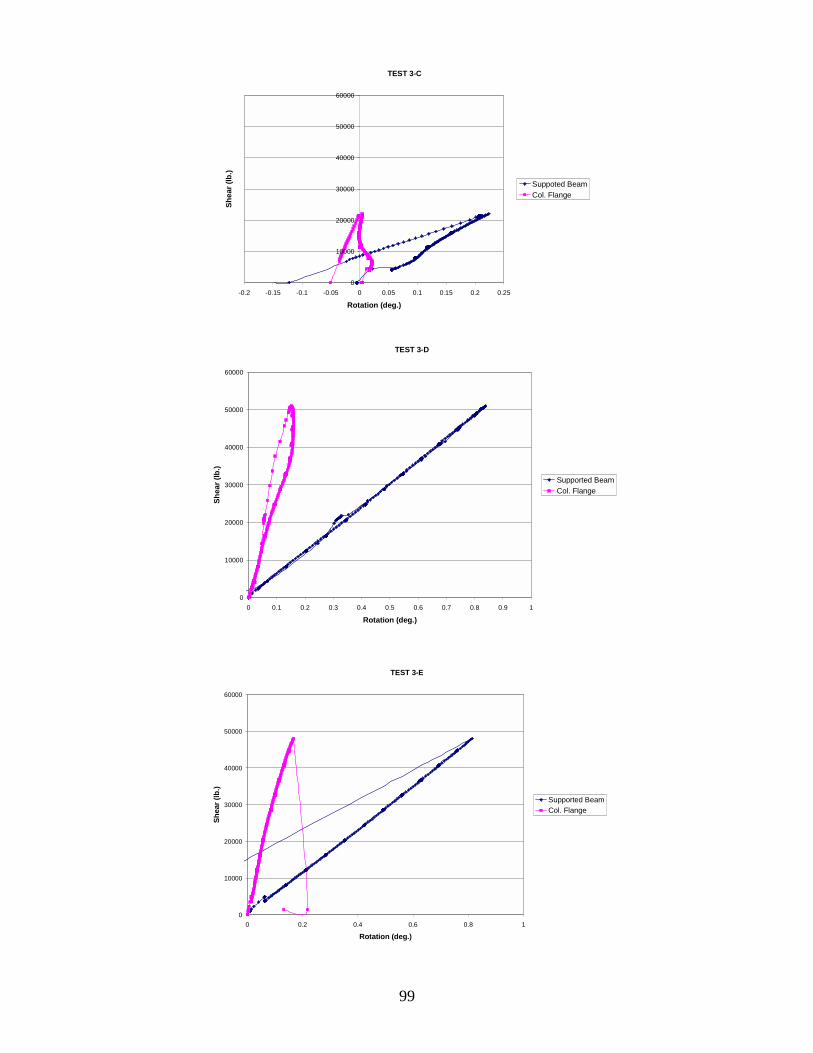
99
TEST 3-C
0
10000
20000
30000
40000
50000
60000
-0.2 -0.15 -0.1 -0.05 0 0.05 0.1 0.15 0.2 0.25
Rotation (deg.)
Shea
r (lb
.)
Suppoted BeamCol. Flange
TEST 3-D
0
10000
20000
30000
40000
50000
60000
0 0.1 0.2 0.3 0.4 0.5 0.6 0.7 0.8 0.9 1
Rotation (deg.)
Shea
r (lb
.)
Supported BeamCol. Flange
TEST 3-E
0
10000
20000
30000
40000
50000
60000
0 0.2 0.4 0.6 0.8 1
Rotation (deg.)
Shea
r (lb
.)
Supported BeamCol. Flange
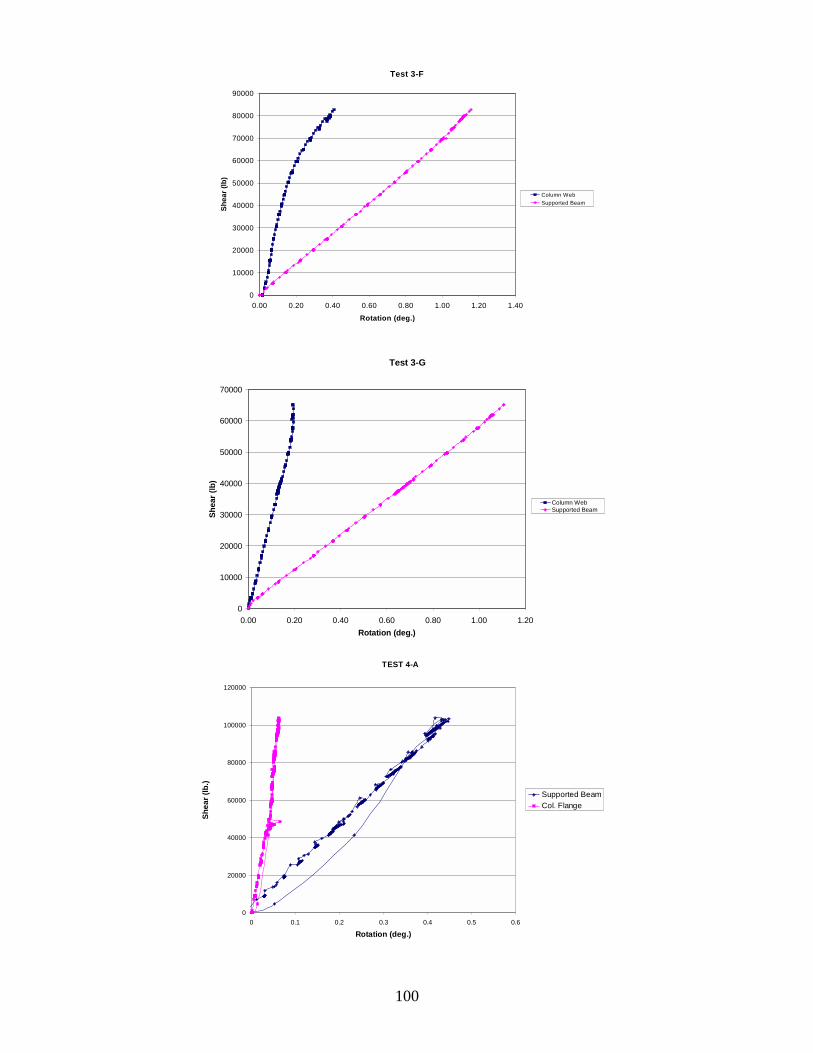
100
Test 3-F
0
10000
20000
30000
40000
50000
60000
70000
80000
90000
0.00 0.20 0.40 0.60 0.80 1.00 1.20 1.40
Rotation (deg.)
Shea
r (lb
)
Column WebSupported Beam
Test 3-G
0
10000
20000
30000
40000
50000
60000
70000
0.00 0.20 0.40 0.60 0.80 1.00 1.20Rotation (deg.)
Shea
r (lb
)
Column WebSupported Beam
TEST 4-A
0
20000
40000
60000
80000
100000
120000
0 0.1 0.2 0.3 0.4 0.5 0.6
Rotation (deg.)
Shea
r (lb
.)
Supported BeamCol. Flange
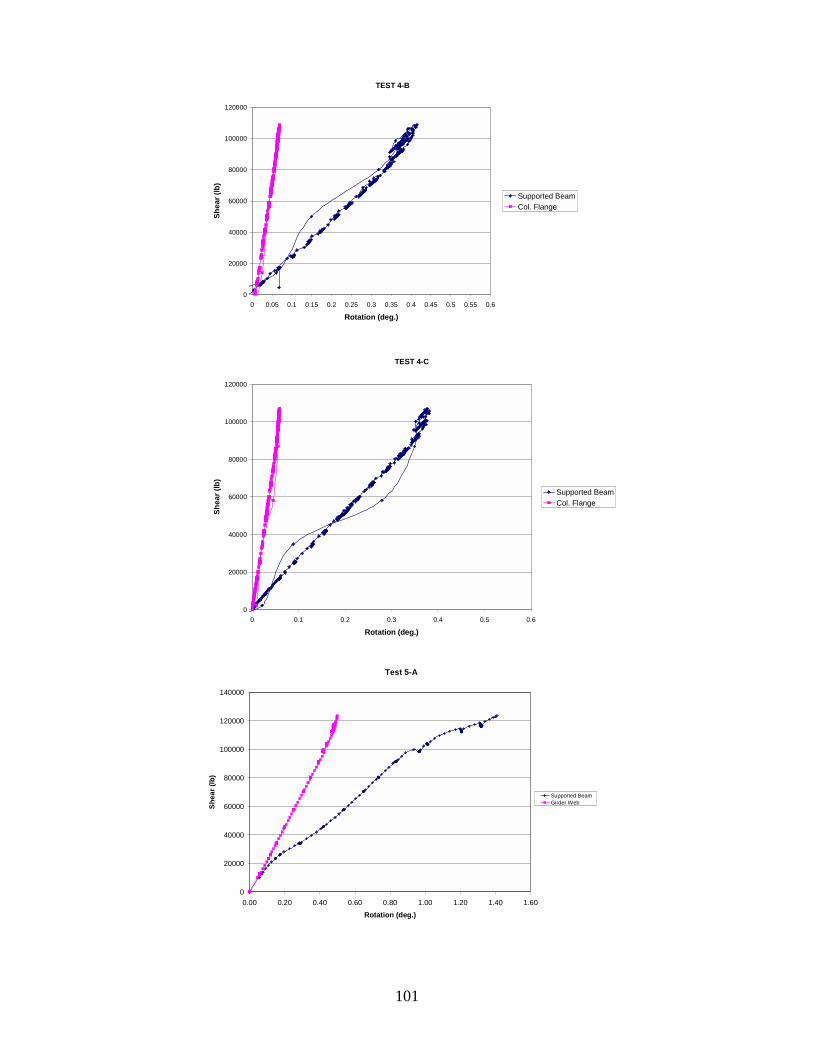
101
TEST 4-B
0
20000
40000
60000
80000
100000
120000
0 0.05 0.1 0.15 0.2 0.25 0.3 0.35 0.4 0.45 0.5 0.55 0.6
Rotation (deg.)
Shea
r (lb
)
Supported BeamCol. Flange
TEST 4-C
0
20000
40000
60000
80000
100000
120000
0 0.1 0.2 0.3 0.4 0.5 0.6
Rotation (deg.)
Shea
r (lb
)
Supported BeamCol. Flange
Test 5-A
0
20000
40000
60000
80000
100000
120000
140000
0.00 0.20 0.40 0.60 0.80 1.00 1.20 1.40 1.60Rotation (deg.)
Shea
r (lb
)
Supported BeamGirder Web
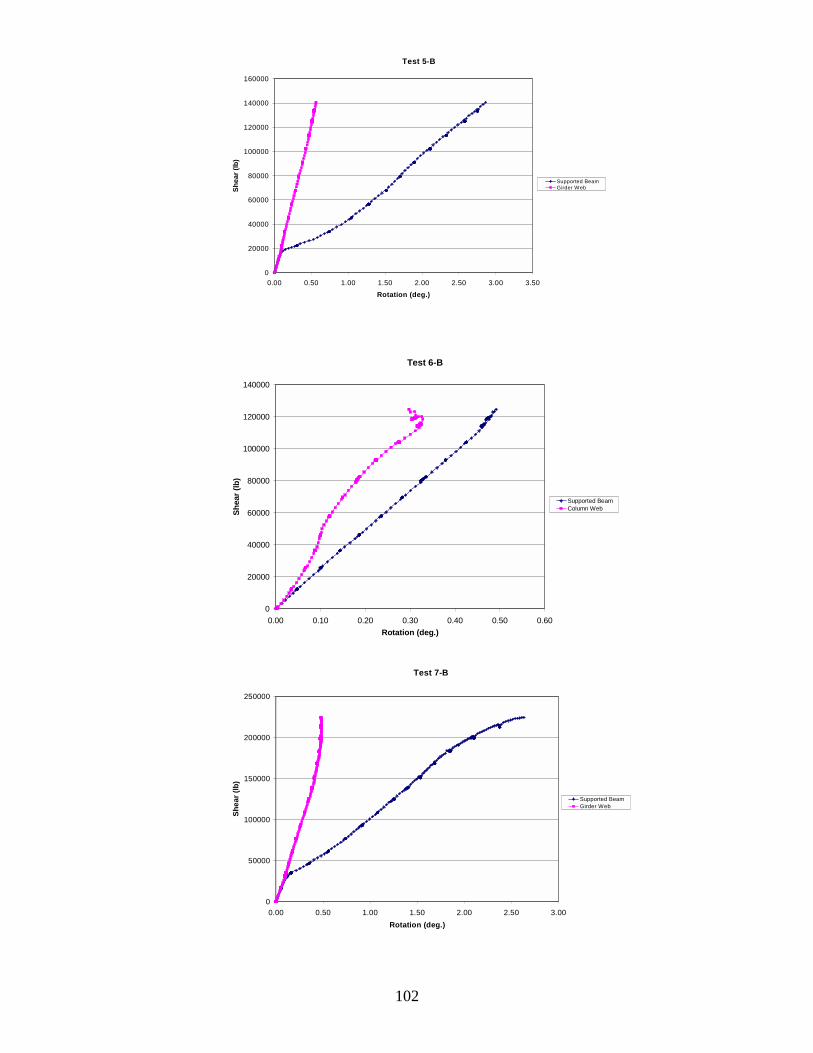
102
Test 5-B
0
20000
40000
60000
80000
100000
120000
140000
160000
0.00 0.50 1.00 1.50 2.00 2.50 3.00 3.50Rotation (deg.)
Shea
r (lb
)
Supported BeamGirder Web
Test 6-B
0
20000
40000
60000
80000
100000
120000
140000
0.00 0.10 0.20 0.30 0.40 0.50 0.60Rotation (deg.)
Shea
r (lb
)
Supported BeamColumn Web
Test 7-B
0
50000
100000
150000
200000
250000
0.00 0.50 1.00 1.50 2.00 2.50 3.00Rotation (deg.)
Shea
r (lb
)
Supported BeamGirder Web

103
Test 7-C
0
50000
100000
150000
200000
250000
0.00 0.50 1.00 1.50 2.00 2.50Rotation (deg.)
Shea
r (lb
)
Supported BeamGirder Web
Test 8-A
0
50000
100000
150000
200000
250000
0.00 0.05 0.10 0.15 0.20 0.25 0.30 0.35 0.40Rotation (deg.)
Shea
r (lb
)
Supported BeamColumn Web
Test 8-B
0
50000
100000
150000
200000
250000
0.00 0.05 0.10 0.15 0.20 0.25 0.30 0.35 0.40 0.45Rotation (deg.)
Shea
r (lb
)
Supported BeamColumn Web

104
A graph for Test 3-H does not appear in this section because the tiltmeter on the back of the column malfunctioned during the test and data for rotation of the column web does not exist.
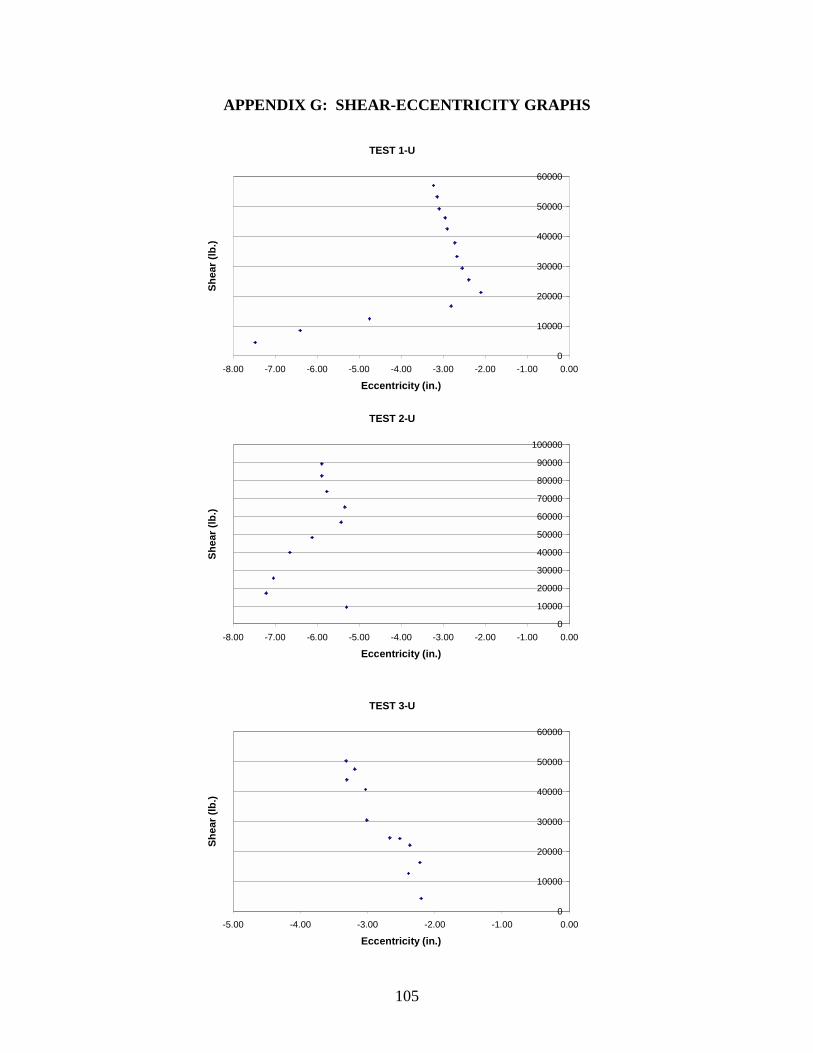
105
APPENDIX G: SHEAR-ECCENTRICITY GRAPHS
TEST 1-U
0
10000
20000
30000
40000
50000
60000
-8.00 -7.00 -6.00 -5.00 -4.00 -3.00 -2.00 -1.00 0.00
Eccentricity (in.)
Shea
r (lb
.)
TEST 2-U
0
10000
20000
30000
40000
50000
60000
70000
80000
90000
100000
-8.00 -7.00 -6.00 -5.00 -4.00 -3.00 -2.00 -1.00 0.00
Eccentricity (in.)
Shea
r (lb
.)
TEST 3-U
0
10000
20000
30000
40000
50000
60000
-5.00 -4.00 -3.00 -2.00 -1.00 0.00
Eccentricity (in.)
Shea
r (lb
.)

106
Test 3-UM
0
10000
20000
30000
40000
50000
60000
70000
-6 -5 -4 -3 -2 -1 0
Eccentricity (in.)
Shea
r (lb
)
TEST 4-U
0
20000
40000
60000
80000
100000
120000
-8 -7 -6 -5 -4 -3 -2 -1 0
Eccentricity (in.)
Shea
r (lb
.)
Test 6-U
0
20000
40000
60000
80000
100000
120000
140000
-6 -5 -4 -3 -2 -1 0Eccentricity (in)
Shea
r (lb
)
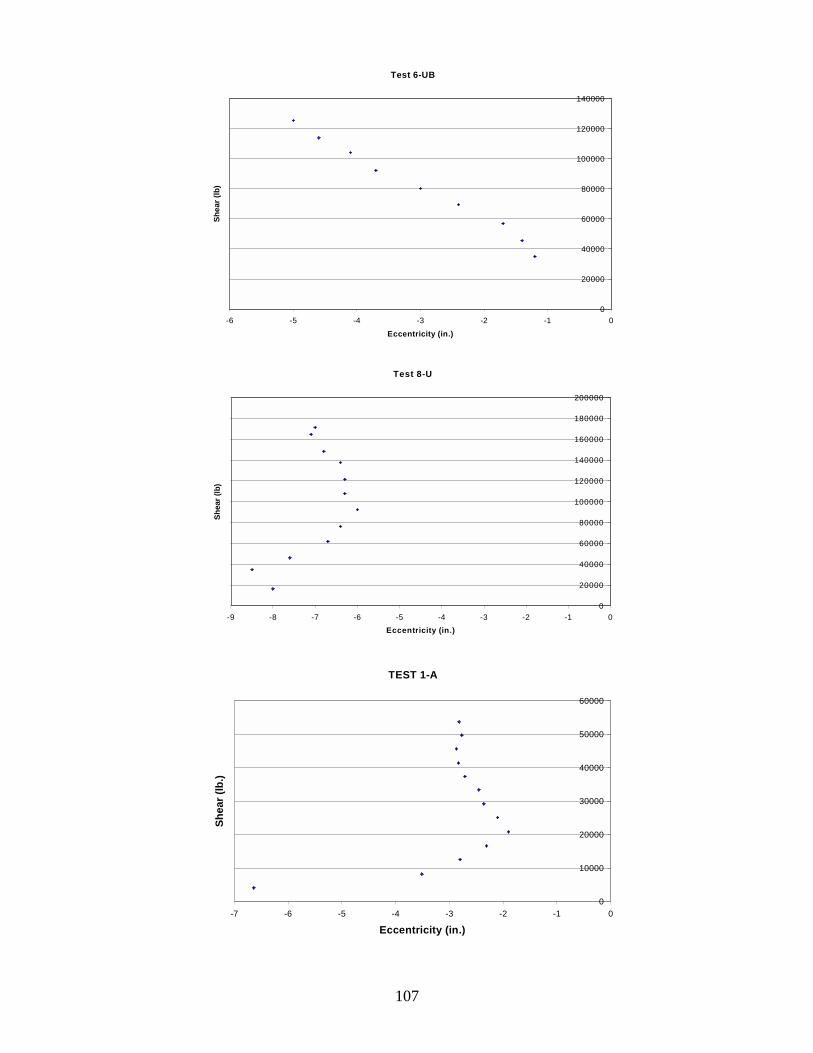
107
Test 6-UB
0
20000
40000
60000
80000
100000
120000
140000
-6 -5 -4 -3 -2 -1 0Eccentricity (in.)
Shea
r (lb
)
Test 8-U
0
20000
40000
60000
80000
100000
120000
140000
160000
180000
200000
-9 -8 -7 -6 -5 -4 -3 -2 -1 0Eccentricity (in.)
Shea
r (lb
)
TEST 1-A
0
10000
20000
30000
40000
50000
60000
-7 -6 -5 -4 -3 -2 -1 0
Eccentricity (in.)
Shea
r (lb
.)

108
TEST 1-B
0
10000
20000
30000
40000
50000
60000
-7 -6 -5 -4 -3 -2 -1 0
Eccentricity (in.)
Shea
r (lb
.)
TEST 2-A
0
10000
20000
30000
40000
50000
60000
70000
80000
90000
-9 -8 -7 -6 -5 -4 -3 -2 -1 0
Eccentricity (in.)
Shea
r (lb
.)
TEST 2-B
0
10000
20000
30000
40000
50000
60000
70000
80000
90000
100000
-8 -7 -6 -5 -4 -3 -2 -1 0
Eccentricity (in.)
Shea
r (lb
.)
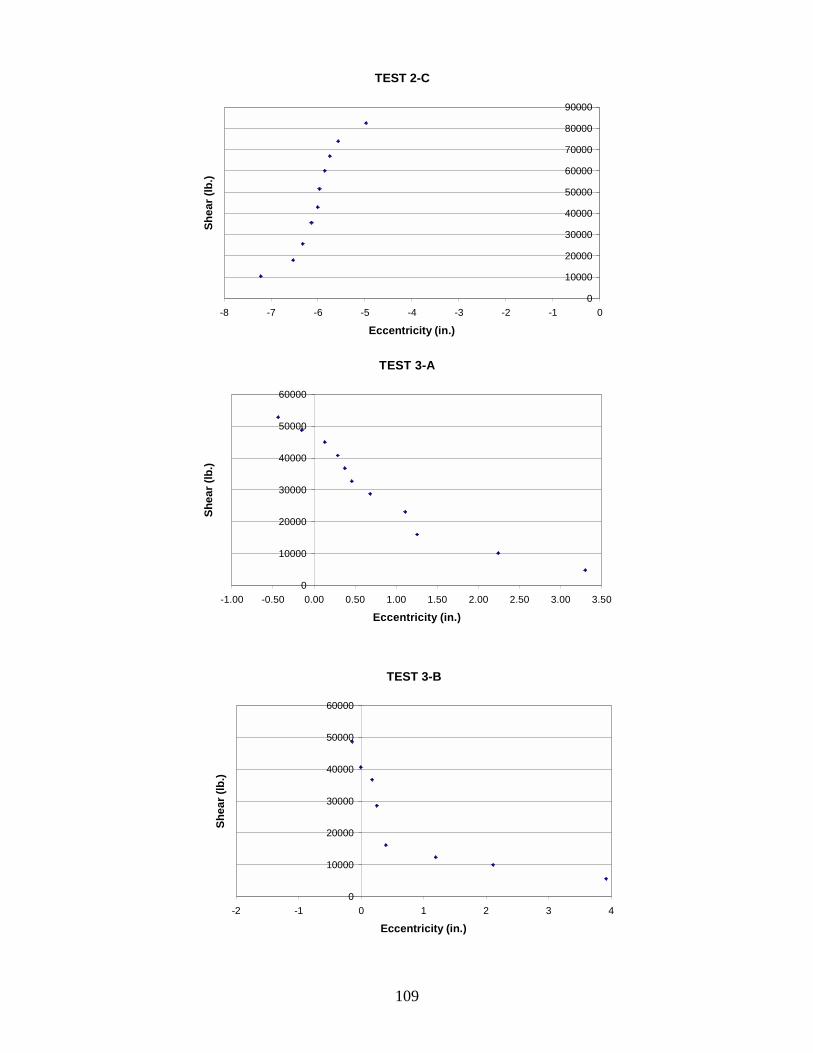
109
TEST 2-C
0
10000
20000
30000
40000
50000
60000
70000
80000
90000
-8 -7 -6 -5 -4 -3 -2 -1 0
Eccentricity (in.)
Shea
r (lb
.)
TEST 3-A
0
10000
20000
30000
40000
50000
60000
-1.00 -0.50 0.00 0.50 1.00 1.50 2.00 2.50 3.00 3.50
Eccentricity (in.)
Shea
r (lb
.)
TEST 3-B
0
10000
20000
30000
40000
50000
60000
-2 -1 0 1 2 3 4
Eccentricity (in.)
Shea
r (lb
.)
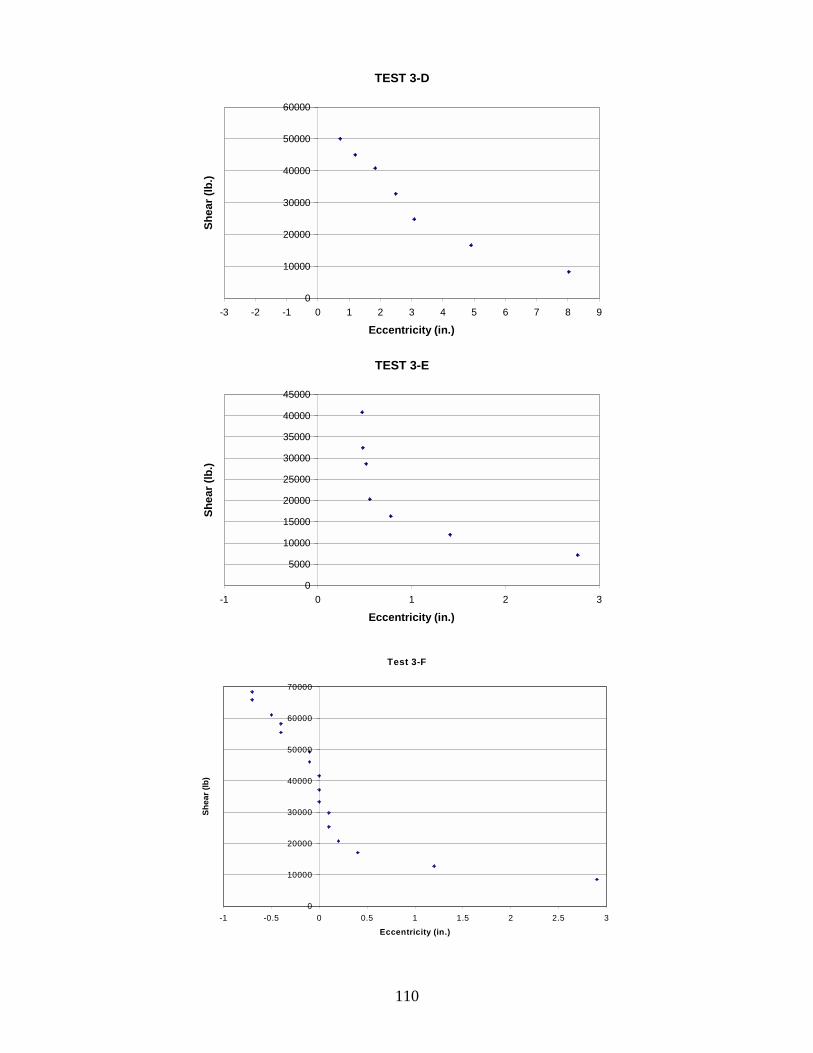
110
TEST 3-D
0
10000
20000
30000
40000
50000
60000
-3 -2 -1 0 1 2 3 4 5 6 7 8 9
Eccentricity (in.)
Shea
r (lb
.)
TEST 3-E
0
5000
10000
15000
20000
25000
30000
35000
40000
45000
-1 0 1 2 3
Eccentricity (in.)
Shea
r (lb
.)
Test 3-F
0
10000
20000
30000
40000
50000
60000
70000
-1 -0.5 0 0.5 1 1.5 2 2.5 3Eccentricity (in.)
Shea
r (lb
)
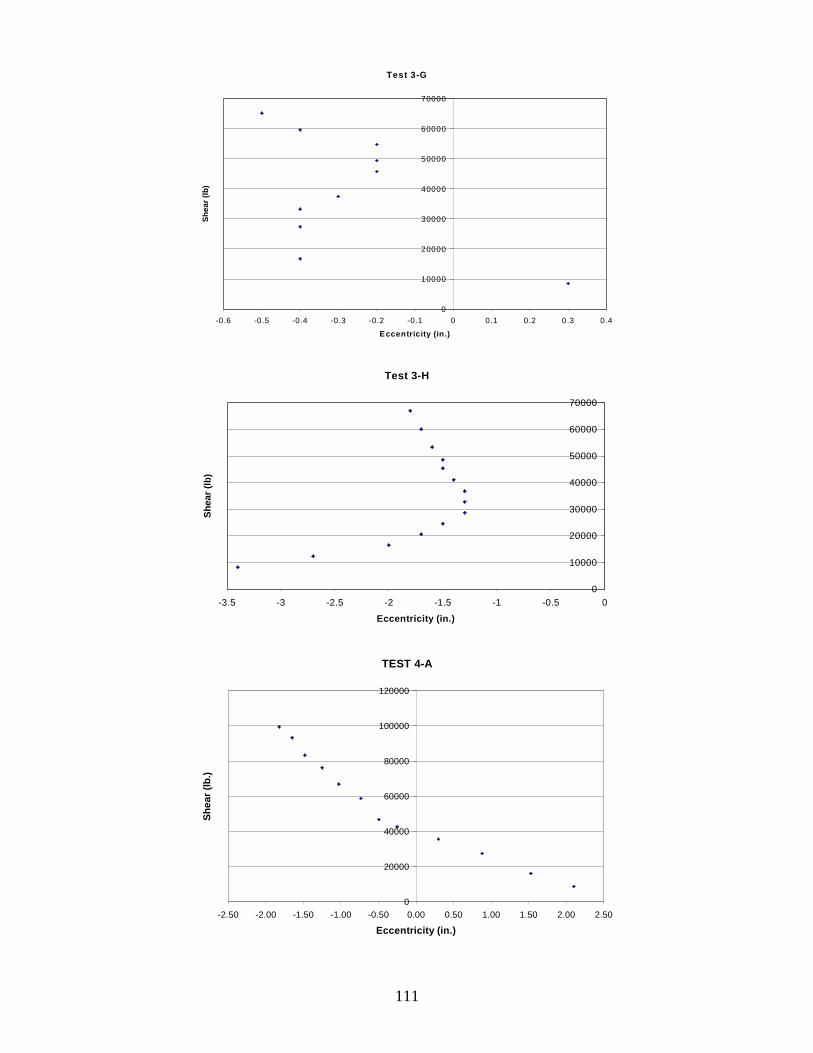
111
Test 3-G
0
10000
20000
30000
40000
50000
60000
70000
-0.6 -0.5 -0.4 -0.3 -0.2 -0.1 0 0.1 0.2 0.3 0.4
Eccentricity (in.)
Shea
r (lb
)
Test 3-H
0
10000
20000
30000
40000
50000
60000
70000
-3.5 -3 -2.5 -2 -1.5 -1 -0.5 0
Eccentricity (in.)
Shea
r (lb
)
TEST 4-A
0
20000
40000
60000
80000
100000
120000
-2.50 -2.00 -1.50 -1.00 -0.50 0.00 0.50 1.00 1.50 2.00 2.50
Eccentricity (in.)
Shea
r (lb
.)
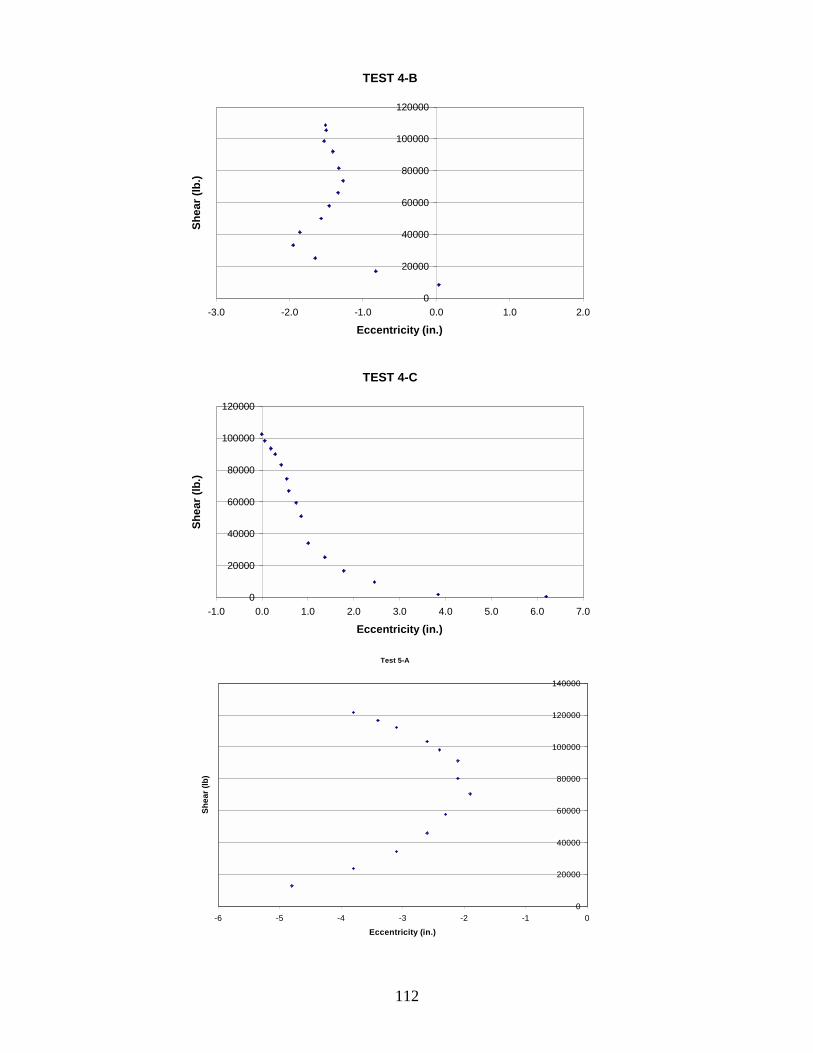
112
TEST 4-C
0
20000
40000
60000
80000
100000
120000
-1.0 0.0 1.0 2.0 3.0 4.0 5.0 6.0 7.0
Eccentricity (in.)
Shea
r (lb
.)
TEST 4-B
0
20000
40000
60000
80000
100000
120000
-3.0 -2.0 -1.0 0.0 1.0 2.0
Eccentricity (in.)
Shea
r (lb
.)
Test 5-A
0
20000
40000
60000
80000
100000
120000
140000
-6 -5 -4 -3 -2 -1 0Eccentricity (in.)
Shea
r (lb
)

113
Test 5-B
0
20000
40000
60000
80000
100000
120000
140000
160000
-10 -9 -8 -7 -6 -5 -4 -3 -2 -1 0Eccentricity (in.)
Shea
r (lb
)
Test 6-B
0
20000
40000
60000
80000
100000
120000
140000
-3 -1 1 3 5 7Eccentricity (in.)
Shea
r (lb
)
Test 7-B
0
50000
100000
150000
200000
250000
-10 -9 -8 -7 -6 -5 -4 -3 -2 -1 0Eccentricity (in.)
Shea
r (lb
)
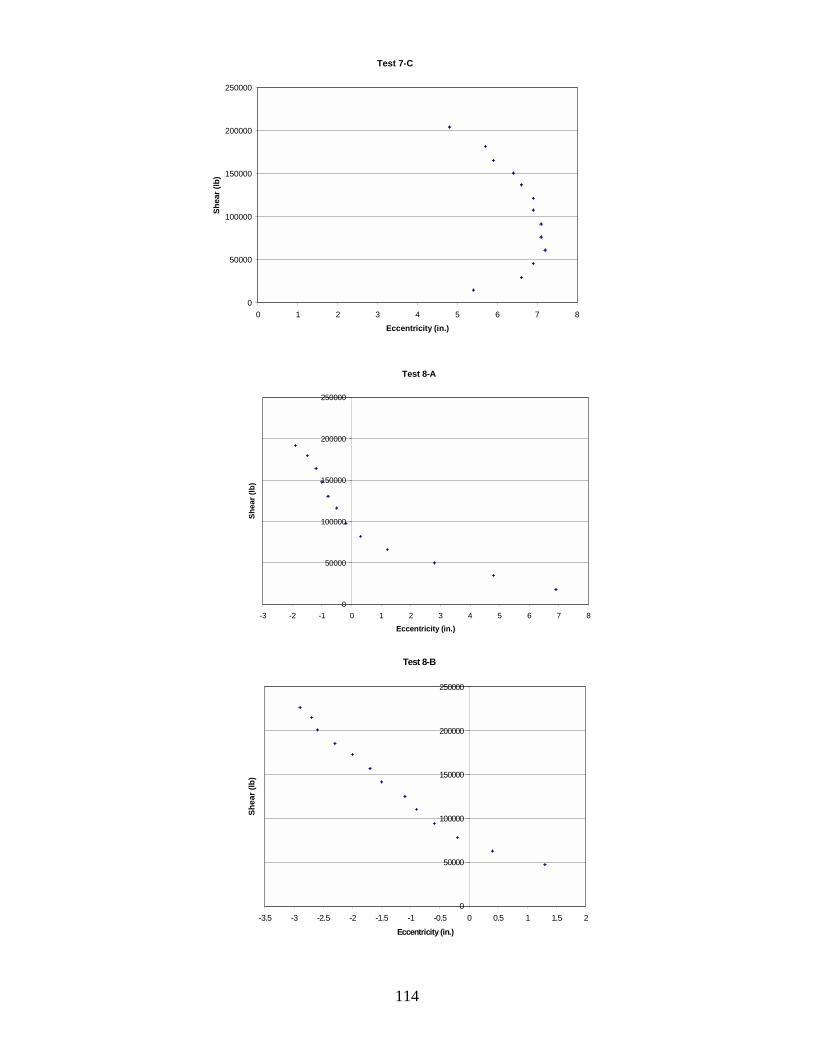
114
Test 7-C
0
50000
100000
150000
200000
250000
0 1 2 3 4 5 6 7 8Eccentricity (in.)
Shea
r (lb
)
Test 8-A
0
50000
100000
150000
200000
250000
-3 -2 -1 0 1 2 3 4 5 6 7 8Eccentricity (in.)
Shea
r (lb
)
Test 8-B
0
50000
100000
150000
200000
250000
-3.5 -3 -2.5 -2 -1.5 -1 -0.5 0 0.5 1 1.5 2Eccentricity (in.)
Shea
r (lb
)

115
No shear-eccentricity graph is included for Test 3-C due to the very low failure load.
Also, the test failed before the eccentricity could approach a constant value.
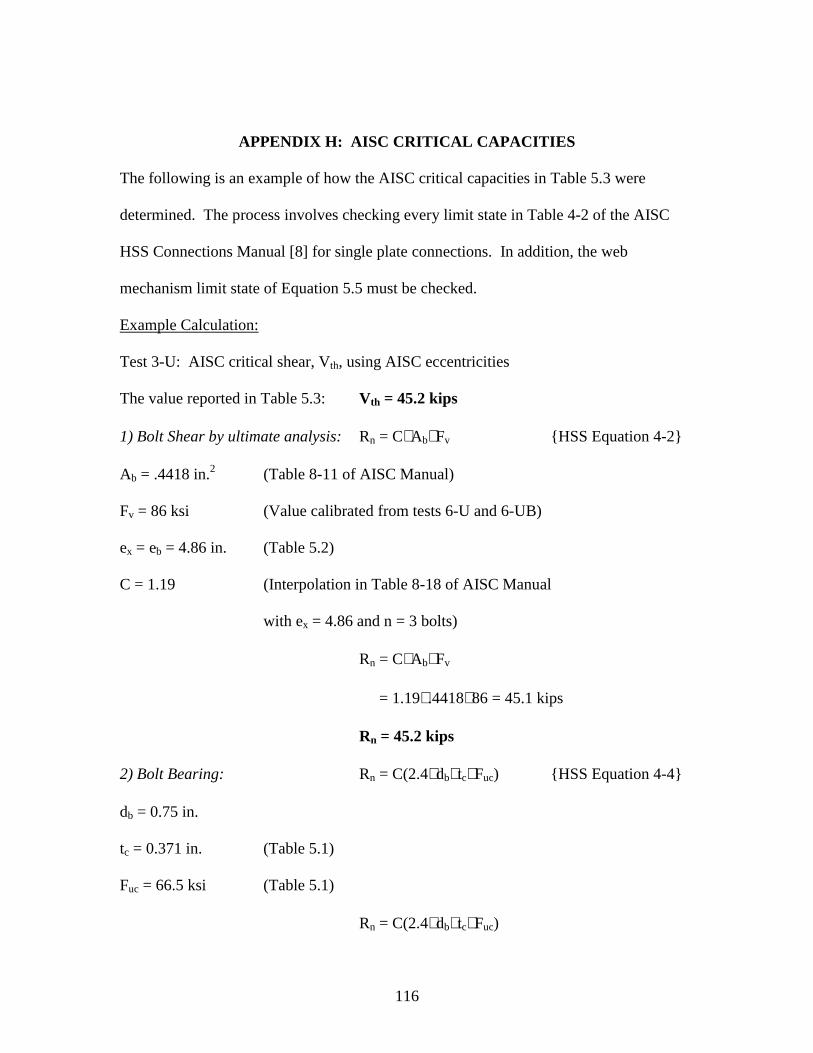
116
APPENDIX H: AISC CRITICAL CAPACITIES
The following is an example of how the AISC critical capacities in Table 5.3 were
determined. The process involves checking every limit state in Table 4-2 of the AISC
HSS Connections Manual [8] for single plate connections. In addition, the web
mechanism limit state of Equation 5.5 must be checked.
Example Calculation:
Test 3-U: AISC critical shear, Vth, using AISC eccentricities
The value reported in Table 5.3: Vth = 45.2 kips
1) Bolt Shear by ultimate analysis: Rn = C∗ Ab∗ Fv {HSS Equation 4-2}
Ab = .4418 in.2 (Table 8-11 of AISC Manual)
Fv = 86 ksi (Value calibrated from tests 6-U and 6-UB)
ex = eb = 4.86 in. (Table 5.2)
C = 1.19 (Interpolation in Table 8-18 of AISC Manual
with ex = 4.86 and n = 3 bolts)
Rn = C∗ Ab∗ Fv
= 1.19∗ .4418∗ 86 = 45.1 kips
Rn = 45.2 kips
2) Bolt Bearing: Rn = C(2.4∗ db∗ tc∗ Fuc) {HSS Equation 4-4}
db = 0.75 in.
tc = 0.371 in. (Table 5.1)
Fuc = 66.5 ksi (Table 5.1)
Rn = C(2.4∗ db∗ tc∗ Fuc)
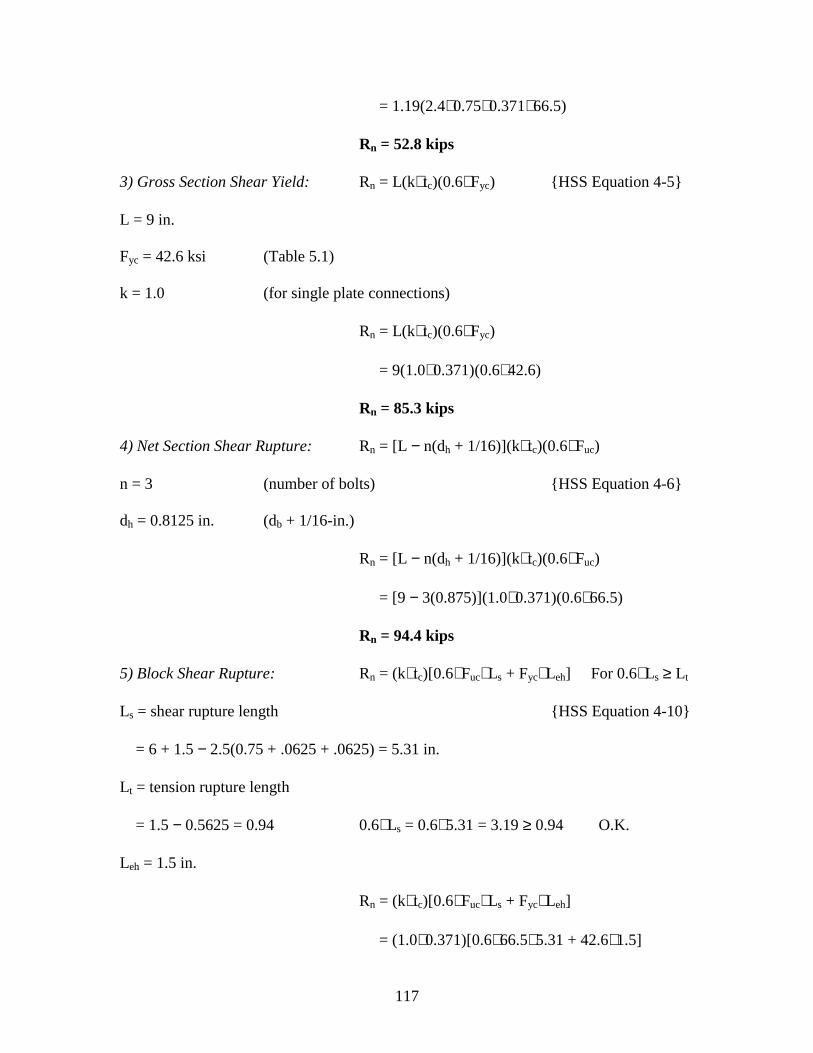
117
= 1.19(2.4∗ 0.75∗ 0.371∗ 66.5)
Rn = 52.8 kips
3) Gross Section Shear Yield: Rn = L(k∗ tc)(0.6∗ Fyc) {HSS Equation 4-5}
L = 9 in.
Fyc = 42.6 ksi (Table 5.1)
k = 1.0 (for single plate connections)
Rn = L(k∗ tc)(0.6∗ Fyc)
= 9(1.0∗ 0.371)(0.6∗ 42.6)
Rn = 85.3 kips
4) Net Section Shear Rupture: Rn = [L − n(dh + 1/16)](k∗ tc)(0.6∗ Fuc)
n = 3 (number of bolts) {HSS Equation 4-6}
dh = 0.8125 in. (db + 1/16-in.)
Rn = [L − n(dh + 1/16)](k∗ tc)(0.6∗ Fuc)
= [9 − 3(0.875)](1.0∗ 0.371)(0.6∗ 66.5)
Rn = 94.4 kips
5) Block Shear Rupture: Rn = (k∗ tc)[0.6∗ Fuc∗ Ls + Fyc∗ Leh] For 0.6∗ Ls ≥ Lt
Ls = shear rupture length {HSS Equation 4-10}
= 6 + 1.5 − 2.5(0.75 + .0625 + .0625) = 5.31 in.
Lt = tension rupture length
= 1.5 − 0.5625 = 0.94 0.6∗ Ls = 0.6∗ 5.31 = 3.19 ≥ 0.94 O.K.
Leh = 1.5 in.
Rn = (k∗ tc)[0.6∗ Fuc∗ Ls + Fyc∗ Leh]
= (1.0∗ 0.371)[0.6∗ 66.5∗ 5.31 + 42.6∗ 1.5]

118
Rn = 102 kips
6) Weld Shear by ultimate analysis: Rn = C∗ D∗ L {HSS Equation 4-17}
a = 6.86 in. (Table 4.1)
ex = ew = a − eb = 6.86 − 4.86 = 2.0 in.
C = 2.57 (Interpolation in Table 8-38 of AISC Manual
with ex = 2.0 and n = 3 bolts)
D = 5 (# of sixteenths of the fillet weld)
Rn = C∗ D∗ L
Rn = 2.56∗ 5∗ 9
= 115 kips
Rn = 115 kips
7) Web Mechanism: Rn = [((2∗ h/L) + (4∗ L/h) + 4∗ (3)1/2)(Fyw∗ tw2/4)(L)]/ew
Fyw = 55.2 ksi (Table 5.1) {Equation 5.5}
tw = 0.288 in. (Table 5.1)
h = h/tw∗ tw = 22.2∗ 0.288 = 6.39
ew = 2.0
Rn = [((2∗ h/L) + (4∗ L/h) + 4∗ (3)1/2)(Fyw∗ tw2/4)(L)]/ew
= [((2∗ 6.39/9) + (4*9/6.39) + ∗ (3)1/2)(55.2∗ 0.2882/4)(9)]/2.0
Rn = 73.0 kips
Therefore, bolt shear controls and Vth = Rn, min = 45.2 kips.
A similar procedure was done for all of the other tests and the results are summarized
in Table H.1.

119
Table H.1: AISC critical capacities
AISC CRITICAL CAPACITIES (KIPS) − USING AISC ECCENTRICITIES Bolt Shear Shear Block Web
Test Shear Bearing Yield Rupture Shear Weld Mechanism 1-U 45.1 52.8 85.3 94.4 102.0 115.0 --- 2-U 94.8 110.8 142.0 157.0 165.0 208.5 --- 3-U 45.2 52.8 85.3 94.4 102.0 115.0 73.0 4-U 89.9 137.0 184.0 204.0 215.0 195.8 120.0
1-A,B 48.9 39.9 61.0 65.9 71.9 96.3 --- 2-A,B,C 98.3 82.8 98.3 113.0 118.0 167.0 ---
2-A (Rigid) 167.7 141.0 98.3 113.0 118.0 153.0 --- 2-B (Rigid) 153.4 129.0 98.3 113.0 118.0 161.0 ---
3-A,B,D 55.8 47.0 59.0 68.0 73.1 96.3 --- 3-E 46.4 39.1 59.0 68.0 73.1 100.0 ---
4-A,C 123.4 101.0 102.0 110.0 116.0 153.0 --- 4-B 112.8 92.1 102.0 110.0 116.0 161.0 ---
AISC CRITICAL CAPACITIES (KIPS) − USING MEASURED ECCENTRICITIES Bolt Shear Shear Block Web
Test Shear Bearing Yield Rupture Shear Weld Mechanism 1-U 65.4 76.4 85.3 94.4 102.0 90.0 --- 2-U 100.6 118.0 142.0 157.0 165.0 208.5 --- 3-U 64.0 74.8 85.3 94.4 102.0 90.0 41.0 4-U 92.2 141.0 184.0 205.0 215.0 195.0 181.0 1-A 71.4 58.3 61.0 65.9 71.9 81.3 --- 1-B 81.3 66.4 61.0 65.9 71.9 78.2 --- 2-A 122.6 103.0 98.3 113.0 118.0 167.0 --- 2-B 111.7 94.0 98.3 113.0 118.0 167.0 --- 2-C 113.1 95.3 98.3 113.0 118.0 167.0 --- 3-A 109.6 92.3 59.0 68.0 73.1 75.2 --- 3-B 111.1 93.6 59.0 68.0 73.1 75.2 --- 3-D 106.7 89.9 59.0 68.0 73.1 76.0 --- 3-E 108.1 91.1 59.0 68.0 73.1 76.6 --- 4-A 170.3 139.1 102.0 110.0 116.0 133.0 --- 4-B 186.5 152.3 102.0 110.0 116.0 128.0 --- 4-C 124.2 101.5 102.0 110.0 116.0 132.0 ---
The numbers that appear in bold are the numbers that are reported in Table 5.3.
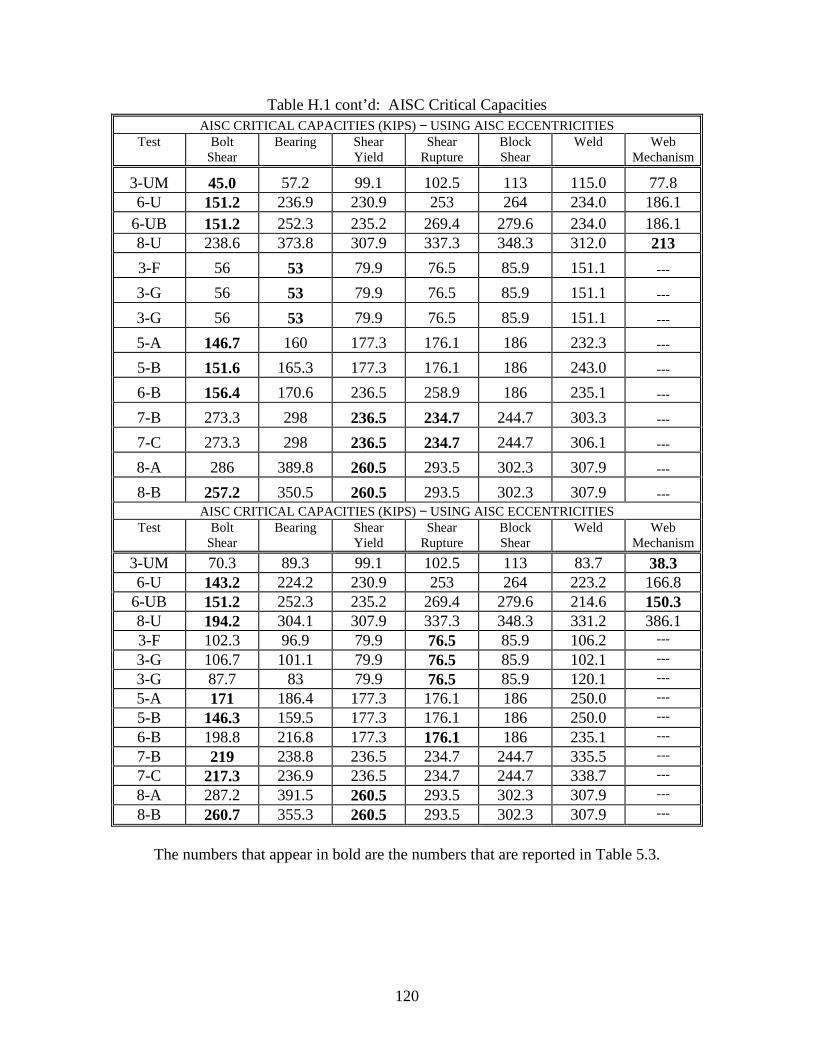
120
Table H.1 cont’d: AISC Critical Capacities AISC CRITICAL CAPACITIES (KIPS) − USING AISC ECCENTRICITIES
Test Bolt Shear
Bearing Shear Yield
Shear Rupture
Block Shear
Weld Web Mechanism
3-UM 45.0 57.2 99.1 102.5 113 115.0 77.8 6-U 151.2 236.9 230.9 253 264 234.0 186.1
6-UB 151.2 252.3 235.2 269.4 279.6 234.0 186.1 8-U 238.6 373.8 307.9 337.3 348.3 312.0 213 3-F 56 53 79.9 76.5 85.9 151.1 ---
3-G 56 53 79.9 76.5 85.9 151.1 ---
3-G 56 53 79.9 76.5 85.9 151.1 ---
5-A 146.7 160 177.3 176.1 186 232.3 ---
5-B 151.6 165.3 177.3 176.1 186 243.0 ---
6-B 156.4 170.6 236.5 258.9 186 235.1 ---
7-B 273.3 298 236.5 234.7 244.7 303.3 ---
7-C 273.3 298 236.5 234.7 244.7 306.1 ---
8-A 286 389.8 260.5 293.5 302.3 307.9 ---
8-B 257.2 350.5 260.5 293.5 302.3 307.9 --- AISC CRITICAL CAPACITIES (KIPS) − USING AISC ECCENTRICITIES
Test Bolt Shear
Bearing Shear Yield
Shear Rupture
Block Shear
Weld Web Mechanism
3-UM 70.3 89.3 99.1 102.5 113 83.7 38.3 6-U 143.2 224.2 230.9 253 264 223.2 166.8
6-UB 151.2 252.3 235.2 269.4 279.6 214.6 150.3 8-U 194.2 304.1 307.9 337.3 348.3 331.2 386.1 3-F 102.3 96.9 79.9 76.5 85.9 106.2 ---
3-G 106.7 101.1 79.9 76.5 85.9 102.1 --- 3-G 87.7 83 79.9 76.5 85.9 120.1 --- 5-A 171 186.4 177.3 176.1 186 250.0 --- 5-B 146.3 159.5 177.3 176.1 186 250.0 ---
6-B 198.8 216.8 177.3 176.1 186 235.1 --- 7-B 219 238.8 236.5 234.7 244.7 335.5 --- 7-C 217.3 236.9 236.5 234.7 244.7 338.7 --- 8-A 287.2 391.5 260.5 293.5 302.3 307.9 ---
8-B 260.7 355.3 260.5 293.5 302.3 307.9 ---
The numbers that appear in bold are the numbers that are reported in Table 5.3.
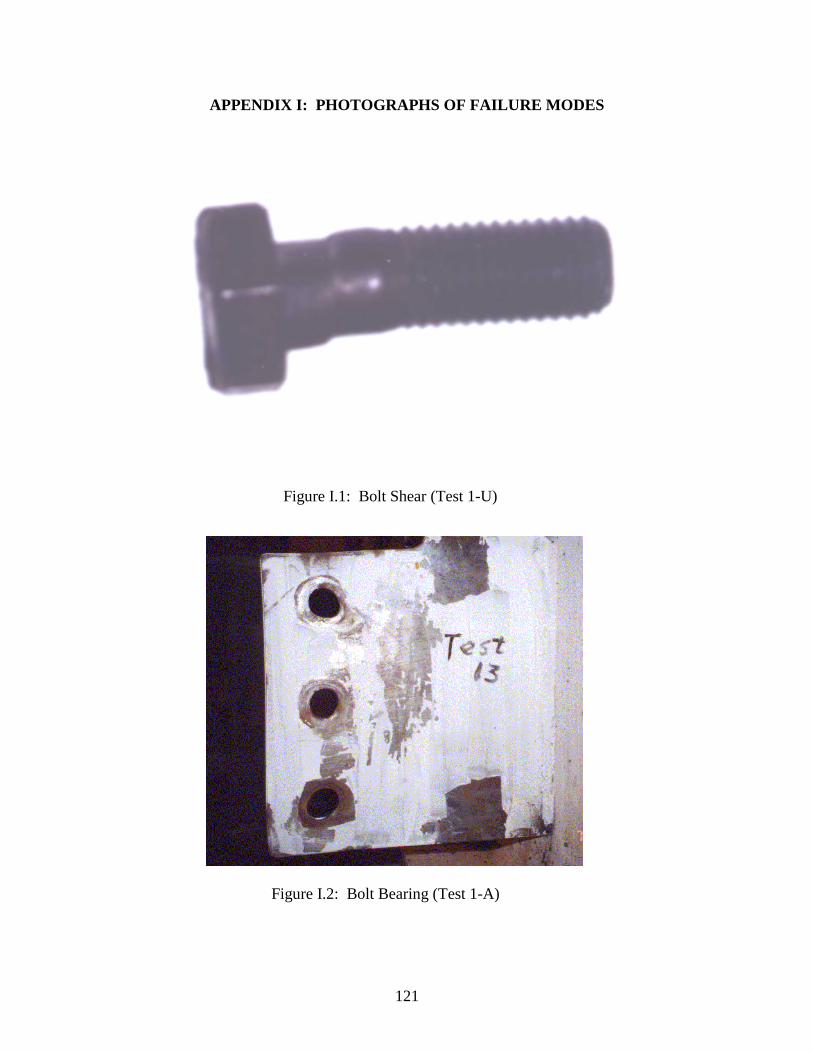
121
APPENDIX I: PHOTOGRAPHS OF FAILURE MODES
Figure I.1: Bolt Shear (Test 1-U)
Figure I.2: Bolt Bearing (Test 1-A)
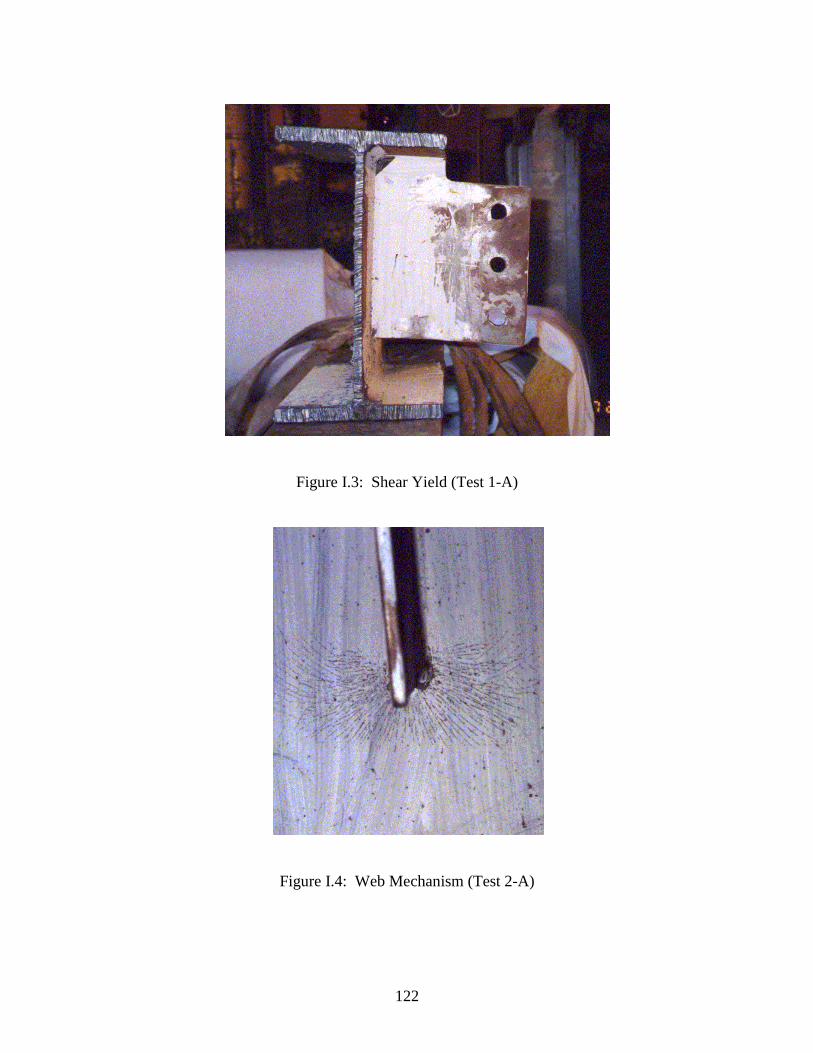
122
Figure I.3: Shear Yield (Test 1-A)
Figure I.4: Web Mechanism (Test 2-A)
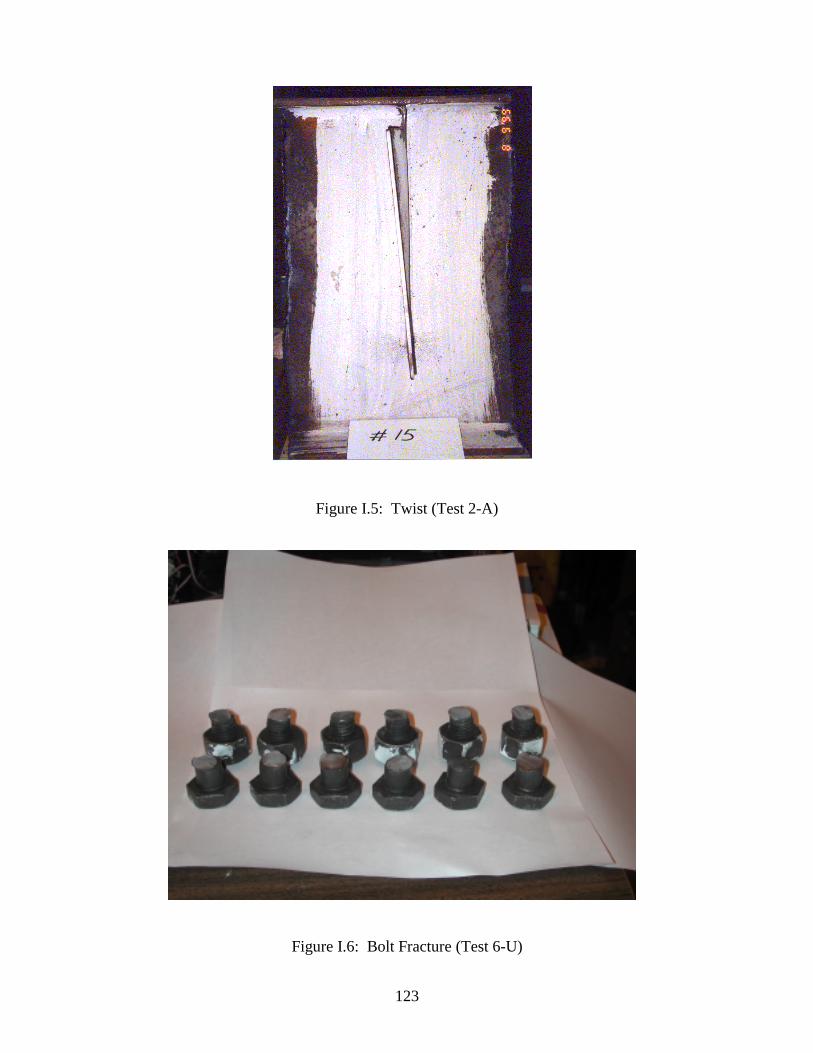
123
Figure I.5: Twist (Test 2-A)
Figure I.6: Bolt Fracture (Test 6-U)

124
Figure I.7: Tearing of weld near top of shear tab (Test 6-U)
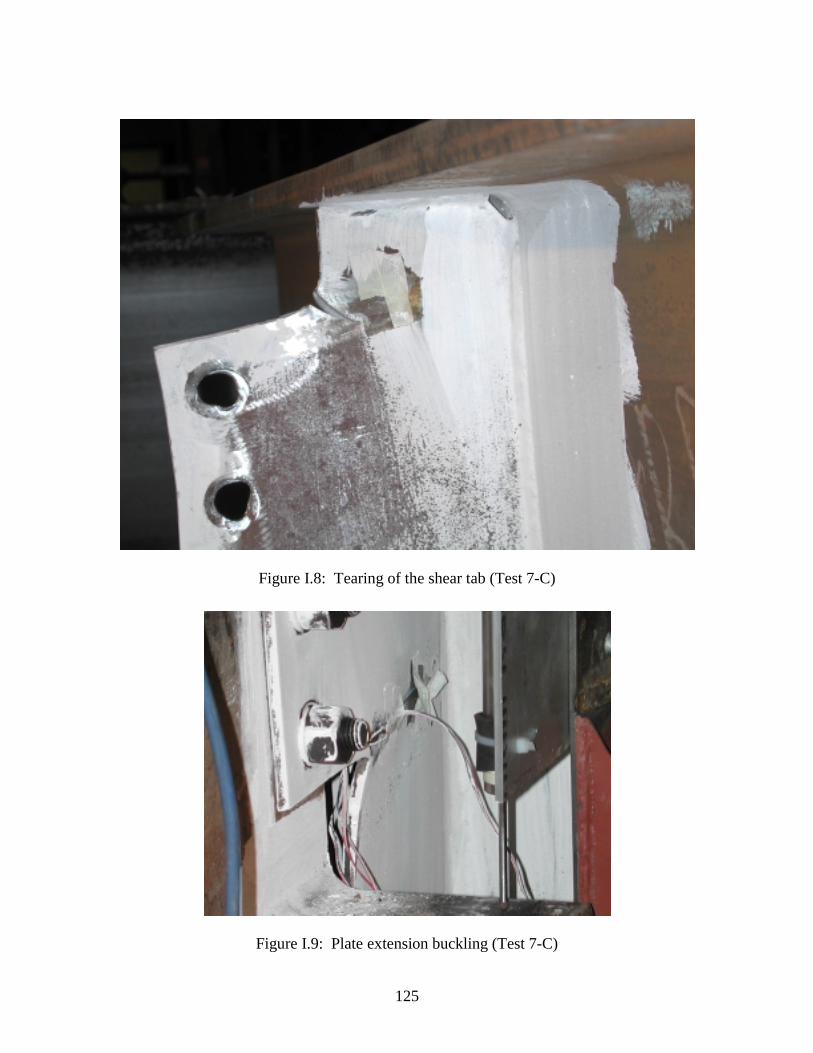
125
Figure I.8: Tearing of the shear tab (Test 7-C)
Figure I.9: Plate extension buckling (Test 7-C)
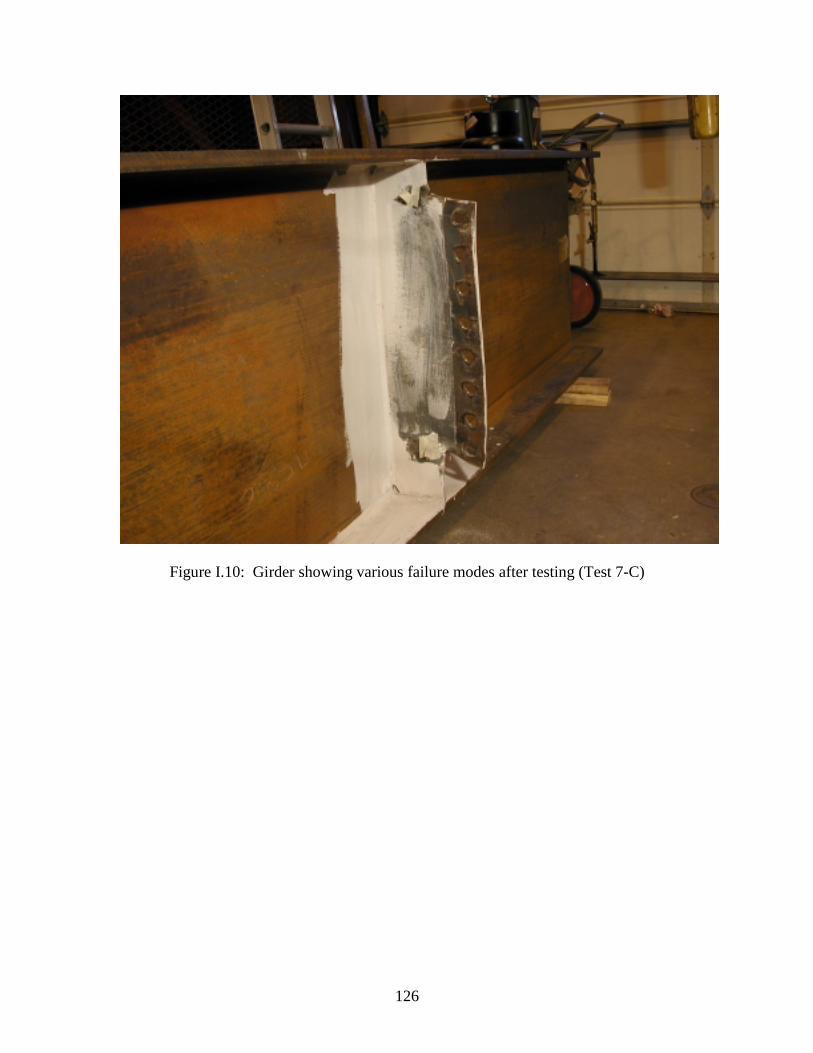
126
Figure I.10: Girder showing various failure modes after testing (Test 7-C)
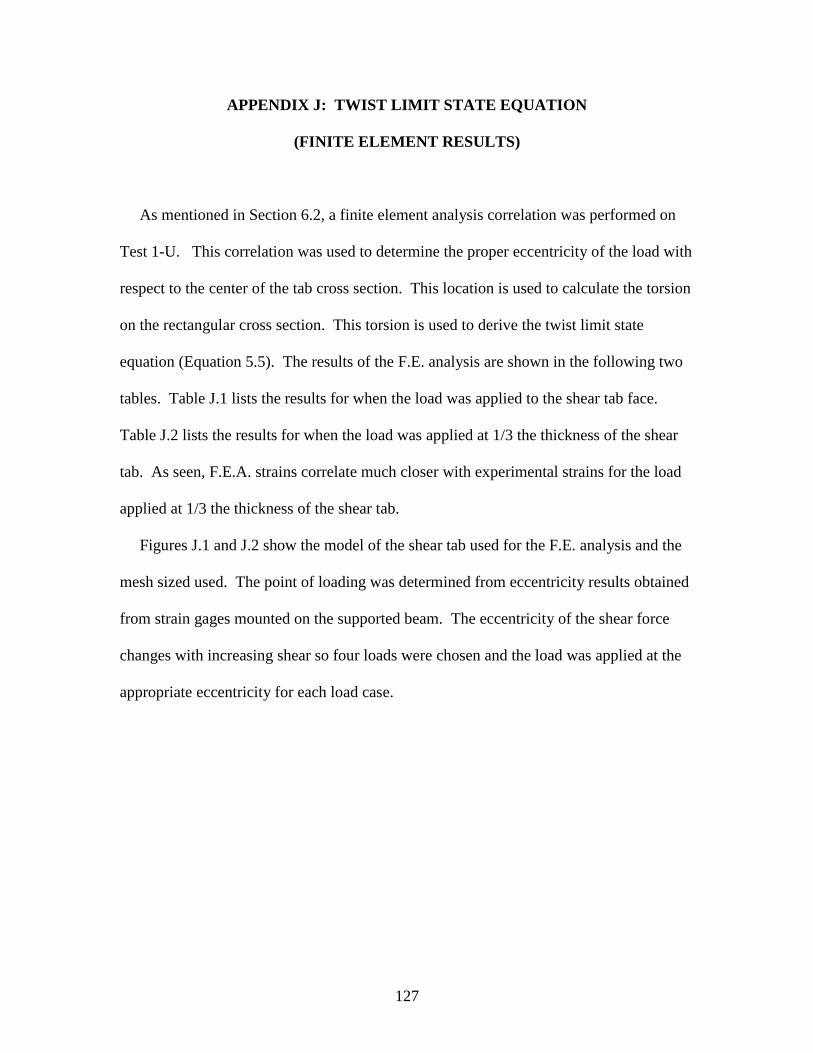
127
APPENDIX J: TWIST LIMIT STATE EQUATION
(FINITE ELEMENT RESULTS)
As mentioned in Section 6.2, a finite element analysis correlation was performed on
Test 1-U. This correlation was used to determine the proper eccentricity of the load with
respect to the center of the tab cross section. This location is used to calculate the torsion
on the rectangular cross section. This torsion is used to derive the twist limit state
equation (Equation 5.5). The results of the F.E. analysis are shown in the following two
tables. Table J.1 lists the results for when the load was applied to the shear tab face.
Table J.2 lists the results for when the load was applied at 1/3 the thickness of the shear
tab. As seen, F.E.A. strains correlate much closer with experimental strains for the load
applied at 1/3 the thickness of the shear tab.
Figures J.1 and J.2 show the model of the shear tab used for the F.E. analysis and the
mesh sized used. The point of loading was determined from eccentricity results obtained
from strain gages mounted on the supported beam. The eccentricity of the shear force
changes with increasing shear so four loads were chosen and the load was applied at the
appropriate eccentricity for each load case.
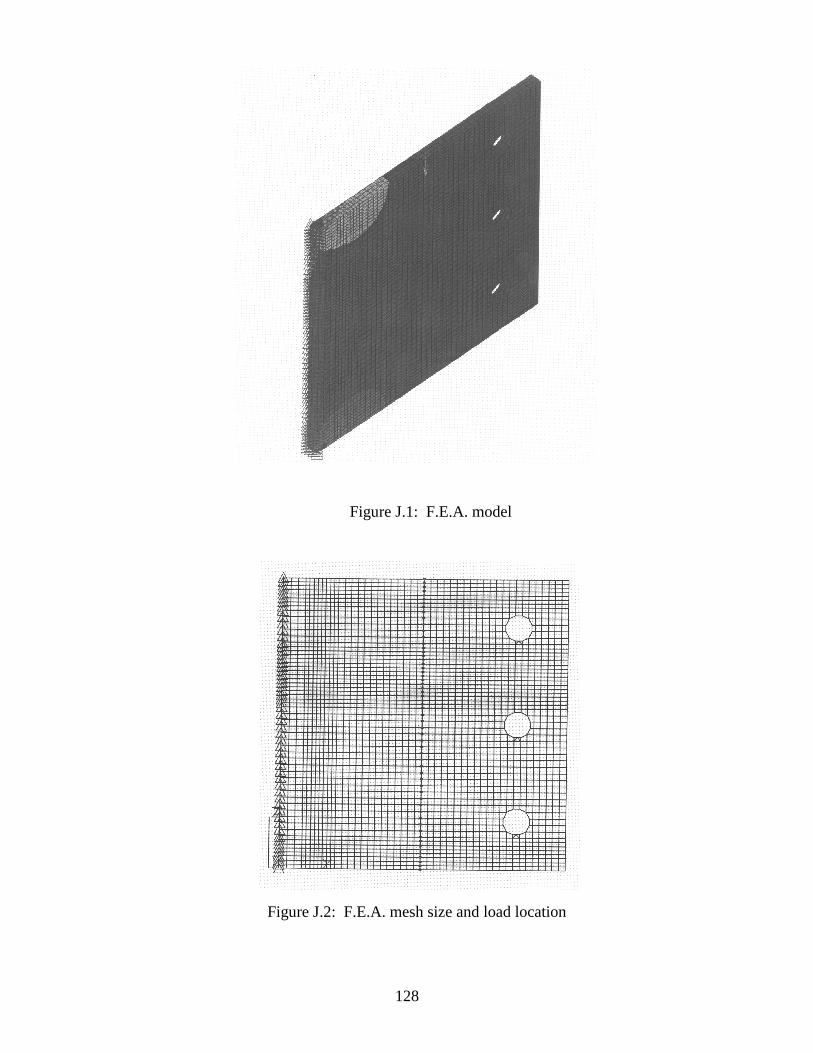
128
Figure J.1: F.E.A. model
Figure J.2: F.E.A. mesh size and load location
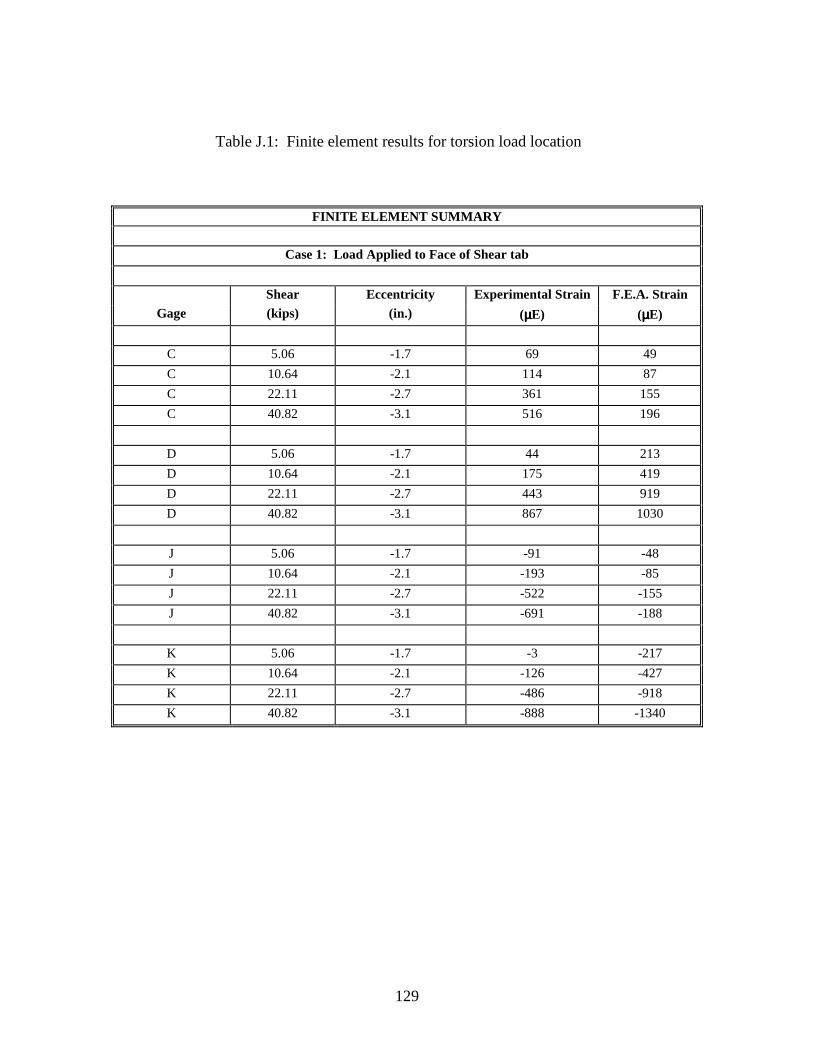
129
Table J.1: Finite element results for torsion load location
FINITE ELEMENT SUMMARY
Case 1: Load Applied to Face of Shear tab
Shear Eccentricity Experimental Strain F.E.A. Strain Gage (kips) (in.) (µµµµE) (µµµµE)
C 5.06 -1.7 69 49 C 10.64 -2.1 114 87 C 22.11 -2.7 361 155 C 40.82 -3.1 516 196
D 5.06 -1.7 44 213 D 10.64 -2.1 175 419 D 22.11 -2.7 443 919 D 40.82 -3.1 867 1030 J 5.06 -1.7 -91 -48 J 10.64 -2.1 -193 -85 J 22.11 -2.7 -522 -155 J 40.82 -3.1 -691 -188
K 5.06 -1.7 -3 -217 K 10.64 -2.1 -126 -427 K 22.11 -2.7 -486 -918 K 40.82 -3.1 -888 -1340
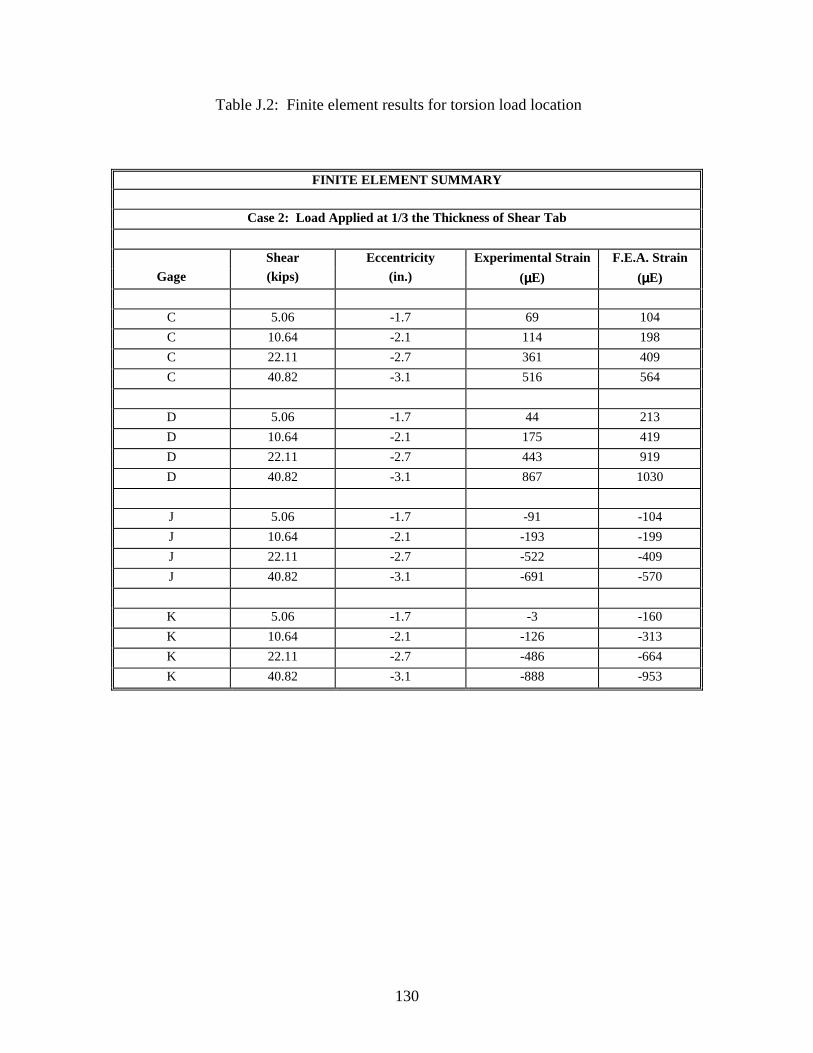
130
Table J.2: Finite element results for torsion load location
FINITE ELEMENT SUMMARY
Case 2: Load Applied at 1/3 the Thickness of Shear Tab
Shear Eccentricity Experimental Strain F.E.A. Strain Gage (kips) (in.) (µµµµE) (µµµµE)
C 5.06 -1.7 69 104 C 10.64 -2.1 114 198 C 22.11 -2.7 361 409 C 40.82 -3.1 516 564
D 5.06 -1.7 44 213 D 10.64 -2.1 175 419 D 22.11 -2.7 443 919 D 40.82 -3.1 867 1030 J 5.06 -1.7 -91 -104 J 10.64 -2.1 -193 -199 J 22.11 -2.7 -522 -409 J 40.82 -3.1 -691 -570
K 5.06 -1.7 -3 -160 K 10.64 -2.1 -126 -313 K 22.11 -2.7 -486 -664 K 40.82 -3.1 -888 -953
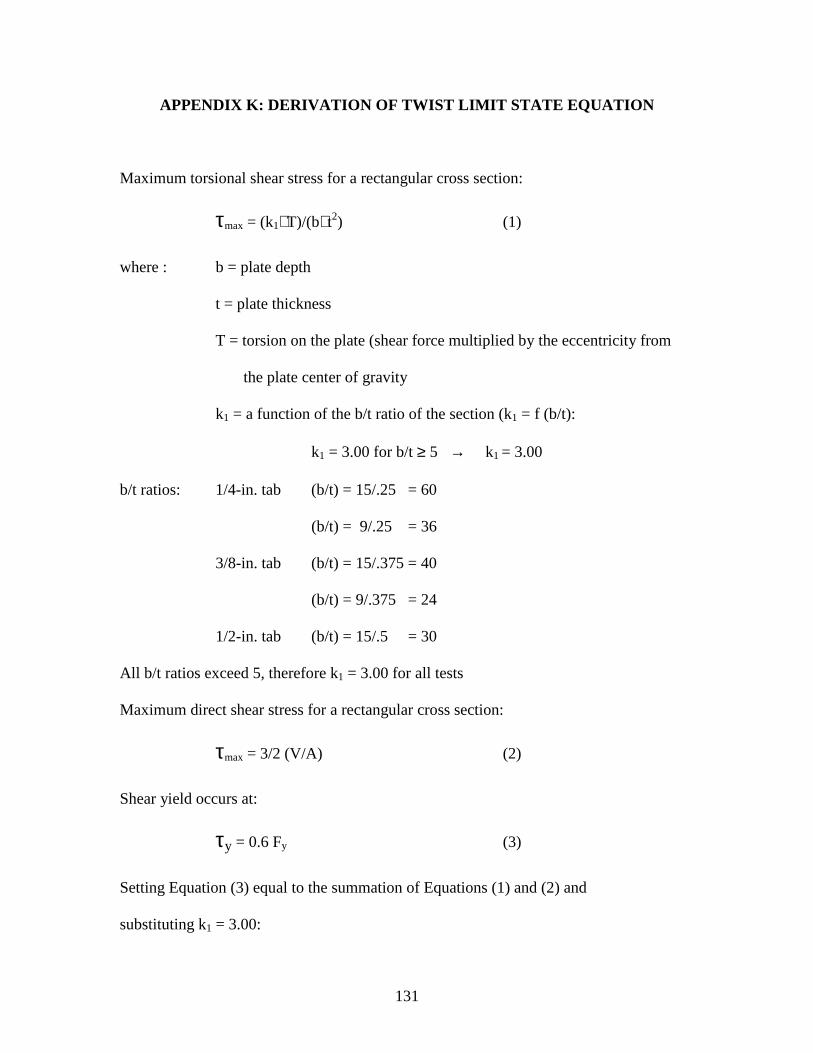
131
APPENDIX K: DERIVATION OF TWIST LIMIT STATE EQUATION
Maximum torsional shear stress for a rectangular cross section:
τmax = (k1∗ T)/(b∗ t2) (1)
where : b = plate depth
t = plate thickness
T = torsion on the plate (shear force multiplied by the eccentricity from
the plate center of gravity
k1 = a function of the b/t ratio of the section (k1 = f (b/t):
k1 = 3.00 for b/t ≥ 5 → k1 = 3.00
b/t ratios: 1/4-in. tab (b/t) = 15/.25 = 60
(b/t) = 9/.25 = 36
3/8-in. tab (b/t) = 15/.375 = 40
(b/t) = 9/.375 = 24
1/2-in. tab (b/t) = 15/.5 = 30
All b/t ratios exceed 5, therefore k1 = 3.00 for all tests
Maximum direct shear stress for a rectangular cross section:
τmax = 3/2 (V/A) (2)
Shear yield occurs at:
τy = 0.6 Fy (3)
Setting Equation (3) equal to the summation of Equations (1) and (2) and
substituting k1 = 3.00:
132
0.6 Fy = (3∗ T)/(b∗ t2) + 3/2 (V/A) (4)
Torsion from the finite element analysis:
T = 1/6*t*V (5)
Substitute (5) into (4) and substituting A=b*t and solving for V:
Vmax = Vt = 0.3*L*T*Fy → Equation 6.1
133
APPENDIX L: CALCULATION OF NOMINAL SHEAR STRENGTH
The following is a sample calculation to determine the nominal shear strengths, Vn, as
shown in Table 7.1. The proposed design procedure for extended shear tabs is followed,
including the proposed new eccentricities for the shear reaction. The following example
is for a Group 3 stiffened test based on actual material properties from Phase II.
- Determine the distance, a, from the centroid of the weld group to the bolt line:
For a stiffened W8X31 support column, a = 5.91 in.
This distance includes 2.91 in. from the centroid of the weld group plus
3-in. from the flange tips to the bolt line.
- Determine the tab thickness, t:
For a stiffened shear tab, the thickness required is from Equation 4.9.
Equation 4.9: t ≥ L/64 = 9/64 = 0.141 in.
t ≥ 1/4-in. = 0.25 in.
t provided = 0.277 in. O.K.
- Determine the eccentricity, e, of the shear force relative to the bolt line:
e = n for stiffened connections with n ≤ 6 bolts
e = 3
- Using AISC criteria, determine the critical limit states:
Bolt Shear Rn = C∗ Ab∗ Fv = 1.75∗ .4418∗ 86 = 66.5 kips
Rn = 66.5 kips
Bolt Bearing Rn = C(2.4∗ db∗ tc∗ Fuc)
134
(in the tab) = 1.75(2.4∗ 0.75∗ 0.277∗ 72.2) = 63 kips
Rn = 63 kips
Shear Yield Rn = L(k∗ tc)(0.6∗ Fyc)
(on the gross section) = 9(1.0∗ 0.277)(0.6∗ 53.4) = 79.9 kips
Rn = 79.9 kips
Shear Rupture Rn = [L − n(dh + 1/16)](k∗ tc)(0.6∗ Fuc)
(of the net section) = [9 − 3(0.875)](1.0∗ 0.277)(0.6∗ 72.2)
= 76.5 kips
Rn = 76.5 kips
Block Shear Rupture Rn = (k∗ tc)[0.6∗ Fuc∗ Ls + Fyc∗ Leh]
= (1.0∗ 0.277)[0.6∗ 72.2∗ 5.31 + 53.4∗ 1.5]
= 85.9 kips
Rn = 85.9 kips
- Use a weld size equal to 3/4 of the plate thickness:
Weld size = 3/4∗ 0.277 = 0.75∗ 0.277 = 0.208 in.
Weld size provided = 3/16 in. = 0.1875 in. OK*
*The plate provided was somewhat thicker than ordered, check shows
weld does not control.
- Examine the beam web for bolt bearing:
Rn = C(2.4∗ db∗ tc∗ Fuc)
= 1.75(2.4∗ 0.75∗ 0.515*72.2)
Rn = 117.1 kips (Does not control)
135
- Provide stiffeners having thickness equal to the thickness of the shear tab.
Summary: The W8X31 support column and 1/4-in. extended shear tab with two ¼-in.
stiffeners has a nominal connection capacity, Vn, of 63 kips. There is a
slight discrepancy from Table 7.1 attributed to interpolation of the C
coefficient for bolted connections.
Note:
It is not the focus of this study to address the design of supporting members in shear tab
connections. However, it is apparent that the resulting shear and moment forces from the
connections do affect the design of the supporting members and will need to be
considered.
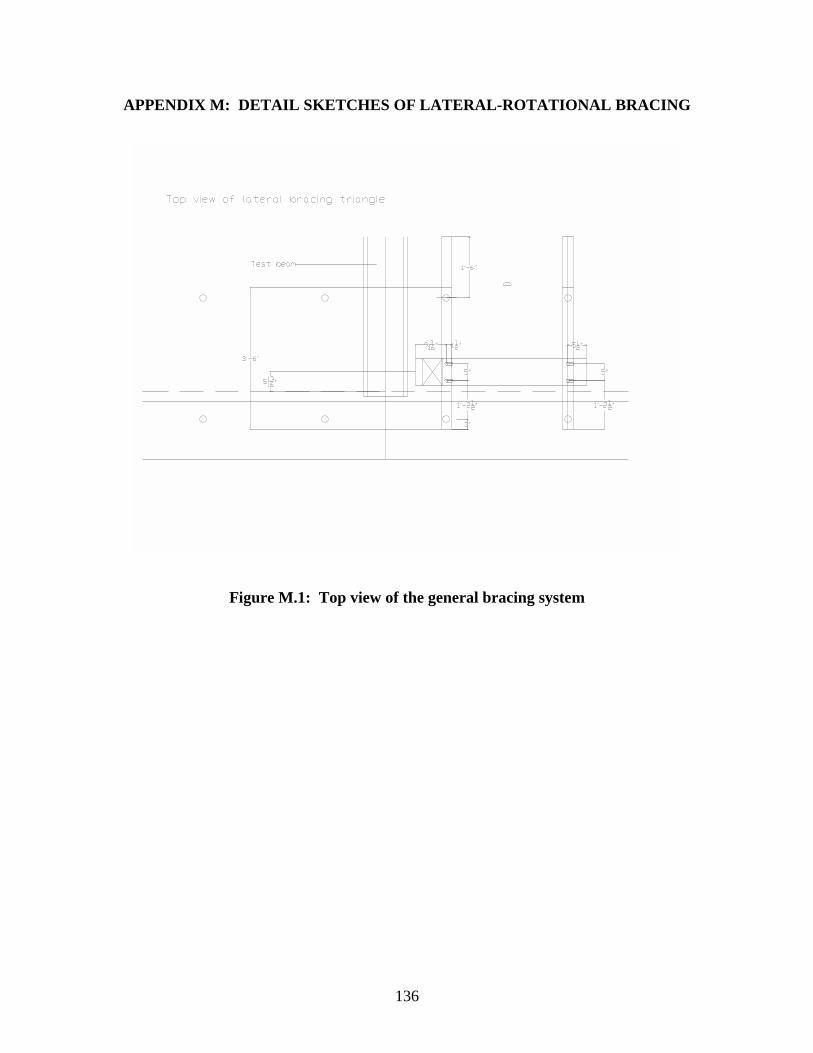
136
APPENDIX M: DETAIL SKETCHES OF LATERAL-ROTATIONAL BRACING
Figure M.1: Top view of the general bracing system
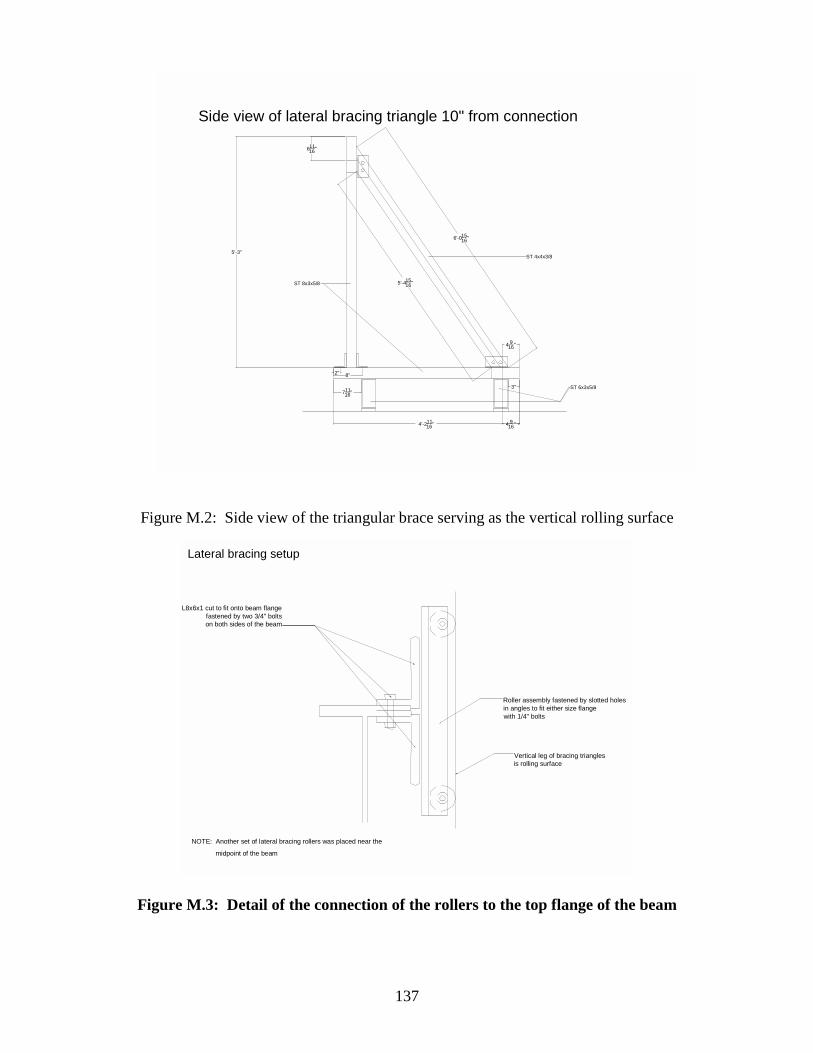
137
Figure M.2: Side view of the triangular brace serving as the vertical rolling surface
Figure M.3: Detail of the connection of the rollers to the top flange of the beam
6'-01516"
5'-41516"
4'-21116"
5'-3"
61116"
4 916"
71116"
2" 8"
3"
4 916"
ST 8x3x5/8
ST 6x3x5/8
ST 4x4x3/8
Side view of lateral bracing triangle 10" from connection
L8x6x1 cut to fit onto beam flange fastened by two 3/4" bolts on both sides of the beam
Roller assembly fastened by slotted holes in angles to fit either size flange with 1/4" bolts
Vertical leg of bracing triangles is rolling surface
NOTE: Another set of lateral bracing rollers was placed near the
midpoint of the beam
Lateral bracing setup
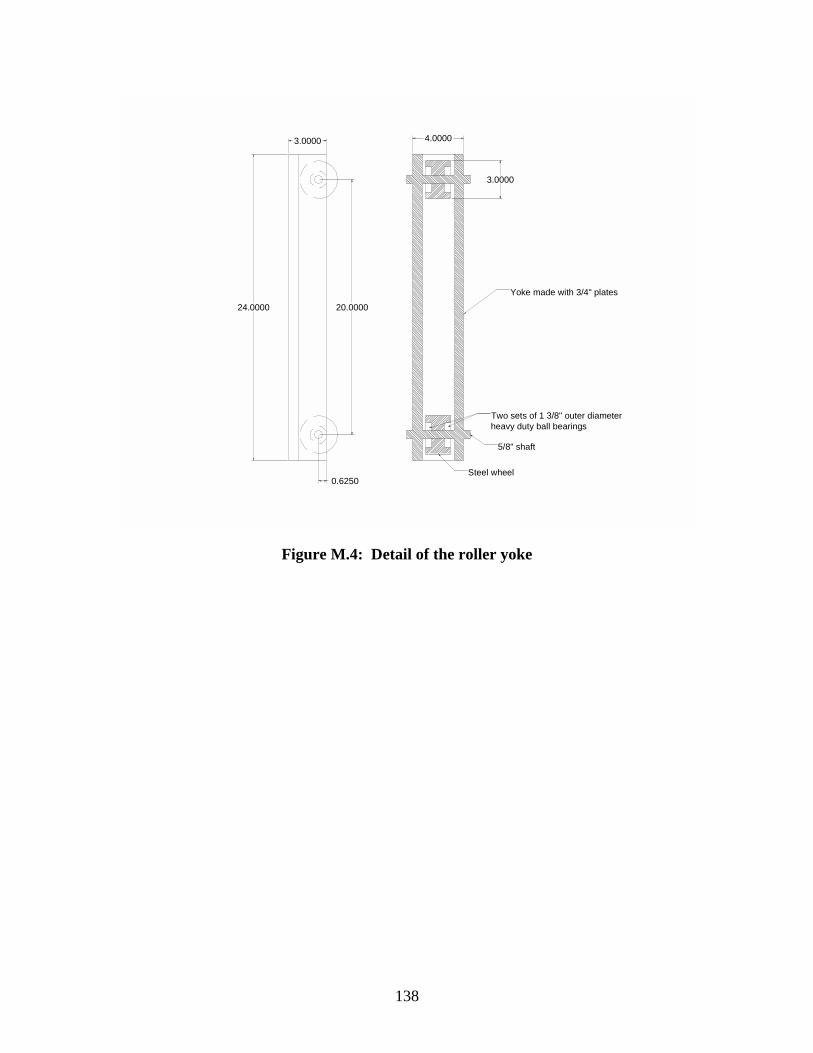
138
Figure M.4: Detail of the roller yoke
24.0000 20.0000
3.0000
3.0000 4.0000
0.6250
Two sets of 1 3/8" outer diameterheavy duty ball bearings
5/8" shaft
Steel wheel
Yoke made with 3/4" plates

139
APPENDIX N: CONNECTION LOAD CAPACITIES AT 0.25-in DEFLECTION
Test Unstiffened Shear (K) Deflection
1-U 33 0.240 2-U 83 0.177 (max) 3-U 48 0.255
3-UM 24 0.251 4-U 89 0.255 6-U 85 0.257
6-UB 47 0.255 8-U 115 0.256
Stiffened 1-A 51 0.250 1-B 52 0.250 2-A 89 0.177 (max) 2-B 93 0.251 2-C 82 0.160 (max) 3-A 48 0.252 3-B 45 0.255 3-C 9 0.253 3-D 47 0.252 3-E 46 0.250 3-F 58 0.254 3-G 61 0.256 3-H 33 0.252 4-A 103 0.222 (max) 4-B 98 0.257 4-C 103 0.257 5-A 119 0.251 5-B 141 0.193 (max) 6-B 118 0.251 7-B 158 0.252 7-C 155 0.250 8-A 196 0.143 (max) 8-B 226 0.250
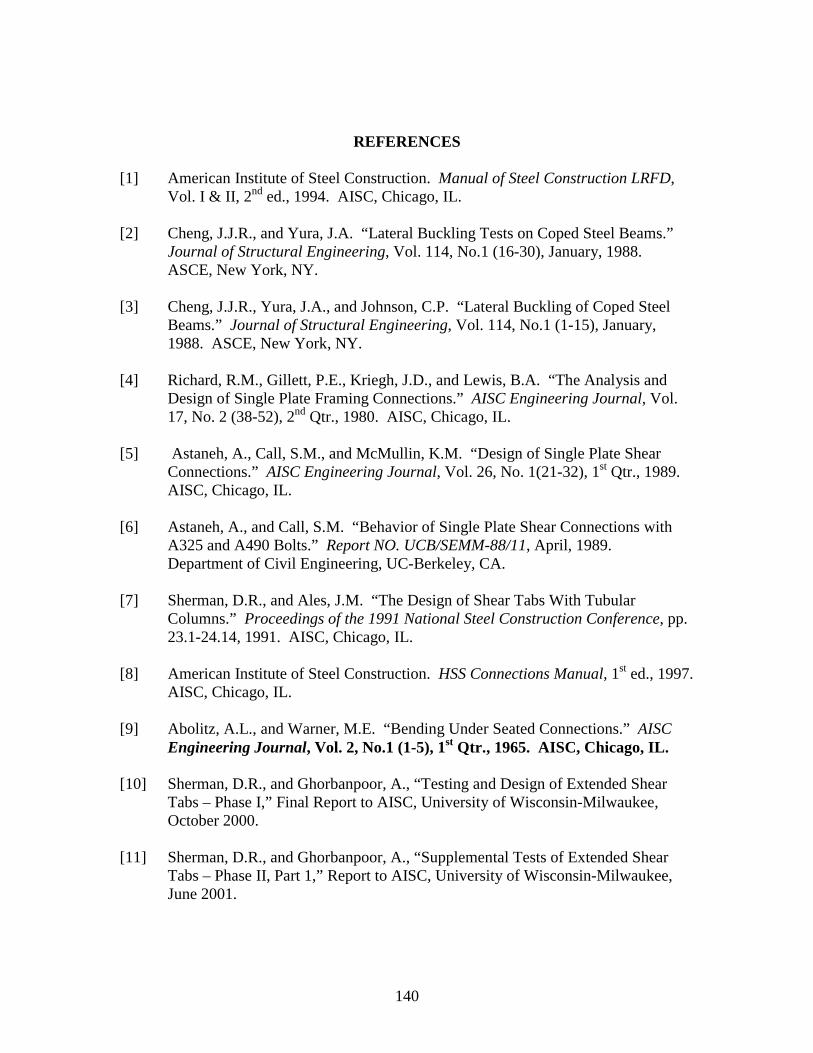
140
REFERENCES
[1] American Institute of Steel Construction. Manual of Steel Construction LRFD, Vol. I & II, 2nd ed., 1994. AISC, Chicago, IL. [2] Cheng, J.J.R., and Yura, J.A. “Lateral Buckling Tests on Coped Steel Beams.”
Journal of Structural Engineering, Vol. 114, No.1 (16-30), January, 1988. ASCE, New York, NY.
[3] Cheng, J.J.R., Yura, J.A., and Johnson, C.P. “Lateral Buckling of Coped Steel
Beams.” Journal of Structural Engineering, Vol. 114, No.1 (1-15), January, 1988. ASCE, New York, NY.
[4] Richard, R.M., Gillett, P.E., Kriegh, J.D., and Lewis, B.A. “The Analysis and Design of Single Plate Framing Connections.” AISC Engineering Journal, Vol. 17, No. 2 (38-52), 2nd Qtr., 1980. AISC, Chicago, IL. [5] Astaneh, A., Call, S.M., and McMullin, K.M. “Design of Single Plate Shear Connections.” AISC Engineering Journal, Vol. 26, No. 1(21-32), 1st Qtr., 1989. AISC, Chicago, IL. [6] Astaneh, A., and Call, S.M. “Behavior of Single Plate Shear Connections with
A325 and A490 Bolts.” Report NO. UCB/SEMM-88/11, April, 1989. Department of Civil Engineering, UC-Berkeley, CA.
[7] Sherman, D.R., and Ales, J.M. “The Design of Shear Tabs With Tubular
Columns.” Proceedings of the 1991 National Steel Construction Conference, pp. 23.1-24.14, 1991. AISC, Chicago, IL.
[8] American Institute of Steel Construction. HSS Connections Manual, 1st ed., 1997. AISC, Chicago, IL. [9] Abolitz, A.L., and Warner, M.E. “Bending Under Seated Connections.” AISC Engineering Journal, Vol. 2, No.1 (1-5), 1st Qtr., 1965. AISC, Chicago, IL. [10] Sherman, D.R., and Ghorbanpoor, A., “Testing and Design of Extended Shear
Tabs – Phase I,” Final Report to AISC, University of Wisconsin-Milwaukee, October 2000.
[11] Sherman, D.R., and Ghorbanpoor, A., “Supplemental Tests of Extended Shear
Tabs – Phase II, Part 1,” Report to AISC, University of Wisconsin-Milwaukee, June 2001.