Beneficial Use of Water Treatment Sludge in Geotechnical ...
Design Framework for Electrokinetically EnhancedDewatering of Sludge
S. Glendinning1; C. K. Mok2; D. Kalumba3; C. D. F. Rogers4; and D. V. L. Hunt5
Abstract: Electrokinetic ~EK! dewatering involves the application of a ~direct current! voltage across sewage sludge, driving water under
an electrical gradient from the positive electrode ~anode! to the negative electrode ~cathode!. Researchers have shown the technique to be
efficient means of driving off water from the sludge, thus improving strength and reducing volume. This paper presents an integrating
framework for EK dewatering under constant voltage and constant current conditions, founded on the mathematics of simple electrical
circuits and demonstrated by laboratory experimentation. The derived equations and experimental results showed that electroosmotic flow
rate decreases with time when dewatering with constant voltage and is constant when constant current conditions are maintained. Having
a linear relationship between flow and time, EK dewatering with constant current not only enhances the sludge dewatering efficiency, but
also has the advantage of simplifying design procedures.
DOI: 10.1061/~ASCE!EE.1943-7870.0000159
CE Database subject headings: Design; Dewatering; Sludge; Slurries; Waste management; Water discharge; Electrokinetics.
Author keywords: Design; Dewatering; Electrokinetics; Electroosmosis; Sludge; Slurries; Waste management; Water discharge.
Background
The treatment of sewage inevitably involves the creation of sew-
age sludge and the disposal of this sludge is one of the most
problematical issues affecting wastewater treatment ~Metcalf and
Eddy 1991!. A medium size sewage treatment works with a popu-
lation equivalent of say 100,000 produces approximately 50,000 t
of liquid per year, or 137 t/day. In Europe in 2005, the annual
production of wastewater sludge was more than 10 million t ~dry
solids! and this was expected to rise significantly due to construc-
tion of new wastewater treatment works ~Paul and Debellefon-
taine 2007!. Sludge production and therefore the problems of
disposal are not restricted to Europe; for direct comparison
Canada produced 0.67 million t in the same time period ~Renzetti
2005!.
In Europe, traditional outlets for sewage sludge have included
spreading it on agricultural land ~46%! forming a cake for deposit
to landfill ~38%! or incineration ~17%! ~Ginestet 2007!. However,
the cheapest route has been to dig a lagoon on the site of the
sewage works and pump the liquid sludge into it. Environmental
concerns have rendered the practice of permanently depositing
sludge produced at a sewage works in a lagoon on the site of such
works universally unacceptable, evidenced for example by a re-
cent E.U. Landfill Directive to stop the practice in Europe. Since
May 30, 2007, nonhazardous waste ~e.g., sewage sludge! should
be treated ~dewatering of primary sludge constitutes treatment!
before it can be landfilled @Environment Agency ~EA! 2007#.
There is also growing pressure for restrictions placed on spread-
ing sludge to agricultural land, and again some countries have
outlawed the practice. Thus, increasingly more emphasis will beplaced on creating sludge cake for depositing in landfill or incin-eration, or other means of disposal. Indeed, whatever means isadopted for dealing with the problem, solid wastes are consideredto be environmentally less harmful or challenging to deal withthan liquid wastes.For sludge disposal to landfill or incineration, the amount of
water associated with the sludge is critical to the economics of thesolution: transportation of water represents wasted energy in con-sumed fuel; incineration requires a greater energy input to initiatethe process. Therefore, there is an increasing worldwide demandfor a more effective means of dewatering sewage sludge.To create a sludge cake, water must be removed ~and subse-
quently treated! and the solids content increased. This has beentraditionally carried out by belt or filter presses, or centrifuges~Novac 2006!. The problem with many of these devices is that thewater that can be extracted from the sludge by hydraulic means islimited. This is because of the way in which water is bound to thesludge particles or flocs. Several researchers have shown thatelectrokinetic ~EK! dewatering of sludge is more efficient thanconventional hydraulically driven methods such as belt and filterpresses ~Glendinning et al. 2007!. Water flow within these mate-rials is induced by the migration of ions and is independent of the
1Reader in Environmental Geotechnics, Drummond Building, School
of Civil Engineering and Geosciences, Newcastle Univ., Newcastle upon
Tyne, NE 1 7RU, U.K. E-mail: [email protected], Drummond Building, School of Civil Engineering and
Geosciences, Newcastle Univ., Newcastle upon Tyne, NE 1 7RU, U.K.
E-mail: [email protected] Associate in Geotechnical Engineering, Drummond Build-
ing, School of Civil Engineering and Geosciences, Newcastle Univ.,
Newcastle upon Tyne, NE 1 7RU, U.K. E-mail: [email protected], Geotechnical Engineering, School of Civil Engineering,
College of Engineering and Physical Sciences, Univ. of Birmingham,
Edgbaston, Birmingham, B15 2TT, U.K. E-mail: c.d.f.rogers@bham.
ac.uk5Postdoctoral Research Fellow, School of Civil Engineering, College
of Engineering and Physical Sciences, Univ. of Birmingham, Edgbaston,
Birmingham, B15 2TT, U.K. E-mail: [email protected]
Note. This manuscript was submitted on August 13, 2009; approved
on September 11, 2009; published online on September 14, 2009. Dis-
cussion period open until September 1, 2010; separate discussions must
be submitted for individual papers. This paper is part of the Journal of
Environmental Engineering, Vol. 136, No. 4, April 1, 2010. ©ASCE,
ISSN 0733-9372/2010/4-417–426/$25.00.
JOURNAL OF ENVIRONMENTAL ENGINEERING © ASCE / APRIL 2010 / 417
Downloaded 30 Mar 2012 to 147.188.147.142. Redistribution subject to ASCE license or copyright. Visit http://www.ascelibrary.org
hydraulic conductivity of sludge which is very low. Barton et al.~1999! demonstrated that at bench scale conventional pressurefiltration could be enhanced by the application of an electric fieldand proved its potential to improve dewatering of difficult mate-rials such as sewage sludge cakes. They produced sludge cakeswith solids contents of 35–46% ~by weight! using electrokineti-cally enhanced dewatering, compared with 24–30% using pres-sure filtration alone. Gingerich et al. ~1999! showed that finalcake solids could be increased to as much as 50% with the appli-cation of 60 V direct current ~DC! to wastewater sludge.The effectiveness of the EK dewatering process is controlled
by a number of treatment variables including treatment time, po-tential difference, and sample thickness. Yuan and Weng ~2003!investigated the effects of processing time and potential gradient~potential difference divided by sample thickness! on the waterremoval by the EK process and the results showed that increasingeither the potential gradient or the processing time would enhancethe sludge dewatering effectiveness ~in terms of percentage ofsolids content achieved!.Thus while the concept has been demonstrated and indications
of the influencing parameters have been reported in the literature,there is no specific direction to the engineer wishing to makepractical use of the process either to modify existing machinery orto maximize the efficiency via the choice of appropriate operatingconditions such as voltage or current levels, sample thickness, andtreatment time. This paper presents a framework for the design ofelectrokinetically enhanced dewatering of sludge using processesbased on parallel plates, as used in belt presses or plate presses,and demonstrates its applicability through an experimental pro-gram which examines the above parameters together with the typeof electrode used and the level of applied pressure. It also dis-cusses the implications of the results on the operating parametersof a practical sludge dewatering device.
Theoretical Basis for EK Dewatering
When a DC is applied to saturated fine-grained soils, the electro-potential developed between the electrodes induces fluid flowthrough the soil mass in a process known as electroosmosis. TheHelmholtz-Smoluchowski theory is the earliest and most widelyused ~Mitchell 1991! to describe this phenomenon. It states thatthe electroosmotic flow of water through a fine-grained materialcan be written as
qe = ke 3 ie 3 A s1d
where qe=electroosmotic flow rate; ie=potential gradient=DV /DL ~where V is voltage and L is distance between twoelectrodes!; A=cross-sectional area; and ke=coefficient of elec-troosmotic permeability. This is very similar in form to Darcy’sequation for hydraulic flow through a soil
qh = kh 3 ih 3 A s2d
where qh=water flow rate; ih=hydraulic gradient=DH /DL
~where H is hydraulic head!; A=cross-sectional area; and kh is thehydraulic permeability, or coefficient of hydraulic conductivity, ofthe soil. There is a fundamental difference in the two permeabili-ties, ke and kh; whereas ke is independent of the size of the indi-vidual grains or pores and kh is very strongly influenced by poresize ~Casagrande 1949!.To simplify the analysis of the EK dewatering process, ke is
assumed to be a constant in most mathematical models ~Esrig1968!. From Eq. ~1!, if ke is assumed to be constant, then the
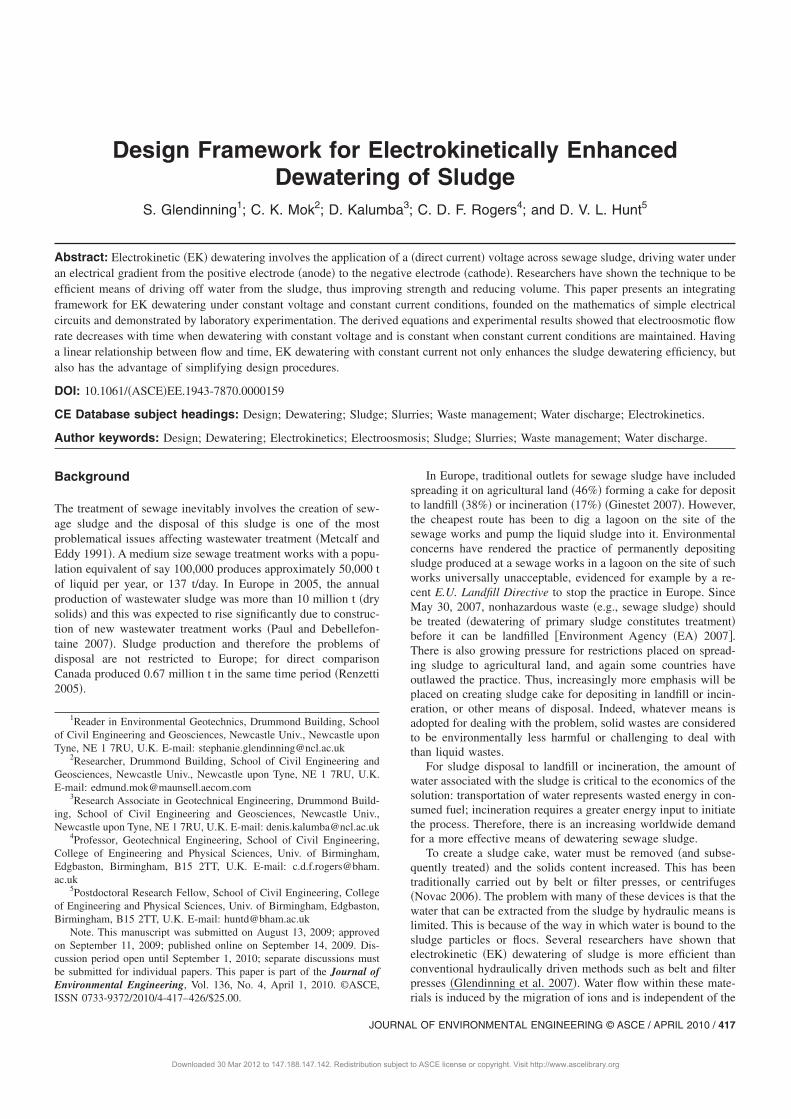
graph for the cumulative volume of extracted water versus ap-plied voltage should be linear when the cross-sectional area of thecell and the voltage gradient are maintained at a constant. How-ever, in reality ke decreases with increasing treatment time and theelectroosmotic flow rate slows down due to electrochemical reac-tions and desiccation at the anode ~positive electrode! causing anincrease in electrical resistance, i.e., in practice conditions changeand this must be recognized. Fig. 1~a! shows a typical graph ofcumulative volume of collected water against treatment time plot-ted from experimental data for a sample of constant cross-sectional area with a constant potential gradient. Slopes OA andOB represent the global flow rate at times A and B, respectively,after the start of the experiment. Given that the gradient of OA isgreater than that of OB, it is clear that ke decreases with time asthe flow rate decreases with time. Therefore, the assumption thatke is constant for design cannot be valid since a constant flow rateis unattainable under constant voltage conditions. In Table 1, thefactors affecting the EK dewatering process are summarized. It isapparent from the table that many factors have to be considered inthe design of EK dewatering systems. Therefore, further refine-ment of the Helmholtz-Smoluchowski equation to produce a de-sign framework is fraught with difficulty and alternative solutionsare required.
Deriving Design Equations for EK Dewatering
The equations presented herein are based upon modeling the en-tire dewatering system as an electric circuit and using supportingmathematics to produce an integrating framework for design. Thefollowing assumptions are used in the derivation: ~1! the sludge ishomogeneous and fully saturated; ~2! there is no movement ofsolid particles by electrophoretic migration; ~3! the water in thesludge moves electroosmotically in the one-dimensional directionbetween electrodes; ~4! ke is constant with time; ~5! Darcy’s lawand Ohm’s law are applicable during EK dewatering; and ~6! theelectrodes and sludge are considered to be in a static system.
Modeling the EK System as an Electrical Circuit
In an EK dewatering system, two conducting electrode platesconnected across a voltage source are placed sandwiching a massof sludge. In physics, this would be regarded as an electricalcircuit connecting a capacitor. A capacitor consists of two con-ducting plates separated by an insulating layer called a dielectric.When a capacitor is connected in a circuit across a voltage source,the voltage forces electrons onto the surface of one plate and pullselectrons off the surface of the other plate resulting in a potentialdifference between the plates. In modeling an EK dewatering sys-tem, the sludge would represent the insulating layer separatingtwo conducting electrodes. Using this analogy, EK dewatering
(a) (b)
Fig. 1. Typical experimental EK dewatering under ~a! constant volt-
age conditions; ~b! constant current conditions
418 / JOURNAL OF ENVIRONMENTAL ENGINEERING © ASCE / APRIL 2010
Downloaded 30 Mar 2012 to 147.188.147.142. Redistribution subject to ASCE license or copyright. Visit http://www.ascelibrary.org
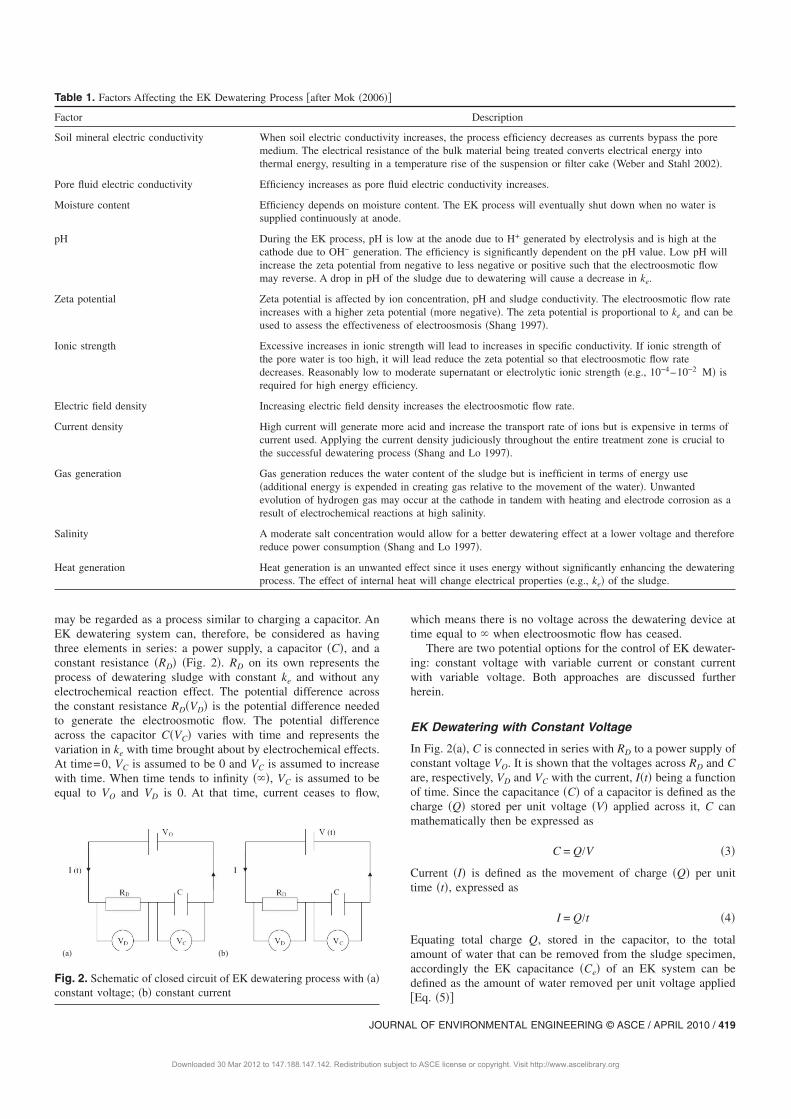
may be regarded as a process similar to charging a capacitor. AnEK dewatering system can, therefore, be considered as havingthree elements in series: a power supply, a capacitor sCd, and aconstant resistance sRDd ~Fig. 2!. RD on its own represents theprocess of dewatering sludge with constant ke and without anyelectrochemical reaction effect. The potential difference acrossthe constant resistance RDsVDd is the potential difference neededto generate the electroosmotic flow. The potential differenceacross the capacitor CsVCd varies with time and represents thevariation in ke with time brought about by electrochemical effects.At time=0, VC is assumed to be 0 and VC is assumed to increasewith time. When time tends to infinity s`d, VC is assumed to beequal to VO and VD is 0. At that time, current ceases to flow,
which means there is no voltage across the dewatering device attime equal to ` when electroosmotic flow has ceased.There are two potential options for the control of EK dewater-
ing: constant voltage with variable current or constant currentwith variable voltage. Both approaches are discussed furtherherein.
EK Dewatering with Constant Voltage
In Fig. 2~a!, C is connected in series with RD to a power supply ofconstant voltage VO. It is shown that the voltages across RD and C
are, respectively, VD and VC with the current, Istd being a functionof time. Since the capacitance sCd of a capacitor is defined as thecharge sQd stored per unit voltage sVd applied across it, C canmathematically then be expressed as
C = Q/V s3d
Current sId is defined as the movement of charge sQd per unittime std, expressed as
I = Q/t s4d
Equating total charge Q, stored in the capacitor, to the totalamount of water that can be removed from the sludge specimen,accordingly the EK capacitance sCed of an EK system can bedefined as the amount of water removed per unit voltage applied@Eq. ~5!#
Table 1. Factors Affecting the EK Dewatering Process @after Mok ~2006!#
Factor Description
Soil mineral electric conductivity When soil electric conductivity increases, the process efficiency decreases as currents bypass the pore
medium. The electrical resistance of the bulk material being treated converts electrical energy into
thermal energy, resulting in a temperature rise of the suspension or filter cake ~Weber and Stahl 2002!.
Pore fluid electric conductivity Efficiency increases as pore fluid electric conductivity increases.
Moisture content Efficiency depends on moisture content. The EK process will eventually shut down when no water is
supplied continuously at anode.
pH During the EK process, pH is low at the anode due to H+ generated by electrolysis and is high at the
cathode due to OH− generation. The efficiency is significantly dependent on the pH value. Low pH will
increase the zeta potential from negative to less negative or positive such that the electroosmotic flow
may reverse. A drop in pH of the sludge due to dewatering will cause a decrease in ke.
Zeta potential Zeta potential is affected by ion concentration, pH and sludge conductivity. The electroosmotic flow rate
increases with a higher zeta potential ~more negative!. The zeta potential is proportional to ke and can be
used to assess the effectiveness of electroosmosis ~Shang 1997!.
Ionic strength Excessive increases in ionic strength will lead to increases in specific conductivity. If ionic strength of
the pore water is too high, it will lead reduce the zeta potential so that electroosmotic flow rate
decreases. Reasonably low to moderate supernatant or electrolytic ionic strength ~e.g., 10−4–10−2 M! is
required for high energy efficiency.
Electric field density Increasing electric field density increases the electroosmotic flow rate.
Current density High current will generate more acid and increase the transport rate of ions but is expensive in terms of
current used. Applying the current density judiciously throughout the entire treatment zone is crucial to
the successful dewatering process ~Shang and Lo 1997!.
Gas generation Gas generation reduces the water content of the sludge but is inefficient in terms of energy use
~additional energy is expended in creating gas relative to the movement of the water!. Unwanted
evolution of hydrogen gas may occur at the cathode in tandem with heating and electrode corrosion as a
result of electrochemical reactions at high salinity.
Salinity A moderate salt concentration would allow for a better dewatering effect at a lower voltage and therefore
reduce power consumption ~Shang and Lo 1997!.
Heat generation Heat generation is an unwanted effect since it uses energy without significantly enhancing the dewatering
process. The effect of internal heat will change electrical properties ~e.g., ke! of the sludge.
(a) (b)
Fig. 2. Schematic of closed circuit of EK dewatering process with ~a!
constant voltage; ~b! constant current
JOURNAL OF ENVIRONMENTAL ENGINEERING © ASCE / APRIL 2010 / 419
Downloaded 30 Mar 2012 to 147.188.147.142. Redistribution subject to ASCE license or copyright. Visit http://www.ascelibrary.org
Ce = Q/V s5d
When the power supply is switched on, the initial current I0 isindependent of Ce whose potential difference is 0. Thus
IO = VO/RD s6d
Because I decreases with t, the potential difference across sRDdcan be written as
VD = IstdRD s7d
The potential difference across Ce is
VC = Q/Ce s8d
dVC
dt=
Istd
Ce
s9d
At any instant, the voltage from power supply V0 is the sum of VD
and VC. Thus
VO = VD + VC s10d
and
dVO
dt=
dVD
dt=
dVC
dt
Substituting from Eqs. ~7! and ~9!
0 = RD
dIstd
dt+
Istd
Ce
From first order nonhomogenous differential equation
adfsxd
dx+ bfsxd + c = 0
fsxd = Be−bx/a +c
bfe−bx/a − 1g, where fsxd = B at x = 0
Therefore
Istd =VO
RD
e−t/RDCe s11d
Istd = IOe−t/RDCe s12d
Substituting Eq. ~12! into Eq. ~7!, the potential difference acrossthe dewatering device is
VDstd = RDIOe−t/RDCe s13d
Substituting Eq. ~13! into Eq. ~10!, the potential difference acrossthe capacitor is:
VCstd = VOs1 − e−t/RDCed s14d
It is clear from Eq. ~13! that the voltage across the dewateringdevice is a function of time and decreases exponentially. There-fore, the potential gradient DV /DL also is a function of time anddecreases exponentially. The cumulative volume of the effluentcan be given by
Volstd =E0
t
ke 3 A 3VDstd
Ldt s15d
Assuming L remains constant throughout EK treatment, and sub-stituting Eq. ~13! into Eq. ~15!, the cumulative volume of col-lected water by EK can be expressed as
Volstd =ke 3 A 3 RD 3 IO
LE0
t
e−t/RDCedt
Volstd =ke 3 A 3 VO
Ls1 − e−t/RDCed s16d
Eq. ~16! shows that EK flow rate decreases with time eventhough ke is assumed to be constant. According to the Eq. ~16! therelationship between the cumulative volume and time, duringsludge dewatering at constant voltage, could be represented as inFig. 1~a!.
EK Dewatering with Constant Current
Under constant current conditions @Fig. 2~b!#, since the resistanceof the capacitor increases periodically, the voltage from the powersupply has to increase in order maintain the constant current.However, because I and RD are constant, VD remains constant,i.e.,
VD = IRD s17d
When the power supply is switched on, the initial voltage V0 isindependent of variable C. Thus
VO = IRD s18d
At any instant, the voltage from the power supply Vstd is the sumof VD and VC. Thus,
Vstd = VD + VC s19d
dVstd
dt=
dVD
dt+
dVCstd
dts20d
During the EK dewatering process, while VC varies with time andVD is a constant. Thus
dVstd
dt=
dVCstd
dts21d
Therefore, the rate of change of voltage from the power supply isidentical to that of VC.Assuming L is constant, and substituting Eq. ~17! into Eq.
~15!, the cumulative volume of collected water can be expressedas
Volstd =keAIRD
LE0
t
dt s22d
Volstd =keAIRDt
Ls23d
Eqs. ~23! shows that the EK flow rate is proportional to the cur-rent when the sludge is electrokinetically treated with constantcurrent @Fig. 1~b!#. The slope of the graph in Fig. 1~b! representsthe electroosmotic flow rate qesm
3/sd which can be expressed as
qe = kejeARO s24d
where je represents current gradient=DI /DL. In Eq. ~24!, ke isstill used to define an intrinsic material property, but the units arein m2 /s-A-V to account for the way it changes with increasingresistance ~which increases with treatment time!.While these theories provide a solid basis for understanding
the phenomena and providing a means of design, there are prac-tical limitations that will temper any outcomes. For example, the
420 / JOURNAL OF ENVIRONMENTAL ENGINEERING © ASCE / APRIL 2010
Downloaded 30 Mar 2012 to 147.188.147.142. Redistribution subject to ASCE license or copyright. Visit http://www.ascelibrary.org
necessary throughput volumes will influence the operating param-
eters in a belt or plate press. Similarly the volume of effluent
under constant voltage @Fig. 1~a!# is limited and this in turn limits
the time over which the process is effective, while under constant
current the process is limited by drying, occurring around the
anode or a practical limitation on voltage as it increases to keep
the current constant as the resistance increases. The type of sludge
will also control the efficacy of dewatering. It is appreciated that
the equations developed appear more suitable for a batch ~static!
process where there is a clearly defined start and finishing point to
the treatment time. However, even in a dynamic system, where
there is a continuous feed of sludge, these equations are consid-
ered to be useful when determining the average belt separation
and sludge residency time, and therefore in the control of the
throughput rate. Using constant current in this situation is also
considered useful for managing the differences in material and
chemical properties of the input feed.
Experimental Program
To demonstrate the applicability of the derived design equations,
a series of experiments was conducted investigating the cumula-
tive volumes of effluent water from treated sludge under both
constant voltage and constant current conditions. The overall ef-
ficiency of EK treatment based on the dewatering rate, final solids
content and power consumption were also examined. The practi-
cal situation modeled is EK enhancement of the belt press, al-
though the same principles apply to batch processing in a plate
press assisted by EK technology. This testing was done using a
combination of different levels of applied stress and EK using
different operating parameters. This, in fact, is essential since
electrode contact must be maintained as dewatering occurs, so a
minimum applied pressure of 25 kPa was adopted. The maximum
likely length of treatment in a belt press is 1 h, so this length of
experiment was adopted with frequent readings up to this time.
While a plate press would typically operate over a longer period
of time, if EK enhancement were to be contemplated then a con-
siderable reduction in treatment time would be required and thus
treatments up to 1 h are consistent with this philosophy. The EK
process results in heat generation, though not to a level sufficient
to significantly affect effluent volumes ~the value of ke might
vary, but no water loss due to evaporation would occur!. In addi-
tion it is likely that the heat generated in the closed laboratory cell
would be greater than that in an operational belt press. Gas gen-
eration due to hydrolysis, on the other hand, would occur equally
in the laboratory or in practice and the results are therefore di-
rectly applicable.
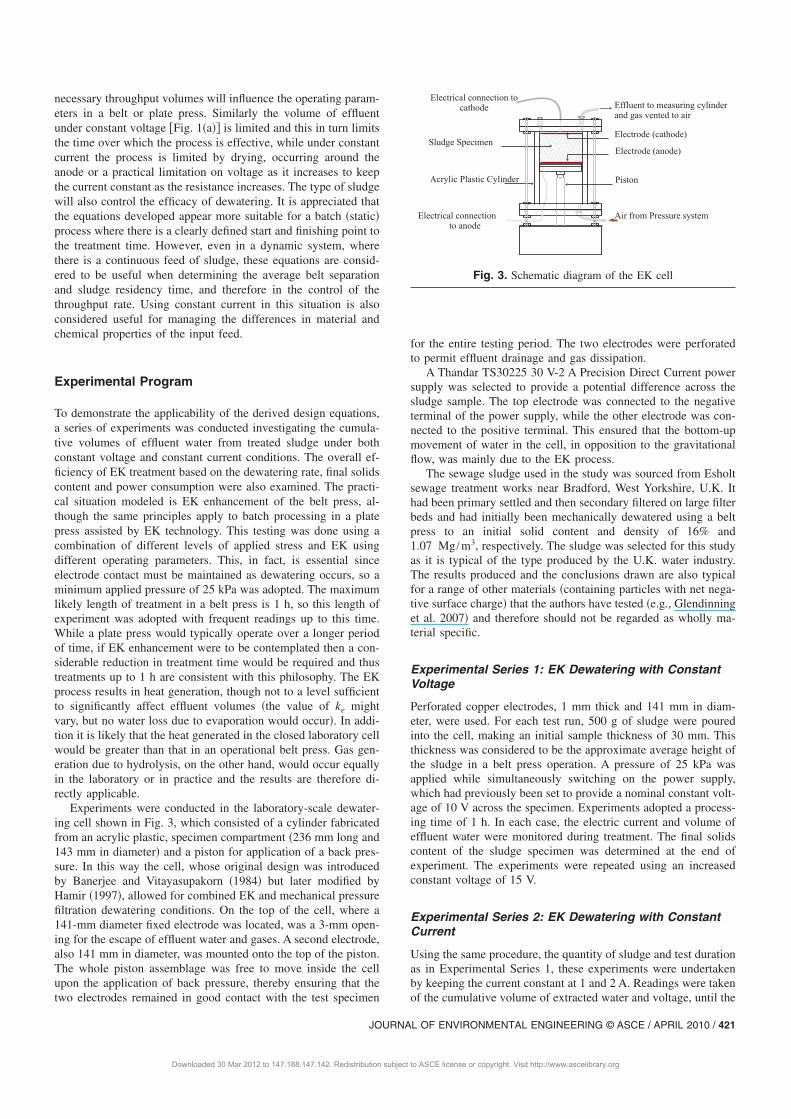
Experiments were conducted in the laboratory-scale dewater-
ing cell shown in Fig. 3, which consisted of a cylinder fabricated
from an acrylic plastic, specimen compartment ~236 mm long and
143 mm in diameter! and a piston for application of a back pres-
sure. In this way the cell, whose original design was introduced
by Banerjee and Vitayasupakorn ~1984! but later modified by
Hamir ~1997!, allowed for combined EK and mechanical pressure
filtration dewatering conditions. On the top of the cell, where a
141-mm diameter fixed electrode was located, was a 3-mm open-
ing for the escape of effluent water and gases. A second electrode,
also 141 mm in diameter, was mounted onto the top of the piston.
The whole piston assemblage was free to move inside the cell
upon the application of back pressure, thereby ensuring that the
two electrodes remained in good contact with the test specimen
for the entire testing period. The two electrodes were perforatedto permit effluent drainage and gas dissipation.A Thandar TS30225 30 V-2 A Precision Direct Current power
supply was selected to provide a potential difference across thesludge sample. The top electrode was connected to the negativeterminal of the power supply, while the other electrode was con-nected to the positive terminal. This ensured that the bottom-upmovement of water in the cell, in opposition to the gravitationalflow, was mainly due to the EK process.The sewage sludge used in the study was sourced from Esholt
sewage treatment works near Bradford, West Yorkshire, U.K. Ithad been primary settled and then secondary filtered on large filterbeds and had initially been mechanically dewatered using a beltpress to an initial solid content and density of 16% and1.07 Mg /m3, respectively. The sludge was selected for this studyas it is typical of the type produced by the U.K. water industry.The results produced and the conclusions drawn are also typicalfor a range of other materials ~containing particles with net nega-tive surface charge! that the authors have tested ~e.g., Glendinninget al. 2007! and therefore should not be regarded as wholly ma-terial specific.
Experimental Series 1: EK Dewatering with ConstantVoltage
Perforated copper electrodes, 1 mm thick and 141 mm in diam-eter, were used. For each test run, 500 g of sludge were pouredinto the cell, making an initial sample thickness of 30 mm. Thisthickness was considered to be the approximate average height ofthe sludge in a belt press operation. A pressure of 25 kPa wasapplied while simultaneously switching on the power supply,which had previously been set to provide a nominal constant volt-age of 10 V across the specimen. Experiments adopted a process-ing time of 1 h. In each case, the electric current and volume ofeffluent water were monitored during treatment. The final solidscontent of the sludge specimen was determined at the end ofexperiment. The experiments were repeated using an increasedconstant voltage of 15 V.
Experimental Series 2: EK Dewatering with ConstantCurrent
Using the same procedure, the quantity of sludge and test durationas in Experimental Series 1, these experiments were undertakenby keeping the current constant at 1 and 2 A. Readings were takenof the cumulative volume of extracted water and voltage, until the
Electrical connection tocathode Effluent to measuring cylinder
and gas vented to air
Sludge Specimen
Piston
Electrode (anode)
Air from Pressure systemElectrical connectionto anode
Electrode (cathode)
Acrylic Plastic Cylinder
Fig. 3. Schematic diagram of the EK cell
JOURNAL OF ENVIRONMENTAL ENGINEERING © ASCE / APRIL 2010 / 421
Downloaded 30 Mar 2012 to 147.188.147.142. Redistribution subject to ASCE license or copyright. Visit http://www.ascelibrary.org
voltage reached a maximum of 30 V set by the rating of thepower supply. At this point the current was allowed to vary ac-cordingly.
Experimental Series 3: Investigation of TreatmentVariables
Tests were conducted following the same procedure as for Experi-mental Series 2, but investigated the effect of applied pressure byincreasing the mechanical pressure to 50 and 75 kPa, the effect ofelectrode conductivity by replacing the copper electrodes withcarbon electrodes of the same dimensions, and the effect ofsample size by halving the sample thickness to 15 mm. In all thedifferent test scenarios, parallel control tests in which no voltagewas applied across the specimen, were conducted.
Results and Discussion
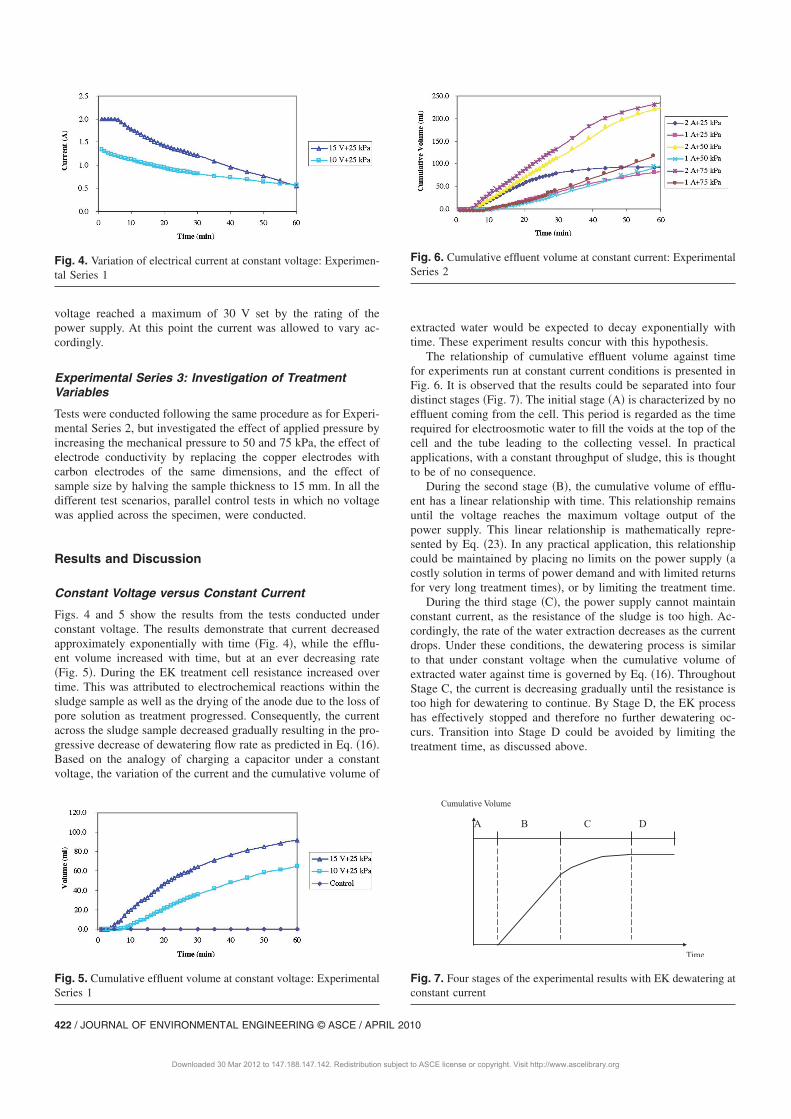
Constant Voltage versus Constant Current
Figs. 4 and 5 show the results from the tests conducted underconstant voltage. The results demonstrate that current decreasedapproximately exponentially with time ~Fig. 4!, while the efflu-ent volume increased with time, but at an ever decreasing rate~Fig. 5!. During the EK treatment cell resistance increased overtime. This was attributed to electrochemical reactions within thesludge sample as well as the drying of the anode due to the loss ofpore solution as treatment progressed. Consequently, the currentacross the sludge sample decreased gradually resulting in the pro-gressive decrease of dewatering flow rate as predicted in Eq. ~16!.Based on the analogy of charging a capacitor under a constantvoltage, the variation of the current and the cumulative volume of
extracted water would be expected to decay exponentially withtime. These experiment results concur with this hypothesis.The relationship of cumulative effluent volume against time
for experiments run at constant current conditions is presented inFig. 6. It is observed that the results could be separated into fourdistinct stages ~Fig. 7!. The initial stage ~A! is characterized by noeffluent coming from the cell. This period is regarded as the timerequired for electroosmotic water to fill the voids at the top of thecell and the tube leading to the collecting vessel. In practicalapplications, with a constant throughput of sludge, this is thoughtto be of no consequence.During the second stage ~B!, the cumulative volume of efflu-
ent has a linear relationship with time. This relationship remainsuntil the voltage reaches the maximum voltage output of thepower supply. This linear relationship is mathematically repre-sented by Eq. ~23!. In any practical application, this relationshipcould be maintained by placing no limits on the power supply ~acostly solution in terms of power demand and with limited returnsfor very long treatment times!, or by limiting the treatment time.During the third stage ~C!, the power supply cannot maintain
constant current, as the resistance of the sludge is too high. Ac-cordingly, the rate of the water extraction decreases as the currentdrops. Under these conditions, the dewatering process is similarto that under constant voltage when the cumulative volume ofextracted water against time is governed by Eq. ~16!. ThroughoutStage C, the current is decreasing gradually until the resistance istoo high for dewatering to continue. By Stage D, the EK processhas effectively stopped and therefore no further dewatering oc-curs. Transition into Stage D could be avoided by limiting thetreatment time, as discussed above.
Fig. 4. Variation of electrical current at constant voltage: Experimen-
tal Series 1
Fig. 5. Cumulative effluent volume at constant voltage: Experimental
Series 1
Fig. 6. Cumulative effluent volume at constant current: Experimental
Series 2
Time
A B C D
Cumulative Volume
Fig. 7. Four stages of the experimental results with EK dewatering at
constant current
422 / JOURNAL OF ENVIRONMENTAL ENGINEERING © ASCE / APRIL 2010
Downloaded 30 Mar 2012 to 147.188.147.142. Redistribution subject to ASCE license or copyright. Visit http://www.ascelibrary.org
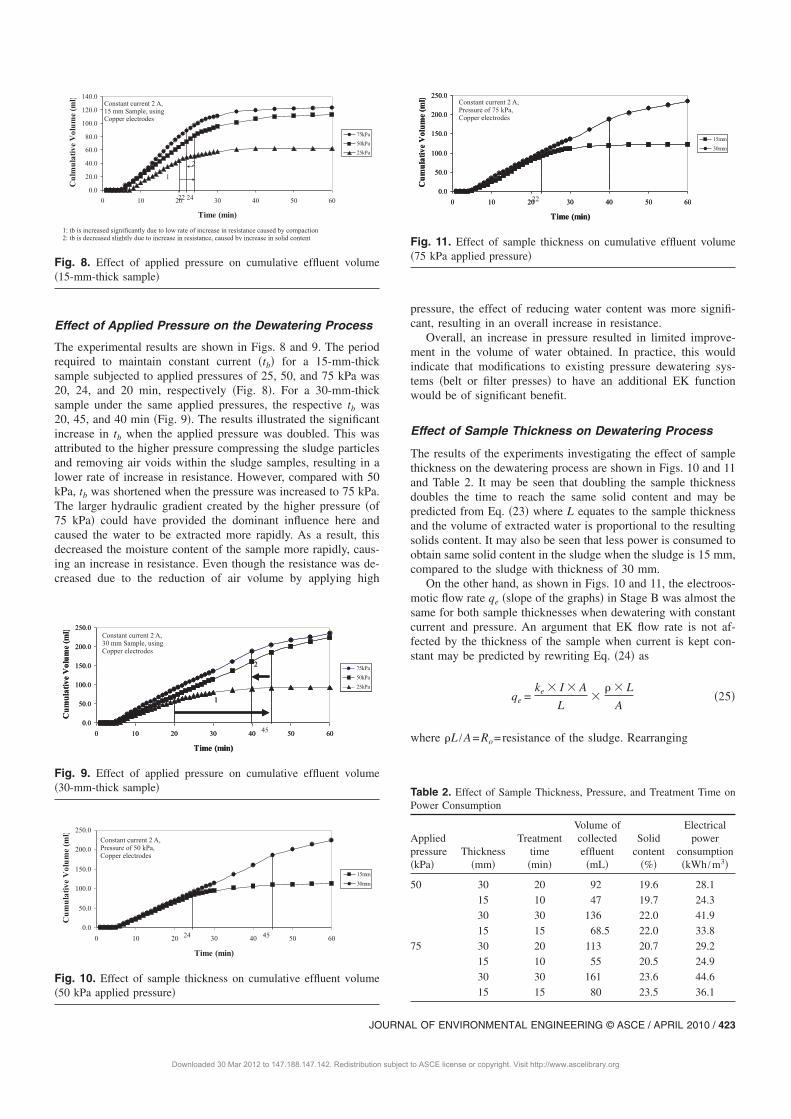
Effect of Applied Pressure on the Dewatering Process
The experimental results are shown in Figs. 8 and 9. The periodrequired to maintain constant current stbd for a 15-mm-thicksample subjected to applied pressures of 25, 50, and 75 kPa was20, 24, and 20 min, respectively ~Fig. 8!. For a 30-mm-thicksample under the same applied pressures, the respective tb was20, 45, and 40 min ~Fig. 9!. The results illustrated the significantincrease in tb when the applied pressure was doubled. This wasattributed to the higher pressure compressing the sludge particlesand removing air voids within the sludge samples, resulting in alower rate of increase in resistance. However, compared with 50kPa, tb was shortened when the pressure was increased to 75 kPa.The larger hydraulic gradient created by the higher pressure ~of75 kPa! could have provided the dominant influence here andcaused the water to be extracted more rapidly. As a result, thisdecreased the moisture content of the sample more rapidly, caus-ing an increase in resistance. Even though the resistance was de-creased due to the reduction of air volume by applying high
pressure, the effect of reducing water content was more signifi-cant, resulting in an overall increase in resistance.Overall, an increase in pressure resulted in limited improve-
ment in the volume of water obtained. In practice, this wouldindicate that modifications to existing pressure dewatering sys-tems ~belt or filter presses! to have an additional EK functionwould be of significant benefit.
Effect of Sample Thickness on Dewatering Process
The results of the experiments investigating the effect of samplethickness on the dewatering process are shown in Figs. 10 and 11and Table 2. It may be seen that doubling the sample thicknessdoubles the time to reach the same solid content and may bepredicted from Eq. ~23! where L equates to the sample thicknessand the volume of extracted water is proportional to the resultingsolids content. It may also be seen that less power is consumed toobtain same solid content in the sludge when the sludge is 15 mm,compared to the sludge with thickness of 30 mm.On the other hand, as shown in Figs. 10 and 11, the electroos-
motic flow rate qe ~slope of the graphs! in Stage B was almost thesame for both sample thicknesses when dewatering with constantcurrent and pressure. An argument that EK flow rate is not af-fected by the thickness of the sample when current is kept con-stant may be predicted by rewriting Eq. ~24! as
qe =ke 3 I 3 A
L3
r 3 L
As25d
where rL /A=Ro=resistance of the sludge. Rearranging
Table 2. Effect of Sample Thickness, Pressure, and Treatment Time on
Power Consumption
Applied
pressure
~kPa!
Thickness
~mm!
Treatment
time
~min!
Volume of
collected
effluent
~mL!
Solid
content
~%!
Electrical
power
consumption
skWh /m3d
50 30 20 92 19.6 28.1
15 10 47 19.7 24.3
30 30 136 22.0 41.9
15 15 68.5 22.0 33.8
75 30 20 113 20.7 29.2
15 10 55 20.5 24.9
30 30 161 23.6 44.6
15 15 80 23.5 36.1
1: tb is increased significantly due to low rate of increase in resistance caused by compaction2: tb is decreased slightly due to increase in resistance, caused by increase in solid content
22 24
12
Constant current 2 A,15 mm Sample, usingCopper electrodes
Fig. 8. Effect of applied pressure on cumulative effluent volume
~15-mm-thick sample!
1
2
45
1
2
Constant current 2 A,30 mm Sample, usingCopper electrodes
Fig. 9. Effect of applied pressure on cumulative effluent volume
~30-mm-thick sample!
24 45
Constant current 2 A,Pressure of 50 kPa,Copper electrodes
Fig. 10. Effect of sample thickness on cumulative effluent volume
~50 kPa applied pressure!
22
Constant current 2 A,Pressure of 75 kPa,Copper electrodes
Fig. 11. Effect of sample thickness on cumulative effluent volume
~75 kPa applied pressure!
JOURNAL OF ENVIRONMENTAL ENGINEERING © ASCE / APRIL 2010 / 423
Downloaded 30 Mar 2012 to 147.188.147.142. Redistribution subject to ASCE license or copyright. Visit http://www.ascelibrary.org
qe = ke 3 I 3 r s26d
Therefore, it may be shown that electroosmotic flow rate qe is afunction of ke, current I, and initial resistivity r. It is independentof cross-sectional area A and sample thickness L. The dimensionof the sludge affects its resistance only. Therefore, in the design ofan EK dewatering system, the sample thickness should be kept asthin as possible to minimize the resistance, provided that constantcurrent can be maintained for dewatering the sludge to a requiredfinal solid concentration.
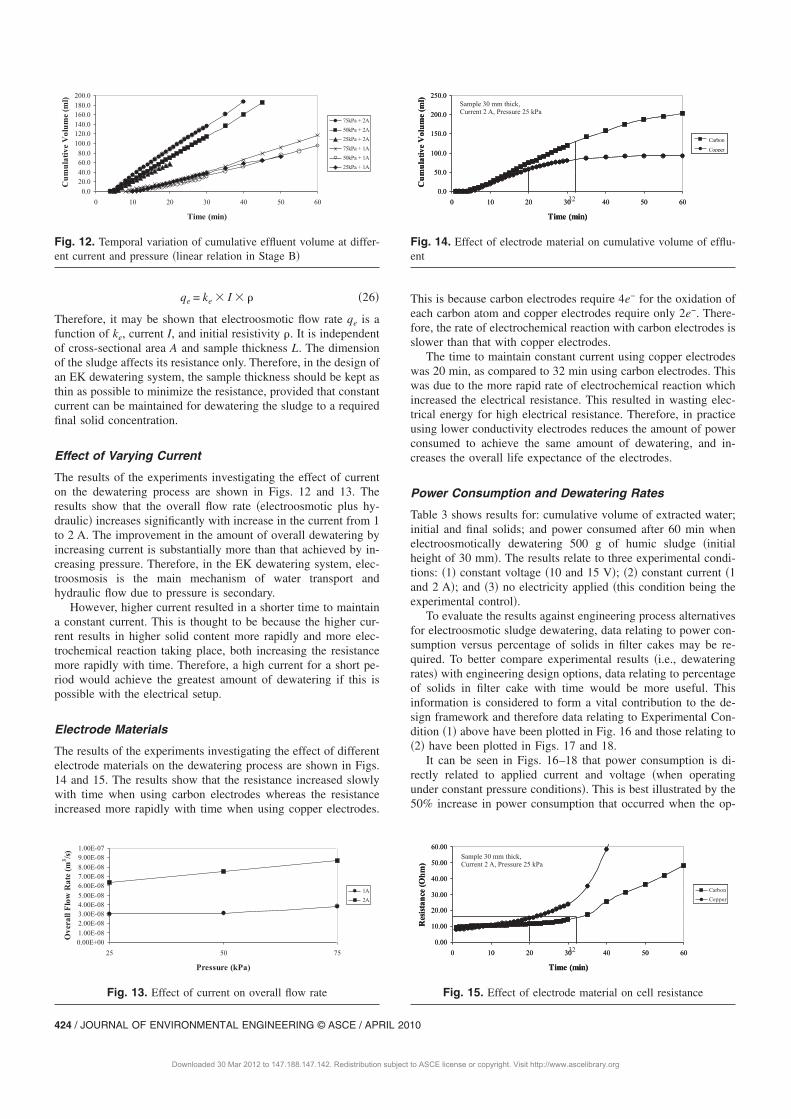
Effect of Varying Current
The results of the experiments investigating the effect of currenton the dewatering process are shown in Figs. 12 and 13. Theresults show that the overall flow rate ~electroosmotic plus hy-draulic! increases significantly with increase in the current from 1to 2 A. The improvement in the amount of overall dewatering byincreasing current is substantially more than that achieved by in-creasing pressure. Therefore, in the EK dewatering system, elec-troosmosis is the main mechanism of water transport andhydraulic flow due to pressure is secondary.However, higher current resulted in a shorter time to maintain
a constant current. This is thought to be because the higher cur-rent results in higher solid content more rapidly and more elec-trochemical reaction taking place, both increasing the resistancemore rapidly with time. Therefore, a high current for a short pe-riod would achieve the greatest amount of dewatering if this ispossible with the electrical setup.
Electrode Materials
The results of the experiments investigating the effect of differentelectrode materials on the dewatering process are shown in Figs.14 and 15. The results show that the resistance increased slowlywith time when using carbon electrodes whereas the resistanceincreased more rapidly with time when using copper electrodes.
This is because carbon electrodes require 4e− for the oxidation ofeach carbon atom and copper electrodes require only 2e−. There-fore, the rate of electrochemical reaction with carbon electrodes isslower than that with copper electrodes.The time to maintain constant current using copper electrodes
was 20 min, as compared to 32 min using carbon electrodes. Thiswas due to the more rapid rate of electrochemical reaction whichincreased the electrical resistance. This resulted in wasting elec-trical energy for high electrical resistance. Therefore, in practiceusing lower conductivity electrodes reduces the amount of powerconsumed to achieve the same amount of dewatering, and in-creases the overall life expectance of the electrodes.
Power Consumption and Dewatering Rates
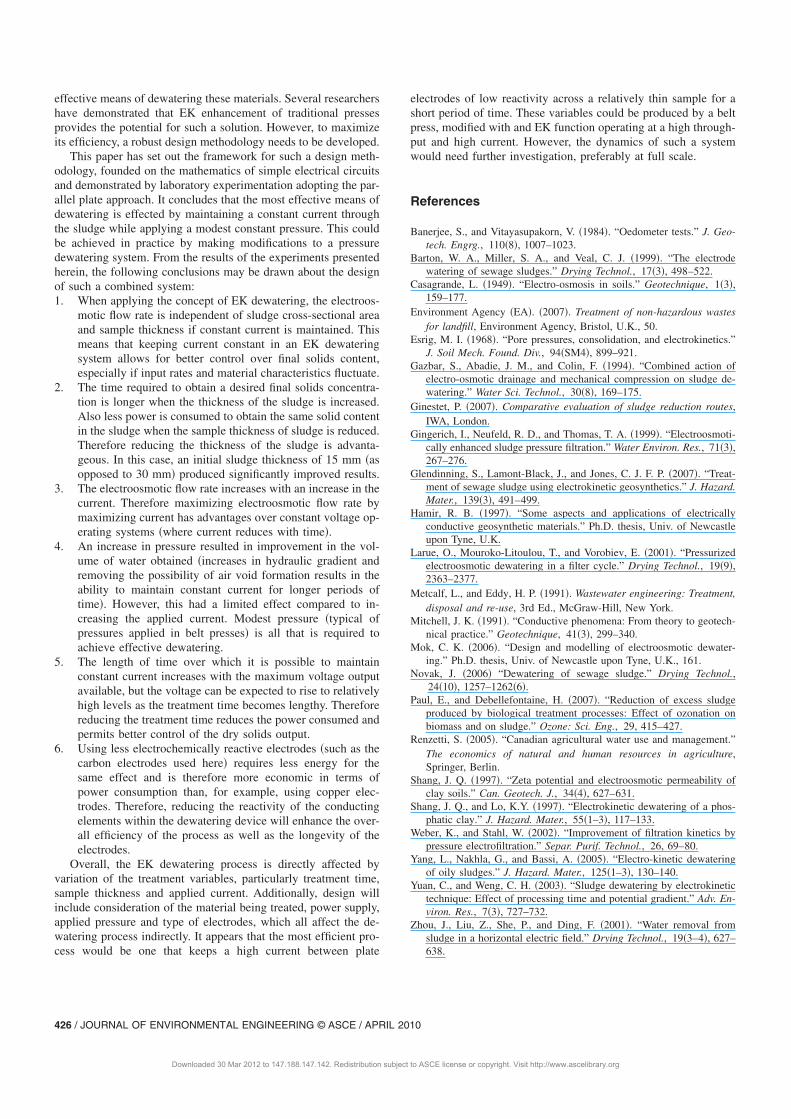
Table 3 shows results for: cumulative volume of extracted water;initial and final solids; and power consumed after 60 min whenelectroosmotically dewatering 500 g of humic sludge ~initialheight of 30 mm!. The results relate to three experimental condi-tions: ~1! constant voltage ~10 and 15 V!; ~2! constant current ~1and 2 A!; and ~3! no electricity applied ~this condition being theexperimental control!.To evaluate the results against engineering process alternatives
for electroosmotic sludge dewatering, data relating to power con-sumption versus percentage of solids in filter cakes may be re-quired. To better compare experimental results ~i.e., dewateringrates! with engineering design options, data relating to percentageof solids in filter cake with time would be more useful. Thisinformation is considered to form a vital contribution to the de-sign framework and therefore data relating to Experimental Con-dition ~1! above have been plotted in Fig. 16 and those relating to~2! have been plotted in Figs. 17 and 18.It can be seen in Figs. 16–18 that power consumption is di-
rectly related to applied current and voltage ~when operatingunder constant pressure conditions!. This is best illustrated by the50% increase in power consumption that occurred when the op-
Fig. 12. Temporal variation of cumulative effluent volume at differ-
ent current and pressure ~linear relation in Stage B!
Fig. 13. Effect of current on overall flow rate
32
Sample 30 mm thick,Current 2 A, Pressure 25 kPa
Fig. 14. Effect of electrode material on cumulative volume of efflu-
ent
32
Sample 30 mm thick,Current 2 A, Pressure 25 kPa
Fig. 15. Effect of electrode material on cell resistance
424 / JOURNAL OF ENVIRONMENTAL ENGINEERING © ASCE / APRIL 2010
Downloaded 30 Mar 2012 to 147.188.147.142. Redistribution subject to ASCE license or copyright. Visit http://www.ascelibrary.org
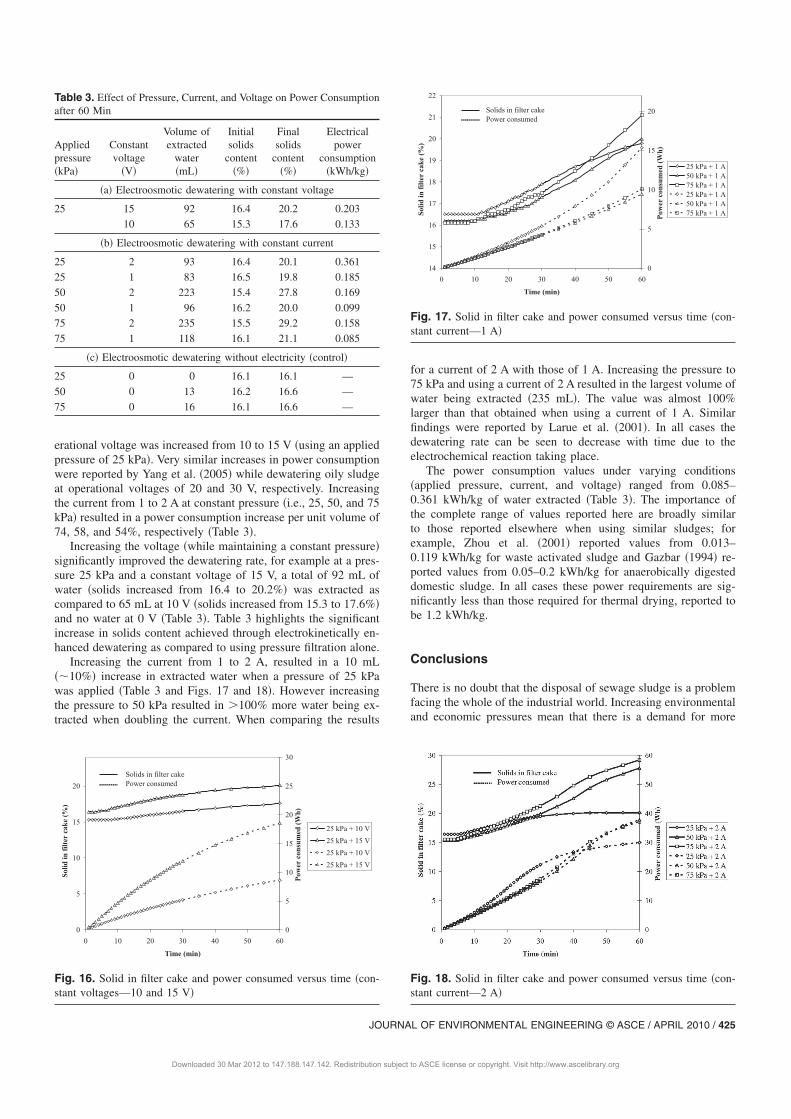
erational voltage was increased from 10 to 15 V ~using an appliedpressure of 25 kPa!. Very similar increases in power consumptionwere reported by Yang et al. ~2005! while dewatering oily sludgeat operational voltages of 20 and 30 V, respectively. Increasingthe current from 1 to 2 A at constant pressure ~i.e., 25, 50, and 75kPa! resulted in a power consumption increase per unit volume of74, 58, and 54%, respectively ~Table 3!.Increasing the voltage ~while maintaining a constant pressure!
significantly improved the dewatering rate, for example at a pres-sure 25 kPa and a constant voltage of 15 V, a total of 92 mL ofwater ~solids increased from 16.4 to 20.2%! was extracted ascompared to 65 mL at 10 V ~solids increased from 15.3 to 17.6%!
and no water at 0 V ~Table 3!. Table 3 highlights the significantincrease in solids content achieved through electrokinetically en-hanced dewatering as compared to using pressure filtration alone.Increasing the current from 1 to 2 A, resulted in a 10 mL
s,10%d increase in extracted water when a pressure of 25 kPawas applied ~Table 3 and Figs. 17 and 18!. However increasingthe pressure to 50 kPa resulted in .100% more water being ex-tracted when doubling the current. When comparing the results
for a current of 2 A with those of 1 A. Increasing the pressure to75 kPa and using a current of 2 A resulted in the largest volume ofwater being extracted ~235 mL!. The value was almost 100%larger than that obtained when using a current of 1 A. Similarfindings were reported by Larue et al. ~2001!. In all cases thedewatering rate can be seen to decrease with time due to theelectrochemical reaction taking place.The power consumption values under varying conditions
~applied pressure, current, and voltage! ranged from 0.085–0.361 kWh/kg of water extracted ~Table 3!. The importance ofthe complete range of values reported here are broadly similarto those reported elsewhere when using similar sludges; forexample, Zhou et al. ~2001! reported values from 0.013–0.119 kWh/kg for waste activated sludge and Gazbar ~1994! re-ported values from 0.05–0.2 kWh/kg for anaerobically digesteddomestic sludge. In all cases these power requirements are sig-nificantly less than those required for thermal drying, reported tobe 1.2 kWh/kg.
Conclusions
There is no doubt that the disposal of sewage sludge is a problemfacing the whole of the industrial world. Increasing environmentaland economic pressures mean that there is a demand for more
Table 3. Effect of Pressure, Current, and Voltage on Power Consumption
after 60 Min
Applied
pressure
~kPa!
Constant
voltage
~V!
Volume of
extracted
water
~mL!
Initial
solids
content
~%!
Final
solids
content
~%!
Electrical
power
consumption
~kWh/kg!
~a! Electroosmotic dewatering with constant voltage
25 15 92 16.4 20.2 0.203
10 65 15.3 17.6 0.133
~b! Electroosmotic dewatering with constant current
25 2 93 16.4 20.1 0.361
25 1 83 16.5 19.8 0.185
50 2 223 15.4 27.8 0.169
50 1 96 16.2 20.0 0.099
75 2 235 15.5 29.2 0.158
75 1 118 16.1 21.1 0.085
~c! Electroosmotic dewatering without electricity ~control!
25 0 0 16.1 16.1 —
50 0 13 16.2 16.6 —
75 0 16 16.1 16.6 —
Fig. 16. Solid in filter cake and power consumed versus time ~con-
stant voltages—10 and 15 V!
Fig. 17. Solid in filter cake and power consumed versus time ~con-
stant current—1 A!
Fig. 18. Solid in filter cake and power consumed versus time ~con-
stant current—2 A!
JOURNAL OF ENVIRONMENTAL ENGINEERING © ASCE / APRIL 2010 / 425
Downloaded 30 Mar 2012 to 147.188.147.142. Redistribution subject to ASCE license or copyright. Visit http://www.ascelibrary.org
effective means of dewatering these materials. Several researchershave demonstrated that EK enhancement of traditional pressesprovides the potential for such a solution. However, to maximizeits efficiency, a robust design methodology needs to be developed.This paper has set out the framework for such a design meth-
odology, founded on the mathematics of simple electrical circuitsand demonstrated by laboratory experimentation adopting the par-allel plate approach. It concludes that the most effective means ofdewatering is effected by maintaining a constant current throughthe sludge while applying a modest constant pressure. This couldbe achieved in practice by making modifications to a pressuredewatering system. From the results of the experiments presentedherein, the following conclusions may be drawn about the designof such a combined system:1. When applying the concept of EK dewatering, the electroos-
motic flow rate is independent of sludge cross-sectional areaand sample thickness if constant current is maintained. Thismeans that keeping current constant in an EK dewateringsystem allows for better control over final solids content,especially if input rates and material characteristics fluctuate.
2. The time required to obtain a desired final solids concentra-tion is longer when the thickness of the sludge is increased.Also less power is consumed to obtain the same solid contentin the sludge when the sample thickness of sludge is reduced.Therefore reducing the thickness of the sludge is advanta-geous. In this case, an initial sludge thickness of 15 mm ~asopposed to 30 mm! produced significantly improved results.
3. The electroosmotic flow rate increases with an increase in thecurrent. Therefore maximizing electroosmotic flow rate bymaximizing current has advantages over constant voltage op-erating systems ~where current reduces with time!.
4. An increase in pressure resulted in improvement in the vol-ume of water obtained ~increases in hydraulic gradient andremoving the possibility of air void formation results in theability to maintain constant current for longer periods oftime!. However, this had a limited effect compared to in-creasing the applied current. Modest pressure ~typical ofpressures applied in belt presses! is all that is required toachieve effective dewatering.
5. The length of time over which it is possible to maintainconstant current increases with the maximum voltage outputavailable, but the voltage can be expected to rise to relativelyhigh levels as the treatment time becomes lengthy. Thereforereducing the treatment time reduces the power consumed andpermits better control of the dry solids output.
6. Using less electrochemically reactive electrodes ~such as thecarbon electrodes used here! requires less energy for thesame effect and is therefore more economic in terms ofpower consumption than, for example, using copper elec-trodes. Therefore, reducing the reactivity of the conductingelements within the dewatering device will enhance the over-all efficiency of the process as well as the longevity of theelectrodes.Overall, the EK dewatering process is directly affected by
variation of the treatment variables, particularly treatment time,sample thickness and applied current. Additionally, design willinclude consideration of the material being treated, power supply,applied pressure and type of electrodes, which all affect the de-watering process indirectly. It appears that the most efficient pro-cess would be one that keeps a high current between plate
electrodes of low reactivity across a relatively thin sample for ashort period of time. These variables could be produced by a beltpress, modified with and EK function operating at a high through-put and high current. However, the dynamics of such a systemwould need further investigation, preferably at full scale.
References
Banerjee, S., and Vitayasupakorn, V. ~1984!. “Oedometer tests.” J. Geo-
tech. Engrg., 110~8!, 1007–1023.
Barton, W. A., Miller, S. A., and Veal, C. J. ~1999!. “The electrode
watering of sewage sludges.” Drying Technol., 17~3!, 498–522.
Casagrande, L. ~1949!. “Electro-osmosis in soils.” Geotechnique, 1~3!,
159–177.
Environment Agency ~EA!. ~2007!. Treatment of non-hazardous wastes
for landfill, Environment Agency, Bristol, U.K., 50.
Esrig, M. I. ~1968!. “Pore pressures, consolidation, and electrokinetics.”
J. Soil Mech. Found. Div., 94~SM4!, 899–921.
Gazbar, S., Abadie, J. M., and Colin, F. ~1994!. “Combined action of
electro-osmotic drainage and mechanical compression on sludge de-
watering.” Water Sci. Technol., 30~8!, 169–175.
Ginestet, P. ~2007!. Comparative evaluation of sludge reduction routes,
IWA, London.
Gingerich, I., Neufeld, R. D., and Thomas, T. A. ~1999!. “Electroosmoti-
cally enhanced sludge pressure filtration.” Water Environ. Res., 71~3!,
267–276.
Glendinning, S., Lamont-Black, J., and Jones, C. J. F. P. ~2007!. “Treat-
ment of sewage sludge using electrokinetic geosynthetics.” J. Hazard.
Mater., 139~3!, 491–499.
Hamir, R. B. ~1997!. “Some aspects and applications of electrically
conductive geosynthetic materials.” Ph.D. thesis, Univ. of Newcastle
upon Tyne, U.K.
Larue, O., Mouroko-Litoulou, T., and Vorobiev, E. ~2001!. “Pressurized
electroosmotic dewatering in a filter cycle.” Drying Technol., 19~9!,
2363–2377.
Metcalf, L., and Eddy, H. P. ~1991!. Wastewater engineering: Treatment,
disposal and re-use, 3rd Ed., McGraw-Hill, New York.
Mitchell, J. K. ~1991!. “Conductive phenomena: From theory to geotech-
nical practice.” Geotechnique, 41~3!, 299–340.
Mok, C. K. ~2006!. “Design and modelling of electroosmotic dewater-
ing.” Ph.D. thesis, Univ. of Newcastle upon Tyne, U.K., 161.
Novak, J. ~2006! “Dewatering of sewage sludge.” Drying Technol.,
24~10!, 1257–1262~6!.
Paul, E., and Debellefontaine, H. ~2007!. “Reduction of excess sludge
produced by biological treatment processes: Effect of ozonation on
biomass and on sludge.” Ozone: Sci. Eng., 29, 415–427.
Renzetti, S. ~2005!. “Canadian agricultural water use and management.”
The economics of natural and human resources in agriculture,
Springer, Berlin.
Shang, J. Q. ~1997!. “Zeta potential and electroosmotic permeability of
clay soils.” Can. Geotech. J., 34~4!, 627–631.
Shang, J. Q., and Lo, K.Y. ~1997!. “Electrokinetic dewatering of a phos-
phatic clay.” J. Hazard. Mater., 55~1–3!, 117–133.
Weber, K., and Stahl, W. ~2002!. “Improvement of filtration kinetics by
pressure electrofiltration.” Separ. Purif. Technol., 26, 69–80.
Yang, L., Nakhla, G., and Bassi, A. ~2005!. “Electro-kinetic dewatering
of oily sludges.” J. Hazard. Mater., 125~1–3!, 130–140.
Yuan, C., and Weng, C. H. ~2003!. “Sludge dewatering by electrokinetic
technique: Effect of processing time and potential gradient.” Adv. En-
viron. Res., 7~3!, 727–732.
Zhou, J., Liu, Z., She, P., and Ding, F. ~2001!. “Water removal from
sludge in a horizontal electric field.” Drying Technol., 19~3–4!, 627–
638.
426 / JOURNAL OF ENVIRONMENTAL ENGINEERING © ASCE / APRIL 2010
Downloaded 30 Mar 2012 to 147.188.147.142. Redistribution subject to ASCE license or copyright. Visit http://www.ascelibrary.org
Copyright © 2022 FDOKUMEN