Design, Fabrication and Calibration of Compliant, Multi-Axis ...
303
-
Upload
khangminh22 -
Category
Documents
-
view
1 -
download
0
Transcript of Design, Fabrication and Calibration of Compliant, Multi-Axis ...

Design, Fabrication and Calibration of Compliant,
Multi-Axis, Fiber-Optic Force/Torque Sensors for
Biomechanical Measurements
by
Osama Al-Mai
A thesis submitted to the Faculty of Graduate and Postdoctoral
Affairs in Partial fulfillment of the requirements for the degree of
Doctor of Philosophy in Mechanical Engineering
Ottawa-Carleton Institute for
Mechanical and Aerospace Engineering
Department of Mechanical and Aerospace Engineering
Carleton University
Ottawa, Ontario, Canada
©Osama Al-Mai
November 5, 2019

The undersigned hereby recommends to the
Faculty of Graduate and Postdoctoral Affairs
acceptance of the thesis
Design, Fabrication and Calibration of Compliant, Multi-
Axis, Fiber-Optic Force/Torque Sensors for Biomechanical
Measurements
submitted by Osama Al-Mai
in partial fulfilment of the requirements for the degree of
Doctor of Philosophy in Mechanical Engineering
Carleton University
November 5, 2019
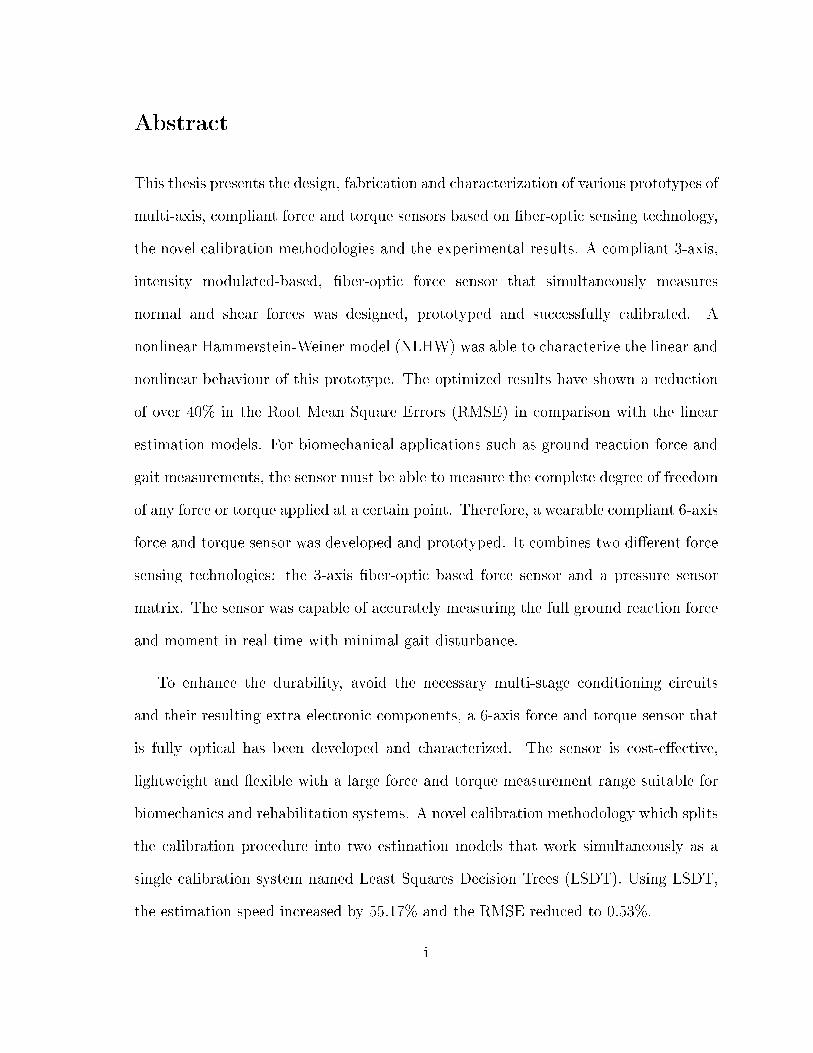
Abstract
This thesis presents the design, fabrication and characterization of various prototypes of
multi-axis, compliant force and torque sensors based on ber-optic sensing technology,
the novel calibration methodologies and the experimental results. A compliant 3-axis,
intensity modulated-based, ber-optic force sensor that simultaneously measures
normal and shear forces was designed, prototyped and successfully calibrated. A
nonlinear Hammerstein-Weiner model (NLHW) was able to characterize the linear and
nonlinear behaviour of this prototype. The optimized results have shown a reduction
of over 40% in the Root Mean Square Errors (RMSE) in comparison with the linear
estimation models. For biomechanical applications such as ground reaction force and
gait measurements, the sensor must be able to measure the complete degree of freedom
of any force or torque applied at a certain point. Therefore, a wearable compliant 6-axis
force and torque sensor was developed and prototyped. It combines two dierent force
sensing technologies: the 3-axis ber-optic based force sensor and a pressure sensor
matrix. The sensor was capable of accurately measuring the full ground reaction force
and moment in real-time with minimal gait disturbance.
To enhance the durability, avoid the necessary multi-stage conditioning circuits
and their resulting extra electronic components, a 6-axis force and torque sensor that
is fully optical has been developed and characterized. The sensor is cost-eective,
lightweight and exible with a large force and torque measurement range suitable for
biomechanics and rehabilitation systems. A novel calibration methodology which splits
the calibration procedure into two estimation models that work simultaneously as a
single calibration system named Least Squares Decision Trees (LSDT). Using LSDT,
the estimation speed increased by 55.17% and the RMSE reduced to 0.53%.
i

To improve sensor portability, further reduce size and eliminate electromagnetic
interference eects as well as enhance sensor biocompatibility, a non-conductive,
electrically passive, ber Bragg grating (FBG) based normal and shear force sensing
elements were designed, fabricated and calibrated. The sensing elements are small
size, lightweight and compliant. The results achieved from the proposed calibration
method have revealed an improvement from an R-squared value of 93% to 100% when
compared to a data obtained using a linear least squares method.
ii

Acknowledgments
In 2015 when I met Professor Mojtaba Ahmadi, he introduced me to the Advanced
Biomechatronics Locomotion (ABL) laboratory and he gave me the opportunity to
work on the development of compliant force and torque sensors as a part of the running
BalanceAid project. I would like to thank him and my co-supervisor Professor Jacques
Albert for their valuable guidance, consistent encouragements and academic support.
With their powerful supervision my Ph.D studies has been a remarkable journey of
several stages, full of challenges, perseverance and hard work. I would also like to
thank the department of Mechanical and Aerospace Engineering for letting me use
the Bionix Servo-hydraulic Test System, 3D printer and the workshop to carry out
experiments, develop force and torque sensors and all research work.
I would particularly like to thank the technologists and sta in the department,
Albane Laronche, David Raude, Stephan Biljan, and Steve Truttman for their
assistance in all things performed throughout my PhD studies. A special thanks to all
my family members for all of sacrices they have made on my behalf. Their prayer for
me is what sustained me in the course of this research. Last but not least, I would like
to thank the present and the past members of the ABL lab for their valuable technical
discussions that are being held daily in the lab and every individual who was a source
of encouragement and support and helped me to accomplish my dream goals.
iii

Preface
As dened by section 12.4 of 2019-2020 Graduate Calendar, the current thesis is an
integrated Ph.D thesis. It includes the following articles which are either published
(paper 1, 2, 3 and 4) or are submitted ( paper 5 and 6):
1. O. Al-Mai, M. Ahmadi, and J. Albert, " A Compliant 3-Axis Fiber-Optic Force
Sensor for Biomechanical Measurement," IEEE Sensors Journal, vol. 17, no. 20,
pp. 6549-6557, 2017 [1].
2. O. Al-Mai, M. Ahmadi, and J. Albert, " Design, Development and Calibration of
a Lightweight, Compliant Six-Axis Optical Force/Torque Sensor," IEEE Sensors
Journal, vol. 18, no. 17, pp. 7005-7014, 2018 [2].
3. S. Eng, O. Al-Mai, and M. Ahmadi, " A 6 DoF, Wearable, Compliant
Shoe Sensor for Total Ground Reaction Measurement," IEEE Transactions on
Instrumentation and Measurement, vol. 67, no. 11, pp. 2714-2722, 2018 [3].
4. O. Al-Mai, M. Ahmadi, and J. Albert, " Fiber-Optic Based, Force and Torque
Compliant Sensing Calibration Strategies ," International Conference of Control,
Dynamic Systems, and Robotics , 2019. [4]
5. O. Al-Mai, M. Ahmadi, and J. Albert, " Development and Characterization
of A Compliant FBG-Based, Shear and Normal Force Sensing Elements for
Biomechanical Applications," submitted to IEEE Sensors Journal, 2019.
iv
6. O. Al-Mai, and M. Ahmadi, " Novel Calibration Methodologies for Compliant
Multi-Axis Fiber-Optic Based Force/Torque Sensors," submitted to IEEE
Transactions on Instrumentation and Measurement, 2019.
The permission from the publisher (IEEE) has been included for each journal paper
at the end of this thesis. The format of these journal papers has been transformed to
be more coherent to the format of the current thesis. Also, the images and plots have
been re-centred and rescaled. Sections of additional work have also been added to
introduce materials included in the Appendix. The references have been created in a
single list that can be found at the end of this thesis.
v

Contents
Abstract . . . . . . . . . . . . . . . . . . . . . . . . . . . . . . . . . . . i
Acknowledgments . . . . . . . . . . . . . . . . . . . . . . . . . . . . . . iii
Preface . . . . . . . . . . . . . . . . . . . . . . . . . . . . . . . . . . . . iv
List of Figures . . . . . . . . . . . . . . . . . . . . . . . . . . . . . . . . xxvii
List of Tables . . . . . . . . . . . . . . . . . . . . . . . . . . . . . . . . xxix
1 Introduction 1
1.1 Motivation . . . . . . . . . . . . . . . . . . . . . . . . . . . . . . . . . . 1
1.2 Objectives . . . . . . . . . . . . . . . . . . . . . . . . . . . . . . . . . 6
1.3 Contributions . . . . . . . . . . . . . . . . . . . . . . . . . . . . . . . 9
1.4 Outline . . . . . . . . . . . . . . . . . . . . . . . . . . . . . . . . . . . 12
2 Background and Literature Review 14
2.1 Measurement Prociency and Advantages of Fiber-Optic Sensors . . . . 14
2.2 Strengths and Limitations of Current Biomedical and Biomechanical
Measurement Systems . . . . . . . . . . . . . . . . . . . . . . . . . . . 16
2.3 Intensity Modulated-Based Fiber-Optic Sensors . . . . . . . . . . . . . 18
2.3.1 Microbending-Based Fiber-Optic Sensors . . . . . . . . . . . . . 19
2.3.2 Reection Based Fiber-Optic Sensors . . . . . . . . . . . . . . . 23
vi

2.3.2.1 Reecting-Based Minimally-Invasive Surgical Force
Sensors with Catheter-Tip . . . . . . . . . . . . . . . . 25
2.3.2.2 Hand-grip Force Sensor with MRI Compatibility Based
on Light Reection . . . . . . . . . . . . . . . . . . . . 26
2.3.3 Shutter-Based Intensity Modulation Fiber Optic Sensors . . . . 28
2.4 Wavelength-Modulated Fiber-Optic Sensors . . . . . . . . . . . . . . . 29
2.4.1 FBG Fabrication . . . . . . . . . . . . . . . . . . . . . . . . . . 30
2.4.2 FBG Sensing Principles . . . . . . . . . . . . . . . . . . . . . . 32
2.4.3 FBG-Based Sensors in Biomechanical and Gait
Measurements . . . . . . . . . . . . . . . . . . . . . . . . . . . . 37
3 A Compliant 3-Axis Fiber-Optic Force Sensor for Biomechanical
Measurement 44
3.1 Introduction . . . . . . . . . . . . . . . . . . . . . . . . . . . . . . . . . 45
3.2 Sensor Design and Fabrication . . . . . . . . . . . . . . . . . . . . . . . 49
3.3 Sensing Mechanism and Working Principles . . . . . . . . . . . . . . . 52
3.4 Experimental Results and Calibration . . . . . . . . . . . . . . . . . . . 54
3.4.1 The Eect of Cross-talk on Sensor Performance . . . . . . . . . 57
3.4.2 Calibration Methodology . . . . . . . . . . . . . . . . . . . . . 61
3.4.3 Nonlinear Hammerstein-Wiener Model . . . . . . . . . . . . . . 65
3.5 Conclusion . . . . . . . . . . . . . . . . . . . . . . . . . . . . . . . . . . 70
4 A 6-DoF, Wearable, Compliant Shoe Sensor for Total Ground
Reaction Measurements 72
4.1 Introduction . . . . . . . . . . . . . . . . . . . . . . . . . . . . . . . . 73
4.2 Sensor Design . . . . . . . . . . . . . . . . . . . . . . . . . . . . . . . . 76
vii

4.3 Fiber-Optic Shear Force Sensor . . . . . . . . . . . . . . . . . . . . . . 77
4.4 FlexiForce Sensors . . . . . . . . . . . . . . . . . . . . . . . . . . . . . 80
4.5 Experimental Results . . . . . . . . . . . . . . . . . . . . . . . . . . . . 81
4.5.1 Floor-mounted experiments . . . . . . . . . . . . . . . . . . . . 82
4.5.1.1 Least squares regression . . . . . . . . . . . . . . . . . 82
4.5.1.2 Neural network regression . . . . . . . . . . . . . . . . 84
4.5.2 Shoe-mounted experiments . . . . . . . . . . . . . . . . . . . . . 85
4.5.2.1 Least squares regression . . . . . . . . . . . . . . . . . 92
4.5.2.2 Neural network regression . . . . . . . . . . . . . . . . 92
4.5.2.3 Angle eects . . . . . . . . . . . . . . . . . . . . . . . 92
4.6 Conclusion . . . . . . . . . . . . . . . . . . . . . . . . . . . . . . . . . . 96
5 Design, Development and Calibration of a Lightweight, Compliant
6-Axis Optical Force/Torque Sensor 98
5.1 Introduction . . . . . . . . . . . . . . . . . . . . . . . . . . . . . . . . . 99
5.2 Sensor Architecture . . . . . . . . . . . . . . . . . . . . . . . . . . . . . 103
5.2.1 Sensor Design and Fabrication . . . . . . . . . . . . . . . . . . . 103
5.2.2 Principles of sensing . . . . . . . . . . . . . . . . . . . . . . . . 106
5.3 Sensor Characterization . . . . . . . . . . . . . . . . . . . . . . . . . . 110
5.3.1 Experimental setup . . . . . . . . . . . . . . . . . . . . . . . . 111
5.3.2 Linear Estimation via Least Squares Method (LSM) . . . . . . 112
5.3.3 Nonlinear Regression Using Decision Trees . . . . . . . . . . . . 114
5.3.4 Least Squares Decision Trees LSDT Approach . . . . . . . . . 117
5.4 Conclusion . . . . . . . . . . . . . . . . . . . . . . . . . . . . . . . . . . 123
viii

6 Development and Characterization of Compliant FBG-Based, Shear
and Normal Force Sensing Elements for Biomechanical Applications 126
6.1 Introduction . . . . . . . . . . . . . . . . . . . . . . . . . . . . . . . . . 128
6.2 FBG-Based Normal and Shear Force Sensing Ele- ments: Design and
Fabrication . . . . . . . . . . . . . . . . . . . . . . . . . . . . . . . . . 131
6.3 Sensing Mechanism and Operating Principles . . . . . . . . . . . . . . . 135
6.4 Experimental Setup . . . . . . . . . . . . . . . . . . . . . . . . . . . . 139
6.5 Sensor Calibration Methodology: Results and
Discussion . . . . . . . . . . . . . . . . . . . . . . . . . . . . . . . . . . 140
6.5.1 Nonlinear System Identifcation using Nonlinear Autoreg- ressive
Exogenous NARX Model . . . . . . . . . . . . . . . . . . . . . . 142
6.5.2 Linear Regression with A Nonlinear Autoregressive
Exogenous (LR-NARX) Calibration Procedure . . . . . . . . . 146
6.5.3 Spline Regression for Sensor characterization . . . . . . . . . . . 153
6.6 Conclusion . . . . . . . . . . . . . . . . . . . . . . . . . . . . . . . . . . 156
7 Novel Calibration Methodologies for Compliant Multi-Axis
Force/Torque Sensors 158
7.1 Introduction . . . . . . . . . . . . . . . . . . . . . . . . . . . . . . . . . 159
7.2 knowledge-Based (Parametric) Calibration Meth- odologies . . . . . . . 162
7.2.1 Data-Driven Dynamic Modelling . . . . . . . . . . . . . . . . . 162
7.2.2 Hysteresis Compensation . . . . . . . . . . . . . . . . . . . . . . 165
7.2.3 Static Calibration . . . . . . . . . . . . . . . . . . . . . . . . . 165
7.3 Non-Parametric Machine Learning Based Calibr- ation . . . . . . . . . 171
7.4 Two-Model Hybrid Calibration Methodology . . . . . . . . . . . . . . . 175
7.5 Conclusion . . . . . . . . . . . . . . . . . . . . . . . . . . . . . . . . . . 176
ix

8 Conclusions and Recommendations for Future Work 178
8.1 Conclusions . . . . . . . . . . . . . . . . . . . . . . . . . . . . . . . . . 179
8.1.1 Design and Implementation of A Compliant 3-Axis Fiber-Optic
Based Force Sensor . . . . . . . . . . . . . . . . . . . . . . . . 179
8.1.2 Development of 6-DoF Sensor for Total Ground Reaction Force
Based on Two Sensing Technologies . . . . . . . . . . . . . . . 180
8.1.3 Design, Development and Calibration of a Lightweight,
Compliant Six-Axis Optical Force/Torque Sensor . . . . . . . . 181
8.1.4 Development of FBG-Based Normal and Shear Force
Sensing Elements . . . . . . . . . . . . . . . . . . . . . . . . . . 182
8.1.5 Novel Calibration Methodologies for Compliant Multi- Axis
Force/Torque Sensors . . . . . . . . . . . . . . . . . . . . . . . 182
8.2 Future Work . . . . . . . . . . . . . . . . . . . . . . . . . . . . . . . . 183
8.2.1 Sensor Modications and Improvements . . . . . . . . . . . . . 183
8.2.2 Development of FBG-Based, 6-Dof insole Sensor for Total
Ground Reaction Force and Moment . . . . . . . . . . . . . . . 184
8.2.3 BalanceAid Biofeedback Integration . . . . . . . . . . . . . . . 185
8.2.4 Assistive Device Feedback Integration . . . . . . . . . . . . . . 186
References 187
Appendices 235
A Experimental Results of the light intensity Modulation-Based,
3-Axis Force Sensor 236
A.1 Experimental Validation Through An Actual Gait Measurement Scenario236
A.2 Specication of the compliant Force Sensor . . . . . . . . . . . . . . . 247
x

B Experimental Results of the intensity-based, 6-Axis F/T Sensor 250
B.1 Experimental Validation Through An Actual Gait Measurement Scenario250
B.2 Frequency Response Function . . . . . . . . . . . . . . . . . . . . . . . 258
C FBG-Based Force Sensing Elements: Experimental Results 262
List of Figures
2.1 Fiber-optic sensors classication: (a) Intrinsic sensors (b) Extrinsic
sensors [5]. . . . . . . . . . . . . . . . . . . . . . . . . . . . . . . . . . 16
2.2 Radiative losses as a ber undergoes bends [6]. . . . . . . . . . . . . . . 19
2.3 plantar and shear pressure sensor prototype [7]. . . . . . . . . . . . . . 21
2.4 plantar and shear pressure sensor prototype [8]. . . . . . . . . . . . . . 22
2.5 Pressure insole developed based on bend loss sensing technique [9]. . . 23
2.6 Schematic of an optical bers located in the front of a movable reecting
surface. The intensity of the reected light increases when the distance
between the tip of bers and the reector decreases. . . . . . . . . . . 24
2.7 Intensity-modulated reected light force sensor catheters (a) having
triaxial sensing with three optical bers and (b) having uniaxial sensing
with six optical bers [10, 11]. . . . . . . . . . . . . . . . . . . . . . . 25
2.8 Hand-Grip Fiber-Optic Force Sensors. (a) metal elastic body and (b)
the 3D printed body structure [12, 13]. . . . . . . . . . . . . . . . . . 27
2.9 Fiber-optic displacement sensors. (a) Measure the displacement directly
using two opposite bers. (b) a moveable shutter is used to modulate
the intensity of light to detect the displacement change. . . . . . . . . 28
xii

2.10 Optoelectronic sensing element without the use of optical bers to
measure the vertical ground reaction force [14]. . . . . . . . . . . . . . 29
2.11 Model FBG theory . . . . . . . . . . . . . . . . . . . . . . . . . . . . . 31
2.12 Light propagation through the FBG sensing element. A narrowband of
the transmitted light with specic wavelength reects back due to the
Bragg gratings. . . . . . . . . . . . . . . . . . . . . . . . . . . . . . . . 33
2.13 FBG sensing element and the reected wavelength variation under
uniaxial strain. . . . . . . . . . . . . . . . . . . . . . . . . . . . . . . . 34
2.14 Strain and temperature sensitivities of an FBG-based sensor [15]. . . . 36
2.15 FBG-based sensor plantar normal force measurements. The FBG is
integrated inside a 3D printed cylindrical bar through a slot made at
the center of each sensing element [16]. . . . . . . . . . . . . . . . . . 38
2.16 A exible insole force sensor composed of six FBG sensing elements for
distributive plantar normal pressure measurements [17]. . . . . . . . . . 39
2.17 A rigid in-shoe shear force sensor axed between to plates [18]. . . . . 40
2.18 FBG-based sensing element for shear force measurements [19, 20]. . . 40
2.19 FBG-based sensing element for normal and shear forces measurements[20]. 41
2.20 A exible FBG-based force sensor for normal force and one component
of shear force detection [21]. . . . . . . . . . . . . . . . . . . . . . . . . 42
2.21 Instrumented insole sensor with six FBG sensing elements for vertical
ground reaction force detection [22]. . . . . . . . . . . . . . . . . . . . . 43
xiii

3.1 The ber-optic sensing principles for the simultaneous measurement of
normal and shear forces in the z, x and y directions. (1), (7). The
transmitting and receiving bers of y-axis force sensor. (2). Reective
surfaces. (3), (4). Z-Axis transmitting and receiving bers. (5), (6).
The transmitting and receiving bers of the x-axis. . . . . . . . . . . . 50
3.2 The sensing mechanism of the proposed sensor. (a) Illustrates the sensor
under a vertical load of 500 N. dz is the generated vertical displacement.
(b) Shows the lateral displacement generated when 200 N of shear force
along x-axis is applied. . . . . . . . . . . . . . . . . . . . . . . . . . . . 52
3.3 The ber-optic sensing principles for the simultaneous measurement of
normal and shear forces in the z, x and y directions. (1), (7). The
transmitting and receiving bers of y-axis force sensor. (2). Reective
surfaces. (3), (4). Z-Axis transmitting and receiving bers. (5), (6).
The transmitting and receiving bers of the x-axis. . . . . . . . . . . . 53
3.4 Sensing principles. (a) occurs when a small amount of force is applied.
(b) occurs when the applied force increases. . . . . . . . . . . . . . . 55
3.5 (a) The developed test device that is mainly composed of ATI 6-axis F/T
sensor and 6-axis stage. (b) The MTS experimental setup was utilized
to apply pure uniaxial force to evaluate the cross-talk eects. . . . . . 56
3.6 Quadratic tting model of force to voltage curves. (A), (B) and (C) are
the tting models of the z-, x- and y-axis respectively. . . . . . . . . . 57
3.7 Sensor response to the applied external force along the three normal
axes using the MTS. . . . . . . . . . . . . . . . . . . . . . . . . . . . . 59
xiv

3.8 (a) The developed test device that is mainly composed of ATI 6-axis F/T
sensor and 6-axis stage. (b) The MTS experimental setup was utilized
to apply pure uniaxial force to evaluate the cross-talk eects. . . . . . 61
3.9 The experimental results of the x-axis in a comparison to the acquired
data from the ATI 6-axis F/T sensor. The plot shows a second-order
Output-Error, a third-order Auto-regressive-moving-average (ARMAX)
and a second-order transfer function model corresponding to the real
data. . . . . . . . . . . . . . . . . . . . . . . . . . . . . . . . . . . . . 63
3.10 A comparison between the real data and the y-axis model. The graph
demonstrates a second-order transfer function model compared to the
real data. . . . . . . . . . . . . . . . . . . . . . . . . . . . . . . . . . . 64
3.11 The similarity between the z-axis results using a second-order transfer
function estimation model and the real data. . . . . . . . . . . . . . . . 64
3.12 The schematic block-diagram of the nonlinear Hammerstein-Wiener
estimation model . . . . . . . . . . . . . . . . . . . . . . . . . . . . . . 65
3.13 A comparison between Hammerstein-Wiener model of the x-axis and
the real data. The tting value was improved by 10% compared to the
previous linear models. . . . . . . . . . . . . . . . . . . . . . . . . . . 67
3.14 The optimized results of the y-axis using Hammerstein-Wiener model
compared to the real data. . . . . . . . . . . . . . . . . . . . . . . . . . 68
3.15 A comparison between the Hammerstein-Wiener model used to model
the z-axis and the real data of the ATI 6-axis F/T sensor . . . . . . . 69
xv

4.1 Structure of the proposed sensor. (1) Silicon rubber block. (2) Bottom
plate (PLA). (3) Higher section to mount FlexiForce sensors. (4)
Top plate. (5) LED and LTV holder. (6) TSL250R (LTV ). (7)
OVLEW1CB9 (LED). (8) Fibre guider. (9) FlexiForce sensors (A301).
(10) Top layer (11) Screw to precompression of the FlexiForce. (12)
Optical bres. (13). Light reector. . . . . . . . . . . . . . . . . . . . 78
4.2 The prposed sensor unit separated from the other related electronics.
The LED and LTV are shown on the sensor side. . . . . . . . . . . . . 79
4.3 Sensors unit with top aluminum plate removed, exposing the FlexiForce
sensors (covered with blue electrical tape for protection) . . . . . . . . 81
4.4 Two Sensor units are axed on the force plate . . . . . . . . . . . . . . 83
4.5 Ground reaction forces of the oor-mounted sensor using the least
squares method and a neural network as calibration methods. (a) x-axis
force (medio-lateral), (b) y-axis force (anterior-posterior), (c) z-axis force
(Normal) . . . . . . . . . . . . . . . . . . . . . . . . . . . . . . . . . . 87
4.6 Ground reaction moments obtained from the oor-mounted setting using
the least squares approach and a neural network as calibration. (a)
x-axis moment, (b) y-axis moment, (c) z-axis moment . . . . . . . . . . 88
4.7 Sensor raw voltage and force applied . . . . . . . . . . . . . . . . . . . 89
4.8 Error between six-axis sensor and forceplate for least sqaures method . 89
4.9 Error between six-axis sensor and forceplate for neural network . . . . . 90
4.10 Experiment set up for shoe-mounted sensors with two 6-axis sensor
systems and 3 Optotrak rigid bodies (one not shown) . . . . . . . . . . 90
xvi

4.11 Ground reaction forces obtained from the shoe-mounted sensor using the
least squares approach and a neural network as calibration. (a) x-axis
force (medio-lateral), (b) y-axis force (anterior-posterior), (c) z-axis force
(vertical) . . . . . . . . . . . . . . . . . . . . . . . . . . . . . . . . . . . 94
4.12 Ground reaction moments obtained from the shoe-mounted sensor using
the least squares approach and a neural network as calibration. (a)
x-axis force (medio-lateral), (b) y-axis force (anterior-posterior), (c)
z-axis force (vertical) . . . . . . . . . . . . . . . . . . . . . . . . . . . . 95
5.1 Structure of the proposed sensor. (1). Screw (2). Outer shield (3). Flat
data cable (4). Printed circuit board for reliable connections (5). Top
rigid layer (6). Light reecting mirror (7). Compliant block (silicon
rubber) (8). Optical ber (9). LEDs and LTVs holder (10). LTV
(Model: TSL-275) (11). LED (Model: OVLEW1CB9) (12). Bottom
rigid layer. . . . . . . . . . . . . . . . . . . . . . . . . . . . . . . . . . . 104
5.2 Conguration of sensing elements. Each force and torque component
has only one sensing element that contains LED, pair of bers, LTV
and reective surface embedded along the top (A) and bottom (B) layers. 106
5.3 Prototype 6-axis ber-optic F/T sensor in its assembled state. . . . . . 107
5.4 Sensor behavior due to applied torque around the x-direction. The
top plate tilts which generates light intensity variation enabling Tx
measurement. . . . . . . . . . . . . . . . . . . . . . . . . . . . . . . . . 108
5.5 Sensing principle of the torque applied around the y-direction. The
distance between the bers tip and their respective reecting mirror
changes. This decreases or increases the intensity of detected light using
LTVs. . . . . . . . . . . . . . . . . . . . . . . . . . . . . . . . . . . . . 109
xvii

5.6 Torque Tz sensing mechanism. The top plate rotates with respect to the
bottom plate and the torque is measured in accordance to the produced
light intensity alteration. . . . . . . . . . . . . . . . . . . . . . . . . . . 109
5.7 Experimental setup for online data collection. The developed sensor
is mounted to a standard 6-axis F/T sensor reference from Industrial
Automation. Both sensors are connected to the same data acquisition
system and data acquired using MATLAB, Real-Time Simulink for
comparison. . . . . . . . . . . . . . . . . . . . . . . . . . . . . . . . . . 114
5.8 Sensor response due to the applied normal-force in the z-direction. The
multiple plots show a comparison between three dierent models and
the reference data obtained from ATI 6-axis F/T sensor. The models
include the novel Least Secures Decision Trees (LSDT ), Least Squares
Method(LSM ) only and Nonlinear Decision Trees NLDT alone. . . . . 115
5.9 A comparison between three models: LSDT, LSM and NLDT of the
x-axis with the reference data. Forces dierent magnitudes, direction
and frequencies were applied along the x-axis . . . . . . . . . . . . . . 116
5.10 Experimental results of the developed prototype for forces applied along
the y-axis in a comparison between the estimated and actual data. . . . 117
5.11 Time-domain response of the proposed compliant 6-axis F/T sensor
due to applied torques around the x-axis. A comparison between the
estimated data using the proposed estimation models and the measured
data from the reference. . . . . . . . . . . . . . . . . . . . . . . . . . . 118
5.12 Response of the prototype under torques with dierent magnitudes and
directions applied around the y-axis. . . . . . . . . . . . . . . . . . . . 119
xviii
5.13 Experimental results of the developed sensor for a comparison between
actual data obtained from the reference and predicted data achieved
from the sensor after applying three estimation models. The graphs
demonstrate sensor performance under several torques around the z-axis. 120
5.14 Sensor characterization procedure of the novel calibration methodology
named as Least Squares Decision Trees (LSDT ). Force and Torque data
(voltages) acquired from the developed sensor are used as multi-inputs to
two models: linear Least Squares model to estimate the applied forces
and torques and nonlinear estimation model based on Decision Trees
regression to estimated the errors. The sum of the two models is the
novelLSDT calibration approach. . . . . . . . . . . . . . . . . . . . . . 120
5.15 The estimated sensor response vs the actual response of the reference
for Fz estimators. (a) demonstrated the performance of the proposed
Least Squares Decision Trees (LSDT ). Curves are not easy to distinguish
because the model perfectly estimates data. (b) shows the output of the
DT model only, which also shows an excellent predilection. (c) Presents
the conventional linear LSM model which exhibits slightly less accurate
results. . . . . . . . . . . . . . . . . . . . . . . . . . . . . . . . . . . . . 121
6.1 Structure of the proposed ber Bragg grating-based compliant normal
force sensor. the sensor is composed of three parts: optical ber
with inscribed FBG sensing region, exible sensing body and a rubber
material used to ll the sensing body. . . . . . . . . . . . . . . . . . . 132
xix

6.2 Structure of the proposed ber Bragg grating-based shear force sesning
element. the sensor is composed of three parts: optical ber with
inscribed FBG sensing region,sensing body and a rubber used to ll
the sensing body. . . . . . . . . . . . . . . . . . . . . . . . . . . . . . . 134
6.3 Illustration of the sensing mechanism of the proposed FBG-based force
sensor using nite element analysis performed using Solidworks. . . . . 136
6.4 Strain distribution along the x-axis due to the applied normal force. . 137
6.5 Explanation of the sensing mechanism and the strain distribution on
the proposed FBG-based shear force sensing element using nite element
analysis performed using Solidworks. As it can be clearly seen the optical
ber with the FBG is starched by a small element at the middle of the
sensing body when a shear force is applied. . . . . . . . . . . . . . . . 138
6.6 The experimental testing steps which are used to test the proposed
compliant FBG-based force sensor in both dynamic and static loading
conditions. In the dynamic loading, arbitrary vertical forces with
dierent magnitudes are applied on the top surface of the sensor whereas
a dierent weights are used for static test. . . . . . . . . . . . . . . . . 140
6.7 The experimental results obtained from static loading conditions test. a
linear function used to t sensor data. . . . . . . . . . . . . . . . . . 141
6.8 The experimental results. The force applied in this case is much higher
than the previous which generated in a higher deection that results in
slight nonlinearity. A quadratic function is used to t the data. . . . . 143
6.9 The experimental setup used to test the proposed compliant FBG-based
shear force sening element force. . . . . . . . . . . . . . . . . . . . . . 143
6.10 The structure of the proposed NARX prediction model model . . . . . 145
xx

6.11 The experimental results: A comparison between force measurements
obtained from the ATI 6-Axis force and torque sensor and the results of
the fabricated FBG-based normal force sensing element using the NARX
model . . . . . . . . . . . . . . . . . . . . . . . . . . . . . . . . . . . . 146
6.12 The performance of the fabricated FBG-based normal force sensing
elements when dierent amounts of loads (weights) are applied compared
to the ATI 6-Axis force and torque sensor. . . . . . . . . . . . . . . . . 147
6.13 A copmarison between the experimental results of the proposed
FBG-based sensor and the force reference in real time. . . . . . . . . . 147
6.14 The structure of the proposed linear regression with a nonlinear
autoregressive exogenous (LR-NARX) calibration procedure. . . . . . . 148
6.15 The performance of the fabricated FBG-based normal force sensing
element compared to the ATI 6-Axis force and torque senso when
the novel LR-NARX model is used to characterize the sensor. The
experiment results are perfectly matches the force reference. . . . . . . 149
6.16 A comparison between the performance of the novel LR-NARX and the
performance of the static quadratic model. . . . . . . . . . . . . . . . 150
6.17 The performance of the fabricated FBG-based shear force sensing
element compared to the ATI 6-Axis force and torque sensor. . . . . . . 151
6.18 The experimental results of the fabricated FBG-based shear force
sensing element compared to the ATI 6-Axis force and torque sensor.
The results matches the force reference. . . . . . . . . . . . . . . . . . . 151
6.19 A comparison between cubic spline estimation model and a simple linear
least squares method when a normal force is applied along the z-axis . 154
xxi

6.20 The experimental results of shear force sensing element in a comparison
between the linear calibration using least squares method and a cubic
spline estimation model. . . . . . . . . . . . . . . . . . . . . . . . . . . 155
6.21 The response of the FBG sensing element. The generated wavelength
variation due to the applied force . . . . . . . . . . . . . . . . . . . . . 155
7.1 A comparison between the actual force and the estimated data using a
transfer function model and a state space model . . . . . . . . . . . . . 163
7.2 Performance of the proposed dynamic models and their ability in
characterizing the dynamic behaviours of the compliant force/torque
sensors. . . . . . . . . . . . . . . . . . . . . . . . . . . . . . . . . . . . 166
7.3 The experimental setup of the bandwidth test. A high frequency force
is applied by hitting the propose sensor continuously generating high
speed force. . . . . . . . . . . . . . . . . . . . . . . . . . . . . . . . . . 167
7.4 The experimental results of the proposed sensor. (a) and (b) the
performance of the Fz sensing element under a higher frequency force
of the applied normal force in a comparison to the acquired actual data
from the ATI 6-axis F/T sensor when the linear least squares approach
is used. . . . . . . . . . . . . . . . . . . . . . . . . . . . . . . . . . . . . 169
7.5 Compliant force and torque sensor response due to the applied shear
force along the x-axis using least squares optimization. . . . . . . . . . 170
7.6 Sensor response due to the shear force applied along the y-axis. . . . . 170
7.7 The experimental results when a linear least squares calibration is used
to characterize the compliant force and torque sensor. This is a torque
applied about the x-axis. . . . . . . . . . . . . . . . . . . . . . . . . . 171
xxii

7.8 A Comparison between the performance of the compliant force and
torque sensor calibrated using the simple linear least squares method
and the actual torque data applied about the y-axis. . . . . . . . . . . 172
7.9 compliant force and torque sensor response due to the torque applied
about the z-axis in a comparison to the actual torque obtained from the
ATI 6-axis force and torque sensor. . . . . . . . . . . . . . . . . . . . . 172
7.10 The performance of the proposed Gaussian process regression models in
comparison to the applied actual force. . . . . . . . . . . . . . . . . . 174
1.1 oor-mounted experiment. Two three-axial force sensors are axed on
the Bertec force plate while the subjects walking across. . . . . . . . . 237
1.2 Force sensor response due to the applied shear force along the x-axis
during gait . . . . . . . . . . . . . . . . . . . . . . . . . . . . . . . . . 238
1.3 Force sensor response due to the applied shear force along the y-axis
during gait . . . . . . . . . . . . . . . . . . . . . . . . . . . . . . . . . . 238
1.4 Force sensor response due to the applied normal force along the z-axis
during gait . . . . . . . . . . . . . . . . . . . . . . . . . . . . . . . . . . 239
1.5 a comparison between the experimental results of the proposed 3-axis
intensity based force sensor and the ATI force and torque sensor when
a force is applied along the z-axis. . . . . . . . . . . . . . . . . . . . . 240
1.6 Sensor performance when a force of high of high frequency and high
speed is applied. . . . . . . . . . . . . . . . . . . . . . . . . . . . . . . 240
1.7 The experimental results of the propse 3-xis force sensor and the
reference sensor when a large amount of normal force is applied. . . . 241
xxiii

1.8 a comparison between the experimental results of the proposed 3-axis
intensity based force sensor and the reference sensor in terms of shear
force applied along the x-axis. . . . . . . . . . . . . . . . . . . . . . . 241
1.9 Shear force sensing element performance in a comparison to the ATI
force and torque sensor. This shear force is acting along the y-axis. . . 242
1.10 Ground reaction force measurement. The sensor is tested during gait
demonstrating sensor results of the shear force applied along the x-axis 242
1.11 Ground reaction force measurement. The sensor is tested during gait
demonstrating sensor results of the shear force applied along the y-axis 243
1.12 Ground reaction force measurement. The sensor is tested during gait
demonstrating sensor results of the normal force applied along the z-axis 243
1.13 Experimental results of the proposed 3-axis force sensor during gait test
presenting four steps while the shear force is applied along the x-axis. . 244
1.14 Ground reaction shear force acting along the y-axis presenting four steps
of the sensor performance compared to the force plate. . . . . . . . . . 244
1.15 Experimental results of the proposed 3-axis force sensor during gait test
showing four steps while the normal force is applied along the x-axis . 245
1.16 One step test of ground reaction force along the x-direction in
comparison to the force plate measurements. . . . . . . . . . . . . . . 245
1.17 The experimental results of the proposed 3-axis force sensor in real gait
measurement of the shear force of the y-direction. . . . . . . . . . . . 246
1.18 One step test of ground reaction force along the z-direction in
comparison to the force plate. measurements . . . . . . . . . . . . . . 246
1.19 The experimental results of the rubber block due to the applied force.
The material exhibits slightly nonlinear force-deection relationship. . 247
xxiv
1.20 The experimental results of the light-to-voltage converter due to the
displacements generated as a result of the applied force which also
exhibits a slightly a nonlinear behaviour. . . . . . . . . . . . . . . . . . 248
1.21 The nal sensor response under the applied force. The sensor shows
good linear correlation between force and generated output voltage. . 249
2.1 Real-time actual gait measurement scenario. The experimental setup is
composed of the proposed light intensity-based,6-axis ber optic, force
and torque sensor and a standard force plate. the sensor is axed on
the force plate and the subject walks across the it. . . . . . . . . . . . 251
2.2 Experimental results through a real gait measurement for the applied
forces. . . . . . . . . . . . . . . . . . . . . . . . . . . . . . . . . . . . . 252
2.3 Experimental results through a real gait measurement for the applied
moments. . . . . . . . . . . . . . . . . . . . . . . . . . . . . . . . . . . 253
2.4 Experimental results through a real gait measurement . The dashed red
line shows the estimated values of F/M and using the proposed sensor
an the blue line depicts the actual F/M measured by the force plate. . 254
2.5 Experimental results of the proposed 6-axis force sensor during gait test
of six steps while the shear force is applied along the x-axis . . . . . . . 255
2.6 Ground reaction shear force acting along the y-axis showing six steps of
the sensor performance compared to the force plate. . . . . . . . . . . . 255
2.7 Experimental results of the proposed 6-axis force sensor during gait test
of six steps while the normal force is applied along the z-axis . . . . . . 256
2.8 Ground reaction moment acting about the x-axis showing six steps of
the sensor performance compared to the force plate. . . . . . . . . . . . 256
xxv

2.9 Ground reaction moment acting about the y-axis showing six steps of
the sensor performance compared to the force plate. . . . . . . . . . . . 257
2.10 Ground reaction moment acting about the z-axis showing six steps of
the sensor performance compared to the force plate. . . . . . . . . . . . 257
2.11 The transient response of the proposed second order compared to the
third-order estimation models . . . . . . . . . . . . . . . . . . . . . . . 258
2.12 The bode plot of the proposed second order and the third-order state
space estimation models that shows a signicant improvements in
bandwidth of compliant force and torque sensor. . . . . . . . . . . . . 259
2.13 A comparison between the resulting output voltages. (a) shows
the output voltage data recorded from the reference sensor. (b)
demonstrates the resulting output voltage of the proposed sensor
obtained from the optical sensing element. . . . . . . . . . . . . . . . . 261
3.1 Experimental setup used for online force data recording. The developed
sensor is attached to the ATI 6-axis F/T sensor reference from Industrial
Automation. the proposed sensor is connected to si720 optical analyser
and the refrence data acquired using Real-Time Simulink, MATLAB,
for a comparison. . . . . . . . . . . . . . . . . . . . . . . . . . . . . . . 263
3.2 FBG integration system: optical sensing analyzer, Si720 Micron Optics.
The system is used to detect the change reected Bragg wavelength as
a result of the applied force. . . . . . . . . . . . . . . . . . . . . . . . . 263
3.3 the measured reected power versus the generated wavelength for the
fabricated ber Bragg grating along the optical ber. This strong
resonance is referred to as Bragg resonance which is created due this
particular FBG. . . . . . . . . . . . . . . . . . . . . . . . . . . . . . . . 264
xxvi

3.4 Normal force sensing element response due to the applied normal force
along the z-axis. A comparison between the performance of a simple
linear least squares optimization and a spline function. . . . . . . . . . 264
3.5 Normal force sensing element response due to the applied normal force
along the z-axis using spline function as a calibration method . . . . . 265
3.6 Shear force sensing element response due to the applied shear force.
The performance of the sensing element when a spline function is used
to characterize the sensor compared to the actual force. . . . . . . . . 265
3.7 Shear force sensing element response due to the applied shear force
compared to the actual force measured by ATI force and torque sensor. 266
xxvii
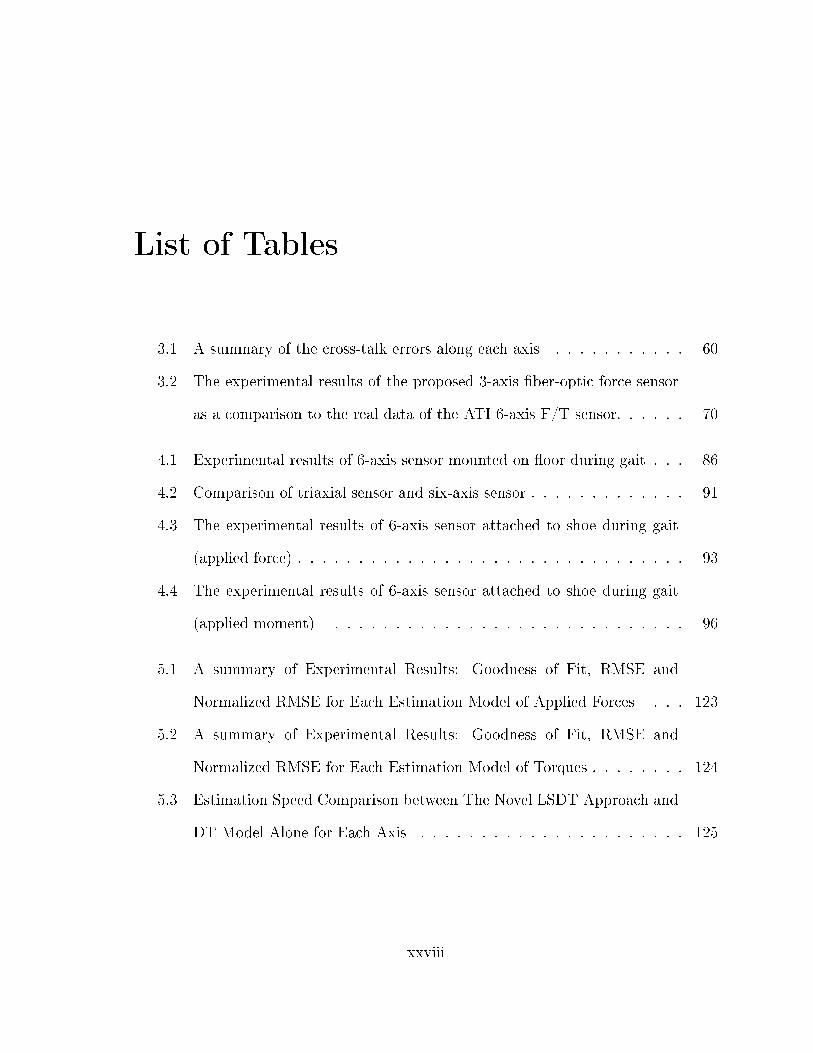
List of Tables
3.1 A summary of the cross-talk errors along each axis . . . . . . . . . . . 60
3.2 The experimental results of the proposed 3-axis ber-optic force sensor
as a comparison to the real data of the ATI 6-axis F/T sensor. . . . . . 70
4.1 Experimental results of 6-axis sensor mounted on oor during gait . . . 86
4.2 Comparison of triaxial sensor and six-axis sensor . . . . . . . . . . . . . 91
4.3 The experimental results of 6-axis sensor attached to shoe during gait
(applied force) . . . . . . . . . . . . . . . . . . . . . . . . . . . . . . . . 93
4.4 The experimental results of 6-axis sensor attached to shoe during gait
(applied moment) . . . . . . . . . . . . . . . . . . . . . . . . . . . . . 96
5.1 A summary of Experimental Results: Goodness of Fit, RMSE and
Normalized RMSE for Each Estimation Model of Applied Forces . . . 123
5.2 A summary of Experimental Results: Goodness of Fit, RMSE and
Normalized RMSE for Each Estimation Model of Torques . . . . . . . . 124
5.3 Estimation Speed Comparison between The Novel LSDT Approach and
DT Model Alone for Each Axis . . . . . . . . . . . . . . . . . . . . . . 125
xxviii

6.1 A summary of the experimental results: A comparison between the three
proposed estimation models, LR-NARX, NARX alone and the linear
least squares method alone in terms of the speed of prediction and the
goodness of the tting value. . . . . . . . . . . . . . . . . . . . . . . . 152
6.2 A summary of the experimental results of shear force sensor: A
comparison between the three proposed estimation models , LR-NARX,
NARX alone and LR alone. . . . . . . . . . . . . . . . . . . . . . . . . 152
7.1 A summary of the experimental results: A comparison between the
three proposed estimation models, 2nd order transfer function model
, 2nd order state space model and 3rd order state space model in terms
of the goodness of the t, RMSE and Bandwidth. . . . . . . . . . . . . 164
7.2 A summary of the experimental results: A comparison between the three
proposed Gaussian process regression models (GPR) estimation models,
Rational-Quadratic GPR, Squared-Exponential GPR and Exponential
GPR in terms of the speed of prediction and the goodness of the tting
value as well as the RMSE. . . . . . . . . . . . . . . . . . . . . . . . . 174
7.3 A comparison between the proposed novel dynamic calibration
methodology of the state space Gaussian process regression (SSGPR)
and the GPR model alone in terms of the RMSE, the speed of prediction
and the tness value . . . . . . . . . . . . . . . . . . . . . . . . . . . . 176
xxix

List of Acronyms
Acronyms Denition
FBG Fiber Bragg Gratings
GRF Ground Reaction Force
ABL Advanced Biomechatronics and Locomotion
CMP Centroidal Moment Pivot
ZMP Zero Moment Point
COM Centre of Mass
COP Centre of Pressure
RMSE Root Mean Square Error
NRMSE Normalized Root Mean Square Error
R2 Coecient of Determination
MTS Bionix Servo-hydraulic Test System
FSR Force Sensitive Resistor
LTV Light to Voltage Converter
TF Transfer Function
ARMAX Auto-Regressive Moving Average
LS Least Squares
NLHW Nonlinear Hammerstein-Wiener
OE Output Error
DT Decision Tree
LSM Least Squares Method
xxx
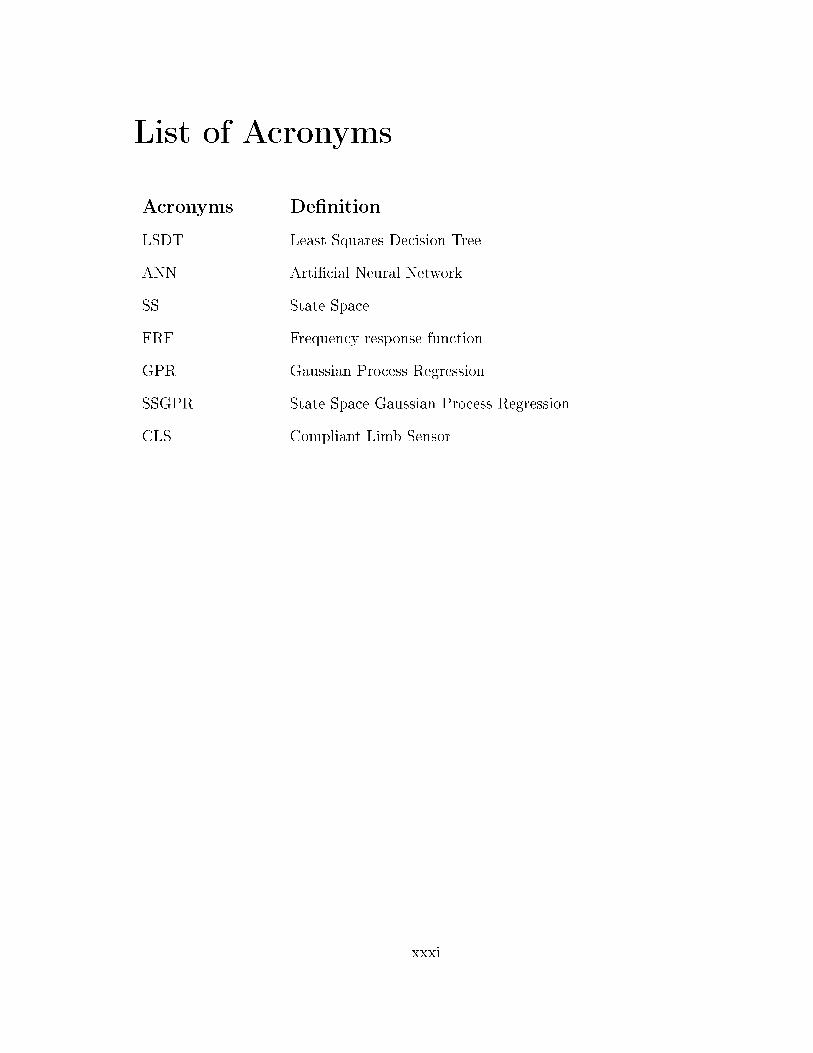
List of Acronyms
Acronyms Denition
LSDT Least Squares Decision Tree
ANN Articial Neural Network
SS State Space
FRF Frequency response function
GPR Gaussian Process Regression
SSGPR State Space Gaussian Process Regression
CLS Compliant Limb Sensor
xxxi

List of Symbols
Symbols Denition
Λm period of the etched patterns of the phase mask
θn incident angle of the ultra-violet beam
θm/2 diracted beam angle
λU ultra-violet wavelength
neff refractive index of the ber
∆λB wavelength shift of the reected spectrum
αf coecient of thermal-expansion
∆ε strain variation
ξ thermo-optic coecient
Pe elasto-optic coecient
∆T temperature variation
p11 elasto-optic tensor 1
p12 elasto-optic tensor 2
ν Poisson' s ratio of the ber
xxxii

Chapter 1
Introduction
1.1 Motivation
In the past decade, ber-optic sensors have shown an immense potential for several
modernized applications where high sensitivity, precision, miniaturization, weight and
otherwise inaccessible measurements are the design essentials. Fiber-optic sensing
techniques are capable of providing novel solutions for dierent sensing elds. They use
an optical signal that propagates through an optical ber cable made of silicon dioxide
(fused silica). This provides high biocompatibility [23] which makes ber-optic sensors
an excellent sensing technology for biomechanical measurements. Conventional (and
electronic) sensors utilized in biomechanical and biomedical applications are typically
based on capacitive, strain gauge, piezoelectric or inductive sensing technologies. These
sensors exemplify some profoundly sophisticated and widespread innovations, however,
they exhibit several drawbacks too, including low exibility, long-standing instability,
fragility, inconsistencies, drift and heavy weight [24].
1

Obtaining precise force and torque information is crucial in applications such as
biomechanics, ground reaction force and gait measurements, human-robot interactions
and rehabilitation systems. Multi-axis force and torque transducers are the most
favourable solution for such applications due to their strong ability to measure the
complete degrees of freedom of an applied point force and torque. Although these
multi-axis, force and torque sensors are important and have great measurement
capabilities, they are also complex in their manufacturing and assembly processes.
For example, the bonding procedure of strain gauges requires high precision. This
makes it time consuming and therefore costly, specically in labour costs [25, 26].
To obtain a suitable sensitivity for multi-axis, force and torque strain gauge-based
sensors, researchers incorporate large numbers of sensing elements (strain gauges)
distributed along the body undergoing deformation [27, 28]. This can cause
communication bandwidth problems since a large data transmission between strain
gauges and the main microcontroller is required, which can lead to unwanted lengthy
delays in data transfer as well as higher power consumption. These shortcomings
associated with the hardware components, rigidity and the size as well as their
sensitivity to electromagnetic eld interference undermine their functionality in clinical
practices . In addition, standard traditional sensors are not desirable in medical centers
where medical imaging techniques are used. Scanners that generate robust magnetic
eld and radio waves, such as in magnetic resonance imaging (MRI) scanners operate
as antennae and produce signicant errors with a penchant for heating impacts [29].
Fiber-optic sensing technology on the other hand, has signicantly revolutionized
the sensing industry as they are being progressively developed as a robust replacement.
Fiber Bragg grating (FBG) technique in particular, is the most attractive and
powerful ber-optic sensing method due to its unmatched capacity for large scale
2
multiplexing [30, 31]. By implementing one of the commonly used FBG interrogation
methods, Wave length Division Multiplexing (WDM), Time Division Multiplexing
(TDM) or a combination [3235], a large number of FBG signals can be acquired
using only one detecting device along one optical ber. In [36], as many as 33 FBG
strain sensors were read using one optical spectrometer, presenting a measurement
range of up to 500 µε with a sensitivity of 1.2 pm/µε. The commercially available
spectrometer, Ibsen I-MON 512-USB, provides a high resolution FBG interrogation
with wide dynamic range that can accommodate more than 70 in-line FBG sensors.
All of these characteristics make the ber-optic sensors suitable to integrate onto the
human body to measure strain and force distribution in applications such as ground
reaction force measurements underneath the foot. A number of papers available in
the literature showing an integration of ber-optic sensing technology in biomechanics
reveal that the technology is still novel [37], and it has not yet been commercialized.
The rapid population growth of the elderly and people with postural instability
has increased the demand for eective healthcare accommodations. Developing human
assistive technologies has become a growing market in the healthcare industry. The
recent advancements in sensor technology and electronics have made assistive devices
more and more plausible. It has been estimated that about one in three aged 65 years
or older experience one fall a year at the very least [38, 39]. Fall predictions for the
elderly and for people with gait instability are crucial in the prevention of fall-related
injuries [40, 41]. The reliable measurements of normal and shear forces on a foot
are imperative for gait measurements in order to help maintain balance and prevent
falls [42]. The assessment of the shear and normal forces between the ground and
the foot can also be benecial for those with diabetic foot ulcers [43, 44]. Studies
have shown that over three quarters of amputation cases are attributed to foot ulcers
3

[43, 45]. Excessive plantar shear force is considered as the main factor behind diabetic
foot ulcers [46]. Investigations in this area have been hindered by underestimating the
inuence of plantar shear forces and the lack of proper technology to measure them. It
is only in the last decade that evidence can conrm the clinical consequence of shear
forces in foot ulcers [47].
Either for improving human balance control or diagnosing diabetic foot diseases,
a precise measurement for the total ground reaction forces is required. To capture
the ground reaction forces, at least three main force components are required: vertical
ground reaction force applied in the z-direction (or normal force) and two shear forces
applied along the x-axis ( medial-lateral force) as well as the y-axis (anterior-posterior).
Along with the assessment of the plantar normal and shear forces, ground reaction
moments about the x-, y- and z-axes are required for balance control. Providing
reliable gait measurements includes a postural sensing system with accurate detection
of the total ground reaction forces and moments without disturbing the natural gait
is desirable. Force plates are considered the standard measuring systems. They have
the ability to accurately measure ground reaction forces and moments, but they are
limited to a laboratory setting and clinical use. Moreover, the maximum number of
steps that can be measured by a force plate are one or two per trial. Force plates
are also incapable of measuring the forces and moments of each foot individually when
both feet are on the same plate. Therefore, an ambulatory, wearable force and moment
measurement system is more advantageous.
Ground reaction force and moment sensors for rehabilitation and biomechanical
measurements must be mobile, lightweight and compliant so that it can not cause
fatigue or discomfort for the elderly and for people with disabilities. Although ATI
4

Industrial Automation's multi-axis, force/torque sensors can precisely measure the
force and moment acting along the six normal axes, these sensors are metallic, strain
gauge-based sensors which have low exibility, large dimensions, and are heavy in
weight and costly, making them unsuitable as a wearable, ambulant assistive devices.
Another limitation in ATI sensors is the small moment measurements range in some
models. It has been found that the applied moments particularly along x-axis (Mx )
can reach up to 40 N.m for a person weighing 50 kg. Although ATI Mini85 SI-1900-80
model, for example, has sucient moment range (80 N.m) for gait measurements, its
weight is 0.635 kg with a thickness of 30 mm and the minimum number of sensors
required for a reliable gait measurement are two per foot. Therefore, the total weight
would be 2.45 kg of rigid instrumented shoes.
To address these limitations and deciencies we present in this thesis, a novel
solution with the development of multi-axis force and moment sensors based on
ber-optic technology providing signicant improvements upon the current technologies
of force and torque sensing systems.
5

1.2 Objectives
The purpose behind this research is to develop various wearable, compliant,
low-cost, and lightweight, multi-axis, force/torque sensors based on ber-optic sensing
technology that can be used in several biomechanical applications. One of these
applications is ground reaction force and moment and gait measurements, both of
which are the focus of this research. Fiber-optic force and torque sensors are currently
being developed in the Advanced Biomechatronics Locomotion laboratory (ABL) at
Carleton University to replace the previously developed wearable sensor system and
to improve the sensing performance of the BalanceAid project. The current sensor of
the BalanceAid was able to detect only the vertical ground reaction force based on
force sensitive resistors (FSR) sensing technique with a relatively low precision. The
objectives of this project are demonstrated as follows:
1. Developing several multi-axis force and torque sensors that can be used for
application such as biomechanics and rehabilitation systems. Starting with the
development of a 3-axis intensity modulation-based ber-optic force sensor that
can precisely measure the complete ground reaction forces and can withstand
high normal forces with low cost. Detecting only normal force on a foot is not
sucient for gait measurements. For instant, the amount of forces generated
during walking, for a person that weighs 60 Kg, can reach over 600 N and 100 N for
normal and shear forces respectively [48]. In this case, the total ground reaction
along z-, x- and y-axis would be 812 N while the total shear forces in the x- and
y-directions would be 141 N. This means that, a 141 N out of 812 N (over 17%) is
ignored when measuring only the vertical normal force. This could signicantly
aect the precision of the measurement system. Such sensory information are
6

needed to measure ZMP (Zero-Moment Point) and CMP (Centroidal Moment
Pivot) [49]. Therefore, developing a sensor that has the ability to detect shear
forces is essential in gait measurement.
2. The project is also seeking to overcome the inconvenient rigidity associated
with the current available conventional sensors that are based on strain
gauge technique. Furthermore, sensor weight is a huge concern especially for
applications where a sensor is carried by a person for a real-time measurement.
Sensors made of metallic materials that relies on strain gauge as their sensing
technology such as ATI sensors are highly rigid and heavy. It is very desirable
for a wearable sensor designed for biomechanics to be lightweight and compliant
so that it would not alter the natural gait nor causing fatigue.
3. One of the primary objectives of this research is to increase the measurement
capability of the proposed 3-Axis force sensor to be able to capture ground
reaction moments in addition to the ground reaction forces. Center of pressure
(CoP) is very common in human postural analysis and balance control studies
[50], and sensors do not have the ability to measure ground reaction moments
cannot detect the center of pressure. Therefore, development of a 6-axis F/T
sensor is key.
4. Minimization is another important goal in this project. Although both of the
proposed 3- and 6-axis ber-optic force sensors have a reasonable size as they
have been used in a comfortable wearable scenario, the thickness (1.2 cm) can be
reduced. Since theses sensors are based on intensity modulation, miniaturization
is challenging because the bers used to detect Fz, Mx and My need to be
permanently bent inside the sensing unit which requires from 3 to 4 mm of the
7

total thickness. Therefore, another powerful ber-optic technology named Fiber
Bragg Gratings (FBG) is suggested to address this challenge. Using FBG-based
technique, sensor thickness can be considerably reduced to a few millimeters.
5. An additional objective of this project is to reduce wires and electromagnetic
interference eects. In the proposed intensity based ber-optic sensors, the
sensing element for each axis entailed three wires (LTV). Strain gauge-based
sensors require four wires for each strain gauge. However, FBG-based sensor do
not entail any wires as the sensing elements (FBGs) are inscribed along only one
optical ber. Also, the sensing element is optical rather than electric. This also
provides better pressure distribution underneath a foot. Furthermore, in some
6-axis F/T sensors such as strain gauge-based transducers, a huge number of
strain gauges up to 32 are used to extract six components of force and torques.
This means that the number of sensing elements exceeds the number of relevant
six F/T signal resulting in extra data transfer bandwidth and wires which can
lead to extra delay in data transmission. In the current project, a 6-axis F/T
sensor with only six force elements is a crucial goal.
6. Another main objective of this research is to develop a thin force sensor that
can be easily integrated in any shoe and can accurately measure the plantar
distributive force and moments as well as temperature beneath a foot using only
one ber with FBG-based sensing technique.
7. The intended applications of the proposed sensors are mostly incorporating
dynamic locomotion with considerable displacement/strain, including gait
analysis and ground reaction force measurements during walking and running
as well as human-robot collision detection in robot movement. Compliant
8

sensors, typically exhibit dynamic behaviours caused by the mass and viscoelastic
properties of the exible material used. In the proposed sensors, elastic materials
used to obtain the required exibility. Therefore, it is required for such class of
sensors to compensate for the nonlinear behaviours natural to large displacement
and strains. A nonlinear dynamic modeling and identication process and
special calibration methodology is required to achieve a satisfactory sensor
characterization.
8. An important goal is to performing human subject experiments to validate the
developed sensing devices in their intended biomechanical applications such as in
total ground reaction force and gait measurenets.
1.3 Contributions
Eight major contributions were accomplished during the course of this research listed
as follows:
1. Develop a novel 3-axis, ber-optic force sensor for biomechanical measurements:
Designed, fabricated and calibrated a novel lightweight, compliant 3-axis force
sensor based on light intensity modulation. Biomechanical applications such as
human-machine interface, gait measurements and rehabilitation devices require
sensing systems that are ambulatory, lightweight, exible and can measure normal
and shear force components. This sensor was able to measure the magnitude
and the direction of the applied normal and shear forces simultaneously with a
potential to adjust the measuring range.
2. Develop a novel, powerful hysteresis compensation methodology for compliant
9

multi-axis force and torque sensors: Compliant sensors exhibit a delay
phenomenon between the output and input. This is attributed to the complex
mechanism in energy dissipation of the compliant materials. Therefore, modelling
of such transducers and materials requires the ability to analyse the associated
memory eects or the hysteresis. A novel hysteresis compensation method was
developed showing a signicant reduction in the generated hysteresis.
3. Development of a wearable, two-technology based 6-axis force and torque sensor
for gait measurement: A compliant, multi-axis wearable force and torque sensor
was designed, prototyped and characterized. The sensor combines two dierent
sensing technologies: the ber-optic force sensor and a pressure sensor matrix
using FlexiForce transducers for ground reaction force and gait measurements.
The sensor was used for the BalanceAid project as wearable ground reaction force
sensor which was able to measure the total ground reaction force and moment
during gait.
4. Developing novel calibration and sensor characterization strategies for compliant,
multi-axis force and torque sensors: A novel calibration methodology named
Least Squares Decision Tree (LSDT) was developed and applied, obtaining a
high precision measurement of force and torque. The calibration procedure was
split up into a linear regression part and a nonlinear regression part. The linear t
was performed using the standard linear least method (LSM) and the nonlinear
regression part used a Decision Trees model (DT) to estimate the residuals. Both
models worked as single calibration system, obtaining a high-quality performance
of force and torque measurement.
5. Development of a lightweight, compliant 6-DoF ber-optic based force and
10

torque sensor: Designed, developed and successfully calibrated a novel, low cost,
compliant 6-axis force and torque sensor based on ber-optic technology. The
sensor is lightweight and has a high force and torque measurement range up
to over 1000 N. Due to its exibility and wide force measurement range, the
sensor can be used in dierent biomedical applications such as measuring the
total ground reaction force, collision detection, human-robot interaction and
applications where the compliance of the sensing element is desirable.
6. Experimental validation through an actual gait measurement scenario: Both the
3- and the 6-axis sensors were validated through an actual gait measurement
scenario using two types of experiments. In the rst experimental procedure, two
sensor units are mounted on the Bertec force plate and the subject walks on them.
In the second experimental set, the two sensors are attached to the bottom of the
shoe, and steps are taken across the Bertec force plate. Optotrak markers are
utilized to determine the orientation and position of the sensing units relative to
the our. Very accurate results were obtained in both sets showing the ability to
measure the total ground reaction force and moment through a real application.
7. Development of compliant FBG-based, normal and shear force sensing elements
for biomechanics: Designed, prototyped and characterized normal and shear force
sensing elements based on light wavelength variation using ber Bragg grating
technology. The sensors are compliant, lightweight, small size and have high
force measurement range. The performance of the sensing elements was evaluated
through several experiments using static and dynamic loading tests. Both normal
and shear force sensing elements have shown the ability to accurately measure
the applied normal and shear force in real-time.
11
8. Develop a novel calibration procedure for compliant FBG-based force sensors:
Developed a novel calibration procedure that aimed to further enhance sensor
performance and increase the speed of estimation. The calibration procedure is
split into two estimation models: a simple linear regression (LR) achieved using
least squares regression, and a nonlinear regression performed using nonlinear
autoregressive with exogenous input (NARX) model. This calibration system
named LR-NARX which was able to capture the nonlinearities attributed to the
high compliance and large deection.
1.4 Outline
The current thesis is an integrated work that incorporates six papers which are either
published or awaiting review. This section provides an outline of the remaining chapters
and papers included in this thesis.
Chapter 2: This chapter contains a literature review of a related work, current
sensing technologies and methods. It gives an explanation of how ber-optic sensing
technologies are classied, functioned and used in biomechanical application such as in
ground reaction force and gait measurement.
Chapter 3: The rst paper (published in IEEE Sensors Journal in September
2017 [1]) covers the development process and calibration methods of a novel compliant,
ber-optic 3-axis force sensor based on intensity modulation for biomechanical
measurements.
Chapter 4: The second paper ((published in IEEE Transactions on
Instrumentation and Measurement in May 2018 [3]) covers the design, fabrication
12

and calibration of multi-axis force and moment sensor that uses two dierent sensing
technology for total ground reaction force and gait measurements. Experimental
validation through a real gait measurement scenario is also included.
Chapter 5: The third paper (published in IEEE Sensors Journal in July 2018 [2])
covers the development and characterization of a novel intensity modulation-based,
compliant, ber-optic 6-axis force and torque sensor. It also covers an experimental
validation through an actual intended application.
Chapter 6: The sixth paper (submitted to IEEE Sensors Journal in May 2019)
covers the design, development and calibration of exible, FBG-based normal and shear
force sensing elements that operate based on wavelength variation.
Chapter 7: The fth paper (submitted to IEEE Transactions on Instrumentation
and Measurement in August 2019) cover a novel calibration methodologies for
compliant force and torque sensors, showing how these novel calibration methods are
eective in characterizing the complexity of the nonlinear dynamic behaviours of the
compliant sensors.
Chapter 8: This chapter contains the conclusions of this thesis, recommendations
and future work.
13
Chapter 2
Background and Literature Review
This chapter introduces a review of the literature that is relevant to ber-optic sensing
technology and its classications used for measuring the distribution of pressure and
ground reaction force underneath a foot to achieve stability and maintain balance. This
chapter also presents a literature review of how plantar normal and shear forces are
measured using various ber-optic based sensors with dierent ber-optic techniques,
demonstrating the importance of monitoring shear stress in diabetic foot ulcers as it
helps to anticipate and prevent them from fall related injuries.
2.1 Measurement Prociency and Advantages of
Fiber-Optic Sensors
Fiber-optic sensors operate by transforming one or more characteristics of the light
(eg. some characteristic like light intensity, phase or wavelength) that passes through
its optical bers. These sensors can be commonly subdivided into extrinsic or intrinsic
14
sensors as seen in Figure 2.1. The extrinsic sensors guide the light to an external sensing
region where the light signal is modulated through another medium. The dierent
sensing mechanisms in extrinsic ber optic sensors produce, transform, or modulate
light rays, resulting in reection, bending loss, wavelength or phase modulations.
The light modulator may also include a gas or liquid cell which can be inuenced
by external perturbation, and hence altering the property of the light. In most
cases, the ber is only used to transmit optical signals from a sensing area to a
photodiode followed by a data acquisition card. One advantage of this technique is
the ability to access hard to reach places to perform measurements, thereby using
non-contact sensing [51, 52]. In the intrinsic ber-optic sensors, the light does not
leave the ber but remains within the wave guide. It modulates the properties of the
optical signal inside the optical ber to achieve the sensing functions by monitoring
the resulting variations in the intensity, wavelength, and phase. Sensors that change
the intensity of light inside the ber are the simplest devices for sensing, as only one
detector and light source are required. Intrinsic ber-optic sensors provide spatial and
continuous sensing along the full length of the ber. They have the ability to measure
a broad range of parameters such as pressure, strain, force, rotation, acceleration,
displacement, acoustics, vibration, temperature and humidity [53] all using only one
optical ber. Thus, intrinsic sensors are much more attractive and are being extensively
investigated in the eld of sensing due to their high performance and multiplexing or
multipoint measurements. Other advantages compared to the conventional electronic
sensors are the small size, lightweight, exibility and their resistance to electromagnetic
interference. These sensors are also viable for inaccessible sensing areas, providing a
substantial allowance for several applications. Fiber-optic sensor can operate under
harsh conditions such as high temperatures, vibrations and shock. Another advantage
15

to ber-optic sensors is their large bandwidth and high sensitivity [54, 55].
Figure 2.1: Fiber-optic sensors classication: (a) Intrinsic sensors (b) Extrinsicsensors [5].
2.2 Strengths and Limitations of Current Biomedical
and Biomechanical Measurement Systems
Signicant eorts in literature have been dedicated to the development of distributive
plantar shear and normal force measurement systems based on various detection
principles. Force-sensitive resistors (FSRs) are commonly used in plantar force
measurements due to their simple interface and low manufacturing cost. In [5659],
a set of FSR sensors were integrated into exible insoles to measure the distributed
pressure of a foot. However, the prototypes were not capable of detecting the two
components of shear forces in the x- and y-directions. In addition, the material
characteristics of FSRs are highly aected by temperature and nonlinearity. They
are also fragile and have limited exibity. Since the gait measurement involves bending
16

during the walk, these sensors are not the best choice for this particular application.
Capacitive-based and inductive-based transducers on the other hand, are broadly used
in plantar pressure distribution measurements [6062]. Although both of the capacitive
and inductive techniques present an adequate precision and a wide range of pressure
measurements, these types of sensors are generally susceptible to electromagnetic
interference and temperature eects, and may experience drift and have small spatial
resolution.
A piezoresistive-based plantar force sensor was reported for gait analysis
measurements in [63]. The sensor exhibited a relatively high sensitivity and virtually
invisible hysteresis eects, but had noticeable linearity and repeatability errors. These
sensors, however, have the following drawbacks: considerably high stiness, low
breaking force, and the need for temperature compensator for each individual sensing
element [64]. These sensors are mostly utilized for small strain measurements, and
not designed for large deformations. In order to measure the pressure on a foot, an
array of solid semiconductor sensors is needed, increasing the sensor's rigidity. In an
attempt to overcome the inconvenient rigidity in [64], the sensor was embedded into
elastic material, silicon rubber.
Piezoelectric-based sensors are also widely used in plantar force measurements [65,
66]. An electric charge is generated when the piezoelectric material experiences
an external force. Electric polymer foils are the most extensively used material in
biomedical applications such as polyvinylidene uoride (PVDF) and cellulose nanobril
(CNF) [67], which can be made very thin (between micrometers and millimeters in
thickness), making them a potential solution for many applications[68]. A exible,
piezoelectric-based polymer foil sensor made of polyvinylidene uoride was presented
in [69] to assess the distribution of foot plantar pressure. Since the proposed material
17
is highly sensitive to pyroelectricity (i.e. the material generates a voltage when there is
a change in temperature) [70], a temperature compensator was necessary to mitigate
the pyroelectric eects. In addition, the data acquisition system is complicated and
the sensor was not capable of measuring the shear forces in the x- and y-directions.
Moreover, the materials were structurally fragile and likely to get damage during
common use [71].
All of the aforementioned sensors are micro-electromechanical systems (MEMS)
technology, making them vulnerable to electromagnetic elds and perturbations caused
by its surroundings. Meanwhile, ber-optic sensors are comparatively better candidates
due to their immunity to electromagnetic interference, small size, lightweight and
wide measuring range. The most common sensing methods of ber-optic sensors
in biomechanical and biomedical applications are mainly based on light intensity,
wavelength and phase modulation.
2.3 Intensity Modulated-Based Fiber-Optic Sensors
Intensity based sensors are inherently one of the primal types of ber optic sensors.
In the intensity modulation structure, the optical signal is transmitted through optical
bers, then modulated. There are several techniques for intensity modulated ber-optic
sensors based on the dierent mechanisms, such as transmission loss, reection, shutter
modulation and ber displacement. The special advantages of intensity modulated
sensors are their simple signal conditioning circuit and detection system. They are
straitforward in fabrication and low-cost with high-quality performance [72, 73].
18

2.3.1 Microbending-Based Fiber-Optic Sensors
Microbending is one of the most attractive intensity modulation techniques. it
involves tilting the ber to induce light intensity losses as a result of a change in
radius of curvature. Microbending sensors have been utilized in applications where
the sensing parameter such as force, strain, position, pressure, and acceleration are
mechanically attributed to the displacement of a mechanism that deforms the ber.
As the deformity increases, the loss of radiation increases and the transmission of light
decreases as a representation of the external perturbations acting on the ber [74, 75].
Figure 2.2: Radiative losses as a ber undergoes bends [6].
The development of lightweight, compact and compliant force sensors that have
a wide measuring range and low energy consumption are very ideal for applications
in biomechanics and rehabilitation systems. The collection of the ground reaction
force, plantar pressure, and body kinematics are broadly utilized to characterize the
normal and abnormal behavior of the human foot in gait analysis. These analyses
work towards diagnosing inferior limb problems [76], maintaining balance for the
elderly and for people with disabilities [77], monitoring force distribution beneath
the foot in a stance phase [78], and preventing injury [79]. More recently, plantar
19

pressure distribution has also been designed for human identication [80] as well as for
rehabilitation purposes [81, 82]. The commercially available plantar force measurement
systems or those under development in laboratories for research, they meet specic
requirements for dierent applications. As such, the shape and conguration of the
sensor (or its design) varies in accordance with its application. For the purpose of
this research, the sensor design would include in-shoe measurements such as pressure
distribution, and total ground reaction force and moment for gait measurements.
The design requirements in constructing plantar force sensors are accuracy, spatial
resolution, sensitivity, sampling frequency and reliable calibration [83].
In-sole and out-sole plantar pressure sensors have enhanced eciency, mobility,
exibility and a relatively low cost for pressure measurement systems in biomechanics.
More importantly, for devices to be fully exible and wearable while observing all
activities on a daily basis, the device ought to be wireless and it ought to have a
relatively low electrical power consumption. The practical solution for short wireless
application range is to use inexpensive devices such as an on-chip antenna. The on-chip
antenna allows devices to work at low frequency bandwidths while adding little to the
size of the device; [84, 85] show examples of its use.
Reliable ground reaction force measurements, including shear and normal force
components, are required in order to investigate the role that shear and normal forces
play in producing plantar ulceration in the case of a diabetic patient [7]. A high
resolution, exible force sensor has been fabricated based on intensity loss through
bending. The prototypes in [7, 86, 87] have the ability to measure the pressure
distribution underneath a foot. These optical ber sensors for this prototype are
congured to incorporate two pairs of optical bers, each pair comprising two parallel
optical bers and each pair congured perpendicular to each other, as illustrated
20

in Figure 2.3. The four resulting intersections provides a means to assess the shear
force by analyzing the set of misalignments of four intersections when applying a
shear force. Normal force is measured through the intensity attenuation as a result of
bending the optical ber.
Figure 2.3: plantar and shear pressure sensor prototype [7].
Furthermore, this prototype is not able to determine forces applied simultaneously
at more than one intersection, particularly when the number of output signals from
the bers are less than the number of measured pressure points (sensors). In [8, 88],
the sensor was fabricated so that the mesh of optical ber is embedded into one
polydimethylsiloxane (PDMS) sheet as shown in Figure 2.4. This prototype uses,
in addition, a neural network imaging algorithm to identify the load shapes and to
determine the corresponding magnitude of the applied loads.
Biomedical and biomechanical sensors are inclind to construction challenges and
specic problems related to the interface between human biological organs. Such
sensors should be safe, reliable, biocompatible, highly stable, lightweight, and agreeable
21
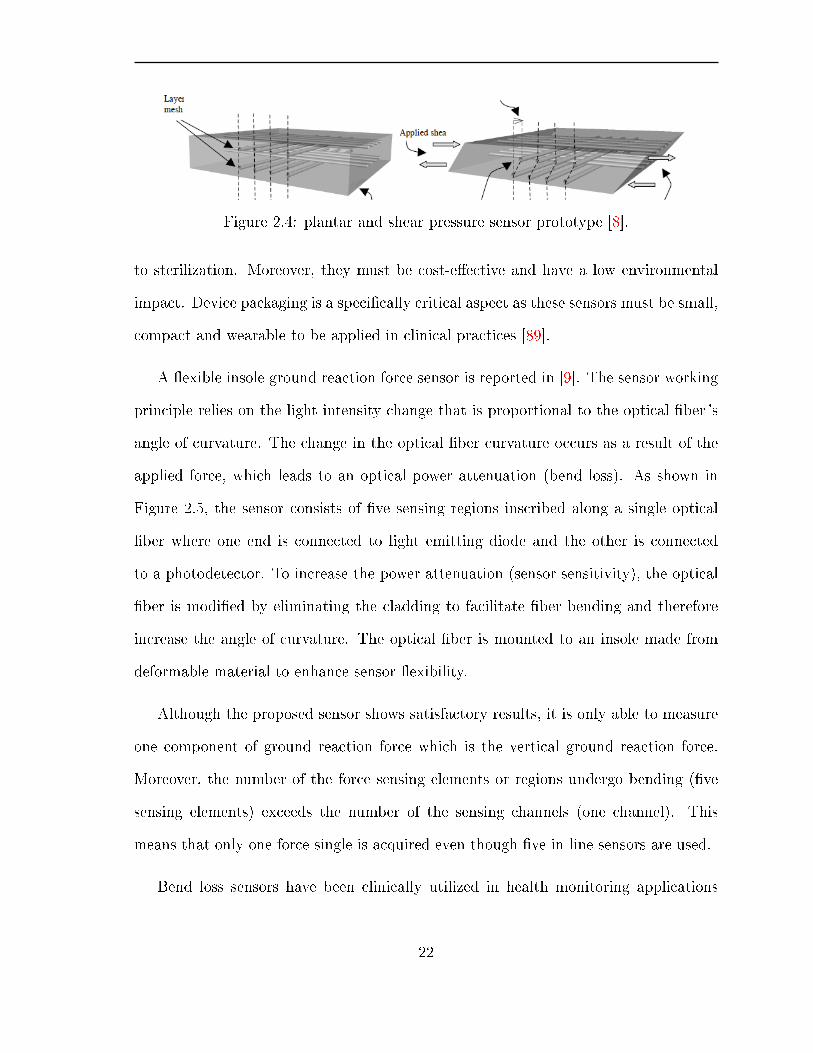
Figure 2.4: plantar and shear pressure sensor prototype [8].
to sterilization. Moreover, they must be cost-eective and have a low environmental
impact. Device packaging is a specically critical aspect as these sensors must be small,
compact and wearable to be applied in clinical practices [89].
A exible insole ground reaction force sensor is reported in [9]. The sensor working
principle relies on the light intensity change that is proportional to the optical ber' s
angle of curvature. The change in the optical ber curvature occurs as a result of the
applied force, which leads to an optical power attenuation (bend loss). As shown in
Figure 2.5, the sensor consists of ve sensing regions inscribed along a single optical
ber where one end is connected to light emitting diode and the other is connected
to a photodetector. To increase the power attenuation (sensor sensitivity), the optical
ber is modied by eliminating the cladding to facilitate ber bending and therefore
increase the angle of curvature. The optical ber is mounted to an insole made from
deformable material to enhance sensor exibility.
Although the proposed sensor shows satisfactory results, it is only able to measure
one component of ground reaction force which is the vertical ground reaction force.
Moreover, the number of the force sensing elements or regions undergo bending (ve
sensing elements) exceeds the number of the sensing channels (one channel). This
means that only one force single is acquired even though ve in-line sensors are used.
Bend loss sensors have been clinically utilized in health monitoring applications
22

Figure 2.5: Pressure insole developed based on bend loss sensing technique [9].
including human lower and upper limbs movement tracking, curvature of lumbar spine,
gait posture, heart and respiration rate assessments. In the upper limb montion
monitoring, the assessment of the angular movement of nger, arm, wrist, elbow as well
as the shoulder joint is essential. A wearable ber-optic sensor based on macrobending
technology was developed to measure the angular movement of the upper human
articulations. The optical ber was installed on a polychloreprene (PCP) rubber suit
where the ber can only bend at the joints of the upper limbs (wrist, elbow and
shoulder). Taking advantage of the light attenuation, the movements of the arm can
be monitored from the bending bers [90].
2.3.2 Reection Based Fiber-Optic Sensors
Reection based intensity modulation ber-optic sensors are ideal in the eld of
sensing due to its simple sensing principles that rely on the intensity alteration in
the reected light. The reecting technique incorporates a moveable reective surface
positioned in front of bers, one transmitting and one receiving. The reective surface
moving in a longitudinal direction leads to an axial displacement that could be
23
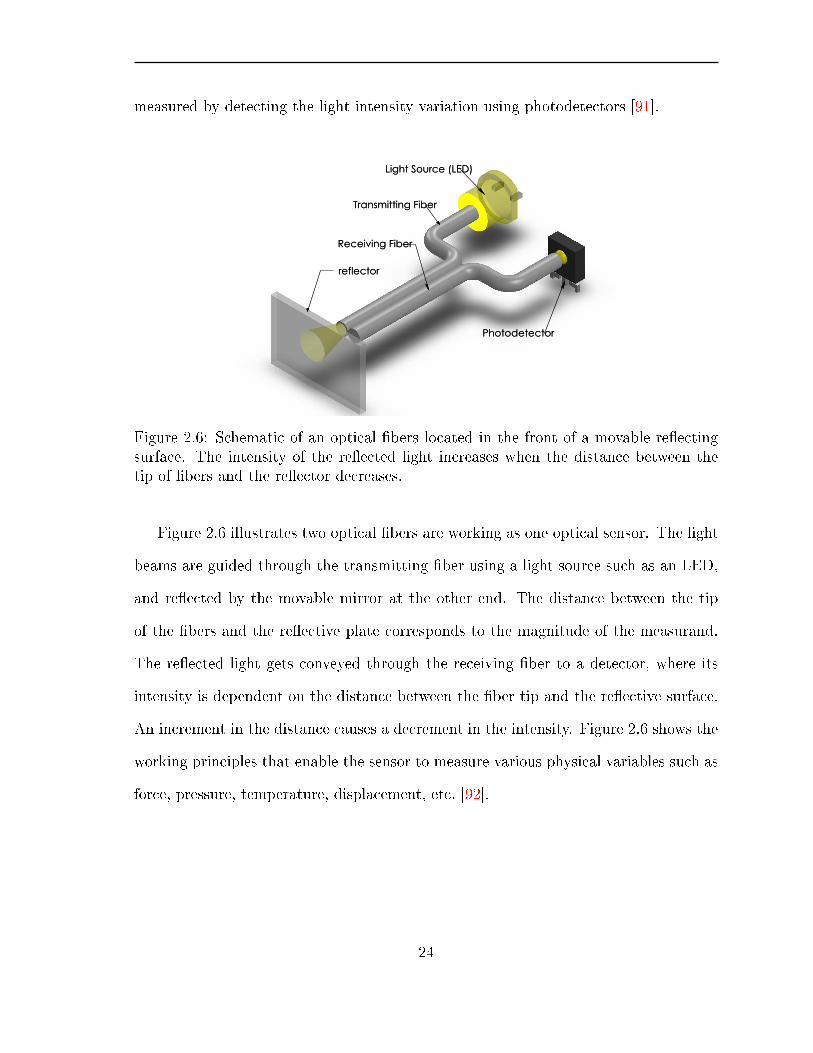
measured by detecting the light intensity variation using photodetectors [91].
reflector
Photodetector
Transmitting Fiber
Receiving Fiber
Light Source (LED)
reflector
Photodetector
Transmitting Fiber
Receiving Fiber
Light Source (LED)
Figure 2.6: Schematic of an optical bers located in the front of a movable reectingsurface. The intensity of the reected light increases when the distance between thetip of bers and the reector decreases.
Figure 2.6 illustrates two optical bers are working as one optical sensor. The light
beams are guided through the transmitting ber using a light source such as an LED,
and reected by the movable mirror at the other end. The distance between the tip
of the bers and the reective plate corresponds to the magnitude of the measurand.
The reected light gets conveyed through the receiving ber to a detector, where its
intensity is dependent on the distance between the ber tip and the reective surface.
An increment in the distance causes a decrement in the intensity. Figure 2.6 shows the
working principles that enable the sensor to measure various physical variables such as
force, pressure, temperature, displacement, etc. [92].
24

2.3.2.1 Reecting-Based Minimally-Invasive Surgical Force Sensors with
Catheter-Tip
Accurate measurement of the displacement is crucial since parameters like force,
pressure and strain are operatively related to the variation of the displacement.
Intensity modulated based sensors with movable reective surfaces located at the
sensor tip have been widely used in minimally-invasive surgery and cardiac pressure
measurements. In [11], a exible, single-axis catheter was developed to assess the
intracardiac pressure in heart surgeries. Three pairs of bers (three transmitting and
three receiving bers) were used to detect the deformation generated when pressing on
a heart. Due to the nonlinear characteristic response of the elastic material used and
its hysteresis, a viscoelastic calibration is necessary to better estimate the applied force.
Although the sensor showed good measuring performance, it was not able to measure
shear forces. The absence of detecting the two components of shear force makes the
sensor lacking as a whole.
Figure 2.7: Intensity-modulated reected light force sensor catheters (a) having triaxialsensing with three optical bers and (b) having uniaxial sensing with six opticalbers [10, 11].
To overcome this challenge, a triaxial catheter with high sensitivity force sensor is
25
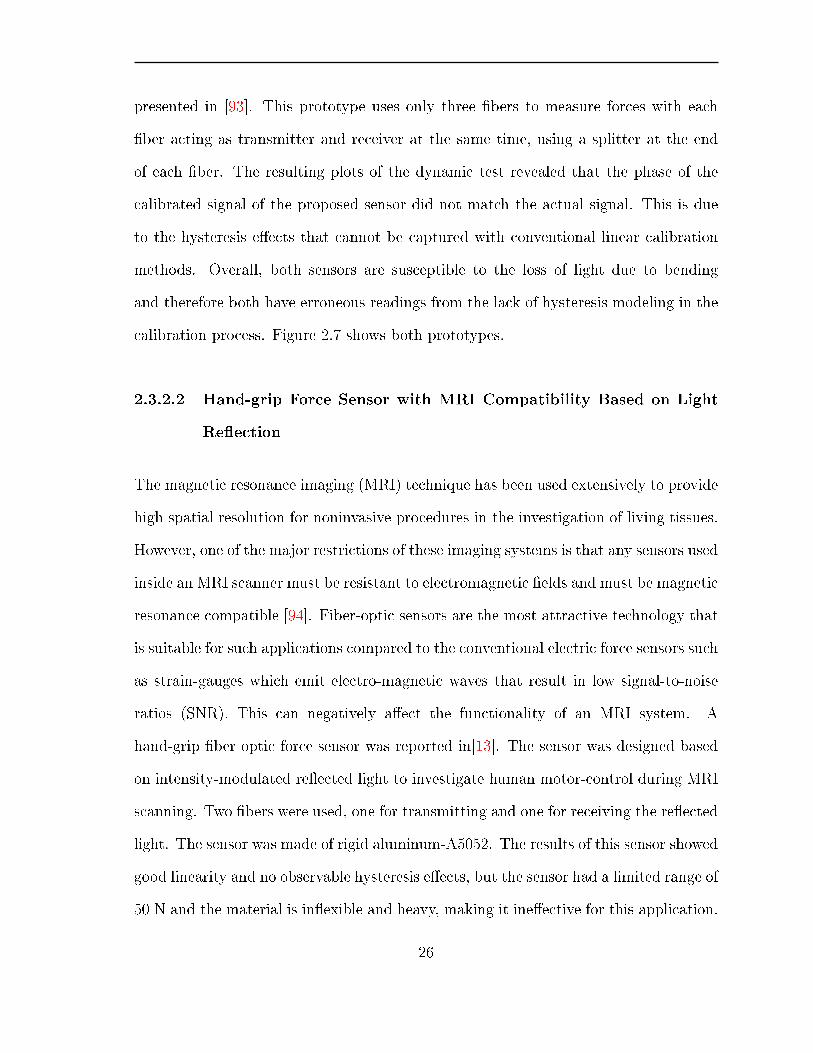
presented in [93]. This prototype uses only three bers to measure forces with each
ber acting as transmitter and receiver at the same time, using a splitter at the end
of each ber. The resulting plots of the dynamic test revealed that the phase of the
calibrated signal of the proposed sensor did not match the actual signal. This is due
to the hysteresis eects that cannot be captured with conventional linear calibration
methods. Overall, both sensors are susceptible to the loss of light due to bending
and therefore both have erroneous readings from the lack of hysteresis modeling in the
calibration process. Figure 2.7 shows both prototypes.
2.3.2.2 Hand-grip Force Sensor with MRI Compatibility Based on Light
Reection
The magnetic resonance imaging (MRI) technique has been used extensively to provide
high spatial resolution for noninvasive procedures in the investigation of living tissues.
However, one of the major restrictions of these imaging systems is that any sensors used
inside an MRI scanner must be resistant to electromagnetic elds and must be magnetic
resonance compatible [94]. Fiber-optic sensors are the most attractive technology that
is suitable for such applications compared to the conventional electric force sensors such
as strain-gauges which emit electro-magnetic waves that result in low signal-to-noise
ratios (SNR). This can negatively aect the functionality of an MRI system. A
hand-grip ber optic force sensor was reported in[13]. The sensor was designed based
on intensity-modulated reected light to investigate human motor-control during MRI
scanning. Two bers were used, one for transmitting and one for receiving the reected
light. The sensor was made of rigid aluminum-A5052. The results of this sensor showed
good linearity and no observable hysteresis eects, but the sensor had a limited range of
50 N and the material is inexible and heavy, making it ineective for this application.
26

Figure 2.8: Hand-Grip Fiber-Optic Force Sensors. (a) metal elastic body and (b) the3D printed body structure [12, 13].
In [12], a reection-based ber-optic sensor used to measure gripping force is 3D
printed using Polylactic Acid (PLA). This sensor was lightweight and exible with
a higher measuring range (from 0 N up to 800 N). The experimental results have
conrmed that the sensor exhibits small hysteresis and small nonlinearity errors only
in the range of 0-500 N. The sensor also exhibits creep errors, with a recovery process
that lasts for one hour and never recovering its full shape. The creep error was 26.5 N
for just one grip of thirty minutes. This sensor is not durable as the recovery errors
could increase overtime. Overall, in both sensors shown in Figure 2.8, the developers
did not take into account the bend loss eects. These sensors are susceptible to bending
during grip force measurements since the distance between this sensor handle and its
electric components is relatively long. This distance is essential for this sensor to avoid
electric noise emissions, which in turn can disturb medical equipment such as an MRI
scanner.
27
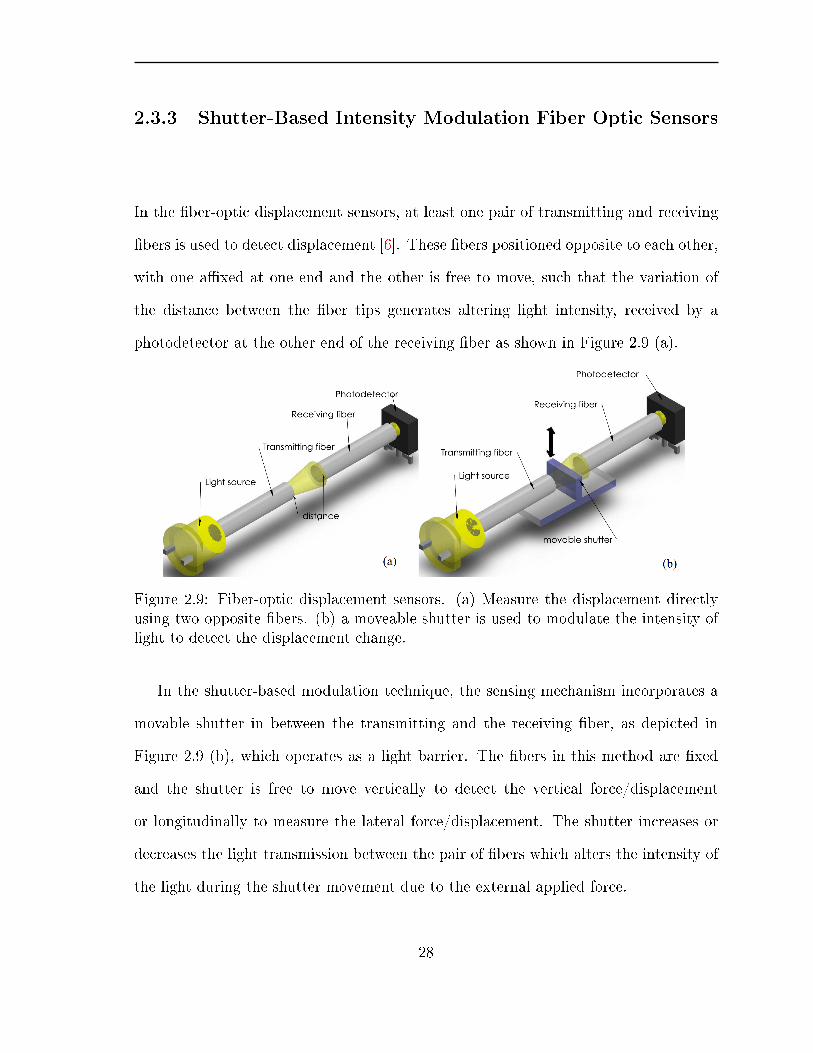
2.3.3 Shutter-Based Intensity Modulation Fiber Optic Sensors
In the ber-optic displacement sensors, at least one pair of transmitting and receiving
bers is used to detect displacement [6]. These bers positioned opposite to each other,
with one axed at one end and the other is free to move, such that the variation of
the distance between the ber tips generates altering light intensity, received by a
photodetector at the other end of the receiving ber as shown in Figure 2.9 (a).
Figure 2.9: Fiber-optic displacement sensors. (a) Measure the displacement directlyusing two opposite bers. (b) a moveable shutter is used to modulate the intensity oflight to detect the displacement change.
In the shutter-based modulation technique, the sensing mechanism incorporates a
movable shutter in between the transmitting and the receiving ber, as depicted in
Figure 2.9 (b), which operates as a light barrier. The bers in this method are xed
and the shutter is free to move vertically to detect the vertical force/displacement
or longitudinally to measure the lateral force/displacement. The shutter increases or
decreases the light transmission between the pair of bers which alters the intensity of
the light during the shutter movement due to the external applied force.
28
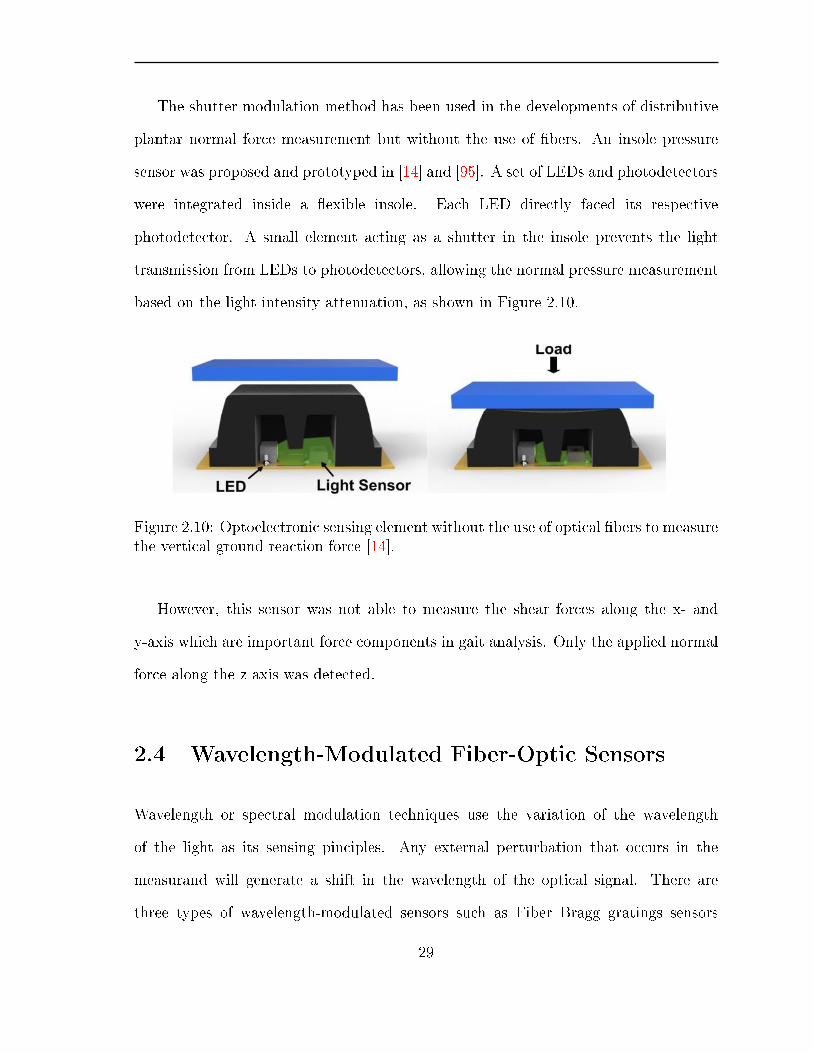
The shutter modulation method has been used in the developments of distributive
plantar normal force measurement but without the use of bers. An insole pressure
sensor was proposed and prototyped in [14] and [95]. A set of LEDs and photodetectors
were integrated inside a exible insole. Each LED directly faced its respective
photodetector. A small element acting as a shutter in the insole prevents the light
transmission from LEDs to photodetectors, allowing the normal pressure measurement
based on the light intensity attenuation, as shown in Figure 2.10.
Figure 2.10: Optoelectronic sensing element without the use of optical bers to measurethe vertical ground reaction force [14].
However, this sensor was not able to measure the shear forces along the x- and
y-axis which are important force components in gait analysis. Only the applied normal
force along the z-axis was detected.
2.4 Wavelength-Modulated Fiber-Optic Sensors
Wavelength or spectral modulation techniques use the variation of the wavelength
of the light as its sensing pinciples. Any external perturbation that occurs in the
measurand will generate a shift in the wavelength of the optical signal. There are
three types of wavelength-modulated sensors such as Fiber Bragg gratings sensors
29
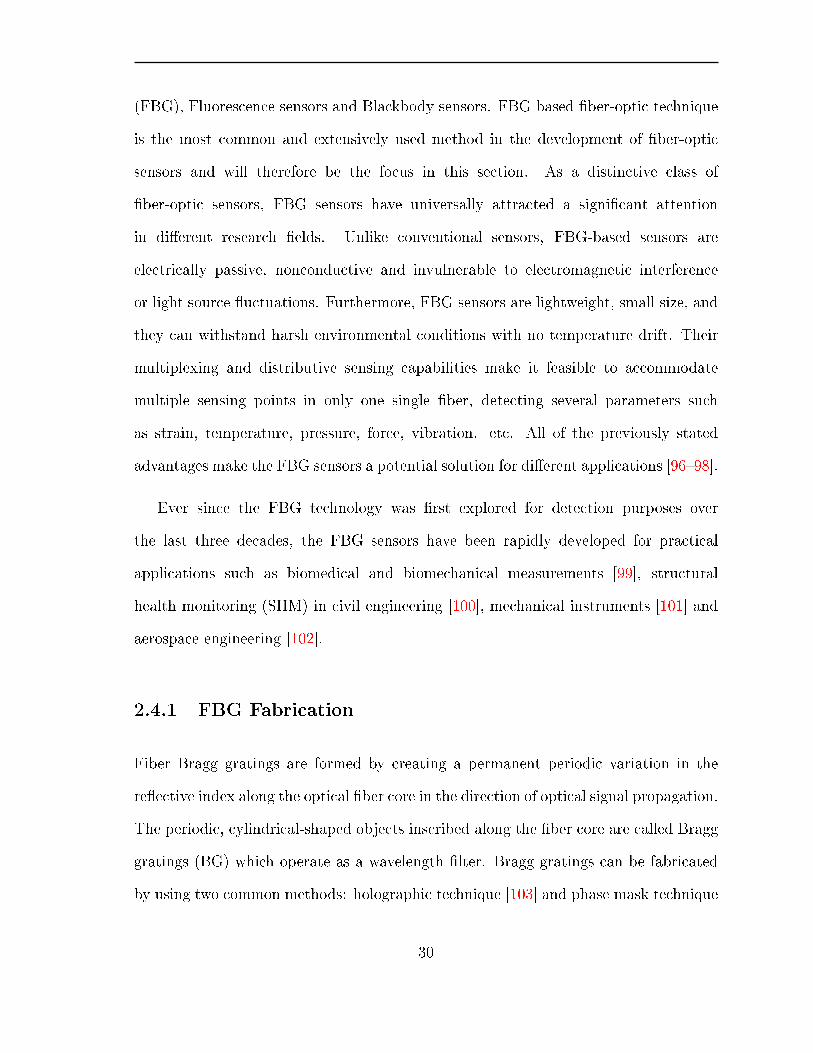
(FBG), Fluorescence sensors and Blackbody sensors. FBG based ber-optic technique
is the most common and extensively used method in the development of ber-optic
sensors and will therefore be the focus in this section. As a distinctive class of
ber-optic sensors, FBG sensors have universally attracted a signicant attention
in dierent research elds. Unlike conventional sensors, FBG-based sensors are
electrically passive, nonconductive and invulnerable to electromagnetic interference
or light source uctuations. Furthermore, FBG sensors are lightweight, small size, and
they can withstand harsh environmental conditions with no temperature drift. Their
multiplexing and distributive sensing capabilities make it feasible to accommodate
multiple sensing points in only one single ber, detecting several parameters such
as strain, temperature, pressure, force, vibration. etc. All of the previously stated
advantages make the FBG sensors a potential solution for dierent applications [9698].
Ever since the FBG technology was rst explored for detection purposes over
the last three decades, the FBG sensors have been rapidly developed for practical
applications such as biomedical and biomechanical measurements [99], structural
health monitoring (SHM) in civil engineering [100], mechanical instruments [101] and
aerospace engineering [102].
2.4.1 FBG Fabrication
Fiber Bragg gratings are formed by creating a permanent periodic variation in the
reective index along the optical ber core in the direction of optical signal propagation.
The periodic, cylindrical-shaped objects inscribed along the ber core are called Bragg
gratings (BG) which operate as a wavelength lter. Bragg gratings can be fabricated
by using two common methods: holographic technique [103] and phase mask technique
30

[104]. In both methods BGs are created by exposing an optical ber to an intense
ultraviolet (UV) beams. For holographic method, a laser beam is transmitted through
a splitter to produce two laser paths which are then combined and intersected inside the
ber, generating permanent regions along the ber core called Fiber Bragg Gratings
(FBG) that have dierent refractive indices. In this method, the BGs wavelength can
be controlled by adjusting the angle between the intersecting laser beams [105].
Figure 2.11: Model FBG theory
For the phase mask approach, a single laser beam and a phase mask are used
to produce BGs, creating an interference pattern along the ber core as shown in
Figure 2.11. The phase mask is usually made of fused silica with etched periodic
patterns which is used to split the single laser beam into various diractive orders which
then interfere and typically overlap each other in the ber. This interference generates
the required FBGs in the ber core, whereas the period of imprinted gratings is either
half or equal to the period of the phase mask, depending on the exposure geometry.
The operating principle of the phase mask is based on the diraction of the incident
UV light into several equal orders: m = 0, ±1, ±2, etc. The general equation of the
31

diraction is described as the following:
Λm =mλU
sin( θm2
) − sin θn(1)
where Λm is the period of the etched patterns of the phase mask, θn is the incident
angle of the UV beam, θm/2 is the diracted beam angle, and λU is the wavelength of
the UV beam. When the UV beam is radiated at the normal incident of θn = 0, the
diracted beam is split into three orders of m = 0 and m = ±1. Thus, the diraction
equation becomes:
Λm =λU
sin( θm2
)(2)
The period of the etched patterns of the phase mask, Λm, is adjusted according to
the required Bragg wavelength λB for the gratings inscribed along the ber core. The
gratings periodicity ΛB, or eectively the distance between two gratings, can can be
described by the following equation :
ΛB =λU
2 sin( θm2
)=
Λm
2(3)
The equally diracted orders ±1 are intersected inside the ber, which creates the
FBG interference patterns that have grating periodicity of half the period of the etched
patterns along the phase mask.
2.4.2 FBG Sensing Principles
When an incident spectrum of light propagates through the ber gratings, a certain
wavelength named Bragg wavelength λB, is reected back while the rest of the spectrum
is transmitted unaected as can be seen in Figure 2.12. The FBG structure functions
32

as a wavelength-selective lter. The reected Bragg wavelength is determined by the
product of the eective index of the core mode propagating in the ber neff , by twice
the grating period, ΛB.
ΛB =Λm
2=
λB2neff
(4)
λB = 2ΛBneff (5)
Equation (5) shows that the reected Bragg wavelength, λB, relies on the refractive
Figure 2.12: Light propagation through the FBG sensing element. A narrowband ofthe transmitted light with specic wavelength reects back due to the Bragg gratings.
index of the ber core and the inscribed grating periodicity along the ber. When
an external perturbation that can alter the periodicity of the grating is applied such
as an axial strain as shown in Figure 2.13, the FBG responds accordingly and causes
a proportional shift in the reected Bragg wavelength. With a real-time calibration
33

process, strain values and many other parameters can be dynamically measured. The
FBG sensing technique exhibits a highly linear relationship between the reected Bragg
wavelength and the measurand, which is limited to the elastic deformation range of the
ber. FBG-based strain sensors can be employed indirectly to measure force, pressure,
displacement, vibration, ow dynamics and liquid level.
The external perturbation could also be a thermal measurand. Temperature
variation along the ber causes a change in the eective reective index due to the
thermo-optic coecient eects of the ber. Furthermore, thermal expansion produces
a change in the gratings periodicity making it possible to measure temperature. The
thermal and axial strain response characteristics can be described in the following well
known equation of FBG sensing technique [106]
Figure 2.13: FBG sensing element and the reected wavelength variation under uniaxialstrain.
∆λB = λB(αf + ξ)∆T + λB(1 − Pe)∆ε (6)
where ∆λB is the wavelength shift of the reected spectrum from the Bragg gratings
34

generated due to the applied external perturbations such as strain, displacement,
pressure, force, vibration. αf , ∆ε represent the thermal-expansion coecient and the
change in applied axial strain, respectively. ξ and Pe represent the thermo-optic and
elesto-optic coecients, respectively. ∆T is the temperature variations along the ber.
The coecient of the thermo-optic is characterized as
Pe =1
2n2eff
(p12 − ν
(p11 − p12
))(7)
where p12 and p11 represent Pockel' s coecients of elesto-optic (strain-optic) tensor,
and ν is Poisson' s ratio of ber material. The typical values of an optical ber made
of bulk silica are p11 = 0.121, p12 = 0.27, neff = 1.448 and ν = 0.16 − 0.17 [107].
Equation (6) reveals that the reected Bragg wavelength becomes shifted when a
physical elongation is produced due to either a variation in the applied axial strain
or in temperature. Longitudinal strain detection equation at constant temperature
(∆T = 0) can be described as follows:
∆ε =∆λB
λB(1 − Pe)(8)
When only strain detection is required, additional FBG can be inscribed along the
same ber which can also be used as a temperature compensator. In this case, the
additional FBG should not be susceptible to any longitudinal strain. The temperature
change can be calculated when the strain is constant (∆ε = 0) as follows:
∆T =∆λB
λB(αf + ξ)(9)
where,
35

αf = (1/ΛB)(∂ΛB/∂T )
ξ = (1/neff )(∂neff/∂T )
Figure 2.14: Strain and temperature sensitivities of an FBG-based sensor [15].
FBG based sensors exhibit a highly linear relationship between the applied axial
strain and the reected Bragg wavelength which is however, limited to the elastic
deformation of the optical ber material. Moreover, the FBG sensitivity to the applied
strain relies on the photo-elasticity and Young' s modulus of the ber material used in
the FBG fabrication and the cross-sectional area of the inscribed ber Bragg gratings
[108].
However, the FBG based sensors exhibit considerably less sensitivity to temperature
change compared to the applied longitudinal strain, as depicted in Figure 2.14 [15]. The
typical temperature sensitivity for the reected Bragg wavelength is between 0.0068
nm/C and 0.013 nm/C. The corresponding Bragg wavelength range is from 830 nm
to 1550 nm. The strain sensitivity starts form 0.00064 nm/µε to 0.0012 nm/µε for the
same Bragg wavelength range [109].
36

2.4.3 FBG-Based Sensors in Biomechanical and Gait
Measurements
FBG sensors have been among the dominating ber-optic sensing technologies for
strain, pressure and force sensing [108]. In biomechanical applications, introducing
several advantages such as lightweight, small size, high accuracy, high longitudinal
strain resolution, no sensitivity to electromagnetic interference, and negligible
hysteresis eects would signicantly enhance the performance of modern human
assistive devices which have become a crucial part in the modern healthcare industry.
The FBG-based sensors include all of the listed superior advantages [110, 111], which
make them a strong potential solution to address the challenges associated with
developing high-tech devices for rehabilitation and for biomechanical applications. Due
to their high capabilities of sensing, FBG sensors have been used in ground reaction
force measurements and gait analysis [112], body kinematics [113], prosthetic socks,
smart medical beds [114] and surgical robots [115].
Monitoring ground reaction forces is essential to help maintain balance and to
help prevent falls, avoiding their associated injuries [116] as well as diagnosing foot
ulceration diseases [76, 117]; this is particularly benecial for the elderly and for people
with abnormal gait and impaired balance. The primary experimental technology for
ground reaction force measurement is the force plate, but it is restricted to a laboratory
setting and requires adjustments to the patient' s walk during experiments in order to
collect data. On the other hand, wearable pressure shoe sensors are desirable for
this practical application, if they are properly designed. FBG-based sensors are a
unique solution as they have many advantages over the conventional electric sensors.
Several sensors based on FBG techniques have been developed for plantar shear and
37
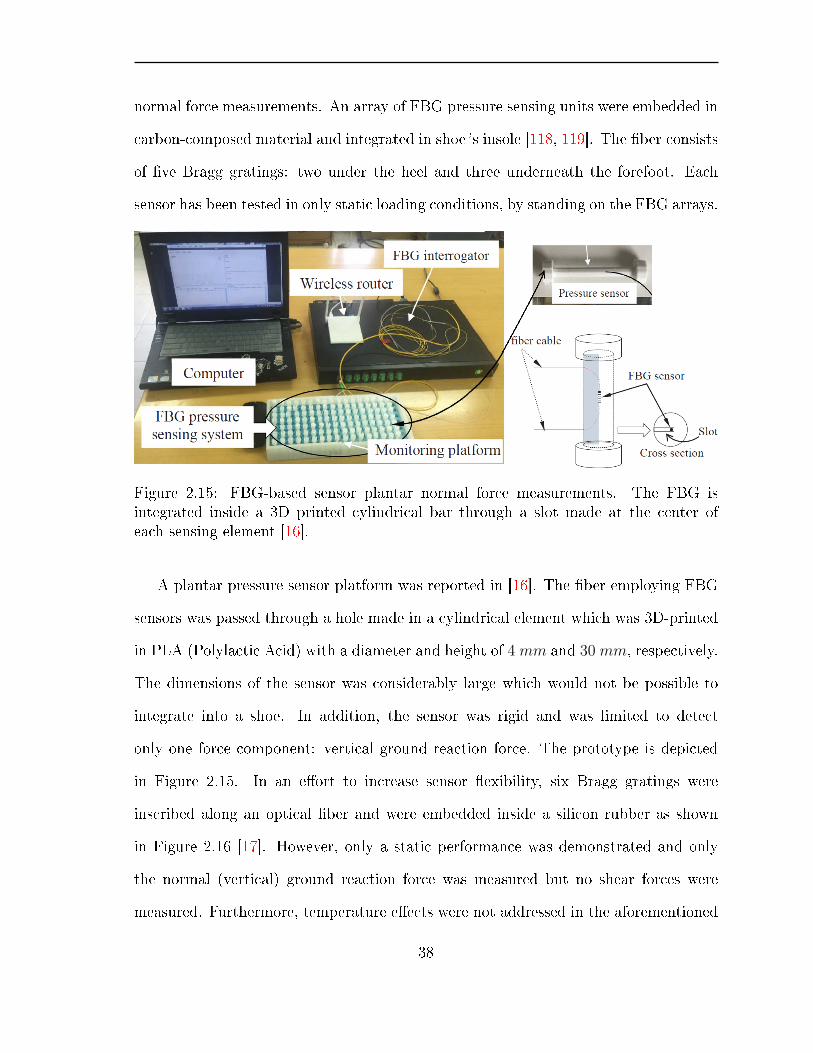
normal force measurements. An array of FBG pressure sensing units were embedded in
carbon-composed material and integrated in shoe' s insole [118, 119]. The ber consists
of ve Bragg gratings: two under the heel and three underneath the forefoot. Each
sensor has been tested in only static loading conditions, by standing on the FBG arrays.
Figure 2.15: FBG-based sensor plantar normal force measurements. The FBG isintegrated inside a 3D printed cylindrical bar through a slot made at the center ofeach sensing element [16].
A plantar pressure sensor platform was reported in [16]. The ber employing FBG
sensors was passed through a hole made in a cylindrical element which was 3D-printed
in PLA (Polylactic Acid) with a diameter and height of 4 mm and 30 mm, respectively.
The dimensions of the sensor was considerably large which would not be possible to
integrate into a shoe. In addition, the sensor was rigid and was limited to detect
only one force component: vertical ground reaction force. The prototype is depicted
in Figure 2.15. In an eort to increase sensor exibility, six Bragg gratings were
inscribed along an optical ber and were embedded inside a silicon rubber as shown
in Figure 2.16 [17]. However, only a static performance was demonstrated and only
the normal (vertical) ground reaction force was measured but no shear forces were
measured. Furthermore, temperature eects were not addressed in the aforementioned
38
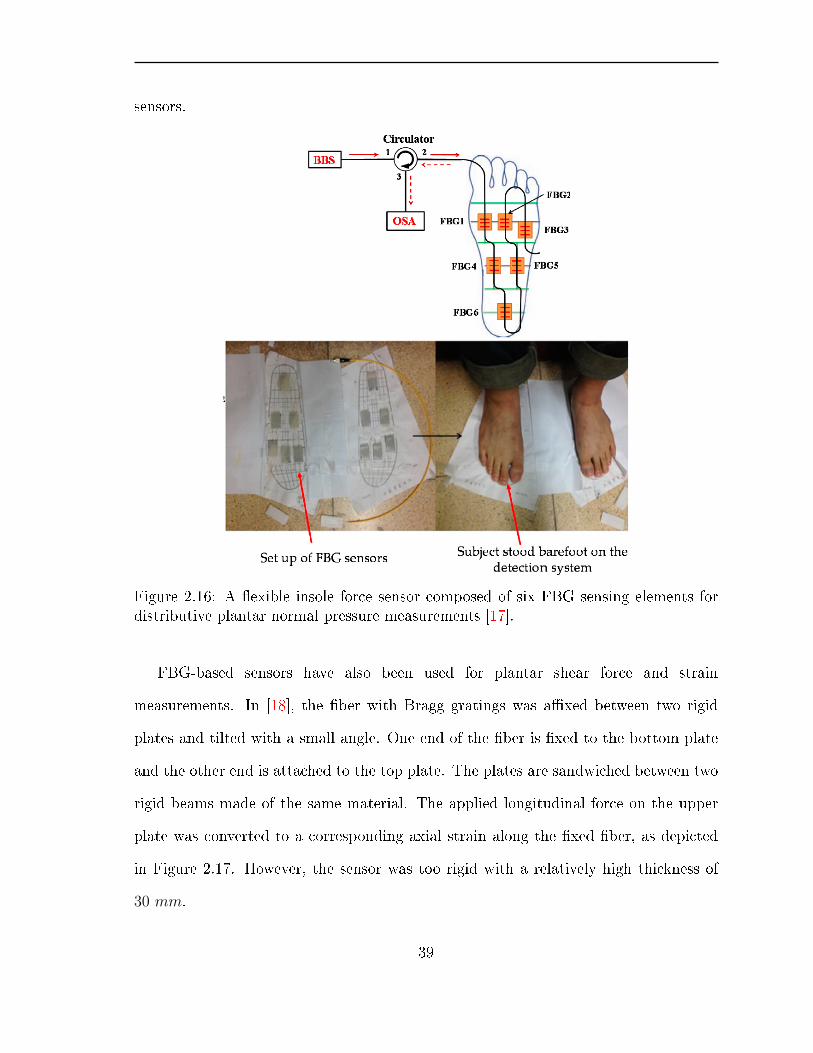
sensors.
Figure 2.16: A exible insole force sensor composed of six FBG sensing elements fordistributive plantar normal pressure measurements [17].
FBG-based sensors have also been used for plantar shear force and strain
measurements. In [18], the ber with Bragg gratings was axed between two rigid
plates and tilted with a small angle. One end of the ber is xed to the bottom plate
and the other end is attached to the top plate. The plates are sandwiched between two
rigid beams made of the same material. The applied longitudinal force on the upper
plate was converted to a corresponding axial strain along the xed ber, as depicted
in Figure 2.17. However, the sensor was too rigid with a relatively high thickness of
30 mm.
39
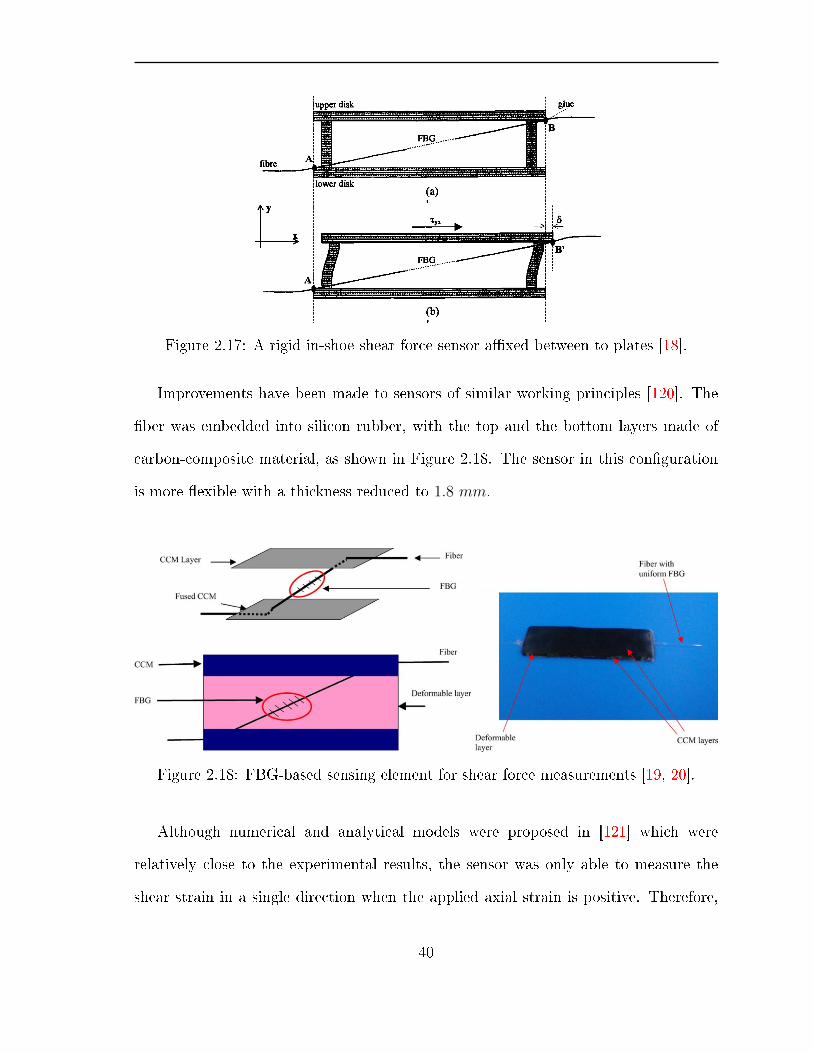
Figure 2.17: A rigid in-shoe shear force sensor axed between to plates [18].
Improvements have been made to sensors of similar working principles [120]. The
ber was embedded into silicon rubber, with the top and the bottom layers made of
carbon-composite material, as shown in Figure 2.18. The sensor in this conguration
is more exible with a thickness reduced to 1.8 mm.
Figure 2.18: FBG-based sensing element for shear force measurements [19, 20].
Although numerical and analytical models were proposed in [121] which were
relatively close to the experimental results, the sensor was only able to measure the
shear strain in a single direction when the applied axial strain is positive. Therefore,
40
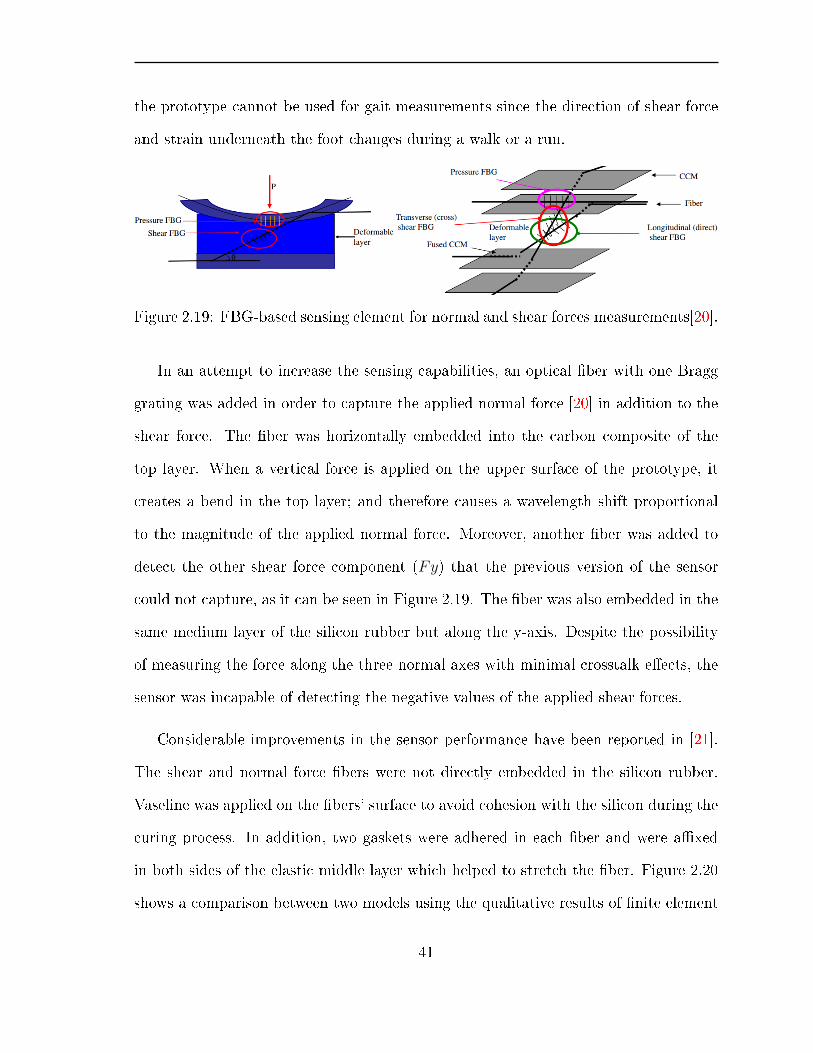
the prototype cannot be used for gait measurements since the direction of shear force
and strain underneath the foot changes during a walk or a run.
Figure 2.19: FBG-based sensing element for normal and shear forces measurements[20].
In an attempt to increase the sensing capabilities, an optical ber with one Bragg
grating was added in order to capture the applied normal force [20] in addition to the
shear force. The ber was horizontally embedded into the carbon composite of the
top layer. When a vertical force is applied on the upper surface of the prototype, it
creates a bend in the top layer; and therefore causes a wavelength shift proportional
to the magnitude of the applied normal force. Moreover, another ber was added to
detect the other shear force component (Fy) that the previous version of the sensor
could not capture, as it can be seen in Figure 2.19. The ber was also embedded in the
same medium layer of the silicon rubber but along the y-axis. Despite the possibility
of measuring the force along the three normal axes with minimal crosstalk eects, the
sensor was incapable of detecting the negative values of the applied shear forces.
Considerable improvements in the sensor performance have been reported in [21].
The shear and normal force bers were not directly embedded in the silicon rubber.
Vaseline was applied on the bers' surface to avoid cohesion with the silicon during the
curing process. In addition, two gaskets were adhered in each ber and were axed
in both sides of the elastic middle layer which helped to stretch the ber. Figure 2.20
shows a comparison between two models using the qualitative results of nite element
41

analysis: one with the ber as being embedded directly into the elastic material (a),
and the other using gaskets (b). By doing so, the applied normal and shear forces
were uniformally distributed along the ber and the sensitivity of the prototype was
also improved. However, this design could damage the sensor if the silicon deection
generated by the applied force exceeds the elastic deformation limit of the used ber.
Figure 2.20: A exible FBG-based force sensor for normal force and one component ofshear force detection [21].
All of the above sensors were tested only in static loading conditions as one single
sensing unit. No critical discussions were presented on how these sensors can be
integrated in a shoe for practical use. In ground reaction force measurements and
other biomechanical applications, the sensor' s dynamic performance is essential but is
not demonstrated or discussed.
In a recent work [22, 122124], an instrumented insole sensor for distributive vertical
ground reaction force has been developed and tested. Six FBG sensing elements were
integrated into a shoe insole made of cork with 10 mm thickness as shown in Figure
2.21. Each FBG was embedded into an epoxy resin (rubber) for protection. Although
the cork was chosen to reduce the temperature eects, additional FBG sensors were
incorporated as a temperature compensator. While the prototype was dynamically
tested for walking there was no standard reference to compare with or showing a
regulated dynamic performance of the proposed sensor to match. Furthermore, the
42
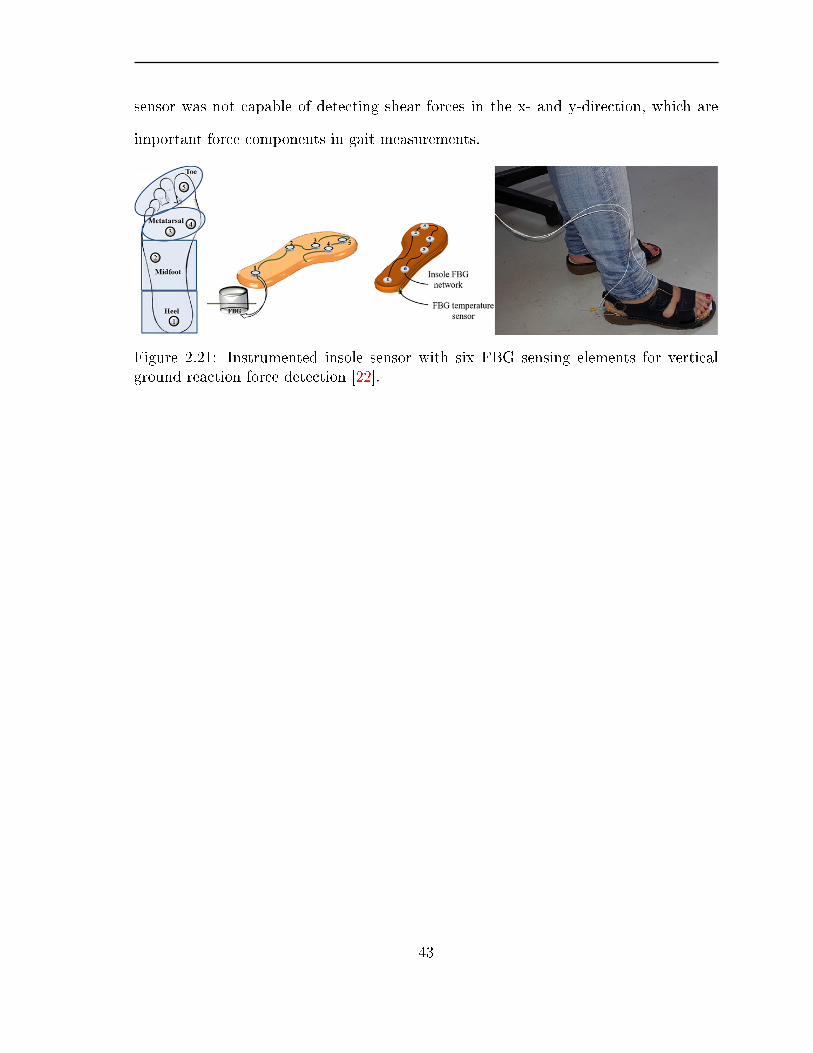
sensor was not capable of detecting shear forces in the x- and y-direction, which are
important force components in gait measurements.
Figure 2.21: Instrumented insole sensor with six FBG sensing elements for verticalground reaction force detection [22].
43
Chapter 3
A Compliant 3-Axis Fiber-Optic Force
Sensor for Biomechanical
Measurement
Abstract
This chapter presents the development of a exible, multi-axis, intensity
modulated-based ber-optic force sensor for concurrently measuring normal and shear
forces. The proposed sensor was prototyped to measure the three force components by
monitoring the variation of the light intensity induced by a deformation as a result of
the applied force. One end of the sensor incorporates three orthogonal reective planes.
The other end brings three pairs of bers; one ber connected to an LED, and the other
to a light-to-voltage converter LTV in each pair. Upon the application of the force, the
distance between the planes and the ber tips changes, thus, the LTV voltage changes,
44
enabling the simultaneous measurement of forces along three normal axes utilizing only
one set of force measurement unit. The fabricated sensor was tested in both static
and dynamic loading conditions as the experimental results have conrmed that the
prototype has the capability to accurately measure the normal and shear forces in real
time ranging from 0 to 1000 N and 0 to 140 N along the z, x and y axes respectively. The
feasible applications of the sensor are ground reaction force measurements (GRF) and
robot-human collision detection. Sensor performance was evaluated for the cross-talk
eects which were found to be less than 5%. A nonlinear Hammerstein-Winer model is
proposed to characterize the linear and nonlinear behavior of the sensor. The optimized
results have shown a reduction of over 40% in the root mean-square errors (RMSE) in
comparison to the linear estimation models.
3.1 Introduction
The rapid population growth of the elderly has increased the demand for eective
healthcare systems. Developing human assistive technologies has become an essential
part in the healthcare industry. In the meantime, recent advanced sensors and modern
electronic technologies have made such development possible. It has been estimated
that about a third of seniors aged 65 years or older fall down every year [125, 126].
Fall prediction for elderly and people with gait instability is crucial in preventing
fall-related injuries [127129]. Reliable measurement of normal and shear forces on
a foot is imperative in gait analysis to help maintain balance and prevent falls [130].
Plantar ulceration is another disease that requires a precise assessment of plantar
shear and normal forces [131, 132]. Studies have revealed that over three-quarters of
amputation cases are attributed to foot ulcers [133, 134].
45

Remarkable eorts in literature have been dedicated to the development of
distributive plantar shear and normal force measurement systems based on various
detection principles. Force-sensitive resistors (FSRs) [135], capacitive and inductive
based transducers [136, 137], piezoresistive [138] and piezoelectric-based plantar
pressure sensors [139] have been proposed and prototyped. However, resistive materials
are highly aected by temperature, structurally fragile, and are prone to damage.
In addition, a temperature compensator is necessary for each individual sensing
element [140].
All the abovementioned sensors are microelectromechanical systems technology,
making them vulnerable to electromagnetic elds and external environmental
perturbations. Moreover, These sensors were only capable of measuring normal force
along the z-axis but not shear forces in the x and y directions. Meanwhile, ber-optic
sensors are comparatively better candidates due to their immunity to electromagnetic
interference and wide measurement range.
A ber-optic sensor based on the bending-loss technique was demonstrated in [7].
The sensor was composed of two ber meshes separated by a exible pad to assess the
normal and shear pressure based on light attenuation due to the material deformation.
In [88, 141143], the sensors were structurally improved by embedding the bers
into elastic material. However, the prototypes entailed too many bers connected to
detectors and light sources making it too bulky to integrate into a shoe. Furthermore,
it was unfeasible to calibrate the sensor using the conventional calibration methods
since the number of output signals exceeded the number of bers (channels). A single
ber mesh contained eight bers xed on an elastic sheet creating several sensing
points for the distributive force measurements [144]. The sensor showed a limited force
measurement range of 2.5 N and can only measure the force applied along the z-axis.
46

Optoelectronic transducers that incorporate only light sources and detectors
without any bers are also used for normal and shear force measurements. An insole
pressure sensor was reported in [95]. A set of LEDs and photodetectors were integrated
inside a exible insole. Each LED faced its respective photodetector. When a physical
deformation occurred due to the applied force, a small element in the insole prevents
the light transmission from LEDs to photodetectors, allowing the normal pressure
measurement based on the light variation. In [145] the LED and LTV pairs were used
to measure the force along the three axes. Nevertheless, the lack of the exibility made
the prototype inconvenient in biomechanical applications.
Wavelength-modulation-based sensors such as ber Bragg Gratings (FBGs) are
another desirable option due to their high sensitivity, small size, and multiplexing
sensing capabilities. The most recent work presented the feasibility of developing
exible sensors where the bers were embedded into a silicon rubber [17, 22, 146, 147].
However, the sensors were capable of measuring only the normal plantar pressure but
not shear, and were sensitive to temperature and very expensive to interrogate.
Compliant sensors have also been used in human-robot interactions. An
optoelectronic force measurement system incorporated a matrix of LEDs and
photodetectors connected on a printed-circuit-board (PCB) was reported in [148]. The
matrix of the sensing elements was shielded by an elastic piece made of silicon rubber
which had the shape of a hemisphere. The variation of the light intensity generated
by a physical deection was proportional to the applied force. The sensor was able to
measure only the force along a single axis. In an eort to enhance the functionality
of the sensor [149151], the pressure sensing elements were distributed in a certain
conguration to detect forces along the three axes.
47
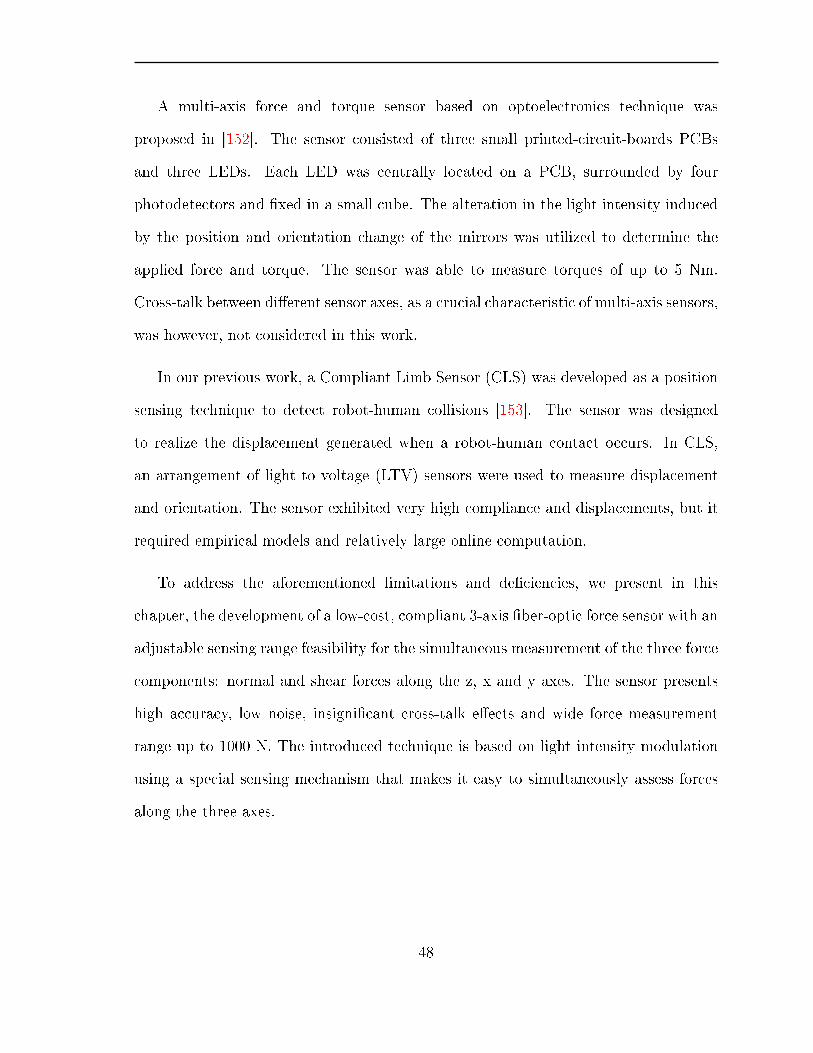
A multi-axis force and torque sensor based on optoelectronics technique was
proposed in [152]. The sensor consisted of three small printed-circuit-boards PCBs
and three LEDs. Each LED was centrally located on a PCB, surrounded by four
photodetectors and xed in a small cube. The alteration in the light intensity induced
by the position and orientation change of the mirrors was utilized to determine the
applied force and torque. The sensor was able to measure torques of up to 5 Nm.
Cross-talk between dierent sensor axes, as a crucial characteristic of multi-axis sensors,
was however, not considered in this work.
In our previous work, a Compliant Limb Sensor (CLS) was developed as a position
sensing technique to detect robot-human collisions [153]. The sensor was designed
to realize the displacement generated when a robot-human contact occurs. In CLS,
an arrangement of light to voltage (LTV) sensors were used to measure displacement
and orientation. The sensor exhibited very high compliance and displacements, but it
required empirical models and relatively large online computation.
To address the aforementioned limitations and deciencies, we present in this
chapter, the development of a low-cost, compliant 3-axis ber-optic force sensor with an
adjustable sensing range feasibility for the simultaneous measurement of the three force
components: normal and shear forces along the z, x and y axes. The sensor presents
high accuracy, low noise, insignicant cross-talk eects and wide force measurement
range up to 1000 N. The introduced technique is based on light intensity modulation
using a special sensing mechanism that makes it easy to simultaneously assess forces
along the three axes.
48

3.2 Sensor Design and Fabrication
Figure 3.1 demonstrates the design concepts of the proposed 3-axis ber-optic force
sensor based on light intensity modulation by reectance to measure the shear and
normal forces in real-time. The sensor consists of three reective surfaces for each sensor
situated at the center of a square rigid aluminum plate (bottom layer) with dimensions
of 5.5 cm×5.5 cm×0.1 cm. The reective surfaces are instantaneously utilized to reect
light from the transmitting bers to the receiving bers in each axis. Three plastic
models (holders) were 3D printed in Acrylonitrile Butadiene-Styrene (ABS) material,
which is the most commonly used in 3D printing and is suitable for this application
due to its durability and rigidity with slight elastic-like characteristics. These holders
are xed on another aluminum plate (top layer) to carry the light detectors (LTVs)
and light sources (LEDs) as well as the transmitting and the receiving bers. Using
these holders the bers can be properly xed and mounted to the LTVs and the LEDs.
The ber is made of copolymer plastic with a total diameter of 750 µm and numerical
aperture (NA) of 0.5. White LED with a power rating of 120 mW was utilized to
provide the necessary light power. The reected light is received by high sensitivity
and low power consuming light to voltage converter (model: TSL257) that consists of
a photodiode with a trans-impedance amplier.
The top layer of the sensor also encompasses four elements used to orient the
transmitting and the receiving bers to their respective reective surfaces via passing
each pair of the bers through small holes made in these elements. The transmitting
and receiving bers of the z-axis utilize one extra element to facilitate the bending
process during bers' installation to appropriately orient the bers to their allocated
reective surface ( the bend seen in Figure 3.3 is xed within the sensing unit, which
49

does not move or bend during the operation). Each reective surface is located
perpendicular to its pair of bers where the reective surface of the normal force
direction (force applied along the z-axis) lies along the bottom layer of the sensor. The
reective surfaces of shear forces are xed perpendicular to the x and y axes.
Figure 3.1: The ber-optic sensing principles for the simultaneous measurement ofnormal and shear forces in the z, x and y directions. (1), (7). The transmittingand receiving bers of y-axis force sensor. (2). Reective surfaces. (3), (4). Z-Axistransmitting and receiving bers. (5), (6). The transmitting and receiving bers ofthe x-axis.
To increase the exibility, a stretchable material such as rubber has been extensively
utilized in developing a variety of exible sensors [154156]. In this work, four
elastic cubes made from Mold Max 60 (a tin-cured silicon rubber of shore 60-A)
features high temperature resistance capability. The dimensions of these cubes are
1.5 cm×1.5 cm×1 cm positioned at the four angles and sandwiched between the top
and bottom layers, creating one sensing unit.
50
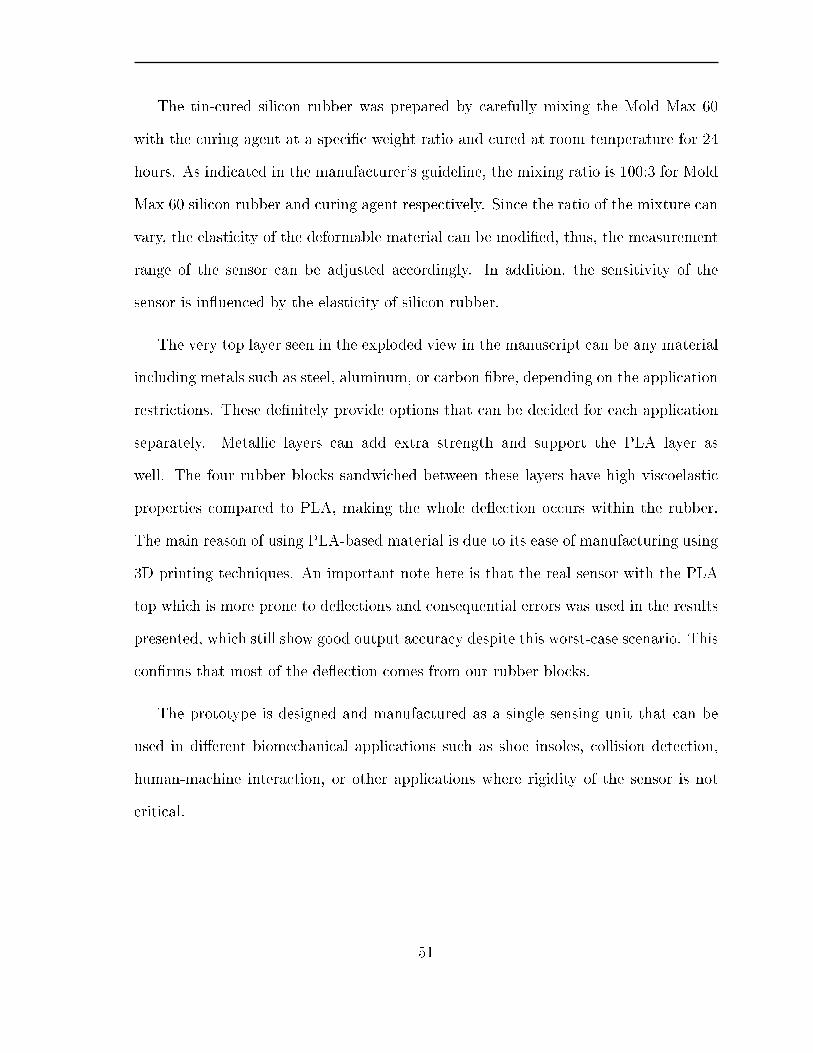
The tin-cured silicon rubber was prepared by carefully mixing the Mold Max 60
with the curing agent at a specic weight ratio and cured at room temperature for 24
hours. As indicated in the manufacturer's guideline, the mixing ratio is 100:3 for Mold
Max 60 silicon rubber and curing agent respectively. Since the ratio of the mixture can
vary, the elasticity of the deformable material can be modied, thus, the measurement
range of the sensor can be adjusted accordingly. In addition, the sensitivity of the
sensor is inuenced by the elasticity of silicon rubber.
The very top layer seen in the exploded view in the manuscript can be any material
including metals such as steel, aluminum, or carbon bre, depending on the application
restrictions. These denitely provide options that can be decided for each application
separately. Metallic layers can add extra strength and support the PLA layer as
well. The four rubber blocks sandwiched between these layers have high viscoelastic
properties compared to PLA, making the whole deection occurs within the rubber.
The main reason of using PLA-based material is due to its ease of manufacturing using
3D printing techniques. An important note here is that the real sensor with the PLA
top which is more prone to deections and consequential errors was used in the results
presented, which still show good output accuracy despite this worst-case scenario. This
conrms that most of the deection comes from our rubber blocks.
The prototype is designed and manufactured as a single sensing unit that can be
used in dierent biomechanical applications such as shoe insoles, collision detection,
human-machine interaction, or other applications where rigidity of the sensor is not
critical.
51
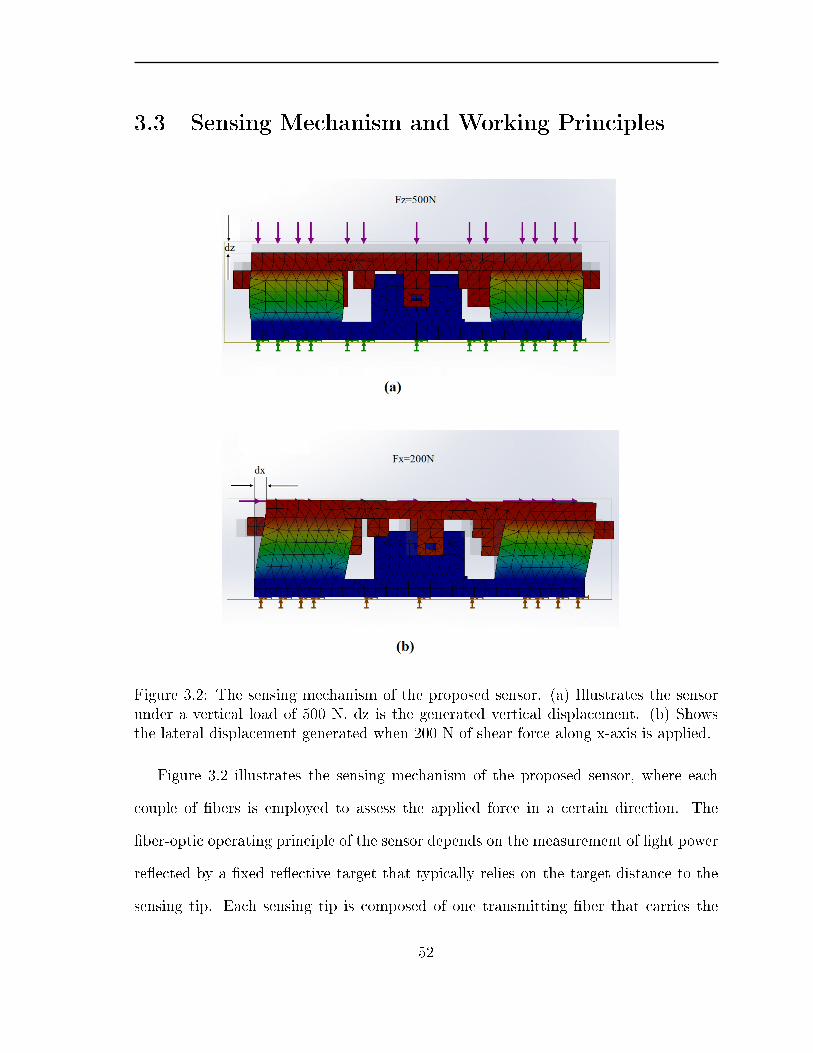
3.3 Sensing Mechanism and Working Principles
Figure 3.2: The sensing mechanism of the proposed sensor. (a) Illustrates the sensorunder a vertical load of 500 N. dz is the generated vertical displacement. (b) Showsthe lateral displacement generated when 200 N of shear force along x-axis is applied.
Figure 3.2 illustrates the sensing mechanism of the proposed sensor, where each
couple of bers is employed to assess the applied force in a certain direction. The
ber-optic operating principle of the sensor depends on the measurement of light power
reected by a xed reective target that typically relies on the target distance to the
sensing tip. Each sensing tip is composed of one transmitting ber that carries the
52

light from the source to the reecting target and one receiving ber that accumulates
the reected light form the target as shown in Figure 3.3.
The receiving bers are connected to photo-detectors to convert the light intensity
to output voltage. The transmitting bers are fed by light emitting diodes (LEDs).
When the top layer of the sensor is excited by a pure normal force along the z-axis,
the four cubes of the tin-cured silicon rubber are compressed and the displacement
dz increases, representing the shrinking distance between the two layers of the sensor
which leads to an increase in the light power. The light intensity in this instance, is
a function of the generated vertical displacement. This is because the radius of the
reected light increases as result of the generated displacement as shown in Figure 3.4.
Figure 3.3: The ber-optic sensing principles for the simultaneous measurement ofnormal and shear forces in the z, x and y directions. (1), (7). The transmittingand receiving bers of y-axis force sensor. (2). Reective surfaces. (3), (4). Z-Axistransmitting and receiving bers. (5), (6). The transmitting and receiving bers ofthe x-axis.
During this excitation, the ber tips of the shear forces in the x and y directions
stay parallel to their reective targets. This means that the distance between the ber
53
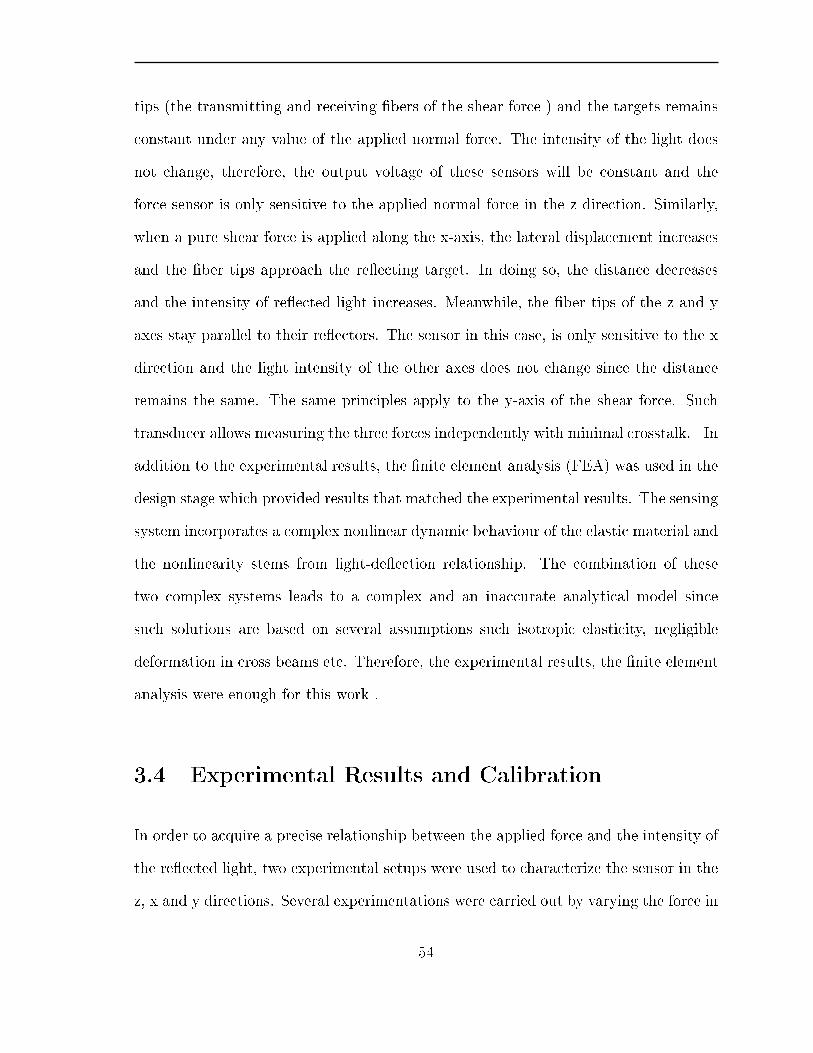
tips (the transmitting and receiving bers of the shear force ) and the targets remains
constant under any value of the applied normal force. The intensity of the light does
not change, therefore, the output voltage of these sensors will be constant and the
force sensor is only sensitive to the applied normal force in the z direction. Similarly,
when a pure shear force is applied along the x-axis, the lateral displacement increases
and the ber tips approach the reecting target. In doing so, the distance decreases
and the intensity of reected light increases. Meanwhile, the ber tips of the z and y
axes stay parallel to their reectors. The sensor in this case, is only sensitive to the x
direction and the light intensity of the other axes does not change since the distance
remains the same. The same principles apply to the y-axis of the shear force. Such
transducer allows measuring the three forces independently with minimal crosstalk. In
addition to the experimental results, the nite element analysis (FEA) was used in the
design stage which provided results that matched the experimental results. The sensing
system incorporates a complex nonlinear dynamic behaviour of the elastic material and
the nonlinearity stems from light-deection relationship. The combination of these
two complex systems leads to a complex and an inaccurate analytical model since
such solutions are based on several assumptions such isotropic elasticity, negligible
deformation in cross beams etc. Therefore, the experimental results, the nite element
analysis were enough for this work .
3.4 Experimental Results and Calibration
In order to acquire a precise relationship between the applied force and the intensity of
the reected light, two experimental setups were used to characterize the sensor in the
z, x and y directions. Several experimentations were carried out by varying the force in
54

Figure 3.4: Sensing principles. (a) occurs when a small amount of force is applied. (b)occurs when the applied force increases.
the x, y and z directions. Due to the lack of simultaneous three-axis force test systems,
we designed and constructed a multi-axis force test device using 6-axis translation
stage that has a resolution of 0.01 mm and a 6-axis force and torque sensor (Model:
F/T Delta SI-60-600, ATI Industrial Automation). The sensor features a measurement
range of 660 N for the force along the x and y axes and 1980 N for the normal force
with a resolution of 0.25 N. The sensor is appropriate for this calibration since the
fabricated sensor operates within that range. An aluminum platform composed of two
plates is connected to each other by four cylindrical beams as shown in Figure 3.5 (a).
The stage is xed to the top plate and the F/T Delta SI-60-600 sensor is located at the
center of the bottom plate. The proposed sensor is placed between the translation stage
and the 6-axis F/T sensor. Forces in dierent directions can be applied by adjusting
the stage in several positions. The data acquisition-system incorporates a CB-68LP
National Instruments, 16-bit multi-function DAQ card, MATLAB Real Time Simulink
software and a desktop computer.
The fabricated force test device has the ability to apply forces simultaneously in
dierent directions compared to the Bionix Servo-hydraulic Test System (MTS) that
applies the force only in one direction as depicted in Figure 3.5 (b). However, the
55

Figure 3.5: (a) The developed test device that is mainly composed of ATI 6-axis F/Tsensor and 6-axis stage. (b) The MTS experimental setup was utilized to apply pureuniaxial force to evaluate the cross-talk eects.
MTS was more accurate in terms of linear motion during the uniaxial loading test. As
a consequence, we used the MTS setup to properly investigate the cross-talk eects.
The device has a precise linear-variable displacement-transducer with a resolution of
0.01 mm and 1 N. We carried out the normal force test (compression) by placing the
sensor between the MTS grips in the test area. Notice that the thickness of the top
and bottom layers of the designed sensor was very small making it hard to apply shear
forces using the MTS so that we replaced the old layers with 3D-printed ones with a
thickness of 3 mm. For the shear force test, the same setup was used by twisting the
sensor in the x or y direction and applying dierent loads. To evaluate the cross-talk
of the sensor, the force was applied individually along each axis using the MTS and
the response of the other two axes was monitored. This assessment guaranteed that
no undesired forces could disturb the uniaxial loading test when a force in a certain
direction is applied.
56

A preliminary characterization was done using a quadratic function for each axis
(F = a1V2 + a2V + a3), where F is the applied force, V is the output voltage, and
a1, a2 and a3 are the coecients. The force-voltage measurements and the tted curves
for static loading are shown in Figure 3.6. The RMSE values were found to be 7.71 N
((0.76%), 1.80 N (1.28%) and 2.76 N (1.97%) for the z-, x- and y-axis respectively.
Figure 3.6: Quadratic tting model of force to voltage curves. (A), (B) and (C) arethe tting models of the z-, x- and y-axis respectively.
3.4.1 The Eect of Cross-talk on Sensor Performance
Force signals acquired from a multi-axis force sensor other than the force being
measured in the target direction are called cross-talk. These unwanted signals
inevitably cause errors, aecting the performance of the force measurement. Cross-talk
eects are commonly considered to be a problem in sensor development. It is very
desirable for a sensor to produce the outputs directly proportional to individual inputs
57

(Fx, Fy and Fz: Forces applied along the x-, y-, and the z-axis respectively) without
cross-talk. As high as 28% of cross-talk was reported in [157]. In [158, 159] a
mathematical compensation method was used which, however, produced cross-talk
errors of 5% and 10.61% respectively. In the datasheet of the commercially-available
multi-axis force sensors (KISTLER, Models: 9167A, 9168A, 9167AB and 9168AB) a
cross-talk of 5% was presented. In this section, several experiments (static tests) were
conducted and repeated several times to evaluate the cross-talk eects on the sensor
under dierent magnitudes and directions of the applied force. Normal force ranging
from 0-1 kN was applied to the proposed sensor, such that the four rubber cubes were
under a compression. The response of the sensor in the three directions of z, x and y
is depicted in Figure 3.7 (a)-(c)
Although the experimental relationship between the light intensity and the
displacement is nonlinear, Figure 3.7 (a) shows good linearity between the applied
normal force and the light intensity. The linearity of the z-axis was achieved as a
result of a nonlinearity cancellation phenomenon that occurred when the mechanical
nonlinearity of the elastic material (between the applied normal force and the generated
displacement) cancelled the nonlinear relationship between the light intensity and
the displacement. The cancellation between these nonlinearities led to overall linear
correlation that can be distinctly observed in Figure 3.7 (a). The level of cancellation
can be controlled by adjusting the stiness of the elastic material.
The results also showed that the sensor responded only to the applied normal forces
which entirely agrees with our theoretical discussion of the working principles in the
previous section. The maximum cross-talk errors in the x and y directions were 2.12 N
(1.51%) and 4.31 N (3.07%) receptively. A negligible sensitivity in both of the x and
y axes to the applied normal force is presented in Figure 3.7 (a)
58
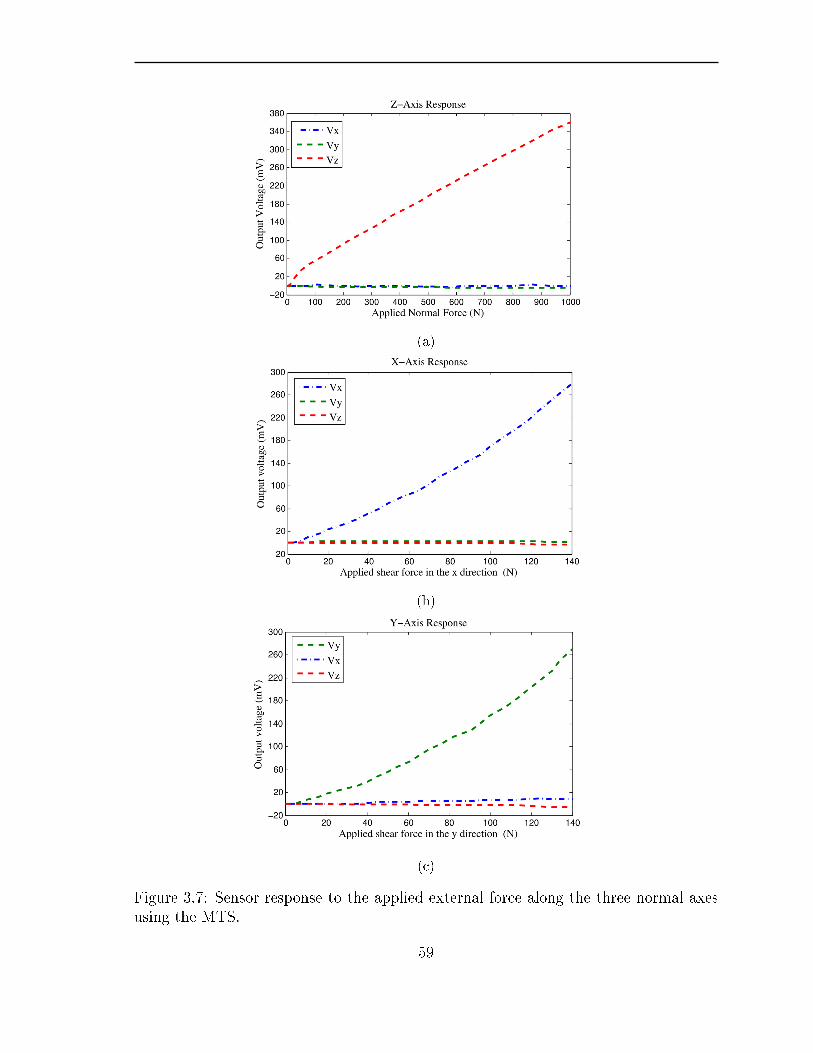
(a)
(b)
(c)
Figure 3.7: Sensor response to the applied external force along the three normal axesusing the MTS.
59

Table 3.1: A summary of the cross-talk errors along each axis
Figure 3.7 (b) illustrates the results obtained from a static shear force test in the
x direction. In order to apply a pure shear force along the x-axis, a xture was made
to orient the sensor at the proper direction. A longitudinal shear force ranging from 0
to 140 N was applied. The gure does not show a linear correlation similar to that in
the z direction between the applied shear and light intensity. This is due to the linear
response of the elastic material to the applied shear force. Therefore, no nonlinearity
cancellation was observed.
Figure 3.7 (b) also presents the greatest sensitivity to the direct shear force in the
x direction, while the other two axes (y and z) revealed a negligible sensitivity with
maximum cross-talk errors of 2.60 N (1.85%) in the y direction and 3.78 N (0.37%)
along the z-axis which also conrms the previously stated theoretical predictions.
Similarly, the sensor was highly sensitive to the shear force in the y direction when
a longitudinal force ranging from 0-140 N along the y-axis was applied as shown in
Figure 3.7 (c) However, maximum cross-talk errors of 13.79 N (1.37%) and 5.62 N
(4.01%) were found in the z and x directions respectively. These eects are all
summarized in table 3.1.
60

3.4.2 Calibration Methodology
Figure 3.8 shows the calibration setup of the proposed 3-axis force sensor that is placed
between the ATI 6-axis F/T sensor and 6-axis manipulator. The force and torque sensor
is utilized to measure the applied force (normal and shear) in the z, x and y directions.
The manipulator is used to apply forces along the three axes. The top layer of the
fabricated sensor is connected to the manipulator via an aluminum bar xed in the
center of a square plate and the bottom layer is positioned on the ATI 6-axis F/T
sensor. When the stage moves along the z-axis, the sensor will be compressed and a
Figure 3.8: (a) The developed test device that is mainly composed of ATI 6-axis F/Tsensor and 6-axis stage. (b) The MTS experimental setup was utilized to apply pureuniaxial force to evaluate the cross-talk eects.
uniform normal force is applied. The lateral movement of the stage in the x direction
will shift the top layer of the sensor, generating a shear force along the x-axis. In the
same way, shear forces can be applied along the y-axis.
For the calibration, reference force data was collected by connecting the sensor
61

and an ATI 6-axis F/T sensor to the data acquisition card, which is connected to a
computer using the RC68-68 ribbon cable. The data was acquired from both sensors
at a sampling rate of 1 kHz. It was dicult to accurately understand the relationship
between the sensor input and output using a conventional least-squares technique in
the calibration process of the proposed sensor, due to nonlinearity.
Several models were applied using the system identication toolbox in MATLAB
using roughly 5,000 samples of a database. For the x-axis, both a third-order
Auto-regressive moving-average (ARMAX) estimation model and a second-order
Output-Error (OE) model exhibited satisfactory results. The Root-Mean Square Error
(RMSE) for each model was 7.32 N and 8.28 N with a tting value of 85.88% and
84.04% for the ARMAX and OE models respectively. A fth-order transfer function
estimation model with ve poles and four zeros as presented in Equation 1 showed a
better result with an RMSE of 6.54 N and a tting value of 87.40%. The results of
the models as a comparison to the real data of the ATI 6-axis F/T sensor is plotted in
Figure 3.9.
G(z) =−197z−1 + 589.4z−2 − 588z−3 − 195z−4
1 − 4.5z−1 + 5.5z−2 − 8.5z−3 − 4.4z−4 − 0.9z−5(1)
The previously selected estimation models have been found to be powerful in
characterizing the sensor. As a result, the three models were applied for each axis.
With respect to the tting value, the results of the y-axis were slightly more accurate
than the x-axis results. Using a fth-order transfer function estimation model, a tting
value of 89.19% was obtained, as shown in Figure 3.10. The RMSE was 5.21 N. A
second-order ARMAX and OE models were minimally less accurate than the transfer
function model. The RMSE and the tting values of both models were 6.24 N, 6.32 N,
62

Figure 3.9: The experimental results of the x-axis in a comparison to the acquireddata from the ATI 6-axis F/T sensor. The plot shows a second-order Output-Error,a third-order Auto-regressive-moving-average (ARMAX) and a second-order transferfunction model corresponding to the real data.
87.01% and 86.86% for the ARMAX and OE respectively.
Although the z-axis presented the best results in terms of the tting value which
is 91.72% when an estimation model of fth-order transfer function with ve poles
and four zero was used. The RMSE was found to be much higher: 20.27 N or
(2.63%) with a maximum error of 10.14% . This is mainly because the dynamic test
range was much more higher, ranging from 0 N to about 800 N compared with the
other two axes. A second-order OE disclosed the same result as the last transfer
function, whereas the RMSE and maximum error of a second-order ARMAX model
were 23.91 N and 10.58% with a tting value of 88.97%. The dynamic response of the
z-axis is illustrated in Figure 3.11.
63

Figure 3.10: A comparison between the real data and the y-axis model. The graphdemonstrates a second-order transfer function model compared to the real data.
Figure 3.11: The similarity between the z-axis results using a second-order transferfunction estimation model and the real data.
64

3.4.3 Nonlinear Hammerstein-Wiener Model
Linear models exhibt a limited performance, mostly because of the nonlinear behavior
of the real systems. Consequently, nonlinear system identication by means of
nonlinear Hammerstein-Wiener (NLHW) estimation model was used. The NLHW
is dened as a series connections of linear dynamic functions with a static nonlinear
[160]. The interest in this model is expanding due to its low-cost computation
process, simple to comprehend and straightforward to use in control systems [161].
The Hammerstein-Wiener model can characterize the linearity by pulse transfer,
impulse response and state space estimation models. Meanwhile, the nonlinearity
can be represented by piecewise linear, wavelets network, polynomial expressions,
sigmoid network, look-up tables and fuzzy models [162164]. Figure 3.12 demonstrates
the schematic block-diagram of the Hammerstein-Wiener model. The results were
enhanced signicantly. The model showed improvements of up to 10% compared to
the previous linear estimation models.
Figure 3.12: The schematic block-diagram of the nonlinear Hammerstein-Wienerestimation model
The static nonlinearity of the rst block is characterized by:
65
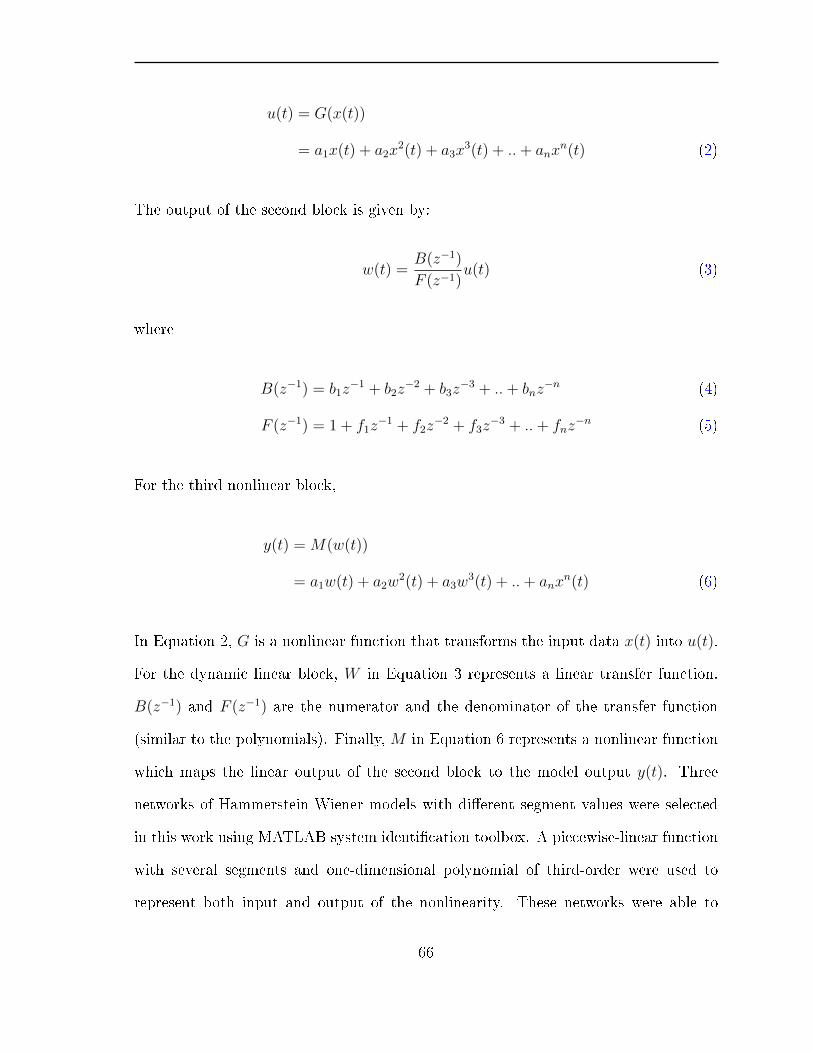
u(t) = G(x(t))
= a1x(t) + a2x2(t) + a3x
3(t) + ..+ anxn(t) (2)
The output of the second block is given by:
w(t) =B(z−1)
F (z−1)u(t) (3)
where
B(z−1) = b1z−1 + b2z
−2 + b3z−3 + ..+ bnz
−n (4)
F (z−1) = 1 + f1z−1 + f2z
−2 + f3z−3 + ..+ fnz
−n (5)
For the third nonlinear block,
y(t) = M(w(t))
= a1w(t) + a2w2(t) + a3w
3(t) + ..+ anxn(t) (6)
In Equation 2, G is a nonlinear function that transforms the input data x(t) into u(t).
For the dynamic linear block, W in Equation 3 represents a linear transfer function.
B(z−1) and F (z−1) are the numerator and the denominator of the transfer function
(similar to the polynomials). Finally, M in Equation 6 represents a nonlinear function
which maps the linear output of the second block to the model output y(t). Three
networks of Hammerstein-Wiener models with dierent segment values were selected
in this work using MATLAB system identication toolbox. A piecewise-linear function
with several segments and one-dimensional polynomial of third-order were used to
represent both input and output of the nonlinearity. These networks were able to
66
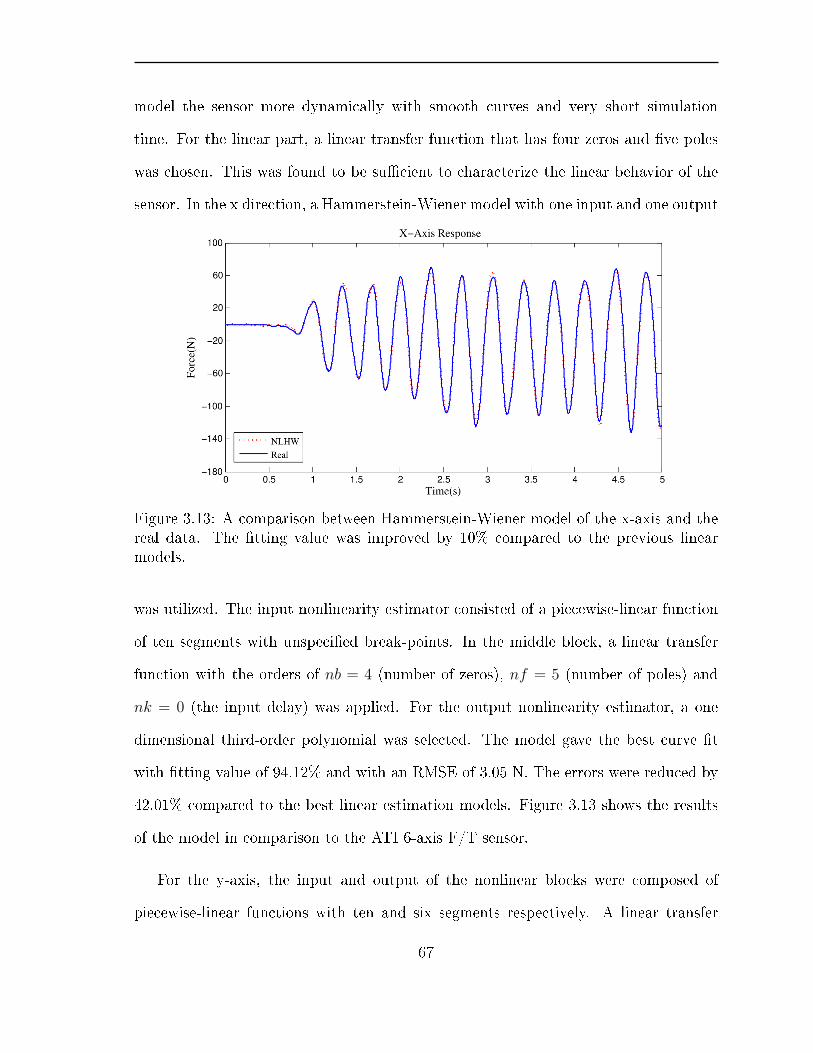
model the sensor more dynamically with smooth curves and very short simulation
time. For the linear part, a linear transfer function that has four zeros and ve poles
was chosen. This was found to be sucient to characterize the linear behavior of the
sensor. In the x direction, a Hammerstein-Wiener model with one input and one output
Figure 3.13: A comparison between Hammerstein-Wiener model of the x-axis and thereal data. The tting value was improved by 10% compared to the previous linearmodels.
was utilized. The input nonlinearity estimator consisted of a piecewise-linear function
of ten segments with unspecied break-points. In the middle block, a linear transfer
function with the orders of nb = 4 (number of zeros), nf = 5 (number of poles) and
nk = 0 (the input delay) was applied. For the output nonlinearity estimator, a one
dimensional third-order polynomial was selected. The model gave the best curve t
with tting value of 94.12% and with an RMSE of 3.05 N. The errors were reduced by
42.01% compared to the best linear estimation models. Figure 3.13 shows the results
of the model in comparison to the ATI 6-axis F/T sensor.
For the y-axis, the input and output of the nonlinear blocks were composed of
piecewise-linear functions with ten and six segments respectively. A linear transfer
67

function with the orders of nb = 4, nf = 5 and nk = 0 was used for the linear part of
the model. These parameters were found to be eective in minimizing the errors. The
results showed a tting value of 92.25%. The root mean square error was minimized
from 5.75 N to 3.72 N. Figure 3.14 illustrates the dynamic response of the y-axis.
Figure 3.14: The optimized results of the y-axis using Hammerstein-Wiener modelcompared to the real data.
In the z-axis, the NLHW included a piecewise-linear function for the input
nonlinearity and a linear transfer function with the orders of nb = 5, nf = 6 and
nk = 0. The output nonlinearity consisted of a piecewise-linear function with six
segments. The results were relatively more accurate than the y-axis with a tting
value of 93.20%. The RMSE was reduced from 23.90 N to 14.78 N and the maximum
error was decreased from 10.14% to 7.78%. The dynamic response of the sensor along
the z-axis is depicted in Figure 3.15.
The experimental results of the compliant 3-axis force sensor are summarized in
table II. It includes a comparison between the real data of the ATI 6-Axis F/T sensor
and the measured data with respect to: the type of estimation model, best tting
68

value, RMSE and the percentage of the RMSE. The results of the z-axis showed the
highest level of accuracy with a small percentage of RMS error (1.92%) compared
to those of the x (2.30%) and the y-axis (4.15%). This essentially stems from the
linear relationship achieved during the static loading test, validating the nonlinearity
cancellation phenomenon described previously. In the x and y axes, the lack of the
linear correlation led to less accurate results.
Figure 3.15: A comparison between the Hammerstein-Wiener model used to model thez-axis and the real data of the ATI 6-axis F/T sensor
The comparison also incorporates the performance of the quadratic models that
were achieved form the static test data in Figure 3.7 (d). In this case, the models
were used to characterize the dynamic test data along each axis. However, the RMS
errors were relativity high at 51.77 N (6.72%) in the z-axis, 13.06 N (9.84% ) and
15.18 N (16.93%) in the x- and y-axis respectively compare to the dynamic estimation
models. This is mainly because of the dynamic behaviours caused by the mass and
viscoelastic properties of the exible material used; therefore, it was required for this
69
Table 3.2: The experimental results of the proposed 3-axis ber-optic force sensor asa comparison to the real data of the ATI 6-axis F/T sensor.
class of sensors to compensate for nonlinear behaviours natural to large strains and
deections.
3.5 Conclusion
In this chapter, a high-accuracy, low-cost, compliant 3-axis ber-optic force sensor
based on light intensity modulation was designed, manufactured and calibrated
70

successfully. The sensor was capable of measuring the magnitude and the direction
of the applied normal and shear forces simultaneously with a potential to adjust the
sensing range. Due to its exibility and wide force measurement range, the sensor can
be used in dierent biomedical applications such as measuring the total ground reaction
force, collision detection and applications where compliance of the sensing element is
needed and rigidity is not suitable, such as human-robot interaction. Both static and
dynamic tests were performed to study the sensor's characteristic response in dierent
loading conditions.
In the dynamic tests, linear and nonlinear system identication models have been
applied and both showed satisfactory results. Since the sensor exhibited nonlinearity
which is mostly attributed to the elastic material behavior, the Hammerstein-Wiener
estimation model was necessary to characterize both the linearity and nonlinearity of
the sensor at the same time. The model gave the best results with tting values of:
Fx = 94.12%, Fy = 92.25% and Fz = 93.20% compared to the linear estimation
models such as the fth-order transfer function that gave lower accurate results: Fx =
87.40%, Fy = 89.19% and Fz = 91.72% of tting values. The sensor was able to
address the undesired cross-talk eects that current available sensors suer from. The
maximum cross-talk errors were ranging from 0.37% to 4.01%, making it feasible to
simultaneously measure the force along the three axes without the need to use cross-talk
compensation.
71

Chapter 4
A 6-DoF, Wearable, Compliant Shoe
Sensor for Total Ground Reaction
Measurements
Abstract
In this chapter, we present a compliant six-axis sensor for total ground reaction
measurement, the calibration methodology, and preliminary data. The sensor is
intended for gait analysis and is designed to have minimal eect on natural gait. A
triaxial optical force sensor is combined with an array of pressure sensing lms to form
a wearable compliant six-axis force/moment sensor. Two sensor units were developed
for the toe and heel and used in two types of experiments: stepping on the sensors that
are mounted on the ground, and attaching the sensors under the shoe while walking.
The data from the sensors are compared with measurements obtained from a standard
72

force plate. The deections induced by the sensor compliance exhibit a slight nonlinear
force-deection relation. Regardless of the nonlinear eects, the sensor is accurately
calibrated with a linear least squares method. To see how well these nonlinearities
could be calibrated for, a nonlinear calibration with a neural network was used. For the
sensors attached to the oor, a linear calibration achieved an RMSE of 4.49% while the
neural network achieves 2.68%. For the wearable sensor, the linear calibration RMSE
was 9.39% and the neural network RMSE was 5.21%. When the orientation data of the
sensors (measured by a motion capture system) was added as an input to the neural
network calibration, the RMSE error was reduced to 3.25%.
4.1 Introduction
Falls are a signicant issue for the elderly. About one in three people over the age of
65 will experience a fall every year, with the rate increasing with age, and quarter of
those who fall have a serious injury [165, 166]. In 2012, the United States had a direct
medical cost of $616.5 million for fatal and $30.3 billion for non-fatal fall injuries [167].
Impaired balance and mobility have been shown to be risk factors for falls [168] showing
the importance of monitoring and improving balance and mobility for fall prevention.
Gait analysis is a method to help better understand falls and help in the
development of a personalized assistive fall prevention devices. Performing gait analysis
requires a posture sensing system and a measurement of the complete ground reaction
forces and moments; these sensors should not disturb natural gait. A desired gait
measurement system must be able to be used inside and outside a laboratory setting
for use in a fall detection and prevention system. In this chapter, we develop a six-axis,
wearable shoe sensor to be used to measure forces and moments in gait. The sensor
73

is lightweight, compliant, inexpensive, and easily modiable to minimize its eect on
gait.
Force plates in laboratories are the traditional method for gait analysis and capable
of accurately measuring the ground reaction forces and moments, but are restricted to
laboratory use. A laboratory typically has one or two force plates xed to the oor
for a maximum of one or two recorded steps per trial. The foot must be placed fully
within the bounds of the force plate. Force plate targeting to consciously attempt to
step within the force plate may have an aect on some joint kinematics [169] and may
disturb gait. Force plates are unable to provide the forces and moments acting on each
foot while both feet are on the same force plate. These limitations indicate the need
for an ambulatory, wearable sensor.
In terms of ambulatory gait measurement systems, pressure insoles such as the
F-Scan are commonly used in various biomechanical studies to track centre of pressure,
gait events, and to assess walking [170172]. An insole containing only eight pressure
sensors was able to measure walking speed, manner of walking, and gait rhythm [173].
Pressure insoles are known to suer from error under certain conditions. The pedar-X
was found to have creep behaviour in which pressure reading increase several hours
of measurement. The insole also changes sensitivity depending on contact area and
temperature [174]. New high accuracy plantar pressure measurment technologies have
been developed that use bre Bragg grating and 3D printing [175]. These pressure
measurement systems resolve the limitations of force plates but cannot measure the
full ground reaction force, only the vertical force. They also do not directly measure
the true ground reaction force but the pressure inside the shoe, which is aected by
shoe tightness,and other factors.
74
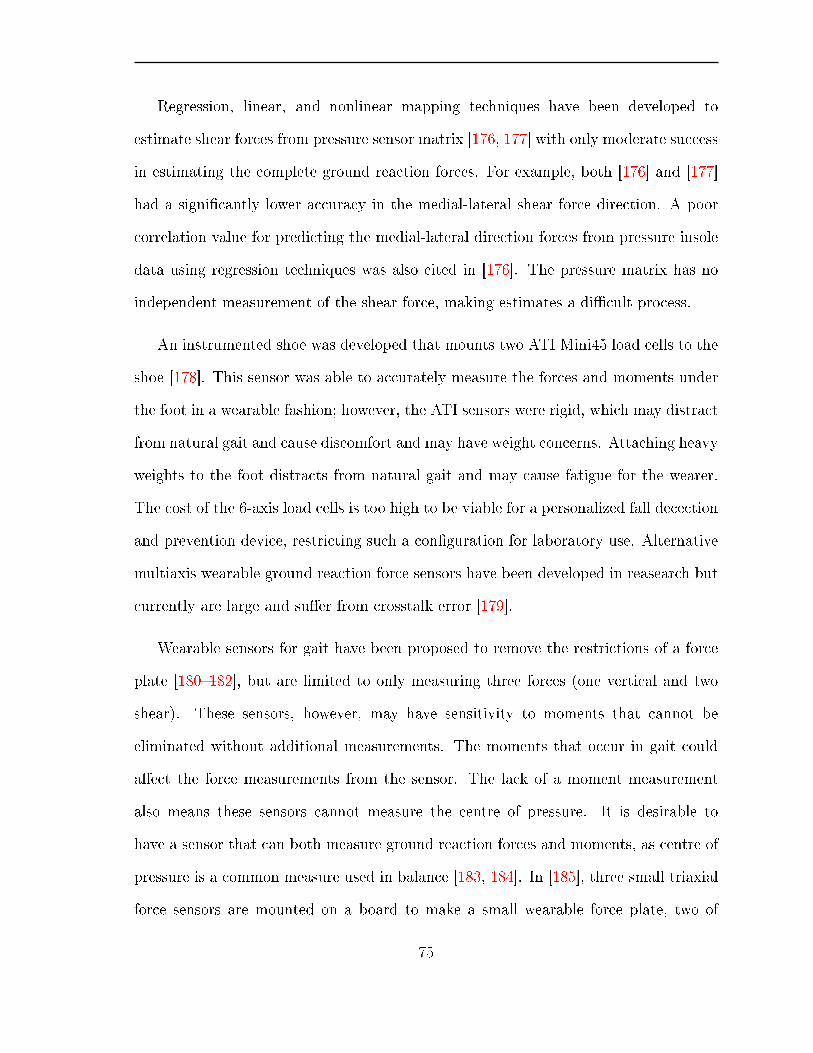
Regression, linear, and nonlinear mapping techniques have been developed to
estimate shear forces from pressure sensor matrix [176, 177] with only moderate success
in estimating the complete ground reaction forces. For example, both [176] and [177]
had a signicantly lower accuracy in the medial-lateral shear force direction. A poor
correlation value for predicting the medial-lateral direction forces from pressure insole
data using regression techniques was also cited in [176]. The pressure matrix has no
independent measurement of the shear force, making estimates a dicult process.
An instrumented shoe was developed that mounts two ATI Mini45 load cells to the
shoe [178]. This sensor was able to accurately measure the forces and moments under
the foot in a wearable fashion; however, the ATI sensors were rigid, which may distract
from natural gait and cause discomfort and may have weight concerns. Attaching heavy
weights to the foot distracts from natural gait and may cause fatigue for the wearer.
The cost of the 6-axis load cells is too high to be viable for a personalized fall decection
and prevention device, restricting such a conguration for laboratory use. Alternative
multiaxis wearable ground reaction force sensors have been developed in reasearch but
currently are large and suer from crosstalk error [179].
Wearable sensors for gait have been proposed to remove the restrictions of a force
plate [180182], but are limited to only measuring three forces (one vertical and two
shear). These sensors, however, may have sensitivity to moments that cannot be
eliminated without additional measurements. The moments that occur in gait could
aect the force measurements from the sensor. The lack of a moment measurement
also means these sensors cannot measure the centre of pressure. It is desirable to
have a sensor that can both measure ground reaction forces and moments, as centre of
pressure is a common measure used in balance [183, 184]. In [185], three small triaxial
force sensors are mounted on a board to make a small wearable force plate, two of
75

which are used to instrument the foot. The moment acting on the torque sensors aect
the force measurments on the plate, increasing measurement error.
In [180], we developed a compliant bre optic based sensor for triaxial force
measurement. We propose a modied system that transforms the sensor into an
enhanced wearable six-axis sensor system that is both lightweight and compliant.
It combines two dierent shoe sensor technologies: the triaxial force sensor and the
pressure sensor matrix. The new sensor uses an intensity-based bre optic sensor as
the triaxial force sensor and FlexiForce A301 force sensitive resistors to capture full
force and moment prole of gait with minimal gait disturbance. The original sensor
in [180] is aected by nonlinearities; the addition of the FlexiForce sensors helps to
improve the linearity of the new sensor package.
The compliance of the sensor [180] due to the blocks of rubber integrated in the
sensor structure is very desirable for gait measurement, but large deections also lead to
nonlinear behaviours requiring special calibrations such as the one in [186]. The sensor
detects force based o of deection from the rubber, which is a nonlinear relationship.
The force sensor thus is aected by nonlinearities. In this chapter we examine the eect
of the nonlinearities by using both a linear calibration and a nonlinear calibration.
4.2 Sensor Design
The sensor has two modules: module (1) is a bre optic, compliant, triaxial force
sensor; module (2) is a thin plate equipped with four round pressure sensing lms
(part (9) in Figure 4.1) to generate outputs that are sensitive to moments.The sensor
system expands on the bre optic force sensor in [180] by adding pressure sensors to
76

improve its moment sensitivity. Two of these modules are proposed to be mounted on
each shoe as an outsole.
4.3 Fiber-Optic Shear Force Sensor
The sensor system uses a previously developed triaxial bre optic force sensor [180].
This sensor detects force using light intensity modulation by reectance. The sensor
consists of two rigid layers of 3D printed PLA connected by a compliant material,
Mold Max 60 rubber. One layer has reective surfaces and the other layer houses the
LEDs, TSL250R light-to-voltages (LTVs), and bre optics. When a force is applied to
the sensor, the rubber deforms and the top layer moves with respect to the bottom
layer. This increases or decreases the intensity of the light detected by the LTVs. The
sensor seen in Figure 4.2 is lightweight, low-cost, and compliant. It has a sensing range
applicable to the magnitude of forces in human gait. Its exibility allows for more
natural gait than would be possible with a rigid sensor.
The triaxial force sensor design was modied to accommodate the FlexiForce
sensors. Force sensitive resistors were selected for their size and compatibility with
the triaxial sensor. The force sensitive resistors are able to detect moment when
arranged in an array and are unable to sense shear. When a moment is applied to
the sensor, the force distribution across the FlexiForce sensors changes, which allows
for the measurement of moment. The triaxial sensor has no moment sensing ability
but is able to sense normal and shear forces. The top layer of the triaxial sensor was
modied to include four pucks of nine millimetre diameter as attachment points for
the FlexiForce sensors. These pucks ensure that the only load path through the sensor
is through the FlexiForce sensors. The modied sensor can be seen in Figure 4.1. To
77

Figure 4.1: Structure of the proposed sensor. (1) Silicon rubber block. (2) Bottomplate (PLA). (3) Higher section to mount FlexiForce sensors. (4) Top plate. (5) LEDand LTV holder. (6) TSL250R (LTV ). (7) OVLEW1CB9 (LED). (8) Fibre guider.(9) FlexiForce sensors (A301). (10) Top layer (11) Screw to precompression of theFlexiForce. (12) Optical bres. (13). Light reector.
78
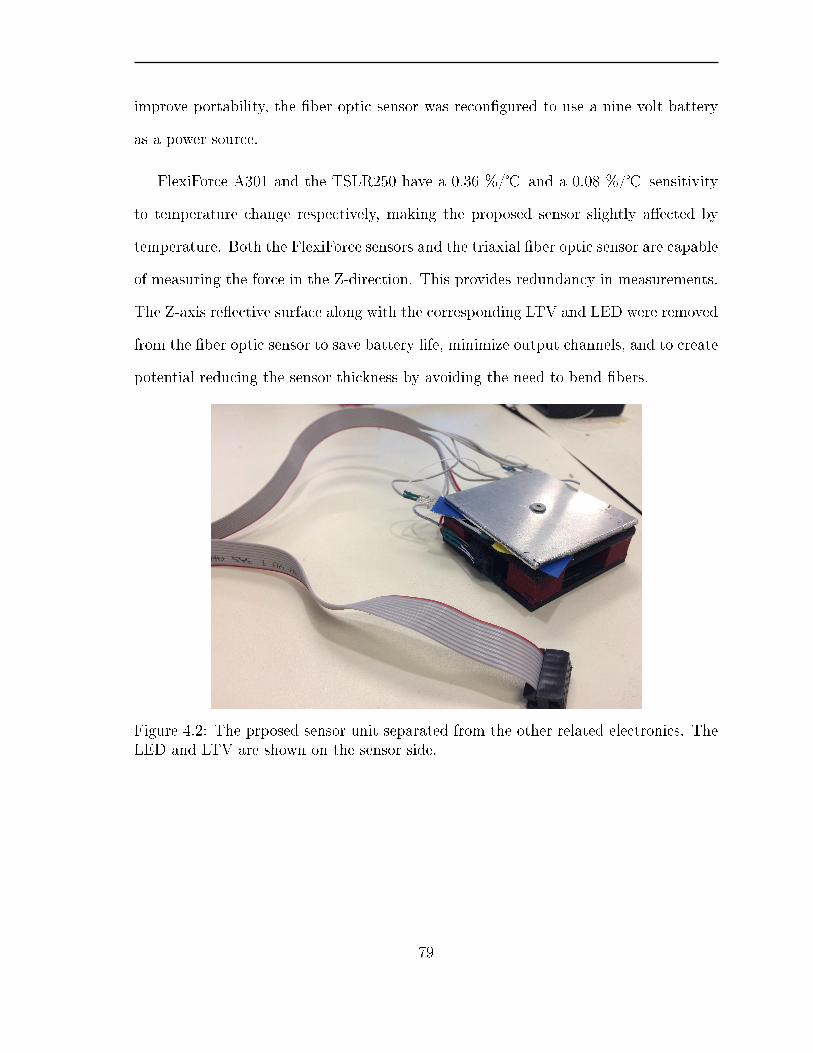
improve portability, the ber optic sensor was recongured to use a nine volt battery
as a power source.
FlexiForce A301 and the TSLR250 have a 0.36 %/ and a 0.08 %/ sensitivity
to temperature change respectively, making the proposed sensor slightly aected by
temperature. Both the FlexiForce sensors and the triaxial ber optic sensor are capable
of measuring the force in the Z-direction. This provides redundancy in measurements.
The Z-axis reective surface along with the corresponding LTV and LED were removed
from the ber optic sensor to save battery life, minimize output channels, and to create
potential reducing the sensor thickness by avoiding the need to bend bers.
Figure 4.2: The prposed sensor unit separated from the other related electronics. TheLED and LTV are shown on the sensor side.
79
4.4 FlexiForce Sensors
The ber optic sensor is able to accurately determine forces in the vertical and two
shear directions [180], but has sensitivity to moments. It is impossible to determine
the full force and moment prole with only the three outputs provided by the sensor.
Additional sensing elements, four FlexiForce A301, were added to create new outputs
sensitive to moment and to help determine the Z-direction force and the moments. The
FlexiForce sensors were placed in each of the corners on top of the raised sections (part
(3) in Figure 4.1) on the modied top layer of the ber optic sensor. The FlexiForce
sensors were taped down to the raised sections on one side and covered with a protective
layer of tape on the other, seen in Figure 4.3. An additional aluminum plate was added
to the top of the sensor to create the load bearing surface. This brought the nal height
of the system to be 2.1 cm, with a 5.5 cm length and width.
The aluminum plate is screwed into the top layer of the ber optic sensor with a
countersunk screw that sits below the surface of the plate. The hole in the plate is
large enough to freely move along the screw, thus not including the screw as a load
path unless the sensor is in tension. This screw provides some precompression on
the FlexiForce sensors. The FlexiForce sensors are incapable of sensing tension, but
certain applications of moments on the sensor can cause tension scenarios for individual
FlexiForce sensors. Therefore, the system allows for the application of precompression
to detect tension scenarios at the cost of having less compression force range. The
screw connects the top aluminum plate and the top of the ber optic sensor parts ((10)
and (4) in Figure 4.1), taking all shear load from the FlexiForce layer.
A voltage is obtained from the FlexiForce resistors via Tekscan's recommended
80
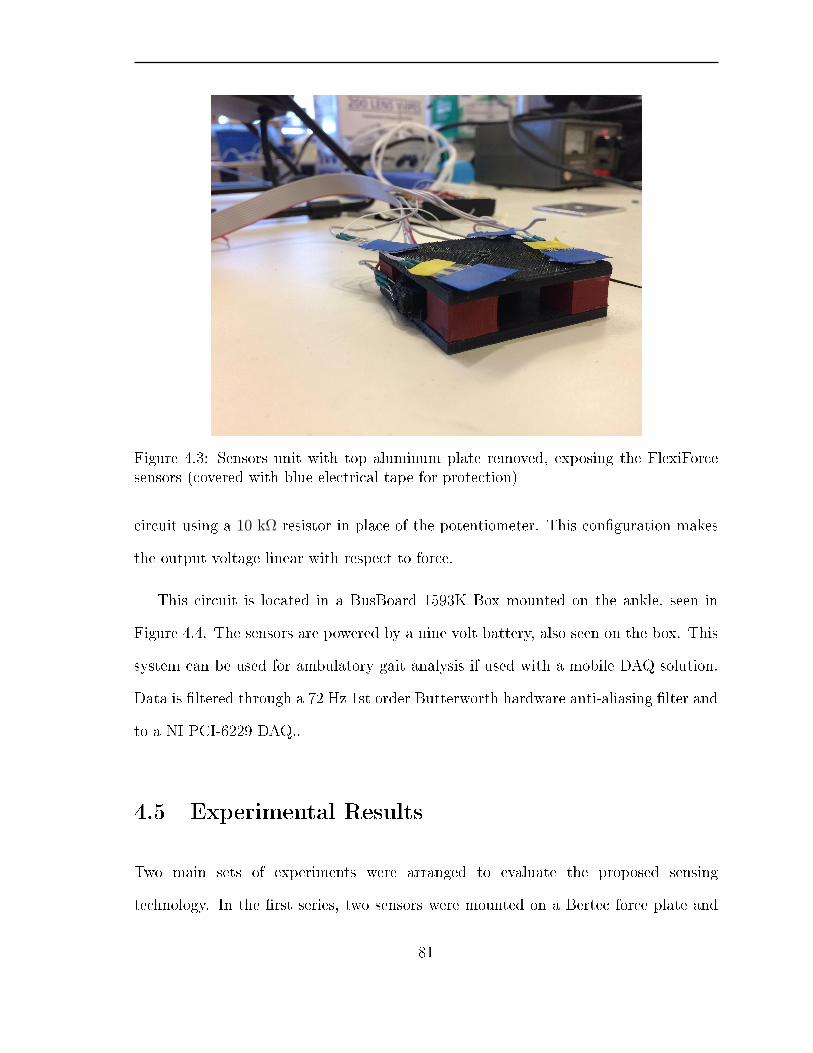
Figure 4.3: Sensors unit with top aluminum plate removed, exposing the FlexiForcesensors (covered with blue electrical tape for protection)
circuit using a 10 kΩ resistor in place of the potentiometer. This conguration makes
the output voltage linear with respect to force.
This circuit is located in a BusBoard 1593K Box mounted on the ankle, seen in
Figure 4.4. The sensors are powered by a nine volt battery, also seen on the box. This
system can be used for ambulatory gait analysis if used with a mobile DAQ solution.
Data is ltered through a 72 Hz 1st order Butterworth hardware anti-aliasing lter and
to a NI PCI-6229 DAQ..
4.5 Experimental Results
Two main sets of experiments were arranged to evaluate the proposed sensing
technology. In the rst series, two sensors were mounted on a Bertec force plate and
81

were walked across. In the second set, two sensors were mounted to the bottom of
a shoe, and a step was taken across the force plate. Optotrak markers were used to
determine the position and orientation of the sensors relative to the ground. For this
wearable enhanced prototype, only gait data is used since the intended application is
for gait analysis and total ground reaction force measurements
4.5.1 Floor-mounted experiments
To verify the new sensor's ability to measure six-axis forces and moments in gait,
the two sensor systems were tested while attached to the ground. The sensors were
mounted with tape to a Bertec (Ohio, United States) FP-4060-07-1000 force plate,
a six-axis force and moment transducer with 0.5 N accuracy for Z-direction force.
The sensors were 10.5 cm apart in the Y-direction of the plate and aligned in the
Z-direction. Gait data was recorded as a person walked across the force plate, stepping
on the sensors. Data was recorded with Bertec AM6800 Amplier digital output with
Bertec Digital Acquire and an NI PCI 6229 DAQ at 1 kHz. The six-axis data from the
force plate was used as a reference to calibrate the sensor. Two methods were used to
process the data, linear and nonlinear.
4.5.1.1 Least squares regression
Linear regression was used as a rst approach to calibrate the sensor [187, 188] as
preliminary tests indicated it had a highly linear response. A total of ten steps around
40,000 data points were collected. As the user only plays the role of applying force and
does not aect the physics of the sensor, a small sample of steps were used. The sensor
behaviour was found to be independent of the user and user's gait speed. Gait data
82

Figure 4.4: Two Sensor units are axed on the force plate
is shown instead of a machine-applied load in order to show this sensor's ability in its
intended application. The calibration results can be seen in Figure 4.5 and Figure 4.6.
High accuracy for each axis was achieved, with a RMS error percent of 4.49%. The
RMS error, RMS percent, and a correlation coecient were calculated. The error is
shown in Figure 4.8. Detailed results for each axis can be found in Table 4.1. The
relatively low RMS error of the least squares regression implies that the sensor has
highly linear characteristics. The FlexiForce sensors were set up to provide a linear
voltage with force with a hysteresis of less than 4.5%. The ber optic sensor was noted
to have nonlinearities due to the exible material but still has mostly linear behaviour
seen in Figure 4.7 where hysteresis eects are visible but not major. Addition of the
FlexiForce sensors helps to remove the eects of moment on the ber optic sensor's
shear force measurement.
The least squares regression was able to get a highly accurate estimate of the
83

forces and moment in gait, especially with respect to the Z-direction force and X-
and Y-direction moments. These forces and moments rely mostly on the FlexiForce
measurements, which have a linear response and thus have high accuracy when
processed with a linear calibration. A less accurate result is seen in the X- and Y-
forces and the Z-moment direction. These errors can be attributed to a low magnitude
of forces and moments, resulting in a poor signal to noise ratio. Changing the gain of
these axes to accommodate for the lower force range would result in a more accurate
measurement. The X- and Y- forces are mainly determined from the ber optic
sensor, and are expected to suer more from nonlinearities than the FlexiForce based
moments. These measurements were improved with a nonlinear calibration. The array
of FlexiForce sensors lie in a plane, and thus have no sensitivity to the Z-moment.
The Z-moment information comes from the shear sensor's sensitivity to moment. The
Z-moment measurement thus is less linear than other moments and the measurement
was improved by applying a nonlinear calibration.
4.5.1.2 Neural network regression
Despite the linear results, the shear sensor is aected by a nonlinear force-displacement
relationship for the rubber, a nonlinear light intensity-displacement relationship, and
rotation of the reective surfaces under moment load. A nonlinear approach, a neural
network, was used for sensor calibration in attempt to achieve a higher accuracy. A
neural network is an architecture that uses optimized interconnected neurons to predict
an output. In this case, the network acts as a nonlinear regression technique. The
neural network is not used as a complete optimized nonlinear solution but as proof
that the results can be improved with a nonlinear t. The results can be found in
Figure 4.5, Figure 4.6 and Figure 4.9.
84

A neural network with one hidden layer with ten neurons was trained using the same
data set with a 70% training, 15% validation, and 15% testing set split. The overall
network consisted of an input layer of twelve neurons (eight FlexiForce, four LTVs),
a hidden layer of ten neurons with a tansig activation function, and an output layer
of six neurons with a linear activation function. Levenberg-Marqardt backpropagation
was used to train the network. with an initaial my of 0.001 and a minimum gradient
of 10−7. Detailed results quantifying the t of each axis can be found in Table 4.1.
The neural network was able to achieve a higher prediction accuracy than the least
squares method, with an average RMS error percent of 2.68%. This is expected as the
neural network is able to t the nonlinear characteristics of the sensor. The neural
network improves the correlation coecient for the shear forces and Z-moment, which
are measurements that would be aected by the nonlinearity of the rubber. Thus,
the neural network is able to calibrate for nonlinear measurements. Both nonlinear
and linear techniques were used to calibrate the sensor with high accuracy in this
conguration. A comparison of the force accuracy between the six-axis sensor and the
triaxial sensor in [180] is shown in Table 4.2.
4.5.2 Shoe-mounted experiments
The sensor provided very good results for the oor mounted conguration. However,
as a oor mounted sensor, it suers from the same issues as a force plate. The main
benet of this sensor is that it is wearable and usable outside of a laboratory setting.
The next experiment, seen in Figure 4.10 on page 90, tested the sensor's performance
in its intended wearable conguration.
The sensor was attached to the shoe for this test. Two sensor units were used
85

Table 4.1: Experimental results of 6-axis sensor mounted on oor during gait
X-Axis Force
Model Type R-squared % RMSE RMSE %
Linear 96% 2.87 N 6.80 %
Neural Network 0.99 1.20 N 2.86 %
Y-Axis Force
Model Type R-squared % RMSE RMSE %
Linear 94% 3.62 N 5.41 %
Neural Network 98% 1.685 N 2.50 %
Z-Axis Force
Model Type R-squared % RMSE RMSE %
Linear 99% 15.04 N 2.77 %
Neural Network 0.99 4.60 N 0.84 %
X-Axis Moment
Model Type R-squared % RMSE RMSE %
Linear 99% 1.11 N·m 1.96 %
Neural Network 99% 1.02 N·m 1.95 %
Y-Axis Moment
Model Type R-squared % RMSE RMSE %
Linear 99% 0.56 N·m 2.75 %
Neural Network 99 % 0.42 N·m 2.08 %
Z-Axis Moment
Model Type R-squared% RMSE RMSE %
Linear 99% 0.29 N·m 7.23 %
Neural Network 94% 0.24 N·m 5.85 %
86

(a)
(b)
(c)
Figure 4.5: Ground reaction forces of the oor-mounted sensor using the least squaresmethod and a neural network as calibration methods. (a) x-axis force (medio-lateral),(b) y-axis force (anterior-posterior), (c) z-axis force (Normal)
87

(a)
(b)
(c)
Figure 4.6: Ground reaction moments obtained from the oor-mounted setting usingthe least squares approach and a neural network as calibration. (a) x-axis moment, (b)y-axis moment, (c) z-axis moment
88
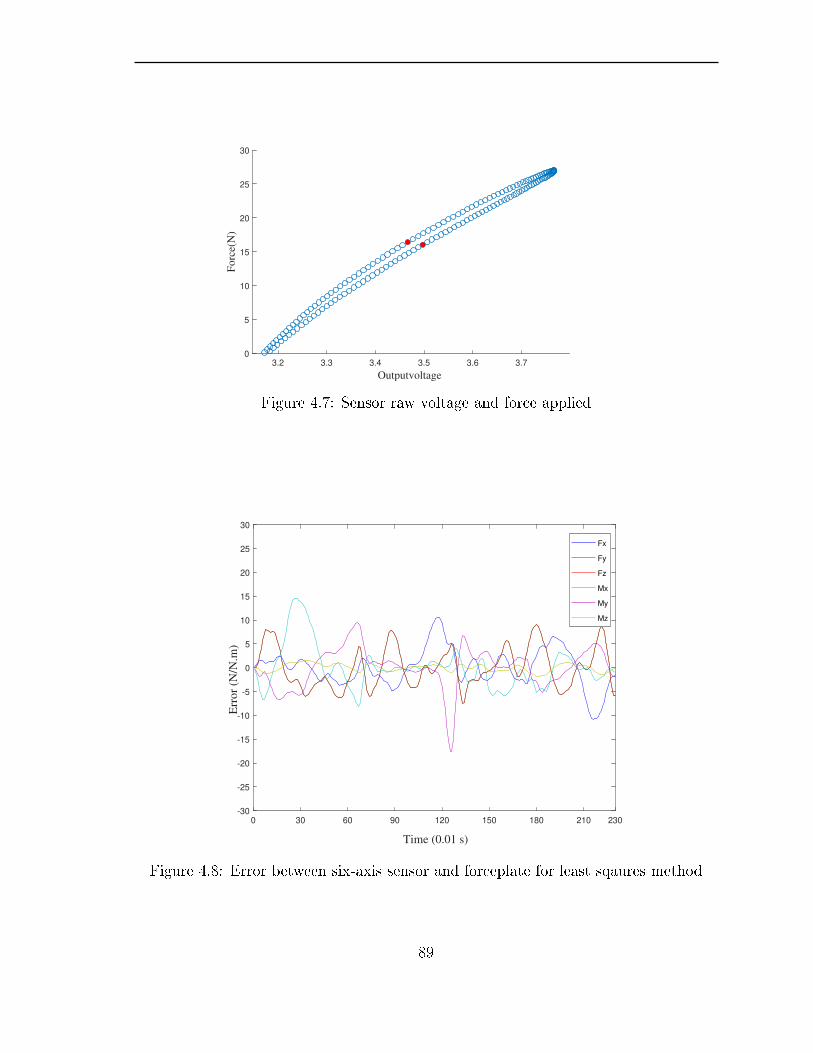
3.2 3.3 3.4 3.5 3.6 3.7
Outputvoltage
0
5
10
15
20
25
30
Forc
e(N
)
Figure 4.7: Sensor raw voltage and force applied
0 30 60 90 120 150 180 210 230
Time (0.01 s)
-30
-25
-20
-15
-10
-5
0
5
10
15
20
25
30
Err
or
(N/N
.m)
Fx
Fy
Fz
Mx
My
Mz
Figure 4.8: Error between six-axis sensor and forceplate for least sqaures method
89

0 30 60 90 120 150 180 210 230
Time (0.01 s)
-30
-25
-20
-15
-10
-5
0
5
10
15
20
25
30
Err
or
(N/N
.m)
Fx
Fy
Fz
Mx
My
Mz
Figure 4.9: Error between six-axis sensor and forceplate for neural network
Figure 4.10: Experiment set up for shoe-mounted sensors with two 6-axis sensorsystems and 3 Optotrak rigid bodies (one not shown)
90

Table 4.2: Comparison of triaxial sensor and six-axis sensor
Sensor X RMSE % Y RMSE % Z RMSE %
Three axis 2.30 % 4.15 % 1.92 %
Six axis 2.86 % 2.50 % 0.84 %
to instrument one shoe, and were xed to the sole of the shoe using tape. One was
mounted to the front of the shoe at the toe and one at the heel, allowing for bending at
the toe joint during gait. To account for the height dierence between shoes caused by
the sensors, two wooden blocks of similar sizes to the sensors were taped to the other
shoe. This brought each shoe up to a similar height.
When mounted to the shoe, the sensor system and shoe are rotated with respect
to the ground during part of the gait cycle. Sensor output is in a dierent coordinate
frame than the force plate data. To account for this, position sensing markers were
used to track location and orientation of the sensors. An Northern Digital Optotrak
Certus (Waterloo, Canada) was used as a motion capture system to track the position
and orientation of rigid bodies attached to shoe and ground.
A total of three Optotrak rigid bodies were used: one attached to the ground, one
attached to the shoe sole rear above the heel sensor, and one attached to the shoe
sole front above the toe sensor. The instrumented shoe was worn and the participant
walked across the platform, stepping on the force plate with the instrumented shoe.
The setup can be seen in Figure 4.10. Data for this test was collected at 100 Hz as it
was limited by the speed of the Optotrak Certus.
91

4.5.2.1 Least squares regression
A least squares calibration, using a total of more than four steps was performed. Only
data during a step was used as the force plate did not capture events when the shoe
was not on the force plate. A linear t achieved reasonably high accuracy for all axes,
with an RMS error percent of 9.39%. Detailed statistics for each axis can be found
in Table 4.3. These results are less accurate than the oor mounted case, but still
produce a satisfactory force and moment estimation.
4.5.2.2 Neural network regression
A nonlinear calibration was used to improve the previous t. A neural network is used
to show that a nonlinear t can improve the calibration accuracy. The results can be
seen in Figure 4.11 and Figure 4.12.
A neural network was trained using the same data set of 233 data points with a
70% training, 15% validation, and 15% testing set split. The network used the same
parameters as the oor mounted case and was able to achieve very high accuracy, with
detailed results found in Table 4.4. The RMS error was found to be 5.21%. A linear
t can get a good estimate of the ground reaction force and moment, while a nonlinear
t such as the neural net can better capture the relationship between the sensor and
forces and moments.
4.5.2.3 Angle eects
To account for the changing angle of the sensors, the rotations of the foot sensors
relative to the ground were included as an input in a second neural network. The
92
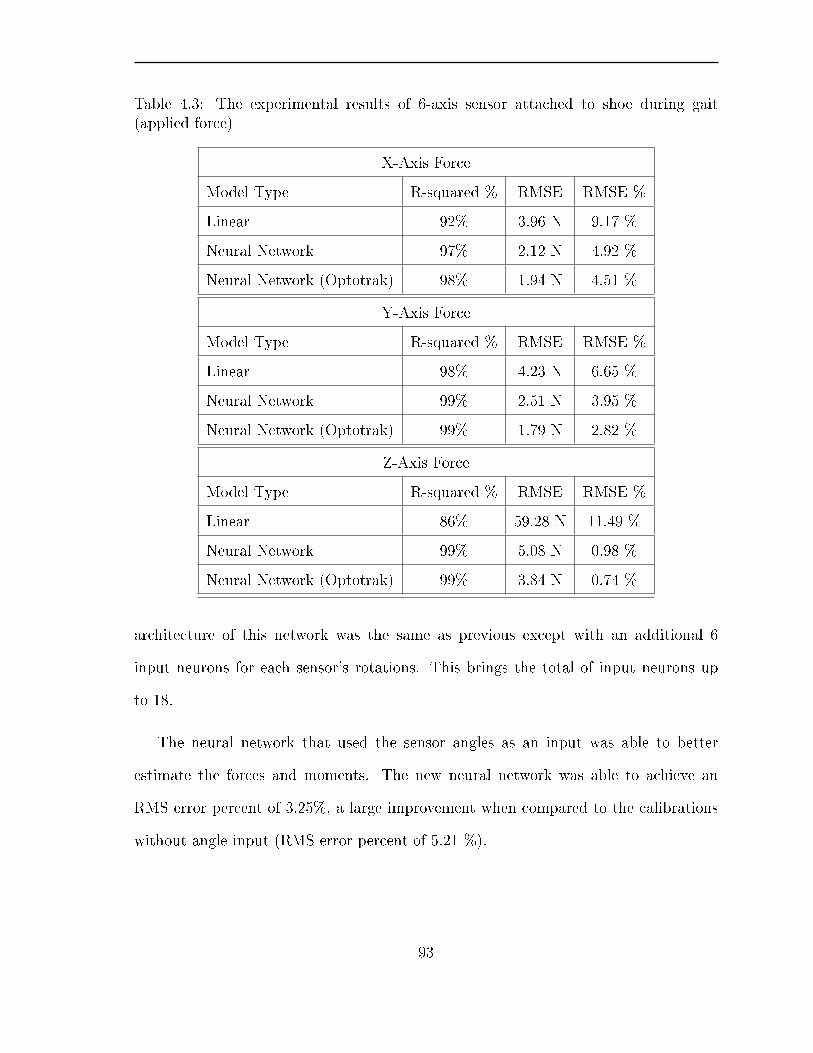
Table 4.3: The experimental results of 6-axis sensor attached to shoe during gait(applied force)
X-Axis Force
Model Type R-squared % RMSE RMSE %
Linear 92% 3.96 N 9.17 %
Neural Network 97% 2.12 N 4.92 %
Neural Network (Optotrak) 98% 1.94 N 4.51 %
Y-Axis Force
Model Type R-squared % RMSE RMSE %
Linear 98% 4.23 N 6.65 %
Neural Network 99% 2.51 N 3.95 %
Neural Network (Optotrak) 99% 1.79 N 2.82 %
Z-Axis Force
Model Type R-squared % RMSE RMSE %
Linear 86% 59.28 N 11.49 %
Neural Network 99% 5.08 N 0.98 %
Neural Network (Optotrak) 99% 3.84 N 0.74 %
architecture of this network was the same as previous except with an additional 6
input neurons for each sensor's rotations. This brings the total of input neurons up
to 18.
The neural network that used the sensor angles as an input was able to better
estimate the forces and moments. The new neural network was able to achieve an
RMS error percent of 3.25%, a large improvement when compared to the calibrations
without angle input (RMS error percent of 5.21 %).
93

(a)
(b)
(c)
Figure 4.11: Ground reaction forces obtained from the shoe-mounted sensor usingthe least squares approach and a neural network as calibration. (a) x-axis force(medio-lateral), (b) y-axis force (anterior-posterior), (c) z-axis force (vertical)
94
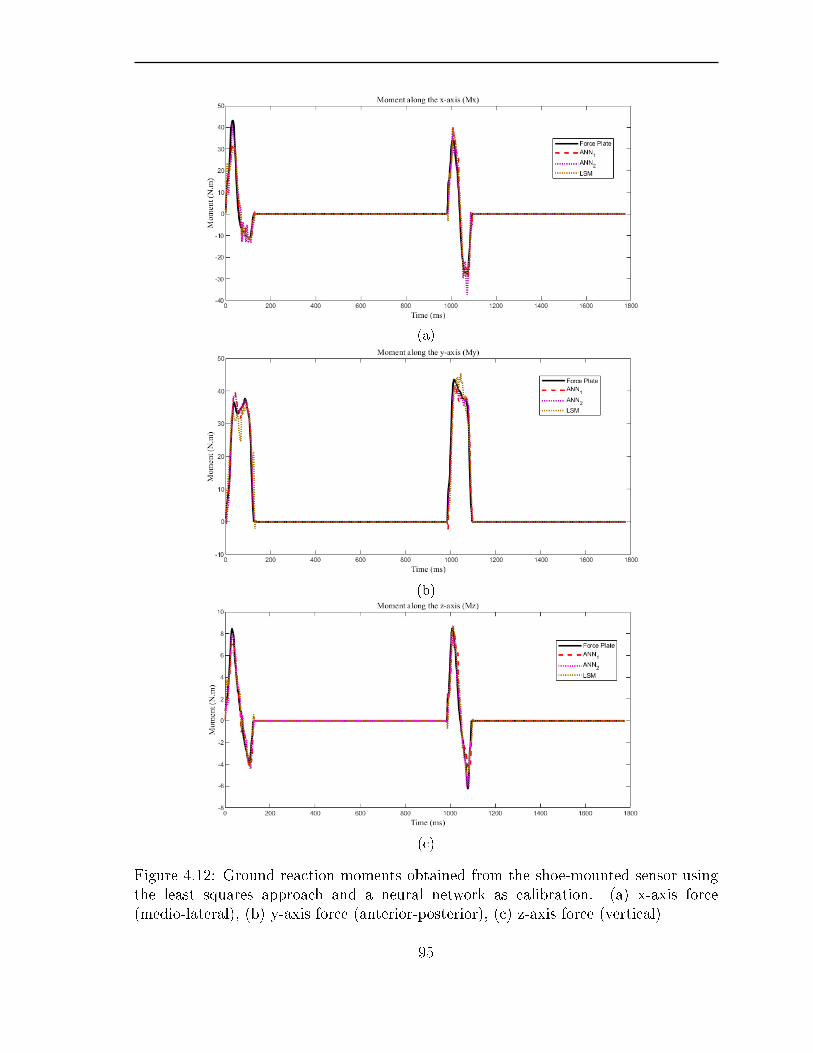
(a)
(b)
(c)
Figure 4.12: Ground reaction moments obtained from the shoe-mounted sensor usingthe least squares approach and a neural network as calibration. (a) x-axis force(medio-lateral), (b) y-axis force (anterior-posterior), (c) z-axis force (vertical)
95

Table 4.4: The experimental results of 6-axis sensor attached to shoe during gait(applied moment)
X-Axis Moment
Model Type R-squared % RMSE RMSE %
Linear 95% 4.40 N·m 10.16 %
Neural Network 98% 2.73 N·m 6.29 %
Neural Network (Optotrak) 99% 1.85 N·m 4.28 %
Y-Axis Moment
Model Type R-squared % RMSE RMSE %
Linear 88% 4.20 N·m 9.63 %
Neural Network 98% 1.53 N·m 3.52 %
Neural Network (Optotrak) 99% 1.23 N·m 2.82 %
Z-Axis Moment
Model Type R-squared % RMSE RMSE %
Linear 96% 0.77 N·m 9.21 %
Neural Network 94% 0.96 N·m 11.60 %
Neural Network (Optotrak) 99% 0.36 N·m 4.35 %
4.6 Conclusion
The new sensor system combines ber optic based and FlexiForce sensors to create a
wearable, six-axis sensor for gait. It is lightweight and compliant which helps maintain
natural gait. The sensor was validated to have accurate performance in a oor-mounted
conguration. Accurate results are obtainable using a linear calibration, achieving a
mean RMS error percent of 4.49%. A nonlinear t is able to capture nonlinearities in
the rubber and LTVs; a neural network was used as an example of a nonlinear t. It
is able to achieve a higher accuracy than the linear t, reaching a mean RMS error of
96

2.68%.
As a wearable sensor, the linear calibration is able to achieve a good force and
moment estimation. The mean RMS error for the linear calibration was found to be
9.39%. A neural network is able to achieve higher accuracy than a linear calibration,
with a mean RMS error of 5.21%. Sensor orientation was included as an input on a
second neural network to attempt to improve this result. This neural network achieved
a mean RMS error percent of 3.25%. Including the orientation of the sensors helps to
improve accuracy.
The nal sensor system is lightweight and wearable, allowing for measurements
to be taken outside of a laboratory setting. It is capable of measuring the complete
ground reaction force and moments for gait analysis applications and centre of pressure
measurement for fall prevention applications.
97
Chapter 5
Design, Development and Calibration
of a Lightweight, Compliant 6-Axis
Optical Force/Torque Sensor
Abstract
This chapter introduces the fabrication of a six degree-of-freedom force and torque
sensor based on ber-optic sensing technology and its novel calibration methodology.
The sensor is cost-eective, lightweight and exible with a large force and torque
measurement range suitable for biomechanics and rehabilitation systems particularly
when a wearable sensing system is desired. Six ber-optic sensing elements are used to
detect three main forces Fx, Fy, Fz and three main torques Tx, Ty, Tz. Sensor data was
collected by applying dynamic forces and torques with various magnitudes, directions
and frequencies and compared with measurements obtained from a standard force
98
and torque reference. The proposed calibration procedure is intended to reduce errors
stemmed from a nonlinear force-deformation relationship and to increase the estimation
speed by splitting the calibration into two estimation models: a linear model, based on
a standard Least Squares Method (LSM ) to estimate the linear portion; and a nonlinear
Decision Trees model (DT ) to estimate the residuals. Both models work simultaneously
as a single calibration system named Least Squares Decision Trees LSDT. Using LSDT,
the estimation speed increased by 55.17% and the Root Mean Square Errors (RMSE )
reduced to 0.53%. In comparison, each model separately had a root mean square errors
of 1.26% and 4.70% for DT and LSM, respectively.
5.1 Introduction
Electronic equipment responsive to external perturbations and mechanical
deformations have attracted signicant attention in several applications such
as biomechanics, Human Machine Interaction (HMI) and rehabilitation systems.
Providing a precise measurement of force and torque is essential to eectively address
the interaction between human body and external environment and to monitor the
body motion and balance through wearable sensing devices. Six-axis force and torque
sensors are the optimum solution for such applications due to their strong ability to
measure the complete degree of freedom of any force or torque applied at a certain
point.
Although these six-axis force and torque sensors are important and have great
measurement capabilities, they are complex in their manufacturing and assembly
process. The bonding procedure of sensing elements, for example, requires high
precision, making it time consuming and therefore costly in terms of time and nance
99
since the sensing systems depend on strain gauges as their sensing technology [189192].
To obtain a satisfactory sensitivity for 6-axis, force and torque strain gauge sensors,
researchers incorporate large numbers of sensing elements (strain gauges) distributed
along the body undergoing deformation [193196]. This can cause communication
bandwidth problems since a large data transmition between strain gauges and the
main microcontroller is required which can lead to unwanted lengthy delay in data
transfer and a higher power consumption [197]. Even though 24 strain gauges were
bonded along the elastic body in [198200], the measurement range was not satisfactory
for these sensors made of rigid metals. Fz for instant, was 500 N in [199].
As many as 32 strain gauges were cemented on the body structure of sensors in
[159, 196, 201], resulting in larger amounts of data being transmitted. In an attempt
to reduce the online communication bandwidth and number of wires out of the sensor,
researchers used electronic components such as an internal microcontroller to group
the sensing elements and pre-process data locally inside the sensor unit. In doing so,
only the relevant six axes force and torque raw data through only six wires to a data
acquisition system is transferred for the nal processing [199]. However, this approach
does not provide any solutions to decrease the amount of transferred data as it only
facilitates data transmission to the main microcontroller. The rigidity, bulkiness and
weight concerns involved in the development of strain gauge-based force and torque
sensors make them less suitable for biomechanics and rehabilitation applications where
compliance is key. Two strain gauge-based force and torque sensors (Mini45 load cells,
from ATI Industrial Automation, Inc.) were mounted underneath a shoe to measure the
total ground reaction force and estimate the center of pressure [202, 203]. Although the
sensors were able to accurately measure force and moments, they were rigid since these
sensors were made of metals that can cause discomfort for the wearer. Furthermore,
100
extra rigid metal plates were used, one mounted on the top of both sensors along the
outsole and two underneath each load cell [203] adding extra weights to the sensor
which can easily inuence natural human movements and cause fatigue.
Capacitive-based transducers are also broadly used in force and torque measurement
systems [204208]. Although these capacitive-based transducers are adequate in
precision and have wide force and torque measurement range, they are also highly
susceptible to electromagnetic interference and may experience drift and small spatial
resolution.
A piezoresistive-based six-axis force and torque sensor prototype was developed
in [158, 209, 210]. These sensors exhibited a relatively good sensitivity but have
noticeable linearity errors and low accuracy and small force measurement range. Other
drawbacks include considerably high stiness, low breaking force and temperature
compensator for each individual sensing element [64]. Piezoelectric-based sensors
are also widely used in force and torque measurement systems [211, 212]. Electric
polymer foils are the most extensively used material in biomedical applications such
as polyvinylidene uoride (PVDF) and cellulose nanobril exible piezoelectric-based
polymer foil multi-axis force sensors [213, 214]. Since the proposed material is highly
sensitive to pyroelectricity (the material generates a voltage when there is a change in
temperature) [70], a temperature compensator is necessary. In addition, the sensors
were capable of measuring forces but not torques, and the materials were structurally
fragile and prone to damage [71].
Fiber-optic sensing technology is another attractive technique used to measure force
and torques; particularly FBG-based sensors [215] with their lightweight, small size,
good accuracy, high longitudinal strain resolution with no sensitivity to electromagnetic
101
interference, and negligible hysteresis eects [216]. However, their high sensitivity
to small temperature variation and their high cost of signal processing reduce the
versatility of their use in biomechanical measurements.
Calibration is critical for multi-dimensional force and torque transducers. It requires
complex data processing and multi-step sensor characterization due to cross coupling
eect and complicated nonlinearities. Conventional calibration methods such as least
squares (calibration matrix) has been extensively used for calibration of multi-axis F/T
sensors [217, 218]. Although calibration matrix is relatively eective in minimizing
crosstalk eects, the relationship between input and output is assumed to be linear.
Compliant sensors exhibits nonlinear behavior due to large deformation generated
by the applied F/T which results in nonlinear output, therefore a certain portion of
sensor data cannot be fully characterized with the calibration matrix. Calibration
method based on nite element analysis (FEA) simulation was used in [219, 220]. This
method is also based on several assumptions such as isotropic elasticity, negligible
deformation in cross beams, and strain gauges being bonded and aligned with high
precision which cannot be experimentally attained. A non-parametric approach such as
Articial Neural Networks (ANN) has the ability to predict any nonlinear relationship
and has been applied to calibrate multi-axis F/T transducers [221223]. However, ANN
has a few shortcomings: extensive network scale, considerable amount of training time
and large data sets are needed for training.
The presented 6-axis ber-optic force/torque sensor with its novel calibration
methodology is exible, low noise, extremely lightweight, cost eective and has large
force and torque measurements range with high precision. Thus, it is usable in a variety
of biomechanics and rehabilitation applications. The novel calibration procedure is able
102

to precisely characterize the slight nonlinear behavior generated from force-deection
relationship. This calibration approach mainly relies on a nonlinear estimation model
that is used to predict the errors and works simultaneously with a standard linear least
squares model, providing a very high-quality sensing performance.
5.2 Sensor Architecture
The current 6-axis F/T sensing system shown in Figure 5.1 was built upon a similar
ber-mirror transducer technology based on light intensity modulation we reported
in [1]. In this design, multiple optical sensing elements were congurated in a single
sensor unit enabling a simultaneous measurement of applied forces and torques along
the six normal axes creating a novel compliant 6-axis F/T sensor. The prototype was
able to precisely describe the applied forces and torques in real-time.
5.2.1 Sensor Design and Fabrication
The exploded view seen in Figure 5.1 illustrates the conceptual design of the proposed
6-axis force and torque sensor. Six optical sensing elements were developed where
each element is composed of 0.75 mm diameter polymethyl methacrylate (PMMA)
bers: one to transmit the light and the other to receive the reecting light into a light
detector. The light transmitting ber is joined at the tip to a high-intensity, white
light emitting diode (OVLEW1CB9, 100 mW from TT Electronics/Optek Technology,
Inc.) as the light source. In this design, two LEDs are used to feed the six transmitting
bers, resulting in lower power consumption. The receiving ber is joined at the tip to
a light-to-voltage converter (LTV), model TSL257 from AMS Austria Micro Systems
103

Figure 5.1: Structure of the proposed sensor. (1). Screw (2). Outer shield (3).Flat data cable (4). Printed circuit board for reliable connections (5). Top rigidlayer (6). Light reecting mirror (7). Compliant block (silicon rubber) (8). Opticalber (9). LEDs and LTVs holder (10). LTV (Model: TSL-275) (11). LED (Model:OVLEW1CB9) (12). Bottom rigid layer.
AG. In an eort to obtain higher sensitivity and increase the light intensity, the LTVs
and LEDs were sanded down to minimize the distance between the outside surface of
the epoxy case and the semiconductor chip, then polished to create a smooth, at and
104

shiny surface. The bers are xed to the top plate of the device along with the LEDs
and LTVs while the electrical wires are hooked to the top plate and feed the electrical
signals to the processing unit. Here, the electrical wires can move relative to the top
plate, whereas the bers cannot. The bers exhibit an excellent light transmission and
illumination characteristics, and superior exibility compared to glass optical bers for
creating shapes and orientation at the ends of each sensing element.
The top plate was 3-D printed in rigid black polylactic acid (PLA) with small paths
1.8 mm in width along the inner surface of the top plate to help guide each pair of
bers to its corresponding reective surface, LTV and LED, as shown in Figure 5.2.
Six reective surfaces are distributed on the 3D printed bottom plate via black PLA
chambers (three open and three enclosed) and six 0.65 cm by 1.2 cm mirrors with
adhesive backings which are axed to a wall in each chamber, as depicted in Figure 5.2.
Sensor exibility is due to the elastic material made of silicon rubber mounted
between the top and the bottom plates. Three adhesive mirrors are taped on the
surface parallel to the bottom and top plates whereas the other three mirrors are
taped perpendicular to the bottom plate. Both groups work simultaneously to reect
six optical signals that are used to describe all forces and torques.
To avoid the optical crosstalk between the axes of the sensor, each optical sensing
element is isolated using a 3D printed plastic barrier, thereby encasing each reective
surface and each tip of transmitting and receiving bers. A 5 cm by 5 cm PCB was
designed to connect the electronic components of the sensor. Finally, the top plate is
used as a shield to protect the electronic components and the printed circuit board.
Figure 5.3 shows the assembled sensor.
105

Figure 5.2: Conguration of sensing elements. Each force and torque component hasonly one sensing element that contains LED, pair of bers, LTV and reective surfaceembedded along the top (A) and bottom (B) layers.
5.2.2 Principles of sensing
The proposed sensor has the ability to measure the three main components of force (Fx,
Fy, Fz ) and three main components of torque (Tx, Ty, Tz ) using reective intensity
modulation via ber-optic technology. To measure the applied forces and torques, at
least six signals from six various locations and directions along the internal structure
106
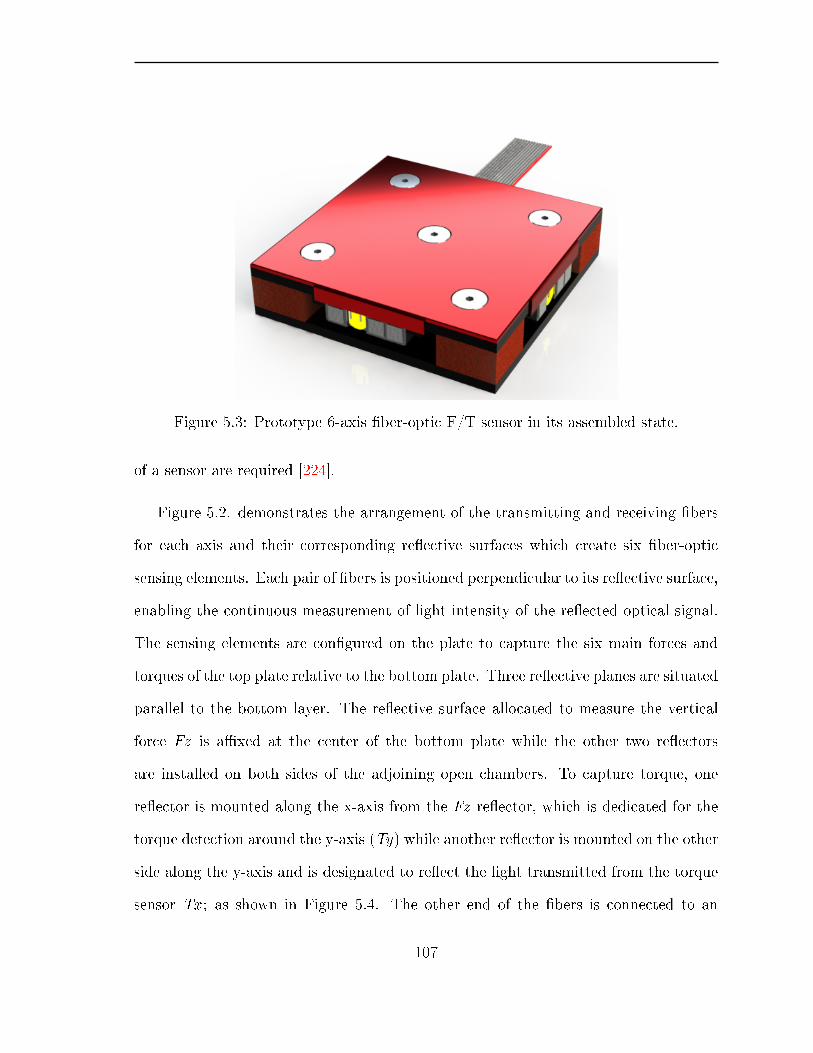
Figure 5.3: Prototype 6-axis ber-optic F/T sensor in its assembled state.
of a sensor are required [224].
Figure 5.2. demonstrates the arrangement of the transmitting and receiving bers
for each axis and their corresponding reective surfaces which create six ber-optic
sensing elements. Each pair of bers is positioned perpendicular to its reective surface,
enabling the continuous measurement of light intensity of the reected optical signal.
The sensing elements are congured on the plate to capture the six main forces and
torques of the top plate relative to the bottom plate. Three reective planes are situated
parallel to the bottom layer. The reective surface allocated to measure the vertical
force Fz is axed at the center of the bottom plate while the other two reectors
are installed on both sides of the adjoining open chambers. To capture torque, one
reector is mounted along the x-axis from the Fz reector, which is dedicated for the
torque detection around the y-axis (Ty) while another reector is mounted on the other
side along the y-axis and is designated to reect the light transmitted from the torque
sensor Tx ; as shown in Figure 5.4. The other end of the bers is connected to an
107

Figure 5.4: Sensor behavior due to applied torque around the x-direction. The topplate tilts which generates light intensity variation enabling Tx measurement.
optical source (LED) and a Light-to-Voltage convertor (LTV).
The distance between optical sensing elements and reectors is xed to 3.5 mm
using four 1 cm tall silicon rubber blocks, which remains constant when there is no
external perturbation acting on the sensor. The value of measured light intensity stays
the same, indicating the absence of force and torque. The intensity of the reected
light changes substantially based on the relative distance variation induced by external
force or torque. The distance between the ber tips and the reectors Fz, Tx, Ty are
termed dFz , dTx and dTy respectively. The force information can be obtained directly
by observing the change in light intensity resulting from the change in distance dFz
when a vertical force along the z-axis is applied. The distances dTx and dTy also change,
thus the light intensity variations produced by Tx sensor is a function of the vertical
force Fz and torque Ty. Once the vertical force Fz is obtained (known), Tx can be
recovered. Similarly, the intensity variations generated by Ty sensor is a function of
both vertical force Fz and torque applied about the x-axis Tx. Ty is recovered from
its allocated sensing element.
When an external torque is applied about the x-axis, the structure of the sensor
deforms and the top plate of the sensor rotates with respect to the bottom plate leading
to a decrease in the distance dTx (the light intensity of Tx sensor increases) and there is
108
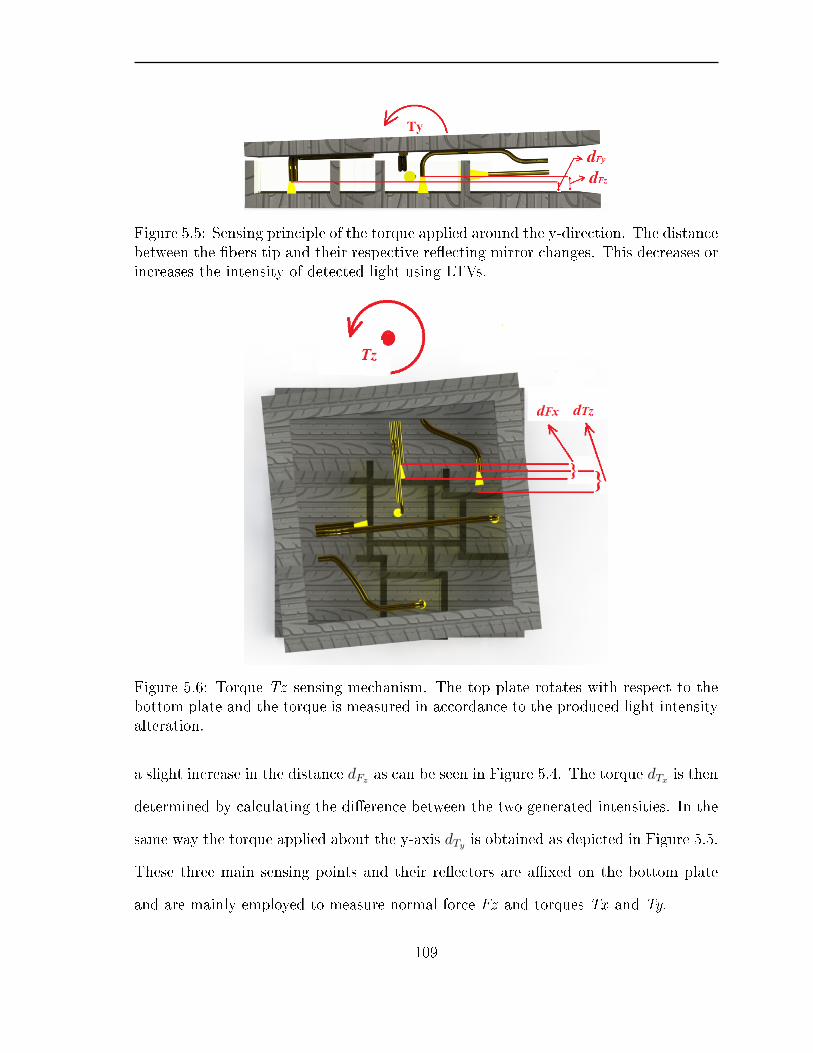
Figure 5.5: Sensing principle of the torque applied around the y-direction. The distancebetween the bers tip and their respective reecting mirror changes. This decreases orincreases the intensity of detected light using LTVs.
Figure 5.6: Torque Tz sensing mechanism. The top plate rotates with respect to thebottom plate and the torque is measured in accordance to the produced light intensityalteration.
a slight increase in the distance dFz as can be seen in Figure 5.4. The torque dTx is then
determined by calculating the dierence between the two generated intensities. In the
same way the torque applied about the y-axis dTy is obtained as depicted in Figure 5.5.
These three main sensing points and their reectors are axed on the bottom plate
and are mainly employed to measure normal force Fz and torques Tx and Ty.
109
The other three sensors are used to measure the two components of shear forces: Fx
and Fy as well as the torque about the z-axis Tz so that each reector of these sensors
is mounted perpendicular to the bottom layer. The ber-optic tips move forward and
backward in parallel to the bottom plate. When a longitudinal shear force is applied,
the top plate moves with respect to the bottom plate, and the distances dFx , dFy
and dTz changes, leading to an increase or decrease in light intensity detected by their
respective LTVs. Light intensity changes in the Fx sensing element is only a function
of longitudinal force in the x-direction. This also applies when there is a force in
the y-direction, Fy. However, the variation of light intensity produced by Tz sensor
is a function of both Fx and Tz. Once the force in the x-direction is obtained, the
torque Tz can be determined. When a shear force is applied in the x-direction the
dierence between the reected light intensities of Tz and Fx remain constant since
their distances dFx and dTz are equal regardless of the amount of force.
When the top plate of the sensor rotates about the z-axis, dFx and dTz are no
longer equal, therefore the dierence between the two generated intensities is used to
determine Tz as shown in Figure 5.6.
5.3 Sensor Characterization
The intended sensor applications are mostly incorporating dynamic locomotion with
considerable displacement and strain, including gait analysis and total ground reaction
force/moment measurements during walking, running, as well as human-machine
interactions. Compliant sensors typically exhibit nonlinear behaviours caused by the
mass and viscoelastic properties of the exible materials. In the current sensor, there
are elastic materials used between the rigid top and bottom plates, therefore it is
110

required for such class of sensors to compensate for the nonlinear behaviours induced
by large strains.
A new calibration procedure is proposed and applied to better characterize the
developed 6-axis F/T sensor. The methodology has the ability to reduce errors,
obtaining a higher accuracy of force and torque measurements. In this approach a
linear and a nonlinear estimation model are used together as a single characterization
system named Least Squares Decision Trees (LSDT) estimation model to achieve the
best results.
5.3.1 Experimental setup
Data obtained from the proposed optical sensor was compared to force measurements
acquired from a standard 6-axis force and torque sensor from Industrial Automation
(ATI Delta SI-660-60). As shown in Figure 5.7, the developed sensor was mounted
to the reference while forces and torques are applied along the six normal axes.
Voltage signals from both sensors were simultaneously acquired through the same data
acquisition system, NI PCI 6229 DAQ, from National Instrument at a sampling rate
of 1 kHz using twelve channels: six channels to connect the prototype and another six
channels to connect the reference. Voltages are received and processed by MATLAB
using xPC-Target real-time environment. Although the intended application of this
sensor is gait analysis, dierent force inputs where applied to the sensor to evaluate
the sensing performance in addition to the gait experiments.
111
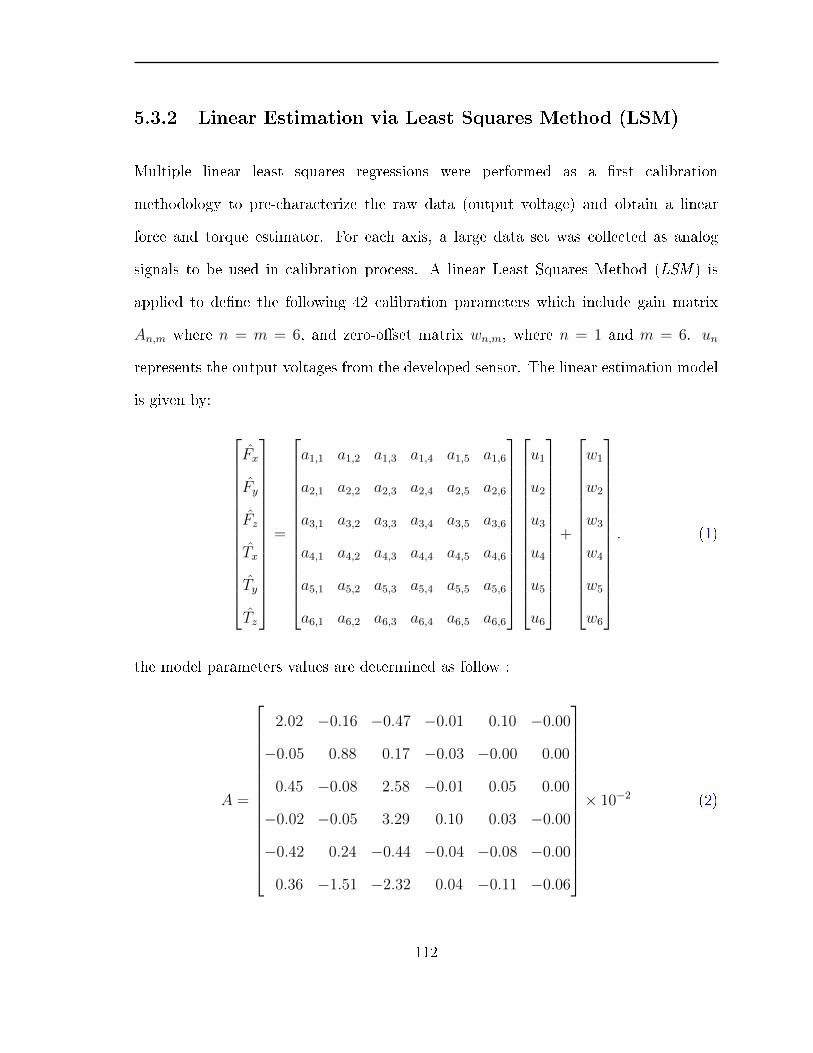
5.3.2 Linear Estimation via Least Squares Method (LSM)
Multiple linear least squares regressions were performed as a rst calibration
methodology to pre-characterize the raw data (output voltage) and obtain a linear
force and torque estimator. For each axis, a large data set was collected as analog
signals to be used in calibration process. A linear Least Squares Method (LSM ) is
applied to dene the following 42 calibration parameters which include gain matrix
An,m where n = m = 6, and zero-oset matrix wn,m, where n = 1 and m = 6. un
represents the output voltages from the developed sensor. The linear estimation model
is given by:
Fx
Fy
Fz
Tx
Ty
Tz
=
a1,1 a1,2 a1,3 a1,4 a1,5 a1,6
a2,1 a2,2 a2,3 a2,4 a2,5 a2,6
a3,1 a3,2 a3,3 a3,4 a3,5 a3,6
a4,1 a4,2 a4,3 a4,4 a4,5 a4,6
a5,1 a5,2 a5,3 a5,4 a5,5 a5,6
a6,1 a6,2 a6,3 a6,4 a6,5 a6,6
u1
u2
u3
u4
u5
u6
+
w1
w2
w3
w4
w5
w6
. (1)
the model parameters values are determined as follow :
A =
2.02 −0.16 −0.47 −0.01 0.10 −0.00
−0.05 0.88 0.17 −0.03 −0.00 0.00
0.45 −0.08 2.58 −0.01 0.05 0.00
−0.02 −0.05 3.29 0.10 0.03 −0.00
−0.42 0.24 −0.44 −0.04 −0.08 −0.00
0.36 −1.51 −2.32 0.04 −0.11 −0.06
× 10−2 (2)
112

w =
−2.18
−0.30
−3.36
0.01
−0.08
0.01
× 10−2 (3)
The least squares estimator of the normal force acting along the z-axis Fz, produces
a Root Mean Square Error (RMSE) of 17.21 N out of a force measurement range
of 1039.26 N. The normalized RMSE is 1.65%. The coecient of determination or
goodness of t, R-squared R2, was found to be 99%, conrming a precise estimated
normal force.
The RMSE, normalized RMSE and R2 were calculated as follows:
RMSE =
[1
n
n∑i=1
(Fzi − F zi)
] 12
(4)
Normalized RMSE =RMSE
Force/Torque Range× 100% (5)
R2% =
[1 −
∑ni=1(Fzi − F zi)
2∑ni=1(Fzi − F zi)2
]× 100% (6)
For the forces acted along the x-axis, the shear force estimator Fx generates an RMSE
value of 10.02 N. The corresponding normalized RSME is 7.72% with R2 of 97%. The
shear force estimator Fy, generates an RMSE value of 5.44 N, normalized RSME of
5.161%, and R2 of 93%. For torques applied about the x, y and z axes, the RMSE,
113
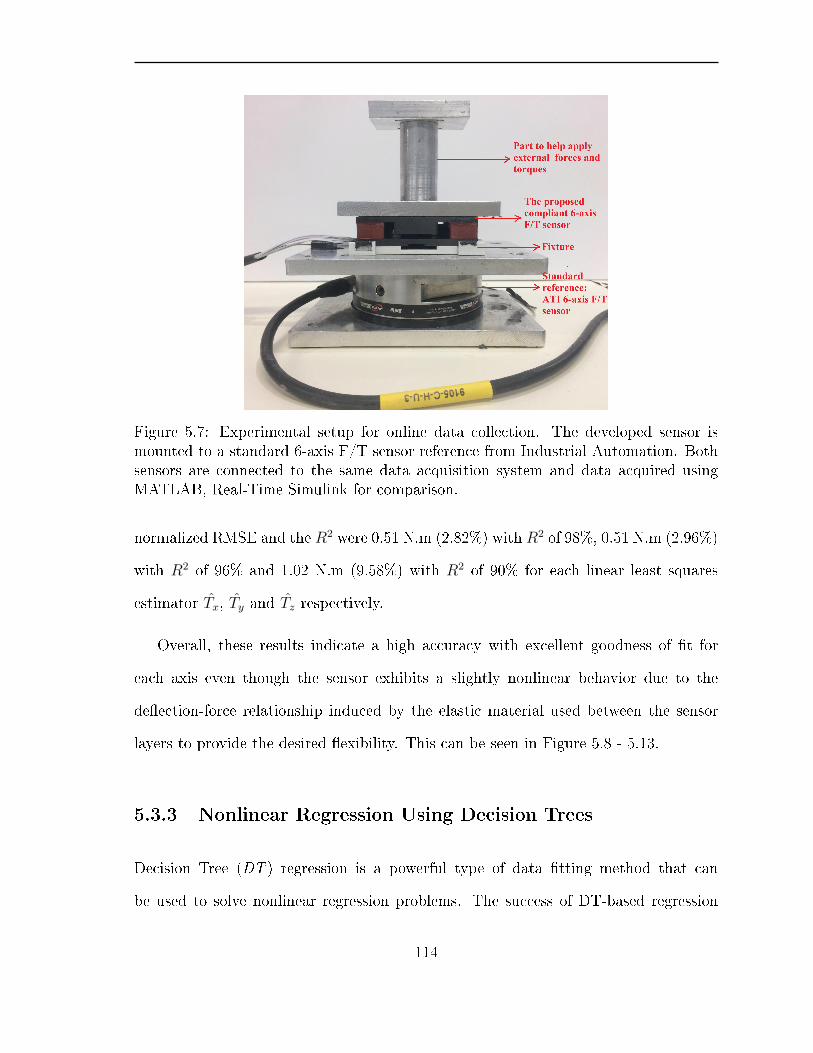
Figure 5.7: Experimental setup for online data collection. The developed sensor ismounted to a standard 6-axis F/T sensor reference from Industrial Automation. Bothsensors are connected to the same data acquisition system and data acquired usingMATLAB, Real-Time Simulink for comparison.
normalized RMSE and the R2 were 0.51 N.m (2.82%) with R2 of 98%, 0.51 N.m (2.96%)
with R2 of 96% and 1.02 N.m (9.58%) with R2 of 90% for each linear least squares
estimator Tx, Ty and Tz respectively.
Overall, these results indicate a high accuracy with excellent goodness of t for
each axis even though the sensor exhibits a slightly nonlinear behavior due to the
deection-force relationship induced by the elastic material used between the sensor
layers to provide the desired exibility. This can be seen in Figure 5.8 - 5.13.
5.3.3 Nonlinear Regression Using Decision Trees
Decision Tree (DT ) regression is a powerful type of data tting method that can
be used to solve nonlinear regression problems. The success of DT-based regression
114
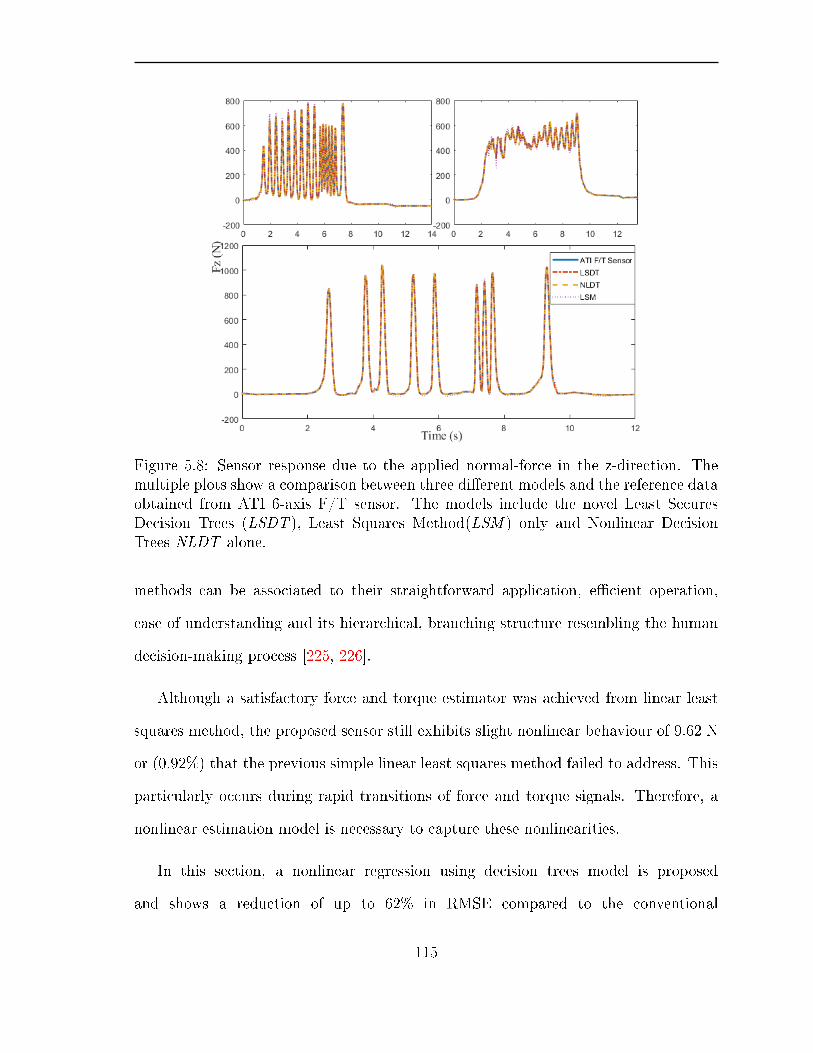
Figure 5.8: Sensor response due to the applied normal-force in the z-direction. Themultiple plots show a comparison between three dierent models and the reference dataobtained from ATI 6-axis F/T sensor. The models include the novel Least SecuresDecision Trees (LSDT ), Least Squares Method(LSM ) only and Nonlinear DecisionTrees NLDT alone.
methods can be associated to their straightforward application, ecient operation,
ease of understanding and its hierarchical, branching structure resembling the human
decision-making process [225, 226].
Although a satisfactory force and torque estimator was achieved from linear least
squares method, the proposed sensor still exhibits slight nonlinear behaviour of 9.62 N
or (0.92%) that the previous simple linear least squares method failed to address. This
particularly occurs during rapid transitions of force and torque signals. Therefore, a
nonlinear estimation model is necessary to capture these nonlinearities.
In this section, a nonlinear regression using decision trees model is proposed
and shows a reduction of up to 62% in RMSE compared to the conventional
115
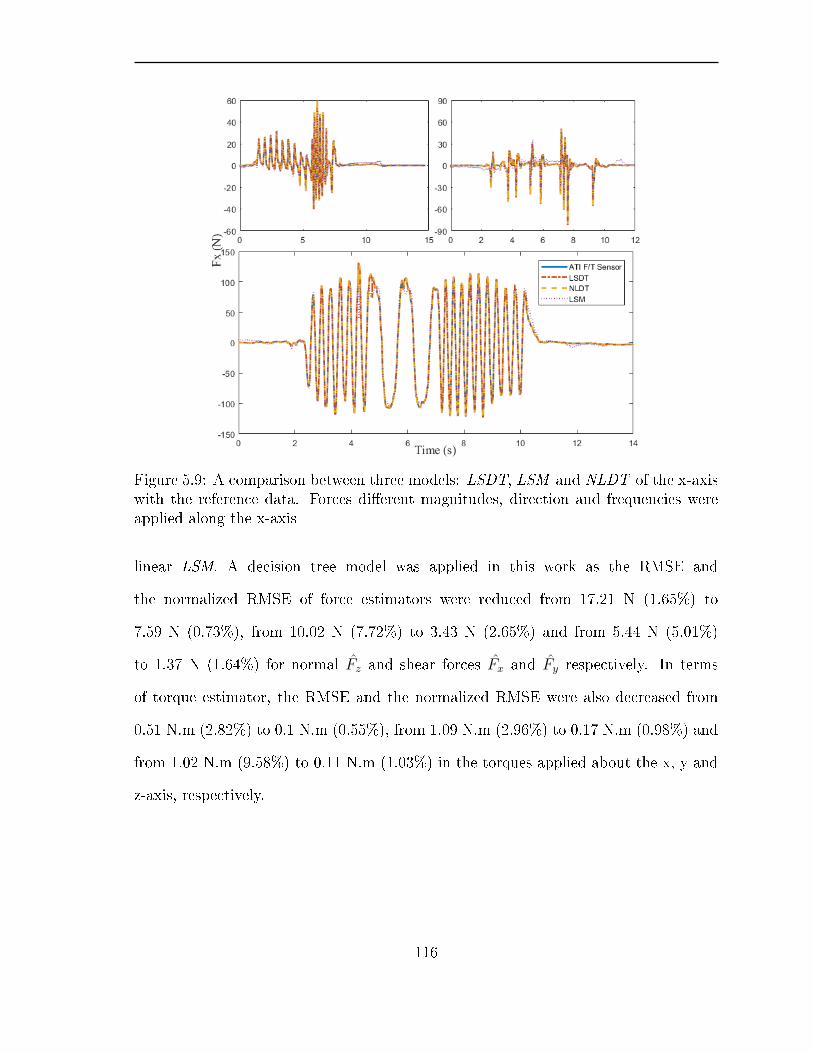
Figure 5.9: A comparison between three models: LSDT, LSM and NLDT of the x-axiswith the reference data. Forces dierent magnitudes, direction and frequencies wereapplied along the x-axis
linear LSM. A decision tree model was applied in this work as the RMSE and
the normalized RMSE of force estimators were reduced from 17.21 N (1.65%) to
7.59 N (0.73%), from 10.02 N (7.72%) to 3.43 N (2.65%) and from 5.44 N (5.01%)
to 1.37 N (1.64%) for normal Fz and shear forces Fx and Fy respectively. In terms
of torque estimator, the RMSE and the normalized RMSE were also decreased from
0.51 N.m (2.82%) to 0.1 N.m (0.55%), from 1.09 N.m (2.96%) to 0.17 N.m (0.98%) and
from 1.02 N.m (9.58%) to 0.11 N.m (1.03%) in the torques applied about the x, y and
z-axis, respectively.
116
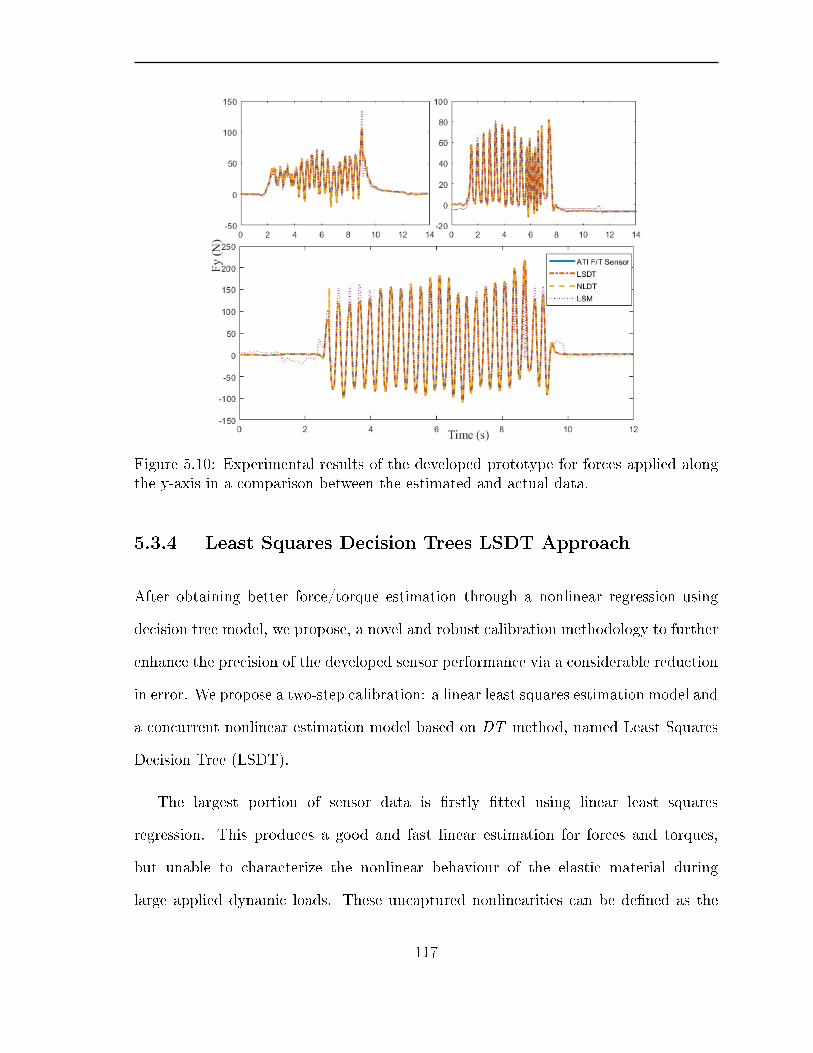
Figure 5.10: Experimental results of the developed prototype for forces applied alongthe y-axis in a comparison between the estimated and actual data.
5.3.4 Least Squares Decision Trees LSDT Approach
After obtaining better force/torque estimation through a nonlinear regression using
decision tree model, we propose, a novel and robust calibration methodology to further
enhance the precision of the developed sensor performance via a considerable reduction
in error. We propose a two-step calibration: a linear least squares estimation model and
a concurrent nonlinear estimation model based on DT method, named Least Squares
Decision Tree (LSDT).
The largest portion of sensor data is rstly tted using linear least squares
regression. This produces a good and fast linear estimation for forces and torques,
but unable to characterize the nonlinear behaviour of the elastic material during
large applied dynamic loads. These uncaptured nonlinearities can be dened as the
117

Figure 5.11: Time-domain response of the proposed compliant 6-axis F/T sensor dueto applied torques around the x-axis. A comparison between the estimated data usingthe proposed estimation models and the measured data from the reference.
dierences between the actual applied forces/torques and the estimated data of the least
squares regression (residuals). A decision tree model is used to generate a nonlinear
estimator for the residuals. The Least Squares Decision Trees calibration procedure
can be described in two steps, as follows:
1. Developing the errors estimator by using the output voltage signal of the proposed
sensor as an input to a decision tree model and residuals of the least squares
model as the output target. The decision trees model is then trained with a
large samples set. It is a one-time training process as the estimated residuals are
predicted only from the output voltage signals of the developed sensor.
2. Combining the outputs of linear least squares estimator with the output of the
118

Figure 5.12: Response of the prototype under torques with dierent magnitudes anddirections applied around the y-axis.
nonlinear decision trees model (residuals estimator) so that the output of the
proposed calibration methodology becomes the sum of the two outputs as shown
in Figure 5.14.
The nal estimated force and torque using the LSDT approach can be described in
the following equation:
ˆF/TLSDT = ˆF/TLSM + ξ (7)
Where ˆF/TLSDT is the forces and torques estimator of the proposed new calibration
methodology, LSDT ; ˆF/TLSM is the output of the least squares method and ξ is
the estimated dierence between the actual force/torque and linear tting (residuals
estimator).
119

Figure 5.13: Experimental results of the developed sensor for a comparison betweenactual data obtained from the reference and predicted data achieved from the sensorafter applying three estimation models. The graphs demonstrate sensor performanceunder several torques around the z-axis.
Figure 5.14: Sensor characterization procedure of the novel calibration methodologynamed as Least Squares Decision Trees (LSDT ). Force and Torque data (voltages)acquired from the developed sensor are used as multi-inputs to two models: linear LeastSquares model to estimate the applied forces and torques and nonlinear estimationmodel based on Decision Trees regression to estimated the errors. The sum of the twomodels is the novelLSDT calibration approach.
120

Figure 5.15: The estimated sensor response vs the actual response of the referencefor Fz estimators. (a) demonstrated the performance of the proposed Least SquaresDecision Trees (LSDT ). Curves are not easy to distinguish because the model perfectlyestimates data. (b) shows the output of the DT model only, which also shows anexcellent predilection. (c) Presents the conventional linear LSM model which exhibitsslightly less accurate results.
121

The Least Squares Decision Tree estimator (LSDT ) gave the best performance with
high accuracy and considerably small errors. In comparison with the performance of
the Decision Tree (DT ) only, the RMSE and the normalized RMSE were extremely
reduced from 7.59 N (0.73%) to 1.82 N (0.17%) for the z-axis estimator and from
3.43 N (2.65%) to 0.94 N (0.72%) and from 1.73 N (1.64%) to 0.48 N (0.56%) in the
x- and y-axis, respectively. The estimated torques were also signicantly improved
as the RMSE and the normalized RMSE were diminished from 0.1 N.m (0.55%)
to 0.03 N.m (0.16%), from 0.17 N.m (0.98%) to 0.13 N.m (0.75%) and from
0.11 N.m (1.03%) to 0.09 N.m (0.84%) in the torques applied around the x, y and
z-axis, respectively.
Signicant enhancements in sensor performance is observed when the LSDT method
was applied. The best force and torque estimation can be seen in Figure 5.15 which
illustrates a comparison between the three methodologies: LSDT in Figure 5.15 (a),
TD regression only shown in Figure 5.15 (b) and Figure 5.15 (c) the LSM for the force
applied along the z-axis.
The objective of this comparison is to show how close the proposed estimators
match the ideal estimation. As it can be seen in the rst plot (Figure (a)), the LSTD
estimator closely matches the ideal estimation, while in the second plot (Figure (b)), it
shows the performance of the DT only which is slightly less identical to the optimum
estimation. The nonlinear eects are seen in the third plot (Figure (c)) of the LSM
which gives a satisfactory performance with good linear tting. Table 5.1 and 5.2
summarize the comparisons between the three calibration approaches in terms of the
RMSE, normalized RMSE and the goodness of t, R2(%).
LSDT also improves the computational processing of sensor characterization which
122

Table 5.1: A summary of Experimental Results: Goodness of Fit, RMSE andNormalized RMSE for Each Estimation Model of Applied Forces
Fz Goodness-of-Fit (R2 %) RMSE (N) Normalized RMSE %
LSDT 100 1.82 0.17
DT 100 7.59 0.73
LSM 99 17.21 1.65
Fx Goodness-of-Fit (R2 %) RMSE (N) Normalized RMSE %
LSDT 100 0.94 0.72
DT 100 3.43 2.65
LSM 97 10.02 7.72
Fy Goodness-of-Fit (R2 %) RMSE (N) Normalized RMSE %
LSDT 100 0.48 0.56
DT 99 1.73 1.64
LSM 93 5.44 5.16
resulted in an increase in speed of prediction that is dened as observations per second
(obs/sec). The estimation speed was signicantly increased by over 50% compared to
DT model when it is used alone to estimate forces and torques.
5.4 Conclusion
In this chapter, a multi-dimensional force and torque sensor based on ber-optic sensing
technology with a 6-axis sensing capability was proposed and prototyped. Only six
ber-optic sensing elements without any conditioners or amplications were integrated
into a lightweight and compliant sensing system. The sensor was able to reduce the
bandwidth of online data transmission due to the limited number of sensing elements
123

Table 5.2: A summary of Experimental Results: Goodness of Fit, RMSE andNormalized RMSE for Each Estimation Model of Torques
Tx Goodness-of-Fit (R2 %) RMSE (N.m) Normalized RMSE %
LSDT 100 0.03 0.16
DT 100 0.10 0.55
LSM 98 0.51 2.82
Ty Goodness-of-Fit (R2 %) RMSE (N.m) Normalized RMSE %
LSDT 100 0.13 0.75
DT 99 0.17 0.98
LSM 96 0.51 2.96
Tz Goodness-of-Fit (R2 %) RMSE (N.m) Normalized RMSE %
LSDT 100 0.09 0.84
DT 99 0.11 1.03
LSM 90 1.02 9.58
used which did not exceed six. The simple conguration and design have led to simpler
sensor fabrication and straightforward assembly process, resulting in a low price 6-axis
F/T sensor. The sensor is customizable as it is possible to increase or decrease the
size of the sensor structure and to adjust its measurement range based on the intended
application.
A novel calibration methodology named Least Squares Decision Tree LSDT was
also proposed and applied to obtain a high precision measurement of forces and
torques. The calibration procedure was split up into a linear regression part and
a nonlinear regression part. The linear t was performed using the standard linear
least method (LSM ) and the nonlinear regression part used a Decision Trees (DT )
estimation model. Results were compared to a linear regression (LSM ) and a nonlinear
124

Table 5.3: Estimation Speed Comparison between The Novel LSDT Approach and DTModel Alone for Each Axis
Fz Estimation Speed (obs/sec) Fx Estimation Speed (obs/sec)
LSDT 320,000 LSDT 290,000
DT 310,000 DT 130,000
Fy Estimation Speed (obs/sec) Tx Estimation Speed (obs/sec)
LSDT 330,000 LSDT 380,000
DT 260,000 DT 120,000
Ty Estimation Speed (obs/sec) Tz Estimation Speed (obs/sec)
LSDT 290,000 LSDT 390,000
DT 280,000 DT 330,000
a Decision Tree (DT ) only, as separate models. The normalized RMSE of LSDT
were as follows Fz=0.17%, Fx=0.72%, Fy=0.56%, Tx=0.16%, Ty=0.75%, Tz=0.84%
compared to the normalized RMS errors produced by the DT alone which were
Fz=0.73%, Fx=2.65%, Fy=1.64%, Tx=0.55%, Ty=0.98%, Tz=1.03% and nally
compared to the normalized RMSE of the LSM : Fz=1.65%, Fx=7.72%, Fy=5.16%,
Tx=2.82%, Ty=2.96%, Tz=9.58%. A reduction of up to 89.42% in RMS errors was
accomplished when the LSDT was used in sensor characterization. Moreover, the
prediction speed was enhanced by 55.17% compared with the prediction speed of
the Decision Trees model alone. All the above-mentioned distinctive features qualify
the proposed sensor to be a preferred solution for measuring forces and torques at
high precision intended for applications such as biomechanics where lightweight and
exibility are highly desirable.
125
Chapter 6
Development and Characterization of
Compliant FBG-Based, Shear and
Normal Force Sensing Elements for
Biomechanical Applications
Abstract
Fiber Bragg grating (FBG) based sensors rely on the wavelength variation of the optical
signal as their main sensing technology. They also use the optical ber both as a
mean of carrying the sensing information through the optical signals and as a sensing
element at the same time which is created along the same optical ber. One of the
most attractive advantages of the FBG sensing systems is their distinctive multiplexing
capabilities. This means that a large number of FBG sensing elements can be inscribed
126

along only a single optical ber [227230]. Sharing one interrogator between several
FBG sensing points, therefore decreasing the cost per sensing element of the sensor
system, making such sensing technology a competitive, compelling in many cases.
Optical ber Bragg gratings are being developed with high quality performance in
the sensing elds, with wide range of various applications in dierent areas of physical
sensing such as strain, temperature, force and pressure [231233].
This chapter presents the development process and the evaluation of compliant
Fiber Bragg Gratings (FBG) based, normal and shear force sensing elements for
biomechanical measurements with their eective novel calibration methodology and
preliminary experimental results. The sensing elements are intended for human
machine interaction such as in transfemoral prosthetic interface. The sensing elements
are designed to utilize the generated deections due to the applied force to stretch
the optical ber when a normal or shear force is applied on the sensor' s top surface.
The performance of the sensor is evaluated through a series of experiments including
both dynamic and static loading conditions. The experimental results showed that
the fabricated sensing elements have the ability to measure applied normal and shear
force. Due to the deformable material used, the sensor exhibits slightly nonlinear
behaviour between force and deformation. This has been addressed using a novel
calibration procedure composed of a linear model to characterize the main sensor
data and a nonlinear estimation model based of a nonlinear autoregressive exogenous
(NARX) model to simultaneously estimate the errors from the input wavelength data
in real-time. The results achieved from the proposed calibration method have revealed
an improvement from an R-squared value of 93% to 100% when compared to a data
obtained using a linear least squares method.
127
6.1 Introduction
Interface shear and normal forces are essential aspects in the development of
human-machine interface of lower-limb assistive devices. Monitoring force distribution
at the limb-machine' s contact surface can provide important information and valuable
knowledge about the biomechanical interaction. In doing so, we can augment the
fundamental understanding, helping researchers and clinicians alike; as well as help to
improve our progress in the technology of assistive devices. The contact surface force
measurements can also help with stump-socket ts, which is considered one of the most
important issues for prosthetists that inuences the mobility, the quality of life and
well-being of amputees [234, 235].
The lack of the shear force measurement is a signicant limitation in prosthetic
sockets force sensing systems. Residual limbs are subject to considerable amounts
of static and dynamic shear forces in addition to the applied normal force. Normal
and shear forces acting on the surface of the residual could potentially damage stump
tissues since the total ground reaction force is ultimately transmitted through these
soft tissues of the residual-limb. Excessive ground reaction forces have revealed to
cause an occlusion in blood ow, resulting in stump ulceration and necrosis [236].
Several sensing systems based on dierent sensing technologies have been developed
and proposed to provide a crucial sensory information about human-machine interface
forces. Such sensing systems typically depend on thin lm pressure transducers which
rely on piezoresistive principles [237, 238]. Other sensors were fabricated based on
capacitive sensing techniques [239241]. However, these sensors are highly aected by
electromagnetic interference, exhibiting a limited accuracy, nonlinearity errors.
128
Force sensitive resistors (FSRs) have also been used in lower-limb human-machine
interface to measure the interaction forces between the residual limb and prosthetic
socket since these sensors have simple interface and low manufacturing cost. In [242,
243], a set of FSR transducers were integrated into prosthetic socket to measure the
distributed interaction force on a residual limb. However, the prototypes were not
capable of detecting the two components of shear forces in the x- and y-directions
as they were only able to measure the normal force. In addition, the material
characteristics of FSRs are fragile and highly aected by the external environment [244].
The commercially available F-Socket pressure sensors such as Rincoe socket tting
system from Tekscan Inc, are designed for prosthetic socket to measure the pressure
distribution on the stump-socket also have the advantages of these sensors are their
small thickness, exibility, acceptable resolution, sensitivity and high bandwidth [245].
The disadvantages of these systems are usually signal creep, their aecting hysteresis
and unknown force cross-talk eects [246]. Furthermore, F-Socket pressure sensors are
highly aected by water which has a high chance of occurrence due to sweat.
Strain gauge-based transducers have been reported in [247] and [248], where a group
of strain gauge-based sensing elements were distributed along a prosthetic socket to
measure the applied interaction forces. These transducers are made of metal with
a high rigidity which can disturb the amputee' s natural gait pattern, leading to
uncomfortable walking. These sensors also have weight concerns and are large in size,
lying several centimetres out of the stump-socket which causes discomfort and fatigue
to the amputee. Attaching heavy mass to the prosthetic socket is not desirable.
Shear forces are also crucial force measurement parameters that are used in
biomedical applications such as surgical robotics and prosthetic sensing [249255], and
we endeavour to use FBG as such. The shear force measurements play a major role
129
in preventing foot ulceration which are a high risk for diabetic individuals as they
experience loss of sensation, particularly underneath the feet [256263]. Shear force
sensors are used to compensate for that lost sensation which may prevent, in some
cases, foot amputation surgeries. Therefore, developing a reliable shear force sensor is
essential for such biomechanical applications.
Optical sensing technologies such as Fiber Bragg Grating (FBG) based sensors can
be a good alternative to the previously stated conventional sensors for stump-socket
interface force measurement. Its small size, lightweight, multiplexing capabilities
and precision measurement with high sensitivity to external strain makes it a
good alternative. More importantly, its unique biocompatibility and its immunity
to electromagnetic interference make this technology a well-suited solution for
biomechanical applications. This sensing technology is also electrically passive, oering
an excellent electrical isolation; and it is inherently safe to be in direct contact
with the human body [6]. One disadvantage of this technology is the cost of the
required integration system. FBG-based sensors have already been used to assess
human-machine interface force [110, 264]. However, these sensors have the limitation
of measuring one force component applied in the normal direction. They do not detect
any shear forces, which are considered crucial information for stump-socket interface.
In this chapter, we propose the development of compliant, small size, lightweight
FBG-based sensing elements capable of measuring both normal and shear forces and
their eective calibration methodology to overcome some of the limitations of the
aforementioned force sensing systems. The presented sensing elements have the ability
to measure normal and shear force components in real-time with RMSE ranging from
2.73% to 4.57%. The nonlinearity eects due to the large deection was investigated
using both a linear, and a nonlinear calibration method and compared with the
130

proposed novel calibration methodology.
6.2 FBG-Based Normal and Shear Force Sensing Ele-
ments: Design and Fabrication
Figure 6.1 illustrates the sensor architecture and the design concept of the proposed
FBG-based force sensing cell. This sensing unit is designed to measure the normal
(vertical) force acting along the z-axis. There are several potential applications where
such compliant sensors are desired, for example in human-robot collisions detection,
plantar normal force mapping in ground reaction force and gait measurement, human
machine interaction (HMI) and other rehabilitation systems. The sensor is composed
of three main parts: an optical ber with FBG inscribed on it, a main sensing body
(the sensing cell) and silicon rubber. The optical ber used in this sensor is SMF-28
from Corning, USA. It is a single mode optical ber with a core diameter of 8.2 µm
and cladding diameter of 125 µm.
The main body was 3D printed using Thermoplastic Poly Urethane (TPU) a thermo
plastic elastomer or a exible material. This type of 3D printing material has the
advantage of being able to control the exibility of the printed model by adjusting the
inll density through the software of the 3D printer.
The sensing body has dimensions of 1.38 cm×2.4 cm with a thickness of only 0.5
cm. On each of the rounded sides of the sensing body, there is a hole centered with
a diameter of 1 mm made to allow for the optical ber to pass through. The ber is
then slightly pre-stretched and set by applying glue on each end of the ber.
Finally, the main sensing body is lled with a exible material made of Econ 60, a
131

Figure 6.1: Structure of the proposed ber Bragg grating-based compliant normal forcesensor. the sensor is composed of three parts: optical ber with inscribed FBG sensingregion, exible sensing body and a rubber material used to ll the sensing body.
132

liquid urethane rubber with shore hardness 60A from Smooth-On, Inc. The urethane
rubber is prepared by thoroughly mixing the Econ 60 with its curing agent in a certain
weight ratio, then cured at the room temperature for more that 16 hours. The mixing
ratio as provided from the manufacturer, and in this case is 1:1 for the urethane rubber
Econ 60 and the curing agent, respectively. The fabricated nal product force sensor
element is shown in Figure 6.1.
The FBG was inscribed in hydrogen-loaded SMF-28 (the single mode optical
ber) using a krypton Fluoride (KrF) excimer laser (type of ultraviolet light) with
a wavelength of 248 nm using a conventional FBG fabrication method of the phase
mask. The length of the FBG is 3 mm at a wavelength of 1543 nm (period of phase
mask is 1066 nm). After the FBG was written along the optical ber, it was put in an
oven at 120 C for 12 hours to remove the remaining hydrogen.
The proposed FBG-based force sensing element is designed and fabricated to measure
the normal force.
A small size, lightweight, FBG-based shear force sensing cell was also designed,
fabricated, and successfully characterized to incorporate shear force sensing. Figure 6.2
demonstrates the design concepts of the proposed FBG-based shear force sensing
element which is also composed of the main sensing body of the same dimension as the
previous FBG-based, normal force sensing cell.
However, the shear force sensing cell contains a small element built on the inner
surface of the main sensing body, used to detect shear force. This element has a
centered hole, 0.5 mm in diameter, for the optical ber with the FBG sensing region
to pass through. The ber is then pre-stretched and glued in that hole at both ends.
The ber remains moderately stretched for several hours until the glue is completely
133

Figure 6.2: Structure of the proposed ber Bragg grating-based shear force sesningelement. the sensor is composed of three parts: optical ber with inscribed FBGsensing region,sensing body and a rubber used to ll the sensing body.
134
dry. Once the optical ber is axed in that hole at both ends, the liquid urethane
rubber Econ 60 is used to ll the sensing body including the shear force element which
can be seen in Figure 6.2.
6.3 Sensing Mechanism and Operating Principles
The ber Bragg gratings (FBG) are narrow-band light lters that are permanently
inscribed along the core of a single mode optical ber. The resulting inscribed
core or grating causes the light that passes through to be partially reected. The
maximum reection occurs when each portion of the reected light (from each grating)
is in-phase with each other. This reected wavelength is called Bragg wavelength. Any
external disruption that can alter the periodicity of the gratings (distance between
each grating) or the refractive index will result in a proportional shift in the reected
Bragg wavelength. The Bragg wavelength' s shift represents a measure of the applied
external perturbation.
When an optical ber with a FBG is stretched due to an applied axial strain, the
distance between each grating changes, the reected Bragg wavelength changes, and it
provides a satisfactory measurement for the applied axial strain.
Figure 6.3 demonstrates the sensing mechanism and working principles of the
proposed FBG-based sensor designed to measure the normal force applied along the
z-axis, where only one FBG sensing element inscribed along a single mode optical ber
is used to measure the applied vertical force. The FBG sensing region is located inside
the main body of the sensor (at the center) and the ber is axed at each end of the
sensor body. When the top surface of the sensor is excited by a normal force acting
135

Figure 6.3: Illustration of the sensing mechanism of the proposed FBG-based forcesensor using nite element analysis performed using Solidworks.
136

along the z-axis, the main exible sensing body deects, generating a displacement at
both ends where the ber is axed. This will result in stretching the ber by converting
the vertical force to an axial strain acting on the optical ber embedded into the sensor.
As a result, the grating periodicity of the FBG changes, which translates as a measure
of the applied force.
Figure 6.3 (a) shows how the original shape of the proposed sensor deforms when a
vertical force is applied. This was carried out using Solidworks' s FEA, a CAD software,
which is mainly used to explain the working mechanism of both normal and shear force
sensing elements. Figure 6.3 (b) illustrates the top view during the applied vertical
force. Both illustrations in Figure 6.3 conrm that the largest deections occur on the
areas where the ber is axed, and the largest displacement is at the edges where the
optical ber is axed. Figure 6.4 shows strain results obtained from the FEA.
Figure 6.4: Strain distribution along the x-axis due to the applied normal force.
Figure 6.4 illustrates the strain along the x-direction as a result of the applied
normal force. In terms of the sensing mechanism of the shear force, the small
element that is created in the sensing body of the shear force cell is used to help
stretching the optical ber at the end of the FBG region. When a certain amount of
137

force is longitudinally applied along the upper surface of the sensor, a corresponding
displacement is generated on the aforementioned small element, which generates an
axial strain along the ber. Since this element works as a cantilever beam which pulls
the ber, producing a wavelength shift proportional to the applied shear force. This
can be seen in Figure 6.5.
The necessary types of force sensing elements required to successfully achieve any
multi-axis force and torque measurement were developed and prototyped in this work.
To obtain a six-axis force and torque sensing system, at least six force sensing elements
are needed: three shear force sensors to measure Fx, Fy and Tz; and three normal force
sensing elements to measure Fz, Tx, Ty.
Figure 6.5: Explanation of the sensing mechanism and the strain distribution onthe proposed FBG-based shear force sensing element using nite element analysisperformed using Solidworks. As it can be clearly seen the optical ber with the FBGis starched by a small element at the middle of the sensing body when a shear force isapplied.
138

6.4 Experimental Setup
The experimental setup shown in Figure 6.6 is used to characterize the proposed
force sensing element and obtain an accurate relationship between the generated
reected wavelength shift and the applied normal and shear force. The applied force
is randomized to have forces in the normal and shear directions. A 6-axis force and
torque sensor (ATI, Delta SI-60-600, from the Industrial Automation) is used as a
reference. The proposed sensor is positioned on top of the reference sensor. The data
acquisition system includes a PCI-6229 16-bit multi-function DAQ card from National
Instrument used to acquire data from the ATI 6-Axis force and torque sensor. Raw
data is received and further processed using MATLAB Simulink with xPC-Target in
real-time environment.
The FBG sensor data was recorded using an optical sensing analyzer (Si720,
supplied by Micron Optics), which has high accuracy, high resolution and a high power
FBG interrogation system. The equipment has a built-in display system which provides
the user with full understanding of the ber Bragg grating spectrum, and shows how
the reected Bragg wavelength shifts when the physical conditions change. This optical
device is used to detect the change in the reected Bragg wavelength of the proposed
sensor. Since the recording speed of the optical sensing analyzer is up to 5 Hz, the
sampling rate of the ATI 6-Axis force and torque sensor is set to the same rate to
obtain matching data points from each sensor for ease of calibration. Figure 6.9 shows
the procedure for shear force application.
139
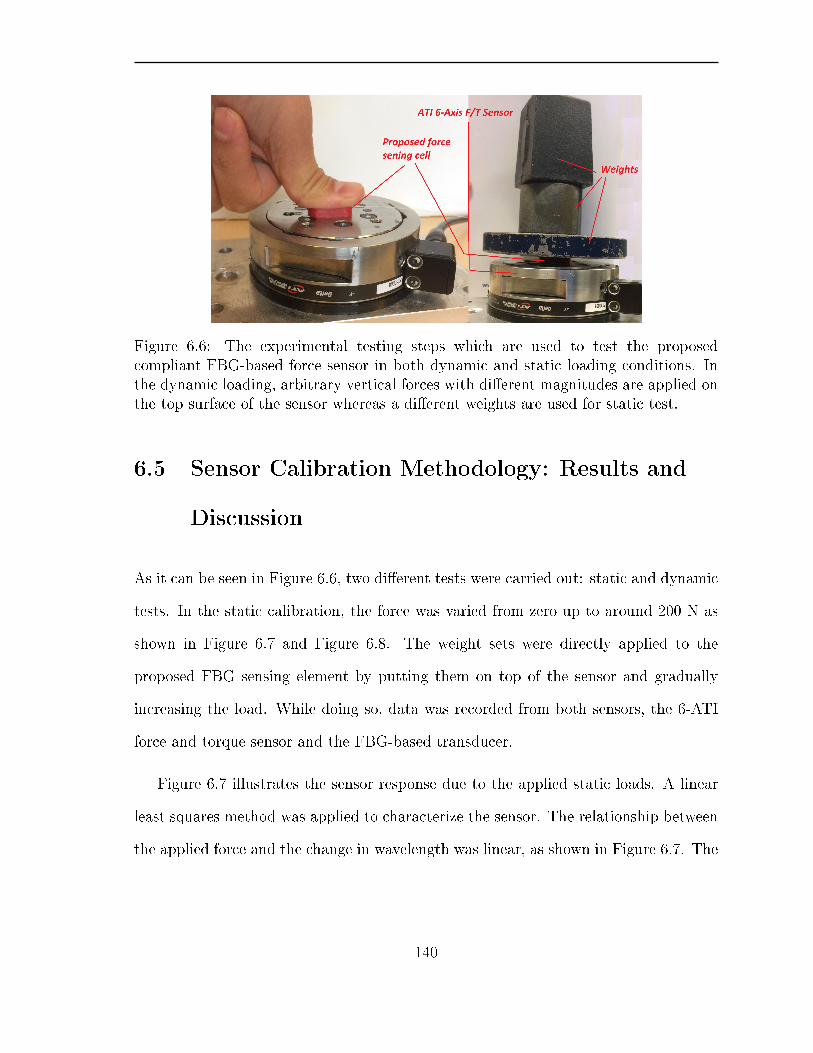
Figure 6.6: The experimental testing steps which are used to test the proposedcompliant FBG-based force sensor in both dynamic and static loading conditions. Inthe dynamic loading, arbitrary vertical forces with dierent magnitudes are applied onthe top surface of the sensor whereas a dierent weights are used for static test.
6.5 Sensor Calibration Methodology: Results and
Discussion
As it can be seen in Figure 6.6, two dierent tests were carried out: static and dynamic
tests. In the static calibration, the force was varied from zero up to around 200 N as
shown in Figure 6.7 and Figure 6.8. The weight sets were directly applied to the
proposed FBG sensing element by putting them on top of the sensor and gradually
increasing the load. While doing so, data was recorded from both sensors, the 6-ATI
force and torque sensor and the FBG-based transducer.
Figure 6.7 illustrates the sensor response due to the applied static loads. A linear
least squares method was applied to characterize the sensor. The relationship between
the applied force and the change in wavelength was linear, as shown in Figure 6.7. The
140
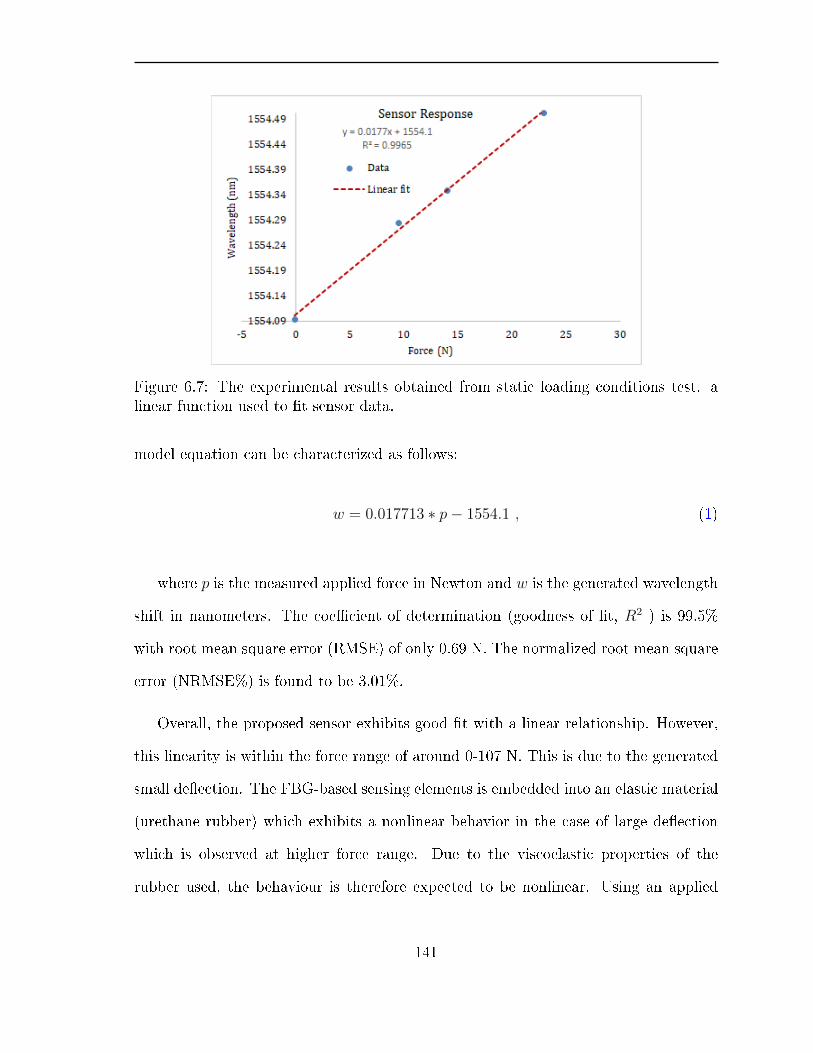
Figure 6.7: The experimental results obtained from static loading conditions test. alinear function used to t sensor data.
model equation can be characterized as follows:
w = 0.017713 ∗ p− 1554.1 , (1)
where p is the measured applied force in Newton and w is the generated wavelength
shift in nanometers. The coecient of determination (goodness of t, R2 ) is 99.5%
with root mean square error (RMSE) of only 0.69 N. The normalized root mean square
error (NRMSE%) is found to be 3.01%.
Overall, the proposed sensor exhibits good t with a linear relationship. However,
this linearity is within the force range of around 0-107 N. This is due to the generated
small deection. The FBG-based sensing elements is embedded into an elastic material
(urethane rubber) which exhibits a nonlinear behavior in the case of large deection
which is observed at higher force range. Due to the viscoelastic properties of the
rubber used, the behaviour is therefore expected to be nonlinear. Using an applied
141
force range of over 180 N, we can animate the proposed sensor's viscoelastic properties
or nonllinearity. A quadratic model was able to accurately capture the nonlinearity
(in the static conditions) as shown in Figure 6.8. The proposed quadratic model is
described by:
w = −4.489 ∗ 10−5 ∗ p2 + 0.030 ∗ p+ 1553.5 (2)
This quadratic model is able to precisely describe the nonlinear relationship between the
applied normal force and the change in the wavelength. The coecient of determination
is found to be 99.6% with an RMSE of only 0.10 N.
The proposed sensor is designed to be used inside a lower-limb prosthetic socket or
inside a shoe, where the sensor is directly attached to the human body. As a result,
the temperature of the sensor ought to be similar to the temperature of the surface of
the human body to avoid temperature variation; in such a case, an additional FBG
sensor can be added to work as a temperature compensator. Also, the sensing element
it self (FBG) is not prone to electromagnetic interference making such sensor suitable
to be used for feedback system. Both normal and shear force sensing elements can be
integrated into an insole shoe. Such sensing elements are small size and light weight
and have the ability to accurately measure shear and normal force. These sensors can
be distributed along insole shoe to measure the total ground reaction force.
6.5.1 Nonlinear System Identifcation using Nonlinear Autoreg-
ressive Exogenous NARX Model
In our previous light intensity modulation-based force and torque sensors, including
the 3- and the 6-axis force and torque sensor [13], linear system identication process
142

Figure 6.8: The experimental results. The force applied in this case is much higher thanthe previous which generated in a higher deection that results in slight nonlinearity.A quadratic function is used to t the data.
Figure 6.9: The experimental setup used to test the proposed compliant FBG-basedshear force sening element force.
143
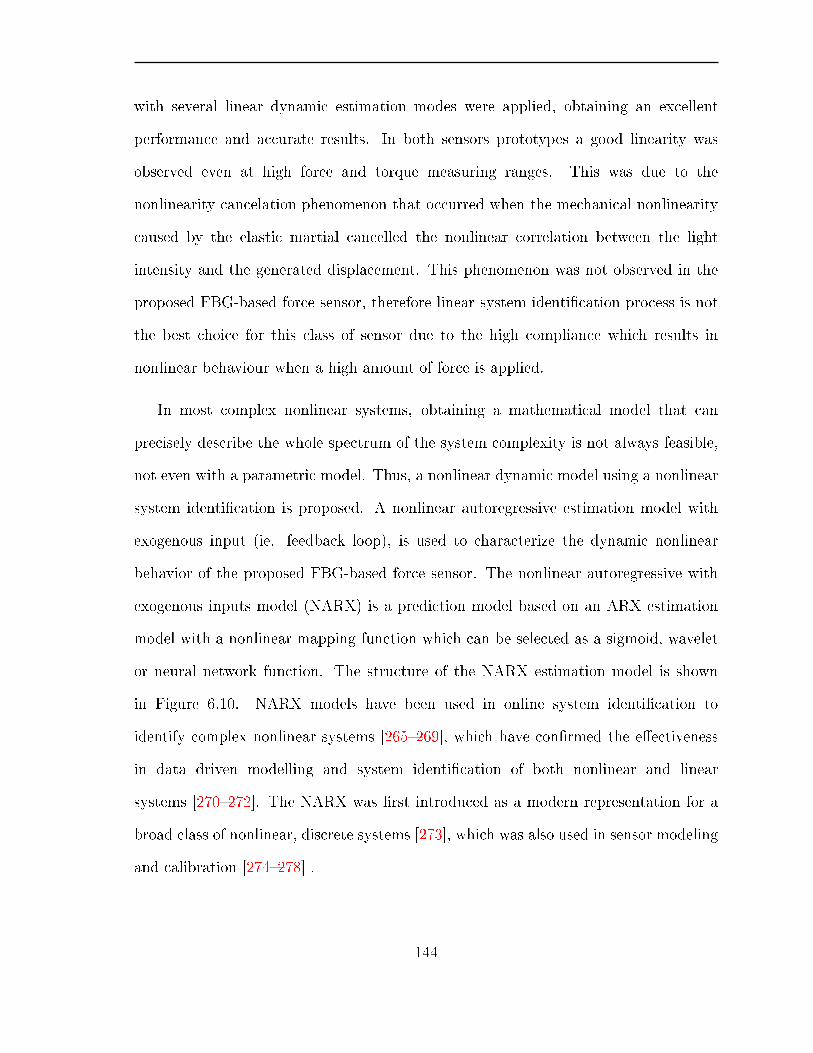
with several linear dynamic estimation modes were applied, obtaining an excellent
performance and accurate results. In both sensors prototypes a good linearity was
observed even at high force and torque measuring ranges. This was due to the
nonlinearity cancelation phenomenon that occurred when the mechanical nonlinearity
caused by the elastic martial cancelled the nonlinear correlation between the light
intensity and the generated displacement. This phenomenon was not observed in the
proposed FBG-based force sensor, therefore linear system identication process is not
the best choice for this class of sensor due to the high compliance which results in
nonlinear behaviour when a high amount of force is applied.
In most complex nonlinear systems, obtaining a mathematical model that can
precisely describe the whole spectrum of the system complexity is not always feasible,
not even with a parametric model. Thus, a nonlinear dynamic model using a nonlinear
system identication is proposed. A nonlinear autoregressive estimation model with
exogenous input (ie. feedback loop), is used to characterize the dynamic nonlinear
behavior of the proposed FBG-based force sensor. The nonlinear autoregressive with
exogenous inputs model (NARX) is a prediction model based on an ARX estimation
model with a nonlinear mapping function which can be selected as a sigmoid, wavelet
or neural network function. The structure of the NARX estimation model is shown
in Figure 6.10. NARX models have been used in online system identication to
identify complex nonlinear systems [265269], which have conrmed the eectiveness
in data driven modelling and system identication of both nonlinear and linear
systems [270272]. The NARX was rst introduced as a modern representation for a
broad class of nonlinear, discrete systems [273], which was also used in sensor modeling
and calibration [274278] .
144
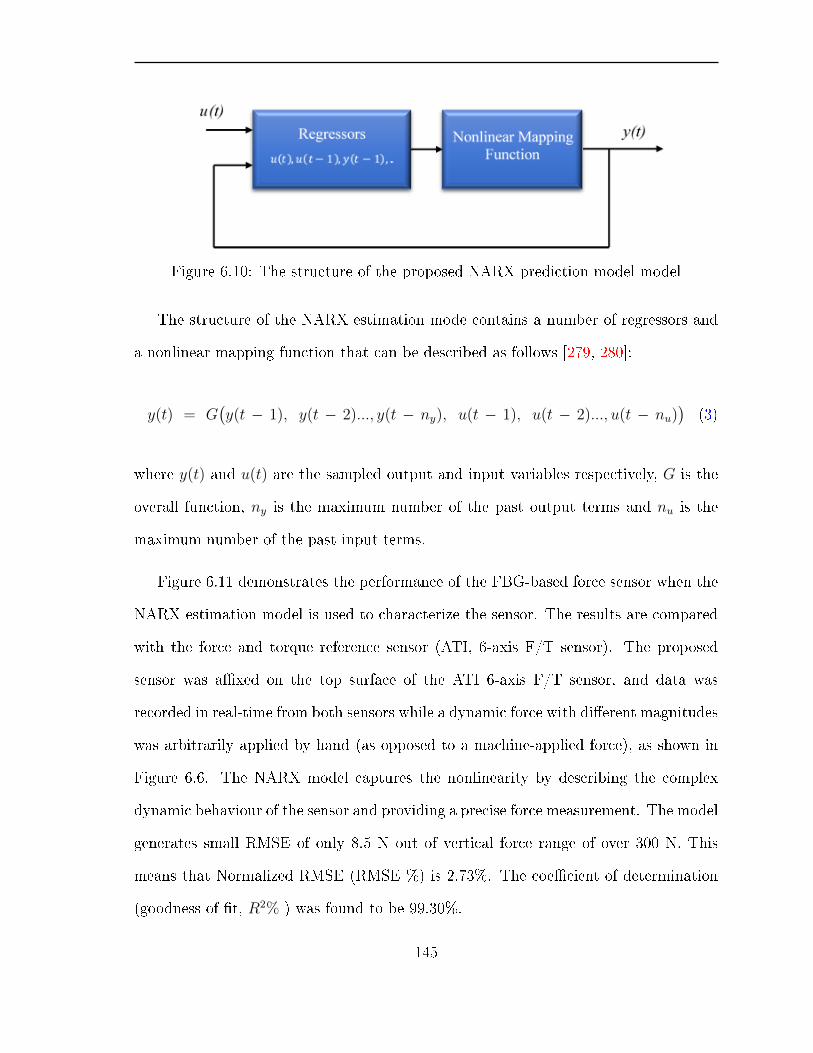
Figure 6.10: The structure of the proposed NARX prediction model model
The structure of the NARX estimation mode contains a number of regressors and
a nonlinear mapping function that can be described as follows [279, 280]:
y(t) = G(y(t − 1), y(t − 2)..., y(t − ny), u(t − 1), u(t − 2)..., u(t − nu)
)(3)
where y(t) and u(t) are the sampled output and input variables respectively, G is the
overall function, ny is the maximum number of the past output terms and nu is the
maximum number of the past input terms.
Figure 6.11 demonstrates the performance of the FBG-based force sensor when the
NARX estimation model is used to characterize the sensor. The results are compared
with the force and torque reference sensor (ATI, 6-axis F/T sensor). The proposed
sensor was axed on the top surface of the ATI 6-axis F/T sensor, and data was
recorded in real-time from both sensors while a dynamic force with dierent magnitudes
was arbitrarily applied by hand (as opposed to a machine-applied force), as shown in
Figure 6.6. The NARX model captures the nonlinearity by describing the complex
dynamic behaviour of the sensor and providing a precise force measurement. The model
generates small RMSE of only 8.5 N out of vertical force range of over 300 N. This
means that Normalized RMSE (RMSE %) is 2.73%. The coecient of determination
(goodness of t, R2% ) was found to be 99.30%.
145

Figure 6.12 and Figure 6.13 illustrate the sensor' s response to altering force signal
proles and dierent magnitudes. The direct overlap conrms the sensor' s ability to
describe any externally applied force. This indicates a high quality performance of
force measurement can be obtained from the proposed sensor.
Figure 6.11: The experimental results: A comparison between force measurementsobtained from the ATI 6-Axis force and torque sensor and the results of the fabricatedFBG-based normal force sensing element using the NARX model
6.5.2 Linear Regression with A Nonlinear Autoregressive
Exogenous (LR-NARX) Calibration Procedure
To further enhance sensor performance and increase the speed of estimation, a novel
calibration methodology is proposed. The calibration procedure is split into two
estimation models: a simple linear regression achieved using least squares regression,
and a nonlinear regression performed using nonlinear autoregressive with exogenous
input model. Figure 6.14 illustrates the structure of the proposed calibration procedure,
146

Figure 6.12: The performance of the fabricated FBG-based normal force sensingelements when dierent amounts of loads (weights) are applied compared to the ATI6-Axis force and torque sensor.
Figure 6.13: A copmarison between the experimental results of the proposedFBG-based sensor and the force reference in real time.
147
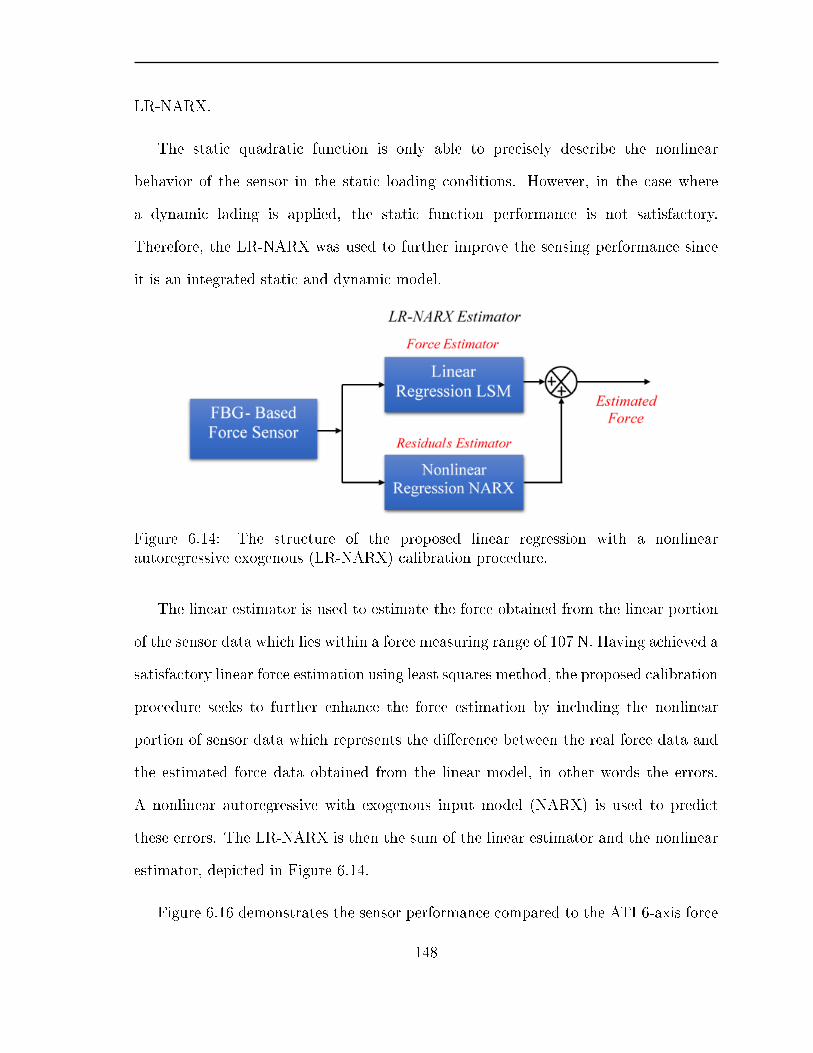
LR-NARX.
The static quadratic function is only able to precisely describe the nonlinear
behavior of the sensor in the static loading conditions. However, in the case where
a dynamic lading is applied, the static function performance is not satisfactory.
Therefore, the LR-NARX was used to further improve the sensing performance since
it is an integrated static and dynamic model.
Figure 6.14: The structure of the proposed linear regression with a nonlinearautoregressive exogenous (LR-NARX) calibration procedure.
The linear estimator is used to estimate the force obtained from the linear portion
of the sensor data which lies within a force measuring range of 107 N. Having achieved a
satisfactory linear force estimation using least squares method, the proposed calibration
procedure seeks to further enhance the force estimation by including the nonlinear
portion of sensor data which represents the dierence between the real force data and
the estimated force data obtained from the linear model, in other words the errors.
A nonlinear autoregressive with exogenous input model (NARX) is used to predict
these errors. The LR-NARX is then the sum of the linear estimator and the nonlinear
estimator, depicted in Figure 6.14.
Figure 6.16 demonstrates the sensor performance compared to the ATI 6-axis force
148

and torque sensor when the proposed linear regression with a nonlinear autoregressive
exogenous (LR-NARX) calibration procedure is used. The coecient of determination
was found to be 100%, which is an improvement compared to the NARX model alone
with 99.30% and the linear least squares regression alone with 93%. The proposed
solution shows uncertainty of only 2.23%.
Figure 6.15: The performance of the fabricated FBG-based normal force sensingelement compared to the ATI 6-Axis force and torque senso when the novel LR-NARXmodel is used to characterize the sensor. The experiment results are perfectly matchesthe force reference.
In addition to the improvement in the curve tting value, the computational
time required for convergence to achieve an excellent force estimator was signicantly
reduced which resulted in a faster speed of prediction for the residuals. The speed
of prediction of the proposed LR-NARX was increased by over 60% compared to the
speed of prediction when a NARX model alone is used. This is attributed to the
smaller number of iterations needed for the training process. In the prediction process,
the number of the iterations is continuously increasing until there is no signicant
decrease in the errors. In the current proposed LR-NARX, the linear portion of sensor
149

data (which is the largest) is not incorporated in the NARX model, only the nonlinear
portion of the sensor data. Therefore, the number of iterations in the LR-NARX is
expected to be less than those needed in the NARX model alone.
The experimental results have conrmed our hypothesis to number of iterations in
case of the LR-NARX estimation model: 61 iterations for the LR-NARX model and
214 iterations for the NARX model. Lower iterations results in a higher prediction
speed with a higher precision of force measure in real-time.
Figure 6.17 and Figure 6.18 shows the performance of the shear force sensing
element compared to the ATI 6-axis force and torque sensor. The coecient of
determination is found to be 98% when the proposed LR-NARX model is applied,
which is an improvement compared to the NARX model alone with 97.5% and the
linear least squares regression alone with 92%. Table 6.2 summarizes the results
obtained from the fabricated shear force sening element
Figure 6.16: A comparison between the performance of the novel LR-NARX and theperformance of the static quadratic model.
150
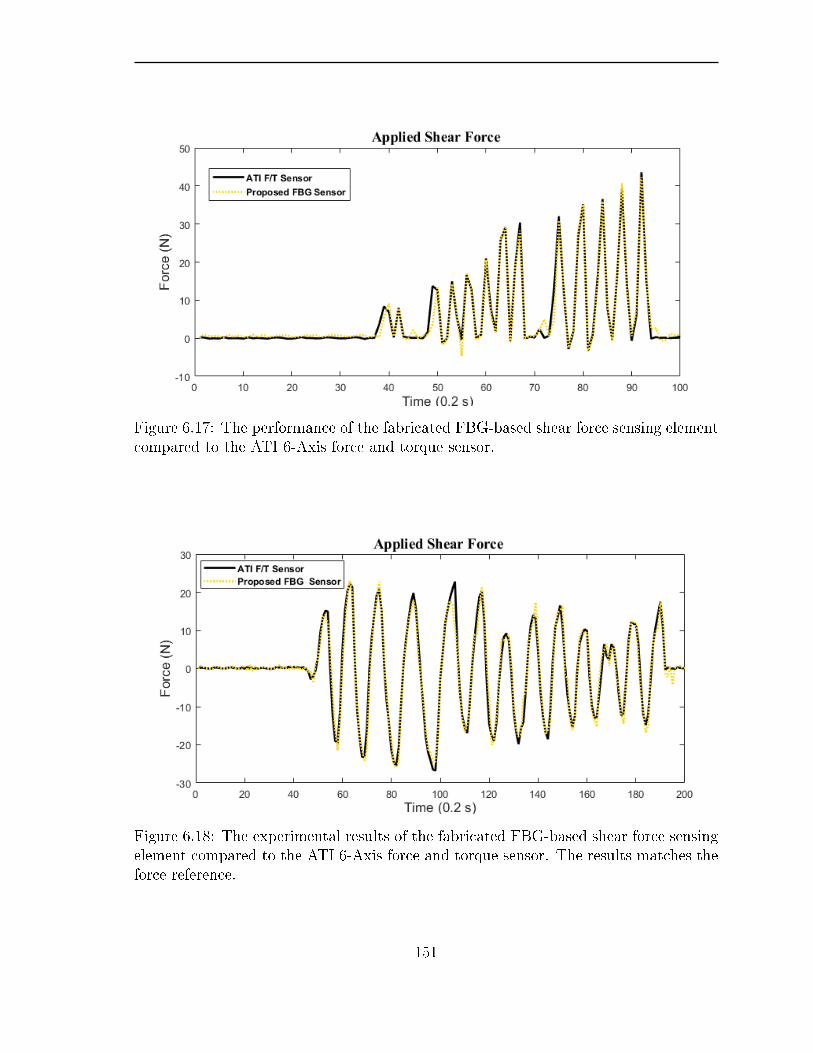
Figure 6.17: The performance of the fabricated FBG-based shear force sensing elementcompared to the ATI 6-Axis force and torque sensor.
Figure 6.18: The experimental results of the fabricated FBG-based shear force sensingelement compared to the ATI 6-Axis force and torque sensor. The results matches theforce reference.
151
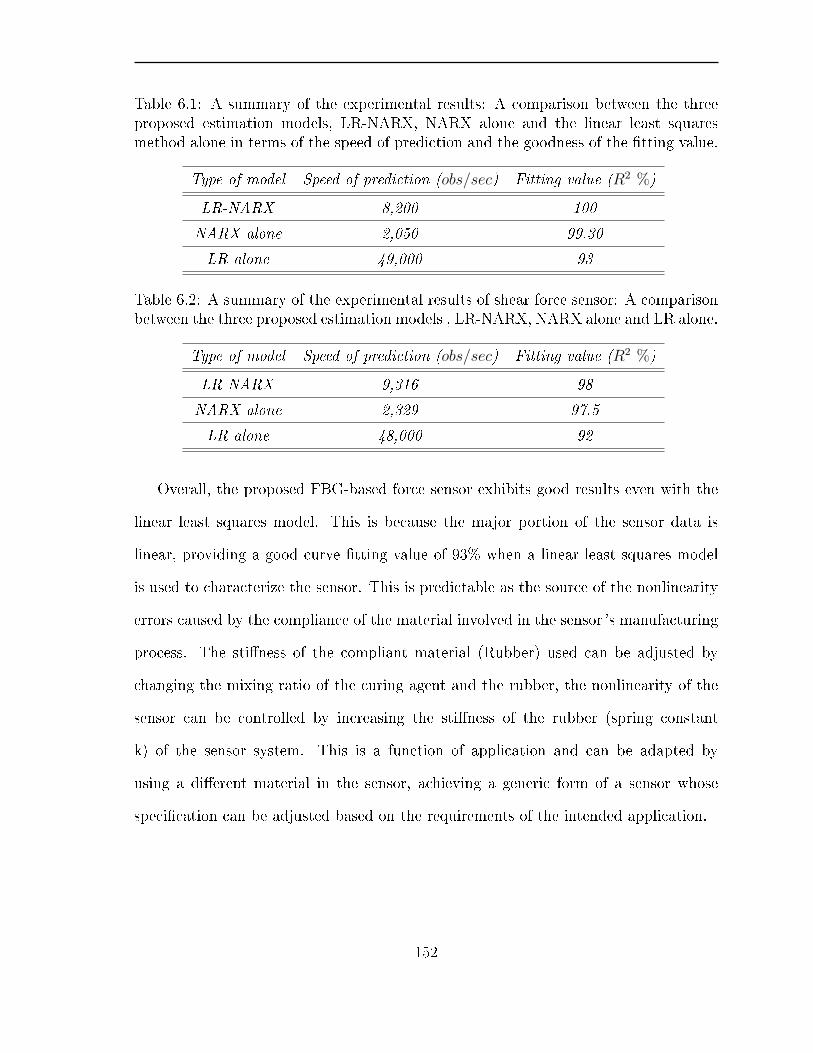
Table 6.1: A summary of the experimental results: A comparison between the threeproposed estimation models, LR-NARX, NARX alone and the linear least squaresmethod alone in terms of the speed of prediction and the goodness of the tting value.
Type of model Speed of prediction (obs/sec) Fitting value (R2 %)
LR-NARX 8,200 100
NARX alone 2,050 99.30
LR alone 49,000 93
Table 6.2: A summary of the experimental results of shear force sensor: A comparisonbetween the three proposed estimation models , LR-NARX, NARX alone and LR alone.
Type of model Speed of prediction (obs/sec) Fitting value (R2 %)
LR-NARX 9,316 98
NARX alone 2,329 97.5
LR alone 48,000 92
Overall, the proposed FBG-based force sensor exhibits good results even with the
linear least squares model. This is because the major portion of the sensor data is
linear, providing a good curve tting value of 93% when a linear least squares model
is used to characterize the sensor. This is predictable as the source of the nonlinearity
errors caused by the compliance of the material involved in the sensor' s manufacturing
process. The stiness of the compliant material (Rubber) used can be adjusted by
changing the mixing ratio of the curing agent and the rubber, the nonlinearity of the
sensor can be controlled by increasing the stiness of the rubber (spring constant
k) of the sensor system. This is a function of application and can be adapted by
using a dierent material in the sensor, achieving a generic form of a sensor whose
specication can be adjusted based on the requirements of the intended application.
152
6.5.3 Spline Regression for Sensor characterization
The fabricated FBG-based force sensor has a conrmed linear relationship between
the applied force and the generated wavelength change when the maximum force is
within a certain degree of exibilty (deection), which was measured according to a
standard hardness measurement and its corresponding Young' s modulus, provided by
the manufacturer. The Durometer Shore Hardness Scale uses a shore durometer (a
device) for measuring the hardness of material. In this work, a silicon rubber with
a Young' s modulus of 2.159 MPa and durometer shore of 60A has been selected. In
the case where a high deection force sensor is required using silicon rubber with a
Young' s modulus between 0.84 MPa and 1.70 MPa, we propose another solution using
a cubic spline function. A cubic spline is eective in tting nonlinear relationships.
Spline models have been used to characterize dierent classes of sensors such as
pressure sensitive resistors [281, 282], where the spline function was used to describe
the nonlinear relationship between pressure and the electric resistance.
Figure 6.19 and Figure 6.20 demonstrate the performance of the proposed cubic
spline estimation model alongside a linear least squares method. Both models are
compared to the actual shear force data obtained from the ATI 6-axis force and torque
sensor. As it can be seen in Figure 6.20, the proposed shear force sensing element is able
to detect the magnitude and the direction of the applied shear force. In this nonlinear
calibration, the acquired data is used to describe the relationship between the applied
force and the generated variation in the light wavelength, producing a curve-tting
estimation model. The sensor output data is then used as input to the achieved spline
model and the output of this model is the estimated force.
The proposed cubic spline estimation model produced a tting value of 97.78% with
153

Figure 6.19: A comparison between cubic spline estimation model and a simple linearleast squares method when a normal force is applied along the z-axis
RMSE of 3.76 N. The normalized RMSE% is 4.57%. Therefore, this is another possible
estimation model to characterize the sensor which indicates the ability of the spline
model to capture the nonlinear behaviour of the exible material and provide a more
accurate force estimate.
As it can be seen in Figure 6.21, the sensor output response (in wavelength ) is
mostly linearly related to its corresponding input applied force, as seen in Figure 6.19;
it indicates that the largest portion of the sensor output data is linear. The proposed
cubic spline model is able to fully capture both the linear and the nonlinear portions
of the sensor output data.
This work discussed a generic form of a customizable sensor whose specications
can be adjusted based on the application requirements, such as in human-machine
interface and gait measurements. The measuring range of the sensor, the accuracy,
sensitivity and the resolution can be all adjusted since they all rely on the generated
deections and strains which are all controlled by stiness/exibility of the material
154
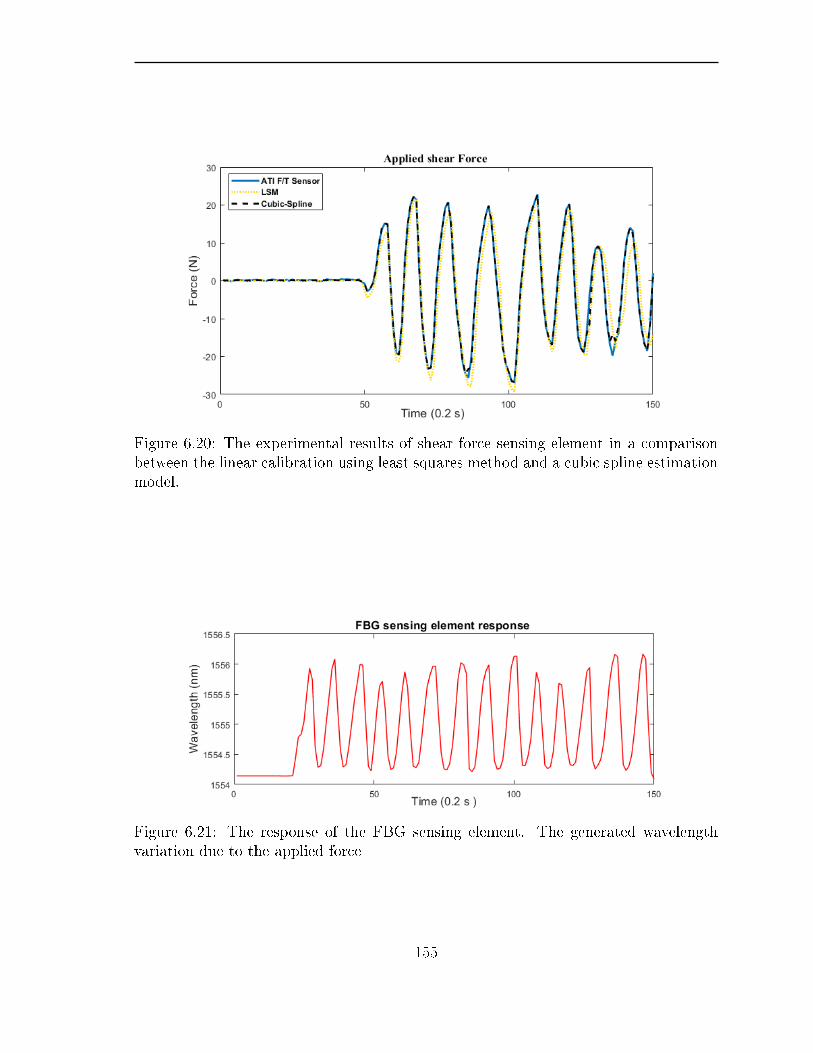
Figure 6.20: The experimental results of shear force sensing element in a comparisonbetween the linear calibration using least squares method and a cubic spline estimationmodel.
Figure 6.21: The response of the FBG sensing element. The generated wavelengthvariation due to the applied force
155

(rubber) used in building the sensor. The stiness/exibility of the material can be
adjusted by changing the mixing ratio of the rubber and the curing agent during the
sensor' s manufacturing process. In doing so, a higher amount of force can be applied
to generate the required amount of deection and strain along the material where the
FBG sensor is embedded. This change in mechanical property will also increase or
decrease the measuring range depending on whether the stiness is increased or the
exibility is increased.
The resolution of the developed sensor is the smallest variation in mechanical
deformation input (the applied force) that can generate a change in the output
wavelength signal, which was found to be 0.09675 N, suitable for the intended
application. The sensitivity of the sensor is 0.054 N/nm with a small repeatability
error of 0.019%. The hysteresis of the sensor was characterized using the proposed
novel calibration methodology and was found to be insignicant: 2.8% of the full
scale. The hysteresis is mostly attributed to compliant material used in the sensor
development process which can be further decrease by increasing the stiness of the
material used. The nonlinear dynamic modelling proposed in this work was eective
in characterizing the hysteresis.
6.6 Conclusion
In this chapter, compliant, small sized, lightweight, ber Bragg gratings-based, normal
and shear force sensing elements have been designed, developed and characterized.
The performance of the sensing elements was investigated and evaluated through
several experiments using static and dynamic loading tests. Both normal and shear
force sensing elements have shown the ability to accurately measure the applied force
156

with a possibility to adjust the force sensing range based on the desired intended
application. To enhance the sensitivity of the sensor the optical ber was pre-stretched
and glued at both sides of the sensing body enabling shear force measurements in
both directions using only one optical ber. Due to its compliance, non-electrical
conductivity, immunity to electromagnetic interference and its wide force measurement
range, the sensing elements exhibit excellent biocompatibility that can be used for
several biomechanical measurements such as in human-machine interface, total ground
reaction force (GRF), and any other applications where exibility of the sensor is
desirable, and rigidity is an issue.
Several force estimation models were applied including a simple linear least squares
method which has shown a precise force estimation. However, in the case where a
large amount of force is applied (generating a large deection), nonlinear behaviour was
observed. Therefore, a novel eective calibration methodology was applied, obtaining
accurate results and high sensing performance. The calibration procedure incorporates
two estimation models: a nonlinear model based on the nonlinear autoregressive
exogenous (NARX) which has been used as an error estimator; and a linear least
squares model to estimate the force data. The sum of both models generates the
proposed calibration system that works eectively in real-time.
The proposed novel calibration procedure is able to obtain higher accuracy than the
linear least squares calibration tool due to its ability to capture the nonlinearity
attributed to the high compliance and large deection.
157

Chapter 7
Novel Calibration Methodologies for
Compliant Multi-Axis Force/Torque
Sensors
Abstract
In this chapter, we present a number of novel calibration methodologies for compliant,
multi-axis, ber-optic based force/torque sensors and evaluate the performance of
these methods in real-time experiments with our custom designed sensors. These
methods address the challenges arising from the important dynamic behaviour of a
compliant sensor and the nonlinearities in force-deection relationship. This chapter
also investigates compliant sensor performance against its response characteristics, such
as the impact of compliance on the sensor' s bandwidth using dynamic modelling
and identication process. A powerful hysteresis compensation solution using a
158
dynamic estimation model is also presented. Furthermore,we propose and apply a new
calibration strategy building on the combination of a linear dynamic model combined
with a static nonlinear model. This includes a state space model with Gaussian Process
Regression model named State Space Gaussian Process Regression (SSGPR). The
results achieved from the proposed calibration method have revealed an improvement
from an R-squared value of 93.86% to 100% when compared to a data obtained using
a linear dynamic model.
7.1 Introduction
Compliant, multi-axis, force/torque sensors play a major role in the health care
industry and in biomechanics measurements. Since they can provide the whole force
and torque information of any structural joint, these six-axis, force/torque sensors
have been extensively used in a broad range of applications such as in robotics,
human-machine interface, biomechanics and rehabilitation systems [207, 218, 283286].
Although several careful considerations and ideas [211, 219, 220, 287] have gone into
the design, development, and characterization of compliant, multi-axis, force/torque
transducers, the challenges associated with the behaviour of compliant materials is
unavoidable and problematic. The interference of the external environment, the error
of the measurement system, and the crosstalk eects on each sensing element of the
multi-axis transducers impose large uncertainties that need to be addressed before
putting these transducers or sensors into application. These uncertainties create a
complex nonlinear relationship between the generated output signal of the sensor and
the applied force/torque.
159

Compliant force and torque sensors in particular exhibit a nonlinear dynamic
behaviour due to the large deection and the viscoelastic property of the compliant
materials. At this level, these compliant materials show a delay phenomenon between
its output signals and its inputs. This is attributed to the complex mechanism in energy
dissipation caused by its viscoelasticity. Therefore, the modelling of such devices and
materials requires the ability to analyze the associated memory eects, ie. the hysteresis
eects. In real feedback systems that use exible actuators or sensors, hysteresis could
potentially cause a severe limitation on the performance of the sensing device and
systems, in terms of seeking precision, accuracy or stability. In order to enhance the
measuring precision, it is required to calibrate the sensor for a real-world, practical
relationship.
Traditional calibration methodologies involve parametric system identication
procedure through a regression analysis based on presumed static models that have
been extensively used in sensor calibrations. As one of the conventional calibration
methodologies, the least squares optimization technique has been widely applied to
calibrate multi-dimensional transducers [3, 288292]. This method is eective and can
be used for rigid, metal-based sensors, showing the ability to eliminate most of the
crosstalk eects. It can also be used for compliant sensors where a small deection is
generated. However, in the case where high forces are applied or where a large deection
is produced on the compliant sensors, such methods cannot capture the associated
nonlinearities since it is a fairly linear calibration approach; therefore, a proportional
error is generated. More importantly, the hysteresis cannot be characterized using a
static linear methods.
A nite element analysis (FEA) based calibration has been used in [195, 196,
219, 293295]. However, such calibration methods rely on several assumptions,
160

such as negligible deformation at the cross beams, isotropic elasticity and high
precision alignment for each sensing element (which is required during bonding
process and cannot be physically achieved). Articial Neural Networks (ANN) and
decision trees-based regressions are capable of predicting various nonlinear relationships
which have been utilized to calibrate single and multi-dimensional force and torque
sensors [2, 3, 221223]. Nevertheless, articial neural networks in most cases, have a
few shortcomings: the need for large network scales and substantial amounts of training
time. Moreover, the ANN cannot compensate for the hysteresis eects since what is
needed is a nonlinear dynamic model while it can only provide a static nonlinear model.
In this chapter, we propose and investigate a number of dierent calibration
methodologies that have conrmed their eectiveness in characterizing the hysteresis
and the dynamic behaviour related to the compliant sensors and its materials. Also,
we investigate the conventional linear calibration methods and prove that they show
good performance for compliant sensors when a small deection is generated.
Finally, a novel dynamic two-model based calibration methodology is proposed
and used. The method is a mixture of a parametric knowledge-based estimation
model, based on a dynamic linear state space (SS) estimation model to estimate the
largest portion of sensor data which is linear and to capture the dynamic behaviour
of the compliant sensor. The other part of the proposed calibration methodology is a
non-parametric machine learning based Gaussian process regression model (GPR) to
predict the errors and create one eective single calibration system, the SSGPR, that
has conrmed its ability to characterize the complexity of the compliant force/torque
sensors.
161

7.2 knowledge-Based (Parametric) Calibration Meth-
odologies
7.2.1 Data-Driven Dynamic Modelling
The bandwidth of compliant force/torque sensors is a crucial factor to evaluate sensor
performance through its intended application. The exibility of the ber-optic based
force/torque sensor is desirable in several biomechanical applications. However, this
compliance can aect the bandwidth of the sensor: The higher the compliance, the
larger the eects on the bandwidth will be; therefore, a dynamic modeling and system
identication is essential to conduct an estimate of the best model based on measured
input/output data.
A voltage-to-force transfer function and state space models were developed from the
observed input and output data of our custom designed compliant sensor [2]. Figure 7.1
shows the performance of these models compared to the actual force.
Second order transfer functions were applied to estimate the normal force applied
along the z-axis (Fz), shear forces acting along the x- and y-axis (Fx, Fy), torques
applied about the x- and the y-axis (Tx, Ty) representing tilting motions and nally
the torque applied about the z-axis (Tz) representing spinning motions. This was
performed to identify the tting value, RMSE, and bandwidth.
Although the current state space model does not exhibit a more accurate result than
the transfer function, it does however give a faster transient response and therefore
higher bandwidth can be obtained when the third order of the state space model is
162
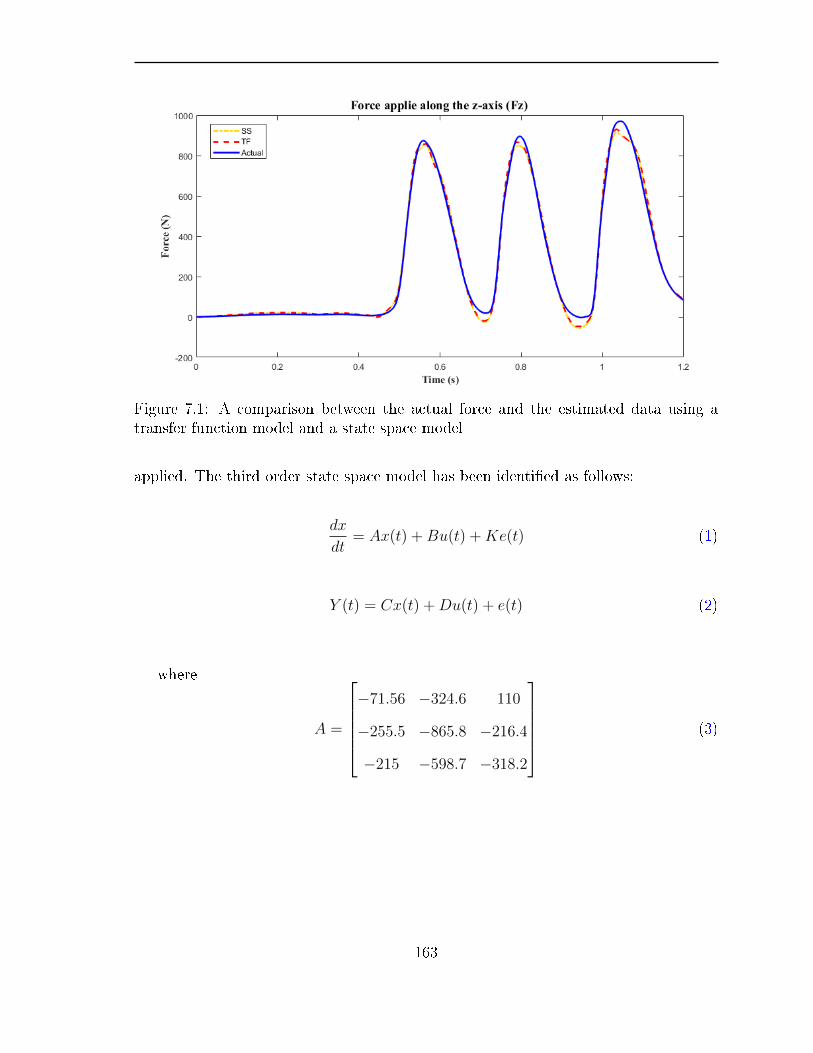
Figure 7.1: A comparison between the actual force and the estimated data using atransfer function model and a state space model
applied. The third order state space model has been identied as follows:
dx
dt= Ax(t) +Bu(t) +Ke(t) (1)
Y (t) = Cx(t) +Du(t) + e(t) (2)
where
A =
−71.56 −324.6 110
−255.5 −865.8 −216.4
−215 −598.7 −318.2
(3)
163

B =
−4.420
−19.50
−16.10
× 106 (4)
C =
[−578.6 691.4 −678.5
](5)
K =
−1.123
−4.955
−4.092
× 104, D = 0 (6)
The third order state space model has a shorter rise time of only 0.001 second,
whereas the rise time of the second order state space model has 0.004 second. The
system overshoot is also decreased to 17.69 compared to the overshoot of second
order state space model with 25.63. As a result, the bandwidth of the compliant
sensing system was estimated using a transfer function and a state space model which
was increased from 65 Hz to 230 Hz when a third order state space model is used.
Table 7.1 summarizes a comparison between the three estimation models.
Table 7.1: A summary of the experimental results: A comparison between the threeproposed estimation models, 2nd order transfer function model , 2nd order state spacemodel and 3rd order state space model in terms of the goodness of the t, RMSE andBandwidth.
2nd order TF 2nd order TF 3rd order SS
Fitting Value 93.86% 93.86% 93.30%
RMSE 1.92% 2.01% 2.14%
Bandwidth 65 Hz 65 Hz 230 Hz
164

7.2.2 Hysteresis Compensation
Compliant materials exhibit large deformation and deections in response to the
external forces. These type of materials have shown their importance in the
development of various devices for sensing and actuation purposes. Particularly in
applications such as biomechanics, human-robot interaction and assistive devices where
compliant transducers are desired. In this chapter, we propose a dynamic calibration
approach that is able to eectively reduce the hysteresis eects.
A second order transfer function estimation model is applied which is capable of
signicantly decreasing the eect of hysteresis by 95.05%, generated by the compliant
materials used in the sensor. Figure 7.2 shows the ability of the proposed transfer
function model to characterize the hysteresis, indicating the eectiveness of the
dynamic modelling and system identication procedure in this compliant sensor
characterization, as well as the third order state space model in removing the hysteresis
eect.
7.2.3 Static Calibration
In order to better investigate sensor performance and evaluate the bandwidth of the
proposed sensor, new types of experiments were conducted using the experimental setup
shown in Figure 7.3. The compliant force/torque sensor is mounted onto the ATI
6-axis F/T sensor, then dierent amounts of forces at high frequencies are applied.
This was done by hitting the sensor as fast as possible while data is recorded from
both the reference sensor and the compliant sensor at a sampling rate of 1 kHz. This
experimental procedure is used due to the lack of high frequency machine-applied force
165

Figure 7.2: Performance of the proposed dynamic models and their ability incharacterizing the dynamic behaviours of the compliant force/torque sensors.
166

testing devices. The commercially available MTS Bionix Servo-hydraulic Test System
provides a maximum frequency of only 2 Hz, which is not satisfactory.
Data is recorded from each axis while the proposed sensor is being hit as shown in
Figure 7.3, and sensor data is then compared to an actual force measurement obtained
from the reference sensor, ie. the ATI 6-axis F/T sensor. In these experiments, the
sensor is characterized by applying a linear least squares method (LSM) as a multi-input
and multi-output linear optimization procedure. Figure 7.4 (a) demonstrates the
response of the sensor due to the normal force applied along the z-axis in comparison
to the ATI 6-axis F/T sensor. Figure 7.4 (b) is a closer look of the same plot to show
that the experimental and actual data overlap exactly, meaning the compliant sensor
exhibits a very similar performance (fast response) compared to the reference. The root
means square error (RMSE) is 6.21 × 10⁻⁸ N, which is very small, showing negligible
error.
Figure 7.3: The experimental setup of the bandwidth test. A high frequency force isapplied by hitting the propose sensor continuously generating high speed force.
Figure 7.5 and Figure 7.6 show the response of the shear force sensing elements
due to the applied force along the x- and the y-axis, respectively. The external force
is arbitrarily applied by hand during these experiments.
167

Figure 7.5 compares the dynamic response of the x-axis sensing element of the
compliant sensor to the reference force data which also exhibits a very accurate result
with an RMSE of 3.25 × 10⁻⁸ N. The coecient of determination or goodness of t
(R-squared R2%) is 100%. Similarly, Figure 7.6 shows a comparison between the
measured and the estimated data of the other shear force component (Fy). The
estimated shear force obtained from the sensor matches the actual force, resulting
in a RMSE of 3.23 × 10⁻⁸ N and an R-squared of 100%.
The proposed experimental procedure also inuences the rest of the torque sensing
elements, generating torques about the x-, y- and z-axis (Tx, Ty, Tz) in a range between
0 N.mm to 450 N.mm. In terms of the torque applied about the x-axis, the sensor
produces a RMSE of 2.45 × 10⁻⁶ N.mm and an R-squared of 100%. These results are
shown in Figure 7.7.
For the torque applied about the y-axis (Ty), and the torque applied about the
z-axis (Tz), the sensor exhibits a high quality performance, generating very small RMSE
of 2.93 × 10⁻⁶ N.mm and 2.78 × 10⁻⁶ N.mm with R-squared of 100% and 100% for
the Ty and Tz sensing elements, respectively. Figure 7.8 and Figure 7.9 show the
performance of each torque sensing element of Ty and Tz when a linear least squares
method is used.
Although the torque range is relatively small in this particular test (which was
expected to give a poor signal to noise ratio), the sensor is able to capture low
magnitudes of force and torque with high accuracy. This means that the sensor
produces very little noise, and provides high precision measurements. The bandwidth
in this test reached to about 60 Hz and the compliant sensor data still matched the
actual force. However, the bandwidth of this sensor can be adjusted by increasing or
168

Figure 7.4: The experimental results of the proposed sensor. (a) and (b) theperformance of the Fz sensing element under a higher frequency force of the appliednormal force in a comparison to the acquired actual data from the ATI 6-axis F/Tsensor when the linear least squares approach is used.
169
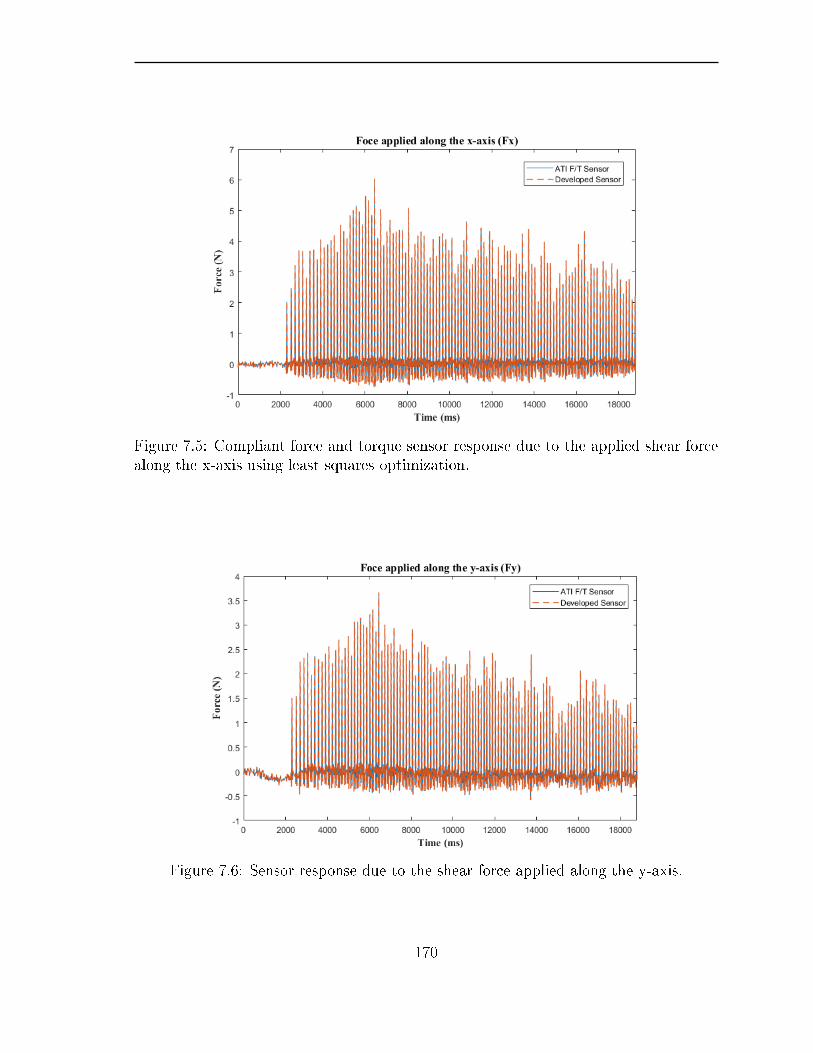
Figure 7.5: Compliant force and torque sensor response due to the applied shear forcealong the x-axis using least squares optimization.
Figure 7.6: Sensor response due to the shear force applied along the y-axis.
170

decreasing the elasticity of the compliant material used. The measuring range can also
be adjusted using the same previously mentioned changes in material property. The
rigidity can not aect the sensitivity of the sensor very much, since the optical sensor
(LTV) exhibits very high sensitivity.
Figure 7.7: The experimental results when a linear least squares calibration is used tocharacterize the compliant force and torque sensor. This is a torque applied about thex-axis.
7.3 Non-Parametric Machine Learning Based Calibr-
ation
Precise estimation models for sensing systems are crucial in several applications.
For complex systems such as compliant sensors that are designed for human robot
interface, automated rehabilitation and surgical robotic hands and other biomechanical
applications, it is not straightforward to suciently model these systems since they
require smart prediction techniques. Modern model learning methods have the
171

Figure 7.8: A Comparison between the performance of the compliant force and torquesensor calibrated using the simple linear least squares method and the actual torquedata applied about the y-axis.
Figure 7.9: compliant force and torque sensor response due to the torque applied aboutthe z-axis in a comparison to the actual torque obtained from the ATI 6-axis force andtorque sensor.
172

capability to of eciently characterizing such complex systems, providing excellent
solution and a valuable alternative. Non-parametric machine learning-based methods
can approximate any linear or nonlinear function relying on the input and the output
data to characterize the relationship of the sensing device, regardless of any prior
knowledge of the system.
However, in some cases of real-time applications, online machine learning modelling,
experiences technical and regression challenges. The prediction speed should be
relatively high enough based on the application requirements. Also, machine learning
models must have the ability to handle large amounts of data sets. Such methods can
be used for sensors that have highly nonlinear behaviour and for complex systems that
cannot be mathematically modelled. Such methods could also be used for systems that
cannot be fully described using knowledge-based models, such as compliant sensors that
generate large deections..
In this section, we propose Gaussian process regression models (GPR) and
show their tting performance and results. Three dierent Gaussian process
regression models are used: Rational-Quadratic GPR, Squared-Exponential GPR and
Exponential GPR. A comparison between the performance of each estimation model
is investigated by applying a high force range to the compliant sensor, at which point
the eects of dynamic behaviour are generated as a result of the force-to-deection
nonlinear relationship. A force with dynamic range of 1000 N is applied on the top
surface of the sensor while data is continuously recorded.
The three GPR-based models' results are depicted in Figure 7.10. The
Squared-Exponential GPR gives R-squared of 100% with RMSE of 1.86%. This model
has a satisfactory speed of prediction of 10,000 obs/sec (observation/second). On the
173

other hand, Rational-Quadratic GPR exhibits a relatively higher estimation speed of
12,000 obs/sec with R-squared of 100% and RMSE of 1.87%. The Exponential GPR
estimation model has slightly less accurate results, generating RMSE of 2.3% with
R-squared of 99%. However, the model exhibits the highest speed of prediction of
19,000 obs/sec.
Figure 7.10: The performance of the proposed Gaussian process regression models incomparison to the applied actual force.
Table 7.2 summarizes a comparison between the proposed estimation models.
Table 7.2: A summary of the experimental results: A comparison betweenthe three proposed Gaussian process regression models (GPR) estimation models,Rational-Quadratic GPR, Squared-Exponential GPR and Exponential GPR in termsof the speed of prediction and the goodness of the tting value as well as the RMSE.
Model R2 Estimation Speed RMSE
Rational-Quadratic GPR 100% 12,000 obs/sec 1.86%
Squared-Exponential GPR 100% 10,000 obs/sec 1.87%
Exponential GPR 99% 19,000 obs/sec 2.3%
174

7.4 Two-Model Hybrid Calibration Methodology
In the two previous sections, parametric and non-parametric calibration methodologies
were used to characterize a compliant, 6-axis, force/torque sensor as both approaches
gave satisfactory results. The dynamic calibration proposed in the previous section had
the ability to eectively characterize the behaviour of the compliant sensor and was
able to signicantly reduce the hysteresis eects. However, the value of good t of the
dynamic model is 93.30% when a state space estimation model is used, which can be
improved by incorporating a non-parametric machine learning based calibration. Using
Gaussian process regression (GPR) models alone gave excellent results and high-quality
performance with a value of good of up to 99% as reported in Table I, but the speed
of estimation was around 12,000 obs/sec which can be increased to enhance the sensing
performance as required for real-time applications where high speeds of prediction is
necessary. Results achieved from dierent GPR model can be seen in Figure 7.10
The proposed two-model based hybrid calibration method aims to better improve
the sensing quality of the compliant sensor by taking the advantages of the dynamic
modelling of the state space model and the excellent performance of the Gaussian
process regression models. This can be achieved by combining a state space estimation
model with a Gaussian process regression to create a single calibration system that has
the advantages of both models at the same time.
The state space model is used to estimate the linear force data, which is achieved
using data-driven modelling and an identication process. The input of the system is
the output voltage of the compliant force/torque sensor and the output is the actual
force data. Once the estimation model is obtained, the dierence of the actual force
175
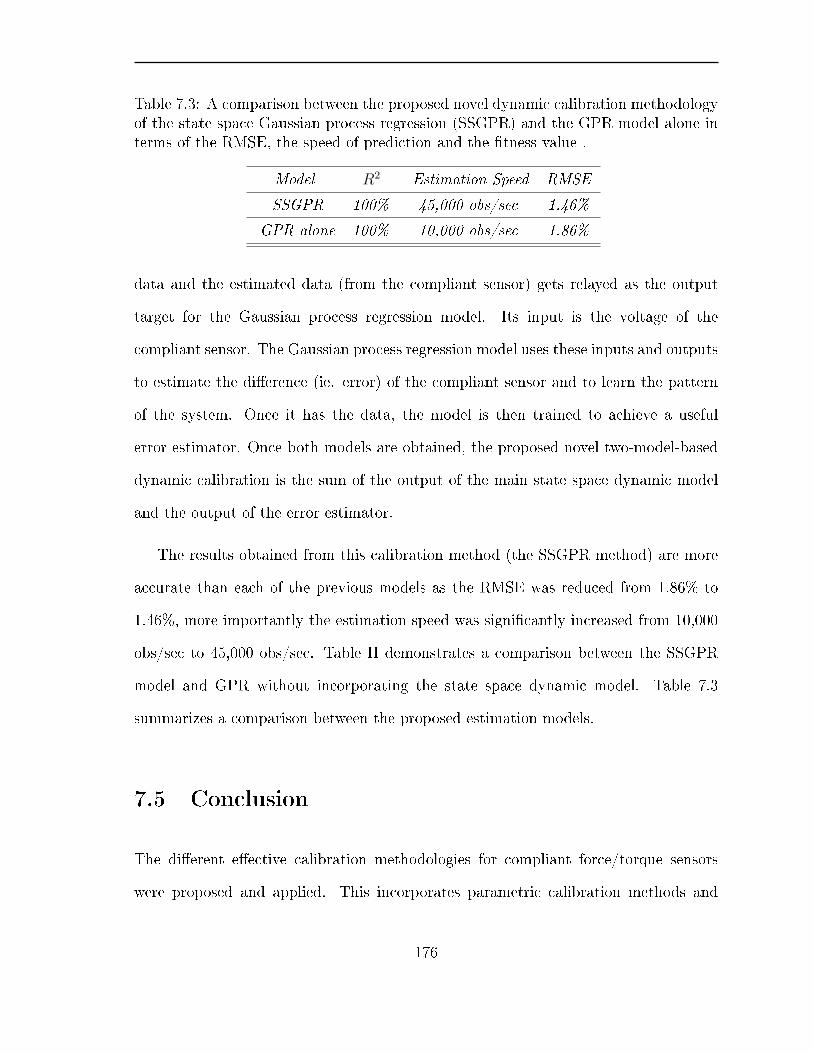
Table 7.3: A comparison between the proposed novel dynamic calibration methodologyof the state space Gaussian process regression (SSGPR) and the GPR model alone interms of the RMSE, the speed of prediction and the tness value .
Model R2 Estimation Speed RMSE
SSGPR 100% 45,000 obs/sec 1.46%
GPR alone 100% 10,000 obs/sec 1.86%
data and the estimated data (from the compliant sensor) gets relayed as the output
target for the Gaussian process regression model. Its input is the voltage of the
compliant sensor. The Gaussian process regression model uses these inputs and outputs
to estimate the dierence (ie. error) of the compliant sensor and to learn the pattern
of the system. Once it has the data, the model is then trained to achieve a useful
error estimator. Once both models are obtained, the proposed novel two-model-based
dynamic calibration is the sum of the output of the main state space dynamic model
and the output of the error estimator.
The results obtained from this calibration method (the SSGPR method) are more
accurate than each of the previous models as the RMSE was reduced from 1.86% to
1.46%, more importantly the estimation speed was signicantly increased from 10,000
obs/sec to 45,000 obs/sec. Table II demonstrates a comparison between the SSGPR
model and GPR without incorporating the state space dynamic model. Table 7.3
summarizes a comparison between the proposed estimation models.
7.5 Conclusion
The dierent eective calibration methodologies for compliant force/torque sensors
were proposed and applied. This incorporates parametric calibration methods and
176

non-parametric machine learning-based calibration strategies. For the parametric
calibration, linear dynamic models were obtained through a system identication
process and data-driven dynamic modelling which includes transfer function and state
space models. These estimation models were able to accurately estimate the applied
force and torque. More importantly, they were able to eciently compensate for the
hysteresis eects as it was signicantly reduced by 95% compared to the conventional
calibration methodologies.
For the small deections generated by a relatively small amount of force between
zero to 25 N, the conventional calibration gave very accurate results with RMSE of
6.2 × 10⁻⁸ N and R-squared of 100%. However, this method could generate errors in
the case where large deections and high force ranging 1000 N is applied, since the
non-linearity increases in this situation.
To address this issue, we proposed a novel, two-model-based dynamic calibration
procedure that combines a dynamic estimation model based on state space
representation and a machine learning model based on Gaussian process regression
(GPR) which was capable of improving the performance the compliant sensor at a
high amount of force application. This novel calibration method was also able to
signicantly increase the speed of prediction compared to the conventional calibration
as well as these models when used on their own.
177

Chapter 8
Conclusions and Recommendations for
Future Work
Compliant force and torque sensors have shown their signicance in several applications
such as biomechanics, rehabilitation systems, human-machine interface, ground
reaction force and gait measurements. BalanceAid project for instance, is a
comprehensive human control and balance system being developed and improved in
the ABL laboratory at Carleton University. The work explained in the current thesis
is a part of this project that aims to develop an ambulatory balance assessment device
and a feedback system to enhance the mobility and balance of the impaired gait person.
Force and torque sensor data is a vital information for the BalanceAid system to provide
a feedback when the patient is at risk of falling. Three force components including
normal and shear forces as well as the three moment components must be measured
to be able to obtain the full ground reaction force which is required for fall prevention
and maintain balance.
178
This thesis demonstrated the full development process of ve dierent prototypes of
compliant, lightweight, small size, multi-dimensional force and torque sensors that were
able to measure the complete ground reaction force and moment. The technologies
involved in these sensors are based on ber-optic sensing principles including light
intensity modulation and ber Bragg grating techniques that relies on light wavelength
variation. Also, a wearable, compliant 6-axis force and torque sensor that combines
two sensing techniques in one sensor system: the optical light intensity modulation
and FlexiForce pressure sensors based on force sensitive resistor. These developed
compliant sensors exhibited a complex nonlinear dynamic behaviour due to the
viscoelastic properties of the exible material used in the sensors. This behaviour
cannot be fully described using the conventional calibration methods, thus, several
novel calibration and sensor characterization methodologies were proposed and used
which have conrmed their eectiveness in addressing this dynamic behaviour. The
calibration methods were also able to characterize the hysteresis, reduce the errors,
increase the speed of estimation and improve the dynamic response of the proposed
compliant force and torque sensors. The conclusions of this thesis are presented as
follows:
8.1 Conclusions
8.1.1 Design and Implementation of A Compliant 3-Axis
Fiber-Optic Based Force Sensor
A novel, high-precision, compliant, triaxial ber-optic force sensor operates based on
light intensity modulation was designed, manufactured and calibrated successfully. The
179

sensor was able to measure the magnitude and the direction of the applied normal and
shear forces simultaneously with a potential to adjust the sensing range. Both static
and dynamic tests were performed to evaluate the sensor's characteristic response in
dierent loading conditions. A dynamic linear and nonlinear system identication
models have been used and both have shown satisfactory results. A Hammerstein
Wiener estimation model was necessary to characterize both the linearity and nonlinea-
rity of the sensor since it incorporated an integrated linear and nonlinear models. The
model has shown a high-quality performance with a tness value of Fx = 94.12%,
Fy = 92.25% and Fz = 93.20%. The crosstalk errors were also signicantly reduced
in this prototype through its novel mechanical design and sensing mechanism which
were between 0.37% and 4.01%, before using any mathematical or any other crosstalk
compensation
8.1.2 Development of 6-DoF Sensor for Total Ground Reaction
Force Based on Two Sensing Technologies
A novel ambulatory force and moment sensor system for the complete ground reaction
measurement was designed and prototyped. The sensor was developed to replace the
previous traditional pressure insole used in the BalanceAid project that was only able
to measure one component of ground reaction force (normal force). The sensor is
compliant, small size and has minimal disturbance to the natural gait pattern. Unlike
the conventional multi-axis force transducers this sensor does not cause fatigue or any
discomfort to the user due to its high exibility and its lightweight. The sensing system
combines two dierent sensing technologies, the ber-optic based on light intensity
modulation the and exible pressure matrix (FlexiForce sensors) to measure the normal
180

and shear forces and to capture the applied moments. The sensor was validated through
an actual gait measurement scenario by mounting two sensing units underneath a
foot to detect the full ground reaction force and moment during gait. The sensor
was successfully calibrated using linear and nonlinear calibration methods based on
neural network with RMSE of 9.39% and 5.21% for the linear and nonlinear calibration
respectively. Stephanie Eng was involved in this work.
8.1.3 Design, Development and Calibration of a Lightweight,
Compliant Six-Axis Optical Force/Torque Sensor
A multi-dimensional force and torque sensor was designed, developed and calibrated.
The sensor is based on ber-optic technology with a six degree of freedom sensing
capability. The sensor incorporates only six ber-optic based sensing element that
were able to accurately measure the six relevant force and torque components. The
sensor is compliant and light weight with no integrated conditioners or amplications.
The simplicity in its conguration and design have led to simpler sensor fabrication
and straightforward assembly process, resulting in a low price 6-axis F/T sensor. The
sensor has the advantage of the ability to increase or decrease the measuring range and
sensor size based on the intended biomechanical application.
A novel calibration methodology named Least Squares Decision Tree (LSDT) was
also developed and applied to obtain a high precision measurement of forces and
torques. The RMSE of LSDT for each axis were as follows Fz=0.17%, Fx=0.72%,
Fy=0.56%, Tx=0.16%, Ty=0.75%, Tz=0.84%. This conrms the high-quality
performance of this sensor when the novel LSDT calibration is used.
181

8.1.4 Development of FBG-Based Normal and Shear Force
Sensing Elements
a compliant, small size, lightweight, ber Bragg gratings-based, normal and shear force
sensing elements have been designed, fabricated and characterized successfully. The
sensors were evaluated through several experiments using static and dynamic loading
tests. Both normal and shear force sensing elements have shown a strong ability to
accurately measure the applied force with a possibility to adjust the force sensing
range based on the desired intended application. Due to its compliance, non-electrical
conductivity, immunity to electromagnetic interference and its wide force measurement
range, the sensing elements exhibit excellent biocompatibility that can be used in
several biomechanical measurements such as in human-machine interface, total ground
reaction force (GRF), and any other applications where exibility of the sensor is
desirable, and rigidity is an issue. a novel eective calibration methodology based
on the nonlinear autoregressive exogenous (NARX) was applied, obtaining accurate
results and high-quality performance.
8.1.5 Novel Calibration Methodologies for Compliant Multi-
Axis Force/Torque Sensors
Novel parametric calibration methods and non-paramedic machine learning-based
calibration strategies were proposed and applied in this thesis. Preliminary results
investigating the functionality of these calibration methodologies indicate their strong
abilities to characterize the complex nonlinear dynamic behaviours of compliant force
and torque sensors. Dynamic models were obtained through a system identication
182

process and data-driven dynamic modelling including state space and transfer function
models which were able to signicantly reduce the hysteresis phenomenon by 95%
compared to the conventional calibration methodologies. However, the sensor
behaviour was not fully capture since these models are linear, thus; a novel two-model
based dynamic calibration procedure was proposed. This approach that combines a
dynamic estimation model based on state space representation and a static machine
learning model based on Gaussian process regression (GPR) which was capable of
improving the performance the compliant sensor even when a high amount of force is
applied. This novel calibration method was also able to signicantly increase the speed
of prediction compared to the conventional calibration.
8.2 Future Work
As a rst version of each sensor prototype the experimental results obtained from
various loading conditions and testing scenarios have conrmed the high-quality
performance of force and torque sensing. However, there are improvements that can
be performed for a next version of each device.
8.2.1 Sensor Modications and Improvements
The current version of each sensor is compliant and lightweight and is functional
to accurately measure the three force components: Fx, Fy and Fz as well as
the three components of the applied torque: Tx, Ty and Tz. However, more
miniaturization could be implemented to be even more comfortable and user compatible
particularly when is the intended application is ground reaction force measurement
183
and rehabilitation systems where the sensor is attached to a shoe or to a personalized
assistive device.
The current thickness of the current sensors is 12 mm and 5 cm square as they were
made to be large for ease of production, but could be reduced, improving portability
and having less disturbance of natural gait pattern.
The proposed sensors have a high measuring range up to 1000 N, but in case of
overweight users, the sudden step can be higher than their normal weight, thus; the
sensors should also be able to withstand higher normal forces. This can be achieved
by adjusting the exibility of the rubber used through its mixing ratio and therefore
increase the measuring range. However, the rigidity of the sensor top and bottom
layers should also be increased to avoid any deformation that might occur to the layers
which can be any material including metals such as steel, aluminum, or carbon ber,
depending on the application restrictions. These denitely provide options that can
be decided for each application separately. Metallic layers can add extra strength
and support the PLA layer as well. In the current versions the four rubber blocks
sandwiched between these layers have high viscoelastic properties compared to PLA,
making the whole deection occurs within the rubber.
8.2.2 Development of FBG-Based, 6-Dof insole Sensor for
Total Ground Reaction Force and Moment
To measure the six components of the applied force and torque, at least six force signals
from six force sensing elements are required [224]. In this research, the necessary types
of force sensing elements required to successfully achieve any multi-axis force and torque
sensor were developed and prototyped which include the developed FBG-based normal
184

and shear force sensors reported in chapter 6. This can be obtained by incorporating
three shear force sensors to measure Fx, Fy and Tz; and three normal force sensing
elements to measure Fz, Tx and Ty.
In the future work we aim to develop a 6-Dof thin sensor sheet that can be easily
integrated in any shoe and can accurately measure the plantar distributive force and
moments as well as the temperature beneath a foot using only one optical ber with
FBG-based sensing technique.
8.2.3 BalanceAid Biofeedback Integration
Various biofeedback systems in literature have been developed to enhance balance
performance based on several technologies, such as haptic biofeedback [296298], visual
biofeedback [299302] and auditory biofeedback [303305] systems. Such methods are
being used to compensate for the reduced sensory information resulting from trauma
or aging.
During a walk or standing state, real-time tracking of center of pressure (COP)
and center of mass (COM) of the human body is conducive to an enhanced
balance performance ??. A oor-xed force plate [306, 307] and motion capture
system [308, 309] with infrared cameras and reective markers attached to the body
are used to detect COP and COM. However, these standard measurement systems are
only available in a laboratory environment, which can signicantly limit the assessment
of gait measurement performance. The future work is to develop a biofeedback system
for balance control using the developed ambulatory sensing system for the complete
ground reaction force and moment. The COP is closely related to the displacement
of COM, which has been extensively used for postural balance assessments in several
185
studies [310]. Therefore, the proposed sensors will be used to predict the positions of
the COP and COM from the measured force and moment signals. By obtaining this
information, a biofeedback system based on vibrotactile actuators can be implemented
to give a reminding signal by way of vibrations to the wearer for postural adjustment
in order to prevent falls that are a result of poor balance. Furthermore, collaborative
experiments should be conducted to evaluate the eect of the overall system on a user;
this could include testing various biofeedback algorithms together with these sensors
as well as human factor aspects of wearing the sensors.
8.2.4 Assistive Device Feedback Integration
Assistive strategies such as wearable lower-limb exoskeletons represent one of the most
eective solutions for locomotion assistance and rehabilitation applications. Lower-limb
assistive devices are used to provide extra energy during daily bases locomotive
activities for the elderly and for people surng from muscle weakness and disabilities.
The single-joint exoskeleton is very practical and requires less complicated control
algorithms than the multi-jointed exoskeleton. Lower-limb rehabilitation devices
with single-joint assistance are classied under three types: hip [286, 311314],
knee [315319] and ankle exoskeletons [320323]. In the future work we aim to develop
a one degree-of-freedom knee assisting joint as a simplied exoskeleton system for
sit-to-stand and stand-to-sit tasks as well as to supply extra torque to help regain
normal gait pattern, adjust one' s posture and maintain balance.
A closed-loop feedback system using the proposed sensors instrumented into the
shoes will be developed. The total ground reaction force and moment information
measured by these sensors will be used to estimate the centre of pressure (COP) and
186

centre of mass (COM). As the positions of the COP and COM exceed a predened
range, an instantaneous feedback signal will be delivered to the controller which in turn
gives the appropriate command to the motors of the knee exoskeleton in order to help
the wearer recover the dened position of the COP/COM.
187
References
[1] O. Al-Mai, M. Ahmadi, and J. Albert, A compliant 3-axis ber-optic force sensor
for biomechanical measurement, IEEE Sensors Journal, vol. 17, no. 20, pp.
65496557, 2017.
[2] , Design, development and calibration of a lightweight, compliant six-axis
optical force/torque sensor, IEEE Sensors Journal, vol. 18, no. 17, pp.
70057014, 2018.
[3] S. Eng, O. Al-Mai, and M. Ahmadi, A 6 dof, wearable, compliant shoe sensor
for total ground reaction measurement, IEEE Transactions on Instrumentation
and Measurement, no. 99, pp. 19, 2018.
[4] O. Al-Mai, M. Ahmadi, and J. Albert, Fiber-optic based, force and torque
compliant sensing calibration strategies, International Conference on Control,
Dynamic Systems, and Robotics (CDSR), 2019, no. 144, p. 1, 2019.
[5] M. d. F. F. Domingues and A. Radwan, Optical Fiber Sensors for loT and Smart
Devices. Springer Publishing Company, Incorporated, 2017.
[6] P. Roriz, O. Frazão, A. B. Lobo-Ribeiro, J. L. Santos, and J. A. Simões, Review
of ber-optic pressure sensors for biomedical and biomechanical applications,
Journal of biomedical optics, vol. 18, no. 5, pp. 050 903050 903, 2013.
188
[7] W.-C. Wang, W. R. Ledoux, B. J. Sangeorzan, and P. G. Reinhall, A shear and
plantar pressure sensor based on ber-optic bend loss, Journal of rehabilitation
research and development, vol. 42, no. 3, p. 315, 2005.
[8] C.-Y. Huang, W.-J. Wu, S.-C. Fu, P. G. Reinhall, and W.-C. Wang, A wireless
composite optical bend loss sensor for pressure and shear measurement, in Health
Monitoring and Smart Nondestructive Evaluation of Structural and Biological
Systems V, vol. 6177. International Society for Optics and Photonics, 2006, p.
61770W.
[9] A. G. Leal-Junior, A. Frizera, L. M. Avellar, C. Marques, and M. J. Pontes,
Polymer optical ber for in-shoe monitoring of ground reaction forces during
the gait, IEEE Sensors Journal, vol. 18, no. 6, pp. 23622368, 2018.
[10] P. Polygerinos, L. D. Seneviratne, R. Razavi, T. Schaeter, and K. Althoefer,
Triaxial catheter-tip force sensor for mri-guided cardiac procedures,
IEEE/ASME Transactions on mechatronics, vol. 18, no. 1, pp. 386396, 2012.
[11] M. C. Yip, S. G. Yuen, and R. D. Howe, A robust uniaxial force sensor
for minimally invasive surgery, IEEE transactions on biomedical engineering,
vol. 57, no. 5, pp. 10081011, 2010.
[12] T. L. Bützer, M. D. Rinderknecht, G. H. Johannes, W. L. Popp, R. Lehner,
O. Lambercy, and R. Gassert, Design and evaluation of a ber-optic grip force
sensor with compliant 3d-printable structure for (f) mri applications, Journal of
Sensors, vol. 2016, 2016.
[13] J. Arata, S. Terakawa, J. Sulzer, R. Gassert, and H. Fujimoto, Mri-compatible
grasping force sensor with an inclined double parallel structure using ber optics,
189

Transactions of the Institute of Systems, Control and Information Engineers,
vol. 26, no. 3, pp. 110116, 2013.
[14] S. Crea, M. Donati, S. M. M. De Rossi, C. M. Oddo, and N. Vitiello, A wireless
exible sensorized insole for gait analysis, Sensors, vol. 14, no. 1, pp. 10731093,
2014.
[15] S. S. Yin and P. Run, Fiber optic sensors. Wiley Online Library, 2002.
[16] Y.-F. Zhang, C.-Y. Hong, R. Ahmed, and Z. Ahmed, A ber Bragg grating based
sensing platform fabricated by fused deposition modeling process for plantar
pressure measurement, Measurement, vol. 112, pp. 7479, 2017.
[17] T.-C. Liang, J.-J. Lin, and L.-Y. Guo, Plantar pressure detection with ber
Bragg gratings sensing system, Sensors, vol. 16, no. 10, p. 1766, 2016.
[18] A. V. Koulaxouzidis, V. C. Roberts, M. J. Holmes, and V. A. Handerek,
Development of a ber Bragg grating sensor for in-shoe shear stress
measurement: design and preliminary results, in Applications of Optical Fiber
Sensors, vol. 4074. International Society for Optics and Photonics, 2000, pp.
7989.
[19] R. Suresh and S. C. Tjin, Eects of dimensional and material parameters and
cross-coupling on FBG based shear force sensor, Sensors and Actuators A:
Physical, vol. 120, no. 1, pp. 2636, 2005.
[20] R. Suresh, S. C. Tjin, and S. Bhalla, Multi-component force measurement using
embedded ber Bragg grating, Optics & Laser Technology, vol. 41, no. 4, pp.
431440, 2009.
[21] Z. F. Zhang, X. M. Tao, H. P. Zhang, and B. Zhu, Soft ber optic sensors
190

for precision measurement of shear stress and pressure, IEEE Sensors Journal,
vol. 13, no. 5, pp. 14781482, 2013.
[22] M. F. Domingues, C. Tavares, C. Leitão, A. Frizera-Neto, N. Alberto,
C. Marques, A. Radwan, J. Rodriguez, O. Postolache, E. Rocon et al.,
Insole optical ber Bragg grating sensors network for dynamic vertical force
monitoring, Journal of Biomedical Optics, vol. 22, no. 9, pp. 091 507091 507,
2017.
[23] G. Voskerician, M. S. Shive, R. S. Shawgo, H. Von Recum, J. M. Anderson, M. J.
Cima, and R. Langer, Biocompatibility and biofouling of mems drug delivery
devices, Biomaterials, vol. 24, no. 11, pp. 19591967, 2003.
[24] A. G. Mignani and F. Baldini, Biomedical sensors using optical bres, Reports
on Progress in Physics, vol. 59, no. 1, p. 1, 1996.
[25] J.-J. Park and G.-S. Kim, Development of the 6-axis force/moment sensor for an
intelligent robot's gripper, Sensors and Actuators A: Physical, vol. 118, no. 1,
pp. 127134, 2005.
[26] T. Dwarakanath and G. Bhutani, Beam type hexapod structure based six
component forcetorque sensor, Mechatronics, vol. 21, no. 8, pp. 12791287,
2011.
[27] L. Schickl, K. Dorer, M. Wülker, and U. Hochberg, Development of a six-axis
force and torque sensor for the humanoid robot sweaty 2.0, in the 11th Workshop
on Humanoid Soccer Robots at 16th IEEE-RAS International Conference on
Humanoid Robots, Cancun, 2016.
[28] S. Hu, H. Wang, Y. Wang, and Z. Liu, Design of a novel six-axis wrist force
191

sensor, Sensors, vol. 18, no. 9, p. 3120, 2018.
[29] M. E. Ladd and H. H. Quick, Reduction of resonant rf heating in intravascular
catheters using coaxial chokes, Magnetic resonance in medicine, vol. 43, no. 4,
pp. 615619, 2000.
[30] W. Jin, Multiplexed FBG sensors and their applications, in International
Symposium on Photonics and Applications. International Society for Optics
and Photonics, 1999, pp. 468479.
[31] C.-S. Kim, T. H. Lee, Y. S. Yu, Y.-G. Han, S. B. Lee, and M. Y.
Jeong, Multi-point interrogation of FBG sensors using cascaded exible
wavelength-division sagnac loop lters, Optics express, vol. 14, no. 19, pp.
85468551, 2006.
[32] M. Davis and A. Kersey, Matched-lter interrogation technique for bre Bragg
grating arrays, Electronics letters, vol. 31, no. 10, pp. 822823, 1995.
[33] D. A. Jackson, L. Reekie, J. Archambault, and A. L. Ribeiro, Simple
multiplexing scheme for a ber-optic grating sensor network, Optics Letters,
vol. 18, no. 14, pp. 11921194, 1993.
[34] D. J. Cooper, T. Coroy, and P. W. Smith, Time-division multiplexing of large
serial ber-optic Bragg grating sensor arrays, Applied Optics, vol. 40, no. 16,
pp. 26432654, 2001.
[35] B. Dong, S. He, Y. Hushu, W. Tianda, F. Lvjun, T. Guo, and Q. Zhao,
Combined time-and wavelength-division-multiplexing demodulation technique
of ber grating sensor arrays using a tunable pulsed laser, Applied optics, vol. 46,
no. 7, pp. 10151018, 2007.
192

[36] S. C. Tjin, J. Hao, Y.-Z. Lam, Y. C. Ho, and B. K. Ng, A pressure sensor using
ber Bragg grating, Fiber & Integrated Optics, vol. 20, no. 1, pp. 5969, 2001.
[37] V. Mishra, N. Singh, U. Tiwari, and P. Kapur, Fiber grating sensors in medicine:
Current and emerging applications, Sensors and Actuators A: Physical, vol. 167,
no. 2, pp. 279290, 2011.
[38] A. Ungar, M. Rafanelli, I. Iacomelli, M. A. Brunetti, A. Ceccoglio, F. Tesi, and
N. Marchionni, Fall prevention in the elderly, Clinical Cases in mineral and
bone metabolism, vol. 10, no. 2, p. 91, 2013.
[39] M. O. Gu, M. Y. Jeon, H. J. Kim, and Y. Eun, A review of exercise interventions
for fall prevention in the elderly, Journal of Korean Academy of Nursing, vol. 35,
no. 6, pp. 11011112, 2005.
[40] K. Milisen, N. Staelens, R. Schwendimann, L. De Paepe, J. Verhaeghe, T. Braes,
S. Boonen, W. Pelemans, R. W. Kressig, and E. Dejaeger, Fall prediction in
inpatients by bedside nurses using the st. thomas's risk assessment tool in falling
elderly inpatients (stratify) instrument: a multicenter study, Journal of the
American Geriatrics Society, vol. 55, no. 5, pp. 725733, 2007.
[41] J. Swanenburg, E. D. de Bruin, D. Uebelhart, and T. Mulder, Falls prediction
in elderly people: a 1-year prospective study, Gait & posture, vol. 31, no. 3, pp.
317321, 2010.
[42] R. Cham and M. S. Redfern, Changes in gait when anticipating slippery oors,
Gait & posture, vol. 15, no. 2, pp. 159171, 2002.
[43] L. A. Lavery, K. R. Higgins, J. La Fontaine, R. G. Zamorano, G. P.
Constantinides, and P. J. Kim, Randomised clinical trial to compare total
193

contact casts, healing sandals and a shear-reducing removable boot to heal
diabetic foot ulcers, International wound journal, vol. 12, no. 6, pp. 710715,
2015.
[44] M. Yavuz, A. Ersen, J. Hartos, B. Schwarz, A. G. Garrett, L. A. Lavery, D. K.
Wukich, and L. S. Adams, Plantar shear stress in individuals with a history of
diabetic foot ulcer: an emerging predictive marker for foot ulceration, Diabetes
care, vol. 40, no. 2, pp. e14e15, 2017.
[45] D. G. Armstrong, A. J. Boulton, and S. A. Bus, Diabetic foot ulcers and their
recurrence, New England Journal of Medicine, vol. 376, no. 24, pp. 23672375,
2017.
[46] M. E. Fernando, R. G. Crowther, P. A. Lazzarini, K. S. Sangla, P. Buttner, and
J. Golledge, Gait parameters of people with diabetes-related neuropathic plantar
foot ulcers, Clinical Biomechanics, vol. 37, pp. 98107, 2016.
[47] M. Yavuz, American society of biomechanics clinical biomechanics award
2012: plantar shear stress distributions in diabetic patients with and without
neuropathy, Clinical biomechanics, vol. 29, no. 2, pp. 223229, 2014.
[48] P. G. Zarzar, Force sensing insole for a balance enhancement system, Ph.D.
dissertation, Carleton University Ottawa, 2014.
[49] M. Vukobratovi¢, H. M. Herr, B. Borovac, M. Rakovi¢, M. Popovic, A. Hofmann,
M. JOVANOVI, and V. Potkonjak, Biological principles of control selection
for a humanoid robot's dynamic balance preservation, International Journal of
Humanoid Robotics, vol. 5, no. 04, pp. 639678, 2008.
[50] L. E. C. Lizama, M. Pijnappels, N. P. Reeves, S. M. Verschueren, and J. H. van
194
Dieën, Centre of pressure or centre of mass feedback in mediolateral balance
assessment, Journal of biomechanics, vol. 48, no. 3, pp. 539543, 2015.
[51] K. Grattan and T. Sun, Fiber optic sensor technology: an overview, Sensors
and Actuators A: Physical, vol. 82, no. 1, pp. 4061, 2000.
[52] P. M. Tracey, Intrinsic ber-optic sensors, Industry Applications, IEEE
Transactions on, vol. 27, no. 1, pp. 9698, 1991.
[53] S.-K. Yao and C. K. Asawa, Fiber optical intensity sensors, Selected Areas in
Communications, IEEE Journal on, vol. 1, no. 3, pp. 562575, 1983.
[54] C. Batchellor and C. Edge, Some recent advances in bre-optic sensors,
Electronics & communication engineering journal, vol. 2, no. 5, pp. 175184,
1990.
[55] A. Marzuki, H. Novianto, W. Hidayat, and A. Setyawan, Intensity modulated
ber sensor conguration equipped with a variable ber optic attenuator, in
The Second International Conference on Technological Advances in Electrical,
Electronics and Computer Engineering (TAEECE2014). The Society of Digital
Information and Wireless Communication, 2014, pp. 205208.
[56] N. Rana, Application of force sensing resistor (fsr) in design of pressure
scanning system for plantar pressure measurement, in Computer and Electrical
Engineering, 2009. ICCEE'09. Second International Conference on, vol. 2.
IEEE, 2009, pp. 678685.
[57] F. Martínez-Martí, M. S. Martínez-García, S. G. García-Díaz, J. García-Jiménez,
A. J. Palma, and M. A. Carvajal, Embedded sensor insole for wireless
195

measurement of gait parameters, Australasian Physical & Engineering Sciences
in Medicine, vol. 37, no. 1, pp. 2535, 2014.
[58] M. Amjadi, M. S. Kim, and I. Park, Flexible and sensitive foot pad for sole
distributed force detection, in Nanotechnology (IEEE-NANO), 2014 IEEE 14th
International Conference on. IEEE, 2014, pp. 764767.
[59] W. Chen, Y. Xu, J. Wang, and J. Zhang, Kinematic analysis of human gait
based on wearable sensor system for gait rehabilitation, Journal of Medical and
Biological Engineering, vol. 36, no. 6, pp. 843856, 2016.
[60] L. Motha, J. Kim, and W. S. Kim, Instrumented rubber insole for plantar
pressure sensing, Organic Electronics, vol. 23, pp. 8286, 2015.
[61] K. F. Lei, K.-F. Lee, and M.-Y. Lee, Development of a exible pdms capacitive
pressure sensor for plantar pressure measurement, Microelectronic Engineering,
vol. 99, pp. 15, 2012.
[62] B. J. Mortimer, G. A. Zets, B. J. Altenbernd, and T. Goonetilleke, Development
of a planar shear sensor, in Engineering in Medicine and Biology Society
(EMBC), 2016 IEEE 38th Annual International Conference of the. IEEE, 2016,
pp. 20302033.
[63] X. Zhang, Y. Zhao, Z. Duan, and Y. Liu, Design and test of a soft plantar
force measurement system for gait detection, Sensors, vol. 12, no. 12, pp.
16 62816 640, 2012.
[64] C. S. Morère, . Sura»y«ski, A. R. Pérez-Tabernero, E. Vihriälä, and T. Myllylä,
Mems technology sensors as a more advantageous technique for measuring foot
plantar pressure and balance in humans, Journal of Sensors, vol. 2016, 2016.
196
[65] S. Rajala, S. Tuukkanen, and J. Halttunen, Characteristics of piezoelectric
polymer lm sensors with solution-processable graphene-based electrode
materials, IEEE Sensors Journal, vol. 15, no. 6, pp. 31023109, 2015.
[66] S. Rajala, T. Salpavaara, and S. Tuukkanen, Testing and comparing of lm-type
sensor materials in measurement of plantar pressure distribution, in Engineering
in Medicine and Biology Society (EMBC), 2016 IEEE 38th Annual International
Conference of the. IEEE, 2016, pp. 251254.
[67] S. Rajala, M. Vuoriluoto, O. J. Rojas, S. Franssila, and S. Tuukkanen,
Piezoelectric sensitivity measurements of cellulose nanobril sensors, Proc. XXI
IMEKO World Congr., Prague, Czech Republic, 2015.
[68] J. W. Sohn, J. Jeon, and S.-B. Choi, An investigation on dynamic signals of mfc
and pvdf sensors: Experimental work, Advances in Mechanical Engineering,
vol. 5, p. 420345, 2013.
[69] E. Klimiec, K. Zaraska, J. Piekarski, P. Guzdek, G. Koªaszczy«ski, and
B. Jasiewicz, Durable sensors for measurement of foot plantar pressure with
piezoelectric polyvinylidene uoride foil, Sensors and Actuators A: Physical,
vol. 247, pp. 504513, 2016.
[70] P. Cosseddu, F. Viola, S. Lai, L. Rao, and A. Bonglio, A temperature
transducer based on a low-voltage organic thin-lm transistor detecting
pyroelectric eect, IEEE Electron Device Letters, vol. 35, no. 12, pp. 12961298,
2014.
[71] S. R. Anton and H. A. Sodano, A review of power harvesting using piezoelectric
materials (20032006), Smart materials and Structures, vol. 16, no. 3, p. R1,
197

2007.
[72] T. Patra, A simple ber optic displacement sensor for measurement of light
intensity with the displacement, International Journal of Latest Trends in
Engineering and Technology (IJLTET)l, vol. 2, pp. 161165, 2013.
[73] D. A. Krohn, Intensity modulated ber optic sensors overview, in Cambridge
Symposium-Fiber/LASE'86. International Society for Optics and Photonics,
1987, pp. 211.
[74] P. Roriz, A. Ramos, J. L. Santos, and J. A. Simões, Fiber optic
intensity-modulated sensors: A review in biomechanics, Photonic Sensors,
vol. 2, no. 4, pp. 315330, 2012.
[75] S. Silvestri and E. Schena, Optical-ber measurement systems for medical
applications. Citeseer, 2011.
[76] D. J. Margolis, J. Knauss, W. Bilker, and M. Baumgarten, Medical conditions as
risk factors for pressure ulcers in an outpatient setting, Age and ageing, vol. 32,
no. 3, pp. 259264, 2003.
[77] M. M. Rodgers, Dynamic biomechanics of the normal foot and ankle during
walking and running, Physical Therapy, vol. 68, no. 12, pp. 18221830, 1988.
[Online]. Available: http://ptjournal.apta.org/content/68/12/1822
[78] E. S. Sazonov, G. Fulk, J. Hill, Y. Schütz, and R. Browning, Monitoring of
posture allocations and activities by a shoe-based wearable sensor, Biomedical
Engineering, IEEE Transactions on, vol. 58, no. 4, pp. 983990, 2011.
[79] P. Bonato et al., Wearable sensors/systems and their impact on biomedical
198

engineering, IEEE Engineering in Medicine and Biology Magazine, vol. 22, no. 3,
pp. 1820, 2003.
[80] Y. Feng, Y. Ge, and Q. Song, A human identication method based on dynamic
plantar pressure distribution, in Information and Automation (ICIA), 2011
IEEE International Conference on. IEEE, 2011, pp. 329332.
[81] F. Neaga, D. Moga, D. Petreus, M. Munteanu, and N. Stroia, A wireless
system for monitoring the progressive loading of lower limb in post-traumatic
rehabilitation, in International Conference on Advancements of Medicine and
Health Care through Technology. Springer, 2011, pp. 5459.
[82] C. Wada, Y. Sugimura, T. Ienaga, Y. Kimuro, F. Wada, K. Hachisuka, and
T. Tsuji, Development of a rehabilitation support system with a shoe-type
measurement device for walking, in SICE Annual Conference 2010, Proceedings
of. IEEE, 2010, pp. 25342537.
[83] A. Gefen, Pressure-sensing devices for assessment of soft tissue loading under
bony prominences: technological concepts and clinical utilization. Wounds: a
compendium of clinical research and practice, vol. 19, no. 12, pp. 350362, 2007.
[84] K. Kim, B. Floyd, J. Mehta, H. Yoon, C.-M. Hung, D. Bravo, T. Dickson,
X. Guo, R. Li, N. Trichy et al., The feasibility of on-chip interconnection using
antennas, in Proceedings of the 2005 IEEE/ACM International conference on
Computer-aided design. IEEE Computer Society, 2005, pp. 979984.
[85] V. Karam, P. H. Popplewell, A. Shamim, J. Rogers, and C. Plett, A 6.3 ghz bfsk
transmitter with on-chip antenna for self-powered medical sensor applications,
in 2007 IEEE Radio Frequency Integrated Circuits (RFIC) Symposium. IEEE,
199

2007, pp. 101104.
[86] W.-C. Wang, J. Dee, W. Ledoux, B. Sangeorzan, and P. Reinhall, Development
of a directional sensitive pressure and shear sensor, in Proc. SPIE, vol. 4702,
2002, pp. 212220.
[87] Y. Otsuka, Y. Koyama, and K. Watanabe, Monitoring of plantar pressure in
gait based on hetero-core optical ber sensor, Procedia Engineering, vol. 87, pp.
14651468, 2014.
[88] C.-Y. Huang, W.-C. Wang, W.-J. Wu, and W. R. Ledoux, Composite optical
bend loss sensor for pressure and shear measurement, IEEE Sensors Journal,
vol. 7, no. 11, pp. 15541565, 2007.
[89] E. Pinet and C. Hamel, True challenges of disposable optical ber sensors for
clinical environment, in Third European Workshop on Optical Fibre Sensors,
vol. 6619. International Society for Optics and Photonics, 2007, p. 66191Q.
[90] R. Munoz, L. Leija, F. Diaz, and J. Alvarez, 3d continuous monitoring system
for localization of upper limb based on optical ber, in Engineering in Medicine
and Biology Society, 1995., IEEE 17th Annual Conference, vol. 2. IEEE, 1995,
pp. 15951596.
[91] Y. Li, K. Guan, and Z. Hu, Fiber optic displacement measurement model based
on nite reective surface, Optics & Laser Technology, vol. 84, pp. 3239, 2016.
[92] D. H. A. Munap, N. Bidin, S. Islam, M. Abdullah, F. M. Marsin, and M. Yasin,
Fiber optic displacement sensor for industrial applications, IEEE Sensors
Journal, vol. 15, no. 9, pp. 48824887, 2015.
[93] P. Polygerinos, L. D. Seneviratne, R. Razavi, T. Schaeter, and K. Althoefer,
200
Triaxial catheter-tip force sensor for mri-guided cardiac procedures,
IEEE/ASME Transactions on mechatronics, vol. 18, no. 1, pp. 386396, 2013.
[94] J. F. Schenck, The role of magnetic susceptibility in magnetic resonance imaging:
Mri magnetic compatibility of the rst and second kinds, Medical physics,
vol. 23, no. 6, pp. 815850, 1996.
[95] S. De Rossi, T. Lenzi, N. Vitiello, M. Donati, A. Persichetti, F. Giovacchini,
F. Vecchi, and M. Carrozza, Development of an in-shoe pressure-sensitive device
for gait analysis, in Engineering in Medicine and Biology Society, EMBC, 2011
Annual International Conference of the IEEE. IEEE, 2011, pp. 56375640.
[96] H. Jiang, J. Chen, and T. Liu, Multi-objective design of an FBG sensor
network using an improved strength pareto evolutionary algorithm, Sensors and
Actuators A: Physical, vol. 220, pp. 230236, 2014.
[97] Y. B. Lin, K. C. Chang, J. C. Chern, and L. A. Wang, Packaging methods of
ber-Bragg grating sensors in civil structure applications, IEEE Sensors journal,
vol. 5, no. 3, pp. 419424, 2005.
[98] L. Xiong, D. Zhang, L. Li, and Y. Guo, Efpi-FBG hybrid sensor for simultaneous
measurement of high temperature and large strain, Chinese Optics Letters,
vol. 12, no. 12, pp. 120 605120 605, 2014.
[99] N. J. van de Berg, J. Dankelman, and J. J. van den Dobbelsteen, Design of an
actively controlled steerable needle with tendon actuation and FBG-based shape
sensing, Medical engineering & physics, vol. 37, no. 6, pp. 617622, 2015.
[100] X.-X. Li, W.-X. Ren, and K.-M. Bi, FBG force-testing ring for bridge cable force
201

monitoring and temperature compensation, Sensors and Actuators A: Physical,
vol. 223, pp. 105113, 2015.
[101] T. Li, Y. Tan, Y. Liu, Y. Qu, M. Liu, and Z. Zhou, A ber Bragg grating sensing
based triaxial vibration sensor, Sensors, vol. 15, no. 9, pp. 24 21424 229, 2015.
[102] J.-a. Chen, D. Huang, H.-t. Zhao, Q.-b. Wang, Y. Qiu, and D.-p. Duan, Fiber
Bragg grating-based plane strain monitoring of aerostat envelope structures,
Applied optics, vol. 52, no. 19, pp. 46314639, 2013.
[103] G. Meltz, W. W. Morey, and W. H. Glenn, Formation of Bragg
gratings in optical bers by a transverse holographic method, Opt.
Lett., vol. 14, no. 15, pp. 823825, Aug 1989. [Online]. Available:
http://ol.osa.org/abstract.cfm?URI=ol-14-15-823
[104] N. Singh, S. C. Jain, A. Aggarwal, and R. Bajpai, Fibre Bragg grating writing
using phase mask technology, 2005.
[105] G. Meltz, W. Morey, and W. Glenn, Formation of Bragg gratings in optical
bers by a transverse holographic method, Optics letters, vol. 14, no. 15, pp.
823825, 1989.
[106] J. Cheng, W. Zhu, Z. Huang, and P. Hu, Experimental and simulation study
on thermal gas owmeter based on ber Bragg grating coated with silver lm,
Sensors and Actuators A: Physical, vol. 228, pp. 2327, 2015.
[107] A. Bertholds and R. Dandliker, Determination of the individual strain-optic
coecients in single-mode optical bres, Journal of lightwave technology, vol. 6,
no. 1, pp. 1720, 1988.
[108] S. James, M. Dockney, and R. Tatam, Simultaneous independent temperature
202

and strain measurement using in-bre Bragg grating sensors, Electronics Letters,
vol. 32, no. 12, pp. 11331134, 1996.
[109] Y.-J. Rao, In-bre Bragg grating sensors, Measurement science and technology,
vol. 8, no. 4, p. 355, 1997.
[110] G. T. Kanellos, G. Papaioannou, D. Tsiokos, C. Mitrogiannis, G. Nianios, and
N. Pleros, Two dimensional polymer-embedded quasi-distributed FBG pressure
sensor for biomedical applications, Optics express, vol. 18, no. 1, pp. 179186,
2010.
[111] M. R. A. Hassan, M. H. A. Bakar, K. Dambul, and F. R. M. Adikan,
Optical-based sensors for monitoring corrosion of reinforcement rebar via an
etched cladding Bragg grating, Sensors, vol. 12, no. 11, pp. 15 82015 826, 2012.
[112] A. G. Prasad, S. Omkar, H. Vikranth, V. Anil, K. Chethana, and S. Asokan,
Design and development of ber Bragg grating sensing plate for plantar strain
measurement and postural stability analysis, Measurement, vol. 47, pp. 789793,
2014.
[113] M. Nishiyama, H. Sasaki, and K. Watanabe, Performance characteristics of
wearable embedded hetero-core ber sensors for unconstrained motion analyses,
Transactions of the Society of Instrument and Control Engineers, vol. 43, no. 12,
pp. 10751081, 2007.
[114] G. T. Kanellos, D. Tsiokos, N. Pleros, P. Childs, and S. Pissadakis, Enhanced
durability FBG-based sensor pads for biomedical applications as human-machine
interface surfaces, in BioPhotonics, 2011 International Workshop on. IEEE,
2011, pp. 13.
203
[115] A. Üneri, M. A. Balicki, J. Handa, P. Gehlbach, R. H. Taylor, and I. Iordachita,
New steady-hand eye robot with micro-force sensing for vitreoretinal surgery,
in Biomedical Robotics and Biomechatronics (BioRob), 2010 3rd IEEE RAS and
EMBS International Conference on. IEEE, 2010, pp. 814819.
[116] Y. Jung, M. Jung, K. Lee, and S. Koo, Ground reaction force estimation using
an insole-type pressure mat and joint kinematics during walking, Journal of
biomechanics, vol. 47, no. 11, pp. 26932699, 2014.
[117] E. S. Sazonov, T. Bumpus, S. Zeigler, and S. Marocco, Classication of
plantar pressure and heel acceleration patterns using neural networks, in
Neural Networks, 2005. IJCNN'05. Proceedings. 2005 IEEE International Joint
Conference on, vol. 5. IEEE, 2005, pp. 30073010.
[118] J. Hao, K. Tan, S. Tjin, C. Liaw, P. R. Chaudhuri, X. Guo, and C. Lu, Design of a
foot-pressure monitoring transducer for diabetic patients based on FBG sensors,
in Lasers and Electro-Optics Society, 2003. LEOS 2003. The 16th Annual Meeting
of the IEEE, vol. 1. IEEE, 2003, pp. 2324.
[119] R. Suresh, S. Bhalla, S. C. Tjin, and J. Hao, Plantar stress monitoring using
ber Bragg grating sensors.
[120] R. Suresh, S. Tjin, and N. Ngo, Shear force sensing by strain transformation
using non-rectilinearly embedded ber Bragg grating, Sensors and Actuators A:
Physical, vol. 116, no. 1, pp. 107118, 2004.
[121] S. Tjin, R. Suresh, and N. Ngo, Fiber Bragg grating based shear-force sensor:
Modeling and testing, Journal of lightwave technology, vol. 22, no. 7, pp.
17281733, 2004.
204

[122] M. F. Domingues, C. Tavares, N. Alberto, C. Leitao, P. Antunes, P. Andre,
E. R. de Lima, V. Sucasas, A. Radwan, and J. Rodriguez, Non-invasive insole
optical ber sensor architecture for monitoring foot anomalies, in GLOBECOM
2017-2017 IEEE Global Communications Conference. IEEE, 2017, pp. 16.
[123] D. Vilarinho, A. Theodosiou, M. F. Domingues, P. F. da Costa Antunes, K. Kalli,
P. S. André, and C. A. Marques, Foot plantar pressure monitoring with cytop
Bragg gratings sensing system. in BIODEVICES, 2018, pp. 2529.
[124] M. F. Domingues, N. Alberto, C. Leitão, C. Tavares, E. R. de Lima, A. Radwan,
V. Sucasas, J. Rodriguez, P. André, and P. Antunes, Insole optical ber
sensor architecturefor remote gait analysis-an ehealth solution, IEEE Internet
of Things Journal, 2017.
[125] E. Weir and L. Culmer, Fall prevention in the elderly population, Canadian
Medical Association Journal, vol. 171, no. 7, pp. 724724, 2004.
[126] P. Kannus, H. Sievänen, M. Palvanen, T. Järvinen, and J. Parkkari, Prevention
of falls and consequent injuries in elderly people, The Lancet, vol. 366, no. 9500,
pp. 18851893, 2005.
[127] L.-J. Lin, F.-T. Chiou, and H. H. Cohen, Slip and fall accident prevention: A
review of research, practice, and regulations, Journal of safety research, vol. 26,
no. 4, pp. 203212, 1996.
[128] S. Sadigh, A. Reimers, R. Andersson, and L. Laamme, Falls and fall-related
injuries among the elderly: a survey of residential-care facilities in a swedish
municipality, Journal of community health, vol. 29, no. 2, pp. 129140, 2004.
[129] S. Jiang, B. Zhang, and D. Wei, The elderly fall risk assessment and prediction
205

based on gait analysis, in Computer and Information Technology (CIT), 2011
IEEE 11th International Conference on. IEEE, 2011, pp. 176180.
[130] R. Hosein and M. Lord, A study of in-shoe plantar shear in normals, Clinical
biomechanics, vol. 15, no. 1, pp. 4653, 2000.
[131] P. R. Cavanagh, J. S. Ulbrecht, and G. M. Caputo, New developments in the
biomechanics of the diabetic foot. Diabetes/metabolism research and reviews,
vol. 16, pp. S6S10, 1999.
[132] M. Yavuz, G. Botek, and B. L. Davis, Plantar shear stress distributions:
Comparing actual and predicted frictional forces at the footground interface,
Journal of biomechanics, vol. 40, no. 13, pp. 30453049, 2007.
[133] J. Apelqvist and J. Larsson, What is the most eective way to reduce incidence
of amputation in the diabetic foot? Diabetes/metabolism research and reviews,
vol. 16, no. S1, pp. S75S83, 2000.
[134] J. E. Perry, J. O. Hall, and B. L. Davis, Simultaneous measurement of plantar
pressure and shear forces in diabetic individuals, Gait & posture, vol. 15, no. 1,
pp. 101107, 2002.
[135] X. Hu, J. Zhao, Y. Li, Y. He, and X. Qu, A low cost instrumented insole to
measure the center of pressure during standing, in International Conference on
Mechatronics and Intelligent Robotics. Springer, 2017, pp. 293298.
[136] S. W. Park, P. S. Das, and J. Y. Park, Development of wearable and exible
insole type capacitive pressure sensor for continuous gait signal analysis, Organic
Electronics, vol. 53, pp. 213220, 2018.
[137] B. Nie, R. Huang, T. Yao, Y. Zhang, Y. Miao, C. Liu, J. Liu, and X. Chen,
206
Textile-based wireless pressure sensor array for human-interactive sensing,
Advanced Functional Materials, p. 1808786, 2019.
[138] S. Stassi, G. Canavese, V. Cauda, C. Fallauto, S. Corbellini, P. Motto,
D. Demarchi, and C. F. Pirri, Wearable and exible pedobarographic insole
for continuous pressure monitoring, in SENSORS, 2013 IEEE. IEEE, 2013,
pp. 14.
[139] G. Zhu, P. Bai, J. Chen, and Z. L. Wang, Power-generating shoe insole based
on triboelectric nanogenerators for self-powered consumer electronics, Nano
Energy, vol. 2, no. 5, pp. 688692, 2013.
[140] F. Baptista, D. Budoya, V. Almeida, and J. Ulson, An experimental study on
the eect of temperature on piezoelectric sensors for impedance-based structural
health monitoring, Sensors, vol. 14, no. 1, pp. 12081227, 2014.
[141] C.-S. Liu, G. CHOU, X. Liang, P. G. Reinhall, and W.-C. Wang, Design of a
multi-layered optical bend loss sensor for pressure and shear sensing, in Proc.
of SPIE Vol, vol. 6532, 2007, pp. 65 321P1.
[142] W. Soetanto, N. T. Nguyen, andW.-C. Wang, Fiber optic plantar pressure/shear
sensor, in Proc. SPIE, vol. 7984, 2011, p. 79840Z.
[143] C.-T. Changf, C. shih Liue, W. Soetantoc, and W.-C. Wanga, A platform based
foot pressure/shear sensor, in Proc. of SPIE Vol, vol. 8348, 2012, pp. 83 481U1.
[144] S. Pirozzi, Multi-point force sensor based on crossed optical bers, Sensors and
Actuators A: Physical, vol. 183, pp. 110, 2012.
[145] J.-C. Kim, J. Lee, K.-S. Kim, and S. Kim, A tri-axial force sensor based on light
207

intensity modulation for detecting ground reaction force, in Robotics (ISR), 2013
44th International Symposium on. IEEE, 2013, pp. 15.
[146] B. Naja, H. Mohseni, G. S. Grewal, T. K. Talal, R. A. Menzies, and D. G.
Armstrong, An optical-ber-based smart textile (smart socks) to manage
biomechanical risk factors associated with diabetic foot amputation, Journal
of Diabetes Science and Technology, pp. 668677, 2017.
[147] R. Suresh, S. Bhalla, J. Hao, and C. Singh, Development of a high resolution
plantar pressure monitoring pad based on ber Bragg grating (FBG) sensors,
Technology and Health Care, vol. 23, no. 6, pp. 785794, 2015.
[148] S. De Rossi, N. Vitiello, T. Lenzi, R. Ronsse, B. Koopman, A. Persichetti,
F. Giovacchini, F. Vecchi, A. Ijspeert, H. van der Kooij et al., Soft articial tactile
sensors for the measurement of human-robot interaction in the rehabilitation of
the lower limb, in Engineering in Medicine and Biology Society (EMBC), 2010
Annual International Conference of the IEEE. IEEE, 2010, pp. 12791282.
[149] A. Tar and G. Cserey, Development of a low cost 3d optical compliant tactile
force sensor, in Advanced Intelligent Mechatronics (AIM), 2011 IEEE/ASME
International Conference on. IEEE, 2011, pp. 236240.
[150] G. De Maria, C. Natale, and S. Pirozzi, Force/tactile sensor for robotic
applications, Sensors and Actuators A: Physical, vol. 175, pp. 6072, 2012.
[151] Y. Yamada, T. Morizono, Y. Umetani, and H. Takahashi, Highly soft viscoelastic
robot skin with a contact object-location-sensing capability, IEEE Transactions
on Industrial electronics, vol. 52, no. 4, pp. 960968, 2005.
[152] C. Melchiorri, L. Moriello, G. Palli, and U. Scarcia, A new force/torque sensor
208

for robotic applications based on optoelectronic components, in Robotics and
Automation (ICRA), 2014 IEEE International Conference on. IEEE, 2014, pp.
64086413.
[153] C. Miyata, K. Chisholm, J. Baba, and M. Ahmadi, A limb compliant
sensing strategy for robot collision reaction, IEEE/ASME Transactions on
Mechatronics, vol. 21, no. 2, pp. 674682, 2016.
[154] S. Wattanasarn, K. Noda, K. Matsumoto, and I. Shimoyama, 3d exible
tactile sensor using electromagnetic induction coils, in Micro Electro Mechanical
Systems (MEMS), 2012 IEEE 25th International Conference on. IEEE, 2012,
pp. 488491.
[155] L. Shu, T. Hua, Y. Wang, Q. Li, D. D. Feng, and X. Tao, In-shoe plantar pressure
measurement and analysis system based on fabric pressure sensing array, IEEE
Transactions on Information Technology in Biomedicine, vol. 14, no. 3, pp.
767775, 2010.
[156] D. S. Chathuranga, Z. Wang, Y. Noh, T. Nanayakkara, and S. Hirai, Disposable
soft 3 axis force sensor for biomedical applications, in Engineering in Medicine
and Biology Society (EMBC), 2015 37th Annual International Conference of the
IEEE. IEEE, 2015, pp. 55215524.
[157] D. Hong, C. Li, and J. Jeong, A crosstalk compensation of a multi-axis
forcetorque sensor based on the least squares method using labview, in
Computational and Information Sciences (ICCIS), 2012 Fourth International
Conference on. IEEE, 2012, pp. 11271130.
[158] W. Zhang, K. B. Lua, K. A. S. Van Tien Truong, K. A. Senthil, T. T. Lim, K. S.
209

Yeo, and G. Zhou, Design and characterization of a novel t-shaped multi-axis
piezoresistive force/moment sensor, IEEE Sensors Journal, vol. 16, no. 11, pp.
41984210, 2016.
[159] Y. Sun, Y. Liu, T. Zou, M. Jin, and H. Liu, Design and optimization of a novel
six-axis force/torque sensor for space robot, Measurement, vol. 65, pp. 135148,
2015.
[160] Y. Zhu, Distillation column identication for control using wiener model, in
American Control Conference, 1999. Proceedings of the 1999, vol. 5. IEEE,
1999, pp. 34623466.
[161] N. Patcharaprakiti, K. Kirtikara, D. Chenvidhya, V. Monyakul, and
B. Muenpinij, Modeling of single phase inverter of photovoltaic system using
system identication, in Computer and Network Technology (ICCNT), 2010
Second International Conference on. IEEE, 2010, pp. 462466.
[162] R. Abbasi-Asl, R. Khorsandi, and B. Vosooghi-Vahdat, Hammerstein-wiener
model: A new approach to the estimation of formal neural information, Basic
and Clinical Neuroscience, vol. 3, no. 4, pp. 4551, 2012.
[163] S. I. Biagiola and J. L. Figueroa, Wiener and Hammerstein uncertain models
identication, Mathematics and Computers in Simulation, vol. 79, no. 11, pp.
32963313, 2009.
[164] P. Kumar, C. Potluri, A. Sebastian, S. Chiu, A. Urfer, D. S. Naidu, and M. P.
Schoen, An adaptive multi sensor data fusion with hybrid nonlinear arx and
wiener-hammerstein models for skeletal muscle force estimation, in The 14th
World Scientic and Engineering Academy and Society (WSEAS) International
210
Conference on Systems, Corfu Island, Greece, 2010.
[165] D. Prudham and J. G. Evans, Factors associated with falls in the elderly: A
community study, Age and Ageing, vol. 10, no. 3, pp. 141146, 1981. [Online].
Available: +http://dx.doi.org/10.1093/ageing/10.3.141
[166] M. Tinetti, M. Speechley, and S. Ginter, Risk factors for falls among
elderly persons living in the community, New England Journal of Medicine,
vol. 319, no. 26, pp. 17011707, 1988, pMID: 3205267. [Online]. Available:
http://dx.doi.org/10.1056/NEJM198812293192604
[167] E. R. Burns, J. A. Stevens, and R. Lee, The direct costs of fatal and non-fatal
falls among older adultsâunited states, Journal of safety research, vol. 58, pp.
99103, 2016.
[168] S. R. Lord and D. L. Sturnieks, The physiology of falling: assessment and
prevention strategies for older people, Journal of science and medicine in sport,
vol. 8, no. 1, pp. 3542, 2005.
[169] J. Sinclair, S. J. Hobbs, P. J. Taylor, G. Currigan, and A. Greenhalgh, The
inuence of dierent force and pressure measuring transducers on lower extremity
kinematics measured during running, Journal of Applied Biomechanics, vol. 30,
no. 1, pp. 166172, 2014.
[170] T. R. Han, N. J. Paik, and M. S. Im, Quantication of the path of center of
pressure (cop) using an f-scan in-shoe transducer, Gait and Posture, vol. 10, pp.
243254, 1999.
[171] M. Munoz-Organero, J. Parker, L. Powell, and S. Mawson, Assessing walking
211
strategies using insole pressure sensors for stroke survivors, Sensors, vol. 16,
no. 10, 2016.
[172] P. Catalfamo, D. Moser, S. Ghoussayni, and D. Ewins, Detection of gait events
using an f-scan in-shoe pressure measurement system, Gait & posture, vol. 28,
no. 3, pp. 420426, 2008.
[173] E. Klimiec, B. Jasiewicz, J. Piekarski, K. Zaraska, P. Guzdek, and
G. KoÅaszczyÅski, Measuring of foot plantar pressureâpossible
applications in quantitative analysis of human body mobility, Measurement
Science and Technology, vol. 28, no. 5, p. 054008, 2017. [Online]. Available:
http://stacks.iop.org/0957-0233/28/i=5/a=054008
[174] B. Saggin, D. Scaccabarozzi, and M. Tarabini, Metrological performances of a
plantar pressure measurement system, IEEE Transactions on Instrumentation
and Measurement, vol. 62, no. 4, pp. 766776, 2013.
[175] Y.-F. Zhang, C.-Y. Hong, R. Ahmed, and Z. Ahmed, A ber Bragg
grating based sensing platform fabricated by fused deposition modeling process
for plantar pressure measurement, Measurement, vol. 112, pp. 74 79,
2017. [Online]. Available: http://www.sciencedirect.com/science/article/pii/
S0263224117305225
[176] D. T.-P. Fong, Y.-Y. Chan, Y. Hong, P. S.-H. Yung, K.-Y. Fung, and K.-M.
Chan, Estimating the complete ground reaction forces with pressure insoles in
walking, Journal of Biomechanics, vol. 41, pp. 25972601, 2008.
[177] H. Rouhani, J. Favre, X. Crevoisier, and K. Aminian, Ambulatory assessment of
3d ground reaction force using plantar pressure distribution, Gait and Posture,
212
vol. 32, pp. 311316, 2010.
[178] P. H. Veltink, C. Liedtke, E. Droog, and H. van der Kooij, Ambulatory
measurement of ground reaction forces, IEEE Trans. Neural Syst. Rehabil. Eng.,
vol. 13, no. 3, Sep 2005.
[179] T. Liu, Y. Inoue, and K. Shibata, Wearable force sensor with parallel structure
for measurement of ground-reaction force, Measurement, vol. 40, no. 6, pp. 644
653, 2007. [Online]. Available: http://www.sciencedirect.com/science/article/
pii/S0263224106001692
[180] O. Al-Mai, M. Ahmadi, and J. Albert, A compliant 3-axis ber-optic force sensor
for biomechanical measurement, IEEE Sensors Journal, Sep 2017.
[181] T. Liu, Y. Inoue, K. Shibata, and K. Shiojima, A mobile force plate and
three-dimensional motion analysis system for three-dimensional gait assessment,
IEEE Sensors Journal, vol. 12, no. 5, pp. 14611467, 2012.
[182] T. Liu, Y. Inoue, and K. Shibata, A wearable ground reaction force
sensor system and its application to the measurement of extrinsic gait
variability, Sensors, vol. 10, no. 11, pp. 10 24010 255, 2010. [Online]. Available:
http://www.mdpi.com/1424-8220/10/11/10240
[183] Z. Li, Y.-Y. Liang, L. Wang, J. Sheng, and S.-J. Ma, Reliability and validity of
center of pressure measures for balance assessment in older adults, Journal of
Physical Therapy Science, vol. 28, no. 4, 2016.
[184] L. E. C. Lizama, M. Pijnappels, N. P. Reeves, S. M. Verschueren, and J. H. van
Dieën, Centre of pressure or centre of mass feedback in mediolateral balance
assessment, Journal of biomechanics, vol. 48, no. 3, pp. 539543, 2015.
213

[185] T. Liu, Y. Inoue, and K. Shibata, A wearable force plate system for the
continuous measurement of triaxial ground reaction force in biomechanical
applications, Measurement Science and Technology, vol. 21, no. 8, p. 085804,
2010. [Online]. Available: http://stacks.iop.org/0957-0233/21/i=8/a=085804
[186] T.-F. Lu, G. C. I. Lin, and J. R. He, Neural-network-based 3d force/torque sensor
calibration for robot applications, Engng Applic. Artif Intell., no. 1, 1997.
[187] J. F. Portoles and P. J. Cumpson, A compact torsional reference device for easy,
accurate and traceable AFM piconewton calibration, Nanotechnology, vol. 24,
no. 33, 2013.
[188] Y. Zheng, L. Song, G. Hu, X. Cai, H. Liu, J. Ma, M. Zhao, and F. Fang, The
multi-position calibration of the stiness for atomic-force microscope cantilevers
based on vibration, Measurement Science and Technology, vol. 26, no. 5, 2015.
[189] D. Diddens, D. Reynaerts, and H. Van Brussel, Design of a ring-shaped
three-axis micro force/torque sensor, Sensors and Actuators A: Physical, vol. 46,
no. 1-3, pp. 225232, 1995.
[190] U. Seibold, B. Kubler, and G. Hirzinger, Prototype of instrument for minimally
invasive surgery with 6-axis force sensing capability, in Robotics and Automation,
2005. ICRA 2005. Proceedings of the 2005 IEEE International Conference on.
IEEE, 2005, pp. 496501.
[191] S. C. Mannsfeld, B. C. Tee, R. M. Stoltenberg, C. V. H. Chen, S. Barman, B. V.
Muir, A. N. Sokolov, C. Reese, and Z. Bao, Highly sensitive exible pressure
sensors with microstructured rubber dielectric layers, Nature materials, vol. 9,
no. 10, pp. 859864, 2010.
214

[192] C. Jacq, B. Lüthi, T. Maeder, O. Lambercy, R. Gassert, and P. Ryser, Thick-lm
multi-dof force/torque sensor for wrist rehabilitation, Sensors and Actuators A:
Physical, vol. 162, no. 2, pp. 361366, 2010.
[193] G.-S. Kim, H.-M. Kim, H.-I. Kim, M.-G. Pio, H.-S. Shin, and J. Yoon,
Development of 6-axis force/moment sensor for measuring the ngers' muscular
strength of human, in Industrial Electronics (ISIE), 2010 IEEE International
Symposium on. IEEE, 2010, pp. 428433.
[194] G.-S. Kim, H.-J. Shin, and J. Yoon, Development of six-axis force/moment
sensor for an intelligent foot of humanoid robot, in Control, Automation and
Systems, 2007. ICCAS'07. International Conference on. IEEE, 2007, pp.
23792384.
[195] A. Valizadeh, A. Akbarzadeh, and M. H. T. Heravi, Eect of structural design
parameters of a six-axis force/torque sensor using full factorial design, in
Robotics and Mechatronics (ICROM), 2015 3rd RSI International Conference
on. IEEE, 2015, pp. 789793.
[196] Y. Sun, Y. Liu, M. Jin, and H. Liu, Design of a novel six-axis force/torque
sensor based on strain gauges by nite element method, in Intelligent Control
and Automation (WCICA), 2014 11th World Congress on. IEEE, 2014, pp.
33873392.
[197] T. Mukai, S. Hirano, and Y. Kato, Fast and accurate tactile sensor system for a
human-interactive robot, in Sensors: Focus on Tactile Force and Stress Sensors.
InTech, 2008.
[198] Y. Wang, G. Zuo, X. Chen, and L. Liu, Strain analysis of six-axis force/torque
215

sensors based on analytical method, IEEE Sensors Journal, vol. 17, no. 14, pp.
43944404, 2017.
[199] Q. Liang, D. Zhang, Q. Song, Y. Ge, H. Cao, and Y. Ge, Design and fabrication
of a six-dimensional wrist force/torque sensor based on e-type membranes
compared to cross beams, Measurement, vol. 43, no. 10, pp. 17021719, 2010.
[200] M.-K. Kang, S. Lee, and J.-H. Kim, Shape optimization of a mechanically
decoupled six-axis force/torque sensor, Sensors and Actuators A: Physical, vol.
209, pp. 4151, 2014.
[201] Y. Sun, Y. Liu, M. Jin, and H. Liu, Design and optimization of a novel six-axis
force/torque sensor with good isotropy and high sensitivity, in 2013 IEEE
International Conference on Robotics and Biomimetics (ROBIO). IEEE, 2013,
pp. 631638.
[202] P. H. Veltink, C. Liedtke, E. Droog, and H. van der Kooij, Ambulatory
measurement of ground reaction forces, IEEE Transactions on Neural Systems
and Rehabilitation Engineering, vol. 13, no. 3, pp. 423427, 2005.
[203] H. M. Schepers, E. H. Van Asseldonk, J. H. Buurke, and P. H. Veltink,
Ambulatory estimation of center of mass displacement during walking, IEEE
Transactions on Biomedical Engineering, vol. 56, no. 4, pp. 11891195, 2009.
[204] S. Somlor, A. Schmitz, R. Hartanto, and S. Sugano, A prototype force sensing
unit for a capacitive-type force-torque sensor, in System Integration (SII), 2014
IEEE/SICE International Symposium on. IEEE, 2014, pp. 684689.
[205] D. Alveringh, R. A. Brookhuis, R. J. Wiegerink, and G. J. Krijnen, A large
range multi-axis capacitive force/torque sensor realized in a single SOI wafer, in
216

2014 IEEE 27th International Conference on Micro Electro Mechanical Systems
(MEMS). IEEE, 2014, pp. 680683.
[206] D. Kim, C. H. Lee, B. C. Kim, D. H. Lee, H. S. Lee, C. T. Nguyen, U. K. Kim,
T. D. Nguyen, H. Moon, J. C. Koo et al., Six-axis capacitive force/torque sensor
based on dielectric elastomer, in Electroactive Polymer Actuators and Devices
(EAPAD) 2013, vol. 8687. International Society for Optics and Photonics, 2013,
p. 86872J.
[207] R. A. Brookhuis, R. J. Wiegerink, T. S. Lammerink, M. J. de Boer, K. Ma,
and M. Elwenspoek, Scalable six-axis force-torque sensor with a large range
for biomechanical applications, in Micro Electro Mechanical Systems (MEMS),
2012 IEEE 25th International Conference on. IEEE, 2012, pp. 595598.
[208] R. A. Brookhuis, H. Droogendijk, M. J. de Boer, R. G. Sanders, T. S.
Lammerink, R. J. Wiegerink, and G. J. Krijnen, Six-axis forcetorque sensor
with a large range for biomechanical applications, Journal of micromechanics
and microengineering, vol. 24, no. 3, p. 035015, 2014.
[209] A. Nakai, Y. Morishita, K. Matsumoto, and I. Shimoyama, 6-axis force-torque
sensor chip composed of 16 piezoresistive beams, in Micro Electro Mechanical
Systems (MEMS), 2015 28th IEEE International Conference on. IEEE, 2015,
pp. 730731.
[210] A. Nakai, K. Kuwana, K. Saito, T. Dohi, A. Kumagai, and I. Shimoyama,
Mems 6-axis force-torque sensor attached to the tip of grasping forceps for
identication of tumor in thoracoscopic surgery, in Micro Electro Mechanical
Systems (MEMS), 2017 IEEE 30th International Conference on. IEEE, 2017,
pp. 546548.
217
[211] Y.-J. Li, B.-Y. Sun, J. Zhang, M. Qian, and Z.-Y. Jia, A novel parallel
piezoelectric six-axis heavy force/torque sensor, Measurement, vol. 42, no. 5,
pp. 730736, 2009.
[212] Y.-j. Li, G.-c. Wang, J. Zhang, and Z.-y. Jia, Dynamic characteristics of
piezoelectric six-dimensional heavy force/moment sensor for large-load robotic
manipulator, Measurement, vol. 45, no. 5, pp. 11141125, 2012.
[213] D. Castaño-Cano, M. Grossard, and A. Hubert, Multi-axis force sensing using a
resonant composite piezoelectric plate: model and experiments, Smart Materials
and Structures, vol. 24, no. 5, p. 055019, 2015.
[214] D. M. Vogt, Y.-L. Park, and R. J. Wood, Design and characterization of a soft
multi-axis force sensor using embedded microuidic channels, IEEE Sensors
Journal, vol. 13, no. 10, pp. 40564064, 2013.
[215] C. Kim and C.-H. Lee, Development of a 6-dof FBG forcemoment sensor for a
haptic interface with minimally invasive robotic surgery, Journal of Mechanical
Science and Technology, vol. 30, no. 8, pp. 37053712, 2016.
[216] E. Al-Fakih, N. A. Abu Osman, and F. R. Mahamd Adikan, The use of
ber Bragg grating sensors in biomechanics and rehabilitation applications:
the state-of-the-art and ongoing research topics, Sensors, vol. 12, no. 10, pp.
12 89012 926, 2012.
[217] F. Beyeler, S. Muntwyler, and B. J. Nelson, Design and calibration of a
microfabricated 6-axis force-torque sensor for microrobotic applications, in
Robotics and Automation, 2009. ICRA'09. IEEE International Conference on.
IEEE, 2009, pp. 520525.
218
[218] D.-H. Lee, U. Kim, H. Jung, and H. R. Choi, A capacitive-type novel six-axis
force/torque sensor for robotic applications, IEEE Sensors Journal, vol. 16,
no. 8, pp. 22902299, 2016.
[219] A. Song, J. Wu, G. Qin, and W. Huang, A novel self-decoupled four
degree-of-freedom wrist force/torque sensor, Measurement, vol. 40, no. 9-10,
pp. 883891, 2007.
[220] Z.-Y. Jia, S. Lin, and W. Liu, Measurement method of six-axis load sharing
based on the stewart platform, Measurement, vol. 43, no. 3, pp. 329335, 2010.
[221] Z. Yao, F. Wang, W. Wang, and Y. Qin, Neural-network-based six-axis
force/torque robot sensor calibration, in 2010 International Conference on
Electrical and Control Engineering. IEEE, 2010, pp. 13361338.
[222] T.-F. Lu, G. C. Lin, and J. R. He, Neural-network-based 3d force/torque
sensor calibration for robot applications, Engineering Applications of Articial
Intelligence, vol. 10, no. 1, pp. 8797, 1997.
[223] H. S. Oh, G. Kang, U. Kim, J. K. Seo, W. S. You, and H. R. Choi, Force/torque
sensor calibration method by using deep-learning, in Ubiquitous Robots and
Ambient Intelligence (URAI), 2017 14th International Conference on. IEEE,
2017, pp. 777782.
[224] F. Sinden and R. Boie, A planar capacitive force sensor with six degrees of
freedom, in Proceedings. 1986 IEEE International Conference on Robotics and
Automation, vol. 3. IEEE, 1986, pp. 18061814.
[225] S. B. Kotsiantis, Decision trees: a recent overview, Articial Intelligence
Review, vol. 39, no. 4, pp. 261283, 2013.
219
[226] L. Rokach and O. Z. Maimon, Data mining with decision trees: theory and
applications. World scientic, 2008, vol. 69.
[227] J. Brooks, R. Wentworth, R. Youngquist, M. Tur, B. Kim, and H. Shaw,
Coherence multiplexing of ber-optic interferometric sensors, Journal of
Lightwave Technology, vol. 3, no. 5, pp. 10621072, 1985.
[228] J. Mlodzianowski, D. Uttamchandani, and B. Culshaw, A simple frequency
domain multiplexing system for optical point sensors, Journal of lightwave
technology, vol. 5, no. 7, pp. 10021007, 1987.
[229] B. Moslehi, H. SHAW, J. BROOKS, and B. Y. Kim, Time-domain addressing of
remote beroptic interferometric sensor arrays, Journal of lightwave technology,
vol. 5, no. 7, pp. 10141023, 1987.
[230] I. Sakai, R. Youngquist, and G. Parry, Multiplexing of optical ber sensors using
a frequency-modulated source and gated output, Journal of lightwave technology,
vol. 5, no. 7, pp. 932940, 1987.
[231] A. D. Kersey, M. A. Davis, H. J. Patrick, M. LeBlanc, K. Koo, C. Askins,
M. Putnam, and E. J. Friebele, Fiber grating sensors, Journal of lightwave
technology, vol. 15, no. 8, pp. 14421463, 1997.
[232] X. Wan and H. F. Taylor, Fiber-Bragg-grating pair interferometer sensor with
improved multiplexing capacity and high resolution, IEEE Photonics Technology
Letters, vol. 15, no. 5, pp. 742744, 2003.
[233] H. Liu, H. Liu, G. Peng, and P. Chu, Strain and temperature sensor using a
combination of polymer and silica bre Bragg gratings, Optics Communications,
vol. 219, no. 1-6, pp. 139142, 2003.
220

[234] L. E. Pezzin, T. R. Dillingham, E. J. MacKenzie, P. Ephraim, and P. Rossbach,
Use and satisfaction with prosthetic limb devices and related services, Archives
of physical medicine and rehabilitation, vol. 85, no. 5, pp. 723729, 2004.
[235] D. Berry, Microprocessor prosthetic knees, Physical Medicine and
Rehabilitation Clinics, vol. 17, no. 1, pp. 91113, 2006.
[236] J. Sanders, C. Daly, and E. Burgess, Clinical measurement of normal and shear
stresses on a trans-tibial stump: characteristics of wave-form shapes during
walking, Prosthetics and orthotics international, vol. 17, no. 1, pp. 3848, 1993.
[237] M. Rossi, M. Nardello, L. Lorenzelli, and D. Brunelli, Dual mode pressure
sensing for prosthetic interfaces, in 2017 7th IEEE International Workshop on
Advances in Sensors and Interfaces (IWASI). IEEE, 2017, pp. 109114.
[238] F. Jasni, N. A. Hamzaid, A. G. A. Muthalif, Z. Zakaria, H. N. Shasmin, and
S.-C. Ng, In-socket sensory system for transfemoral amputees using piezoelectric
sensors: an ecacy study, IEEE/ASME Transactions on Mechatronics, vol. 21,
no. 5, pp. 24662476, 2016.
[239] E. Zheng, L. Wang, K. Wei, and Q. Wang, A noncontact capacitive sensing
system for recognizing locomotion modes of transtibial amputees, IEEE
Transactions on Biomedical Engineering, vol. 61, no. 12, pp. 29112920, 2014.
[240] E. Zheng and Q. Wang, Noncontact capacitive sensing-based locomotion
transition recognition for amputees with robotic transtibial prostheses, IEEE
Transactions on Neural Systems and Rehabilitation Engineering, vol. 25, no. 2,
pp. 161170, 2017.
[241] P. Laszczak, L. Jiang, D. L. Bader, D. Moser, and S. Zahedi, Development and
221

validation of a 3d-printed interfacial stress sensor for prosthetic applications,
Medical engineering & physics, vol. 37, no. 1, pp. 132137, 2015.
[242] N. A. A. Razak, N. A. A. Osman, H. Gholizadeh, and S. Ali, Prosthetics socket
that incorporates an air splint system focusing on dynamic interface pressure,
Biomedical engineering online, vol. 13, no. 1, p. 108, 2014.
[243] P. Convery and A. Buis, Socket/stump interface dynamic pressure distributions
recorded during the prosthetic stance phase of gait of a trans-tibial amputee
wearing a hydrocast socket, Prosthetics and Orthotics International, vol. 23,
no. 2, pp. 107112, 1999.
[244] A. Hollinger and M. M. Wanderley, Evaluation of commercial force-sensing
resistors, in Proceedings of the International Conference on New Interfaces for
Musical Expression, Paris, France, 2006, pp. 48.
[245] A. Buis and P. Convery, Calibration problems encountered while monitoring
stump/socket interface pressures with force sensing resistors: techniques adopted
to minimise inaccuracies, Prosthetics and orthotics international, vol. 21, no. 3,
pp. 179182, 1997.
[246] A. Polliack, R. Sieh, D. Craig, S. Landsberger, D. McNeil, and E. Ayyappa,
Scientic validation of two commercial pressure sensor systems for prosthetic
socket t, Prosthetics and orthotics international, vol. 24, no. 1, pp. 6373,
2000.
[247] N. Abu Osman, W. Spence, S. Solomonidis, J. Paul, and A. Weir, Transducers
for the determination of the pressure and shear stress distribution at the
stumpâsocket interface of trans-tibial amputees, Proceedings of the Institution
222

of Mechanical Engineers, Part B: Journal of Engineering Manufacture, vol. 224,
no. 8, pp. 12391250, 2010.
[248] J. E. Sanders, D. Lain, A. J. Dralle, and R. Okumura, Interface pressures and
shear stresses at thirteen socket sites on two persons with transtibial amputation,
Journal of Rehabilitation Research and Development, vol. 34, pp. 1943, 1997.
[249] T. Maeno, T. Kawamura, and S.-C. Cheng, Friction estimation by pressing an
elastic nger-shaped sensor against a surface, IEEE Transactions on Robotics
and Automation, vol. 20, no. 2, pp. 222228, 2004.
[250] M. Ohka, Y. Mitsuya, I. Higashioka, and H. Kabeshita, An experimental optical
three-axis tactile sensor for micro-robots, Robotica, vol. 23, no. 4, pp. 457465,
2005.
[251] E.-S. Hwang, J.-h. Seo, and Y.-J. Kim, A polymer-based exible tactile sensor for
both normal and shear load detections and its application for robotics, Journal
of microelectromechanical systems, vol. 16, no. 3, pp. 556563, 2007.
[252] H.-K. Lee, J. Chung, S.-I. Chang, and E. Yoon, Normal and shear force
measurement using a exible polymer tactile sensor with embedded multiple
capacitors, Journal of Microelectromechanical Systems, vol. 17, no. 4, pp.
934942, 2008.
[253] T. Agcayazi, M. McKnight, P. Sotory, H. Huang, T. Ghosh, and A. Bozkurt,
A scalable shear and normal force sensor for prosthetic sensing, in SENSORS,
2017 IEEE. IEEE, 2017, pp. 13.
[254] R. A. Brookhuis, R. J. Wiegerink, T. S. Lammerink, K. Ma, and G. J.
Krijnen, Large range multi-axis ngertip force sensor, in 2013 Transducers &
223
Eurosensors XXVII: The 17th International Conference on Solid-State Sensors,
Actuators and Microsystems (TRANSDUCERS & EUROSENSORS XXVII).
IEEE, 2013, pp. 27372740.
[255] M. I. Tiwana, A. Shashank, S. J. Redmond, and N. H. Lovell, Characterization
of a capacitive tactile shear sensor for application in robotic and upper limb
prostheses, Sensors and Actuators A: Physical, vol. 165, no. 2, pp. 164172,
2011.
[256] J. R. Mackey and B. L. Davis, Simultaneous shear and pressure sensor array for
assessing pressure and shear at foot/ground interface, Journal of biomechanics,
vol. 39, no. 15, pp. 28932897, 2006.
[257] M. Lord and R. Hosein, A study of in-shoe plantar shear in patients with diabetic
neuropathy, Clinical Biomechanics, vol. 15, no. 4, pp. 278283, 2000.
[258] M. J. Mueller, D. Zou, K. L. Bohnert, L. J. Tuttle, and D. R. Sinacore, Plantar
stresses on the neuropathic foot during barefoot walking, Physical therapy,
vol. 88, no. 11, pp. 13751384, 2008.
[259] A. Rathnayaka, W. Perera, H. Savindu, K. Madarasingha, S. Ranasinghe,
H. Thuduwage, A. Kulathilaka, P. Silva, S. Jayasinghe, K. Kahaduwa et al.,
A customized system to assess foot plantar pressure: A case study on calloused
and normal feet, arXiv preprint arXiv:1901.05303, 2019.
[260] M. E. Fernando, R. G. Crowther, and S. Wearing, The importance of foot
pressure in diabetes, Handbook of Human Motion, pp. 759787, 2018.
[261] M. Yavuz, A. Ersen, J. Hartos, L. A. Lavery, D. K. Wukich, G. B. Hirschman,
D. G. Armstrong, M. Q. Quiben, and L. S. Adams, Temperature as a causative
224

factor in diabetic foot ulceration: A call to revisit ulcer pathomechanics, Journal
of the American Podiatric Medical Association, vol. 0, 2018.
[262] R. Vaishya, Smart insole for diabetic patient, Methodology, vol. 4, no. 7, 2018.
[263] B. Naja, D. Armstrong, and M. Bharara, Smart textile to predict risk of
diabetic foot ulcer, Sep. 6 2018, uS Patent App. 15/760,503.
[264] E. Al-Fakih, N. Osman, A. Eshraghi, and F. Adikan, The capability of ber
Bragg grating sensors to measure amputees trans-tibial stump/socket interface
pressures, Sensors, vol. 13, no. 8, pp. 10 34810 357, 2013.
[265] Y. Liu, H. Wang, J. Yu, and P. Li, Selective recursive kernel learning for online
identication of nonlinear systems with narx form, Journal of Process Control,
vol. 20, no. 2, pp. 181194, 2010.
[266] I. Petrovic, M. Baotic, and N. Peric, Model structure selection for nonlinear
system identication using feedforward neural networks, in Neural Networks,
2000. IJCNN 2000, Proceedings of the IEEE-INNS-ENNS International Joint
Conference on, vol. 1. IEEE, 2000, pp. 5357.
[267] Y. Chetouani, Using arx and narx approaches for modeling and prediction of
the process behavior: application to a reactor-exchanger, Asia-Pacic Journal
of Chemical Engineering, vol. 3, no. 6, pp. 597605, 2008.
[268] M. V. Kumar, S. Omkar, R. Ganguli, P. Sampath, and S. Suresh, Identication
of helicopter dynamics using recurrent neural networks and ight data, Journal
of the American Helicopter Society, vol. 51, no. 2, pp. 164174, 2006.
[269] M. M. Korjani, O. Bazzaz, and M. B. Menhaj, Real time identication
225
and control of dynamic systems using recurrent neural networks, Articial
Intelligence Review, vol. 30, no. 1-4, p. 1, 2008.
[270] A. E. Ruano, P. J. Fleming, C. Teixeira, K. RodrGuez-Vázquez, and
C. M. Fonseca, Nonlinear identication of aircraft gas-turbine dynamics,
Neurocomputing, vol. 55, no. 3-4, pp. 551579, 2003.
[271] H. Asgari, X. Chen, M. Morini, M. Pinelli, R. Sainudiin, P. R. Spina, and
M. Venturini, Narx models for simulation of the start-up operation of a
single-shaft gas turbine, Applied Thermal Engineering, vol. 93, pp. 368376,
2016.
[272] E. Cadenas, W. Rivera, R. Campos-Amezcua, and C. Heard, Wind speed
prediction using a univariate arima model and a multivariate narx model,
Energies, vol. 9, no. 2, p. 109, 2016.
[273] I. Leontaritis and S. A. Billings, Input-output parametric models for non-linear
systems part i: deterministic non-linear systems, International journal of
control, vol. 41, no. 2, pp. 303328, 1985.
[274] L. C. B. da Silva, J. L. A. Samatelo, M. E. V. Segatto, J. P. Bazzo, J. C. C.
da Silva, C. Martelli, and M. J. Pontes, Narx neural network model for strong
resolution improvement in a distributed temperature sensor, Applied optics,
vol. 57, no. 20, pp. 58595864, 2018.
[275] H. Wang and G. Song, Innovative narx recurrent neural network model for
ultra-thin shape memory alloy wire, Neurocomputing, vol. 134, pp. 289295,
2014.
[276] E. Di Tucci, S. Manfredi, C. Sansone, and S. De Vito, A new narx based semi
226

supervised learning algorithm for pollutant estimation, in Environmental Energy
and Structural Monitoring Systems (EESMS), 2014 IEEE Workshop on. IEEE,
2014, pp. 15.
[277] F. A. Ruslan, A. M. Samad, Z. M. Zain, and R. Adnan, Flood water level
modeling and prediction using narx neural network: Case study at kelang river,
in Signal Processing & its Applications (CSPA), 2014 IEEE 10th International
Colloquium on. IEEE, 2014, pp. 204207.
[278] E. Esposito, S. De Vito, M. Salvato, V. Bright, R. L. Jones, and O. Popoola,
Dynamic neural network architectures for on eld stochastic calibration of
indicative low cost air quality sensing systems, Sensors and Actuators B:
Chemical, vol. 231, pp. 701713, 2016.
[279] H.-L. Wei and S. A. Billings, Model structure selection using an integrated
forward orthogonal search algorithm assisted by squared correlation and mutual
information, International Journal of Modelling Identication and Control,
vol. 3, no. 4, pp. 341356, 2008.
[280] Y. Ma, H. Liu, Y. Zhu, F. Wang, and Z. Luo, The narx model-based system
identication on nonlinear, rotor-bearing systems, Applied Sciences, vol. 7, no. 9,
p. 911, 2017.
[281] M. H. M. Som, K. Nagamune, and S. Kawaguchi, Performance comparison
of conductive rubber-based sensor array calibration using cubic spline and
back propagation neural network, International Information Institute (Tokyo).
Information, vol. 18, no. 2, p. 673, 2015.
[282] , Performance of conductive rubber-based sensor array calibration using
227

cubic spline, in 2014 IEEE International Conference on Systems, Man, and
Cybernetics (SMC). IEEE, 2014, pp. 36793684.
[283] V. Grosu, S. Grosu, B. Vanderborght, D. Lefeber, and C. Rodriguez-Guerrero,
Multi-axis force sensor for humanrobot interaction sensing in a rehabilitation
robotic device, Sensors, vol. 17, no. 6, p. 1294, 2017.
[284] J. Liu, L. Zhang, Z. Fu, M. Li, J. Liu, and L. Qin, Dynamic characteristic analysis
of planar piezoelectric six-axis force/torque sensor, in 2018 10th International
Conference on Intelligent Human-Machine Systems and Cybernetics (IHMSC),
vol. 2. IEEE, 2018, pp. 140145.
[285] Y. Noh, J. Bimbo, S. Sareh, H. Wurdemann, J. Fra±, D. Chathuranga, H. Liu,
J. Housden, K. Althoefer, and K. Rhode, Multi-axis force/torque sensor based
on simply-supported beam and optoelectronics, Sensors, vol. 16, no. 11, p. 1936,
2016.
[286] T. Zhang, M. Tran, and H. Huang, Design and experimental verication of
hip exoskeleton with balance capacities for walking assistance, IEEE/ASME
Transactions on Mechatronics, 2018.
[287] Y. Ma, S. Xie, X. Zhang, and Y. Luo, Hybrid calibration method for
six-component force/torque transducers of wind tunnel balance based on support
vector machines, Chinese Journal of Aeronautics, vol. 26, no. 3, pp. 554562,
2013.
[288] E. Bayo and J. Stubbe, Six-axis force sensor evaluation and a new type of optimal
frame truss design for robotic applications, Journal of Robotic Systems, vol. 6,
no. 2, pp. 191208, 1989.
228
[289] C. Ren, Y. Gong, F. Jia, and X. Wang, Theoretical analysis of a six-axis
force/torque sensor with overload protection for polishing robot, in 2016
23rd International Conference on Mechatronics and Machine Vision in Practice
(M2VIP). IEEE, 2016, pp. 16.
[290] Y. B. Kim, U. Kim, D.-Y. Seok, J. So, and H. R. Choi, A novel capacitive type
torque sensor for robotic applications, in 2016 IEEE International Conference
on Advanced Intelligent Mechatronics (AIM). IEEE, 2016, pp. 993998.
[291] Y. Sun, K. Kim, R. M. Voyles, and B. J. Nelson, Calibration of multi-axis mems
force sensors using the shape from motion method, in Proceedings 2006 IEEE
International Conference on Robotics and Automation, 2006. ICRA 2006. IEEE,
2006, pp. 269274.
[292] K. Kim, Y. Sun, R. M. Voyles, and B. J. Nelson, Calibration of multi-axis mems
force sensors using the shape-from-motion method, IEEE Sensors Journal,
vol. 7, no. 3, pp. 344351, 2007.
[293] J. Huang, C. Y. Wong, D. T. Pham, Y. Wang, C. Ji, S. Su, W. Xu, Q. Liu, and
Z. Zhou, Design of a novel six-axis force/torque sensor based on optical bre
sensing for robotic applications, 2018.
[294] D. Chen, A. Song, and A. Li, Design and calibration of a six-axis force/torque
sensor with large measurement range used for the space manipulator, Procedia
Engineering, vol. 99, pp. 11641170, 2015.
[295] R. Kumar, S. Rab, B. Pant, S. Maji, and R. Mishra, Fea-based design studies
for development of diaphragm force transducers, MAPAN, pp. 19, 2018.
[296] K. H. Sienko, V. V. Vichare, M. D. Balkwill, and C. Wall III, Assessment of
229

vibrotactile feedback on postural stability during pseudorandom multidirectional
platform motion, IEEE Transactions on Biomedical Engineering, vol. 57, no. 4,
pp. 944952, 2010.
[297] M. R. Afzal, Y. Jan, S. Hassan, and J. Yoon, Analysis of active haptic feedback
eects on standing stability, in International Conference on Intelligent Robotics
and Applications. Springer, 2013, pp. 154164.
[298] B.-C. Lee, J. Kim, S. Chen, and K. H. Sienko, Cell phone based balance trainer,
Journal of neuroengineering and rehabilitation, vol. 9, no. 1, p. 10, 2012.
[299] J.-F. Bayouk, J. P. Boucher, and A. Leroux, Balance training following stroke:
eects of task-oriented exercises with and without altered sensory input,
International Journal of Rehabilitation Research, vol. 29, no. 1, pp. 5159, 2006.
[300] B. Lange, S. Flynn, R. Prott, C.-Y. Chang, and A. âSkipâ Rizzo,
Development of an interactive game-based rehabilitation tool for dynamic
balance training, Topics in stroke rehabilitation, vol. 17, no. 5, pp. 345352,
2010.
[301] A. Srivastava, A. B. Taly, A. Gupta, S. Kumar, and T. Murali, Post-stroke
balance training: role of force platform with visual feedback technique, Journal
of the neurological sciences, vol. 287, no. 1, pp. 8993, 2009.
[302] W. Young, S. Ferguson, S. Brault, and C. Craig, Assessing and training standing
balance in older adults: a novel approach using the nintendo wii balance board,
Gait & posture, vol. 33, no. 2, pp. 303305, 2011.
[303] C. Franco, A. Fleury, P.-Y. Guméry, B. Diot, J. Demongeot, and N. Vuillerme,
230

ibalance-abf: a smartphone-based audio-biofeedback balance system, IEEE
transactions on biomedical engineering, vol. 60, no. 1, pp. 211215, 2013.
[304] M. Dozza, F. B. Horak, and L. Chiari, Auditory biofeedback substitutes for loss
of sensory information in maintaining stance, Experimental brain research, vol.
178, no. 1, pp. 3748, 2007.
[305] L. Chiari, M. Dozza, A. Cappello, F. B. Horak, V. Macellari, and D. Giansanti,
Audio-biofeedback for balance improvement: an accelerometry-based system,
IEEE transactions on biomedical engineering, vol. 52, no. 12, pp. 21082111,
2005.
[306] N. Vuillerme, O. Chenu, J. Demongeot, and Y. Payan, Controlling posture
using a plantar pressure-based, tongue-placed tactile biofeedback system,
Experimental brain research, vol. 179, no. 3, pp. 409414, 2007.
[307] S. E. Sihvonen, S. Sipilä, and P. A. Era, Changes in postural balance in frail
elderly women during a 4-week visual feedback training: a randomized controlled
trial, Gerontology, vol. 50, no. 2, pp. 8795, 2004.
[308] R. A. Geiger, J. B. Allen, J. O'Keefe, and R. R. Hicks, Balance and mobility
following stroke: eects of physical therapy interventions with and without
biofeedback/forceplate training, Physical therapy, vol. 81, no. 4, pp. 9951005,
2001.
[309] E. Bisson, B. Contant, H. Sveistrup, and Y. Lajoie, Functional balance and
dual-task reaction times in older adults are improved by virtual reality and
biofeedback training, Cyberpsychology & behavior, vol. 10, no. 1, pp. 1623,
2007.
231

[310] T. E. Prieto, J. Myklebust, R. Homann, E. Lovett, and B. Myklebust, Measures
of postural steadiness: dierences between healthy young and elderly adults,
IEEE Transactions on biomedical engineering, vol. 43, no. 9, pp. 956966, 1996.
[311] K. Seo, J. Lee, Y. Lee, T. Ha, and Y. Shim, Fully autonomous hip exoskeleton
saves metabolic cost of walking, in Robotics and Automation (ICRA), 2016
IEEE International Conference on Robotics and Automation (ICRA). IEEE,
2016, pp. 46284635.
[312] K. Seo, J. Lee, and Y. J. Park, Autonomous hip exoskeleton saves metabolic
cost of walking uphill, in Rehabilitation Robotics (ICORR), 2017 International
Conference on Rehabilitation Robotics (ICORR). IEEE, 2017, pp. 246251.
[313] J. Beil and T. Asfour, New mechanism for a 3 dof exoskeleton hip joint with ve
revolute and two prismatic joints, in Biomedical Robotics and Biomechatronics
(BioRob), 2016 6th IEEE International Conference on Biomedical Robotics and
Biomechatronics (BioRob). IEEE, 2016, pp. 787792.
[314] J. Jang, K. Kim, J. Lee, B. Lim, and Y. Shim, Online gait task recognition
algorithm for hip exoskeleton, in Intelligent Robots and Systems (IROS), 2015
IEEE/RSJ International Conference on Intelligent Robots and Systems (IROS.
IEEE, 2015, pp. 53275332.
[315] S. O. Schrade, Y. Nager, A. R. Wu, R. Gassert, and A. Ijspeert, Bio-inspired
control of joint torque and knee stiness in a robotic lower limb exoskeleton using
a central pattern generator, in 2017 International Conference on Rehabilitation
Robotics (ICORR). IEEE, 2017, pp. 13871394.
[316] A. Martínez, B. Lawson, and M. Goldfarb, A controller for guiding leg movement
232

during overground walking with a lower limb exoskeleton, IEEE Transactions
on Robotics, 2017.
[317] R. Analia, K.-T. Song et al., Design of assistive torque for a lower limb
exoskeleton based on motion prediction, in Society of Instrument and Control
Engineers of Japan (SICE), 2016 55th Annual Conference of the Society of
Instrument and Control Engineers of Japan (SICE). IEEE, 2016, pp. 172177.
[318] K. A. Witte, A. M. Fatschel, and S. H. Collins, Design of a lightweight, tethered,
torque-controlled knee exoskeleton, in Rehabilitation Robotics (ICORR), 2017
International Conference on Rehabilitation Robotics (ICORR). IEEE, 2017, pp.
16461653.
[319] Z. F. Lerner, D. L. Damiano, and T. C. Bulea, Relationship between assistive
torque and knee biomechanics during exoskeleton walking in individuals with
crouch gait, in Rehabilitation Robotics (ICORR), 2017 International Conference
on Rehabilitation Robotics (ICORR). IEEE, 2017, pp. 491497.
[320] H. Choi, Y. J. Park, K. Seo, J. Lee, S.-e. Lee, and Y. Shim, A multifunctional
ankle exoskeleton for mobility enhancement of gait-impaired individuals and
seniors, IEEE Robotics and Automation Letters, vol. 3, no. 1, pp. 411418, 2018.
[321] C. Meijneke, W. van Dijk, and H. van der Kooij, Achilles: an
autonomous lightweight ankle exoskeleton to provide push-o power, in
5th IEEE RAS/EMBS International Conference on Biomedical Robotics and
Biomechatronics. IEEE, 2014, pp. 918923.
[322] K. A. Witte, J. Zhang, R. W. Jackson, and S. H. Collins, Design of two
lightweight, high-bandwidth torque-controlled ankle exoskeletons, in Robotics
233
and Automation (ICRA), 2015 IEEE International Conference on Robotics and
Automation (ICRA). IEEE, 2015, pp. 12231228.
[323] M. B. Wiggin, G. S. Sawicki, and S. H. Collins, An exoskeleton using controlled
energy storage and release to aid ankle propulsion, in Rehabilitation Robotics
(ICORR), 2011 IEEE International Conference on. IEEE, 2011, pp. 15.
[324] Z.-F. Fu and J. He, Modal analysis. Elsevier, 2001.
[325] H. A. Al-Khazali and M. R. Askari, Calculations of frequency response functions
(frf) using computer smart oce software and nyquist plot under gyroscopic eect
rotation, arXiv preprint arXiv:1208.3681, 2012.
234

Appendices
235

Appendix A
Experimental Results of the light
intensity Modulation-Based, 3-Axis
Force Sensor
A.1 Experimental Validation Through An Actual
Gait Measurement Scenario
To evaluate the proposed sensor' s capability to measure three-axis forces in a real gait
measurement scenario, the force sensing units were tested while mounted to the oor.
Both sensors were attached to a Bertec force plate (FP 4060-07-1000, Ohio, United
States) as shown in Figure 1.1. The force plate has a six-axis, strain gauge-base force
and torque sensor. In this experimental procedure, the sensors are around 10 cm apart
along the y-axis of the force plate and are aligned to the z-axis.
236
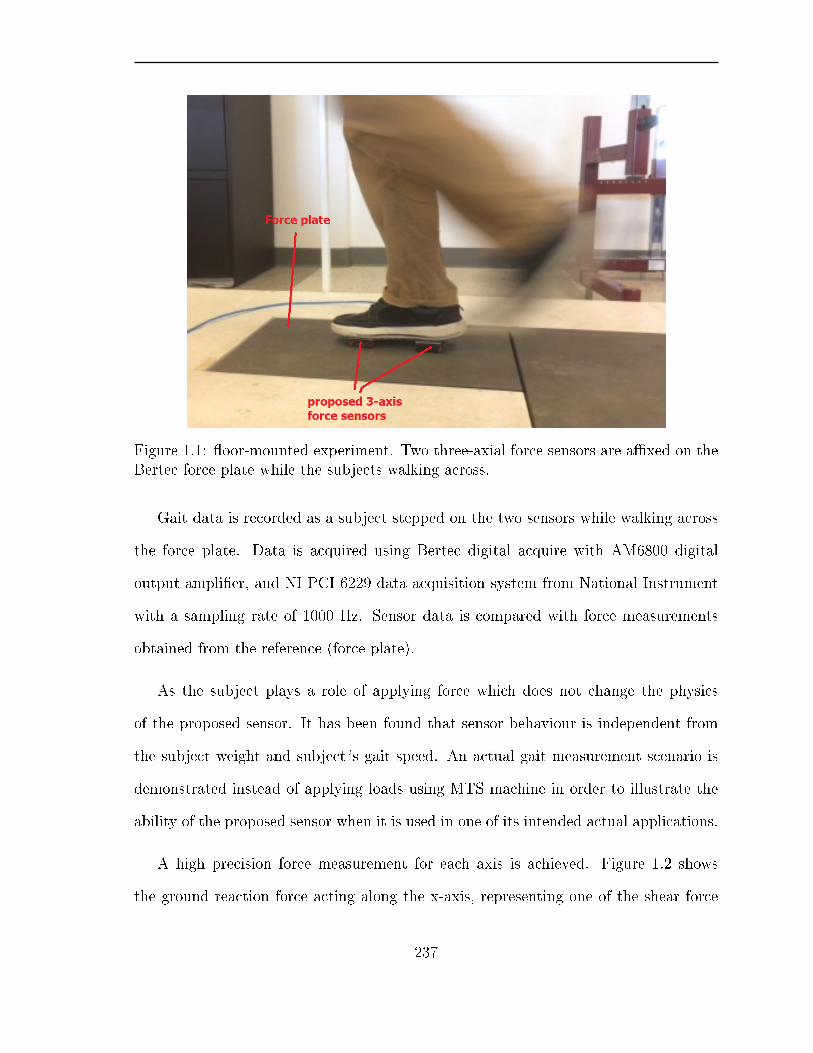
Figure 1.1: oor-mounted experiment. Two three-axial force sensors are axed on theBertec force plate while the subjects walking across.
Gait data is recorded as a subject stepped on the two sensors while walking across
the force plate. Data is acquired using Bertec digital acquire with AM6800 digital
output amplier, and NI PCI 6229 data acquisition system from National Instrument
with a sampling rate of 1000 Hz. Sensor data is compared with force measurements
obtained from the reference (force plate).
As the subject plays a role of applying force which does not change the physics
of the proposed sensor. It has been found that sensor behaviour is independent from
the subject weight and subject' s gait speed. An actual gait measurement scenario is
demonstrated instead of applying loads using MTS machine in order to illustrate the
ability of the proposed sensor when it is used in one of its intended actual applications.
A high precision force measurement for each axis is achieved. Figure 1.2 shows
the ground reaction force acting along the x-axis, representing one of the shear force
237

Figure 1.2: Force sensor response due to the applied shear force along the x-axis duringgait
Figure 1.3: Force sensor response due to the applied shear force along the y-axis duringgait
238
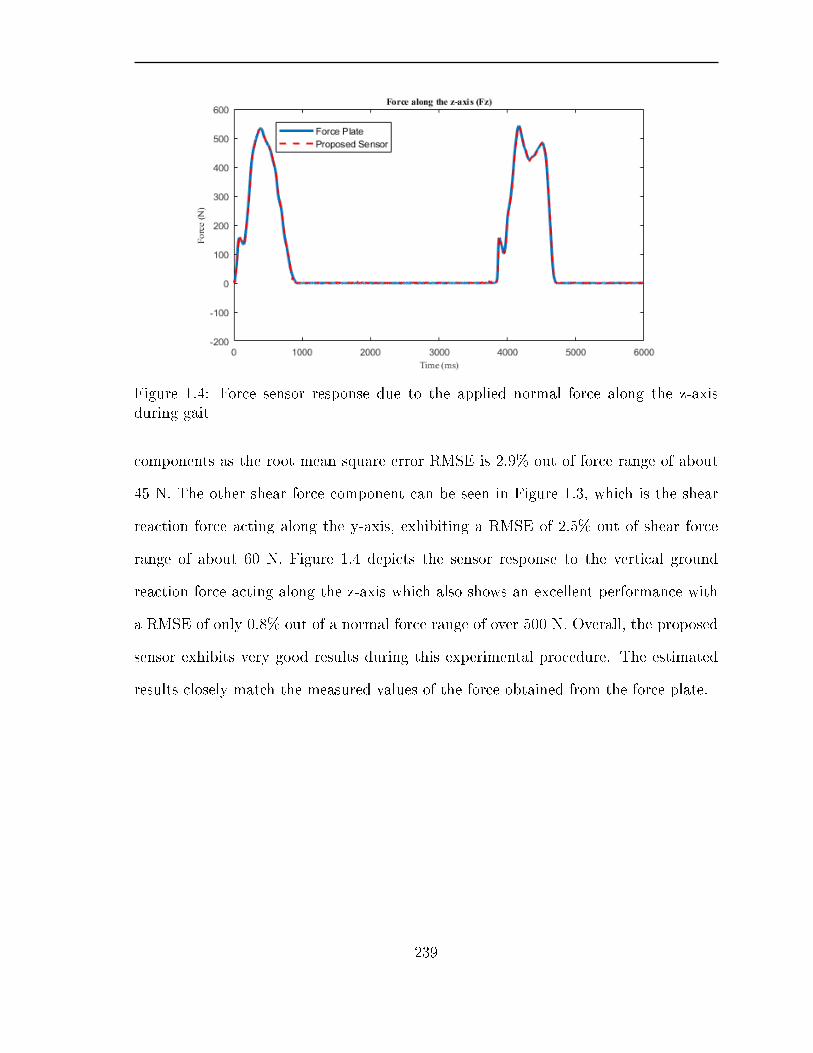
Figure 1.4: Force sensor response due to the applied normal force along the z-axisduring gait
components as the root mean square error RMSE is 2.9% out of force range of about
45 N. The other shear force component can be seen in Figure 1.3, which is the shear
reaction force acting along the y-axis, exhibiting a RMSE of 2.5% out of shear force
range of about 60 N. Figure 1.4 depicts the sensor response to the vertical ground
reaction force acting along the z-axis which also shows an excellent performance with
a RMSE of only 0.8% out of a normal force range of over 500 N. Overall, the proposed
sensor exhibits very good results during this experimental procedure. The estimated
results closely match the measured values of the force obtained from the force plate.
239

Figure 1.5: a comparison between the experimental results of the proposed 3-axisintensity based force sensor and the ATI force and torque sensor when a force is appliedalong the z-axis.
Figure 1.6: Sensor performance when a force of high of high frequency and high speedis applied.
240

Figure 1.7: The experimental results of the propse 3-xis force sensor and the referencesensor when a large amount of normal force is applied.
Figure 1.8: a comparison between the experimental results of the proposed 3-axisintensity based force sensor and the reference sensor in terms of shear force appliedalong the x-axis.
241
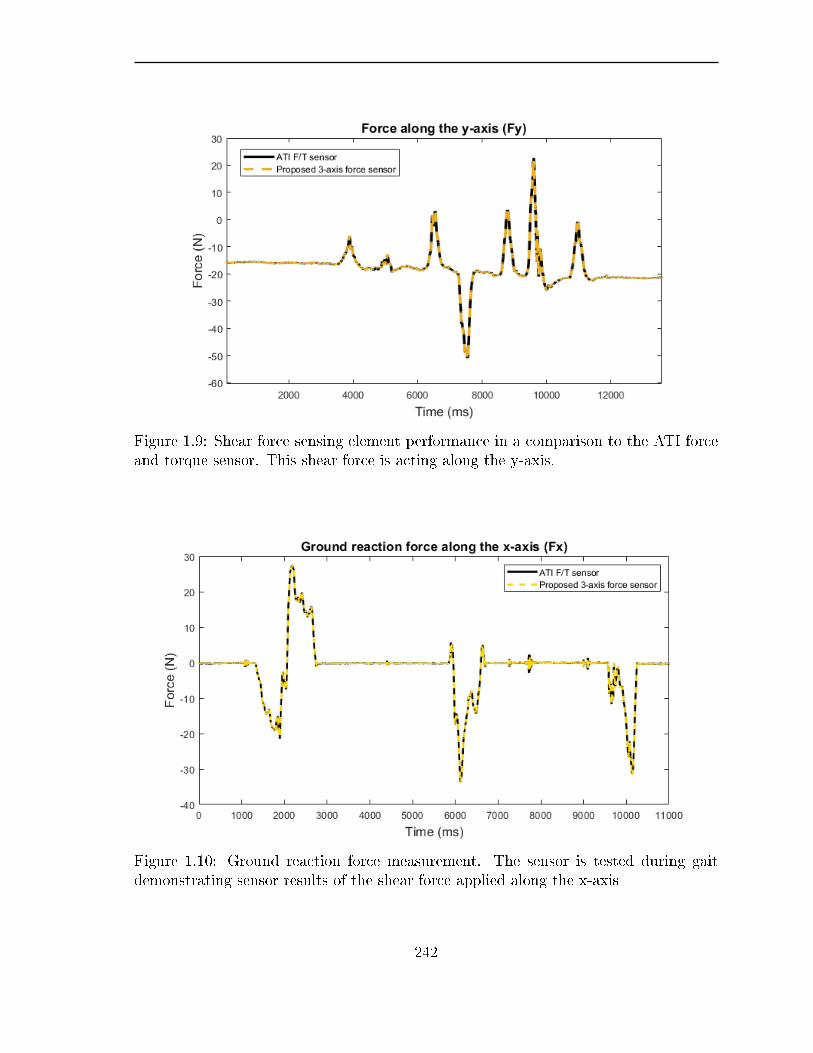
Figure 1.9: Shear force sensing element performance in a comparison to the ATI forceand torque sensor. This shear force is acting along the y-axis.
Figure 1.10: Ground reaction force measurement. The sensor is tested during gaitdemonstrating sensor results of the shear force applied along the x-axis
242

Figure 1.11: Ground reaction force measurement. The sensor is tested during gaitdemonstrating sensor results of the shear force applied along the y-axis
Figure 1.12: Ground reaction force measurement. The sensor is tested during gaitdemonstrating sensor results of the normal force applied along the z-axis
243

Figure 1.13: Experimental results of the proposed 3-axis force sensor during gait testpresenting four steps while the shear force is applied along the x-axis.
Figure 1.14: Ground reaction shear force acting along the y-axis presenting four stepsof the sensor performance compared to the force plate.
244

Figure 1.15: Experimental results of the proposed 3-axis force sensor during gait testshowing four steps while the normal force is applied along the x-axis
Figure 1.16: One step test of ground reaction force along the x-direction in comparisonto the force plate measurements.
245

Figure 1.17: The experimental results of the proposed 3-axis force sensor in real gaitmeasurement of the shear force of the y-direction.
Figure 1.18: One step test of ground reaction force along the z-direction in comparisonto the force plate. measurements
246

A.2 Specication of the compliant Force Sensor
In order to determine the sensitivities of the electric sensing element (light-to-voltage
convertor LTV), silicon rubber blocks and the sensor as whole integrated force
measurement system, several experiments were carried out using a Servo-hydraulic
Testing Systems (MTS) to measure the output-voltage and displacement (rubber
deection) as a result of the supplied force. Figure 1.19 shows the silicon rubber
(compliant blocks) response to the force applied using the MTS, illustrating the
relationship between the applied force and the generated deformation. It is known for
any exible martial to exhibit a nonlinear behaviour. However, the silicon rubber used
shows a slightly force-deection nonlinear relationship due the small deection range
(0 up to 2.5 mm) compared to the amount of the applied force as shown Figure 1.19.
Figure 1.19: The experimental results of the rubber block due to the applied force.The material exhibits slightly nonlinear force-deection relationship.
To determine the silicon rubber sensitivity, force-deection relationship is assumed
to be linear since it is almost linear. Compliant blocks sensitivity is the ratio of the
247

incremental variation of the mechanical deformation (output) ∆d to the incremental
variation of the input force ∆F which is given by:
Srubber =∆d
∆F= 0.0018mm/N or 18µm/N (1)
During the application of the force the output voltage (light intensity) of the optical
sensing element (LTV) is also measured. As shown in Figure 3, light intensity
to displacement relationship is also slightly nonlinear. The rang of the applied
displacement in this test is between 0 mm to 2.1 mm. In the same previous way,
the optical sensitivity is calculated as follows:
SLTV =∆v
∆d= 0.17V/mm (2)
Figure 1.20: The experimental results of the light-to-voltage converter due to thedisplacements generated as a result of the applied force which also exhibits a slightlya nonlinear behaviour.
The overall sensitivity of the proposed sensor as whole integrated measurement
system is the combination of both previous curves of light intensity-displacement
248

relationship and force-deection relationship which results in a linear nal sensor
response (the nal output of the sensor ) exhibiting a linear force to voltage correlation.
This proves the previous discussion of the nonlinearity cancellation phenomenon seen
in the sensor response as shown in Figure 1.21. The sensor sensitivity is also calculated
using the same previous formula which was 0.29 mV/N .
The resolution of the developed sensor is the smallest variation in mechanical
deformation input (the applied force) that can generate a change in the output voltage
signal which was found to be 0.11131 N.
Figure 1.21: The nal sensor response under the applied force. The sensor shows goodlinear correlation between force and generated output voltage.
249

Appendix B
Experimental Results of the
intensity-based, 6-Axis F/T Sensor
B.1 Experimental Validation Through An Actual
Gait Measurement Scenario
In order to validate the developed 6-axis force and torque sensor and its capability
to measure the total ground reaction force and moment, the sensor was tested while
mounted to the ground as depicted in Figure 2.1. The sensor was axed to a
standard force plate from Bertec Corporation. Gait data was recorded while a subject
walked across the force plate and stepping on the sensor. Data was acquired as at
a sampling rate of 1kHz using NI PCI 6229 DAQ from National Instrument. Sensor
data was compared with a force and torque measurements obtained from the force plate.
Figure 2.3 illustrates a comparison between the performance of the developed 6-axis
250

Figure 2.1: Real-time actual gait measurement scenario. The experimental setup iscomposed of the proposed light intensity-based,6-axis ber optic, force and torquesensor and a standard force plate. the sensor is axed on the force plate and thesubject walks across the it.
F/T sensor and results achieved from a standard force plate for each axis. The three
plots seen in Figure 2.4 show the complete ground reaction force and moments in
real-time for three subjects with dierent weight of 93 kg, 85 kg and 50 kg in sub-gures
(a), (b) and (c) respectively. As it can be seen, the estimated F/T data closely match
the measured data, indicating a reliable and high-quality performance of force and
moment sensing.
251

0 2 4 6 8 10 12 14 16-200
0
200
400
600
800
1000
Forc
e (N
)
Time (s)
Force along the z-axis (Fz)
Force Plate6-Axis F/T Sensor Prototype
(a)
0 2 4 6 8 10 12 14 16
Time (s)
-4
-2
0
2
4
6
8
10
12
14
16
Mom
ent (
N.m
)
Moment along the x-axis (Mx)
Force Plate6-Axis F/T Sensor Prototype
(b)
0 2 4 6 8 10 12 14 16Time (s)
-100
-80
-60
-40
-20
0
20
40
60
80
100
Forc
e (N
)
Force along the x-axis (Fx)
Force Plate6-Axis F/T Sensor Prototype
(c)
Figure 2.2: Experimental results through a real gait measurement for the applied forces.
252
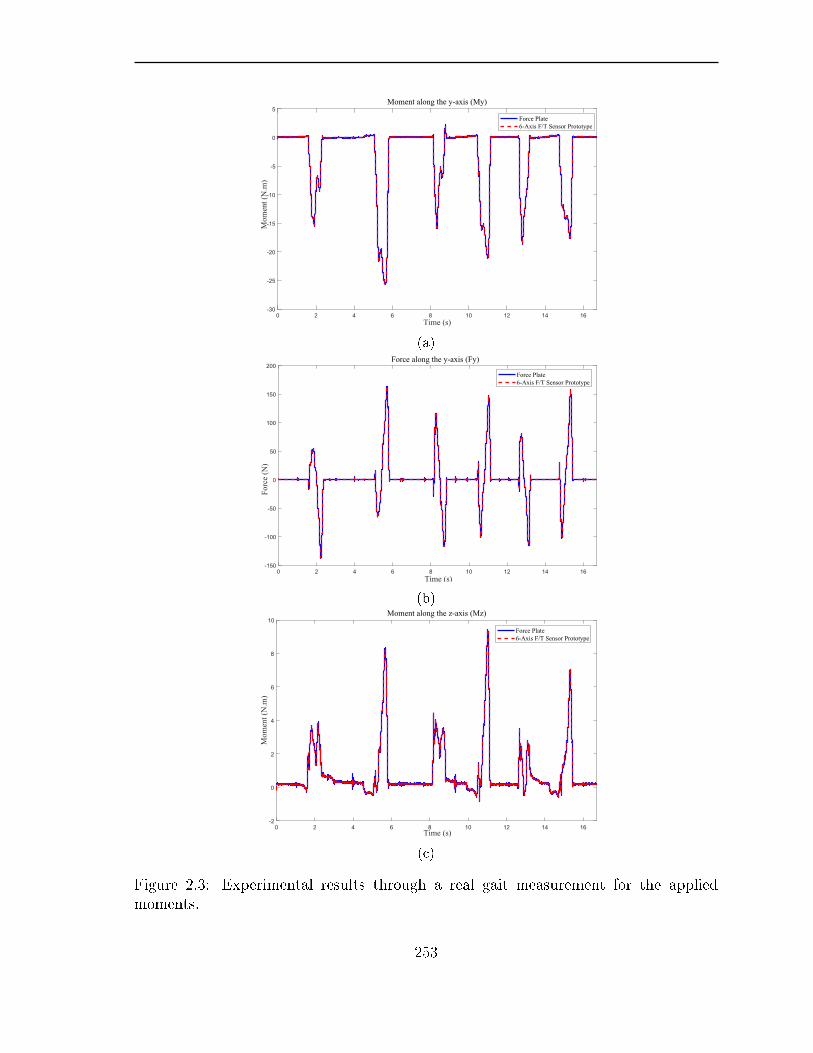
0 2 4 6 8 10 12 14 16Time (s)
-30
-25
-20
-15
-10
-5
0
5
Mom
ent (
N.m
)
Moment along the y-axis (My)
Force Plate6-Axis F/T Sensor Prototype
(a)
0 2 4 6 8 10 12 14 16-150
-100
-50
0
50
100
150
200
Forc
e (N
)
Time (s)
Force along the y-axis (Fy)
Force Plate6-Axis F/T Sensor Prototype
(b)
0 2 4 6 8 10 12 14 16Time (s)
-2
0
2
4
6
8
10
Mom
ent (
N.m
)
Moment along the z-axis (Mz)
Force Plate6-Axis F/T Sensor Prototype
(c)
Figure 2.3: Experimental results through a real gait measurement for the appliedmoments.
253

(a)
(b)
(c)
Figure 2.4: Experimental results through a real gait measurement . The dashed redline shows the estimated values of F/M and using the proposed sensor an the blue linedepicts the actual F/M measured by the force plate.
254
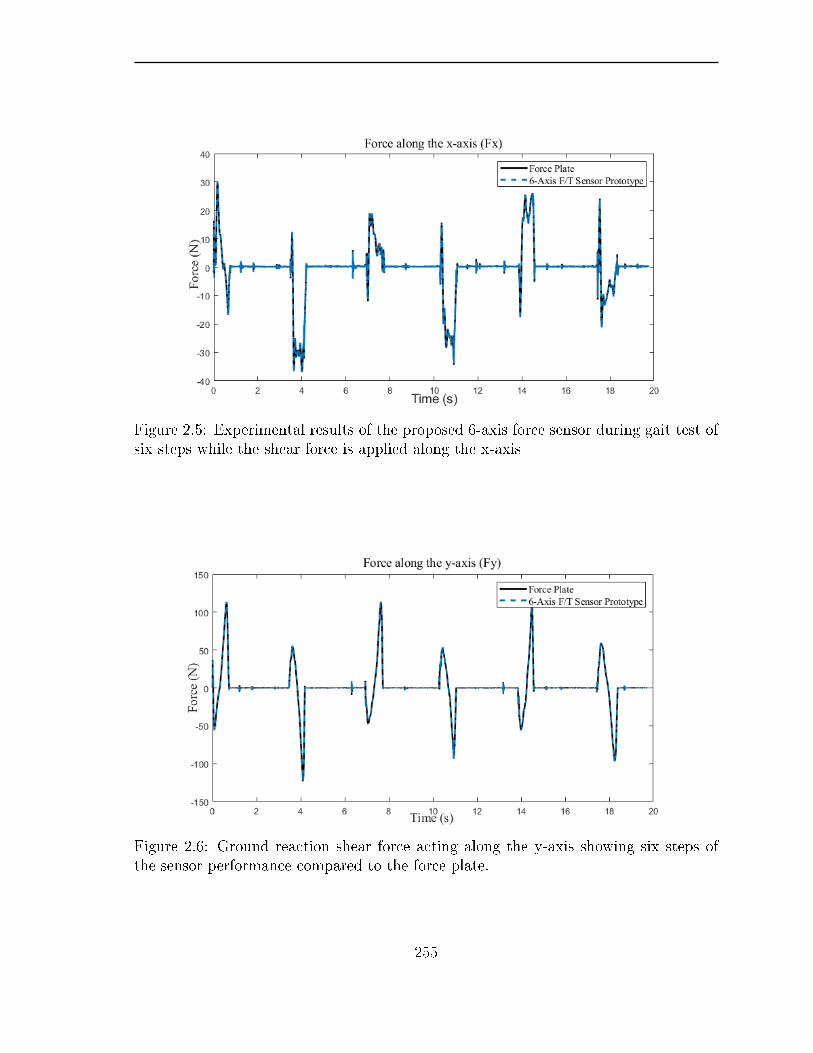
Figure 2.5: Experimental results of the proposed 6-axis force sensor during gait test ofsix steps while the shear force is applied along the x-axis
Figure 2.6: Ground reaction shear force acting along the y-axis showing six steps ofthe sensor performance compared to the force plate.
255
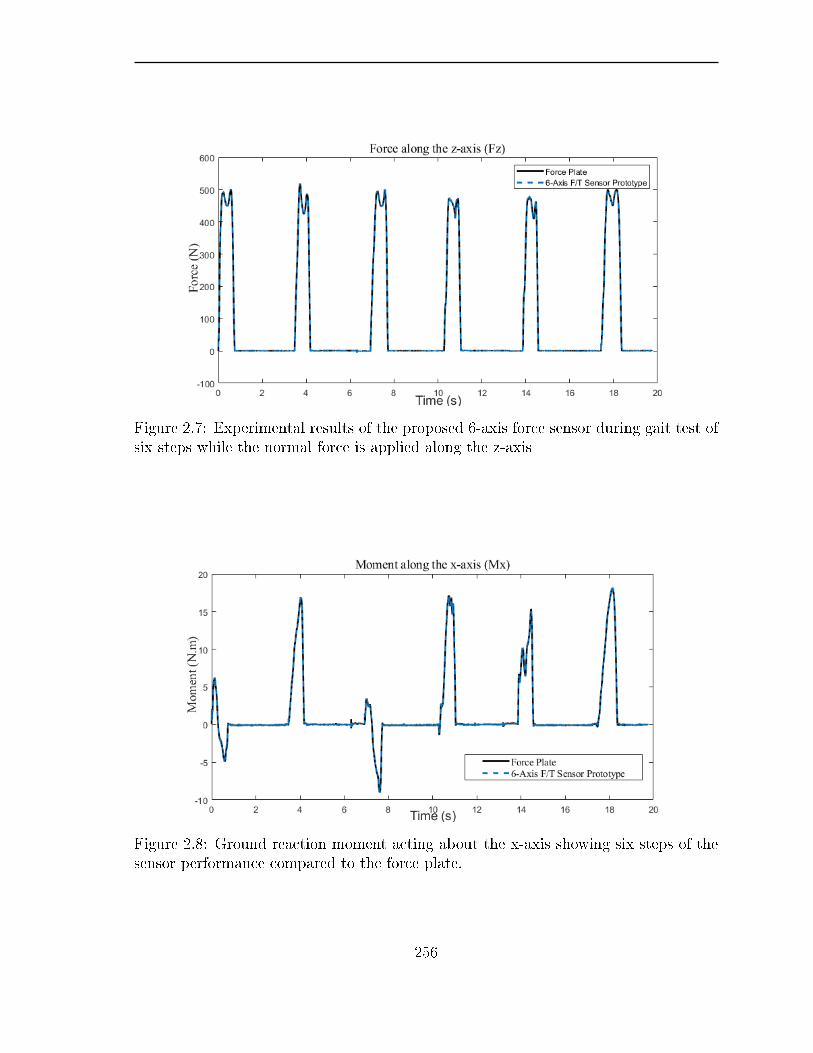
Figure 2.7: Experimental results of the proposed 6-axis force sensor during gait test ofsix steps while the normal force is applied along the z-axis
Figure 2.8: Ground reaction moment acting about the x-axis showing six steps of thesensor performance compared to the force plate.
256

Figure 2.9: Ground reaction moment acting about the y-axis showing six steps of thesensor performance compared to the force plate.
Figure 2.10: Ground reaction moment acting about the z-axis showing six steps of thesensor performance compared to the force plate.
257
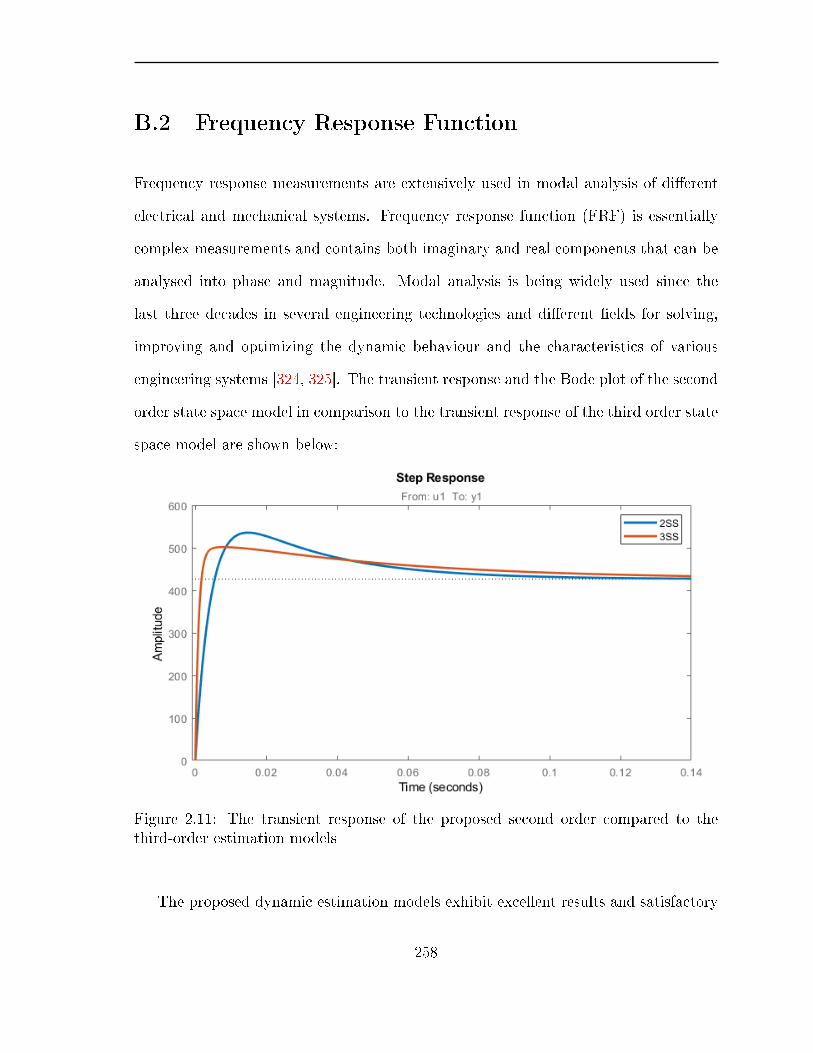
B.2 Frequency Response Function
Frequency response measurements are extensively used in modal analysis of dierent
electrical and mechanical systems. Frequency response function (FRF) is essentially
complex measurements and contains both imaginary and real components that can be
analysed into phase and magnitude. Modal analysis is being widely used since the
last three decades in several engineering technologies and dierent elds for solving,
improving and optimizing the dynamic behaviour and the characteristics of various
engineering systems [324, 325]. The transient response and the Bode plot of the second
order state space model in comparison to the transient response of the third order state
space model are shown below:
Figure 2.11: The transient response of the proposed second order compared to thethird-order estimation models
The proposed dynamic estimation models exhibit excellent results and satisfactory
258
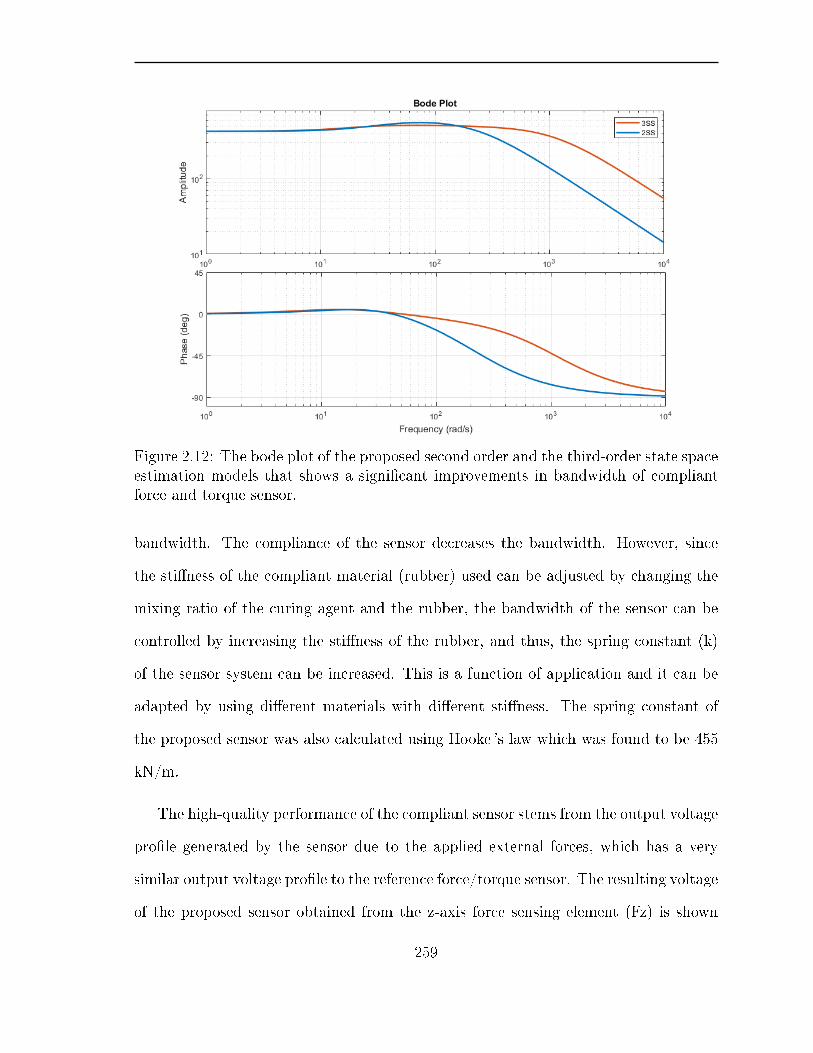
Figure 2.12: The bode plot of the proposed second order and the third-order state spaceestimation models that shows a signicant improvements in bandwidth of compliantforce and torque sensor.
bandwidth. The compliance of the sensor decreases the bandwidth. However, since
the stiness of the compliant material (rubber) used can be adjusted by changing the
mixing ratio of the curing agent and the rubber, the bandwidth of the sensor can be
controlled by increasing the stiness of the rubber, and thus, the spring constant (k)
of the sensor system can be increased. This is a function of application and it can be
adapted by using dierent materials with dierent stiness. The spring constant of
the proposed sensor was also calculated using Hooke' s law which was found to be 455
kN/m.
The high-quality performance of the compliant sensor stems from the output voltage
prole generated by the sensor due to the applied external forces, which has a very
similar output voltage prole to the reference force/torque sensor. The resulting voltage
of the proposed sensor obtained from the z-axis force sensing element (Fz) is shown
259

in Figure 2.13 (b) when the sensor is continuously struck, generating a high frequency
normal force ranging between -5 N and +25 N. Figure 2.13 illustrates the force along the
z-axis for both the reference sensor (a) using a strain gauge element and the proposed
sensor (b), all as output voltages over time. This illustrates the dierence between
voltages as a change in magnitude and a shift in phase while the curvature of the lines
exhibit the same voltage versus time prole.
260

Figure 2.13: A comparison between the resulting output voltages. (a) shows the outputvoltage data recorded from the reference sensor. (b) demonstrates the resulting outputvoltage of the proposed sensor obtained from the optical sensing element.
261
Appendix C
FBG-Based Force Sensing Elements:
Experimental Results
Data was recorded using an optical sensing analyzer, from Micron Optics, USA. Si720
is high accuracy, high resolution, high power FBG interrogation system that can be
used in various applications of ber optic sensors. The system has a built-in monitor
which provides the user with full understanding of the ber Bragg grating spectrum and
shows how the reected Bragg wavelength shifts when the physical condition changes.
This optical device is used to detect the change in the reected Brag wavelength of the
proposed sensor. Since the recording speed of the optical sensing analyzer is around
2.5 Hz, the sampling rate of the ATI 6-Axis force and torque sensor is set to the same
as the optical sensing analyzer. Figure 3.2 shows the si720 FBG integration system.
Figure 3.2 shows the si720 FBG integration system.
262

Figure 3.1: Experimental setup used for online force data recording. The developedsensor is attached to the ATI 6-axis F/T sensor reference from Industrial Automation.the proposed sensor is connected to si720 optical analyser and the refrence dataacquired using Real-Time Simulink, MATLAB, for a comparison.
Figure 3.2: FBG integration system: optical sensing analyzer, Si720 Micron Optics.The system is used to detect the change reected Bragg wavelength as a result of theapplied force.
263

Figure 3.3: the measured reected power versus the generated wavelength for thefabricated ber Bragg grating along the optical ber. This strong resonance is referredto as Bragg resonance which is created due this particular FBG.
Figure 3.4: Normal force sensing element response due to the applied normal forcealong the z-axis. A comparison between the performance of a simple linear least squaresoptimization and a spline function.
264
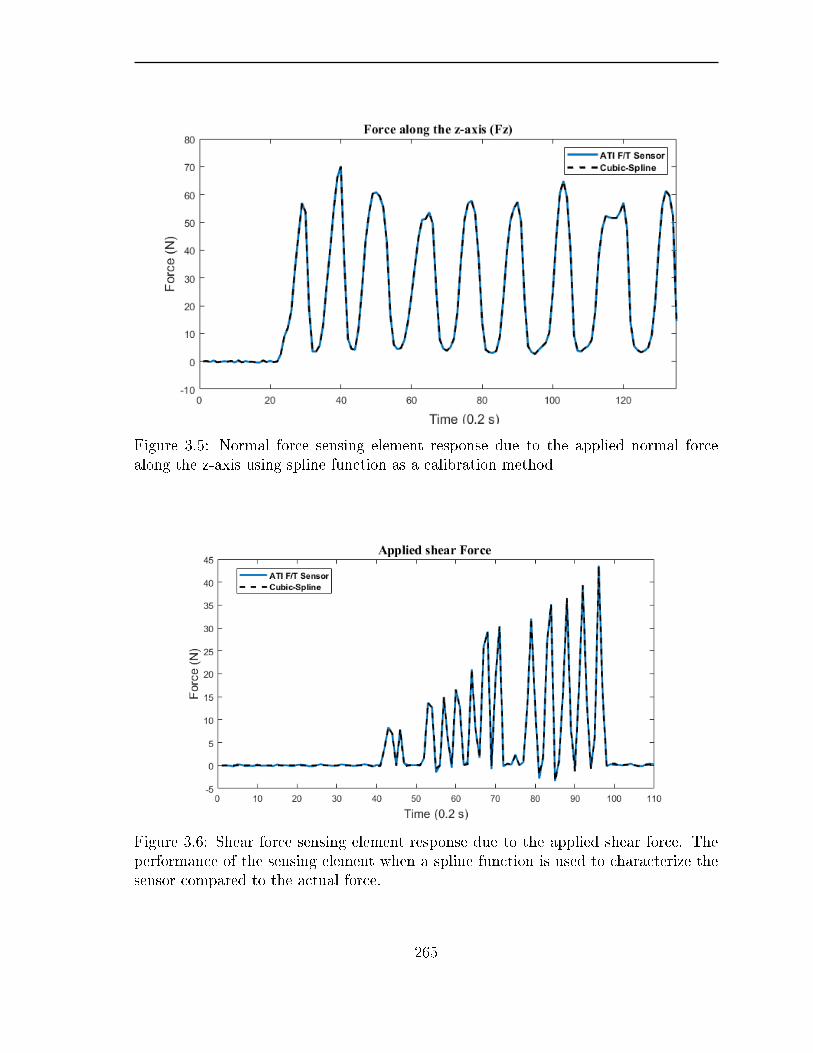
Figure 3.5: Normal force sensing element response due to the applied normal forcealong the z-axis using spline function as a calibration method
Figure 3.6: Shear force sensing element response due to the applied shear force. Theperformance of the sensing element when a spline function is used to characterize thesensor compared to the actual force.
265

Figure 3.7: Shear force sensing element response due to the applied shear forcecompared to the actual force measured by ATI force and torque sensor.
266

7/28/2019 Rightslink® by Copyright Clearance Center
https://s100.copyright.com/AppDispatchServlet#formTop 1/1
Title: A Compliant 3-Axis Fiber-OpticForce Sensor for BiomechanicalMeasurement
Author: [::Osama::] [::Al-Mai::];Mojtaba Ahmadi; Jacques Albert
Publication: IEEE Sensors JournalPublisher: IEEEDate: 15 Oct.15, 2017Copyright © 2017, IEEE
LOGINLOGIN
If you're a copyright.comuser, you can login toRightsLink using yourcopyright.com credentials.Already a RightsLink user orwant to learn more?
Thesis / Dissertation Reuse
The IEEE does not require individuals working on a thesis to obtain a formal reuse license, however,you may print out this statement to be used as a permission grant:
Requirements to be followed when using any portion (e.g., figure, graph, table, or textual material) of an IEEEcopyrighted paper in a thesis:
1) In the case of textual material (e.g., using short quotes or referring to the work within these papers) usersmust give full credit to the original source (author, paper, publication) followed by the IEEE copyright line © 2011IEEE. 2) In the case of illustrations or tabular material, we require that the copyright line © [Year of originalpublication] IEEE appear prominently with each reprinted figure and/or table. 3) If a substantial portion of the original paper is to be used, and if you are not the senior author, also obtain thesenior author's approval.
Requirements to be followed when using an entire IEEE copyrighted paper in a thesis:
1) The following IEEE copyright/ credit notice should be placed prominently in the references: © [year of originalpublication] IEEE. Reprinted, with permission, from [author names, paper title, IEEE publication title, andmonth/year of publication] 2) Only the accepted version of an IEEE copyrighted paper can be used when posting the paper or your thesison-line.3) In placing the thesis on the author's university website, please display the following message in a prominentplace on the website: In reference to IEEE copyrighted material which is used with permission in this thesis, theIEEE does not endorse any of [university/educational entity's name goes here]'s products or services. Internal orpersonal use of this material is permitted. If interested in reprinting/republishing IEEE copyrighted material foradvertising or promotional purposes or for creating new collective works for resale or redistribution, please go tohttp://www.ieee.org/publications_standards/publications/rights/rights_link.html to learn how to obtain a Licensefrom RightsLink.
If applicable, University Microfilms and/or ProQuest Library, or the Archives of Canada may supply single copiesof the dissertation.
Copyright © 2019 Copyright Clearance Center, Inc. All Rights Reserved. Privacy statement. Terms and Conditions. Comments? We would like to hear from you. E-mail us at [email protected]
267

7/28/2019 Rightslink® by Copyright Clearance Center
https://s100.copyright.com/AppDispatchServlet#formTop 1/1
Title: Design, Development andCalibration of a Lightweight,Compliant Six-Axis OpticalForce/Torque Sensor
Author: [::Osama::] [::Al-Mai::];Mojtaba Ahmadi; Jacques Albert
Publication: IEEE Sensors JournalPublisher: IEEEDate: 1 Sept.1, 2018Copyright © 2018, IEEE
LOGINLOGIN
If you're a copyright.comuser, you can login toRightsLink using yourcopyright.com credentials.Already a RightsLink user orwant to learn more?
Thesis / Dissertation Reuse
The IEEE does not require individuals working on a thesis to obtain a formal reuse license, however,you may print out this statement to be used as a permission grant:
Requirements to be followed when using any portion (e.g., figure, graph, table, or textual material) of an IEEEcopyrighted paper in a thesis:
1) In the case of textual material (e.g., using short quotes or referring to the work within these papers) usersmust give full credit to the original source (author, paper, publication) followed by the IEEE copyright line © 2011IEEE. 2) In the case of illustrations or tabular material, we require that the copyright line © [Year of originalpublication] IEEE appear prominently with each reprinted figure and/or table. 3) If a substantial portion of the original paper is to be used, and if you are not the senior author, also obtain thesenior author's approval.
Requirements to be followed when using an entire IEEE copyrighted paper in a thesis:
1) The following IEEE copyright/ credit notice should be placed prominently in the references: © [year of originalpublication] IEEE. Reprinted, with permission, from [author names, paper title, IEEE publication title, andmonth/year of publication] 2) Only the accepted version of an IEEE copyrighted paper can be used when posting the paper or your thesison-line.3) In placing the thesis on the author's university website, please display the following message in a prominentplace on the website: In reference to IEEE copyrighted material which is used with permission in this thesis, theIEEE does not endorse any of [university/educational entity's name goes here]'s products or services. Internal orpersonal use of this material is permitted. If interested in reprinting/republishing IEEE copyrighted material foradvertising or promotional purposes or for creating new collective works for resale or redistribution, please go tohttp://www.ieee.org/publications_standards/publications/rights/rights_link.html to learn how to obtain a Licensefrom RightsLink.
If applicable, University Microfilms and/or ProQuest Library, or the Archives of Canada may supply single copiesof the dissertation.
Copyright © 2019 Copyright Clearance Center, Inc. All Rights Reserved. Privacy statement. Terms and Conditions. Comments? We would like to hear from you. E-mail us at [email protected]
268

7/28/2019 Rightslink® by Copyright Clearance Center
https://s100.copyright.com/AppDispatchServlet#formTop 1/1
Title: A 6 DoF, Wearable, CompliantShoe Sensor for Total GroundReaction Measurement
Author: Stephanie Eng; [::Osama::][::Al-Mai::]; Mojtaba Ahmadi
Publication: Instrumentation andMeasurement, IEEE Transactionson
Publisher: IEEEDate: Nov. 2018Copyright © 2018, IEEE
LOGINLOGIN
If you're a copyright.comuser, you can login toRightsLink using yourcopyright.com credentials.Already a RightsLink user orwant to learn more?
Thesis / Dissertation Reuse
The IEEE does not require individuals working on a thesis to obtain a formal reuse license, however,you may print out this statement to be used as a permission grant:
Requirements to be followed when using any portion (e.g., figure, graph, table, or textual material) of an IEEEcopyrighted paper in a thesis:
1) In the case of textual material (e.g., using short quotes or referring to the work within these papers) usersmust give full credit to the original source (author, paper, publication) followed by the IEEE copyright line © 2011IEEE. 2) In the case of illustrations or tabular material, we require that the copyright line © [Year of originalpublication] IEEE appear prominently with each reprinted figure and/or table. 3) If a substantial portion of the original paper is to be used, and if you are not the senior author, also obtain thesenior author's approval.
Requirements to be followed when using an entire IEEE copyrighted paper in a thesis:
1) The following IEEE copyright/ credit notice should be placed prominently in the references: © [year of originalpublication] IEEE. Reprinted, with permission, from [author names, paper title, IEEE publication title, andmonth/year of publication] 2) Only the accepted version of an IEEE copyrighted paper can be used when posting the paper or your thesison-line.3) In placing the thesis on the author's university website, please display the following message in a prominentplace on the website: In reference to IEEE copyrighted material which is used with permission in this thesis, theIEEE does not endorse any of [university/educational entity's name goes here]'s products or services. Internal orpersonal use of this material is permitted. If interested in reprinting/republishing IEEE copyrighted material foradvertising or promotional purposes or for creating new collective works for resale or redistribution, please go tohttp://www.ieee.org/publications_standards/publications/rights/rights_link.html to learn how to obtain a Licensefrom RightsLink.
If applicable, University Microfilms and/or ProQuest Library, or the Archives of Canada may supply single copiesof the dissertation.
Copyright © 2019 Copyright Clearance Center, Inc. All Rights Reserved. Privacy statement. Terms and Conditions. Comments? We would like to hear from you. E-mail us at [email protected]
269