
Design and Modeling of One Refrigeration Ton Solar Assisted Adsorption Air Conditioning System
9
M. Alkhair 1 Solar Energy Research Institute (SERI), Universiti Kebangsaan Malaysia, Bangi 43600, Selangor, Malaysia e-mail: [email protected] M. Y. Sulaiman Solar Energy Research Institute (SERI), Universiti Kebangsaan Malaysia, Bangi 43600, Selangor, Malaysia K. Sopian Solar Energy Research Institute (SERI), Universiti Kebangsaan Malaysia, Bangi 43600, Selangor, Malaysia C. H. Lim Solar Energy Research Institute (SERI), Universiti Kebangsaan Malaysia, Bangi 43600, Selangor, Malaysia E. Salleh Solar Energy Research Institute (SERI), Universiti Kebangsaan Malaysia, Bangi 43600, Selangor, Malaysia S. Mat Solar Energy Research Institute (SERI), Universiti Kebangsaan Malaysia, Bangi 43600, Selangor, Malaysia B. B. Saha Kyushu University, Program for Leading Graduate Schools, Green Asia Education Center, Kasuga-Koen 6-1, Kasuga-Shi, Fukuoka 816-8580, Japan Design and Modeling of One Refrigeration Ton Solar Assisted Adsorption Air Conditioning System The modeling of the performance of a one refrigeration ton (RT) solar assisted adsorp- tion air-conditioning refrigeration system using activated carbon fiber/ethanol as the adsorbent/adsorbate pair has been undertaken in this study. The effects of hot water, cooling water, chilled water inlet temperatures, and hot water and chilled water flow rates were taken into consideration in the optimization of the system and in the design of the condenser, evaporator, and hot water storage tank. The study includes analysis of the weather data and its effect on both the adsorption system and the cooling load. This is then followed by estimation of the cooling capacity and coefficient of performance (COP) of the adsorption system as a function of the input parameters. The results of the model will be compared to experimental data in a next step. [DOI: 10.1115/1.4027964] Keywords: solar energy, adsorption air conditioning, activated carbon fiber/ethanol, cooling load 1 Introduction Solar radiation is a sustainable and clean source of energy of the world. Many technologies use this source of energy to com- pensate for the ever increasing price of fuel [1]. One of these tech- nologies is the solar cooling, which is compatible with this type of free energy source [2]. Solar cooling system introduces processes that are benign to the environment due to its zero rate of ozone depletion potential (ODP) and low effect on global warming potential, compared to other standard technology such as vapor compression [3]. The adsorption cooling system is even friendlier to the environment because it uses no moving parts, no corrosion, no noise, and utilizing low source temperature. The only disad- vantage is its low COP and cooling power [4]. In the adsorption cooling system, the interaction occurs between solid and fluid under thermal gradient and the cycles are induced by controlling the valves. The driving components are heat exchangers [5]. Adsorption cooling systems differ from each other in the adsorbate/refrigerant used. Silica gel–water, zeolite–water, activated carbon–ammonia, activated carbon– methanol, and activated carbon fiber–ammonia have all been used as the working pairs and the summary of the related work is given in Table 1. For continuous supply of cooling load the number of adsorption beds must be more than one. Saha et al. [16] studied the perform- ance of the two bed adsorption system using waste heat as the source of power. Li Yong and Sumathy [17] established a model of simple lumped parameter of two adsorption bed to analyze the thermal performance of the solar adsorption air conditioning sys- tem, using flat plate solar collector as heat source. In this study, the model and simulation of two adsorption beds solar air conditioning system were carried out to find the thermal performance of one RT system. The effect of hot water, cooling water, and chilled water inlet temperatures, and the effect of hot water and chilled water flow rates are examined. In addition, the analysis of the weather data and its effect on the cooling load was also carried out. 2 System Layout The schematic layout of the two adsorption bed solar air condi- tioning system under construction is shown in Figs. 1(a) and 1(b). It consists of: (1) evacuated tube collectors; (2) hot water storage 1 Corresponding author. Contributed by the Solar Energy Division of ASME for publication in the JOURNAL OF SOLAR ENERGY ENGINEERING:INCLUDING WIND ENERGY AND BUILDING ENERGY CONSERVATION. Manuscript received January 21, 2014; final manuscript received June 18, 2014; published online July 29, 2014. Editor: Gilles Flamant. Journal of Solar Energy Engineering FEBRUARY 2015, Vol. 137 / 011005-1 Copyright V C 2015 by ASME Downloaded From: http://solarenergyengineering.asmedigitalcollection.asme.org/ on 10/29/2014 Terms of Use: http://asme.org/terms
Transcript of Design and Modeling of One Refrigeration Ton Solar Assisted Adsorption Air Conditioning System

M. Alkhair1
Solar Energy Research Institute (SERI),
Universiti Kebangsaan Malaysia,
Bangi 43600, Selangor, Malaysia
e-mail: [email protected]
M. Y. SulaimanSolar Energy Research Institute (SERI),
Universiti Kebangsaan Malaysia,
Bangi 43600, Selangor, Malaysia
K. SopianSolar Energy Research Institute (SERI),
Universiti Kebangsaan Malaysia,
Bangi 43600, Selangor, Malaysia
C. H. LimSolar Energy Research Institute (SERI),
Universiti Kebangsaan Malaysia,
Bangi 43600, Selangor, Malaysia
E. SallehSolar Energy Research Institute (SERI),
Universiti Kebangsaan Malaysia,
Bangi 43600, Selangor, Malaysia
S. MatSolar Energy Research Institute (SERI),
Universiti Kebangsaan Malaysia,
Bangi 43600, Selangor, Malaysia
B. B. SahaKyushu University,
Program for Leading Graduate Schools,
Green Asia Education Center,
Kasuga-Koen 6-1, Kasuga-Shi,
Fukuoka 816-8580, Japan
Design and Modeling of OneRefrigeration Ton SolarAssisted Adsorption AirConditioning SystemThe modeling of the performance of a one refrigeration ton (RT) solar assisted adsorp-tion air-conditioning refrigeration system using activated carbon fiber/ethanol as theadsorbent/adsorbate pair has been undertaken in this study. The effects of hot water,cooling water, chilled water inlet temperatures, and hot water and chilled water flowrates were taken into consideration in the optimization of the system and in the design ofthe condenser, evaporator, and hot water storage tank. The study includes analysis of theweather data and its effect on both the adsorption system and the cooling load. This isthen followed by estimation of the cooling capacity and coefficient of performance (COP)of the adsorption system as a function of the input parameters. The results of the modelwill be compared to experimental data in a next step. [DOI: 10.1115/1.4027964]
Keywords: solar energy, adsorption air conditioning, activated carbon fiber/ethanol,cooling load
1 Introduction
Solar radiation is a sustainable and clean source of energy ofthe world. Many technologies use this source of energy to com-pensate for the ever increasing price of fuel [1]. One of these tech-nologies is the solar cooling, which is compatible with this type offree energy source [2]. Solar cooling system introduces processesthat are benign to the environment due to its zero rate of ozonedepletion potential (ODP) and low effect on global warmingpotential, compared to other standard technology such as vaporcompression [3]. The adsorption cooling system is even friendlierto the environment because it uses no moving parts, no corrosion,no noise, and utilizing low source temperature. The only disad-vantage is its low COP and cooling power [4].
In the adsorption cooling system, the interaction occursbetween solid and fluid under thermal gradient and the cycles areinduced by controlling the valves. The driving components areheat exchangers [5]. Adsorption cooling systems differ fromeach other in the adsorbate/refrigerant used. Silica gel–water,
zeolite–water, activated carbon–ammonia, activated carbon–methanol, and activated carbon fiber–ammonia have all been usedas the working pairs and the summary of the related work is givenin Table 1.
For continuous supply of cooling load the number of adsorptionbeds must be more than one. Saha et al. [16] studied the perform-ance of the two bed adsorption system using waste heat as thesource of power. Li Yong and Sumathy [17] established a modelof simple lumped parameter of two adsorption bed to analyze thethermal performance of the solar adsorption air conditioning sys-tem, using flat plate solar collector as heat source.
In this study, the model and simulation of two adsorption bedssolar air conditioning system were carried out to find the thermalperformance of one RT system. The effect of hot water, coolingwater, and chilled water inlet temperatures, and the effect of hotwater and chilled water flow rates are examined. In addition, theanalysis of the weather data and its effect on the cooling load wasalso carried out.
2 System Layout
The schematic layout of the two adsorption bed solar air condi-tioning system under construction is shown in Figs. 1(a) and 1(b).It consists of: (1) evacuated tube collectors; (2) hot water storage
1Corresponding author.Contributed by the Solar Energy Division of ASME for publication in the
JOURNAL OF SOLAR ENERGY ENGINEERING: INCLUDING WIND ENERGY AND BUILDING
ENERGY CONSERVATION. Manuscript received January 21, 2014; final manuscriptreceived June 18, 2014; published online July 29, 2014. Editor: Gilles Flamant.
Journal of Solar Energy Engineering FEBRUARY 2015, Vol. 137 / 011005-1Copyright VC 2015 by ASME
Downloaded From: http://solarenergyengineering.asmedigitalcollection.asme.org/ on 10/29/2014 Terms of Use: http://asme.org/terms

tank; (3) cool water storage tanks; (4) cooling towers; (5) adsorberbeds; (6) condenser; (7) evaporator; (8) valves; (9) water pumps;(10) connecting pipes; and (11) temperature and pressure sensors.The description of each components and the empirical perform-ance of the complete system will be reported at a later stage.
3 Mathematical Model
A simulation program was developed using MATLAB program tocalculate the cooling capacity and COP of the system according tothe operating parameters. The four phases of the adsorption cycleare shown in Fig. 2, and consists of isosteric heating, desorption,isosteric cooling, and adsorption. In phase I (isosteric heating), theadsorber was heated from Ta to Tb with constant adsorbent con-centration with increasing of pressure from Pevap to Pcond. Inphase II (desorption process), after passing the refrigerant to thecondenser, the ethanol will condensate at a pressure of Pcond asthe temperature will decrease from Tb to Tc with decreasing theconcentration from its maximum value to the minimum. Phase III(isosteric cooling), the adsorbent was cooled from Tc to Td at con-stant concentration Wmin as the pressure is also decreased to Pevap.Phase IV (adsorption process), the ethanol vapor was evaporatedin the evaporator at constant pressure Pevap with increasing theconcentration to its maximum value again. The equilibriumuptake of the activated carbon fiber–ethanol pair is given by theDubinin–Astakhov (D–A) expression
W ¼ Wo exp � RT
Eln
ps
p
� �� �n� �(1)
where Wo, n, and E for the activated carbon fiber/ethanol pairwere found to be 0.797 kg kg�1, 2, and 138 kJ kg�1, respectively,El-Sharkawy et al. [18].
3.1 Adsorption Isotherm. The adsorption rate was estimatedusing Eq. (2). Saha et al. [16] found a relation between ksav, andthe constant of time diffusion Ds/R
2p this is given in Eq. (3).
El-Sharkawy and co-workers [19] studied the kinetics of theactivated carbon fiber/ethanol pair using the thermo-gravimetricanalyzer. It was found that the numerical value of Fo was 11. Thesurface diffusion Ds can be found using Eq. (4). The values ofEa and Dso were found to be 306.7� 103 and 1.8� 10�12,respectively.
@w
@t¼ ksav W � wð Þ (2)
ksav ¼ Fo
Ds
R2p
(3)
Ds ¼ Dso exp � Ea
RT
� �(4)
3.2 Isosteric Heat of Adsorption. El-Sharkawy [20] calcu-lated the isosteric heat of adsorption for the activated carbon fiber/ethanol pair, and it can be described by the following equation:
DHst � hfg
� E
¼ ln Wo=Wð Þ½ �1=nþ a T=Tcð Þb (5)
where a¼ 6.717, b¼ 9.75.
3.3 Adsorption and Desorption Energy Balance. For theanalysis of the solar adsorption system, a simple lumped modelproposed by Li Yong [17] was used
MCp
� bed
eff
dTbedi
drþ mCp
�i�phase
dTbedi
dt
¼ [Macf
dwbedi
dt
� �DHstð Þ � _mCp
� j
Tj;o � Tj;in
� (6)
In the above equation, ؼ 0 for isosteric cooling and heating, andؼ 1 for adsorption/desorption, i indicates adsorption/desorptionbed, and j the cooling/heating source. The left hand side of Eq. (6)represents the rate of change of internal energy, where this rateoccurs due to the thermal mass of activated carbon fiber, ethanol,as well as the heat exchanger during the adsorption/desorptionprocess. The first term in the right hand side of the above equationrepresents the release of adsorption heat during desorption pro-cess, while the second term represents the total heat released tothe cooling water during adsorption. The first term represents theheat input during desorption process, and the second term mayrepresent the heat released by the hot water during desorption pro-cess. Therefore, for the small difference in temperature that occursduring cooling/heating fluid like water, the outlet temperature ofthe heat source is good enough to be modeled by the (LMTD)method, this is given by the following equation:
Table 1 Summary of related work on solar adsorption cooling system
Source Refrigeration pair System description Remarks
Aghbalou et al. [6] Activated carbon/ammonia Contribution of heat and mass transfer into porousmedium and analysis of thermal performance
Improving COP from 0.144 to 0.162(14.37%)
Khattab [7] Charcoal/Methanol Modified glass tube with sorbtion bed at one end, andcombined condenser–evaporator on the other end
COP¼ 0.136 and 0.159 for cold andhot climate, respectively
Hildbrand [8] Silica gel/water Flat plate collector of 2 m2 double glazing air cooledcondenser
COP¼ 0.10 and 0.25 with meanvalue of 0.16
Lemmini [9] Activated carbon/methanol Flat plate collector, condenser, and cold-chamberevaporator. The connection between the parts is flexibletubes covered with fins
COP¼ 0.05–0.06 for cooling energy/solar energy range of 5 and 8% for12,000 and 27,000 kJ/m2
Luo [10] Activated carbon/methanol Combined flat plate adsorbent bed with no valves in thecycle. The condensation heat exchanger was immersedin water tank
COP¼ 0.083–0.127
Luo [11] Silica gel/water Adsorption chiller used for grain cooling storage COP¼ 0.1–0.13
Anyanwu [12] Activated carbon/methanol Transient analysis and performance of adsorptionrefrigerator using finite element transformation
COP¼ 0.06,improving by 9% withevaporator temperature of 5 �C
Manuel [13] Activated carbon/methanol Combination of parabolic trough concentrator withadsorption system
COP¼ 0.078–0.096
Khan [14] Silica gel/water Computer simulation of multi bed adsorption chillerdriver by solar waste heat with mass recovery
Higher COP than no mass recoverysystem with 65 �C sourcetemperature
Ogueke [15] Activated carbon/methanol Effect of different collector design parameters on theperformance of adsorption system
COP improvement by 29–38%
011005-2 / Vol. 137, FEBRUARY 2015 Transactions of the ASME
Downloaded From: http://solarenergyengineering.asmedigitalcollection.asme.org/ on 10/29/2014 Terms of Use: http://asme.org/terms

Fig. 1 (a) Schematic diagram of the adsorption system and (b) experimental apparatus of the adsorption system
Journal of Solar Energy Engineering FEBRUARY 2015, Vol. 137 / 011005-3
Downloaded From: http://solarenergyengineering.asmedigitalcollection.asme.org/ on 10/29/2014 Terms of Use: http://asme.org/terms
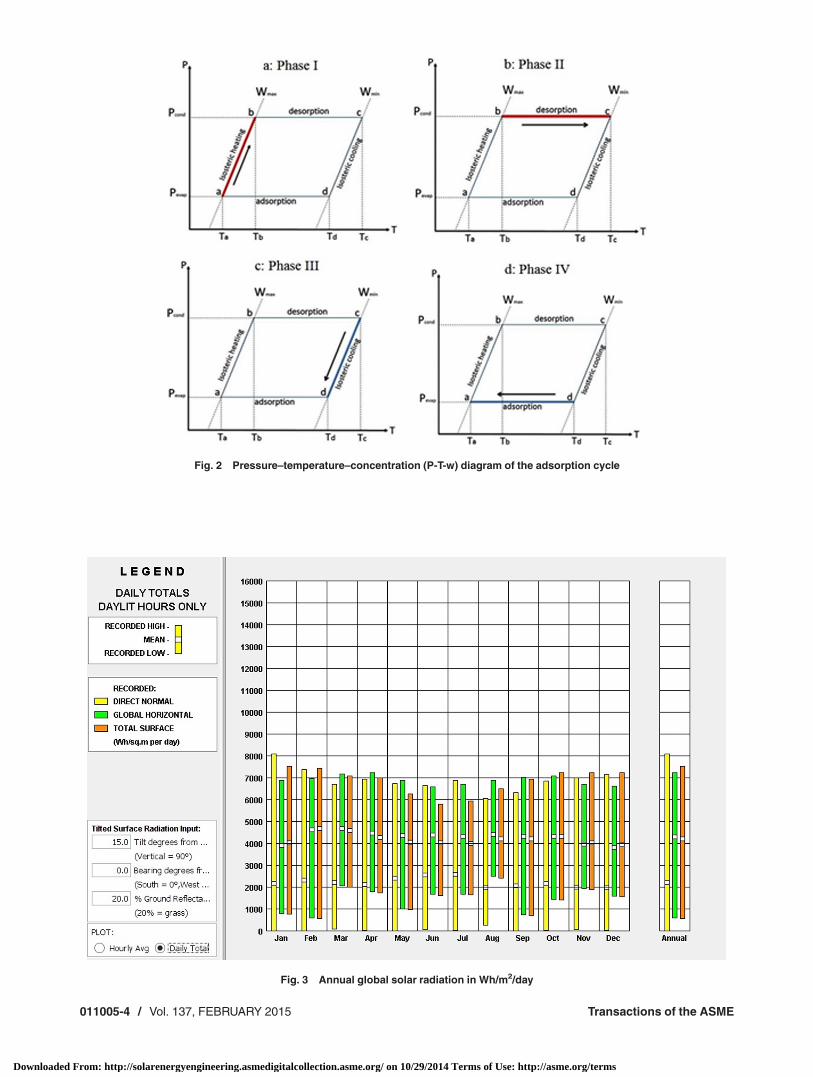
Fig. 2 Pressure–temperature–concentration (P-T-w) diagram of the adsorption cycle
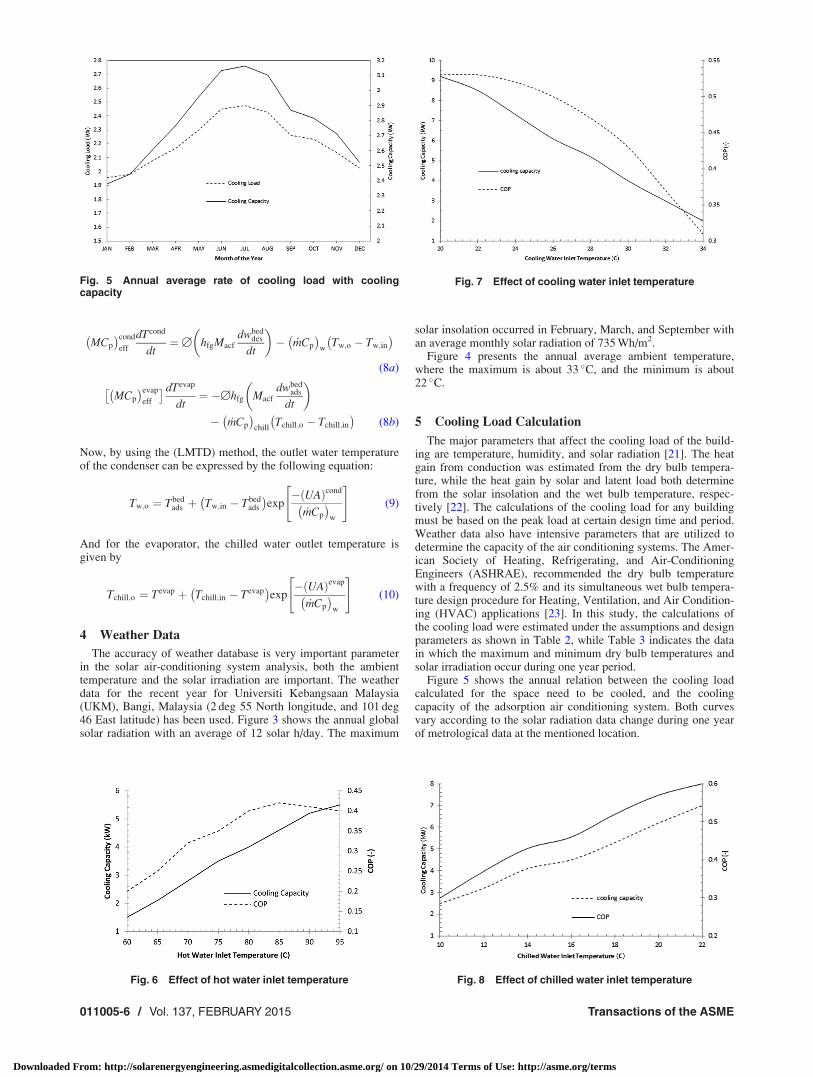
Fig. 3 Annual global solar radiation in Wh/m2/day
011005-4 / Vol. 137, FEBRUARY 2015 Transactions of the ASME
Downloaded From: http://solarenergyengineering.asmedigitalcollection.asme.org/ on 10/29/2014 Terms of Use: http://asme.org/terms

Tj;o ¼ Tbedi þ Tj;in � Tbed
i
� exp
� UAð Þbedi
_mCp
� j
" #(7)
From the above equation, Abed and Ubed represent the heat transferarea and the overall heat transfer coefficient, respectively.
3.4 Condenser and Evaporator Energy Balance. A shelland tube heat exchanger type were used as a condenser, where thephase of the ethanol is converted from vapor to liquid, and thenflows to the evaporator using a capillary tube. Equations 8(a) and8(b) represent the combined model of condenser or evaporatorwith the desorption thermodynamic and the pressure differencebetween condenser and evaporator. The energy balance for thecondenser can be expressed by
Fig. 4 Annual average ambient temperature
Table 2 Cooling load design parameters
Design parameters Value Remarks
WeatherDesign DB temperature 34.5 �C —Design WB temperature 25.6 �C —Atmospheric clearness number 0.85 Cloudy climateAverage ground reflectiveness 0.2 Grass groundSoil conductivity 1.385 W/m/K Muddy groundBuildingArea 15 m2 —Space usage Education Computer labNo. of level 1 Ground floorOccupation 2 Student
Table 3 Maximum and minimum weather data days
Highest dry-bulb Lowest dry-bulb Maximum total Minimum totalMonth temperature temperature solar solar
January Jan. 25, 1500 Jan. 30, 0600 Jan. 25 Jan. 13February Feb. 21, 1400 Feb. 3, 0600 Feb. 3 Feb. 8March Mar. 26, 1500 Mar. 5, 0600 Mar. 25 Mar. 12April Apr. 1, 1400 Apr. 29, 0600 Apr. 2 Apr. 27May May 21, 1400 May 7, 0300 May 8 May 19June Jun. 24, 1400 Jun. 29, 0500 Jun. 2 Jun. 26July Jul. 3, 1400 Jul. 14, 0600 Jul. 7 Jul. 12August Aug. 1, 1500 Aug. 25, 0500 Aug. 31 Aug. 25September Sept. 29, 1300 Sept. 1, 0300 Sept. 7 Sept. 17October Oct. 10, 1200 Oct. 12, 0500 Oct. 5 Oct 11November Nov. 6, 1500 Nov. 6, 0500 Nov. 6 Nov. 2December Dec. 27, 1400 Dec. 3, 0500 Dec. 24 Dec. 16
Journal of Solar Energy Engineering FEBRUARY 2015, Vol. 137 / 011005-5
Downloaded From: http://solarenergyengineering.asmedigitalcollection.asme.org/ on 10/29/2014 Terms of Use: http://asme.org/terms
MCp
� cond
eff
dTcond
dt¼ [ hfgMacf
dwbeddes
dt
� �� _mCp
� w
Tw;o � Tw;in
� (8a)
MCp
� evap
eff
� dTevap
dt¼ �[hfg Macf
dwbedads
dt
� �� _mCp
� chill
Tchill;o � Tchill;in
� (8b)
Now, by using the (LMTD) method, the outlet water temperatureof the condenser can be expressed by the following equation:
Tw;o ¼ Tbedads þ Tw;in � Tbed
ads
� exp
� UAð Þcond
_mCp
� w
" #(9)
And for the evaporator, the chilled water outlet temperature isgiven by
Tchill;o ¼ Tevap þ Tchill;in � Tevap�
exp� UAð Þevap
_mCp
� w
" #(10)
4 Weather Data
The accuracy of weather database is very important parameterin the solar air-conditioning system analysis, both the ambienttemperature and the solar irradiation are important. The weatherdata for the recent year for Universiti Kebangsaan Malaysia(UKM), Bangi, Malaysia (2 deg 55 North longitude, and 101 deg46 East latitude) has been used. Figure 3 shows the annual globalsolar radiation with an average of 12 solar h/day. The maximum
solar insolation occurred in February, March, and September withan average monthly solar radiation of 735 Wh/m2.
Figure 4 presents the annual average ambient temperature,where the maximum is about 33 �C, and the minimum is about22 �C.
5 Cooling Load Calculation
The major parameters that affect the cooling load of the build-ing are temperature, humidity, and solar radiation [21]. The heatgain from conduction was estimated from the dry bulb tempera-ture, while the heat gain by solar and latent load both determinefrom the solar insolation and the wet bulb temperature, respec-tively [22]. The calculations of the cooling load for any buildingmust be based on the peak load at certain design time and period.Weather data also have intensive parameters that are utilized todetermine the capacity of the air conditioning systems. The Amer-ican Society of Heating, Refrigerating, and Air-ConditioningEngineers (ASHRAE), recommended the dry bulb temperaturewith a frequency of 2.5% and its simultaneous wet bulb tempera-ture design procedure for Heating, Ventilation, and Air Condition-ing (HVAC) applications [23]. In this study, the calculations ofthe cooling load were estimated under the assumptions and designparameters as shown in Table 2, while Table 3 indicates the datain which the maximum and minimum dry bulb temperatures andsolar irradiation occur during one year period.
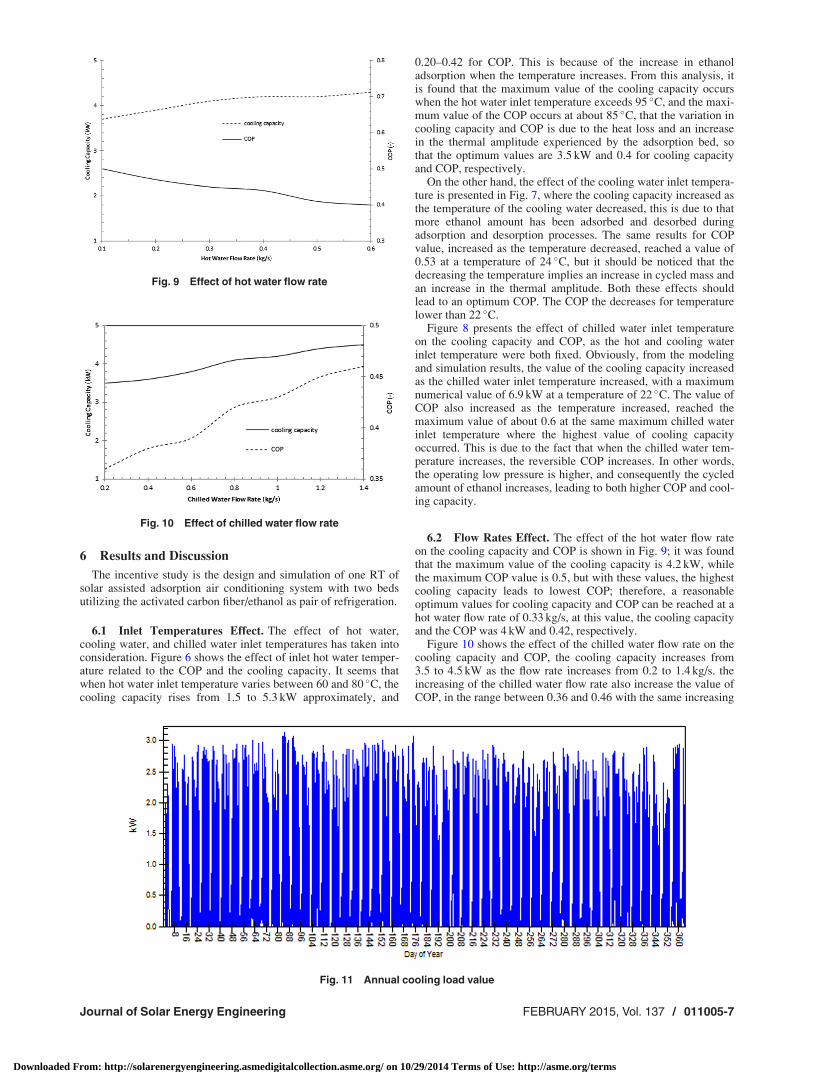
Figure 5 shows the annual relation between the cooling loadcalculated for the space need to be cooled, and the coolingcapacity of the adsorption air conditioning system. Both curvesvary according to the solar radiation data change during one yearof metrological data at the mentioned location.
Fig. 5 Annual average rate of cooling load with coolingcapacity
Fig. 6 Effect of hot water inlet temperature
Fig. 7 Effect of cooling water inlet temperature
Fig. 8 Effect of chilled water inlet temperature
011005-6 / Vol. 137, FEBRUARY 2015 Transactions of the ASME
Downloaded From: http://solarenergyengineering.asmedigitalcollection.asme.org/ on 10/29/2014 Terms of Use: http://asme.org/terms
6 Results and Discussion
The incentive study is the design and simulation of one RT ofsolar assisted adsorption air conditioning system with two bedsutilizing the activated carbon fiber/ethanol as pair of refrigeration.
6.1 Inlet Temperatures Effect. The effect of hot water,cooling water, and chilled water inlet temperatures has taken intoconsideration. Figure 6 shows the effect of inlet hot water temper-ature related to the COP and the cooling capacity. It seems thatwhen hot water inlet temperature varies between 60 and 80 �C, thecooling capacity rises from 1.5 to 5.3 kW approximately, and
0.20–0.42 for COP. This is because of the increase in ethanoladsorption when the temperature increases. From this analysis, itis found that the maximum value of the cooling capacity occurswhen the hot water inlet temperature exceeds 95 �C, and the maxi-mum value of the COP occurs at about 85 �C, that the variation incooling capacity and COP is due to the heat loss and an increasein the thermal amplitude experienced by the adsorption bed, sothat the optimum values are 3.5 kW and 0.4 for cooling capacityand COP, respectively.
On the other hand, the effect of the cooling water inlet tempera-ture is presented in Fig. 7, where the cooling capacity increased asthe temperature of the cooling water decreased, this is due to thatmore ethanol amount has been adsorbed and desorbed duringadsorption and desorption processes. The same results for COPvalue, increased as the temperature decreased, reached a value of0.53 at a temperature of 24 �C, but it should be noticed that thedecreasing the temperature implies an increase in cycled mass andan increase in the thermal amplitude. Both these effects shouldlead to an optimum COP. The COP the decreases for temperaturelower than 22 �C.
Figure 8 presents the effect of chilled water inlet temperatureon the cooling capacity and COP, as the hot and cooling waterinlet temperature were both fixed. Obviously, from the modelingand simulation results, the value of the cooling capacity increasedas the chilled water inlet temperature increased, with a maximumnumerical value of 6.9 kW at a temperature of 22 �C. The value ofCOP also increased as the temperature increased, reached themaximum value of about 0.6 at the same maximum chilled waterinlet temperature where the highest value of cooling capacityoccurred. This is due to the fact that when the chilled water tem-perature increases, the reversible COP increases. In other words,the operating low pressure is higher, and consequently the cycledamount of ethanol increases, leading to both higher COP and cool-ing capacity.
6.2 Flow Rates Effect. The effect of the hot water flow rateon the cooling capacity and COP is shown in Fig. 9; it was foundthat the maximum value of the cooling capacity is 4.2 kW, whilethe maximum COP value is 0.5, but with these values, the highestcooling capacity leads to lowest COP; therefore, a reasonableoptimum values for cooling capacity and COP can be reached at ahot water flow rate of 0.33 kg/s, at this value, the cooling capacityand the COP was 4 kW and 0.42, respectively.
Figure 10 shows the effect of the chilled water flow rate on thecooling capacity and COP, the cooling capacity increases from3.5 to 4.5 kW as the flow rate increases from 0.2 to 1.4 kg/s. theincreasing of the chilled water flow rate also increase the value ofCOP, in the range between 0.36 and 0.46 with the same increasing
Fig. 9 Effect of hot water flow rate
Fig. 10 Effect of chilled water flow rate
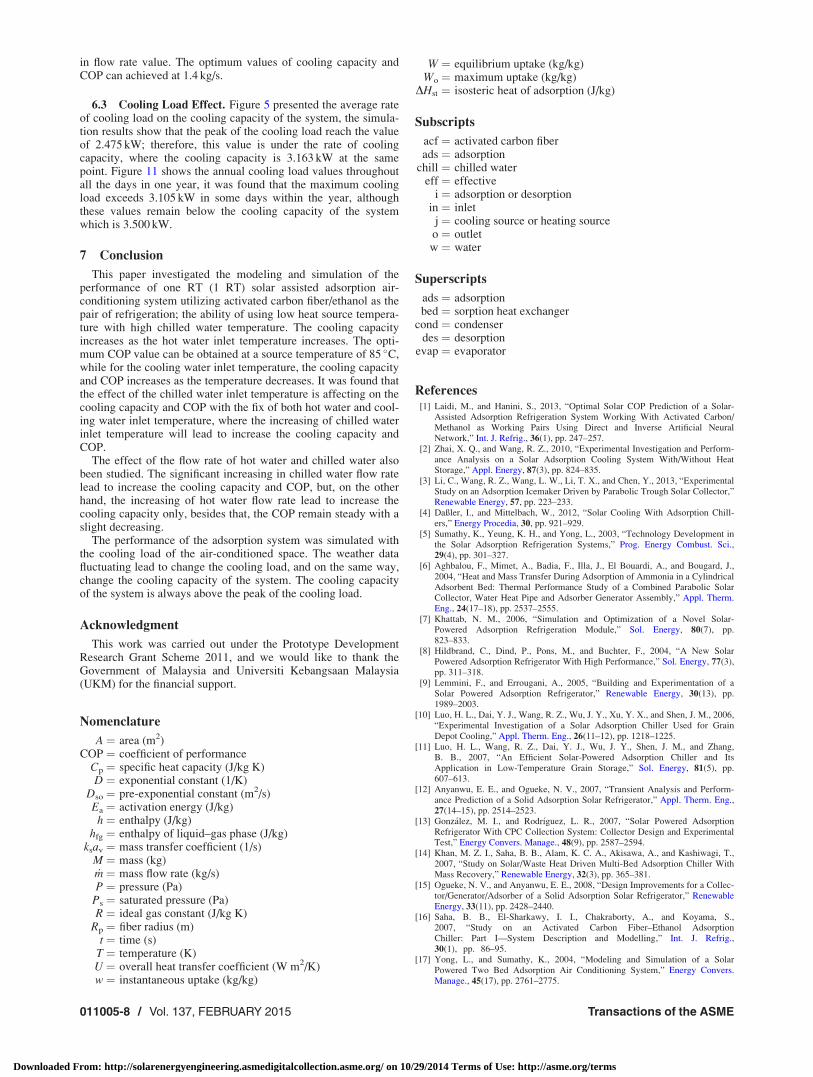
Fig. 11 Annual cooling load value
Journal of Solar Energy Engineering FEBRUARY 2015, Vol. 137 / 011005-7
Downloaded From: http://solarenergyengineering.asmedigitalcollection.asme.org/ on 10/29/2014 Terms of Use: http://asme.org/terms
in flow rate value. The optimum values of cooling capacity andCOP can achieved at 1.4 kg/s.
6.3 Cooling Load Effect. Figure 5 presented the average rateof cooling load on the cooling capacity of the system, the simula-tion results show that the peak of the cooling load reach the valueof 2.475 kW; therefore, this value is under the rate of coolingcapacity, where the cooling capacity is 3.163 kW at the samepoint. Figure 11 shows the annual cooling load values throughoutall the days in one year, it was found that the maximum coolingload exceeds 3.105 kW in some days within the year, althoughthese values remain below the cooling capacity of the systemwhich is 3.500 kW.
7 Conclusion
This paper investigated the modeling and simulation of theperformance of one RT (1 RT) solar assisted adsorption air-conditioning system utilizing activated carbon fiber/ethanol as thepair of refrigeration; the ability of using low heat source tempera-ture with high chilled water temperature. The cooling capacityincreases as the hot water inlet temperature increases. The opti-mum COP value can be obtained at a source temperature of 85 �C,while for the cooling water inlet temperature, the cooling capacityand COP increases as the temperature decreases. It was found thatthe effect of the chilled water inlet temperature is affecting on thecooling capacity and COP with the fix of both hot water and cool-ing water inlet temperature, where the increasing of chilled waterinlet temperature will lead to increase the cooling capacity andCOP.
The effect of the flow rate of hot water and chilled water alsobeen studied. The significant increasing in chilled water flow ratelead to increase the cooling capacity and COP, but, on the otherhand, the increasing of hot water flow rate lead to increase thecooling capacity only, besides that, the COP remain steady with aslight decreasing.
The performance of the adsorption system was simulated withthe cooling load of the air-conditioned space. The weather datafluctuating lead to change the cooling load, and on the same way,change the cooling capacity of the system. The cooling capacityof the system is always above the peak of the cooling load.
Acknowledgment
This work was carried out under the Prototype DevelopmentResearch Grant Scheme 2011, and we would like to thank theGovernment of Malaysia and Universiti Kebangsaan Malaysia(UKM) for the financial support.
Nomenclature
A ¼ area (m2)COP ¼ coefficient of performance
Cp ¼ specific heat capacity (J/kg K)D ¼ exponential constant (1/K)
Dso ¼ pre-exponential constant (m2/s)Ea ¼ activation energy (J/kg)h ¼ enthalpy (J/kg)
hfg ¼ enthalpy of liquid–gas phase (J/kg)ksav ¼ mass transfer coefficient (1/s)
M ¼ mass (kg)_m ¼ mass flow rate (kg/s)P ¼ pressure (Pa)
Ps ¼ saturated pressure (Pa)R ¼ ideal gas constant (J/kg K)
Rp ¼ fiber radius (m)t ¼ time (s)
T ¼ temperature (K)U ¼ overall heat transfer coefficient (W m2/K)w ¼ instantaneous uptake (kg/kg)
W ¼ equilibrium uptake (kg/kg)Wo ¼ maximum uptake (kg/kg)
DHst ¼ isosteric heat of adsorption (J/kg)
Subscripts
acf ¼ activated carbon fiberads ¼ adsorption
chill ¼ chilled watereff ¼ effective
i ¼ adsorption or desorptionin ¼ inlet
j ¼ cooling source or heating sourceo ¼ outletw ¼ water
Superscripts
ads ¼ adsorptionbed ¼ sorption heat exchanger
cond ¼ condenserdes ¼ desorption
evap ¼ evaporator
References[1] Laidi, M., and Hanini, S., 2013, “Optimal Solar COP Prediction of a Solar-
Assisted Adsorption Refrigeration System Working With Activated Carbon/Methanol as Working Pairs Using Direct and Inverse Artificial NeuralNetwork,” Int. J. Refrig., 36(1), pp. 247–257.
[2] Zhai, X. Q., and Wang, R. Z., 2010, “Experimental Investigation and Perform-ance Analysis on a Solar Adsorption Cooling System With/Without HeatStorage,” Appl. Energy, 87(3), pp. 824–835.
[3] Li, C., Wang, R. Z., Wang, L. W., Li, T. X., and Chen, Y., 2013, “ExperimentalStudy on an Adsorption Icemaker Driven by Parabolic Trough Solar Collector,”Renewable Energy, 57, pp. 223–233.
[4] Daßler, I., and Mittelbach, W., 2012, “Solar Cooling With Adsorption Chill-ers,” Energy Procedia, 30, pp. 921–929.
[5] Sumathy, K., Yeung, K. H., and Yong, L., 2003, “Technology Development inthe Solar Adsorption Refrigeration Systems,” Prog. Energy Combust. Sci.,29(4), pp. 301–327.
[6] Aghbalou, F., Mimet, A., Badia, F., Illa, J., El Bouardi, A., and Bougard, J.,2004, “Heat and Mass Transfer During Adsorption of Ammonia in a CylindricalAdsorbent Bed: Thermal Performance Study of a Combined Parabolic SolarCollector, Water Heat Pipe and Adsorber Generator Assembly,” Appl. Therm.Eng., 24(17–18), pp. 2537–2555.
[7] Khattab, N. M., 2006, “Simulation and Optimization of a Novel Solar-Powered Adsorption Refrigeration Module,” Sol. Energy, 80(7), pp.823–833.
[8] Hildbrand, C., Dind, P., Pons, M., and Buchter, F., 2004, “A New SolarPowered Adsorption Refrigerator With High Performance,” Sol. Energy, 77(3),pp. 311–318.
[9] Lemmini, F., and Errougani, A., 2005, “Building and Experimentation of aSolar Powered Adsorption Refrigerator,” Renewable Energy, 30(13), pp.1989–2003.
[10] Luo, H. L., Dai, Y. J., Wang, R. Z., Wu, J. Y., Xu, Y. X., and Shen, J. M., 2006,“Experimental Investigation of a Solar Adsorption Chiller Used for GrainDepot Cooling,” Appl. Therm. Eng., 26(11–12), pp. 1218–1225.
[11] Luo, H. L., Wang, R. Z., Dai, Y. J., Wu, J. Y., Shen, J. M., and Zhang,B. B., 2007, “An Efficient Solar-Powered Adsorption Chiller and ItsApplication in Low-Temperature Grain Storage,” Sol. Energy, 81(5), pp.607–613.
[12] Anyanwu, E. E., and Ogueke, N. V., 2007, “Transient Analysis and Perform-ance Prediction of a Solid Adsorption Solar Refrigerator,” Appl. Therm. Eng.,27(14–15), pp. 2514–2523.
[13] Gonz�alez, M. I., and Rodr�ıguez, L. R., 2007, “Solar Powered AdsorptionRefrigerator With CPC Collection System: Collector Design and ExperimentalTest,” Energy Convers. Manage., 48(9), pp. 2587–2594.
[14] Khan, M. Z. I., Saha, B. B., Alam, K. C. A., Akisawa, A., and Kashiwagi, T.,2007, “Study on Solar/Waste Heat Driven Multi-Bed Adsorption Chiller WithMass Recovery,” Renewable Energy, 32(3), pp. 365–381.
[15] Ogueke, N. V., and Anyanwu, E. E., 2008, “Design Improvements for a Collec-tor/Generator/Adsorber of a Solid Adsorption Solar Refrigerator,” RenewableEnergy, 33(11), pp. 2428–2440.
[16] Saha, B. B., El-Sharkawy, I. I., Chakraborty, A., and Koyama, S.,2007, “Study on an Activated Carbon Fiber–Ethanol AdsorptionChiller: Part I—System Description and Modelling,” Int. J. Refrig.,30(1), pp. 86–95.
[17] Yong, L., and Sumathy, K., 2004, “Modeling and Simulation of a SolarPowered Two Bed Adsorption Air Conditioning System,” Energy Convers.Manage., 45(17), pp. 2761–2775.
011005-8 / Vol. 137, FEBRUARY 2015 Transactions of the ASME
Downloaded From: http://solarenergyengineering.asmedigitalcollection.asme.org/ on 10/29/2014 Terms of Use: http://asme.org/terms

[18] El-Sharkawy, I. I., Saha, B. B., Koyama, S., He, J., Ng, K. C., and Yap, C.,2008, “Experimental Investigation on Activated Carbon–Ethanol Pair forSolar Powered Adsorption Cooling Applications,” Int. J. Refrig., 31(8), pp.1407–1413.
[19] Saha, B. B., El-Sharkawy, I. I., Chakraborty, A., and Koyama, S., 2007, “Studyon an Activated Carbon Fiber–Ethanol Adsorption Chiller: Part II—Perform-ance Evaluation,” Int. J. Refrig., 30(1), pp. 96–102.
[20] El-sharkawy, I. I. A., 2006, “Development of Adsorption Systems Powered byRenewable Energy or Waste Heat Sources,” Int. J. Eng. Technol. Adv. Eng., 3,pp. 382–388.
[21] Aktacir, M. A., B€uy€ukalaca, O., and Yılmaz, T., 2010, “A Case Study forInfluence of Building Thermal Insulation on Cooling Load and Air-ConditioningSystem in the Hot and Humid Regions,” Appl. Energy, 87(2), pp. 599–607.
[22] Qi, R., Lu, L., and Yang, H., 2012, “Impact of Climate Change on VentilationLoad and Energy Use of Air Conditioning Systems in Buildings of HongKong,” Int. J. Low-Carbon Technol., 7, pp. 303–309. Available at http://ijlct.oxfordjournals.org/content/7/4/303.abstract
[23] Li, D. H. W., Wong, S. L., and Lam, J. C., 2003, “Climatic Effects on CoolingLoad Determination in Subtropical Regions,” Energy Convers. Manage., 44,pp. 1831–1843.
Journal of Solar Energy Engineering FEBRUARY 2015, Vol. 137 / 011005-9
Downloaded From: http://solarenergyengineering.asmedigitalcollection.asme.org/ on 10/29/2014 Terms of Use: http://asme.org/terms