Desertation sadic publish
69
HUMAN INFULUENCES ON THE AQUATIC ENVIRONMENTOF LAKE WAMALA MITYANA DISTRICT BY WASWA SADIC BABYESIZA (07/ U /1311) A DESERTATION SUBMITED IN PARTIAL FULFILMENT OF THE REQUIREMENT FOR THE AWARD OF THE DEGREE OF BERCHERLOR OF SCIENCE IN CONSERVATION BIOLOGY OF MAKERERE UNIVERSITY.
-
Upload
independent -
Category
Documents
-
view
0 -
download
0
Transcript of Desertation sadic publish

HUMAN INFULUENCES ON THE AQUATIC
ENVIRONMENTOF LAKE WAMALA MITYANA DISTRICT
BY
WASWA SADIC BABYESIZA (07/ U /1311)
A DESERTATION SUBMITED IN PARTIAL FULFILMENT
OF THE REQUIREMENT FOR THE AWARD OF THE
DEGREE OF BERCHERLOR OF SCIENCE IN
CONSERVATION BIOLOGY OF MAKERERE UNIVERSITY.

JULY, 2010
DECLARATION
I, WASWA SADIC BABYESIZA declare that the work presented in
this document is entirely based on findings carried out by
me and has never been submitted in to any institution for
the award of a bachelor of science degree in Conservation
Biology.
Student: WASWA SADIC BABYESIZA
Signed:………………………………
Date:…………………………………
This report has been submitted for examination with my
approval as university supervisor
Supervisor: DR. G. MUTUMBA
Signed:………………………………
Date:…………………………………
Department of Botany
Makerere University

DEDICATION
This book is dedicated to my beloved mother Miss Harriet
Mukasa, my late father Mr. Abraham Babyesiza, my brothers,
sisters, and all my class mates.

ACKNOWLEDGEMENT
I would also like to take this opportunity to thank my
supervisor Dr. G. Mutumba for all the academic assistance
rendered to me during the research period.
I also wish to convey my sincere gratitude to Makerere
university herbarium department for all the assistance given

to me during plant identification, especially Mr.
Rwaburindore Protase.
I would also want to acknowledge the government of Uganda
for all the support given to me during my stay at Makerere
University through their government sponsorship program of
which I have been part. Through that scheme money used in
this research was provided in form of faculty allowance.
Last but not least I wish to dearly thank my mother Miss
Harriet Mukasa and all my family members for all the
emotional, spiritual and financial support given to me
during my stay in university.

ABSTRACT
Macrophytes on Ugandan lakes have been greatly affected by
human activities however no much research has been done to
document how human activities affect the environment around
our lakes.
Macrophytes serve an important role in the ecology of
wetlands. However over the years macrophytes around lakes
have been severely affected by human activity making many
lakes greatly silted hence reducing their productivity. This
research was done to identify the activities that are
affecting macrophytes and identify alternatives for the
local people.
The sample included all vegetation growing Lake Wamala in
Butebi and Bukanaga landing site. Plant pressers, polythene
bags, tape measures and soil auger were some of the
instruments used in data collection.
Two sites with different levels of human activities along
the shores of Lake Wamala were used as study areas (Butebi
active site and Bukanaga less active site). Sample plots
were randomly put along the shore from which data was
collected.
It was discovered that Butebi landing site has little
macrophyte families as compared to Bukanaga landing site

Agriculture has affected the diversity of macrophyte along
the shores of Lake Wamala this is because most land is
usually cleared to establish farming plots.
CHAPTER ONE
1.0 Back ground Information
Much of Mityana districts land is occupied by wetlands that
is 3.58% coverage of the districts land surface area.
Permanent wetlands cover 273.6 hectares while seasonal wet
lands cover 250.11 ha. In addition, a total of 117.04 of
wetlands, mainly seasonal have been reclaimed for
agriculture representing 0.8% of the districts land area.
They are divided into the following categories, lake areas
and riverine swamps. Cyperus papyrus dominates most wetland
herbaceous vegetation flooded either permanently or for most
parts of the year. They occur on the edges of Lake Wamala.

Topography
The district is characterized by isolated flat-topped hills
with steep slops, often merging abruptly into long and
gentle pediments which are usually dissected by relatively
broad valley. Mityana district is divided into two main
topographic zones, the lake Wamala zone and high land zone.
Climate
The climate shows small variation of temperature, humidity,
winds. The district experiences rain throughout the year,
with heavy rains in march-April and September- November. The
annual average rain fall is 930mm. the high altitude ensures
favorable climate with medium annual temperature ranging
from 17.2 degrees to 29 degrees centigrade.
Geology and soils.
Mityana district is underlain by both old and recent rock
systems, which include precambrian, Cenozoic and laterites.
All the three major divisions of rocks that is to say
sedimentary, igneous and metamorphic Are represented. The
Cenozoic rock extend towards lake Wamala.
The soils are generally highly productive and are mainly
sandy clay soils. The dominant soils types are red gravely
loamy with occasional murrum, raddish brown sandy loam, red
clay loam and yellowish sands with quartz gravel. The in
wetlands include gray sands whose parent material is

alluvium and hill wash, gray coarse sand from lake deposits,
black and grey clays from swamps streams and clay formed
from papyrus residue and river alluvium.
Water sheds are important sources of water for house hold
use, animal consumption and irrigation. Rivers and lakes,
play an important role in the hydrological cycle. Currently
many water sheds forests in the district especially on
private land have been degraded and deforested. This has
resulted into soil erosion, lowering of water tables,
decrease in stream and river flows silting of water bodies,
floods and reducing water quality.(district state of the
environment report Mityana 2007-2008)
Lake Wamala is one of the freshwater bodies located in
Mubende, Mpigi, Mityana and Mawokota districts of Central
Uganda, it covers a total area of 250 sq. km. It is dotted
by many islands including Lwanja, Mabo and Bagwe. It is
associated with several rivers and wetlands. The rivers
Nyanzi-kitenga, Kabasuma, Mpamujugu and Bimbye flow into the
lake, whereas river Kibimba drains westwards into Lake
Victoria. River Katonga coming from Lake Victoria flows into
Lake Wamala.
The vegetation surrounding Lake Wamala is dominated by
papyrus, other spectacular floaters and water based
vegetation. There are also trees such as Raphia and other
palms. There exist remnants of a variety of species such as

sitatunga, wild pigs, hippopotamus, bush bucks, waterbuck’s
velvet monkeys, baboons and a variety of birds such
as guinea fowls, turraco. Francolins in the forests, while a
diversity of water based birds are visible in the remaining
wetlands. Existing fish species include among others
tilapia, catfish lung fish and mud fish.
Economic activities
People along Lake Wamala mainly engage in two economic
activities, which are fishing and agriculture. Plants mainly
grown include; Sugar canes, Yams, Cassava, Sweet potatoes
and Maize
However most of the farming is subsistence besides a few
crops that are grown commercially like sugar canes and
maize. Fishing acts as the main source of revenue for most
people through sells to neighboring communities.
1.2 Statement of the Problem
Macrophytes are aquatic plants which grow in or near water
they are classified into emergent, submergent, or floating.
They occur in all wet lands. Along lakes, emergent
macrophytes act as sieves for all toxic substances that try
to enter the lake through runoffs. In lakes macrophytes
provide cover for fish and substrate for aquatic

invertebrates, produce oxygen, and act as food for some fish
and wildlife.
Wetlands in Uganda have been severely affected through human
activities such as over fishing, agriculture (use of
artificial fertilizers), over extraction of resources,
deposition of untreated wastes into wetlands, use of
herbicides and clearance of vegetation for proper navigation
on the wet lands. In so doing this has greatly affected the
population of wetland vegetation (macrophytes) yet these
plants macrophytes play an important role in the ecology of
the wetlands that’s through water purification, provide
cover for fish, act as food for fish, prevent siltation of
the water bodies (lakes) and some are also medicinal.
However most of the research done by the district
environment officers, has not shown which macrophyte
families have been affected most and why? This research will
show the dominant macrophytes and abundance, activities that
greatly impact the lake ecosystem and their influence on the
soil characteristics (PH and moisture content).
1.3 Research question
What macrophytes found on Lake Wamala?
Which plant families are found on Lake Wamala?
What is the land use along the shore?

How dose land use affect soil pH?
What are the dominant plant families?
1.4 Hypothesis
Ho: Human activities have no effect on the macrophyte
populations of Lake Wamala.
1.5 Research objectives
Main objective
Asses the abundance of macrophytes on lake Wamala.
Specific objective
To examine level of cultivation 100 meters from the
lake shore.
To determine soil pH.
To determine diversity of macrophytes.
1.6 Scope of the study
Lake Wamala is one of the freshwater bodies located in
Mubende, Mpigi and Mityana districts; it’s about 51 000 ha
(25 000 ha open water)
Coordinates: 0°12 '- 0 °25 'N/31°41 '-32°02 'E
Altitude: 1290 meters above sea level

In this research, the researcher will determine the
influence of humans on macrophytes. This he will do by
comparing two sites; an active site Butebi landing site and
a less active site Bukanaga landing site. The researcher
will also look at the soil characteristics of Lake Wamala by
taking samples of soil PH and soil moisture content.
1.7 Significance of the study
Macrophytes participate significantly in the ecological
activities of wet lands, such as sediment filtration,
control of run offs, and preventing entry of toxic
substances from the lake. Over the years macrophytes,
especially emergent macrophytes (Cyperus papyrus) along lake
Wamala have been cleared for proper navigation and
agriculture this has led to siltation of the lake causing it
to shrink in size to almost 50% from1984 to 1995 (Highlights
of the Uganda Atlas of Our Changing Environment Wetlands).
There for more research needs to be done to identify the
activities that are affecting macrophytes and identify
alternatives for the local people.

CHAPTER TWO
LITERATURE REVIEW
2.1 Classes of macrophytes
According to Omondi and Mwende (2001) macrophytes can be
subdivided into four groups on the basis of their water
requirements and habitats. Submerged macrophytes are those
that are completely covered with water. These have leaves
that tend to be thin and finely divided adapted for exchange
of nutrients with water. Floating leafed macrophytes are
those that are rooted but have floating leaves while free
floating are those that float on the water surface. The last
group is the emergent macrophytes. These are rooted plants
with their principal photosynthetic surfaces projecting
above the water. Emergent macrophytes dominate the shoreline

flora while the middle and lower littoral zones supports
stands of floating-leafed macrophytes.
education programs may need to be changed to address the
cumulative impacts to North American lakes.
2.2 Diversity and distribution of macrophytes on Ugandan
wetlands
There are over 60 km2 of swamps associated with the waters
of Lake George, especially along the northern shore of the
lake; in most swamp areas up to 97 % of the plant biomass is
papyrus (Cyperus papyrus). Tentative estimates of the plant
biomass in these swamps range from 2.5 to 4.5 kg (d.m.) m-2
(Thompson, in Burgis et al. I973). Submerged macrophytes
(Cerato- phyllum, Nymphaea, Utricularia) occur only in the
mouth and lagoons of the Nsonge River, where the water is
clear; emergent vegetation, consisting mainly of the swamp
grass Paspalidium geminatum, is sparse and of restricted
occurrence (Lock I973). The floating Nile cabbage (Pistia
stratiotes) is particularly abundant in bays on the western
side of the lake; it has a clear- cut seasonal periodicity
probably related to its cycle of seasonal reproduction
(Thompson, in Burgis et al. I973).
Arccording to Esaet., Kasenene, Orjan and Obua (2008), the
diversity of major macrophytes was assessed in cultivated

areas in Bukasa and Kinawataka wetlands in Central Uganda.
One thousand and seventy-two (1072) plots of 1 × 1 m were
established in 69 cultivated areas. Data were collected on
species richness and abundance. Two-way analysis of
covariance (ANCOVA) showed how cropping regimes affected
macrophyte species richness and abundance. There were 127
plant species belonging to 37 families in cultivated areas.
Of the 127 species, 42 were macrophytes and of the 37
families, fourteen contained macrophyte species. Plant
species diversity was higher in the short-term cropping
regime areas (11.3 species per 1 m2) than in the long-term
cropping regime areas (9.3 species per 1 m2). However,
macrophyte species richness was similar in the short-term
(3.2 species per 1 m2) and the long-term (3.3 species per
1 m2) cropping regimes. The dominant families were Poaceae,
Asteraceae and Cyperaceae with more than ten species each.
The higher plant species diversity in cultivated areas than
in uncultivated was because of non macrophyte species, thus
cropping regime does not influence macrophyte species
diversity. Increase in diversity of non macrophyte species
in short-term cropping regime implies that the use of
wetlands for agricultural crop growing may alter plant
species composition and diversity during secondary
succession.

According to Omondi and Mwende, (2001), more species of
macrophytes were found at the river mouths and sheltered
bays. This was probably so because these areas have muddy
substrates suitable for attachment and the plant nutrients
from the rivers enriched the environment. Comparison of open
water station macrophytes and gulf station ones further
shows that the distribution of macrophytes, especially
emergents, is related to the type of substrate. Stations
within the gulf were dominated by Cyperus papyrus while those
in the open waters were dominated by Phragmites australis.
Sediment deposition from
2.3 Uses of macrophytes
Macrophytes have a vast variety of uses ranging from
ecological to sociological that’s why there degradation
should be perceived as a major concern. According to Muthuri
and Kinyamario (1989). Nutritive value of papyrus (Cyperus
papyrus), a tropical emergent macrophytes. Aquatic
macrophytes have food qualities either as raw materials for
leaf protein extraction or as fodder. Aquatic macrophytes in
swamps and marshes are increasingly being recognized as the
most productive plant communities (Auclair et al. 1976;
Westlake 1963, 1975). Much as their exploitation as a source
of animal feed has received little attention.
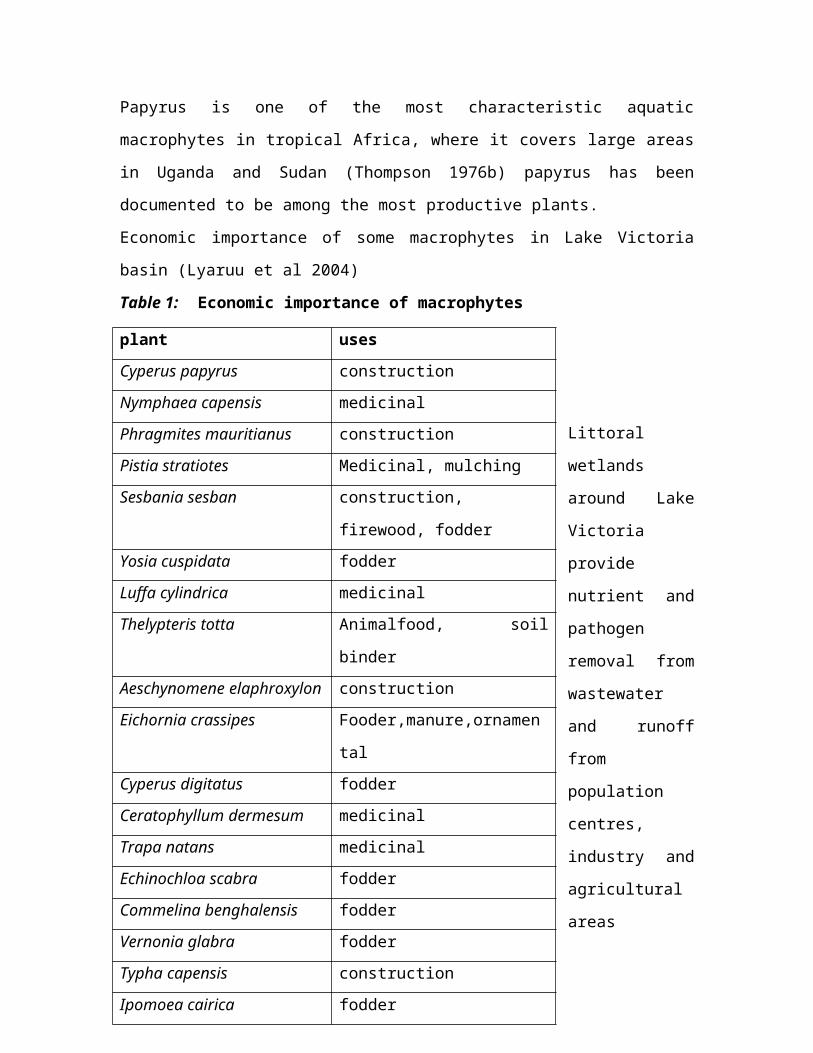
Papyrus is one of the most characteristic aquatic
macrophytes in tropical Africa, where it covers large areas
in Uganda and Sudan (Thompson 1976b) papyrus has been
documented to be among the most productive plants.
Economic importance of some macrophytes in Lake Victoria
basin (Lyaruu et al 2004)
Table 1: Economic importance of macrophytes
Littoral
wetlands
around Lake
Victoria
provide
nutrient and
pathogen
removal from
wastewater
and runoff
from
population
centres,
industry and
agricultural
areas
plant usesCyperus papyrus constructionNymphaea capensis medicinalPhragmites mauritianus constructionPistia stratiotes Medicinal, mulchingSesbania sesban construction,
firewood, fodderYosia cuspidata fodder Luffa cylindrica medicinalThelypteris totta Animalfood, soil
binderAeschynomene elaphroxylon constructionEichornia crassipes Fooder,manure,ornamen
talCyperus digitatus fodderCeratophyllum dermesum medicinalTrapa natans medicinalEchinochloa scabra fodderCommelina benghalensis fodderVernonia glabra fodderTypha capensis constructionIpomoea cairica fodder

(Kansiime and Nalubega 1999; Kansiime and van Bruggen 2001).
The ability of these wetlands to retain phosphorus and
nitrogen depends on the dominant vegetation structure and
the dispersion of runoff waters (Kansiime et al. 2003).
Under the Ecotools Project (a project that focused on
developing tools for wetland ecosystem resource management
in East Africa), an ecosystems approach was taken to
determine wetland related nutrient retention. This approach
examined the impacts of wastewater and surface runoff
entering three important Ugandan wetlands: Nabugabo, a rural
wetland in Masaka, Nakivubo in Kampala and Kirinya in Jinja.
The latter represent two urban wetlands experiencing
different anthropogenic pressures. For the urban wetlands,
the study also involved characterisation of the dominant
wetland plant species and the identification of wastewater
flow patterns within these wetlands. The urban wetlands were
further investigated through the identification of the in
situ nutrient retention capacity of the major wetland plant
species (those which naturally occur and those which are
planted for subsistence farming). This characterization
permitted the estimation of retention capabilities of
different wetland plants, the implications of replacing of
wetland vegetation by human activities and the use of
generated data for use in modelling by other work packages
of the project.

2.4 Loss of macrophytes in Ugandan wetlands
There quite a number of reasons that are attributed for the
alarming disappearance of macrophytes populations in wet
lands. Less than 20 of the 700 species of the macrophytes
are considered weeds (Triest 1993) as a consequence of there
prolific growth and production, macrophytes often interfere
with human utilization of water bodies in a number of ways.
Recent findings indicate that apart from interfering with
fishing and navigation, free floating mats of macrophytes
are a threat to biological diversity affecting fish, other
fauna, plant diversity and food chains. (Garry et al 1997).
Wetlands in Uganda experience different forms of human
pressure ranging from drainage for agriculture and
industrial development to over harvesting of wetland
products. In order to develop sustainable management tools
for wetland ecosystems in Uganda and the Lake Victoria
Region, water quality analyses were carried out in a rural
undisturbed (pristine) wetland (Nabugabo wetland in Masaka)
and two urban wetlands that are experiencing human and urban
development pressure (the Nakivubo wetland in Kampala and
Kirinya wetland in Jinja). Water quality was assessed in all

the wetland sites, and in addition nutrient content and
storage was investigated in the main plant species (Papyrus,
Phragmites, Miscanthidium and Cocoyam) in Nakivubo and
Kirinya wetlands. It was concluded that urbanisation
pressure reduces natural wetland functioning either through
the discharge of wastewater effluent or the degradation of
natural wetland vegetation. Nutrient status and retention in pristine
and disturbed wetlands in Uganda Kansiime, Kateyo, Oryem-Origa and
Mucunguzi, (2007)
2.5 Influence of human activities on macrophytes
Human activities have over the years affected the vegetation
of wetlands however not much work has been done to document
which macrophytes have been affected more. The vegetation
abundance along undeveloped and developed shorelines of
Minnesota lakes was compared to test the hypothesis that
development has not altered the abundance of emergent and
floating-leaf vegetation. Aerial photographs of clear-water
lakes dominated by centrarchids and walleyes (Stizostedion
vitreum) were analyzed for vegetation. Vegetative coverage
was estimated in 12 randomly selected 935-m2 digitized
photograph plots for both developed and undeveloped
shorelines of 44 lakes representing a gradient of
development. Vegetative cover in littoral areas adjacent to
developed shores was less abundant than along undeveloped

shorelines. On average, there was a 66% reduction in
vegetation coverage with development. The estimated loss of
emergent and floating-leaf coverage from human development
for all Minnesota's clear-water centrarchid–walleye lakes
was 20–28%. Significant correlations were detected between
occurrence of emergent and floating-leaf plant species and
relative biomass and mean size of northern pike Esox lucius,
Bluegill (Lepomis macrochirus) and pumpkin seed (Lepomis
gibbosus) using Spearman's rank correlation, P < 0.05. Paul
and Timothy (2001).
The wetlands of Nyamuriro and Doho were surveyed for their
flora during the period August 2001 and May 2002. These two
wetlands are highly degraded through cultivation. The plants
in these areas were documented with a view to determining
their richness and conservation importance in Uganda. Two
hundred and eight species were recorded in 140 genera, 63
families and 37 orders in Nyamuriro while 184 species, 109
genera, 39 families and 27 orders were recorded in Doho.
Although there are no species of global priority
conservation concern, these wetlands harbour reasonable
numbers of plant species, some of them rare, for their size.
Nyamuriro has five species of restricted range in the
country occurring in only one of the four floristic regions.
The flora of highly degraded and vulnerable wetland ecosystems of Nyamuriro
and Doho. Kalema and Ssegawa. (2006).

2.6 Soil pH
Soil PH testing is of great importance, since all the plants
show different pH preferences. The pH of the soil directly
affects the quality of nutrients that the soil offers to the
plants. Soil pH can influence many factors such as
availability of nutrients in the soil, soil life and the
susceptibility of plants to various diseases. 'Soil life' is
the term used to define various micro-organisms that are
responsible for decomposing complex compounds into simpler
organic forms, Thereby enriching the soil. Some micro-
organisms thrive in alkaline soil, while others prefer
acidic soil. Soil testing helps you to determine the pH of
the soil so that you can make amendments to improve it.
Ashwini Kulkarni Soil Testing - How to Test Soil pH, www.vl-pc.com (2009)

CHAPTER THREE
METHODS AND MATERIALS
3.1 Study area
The research will be carried out on Butebi and Bukanaga
landing site of Mityana district on Lake Wamala. Lake
Wamala, with Coordinates: 0°12 '- 0 °25 'N/31°41 '-32°02 'E.
is one of the freshwater bodies located in Mityana districts
of Central Uganda; it covers a total area of 250km2. It is
dotted by many islands including Lwanja, Mabo and Bagwe. It
is associated with several rivers and wetlands, such as
Nyanzi-Kitenga, Kabasuma, Mpamujugu and Bimbye which flow
into the lake, whereas river Kibimba drains westwards into

Lake Victoria. River Katonga running from Lake Victoria
flows into Lake Wamala.
Butebi
This is one of the landing sites on lake Wamala. It is one
of the most active landing sites on the lake it accommodates
about 20-30 fishermen with some using engine boats. Fish
caught here are consumed by the local people or are taken to
the nearest towns of Mityana and Kampala.
The other activity carried out on this landing site is
farming with people setting farming plots up to three meters
from the lake shore.
Bukanaga
This is another landing site on the lake however this not
active since most people depend more on agriculture farming
compared to fishing. It accommodates about 5-10 fishermen.
3.2 Research design
The research is basically a qualitative one. It will involve
plants identifying and counting the different plant species
collected from the different sites. Soil and water PH
testing.

3.3 Sample size
My samples will include all vegetation growing along lake
Wamala in Butebi and Bukanaga landing sites.
3.4 Sampling procedure
Line transects will be used, and sampling plots will be put
along the transects. Each transect will be selected randomly
using simple random sampling. From these plots also soil
samples will be collected for testing soil ph and soil
moisture content. This procedure will be repeated with
another site were there is minimum human activity.
Procedure
The researcher will first introduce him self to the local
officials of Lake Wamala using an introductory letter from
the department of botany Makerere University. He will then
look for a person willing to help during the period of data
collection. After that, the researcher will lay a transect
of three hundred meters (300) along the shores of lake
Wamala. On this transect he will put six (6) plots each
separated from the other by a distance of 50 metres. Form
the six plots, he will randomly choose three. This will be
done by giving the points numbers of up to six then toss a
die thrice to select the points from which he will put
transects of one hundred fifty (150) meters up stream. On

the transects running upstream, the researcher will put
plots of one meter by one meter (1mx1m)separated by 50
meters from which plant and soil samples will be collected.
This will be done on two sites, that is one that is strongly
influenced by human activities and one that has little human
activities. PH will be tested using a PH paper. This will be
done by mixing soil samples collected from different plots
with distilled water. Then PH papers will be dipped in the
solution and the colour changes compared with the scales
provided by the manufacturer. Soil moisture will be detected
by observation using a scale of low, medium and high.
3.6 Data Presentation and Analysis
Data presentation
Basically, data were presented in graph and table form
Data analysis
Data that was collected was largely Quantitative and
descriptive.
Jaccard Index
The Jaccard coefficient measures similarity between sample
sets, and is defined as the size of the intersection divided
by the size of the union of the sample sets:

Where A= Butebi landing site
B=Bukanaga landing site
n=Intersection between A and B
U= Union of A and B
The Jaccard distance, which measures dissimilarity between
sample sets, is complementary to the Jaccard coefficient and
is obtained by subtracting the Jaccard coefficient from 1,
or, equivalently, by dividing the difference of the sizes of
the union and the intersection of two sets by the size of
the union:
Shannon index
The Shannon index will be used to determine diversity in the
different areas. The Shannon index, also known as the
Shannon-Wiener Index ( ), is one of several diversity
indices used to measure diversity in categorical data. It is
simply the Information entropy of the distribution, treating
species as symbols and their relative population sizes as
the probability.
The advantage of this index is that it takes into account
the number of species and the evenness of the species. The

index is increased either by having additional unique
species, or by having greater species evenness.
Computing the index
Where;
ni = The number of individuals in species i; the abundance
of species i.
S = The number of species. Also called species richness.
N = The total number of all individuals
In= Natural log
pi =The relative abundance of each species, calculated as
the proportion of individuals of a given species to the
total number of individuals in the community:
It can be shown that for any given number of species, there
is a maximum possible , Hmax = lnS which occurs when all
species are present in equal numbers.
Relative Abundance

Relative abundance for macrophyte families was calculated as
a sum of relative frequency of the macrophyte families
collected.
Relative abundance for the macrophyte families= No. of
individuals seen/ Total No. of macrophyte families collected
X100
To compare abundances, eight most abundant macrophyte
families from both sites were tabulated and the results used
in chi-square to compare abundance of both Butebi and
Bukanaga landing site

CHAPTER FOUR
RESULTS
Introduction
The following data on macrophyte species diversity, soil pH
and agricultural practices was obtained from the research
carried out in Butebi and Bukanaga landing sites of Lake
Wamala from first March to the last week of April
Species Diversity
Lake Wamala has a very high diversity of macrophytes as will
be shown bellow. However the diversity of macrophytes has
been influenced by human activities mainly fishing and
farming. The plants seen and identified include Achyrantes
asepera, Ludwigia stolonifera and Conyza floribunda. Others included
cultivated plant species such as Phaseolus vulgaris, Zea mays,
Ipomea batatus and tomatoes.
A total of 25 plant species were collected in Butebi landing
site while 39 plant species were collected at Bukanaga
landing site.

A full list of all plant species collected at Bukanaga
landing site and Butebi are shown in Appendix Ia and Ib
A total of 24 cultivated plant species were collected from
Butebi representing 71% of the total population sampled
around the lake. 10 macrophyte plant species were collected
representing 29% of the total population sampled around the
lake.
A total of 6 cultivated plant species were collected from
Bukanaga landing site representing 13% of the total
population sampled around the lake. 33 macrophyte plant
species were collected representing 87% of the total sampled
species.
Figure 1: Pie chat showing percentage cover of different
cultivated plants

Sugar canesSweet potatoesCassavaYam sTom atoes Others
Shannon Index,
Shannon index was used to calculate the diversity of
macrophytes families in the two habitats, and the following
results were obtained;
Macrophytes families’ diversity at Bukanaga landing site is
2.154
Macrophytes families’ diversity at Butebi landing site is
1.500
Plant families’ diversity at Butebi landing site is 2.301
Plant families’ diversity at Bukanaga landing site is 2.469

Bukanaga landing site is more diverse in macrophyte plant
families (2.154) as compared to Butebi which has 1.500
macrophyte families diversity. The diversity of overall
plant species collected from the two site is still high in
Bukanaga at 2.469 and 2.301 in Butebi however the
diversities differ slightly.
Figure 2: Mean Number of species sighted in Butebi andBukanaga landing site
0
5
10
15
20
25
study site
mean number of pecies collected
Series1
From the figure 1 above, it is shown that the mean number of
species collected in the three plots (Bukanaga 1, Bukanaga 2
and Bukanaga 3) of Bukanaga landing site is higher than that

of Butebi landing site as shown by he three plots of
Butebi1, Butebi 2, and Butebi 3.
Relative abundance of macrophyte plant families
Table 2: Abundance of Macrophytes families at Butebi landing
site.
Average no
of
plant
families
Relative abundance
(%)
Compositae 0.3 30Cyperaceae 0.1 10Amaranthace
ae
0.2 20
Graminaea 0.1 10Polygonacea
e
0.3 30
The most abundant macrophyte families at Butebi landing site
are Compositae and Polygonaceae
Table 3: Abundance of Macrophytes families at Bukanaga
landing site.
Family Number
of
Relative abundance
(%)

speciesAcanthaceae 0.03 03Amaranthace
ae
0.03 03
Compositae 0.33 33Eurphorbiac
eae
0.06 06
Fabaceae 0.03 03commelinace
ae
0.03 03
Araceae 0.06 06Polygonacea
e
0.12 12
Graminaea 0.15 15Cyperaceae 0.06 06Solanaceae 0.03 03Malvaceae 0.03 03Onagraceae 0.03 03
Abundance along Bukanaga landing site is still dominated by
Compositae at 33% and Gramineae at 16 % followed closely by
Polygonaceae at 12%.
Table 4: Abundance of the five common plant families in the
two study sites

Macrophyte
families
Buteb
i
Bukanag
a
Tot
al Compositae 03 11 14Cyperaceae 01 02 03Amaranthaceae 02 01 03Graminaea 01 05 06Polygonaceae 03 04 07Total 10 23 33
A chi-square test (x2) is used to measure the species
abundance.
Ho = Null hypothesis “Abundance more in Bukanaga, where out
of 100 families
60 are in Bukanaga while 40 are in Butebi”.
Table 5: Calculation of chi square
Classes Observed(O) Expected(E) O-E (O-E)2 (O-E)2/E (x2)
Butebi 30.3 40 -9.7 94.09 2.35Bukanaga 69.7 60 9.7 94.09 1.37
x∑ 2 = 3.72
Degree of freedom = n-1 which is equal to one

However, the chi square value at the confidence limit of
0.05 with 1 degree of freedom is 3.84, greater than the
calculated chi-square value of 0.12.
Therefore, accept the null hypothesis that is abundance of
macrophyte families is more in Bukanaga.
Land use along the shore
Land use along the shore is mainly farming (subsistence and
large scale farming). Crops grown for domestic consumption
include beans, maize, yams and cassava while sugar canes and
potatoes a cultivated on a large scale.
At Bukanaga landing site most of the land along the shore is
still intact with the exception of a few areas were people
have put gardens of yams and potatoes.

Picture 1: A garden of sweet potatoes along the shores of Lake
Wamala at Butebi landing site.
When asked, most farmers declined the use of herbicides and
artificial fertilizers claiming that there land is fertile
and even such inputs are very expensive. However some large
scale farmers admitted use of herbicides and fertilizers.
Interview schedules were done to ask people about use of
herbicides and fertilizers.
Herbicides commonly used
Figure 3

PIE CHART SHOW ING PERCENTAGE USE OF AGRICULTURAL INPUTS IN
BUTEBI
Organic fertilizersInorganic fertilizersHerbicidesNone
Figure 4
PIE CCHART SHOW ING PERCENTAGE USE OF
AGRICULTURAL IN PUTS IN BUKANAGA
Organic fertilizersHerbicidesNone
PH levels for soils in Butebi and Bukanaga
The average PH at Bukanaga landing site is slightly bellow 7
that is (7.5) as compared to that of Butebi which is at 5.3

Table 6: Bukanaga
pl
ot
PH averag
e1 6
6.72 73 7
Table 7: Butebi
pl
ot
PH averag
e1 5
5.32 53 6
Soil moisture
This was determined by observation using a using a
quantitative scale of low medium and high in all the sampled
plots
Table 8: Bukanaga
Plo
t
Moisture
content
averag
e1 High
Medium2 Medium 3 Medium

Table 9: Butebi
Plo
t
Moisture
content
averag
e1 Medium
Low 2 Low 3 Low
Jaccard’s Similarity index
Testing similarity using JACCARD’S INDEX using datagenerated relative abundance table
Where A=Butebi and B=Bukanaga.
|A| = 23
|B|=27
|AnB|=48
|AUB|=60
J (A, B) =48/60
= 0.8
It is less than the tabulated value at 0.05 meaning that the
value is statistically significant

CHAPTE
R FIVE
DIS
CUSSIONS
Lake Wamala is a fresh water body supporting a variety of
life forms and providing a habitat to a number of animal and
plant species (macrophyte). Bukanaga and Butebi landing site
have a great diversity of macrophyte families, and other
plant families in general. This is mainly due to the still
low population in the area in that most of the land is still
intact or with little manipulation by humans. Back wardness
could also be another factor in that, even in cultivated
areas people use primitive methods of farming.
The diversity of macrophyte plant families is low in Butebi
as compared to Bukanaga landing site. This is due to the
fact that most of the land in Butebi landing site has been

turned in farming grounds. In so doing vegetation along the
shores is often cleared to prepare land for farming.
Farming at Butebi landing site
Since most people in this area are leaving bellow the
poverty line. This means they solely depend on the
environment for resources.
The main economic activity on this landing site is mainly
fishing however its followed closely by farming. Most of the
land along the shore has been turned into farming grounds.
Most people practice subsistence farming of plants mainly
food crops like beans, maize, cassava, yams and bananas.
Usually farmers want to place their gardens next to the lake
shore claiming that the land there is very fertile unlike
the soils upstream.
In Uganda, cultivation of wetlands has increased because of
increasing human population around wetlands. Many valley
bottoms are used for smallholder rice (Oryza sativa)
production and in urban areas cocoyams (Colocasia esculenta),
sugarcane (Saccharum officinarum ), sweet potatoes (Ipomoea
batatus) and cabbages (Brassica oleracea) are important wetland
crops (NEMA, 1998).

Picture 2: A boy cultivates a garden of cassava along the shores of Lake Wamala
on Butebi landing site
Some people however practice large scale farming of mainly
sweet potatoes and sugar canes. This acts as a source of
income for these people. They sell these products to the
near by trading centers of Mityana town. Such type of
farming is usually done by people who own large chunks of
land and since they are few, very few people practice such
kind of farming.
land ownership along the shore is mainly private ownership
meaning people do as they please with there properties most

people look at off shore vegetation as useless compared to
the tangible benefits that can be obtained through farming.
Picture 3: Sugar cane plantations along the shores of Lake Wamala on Butebi
landing site
Economic activities of Bukanaga landing site.
The main economic economic activity of Bukanaga landing site
is mainly fishing which is also done on a lower scale since
people still practice primitive methods of fishing. Fish
caught mainly include; mud fish, lung fish and tilapia. Very
few people practice subsistence farming growing mainly food
crops.
Diversity of plants on Butebi and Bukanaga
Plant diversity is high in Bukanaga landing site as compared
to that in Butebi landing site. This is mainly because most

of the ecology along the shores of Lake Wamala in Bukanaga
landing site has not been interfered by man. Lack of
interference means that organisms interact freely, natural
systems are still in play which provides a suitable
environment for a variety of plant species.
Plant species diversity is low in Butebi landing site. This
is because most of the natural habitats and systems have
been interfered and influenced by human activities such as
farming and fishing. This means that plant species that can
survive in such disturbed environments are dominant and
hence loss of diversity.
Picture 4: Picture showing land cleared of its vegetation to
prepare for farming.

The other reason owing to the loss of diversity in Butebi
landing site is the fact that most of the vegetation having
a diversity of plant species have been cleared by man and
replaced by plantations with one type of plant species hence
loss of biodiversity. And since people do not understand the
ecological importance of macrophytes along the shore, this
means that people clear shore line vegetation with no
consciousness. According to (Kinzig & Pacala, 2001), one of
the greatest challenges to biodiversity conservation is the
need to understand patterns and processes that influence
biological resources. Environmental degradation because of
human activities is causing loss of biodiversity and affects
the livelihoods of communities that depend on it either
directly or indirectly.
Diversity of macrophytes in Butebi and Bukanaga
Macrophytes diversity is high in Bukanaga as compared to
Butebi. This is because, most of the vegetation along the
shores in Bukanaga has remained intact that is undisturbed
giving a chance to macrophytes to survive and perform their
ecological duties. However in Butebi most of the vegetation
has been disturbed by human activities that include farming,
fishing and settlement leading to a great loss of
macrophytes species much as disturbance is necessary in
natural systems, the frequency of disturbance becomes a very

influential factor. In that more frequent disturbances
affect ecosystems severely. (Grime, 1973; Connell,1978;
Sousa, 1979) Disturbances that re-occur frequently influence
propagule availability by destroying individuals before
maturity and thus affect ecosystem attributes. It has been
established that along disturbance gradients, species
richness is often highest at intermediate levels. However,
other studies have reported species richness increase
(Tilman, 1983) or decrease (Wilson & Tilam, 1991) along
disturbance gradients. The few macrophytes recorded in
Butebi, are those that can with stand disturbance and those
that existed along the shore line.
.

Picture 5: Picture showing plantation of sweet potatoes a few
meters from the shores of Lake Wamala.
Relative Abundance of macrophytes families
It was observed that some macrophytes families were more
abundant than others and this is attributed to the level of
human activities along the shores of Butebi and Bukanaga
landing site. The more abundant species are probably less
affected by human disturbance or have adapted to the human
activities and presence.
According to J Esaete, J M. Kasenene, O Totland and J Obua
(Macrophyte species diversity in formerly cultivated
wetlands in Uganda), In frequently cultivated areas, the
subordinate species consist of a few annuals and relatively
short-lived perennials. Although cultivation in the first
stages of disturbance eliminates all plant species, in the
long run its effect on vegetation becomes selective and
result in either increase or decrease in species diversity.
The effect of frequency of cultivation on macrophytes
species diversity is most observable in wetland areas with
contrasting cropping regimes. Cropping regimes define
cultivation on the basis of crop type, maturity period of

the
The relative abundance of macrophytes families in Butebi
landing site were lower than the relative abundance of
macrophytes families of the same species in Bukanaga.. While
some families had higher relative abundances in Butebi than
in Bukanaga landing site.
This is because of the limited disturbance in Bukanaga gives
chance to natural interaction between species hence
preventing dominance by a few more adapted families. In
Butebi, the macrophytes families that have adapted to
disturbance by human activities are more dominant.
Cultivation affects macrophytes diversity in the following
forms. It usually results in clearing of macrophytes through
digging to break up the soil, planting and weeding. The
process of digging to break up the soil causes more soil
disturbance than weeding.
According to J Esaete, J M. Kasenene, O Totland and J Obua
(Macrophyte species diversity in formerly cultivated
wetlands in Uganda) Digging for replanting in wetlands is
done 1–3 times a year for crops such as cabbages (Brassica
oleracea) and sweet potatoes (Ipomoea batatus) that take less
than 6 months to mature (short-term cropping regime). In
wetlands where sugar cane (Saccharum officinarum) and cocoyams
(Colocasia esculenta) are grown, digging for replanting takes

place once a year (long-term cropping regime) because these
crops take more than 6 months to mature. As disturbance
regimes are described in terms of frequency, cropping
regimes present a potential surrogate to study the impact of
cultivation on macrophytes species diversity.
Generally the relative abundance of Compositeae is highest
in both the study areas though the relative abundance is
higher in Bukanaga landing site than Butebi landing site.
The high relative abundance of the Compositeae family is
probably due to the fact that most of its species are more
adaptive and occupy a wide range of habitats.
Soil pH
Soil pH was measured using pH papers. Soil pH is generally
acidic in both sites however it’s more acidic in Butebi
landing site. Soil pH is also determined by how the parent
rock material was formed and the constituent elements.
It is there fore important to realize that the mineral
constituent of the parent rock material determines the pH
ranges of the soil, that is to say, Ca, Mg and K are base
cations, (cations of strong bases) and strong bases are
fully dissociated at the pH-ranges occurring in most natural
waters. However, as the soil solution pH is dependent on
mineral weathering, and mineral weathering increases pH by
releasing Ca, Mg and K, a soil which is rich in easily

weatherable minerals tends to have both a higher pH and
higher soil solution concentration of Ca, Mg and K.
The other factor that affects soil pH is the influence of
acid rain which also adds hydrogen ions to the soil hence
increasing soil pH.
Also application of artificial fertilizers and herbicides by
farmers increases the concentration of ions and cataions in
the soils. This intern influences the pH of the soil as
explained above. Since most of the land along Butebi landing
site has been agriculturalized, there has been increased use
of agricultural inputs hence increase in acidity of the
soils.
pH also increases as one goes down stream along the shores
of Butebi landing site. This is because; most of the
vegetation has been cleared meaning that soil erosion
carries the ions and cataions down stream.
Soil moisture content
Soil moisture content is relatively high in Bukanaga landing
site as compared to Butebi. This is because most of the
vegetation in Butebi landing site has been cleared for
farming. This exposes the ground to direct sun heat leading
to high rates of evaporation hence loss of soil moisture.
There is also reduced sinking of water when it rains since
there is no vegetation to reduce the flow of running water.

Unlike Butebi landing site, in Bukanaga the vegetation
reduces the speed of running water giving it a chance to
sink in the ground hence increasing soil moisture. Also the
vegetation prevents excessive evaporation from the ground
hence maintaining soil moisture content.
CHAPTER
SIX
CONCLUSSION AND RECOMMENDATIONS
CONCULUSION

Human activities have greatly impacted the ecology of Lake
Wamala especially along the most active landing sites were
human activity has increased over the years. There has been
notable loss of biodiversity in areas of increased human
activities resulting from destruction of natural habitats.
Loss of vegetation through macrophytes clearance for
navigation along the lake shore and for agricultural
purposes has led to increased soil erosion. This has in turn
led to siltation of the lake. The continued siltation of
Lake Wamala has consequently led to its reduction in size
and reduction in quality of fish caught. The fact that
people depend on farming as one of the main economic
activity, and since they still practice poor methods of
farming, means that they will go on to in habit even the un
disturbed parts of lake as their soils lose fertility.
Most land along the shore is occupied by sugar cane
plantations which are long term regime plants that is
digging for replanting takes place only once a year. This
gives chance to a few adaptive macrophytes such as those in
Polygonaceae and Compositeae families to grow.
Loss of vegetation has also led to the increased reduction
in soil quality, that is, in areas were vegetation has been
cleared, the soils have dried up through moisture

evaporation. There has been loss of nutrients and top soil
through continued soil erosion when it rains.
The standards of leaving along the shores are still very low
due to the extreme levels of poverty. This implies that
people have to depend on the environment for resources. This
has made and will make conservation of biodiversity
extremely hard.
RECOMMENDATIONS
This research took place for a period of one and half months
a period not enough to sample enough areas around the lake
in order to come up with conclusive evidence of the effect
human activities on the diversity of macrophytes families.
However this research is going to act as base line for
further studies.
People leaving along the shores need to be sensitized and
educated about the need to conserve and protect lake shore
vegetation. This will involve providing information such as
the importance of macrophytes to the ecology of the lake.
The government should also gazette land of up to 50 meters
from the lake shore in order to conserve the few remaining
vegetation of macrophytes and also give a chance for the
regeneration of the lost macrophytes
Village committees need to be set up to over see how people
use lake resources and also enforce by laws set to protect
the lake ecosystems.
District committees need to be set to monitor the state of
the lake and present monthly or yearly reports about the
state of the lake. This committee should also forge ways on
how to restore the state and biodiversity of Lake Wamala.
REFERENCES
Ashwini Kulkarni Soil Testing - How to Test Soil pH
www.vl-pc.com (2009)
Josephine, E., Kasenene, J.M., Orjan, T. and Obua, J.
Macrophyte species diversity in formerly cultivated

wetlands in Uganda (2008). African journal of ecology 46(4)
646 – 654.
Grime, J.P. (1973) Control of species density in
herbaceous vegetation. J. Environ. Manage. 1, 151–167.
Kalema, J. and Ssegawa, P. (2006)
Kansiime, F., Kateyo, E., Oryem-Origa, H. and
Mucunguzi, P. Nutrient status and retention in pristine
and disturbed wetlands in Uganda (2007)
Kansiime and Nalubega 1999; Kansiime and van Bruggen
2001)
Kansiime, F. and Van Bruggen, J.J.A. (2001).
Distribution and retention of faecal coliforms in the
Nakivubo wetland in Kampala, Uganda. Water science and
technology. 44 (11-12_: 199-206.
Kinzig, A.P. & Pacala, S. (2001) Successional
biodiversity and ecosystem function. In: The Functional
Consequences of Biodiversity. Empirical Progress and
Theoretical Extensions (Eds A. P. Kinzig, S. W. Pacala
and D. Tilman). Princeton University Press, Princeton,
Oxford.
Lyaruu, H.V. M. and Eliapenda, S. (2002) “the diversity
of aquatic macrophytes in selected ecosystems of the
lake Victoria basin and their importance in
biodiversity conservation.” Mahogo, S.B., Chande, A.I
and Katunzi E.F.B. (eds.) Biodiversity of Lake Victoria: its
conservation and sustainable use. pp. 49-62

Muthuri, F.M. and Kinyamario, J.I (1989). Nutritive value of
papyrus (Cyperus papyrus), A tropical emergent macrophytes. Economic
botany, 43(1), 23-30.
NEMA (1998) State of Environment Report for Uganda.
National Environment Management Authority, NEMA,
Kampala.
Triest, L. (1993) problems created by excessive
macrophyte growth in tropical freshwater ecosystems and
strategies for control.
Timothy, J.G. (2001). Consequences of human lakeshore
development on emergent and floating-leaf vegetation
abundance. North American Journal of Fisheries Management 21:46-
61.
Tilman, D. (1983) Plant succession and gopher
disturbance along an experimental gradient. Oecologia
60, 285–292.
Wilson, S.D. and Keddy, P.A. (1986) Species competitive
ability and position along a natural stress ⁄
disturbance gradient. Ecology 67, 1236–1242.
Wilson, S.D. & Tilam, D. (1991) Intereactive effects of
fertilization and disturbance on community structure
and resource availability in old-field plant community.
Oecologia 88, 61–71.

APPENDICES
Appendix I list of all species collected from all study
sites
(A) List of all plant species collected in Bukanaga landing
site.
Number Family Species

001 Acanthaceae Asystasia sp
002 Amaranthacea
e
Adyranthes aspera
003 Amaranthacea
e
Amaranthus dubius
004 Araceae Pisitia stratiotes
005 Compositae Bidens pilosa
006 Compositae Synedrella nodiflora
007 Compositae Conyza floribunda
008 Compositae Sonchus sp
009 Compositae Tithonia diversifolia
010 Compositae Galisonga parviflora
011 Compositae Agerantum conyzoides
012 Compositeae Crassocephalum
picidifolium
013 Compositeae Melanthera scadens
014 Compositeae Ethulia scheffleri
015 Compositeae Aspilia pluriseta
016 Compositae Synedrella nodiflora
017 Cyperaceae Cyperus papyrus
018 Cyperaceae Scirpus confusus
019 Commelinacea
e
Commelina baghalensis
020 Dioscoraceae Dioscorea alata
021 Euphorbiacea
e
Phyllanthus odontadenius
022 Euphorbiacea Ricinus communis

e 023 Fabaceae Crotalaria agatifola
024 Gramineae Digitaria abyssinica
025 Gramineae Pennisetum purpureum
026 Gramineae Echinochloa pyramidalis
027 Gramineae Zea mays
028 Gramineae Saccharum officinarum
029 Gramineae Brachiaria sp
030 Gramineae Pasparum sp
031 Malvaceae Hibiscus sp
032 Onagraceae Ludwigia abyssinica
033 Polygonaceae Polygonum salicifolium
034 Polygonaceae Oxygonum sinuatum
035 Polygonaceae Polygonum bequaertii
036 Polygonaceae Polygonum setosulum
037 Papilionacea
e
Arachis hypogen
038 Papilionacea
e
Phaseolus vulgaris
039 Solanaceae Datura stramonium
(B) List of plant species collected from Butebi landing site
Number Family Species 001 Amaranthace
ae
Adyranthes aspera
002 AmaranthaceAmaranthus dubius

ae 003 Amaranthace
aeAmaranthus hybridus
004 Amaranthace
ae
Amaranthus gangiticus
005 Compositae Conyza floribunda
006 Compositae Bidens pilosa
007 Compositae Synedrella nodiflora
008 Convolvulac
eae
Ipomoea batatus
009 Cucurbitace
ae
Cucurbito maxima
010 Cyperaceae Cyperus papyrus
011 Dioscoracea
e
Dioscorea alata
012 Dioscoracea
e
Dioscorea bulbifera
013 Euphorbiace
ae
Manihot eseculenta
014 Gramineae Pennisetum
purpureum
015 Gramineae Saccharum
officinarum
016 Gramineae Zea mays
017 Musaceae Musa sp
018 Musaceae Musa paradisiaca
019 Papilionace Arachis hypogen

ae 020 Papilionace
ae
Pisum lunutus
021 Papilionace
ae
Phaseolus vulgaris
022 Polygonacea
e
Oxygonum sinuatum
023 Polygonacea
e
Polygonum setosulum
024 Polygonacea
e
Polygonum salicifolium
025 Zyngberaceae
Zyngber officinale

Appendix II calculation ofdiversity indices of plantscollected in all study sites
(A) Diversity of plant
families at Butebi landing
site.
Family pi pi*ln*p
iCompositae 4 0.1
6
0.293
Euphorbiacea
e
1 0.0
4
0.129
Polygonaceae 3 0.1
2
0.254
Graminaea 5 0.2
0
0.322
Amaranthacea
e
2 0.0
8
0.202
Dioscoraceae 1 0.0
4
0.129
Cucurbitacea
e
1 0.0
4
0.129
Papilionacea
e
3 0.1
2
0.254
Commelinacea
e
1 0.0
4
0.129
Convolvulace
ae
1 0.0
4
0.129
Musaceae 1 0.0
4
0.129
Cyperaceae 2 0.0
8
0.202
2
5
H1= -
2.301

(B) Diversity of plantfamilies at Bukanagalanding site.
Family pi Pi*ln*p
iAcanthaceae 1 0.02
6
0.095
Amaranthace
ae
2 0.05
1
0.152
Compositae 1
1
0.28
2
0.357
Eurphorbiac
eae
2 0.05
1
0.152
Fabaceae 1 0.02
6
0.095
commelinace
ae
1 0.02
6
0.095
Araceae 2 0.05
1
0.152
Polygonacea
e
4 0.10
3
0.234
Graminaea 5 0.12
8
0.263
Cyperaceae 2 0.05
1
0.152
Solanaceae 1 0.02
6
0.095
Malvaceae 1 0.02
6
0.095
Onagraceae 1 0.02
6
0.095
convolvulac
eae
1 0.02
6
0.095
Dioscoracea
e
1 0.02
6
0.095
Gramineae 2 0.05
1
0.152

Appendix III. Calculation of diversity indices of
macrophytes families collected in all study sites
(A) Diversity of Macrophytes families at Butebi landimg
site.
Family Number
of
species
Pi Pi*ln*
pi
Compositae 03 0.3
0
0.36
Cyperaceae 01 0.1
0
0.23
Amaranthace
ae
02 0.2
0
0.32
Graminaea 01 0.1
0
0.23
Polygonacea
e
03 0.3
0
0.36

10 H1=1.5
0
(B) Diversity of Macrophytes families at Bukanaga landing
site.
Family Number
of
species
Pi Pi*ln*
pi
Acanthaceae 1 0.03
0
0.105
Amaranthace
ae
1 0.03
0
0.105
Compositae 11 0.33
3
0.366
Eurphorbiac
eae
2 0.06
1
0.171
Fabaceae 1 0.03
0
0.105
commelinace
ae
1 0.03
0
0.105
Araceae 2 0.06
1
0.171
Polygonacea
e
4 0.12
1
0.255
Graminaea 5 0.15 0.285

1Cyperaceae 2 0.06
1
0.171
Solanaceae 1 0.03
0
0.105
Malvaceae 1 0.03
0
0.105
Onagraceae 1 0.03
0
0.105
33 H1=2.15
4