Desert Air Incursions, an Overlooked Aspect, for the Dry Spells of the Indian Summer Monsoon: BY T....
19
Desert Air Incursions, an Overlooked Aspect, for the Dry Spells of the Indian Summer Monsoon T. N. KRISHNAMURTI, A. THOMAS,ANU SIMON, AND VINAY KUMAR Department of Meteorology, The Florida State University, Tallahassee, Florida (Manuscript received 7 January 2010, in final form 22 March 2010) ABSTRACT The year 2009 was a major drought year for the Indian summer monsoon with a seasonal deficit of rainfall by 21.6%. Standard oceanic predictors such as ENSO and the Indian Ocean dipole are not consistent for these dry spells. There are a host of other parameters such as the Himalayan ice cover, the Eurasian snow cover, the passage of intraseasonal waves, and even accumulated effects of Asian pollution that have been considered for analysis of the dry spells of the monsoon. This paper presents another factor, the western Asian desert air incursions toward central India, and emphasizes the formation of a blocking high over western Asia as an important feature for these dry spells. The blocking high advects descending very dry air toward central India, portrayed using swaths of three-dimensional trajectories. This is a robust indicator for dry spells of the monsoon during the last several decades. This dry air above the 3-km level over central India strongly inhibits the vertical growth of deep convection. Some of the interesting antecedents of the formation of the blocking high include an eastward and somewhat northward extension of the ITCZ over North Africa, a stronger than normal local Hadley cell over North Africa, a strong subtropical jet stream over the southern Mediterranean, and strong conversions of anticyclonic shear vorticity to anticyclonic curvature vorticity. The dynamical antecedents of the aforementioned scenario in this study are related to many aspects of North African weather features. They are portrayed using both reanalysis datasets and ensemble modeling using a suite of coupled atmosphere–ocean models. 1. Introduction The intervals between rain spells during the Indian summer rainy season, called breaks, generally last from one to two weeks. Some years there may be longer- lasting dry spells and those are often defined as drought years. Climatological aspects of breaks including their duration, geographic distributions, preferred periods dur- ing summer, and other statistics have been addressed by a number of authors (Krishnan et al. 2000; Rajeevan et al. 2006; Gadgil and Rupakumar 2006). The range of external parameters that impact the be- havior of the summer monsoon rains over India includes the effects of the El Nin ˜ o (Rasmusson and Carpenter 1982; Krishnakumar et al. 2006), the Indian Ocean tem- peratures expressed by the index called the Indian Ocean dipole (IOD) (Saji et al. 1999), the meridional passage of intraseasonal oscillation (ISO) waves (Krishnamurti and Subrahmanyam 1982; Sikka and Gadgil 1980; Wang and Rui 1990), the Himalayan ice cover (Dickson 1984; Fasullo 2004), and the Eurasian snow cover (Barnett et al. 1989; Bhanu Kumar 1988). A number of internal indices have been discussed in this context (Dumenil et al. 1994; Harzallah and Sadourny 1995), as have possible effects of monsoonal pollution (Ramanathan et al. 2005; Lau et al. 2006; Lau and Kim 2006; Krishnamurti et al. 2009). The extreme dryness of the troposphere above the 2-km level over central India during periods of dry spells bears a strong resemblance to desert air rather than to the drying from a slow subsidence related to El Nin ˜ o events. The warm SST anomalies of the El Nin ˜ o reside in the eastern and/or the central equatorial Pacific Ocean. The compensating descent of the El Nin ˜ o–related rising mo- tions is described by east–west divergent circulations. The El Nin ˜o–related droughts are known to occur anywhere throughout eastern Australia, the Philippines, Indonesia, India, East Africa, Indo-China, and China. The strongest descending lobe of the east–west circulation anomaly is known to meander from one El Nin ˜ o event to the next. The El Nin ˜ o monsoon relationship over India is not very Corresponding author address: T. N. Krishnamurti, Dept. of Meteorology, The Florida State University, Tallahassee, FL 32310. E-mail: [email protected] OCTOBER 2010 KRISHNAMURTI ET AL. 3423 DOI: 10.1175/2010JAS3440.1
Transcript of Desert Air Incursions, an Overlooked Aspect, for the Dry Spells of the Indian Summer Monsoon: BY T....

Desert Air Incursions, an Overlooked Aspect, for the Dry Spellsof the Indian Summer Monsoon
T. N. KRISHNAMURTI, A. THOMAS, ANU SIMON, AND VINAY KUMAR
Department of Meteorology, The Florida State University, Tallahassee, Florida
(Manuscript received 7 January 2010, in final form 22 March 2010)
ABSTRACT
The year 2009 was a major drought year for the Indian summer monsoon with a seasonal deficit of rainfall
by 21.6%. Standard oceanic predictors such as ENSO and the Indian Ocean dipole are not consistent for these
dry spells. There are a host of other parameters such as the Himalayan ice cover, the Eurasian snow cover, the
passage of intraseasonal waves, and even accumulated effects of Asian pollution that have been considered
for analysis of the dry spells of the monsoon. This paper presents another factor, the western Asian desert air
incursions toward central India, and emphasizes the formation of a blocking high over western Asia as an
important feature for these dry spells. The blocking high advects descending very dry air toward central India,
portrayed using swaths of three-dimensional trajectories. This is a robust indicator for dry spells of the
monsoon during the last several decades. This dry air above the 3-km level over central India strongly inhibits
the vertical growth of deep convection. Some of the interesting antecedents of the formation of the blocking
high include an eastward and somewhat northward extension of the ITCZ over North Africa, a stronger than
normal local Hadley cell over North Africa, a strong subtropical jet stream over the southern Mediterranean,
and strong conversions of anticyclonic shear vorticity to anticyclonic curvature vorticity. The dynamical
antecedents of the aforementioned scenario in this study are related to many aspects of North African
weather features. They are portrayed using both reanalysis datasets and ensemble modeling using a suite of
coupled atmosphere–ocean models.
1. Introduction
The intervals between rain spells during the Indian
summer rainy season, called breaks, generally last from
one to two weeks. Some years there may be longer-
lasting dry spells and those are often defined as drought
years. Climatological aspects of breaks including their
duration, geographic distributions, preferred periods dur-
ing summer, and other statistics have been addressed
by a number of authors (Krishnan et al. 2000; Rajeevan
et al. 2006; Gadgil and Rupakumar 2006).
The range of external parameters that impact the be-
havior of the summer monsoon rains over India includes
the effects of the El Nino (Rasmusson and Carpenter
1982; Krishnakumar et al. 2006), the Indian Ocean tem-
peratures expressed by the index called the Indian Ocean
dipole (IOD) (Saji et al. 1999), the meridional passage of
intraseasonal oscillation (ISO) waves (Krishnamurti and
Subrahmanyam 1982; Sikka and Gadgil 1980; Wang
and Rui 1990), the Himalayan ice cover (Dickson 1984;
Fasullo 2004), and the Eurasian snow cover (Barnett et al.
1989; Bhanu Kumar 1988). A number of internal indices
have been discussed in this context (Dumenil et al. 1994;
Harzallah and Sadourny 1995), as have possible effects
of monsoonal pollution (Ramanathan et al. 2005; Lau
et al. 2006; Lau and Kim 2006; Krishnamurti et al. 2009).
The extreme dryness of the troposphere above the 2-km
level over central India during periods of dry spells bears
a strong resemblance to desert air rather than to the
drying from a slow subsidence related to El Nino events.
The warm SST anomalies of the El Nino reside in the
eastern and/or the central equatorial Pacific Ocean. The
compensating descent of the El Nino–related rising mo-
tions is described by east–west divergent circulations. The
El Nino–related droughts are known to occur anywhere
throughout eastern Australia, the Philippines, Indonesia,
India, East Africa, Indo-China, and China. The strongest
descending lobe of the east–west circulation anomaly is
known to meander from one El Nino event to the next.
The El Nino monsoon relationship over India is not very
Corresponding author address: T. N. Krishnamurti, Dept. of
Meteorology, The Florida State University, Tallahassee, FL 32310.
E-mail: [email protected]
OCTOBER 2010 K R I S H N A M U R T I E T A L . 3423
DOI: 10.1175/2010JAS3440.1
consistent: whereas some major El Nino years such as
1972 and 1987 have been associated with significantly
below-normal monsoon rainfall years, many El Nino years
have been near-normal rainfall years for the Indian
summer monsoon (Rasmusson and Carpenter 1982). The
dry spells of the Indian summer monsoon last for several
weeks. To portray the teleconnections between the re-
gion of the El Nino and a region of drought, it is not
advisable to look at daily charts of divergent circula-
tions, since short space time transients mask the rela-
tionships being sought. Generally that teleconnection
becomes very apparent after some space–time smoothing
(Krishnamurti et al. 1986). From such an analysis of sev-
eral years of data, it becomes apparent that the El Nino–
Indian monsoon rainfall relationship is not very robust.
The El Nino–related warm SST anomalies also occur in
the central equatorial Pacific ocean (Krishnakumar et al.
2006), and these seem to bear a somewhat stronger re-
lationship to the droughts over India compared to the
warm SST anomalies of El Nino that reside only over the
equatorial eastern Pacific Ocean. The IOD is a normal-
ized SST anomaly difference between the western and
the eastern equatorial Indian Ocean (Saji et al. 1999).
Above-normal rainfall anomalies (over India during the
summer monsoon) have been related to a positive IOD
index (Saji et al. 1999), with the converse being the case
during periods of a negative IOD index. Gadgil et al.
(2003, 2004) noted stronger than normal trades over the
equatorial Indian Ocean during periods of the positive
IOD index and proposed the role of such winds and
related evaporation in the enhancement of monsoon
rains. Gadgil et al. (2004) proposed the name Equatorial
Indian Ocean Oscillation (EQUINO) to define their
wind-related index for assessing the monsoon rainfall
behavior. The variations of the IOD index and summer
monsoon rainfall relationship during recent decades are
illustrated in this paper. Overall the impression one gets
from these indices is that no single parameter is a robust
indicator of the seasonal rainfall behavior.
Another observed feature is the northward arrival of
a high sea level pressure anomaly extending from south
of India northward to around 258N latitude (Krishnan et al.
2000). This northward-moving feature has been identi-
fied as a component of the meridionally propagating
ISO of the monsoon (Waliser 2006). The passage of these
meridionally propagating waves from near the equator
to the foothills of the Himalayas brings in alternate spells
of dry and wet monsoon weather. The ISO is character-
ized by a meridional passage of cyclonic and anticyclonic
eddies on a time scale of roughly 30–50 days in the
lower troposphere over southern and southeastern Asia
(Yasunari 1980, 1981; Krishnamurti and Subrahmanyam
1982; Sikka and Gadgil 1980). The scale of these eddies
is on the order of 3000 km; these propagate meridionally
at a speed of roughly 18 day21. The arrival of an anti-
cyclonic eddy from the near-equatorial latitudes of the
Indian Ocean to near 258N takes nearly 15 days and is
known to bring about a dry spell. Since the space–time
scales and amplitudes of the ISO vary considerably from
case to case, the relationship of the ISO to the occur-
rences of the dry spells of the summer monsoon is not
very robust. Other factors such as the Himalayan ice
cover and the Eurasian snow cover are also not consid-
ered to be consistent robust parameters for the behavior
of the Indian summer monsoon rainfall (ISMR).
There is an important overlooked aspect of dry spells
of the Indian monsoon that is highlighted in this study.
This relates to the formation of a blocking high, around
the Arabian Peninsula, that is located roughly above the
3-km level to almost 9 km above sea level. This intense
blocking high advects descending very dry air over the
Arabian Sea and toward central India and strongly in-
hibits the vertical growth of deep convection. It is pos-
sible to portray the eastward passage of this dry air
through the construction of swaths of three-dimensional
trajectories, which turn out to be a robust indicator for
the dry spells of the last several decades. Our study also
presents an analysis of some of the salient antecedents of
the blocking high that suggests that the phenomenology
to the west of India deserves a closer examination. A
modeling of the proposed scenario, covering dry spells
of the Indian summer monsoon rains, is also addressed
in this paper. This modeling entails the use of a suite of
coupled atmosphere–ocean models for examining the
dry spells of the 2009 season.
2. Results
a. The El Nino factor
The relationship of seasonal monsoon rains to the
El Nino is a major topic of considerable interest
(Rasmusson and Carpenter 1982). The current under-
standing of this problem is that whereas some droughts
or below-normal monsoon rains over India seem to be
related to El Nino years, many El Nino years experience
near normal rainfall over India. The warm SST during
an El Nino reside over the equatorial central and east-
ern Pacific Ocean and divergent east–west circulations
(Krishnamurti 1971) carry an ascending branch of air
over these warm belts of SST anomalies. The compen-
sating descending lobe is known to meander considerably
from one El Nino to the next. That region of strongest
descent can be seen over eastern Australia, Malaysia,
the Philippines, eastern and central China, Indochina,
India, or even as far away as East Africa during dif-
ferent El Nino years. Thus, the prominent response to
3424 J O U R N A L O F T H E A T M O S P H E R I C S C I E N C E S VOLUME 67
El Nino–related dry weather is not a consistent feature
for any given region. Krishnakumar et al. (2006) noted
the importance of the central Pacific SST during El Nino
years for deficient rainfall over India. The 2009 El Nino
was also characterized by a central Pacific warm SST
anomaly, but that season did not carry a strong descending
lobe of divergent circulation over India. Strong factors
contributing to the varied locations of the descending lobe
are the prevailing atmospheric winds, wind shears, and
thermal structures during these various El Nino years.
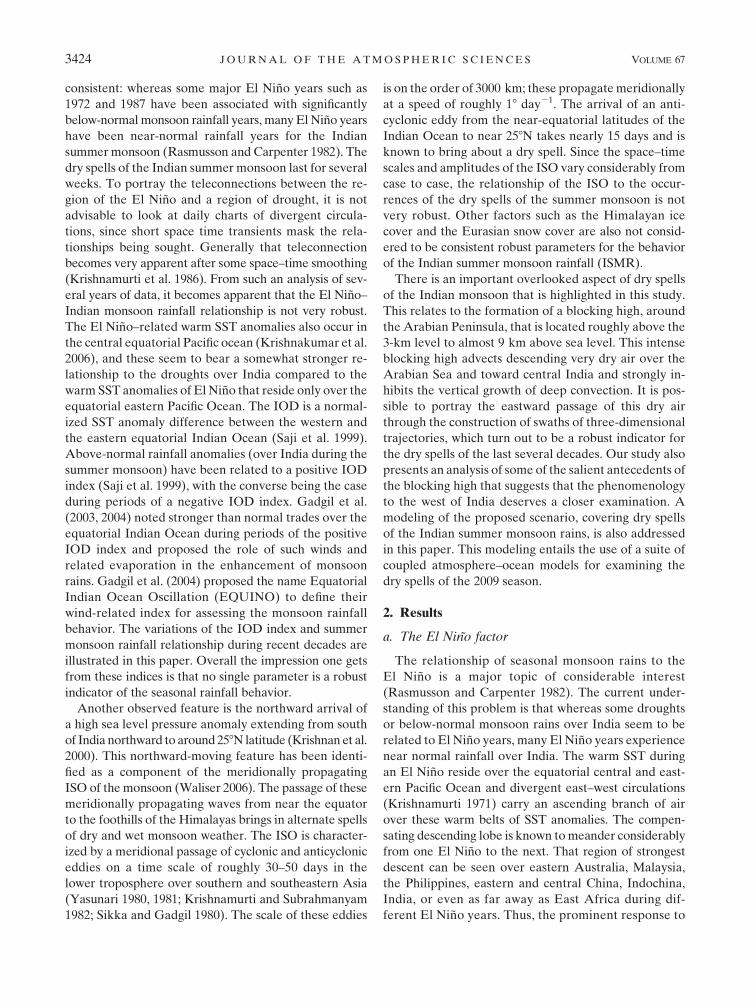
The total seasonal rainfall (for June–September) over
all of India [the all-India summer monsoon rainfall
(AISMR)] is used as a measure of the Indian monsoon
behavior. Figure 1 illustrates the total rainfall covering
the years 1960–2009. The El Nino years are shown by an
open bar. While some deficient rainfall years were clearly
El Nino years, many were characterized by near-normal
rains. Thus, the monsoon–El Nino relationship is not very
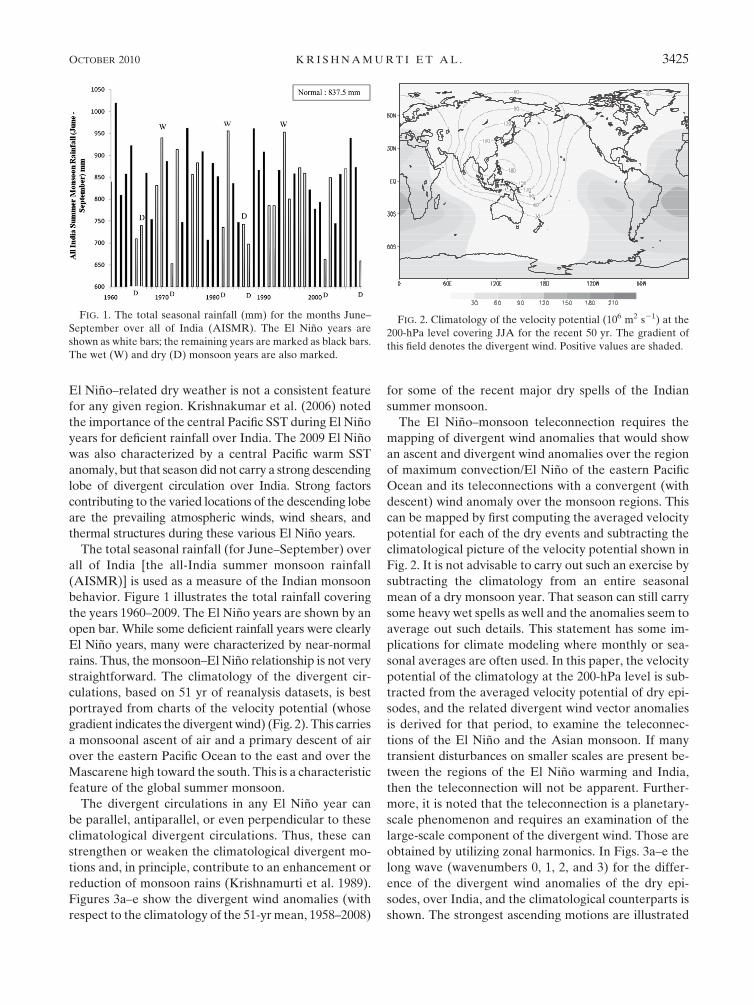
straightforward. The climatology of the divergent cir-
culations, based on 51 yr of reanalysis datasets, is best
portrayed from charts of the velocity potential (whose
gradient indicates the divergent wind) (Fig. 2). This carries
a monsoonal ascent of air and a primary descent of air
over the eastern Pacific Ocean to the east and over the
Mascarene high toward the south. This is a characteristic
feature of the global summer monsoon.
The divergent circulations in any El Nino year can
be parallel, antiparallel, or even perpendicular to these
climatological divergent circulations. Thus, these can
strengthen or weaken the climatological divergent mo-
tions and, in principle, contribute to an enhancement or
reduction of monsoon rains (Krishnamurti et al. 1989).
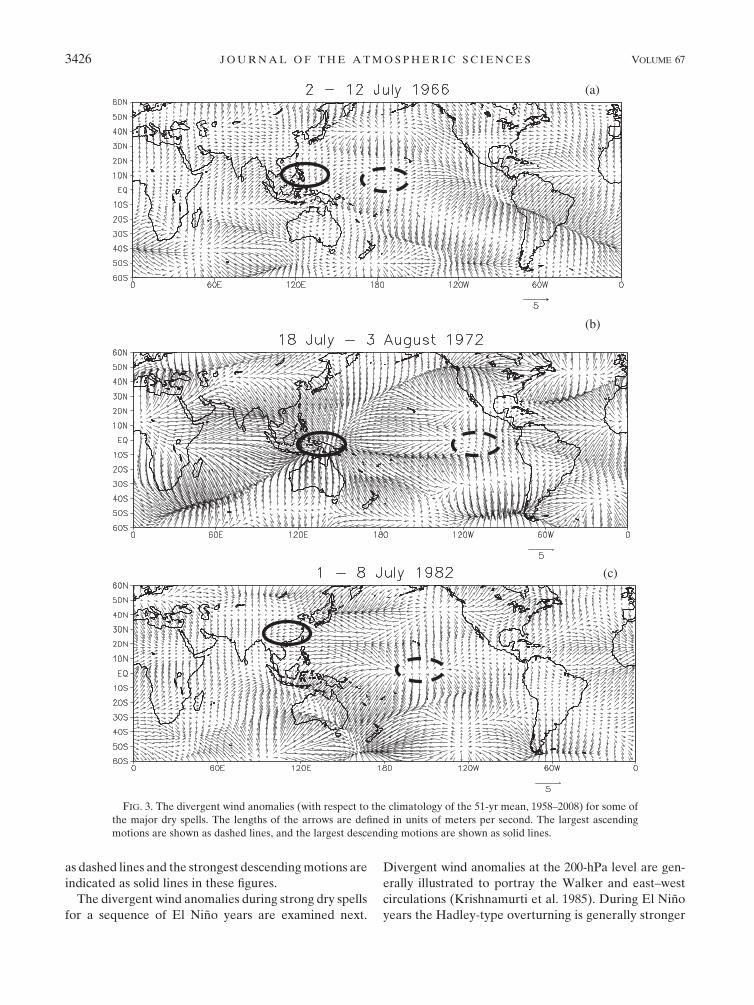
Figures 3a–e show the divergent wind anomalies (with
respect to the climatology of the 51-yr mean, 1958–2008)
for some of the recent major dry spells of the Indian
summer monsoon.
The El Nino–monsoon teleconnection requires the
mapping of divergent wind anomalies that would show
an ascent and divergent wind anomalies over the region
of maximum convection/El Nino of the eastern Pacific
Ocean and its teleconnections with a convergent (with
descent) wind anomaly over the monsoon regions. This
can be mapped by first computing the averaged velocity
potential for each of the dry events and subtracting the
climatological picture of the velocity potential shown in
Fig. 2. It is not advisable to carry out such an exercise by
subtracting the climatology from an entire seasonal
mean of a dry monsoon year. That season can still carry
some heavy wet spells as well and the anomalies seem to
average out such details. This statement has some im-
plications for climate modeling where monthly or sea-
sonal averages are often used. In this paper, the velocity
potential of the climatology at the 200-hPa level is sub-
tracted from the averaged velocity potential of dry epi-
sodes, and the related divergent wind vector anomalies
is derived for that period, to examine the teleconnec-
tions of the El Nino and the Asian monsoon. If many
transient disturbances on smaller scales are present be-
tween the regions of the El Nino warming and India,
then the teleconnection will not be apparent. Further-
more, it is noted that the teleconnection is a planetary-
scale phenomenon and requires an examination of the
large-scale component of the divergent wind. Those are
obtained by utilizing zonal harmonics. In Figs. 3a–e the
long wave (wavenumbers 0, 1, 2, and 3) for the differ-
ence of the divergent wind anomalies of the dry epi-
sodes, over India, and the climatological counterparts is
shown. The strongest ascending motions are illustrated
FIG. 1. The total seasonal rainfall (mm) for the months June–
September over all of India (AISMR). The El Nino years are
shown as white bars; the remaining years are marked as black bars.
The wet (W) and dry (D) monsoon years are also marked.
FIG. 2. Climatology of the velocity potential (106 m2 s21) at the
200-hPa level covering JJA for the recent 50 yr. The gradient of
this field denotes the divergent wind. Positive values are shaded.
OCTOBER 2010 K R I S H N A M U R T I E T A L . 3425
as dashed lines and the strongest descending motions are
indicated as solid lines in these figures.
The divergent wind anomalies during strong dry spells
for a sequence of El Nino years are examined next.
Divergent wind anomalies at the 200-hPa level are gen-
erally illustrated to portray the Walker and east–west
circulations (Krishnamurti et al. 1985). During El Nino
years the Hadley-type overturning is generally stronger
FIG. 3. The divergent wind anomalies (with respect to the climatology of the 51-yr mean, 1958–2008) for some of
the major dry spells. The lengths of the arrows are defined in units of meters per second. The largest ascending
motions are shown as dashed lines, and the largest descending motions are shown as solid lines.
3426 J O U R N A L O F T H E A T M O S P H E R I C S C I E N C E S VOLUME 67
compared to La Nina years (Wallace and Gutzler 1981).
The divergent wind anomalies for a major dry spell (2–
12 July 1966) are shown in Fig. 3a. The divergent winds
from the Southern Hemisphere ITCZ were strong dur-
ing this period and the divergent winds imply an ascent
of air near 108S latitude and a descent over India. No
direct teleconnections of the monsoonal region with the
belt of warm SST anomalies of the eastern equatorial
Pacific Ocean were noted during this period. The di-
vergent winds of the period 18 July–3 August 1972 (Fig. 3b)
show divergent wind emanations from the ITCZ over
Africa near 108N that carried a descent over India, and
the divergent wind teleconnections with the central or
eastern equatorial Pacific Ocean were not present. In
1982 the period 1–8 July was characterized by a strong
sea surface anomaly over the central Pacific Ocean and
the divergent wind emanation from this region of ascent
could be clearly seen (Fig. 3c) and a teleconnection with
central India where the descending lobe existed was
noted. The vertical motions are not shown; they were
examined from reanalysis datasets (Kalnay et al. 1996).
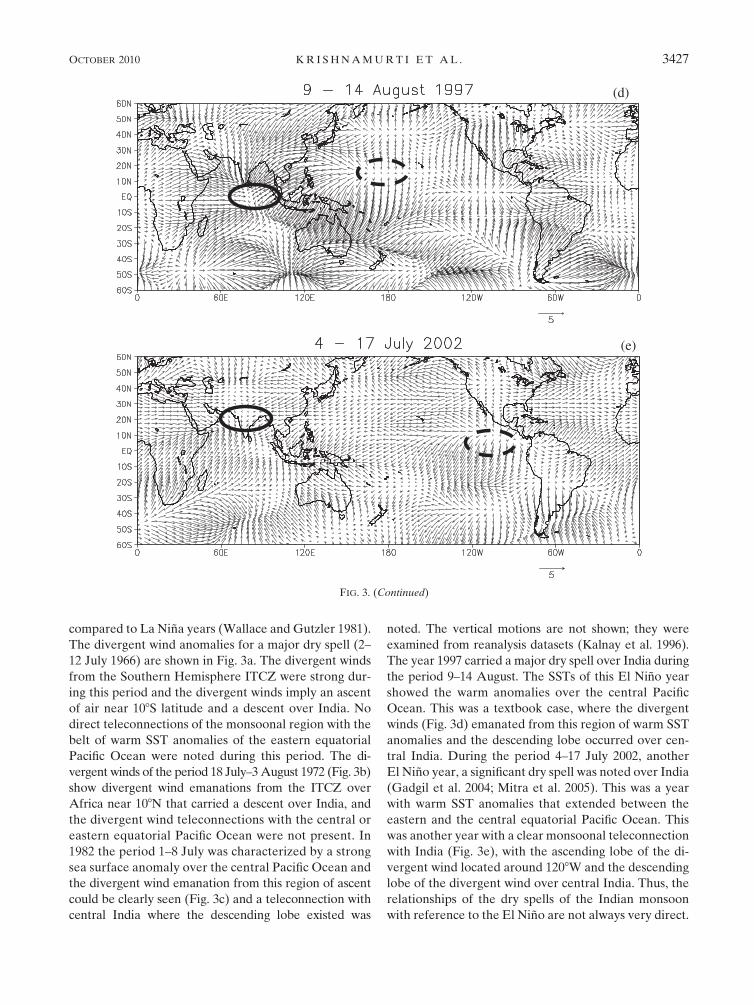
The year 1997 carried a major dry spell over India during
the period 9–14 August. The SSTs of this El Nino year
showed the warm anomalies over the central Pacific
Ocean. This was a textbook case, where the divergent
winds (Fig. 3d) emanated from this region of warm SST
anomalies and the descending lobe occurred over cen-
tral India. During the period 4–17 July 2002, another
El Nino year, a significant dry spell was noted over India
(Gadgil et al. 2004; Mitra et al. 2005). This was a year
with warm SST anomalies that extended between the
eastern and the central equatorial Pacific Ocean. This
was another year with a clear monsoonal teleconnection
with India (Fig. 3e), with the ascending lobe of the di-
vergent wind located around 1208W and the descending
lobe of the divergent wind over central India. Thus, the
relationships of the dry spells of the Indian monsoon
with reference to the El Nino are not always very direct.
FIG. 3. (Continued)
OCTOBER 2010 K R I S H N A M U R T I E T A L . 3427
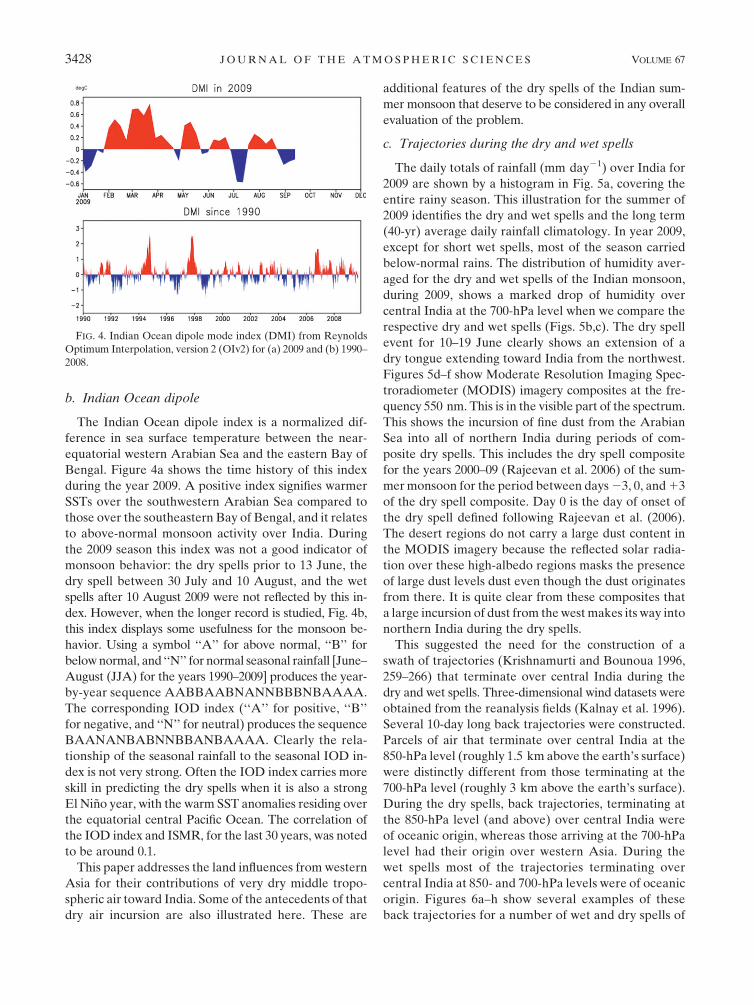
b. Indian Ocean dipole
The Indian Ocean dipole index is a normalized dif-
ference in sea surface temperature between the near-
equatorial western Arabian Sea and the eastern Bay of
Bengal. Figure 4a shows the time history of this index
during the year 2009. A positive index signifies warmer
SSTs over the southwestern Arabian Sea compared to
those over the southeastern Bay of Bengal, and it relates
to above-normal monsoon activity over India. During
the 2009 season this index was not a good indicator of
monsoon behavior: the dry spells prior to 13 June, the
dry spell between 30 July and 10 August, and the wet
spells after 10 August 2009 were not reflected by this in-
dex. However, when the longer record is studied, Fig. 4b,
this index displays some usefulness for the monsoon be-
havior. Using a symbol ‘‘A’’ for above normal, ‘‘B’’ for
below normal, and ‘‘N’’ for normal seasonal rainfall [June–
August (JJA) for the years 1990–2009] produces the year-
by-year sequence AABBAABNANNBBBNBAAAA.
The corresponding IOD index (‘‘A’’ for positive, ‘‘B’’
for negative, and ‘‘N’’ for neutral) produces the sequence
BAANANBABNNBBANBAAAA. Clearly the rela-
tionship of the seasonal rainfall to the seasonal IOD in-
dex is not very strong. Often the IOD index carries more
skill in predicting the dry spells when it is also a strong
El Nino year, with the warm SST anomalies residing over
the equatorial central Pacific Ocean. The correlation of
the IOD index and ISMR, for the last 30 years, was noted
to be around 0.1.
This paper addresses the land influences from western
Asia for their contributions of very dry middle tropo-
spheric air toward India. Some of the antecedents of that
dry air incursion are also illustrated here. These are
additional features of the dry spells of the Indian sum-
mer monsoon that deserve to be considered in any overall
evaluation of the problem.
c. Trajectories during the dry and wet spells
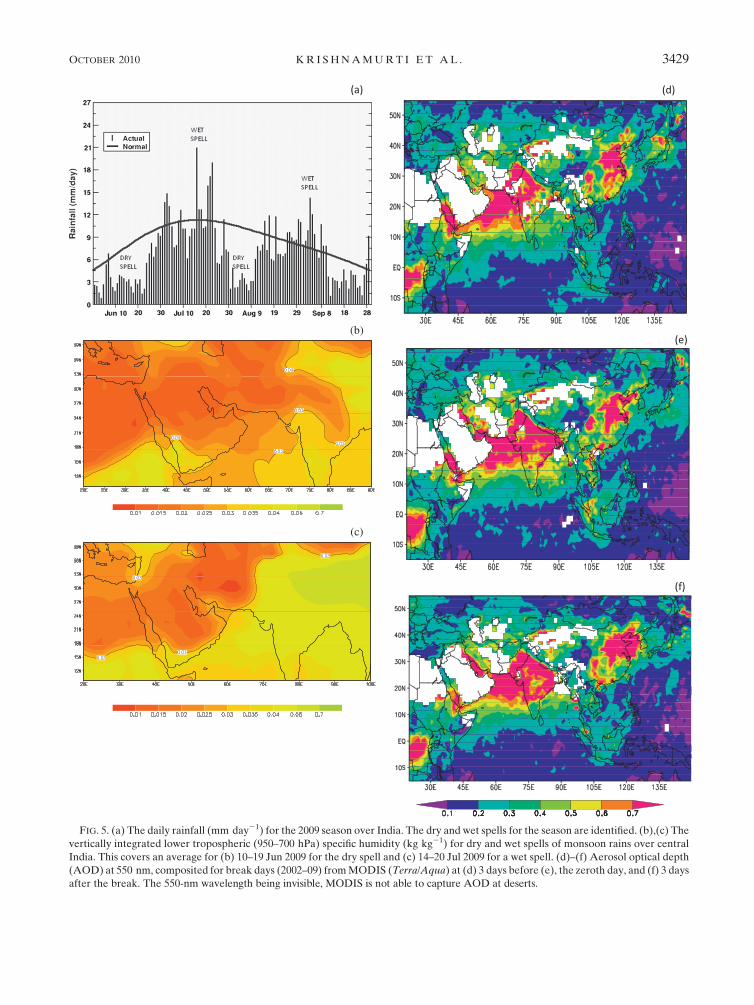
The daily totals of rainfall (mm day21) over India for
2009 are shown by a histogram in Fig. 5a, covering the
entire rainy season. This illustration for the summer of
2009 identifies the dry and wet spells and the long term
(40-yr) average daily rainfall climatology. In year 2009,
except for short wet spells, most of the season carried
below-normal rains. The distribution of humidity aver-
aged for the dry and wet spells of the Indian monsoon,
during 2009, shows a marked drop of humidity over
central India at the 700-hPa level when we compare the
respective dry and wet spells (Figs. 5b,c). The dry spell
event for 10–19 June clearly shows an extension of a
dry tongue extending toward India from the northwest.
Figures 5d–f show Moderate Resolution Imaging Spec-
troradiometer (MODIS) imagery composites at the fre-
quency 550 nm. This is in the visible part of the spectrum.
This shows the incursion of fine dust from the Arabian
Sea into all of northern India during periods of com-
posite dry spells. This includes the dry spell composite
for the years 2000–09 (Rajeevan et al. 2006) of the sum-
mer monsoon for the period between days 23, 0, and 13
of the dry spell composite. Day 0 is the day of onset of
the dry spell defined following Rajeevan et al. (2006).
The desert regions do not carry a large dust content in
the MODIS imagery because the reflected solar radia-
tion over these high-albedo regions masks the presence
of large dust levels dust even though the dust originates
from there. It is quite clear from these composites that
a large incursion of dust from the west makes its way into
northern India during the dry spells.
This suggested the need for the construction of a
swath of trajectories (Krishnamurti and Bounoua 1996,
259–266) that terminate over central India during the
dry and wet spells. Three-dimensional wind datasets were
obtained from the reanalysis fields (Kalnay et al. 1996).
Several 10-day long back trajectories were constructed.
Parcels of air that terminate over central India at the
850-hPa level (roughly 1.5 km above the earth’s surface)
were distinctly different from those terminating at the
700-hPa level (roughly 3 km above the earth’s surface).
During the dry spells, back trajectories, terminating at
the 850-hPa level (and above) over central India were
of oceanic origin, whereas those arriving at the 700-hPa
level had their origin over western Asia. During the
wet spells most of the trajectories terminating over
central India at 850- and 700-hPa levels were of oceanic
origin. Figures 6a–h show several examples of these
back trajectories for a number of wet and dry spells of
FIG. 4. Indian Ocean dipole mode index (DMI) from Reynolds
Optimum Interpolation, version 2 (OIv2) for (a) 2009 and (b) 1990–
2008.
3428 J O U R N A L O F T H E A T M O S P H E R I C S C I E N C E S VOLUME 67
(a)
FIG. 5. (a) The daily rainfall (mm day21) for the 2009 season over India. The dry and wet spells for the season are identified. (b),(c) The
vertically integrated lower tropospheric (950–700 hPa) specific humidity (kg kg21) for dry and wet spells of monsoon rains over central
India. This covers an average for (b) 10–19 Jun 2009 for the dry spell and (c) 14–20 Jul 2009 for a wet spell. (d)–(f) Aerosol optical depth
(AOD) at 550 nm, composited for break days (2002–09) from MODIS (Terra/Aqua) at (d) 3 days before (e), the zeroth day, and (f) 3 days
after the break. The 550-nm wavelength being invisible, MODIS is not able to capture AOD at deserts.
OCTOBER 2010 K R I S H N A M U R T I E T A L . 3429
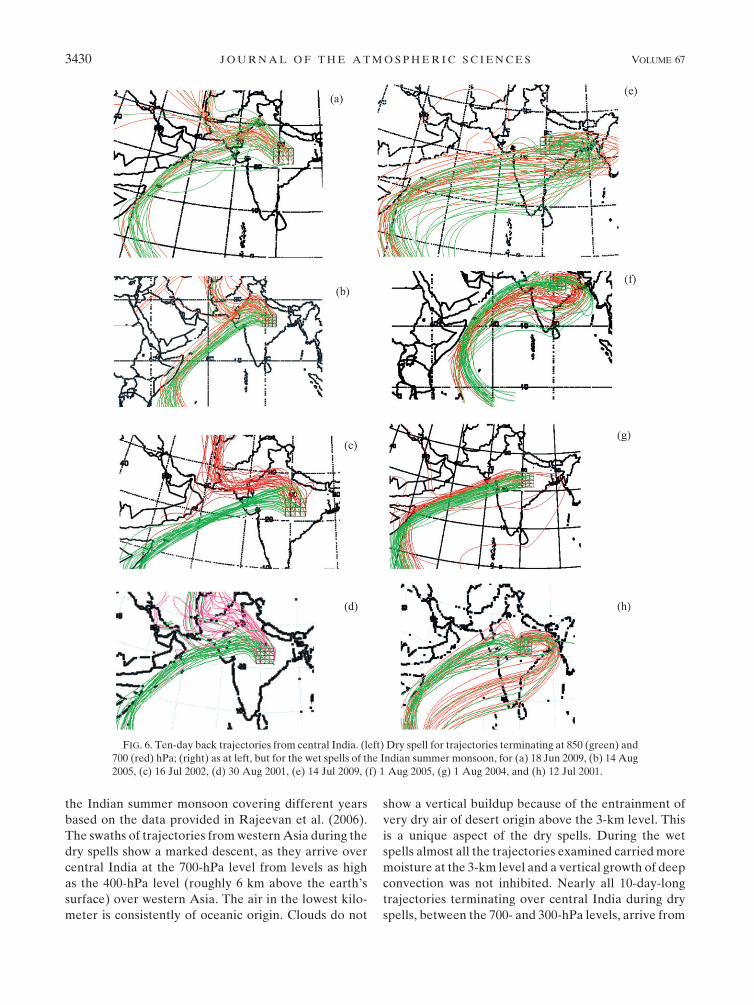
the Indian summer monsoon covering different years
based on the data provided in Rajeevan et al. (2006).
The swaths of trajectories from western Asia during the
dry spells show a marked descent, as they arrive over
central India at the 700-hPa level from levels as high
as the 400-hPa level (roughly 6 km above the earth’s
surface) over western Asia. The air in the lowest kilo-
meter is consistently of oceanic origin. Clouds do not
show a vertical buildup because of the entrainment of
very dry air of desert origin above the 3-km level. This
is a unique aspect of the dry spells. During the wet
spells almost all the trajectories examined carried more
moisture at the 3-km level and a vertical growth of deep
convection was not inhibited. Nearly all 10-day-long
trajectories terminating over central India during dry
spells, between the 700- and 300-hPa levels, arrive from
FIG. 6. Ten-day back trajectories from central India. (left) Dry spell for trajectories terminating at 850 (green) and
700 (red) hPa; (right) as at left, but for the wet spells of the Indian summer monsoon, for (a) 18 Jun 2009, (b) 14 Aug
2005, (c) 16 Jul 2002, (d) 30 Aug 2001, (e) 14 Jul 2009, (f) 1 Aug 2005, (g) 1 Aug 2004, and (h) 12 Jul 2001.
3430 J O U R N A L O F T H E A T M O S P H E R I C S C I E N C E S VOLUME 67
western Asia, whereas most of the trajectories of the
wet spells terminating over central India are of oceanic
origin.
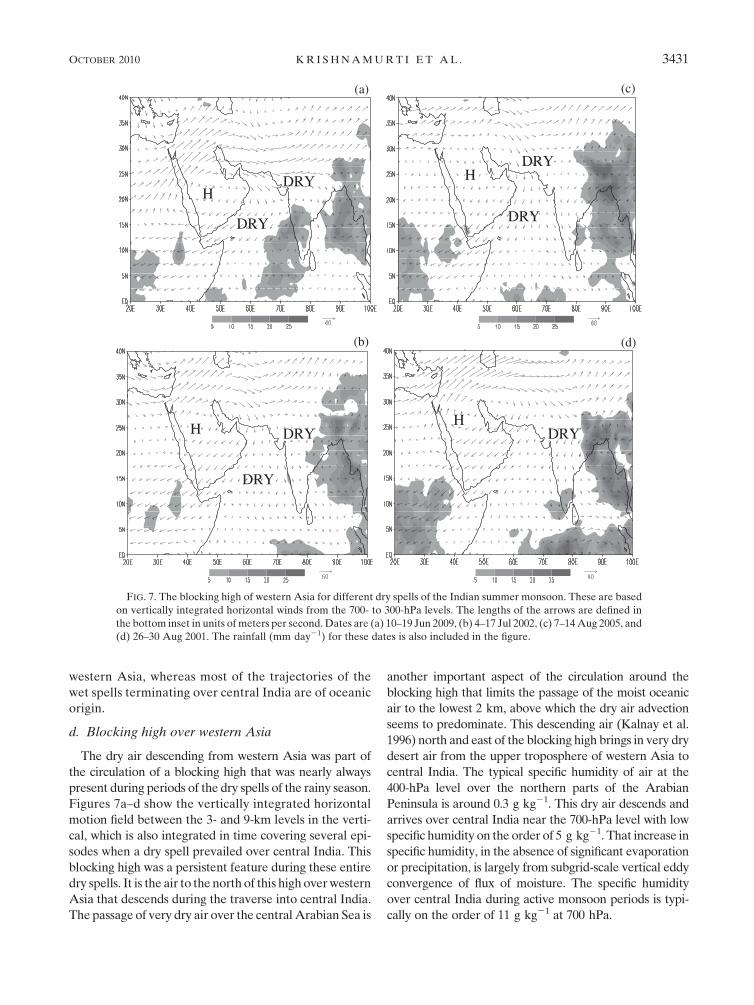
d. Blocking high over western Asia
The dry air descending from western Asia was part of
the circulation of a blocking high that was nearly always
present during periods of the dry spells of the rainy season.
Figures 7a–d show the vertically integrated horizontal
motion field between the 3- and 9-km levels in the verti-
cal, which is also integrated in time covering several epi-
sodes when a dry spell prevailed over central India. This
blocking high was a persistent feature during these entire
dry spells. It is the air to the north of this high over western
Asia that descends during the traverse into central India.
The passage of very dry air over the central Arabian Sea is
another important aspect of the circulation around the
blocking high that limits the passage of the moist oceanic
air to the lowest 2 km, above which the dry air advection
seems to predominate. This descending air (Kalnay et al.
1996) north and east of the blocking high brings in very dry
desert air from the upper troposphere of western Asia to
central India. The typical specific humidity of air at the
400-hPa level over the northern parts of the Arabian
Peninsula is around 0.3 g kg21. This dry air descends and
arrives over central India near the 700-hPa level with low
specific humidity on the order of 5 g kg21. That increase in
specific humidity, in the absence of significant evaporation
or precipitation, is largely from subgrid-scale vertical eddy
convergence of flux of moisture. The specific humidity
over central India during active monsoon periods is typi-
cally on the order of 11 g kg21 at 700 hPa.
FIG. 7. The blocking high of western Asia for different dry spells of the Indian summer monsoon. These are based
on vertically integrated horizontal winds from the 700- to 300-hPa levels. The lengths of the arrows are defined in
the bottom inset in units of meters per second. Dates are (a) 10–19 Jun 2009, (b) 4–17 Jul 2002, (c) 7–14 Aug 2005, and
(d) 26–30 Aug 2001. The rainfall (mm day21) for these dates is also included in the figure.
OCTOBER 2010 K R I S H N A M U R T I E T A L . 3431
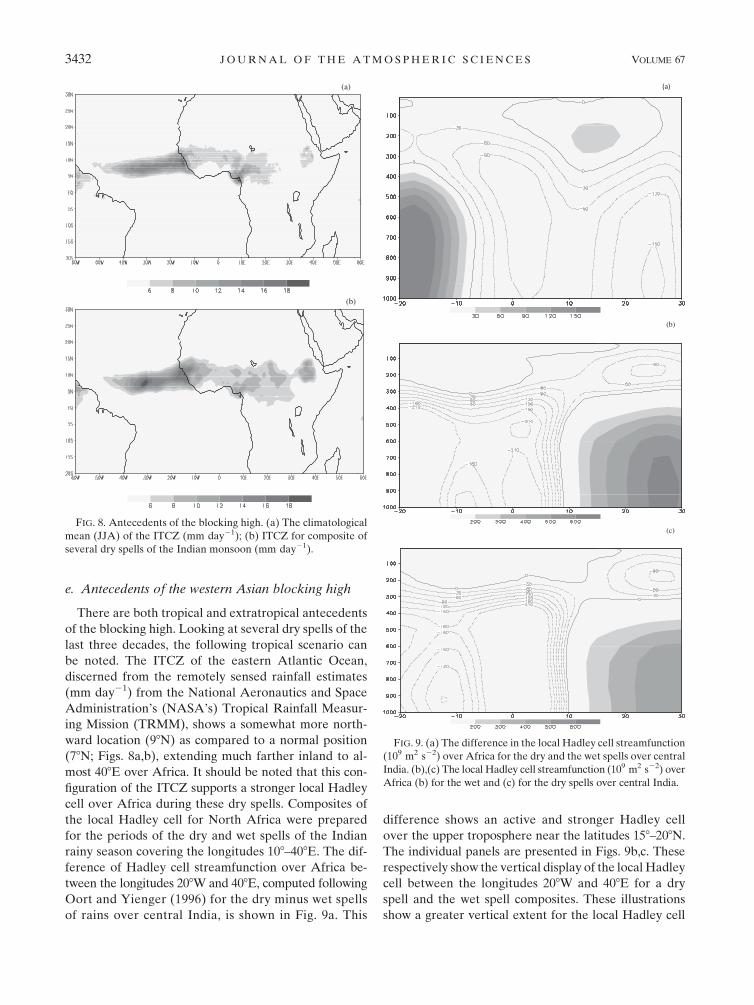
e. Antecedents of the western Asian blocking high
There are both tropical and extratropical antecedents
of the blocking high. Looking at several dry spells of the
last three decades, the following tropical scenario can
be noted. The ITCZ of the eastern Atlantic Ocean,
discerned from the remotely sensed rainfall estimates
(mm day21) from the National Aeronautics and Space
Administration’s (NASA’s) Tropical Rainfall Measur-
ing Mission (TRMM), shows a somewhat more north-
ward location (98N) as compared to a normal position
(78N; Figs. 8a,b), extending much farther inland to al-
most 408E over Africa. It should be noted that this con-
figuration of the ITCZ supports a stronger local Hadley
cell over Africa during these dry spells. Composites of
the local Hadley cell for North Africa were prepared
for the periods of the dry and wet spells of the Indian
rainy season covering the longitudes 108–408E. The dif-
ference of Hadley cell streamfunction over Africa be-
tween the longitudes 208W and 408E, computed following
Oort and Yienger (1996) for the dry minus wet spells
of rains over central India, is shown in Fig. 9a. This
difference shows an active and stronger Hadley cell
over the upper troposphere near the latitudes 158–208N.
The individual panels are presented in Figs. 9b,c. These
respectively show the vertical display of the local Hadley
cell between the longitudes 208W and 408E for a dry
spell and the wet spell composites. These illustrations
show a greater vertical extent for the local Hadley cell
FIG. 8. Antecedents of the blocking high. (a) The climatological
mean (JJA) of the ITCZ (mm day21); (b) ITCZ for composite of
several dry spells of the Indian monsoon (mm day21).
FIG. 9. (a) The difference in the local Hadley cell streamfunction
(109 m2 s22) over Africa for the dry and the wet spells over central
India. (b),(c) The local Hadley cell streamfunction (109 m2 s22) over
Africa (b) for the wet and (c) for the dry spells over central India.
3432 J O U R N A L O F T H E A T M O S P H E R I C S C I E N C E S VOLUME 67
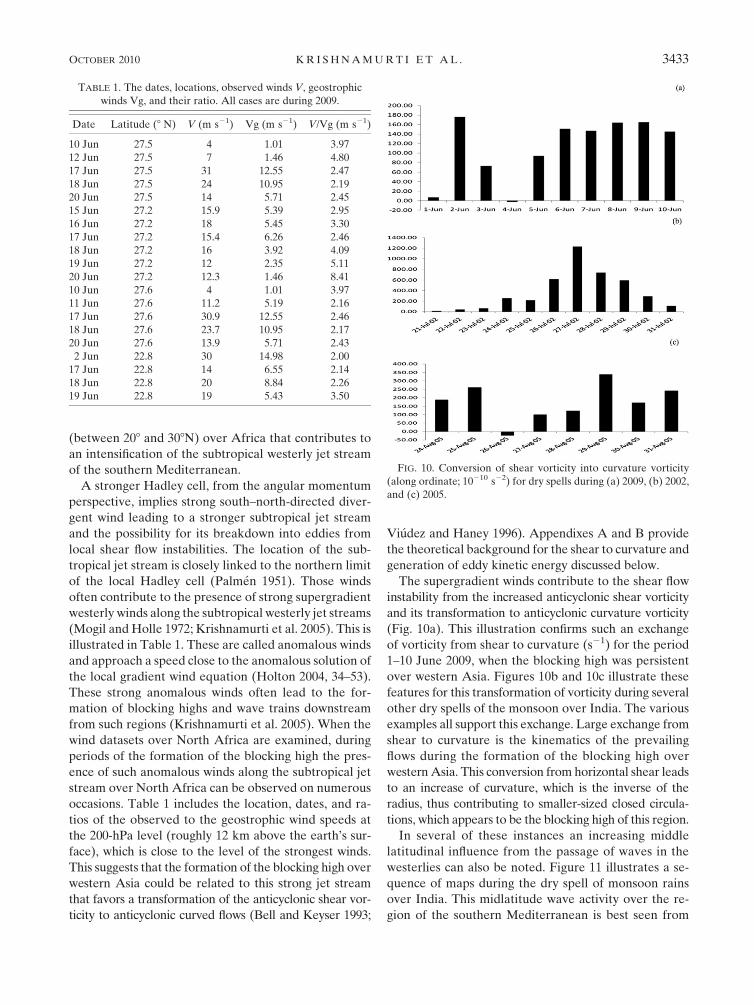
(between 208 and 308N) over Africa that contributes to
an intensification of the subtropical westerly jet stream
of the southern Mediterranean.
A stronger Hadley cell, from the angular momentum
perspective, implies strong south–north-directed diver-
gent wind leading to a stronger subtropical jet stream
and the possibility for its breakdown into eddies from
local shear flow instabilities. The location of the sub-
tropical jet stream is closely linked to the northern limit
of the local Hadley cell (Palmen 1951). Those winds
often contribute to the presence of strong supergradient
westerly winds along the subtropical westerly jet streams
(Mogil and Holle 1972; Krishnamurti et al. 2005). This is
illustrated in Table 1. These are called anomalous winds
and approach a speed close to the anomalous solution of
the local gradient wind equation (Holton 2004, 34–53).
These strong anomalous winds often lead to the for-
mation of blocking highs and wave trains downstream
from such regions (Krishnamurti et al. 2005). When the
wind datasets over North Africa are examined, during
periods of the formation of the blocking high the pres-
ence of such anomalous winds along the subtropical jet
stream over North Africa can be observed on numerous
occasions. Table 1 includes the location, dates, and ra-
tios of the observed to the geostrophic wind speeds at
the 200-hPa level (roughly 12 km above the earth’s sur-
face), which is close to the level of the strongest winds.
This suggests that the formation of the blocking high over
western Asia could be related to this strong jet stream
that favors a transformation of the anticyclonic shear vor-
ticity to anticyclonic curved flows (Bell and Keyser 1993;
Viudez and Haney 1996). Appendixes A and B provide
the theoretical background for the shear to curvature and
generation of eddy kinetic energy discussed below.
The supergradient winds contribute to the shear flow
instability from the increased anticyclonic shear vorticity
and its transformation to anticyclonic curvature vorticity
(Fig. 10a). This illustration confirms such an exchange
of vorticity from shear to curvature (s21) for the period
1–10 June 2009, when the blocking high was persistent
over western Asia. Figures 10b and 10c illustrate these
features for this transformation of vorticity during several
other dry spells of the monsoon over India. The various
examples all support this exchange. Large exchange from
shear to curvature is the kinematics of the prevailing
flows during the formation of the blocking high over
western Asia. This conversion from horizontal shear leads
to an increase of curvature, which is the inverse of the
radius, thus contributing to smaller-sized closed circula-
tions, which appears to be the blocking high of this region.
In several of these instances an increasing middle
latitudinal influence from the passage of waves in the
westerlies can also be noted. Figure 11 illustrates a se-
quence of maps during the dry spell of monsoon rains
over India. This midlatitude wave activity over the re-
gion of the southern Mediterranean is best seen from
TABLE 1. The dates, locations, observed winds V, geostrophic
winds Vg, and their ratio. All cases are during 2009.
Date Latitude (8 N) V (m s21) Vg (m s21) V/Vg (m s21)
10 Jun 27.5 4 1.01 3.97
12 Jun 27.5 7 1.46 4.80
17 Jun 27.5 31 12.55 2.47
18 Jun 27.5 24 10.95 2.19
20 Jun 27.5 14 5.71 2.45
15 Jun 27.2 15.9 5.39 2.95
16 Jun 27.2 18 5.45 3.30
17 Jun 27.2 15.4 6.26 2.46
18 Jun 27.2 16 3.92 4.09
19 Jun 27.2 12 2.35 5.11
20 Jun 27.2 12.3 1.46 8.41
10 Jun 27.6 4 1.01 3.97
11 Jun 27.6 11.2 5.19 2.16
17 Jun 27.6 30.9 12.55 2.46
18 Jun 27.6 23.7 10.95 2.17
20 Jun 27.6 13.9 5.71 2.43
2 Jun 22.8 30 14.98 2.00
17 Jun 22.8 14 6.55 2.14
18 Jun 22.8 20 8.84 2.26
19 Jun 22.8 19 5.43 3.50
FIG. 10. Conversion of shear vorticity into curvature vorticity
(along ordinate; 10210 s22) for dry spells during (a) 2009, (b) 2002,
and (c) 2005.
OCTOBER 2010 K R I S H N A M U R T I E T A L . 3433
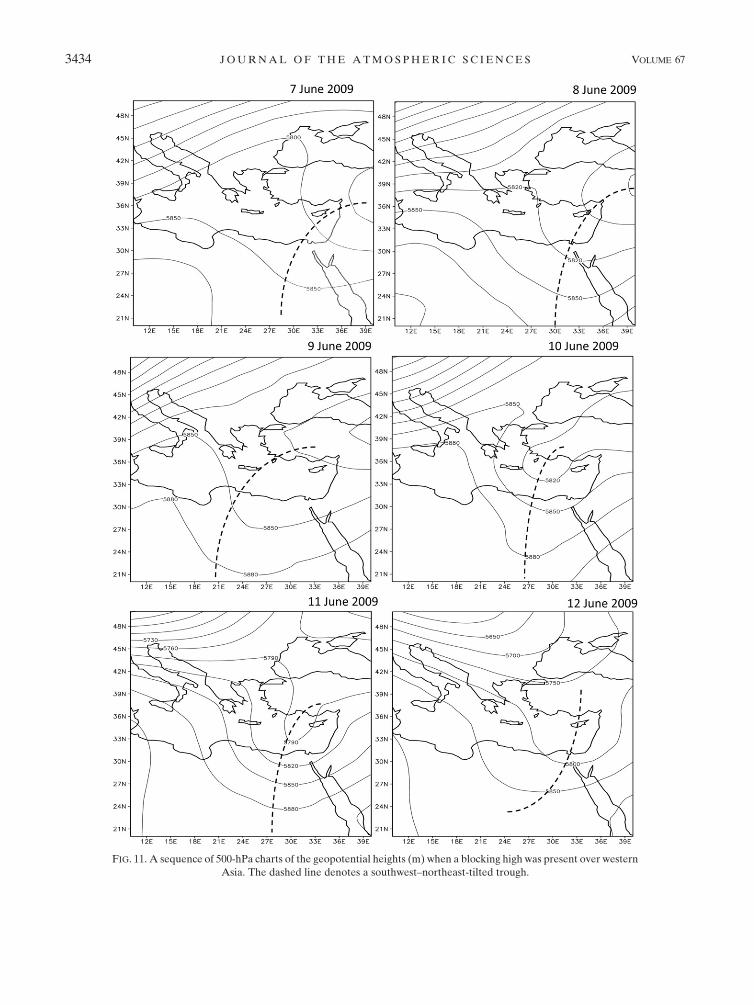
FIG. 11. A sequence of 500-hPa charts of the geopotential heights (m) when a blocking high was present over western
Asia. The dashed line denotes a southwest–northeast-tilted trough.
3434 J O U R N A L O F T H E A T M O S P H E R I C S C I E N C E S VOLUME 67

the geopotential height fields at the 500-hPa (6 km) level.
A sequence of days of such maps covering the period
7–12 June 2009 is shown here. The waves in the mid-
latitude westerlies show a tilt from southwest to north-
east that signify a northward flux of westerly momentum.
Midlatitude wave activity over eastern Europe leading
to the dry spells of the Indian summer monsoon was also
noted by Krishnan et al. (2009). From the latitudes
308–458N there was an increase of this momentum flux,
signifying a divergence of westerly momentum flux from
this belt. When the subtropical jet encounters this re-
moval of westerly momentum, the result is a significant
barotropic energy exchange from the zonal kinetic en-
ergy (i.e., the subtropical jet) to the eddy kinetic (i.e.,
the blocking high). This results in an energy exchange
(Manabe et al. 1965) from the eddies to the zonal flows
(the results for period 1–20 June 2009 are illustrated in
Fig. 12a). The preponderance of negative values implies
the growth of eddies, which is related to the blocking
high in this region (108–508N, 108W–508E). These cal-
culations cover the vertical layer between the 500- and
200-hPa levels where the blocking high was noted to
form. This is a consistent feature during the formation
of the blocking high.
Figures 12b and 12c show similar results for dry spells
over India during 21–31 July 2002 and during 24–30
August 2005 for such energy exchanges. These were both
strong dry spells over India with rainfall amounts around
30% below normal. In both instances we noted a strong
negative energy exchange, implying a transfer of energy
from the zonal kinetic energy toward the eddies. This
calls for a weakening of the subtropical jet over North
Africa and a strengthening of the eddies. The prominent
eddy of this region was the blocking high. Thus, it is
perceived that the growth of the blocking high of west-
ern Asia carries contributions from the divergent winds
of the local tropical Hadley cell over Africa and from the
drainage of westerly momentum of the subtropical jet
stream from midlatitude waves, which then results in that
growth of the eddy.
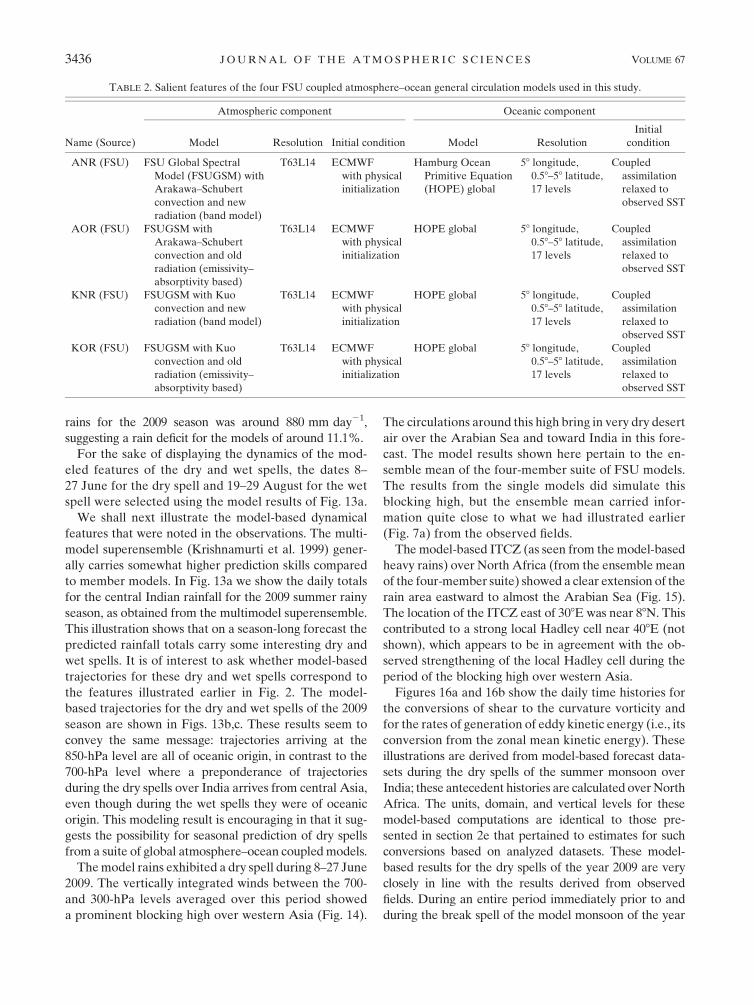
f. Modeling aspects
A suite of four Florida State University (FSU) cou-
pled atmosphere–ocean models are used in this study;
they are described in detail in Krishnamurti et al. (2002,
2006a,b) and Chakraborty and Krishnamurti (2006).
These models differ only in the prescription of physical
parameterizations (Table 2). All other features of these
models were kept identical. Table 2 also describes the
horizontal and vertical resolutions of these models and
the rest of the model specifications. Seasonal climate
forecasts were started on the first day of each month
covering the years 1987–2001. The construction of the
multimodel superensemble for seasonal climate forecasts
follows our earlier studies (Krishnamurti et al. 2006c;
Chakraborty and Krishnamurti 2006). Superensemble
forecasts include training and a forecast phase, which are
carried out using the cross-validation method that al-
lowed for the handling of smaller data lengths covering
these forecast years.
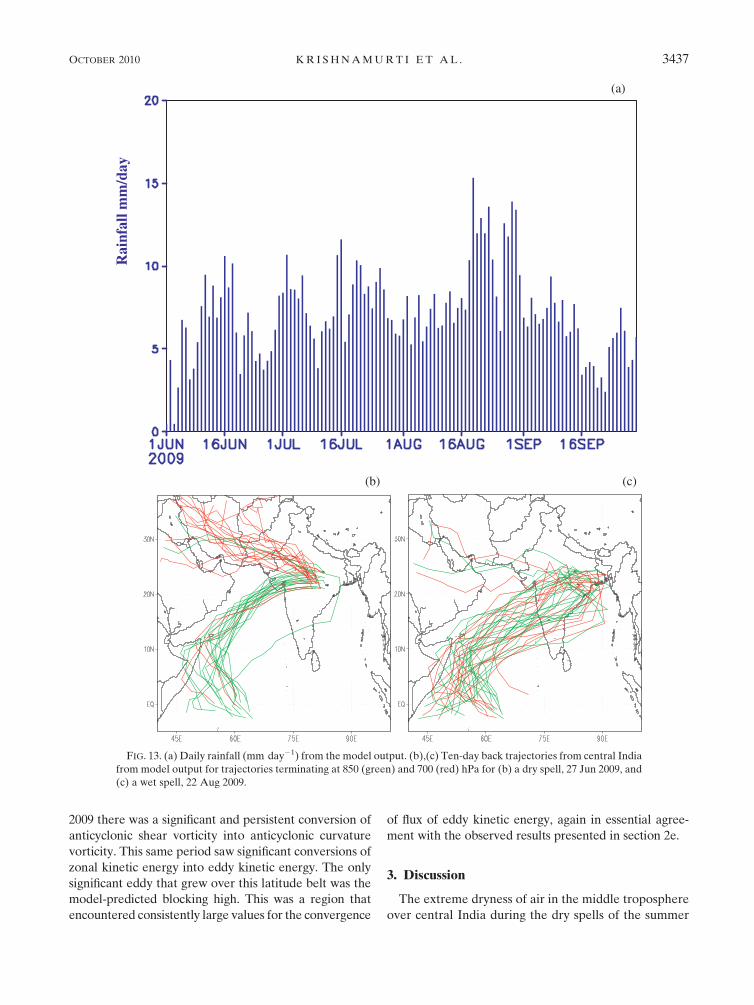
Figure 13a illustrates the daily march of the predicted
daily rainfall (mm day21) from this ensemble suite cov-
ering the Indian monsoon domain (188–228N, 718–808E)
for the summer months of 2009. This cannot be literally
compared with an observed counterpart, since daily
forecasts lose their predictability by about a week. How-
ever, this forecast shows that the ensemble suite does
carry some interesting dry and wet spells of rains, the
dates and amplitude of which not expected to be any-
where close to the corresponding dates for the observed
events. The climatological rainfall over the belt 188–228N,
718–808E during the summer monsoon months (June–
September) was around 837 mm day21. During the 2009
season that figure was around 660 mm day21, suggesting
a 21.6% deficit for rain. The climatological ensemble
mean rains from the suite of four coupled models was
around 990 mm day21, whereas the corresponding model
FIG. 12. The energy exchange from eddy kinetic energy to
the zonal kinetic energy (m2 s21) for dry spells during (a) 2009,
(b) 2002, and (c) 2005.
OCTOBER 2010 K R I S H N A M U R T I E T A L . 3435
rains for the 2009 season was around 880 mm day21,
suggesting a rain deficit for the models of around 11.1%.
For the sake of displaying the dynamics of the mod-
eled features of the dry and wet spells, the dates 8–
27 June for the dry spell and 19–29 August for the wet
spell were selected using the model results of Fig. 13a.
We shall next illustrate the model-based dynamical
features that were noted in the observations. The multi-
model superensemble (Krishnamurti et al. 1999) gener-
ally carries somewhat higher prediction skills compared
to member models. In Fig. 13a we show the daily totals
for the central Indian rainfall for the 2009 summer rainy
season, as obtained from the multimodel superensemble.
This illustration shows that on a season-long forecast the
predicted rainfall totals carry some interesting dry and
wet spells. It is of interest to ask whether model-based
trajectories for these dry and wet spells correspond to
the features illustrated earlier in Fig. 2. The model-
based trajectories for the dry and wet spells of the 2009
season are shown in Figs. 13b,c. These results seem to
convey the same message: trajectories arriving at the
850-hPa level are all of oceanic origin, in contrast to the
700-hPa level where a preponderance of trajectories
during the dry spells over India arrives from central Asia,
even though during the wet spells they were of oceanic
origin. This modeling result is encouraging in that it sug-
gests the possibility for seasonal prediction of dry spells
from a suite of global atmosphere–ocean coupled models.
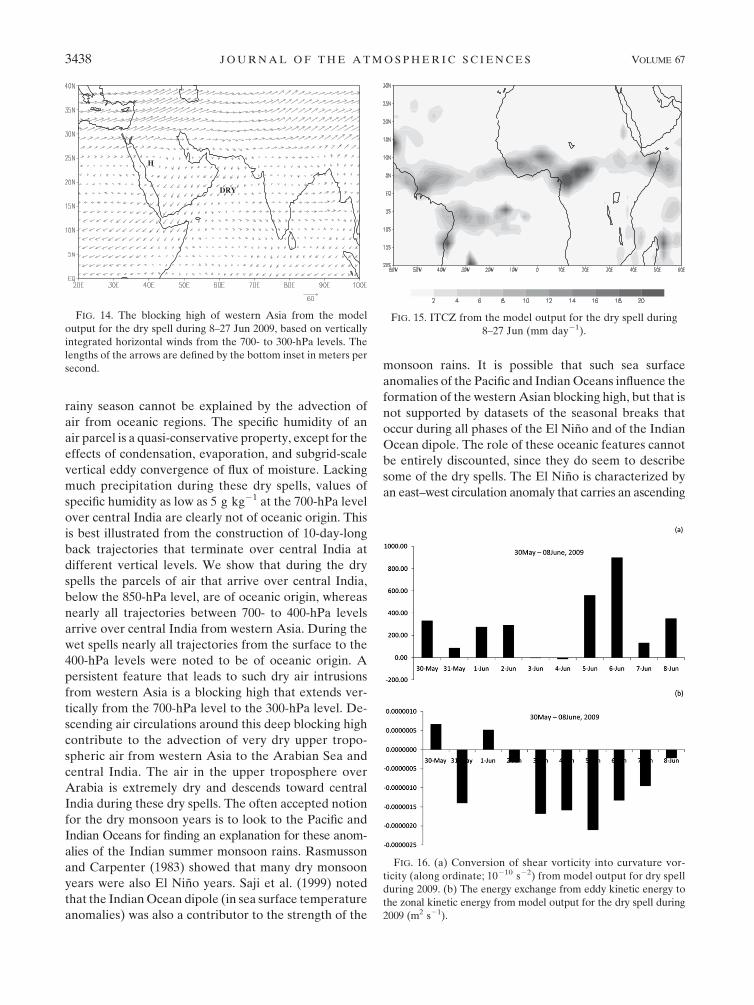
The model rains exhibited a dry spell during 8–27 June
2009. The vertically integrated winds between the 700-
and 300-hPa levels averaged over this period showed
a prominent blocking high over western Asia (Fig. 14).
The circulations around this high bring in very dry desert
air over the Arabian Sea and toward India in this fore-
cast. The model results shown here pertain to the en-
semble mean of the four-member suite of FSU models.
The results from the single models did simulate this
blocking high, but the ensemble mean carried infor-
mation quite close to what we had illustrated earlier
(Fig. 7a) from the observed fields.
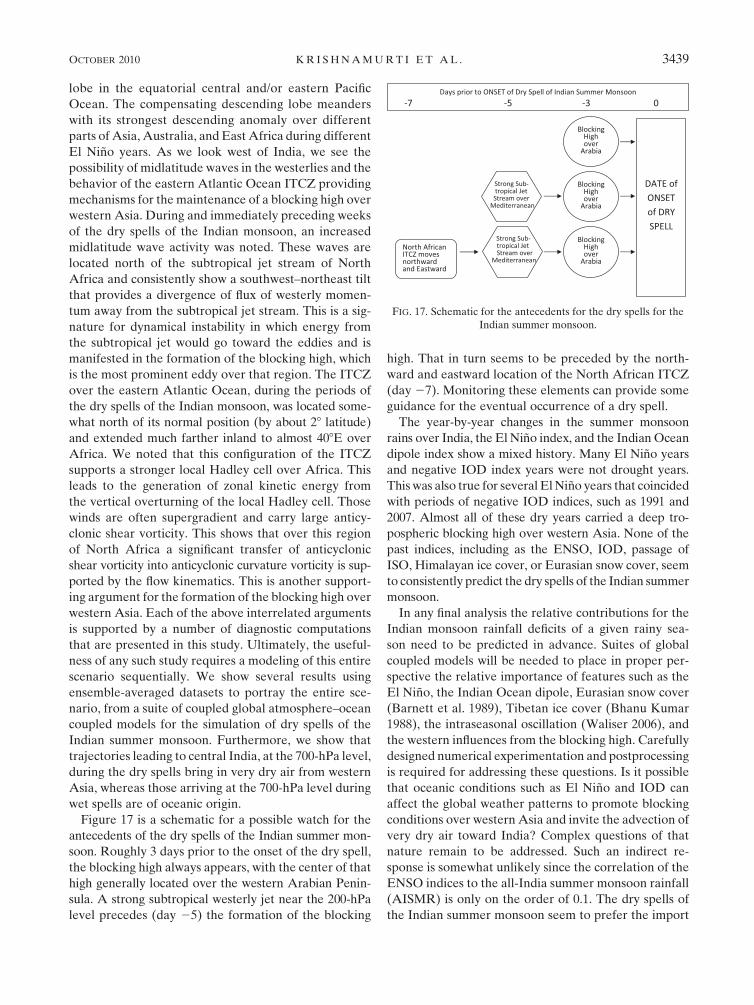
The model-based ITCZ (as seen from the model-based
heavy rains) over North Africa (from the ensemble mean
of the four-member suite) showed a clear extension of the
rain area eastward to almost the Arabian Sea (Fig. 15).
The location of the ITCZ east of 308E was near 88N. This
contributed to a strong local Hadley cell near 408E (not
shown), which appears to be in agreement with the ob-
served strengthening of the local Hadley cell during the
period of the blocking high over western Asia.
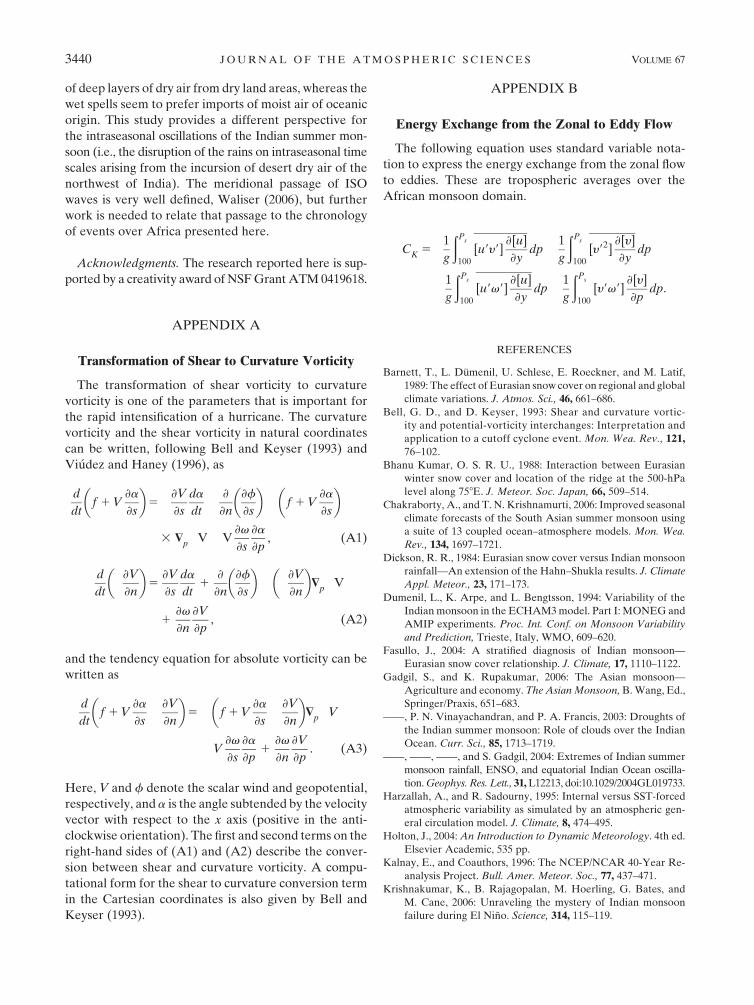
Figures 16a and 16b show the daily time histories for
the conversions of shear to the curvature vorticity and
for the rates of generation of eddy kinetic energy (i.e., its
conversion from the zonal mean kinetic energy). These
illustrations are derived from model-based forecast data-
sets during the dry spells of the summer monsoon over
India; these antecedent histories are calculated over North
Africa. The units, domain, and vertical levels for these
model-based computations are identical to those pre-
sented in section 2e that pertained to estimates for such
conversions based on analyzed datasets. These model-
based results for the dry spells of the year 2009 are very
closely in line with the results derived from observed
fields. During an entire period immediately prior to and
during the break spell of the model monsoon of the year
TABLE 2. Salient features of the four FSU coupled atmosphere–ocean general circulation models used in this study.
Atmospheric component Oceanic component
Name (Source) Model Resolution Initial condition Model Resolution
Initial
condition
ANR (FSU) FSU Global Spectral
Model (FSUGSM) with
Arakawa–Schubert
convection and new
radiation (band model)
T63L14 ECMWF
with physical
initialization
Hamburg Ocean
Primitive Equation
(HOPE) global
58 longitude,
0.58–58 latitude,
17 levels
Coupled
assimilation
relaxed to
observed SST
AOR (FSU) FSUGSM with
Arakawa–Schubert
convection and old
radiation (emissivity–
absorptivity based)
T63L14 ECMWF
with physical
initialization
HOPE global 58 longitude,
0.58–58 latitude,
17 levels
Coupled
assimilation
relaxed to
observed SST
KNR (FSU) FSUGSM with Kuo
convection and new
radiation (band model)
T63L14 ECMWF
with physical
initialization
HOPE global 58 longitude,
0.58–58 latitude,
17 levels
Coupled
assimilation
relaxed to
observed SST
KOR (FSU) FSUGSM with Kuo
convection and old
radiation (emissivity–
absorptivity based)
T63L14 ECMWF
with physical
initialization
HOPE global 58 longitude,
0.58–58 latitude,
17 levels
Coupled
assimilation
relaxed to
observed SST
3436 J O U R N A L O F T H E A T M O S P H E R I C S C I E N C E S VOLUME 67
2009 there was a significant and persistent conversion of
anticyclonic shear vorticity into anticyclonic curvature
vorticity. This same period saw significant conversions of
zonal kinetic energy into eddy kinetic energy. The only
significant eddy that grew over this latitude belt was the
model-predicted blocking high. This was a region that
encountered consistently large values for the convergence
of flux of eddy kinetic energy, again in essential agree-
ment with the observed results presented in section 2e.
3. Discussion
The extreme dryness of air in the middle troposphere
over central India during the dry spells of the summer
FIG. 13. (a) Daily rainfall (mm day21) from the model output. (b),(c) Ten-day back trajectories from central India
from model output for trajectories terminating at 850 (green) and 700 (red) hPa for (b) a dry spell, 27 Jun 2009, and
(c) a wet spell, 22 Aug 2009.
OCTOBER 2010 K R I S H N A M U R T I E T A L . 3437
rainy season cannot be explained by the advection of
air from oceanic regions. The specific humidity of an
air parcel is a quasi-conservative property, except for the
effects of condensation, evaporation, and subgrid-scale
vertical eddy convergence of flux of moisture. Lacking
much precipitation during these dry spells, values of
specific humidity as low as 5 g kg21 at the 700-hPa level
over central India are clearly not of oceanic origin. This
is best illustrated from the construction of 10-day-long
back trajectories that terminate over central India at
different vertical levels. We show that during the dry
spells the parcels of air that arrive over central India,
below the 850-hPa level, are of oceanic origin, whereas
nearly all trajectories between 700- to 400-hPa levels
arrive over central India from western Asia. During the
wet spells nearly all trajectories from the surface to the
400-hPa levels were noted to be of oceanic origin. A
persistent feature that leads to such dry air intrusions
from western Asia is a blocking high that extends ver-
tically from the 700-hPa level to the 300-hPa level. De-
scending air circulations around this deep blocking high
contribute to the advection of very dry upper tropo-
spheric air from western Asia to the Arabian Sea and
central India. The air in the upper troposphere over
Arabia is extremely dry and descends toward central
India during these dry spells. The often accepted notion
for the dry monsoon years is to look to the Pacific and
Indian Oceans for finding an explanation for these anom-
alies of the Indian summer monsoon rains. Rasmusson
and Carpenter (1983) showed that many dry monsoon
years were also El Nino years. Saji et al. (1999) noted
that the Indian Ocean dipole (in sea surface temperature
anomalies) was also a contributor to the strength of the
monsoon rains. It is possible that such sea surface
anomalies of the Pacific and Indian Oceans influence the
formation of the western Asian blocking high, but that is
not supported by datasets of the seasonal breaks that
occur during all phases of the El Nino and of the Indian
Ocean dipole. The role of these oceanic features cannot
be entirely discounted, since they do seem to describe
some of the dry spells. The El Nino is characterized by
an east–west circulation anomaly that carries an ascending
FIG. 14. The blocking high of western Asia from the model
output for the dry spell during 8–27 Jun 2009, based on vertically
integrated horizontal winds from the 700- to 300-hPa levels. The
lengths of the arrows are defined by the bottom inset in meters per
second.
FIG. 15. ITCZ from the model output for the dry spell during
8–27 Jun (mm day21).
FIG. 16. (a) Conversion of shear vorticity into curvature vor-
ticity (along ordinate; 10210 s22) from model output for dry spell
during 2009. (b) The energy exchange from eddy kinetic energy to
the zonal kinetic energy from model output for the dry spell during
2009 (m2 s21).
3438 J O U R N A L O F T H E A T M O S P H E R I C S C I E N C E S VOLUME 67
lobe in the equatorial central and/or eastern Pacific
Ocean. The compensating descending lobe meanders
with its strongest descending anomaly over different
parts of Asia, Australia, and East Africa during different
El Nino years. As we look west of India, we see the
possibility of midlatitude waves in the westerlies and the
behavior of the eastern Atlantic Ocean ITCZ providing
mechanisms for the maintenance of a blocking high over
western Asia. During and immediately preceding weeks
of the dry spells of the Indian monsoon, an increased
midlatitude wave activity was noted. These waves are
located north of the subtropical jet stream of North
Africa and consistently show a southwest–northeast tilt
that provides a divergence of flux of westerly momen-
tum away from the subtropical jet stream. This is a sig-
nature for dynamical instability in which energy from
the subtropical jet would go toward the eddies and is
manifested in the formation of the blocking high, which
is the most prominent eddy over that region. The ITCZ
over the eastern Atlantic Ocean, during the periods of
the dry spells of the Indian monsoon, was located some-
what north of its normal position (by about 28 latitude)
and extended much farther inland to almost 408E over
Africa. We noted that this configuration of the ITCZ
supports a stronger local Hadley cell over Africa. This
leads to the generation of zonal kinetic energy from
the vertical overturning of the local Hadley cell. Those
winds are often supergradient and carry large anticy-
clonic shear vorticity. This shows that over this region
of North Africa a significant transfer of anticyclonic
shear vorticity into anticyclonic curvature vorticity is sup-
ported by the flow kinematics. This is another support-
ing argument for the formation of the blocking high over
western Asia. Each of the above interrelated arguments
is supported by a number of diagnostic computations
that are presented in this study. Ultimately, the useful-
ness of any such study requires a modeling of this entire
scenario sequentially. We show several results using
ensemble-averaged datasets to portray the entire sce-
nario, from a suite of coupled global atmosphere–ocean
coupled models for the simulation of dry spells of the
Indian summer monsoon. Furthermore, we show that
trajectories leading to central India, at the 700-hPa level,
during the dry spells bring in very dry air from western
Asia, whereas those arriving at the 700-hPa level during
wet spells are of oceanic origin.
Figure 17 is a schematic for a possible watch for the
antecedents of the dry spells of the Indian summer mon-
soon. Roughly 3 days prior to the onset of the dry spell,
the blocking high always appears, with the center of that
high generally located over the western Arabian Penin-
sula. A strong subtropical westerly jet near the 200-hPa
level precedes (day 25) the formation of the blocking
high. That in turn seems to be preceded by the north-
ward and eastward location of the North African ITCZ
(day 27). Monitoring these elements can provide some
guidance for the eventual occurrence of a dry spell.
The year-by-year changes in the summer monsoon
rains over India, the El Nino index, and the Indian Ocean
dipole index show a mixed history. Many El Nino years
and negative IOD index years were not drought years.
This was also true for several El Nino years that coincided
with periods of negative IOD indices, such as 1991 and
2007. Almost all of these dry years carried a deep tro-
pospheric blocking high over western Asia. None of the
past indices, including as the ENSO, IOD, passage of
ISO, Himalayan ice cover, or Eurasian snow cover, seem
to consistently predict the dry spells of the Indian summer
monsoon.
In any final analysis the relative contributions for the
Indian monsoon rainfall deficits of a given rainy sea-
son need to be predicted in advance. Suites of global
coupled models will be needed to place in proper per-
spective the relative importance of features such as the
El Nino, the Indian Ocean dipole, Eurasian snow cover
(Barnett et al. 1989), Tibetan ice cover (Bhanu Kumar
1988), the intraseasonal oscillation (Waliser 2006), and
the western influences from the blocking high. Carefully
designed numerical experimentation and postprocessing
is required for addressing these questions. Is it possible
that oceanic conditions such as El Nino and IOD can
affect the global weather patterns to promote blocking
conditions over western Asia and invite the advection of
very dry air toward India? Complex questions of that
nature remain to be addressed. Such an indirect re-
sponse is somewhat unlikely since the correlation of the
ENSO indices to the all-India summer monsoon rainfall
(AISMR) is only on the order of 0.1. The dry spells of
the Indian summer monsoon seem to prefer the import
FIG. 17. Schematic for the antecedents for the dry spells for the
Indian summer monsoon.
OCTOBER 2010 K R I S H N A M U R T I E T A L . 3439
of deep layers of dry air from dry land areas, whereas the
wet spells seem to prefer imports of moist air of oceanic
origin. This study provides a different perspective for
the intraseasonal oscillations of the Indian summer mon-
soon (i.e., the disruption of the rains on intraseasonal time
scales arising from the incursion of desert dry air of the
northwest of India). The meridional passage of ISO
waves is very well defined, Waliser (2006), but further
work is needed to relate that passage to the chronology
of events over Africa presented here.
Acknowledgments. The research reported here is sup-
ported by a creativity award of NSF Grant ATM 0419618.
APPENDIX A
Transformation of Shear to Curvature Vorticity
The transformation of shear vorticity to curvature
vorticity is one of the parameters that is important for
the rapid intensification of a hurricane. The curvature
vorticity and the shear vorticity in natural coordinates
can be written, following Bell and Keyser (1993) and
Viudez and Haney (1996), as
d
dtf 1 V
›a
›s
� �5�›V
›s
da
dt� ›
›n
›f
›s
� �� f 1 V
›a
›s
� �
3 $p�V�V
›v
›s
›a
›p, (A1)
d
dt�›V
›n
� �5
›V
›s
da
dt1
›
›n
›f
›s
� �� �›V
›n
� �$
p�V
1›v
›n
›V
›p, (A2)
and the tendency equation for absolute vorticity can be
written as
d
dtf 1 V
›a
›s� ›V
›n
� �5 � f 1 V
›a
›s� ›V
›n
� �$
p� V
� V›v
›s
›a
›p1
›v
›n
›V
›p. (A3)
Here, V and f denote the scalar wind and geopotential,
respectively, and a is the angle subtended by the velocity
vector with respect to the x axis (positive in the anti-
clockwise orientation). The first and second terms on the
right-hand sides of (A1) and (A2) describe the conver-
sion between shear and curvature vorticity. A compu-
tational form for the shear to curvature conversion term
in the Cartesian coordinates is also given by Bell and
Keyser (1993).
APPENDIX B
Energy Exchange from the Zonal to Eddy Flow
The following equation uses standard variable nota-
tion to express the energy exchange from the zonal flow
to eddies. These are tropospheric averages over the
African monsoon domain.
CK
5�1
g
ðPs
100
[u9y9]›[u]
›ydp� 1
g
ðPs
100
[y92]›[y]
›ydp
� 1
g
ðPs
100
[u9v9]›[u]
›ydp� 1
g
ðPs
100
[y9v9]›[y]
›pdp.
REFERENCES
Barnett, T., L. Dumenil, U. Schlese, E. Roeckner, and M. Latif,
1989: The effect of Eurasian snow cover on regional and global
climate variations. J. Atmos. Sci., 46, 661–686.
Bell, G. D., and D. Keyser, 1993: Shear and curvature vortic-
ity and potential-vorticity interchanges: Interpretation and
application to a cutoff cyclone event. Mon. Wea. Rev., 121,
76–102.
Bhanu Kumar, O. S. R. U., 1988: Interaction between Eurasian
winter snow cover and location of the ridge at the 500-hPa
level along 758E. J. Meteor. Soc. Japan, 66, 509–514.
Chakraborty, A., and T. N. Krishnamurti, 2006: Improved seasonal
climate forecasts of the South Asian summer monsoon using
a suite of 13 coupled ocean–atmosphere models. Mon. Wea.
Rev., 134, 1697–1721.
Dickson, R. R., 1984: Eurasian snow cover versus Indian monsoon
rainfall—An extension of the Hahn–Shukla results. J. Climate
Appl. Meteor., 23, 171–173.
Dumenil, L., K. Arpe, and L. Bengtsson, 1994: Variability of the
Indian monsoon in the ECHAM3 model. Part I: MONEG and
AMIP experiments. Proc. Int. Conf. on Monsoon Variability
and Prediction, Trieste, Italy, WMO, 609–620.
Fasullo, J., 2004: A stratified diagnosis of Indian monsoon—
Eurasian snow cover relationship. J. Climate, 17, 1110–1122.
Gadgil, S., and K. Rupakumar, 2006: The Asian monsoon—
Agriculture and economy. The Asian Monsoon, B. Wang, Ed.,
Springer/Praxis, 651–683.
——, P. N. Vinayachandran, and P. A. Francis, 2003: Droughts of
the Indian summer monsoon: Role of clouds over the Indian
Ocean. Curr. Sci., 85, 1713–1719.
——, ——, ——, and S. Gadgil, 2004: Extremes of Indian summer
monsoon rainfall, ENSO, and equatorial Indian Ocean oscilla-
tion. Geophys. Res. Lett., 31, L12213, doi:10.1029/2004GL019733.
Harzallah, A., and R. Sadourny, 1995: Internal versus SST-forced
atmospheric variability as simulated by an atmospheric gen-
eral circulation model. J. Climate, 8, 474–495.
Holton, J., 2004: An Introduction to Dynamic Meteorology. 4th ed.
Elsevier Academic, 535 pp.
Kalnay, E., and Coauthors, 1996: The NCEP/NCAR 40-Year Re-
analysis Project. Bull. Amer. Meteor. Soc., 77, 437–471.
Krishnakumar, K., B. Rajagopalan, M. Hoerling, G. Bates, and
M. Cane, 2006: Unraveling the mystery of Indian monsoon
failure during El Nino. Science, 314, 115–119.
3440 J O U R N A L O F T H E A T M O S P H E R I C S C I E N C E S VOLUME 67
Krishnamurti, T. N., 1971: Tropical east–west circulations during
the northern summer. J. Atmos. Sci., 28, 1342–1347.
——, and D. Subrahmanyam, 1982: The 30–50-day mode at 850 Mb
during MONEX. J. Atmos. Sci., 39, 2088–2095.
——, and L. Bounoua, 1996: Model Output Diagnostics: An In-
troduction to Numerical Weather Prediction Techniques. CRC
Press, 266–275.
——, P. K. Jayakumar, J. Sheng, N. Surgi, and A. Kumar, 1985:
Divergent circulations on the 30–50-day time scale. J. Atmos.
Sci., 42, 364–375.
——, S.-H. Chu, and W. Iglesias, 1986: On the sea level pressure of
the Southern Oscillation. Meteor. Atmos. Phys., 34, 385–425.
——, H. S. Bedi, and M. Subramaniam, 1989: The summer mon-
soon of 1987. J. Climate, 2, 321–334.
——, C. M. Kishtawal, T. LaRow, D. Bachiochi, Z. Zhang,
C. E. Williford, S. Gadgi, and S. Surendran, 1999: Improved
weather and seasonal climate forecasts from multimodel su-
perensemble. Science, 285, 1548–1550.
——, L. Stefanova, A. Chakraborty, T. S. V. Kumar, S. Cocke,
D. Bachiochi, and B. Mackey, 2002: Seasonal forecasts of
precipitation anomalies for North American and Asian mon-
soons. J. Meteor. Soc. Japan, 80, 1415–1426.
——, P. Cunningham, and K. Rajendran, 2005: Anomalous gradi-
ent winds in the subtropical jet stream and interpretations of
forecast failures. Meteor. Atmos. Phys., 88, 237–250.
——, H. S. Bedi, and V. M. Hardiker, 2006a: An Introduction to
Global Spectral Modeling. 2nd ed. Springer, 317 pp.
——, A. Chakraborty, R. Krishnamurti, W. K. Dewar, and C. A.
Clayson, 2006b: Seasonal prediction of sea surface tempera-
ture anomalies using a suite of 13 coupled atmosphere–ocean
models. J. Climate, 19, 6069–6088.
——, T. S. V. Kumar, A. K. Mitra, W. T. Yun, A. Chakraborty, and
L. Stefanova, 2006c: Further improvements in superensemble
forecasts in weather research and climate. Predictability of
Weather and Climate, T. Palmer and R. Hagedorn, Eds.,
Cambridge University Press, 532–560.
——, A. Chakraborty, A. Martin, W. K. Lau, K.-M. Kim, Y. Sud,
and G. Walker, 2009: Impact of Arabian Sea pollution on the
Bay of Bengal winter monsoon rains. J. Geophys. Res., 114,
D06213, doi:10.1029/2008JD010679.
Krishnan, R., C. Zhang, and M. Sugi, 2000: Dynamics of breaks in
the Indian summer monsoon. J. Atmos. Sci., 57, 1354–1372.
——, V. Kumar, M. Sugi, and J. Yoshimura, 2009: Internal feed-
backs from monsoon–midlatitude interactions during droughts
in the Indian summer monsoon. J. Atmos. Sci., 66, 553–578.
Lau, K.-M., and K.-M. Kim, 2006: Observational relationships
between aerosol and Asian monsoon rainfall, and circulation.
Geophys. Res. Lett., 33, L21810, doi:10.1029/2006GL027546.
——, M.-K. Kim, and K.-M. Kim, 2006: Asian summer monsoon
anomalies induced by aerosol direct forcing: The role of the
Tibetan plateau. Climate Dyn., 26, 855–864.
Manabe, S., J. Smagorinsky, and R. F. Strickler, 1965: Simulated
climatology of a general circulation model with a hydrologic
cycle. Mon. Wea. Rev., 93, 769–798.
Mitra, A. K., L. Stefanova, T. S. V. Vijayakumar, and T. N.
Krishnamurti, 2005: Seasonal prediction for the Indian mon-
soon region with FSU ocean–atmosphere coupled model: Model
mean and 2002 anomalous drought. Pure Appl. Geophys., 162,
1431–1454.
Mogil, H. M., and R. L. Holle, 1972: Anomalous gradient winds:
Existence and implications. Mon. Wea. Rev., 100, 709–716.
Oort, A. H., and J. J. Yienger, 1996: Observed interannual vari-
ability in the Hadley circulation and its connection to ENSO.
J. Climate, 9, 2751–2767.
Palmen, E., 1951: The role of atmospheric disturbances in the
general circulation. Quart. J. Roy. Meteor. Soc., 77, 337–354.
Rajeevan, M., J. Bhate, J. D. Kale, and B. Lal, 2006: High-resolution
daily gridded rainfall data for the Indian region: Analysis of
break and active monsoon spells. Curr. Sci., 91, 296–306.
Ramanathan, V., and Coauthors, 2005: Atmospheric brown clouds:
Impacts on South Asian climate and hydrological cycle. Proc.
Natl. Acad. Sci. USA, 102, 5326–5333.
Rasmusson, E. M., and T. H. Carpenter, 1982: Variations in tropical
sea surface temperature and surface wind fields associated with
the Southern Oscillation–El Nino. Mon. Wea. Rev., 110, 354–384.
Saji, N. H., B. N. Goswami, P. N. Vinayachandran, and T. A. Yamagata,
1999: A dipole mode in the tropical Indian Ocean. Nature, 401,
360–363.
Sikka, D. R., and S. Gadgil, 1980: On the maximum cloud zone and
the ITCZ over India longitude during the southwest monsoon.
Mon. Wea. Rev., 108, 1840–1853.
Viudez, A., and R. L. Haney, 1996: On the shear and curvature
vorticity equations. J. Atmos. Sci., 53, 3384–3394.
Waliser, D. E., 2006: Intraseasonal variability. The Asian Monsoon,
B. Wang, Ed., Springer/Praxis, 203–257.
Wallace, J. M., and D. S. Gutzler, 1981: Teleconnections in the
geopotential height field during the Northern Hemisphere
winter. Mon. Wea. Rev., 109, 784–812.
Wang, B., and H. Rui, 1990: Synoptic climatology of transient
tropical intraseasonal convection anomalies: 1975–1985. Me-
teor. Atmos. Phys., 44, 43–61.
Yasunari, Y., 1980: A quasi-stationary appearance of a 30–40-day
period in the cloudiness fluctuations during the summer mon-
soon over India. J. Meteor. Soc. Japan, 58, 225–229.
——, 1981: Structure of an Indian summer monsoon system with
around 40-day period. J. Meteor. Soc. Japan, 59, 336–354.
OCTOBER 2010 K R I S H N A M U R T I E T A L . 3441