Desai, S (2015) The effect of health education on women's ... - CORE
326
Desai, S (2015) The effect of health education on women’s treatment- seeking behaviour: Findings from a cluster randomised trial and an in-depth investigation of hysterectomy in Gujarat, India. PhD thesis, London School of Hygiene & Tropical Medicine. DOI: https://doi.org/10.17037/PUBS.02228561 Downloaded from: http://researchonline.lshtm.ac.uk/2228561/ DOI: 10.17037/PUBS.02228561 Usage Guidelines Please refer to usage guidelines at http://researchonline.lshtm.ac.uk/policies.html or alterna- tively contact [email protected]. Available under license: http://creativecommons.org/licenses/by-nc-nd/2.5/
-
Upload
khangminh22 -
Category
Documents
-
view
4 -
download
0
Transcript of Desai, S (2015) The effect of health education on women's ... - CORE
Desai, S (2015) The effect of health education on women’s treatment-seeking behaviour: Findings from a cluster randomised trial and anin-depth investigation of hysterectomy in Gujarat, India. PhD thesis,London School of Hygiene & Tropical Medicine. DOI: https://doi.org/10.17037/PUBS.02228561
Downloaded from: http://researchonline.lshtm.ac.uk/2228561/
DOI: 10.17037/PUBS.02228561
Usage Guidelines
Please refer to usage guidelines at http://researchonline.lshtm.ac.uk/policies.html or alterna-tively contact [email protected].
Available under license: http://creativecommons.org/licenses/by-nc-nd/2.5/
The effect of health education on women's treatment-seeking behaviour:
Findings from a cluster randomised trial and an in-depth investigation of hysterectomy in Gujarat, India
Sapna Desai
Thesis submitted in accordance with the requirements for the degree of
Doctor of Philosophy University of London
June 2015
Funding details: No funding received for PhD training
Research study funded by the International Labour Organization
Department of Infectious Disease Epidemiology Faculty of Epidemiology and Population Health LONDON SCHOOL OF HYGIENE & TROPICAL MEDICINE
2
DECLARATION OF OWN WORK DECLARATION BY CANDIDATE
I have read and understood the School’s definition of plagiarism and cheating given in the Research
Degrees Handbook. I declare that this thesis is my own work, and that I have acknowledged all results
and quotations from the published or unpublished work of other people. I have read and understood
the School’s definition and policy on the use of third parties (either paid or unpaid) who have
contributed to the preparation of this thesis by providing copy editing and, or, proof reading services. I
declare that no changes to the intellectual content or substance of this thesis were made as a result of
this advice, and, that I have fully acknowledged all such contributions. I have exercised reasonable care
to ensure that the work is original and does not to the best of my knowledge break any UK law or
infringe any third party’s copyright or other intellectual property right.
NAME IN FULL Sapna Desai STUDENT ID NO lsh266180 SIGNED
DATE 8.6.2015
3
Acknowledgements
This dissertation and my learning process owe much to those who have supported me along the way.
My supervisor Simon Cousens provided guidance and support beyond expectation, and I am incredibly
grateful for his direction at each step. I was also fortunate to have an engaged and diverse advisory
committee. Dominique Behague provided essential guidance throughout the qualitative research
design and analysis, along with consistent encouragement in my pursuit of an interdisciplinary approach.
Oona Campbell provided key contributions to my work on hysterectomy and the framing of my research
questions. Joanna Schellenberg has been a steady support and insightful reviewer from development of
my research proposal through to the dissertation. Last but certainly not least, I thank Anne Mills for her
encouragement, from before the PhD to this final stage, and for guidance on the economic analyses.
In India, my colleagues at SEWA – longstanding teachers and friends – supported my research training
despite the break it entailed from the world of grassroots organising and implementation. As promised
to Mirai and Mittal, I have aimed to conduct research that contributes both to theory and practice.
Tara Sinha was the ideal collaborator at SEWA who provided leadership to the research team and
invaluable insight into our findings. Ajay Mahal, who taught me on my first public health degree,
continued to be a fantastic project advisor a decade later. Seema and Yasmin were unparalleled project
coordinators; I am grateful for their skills and commitment. The arogya sevika team taught me lasting
lessons on what it takes to be a community health worker.
The International Labour Organization provided funding for the intervention and evaluation study, as
well as for logistical support for my qualitative fieldwork. Jeanna Holtz went beyond the call of a donor,
who understood and encouraged the changes required when I enrolled in a PhD. I am also grateful to
the British Fund for Women Graduates for a scholarship in my third year. Lastly, I am especially
indebted to my parents and sister Nina, for their unconditional support throughout. I can only hope to
continue this family tradition. To Martand, who believes in each new idea and pushes me further, and to
Atish Mir - the other ‘output’ produced alongside this thesis – thank you for giving me perspective, and
joy.
4
Abstract
A community-based health insurance scheme operated by the Self-Employed Women’s Association
(SEWA), an organisation of women workers in India, reported that the leading reasons for inpatient
hospitalisation claims by adult women were diarrhoea, fever and hysterectomy – the latter at the
average age of 37. In 2010, SEWA initiated a cluster randomised trial to evaluate whether community
health worker-led education amongst insured and uninsured adult women could reduce morbidity,
hospitalisation and insurance claims related to these three conditions.
This thesis reports the findings of the intervention evaluation and of an in-depth examination of
hysterectomy, the most common cause of hospitalisation. Literature reviews were conducted on the
effect of community health worker-led group health education and on the frequency of hysterectomy in
low and middle-income countries. Analysis of the cluster randomised trial utilised data from SEWA’s
insurance database and four household surveys. Hysterectomy was explored through an in-depth
qualitative study and quantitative analyses using the study cohort to estimate incidence and identify
determinants of the procedure. Lastly, findings were synthesised with process data to examine the
intervention process, with a focus on hysterectomy.
Statistical analyses indicated no evidence of an intervention effect on insurance claims, hospitalisations
or morbidity related to fever, diarrhoea and hysterectomy. There was no evidence of effect
modification by insurance status. Hysterectomy amongst women in their mid-thirties appeared to be
rooted in its normalisation as a prophylactic, permanent treatment for gynaecological ailments.
Incidence of hysterectomy was associated with income, age and number of children. Evaluation of the
intervention process suggested that improved knowledge was necessary, but not sufficient, to change
women’s treatment-seeking behaviour regarding hysterectomy. Interventions to reduce hysterectomy
must integrate approaches that address the structural determinants of the procedure, such as the lack
of reproductive and sexual health services, providers’ behaviour towards low-income women and
attitudes towards the utility of the uterus.
5
Table of Contents Acknowledgements ................................................................................................................................. 3
Abstract .................................................................................................................................................. 4
List of Figures and Boxes.......................................................................................................................... 8
List of Tables ........................................................................................................................................... 9
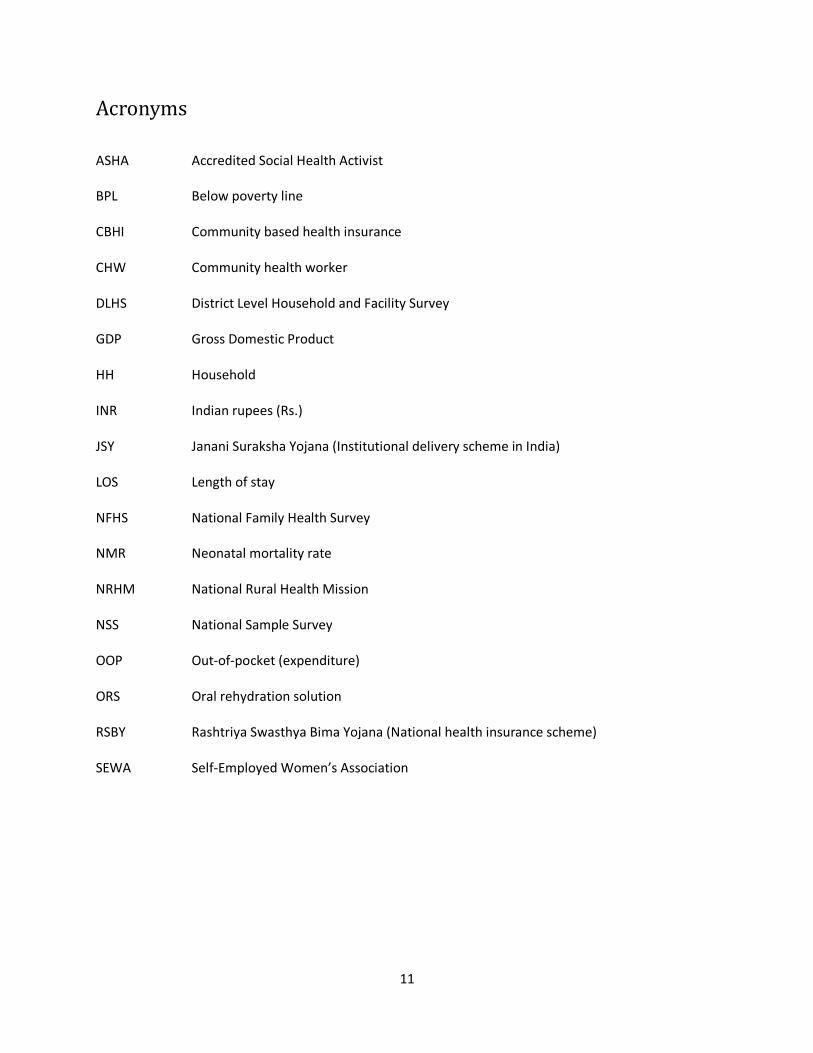
Acronyms .............................................................................................................................................. 11
SECTION ONE ........................................................................................................................................ 12
Chapter I. Introduction ......................................................................................................................... 12
I. Background .................................................................................................................................... 12
II. Thesis objectives ............................................................................................................................ 15
III. Dissertation structure ................................................................................................................... 16
IV. Role of candidate .......................................................................................................................... 17
Chapter II. Literature Reviews ............................................................................................................... 18
I. Literature Review on CHW-led group health education .................................................................. 18
Introduction .................................................................................................................................. 18
Methods ........................................................................................................................................ 21
Findings ......................................................................................................................................... 22
Discussion ...................................................................................................................................... 28
II. Literature Review: Hysterectomy in low and middle income countries, with a focus on India ......... 32
Introduction .................................................................................................................................. 32
Methods ........................................................................................................................................ 33
Findings ......................................................................................................................................... 36
Discussion ...................................................................................................................................... 41
Chapter III. Study Background................................................................................................................ 45
I. Setting ............................................................................................................................................ 45
II. Intervention description ................................................................................................................ 50
Chapter IV. Research Methods ............................................................................................................. 63
I. Intervention evaluation.................................................................................................................. 63
II. In-depth examination of hysterectomy .......................................................................................... 73
Qualitative study ........................................................................................................................... 73
Quantitative analysis of survey data .............................................................................................. 76
Mixed methods approach .............................................................................................................. 76
6
III. Process evaluation ........................................................................................................................ 78
IV. Ethical considerations ................................................................................................................... 81
SECTION TWO ....................................................................................................................................... 83
Chapter V. Baseline findings: description of study population and comparison of insured and uninsured
women .................................................................................................................................................. 83
Abstract ............................................................................................................................................. 86
Background ....................................................................................................................................... 88
Methods ............................................................................................................................................ 91
Results ............................................................................................................................................... 94
Discussion ....................................................................................................................................... 104
Chapter VI. Intervention Evaluation ................................................................................................... 111
I. Effect of the health education intervention on health insurance claims rates ............................... 111
II. Effect of the health education intervention on hospitalisation rates amongst insured and
uninsured adult women ................................................................................................................... 117
III. Effect of the health education intervention on 30-day morbidity rates amongst insured and
uninsured adult women ................................................................................................................... 127
IV. Discussion ................................................................................................................................. 133
Chapter VII. Out-of-pocket expenditure on hospitalisation and illness episodes amongst insured and
uninsured women ............................................................................................................................... 142
I .Hospitalisation expenditure .......................................................................................................... 143
II. Expenditure on ambulatory care related to illness episodes in the past 30 days ........................... 151
III. Discussion ................................................................................................................................... 155
Chapter VIII. In-depth examination of hysterectomy ........................................................................... 160
I. Qualitative study of hysterectomy ............................................................................................... 163
Introduction ................................................................................................................................ 163
Methodological and analytical approach ...................................................................................... 164
Findings ....................................................................................................................................... 168
Discussion .................................................................................................................................... 179
Conclusion ................................................................................................................................... 182
II. Incidence and determinants of hysterectomy in a low-income setting in Gujarat, India ............... 186
Introduction ................................................................................................................................ 186
Methods ...................................................................................................................................... 188
Findings ....................................................................................................................................... 190
7
Discussion .................................................................................................................................... 199
Conclusion ................................................................................................................................... 205
Chapter IX. Process Evaluation............................................................................................................. 207
Introduction ................................................................................................................................ 207
Methods ...................................................................................................................................... 207
Findings ....................................................................................................................................... 208
Discussion .................................................................................................................................... 216
Chapter X. Conclusion.......................................................................................................................... 226
I. Summary of findings ..................................................................................................................... 226
II. Strengths and limitations ............................................................................................................. 229
III. Reflections .................................................................................................................................. 231
IV. Contributions to research, policy and practice ............................................................................ 233
References .......................................................................................................................................... 236
List of Annexes .................................................................................................................................... 252
Annex 1 Literature search on women’s morbidity patterns in India ..................................................... 253
Annex 2 Overview of articles reviewed on CHW-led group education ................................................. 259
Annex 3 Survey Instruments ............................................................................................................... 261
Annex 4 Hysterectomy Interview Guides ............................................................................................ 284
Annex 5 Process Evaluation Guides ..................................................................................................... 287
Annex 6 Information Sheet (Survey) and Study Protocol ..................................................................... 291
Annex 7 Information sheet (Qualitative research) ............................................................................... 303
Annex 8 Ethical Approvals................................................................................................................... 311
Annex 9 Baseline claims rates in 28 clusters ........................................................................................ 314
Annex 10 Baseline hospitalisation rates in 28 clusters.......................................................................... 316
Annex 11 Baseline morbidity rates in 28 clusters, by intervention and insurance status ....................... 320
Annex 12 Causes of hospitalisation and morbidity ............................................................................... 324
8
LIST OF FIGURES AND BOXES
FIGURE 1.1 LEADING HOSPITALISATION CLAIMS AMONGST WOMEN INSURED BY VIMOSEWA.............................. 14
FIGURE 2.2 SEARCH 1: PREVALENCE OF HYSTERECTOMY IN LOW AND MIDDLE INCOME COUNTRIES .................... 34
FIGURE 2.3 SEARCH 2: HYSTERECTOMY IN INDIA .................................................................................................. 35
FIGURE 3.1 GUJARAT STATE, WESTERN INDIA AND DETAILED MAP OF GUJARAT ................................................... 45
FIGURE 3.2 AGE AT HYSTERECTOMY AMONGST VIMOSEWA CLAIMANTS, 2007-2009 ............................................ 50
FIGURE 3.3A CONCEPTUAL FRAMEWORK: CAUSES OF HOSPITALISATION FOR DIARRHOEA ................................... 53
FIGURE 3.3B CONCEPTUAL FRAMEWORK: CAUSES OF HYSTERECTOMY ................................................................. 54
FIGURE 3.4 MALARIA POSTER AND SNAKES AND LADDER GAME ........................................................................... 60
FIGURE 3.5 WALL PAINTING ON DIARRHOEA, PROMOTING HANDWASHING, BOILING WATER AND ORS .............. 60
FIGURE 4.1 CHW ALLOCATION ............................................................................................................................. 65
FIGURE 4.2 INTERVENTION CAUSAL PATHWAY ..................................................................................................... 80
FIGURE 5.1 FIRST PLACE OF TREATMENT FOR REPORTED MORBIDITY IN PAST 30 DAYS ......................................... 99
FIGURE 5.2 CAUSES OF HOSPITALISATION ........................................................................................................... 101
FIGURE 6.1 DISTRIBUTION OF BASELINE CLAIMS RATES IN 28 CLUSTERS ............................................................. 113
FIGURE 6.2 DISTRIBUTION OF CLAIMS RATES BY TREATMENT ARM ..................................................................... 115
FIGURE 6.3 CLUSTER AND SURVEY PARTICIPATION ............................................................................................. 118
FIGURE 6.4 DISTRIBUTION OF CLUSTER-LEVEL BASELINE HOSPITALISATION RATES FOR 3 CONDITIONS .............. 121
FIGURE 6.5 HOSPITALISATION RATES BY SURVEY ROUND, USING INSURANCE STATUS AT BASELINE .................... 125
FIGURE 6.6 DISTRIBUTION OF CLUSTER-LEVEL MORBIDITY RATES, PER 100 PERSON-MONTHS ............................ 129
FIGURE 7.1 VARIATION IN HOSPITALISATION EXPENDITURE, BY TREATMENT ARM .............................................. 144
FIGURE 7.2 VARIATION IN HOSPITALISATION EXPENDITURE BY LOCATION .......................................................... 145
FIGURE 7.3 VARIATION IN HOSPITALISATION EXPENDITURE BY TYPE OF FACILITY AND LOCATION ....................... 146
FIGURE 7.4 VARIATION IN HOSPITALISATION EXPENDITURE BY INSURANCE STATUS ........................................... 146
FIGURE 7.5 VARIATION IN HOSPITALISATION EXPENDITURE FOR 3 FOCUS CONDITIONS, BY FACILITY TYPE ......... 149
FIGURE 7.6 VARIATION IN HYSTERECTOMY EXPENDITURE BY INSURANCE STATUS ............................................ 150
FIGURE 7.7 VARIATION IN HYSTERECTOMY EXPENDITURE BY URBAN/RURAL LOCATION AND FACILITY TYPE ....... 150
FIGURE 7.8 VARIATION IN AMBULATORY CARE EXPENDITURE BY URBAN/RURAL LOCATION ............................... 152
FIGURE 7.9 VARIATION IN AMBULATORY CARE EXPENDITURE BY INSURANCE STATUS ....................................... 152
FIGURE 7.10 VARIATION IN FEVER EXPENDITURE BY URBAN/RURAL LOCATION .................................................. 154
FIGURE 7.11 VARIATION IN FEVER EXPENDITURE BY INSURANCE STATUS............................................................ 154
FIGURE 8.1 PROPORTION OF WOMEN STERILISED, BY AGE CATEGORY ................................................................ 191
BOX 8.1 WOMEN’S EXPERIENCES WITH HYSTERECTOMY .................................................................................... 197
BOX 8.2 PROVIDERS’ VIEWS ................................................................................................................................ 199
FIGURE 8.2 OVERVIEW OF DETERMINANTS AND PATHWAYS ASSOCIATED WITH HYSTERECTOMY ....................... 201
FIGURE 9.1 INTERVENTION CASUAL PATHWAY ................................................................................................... 211
BOX 9.1 SUMMARY OF TWO CHWS FOLLOWED ON DAILY ROUNDS .................................................................... 214
FIGURE 9.2 SUMMARY OF PROCESS EVALUATION FINDINGS .............................................................................. 215
9
LIST OF TABLES
TABLE 2.1 ESTIMATES OF HYSTERECTOMY PREVALENCE IN LOW AND MIDDLE INCOME COUNTRIES ..................... 37
TABLE 2.2 SUMMARY OF HISTOPATHOLOGICAL STUDIES OF HYSTERECTOMY CASES IN INDIA ............................... 38
TABLE 3.1 SELECTED HEALTH INDICATORS FOR GUJARAT ...................................................................................... 46
TABLE 3.2 PROPORTION OF TREATMENT IN PRIVATE SECTOR (2004), GUJARAT (%)............................................... 46
TABLE 3.3 VIMOSEWA HEALTH PRODUCTS IN 2009 ............................................................................................... 48
TABLE 3.4 VIMOSEWA LEADING CLAIMS IN ADULT WOMEN, 2007-2009 ............................................................... 50
TABLE 3.5 POPULATION COVERED BY CHWS (28) AND VIMOSEWA IN STUDY AREA, 2009...................................... 52
TABLE 3.6 EXISTING INTERVENTIONS IN AHMEDABAD CITY AND DISTRICT ............................................................ 53
TABLE 3.7 SUGGESTED INTERVENTIONS AND FEASIBILITY FILTER .......................................................................... 56
TABLE 3.8 CHW ACTIVITIES IN CONTROL AND INTERVENTION AREAS .................................................................... 61
TABLE 4.1 EVALUATION OUTCOMES AND DATA SOURCES ..................................................................................... 66
TABLE 4.2 HOUSEHOLD SURVEY SAMPLE SIZE ....................................................................................................... 68
TABLE 5.1 VIMOSEWA HEALTH PRODUCTS ........................................................................................................... 90
TABLE 5.2 HOUSEHOLD LEVEL CHARACTERISTICS OF INSURED AND UNINSURED WOMEN IN GUJARAT ................. 95
TABLE 5.3 INDIVIDUAL CHARACTERISTICS OF RESPONDENTS ................................................................................ 96
TABLE 5.4 FACTORS ASSOCIATED WITH INSURANCE STATUS AMONG ADULT WOMEN .......................................... 97
TABLE 5.5 TYPE OF MORBIDITY EXPERIENCED IN PAST 30 DAYS............................................................................. 98
TABLE 5.6 TREATMENT RESULT FOR REPORTED MORBIDITY.................................................................................. 99
TABLE 5.7 HOSPITALISATION AMONGST RURAL AND URBAN ADULT RESPONDENTS ........................................... 100
TABLE 5.8 ASSOCIATION OF INSURANCE COVERAGE WITH HOSPITALISATION ..................................................... 102
TABLE 5.9 RISK OF HOSPITALISATION BY CAUSE .................................................................................................. 103
TABLE 5.10 LENGTH OF STAY AMONGST THOSE HOSPITALISED ........................................................................... 103
TABLE 5.11 PLACE OF HOSPITALISATION ............................................................................................................. 104
TABLE 6.1 OVERVIEW OF PRE-INTERVENTION VIMOSEWA MEMBERSHIP AND DEMOGRAPHIC VARIABLES .......... 112
TABLE 6.2 SUMMARY OF BASELINE CLAIMS DATA, BY TREATMENT ARM ............................................................. 113
TABLE 6.3 BASELINE CLAIMS DATA, BY URBAN/RURAL LOCATION ....................................................................... 113
TABLE 6.4 VIMOSEWA MEMBERSHIP DURING THE INTERVENTION PERIOD ......................................................... 114
TABLE 6.5 ESTIMATES OF THE EFFECT OF THE INTERVENTION ON CLAIM RATES FOR THREE FOCUS CONDITIONS 115
TABLE 6.6 ESTIMATES OF INTERVENTION EFFECT USING CLUSTER LEVEL SUMMARIES ........................................ 116
TABLE 6.7 COMPARISON OF UNADJUSTED EFFECT ESTIMATES ............................................................................ 116
TABLE 6.8 HOUSEHOLDS SURVEYED, BY ROUND ................................................................................................ 118
TABLE 6.9 REASONS FOR LOSS TO FOLLOW-UP, ROUNDS 2-4 .............................................................................. 118
TABLE 6.10 BASELINE DEMOGRAPHIC CHARACTERISTICS IN CONTROL AND INTERVENTION ARMS ...................... 119
TABLE 6.11 BASELINE HOSPITALISATIONS IN 28 CLUSTERS, AMONGST UNINSURED AND INSURED WOMEN ........ 120
TABLE 6.12 TOTAL HOSPITALISATION EPISODES ................................................................................................. 121
TABLE 6.13 POST-INTERVENTION HOSPITALISATION RATES IN 28 CLUSTERS, SURVEY ROUNDS 2-4 ..................... 122
TABLE 6.14 HOSPITALISATION RATES FOR 3 CONDITIONS IN INSURED AND UNINSURED WOMEN, ..................... 122
TABLE 6.15 ESTIMATES OF INTERVENTION EFFECT USING POISSON REGRESSION WITH RANDOM EFFECTS, ROUNDS
2-4 ............................................................................................................................................................. 123
TABLE 6.16 ESTIMATES OF INTERVENTION EFFECT, ADJUSTED FOR IMBALANCED BASELINE CHARACTERISTICS ... 124
TABLE 6.17 ESTIMATES OF INTERVENTION EFFECT ON HOSPITALISATION FOR 3 CONDITIONS, CLUSTER LEVEL
SUMMARIES .............................................................................................................................................. 124
10
TABLE 6.18 REPORTED INSURANCE STATUS COMPARED WITH BASELINE STATUS (ROUNDS 3 AND 4) ................ 125
TABLE 6.19 POISSON REGRESSION USING RANDOM EFFECTS, INDIVIDUAL DATA, ROUNDS 3 AND 4 USING
REPORTED INSURANCE STATUS .................................................................................................................. 126
TABLE 6.20 HOSPITALISATION RATES BY ROUND, USING REPORTED STATUS AND INDIVIDUAL DATA .................. 126
TABLE 6.21 COMPARISON OF HOSPITALISATION RATES FOR 3 CONDITIONS AMONG INSURED WOMEN ............. 126
TABLE 6.22 BASELINE 30 DAY-MORBIDITY RATES IN 28 CLUSTERS ....................................................................... 128
TABLE 6.23 TOTAL MORBIDITY EPISODES, BY ROUND.......................................................................................... 129
TABLE 6.24 POST-INTERVENTION MORBIDITY RATES, SURVEY ROUNDS 2-4 ........................................................ 130
TABLE 6.25 SUMMARY OF 30-DAY MORBIDITY IN INSURED AND UNINSURED WOMEN ....................................... 130
TABLE 6.26 ESTIMATES OF INTERVENTION EFFECT ON MORBIDITY, POISON REGRESSION RANDOM EFFECTS ...... 131
TABLE 6.27 ADJUSTED ESTIMATES OF INTERVENTION EFFECT, USING BASELINE CHARACTERISTICS ..................... 132
TABLE 6.28 ESTIMATES OF INTERVENTION EFFECT ON MORBIDITY, CLUSTER SUMMARIES .................................. 132
TABLE 7.1 HOSPITALISATION EXPENDITURE BY RURAL/URBAN LOCATION........................................................... 144
TABLE 7.2 HOSPITALISATION EXPENDITURE BY TYPE OF FACILITY ........................................................................ 144
TABLE 7.3 HOSPITALISATION EXPENDITURE BY INSURANCE STATUS .................................................................... 145
TABLE 7.4 MEAN HOSPITALISATION EXPENDITURE BY INSURANCE STATUS ......................................................... 147
TABLE 7.5 CLAIMS AMONGST INSURED WOMEN – EXPECTED AND REPORTED .................................................... 147
TABLE 7.6 BREAKDOWN OF HOSPITALISATION EXPENDITURE ............................................................................. 148
TABLE 7.7 HOSPITALISATION EXPENDITURE BY CONDITION (INR) ........................................................................ 148
TABLE 7.8 HYSTERECTOMY EXPENDITURE ........................................................................................................... 149
TABLE 7.9 OUTPATIENT/AMBULATORY CARE EXPENDITURE BY INTERVENTION ARM .......................................... 151
TABLE 7.10 AMBULATORY CARE EXPENDITURE BY LOCATION, FACILITY TYPE AND INSURANCE STATUS .............. 151
TABLE 7.11 AMBULATORY CARE EXPENDITURE BY CONDITION ........................................................................... 153
TABLE 7.12 FEVER EXPENDITURE ........................................................................................................................ 153
TABLE 8.1 DEMOGRAPHIC CHARACTERISTICS OF WOMEN INTERVIEWED ............................................................ 168
TABLE 8.2 OVERVIEW OF STUDY SAMPLE AT RISK OF HYSTERECTOMY ............................................................... 191
TABLE 8.3 BASELINE CHARACTERISTICS ASSOCIATED WITH INCIDENCE OF HYSTERECTOMY................................. 192
TABLE 8.4 BASELINE CHARACTERISTICS ASSOCIATED WITH HYSTERECTOMY; MULTIVARIABLE REGRESSION ........ 194
TABLE 8.5 EXPENDITURE ON HYSTERECTOMY BY INSURANCE STATUS, LOCATION AND HOSPITAL TYPE............... 195
TABLE 8.6 DEMOGRAPHIC CHARACTERISTICS OF 35 WOMEN WHO UNDERWENT HYSTERECTOMY ..................... 196
TABLE 8.7 WOMEN’S TREATMENT-SEEKING PATTERNS ....................................................................................... 196
TABLE 8.8 TREATMENT-SEEKING SPECTRUM ....................................................................................................... 198
TABLE 9.1 HYSTERECTOMY SESSION OUTREACH, CHW REGISTERS ...................................................................... 209
TABLE 9.2 REPORTED ATTENDANCE AT HYSTERECTOMY SESSIONS ...................................................................... 210
11
Acronyms
ASHA Accredited Social Health Activist
BPL Below poverty line CBHI Community based health insurance CHW Community health worker DLHS District Level Household and Facility Survey GDP Gross Domestic Product HH Household INR Indian rupees (Rs.) JSY Janani Suraksha Yojana (Institutional delivery scheme in India) LOS Length of stay NFHS National Family Health Survey NMR Neonatal mortality rate NRHM National Rural Health Mission NSS National Sample Survey OOP Out-of-pocket (expenditure) ORS Oral rehydration solution RSBY Rashtriya Swasthya Bima Yojana (National health insurance scheme) SEWA Self-Employed Women’s Association
12
SECTION ONE
Chapter I. Introduction
I. Background The World Health Organisation report on Women and Health (2009) called for
“…better data, for more research, for more systematic monitoring of the health of the female half of the world, and for addressing the barriers that girls and women face in protecting their health and in accessing health care and information.” [1]
In India, three government-commissioned national surveys are the primary source of information on
women’s morbidity and treatment-seeking patterns. The National Sample Survey (NSS) collected data
on the incidence of morbidity and hospitalisation in a nationally representative sample of households in
2004, after which it has not repeated a similar survey on health[2]. Overall, adult women reported
higher incidence of morbidity in the past 15 days than men, while hospitalisation rates were largely the
same for men and women, with slight differences in some age groups. The leading causes of
hospitalisation amongst adults were accidents/injury (10%); fevers of unknown origin (8%);
diarrhoea/dysentery; (7%); heart disease (5%); and gynaecological disorders (5%). Sex-disaggregated
data were not reported for cause of hospitalisation. The other two national studies, the National Family
Health Survey (NFHS) and District Level Household Survey (DLHS), conduct surveys amongst
reproductive-aged women and men that focus on knowledge and practices related to maternal and
child health and family planning[3, 4]. The most recent round of the NFHS (2005-6) also reported
estimates of prevalence of HIV/AIDS, tuberculosis, chronic illness and violence against women. Neither
survey, however, documents overall morbidity patterns or health service utilisation amongst adult
women.
A search of community-based research in India on women’s morbidity patterns indicated that forty
percent of 556 studies focussed on women’s reproductive and maternal health, and over a quarter
examined chronic illnesses (Annex 1). Fourteen community-based studies aimed to identify overall
morbidity patterns amongst women, primarily in low-income settings. Reported prevalence of
morbidity varied considerably across these studies. Regional diversity may be one explanation for this
variation: two multi-site studies found that prevalence of illness varied considerably by geographic
location in similar socioeconomic groups [5, 6]. Causes of illness and treatment-seeking reported by
13
women, however, were largely similar: fever, respiratory illness and gynaecological morbidities
emerged as the most common illnesses amongst adult women [5, 7-9]. Married women under 35 years
ranked circulatory/respiratory illnesses as the highest burden, followed by reproductive and
infectious/parasitic illnesses [10]. In addition to epidemiological studies, a range of qualitative research
in India has provided further insight into women’s health – and has underscored the importance of
integrating multiple perspectives, particularly women’s voices, to examine both the burden and
experience of morbidity [11-26]. Women’s perceptions of morbidity, for example, may reflect
negotiations in other spheres or the dynamics of social transition [20, 27]. While both quantitative and
qualitative studies in India cover a range of topics and settings, available research is far from sufficient
to systematically track the overall health of India’s women and girls – a gap in of itself, as well as a
barrier to designing needs-based interventions.
This thesis aims to contribute to research on women’s health in India, through an in-depth examination
of treatment-seeking patterns and the evaluation of a women-focussed intervention in a low-income
setting. My research questions emerged while implementing women’s health programs with the Self-
Employed Women’s Association (SEWA) in India. SEWA, an organisation of low-income women workers
in India’s informal economy, operates a community health worker (CHW)-led health program and a
community-based health insurance (CBHI) scheme, known as VimoSEWA. In 2008, while setting
priorities for SEWA health programs in rural and urban Gujarat, I found the data on which health
conditions women suffered from most were few, with respect to both frequency and severity. National
data provided a limited, aggregate picture of adult health, and SEWA had not conducted a survey of its
members’ health since 1999. I thus turned to routine claims data collected by VimoSEWA on causes of
hospitalisation amongst insured, low-income women workers who submitted hospitalisation claims in
Gujarat. Although these data were not representative of the population, they provided insight into
health services utilisation.
With few exceptions, CBHI schemes do not regularly conduct epidemiological analyses of claims;
VimoSEWA had conducted such an analysis only once before[28]. In 2001, Ranson identified accidents,
malaria, gastroenteritis and hysterectomy as the most common reasons for hospitalisation [29] – a
similar pattern to that reported by the NSS in 2004. In 2009, we found that the over 40% of adult
14
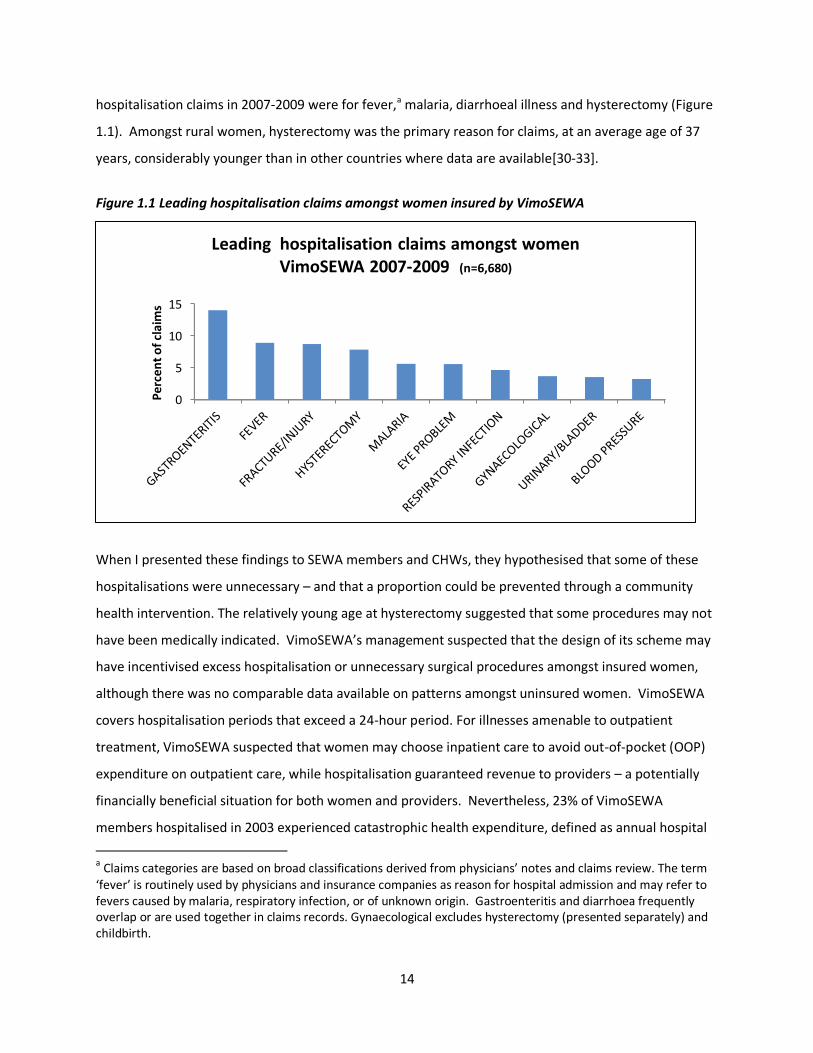
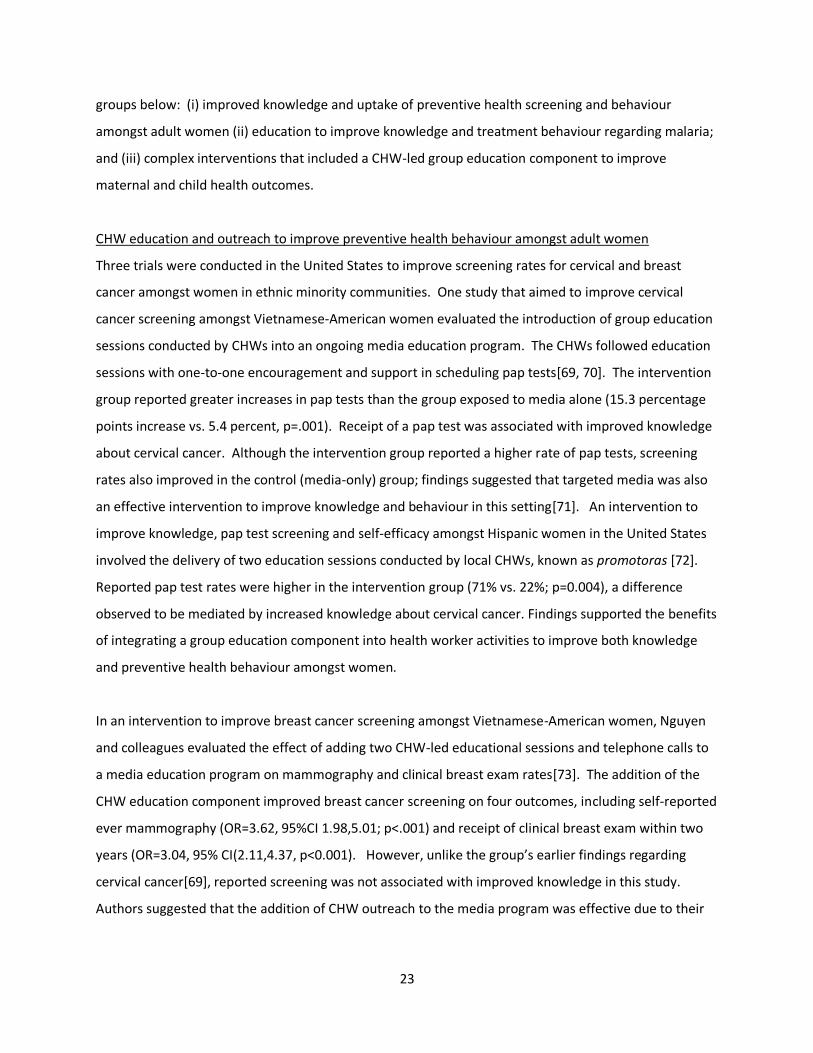
hospitalisation claims in 2007-2009 were for fever,a malaria, diarrhoeal illness and hysterectomy (Figure
1.1). Amongst rural women, hysterectomy was the primary reason for claims, at an average age of 37
years, considerably younger than in other countries where data are available[30-33].
Figure 1.1 Leading hospitalisation claims amongst women insured by VimoSEWA
When I presented these findings to SEWA members and CHWs, they hypothesised that some of these
hospitalisations were unnecessary – and that a proportion could be prevented through a community
health intervention. The relatively young age at hysterectomy suggested that some procedures may not
have been medically indicated. VimoSEWA’s management suspected that the design of its scheme may
have incentivised excess hospitalisation or unnecessary surgical procedures amongst insured women,
although there was no comparable data available on patterns amongst uninsured women. VimoSEWA
covers hospitalisation periods that exceed a 24-hour period. For illnesses amenable to outpatient
treatment, VimoSEWA suspected that women may choose inpatient care to avoid out-of-pocket (OOP)
expenditure on outpatient care, while hospitalisation guaranteed revenue to providers – a potentially
financially beneficial situation for both women and providers. Nevertheless, 23% of VimoSEWA
members hospitalised in 2003 experienced catastrophic health expenditure, defined as annual hospital
a Claims categories are based on broad classifications derived from physicians’ notes and claims review. The term ‘fever’ is routinely used by physicians and insurance companies as reason for hospital admission and may refer to fevers caused by malaria, respiratory infection, or of unknown origin. Gastroenteritis and diarrhoea frequently overlap or are used together in claims records. Gynaecological excludes hysterectomy (presented separately) and childbirth.
0
5
10
15
Per
cen
t o
f cl
aim
s
Leading hospitalisation claims amongst women VimoSEWA 2007-2009 (n=6,680)
15
expenditure greater than 10% of annual income, after reimbursement[34]. Hospitalisation also entails
additional costs such as loss of income and care-giver time. Even with insurance coverage,
hospitalisation remains a considerable risk to financial security for low-income women workers.
Both SEWA’s CHWs team and VimoSEWA’s management concluded that reduction of seemingly
preventable claims was critical, both to protect women’s health security and to reduce VimoSEWA’s
unsustainably high claims ratios. The organisation began to explore how the CHW program could work
to reduce preventable claims. In March 2009, SEWA initiated the design of a CHW-led health education
program that aimed to address the three leading causes of claims submission – diarrhoea, fever and
hysterectomy – with the aim of reducing preventable claims and hospitalisation. Since CHWs worked in
the entire community, SEWA Health decided the intervention would aim to reach all women, rather
than target insured women in particular. Accordingly, a cluster randomised trial was designed to
evaluate the effect of a CHW-led health education intervention on insurance claims utilisation,
hospitalisation, and morbidity amongst insured and uninsured adult women in Gujarat.
II. Thesis objectives My doctoral research was based on this evaluation study, the design of which was completed by SEWA
before I enrolled in a PhD. Since there was little research on hysterectomy in India –and VimoSEWA’s
claims patterns suggested it was a critical, emerging women’s health issue– I also examined
hysterectomy through qualitative research and additional quantitative analyses. Process data collected
during the trial were combined with these findings, in an intervention process evaluation that examined
how CHW-led health education could affect hysterectomy. The objectives of this thesis are to:
(i) Evaluate the impact of a CHW-led health education intervention on women’s insurance claims,
hospitalisation, morbidity rates and expenditure related to diarrhoea, fever and hysterectomy
(ii) Examine hysterectomy in this setting through:
(a) Exploration of the socioeconomic, individual, household and health system determinants of
the decision to undergo hysterectomy
(b) Analysis of the process by which CHW-led health education could address hysterectomy
While grounded in an epidemiological approach to evaluate the intervention, this thesis also draws from
medical anthropology, economic analysis and process evaluation to understand its outcomes. Although
I did not commence with an overarching epistemological framework, my approach to women’s health
16
and the synthesis of methods resonates with the basic principles of ‘feminist epidemiology.’ Inhorn and
Whittle(2001), building on debates within modern epidemiology[35, 36]b and the work of other feminist
scholars, have defined feminist epidemiology to include: (i) engagement of women in problem
definition and knowledge production (ii) examination of women’s health in its totality, in both
reproductive and non-reproductive roles and (iii) contextualisation of women’s risk and health
outcomes within the larger social, economic and political forces that affect their lives[37-39]. Feminist
epidemiology focuses on women and employs multiple methodologies, with the ultimate aim of re-
thinking the ways in which women and health are studied and linked to policy[37]. This thesis
synthesises analyses of population-level data and women’s experiences, to examine the research
questions in-depth and from multiple perspectives. The findings will inform SEWA’s programs, while
contributing to the evidence base on women’s health in India and CHW-led interventions in low-income
settings.
III. Dissertation structure This dissertation report is a combination of book-style chapters and research papers. Section One
presents literature reviews on CHW-led health education interventions and hysterectomy, followed by a
description of the research setting, intervention and methodological approaches, all written as chapters.
In Section Two, I first present results of the baseline survey in a published research paper that describes
the population and compares treatment-seeking patterns amongst insured and uninsured women. The
following two book-style chapters present the evaluation findings: the intervention effect on claims,
hospitalisation and morbidity related to diarrhoea, fever and hysterectomy and description of out-of-
pocket expenditure on the three conditions. The next chapter is an in-depth examination of
hysterectomy, comprised of two research papers that present (i) a qualitative study on hysterectomy
and (ii) a mixed-methods analysis of its incidence and determinants. The final results chapter is an
intervention process evaluation that brings together hysterectomy-related findings from previous
chapters with process data collected during the trial, to explore how CHW-led health education can
b Inhorn and Whittle identified an ‘anti-feminist bias’ in mainstream epidemiology, in which research conducted on women
predominantly focusses on their reproductive role or issues central to men, such as chronic disease, without consideration of women’s own priorities. Further, they have criticised the dominant objective of identifying individual risk or changing behaviour that neither accounts for the broader context of women’s lives–such as political voice and socioeconomic structures–nor addresses gender oppression as a factor in women’s health outcomes. They, like others (Freedman and Maine 2004, Kaufert 1998) build the case for a ‘feminist epidemiology’ that draws from approaches described as critical, popular/participatory and alternative epidemiology. This approach also echoes calls to anchor epidemiology within public health and link it within social sciences (such as those set forth by Pearce 1998, Krieger, 2000).
17
affect hysterectomy. I conclude with a synthesis of results, reflections on lessons learned and discussion
of the contributions of this thesis to research, programs and policy.
IV. Role of candidate I was the initial project director of the intervention and research study. As SEWA’s national health
coordinator at the time, I wrote the grant proposal for the intervention and evaluation, secured funding
from the International Labour Organization Microinsurance Innovation Facility and managed the project
for one year. When I enrolled in a PhD in September 2010, project coordination was handed over to a
senior health supervisor at SEWA. I conducted all statistical analyses and qualitative fieldwork
presented in this thesis and drafted research papers as first author, with guidance from my supervisor
and advisory committee. Ajay Mahal acted as study advisor to SEWA during the course of the project
and led the design of the trial. Tara Sinha managed the implementation of the intervention and study
and conducted qualitative research on hospitalisation for diarrhoea and fever.
18
Chapter II. Literature Reviews
I. Literature Review on CHW-led group health education
Introduction
Since the Alma-Ata declaration for primary health care, CHWs, also known as lay health workers, health
aides or auxiliary health workers, have been promoted to improve health systems[40]. In recent years,
evidence on CHW interventions has been synthesised through meta-analyses, qualitative syntheses and
disease-focussed reviews, highlighting their potential role in improving health outcomes [41-51]. CHW
roles vary according to the local setting: from government extension worker to volunteer social activist,
they can provide basic services, promote preventive health activities or mobilise community groups.
Despite the considerable diversity across programs, evidence syntheses concur on the importance of
CHWs in linking communities to health systems, particularly in low and middle income settings[48, 50,
51].
A 2010 Cochrane systematic review and meta-analysis of interventions involving community-based lay
health workers indicated moderate evidence of their potential to improve immunisation coverage,
breastfeeding and adherence to tuberculosis treatment[48]. With the exception of some chronic
diseases, evidence was scarce regarding other health issues. Evaluations addressed a wide range of
activities, such as home visits, counselling, telephone campaigns and health facility-based support,
implemented by workers with varying degrees of training, background, payment mechanisms and
structural support. The review identified a lack of evaluations in low-income settings: only 27 of 82
studies were conducted middle or low-income settings. Lehmann and Sanders, in a review of published
and grey literature on CHWs, highlighted their value in improving coverage of basic health services in
low-income settings, but also emphasised the need for appropriate selection and training, with
consistent support, realistic planning and clear understanding of the role of community participation or
mobilization[50]. Similarly, Bhutta et al synthesised literature and presented country case studies on a
wide range of CHW programs related to achievement of the Millennium Development Goals[51]. While
existing evidence attests to the capacity of CHWs in providing health services, improvements in the
coverage, quality and impact of programs requires appropriate health system support, particularly for
large scale CHW initiatives.
19
A 2013 Cochrane review of 53 qualitative research studies on the processes and mechanisms by which
CHW-led interventions have improved health outcomes identified five critical factors: integration of
CHWs in their communities; supportive working structures, particularly regarding incentives and
training; affordability of services; appropriate selection criteria; and support and participation from both
the health system and community. Noting that there is limited research that evaluates both the
outcomes and processes of the same CHW program, recommendations for future research included
inclusion of the perspectives of stakeholders such as managers and community leaders, descriptions of
CHW processes in trials and measures of their role, such as the relationship between CHWs and service
recipients. Each of these global reviews emphasised the need for more rigorous evaluations of CHW
programs in low-income settings. Further, given the diversity of CHW programs, in-depth
documentation of implementation mechanisms and barriers is required to draw generalised implications
for policy or practitioners[43, 52].
Health education and behaviour change theory
This literature review and dissertation employ the term “health education” to describe the intervention.
Health education has been defined as an approach to catalysing behaviour change through learning
experiences. Health education aims to change health behaviour by improving knowledge and
influencing attitudes, with the ultimate goal of improving the health status and quality of life of
individuals and their communities[53-55]. Although health education historically has been understood
as combination of strategies to influence individuals as well as their environment, it is often
differentiated from health promotion, a comparatively broader approach which addresses the social
context of behaviour change. Interventions that aim to change behaviour span a range of theoretical
approaches, commonly known as behaviour change theory.
A recent systematic review reported that the most commonly applied theories in health behaviour
intervention research are social cognitive theory, the health belief model and the trans-theoretical
model[56]. Additional common approaches are theories based on reasoned action, planned behaviour
and the precaution adoption model[57]. While most theoretical models share the assumption that
individual attitudes and beliefs shape health behaviour, they differ on factors such as the role of
environmental influences, on how an individual decides to perform a specific behaviour and on the
scope for intervention.
20
Social cognitive theory, potentially the most comprehensive approach to behaviour change, posits that
behaviour is a result of continuous and multifaceted interactions between individual and environmental
factors[58]. Personal variables, such control over decision-making, influence behaviour along with
external barriers or facilitating factors such as access to services. In this model, behaviour may be
changed if: (i) individuals believe they have control over the outcome (ii) they can execute the behaviour
and (iii) there are few external barriers. While knowledge of health risks influences behaviour, self-
efficacy – an individual’s belief regarding his/her own ability to perform a behaviour towards a desired
outcome – is also viewed as a critical influence on behaviour[59]. In the health belief model, behaviour
is linked to an individual’s appraisal of barriers and benefits of an action[60]. The four constructs of this
model of illness and health behaviour – perceived susceptibility, severity, benefits and barriers – may
vary by demographic variables or personal characteristics. Interventions may focus on these four areas,
through providing strategies for action or support to enhance self-efficacy[61]. The theory of reasoned
action is rooted in an individual’s intention to perform a specific behaviour[62]. Interventions address
intentions through aiming to influence both knowledge and attitudes towards an action. In an
expansion of this approach, the theory of planned behaviour includes perceptions of behavioural control
and self-efficacy as factors that influence intention.
Approaches based on stages of behaviour change include the trans-theoretical model and precaution
adoption model. The former conceptualises behaviour change as a process of six steps: pre-
contemplation, contemplation, preparation, action, maintenance, and termination[63]. Interventions
aim to address processes related to these stages, often through diverse methods tailored to an
individual’s stage. Precaution adoption process models apply a similar approach to identify how and
when health protective behaviours commence, with a focus on recognising the qualitative differences
within populations[64].
While empirical evidence indicates support for elements of many of these frameworks, a common
weakness is the lack of recognition of the emotional influences on behaviour[54]. Theories dependent
on rational processes also do not include factors such as religion and social norms that define individual
behaviour[57]. Further, these frameworks have been critiqued for their inability to account sufficiently
for: social, community and environmental influences ; the competing interests in an individual’s life
outside of the specific behaviour of interest; recognition of the origin of beliefs and how beliefs shape
actions; and the role of human agency and local context[57, 65, 66]. In practice, interventions often
21
synthesise two or more behaviour change models, based on the nature of specific health conditions and
the intervention setting/context [54]. Evaluations of intervention processes, therefore, require an
understanding of the theoretical basis of an intervention, how it was applied in practice and insight into
the range of influences on individual behaviour.
Objectives of literature review
This literature review aims to inform the evaluation of SEWA’s CHW-led group health education
intervention amongst adult women. While the reviews summarised above provide a wide range of
evidence on CHW interventions, none focused on, or differentiated the effect of, CHW-led group health
education. The objective of this literature review is to evaluate whether, and in what circumstances,
CHW-led group health education interventions affect knowledge, behaviour and health outcomes. In
light of SEWA’s history as a membership-based organisation that works towards women’s
empowerment, this chapter also summarises findings on interventions that provide insight into
evaluating SEWA’s approach to CHW-led health education.
Methods
Search terms for (i) health education (health education, behavio* change, group education, health
behaviour, health promotion) and (ii) health worker (health worker, health aide, health auxiliary,
medical auxiliary) were combined and searched for in title, abstract and keyword fields. MeSH terms
were utilised where available, such as for health auxiliaries, health education and behaviour, and the
remaining terms were entered as free text. Searches conducted in November 2014 in seven databases –
PubMed, Global Health, Embase, Popline, Web of Science, Scopus and IMSEAR– yielded an initial 4,219
hits (Figure 2.1). Inclusion criteria were: randomised evaluations; interventions led by CHWs that
included group health education as a major component; and studies published after 1995, in any
language or geographic region. Many of the 162 abstracts reviewed did not include sufficient
description of the CHW intervention; 24 articles underwent full text review in order to differentiate
group based interventions from other CHW-led health education activities. Of these, 14 were excluded
for the following reasons: (i) the health education intervention was not implemented by a CHW (ii)
CHWs only implemented another form of education such as one-to-one visits or community media,
without a group education component or (iii) the intervention did not recruit participants through
community-based outreach. Thus, school-based or facility-level health education interventions were
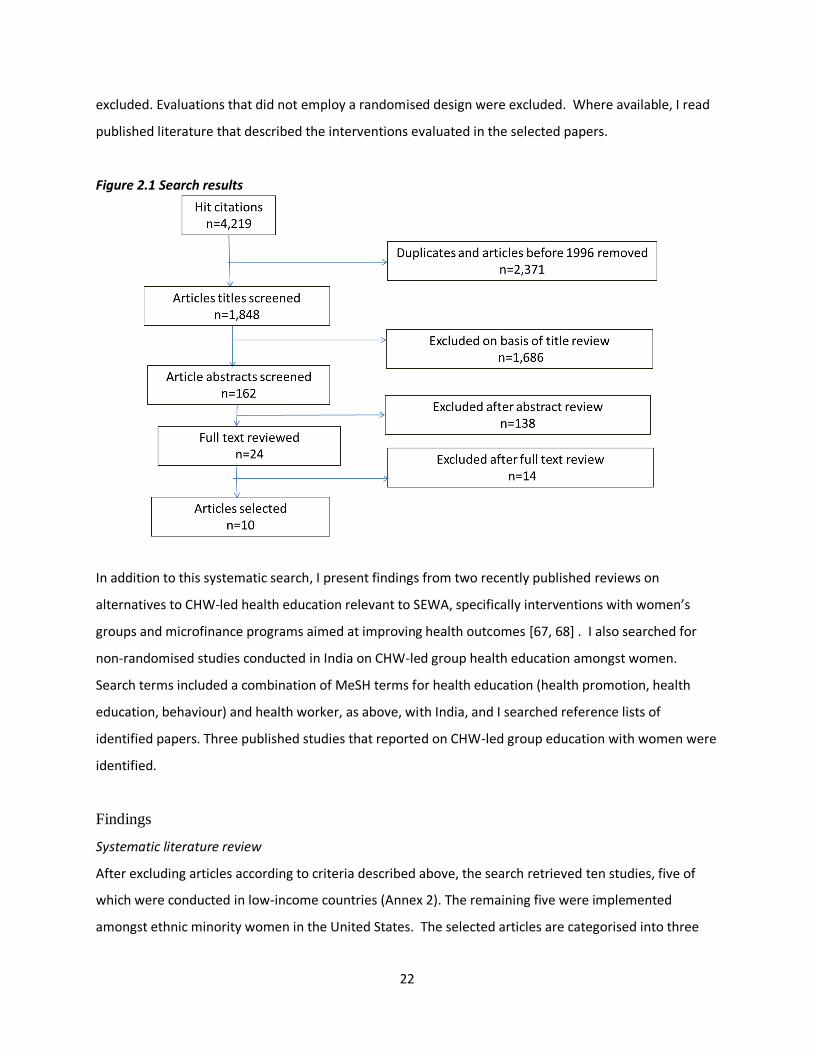
22
excluded. Evaluations that did not employ a randomised design were excluded. Where available, I read
published literature that described the interventions evaluated in the selected papers.
Figure 2.1 Search results
In addition to this systematic search, I present findings from two recently published reviews on
alternatives to CHW-led health education relevant to SEWA, specifically interventions with women’s
groups and microfinance programs aimed at improving health outcomes [67, 68] . I also searched for
non-randomised studies conducted in India on CHW-led group health education amongst women.
Search terms included a combination of MeSH terms for health education (health promotion, health
education, behaviour) and health worker, as above, with India, and I searched reference lists of
identified papers. Three published studies that reported on CHW-led group education with women were
identified.
Findings
Systematic literature review
After excluding articles according to criteria described above, the search retrieved ten studies, five of
which were conducted in low-income countries (Annex 2). The remaining five were implemented
amongst ethnic minority women in the United States. The selected articles are categorised into three
23
groups below: (i) improved knowledge and uptake of preventive health screening and behaviour
amongst adult women (ii) education to improve knowledge and treatment behaviour regarding malaria;
and (iii) complex interventions that included a CHW-led group education component to improve
maternal and child health outcomes.
CHW education and outreach to improve preventive health behaviour amongst adult women
Three trials were conducted in the United States to improve screening rates for cervical and breast
cancer amongst women in ethnic minority communities. One study that aimed to improve cervical
cancer screening amongst Vietnamese-American women evaluated the introduction of group education
sessions conducted by CHWs into an ongoing media education program. The CHWs followed education
sessions with one-to-one encouragement and support in scheduling pap tests[69, 70]. The intervention
group reported greater increases in pap tests than the group exposed to media alone (15.3 percentage
points increase vs. 5.4 percent, p=.001). Receipt of a pap test was associated with improved knowledge
about cervical cancer. Although the intervention group reported a higher rate of pap tests, screening
rates also improved in the control (media-only) group; findings suggested that targeted media was also
an effective intervention to improve knowledge and behaviour in this setting[71]. An intervention to
improve knowledge, pap test screening and self-efficacy amongst Hispanic women in the United States
involved the delivery of two education sessions conducted by local CHWs, known as promotoras [72].
Reported pap test rates were higher in the intervention group (71% vs. 22%; p=0.004), a difference
observed to be mediated by increased knowledge about cervical cancer. Findings supported the benefits
of integrating a group education component into health worker activities to improve both knowledge
and preventive health behaviour amongst women.
In an intervention to improve breast cancer screening amongst Vietnamese-American women, Nguyen
and colleagues evaluated the effect of adding two CHW-led educational sessions and telephone calls to
a media education program on mammography and clinical breast exam rates[73]. The addition of the
CHW education component improved breast cancer screening on four outcomes, including self-reported
ever mammography (OR=3.62, 95%CI 1.98,5.01; p<.001) and receipt of clinical breast exam within two
years (OR=3.04, 95% CI(2.11,4.37, p<0.001). However, unlike the group’s earlier findings regarding
cervical cancer[69], reported screening was not associated with improved knowledge in this study.
Authors suggested that the addition of CHW outreach to the media program was effective due to their
24
common cultural background and social relationship with participants, and called for further research
into how the position of CHWs within social networks can mediate behaviour change.
A CHW-led intervention to reduce cardiovascular disease risk amongst a Hispanic population in the
United States implemented two months of weekly educational sessions, followed by telephone calls and
a clinic-based group session to encourage behaviour change[74]. The control group was only provided
with educational materials once, with no CHW follow-up or education. Adjusted findings detected lower
diastolic blood pressure (75.5 vs. 79.8 mmHg; p<.001) and improvements in self-reported behaviours
related to cardiovascular risk, such as salt intake and weight control practices, amongst the intervention
group. There was no evidence of a difference in other clinical indicators related to cholesterol or systolic
blood pressure. Changes in behaviour and awareness were observed in both experimental and control
groups, suggesting print materials alone may have had an effect. Limitations due to self-reporting of
behaviour and accuracy of measurement methods were also noted.
A similar, more intensive intervention was implemented amongst Hispanic women for six months,
through both CHW-led group education and individual follow-up sessions[75]. Outcome measures
included dietary habits, measures of physical activity, clinical measurements related to cardiovascular
risk (such as blood pressure and weight), and knowledge. The evaluation indicated evidence of
improved knowledge scores (p<0.001) and dietary habit scores (p=0.009) for women in the intervention
group, as well as smaller, yet statistically significant improvements in waist circumference and physical
activity. There was no evidence of any differences in other cardiometabolic outcomes between
intervention and control groups nine months after baseline measurements. Findings were consistent
with short-term improvements in behaviour and weight loss, which could translate into improved health
outcomes with longer term intervention and follow-up.
In Sri Lanka, a community randomised trial aimed to improve knowledge and attitudes on family
planning through CHW-led education. The intervention involved four community-based education
sessions that utilised flip charts and other printed educational materials[76]. A six-month follow-up
indicated strong evidence for higher utilisation of modern family planning method amongst women in
the intervention areas (OR=8.25, 95% CI: 5.44,12.54; p<0.001), as well as improvements in knowledge
and attitudes. Reported results did not take into account the cluster randomised design, however,
which would have affected the precision of effect estimates.
25
Community-based malaria control
Two trials evaluated the effect of CHW-led education on knowledge and behaviour related to malaria.
In rural Tanzania, health workers were trained to teach community-based women leaders to recognise
symptoms of malaria and treat uncomplicated cases amongst children under five in their community
[77]. Although the intervention description referred to women’s groups, it was unclear if the CHWs
facilitated groups of women leaders, or if women leaders trained in malaria case management organised
group sessions in the community. Prevalence of anaemia, the primary outcome, decreased slightly
more in the intervention group (43.1 percentage points compared to 36.5; p=0.038), but there was no
evidence of effect on secondary outcomes on prevalence of fever and mean body weight. A government
intervention implemented at the same time as the intervention subsidised mosquito nets and improved
first line antimalarial treatment, which may have reduced malaria incidence in both treatment and
control areas. While the authors concluded that the evaluation demonstrated the feasibility of a CHW-
led intervention to reach mothers through women’s groups, the lack of clarity in the description of the
intervention limits conclusions on the role of CHW-led group education.
A 1996 study described an intervention implemented in Colombia, Ecuador and Nicaragua that trained
village health workers to conduct community-based education workshops, home visits and community
meetings to raise awareness on malaria control[78]. The intervention approach and educational tools
were designed after formative research was conducted on local awareness of malaria. Health workers
randomised to the intervention utilised a locally produced film, print materials such as flip charts and
cards, games and discussions in group meetings. Assessment of the implementation process indicated
that CHW were actively involved in the participatory sprit of the intervention, despite some difficulties
with new visual aids that were introduced. Knowledge about malaria and drug-taking behaviour
improved amongst participants in two of three sites, in a comparison of post-intervention knowledge of
symptoms and treatment of malaria between intervention and control areas (p<0.05). Findings did not
report estimates of precision or adjust for clustering, however. The findings highlighted the feasibility of
CHW-led, locally tailored health education programs, the importance of support for health workers in
providing health education as part of regular activities and of community participation in the
development and implementation of an intervention.
26
Complex interventions that included CHW-led group education
Two South Asian trials evaluated the effect of CHW-led interventions that included, but were not limited
to, group education to decrease neonatal mortality. A three-armed trial in Bangladesh compared home
visits or group education with no intervention[79]. In the home visit arm, CHWs were trained to
promote antenatal and birth preparedness, conduct postnatal home visits and provide basic treatment
to neonates. In both the home visit and group education arm, community mobilisers disseminated
maternal and child health messages in a group setting. The community education arm had higher
intensity of meetings and additional resources to support education efforts. Home visits resulted in a
34% reduction in neonatal mortality in the last six months compared to the control arm (RR=0.66, 95%CI
(0.47-0.93, p=0.011), while there was no evidence of a reduction in the group education arm. There was
evidence of improvement in care practices such as clean cord-cutting and breastfeeding initiation in
both arms. While the findings support home visits as an effective strategy but not group education
sessions, the authors also suggested that a community care strategy may require a longer
implementation period and greater coverage to achieve an effect.
In Pakistan, a community-based intervention to improve perinatal and neonatal outcomes included
health education through group sessions by government CHWs, home visits, linkages between CHWs
and traditional midwives and establishment of community health committees[47]. Control area
government CHWs continued with regular activities primarily through home visits. The evaluation
detected a 15% reduction in neonatal mortality (RR 0.85, 95% CI 0.76-0.96; p=0.02) compared to areas
without the intervention, as well as improvements in delivery and newborn care practices. Findings are
consistent with health benefits of CHW-led intervention, wherein group education was one component
of a multi-faceted health promotion effort.
Alternatives to CHW-led education
A meta-analysis and review of research on interventions with women’s groups provided insight into the
effect of participatory group learning processes [67]. Seven trials in Bangladesh, Malawi, Nepal and India
involved the establishment of women’s groups to design and implement community-based strategies to
improve neonatal and maternal health outcomes. The participatory model marks a departure from
CHW-led group education through the use of an action research-facilitated learning cycle, interactive
tools and joint action to address both demand for and supply of health services. Groups were facilitated
by local women who were not previously health workers. The meta-analysis reported that
27
implementation of participatory women’s groups was associated with a reduction in neonatal mortality
(OR 0.80; CI: 0.67,0.96) and a non-significant reduction in maternal mortality (OR 0.77; 95% CI: 0.48-
1.23), with statistical heterogeneity across trials. The proportion of pregnant women who participated
in the intervention was linearly associated with reductions in both outcomes. Hypothesised
mechanisms for improvements in health outcomes were based in the principle that organising women
into facilitated groups through a participatory learning cycle led to individual, community and social
action to change behaviour and determinants of health, such as improved antenatal care uptake and
increased access to services through organising funds and transport. A common factor across trials
appeared to be collective action towards supply-side interventions. Specific behavioural change varied
across settings: in Nepal, for example, improvements in health-seeking behaviour related to delivery
were noted as the most likely explanation for a reduction in neonatal mortality while the India trial
suggested that improved home practices by birth attendants and use of delivery kits – with no major
change in health-seeking behaviour of women – may have been responsible [80, 81].
Another variation of CHW-led health education is interventions that integrate health education with
microfinance groups, which is particularly relevant as most of SEWA’s members also participate in its
microfinance activities. A recent review of studies that utilised a variety of evaluation designs suggested
a generally positive effect of health education on knowledge, and some improvement in service
utilisation and health outcomes, amongst microfinance clients. The authors also note the need for more
rigorous research on how health education can be integrated into microfinance groups[82]. In South
Africa, a randomised trial of a microfinance and group health education intervention reported a 55%
reduction in reported intimate partner violence, with no effect on the two other primary outcomes,
unprotected sexual intercourse or HIV incidence[83]. A subsequent analysis of the specific contribution
of group education suggested that microfinance clients exposed to health education were more likely to
report behaviour consistent with women’s empowerment and reduction of intimate partner violence
and HIV risk than women who only participated in financial services[84]. Another experiment to provide
education on child health to female microfinance loan groups in Peru reported increased knowledge
amongst recipients, but no overall effect on the primary outcome of child health and nutrition
status[85]. Notably, the effect on child health outcomes appeared to vary with the skill level of the
trainer: women who interacted with a skilled educator reported reduced levels of bloody diarrhoea in
their children.
28
Non-randomised studies in India
Three non-randomised studies were identified that evaluated the effect of group education on women’s
health knowledge or treatment-seeking behaviour in India. In rural Haryana, a pre-post intervention
study reported that knowledge about reproductive tract and sexually transmitted infections improved
after participation in a health education program led by health workers, through individual visits and
group sessions. The introduction of group health education in particular was cited as reason for an
eight-fold increase in attendance at a government health clinic, although detailed attendance data were
not reported[86]. In another rural setting, rural adolescent girls participated in facilitated monthly
group education sessions on menstrual hygiene. A pre-post intervention study in 23 villages found that
the proportion of adolescent girls who reported using sanitary napkins increased from 5% to 25% after
three years. Other factors that may have influenced the increase in use of sanitary napkins were not
discussed, however [87]. A separate process evaluation indicated that, given the sensitive nature of
discussing menstruation openly, health workers were instrumental in countering resistance amongst
families and promoting attendance. Further, it noted that knowledge was not sufficient to influence
behaviour change, and that community-based distribution of subsidised sanitary napkins facilitated
increased use[88]. In a third study, also in a rural area, village-level nurses conducted group education
with small group of women on breast cancer prevention, using teaching aides and practical
demonstrations[89]. A post-intervention survey reported improved knowledge and use of breast self-
exam. A lower proportion of older women reported use of self-exam, citing that it was not important at
their age.
Discussion
This literature review identified only ten studies that evaluated the effect of CHW-led group education
sessions, despite the widespread use of CHWs in health systems[48]. The limited number of papers may
reflect the overall lack of rigorous evaluations of CHW programs, as noted in several literature
reviews[42, 48, 51, 90], or low utilisation of group education sessions as an intervention strategy. For
example, evaluations of health education interventions based in India included either home visits or
peer education; none included CHW-led health education in a group setting. Nine of the ten studies
reported positive outcomes, which may suggest publication bias – another possible reason for the low
number of studies identified. While three observational studies in rural India, in settings similar to the
SEWA intervention, reported positive outcomes related to behaviour change, none employed a
concurrent control group or described the intervention processes in detail.
29
In the reviewed studies, CHW-led group education sessions were reported to improve knowledge and
influence care-seeking behaviour across a range of settings. In addition, CHW-led group education may
also contribute to improving health outcomes, when part of a multi-faceted intervention [91]. While
studies reviewed provided fairly detailed descriptions of the intervention mechanics, they provided
minimal analysis of why or how the interventions had an effect – likely due to a lack of process-oriented
research as well as limitations on the length of publications. Factors considered to contribute to positive
effects were CHW’s ability to communicate with participants; use of local knowledge to share
information; interactive communication tools and follow-up by CHWs[69, 72-75]. Several of the
interventions noted the contribution and perceived effectiveness of print-based educational materials
and teaching aides, such as flip charts and games.
While the evaluations concurred on the feasibility of CHW-led group education, several characteristics of
the interventions varied across settings. This suggests that group education may be effective in a range
of circumstances, as well as highlights the need to understand the processes associated with CHW-led
group education further. All programs defined CHWs as local women recruited from the community
they served, but with different service, implementation and payment structures. Most interventions
recruited CHWs or partnered with non-governmental or community programs for the intervention,
while only one trained government CHWs [47]. The duration and design of group sessions also varied,
which may be linked to the intended behavioural change. For example, attempts to change embedded
care-seeking practices, such as diet or delivery care, were implemented through intensive health
education interventions, such as eight focused educational sessions followed by individual follow-up and
additional activities [47, 75]. In contrast, changes in behaviour marked by a single, discrete activity such
as undergoing a pap smear test or administering malaria treatment were associated with a lower
number of education sessions. Notably, the relatively shorter breast screening and pap test
interventions were add-ons to existing media campaigns [69, 73].
Accordingly, CHW-led group education may add value to wider health promotion activities, such as
media education. It is possible that the ongoing media campaign served as the primary source of
information, while CHWs facilitated the use of health services. Although not discussed in-depth, access
or availability of services did not emerge as a barrier to behaviour change in these settings. Further,
several of the interventions involved follow-up home visits or individual counselling sessions, which may
30
have further supported improved preventive health practices through increased comfort, consistent
contact and tailored messages. The multifaceted intervention in Pakistan demonstrated that education
sessions, implemented along with home visits and community interventions, may capitalise on CHW’s
strengths as educators and service providers to improve neonatal outcomes [47]. Evidence suggests
that the mechanisms by which CHWs affect health behaviour may involve their position as a community
role models or support provided through informal interactions[73]. While improved knowledge in
women exposed to group education was associated with increased uptake of pap smear tests, for
example, women who underwent mammography did not report changes in knowledge. Similarly,
although in a different approach, women’s groups interventions suggest that behaviour changes may be
facilitated by dynamics that emerge in a group setting, such as joint identification of problems and
solutions, without the structured transfer of knowledge[67].
Although there is some evidence that CHW-led group education can improve knowledge and health-
related behaviour, there is limited evidence for its role in improving health outcomes. Despite
improvements in knowledge, lifestyle interventions aimed at reducing cardiovascular risk did not detect
changes in most clinical outcomes [74, 75]. Similarly, the comparison of group education with home
visits in Bangladesh, the only ‘head-to-head’ evaluation of its kind identified, did not detect evidence of
an effect of group education on neonatal mortality in the time frame studied[79]. The only intervention
to detect an effect on a health outcome (neonatal mortality) included a combination of group education
with home visits and community-based health promotion, implemented by CHWs linked to the
government health system; the effect of group education could not be differentiated from other
activities [91]. Microfinance interventions that include a group health education component have
reported changes in knowledge and behaviour, but no effects on health outcomes. Most studies noted
the longer period of time required to measure an effect of community-based interventions on health
outcomes.
The limited evidence available suggests that CHWs can play a unique role in disseminating information
to improve knowledge and in facilitating service utilisation. Given the continued support for CHW
programs in health systems around the world, more analysis of whether, how and the health system
environment in which CHW-led group education can affect knowledge and behaviour is a critical need
for interventions research [43, 48]. Further, although most interventions reviewed did not explicitly
discuss the theoretical model for behaviour change, application of such frameworks in both intervention

31
and evaluation design will provide more insight on the potential role of CHWs. Similarly, investigation is
required into the processes by which CHWs can mediate improvements in health outcomes. More
research in low-income settings, as well as comparison of CHW-led group education with other
approaches, will enhance the evidence base as well as contribute to strategies to strengthen the role of
CHWs in health systems and communities.
32
II. Literature Review: Hysterectomy in low and middle income countries, with
a focus on India
Introduction
Hysterectomy, the removal of the uterus, is the leading reason for non-obstetric surgery amongst adult
women in many high-income countries[92]. Common indications for hysterectomy include fibroids,
dysfunctional uterine bleeding, uterine prolapse and chronic pelvic pain[93]. Reviews of clinical
guidelines in the United States have advised hysterectomy as appropriate only if major impairment and
symptoms are present, and after conservative surgery and/or hormonal treatment has been
attempted[93, 94]. There is no established benchmark rate for hysterectomy; incidence varies widely
between and within countries. An estimated 5.1 women per 1,000 women above age 15 underwent the
procedure in 2004 in the United States, while incidence in Australia is estimated to be 3.1 per 1,000
women[33, 95]. Within Germany, age-standardized rates vary across federal republics, ranging between
2.1 to to 3.6 per 1,000 adult women [96]. In these settings, hysterectomy is most commonly conducted
in women over the age of 45 [97, 98].
While there has been no cross-country analysis of the frequency of hysterectomy, available research
points to several factors that contribute to the wide variation in incidence of hysterectomy within and
across countries. Hysterectomy rates have been associated with women’s social, economic and
educational background, physician characteristics and health insurance coverage [99-105]. Further,
there is a lack of established indications for hysterectomy for benign conditions and limited data on the
long-term outcomes of hysterectomy, leading to variation in clinical practice [93, 106-108]. Qualitative
studies have reflected wide diversity in gynaecologists’ assessment of the indications for and necessity
of hysterectomies: one study points to differences in advising hysterectomy based on physician sex,
training and geography [108-110]. High lifetime risk in some settings–one in three in the United States,
for example–has suggested that the procedure may be subject to misuse and has resulted in calls for
medical audits and surveys of clinical practice[111]. For example, an analysis of 497 hysterectomies
conducted in the United States reported that at least 70% were recommended inappropriately, primarily
due to lack of diagnostic evaluation or failure to try alternative procedures[112]. Research, popular
media reports and women’s health activists have also suggested that attitudes towards intervention in
women’s bodies are a factor in medically unindicated hysterectomy[113-115].
33
Research on hysterectomy has primarily been conducted in high-income settings, using hospitals’
administrative databases, national population surveys and community-based research. Studies based in
low and middle-income countries have focused on obstetric emergencies and clinical reviews, with
limited analyses of population-level data. The lack of research outside of high-income settings may
reflect lower rates, or limited interest in the subject. However, in India, numerous recent media reports
(2012-13) have suggested that hysterectomy is increasingly used as routine treatment for gynaecological
ailments, presumably influenced by profit considerations and incentives under Rasthriya Swasthya Bima
Yojana (RSBY), the national health insurance scheme[116-118]. With limited research available on the
epidemiology of hysterectomy outside of high-income countries, it is difficult to evaluate these
observations in India.
Objectives
To contextualise my research on hysterectomy amongst low-income women in Gujarat, this chapter
reviews literature on i) measures of the frequency of hysterectomy (prevalence and incidence) in low
and middle income countries and ii) medical audits, treatment-seeking behaviour and health systems
research on hysterectomy specific to India. In addition, I present an overview of the sociocultural
context in which women in India seek treatment for gynaecological ailments.
Methods
A systematic literature search was conducted on the prevalence of hysterectomy in low and middle
income countries. The search term hysterectom* was combined in separate searches with prevalence,
rate, risk, incidence, epidemiolog* and surveillance, using MeSH terms and the adjacent (adj3) or near
function where available, in the title, keywords and abstract fields. Searches were conducted in
September 2014 in seven databases: PubMed, EMBASE, Scopus, Web of Science, Popline, IMSEAR and
Global Health and yielded 8,123 initial hits (Figure 2.2).
Inclusion and exclusion criteria were as follows. Papers were included if they were (i) population-based
research studies that reported measures of hysterectomy frequency, including studies that reported on
hysterectomy while focussing on a different condition such as urinary incontinence and (ii) published
since 2000 in any language. A 15 year cut-off was chosen to focus on more recent estimates of
hysterectomy. Studies were excluded if they: (i) did not include denominator information on the
population at risk of hysterectomy (ii) limited research to obstetric hysterectomy or (iii) were conducted
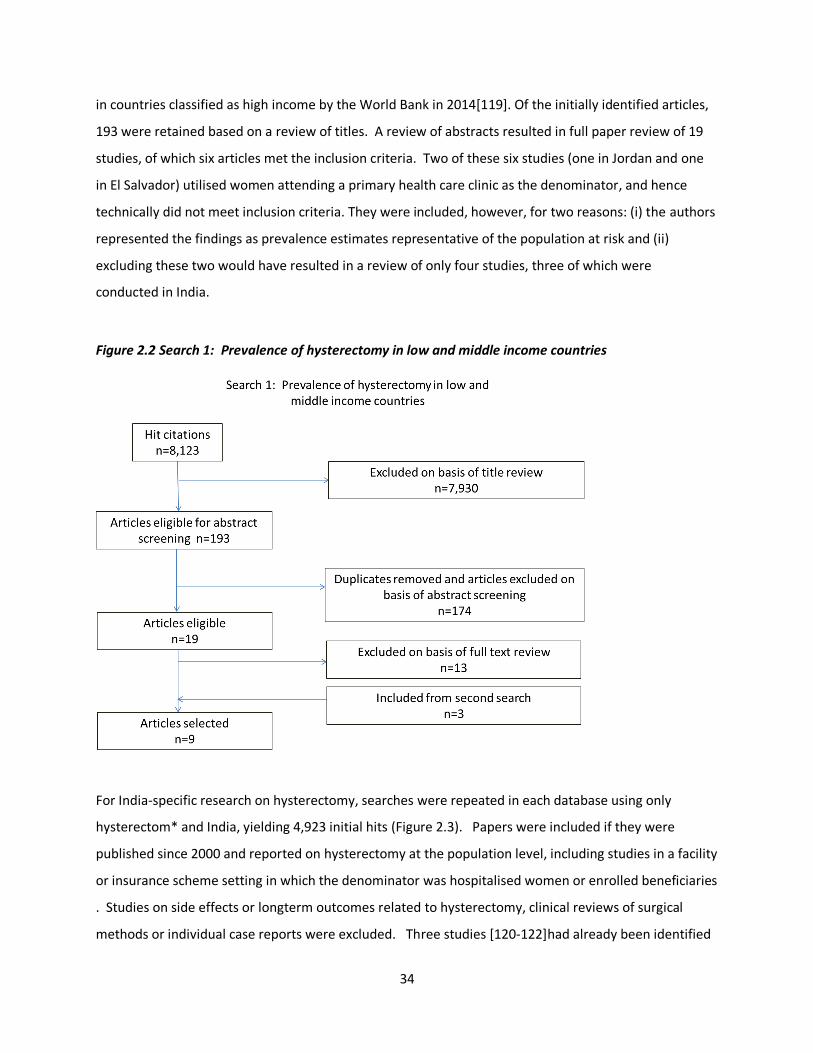
34
in countries classified as high income by the World Bank in 2014[119]. Of the initially identified articles,
193 were retained based on a review of titles. A review of abstracts resulted in full paper review of 19
studies, of which six articles met the inclusion criteria. Two of these six studies (one in Jordan and one
in El Salvador) utilised women attending a primary health care clinic as the denominator, and hence
technically did not meet inclusion criteria. They were included, however, for two reasons: (i) the authors
represented the findings as prevalence estimates representative of the population at risk and (ii)
excluding these two would have resulted in a review of only four studies, three of which were
conducted in India.
Figure 2.2 Search 1: Prevalence of hysterectomy in low and middle income countries
For India-specific research on hysterectomy, searches were repeated in each database using only
hysterectom* and India, yielding 4,923 initial hits (Figure 2.3). Papers were included if they were
published since 2000 and reported on hysterectomy at the population level, including studies in a facility
or insurance scheme setting in which the denominator was hospitalised women or enrolled beneficiaries
. Studies on side effects or longterm outcomes related to hysterectomy, clinical reviews of surgical
methods or individual case reports were excluded. Three studies [120-122]had already been identified
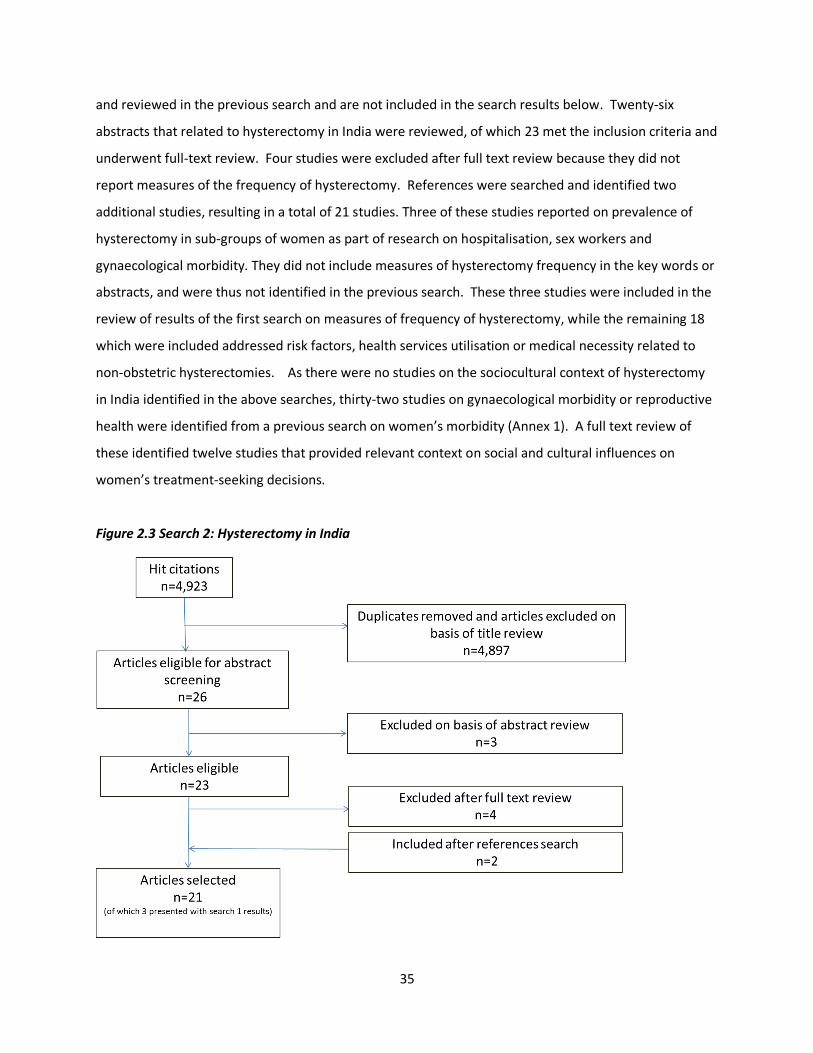
35
and reviewed in the previous search and are not included in the search results below. Twenty-six
abstracts that related to hysterectomy in India were reviewed, of which 23 met the inclusion criteria and
underwent full-text review. Four studies were excluded after full text review because they did not
report measures of the frequency of hysterectomy. References were searched and identified two
additional studies, resulting in a total of 21 studies. Three of these studies reported on prevalence of
hysterectomy in sub-groups of women as part of research on hospitalisation, sex workers and
gynaecological morbidity. They did not include measures of hysterectomy frequency in the key words or
abstracts, and were thus not identified in the previous search. These three studies were included in the
review of results of the first search on measures of frequency of hysterectomy, while the remaining 18
which were included addressed risk factors, health services utilisation or medical necessity related to
non-obstetric hysterectomies. As there were no studies on the sociocultural context of hysterectomy
in India identified in the above searches, thirty-two studies on gynaecological morbidity or reproductive
health were identified from a previous search on women’s morbidity (Annex 1). A full text review of
these identified twelve studies that provided relevant context on social and cultural influences on
women’s treatment-seeking decisions.
Figure 2.3 Search 2: Hysterectomy in India
36
Findings
The literature search identified very limited research on the prevalence of hysterectomy in low and
middle-income countries and no studies that reported on incidence. Two studies in Jordan [123, 124]
and one study in El Salvador[125] reported on hysterectomy as part of research on the prevalence of
urinary incontinence. In a 2005 population-based study to investigate urinary incontinence amongst
rural Jordanian women between the ages 50 and 65 years (n=182), 8.4 percent of women reported
previous hysterectomy[123]. Age at the procedure was not reported. A 2013 study of 1,001 women
above age 30 attending a primary health clinic in urban Amman estimated hysterectomy prevalence of
7.3 percent, again with no age at hysterectomy reported [124]. This may be an underestimate of the
prevalence of hysterectomy in the population, as the study excluded women previously diagnosed with
urinary incontinence, which may be associated with hysterectomy. Further, the study was conducted in
health clinics amongst women seeking treatment for other ailments; although the authors suggested the
population was representative, it may have excluded women who did not seek primary health services.
Of 236 women aged 31 to 75 who were interviewed in health clinics in a 2007 study in rural El Salvador,
4.2 percent reported having undergone a hysterectomy[125]. Age at the procedure was not reported.
Part of a study on women’s attitudes toward reproductive health and menopause, the population was
limited to women seeking treatment in clinics, who may not represent the entire population of women
at risk of hysterectomy.
Prevalence in India
Six studies conducted in India provided estimates of the prevalence of hysterectomy in different
populations (Table 2.1). One study reported standard errors, while the remaining five did not provide
estimates of precision (and the reported information was not sufficient for calculations). A 2008 survey
conducted to describe hysterectomy amongst 1,000 women (> 15 years of age) in rural Haryana
estimated that 7.0 percent of adult women had undergone the procedure [120]. Age-specific
prevalence was highest amongst women aged 45-54 (15.1%) at the time of survey, and lower (8.7%)
amongst women in both the 35-44 and >55 year age groups. Age at the time of the procedure was not
reported. The leading indication for surgery reported by women was excessive menstrual bleeding.
Close to half (47%) of women reported using a government hospital for hysterectomy. A large majority
(89%) of women reported seeking medical advice from three or more health care providers, the first
source of care most commonly a local or traditional practitioner. Two-thirds of women waited at least
one month to have the procedure after being advised to have it, due to fear of surgery or financial
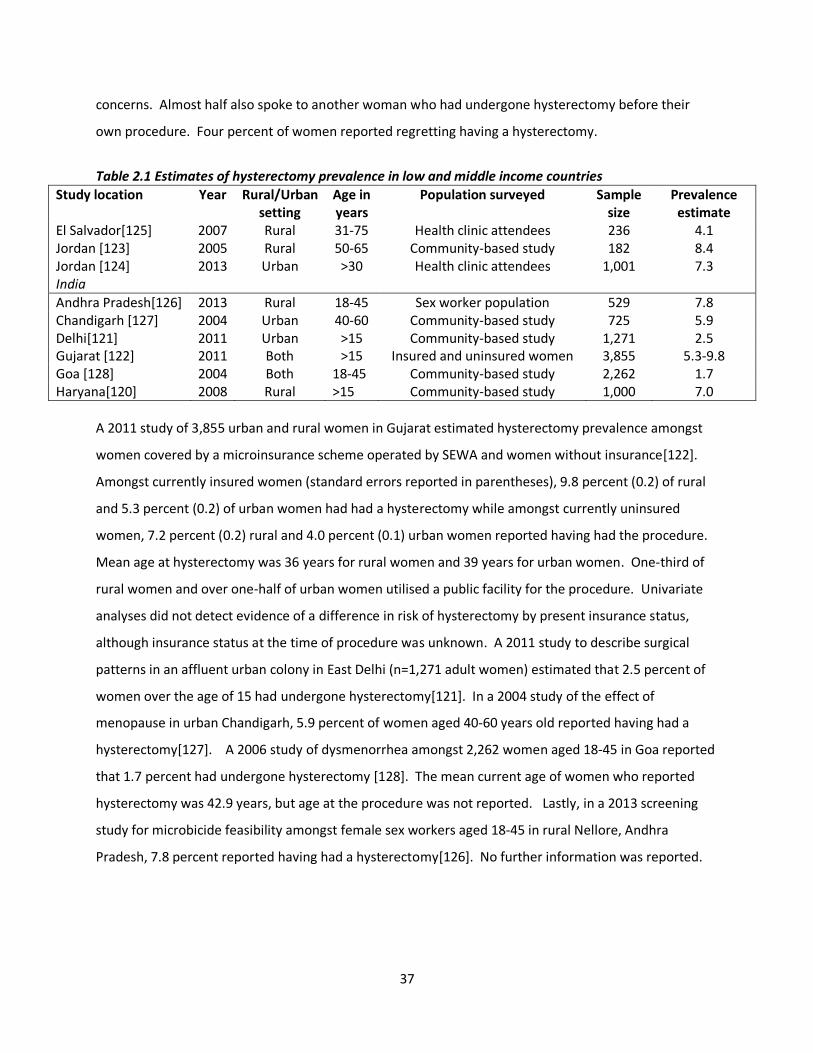
37
concerns. Almost half also spoke to another woman who had undergone hysterectomy before their
own procedure. Four percent of women reported regretting having a hysterectomy.
Table 2.1 Estimates of hysterectomy prevalence in low and middle income countries
Study location Year Rural/Urban setting
Age in years
Population surveyed Sample size
Prevalence estimate
El Salvador[125] 2007 Rural 31-75 Health clinic attendees 236 4.1 Jordan [123] 2005 Rural 50-65 Community-based study 182 8.4 Jordan [124] 2013 Urban >30 Health clinic attendees 1,001 7.3 India
Andhra Pradesh[126] 2013 Rural 18-45 Sex worker population 529 7.8 Chandigarh [127] 2004 Urban 40-60 Community-based study 725 5.9 Delhi[121] 2011 Urban >15 Community-based study 1,271 2.5 Gujarat [122] 2011 Both >15 Insured and uninsured women 3,855 5.3-9.8 Goa [128] 2004 Both 18-45 Community-based study 2,262 1.7 Haryana[120] 2008 Rural >15 Community-based study 1,000 7.0
A 2011 study of 3,855 urban and rural women in Gujarat estimated hysterectomy prevalence amongst
women covered by a microinsurance scheme operated by SEWA and women without insurance[122].
Amongst currently insured women (standard errors reported in parentheses), 9.8 percent (0.2) of rural
and 5.3 percent (0.2) of urban women had had a hysterectomy while amongst currently uninsured
women, 7.2 percent (0.2) rural and 4.0 percent (0.1) urban women reported having had the procedure.
Mean age at hysterectomy was 36 years for rural women and 39 years for urban women. One-third of
rural women and over one-half of urban women utilised a public facility for the procedure. Univariate
analyses did not detect evidence of a difference in risk of hysterectomy by present insurance status,
although insurance status at the time of procedure was unknown. A 2011 study to describe surgical
patterns in an affluent urban colony in East Delhi (n=1,271 adult women) estimated that 2.5 percent of
women over the age of 15 had undergone hysterectomy[121]. In a 2004 study of the effect of
menopause in urban Chandigarh, 5.9 percent of women aged 40-60 years old reported having had a
hysterectomy[127]. A 2006 study of dysmenorrhea amongst 2,262 women aged 18-45 in Goa reported
that 1.7 percent had undergone hysterectomy [128]. The mean current age of women who reported
hysterectomy was 42.9 years, but age at the procedure was not reported. Lastly, in a 2013 screening
study for microbicide feasibility amongst female sex workers aged 18-45 in rural Nellore, Andhra
Pradesh, 7.8 percent reported having had a hysterectomy[126]. No further information was reported.
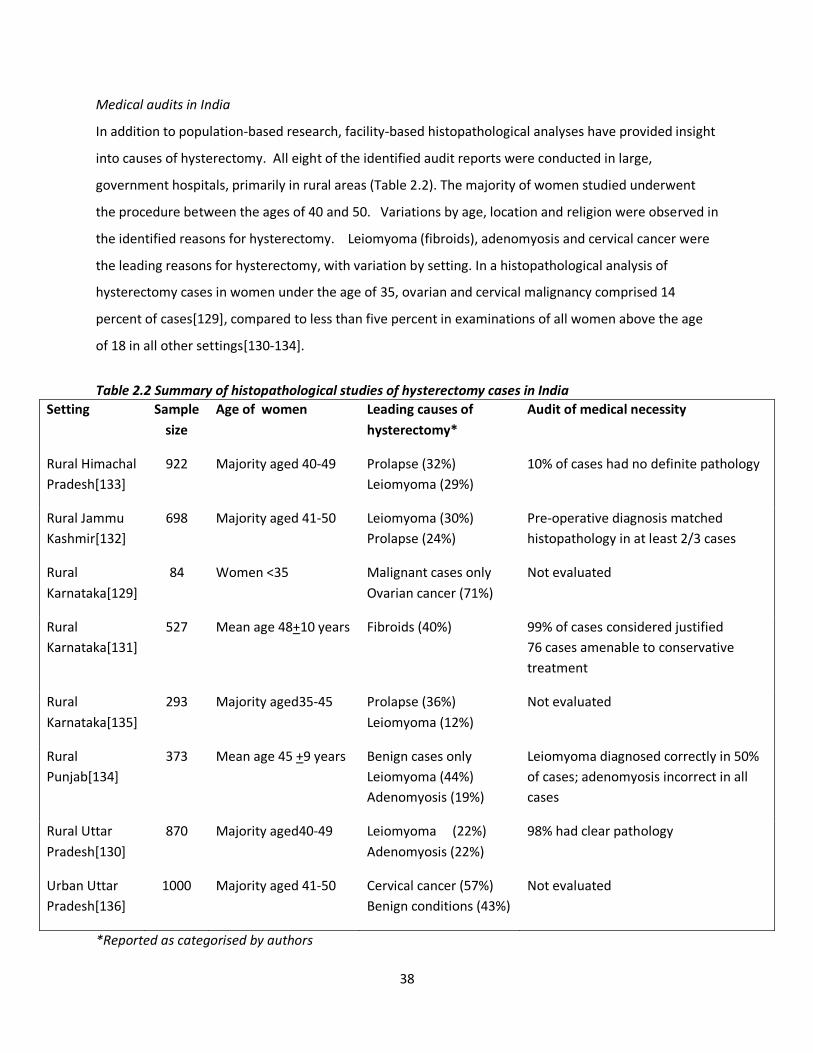
38
Medical audits in India
In addition to population-based research, facility-based histopathological analyses have provided insight
into causes of hysterectomy. All eight of the identified audit reports were conducted in large,
government hospitals, primarily in rural areas (Table 2.2). The majority of women studied underwent
the procedure between the ages of 40 and 50. Variations by age, location and religion were observed in
the identified reasons for hysterectomy. Leiomyoma (fibroids), adenomyosis and cervical cancer were
the leading reasons for hysterectomy, with variation by setting. In a histopathological analysis of
hysterectomy cases in women under the age of 35, ovarian and cervical malignancy comprised 14
percent of cases[129], compared to less than five percent in examinations of all women above the age
of 18 in all other settings[130-134].
Table 2.2 Summary of histopathological studies of hysterectomy cases in India
Setting Sample
size
Age of women Leading causes of
hysterectomy*
Audit of medical necessity
Rural Himachal
Pradesh[133]
922 Majority aged 40-49 Prolapse (32%)
Leiomyoma (29%)
10% of cases had no definite pathology
Rural Jammu
Kashmir[132]
698 Majority aged 41-50 Leiomyoma (30%)
Prolapse (24%)
Pre-operative diagnosis matched
histopathology in at least 2/3 cases
Rural
Karnataka[129]
84 Women <35 Malignant cases only
Ovarian cancer (71%)
Not evaluated
Rural
Karnataka[131]
527 Mean age 48+10 years Fibroids (40%) 99% of cases considered justified
76 cases amenable to conservative
treatment
Rural
Karnataka[135]
293 Majority aged35-45 Prolapse (36%)
Leiomyoma (12%)
Not evaluated
Rural
Punjab[134]
373 Mean age 45 +9 years
Benign cases only
Leiomyoma (44%)
Adenomyosis (19%)
Leiomyoma diagnosed correctly in 50%
of cases; adenomyosis incorrect in all
cases
Rural Uttar
Pradesh[130]
870 Majority aged40-49 Leiomyoma (22%)
Adenomyosis (22%)
98% had clear pathology
Urban Uttar
Pradesh[136]
1000 Majority aged 41-50 Cervical cancer (57%)
Benign conditions (43%)
Not evaluated
*Reported as categorised by authors
39
A comparison of Hindu and Muslim women who underwent hysterectomy in Noida, an urban area
outside of New Delhi, reported that a lower proportion of Muslim women underwent hysterectomy for
cervical malignancies compared to Hindu women [136]. Studies conducted in rural Karnataka, Jammu
and Himachal Pradesh observed uterine prolapse as a leading cause of hysterectomy, compared to a
higher proportion for fibroids and almost no prolapse in urban areas[131, 133-135]. In all settings, the
large majority of procedures were conducted through abdominal hysterectomy, with the exception of
those done for uterine prolapse where vaginal hysterectomy was used.
Authors evaluated the medical necessity of hysterectomies conducted by comparing clinical diagnoses
and histopathological results. Findings varied by study setting. In an audit based at a large teaching
hospital in Karnataka, the authors concluded that 76 of 527 (14%) hysterectomies performed were
amenable to more conservative medical management[131]. Researchers in a government hospital in
rural Uttar Pradesh found no pathology in two percent of 870 cases[130], while 10 percent of 922
specimens in a rural Himachal Pradesh hospital had no clear pathology[133]. In rural Punjab, 11 of 18
cases performed in women under 30 years old were deemed medically unnecessary[134].
Health systems research
Several Indian studies provided perspective on health services utilisation and health systems concerns
raised by hysterectomy patterns. A costing of hysterectomy for facilities, rather than cost incurred by
patients, reported the mean cost (in Indian rupees, 1 GBP=94 rupees ) to be Rs. 4,124 to government
facilities; Rs. 10,081 to private for-profit hospitals and Rs. 57,622 to a private charity hospital, the high
amount at the latter due to a low case load[137]. In a review of 63 hysterectomies conducted on insured
women in rural Gujarat, Ranson and John reported an average cost of Rs. 5,010 incurred by women, of
which a mean amount of Rs. 1,277 was reimbursed [138]. The majority of 728 cases reviewed in rural
Andhra Pradesh incurred a cost between Rs. 7,500 and Rs. 10,000[139].
A study of providers who conducted hysterectomies on SEWA-insured women in Kheda, Gujarat
reported widely varying quality of care[138]. Authors documented practices that included providers
performing hysterectomy on demand, conducting oophorectomy without consultation or consent, and
working in non-hygienic conditions in operating theatres. Histopathology of specimens was not
conducted by any of the 12 providers interviewed. A focus group discussion with ten women who had
not undergone hysterectomy revealed that they perceived advice regarding hysterectomies to be better
40
in government facilities compared to private doctors, although the majority of procedures were
conducted by the latter. In rural Andhra Pradesh, where 97% of cases were conducted in the private
sector, women were not informed of their options or potential side effects of hysterectomy and
oophorectomy at a young age. The mean age at hysterectomy in the 132 cases reviewed in this setting
was 28.5 years[140].
Hysterectomy has been reported as the leading reason for use of health insurance by adult women in
several schemes [138, 139, 141, 142]. Documentation of surgeries conducted under Arogya Shri, a
government insurance program in the state of Andhra Pradesh, amongst young women has led to
hysterectomy’s removal from the coverage package due to suggestions of medically un-indicated
hysterectomy[139, 140, 143]. Hysterectomy was reported as the leading reason for admission amongst
women insured by RSBY in Gujarat [142]. Studies have also noted differences in treatment-seeking
behaviour based on insurance status. In rural Karnataka, a descriptive review of 776 cases, 176 of
whom were insured, observed that insured women were older, waited for a shorter period of time and
were more likely to have fibroids, compared to uninsured women who waited up to two years to seek
treatment, with higher prevalence of indications of carcinoma [144]. VimoSEWA, a scheme in Gujarat,
reported hysterectomy as the highest reason for claims amongst adult women. A comparison of women
insured by VimoSEWA with uninsured women, however, did not detect evidence of a difference in the
odds of undergoing hysterectomy in the past six months, based on a cross-sectional analysis of 1,934
women in rural and urban Gujarat [145].
Women’s perspectives on hysterectomy also varied across study settings. In Gujarat, women felt that
menstrual taboos and restrictions could be sufficient reason to justify or demand hysterectomy,
although provider opinions were deemed paramount in the decision-making process[138]. In Andhra
Pradesh, however, hysterectomy was reported as a cause of considerable debt and physical suffering
due to side effects. In a study of 50 women who had undergone hysterectomy in New Delhi, most (92%)
did not know what type of hysterectomy was conducted or what alternative treatment was
available[146]. A large majority requested more information on hysterectomy through pamphlets and
from their providers.
41
Sociocultural factors related to hysterectomy
While there has been very limited research on hysterectomy in India, studies on gynaecological
morbidity, particularly related to menstrual disorders, provide context on the influences on women’s
perceptions and decisions related to treatment. Several studies have suggested that Indian women live
in a ‘culture of silence[147]’ – fuelled by gender inequality and social norms – that proscribes women
from communicating an illness or using household resources for treatment related to reproductive and
sexual health[148-152]. Accordingly, cultural expectations that women will demonstrate resilience in
the face of hardship, and not prioritise their needs over others, may translate into low treatment-
seeking rates[153]. For example, less than half of women studied in rural Rajasthan, Maharashtra and
Tamil Nadu and in urban Mumbai sought treatment for vaginal discharge, menstrual disorders or
abdominal pain[149, 153-156]. Reasons for not seeking care were related to normalisation of
gynaecological ailments, fear or embarrassment, financial constraints and lack of decision-making power
over health care. However, two studies amongst low-income women in rural Gujarat and rural
Karnataka reported that the majority of women sought multiple sources of treatment for similar
ailments as reported in other studies[157, 158]. Suggesting that the ‘culture of silence’ is not universal,
these findings also underscore regional diversity regarding perceptions and treatment of gynaecological
ailments.
In the two ethnographic studies identified that explored perceptions of gynaecological morbidity,
women’s attitudes towards gynaecological symptoms and ailments reflect the role of cultural norms in
defining and treating illness[154, 158]. The most common gynaecological complaints involved vaginal
discharge, menstrual disorders and uterine prolapse. Attitudes towards menstruation and menstrual
disorders, given their relevance to research on hysterectomy, are summarised here. Menstruating
women are considered ‘polluting’: particularly in rural India, they cannot enter the kitchen, temples or
sacred places, with more stringent rules in some communities[14, 158, 159]. Women in rural Rajasthan
linked menstruation and their gynaecological problems with kamjori, bodily weakness[154]. Women
who suffer from weakness are more prone to excessive menstrual bleeding, which was a symptom of a
defect in the uterus or cervical cancer. In a state of kamjori/weakness, factors such as sterilisation,
pregnancy, eating hot foods, and mental tension are more likely to cause menstrual problems. In this
setting, most women did not seek treatment for gynaecological ailments unless they became severe.
42
Women in rural Gujarat, on the other hand, attributed reproductive ailments to excessive garmi – heat
in the body[158]. Based in the ayurvedic concept of humoral balance, garmi suggests that illness
originates from an imbalance of hot and cold. Garmi was linked to ingestion of hot food, allopathic
medicines, alcohol consumption and sexual intercourse. Sterilisation was linked to manifestations of
garmi, as a result of the heat that resulted from an invasive tubal ligation. Most women sought private
care for ailments, as locally available government health services only provided family planning or
immunisation. Women who reported excessive menstrual bleeding frequently inquired about the
possibility of hysterectomy as a permanent solution to menstrual problems. They also avoided
treatment that involved allopathic oral medicines, due to fear of excessive heat production.
Discussion
This review highlights the very limited research available on measures of the frequency of hysterectomy
in low and middle-income countries. A search that included all countries yielded an initial 18,465 hits;
almost all studies that reported incidence and prevalence were based in high-income settings. Case-
control studies conducted in Nepal, Brazil and China and facility-based studies in Egypt, Ethiopia,
Malaysia, Pakistan and Nigeria that studied hysterectomy were excluded from this review because they
did not provide denominator information about the population at risk. In North America and Europe,
nationally representative surveys and databases of medical admissions and insurance utilisation provide
population data for epidemiological analyses. In India and other low-income settings, community-based
estimates of hysterectomy have been based on small samples, in specific sub-populations, with limited
population data and measures of precision presented. Variation in time periods, population
characteristics and age structure limits comparisons between the available data, while lack of incidence
or age-standardised data prevents assessment of trends over time or with rates estimated in other
countries.
While noting the limitations of comparing prevalence data in different populations, estimates in India, El
Salvador and Jordan are similar or slightly lower than those in Asian high-income settings –8.8% in
Taiwan and 7.5% in Singapore – and one high-income Eastern European country, Estonia (11.7%) [160]
[161, 162]. However, the mean age of hysterectomy in India (where reported) is approximately ten
years younger than that reported in the high-income settings [97, 98, 163]. Prevalence also appears to
vary by geographic setting, health systems environment and socioeconomic status within India. While
only 2.5 percent of women in an affluent colony in Delhi reported hysterectomy, the procedure was
43
reported as more prevalent amongst low-income women in rural areas. Comparisons of insured and
uninsured women in a community-based scheme do not suggest differences in hysterectomy patterns
based on insurance coverage, but there has been no comparison of women insured by higher coverage
government schemes with uninsured women. Further, available population-based estimates of
hysterectomy present very limited analysis of risk factors or health care utilisation patterns associated
with the procedure.
The primary medical indications in India – fibroids, adenomyosis and prolapse – suggest that a
proportion of cases are amenable to initial medical management or less invasive treatment. However,
histopathological reports suggested that the large majority of procedures conducted in government
hospitals were appropriately recommended, compared to 20% to 70% found inappropriate in Taiwan
and the United States, respectively[112, 164]. Audits also indicated a higher mean age of women that
reported in community-based studies, although the study settings may not be comparable. Medical
audits were conducted in large government teaching hospitals, while community-based studies reported
high proportions of procedures conducted by private providers. Accordingly, these assessments of
medical necessity may not be representative of wider patterns in India. Further, facility-based research
has raised concerns about the quality of gynaecological care and cost incurred by women, as well as
women’s limited knowledge of hysterectomy before undergoing the procedure.
There is limited research on the social and cultural context of treatment-seeking behaviour for
gynaecological morbidity, both in India and globally[165]. Available research in India suggests that
sociocultural perceptions vary by setting – underscoring the importance of localised, context-specific
research. The lack of available or effective services for gynaecological ailments, however, was common
across settings[149, 153-155, 158, 166]. Several studies also noted women’s perceptions of the
iatrogenic roots of gynaecological problems: sterilisation, intra-uterine device insertion and abortion
are perceived as causes of subsequent infections or disorders[154, 155, 158, 165].
This review underscores the type of research required to evaluate hysterectomy levels and trends in
India. Analyses of population-based data and estimates of incidence are required to establish national
patterns and make meaningful comparisons within and between settings. Given the regional diversity
suggested by available studies, more community-based research is required to document and identify
local risk factors. Medical audits conducted in a range of health facilities, particularly private hospitals
44
where the majority of procedures is conducted, would provide insight into clinical practice as well as
identify medically unindicated procedures. Age-specific data are required, as well as estimates of
incidence, are required to evaluate trends in India. Longterm research on side effects of hysterectomy
is also needed, along with consideration of the health implications of a relatively younger age at
hysterectomy in India. Examination of the role of health insurance and health systems environments
requires more research based on population-level data, rather than analyses of enrolled beneficiaries
alone. Encouragingly, the next round of the NFHS in India will include hysterectomy in its 2014-15
survey of a nationally representative sample of households [167]. Combined with medical audits and
perspectives of providers and women, regular analysis of national data will provide insight into why
hysterectomy has emerged as a public health concern in India. Lastly, research on the social and
cultural determinants of hysterectomy will provide critical insight into: women’s perspectives on the
procedure; facilitating factors and barriers; the implication of the procedure on women’s role in the
family and on gender norms; and on potential areas for intervention.
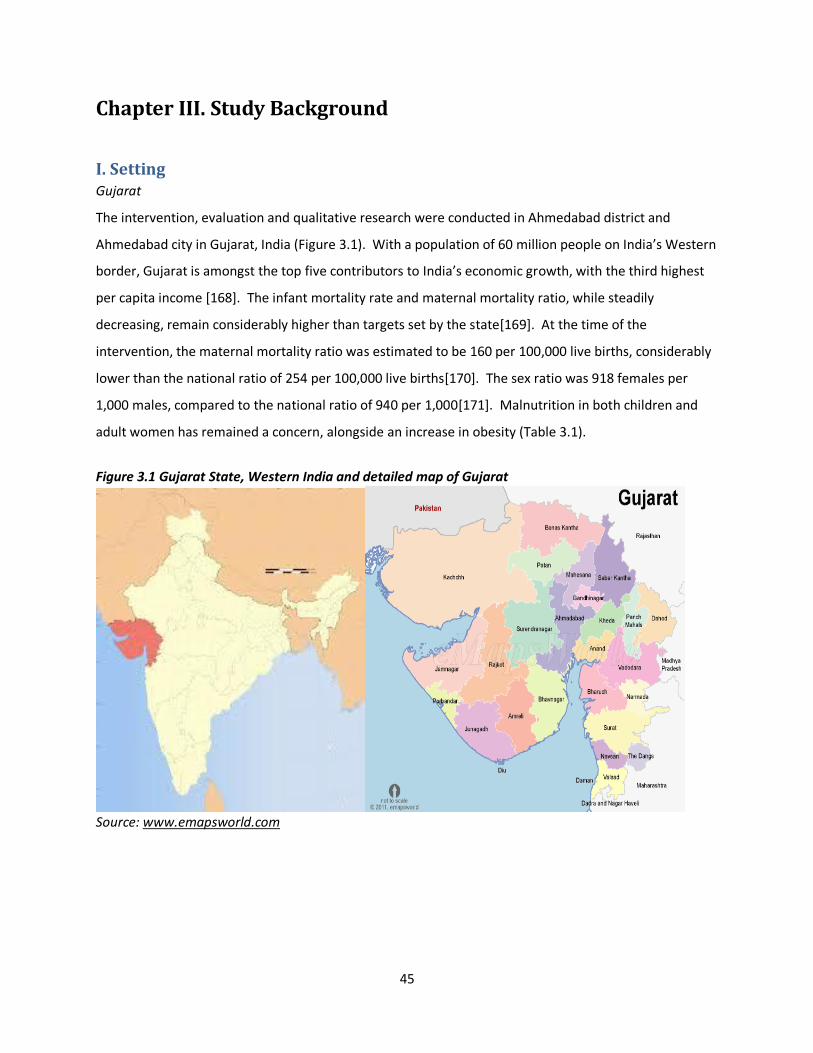
45
Chapter III. Study Background
I. Setting Gujarat
The intervention, evaluation and qualitative research were conducted in Ahmedabad district and
Ahmedabad city in Gujarat, India (Figure 3.1). With a population of 60 million people on India’s Western
border, Gujarat is amongst the top five contributors to India’s economic growth, with the third highest
per capita income [168]. The infant mortality rate and maternal mortality ratio, while steadily
decreasing, remain considerably higher than targets set by the state[169]. At the time of the
intervention, the maternal mortality ratio was estimated to be 160 per 100,000 live births, considerably
lower than the national ratio of 254 per 100,000 live births[170]. The sex ratio was 918 females per
1,000 males, compared to the national ratio of 940 per 1,000[171]. Malnutrition in both children and
adult women has remained a concern, alongside an increase in obesity (Table 3.1).
Figure 3.1 Gujarat State, Western India and detailed map of Gujarat
Source: www.emapsworld.com
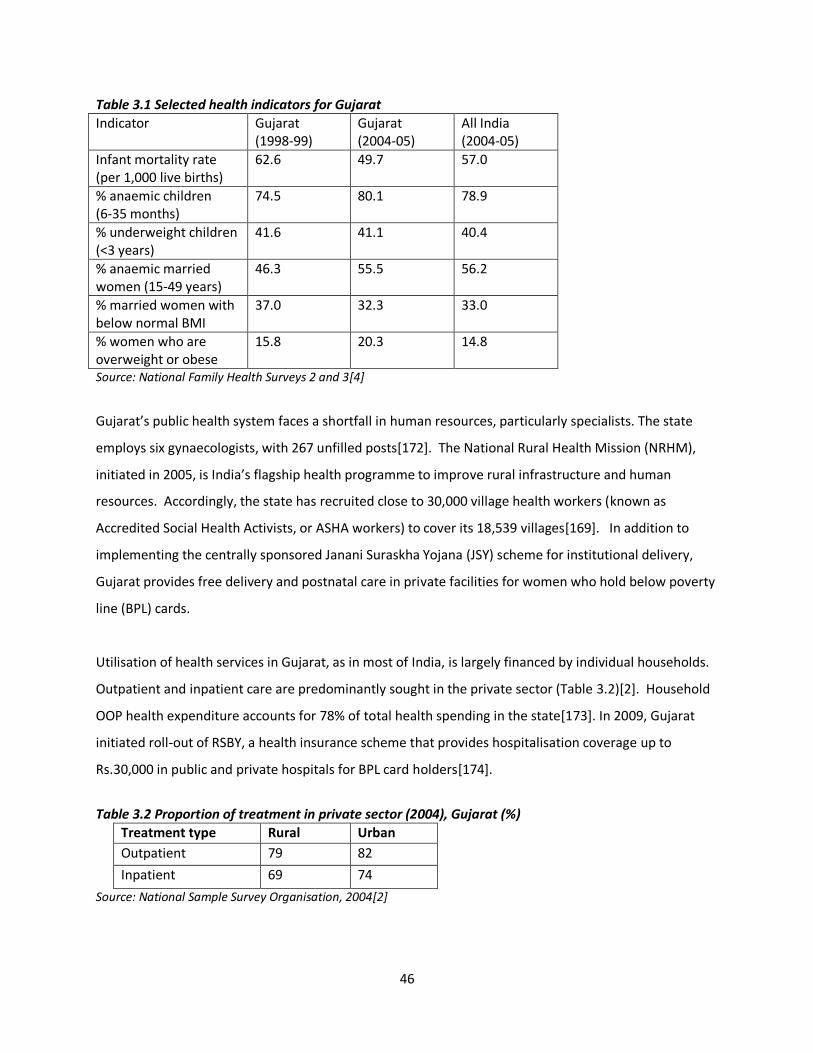
46
Table 3.1 Selected health indicators for Gujarat
Indicator Gujarat (1998-99)
Gujarat (2004-05)
All India (2004-05)
Infant mortality rate (per 1,000 live births)
62.6 49.7 57.0
% anaemic children (6-35 months)
74.5 80.1 78.9
% underweight children (<3 years)
41.6 41.1 40.4
% anaemic married women (15-49 years)
46.3 55.5 56.2
% married women with below normal BMI
37.0 32.3 33.0
% women who are overweight or obese
15.8 20.3 14.8
Source: National Family Health Surveys 2 and 3[4]
Gujarat’s public health system faces a shortfall in human resources, particularly specialists. The state
employs six gynaecologists, with 267 unfilled posts[172]. The National Rural Health Mission (NRHM),
initiated in 2005, is India’s flagship health programme to improve rural infrastructure and human
resources. Accordingly, the state has recruited close to 30,000 village health workers (known as
Accredited Social Health Activists, or ASHA workers) to cover its 18,539 villages[169]. In addition to
implementing the centrally sponsored Janani Suraskha Yojana (JSY) scheme for institutional delivery,
Gujarat provides free delivery and postnatal care in private facilities for women who hold below poverty
line (BPL) cards.
Utilisation of health services in Gujarat, as in most of India, is largely financed by individual households.
Outpatient and inpatient care are predominantly sought in the private sector (Table 3.2)[2]. Household
OOP health expenditure accounts for 78% of total health spending in the state[173]. In 2009, Gujarat
initiated roll-out of RSBY, a health insurance scheme that provides hospitalisation coverage up to
Rs.30,000 in public and private hospitals for BPL card holders[174].
Table 3.2 Proportion of treatment in private sector (2004), Gujarat (%)
Treatment type Rural Urban
Outpatient 79 82
Inpatient 69 74
Source: National Sample Survey Organisation, 2004[2]
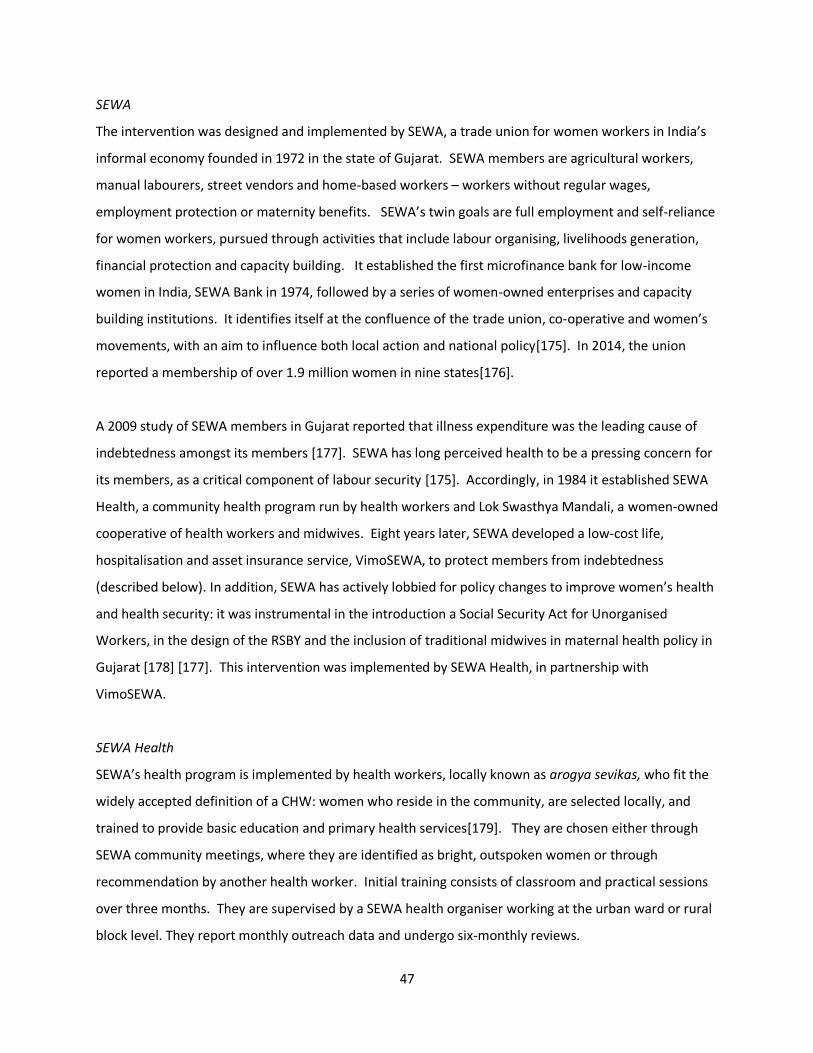
47
SEWA
The intervention was designed and implemented by SEWA, a trade union for women workers in India’s
informal economy founded in 1972 in the state of Gujarat. SEWA members are agricultural workers,
manual labourers, street vendors and home-based workers – workers without regular wages,
employment protection or maternity benefits. SEWA’s twin goals are full employment and self-reliance
for women workers, pursued through activities that include labour organising, livelihoods generation,
financial protection and capacity building. It established the first microfinance bank for low-income
women in India, SEWA Bank in 1974, followed by a series of women-owned enterprises and capacity
building institutions. It identifies itself at the confluence of the trade union, co-operative and women’s
movements, with an aim to influence both local action and national policy[175]. In 2014, the union
reported a membership of over 1.9 million women in nine states[176].
A 2009 study of SEWA members in Gujarat reported that illness expenditure was the leading cause of
indebtedness amongst its members [177]. SEWA has long perceived health to be a pressing concern for
its members, as a critical component of labour security [175]. Accordingly, in 1984 it established SEWA
Health, a community health program run by health workers and Lok Swasthya Mandali, a women-owned
cooperative of health workers and midwives. Eight years later, SEWA developed a low-cost life,
hospitalisation and asset insurance service, VimoSEWA, to protect members from indebtedness
(described below). In addition, SEWA has actively lobbied for policy changes to improve women’s health
and health security: it was instrumental in the introduction a Social Security Act for Unorganised
Workers, in the design of the RSBY and the inclusion of traditional midwives in maternal health policy in
Gujarat [178] [177]. This intervention was implemented by SEWA Health, in partnership with
VimoSEWA.
SEWA Health
SEWA’s health program is implemented by health workers, locally known as arogya sevikas, who fit the
widely accepted definition of a CHW: women who reside in the community, are selected locally, and
trained to provide basic education and primary health services[179]. They are chosen either through
SEWA community meetings, where they are identified as bright, outspoken women or through
recommendation by another health worker. Initial training consists of classroom and practical sessions
over three months. They are supervised by a SEWA health organiser working at the urban ward or rural
block level. They report monthly outreach data and undergo six-monthly reviews.
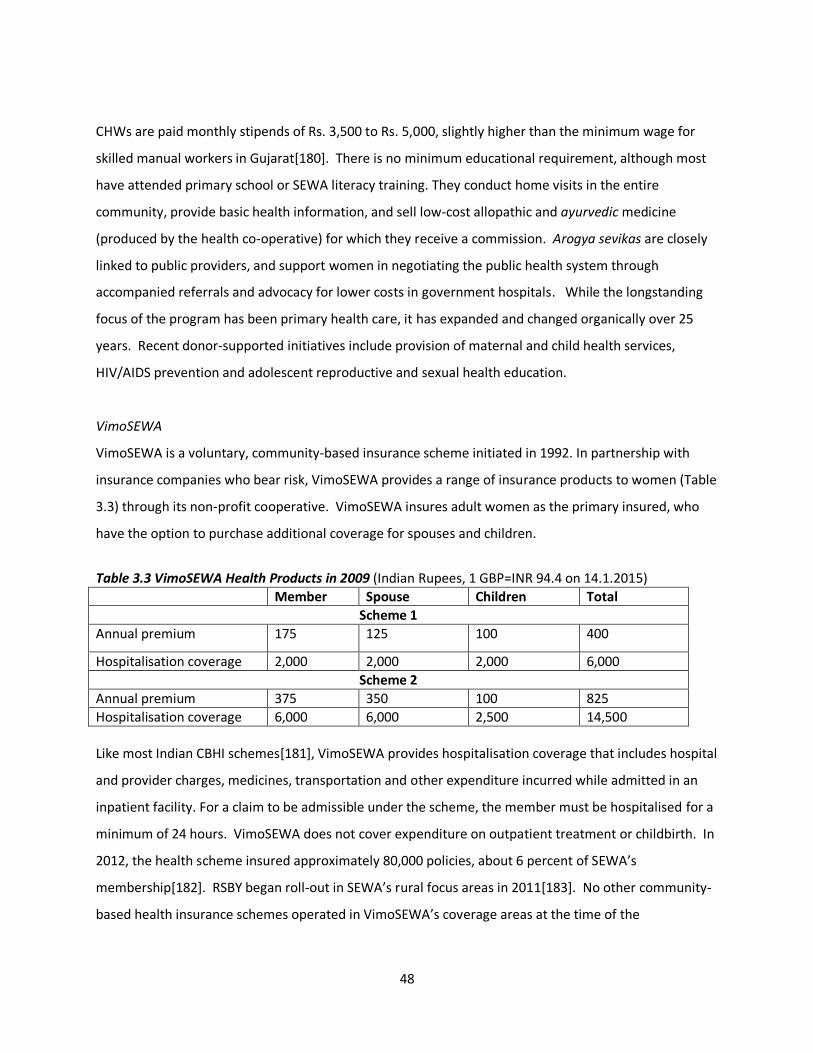
48
CHWs are paid monthly stipends of Rs. 3,500 to Rs. 5,000, slightly higher than the minimum wage for
skilled manual workers in Gujarat[180]. There is no minimum educational requirement, although most
have attended primary school or SEWA literacy training. They conduct home visits in the entire
community, provide basic health information, and sell low-cost allopathic and ayurvedic medicine
(produced by the health co-operative) for which they receive a commission. Arogya sevikas are closely
linked to public providers, and support women in negotiating the public health system through
accompanied referrals and advocacy for lower costs in government hospitals. While the longstanding
focus of the program has been primary health care, it has expanded and changed organically over 25
years. Recent donor-supported initiatives include provision of maternal and child health services,
HIV/AIDS prevention and adolescent reproductive and sexual health education.
VimoSEWA
VimoSEWA is a voluntary, community-based insurance scheme initiated in 1992. In partnership with
insurance companies who bear risk, VimoSEWA provides a range of insurance products to women (Table
3.3) through its non-profit cooperative. VimoSEWA insures adult women as the primary insured, who
have the option to purchase additional coverage for spouses and children.
Table 3.3 VimoSEWA Health Products in 2009 (Indian Rupees, 1 GBP=INR 94.4 on 14.1.2015)
Member Spouse Children Total
Scheme 1
Annual premium 175 125 100 400
Hospitalisation coverage 2,000 2,000 2,000 6,000
Scheme 2
Annual premium 375 350 100 825
Hospitalisation coverage 6,000 6,000 2,500 14,500
Like most Indian CBHI schemes[181], VimoSEWA provides hospitalisation coverage that includes hospital
and provider charges, medicines, transportation and other expenditure incurred while admitted in an
inpatient facility. For a claim to be admissible under the scheme, the member must be hospitalised for a
minimum of 24 hours. VimoSEWA does not cover expenditure on outpatient treatment or childbirth. In
2012, the health scheme insured approximately 80,000 policies, about 6 percent of SEWA’s
membership[182]. RSBY began roll-out in SEWA’s rural focus areas in 2011[183]. No other community-
based health insurance schemes operated in VimoSEWA’s coverage areas at the time of the
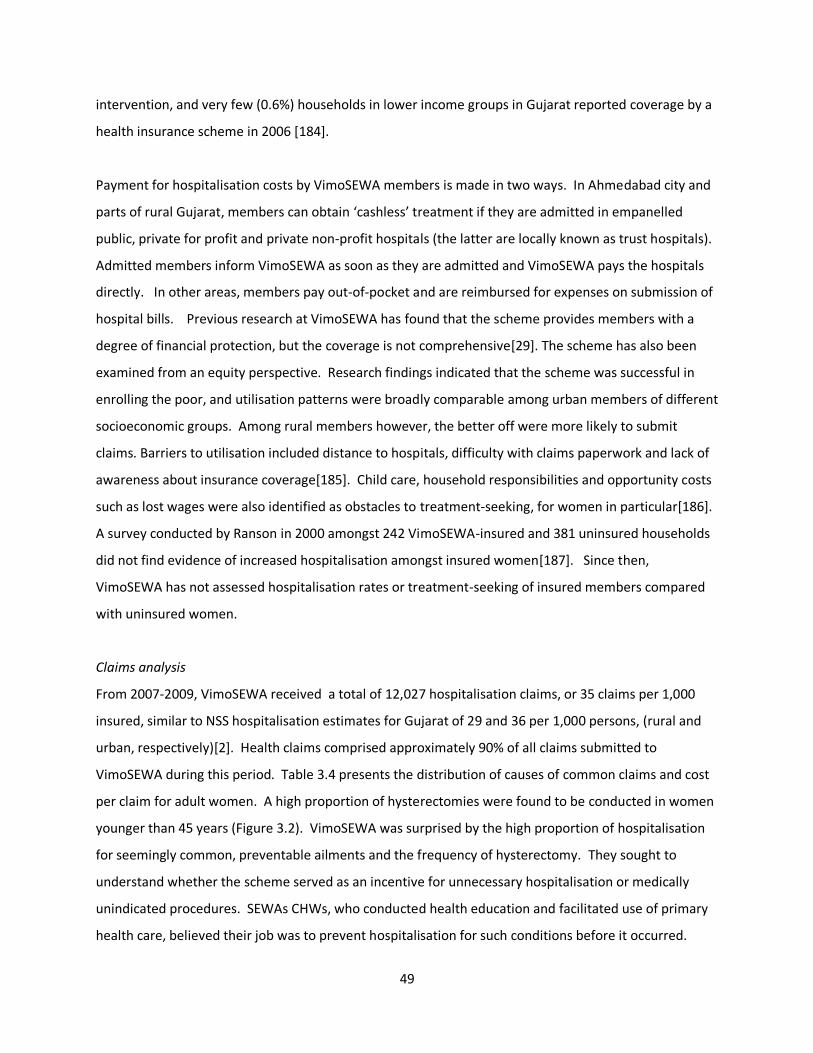
49
intervention, and very few (0.6%) households in lower income groups in Gujarat reported coverage by a
health insurance scheme in 2006 [184].
Payment for hospitalisation costs by VimoSEWA members is made in two ways. In Ahmedabad city and
parts of rural Gujarat, members can obtain ‘cashless’ treatment if they are admitted in empanelled
public, private for profit and private non-profit hospitals (the latter are locally known as trust hospitals).
Admitted members inform VimoSEWA as soon as they are admitted and VimoSEWA pays the hospitals
directly. In other areas, members pay out-of-pocket and are reimbursed for expenses on submission of
hospital bills. Previous research at VimoSEWA has found that the scheme provides members with a
degree of financial protection, but the coverage is not comprehensive[29]. The scheme has also been
examined from an equity perspective. Research findings indicated that the scheme was successful in
enrolling the poor, and utilisation patterns were broadly comparable among urban members of different
socioeconomic groups. Among rural members however, the better off were more likely to submit
claims. Barriers to utilisation included distance to hospitals, difficulty with claims paperwork and lack of
awareness about insurance coverage[185]. Child care, household responsibilities and opportunity costs
such as lost wages were also identified as obstacles to treatment-seeking, for women in particular[186].
A survey conducted by Ranson in 2000 amongst 242 VimoSEWA-insured and 381 uninsured households
did not find evidence of increased hospitalisation amongst insured women[187]. Since then,
VimoSEWA has not assessed hospitalisation rates or treatment-seeking of insured members compared
with uninsured women.
Claims analysis
From 2007-2009, VimoSEWA received a total of 12,027 hospitalisation claims, or 35 claims per 1,000
insured, similar to NSS hospitalisation estimates for Gujarat of 29 and 36 per 1,000 persons, (rural and
urban, respectively)[2]. Health claims comprised approximately 90% of all claims submitted to
VimoSEWA during this period. Table 3.4 presents the distribution of causes of common claims and cost
per claim for adult women. A high proportion of hysterectomies were found to be conducted in women
younger than 45 years (Figure 3.2). VimoSEWA was surprised by the high proportion of hospitalisation
for seemingly common, preventable ailments and the frequency of hysterectomy. They sought to
understand whether the scheme served as an incentive for unnecessary hospitalisation or medically
unindicated procedures. SEWAs CHWs, who conducted health education and facilitated use of primary
health care, believed their job was to prevent hospitalisation for such conditions before it occurred.
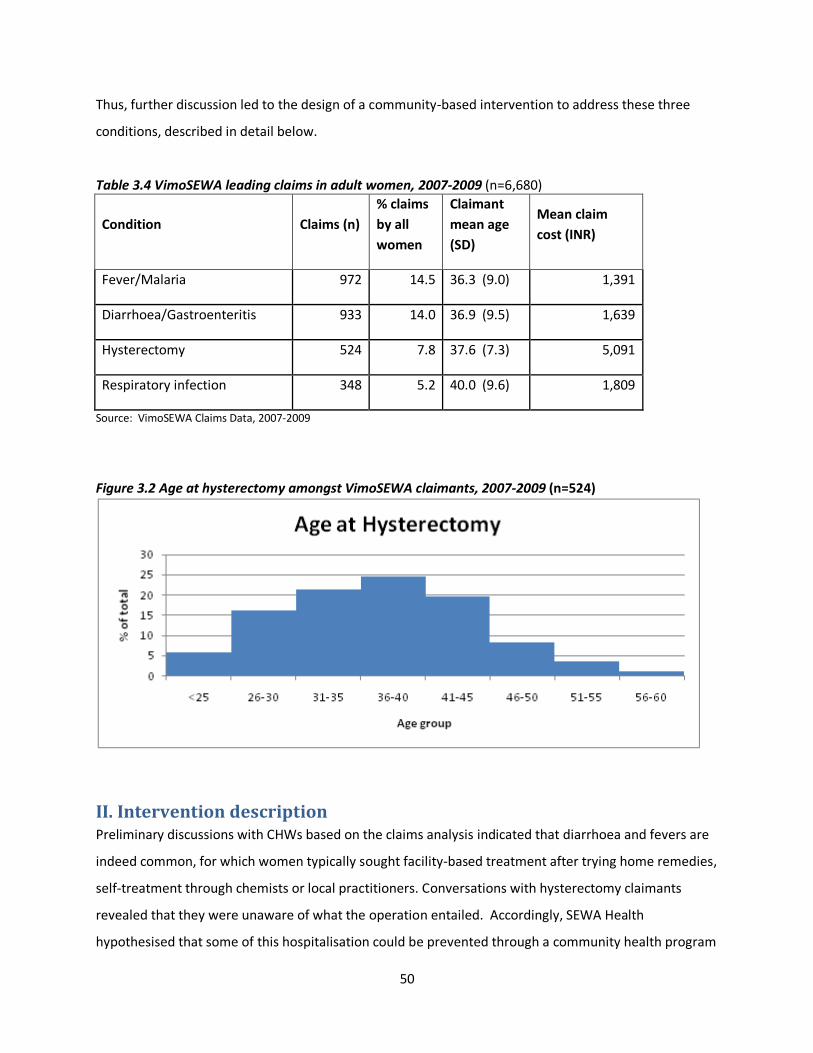
50
Thus, further discussion led to the design of a community-based intervention to address these three
conditions, described in detail below.
Table 3.4 VimoSEWA leading claims in adult women, 2007-2009 (n=6,680)
Condition Claims (n)
% claims
by all
women
Claimant
mean age
(SD)
Mean claim
cost (INR)
Fever/Malaria 972 14.5 36.3 (9.0) 1,391
Diarrhoea/Gastroenteritis 933 14.0 36.9 (9.5) 1,639
Hysterectomy 524 7.8 37.6 (7.3) 5,091
Respiratory infection 348 5.2 40.0 (9.6) 1,809
Source: VimoSEWA Claims Data, 2007-2009
Figure 3.2 Age at hysterectomy amongst VimoSEWA claimants, 2007-2009 (n=524)
II. Intervention description Preliminary discussions with CHWs based on the claims analysis indicated that diarrhoea and fevers are
indeed common, for which women typically sought facility-based treatment after trying home remedies,
self-treatment through chemists or local practitioners. Conversations with hysterectomy claimants
revealed that they were unaware of what the operation entailed. Accordingly, SEWA Health
hypothesised that some of this hospitalisation could be prevented through a community health program
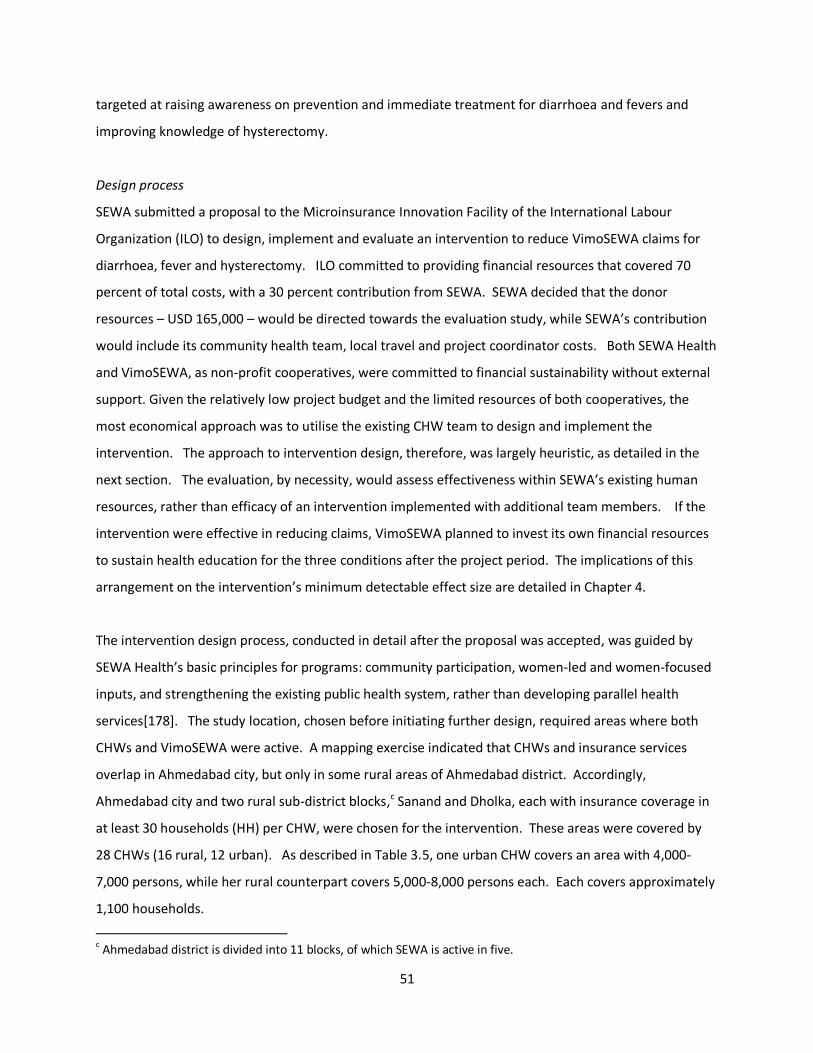
51
targeted at raising awareness on prevention and immediate treatment for diarrhoea and fevers and
improving knowledge of hysterectomy.
Design process
SEWA submitted a proposal to the Microinsurance Innovation Facility of the International Labour
Organization (ILO) to design, implement and evaluate an intervention to reduce VimoSEWA claims for
diarrhoea, fever and hysterectomy. ILO committed to providing financial resources that covered 70
percent of total costs, with a 30 percent contribution from SEWA. SEWA decided that the donor
resources – USD 165,000 – would be directed towards the evaluation study, while SEWA’s contribution
would include its community health team, local travel and project coordinator costs. Both SEWA Health
and VimoSEWA, as non-profit cooperatives, were committed to financial sustainability without external
support. Given the relatively low project budget and the limited resources of both cooperatives, the
most economical approach was to utilise the existing CHW team to design and implement the
intervention. The approach to intervention design, therefore, was largely heuristic, as detailed in the
next section. The evaluation, by necessity, would assess effectiveness within SEWA’s existing human
resources, rather than efficacy of an intervention implemented with additional team members. If the
intervention were effective in reducing claims, VimoSEWA planned to invest its own financial resources
to sustain health education for the three conditions after the project period. The implications of this
arrangement on the intervention’s minimum detectable effect size are detailed in Chapter 4.
The intervention design process, conducted in detail after the proposal was accepted, was guided by
SEWA Health’s basic principles for programs: community participation, women-led and women-focused
inputs, and strengthening the existing public health system, rather than developing parallel health
services[178]. The study location, chosen before initiating further design, required areas where both
CHWs and VimoSEWA were active. A mapping exercise indicated that CHWs and insurance services
overlap in Ahmedabad city, but only in some rural areas of Ahmedabad district. Accordingly,
Ahmedabad city and two rural sub-district blocks,c Sanand and Dholka, each with insurance coverage in
at least 30 households (HH) per CHW, were chosen for the intervention. These areas were covered by
28 CHWs (16 rural, 12 urban). As described in Table 3.5, one urban CHW covers an area with 4,000-
7,000 persons, while her rural counterpart covers 5,000-8,000 persons each. Each covers approximately
1,100 households.
c Ahmedabad district is divided into 11 blocks, of which SEWA is active in five.
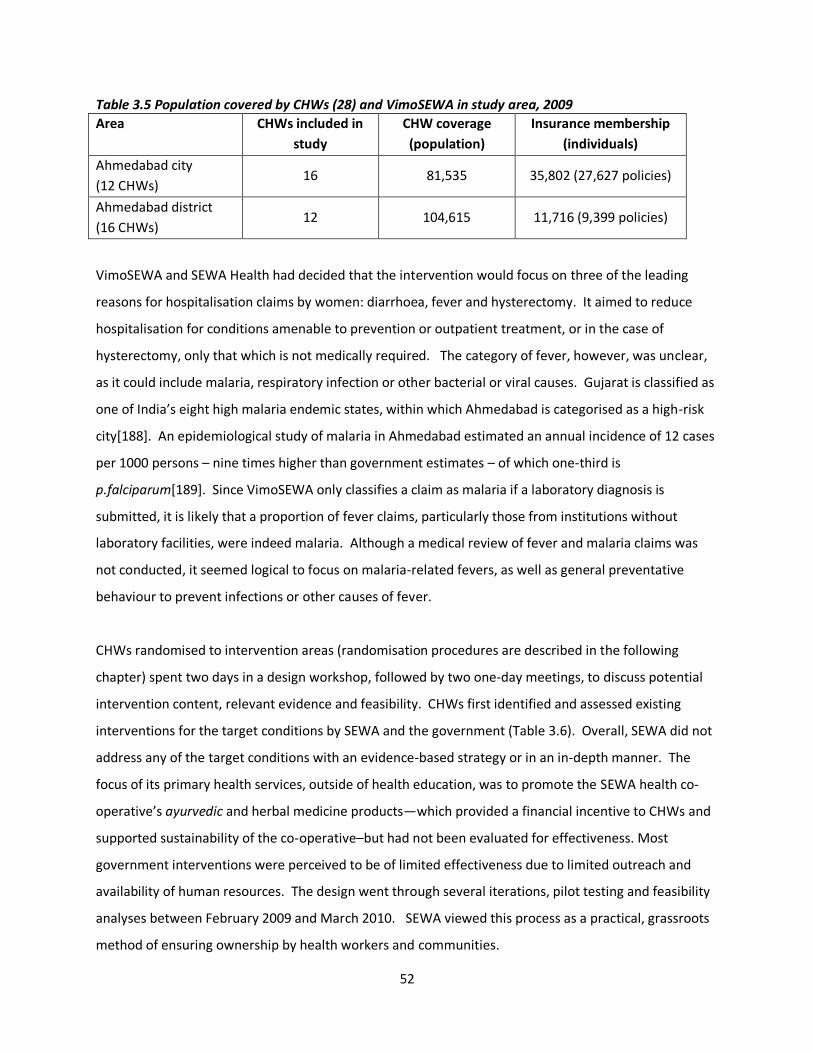
52
Table 3.5 Population covered by CHWs (28) and VimoSEWA in study area, 2009
Area CHWs included in
study
CHW coverage
(population)
Insurance membership
(individuals)
Ahmedabad city
(12 CHWs) 16 81,535 35,802 (27,627 policies)
Ahmedabad district
(16 CHWs) 12 104,615 11,716 (9,399 policies)
VimoSEWA and SEWA Health had decided that the intervention would focus on three of the leading
reasons for hospitalisation claims by women: diarrhoea, fever and hysterectomy. It aimed to reduce
hospitalisation for conditions amenable to prevention or outpatient treatment, or in the case of
hysterectomy, only that which is not medically required. The category of fever, however, was unclear,
as it could include malaria, respiratory infection or other bacterial or viral causes. Gujarat is classified as
one of India’s eight high malaria endemic states, within which Ahmedabad is categorised as a high-risk
city[188]. An epidemiological study of malaria in Ahmedabad estimated an annual incidence of 12 cases
per 1000 persons – nine times higher than government estimates – of which one-third is
p.falciparum[189]. Since VimoSEWA only classifies a claim as malaria if a laboratory diagnosis is
submitted, it is likely that a proportion of fever claims, particularly those from institutions without
laboratory facilities, were indeed malaria. Although a medical review of fever and malaria claims was
not conducted, it seemed logical to focus on malaria-related fevers, as well as general preventative
behaviour to prevent infections or other causes of fever.
CHWs randomised to intervention areas (randomisation procedures are described in the following
chapter) spent two days in a design workshop, followed by two one-day meetings, to discuss potential
intervention content, relevant evidence and feasibility. CHWs first identified and assessed existing
interventions for the target conditions by SEWA and the government (Table 3.6). Overall, SEWA did not
address any of the target conditions with an evidence-based strategy or in an in-depth manner. The
focus of its primary health services, outside of health education, was to promote the SEWA health co-
operative’s ayurvedic and herbal medicine products—which provided a financial incentive to CHWs and
supported sustainability of the co-operative–but had not been evaluated for effectiveness. Most
government interventions were perceived to be of limited effectiveness due to limited outreach and
availability of human resources. The design went through several iterations, pilot testing and feasibility
analyses between February 2009 and March 2010. SEWA viewed this process as a practical, grassroots
method of ensuring ownership by health workers and communities.
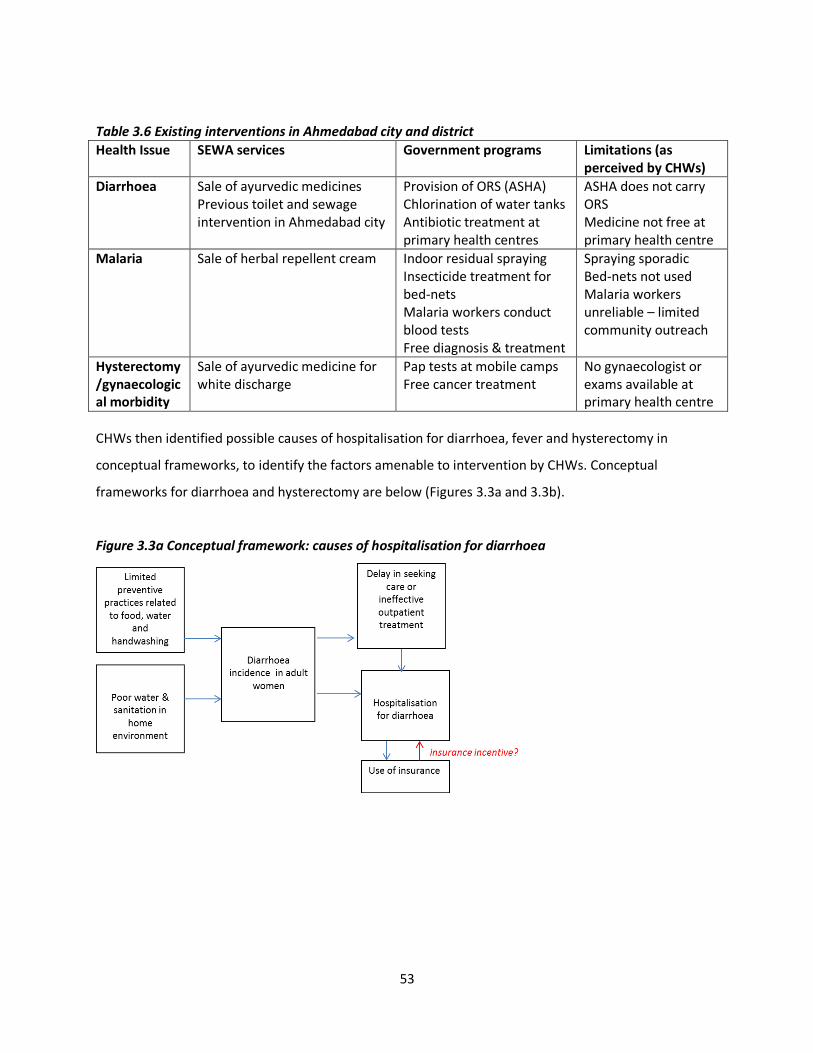
53
Table 3.6 Existing interventions in Ahmedabad city and district
Health Issue SEWA services Government programs Limitations (as perceived by CHWs)
Diarrhoea
Sale of ayurvedic medicines Previous toilet and sewage intervention in Ahmedabad city
Provision of ORS (ASHA) Chlorination of water tanks Antibiotic treatment at primary health centres
ASHA does not carry ORS Medicine not free at primary health centre
Malaria
Sale of herbal repellent cream Indoor residual spraying Insecticide treatment for bed-nets Malaria workers conduct blood tests Free diagnosis & treatment
Spraying sporadic Bed-nets not used Malaria workers unreliable – limited community outreach
Hysterectomy /gynaecological morbidity
Sale of ayurvedic medicine for white discharge
Pap tests at mobile camps Free cancer treatment
No gynaecologist or exams available at primary health centre
CHWs then identified possible causes of hospitalisation for diarrhoea, fever and hysterectomy in
conceptual frameworks, to identify the factors amenable to intervention by CHWs. Conceptual
frameworks for diarrhoea and hysterectomy are below (Figures 3.3a and 3.3b).
Figure 3.3a Conceptual framework: causes of hospitalisation for diarrhoea
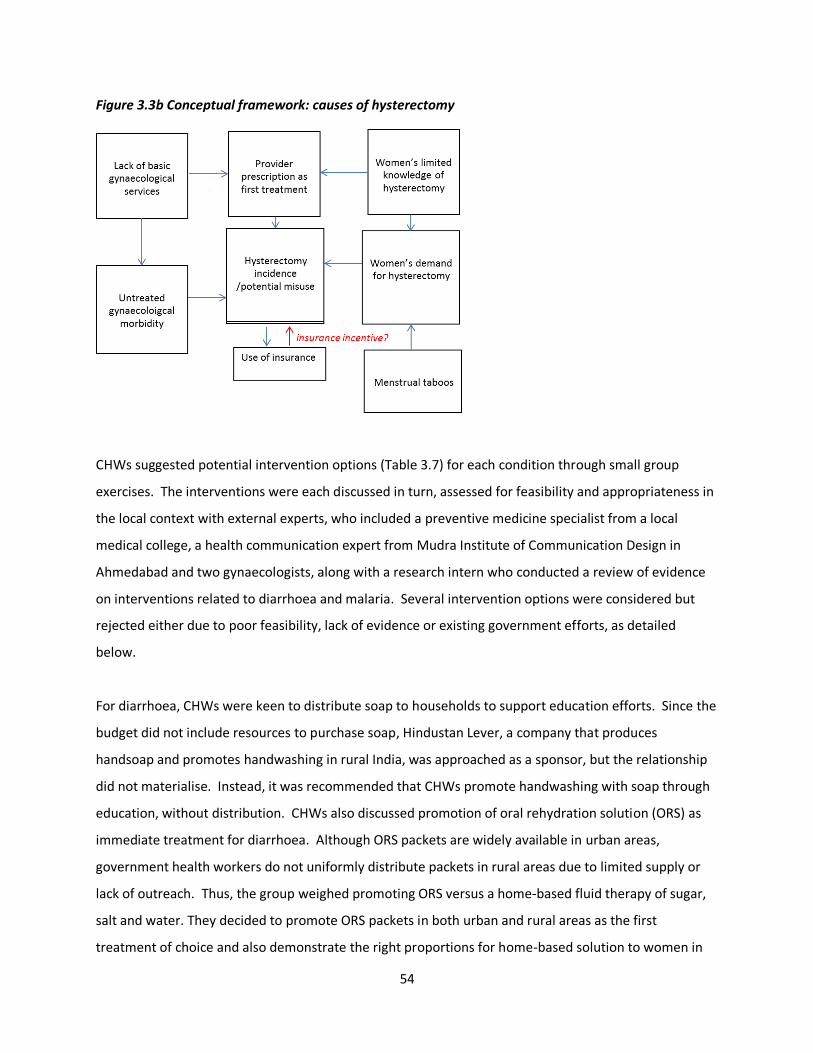
54
Figure 3.3b Conceptual framework: causes of hysterectomy
CHWs suggested potential intervention options (Table 3.7) for each condition through small group
exercises. The interventions were each discussed in turn, assessed for feasibility and appropriateness in
the local context with external experts, who included a preventive medicine specialist from a local
medical college, a health communication expert from Mudra Institute of Communication Design in
Ahmedabad and two gynaecologists, along with a research intern who conducted a review of evidence
on interventions related to diarrhoea and malaria. Several intervention options were considered but
rejected either due to poor feasibility, lack of evidence or existing government efforts, as detailed
below.
For diarrhoea, CHWs were keen to distribute soap to households to support education efforts. Since the
budget did not include resources to purchase soap, Hindustan Lever, a company that produces
handsoap and promotes handwashing in rural India, was approached as a sponsor, but the relationship
did not materialise. Instead, it was recommended that CHWs promote handwashing with soap through
education, without distribution. CHWs also discussed promotion of oral rehydration solution (ORS) as
immediate treatment for diarrhoea. Although ORS packets are widely available in urban areas,
government health workers do not uniformly distribute packets in rural areas due to limited supply or
lack of outreach. Thus, the group weighed promoting ORS versus a home-based fluid therapy of sugar,
salt and water. They decided to promote ORS packets in both urban and rural areas as the first
treatment of choice and also demonstrate the right proportions for home-based solution to women in
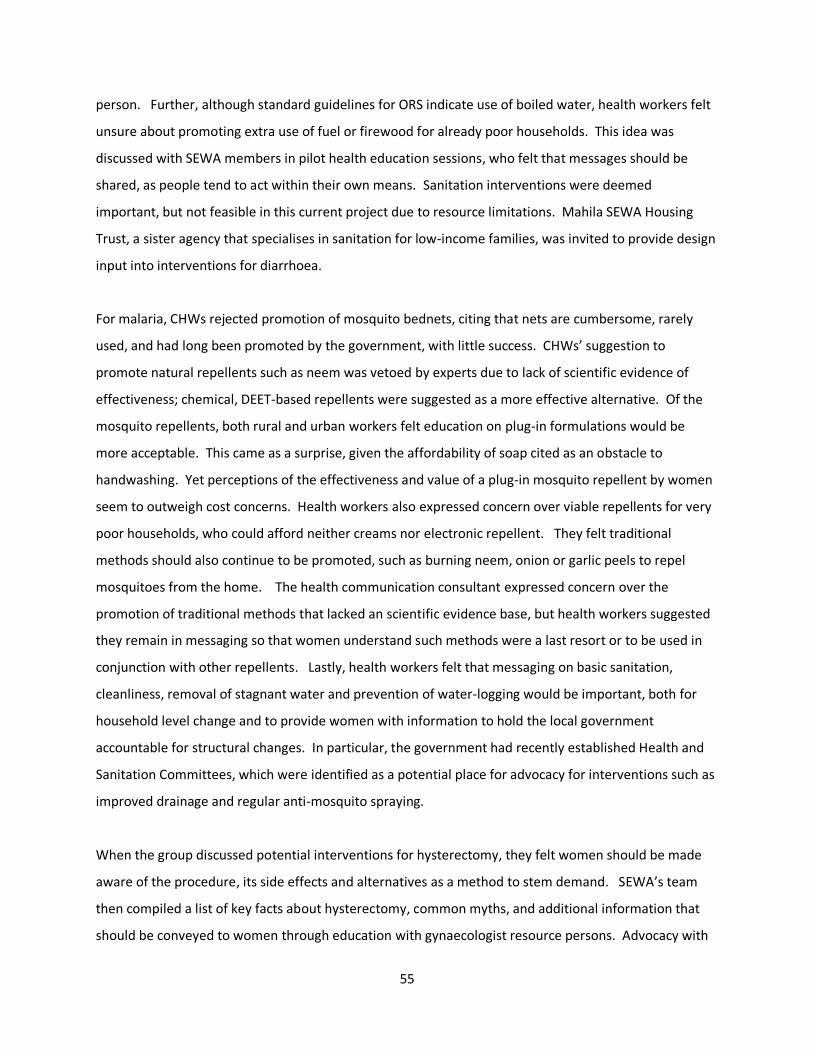
55
person. Further, although standard guidelines for ORS indicate use of boiled water, health workers felt
unsure about promoting extra use of fuel or firewood for already poor households. This idea was
discussed with SEWA members in pilot health education sessions, who felt that messages should be
shared, as people tend to act within their own means. Sanitation interventions were deemed
important, but not feasible in this current project due to resource limitations. Mahila SEWA Housing
Trust, a sister agency that specialises in sanitation for low-income families, was invited to provide design
input into interventions for diarrhoea.
For malaria, CHWs rejected promotion of mosquito bednets, citing that nets are cumbersome, rarely
used, and had long been promoted by the government, with little success. CHWs’ suggestion to
promote natural repellents such as neem was vetoed by experts due to lack of scientific evidence of
effectiveness; chemical, DEET-based repellents were suggested as a more effective alternative. Of the
mosquito repellents, both rural and urban workers felt education on plug-in formulations would be
more acceptable. This came as a surprise, given the affordability of soap cited as an obstacle to
handwashing. Yet perceptions of the effectiveness and value of a plug-in mosquito repellent by women
seem to outweigh cost concerns. Health workers also expressed concern over viable repellents for very
poor households, who could afford neither creams nor electronic repellent. They felt traditional
methods should also continue to be promoted, such as burning neem, onion or garlic peels to repel
mosquitoes from the home. The health communication consultant expressed concern over the
promotion of traditional methods that lacked an scientific evidence base, but health workers suggested
they remain in messaging so that women understand such methods were a last resort or to be used in
conjunction with other repellents. Lastly, health workers felt that messaging on basic sanitation,
cleanliness, removal of stagnant water and prevention of water-logging would be important, both for
household level change and to provide women with information to hold the local government
accountable for structural changes. In particular, the government had recently established Health and
Sanitation Committees, which were identified as a potential place for advocacy for interventions such as
improved drainage and regular anti-mosquito spraying.
When the group discussed potential interventions for hysterectomy, they felt women should be made
aware of the procedure, its side effects and alternatives as a method to stem demand. SEWA’s team
then compiled a list of key facts about hysterectomy, common myths, and additional information that
should be conveyed to women through education with gynaecologist resource persons. Advocacy with
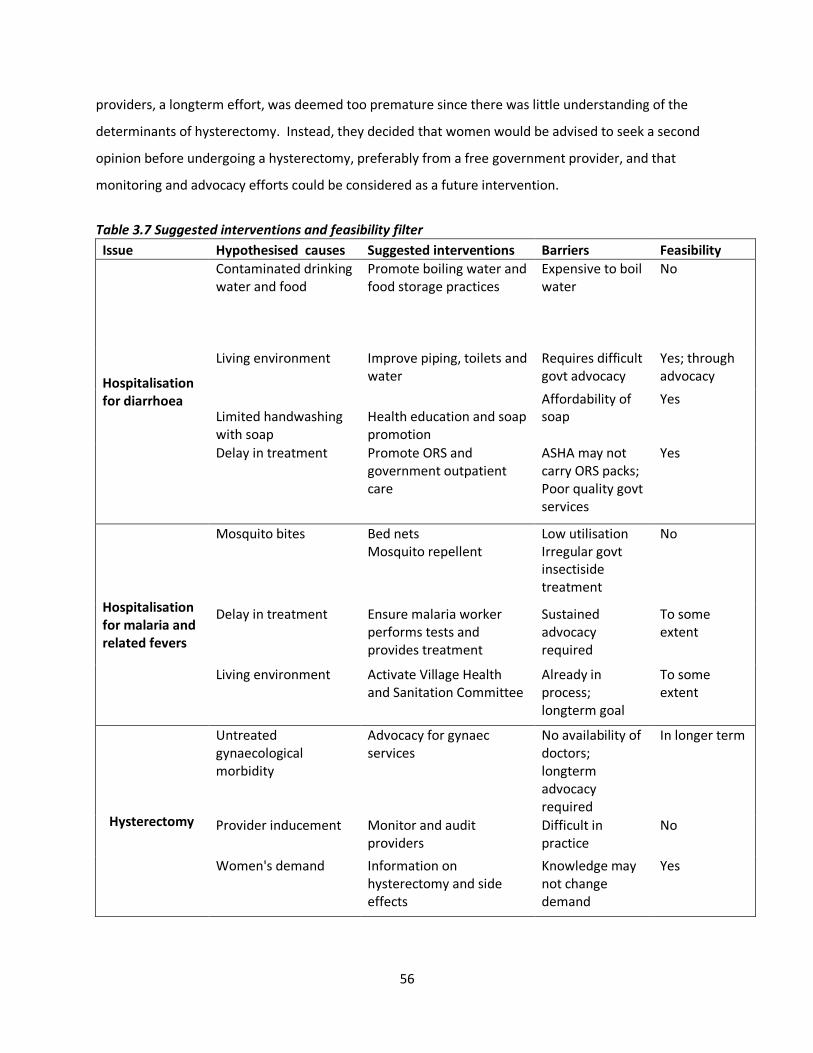
56
providers, a longterm effort, was deemed too premature since there was little understanding of the
determinants of hysterectomy. Instead, they decided that women would be advised to seek a second
opinion before undergoing a hysterectomy, preferably from a free government provider, and that
monitoring and advocacy efforts could be considered as a future intervention.
Table 3.7 Suggested interventions and feasibility filter
Issue Hypothesised causes Suggested interventions Barriers Feasibility
Hospitalisation for diarrhoea
Contaminated drinking water and food
Promote boiling water and food storage practices
Expensive to boil water
No
Living environment Improve piping, toilets and water
Requires difficult govt advocacy
Yes; through advocacy
Limited handwashing with soap
Health education and soap promotion
Affordability of soap
Yes
Delay in treatment Promote ORS and government outpatient care
ASHA may not carry ORS packs; Poor quality govt services
Yes
Hospitalisation for malaria and related fevers
Mosquito bites Bed nets Mosquito repellent
Low utilisation Irregular govt insectiside treatment
No
Delay in treatment Ensure malaria worker performs tests and provides treatment
Sustained advocacy required
To some extent
Living environment Activate Village Health and Sanitation Committee
Already in process; longterm goal
To some extent
Hysterectomy
Untreated gynaecological morbidity
Advocacy for gynaec services
No availability of doctors; longterm advocacy required
In longer term
Provider inducement Monitor and audit providers
Difficult in practice
No
Women's demand Information on hysterectomy and side effects
Knowledge may not change demand
Yes
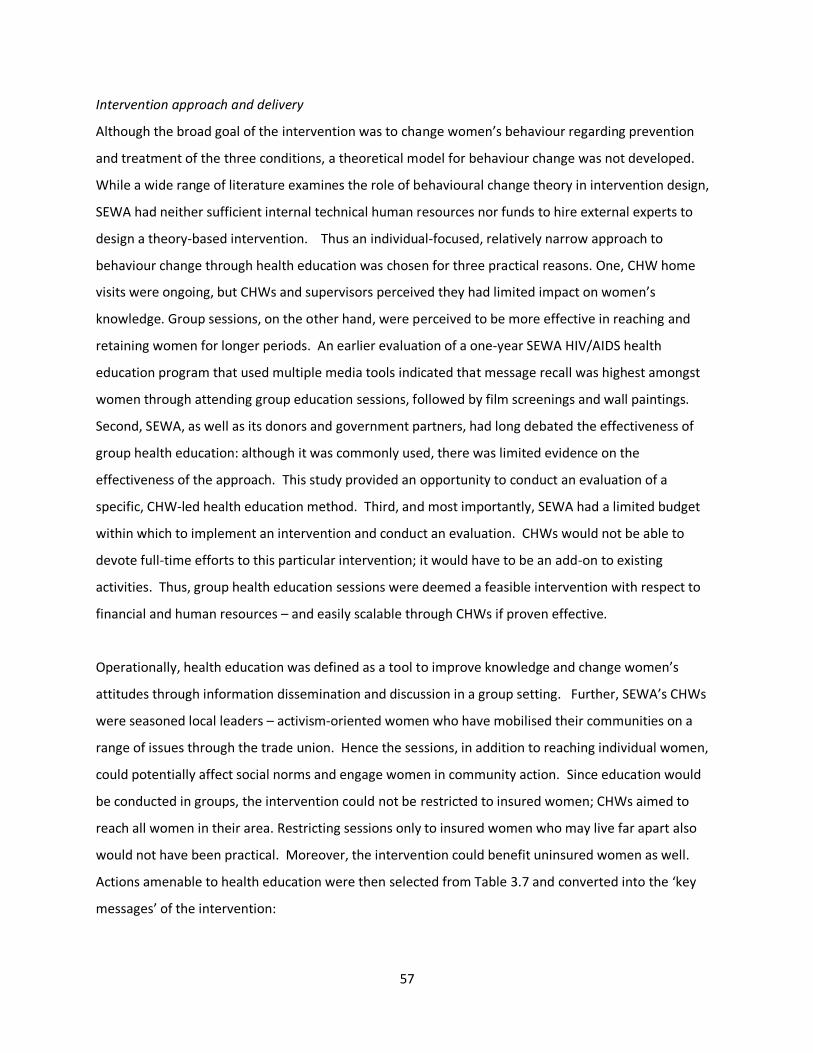
57
Intervention approach and delivery
Although the broad goal of the intervention was to change women’s behaviour regarding prevention
and treatment of the three conditions, a theoretical model for behaviour change was not developed.
While a wide range of literature examines the role of behavioural change theory in intervention design,
SEWA had neither sufficient internal technical human resources nor funds to hire external experts to
design a theory-based intervention. Thus an individual-focused, relatively narrow approach to
behaviour change through health education was chosen for three practical reasons. One, CHW home
visits were ongoing, but CHWs and supervisors perceived they had limited impact on women’s
knowledge. Group sessions, on the other hand, were perceived to be more effective in reaching and
retaining women for longer periods. An earlier evaluation of a one-year SEWA HIV/AIDS health
education program that used multiple media tools indicated that message recall was highest amongst
women through attending group education sessions, followed by film screenings and wall paintings.
Second, SEWA, as well as its donors and government partners, had long debated the effectiveness of
group health education: although it was commonly used, there was limited evidence on the
effectiveness of the approach. This study provided an opportunity to conduct an evaluation of a
specific, CHW-led health education method. Third, and most importantly, SEWA had a limited budget
within which to implement an intervention and conduct an evaluation. CHWs would not be able to
devote full-time efforts to this particular intervention; it would have to be an add-on to existing
activities. Thus, group health education sessions were deemed a feasible intervention with respect to
financial and human resources – and easily scalable through CHWs if proven effective.
Operationally, health education was defined as a tool to improve knowledge and change women’s
attitudes through information dissemination and discussion in a group setting. Further, SEWA’s CHWs
were seasoned local leaders – activism-oriented women who have mobilised their communities on a
range of issues through the trade union. Hence the sessions, in addition to reaching individual women,
could potentially affect social norms and engage women in community action. Since education would
be conducted in groups, the intervention could not be restricted to insured women; CHWs aimed to
reach all women in their area. Restricting sessions only to insured women who may live far apart also
would not have been practical. Moreover, the intervention could benefit uninsured women as well.
Actions amenable to health education were then selected from Table 3.7 and converted into the ‘key
messages’ of the intervention:
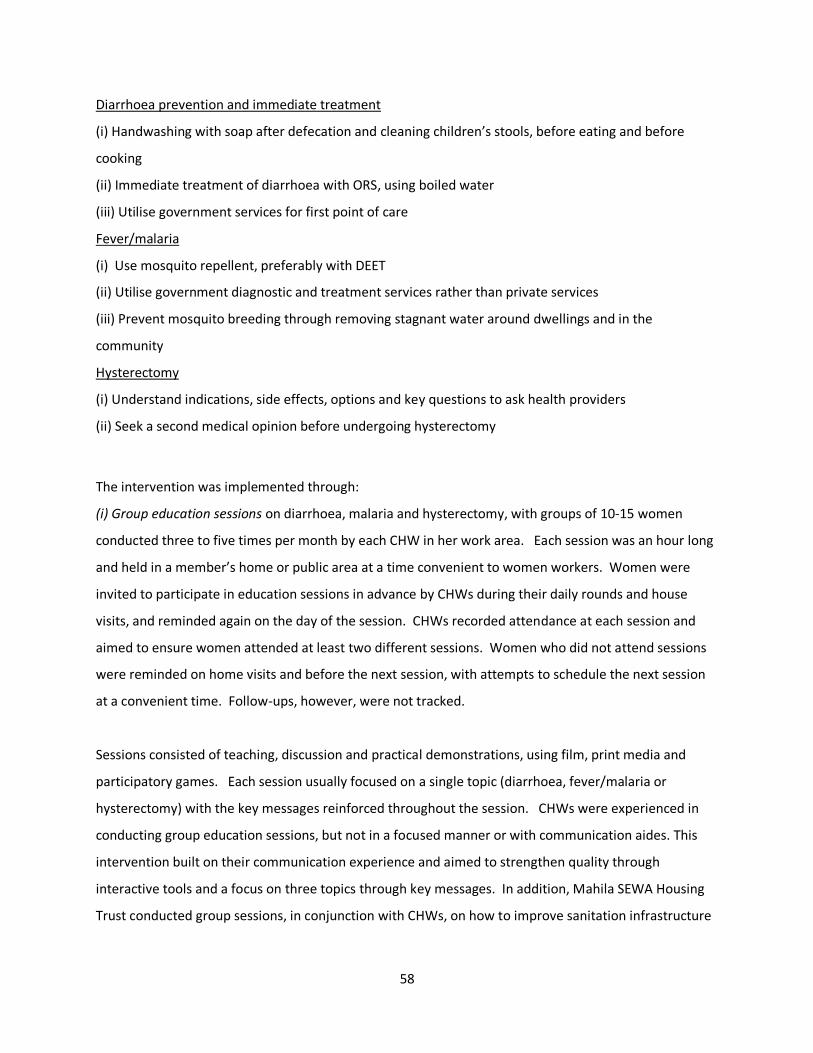
58
Diarrhoea prevention and immediate treatment
(i) Handwashing with soap after defecation and cleaning children’s stools, before eating and before
cooking
(ii) Immediate treatment of diarrhoea with ORS, using boiled water
(iii) Utilise government services for first point of care
Fever/malaria
(i) Use mosquito repellent, preferably with DEET
(ii) Utilise government diagnostic and treatment services rather than private services
(iii) Prevent mosquito breeding through removing stagnant water around dwellings and in the
community
Hysterectomy
(i) Understand indications, side effects, options and key questions to ask health providers
(ii) Seek a second medical opinion before undergoing hysterectomy
The intervention was implemented through:
(i) Group education sessions on diarrhoea, malaria and hysterectomy, with groups of 10-15 women
conducted three to five times per month by each CHW in her work area. Each session was an hour long
and held in a member’s home or public area at a time convenient to women workers. Women were
invited to participate in education sessions in advance by CHWs during their daily rounds and house
visits, and reminded again on the day of the session. CHWs recorded attendance at each session and
aimed to ensure women attended at least two different sessions. Women who did not attend sessions
were reminded on home visits and before the next session, with attempts to schedule the next session
at a convenient time. Follow-ups, however, were not tracked.
Sessions consisted of teaching, discussion and practical demonstrations, using film, print media and
participatory games. Each session usually focused on a single topic (diarrhoea, fever/malaria or
hysterectomy) with the key messages reinforced throughout the session. CHWs were experienced in
conducting group education sessions, but not in a focused manner or with communication aides. This
intervention built on their communication experience and aimed to strengthen quality through
interactive tools and a focus on three topics through key messages. In addition, Mahila SEWA Housing
Trust conducted group sessions, in conjunction with CHWs, on how to improve sanitation infrastructure
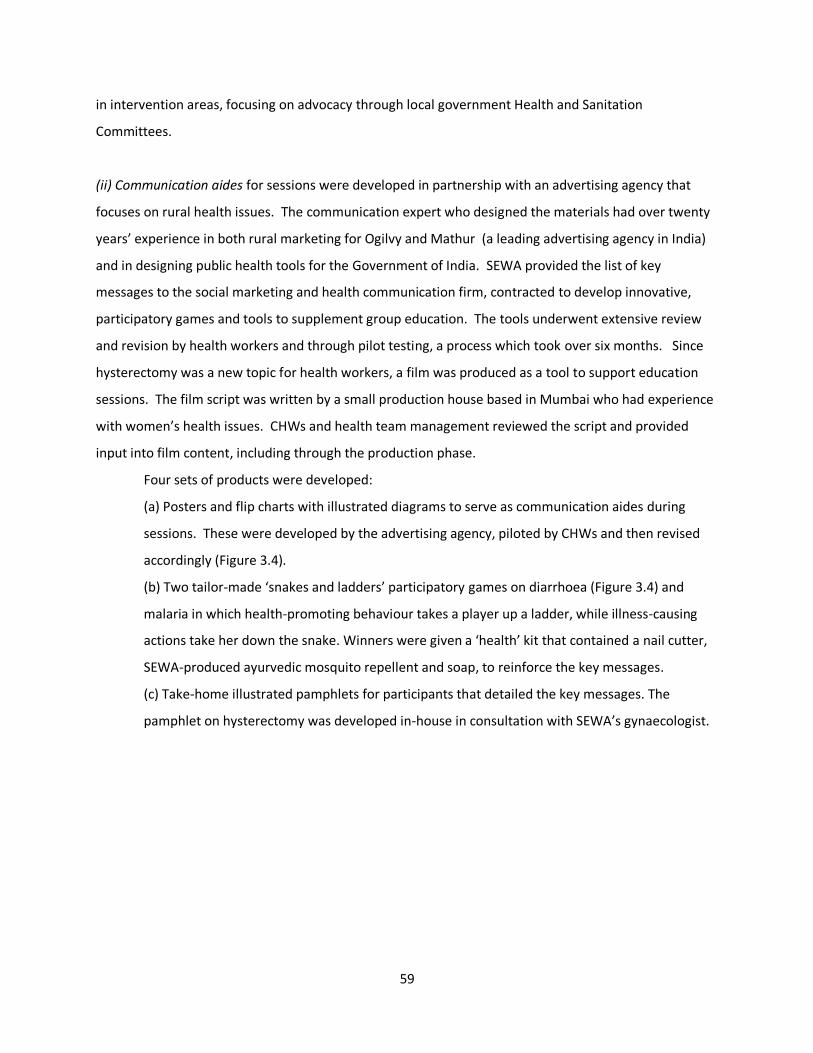
59
in intervention areas, focusing on advocacy through local government Health and Sanitation
Committees.
(ii) Communication aides for sessions were developed in partnership with an advertising agency that
focuses on rural health issues. The communication expert who designed the materials had over twenty
years’ experience in both rural marketing for Ogilvy and Mathur (a leading advertising agency in India)
and in designing public health tools for the Government of India. SEWA provided the list of key
messages to the social marketing and health communication firm, contracted to develop innovative,
participatory games and tools to supplement group education. The tools underwent extensive review
and revision by health workers and through pilot testing, a process which took over six months. Since
hysterectomy was a new topic for health workers, a film was produced as a tool to support education
sessions. The film script was written by a small production house based in Mumbai who had experience
with women’s health issues. CHWs and health team management reviewed the script and provided
input into film content, including through the production phase.
Four sets of products were developed:
(a) Posters and flip charts with illustrated diagrams to serve as communication aides during
sessions. These were developed by the advertising agency, piloted by CHWs and then revised
accordingly (Figure 3.4).
(b) Two tailor-made ‘snakes and ladders’ participatory games on diarrhoea (Figure 3.4) and
malaria in which health-promoting behaviour takes a player up a ladder, while illness-causing
actions take her down the snake. Winners were given a ‘health’ kit that contained a nail cutter,
SEWA-produced ayurvedic mosquito repellent and soap, to reinforce the key messages.
(c) Take-home illustrated pamphlets for participants that detailed the key messages. The
pamphlet on hysterectomy was developed in-house in consultation with SEWA’s gynaecologist.
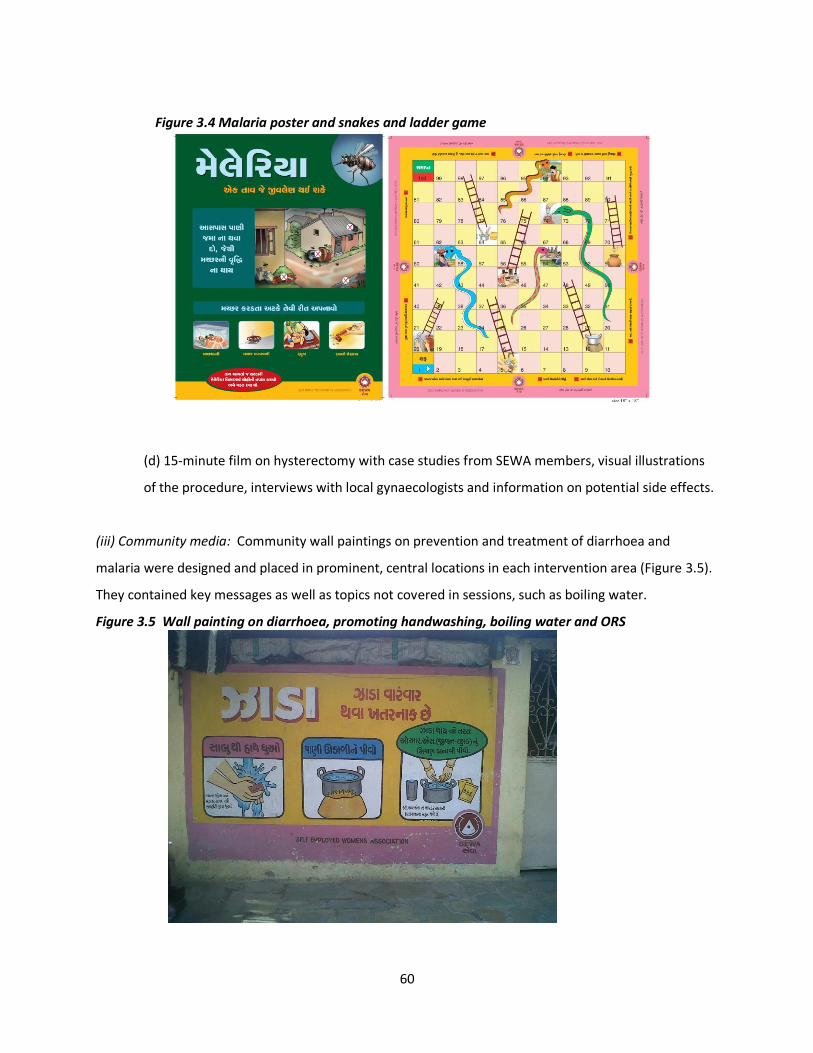
60
Figure 3.4 Malaria poster and snakes and ladder game
(d) 15-minute film on hysterectomy with case studies from SEWA members, visual illustrations
of the procedure, interviews with local gynaecologists and information on potential side effects.
(iii) Community media: Community wall paintings on prevention and treatment of diarrhoea and
malaria were designed and placed in prominent, central locations in each intervention area (Figure 3.5).
They contained key messages as well as topics not covered in sessions, such as boiling water.
Figure 3.5 Wall painting on diarrhoea, promoting handwashing, boiling water and ORS
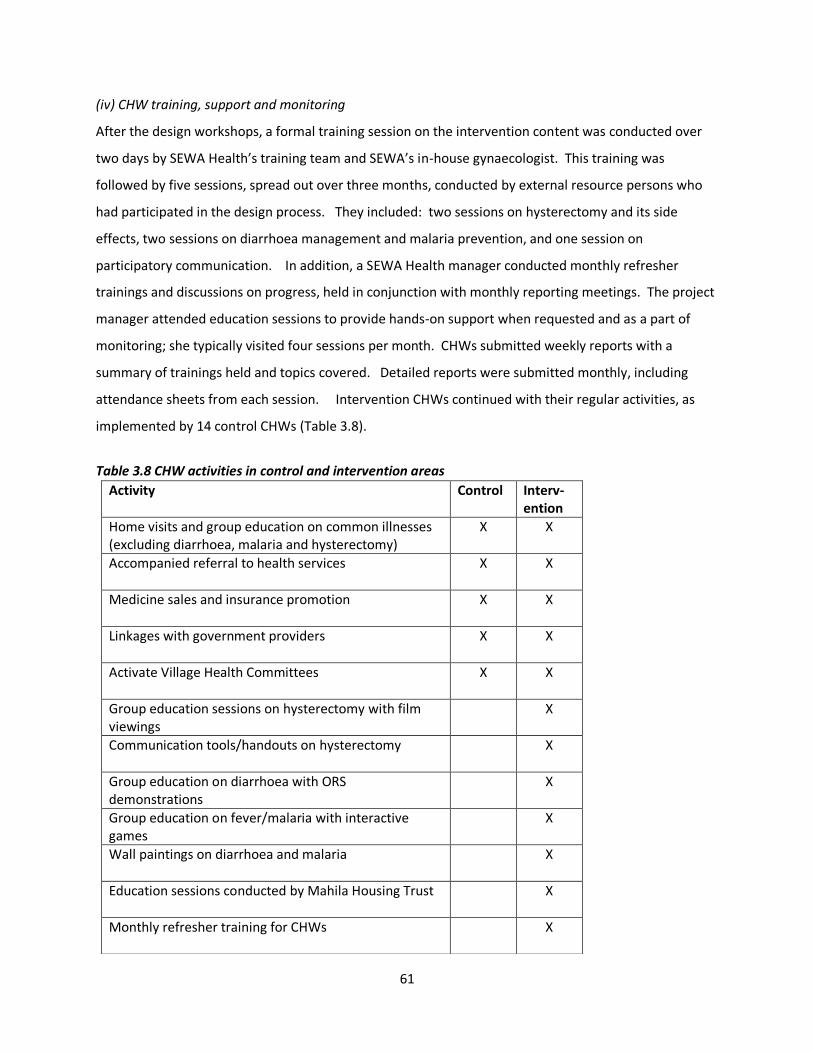
61
(iv) CHW training, support and monitoring
After the design workshops, a formal training session on the intervention content was conducted over
two days by SEWA Health’s training team and SEWA’s in-house gynaecologist. This training was
followed by five sessions, spread out over three months, conducted by external resource persons who
had participated in the design process. They included: two sessions on hysterectomy and its side
effects, two sessions on diarrhoea management and malaria prevention, and one session on
participatory communication. In addition, a SEWA Health manager conducted monthly refresher
trainings and discussions on progress, held in conjunction with monthly reporting meetings. The project
manager attended education sessions to provide hands-on support when requested and as a part of
monitoring; she typically visited four sessions per month. CHWs submitted weekly reports with a
summary of trainings held and topics covered. Detailed reports were submitted monthly, including
attendance sheets from each session. Intervention CHWs continued with their regular activities, as
implemented by 14 control CHWs (Table 3.8).
Table 3.8 CHW activities in control and intervention areas
Activity Control Interv-ention
Home visits and group education on common illnesses (excluding diarrhoea, malaria and hysterectomy)
X X
Accompanied referral to health services X X
Medicine sales and insurance promotion X X
Linkages with government providers X X
Activate Village Health Committees X X
Group education sessions on hysterectomy with film viewings
X
Communication tools/handouts on hysterectomy X
Group education on diarrhoea with ORS demonstrations
X
Group education on fever/malaria with interactive games
X
Wall paintings on diarrhoea and malaria X
Education sessions conducted by Mahila Housing Trust X
Monthly refresher training for CHWs X
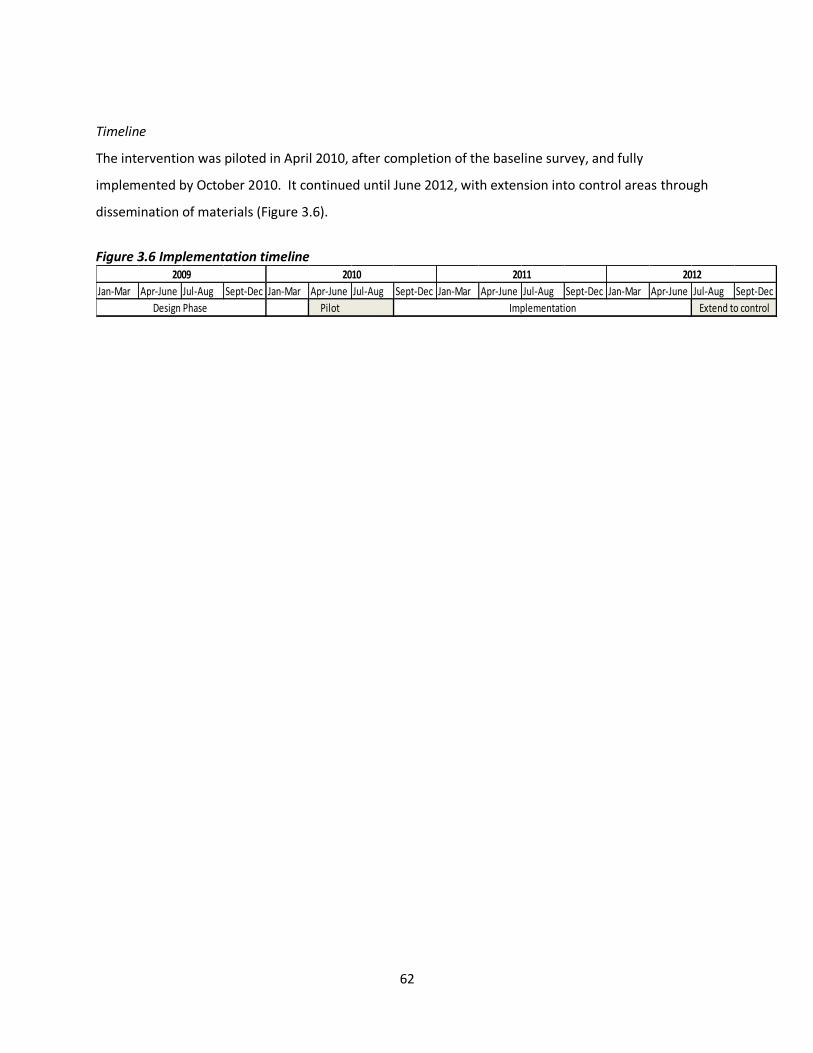
62
Timeline
The intervention was piloted in April 2010, after completion of the baseline survey, and fully
implemented by October 2010. It continued until June 2012, with extension into control areas through
dissemination of materials (Figure 3.6).
Figure 3.6 Implementation timeline
Jan-Mar Apr-June Jul-Aug Sept-Dec Jan-Mar Apr-June Jul-Aug Sept-Dec Jan-Mar Apr-June Jul-Aug Sept-Dec Jan-Mar Apr-June Jul-Aug Sept-Dec
Pilot
2012
Implementation Extend to control
2009 2010 2011
Design Phase
63
Chapter IV. Research Methods
This chapter details the methodological approaches utilised for each study. Section I details the design
of the trial and methods used for the trial analysis, which follows the CONSORT guidelines for reporting
on cluster randomised trials[190]. Section II describes the methods utilised for an in-depth investigation
of hysterectomy, which included qualitative exploration of influences on women’s decisions and a
mixed-methods analysis of predictors of hysterectomy. Section III describes the methods employed for
the intervention process evaluation, followed by reporting of procedures followed regarding ethics and
informed consent.
I. Intervention evaluation
Overview of trial design
The evaluation utilised a cluster randomised design to assess the effect of the health education
intervention. The intervention was implemented by CHWs in their communities through primarily group
outreach activities; contamination would likely have resulted if the intervention had been randomised to
individual women in the same CHW catchment area. Further, some components of the education
intervention, such as wall paintings and posters, were implemented at the community level and could
not be randomised to individuals. Accordingly, the chosen unit of randomisation was the CHW.
Clusters were defined as each CHW’s discrete geographical outreach area. CHWs serve three to five
villages in rural areas and two to five slum pockets in urban Ahmedabad. Catchment areas did not
overlap between CHWs. The evaluation utilised a cohort design to measure the impact of the
intervention.
Eligibility of clusters
Clusters were considered for inclusion in the trial if a SEWA CHW already served the area and
VimoSEWA’s insurance programme had insured at least 30 women in the past year. All 28 CHWs who
work in Ahmedabad city (12) and two rural blocks of Ahmedabad district (16) were included in the trial.
Although an additional ten rural SEWA CHWs were available, they were excluded due to limited
VimoSEWA coverage in their areas.
64
Interventions
As detailed in Chapter III, the interventions consisted of health education sessions on fever, diarrhoea
and hysterectomy delivered by CHWs to insured and uninsured women in a group setting, use of
community media tools, education on government sanitation programs and training sessions for CHWs.
CHWs in control areas continued with ongoing activities, which included home visits, referral services
and linkages with government health services.
Outcome measures
(i) The primary outcome – claims submission for diarrhoea, fever and hysterectomy – was measured by
the claim rate for the three conditions using SEWA’s claim database (see below): n claims/person time
insured.
(ii) Reported hospitalisation amongst insured and uninsured women for the three conditions was
measured through four rounds of a household survey (see below): n hospitalisations/person-time.
(iii) Reported morbidity related to fever, diarrhoea and gynaecological ailments amongst insured and
uninsured women was measured through four rounds of a household survey (see below): n
episodes/person-time.
(iv) Out-of-pocket expenditure related to hospitalisation and morbidity episodes for the three conditions
was measured through four rounds of a household survey (see below): n rupees/episode.
Sample size and study power
The number of clusters included in the trial, 28 in total, was determined by the number of CHWs
available in areas where VimoSEWA operates. For the study’s primary outcome, claims submissions, all
claims submitted in the study area would be utilised. To determine the minimum effect size that the
study would be able to detect, VimoSEWA’s CEO and the study advisor, a health economist, considered
the financial implications of a potential reduction in claims on the claims ratio and operating budget. A
non-profit organisation, VimoSEWA was committed to financial sustainability without donor support.
Thus if there were evidence of an intervention effect, VimoSEWA would have to invest the resources to
sustain the health education intervention as part of its operations. Taking into account its financial
constraints, VimoSEWA defined a minimum intervention effect of 30-40% reduction in claims for the
three conditions. A lower reduction would not have generated sufficient resources to sustain or justify
the operational costs of a health intervention aimed at reducing claims.
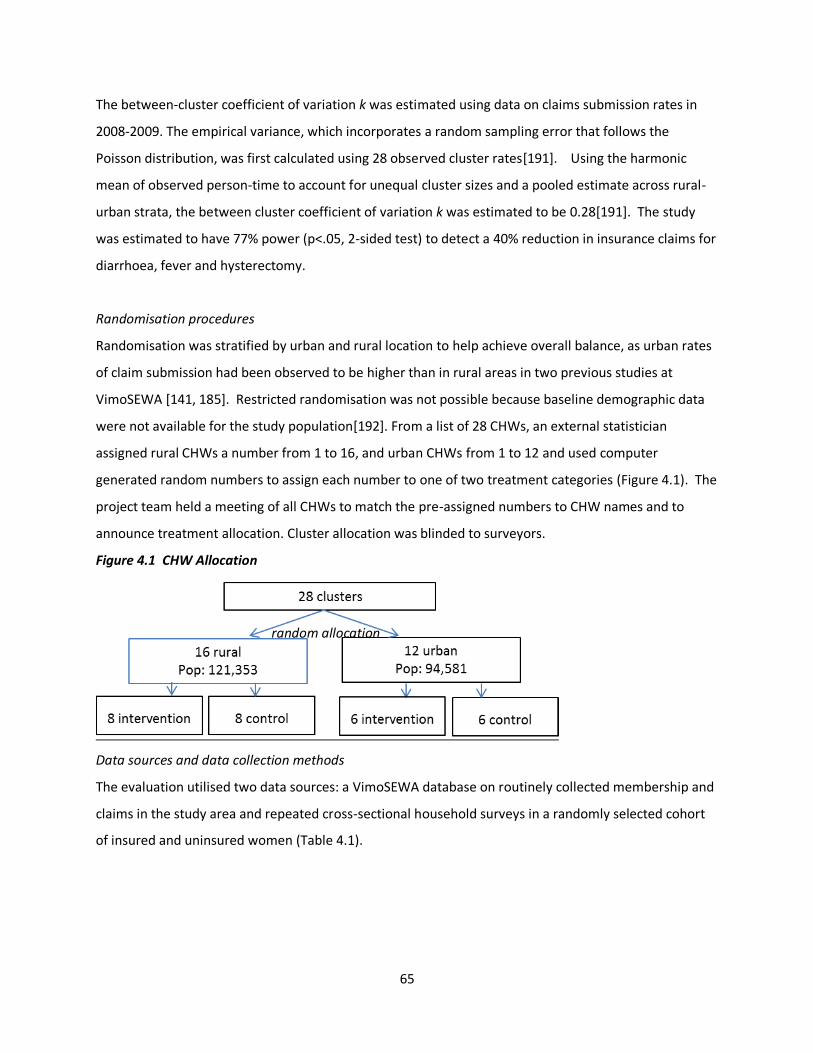
65
random allocation
The between-cluster coefficient of variation k was estimated using data on claims submission rates in
2008-2009. The empirical variance, which incorporates a random sampling error that follows the
Poisson distribution, was first calculated using 28 observed cluster rates[191]. Using the harmonic
mean of observed person-time to account for unequal cluster sizes and a pooled estimate across rural-
urban strata, the between cluster coefficient of variation k was estimated to be 0.28[191]. The study
was estimated to have 77% power (p<.05, 2-sided test) to detect a 40% reduction in insurance claims for
diarrhoea, fever and hysterectomy.
Randomisation procedures
Randomisation was stratified by urban and rural location to help achieve overall balance, as urban rates
of claim submission had been observed to be higher than in rural areas in two previous studies at
VimoSEWA [141, 185]. Restricted randomisation was not possible because baseline demographic data
were not available for the study population[192]. From a list of 28 CHWs, an external statistician
assigned rural CHWs a number from 1 to 16, and urban CHWs from 1 to 12 and used computer
generated random numbers to assign each number to one of two treatment categories (Figure 4.1). The
project team held a meeting of all CHWs to match the pre-assigned numbers to CHW names and to
announce treatment allocation. Cluster allocation was blinded to surveyors.
Figure 4.1 CHW Allocation
Data sources and data collection methods
The evaluation utilised two data sources: a VimoSEWA database on routinely collected membership and
claims in the study area and repeated cross-sectional household surveys in a randomly selected cohort
of insured and uninsured women (Table 4.1).
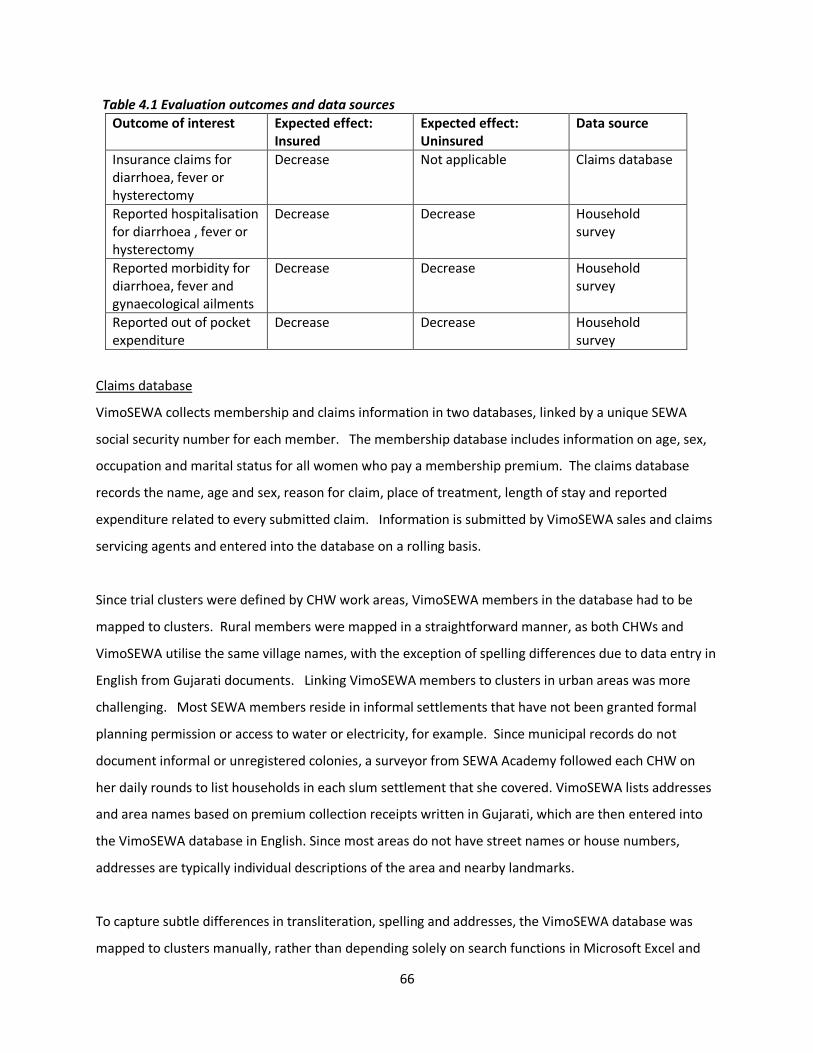
66
Table 4.1 Evaluation outcomes and data sources
Outcome of interest Expected effect: Insured
Expected effect: Uninsured
Data source
Insurance claims for diarrhoea, fever or hysterectomy
Decrease Not applicable Claims database
Reported hospitalisation for diarrhoea , fever or hysterectomy
Decrease Decrease Household survey
Reported morbidity for diarrhoea, fever and gynaecological ailments
Decrease Decrease Household survey
Reported out of pocket expenditure
Decrease Decrease Household survey
Claims database
VimoSEWA collects membership and claims information in two databases, linked by a unique SEWA
social security number for each member. The membership database includes information on age, sex,
occupation and marital status for all women who pay a membership premium. The claims database
records the name, age and sex, reason for claim, place of treatment, length of stay and reported
expenditure related to every submitted claim. Information is submitted by VimoSEWA sales and claims
servicing agents and entered into the database on a rolling basis.
Since trial clusters were defined by CHW work areas, VimoSEWA members in the database had to be
mapped to clusters. Rural members were mapped in a straightforward manner, as both CHWs and
VimoSEWA utilise the same village names, with the exception of spelling differences due to data entry in
English from Gujarati documents. Linking VimoSEWA members to clusters in urban areas was more
challenging. Most SEWA members reside in informal settlements that have not been granted formal
planning permission or access to water or electricity, for example. Since municipal records do not
document informal or unregistered colonies, a surveyor from SEWA Academy followed each CHW on
her daily rounds to list households in each slum settlement that she covered. VimoSEWA lists addresses
and area names based on premium collection receipts written in Gujarati, which are then entered into
the VimoSEWA database in English. Since most areas do not have street names or house numbers,
addresses are typically individual descriptions of the area and nearby landmarks.
To capture subtle differences in transliteration, spelling and addresses, the VimoSEWA database was
mapped to clusters manually, rather than depending solely on search functions in Microsoft Excel and
67
Stata. This was not always straightforward. For example, Ayesha, an urban CHW, was listed by a
surveyor as covering parts of Rahikyal, a large area which includes dozens of slum settlements, one of
which is Nura Ni Chali (Nura street). A VimoSEWA member was listed in the VimoSEWA database with
the address Nurani Chowk (Nura intersection/square) in Rakhial (spelled without a y). Nurani Chowk is
at the end of the street by the same name, and women who live there were also part of Ayesha’s
cluster, despite not being listed as residents of Nura Ni Chali. To limit such errors, I involved VimoSEWA
workers and CHWs in the matching process and relied on my own previous knowledge from having
implemented community health programs in Ahmedabad City.
The baseline analysis utilised all membership data and submitted claims for a pre-intervention period
from January 2009 to May 2010. All claims submitted from September 2010 till February 2012 were
included in the intervention analysis, allowing for a three month start-up period after the intervention
began in June 2010.
Household surveys
Household surveys were conducted to i) collect information on demographic characteristics of the study
population ii) include uninsured women in the intervention evaluation and iii) collect information from
women on morbidity and treatment-seeking behaviour in the past month, and hospitalisations in the
past six months. A baseline survey was conducted from January to March 2010, followed by three
survey rounds at six-month intervals following implementation of the intervention. The survey
instrument can be found in Annex 3.
For the household survey, sample size of the study cohort was determined based on the coefficient of
between cluster variation estimated using claims data and budgetary considerations. A sample size of
35 uninsured and 35 insured households per each cluster was chosen – a total of 1,960 households
across 28 clusters. Insured and uninsured women were included in the household survey to enable the
investigation of predictors of insurance coverage and to investigate for evidence of effect modification
by insurance status. The study was estimated to have 74% power (p<.05, 2 sided test) to detect a 40%
reduction in hospitalisation for diarrhoea, fever and hysterectomy.
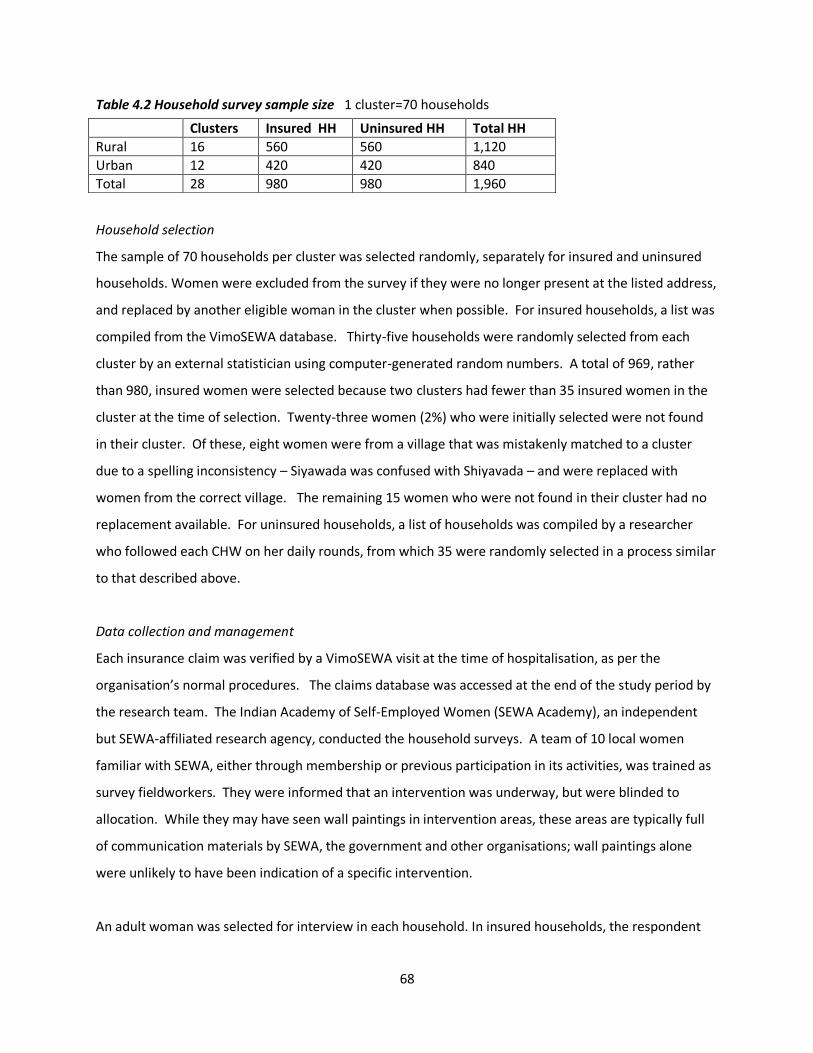
68
Table 4.2 Household survey sample size 1 cluster=70 households
Household selection
The sample of 70 households per cluster was selected randomly, separately for insured and uninsured
households. Women were excluded from the survey if they were no longer present at the listed address,
and replaced by another eligible woman in the cluster when possible. For insured households, a list was
compiled from the VimoSEWA database. Thirty-five households were randomly selected from each
cluster by an external statistician using computer-generated random numbers. A total of 969, rather
than 980, insured women were selected because two clusters had fewer than 35 insured women in the
cluster at the time of selection. Twenty-three women (2%) who were initially selected were not found
in their cluster. Of these, eight women were from a village that was mistakenly matched to a cluster
due to a spelling inconsistency – Siyawada was confused with Shiyavada – and were replaced with
women from the correct village. The remaining 15 women who were not found in their cluster had no
replacement available. For uninsured households, a list of households was compiled by a researcher
who followed each CHW on her daily rounds, from which 35 were randomly selected in a process similar
to that described above.
Data collection and management
Each insurance claim was verified by a VimoSEWA visit at the time of hospitalisation, as per the
organisation’s normal procedures. The claims database was accessed at the end of the study period by
the research team. The Indian Academy of Self-Employed Women (SEWA Academy), an independent
but SEWA-affiliated research agency, conducted the household surveys. A team of 10 local women
familiar with SEWA, either through membership or previous participation in its activities, was trained as
survey fieldworkers. They were informed that an intervention was underway, but were blinded to
allocation. While they may have seen wall paintings in intervention areas, these areas are typically full
of communication materials by SEWA, the government and other organisations; wall paintings alone
were unlikely to have been indication of a specific intervention.
An adult woman was selected for interview in each household. In insured households, the respondent
Clusters Insured HH Uninsured HH Total HH
Rural 16 560 560 1,120
Urban 12 420 420 840
Total 28 980 980 1,960
69
was the primary VimoSEWA policy holder. In uninsured households, the primary SEWA union member
or spouse of the male head of household was selected. Consent procedures are described in the next
section. Survey data were double-entered into a Microsoft Access database by SEWA Academy. A
supervisor observed a random sub-set of interviews and checked each survey form manually before
data entry. I performed internal consistency checks after each round using Stata 11, and sent queries to
the research agency for clarification/correction. Monitoring data was submitted monthly by CHWs;
reports included the number and topic of trainings conducted, with names of women who attended.
Summary data, excluding names, were entered in a database by SEWA’s health team. The project
managers attended a sub-set of intervention sessions and reviewed CHW reports monthly.
Statistical methods
Methods used are described separately for the baseline analysis and the analysis of the trial outcomes –
rates of claims, hospitalisation and morbidity – and the analysis of out of pocket expenditure. Statistical
analyses were performed using Stata 11.
(i) Baseline data
Data collected at baseline were first analysed to describe the study population. As this study was the
first time VimoSEWA had collected data on uninsured women in Ahmedabad city and district, insured
and uninsured women were compared to identify: (i) predictors of insurance coverage (ii) differences in
recent (30-day) morbidity and outpatient treatment-seeking behaviour and (iii) the association between
insurance coverage and hospitalisation. The svyset command was utilised to take into account the
cluster sampling and sampling weights for insured and uninsured households. Sampling weights were
calculated at cluster-level, as both the population size and insurance coverage varied by CHW work area.
Demographic and socioeconomic characteristics of insured and uninsured households were examined to
identify predictors of insurance coverage and factors that may be associated with differences in
treatment-seeking behaviour. Socioeconomic indicators (income, education, dwelling type, toilet,
drinking water access) were analysed separately rather than as a score derived using principal
components analysis, as some of these variables could be independently associated with morbidity or
hospitalisation. Although women workers in the informal economy typically engage in multiple income-
earning activities[175], only the respondent’s stated primary occupation was included in the analysis.
After examining unadjusted odds ratios calculated using logistic regression, multivariable logistic
70
regression was used to identify predictors of insurance status. Variables associated with (p<.05) or
those that could be theoretically associated with, insurance coverage were included. Results are
presented as adjusted odds ratios with 95% confidence intervals. Overall p-values for variables with
more than two levels were obtained using Wald tests. Urban and rural data were analysed separately in
the initial, crude analyses and then combined in multivariable analyses, with urban/rural location
formally tested for effect modification.
Data on recent morbidity and treatment-seeking were then compared between insured and uninsured
women. Recent morbidity was defined as any illness in the past month, to limit recall bias and to
capture home-based treatment or care sought in ambulatory facilities as accurately as possible. Self-
reported reasons for morbidity were categorised to the extent possible in the absence of clinical reports.
Given the large variety of illnesses and hence small category sizes, morbidity-related data are presented
as descriptive proportions. The association between current insurance coverage and hospitalisation,
defined as an inpatient admission for 24 hours or more in the past six months, was examined through
logistic regression. Multivariable logistic regression included variables associated with insurance
coverage and those considered to be associated with hospitalisation, both theoretically and through
examining crude odds ratios. The role of urban/rural location was examined through inspecting stratum-
specific odds ratios and formally tested for effect modification. Lastly, reasons for hospitalisation, type
of hospital and length of stay were presented to identify any differences between insured and uninsured
women.
(ii) Trial analysis
a) Baseline analysis
Analysis of the intervention effect on the primary outcome, claims rates for diarrhoea, fever and
hysterectomy, utilised the VimoSEWA membership and claims databases. Demographic characteristics
of members during a 17-month pre-intervention period were compared between the intervention and
control arms to identify imbalanced variables to include in the trial analysis. Claims for the three
conditions were tabulated by cluster, and claims rates per person year were calculated and compared
using both individual data and cluster-level means[193]. Unadjusted cluster level summary rates were
compared in urban and rural strata using an unpaired t-test, to assess if rates differed by location as in
previous analyses of VimoSEWA data. The distribution of baseline claims rates across 28 clusters was
examined for normality. As the claims rates were only slightly skewed, and three clusters had zero
71
claims, a log transformation was not applied. The coefficient of variation k was estimated using the
empirical variance of observed baseline claims rates and adjusting for random sampling error, for both
rural and urban strata[191].
Similar baseline analyses as described above were conducted using the household survey data. Since
women were selected into the survey sample based on insurance status, data are presented separately
for insured and uninsured women. Overall balance of the treatment arms was examined across a wider
range of demographic variables, as well hospitalisation and morbidity rates, amongst insured and
uninsured women. Baseline hospitalisation and morbidity rates were calculated using both overall data
and cluster summaries. Although neither hospitalisation nor morbidity rates were normally distributed,
the log transformation was not applied in either case due to clusters with no events. The coefficient of
variation k was estimated for both hospitalisation and morbidity rates, separately for rural and urban
location.
b) Intervention effect on claims, hospitalisation and morbidity
With 14 clusters in each treatment arm, the trial was at the borderline size for which individual-level
regression methods can provide reliable estimates[191]. Analyses of intervention effect were conducted
using individual regression methods for correlated data first, followed by estimates based on cluster-
level summaries to confirm the robustness of the analysis based on individual values. Analysis was by
intention to treat. In the initial analysis, women’s insurance status at baseline was used to define the
insured and uninsured groups.
A Poisson regression random effects model was fitted to estimate the effect of the intervention on
claims rates for the three conditions[194]. The unadjusted rate ratio and 95% confidence intervals were
first estimated, followed by an effect estimate adjusted for rural-urban location and cluster-level
baseline claims rates. The latter was included to control for baseline imbalance in claims rates and to
reduce between-cluster variation, in order to increase the power and precision of endline point
estimates[191]. Likelihood ratio tests of models with and without the intervention effect were
performed to obtain p values.
Using cluster-level rates post-intervention, a crude rate difference was estimated and an unpaired t-test
was applied to compare rates across treatment arms. An unadjusted rate ratio was also computed to
72
facilitate comparison with the crude rate ratio derived from individual level data. A 95% confidence
interval for the rate ratio was estimated by dividing and multiplying the estimated RR by an error factor,
and the p value obtained using the t distribution[191]. Analysis of co-variance, adjusting for rural-urban
location and cluster-level baseline claims rates, was performed on cluster summary rates to obtain an
adjusted estimate of the rate difference.
Analyses of the effect of the intervention on hospitalisation and morbidity rates for the three conditions
were conducted using similar methods to those described above. Overall post-intervention
hospitalisation and morbidity rates were calculated, and presented separately for insured and uninsured
women. A Poisson regression random effects model was fitted to individual data to obtain unadjusted
rate ratios first, followed by estimates adjusted for rural-urban location, cluster level baseline rates,
insurance status and survey round. Survey round was included to adjust for any seasonal effects.
Insurance status was formally tested for effect modification by incorporating an interaction term, while
noting that such analysis would have low power[194]. Likelihood ratio tests were performed to obtain p
values for all analyses. Additional analyses were performed to adjust for imbalanced baseline variables.
To check the robustness of analyses using individual-level data, crude rate ratios were estimated using
cluster level data and compared to estimates derived from the random effects model. An unpaired t-
test was applied to compare unadjusted cluster level hospitalisation and morbidity rates. While noting
that the t-test has been demonstrated to be robust to departures from normality, particularly when the
number of clusters in each arm is equal, nonparametric Wilcoxon rank-sum tests were also performed
to compare p values to those obtained using the t test[195]. Analysis of covariance was performed on
cluster summary rates, adjusting for insurance status, rural-urban location, survey round and cluster
level baseline rate, to obtain adjusted estimates of the rate difference. For hospitalisation data,
sensitivity analyses were performed using reported insurance status at subsequent rounds, rather than
insurance status at baseline.
(iii) Out-of -pocket expenditure
If the intervention had an effect on rates of claims, hospitalisation or morbidity, an effect on mean out
of pocket expenditure at the cluster level would have been expected. Mixed effects linear regression
models would have been fitted to individual data to estimate difference in mean expenditure, and then
73
adjusted for rural-urban location, insurance status, survey round and mean cluster-level baseline
expenditure to obtain an adjusted estimate[191].
As there was no evidence of a treatment effect on any of the above-mentioned outcomes, out-of-pocket
expenditure was not expected to have changed due to the intervention. Instead, a separate chapter
presents descriptive statistics on expenditure to provide more insight into treatment-seeking patterns
and their associated costs in the study population. Mean, median and range of expenditure are
presented by arm, rural-urban location, type of facility and insurance status. Box whisker plots are used
to display the distribution of expenditure for two focus conditions. Linear regression, using robust
standard errors to account for non-normality of the expenditure data, was performed to compare
expenditure patterns across rural-urban location and insurance status.
II. In-depth examination of hysterectomy
Qualitative study
A qualitative study was designed after analysis of the baseline data on prevalence of hysterectomy. The
primary objective was to explore the socioeconomic, cultural, individual and household factors that
influenced women’s decisions to undergo hysterectomy, with a sub-objective to examine whether
VimoSEWA coverage influenced women’s decisions.
Field approach
The fieldwork employed an ethnographic approach to qualitative data collection, drawing on ten years’
previous experience working as a health program director and researcher with SEWA in the study areas
and six months of fieldwork focussed on investigating hysterectomy, to situate accounts within women’s
lived experiences. I was already familiar with modes of daily living, village dynamics, health services and
local terminology in the study setting. Further, affiliation with SEWA allowed me to interact casually
with women and their families and observe how health care decisions were embedded in the local
context[196]. I utilised a combination of participant observation, in-depth interviews and case studies
to observe and analyse the complex phenomena that influenced women’s decisions[197]. In the initial
phases of research, I interacted and observed women and their families in daily life, particularly health-
related activities, and I accompanied community health workers on home visits, health care referrals
and group meetings. I also reviewed quantitative data from the baseline household survey and
discussed findings with women and their families, grassroots SEWA health and health insurance workers
74
and government heath staff. Through this process, I identified seven provisional themes to explore
through in-depth interviews: women’s experiences with gynaecological morbidity; drivers of women’s
demand; socioeconomic/occupation-related determinants; family/household and intergenerational
dynamics; health insurance status; health provider practices; physical, emotional and economic
consequences of hysterectomy.
Interview guides (Annex 4) were utilised to cover these a priori themes, but were modified to explore
new themes as they emerged, such as fear of cancer or experience with menstrual difficulties. Women
who had undergone hysterectomy were identified through SEWA’s CHWs, referrals from interviewees
and key informants. I conducted interviews until (i) the group represented both variation in insurance
status and length of time elapsed since the procedure and (ii) no new analytical themes emerged.
Thirty-five women were interviewed, eleven of whom were insured by SEWA and/or the government.
Nineteen women had undergone the procedure in the past five years (seven in the past year) and could
provide specific details of the treatment-seeking process. The remainder offered perspective on longer
term effects of hysterectomy.
I also interviewed five local gynaecologists, who had conducted 20 of the 35 hysterectomy cases
conducted in the area. It was not logistically feasible to link a specific woman’s case history with her
provider to develop case studies, although I was able to conduct analysis linking women’s cases with the
viewpoints of the identified provider. Where possible, I also read women’s medical case histories and
test results if they agreed. Interviews were conducted individually with thirteen key informants and
three women with gynaecological ailments who did not proceed with the operation, as well as in groups
with three sets of younger women who have not had a hysterectomy. These were all identified during
the course of research. Young women were identified in three villages, where groups were readily
formed through connections I had made on earlier visits. I kept extensive field notes throughout this
process, to describe each setting and experience, document my own reflections and identify new ideas.
During the design and research process, I read qualitative studies focused on women’s bodies, health
and their interactions with medical intervention, such as Kielmann’s analysis of women’s perceptions of
morbidity[20], ethnographies contained in Lock and Kaufert’s volume Pragmatic Women and Body
Politics[198] and Behague’s study of caesarean sections in Brazil[199], in order to familiarise myself with
methods of understanding women’s narratives and perspectives. Analyses of biomedicine such as Lock
75
and Nguyen’s An Anthropology of Biomedicine[200] and sociological analyses of medicalisation[201-203]
provided theoretical frameworks to contextualise my observations.
Analysis
The objective of this research was to understand the multiple influences on women’s decisions to
undergo hysterectomy, with an aim to inform future interventions and policy related to women’s health.
Accordingly, a framework method was applied to conduct thematic analysis, in which I aimed to
understand hysterectomy by exploring the findings through an inductive approach, rather than test
specific hypotheses[196]. Although I sought to contextualise the findings within, and contribute to,
theoretical frameworks that address women’s health care decisions, it was not an explicit research aim
to develop theory; hence a grounded theory approach was not pursued.
The analysis was conducted through several steps consistent with framework analysis. I consulted
qualitative research guides for analytical tools [204, 205], as well as textbooks on anthropological
methods for broader frameworks[197, 206]. As a first step, interviews were transcribed in Gujarati,
after which I checked transcripts through re-listening to each audio recording. Open coding was
utilised to categorise content by different influences on hysterectomy, such as individual characteristics,
social determinants and modes of decision-making. An analytical framework that identified codes,
thematic groupings and broad causal pathways was developed after analysis of several transcripts, and
discussed with an anthropologist on my advisory committee (Dominique Behague). As I was the only
person with access to the data, I chose not to use a software package for analysis. Next, I developed a
matrix of cases and themes, in which each interview was structured in rows and thematic areas/coding
groups were presented across columns. Each cell contained information that detailed how a woman’s
experience fitted (or did not apply to) a specific theme. Women were compared across individual sub-
themes and demographic variables to identify heterogeneity, as well as to generate new themes. After
this first round of analysis, I drafted a preliminary note that identified analytical themes and further
questions to explore.
At this point, I returned to theoretical work on medicalisation and ethnographies that focused on
women’s bodies and reproductive health. While I found that many analytical concepts were no longer
relevant to my findings, such as the view of medicalisation as provider-driven intervention or
somatisation, specific works resonated and contributed to generating analytical themes. In particular,
76
the idea of women’s pragmatic agency (Lock and Kaufert), as illustrated through case studies on
sterilisation, childbirth and reproductive technology, provided the primary theoretical lens for further
analysis[198]. The matrix was thus further developed and utilised to analyse sub-groups of women and
across themes. For example, women were analysed across sterilisation status and the thematic idea of
hysterectomy as freedom from risk, compared to the view of hysterectomy as pragmatic treatment.
The matrix also allowed for identification of specific case studies that would be utilised to represent
thematic areas. I aimed to integrate reflexivity throughout the process by: keeping and reviewing field
notes regularly; comparing my findings with the quantitative study and other research on hysterectomy
and medical interventions; and by discussing case study choices and the theoretical framework with Dr.
Behague and two former SEWA colleagues who engage in qualitative research[196, 206].
Quantitative analysis of survey data
Analysis of the trial indicated no evidence of an effect of the intervention on rates of claim submission,
hospitalisation or morbidity. Accordingly, a cohort analysis to estimate incidence and identify predictors
of hysterectomy, including data from both treatment and control areas over four rounds of the
household survey, was performed. Data were entered into a Microsoft Access database and analysed
using Stata 11. The svyset command was utilised to take into account the cluster sampling and sampling
weights for insured and uninsured households. The stset command was utilised to define person-time
at risk. Women who reported past hysterectomy prior to the period covered by the baseline survey
were excluded. The incidence of hysterectomy, based on cases reported by the primary adult
respondent over the two-year survey period, was estimated using the exponent of the Poisson
regression coefficient. Crude rate ratios for a range of demographic characteristics such as income,
location, education, insurance status, number of living children and sterilisation history, were estimated
using Poisson regression. Wald tests were utilised to obtain p values for variables with more than one
level. A multivariable Poisson regression model was fitted with variables with crude rate ratios observed
to be associated with (p<0.05), or those that could be theoretically associated with, hysterectomy.
Effect modification was investigated for sterilisation history, education, insurance status and rural/urban
location.
Mixed methods approach
While incidence and some individual-level predictors of hysterectomy could be estimated from the
cohort study, the complexity of the social, structural and behavioural factors that influence why women
77
undergo hysterectomy called for integration of a qualitative approach to identify the determinants and
pathways associated with hysterectomy[207]. Further, given the lack of previous research in low-
income settings, a mix of quantitative and qualitative data allowed for triangulation of findings and
more extensive exploration of determinants in this setting[207]. The mixed methods examination of
hysterectomy utilised two data sources, detailed above: (i) a quantitative, population-based cohort
study amongst adult women and (ii) in-depth ethnographic research amongst women, health care
providers and key informants. All participants reviewed a study information form with researchers and
provided consent to participation and sharing of findings, as detailed above. Identities of all sources
have been anonymised.
Quantitative and qualitative methods were combined sequentially in the design and analysis phases. The
quantitative survey was designed first, and included basic questions to estimate prevalence of
hysterectomy in the study population. After analysing the baseline data, the need to examine both
proximate and distal, as well as individual and social, factors was identified as important to
understanding identify the determinants of hysterectomy. Two steps were taken: (i) survey questions
pertinent to hysterectomy and reproductive health history were added to subsequent survey rounds
and (ii) a qualitative study to explore individual, social and health systems determinants of hysterectomy
was designed, as described above. The mix of providers and average age reported in the baseline led to
inclusion of in-depth interviews with government health providers and younger women.
The mixed methods analysis was both inductive and deductive, in an iterative approach that combined
data through triangulation and by ‘following a thread’[208]. The quantitative cohort data were analysed
first to estimate incidence and identify predictors of hysterectomy. A thematic analysis of qualitative
data was conducted next to examine processes and determinants. Next, findings from both sets of data
were triangulated to identify convergence, dissonance and gaps[207]. New analytical themes in either
set of data also led to further analysis in the other. For example, in-depth interviews with women
suggested that views on hysterectomy varied by sterilisation history (a ‘thread’), which prompted
quantitative analysis of effect modification by sterilisation status. Finally, predictors and underlying
determinants were examined together to identify their intersections and comparisons with other
settings.
78
III. Process evaluation
The intervention process evaluation presented in this thesis focusses only on hysterectomy for two
reasons. One, the findings on hysterectomy provided an opportunity to contextualise the intervention
with insight into individual, social and structural factors that may have influenced both the
implementation and results. Two, it was not logistically feasible for me to conduct qualitative research
and analyse process data for all three conditions. I chose to focus on hysterectomy in an in-depth
process evaluation while a colleague at SEWA examined the intervention processes related to diarrhoea
and fever.
The process evaluation was based on the principles of theory-based impact evaluation, components of
which were identified by White (2009) as:
(1) map out the causal chain (program theory); (2) understand context; (3) anticipate heterogeneity; (4) rigorous evaluation of impact using a credible counterfactual; (5) rigorous factual analysis; and (6) use mixed methods [209].
The intervention evaluation, described in Section 1, addresses points (4) and (5) above. Based on the
conceptual framework initially designed with CHWs, I developed an intervention causal chain (Figure 4.
2) after reviewing baseline findings and relevant literature. Quantitative and qualitative data were
collected and analysed along the intervention pathway, to examine each step or assumption between
inputs and outcomes, such as: who actually participated in the intervention, whether implementation
differed from the intended plan, and changes in intermediate outcomes that may have affected the final
outcomes. Findings from the in-depth qualitative study on hysterectomy provided context on the social,
economic and health systems for the intervention, as well as insight into barriers and facilitators related
to treatment-seeking for hysterectomy. Heterogeneity was examined in the trial analysis through
investigation of effect modification related to insurance status and rural/urban location, while the
process evaluation further examined how the intervention may have been implemented (or received)
differently amongst insured and uninsured women and by rural/urban location.
Data sources included: (i) CHW registers and monitoring data (ii) short interviews with 379 participants
to test message recall, conducted by the same external research agency that conducted the evaluation.
Interviewees were randomly selected from participant lists submitted by CHWs and asked questions
based on the key messages (iii) qualitative, in-depth interviews with ten participants, 14 CHWs and 2
program managers (iv) household surveys utilised for the evaluation and (v) observation of intervention
79
sessions. Guides are found in Annex 5. For the latter, at least two sessions were observed for all 14
CHWs, and two CHWs were followed over six months, during which I observed a series of health
education sessions and interacted with participants. Interviews with CHWs and program managers were
transcribed, and session observations recorded in notes. Household survey data were analysed using
Stata 11, and process monitoring data were analysed in Microsoft Excel. Qualitative interviews were
conducted and transcribed in Gujarati. Notes were organised using open coding and analysed
thematically.
Data were: (i) assessed along the causal chain to identify achievements and breakdowns (ii)
contextualised with findings from qualitative research and (iii) interpreted with a view towards
improving practice. The different data sources were triangulated at specific points in the causal chain,
such as using both process and survey data to estimate outreach, or by combining qualitative interviews
and session observations to understand effectiveness. My approach to the process evaluation was
necessarily participatory to some extent, as I had a central role in its design and early implementation. I
aimed to achieve a balance between participation and observation by employing reflexivity–being aware
of and documenting my position throughout the research period and analysis–as well as utilising
multiple forms of data to triangulate findings[206].
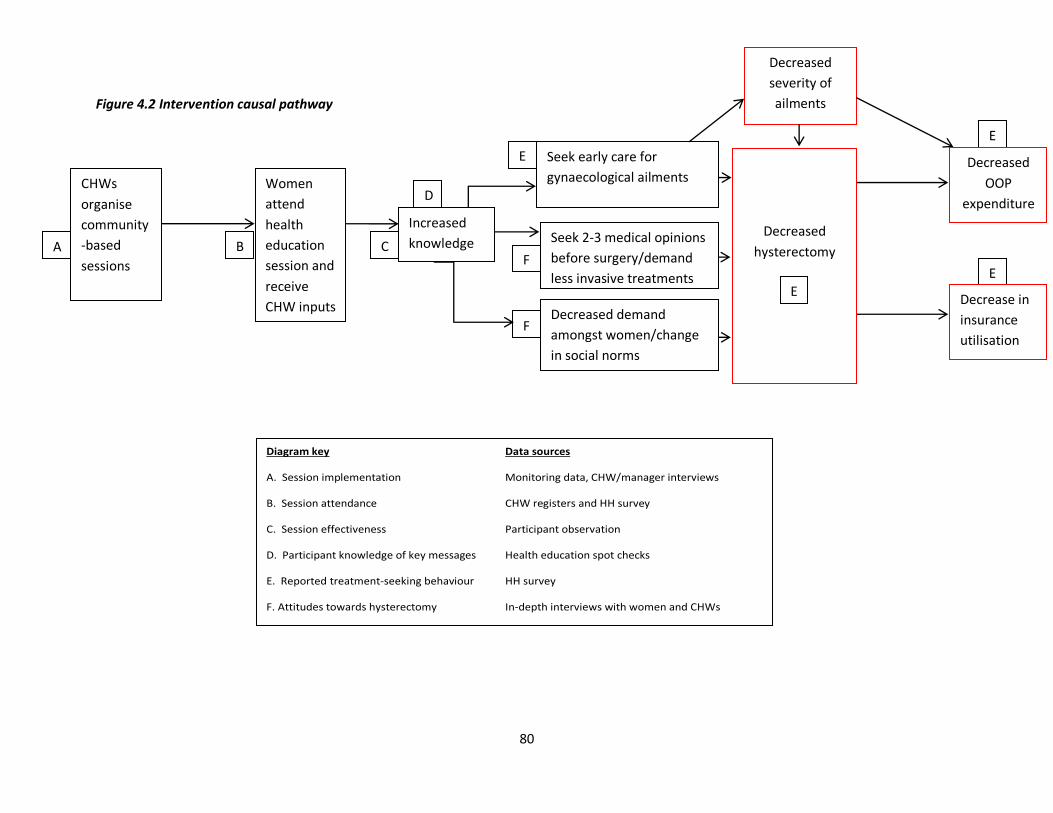
80
Figure 4.2 Intervention causal pathway
C
D
F
Diagram key Data sources
A. Session implementation Monitoring data, CHW/manager interviews
B. Session attendance CHW registers and HH survey
C. Session effectiveness Participant observation
D. Participant knowledge of key messages Health education spot checks
E. Reported treatment-seeking behaviour HH survey
F. Attitudes towards hysterectomy In-depth interviews with women and CHWs
Women
attend
health
education
session and
receive
CHW inputs
Seek early care for
gynaecological ailments
Increased
knowledge
Seek 2-3 medical opinions
before surgery/demand
less invasive treatments
Decreased demand
amongst women/change
in social norms
Decreased
severity of
ailments
B F
CHWs
organise
community
-based
sessions
A
E
E
Decreased
hysterectomy
E
Decrease in
insurance
utilisation
Decreased
OOP
expenditure
E
81
IV. Ethical considerations
Intervention evaluation
Ethical approval for randomisation was sought locally before the study began, to ensure that
only CHWs allocated to the intervention participated in its design. The intervention was first
discussed in June 2010 at the Annual Meeting of the Executive Committee of SEWA’s Health
Cooperative, where SEWA health activities are regularly discussed. The Health Cooperative
consists of 500 health workers and midwives, including all CHWs who participated in the
intervention, and elected leaders that represent the SEWA membership. After reviewing the
intervention goals and implementation plan, the cooperative passed a resolution approving
a randomised intervention implemented by its member CHWs. Since cooperative members
included elected SEWA representatives from the 28 clusters, cluster members were not
approached individually for consent to randomisation.
Individual data were protected both through restricting access and removal of identifying
information. Individual consent was not sought for use of claims data, as claims analysis
formed a part of routine monitoring and evaluation at VimoSEWA. Insurance data were
accessed before the intervention began and three months after it concluded. Surveyed
households were identified by a unique id that concealed identifying information. All survey
participants provided oral informed consent, after researchers reviewed a study information
form with the interviewee and, if necessary or appropriate, additional household members.
Both the local ethics committee and CHWs considered oral consent the most appropriate
convention for the survey, rather than written consent, as most women in the area had not
attended formal schooling. As no adverse consequences of the intervention were
anticipated at the cluster or individual level, a data safety and monitoring board was not
constituted. The participant information forms and study protocol can be found in Annex 6.
Qualitative research
For the qualitative research, all interviewees provided written consent after reviewing a
study information form with the author that included a description of the objectives and
how provided information would be utilised and shared. The information forms can be
found in Annex 7. All interviewees were asked for consent for anonymous inclusion in
publication.
82
Process evaluation
CHW reports and monitoring data that were entered into a database did not include names
of participants. Participants in education sessions who were later interviewed provided
informed consent after reviewing a study information form, as above, and were included in
the application for ethics approval for the qualitative research. As Project Director of the
study, I had access to all project documents and meeting records. All findings were shared
and discussed with SEWA management, CHWs and representatives of the membership.
Ethical approvals
Ethical approval for the intervention, evaluation and qualitative research was granted by a
board constituted by SEWA’s Health Cooperative Executive Committee and external experts,
as per Indian Council of Medical Research guidelines, and by the Ethics Committee of the
London School of Hygiene and Tropical Medicine (Annex 8). The study was registered as
ISRCTN21290274.
Role of the funder
The study was funded by International Labour Organization, Microinsurance Innovation
Facility Grant R2-189. The funder had no role in the design, implementation or analysis of
the study.
83
SECTION TWO
Chapter V. Baseline findings: description of study population and comparison of insured and uninsured women
This chapter describes the study population and compares the demographic characteristics
and treatment-seeking behaviour of VimoSEWA-insured with uninsured women. As
described in Chapter III, VimoSEWA questioned whether the scheme promoted
hospitalisation for conditions potentially amenable to outpatient care or for unnecessary
procedures. Analysis of the baseline household survey amongst insured and uninsured
women provided some insight into this question as well as provided a picture of overall
hospitalisation patterns in the population before the start of the intervention. Cluster-level
baseline claims and hospitalisation rates in the intervention and control arms are further
compared in Chapter VI. This chapter is a paper that was published in BMC Health Services
Research in 2014[145]. The text is exactly as published, except for numbering of tables and
figures.

84
RESEARCH PAPER COVER SHEET
PLEASE NOTE THAT A COVER SHEET MUST BE COMPLETED FOR EACH RESEARCH
PAPER INCLUDED IN A THESIS.
SECTION A – Student Details
Student Sapna Desai
Principal Supervisor Simon Cousens
Thesis Title
Community health worker-led education to change women’s treatment-seeking
behaviour: A cluster randomised trial and qualitative investigation in Gujarat,
India
If the Research Paper has previously been published please complete Section B, if not
please move to Section C
SECTION B – Paper already published
Where was the work published?
BMC Health Services Research
When was the work published?
26 July 2014
If the work was published prior to registration for your research degree, give a
brief rationale for its inclusion
Have you retained the copyright for the work?*
Yes. It is an open access publication.
Was the work subject to academic peer review?
Yes
*If yes, please attach evidence of retention. If no, or if the work is being included in its
published format, please attach evidence of permission from the copyright holder
(publisher or other author) to include this work.
85
SECTION C – Prepared for publication, but not yet published
Where is the work intended to be published?
Please list the paper’s authors in the intended authorship order:
Stage of publication
SECTION D – Multi-authored work
For multi-authored work, give full details of your role in the research included in
the paper and in the preparation of the paper. (Attach a further sheet if necessary)
I performed all statistical analyses, drafted the manuscript, incorporated
comments from co-authors and submitted the article for publication.
Student Signature: Date: 6.2.2015
Supervisor Signature: Date: 6.2.2015
86
Understanding CBHI hospitalisation patterns: A comparison of insured and uninsured women in Gujarat, India Sapna Desai1,2§, Tara Sinha2, Ajay Mahal,3 Simon Cousens1
1Faculty of Epidemiology and Population Health, London School of Hygiene and Tropical Medicine, London, UK 2Self Employed Women’s Association, Ahmedabad, Gujarat, India 3School of Public Health and Preventive Medicine, Monash University, Melbourne, Australia §Corresponding author
Abstract Background
Community-based health insurance has been associated with increased hospitalisation in
low-income settings, but with limited analysis of the illnesses for which claims are
submitted. A review of claims submitted to VimoSEWA, an inpatient insurance scheme in
Gujarat, India, found that fever, diarrhoea and hysterectomy, the latter at a mean age of 36
years, were the leading reasons for claims by adult women. To understand this pattern, we
compare the morbidity, outpatient treatment-seeking and hospitalisation patterns of
VimoSEWA-insured women with uninsured women.
Methods
We utilise data from a cross-sectional survey of 1,934 insured and uninsured women in
urban and rural Gujarat, India. Multivariable logistic regression was utilised to identify
predictors of insurance coverage and the association of insurance with hospitalisation. Self-
reported data on morbidity, outpatient care, hospitalisation and length of stay are compared
between insured and uninsured women.
Results
Age, marital status and employment category of adult women were associated with
insurance status. Reported prevalence of recent morbidity, type of illness, outpatient
treatment and outcomes were similar among insured and uninsured women. Multivariable
analysis reveals strong evidence of a higher odds of hospitalisation amongst the insured (OR
= 2.7; 95% ci. 1.6, 4.7). The leading reason for hospitalisation for uninsured and insured
women was hysterectomy, at a similar mean age of 36, followed by common ailments such
as fever and diarrhoea. Insured women appear to have a higher probability of being
hospitalised for all causes than uninsured women, rather than specifically for fever,
diarrhoea or hysterectomy. Length of stay was similar; the insured were not more likely to
87
be admitted for only one day, the minimum required for reimbursement. The insured
utilised a mix of trust, public and private hospitals, while two-thirds uninsured women
utilised private hospitals.
Conclusions
Despite similar reported morbidity patterns and initial treatment-seeking behaviour,
VimoSEWA members were more likely to be hospitalised. The data do not provide strong
evidence that the differential is explained by inpatient hospitalisation replacing outpatient
treatment for common illnesses or that insurance is the primary inducement for
hysterectomy in the population. Rather, it appears that VimoSEWA members behave
differently in deciding if, and where, to be hospitalised for any condition. Further research is
required to explore this decision-making process, the roles, if any, played by adverse
selection and moral hazard. Lastly, these hospitalisation patterns raise concerns regarding
population health needs and access to quality preventive and outpatient services.
Keywords Community-based health insurance, treatment-seeking behaviour (MESH): Health insurance, India, hysterectomy, female, hospitalization
88
Background Community based health insurance (CBHI) is a health financing arrangement that aims to reduce risk of
catastrophic health expenditure and improve access to health care in low-income settings. Most CBHI
schemes are rooted, to varying degrees, in principles of risk-sharing, community solidarity, participatory
decision-making and voluntary affiliation[210]. According to findings from a systematic review in 2009
that covered 31 studies and 118 schemes, and an earlier review of 12 schemes in Asia and Africa, there
is strong evidence that CBHI schemes can decrease out of pocket spending on health care [211] [28]. A
large proportion of schemes in low-income settings cover only inpatient hospitalisation expenses, and
CBHI coverage has been associated with increased hospitalisation in a number of studies [212-217].
However, health systems issues such as poor quality of services and lack of patient empowerment
remain barriers to increased treatment-seeking [218, 219], while low enrolment limits coverage of CBHIs
and similar voluntary schemes[220]. Despite these weaknesses, CBHIs continue to be implemented in
many low-income countries, as a potential tool to improve access and financial security [210].
Much of the existing research on CBHIs and hospitalisation in low-income settings has focused on the
association with increased hospitalisation, with limited analysis of the underlying health conditions that
drive utilisation. In fact, careful analysis of morbidity profiles in combination with treatment-seeking
behaviour by (CBHI) insurance status can shed light on the role of insurance in increasing use of both
outpatient and inpatient health services, including the risk of inefficient provider-induced or patient
overutilization of services (moral hazard). Analysis of data on morbidity and treatment patterns can also
be useful for exploring whether there is a higher likelihood of enrolment by persons more prone to
seeking care (adverse selection).
To our knowledge, only three CBHI studies have integrated an epidemiological analysis to compare
hospitalisation amongst the insured and uninsured in low-income settings. Devadasan et al compared
reported illness – categorised as minor, major or chronic – amongst matched insured and uninsured
households in rural India [221]. Despite similar levels of minor and chronic illness, the insured were 2.5
times more likely to present with a major ailment and almost twice as likely to be hospitalised as the
uninsured. However, the insurance scheme covered only hospitalisation and all hospitalisations were
automatically categorised as major illness – which may account for the difference in reported morbidity
patterns between the insured and uninsured. In contrast, an evaluation of Filipino micro-insurance
89
units that cover inpatient care reported similar incidence of recent morbidity amongst the insured and
uninsured. Yet the insured had a 50% higher risk of hospitalisation for both communicable and non-
communicable illnesses, as well as more physician encounters and institutional deliveries[222].
Similarly, a detailed study of the impact of the Bwamanda hospital scheme in Zaire reported a 2.9-fold
higher admission rate for the insured[223]. The authors analysed care for two ‘justified high priority’
conditions – caesarean sections and strangulated hernias – and found significantly lower rates amongst
the uninsured.
In our own experience at VimoSEWA, a CBHI in India that covers only 24-hour or longer hospitalisation, a
recent analysis of claims indicated that close to forty percent of adult hospitalisation was for common,
typically mild illnesses such as fever and diarrhoea, as well as hysterectomy amongst women in their
mid-thirties[141]. This pattern surprised VimoSEWA’s management and SEWA’s community health
team, who questioned if: (i) the scheme’s inpatient-only design effectively serves to replace outpatient
treatment for common illnesses such as diarrhoea and fever with reimbursable, inpatient hospitalisation
(ii) the scheme and/or providers promote unnecessary procedures, particularly hysterectomy at a young
age and (iii) some of the burden of illness and hospitalisation was preventable through community
intervention. As a first step in exploring the first two questions, we conducted a household survey to
compare morbidity, outpatient treatment-seeking and hospitalisation patterns of women insured by
VimoSEWA with uninsured women in the same geographical areas. A health education intervention was
designed to test (iii), along with qualitative research on the three questions. This paper reports the
findings from the household survey.
VimoSEWA
VimoSEWA is a voluntary, community-based insurance scheme initiated in 1992 by the Self-Employed
Women’s Association (SEWA), a women’s trade union with 1.3 million members in nine states of India
[224]. The majority of VimoSEWA’s members are women workers in the informal sector in the state of
Gujarat. In partnership with insurance companies, VimoSEWA promotes a range of voluntary insurance
products to women workers through its non-profit cooperative. VimoSEWA insures adult women as the
primary insured, who have the option to purchase additional coverage for spouses and children (Table
5.1).
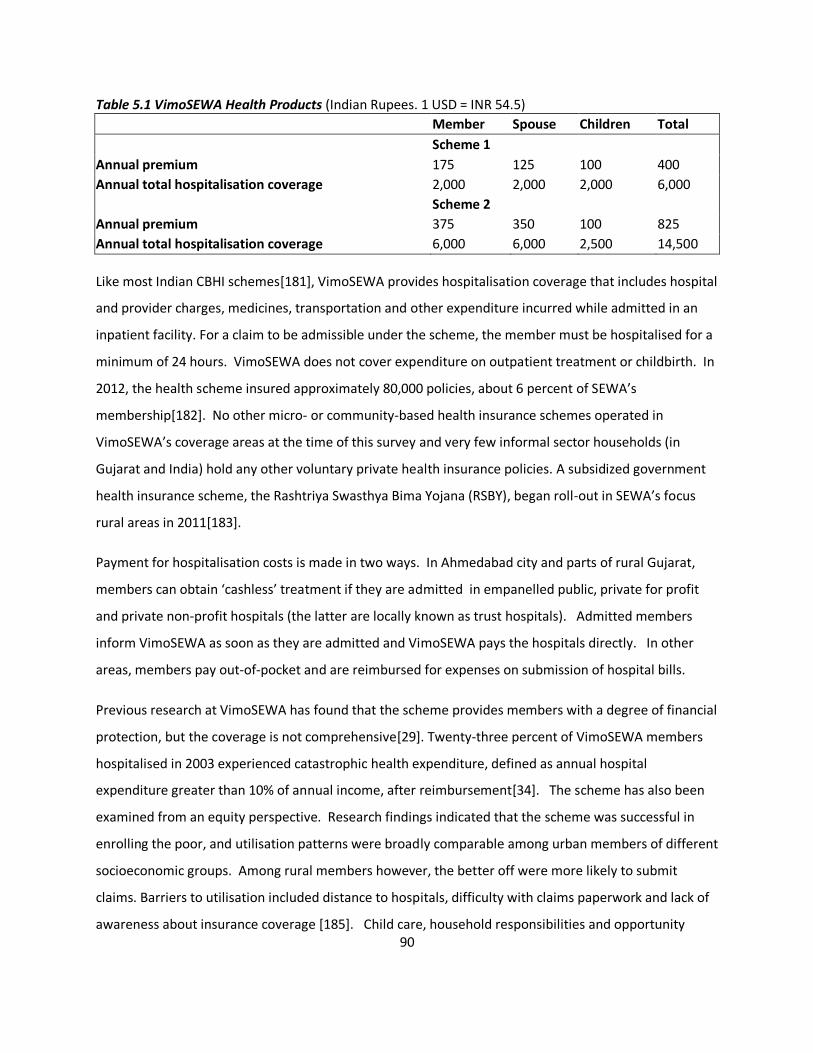
90
Table 5.1 VimoSEWA Health Products (Indian Rupees. 1 USD = INR 54.5)
Member Spouse Children Total
Scheme 1
Annual premium 175 125 100 400
Annual total hospitalisation coverage 2,000 2,000 2,000 6,000
Scheme 2
Annual premium 375 350 100 825
Annual total hospitalisation coverage 6,000 6,000 2,500 14,500
Like most Indian CBHI schemes[181], VimoSEWA provides hospitalisation coverage that includes hospital
and provider charges, medicines, transportation and other expenditure incurred while admitted in an
inpatient facility. For a claim to be admissible under the scheme, the member must be hospitalised for a
minimum of 24 hours. VimoSEWA does not cover expenditure on outpatient treatment or childbirth. In
2012, the health scheme insured approximately 80,000 policies, about 6 percent of SEWA’s
membership[182]. No other micro- or community-based health insurance schemes operated in
VimoSEWA’s coverage areas at the time of this survey and very few informal sector households (in
Gujarat and India) hold any other voluntary private health insurance policies. A subsidized government
health insurance scheme, the Rashtriya Swasthya Bima Yojana (RSBY), began roll-out in SEWA’s focus
rural areas in 2011[183].
Payment for hospitalisation costs is made in two ways. In Ahmedabad city and parts of rural Gujarat,
members can obtain ‘cashless’ treatment if they are admitted in empanelled public, private for profit
and private non-profit hospitals (the latter are locally known as trust hospitals). Admitted members
inform VimoSEWA as soon as they are admitted and VimoSEWA pays the hospitals directly. In other
areas, members pay out-of-pocket and are reimbursed for expenses on submission of hospital bills.
Previous research at VimoSEWA has found that the scheme provides members with a degree of financial
protection, but the coverage is not comprehensive[29]. Twenty-three percent of VimoSEWA members
hospitalised in 2003 experienced catastrophic health expenditure, defined as annual hospital
expenditure greater than 10% of annual income, after reimbursement[34]. The scheme has also been
examined from an equity perspective. Research findings indicated that the scheme was successful in
enrolling the poor, and utilisation patterns were broadly comparable among urban members of different
socioeconomic groups. Among rural members however, the better off were more likely to submit
claims. Barriers to utilisation included distance to hospitals, difficulty with claims paperwork and lack of
awareness about insurance coverage [185]. Child care, household responsibilities and opportunity
91
costs such as lost wages were also identified as obstacles to treatment-seeking, for women in
particular[186].
A review of VimoSEWA health claims in 2001 indicated that the most common reasons for adult
hospitalisation were accidents, malaria, gastroenteritis and hysterectomy[29]. A follow-up review in
2009 revealed that the leading reasons for adult hospitalisation claims were for illnesses such as fever,
diarrhoea/gastroenteritis and respiratory infection – which are considered common illnesses amenable
to prevention or outpatient treatment if diagnosed early. Hysterectomy was the primary reason for
claims amongst rural women, at an average age of 37 years, considerably younger than in countries
where data are available[30-33]. A survey conducted by Ranson in 2000 amongst 242 VimoSEWA-
insured and 381 uninsured households did not find evidence of increased hospitalisation amongst
insured women[187]. Since then, VimoSEWA has not assessed hospitalisation rates or treatment-
seeking of insured members with the uninsured.
Study Objectives
This analysis is one of a set of studies at SEWA to explore treatment-seeking behaviour amongst low-
income women in Ahmedabad city and district in Gujarat. It builds on previous research at VimoSEWA
by comparing insured women to the uninsured, and contributes to the literature on CBHI by integrating
an epidemiological approach to the analysis of healthcare utilisation patterns. We examine three issues.
First, we examine demographic characteristics of VimoSEWA and uninsured women to identify factors
associated with insurance coverage, particularly those which could potentially affect treatment-seeking.
Second, we compare insured and uninsured women with respect to the prevalence of morbidity in the
past month and place where treatment was sought (self/outpatient clinic/hospital/none), in order to
examine treatment choices that are not covered by VimoSEWA’s inpatient-only scheme. Third, we
compare insured and uninsured women with respect to hospitalisation in the past six months,
comparing type of illness, length of stay and place of hospitalisation.
Methods This study utilises data from a cross-sectional baseline household survey conducted from January to
March 2010 amongst a sample of insured and uninsured households in Ahmedabad district and
Ahmedabad city, Gujarat. The survey was designed to provide baseline information for a subsequent
92
evaluation of a health education intervention amongst insured and uninsured women. We compare
demographic, morbidity and treatment-seeking patterns across 28 clusters where the intervention was
to be implemented. The survey was conducted in 16 rural and 12 urban clusters, with clusters defined
as discrete geographical units serviced by a single SEWA community health worker (CHW). CHWs serve
both insured and uninsured households: approximately eight to ten percent of the 200-500 households
in each cluster are insured by VimoSEWA. The sample was stratified by urban and rural location, as
urban rates of claim submission have been established to be higher than in rural areas in two previous
analyses[141, 185].
Household selection
For insured households, 35 households from each cluster were randomly selected from the VimoSEWA
database. A researcher followed each CHW on her daily rounds to list uninsured households, from
which 35 were also randomly selected. Thus, 70 households were selected per cluster to give a total of
1,960 households.
Data collection
The survey collected information for all family members on demographic and socioeconomic
characteristics, morbidity and all treatment-seeking behaviour in the past 30 days and hospitalisation
and associated expenditure in the past six months. In each household, an adult woman was selected for
interview. In insured households, the respondent was the primary VimoSEWA policy holder. In
uninsured households, the primary SEWA union member or spouse of the male head of household was
selected. All respondents provided oral informed consent. Both the local ethics committee and CHWs
considered this the most appropriate convention, rather than written consent, as most women in the
area have not attended formal schooling. Ethics approval was granted by the Executive Committee of
the SEWA Health Cooperative.
Data analysis
Data were entered into a Microsoft Access database and analysed using Stata 11. The svyset command
was utilised to take into account the cluster sampling, sampling weights for insured and uninsured
households, and the rural/urban stratification. Sampling weights were defined by cluster, as both the
93
population size and penetration of insurance vary by CHW work area. All tables present weighted
proportions.
We conducted three analyses to compare insured and uninsured women. In the first analysis, we
examined demographic and socioeconomic characteristics of insured and uninsured households and
women in order to identify any factors that may later be associated with differences in treatment-
seeking behaviour. Socioeconomic indicators (income, education, dwelling type, toilet, drinking water
access) are presented and analysed separately rather than as a score derived using principal component
analysis, as we believed that some of these variables could be independently associated with morbidity
or hospitalisation. Although women workers in the informal economy typically engage in multiple
income-earning activities[175], only the respondent’s stated primary occupation was included in the
analysis. After examining unadjusted odds ratios calculated using logistic regression, multivariable
logistic regression was used to identify predictors of insurance status. We included variables with crude
odds ratios observed to be associated with (p<.05) or those that could be theoretically associated with,
insurance coverage. Results are presented as adjusted odds ratios with 95% confidence intervals.
Overall p-values for variables with more than two levels were obtained using Wald tests. Urban and
rural data were stratified in crude analyses and then combined in multivariable analyses, with location
formally tested for effect modification.
In the second set of analyses, data on recent morbidity and treatment-seeking were compared between
insured and uninsured women. Recent morbidity was defined as any illness episode in the past month,
to limit recall bias and to capture outpatient treatment-seeking behaviour as accurately as possible.
Morbidity in the past 30 days included chronic illness, as we did not inquire about chronic illness
separately at the individual level.
In the third analysis, the association between current insurance coverage and hospitalisation, defined as
an inpatient admission for 24 hours or more in the past six months, was examined through logistic
regression. Multivariable logistic regression included variables associated with insurance coverage and
those considered to be associated with hospitalisation, both theoretically and through examining crude
odds ratios. The role of urban/rural location was examined through stratified odds ratios and formally
tested for effect modification. Lastly, reasons for hospitalisation, type of hospital and length of stay
94
were compared to identify any differences between insured and uninsured women. Throughout, self-
reported reasons for recent morbidity and hospitalisation were categorised into illness or symptom
groups to the extent possible without clinical reports. Given the large variety of illnesses and hence
small category sizes, we present morbidity-related data with descriptive proportions rather than formal
statistical tests.
Results A total of 1,934 adult female respondents (980 uninsured/954 insured) from the selected sample of
1,960 households were interviewed in the baseline survey. Twenty-six insured women were
unavailable, mostly in Ahmedabad city, with no replacement available in the same cluster. Demographic
and socioeconomic characteristics are presented in Tables 5.2 and 5.3.
Insurance coverage
Unadjusted odds ratios indicate no major differences in demographic or socioeconomic characteristics
at the household level between insured and uninsured respondents, examined separately within rural
(n=1,118) and urban (n=816) strata (Table 5.2). Living conditions appeared to vary across location: more
rural households lived in precarious mud houses rather than brick or cement dwellings, and urban
households were more likely to have a toilet. With respect to individual-level characteristics (Table 5.3),
insured women were older, more likely to be employed, and, in rural areas, less educated than their
uninsured counterparts. Also, a higher proportion of insured women were widows. Although insured
and uninsured women reported similar levels of morbidity in the past 30 days, insured women were
more likely to perceive their own health as average, compared to uninsured women who reported
higher levels of very good health.
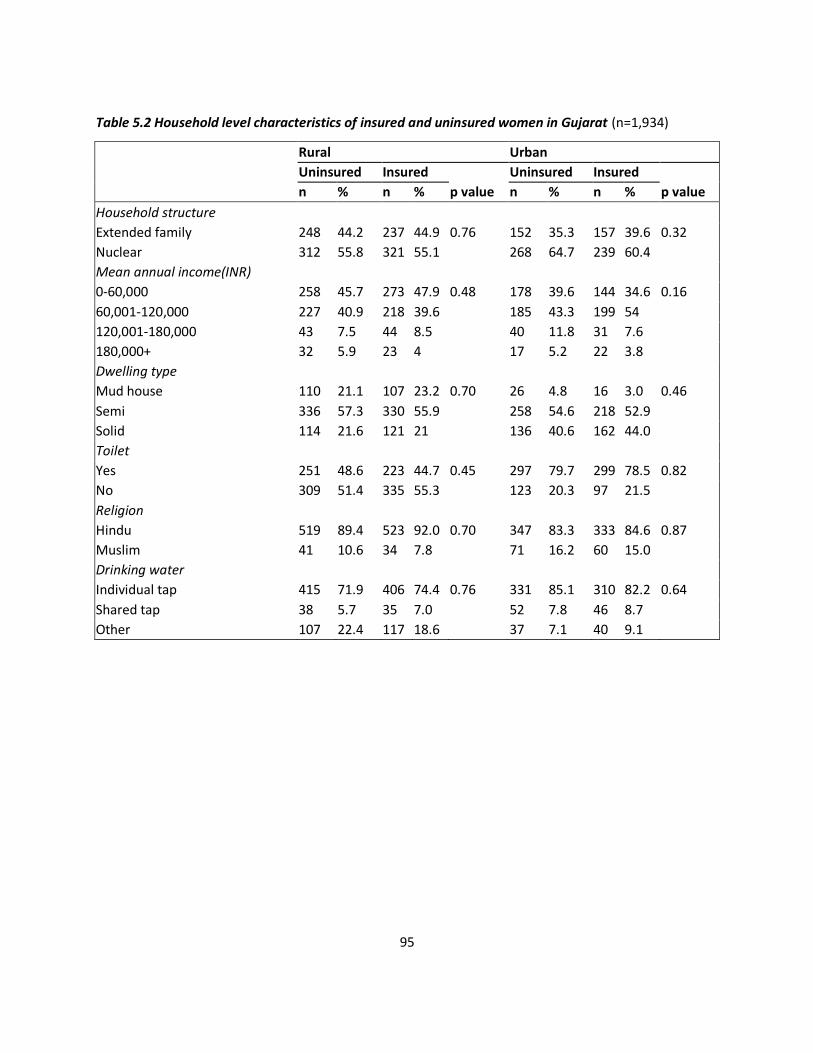
95
Table 5.2 Household level characteristics of insured and uninsured women in Gujarat (n=1,934)
Rural Urban
Uninsured Insured Uninsured Insured
n % n % p value n % n % p value
Household structure
Extended family 248 44.2 237 44.9 0.76 152 35.3 157 39.6 0.32
Nuclear 312 55.8 321 55.1 268 64.7 239 60.4
Mean annual income(INR)
0-60,000 258 45.7 273 47.9 0.48 178 39.6 144 34.6 0.16
60,001-120,000 227 40.9 218 39.6 185 43.3 199 54
120,001-180,000 43 7.5 44 8.5 40 11.8 31 7.6
180,000+ 32 5.9 23 4 17 5.2 22 3.8
Dwelling type
Mud house 110 21.1 107 23.2 0.70 26 4.8 16 3.0 0.46
Semi 336 57.3 330 55.9 258 54.6 218 52.9
Solid 114 21.6 121 21 136 40.6 162 44.0
Toilet
Yes 251 48.6 223 44.7 0.45 297 79.7 299 78.5 0.82
No 309 51.4 335 55.3 123 20.3 97 21.5
Religion
Hindu 519 89.4 523 92.0 0.70 347 83.3 333 84.6 0.87
Muslim 41 10.6 34 7.8 71 16.2 60 15.0
Drinking water
Individual tap 415 71.9 406 74.4 0.76 331 85.1 310 82.2 0.64
Shared tap 38 5.7 35 7.0 52 7.8 46 8.7
Other 107 22.4 117 18.6 37 7.1 40 9.1
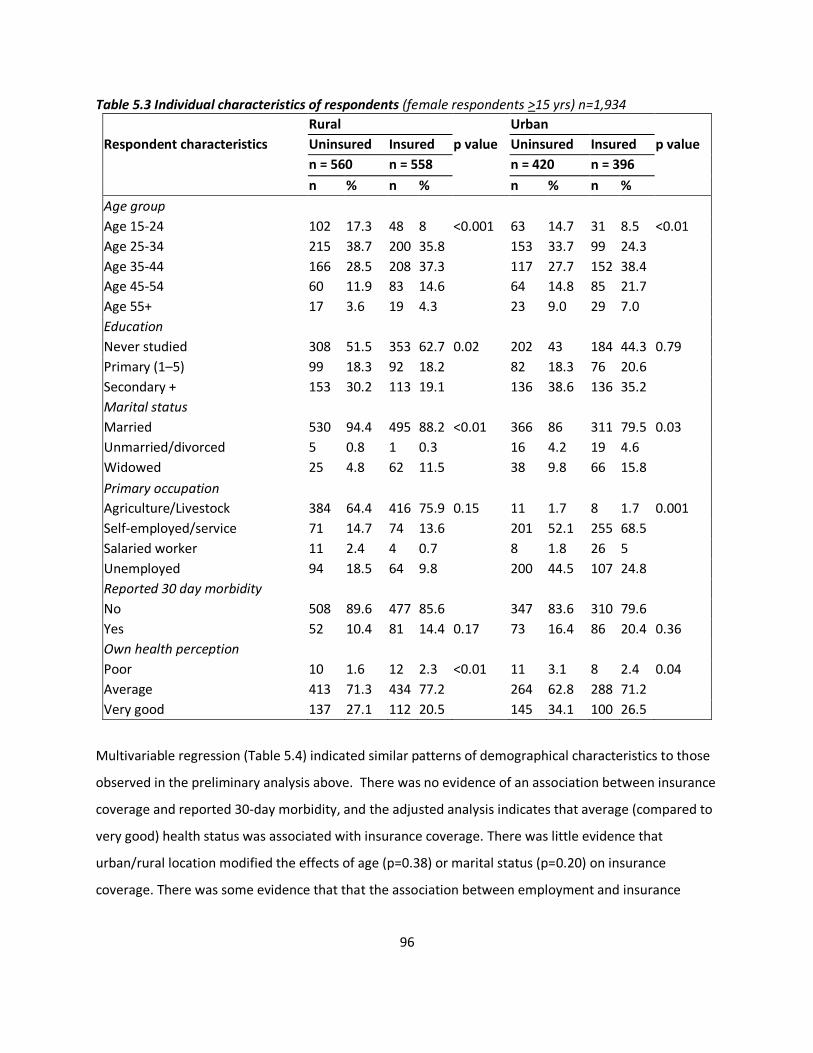
96
Table 5.3 Individual characteristics of respondents (female respondents >15 yrs) n=1,934
Rural Urban
Respondent characteristics Uninsured Insured p value Uninsured Insured p value
n = 560 n = 558 n = 420 n = 396
n % n % n % n %
Age group
Age 15-24 102 17.3 48 8 <0.001 63 14.7 31 8.5 <0.01
Age 25-34 215 38.7 200 35.8 153 33.7 99 24.3
Age 35-44 166 28.5 208 37.3 117 27.7 152 38.4
Age 45-54 60 11.9 83 14.6 64 14.8 85 21.7
Age 55+ 17 3.6 19 4.3 23 9.0 29 7.0
Education
Never studied 308 51.5 353 62.7 0.02 202 43 184 44.3 0.79
Primary (1–5) 99 18.3 92 18.2 82 18.3 76 20.6
Secondary + 153 30.2 113 19.1 136 38.6 136 35.2
Marital status
Married 530 94.4 495 88.2 <0.01 366 86 311 79.5 0.03
Unmarried/divorced 5 0.8 1 0.3 16 4.2 19 4.6
Widowed 25 4.8 62 11.5 38 9.8 66 15.8
Primary occupation
Agriculture/Livestock 384 64.4 416 75.9 0.15 11 1.7 8 1.7 0.001
Self-employed/service 71 14.7 74 13.6 201 52.1 255 68.5
Salaried worker 11 2.4 4 0.7 8 1.8 26 5
Unemployed 94 18.5 64 9.8 200 44.5 107 24.8
Reported 30 day morbidity
No 508 89.6 477 85.6 347 83.6 310 79.6
Yes 52 10.4 81 14.4 0.17 73 16.4 86 20.4 0.36
Own health perception
Poor 10 1.6 12 2.3 <0.01 11 3.1 8 2.4 0.04
Average 413 71.3 434 77.2 264 62.8 288 71.2
Very good 137 27.1 112 20.5 145 34.1 100 26.5
Multivariable regression (Table 5.4) indicated similar patterns of demographical characteristics to those
observed in the preliminary analysis above. There was no evidence of an association between insurance
coverage and reported 30-day morbidity, and the adjusted analysis indicates that average (compared to
very good) health status was associated with insurance coverage. There was little evidence that
urban/rural location modified the effects of age (p=0.38) or marital status (p=0.20) on insurance
coverage. There was some evidence that that the association between employment and insurance
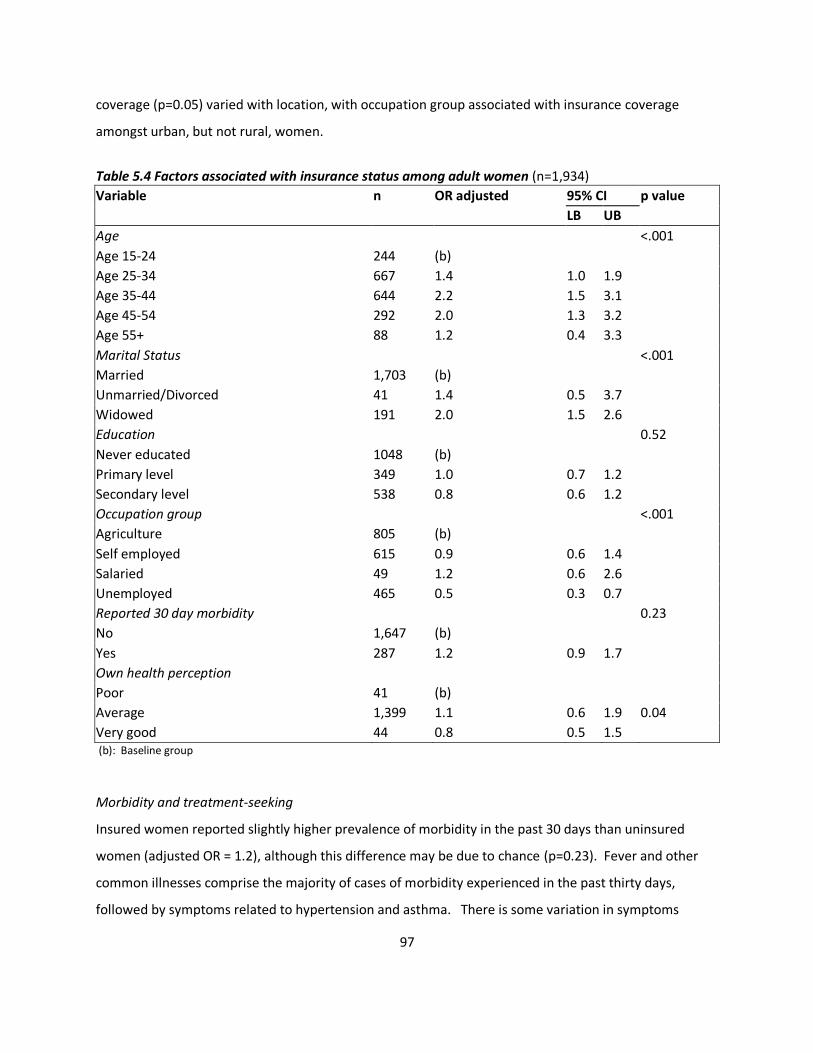
97
coverage (p=0.05) varied with location, with occupation group associated with insurance coverage
amongst urban, but not rural, women.
Table 5.4 Factors associated with insurance status among adult women (n=1,934)
Variable n OR adjusted 95% CI p value
LB UB
Age <.001
Age 15-24 244 (b)
Age 25-34 667 1.4 1.0 1.9
Age 35-44 644 2.2 1.5 3.1
Age 45-54 292 2.0 1.3 3.2
Age 55+ 88 1.2 0.4 3.3
Marital Status <.001
Married 1,703 (b)
Unmarried/Divorced 41 1.4 0.5 3.7
Widowed 191 2.0 1.5 2.6
Education 0.52
Never educated 1048 (b)
Primary level 349 1.0 0.7 1.2
Secondary level 538 0.8 0.6 1.2
Occupation group <.001
Agriculture 805 (b)
Self employed 615 0.9 0.6 1.4
Salaried 49 1.2 0.6 2.6
Unemployed 465 0.5 0.3 0.7
Reported 30 day morbidity 0.23
No 1,647 (b)
Yes 287 1.2 0.9 1.7
Own health perception
Poor 41 (b)
Average 1,399 1.1 0.6 1.9 0.04
Very good 44 0.8 0.5 1.5 (b): Baseline group
Morbidity and treatment-seeking
Insured women reported slightly higher prevalence of morbidity in the past 30 days than uninsured
women (adjusted OR = 1.2), although this difference may be due to chance (p=0.23). Fever and other
common illnesses comprise the majority of cases of morbidity experienced in the past thirty days,
followed by symptoms related to hypertension and asthma. There is some variation in symptoms
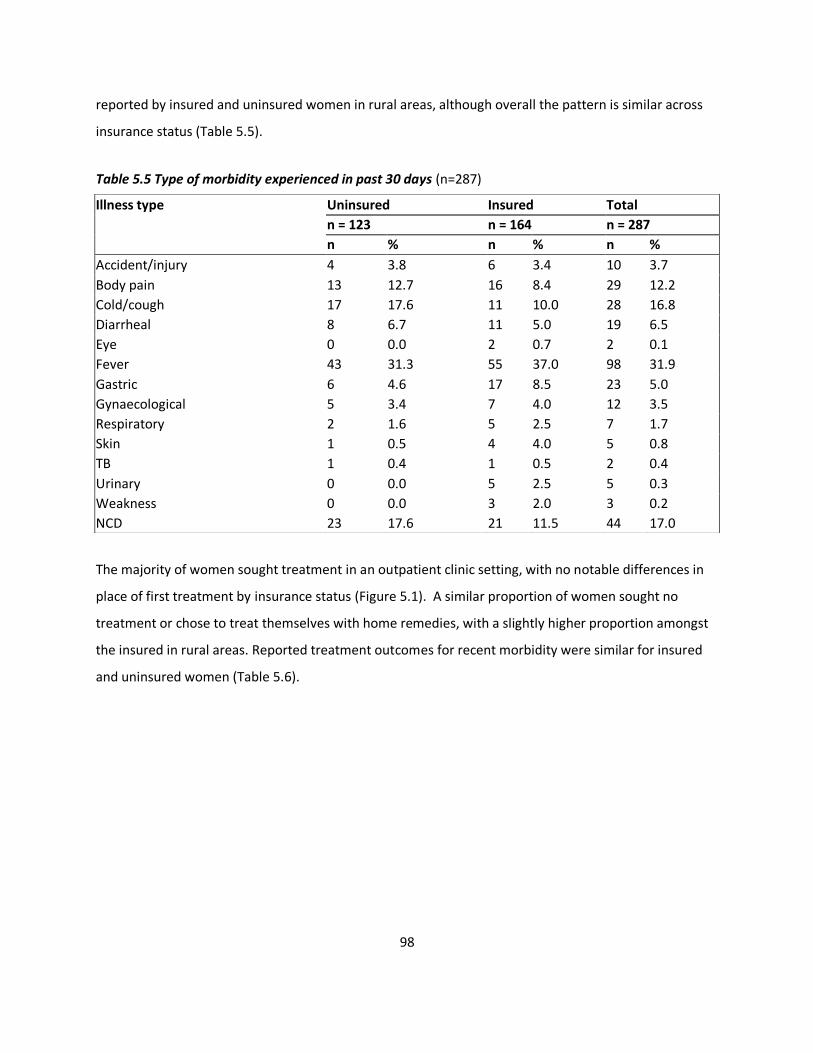
98
reported by insured and uninsured women in rural areas, although overall the pattern is similar across
insurance status (Table 5.5).
Table 5.5 Type of morbidity experienced in past 30 days (n=287)
The majority of women sought treatment in an outpatient clinic setting, with no notable differences in
place of first treatment by insurance status (Figure 5.1). A similar proportion of women sought no
treatment or chose to treat themselves with home remedies, with a slightly higher proportion amongst
the insured in rural areas. Reported treatment outcomes for recent morbidity were similar for insured
and uninsured women (Table 5.6).
Illness type Uninsured Insured Total
n = 123 n = 164 n = 287
n % n % n %
Accident/injury 4 3.8 6 3.4 10 3.7
Body pain 13 12.7 16 8.4 29 12.2
Cold/cough 17 17.6 11 10.0 28 16.8
Diarrheal 8 6.7 11 5.0 19 6.5
Eye 0 0.0 2 0.7 2 0.1
Fever 43 31.3 55 37.0 98 31.9
Gastric 6 4.6 17 8.5 23 5.0
Gynaecological 5 3.4 7 4.0 12 3.5
Respiratory 2 1.6 5 2.5 7 1.7
Skin 1 0.5 4 4.0 5 0.8
TB 1 0.4 1 0.5 2 0.4
Urinary 0 0.0 5 2.5 5 0.3
Weakness 0 0.0 3 2.0 3 0.2
NCD 23 17.6 21 11.5 44 17.0
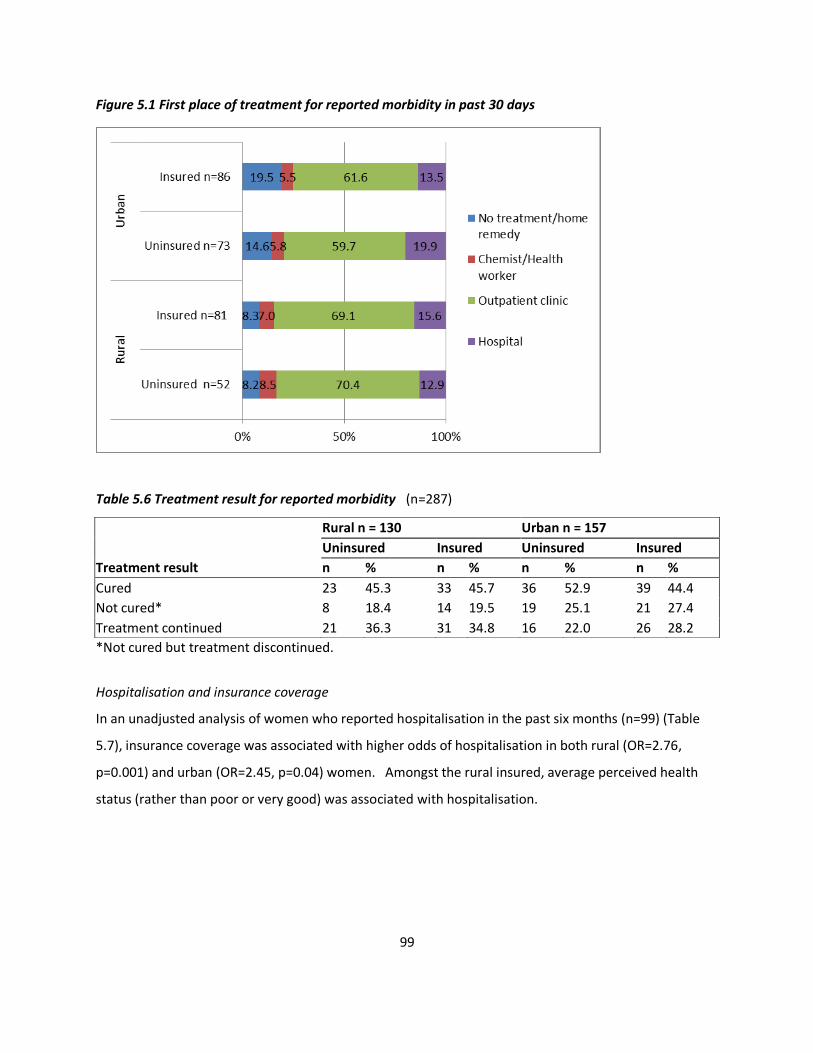
99
Figure 5.1 First place of treatment for reported morbidity in past 30 days
Table 5.6 Treatment result for reported morbidity (n=287)
*Not cured but treatment discontinued.
Hospitalisation and insurance coverage
In an unadjusted analysis of women who reported hospitalisation in the past six months (n=99) (Table
5.7), insurance coverage was associated with higher odds of hospitalisation in both rural (OR=2.76,
p=0.001) and urban (OR=2.45, p=0.04) women. Amongst the rural insured, average perceived health
status (rather than poor or very good) was associated with hospitalisation.
Rural n = 130 Urban n = 157
Uninsured Insured Uninsured Insured
Treatment result n % n % n % n %
Cured 23 45.3 33 45.7 36 52.9 39 44.4
Not cured* 8 18.4 14 19.5 19 25.1 21 27.4
Treatment continued 21 36.3 31 34.8 16 22.0 26 28.2
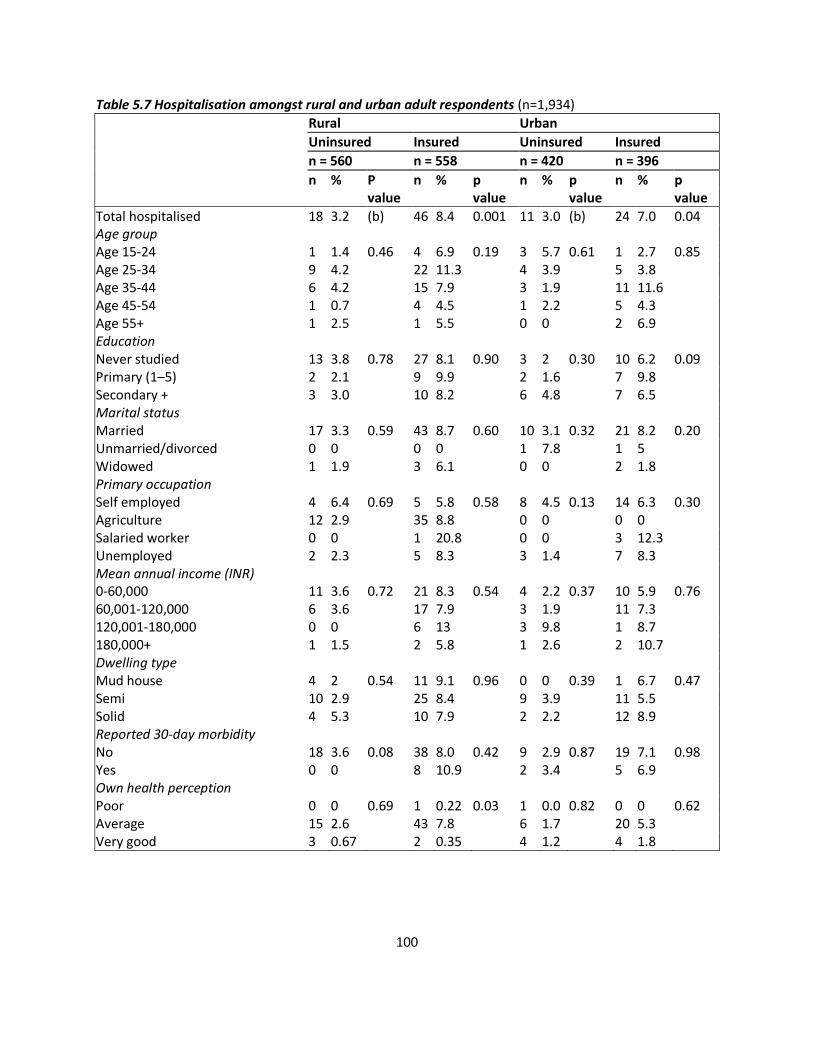
100
Table 5.7 Hospitalisation amongst rural and urban adult respondents (n=1,934)
Rural Urban
Uninsured Insured Uninsured Insured
n = 560 n = 558 n = 420 n = 396
n % P n % p n % p n % p value value value value
Total hospitalised 18 3.2 (b) 46 8.4 0.001 11 3.0 (b) 24 7.0 0.04 Age group Age 15-24 1 1.4 0.46 4 6.9 0.19 3 5.7 0.61 1 2.7 0.85 Age 25-34 9 4.2 22 11.3 4 3.9 5 3.8 Age 35-44 6 4.2 15 7.9 3 1.9 11 11.6 Age 45-54 1 0.7 4 4.5 1 2.2 5 4.3 Age 55+ 1 2.5 1 5.5 0 0 2 6.9 Education Never studied 13 3.8 0.78 27 8.1 0.90 3 2 0.30 10 6.2 0.09 Primary (1–5) 2 2.1 9 9.9 2 1.6 7 9.8 Secondary + 3 3.0 10 8.2 6 4.8 7 6.5 Marital status Married 17 3.3 0.59 43 8.7 0.60 10 3.1 0.32 21 8.2 0.20 Unmarried/divorced 0 0 0 0 1 7.8 1 5 Widowed 1 1.9 3 6.1 0 0 2 1.8 Primary occupation Self employed 4 6.4 0.69 5 5.8 0.58 8 4.5 0.13 14 6.3 0.30 Agriculture 12 2.9 35 8.8 0 0 0 0 Salaried worker 0 0 1 20.8 0 0 3 12.3 Unemployed 2 2.3 5 8.3 3 1.4 7 8.3 Mean annual income (INR) 0-60,000 11 3.6 0.72 21 8.3 0.54 4 2.2 0.37 10 5.9 0.76 60,001-120,000 6 3.6 17 7.9 3 1.9 11 7.3 120,001-180,000 0 0 6 13 3 9.8 1 8.7 180,000+ 1 1.5 2 5.8 1 2.6 2 10.7 Dwelling type Mud house 4 2 0.54 11 9.1 0.96 0 0 0.39 1 6.7 0.47 Semi 10 2.9 25 8.4 9 3.9 11 5.5 Solid 4 5.3 10 7.9 2 2.2 12 8.9 Reported 30-day morbidity No 18 3.6 0.08 38 8.0 0.42 9 2.9 0.87 19 7.1 0.98 Yes 0 0 8 10.9 2 3.4 5 6.9 Own health perception Poor 0 0 0.69 1 0.22 0.03 1 0.0 0.82 0 0 0.62 Average 15 2.6 43 7.8 6 1.7 20 5.3 Very good 3 0.67 2 0.35 4 1.2 4 1.8
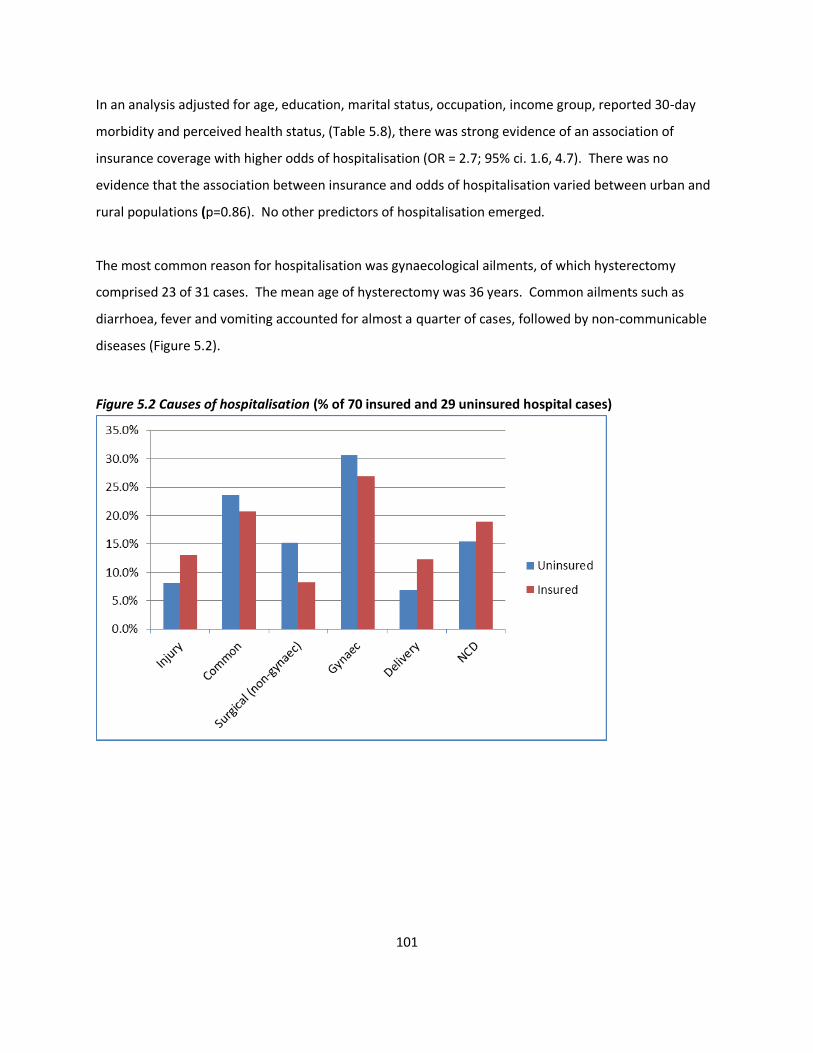
101
In an analysis adjusted for age, education, marital status, occupation, income group, reported 30-day
morbidity and perceived health status, (Table 5.8), there was strong evidence of an association of
insurance coverage with higher odds of hospitalisation (OR = 2.7; 95% ci. 1.6, 4.7). There was no
evidence that the association between insurance and odds of hospitalisation varied between urban and
rural populations (p=0.86). No other predictors of hospitalisation emerged.
The most common reason for hospitalisation was gynaecological ailments, of which hysterectomy
comprised 23 of 31 cases. The mean age of hysterectomy was 36 years. Common ailments such as
diarrhoea, fever and vomiting accounted for almost a quarter of cases, followed by non-communicable
diseases (Figure 5.2).
Figure 5.2 Causes of hospitalisation (% of 70 insured and 29 uninsured hospital cases)
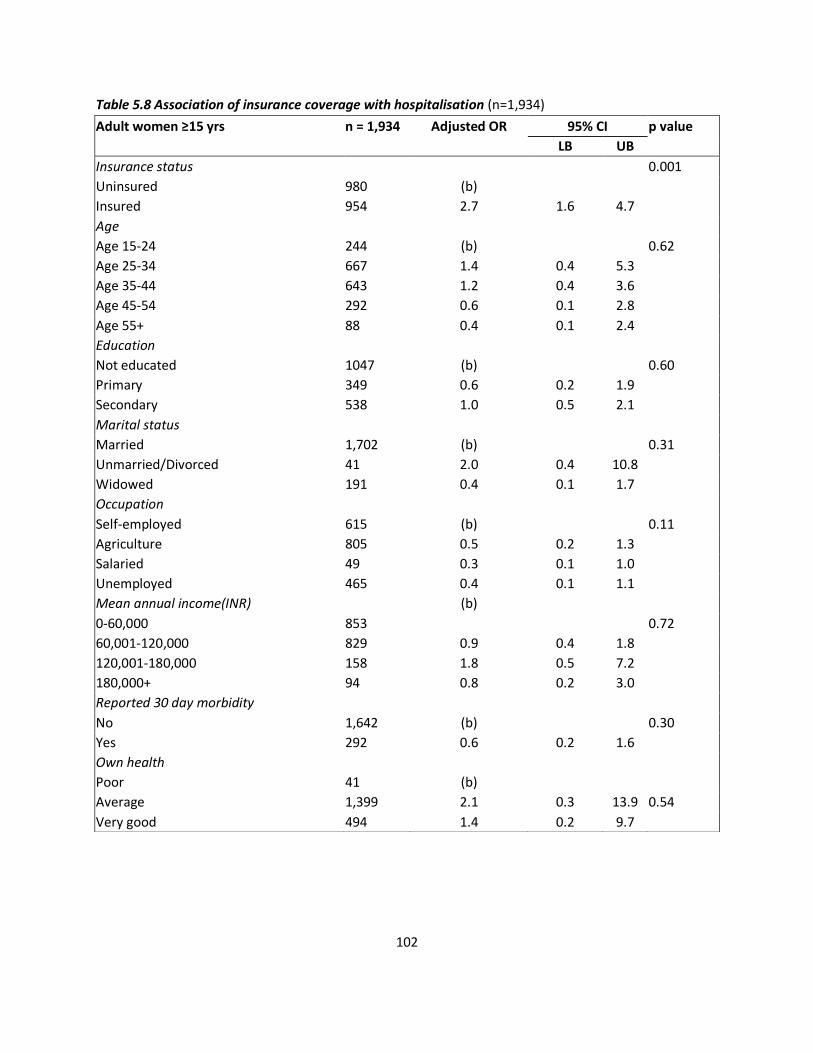
102
Table 5.8 Association of insurance coverage with hospitalisation (n=1,934)
Adult women ≥15 yrs n = 1,934 Adjusted OR 95% CI p value
LB UB
Insurance status 0.001
Uninsured 980 (b)
Insured 954 2.7 1.6 4.7
Age
Age 15-24 244 (b) 0.62
Age 25-34 667 1.4 0.4 5.3
Age 35-44 643 1.2 0.4 3.6
Age 45-54 292 0.6 0.1 2.8
Age 55+ 88 0.4 0.1 2.4
Education
Not educated 1047 (b) 0.60
Primary 349 0.6 0.2 1.9
Secondary 538 1.0 0.5 2.1
Marital status
Married 1,702 (b) 0.31
Unmarried/Divorced 41 2.0 0.4 10.8
Widowed 191 0.4 0.1 1.7
Occupation
Self-employed 615 (b) 0.11
Agriculture 805 0.5 0.2 1.3
Salaried 49 0.3 0.1 1.0
Unemployed 465 0.4 0.1 1.1
Mean annual income(INR) (b)
0-60,000 853 0.72
60,001-120,000 829 0.9 0.4 1.8
120,001-180,000 158 1.8 0.5 7.2
180,000+ 94 0.8 0.2 3.0
Reported 30 day morbidity
No 1,642 (b) 0.30
Yes 292 0.6 0.2 1.6
Own health
Poor 41 (b)
Average 1,399 2.1 0.3 13.9 0.54
Very good 494 1.4 0.2 9.7
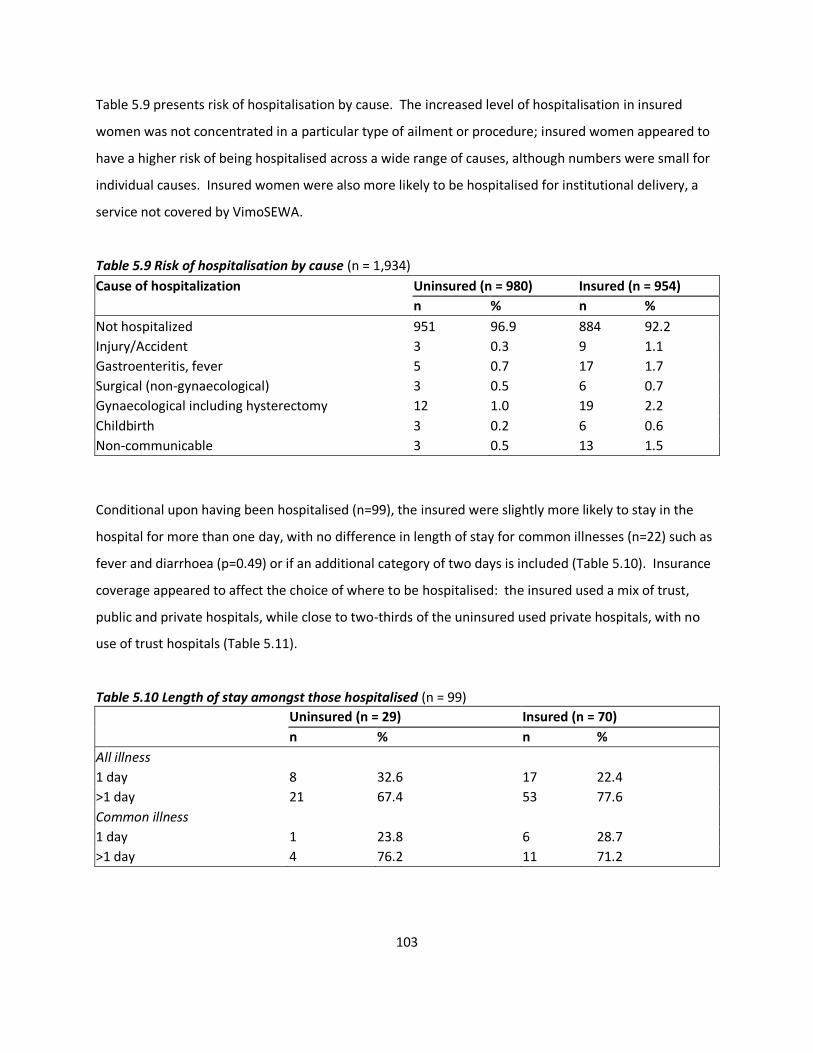
103
Table 5.9 presents risk of hospitalisation by cause. The increased level of hospitalisation in insured
women was not concentrated in a particular type of ailment or procedure; insured women appeared to
have a higher risk of being hospitalised across a wide range of causes, although numbers were small for
individual causes. Insured women were also more likely to be hospitalised for institutional delivery, a
service not covered by VimoSEWA.
Table 5.9 Risk of hospitalisation by cause (n = 1,934)
Conditional upon having been hospitalised (n=99), the insured were slightly more likely to stay in the
hospital for more than one day, with no difference in length of stay for common illnesses (n=22) such as
fever and diarrhoea (p=0.49) or if an additional category of two days is included (Table 5.10). Insurance
coverage appeared to affect the choice of where to be hospitalised: the insured used a mix of trust,
public and private hospitals, while close to two-thirds of the uninsured used private hospitals, with no
use of trust hospitals (Table 5.11).
Table 5.10 Length of stay amongst those hospitalised (n = 99)
Uninsured (n = 29) Insured (n = 70)
n % n %
All illness
1 day 8 32.6 17 22.4
>1 day 21 67.4 53 77.6
Common illness
1 day 1 23.8 6 28.7
>1 day 4 76.2 11 71.2
Cause of hospitalization Uninsured (n = 980) Insured (n = 954)
n % n %
Not hospitalized 951 96.9 884 92.2
Injury/Accident 3 0.3 9 1.1
Gastroenteritis, fever 5 0.7 17 1.7
Surgical (non-gynaecological) 3 0.5 6 0.7
Gynaecological including hysterectomy 12 1.0 19 2.2
Childbirth 3 0.2 6 0.6
Non-communicable 3 0.5 13 1.5
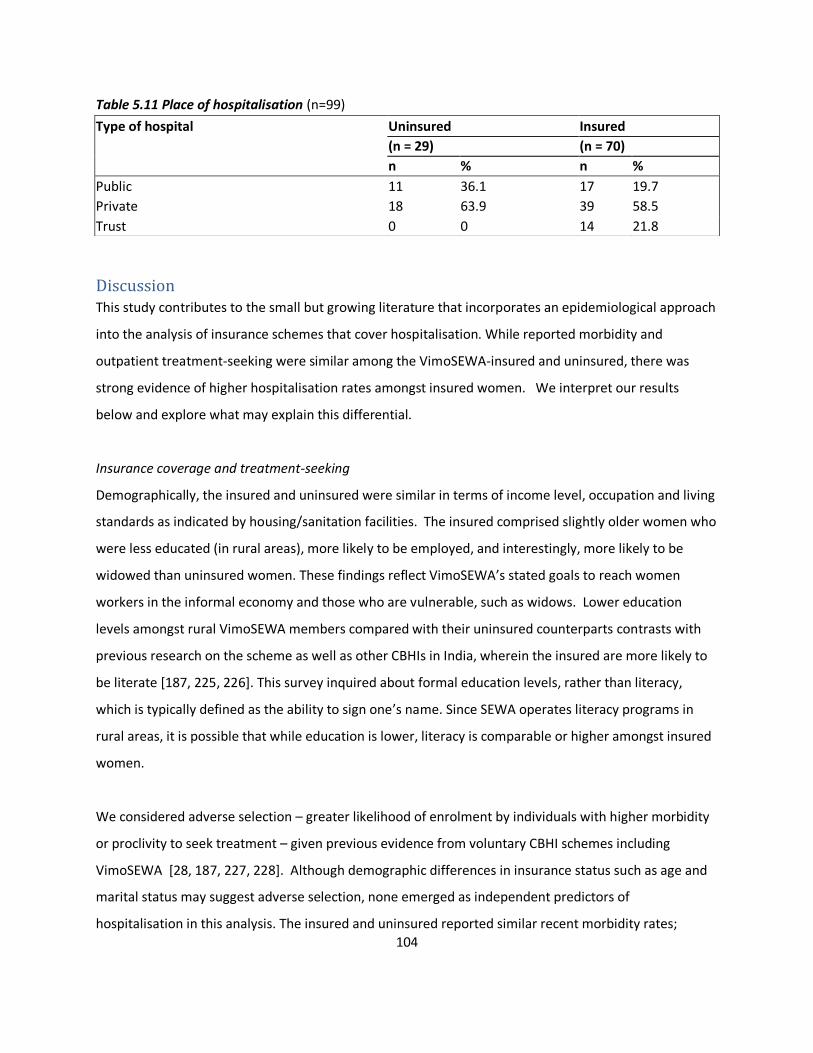
104
Table 5.11 Place of hospitalisation (n=99)
Discussion This study contributes to the small but growing literature that incorporates an epidemiological approach
into the analysis of insurance schemes that cover hospitalisation. While reported morbidity and
outpatient treatment-seeking were similar among the VimoSEWA-insured and uninsured, there was
strong evidence of higher hospitalisation rates amongst insured women. We interpret our results
below and explore what may explain this differential.
Insurance coverage and treatment-seeking
Demographically, the insured and uninsured were similar in terms of income level, occupation and living
standards as indicated by housing/sanitation facilities. The insured comprised slightly older women who
were less educated (in rural areas), more likely to be employed, and interestingly, more likely to be
widowed than uninsured women. These findings reflect VimoSEWA’s stated goals to reach women
workers in the informal economy and those who are vulnerable, such as widows. Lower education
levels amongst rural VimoSEWA members compared with their uninsured counterparts contrasts with
previous research on the scheme as well as other CBHIs in India, wherein the insured are more likely to
be literate [187, 225, 226]. This survey inquired about formal education levels, rather than literacy,
which is typically defined as the ability to sign one’s name. Since SEWA operates literacy programs in
rural areas, it is possible that while education is lower, literacy is comparable or higher amongst insured
women.
We considered adverse selection – greater likelihood of enrolment by individuals with higher morbidity
or proclivity to seek treatment – given previous evidence from voluntary CBHI schemes including
VimoSEWA [28, 187, 227, 228]. Although demographic differences in insurance status such as age and
marital status may suggest adverse selection, none emerged as independent predictors of
hospitalisation in this analysis. The insured and uninsured reported similar recent morbidity rates;
Type of hospital Uninsured Insured
(n = 29) (n = 70)
n % n %
Public 11 36.1 17 19.7
Private 18 63.9 39 58.5
Trust 0 0 14 21.8
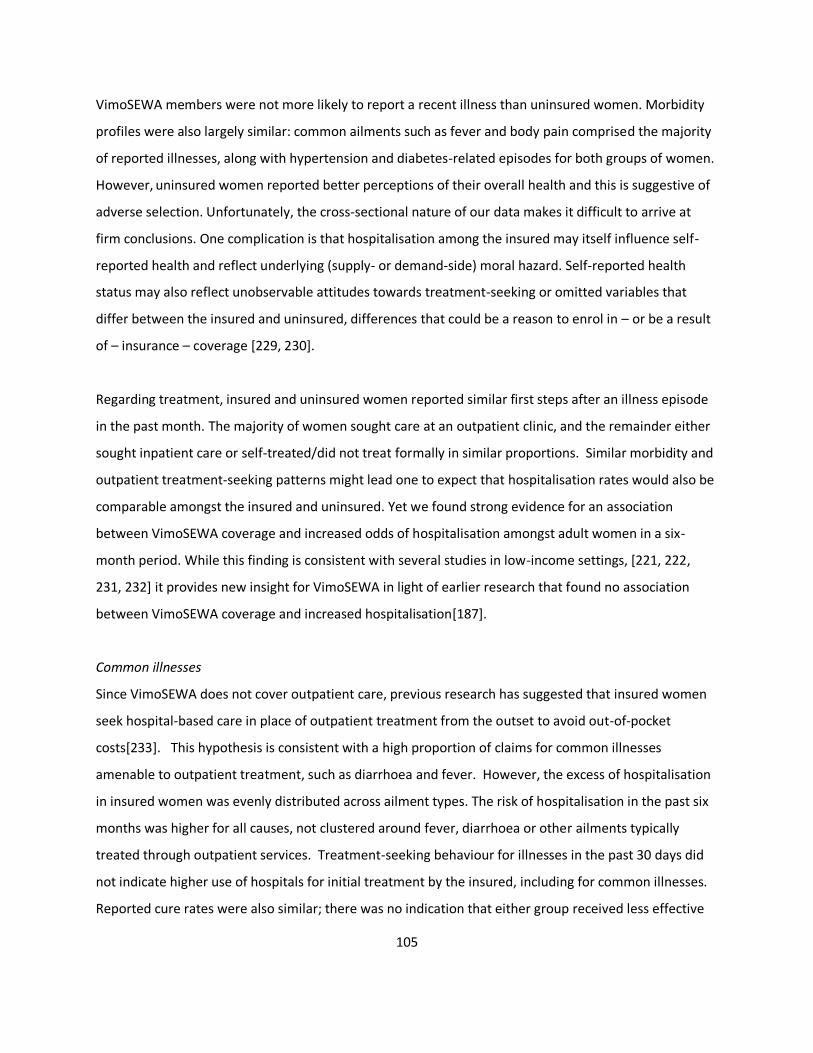
105
VimoSEWA members were not more likely to report a recent illness than uninsured women. Morbidity
profiles were also largely similar: common ailments such as fever and body pain comprised the majority
of reported illnesses, along with hypertension and diabetes-related episodes for both groups of women.
However, uninsured women reported better perceptions of their overall health and this is suggestive of
adverse selection. Unfortunately, the cross-sectional nature of our data makes it difficult to arrive at
firm conclusions. One complication is that hospitalisation among the insured may itself influence self-
reported health and reflect underlying (supply- or demand-side) moral hazard. Self-reported health
status may also reflect unobservable attitudes towards treatment-seeking or omitted variables that
differ between the insured and uninsured, differences that could be a reason to enrol in – or be a result
of – insurance – coverage [229, 230].
Regarding treatment, insured and uninsured women reported similar first steps after an illness episode
in the past month. The majority of women sought care at an outpatient clinic, and the remainder either
sought inpatient care or self-treated/did not treat formally in similar proportions. Similar morbidity and
outpatient treatment-seeking patterns might lead one to expect that hospitalisation rates would also be
comparable amongst the insured and uninsured. Yet we found strong evidence for an association
between VimoSEWA coverage and increased odds of hospitalisation amongst adult women in a six-
month period. While this finding is consistent with several studies in low-income settings, [221, 222,
231, 232] it provides new insight for VimoSEWA in light of earlier research that found no association
between VimoSEWA coverage and increased hospitalisation[187].
Common illnesses
Since VimoSEWA does not cover outpatient care, previous research has suggested that insured women
seek hospital-based care in place of outpatient treatment from the outset to avoid out-of-pocket
costs[233]. This hypothesis is consistent with a high proportion of claims for common illnesses
amenable to outpatient treatment, such as diarrhoea and fever. However, the excess of hospitalisation
in insured women was evenly distributed across ailment types. The risk of hospitalisation in the past six
months was higher for all causes, not clustered around fever, diarrhoea or other ailments typically
treated through outpatient services. Treatment-seeking behaviour for illnesses in the past 30 days did
not indicate higher use of hospitals for initial treatment by the insured, including for common illnesses.
Reported cure rates were also similar; there was no indication that either group received less effective
106
outpatient care. Further, the length of stay for inpatient hospitalisations – including the proportion of
those hospitalised for a 24-hour visit – was similar to that of the uninsured. Insured women were not
more likely to be admitted for the minimum one-day period which would qualify for reimbursement.
Taken with the opportunity cost associated with hospitalisation for women in the informal sector, this
analysis suggests that any substitution of inpatient for outpatient care for common illnesses (a form of
moral hazard) by VimoSEWA members may be small.
More insight is provided by recent qualitative research with VimoSEWA-insured urban women who had
been hospitalised for fever. Most women indicated that hospitalisation was only sought after outpatient
treatment repeatedly failed[234]. Women preferred outpatient care as a first step because it involves
lower opportunity costs than hospitalisation – which is consistent with our finding of similar morbidity
and outpatient-treatment seeking amongst the insured and uninsured. From insured women’s
perspectives, hospitalisation was viewed as a last resort to access more potent treatment. The
knowledge that partial costs would be covered by VimoSEWA offered security in the decision-making
process. Providers indicated that when they suggest hospitalisation for persistent fever or minor
ailments that have become more severe, insured women are more likely to agree. Despite VimoSEWA’s
relatively low coverage amounts, this qualitative research suggests that we cannot rule out either
provider-induced or demand-side moral hazard.
Hysterectomy
We examined if the higher hospitalisation rate amongst insured women could be partly explained by
higher rates of hysterectomy. Insured women reported slightly higher odds of undergoing a
hysterectomy than the uninsured in the past six months, but this difference may be due to chance
(p=0.13). The mean ages at which insured and uninsured women underwent hysterectomy were similar
– and relatively young by global standards. The reasons reported for hysterectomy, also similar amongst
insured and uninsured women, were gynaecological ailments (fibroids, cysts, menstrual difficulty and to
a lesser extent, uterine prolapse) – most of which are amenable to non-invasive, first-line treatment. In
a separate analysis of our survey data we found that the proportion of women reporting having ‘ever
undergone hysterectomy’ (instead of in a 6-month reference period) was similar between insured and
uninsured women, but we did not know their insurance status at the time of the hysterectomy[235].
107
The data available thus far suggest that having insurance may influence hysterectomy related
hospitalisations, possibly as one of a complex set of factors. The coverage provided by VimoSEWA of Rs.
2,000-5,000 covers a significant chunk of the total cost of a hysterectomy (which typically ranges from
Rs. 4,000-10,000). Previous qualitative research at SEWA has also identified questionable provider
practices, such as conducting hysterectomy on demand or as first-line treatment before less invasive
procedures. Provider behaviour is likely to influence the incidence of hysterectomy among women in
their mid-thirties – but these practices are likely not limited to insured women or solely in the private
sector [235, 236]. We are currently exploring the health system and social determinants of
hysterectomy through in-depth qualitative research. Initial findings suggest that a high burden of
untreated gynaecological morbidity, the lack of primary gynaecological care, treatment practices in both
the government and private sectors, and women’s demand for the procedure also contribute to the
incidence of hysterectomy in both insured and uninsured women.
Why higher hospitalisation?
In the absence of strong evidence that i) having insurance promotes hospitalisation for common
illnesses ii) insurance coverage is the primary driver of unnecessary hysterectomy, we explore other
possible explanations for higher inpatient admission amongst the insured. One well-established
interpretation in the literature is that CBHI is associated with higher utilisation by removing financial
barriers to hospitalisation [221-223, 232]. This could explain why VimoSEWA coverage is associated
with higher odds of hospitalisation in this survey, but not previously in the 2001 analysis by Ranson,
when cashless admission facilities were not available. Previous research at VimoSEWA indicates that
cashless procedures increases claims submissions overall, but does not improve access to hospitalisation
for the poorest[237].
A second reason for higher hospitalisation may be that the insured have greater knowledge/confidence
in negotiating hospitals, resulting in greater utilisation of inpatient care. Fear of navigating complicated
hospital admissions procedures has previously been identified as a barrier to both hospitalisation and
claims submission, especially amongst the poorest and those living in rural areas[185]. The greater
likelihood of seeking hospitalisation could either be a characteristic of insured women, or a result of
being insured.
108
It is possible that women at ease with health services are more likely to enrol in VimoSEWA in the first
place. A higher prevalence of institutional deliveries – a service not covered by VimoSEWA –
underscores this possibility. Women insured by a CBHI in South India that covers maternity care were
twice as likely to deliver in an institution compared to uninsured women[221], while research in three
African countries has found that women CBHI-insured women do not utilise maternal health services at
higher rates if they are not included in the scheme coverage[238]. In this context, it is possible that
VimoSEWA membership attracts women more likely to use inpatient services, suggesting adverse
selection.
Membership in VimoSEWA itself may result in greater negotiating power. Particularly in the surveyed
areas, VimoSEWA members are in continued contact with a concentrated force of grassroots SEWA
health and insurance workers who live in the community. CHWs regularly accompany SEWA members
(not only the insured) to hospitals and facilitate admission when required – ensuring accessibility to
hospitalisation and easier navigation of complicated paperwork, even when procedures are not covered
by insurance. In addition to CHWs, VimoSEWA members have the added benefit of dedicated insurance
workers. Thus it is plausible that insurance coverage results in women being more able, and perhaps
more inclined, to seek inpatient care when required.
Apart from the mechanisms above, insurance coverage may trigger a different decision-making process
regarding place and type of treatment, both for women and providers. To illustrate, no uninsured
women in the survey population reported use of a non-profit trust hospital, compared to 22 percent of
the insured, in the past six months. Since VimoSEWA’s cashless procedures are only available at
empanelled hospitals, one-third of which are trust hospitals, the insured are encouraged to seek care at
specific institutions. If empanelled providers are incentivised by guaranteed revenue from insured
patients, they may provide advice that promotes hospitalisation. Further research is required to explore
the treatment decision-making process, and the role, if any, played by moral hazard.
Study limitations
The research questions addressed arose directly from our experience working with SEWA Health and
VimoSEWA; these findings are likely to resonate with both managers and researchers linked to CBHI
schemes in low-income settings. Because VimoSEWA’s primary policyholders are women, we did not
109
assess gender differentials or the effect of a women-centred scheme on rationing of health care within
the household. As in most household surveys, our analysis is limited by a reliance on self-reported
morbidity [229, 230]. We confirmed that the pattern of hospitalisation reasons reported by insured
women matched that of the VimoSEWA claims database. However, if rates of self-reported morbidity
were inaccurate, our analysis may have masked an association of recent morbidity with insurance
coverage. Accordingly, our understanding of the pathways associated with greater hospitalisation
amongst insured women would change.
If insured women had better recall of hospitalisation in the past six months due to interaction with
VimoSEWA, we may have underestimated, or inaccurately categorised reasons for, hospitalisation
amongst the uninsured. Lastly, this cross-sectional analysis is limited by an inability to capture
unobservable characteristics or omitted variables that may differ systematically between the insured
and uninsured; our findings may be biased accordingly.
Conclusion
From the perspective of a CBHI, increased hospitalisation across a wide range of conditions may reflect
the mission to increase access to care. From a public health perspective, however, our findings are of
concern. Why is hospitalisation for fever, diarrhoea and gastroenteritis amongst adult women common
in the first place? Poor sanitation and limited preventive health practices result in widespread,
persistent waterborne ailments. The failure of outpatient care, as indicated by qualitative findings,
eventually leads insured women who can seek hospitalisation to do so, in hopes of more effective
treatment. In this scenario, insurance appears to compensate for weaknesses in the health system,
albeit at a cost to women. Without preventive health measures and quality outpatient care, these illness
patterns are likely to persist – and should be of concern both to health policymakers and CBHIs.
Similarly, hysterectomy amongst insured and uninsured women in their mid-thirties is symptomatic of
major gaps in the health system, as well as attitudes towards intervention in women’s bodies. Lack of
gynaecological care at the primary level, poor knowledge of side effects, provider attitudes that
encourage intervention and sociocultural factors all likely play a role in promoting hysterectomy as a
common, first-line gynaecological treatment. While insurance, particularly packages with larger
coverage than VimoSEWA may facilitate medically unnecessary hysterectomies, the comparable
110
prevalence in uninsured women calls attention to the lack of reproductive health care and underlying
determinants of women’s health in general.
Lastly, if the insured indeed enjoy better access to treatment, it is unclear whether they also enjoy
higher quality health care or better health outcomes than those without health insurance. Based on our
findings, morbidity patterns and outpatient care are similar up until the point of hospitalisation – but
there is no indication of whether higher inpatient admission results in better long term health. Thus far,
evaluations of CBHI as well as larger social insurance schemes have focused on the quantitative increase
in utilisation and financial security afforded by coverage, with limited assessment of the associated
effects on health[28, 211, 220]. Encouragingly, a recent study in Burkina Faso has investigated the
association of CBHI coverage with mortality outcomes [239]. As publicly-funded health insurance
schemes such as Rashtriya Swasthya Bima Yojana (RSBY) expand in India and other developing countries,
population health needs, access to quality primary care and longitudinal, health outcomes research
deserve consideration in program and evaluation design.
Competing interests
The authors declare that they have no competing interests.
Authors' contributions
SD and AM conceived the study, and participated in its design and implementation. SD performed the
statistical analysis and drafted the manuscript. TS participated in the study design and implementation.
SC guided the statistical analyses and drafting of the manuscript. All authors read and approved the final
manuscript.
Acknowledgements
We thank colleagues at VimoSEWA and SEWA Health for their support and SEWA Academy for data
collection and fieldwork. We are grateful to the ILO Microinsurance Innovation Facility for financial
support for this research study.
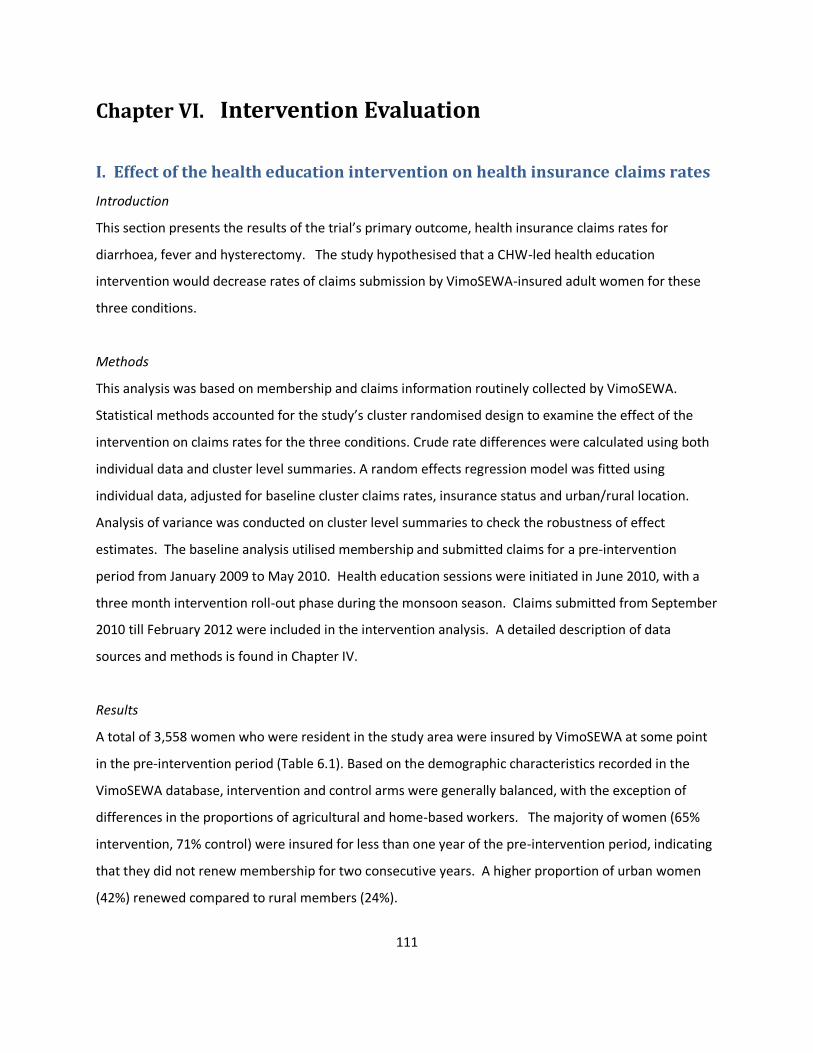
111
Chapter VI. Intervention Evaluation
I. Effect of the health education intervention on health insurance claims rates
Introduction
This section presents the results of the trial’s primary outcome, health insurance claims rates for
diarrhoea, fever and hysterectomy. The study hypothesised that a CHW-led health education
intervention would decrease rates of claims submission by VimoSEWA-insured adult women for these
three conditions.
Methods
This analysis was based on membership and claims information routinely collected by VimoSEWA.
Statistical methods accounted for the study’s cluster randomised design to examine the effect of the
intervention on claims rates for the three conditions. Crude rate differences were calculated using both
individual data and cluster level summaries. A random effects regression model was fitted using
individual data, adjusted for baseline cluster claims rates, insurance status and urban/rural location.
Analysis of variance was conducted on cluster level summaries to check the robustness of effect
estimates. The baseline analysis utilised membership and submitted claims for a pre-intervention
period from January 2009 to May 2010. Health education sessions were initiated in June 2010, with a
three month intervention roll-out phase during the monsoon season. Claims submitted from September
2010 till February 2012 were included in the intervention analysis. A detailed description of data
sources and methods is found in Chapter IV.
Results
A total of 3,558 women who were resident in the study area were insured by VimoSEWA at some point
in the pre-intervention period (Table 6.1). Based on the demographic characteristics recorded in the
VimoSEWA database, intervention and control arms were generally balanced, with the exception of
differences in the proportions of agricultural and home-based workers. The majority of women (65%
intervention, 71% control) were insured for less than one year of the pre-intervention period, indicating
that they did not renew membership for two consecutive years. A higher proportion of urban women
(42%) renewed compared to rural members (24%).
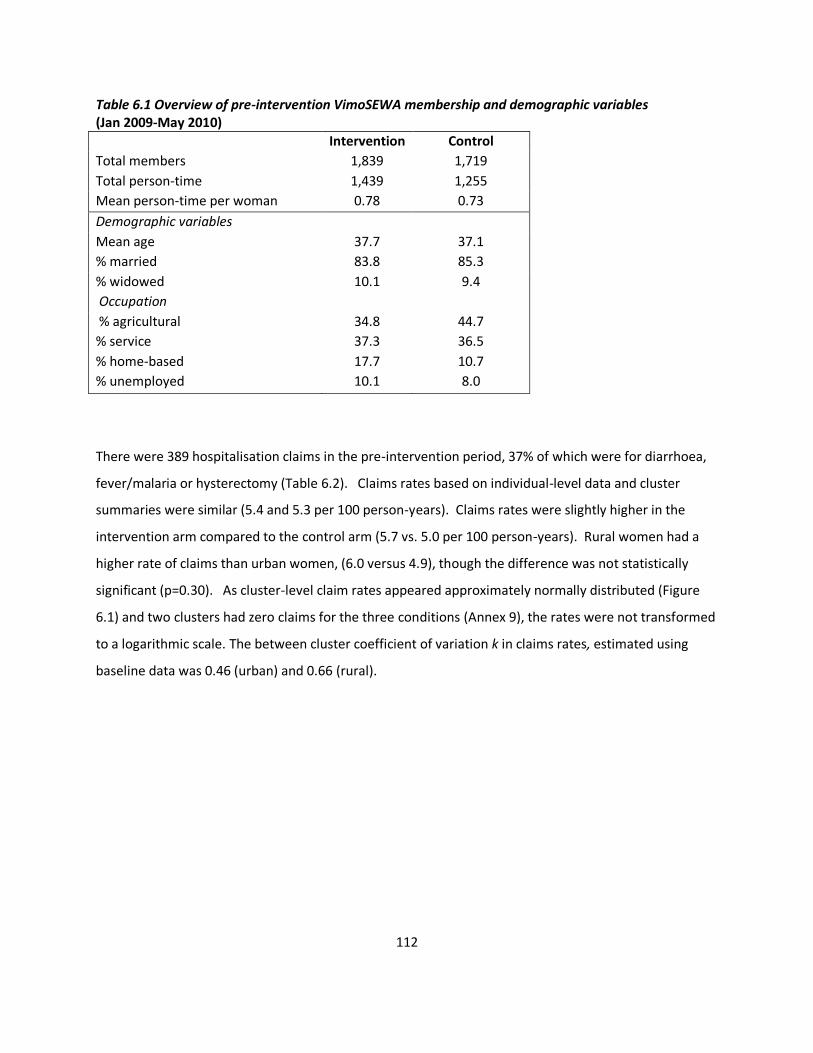
112
Table 6.1 Overview of pre-intervention VimoSEWA membership and demographic variables (Jan 2009-May 2010)
Intervention Control
Total members 1,839 1,719
Total person-time 1,439 1,255
Mean person-time per woman 0.78 0.73
Demographic variables
Mean age 37.7 37.1
% married 83.8 85.3
% widowed 10.1 9.4
Occupation
% agricultural 34.8 44.7
% service 37.3 36.5
% home-based 17.7 10.7
% unemployed 10.1 8.0
There were 389 hospitalisation claims in the pre-intervention period, 37% of which were for diarrhoea,
fever/malaria or hysterectomy (Table 6.2). Claims rates based on individual-level data and cluster
summaries were similar (5.4 and 5.3 per 100 person-years). Claims rates were slightly higher in the
intervention arm compared to the control arm (5.7 vs. 5.0 per 100 person-years). Rural women had a
higher rate of claims than urban women, (6.0 versus 4.9), though the difference was not statistically
significant (p=0.30). As cluster-level claim rates appeared approximately normally distributed (Figure
6.1) and two clusters had zero claims for the three conditions (Annex 9), the rates were not transformed
to a logarithmic scale. The between cluster coefficient of variation k in claims rates, estimated using
baseline data was 0.46 (urban) and 0.66 (rural).
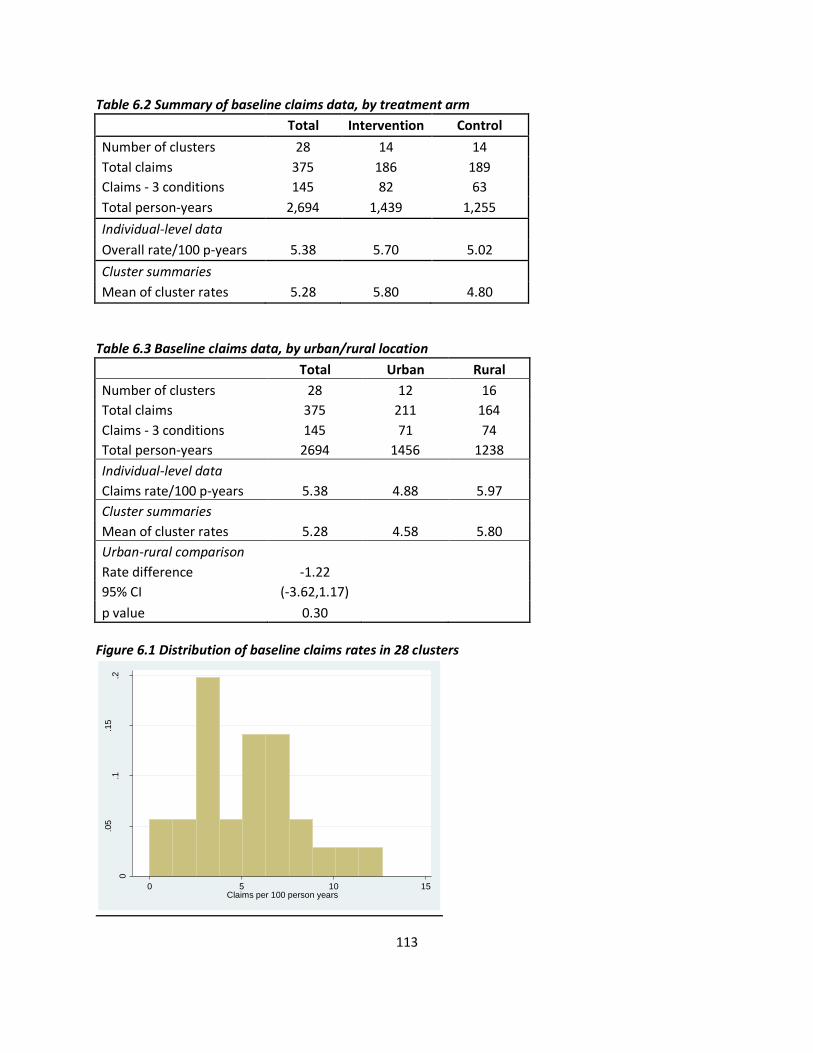
113
Table 6.2 Summary of baseline claims data, by treatment arm
Total Intervention Control
Number of clusters 28 14 14
Total claims 375 186 189
Claims - 3 conditions 145 82 63
Total person-years 2,694 1,439 1,255
Individual-level data
Overall rate/100 p-years 5.38 5.70 5.02
Cluster summaries
Mean of cluster rates 5.28 5.80 4.80
Table 6.3 Baseline claims data, by urban/rural location
Total Urban Rural
Number of clusters 28 12 16
Total claims 375 211 164
Claims - 3 conditions 145 71 74
Total person-years 2694 1456 1238
Individual-level data Claims rate/100 p-years 5.38 4.88 5.97
Cluster summaries Mean of cluster rates 5.28 4.58 5.80
Urban-rural comparison Rate difference -1.22
95% CI (-3.62,1.17) p value 0.30
Figure 6.1 Distribution of baseline claims rates in 28 clusters
0
.05
.1.1
5.2
Den
sity
0 5 10 15Claims per 100 person years
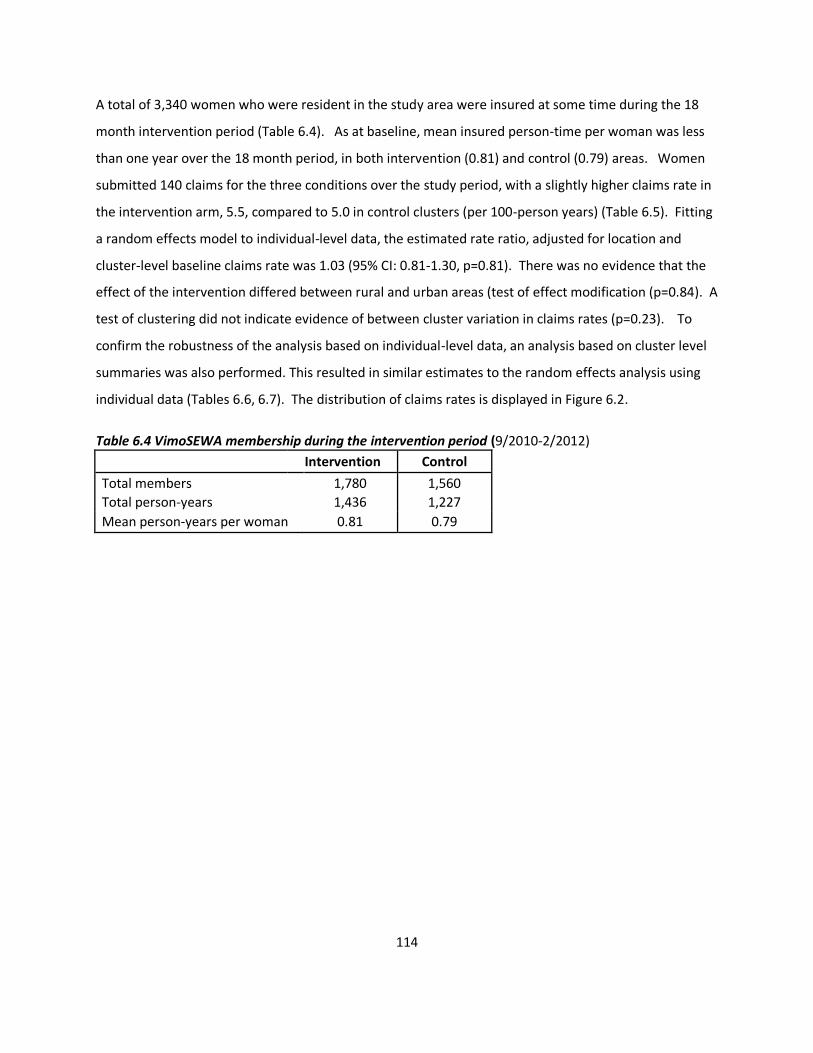
114
A total of 3,340 women who were resident in the study area were insured at some time during the 18
month intervention period (Table 6.4). As at baseline, mean insured person-time per woman was less
than one year over the 18 month period, in both intervention (0.81) and control (0.79) areas. Women
submitted 140 claims for the three conditions over the study period, with a slightly higher claims rate in
the intervention arm, 5.5, compared to 5.0 in control clusters (per 100-person years) (Table 6.5). Fitting
a random effects model to individual-level data, the estimated rate ratio, adjusted for location and
cluster-level baseline claims rate was 1.03 (95% CI: 0.81-1.30, p=0.81). There was no evidence that the
effect of the intervention differed between rural and urban areas (test of effect modification (p=0.84). A
test of clustering did not indicate evidence of between cluster variation in claims rates (p=0.23). To
confirm the robustness of the analysis based on individual-level data, an analysis based on cluster level
summaries was also performed. This resulted in similar estimates to the random effects analysis using
individual data (Tables 6.6, 6.7). The distribution of claims rates is displayed in Figure 6.2.
Table 6.4 VimoSEWA membership during the intervention period (9/2010-2/2012)
Intervention Control
Total members 1,780 1,560
Total person-years 1,436 1,227
Mean person-years per woman 0.81 0.79
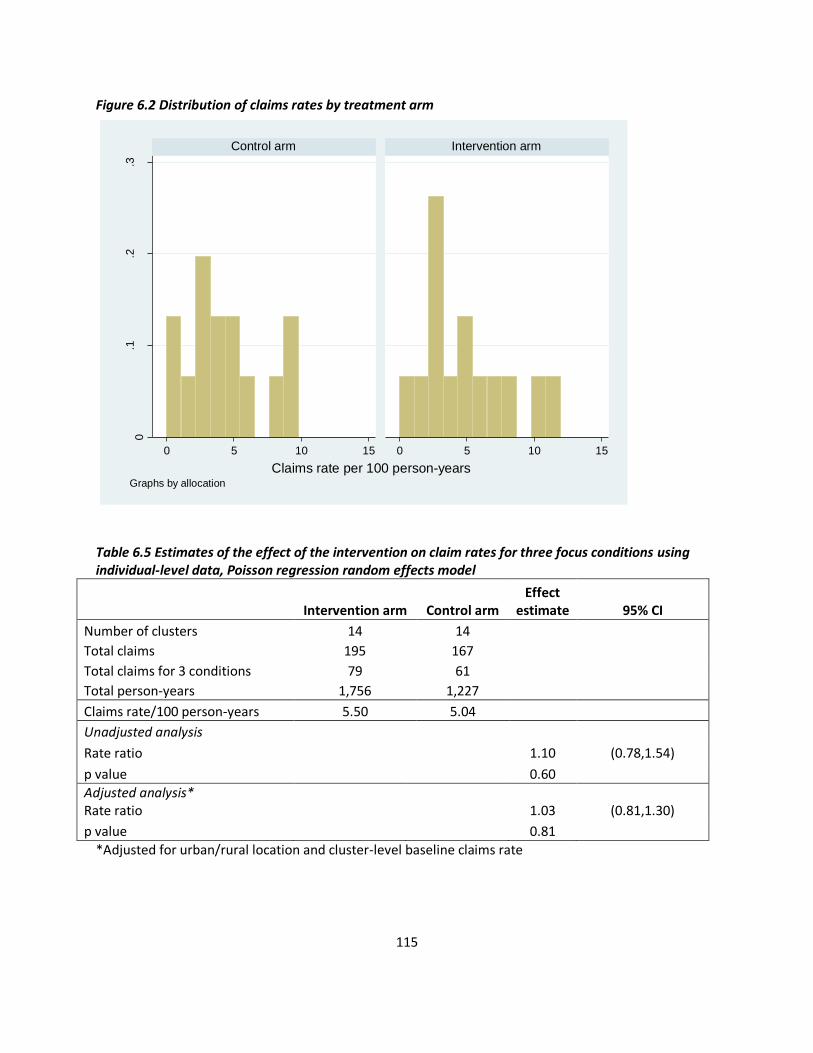
115
Figure 6.2 Distribution of claims rates by treatment arm
Table 6.5 Estimates of the effect of the intervention on claim rates for three focus conditions using individual-level data, Poisson regression random effects model
Intervention arm Control arm Effect
estimate 95% CI
Number of clusters 14 14
Total claims 195 167
Total claims for 3 conditions 79 61
Total person-years 1,756 1,227
Claims rate/100 person-years 5.50 5.04
Unadjusted analysis
Rate ratio 1.10 (0.78,1.54)
p value 0.60
Adjusted analysis* Rate ratio 1.03 (0.81,1.30)
p value 0.81
*Adjusted for urban/rural location and cluster-level baseline claims rate
0.1
.2.3
0 5 10 15 0 5 10 15
Control arm Intervention arm
Den
sity
Claims rate per 100 person-yearsGraphs by allocation
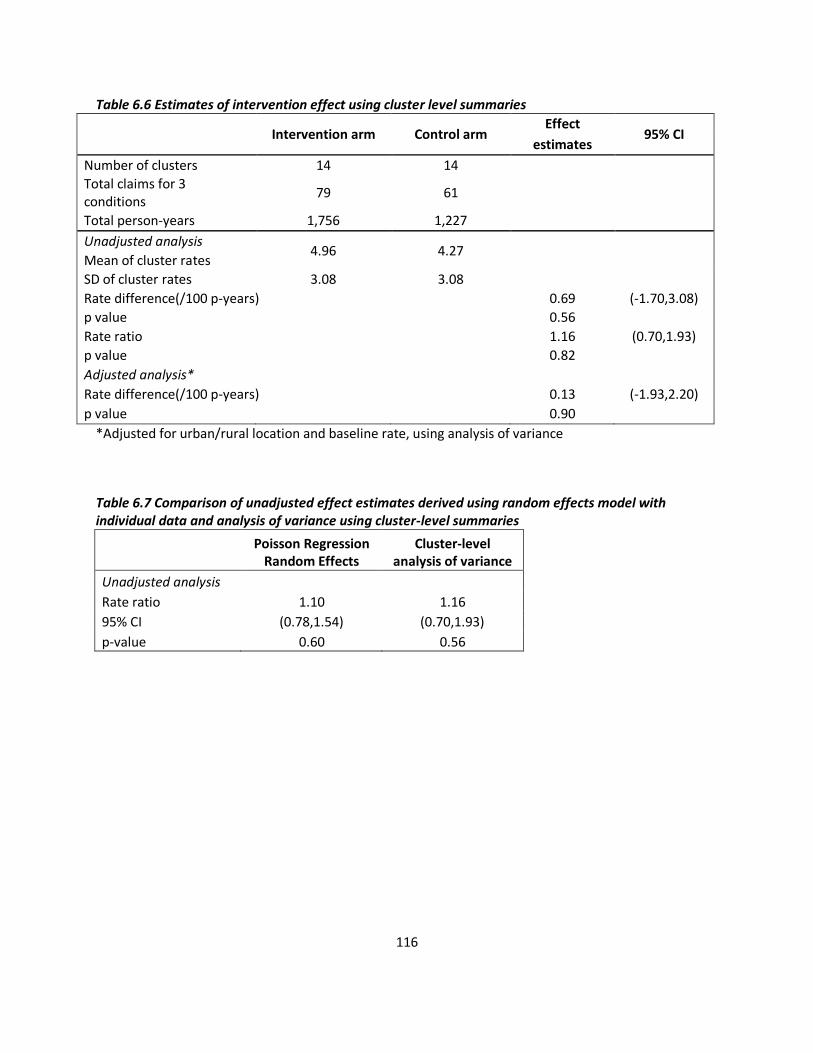
116
Table 6.6 Estimates of intervention effect using cluster level summaries
Intervention arm Control arm Effect
95% CI estimates
Number of clusters 14 14
Total claims for 3 conditions
79 61
Total person-years 1,756 1,227
Unadjusted analysis 4.96 4.27
Mean of cluster rates
SD of cluster rates 3.08 3.08
Rate difference(/100 p-years)
0.69 (-1.70,3.08)
p value
0.56
Rate ratio
1.16 (0.70,1.93)
p value
0.82
Adjusted analysis*
Rate difference(/100 p-years)
0.13 (-1.93,2.20)
p value 0.90
*Adjusted for urban/rural location and baseline rate, using analysis of variance
Table 6.7 Comparison of unadjusted effect estimates derived using random effects model with individual data and analysis of variance using cluster-level summaries
Poisson Regression
Random Effects Cluster-level
analysis of variance
Unadjusted analysis Rate ratio 1.10 1.16
95% CI (0.78,1.54) (0.70,1.93)
p-value 0.60 0.56
117
II. Effect of the health education intervention on hospitalisation rates
amongst insured and uninsured adult women
Introduction
This analysis examines whether the community health intervention had an effect on hospitalisation and
compares outcomes based on insurance status. Before and during the intervention, repeated
household surveys were conducted to collect information on demographic characteristics, morbidity
and treatment-seeking behaviour among both insured and uninsured women in the study area.
Methods
A sample of 35 insured and 35 uninsured women were selected per cluster; a total of 1,980 households
were sampled across 28 clusters. Insured women were selected from the VimoSEWA member database,
and uninsured women were sampled from household lists compiled in CHW work areas. A baseline
survey was conducted from January to March 2010, followed by three survey rounds at six-month
intervals over the course of the 18-month intervention. Women who were insured at baseline were
considered insured throughout for the initial analysis. Separate analyses were conducted based on
reported insurance status in subsequent rounds.
The statistical analysis adopted an intent-to-treat approach that accounted for the cluster
randomisation. Assuming that fourteen clusters per arm were sufficient, random effects regression
models were first fitted with individual-level data. These analyses were checked for robustness with
effect estimates produced using analysis of variance of cluster-level summaries. The primary analysis
adjusted for rural/urban location, insurance status, cluster level baseline rates and survey round.
Sensitivity analyses adjusted for imbalanced variables identified at baseline. A detailed description of
the household surveys and statistical methods is presented in Chapter IV.
Results
A total of 1,934 adult women were surveyed at baseline (Table 6.8). Attrition increased at each round,
primarily due to demolition of slum pockets in Ahmedabad city and rural pre-monsoon seasonal
migration in rounds 3 and 4 (Table 6.9). A total of 1,616 households were surveyed in round 4 (Figure
6.3).
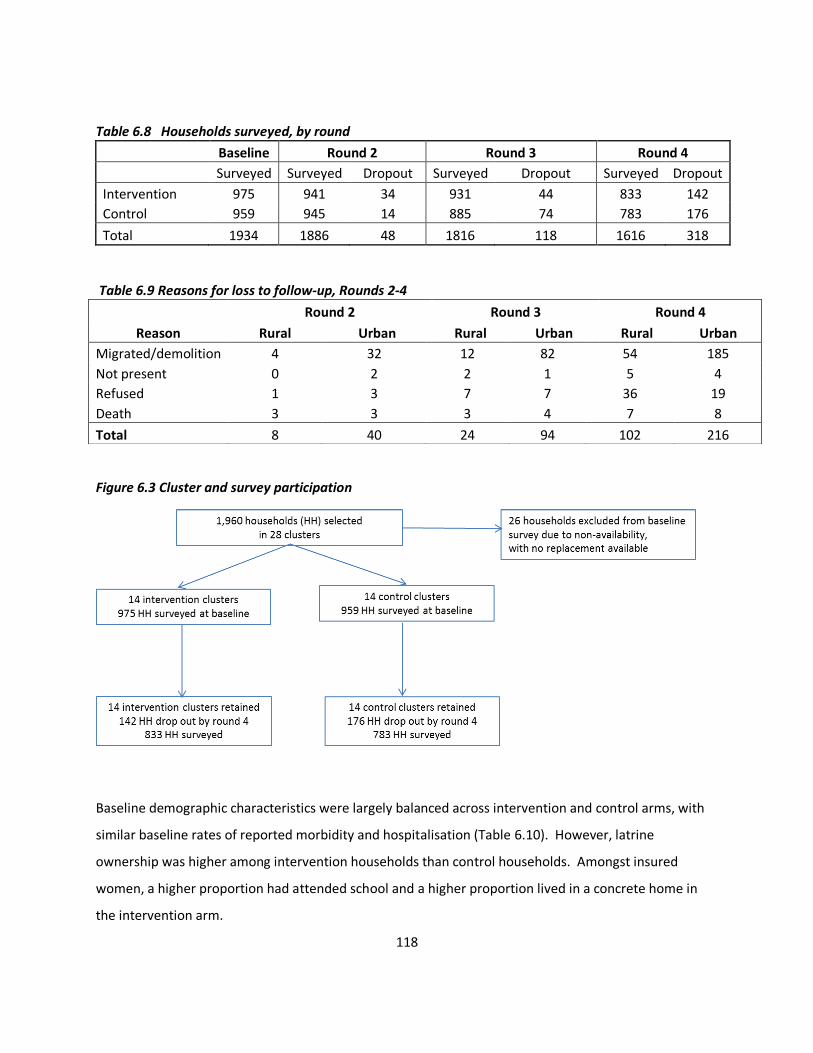
118
Table 6.8 Households surveyed, by round
Baseline Round 2 Round 3 Round 4
Surveyed Surveyed Dropout Surveyed Dropout Surveyed Dropout
Intervention 975 941 34 931 44 833 142
Control 959 945 14 885 74 783 176
Total 1934 1886 48 1816 118 1616 318
Table 6.9 Reasons for loss to follow-up, Rounds 2-4
Figure 6.3 Cluster and survey participation
Baseline demographic characteristics were largely balanced across intervention and control arms, with
similar baseline rates of reported morbidity and hospitalisation (Table 6.10). However, latrine
ownership was higher among intervention households than control households. Amongst insured
women, a higher proportion had attended school and a higher proportion lived in a concrete home in
the intervention arm.
Round 2 Round 3 Round 4
Reason Rural Urban Rural Urban Rural Urban
Migrated/demolition 4 32 12 82 54 185
Not present 0 2 2 1 5 4
Refused 1 3 7 7 36 19
Death 3 3 3 4 7 8
Total 8 40 24 94 102 216
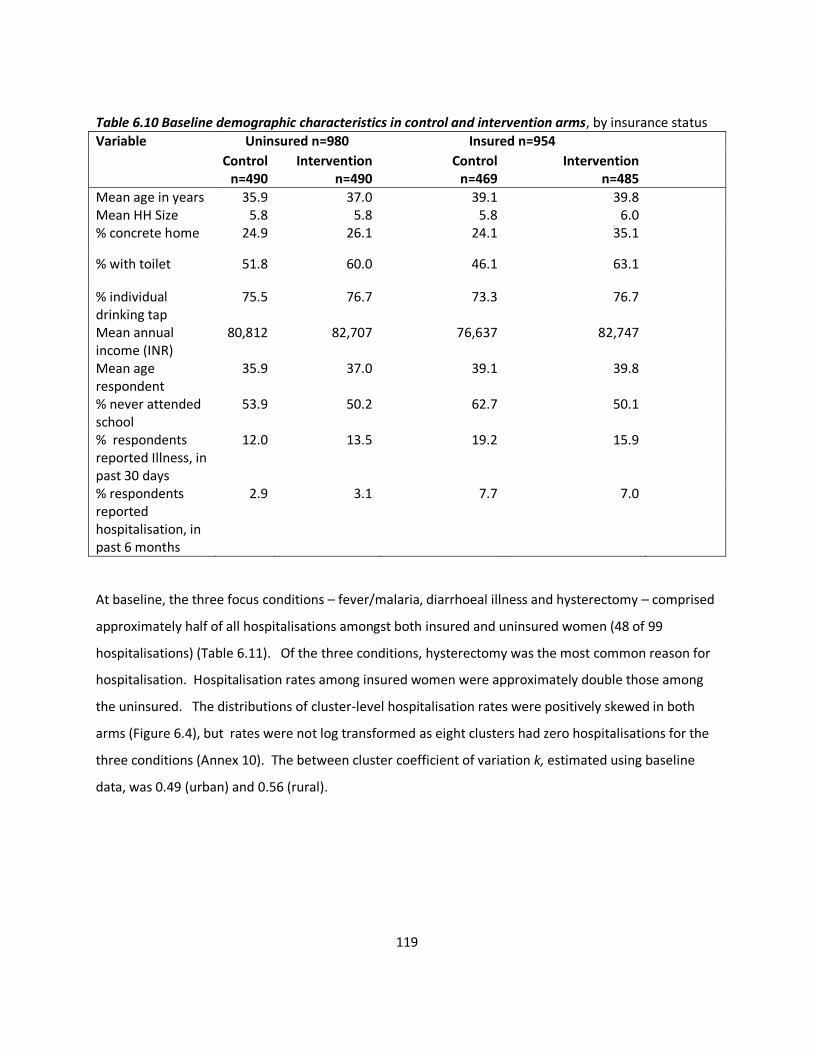
119
Table 6.10 Baseline demographic characteristics in control and intervention arms, by insurance status
Variable Uninsured n=980 Insured n=954
Control n=490
Intervention n=490
Control n=469
Intervention n=485
Mean age in years Mean HH Size
35.9 5.8
37.0 5.8
39.1 5.8
39.8 6.0
% concrete home 24.9 26.1 24.1 35.1
% with toilet 51.8 60.0 46.1 63.1
% individual drinking tap
75.5 76.7 73.3 76.7
Mean annual income (INR)
80,812 82,707 76,637 82,747
Mean age respondent
35.9 37.0 39.1 39.8
% never attended school
53.9 50.2 62.7 50.1
% respondents reported Illness, in past 30 days
12.0 13.5 19.2 15.9
% respondents reported hospitalisation, in past 6 months
2.9 3.1 7.7 7.0
At baseline, the three focus conditions – fever/malaria, diarrhoeal illness and hysterectomy – comprised
approximately half of all hospitalisations amongst both insured and uninsured women (48 of 99
hospitalisations) (Table 6.11). Of the three conditions, hysterectomy was the most common reason for
hospitalisation. Hospitalisation rates among insured women were approximately double those among
the uninsured. The distributions of cluster-level hospitalisation rates were positively skewed in both
arms (Figure 6.4), but rates were not log transformed as eight clusters had zero hospitalisations for the
three conditions (Annex 10). The between cluster coefficient of variation k, estimated using baseline
data, was 0.49 (urban) and 0.56 (rural).
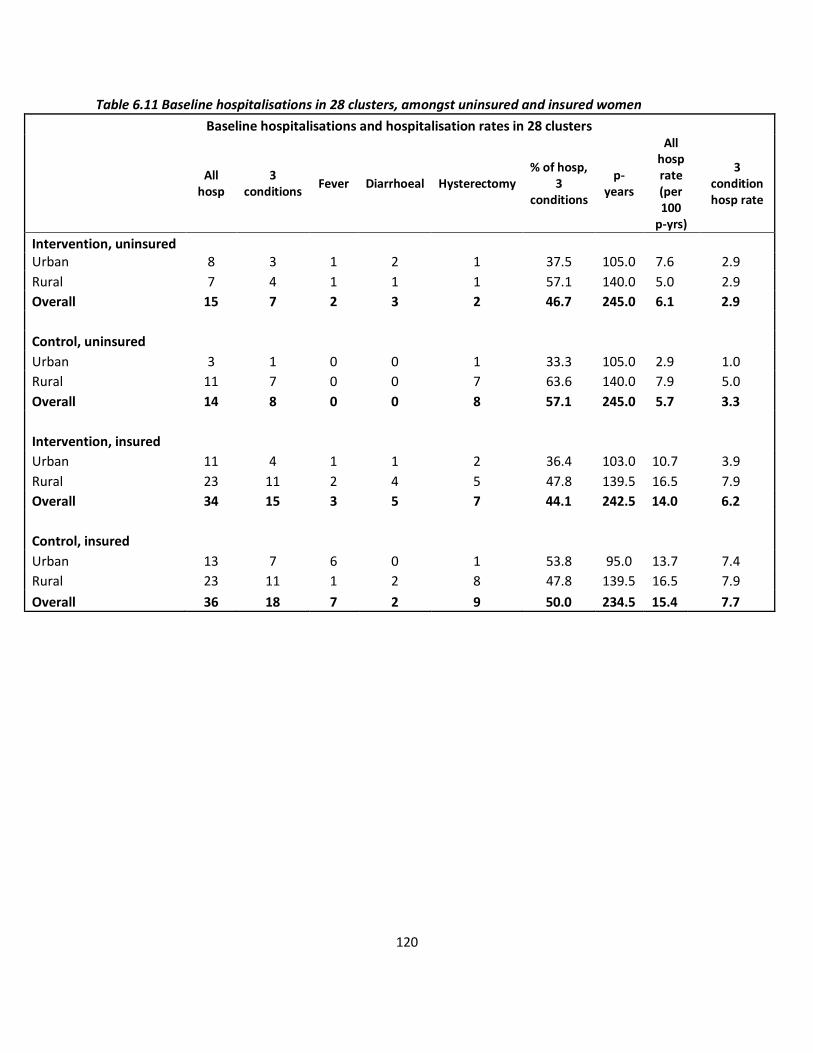
120
Table 6.11 Baseline hospitalisations in 28 clusters, amongst uninsured and insured women
Baseline hospitalisations and hospitalisation rates in 28 clusters
All
hosp 3
conditions Fever Diarrhoeal Hysterectomy
% of hosp, 3
conditions
p-years
All hosp rate (per 100
p-yrs)
3 condition hosp rate
Intervention, uninsured
Urban 8 3 1 2 1 37.5 105.0 7.6 2.9
Rural 7 4 1 1 1 57.1 140.0 5.0 2.9
Overall 15 7 2 3 2 46.7 245.0 6.1 2.9
Control, uninsured Urban 3 1 0 0 1 33.3 105.0 2.9 1.0
Rural 11 7 0 0 7 63.6 140.0 7.9 5.0
Overall 14 8 0 0 8 57.1 245.0 5.7 3.3
Intervention, insured Urban 11 4 1 1 2 36.4 103.0 10.7 3.9
Rural 23 11 2 4 5 47.8 139.5 16.5 7.9
Overall 34 15 3 5 7 44.1 242.5 14.0 6.2
Control, insured Urban 13 7 6 0 1 53.8 95.0 13.7 7.4
Rural 23 11 1 2 8 47.8 139.5 16.5 7.9
Overall 36 18 7 2 9 50.0 234.5 15.4 7.7
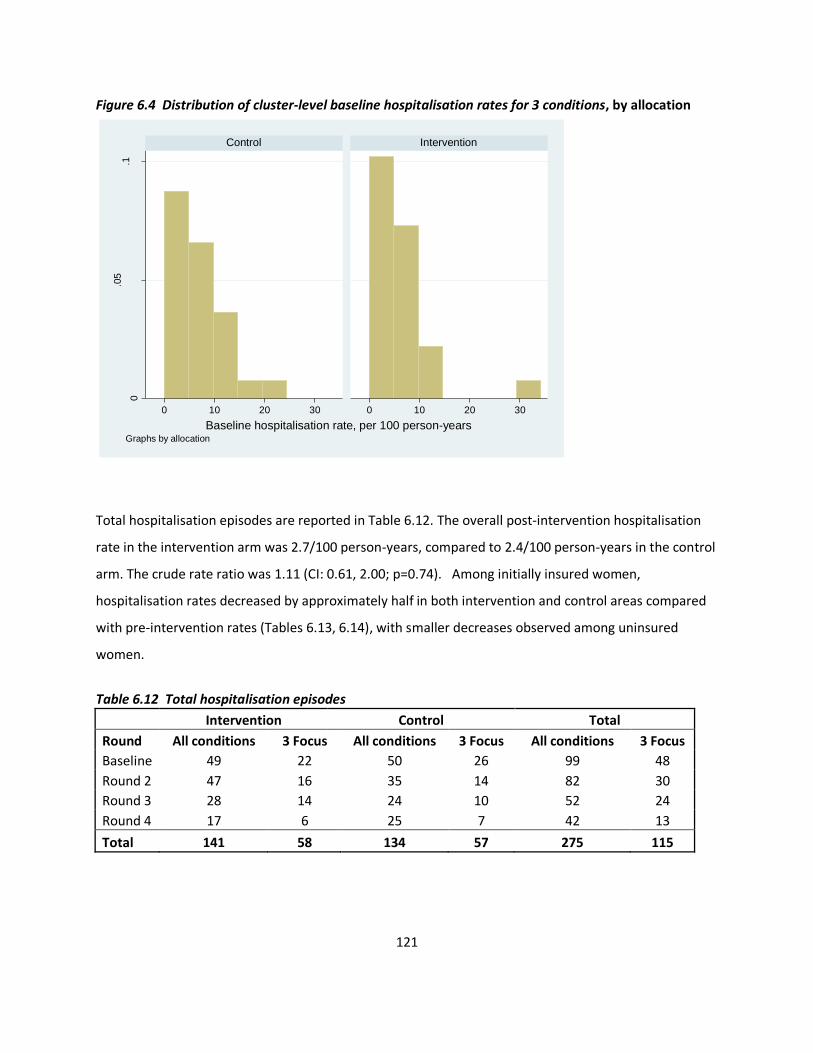
121
Figure 6.4 Distribution of cluster-level baseline hospitalisation rates for 3 conditions, by allocation
Total hospitalisation episodes are reported in Table 6.12. The overall post-intervention hospitalisation
rate in the intervention arm was 2.7/100 person-years, compared to 2.4/100 person-years in the control
arm. The crude rate ratio was 1.11 (CI: 0.61, 2.00; p=0.74). Among initially insured women,
hospitalisation rates decreased by approximately half in both intervention and control areas compared
with pre-intervention rates (Tables 6.13, 6.14), with smaller decreases observed among uninsured
women.
Table 6.12 Total hospitalisation episodes
Intervention Control Total
Round All conditions 3 Focus All conditions 3 Focus All conditions 3 Focus
Baseline 49 22 50 26 99 48
Round 2 47 16 35 14 82 30
Round 3 28 14 24 10 52 24
Round 4 17 6 25 7 42 13
Total 141 58 134 57 275 115
0
.05
.1
0 10 20 30 0 10 20 30
Control Intervention
Den
sity
Baseline hospitalisation rate, per 100 person-yearsGraphs by allocation
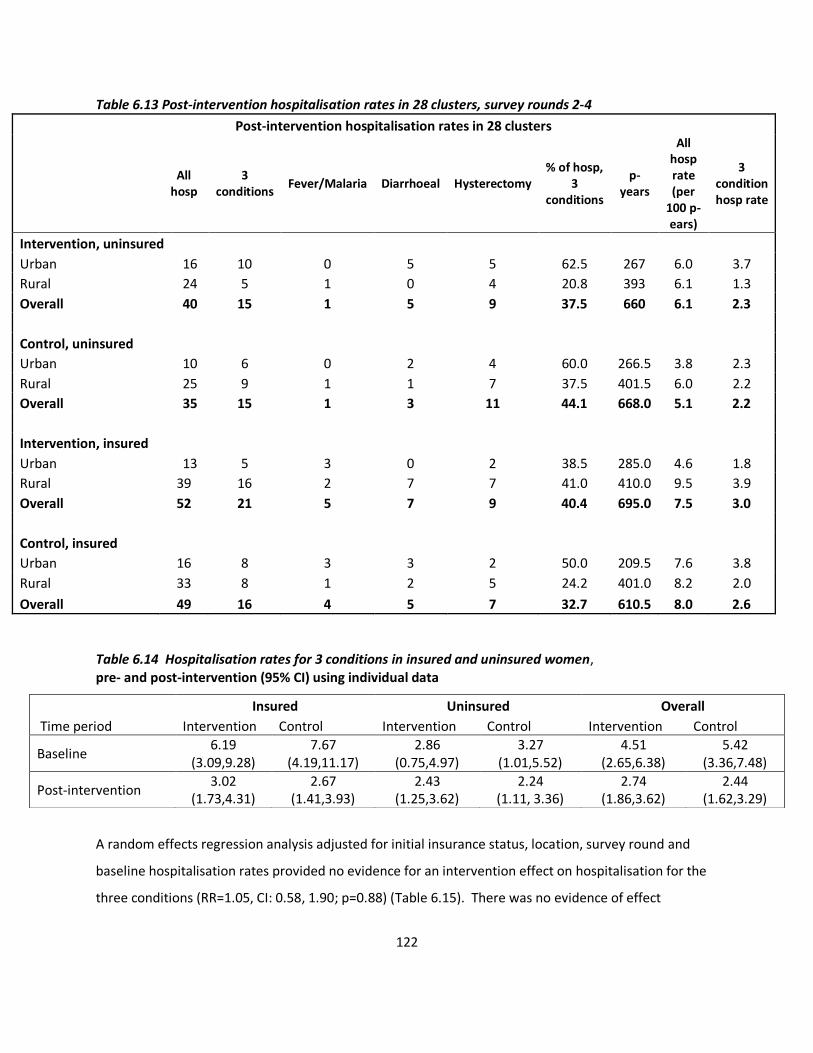
122
Table 6.13 Post-intervention hospitalisation rates in 28 clusters, survey rounds 2-4
Post-intervention hospitalisation rates in 28 clusters
All
hosp 3
conditions Fever/Malaria Diarrhoeal Hysterectomy
% of hosp, 3
conditions
p-years
All hosp rate (per
100 p-ears)
3 condition hosp rate
Intervention, uninsured
Urban 16 10 0 5 5 62.5 267 6.0 3.7
Rural 24 5 1 0 4 20.8 393 6.1 1.3
Overall 40 15 1 5 9 37.5 660 6.1 2.3
Control, uninsured Urban 10 6 0 2 4 60.0 266.5 3.8 2.3
Rural 25 9 1 1 7 37.5 401.5 6.0 2.2
Overall 35 15 1 3 11 44.1 668.0 5.1 2.2
Intervention, insured Urban 13 5 3 0 2 38.5 285.0 4.6 1.8
Rural 39 16 2 7 7 41.0 410.0 9.5 3.9
Overall 52 21 5 7 9 40.4 695.0 7.5 3.0
Control, insured Urban 16 8 3 3 2 50.0 209.5 7.6 3.8
Rural 33 8 1 2 5 24.2 401.0 8.2 2.0
Overall 49 16 4 5 7 32.7 610.5 8.0 2.6
Table 6.14 Hospitalisation rates for 3 conditions in insured and uninsured women, pre- and post-intervention (95% CI) using individual data
A random effects regression analysis adjusted for initial insurance status, location, survey round and
baseline hospitalisation rates provided no evidence for an intervention effect on hospitalisation for the
three conditions (RR=1.05, CI: 0.58, 1.90; p=0.88) (Table 6.15). There was no evidence of effect
Insured Uninsured Overall
Time period Intervention Control Intervention Control Intervention Control
Baseline 6.19
(3.09,9.28) 7.67
(4.19,11.17) 2.86
(0.75,4.97) 3.27
(1.01,5.52) 4.51
(2.65,6.38) 5.42
(3.36,7.48)
Post-intervention 3.02
(1.73,4.31) 2.67
(1.41,3.93) 2.43
(1.25,3.62) 2.24
(1.11, 3.36) 2.74
(1.86,3.62) 2.44
(1.62,3.29)
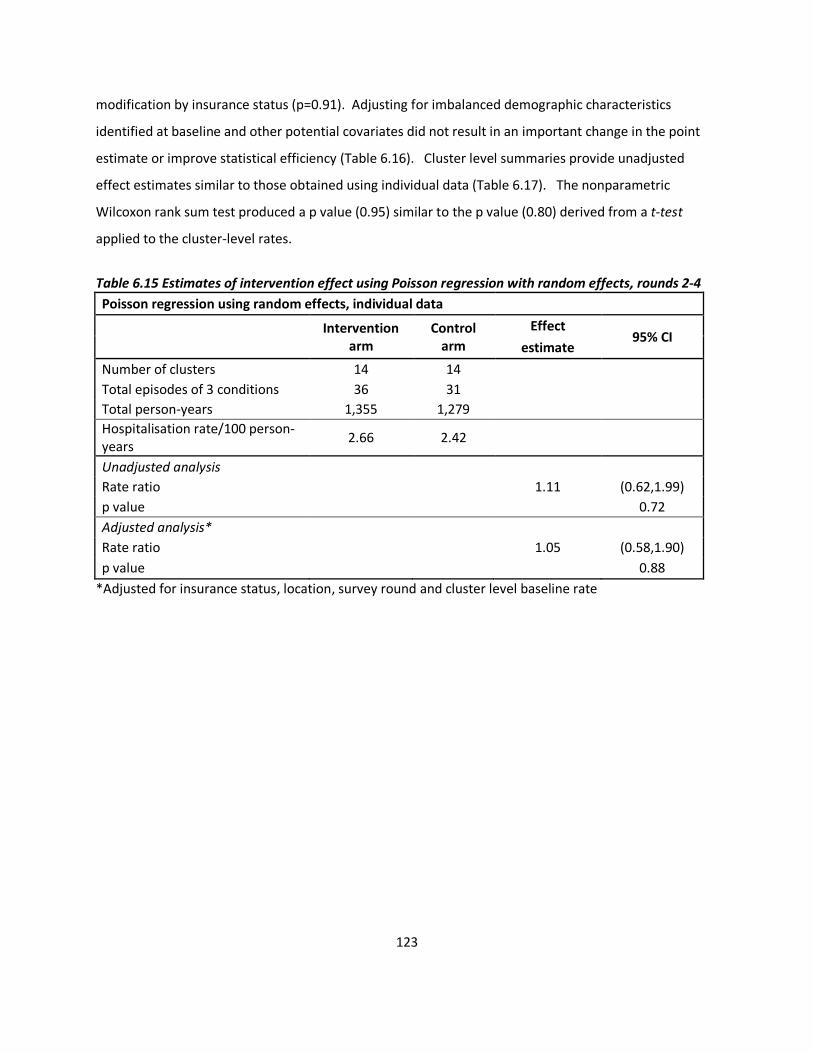
123
modification by insurance status (p=0.91). Adjusting for imbalanced demographic characteristics
identified at baseline and other potential covariates did not result in an important change in the point
estimate or improve statistical efficiency (Table 6.16). Cluster level summaries provide unadjusted
effect estimates similar to those obtained using individual data (Table 6.17). The nonparametric
Wilcoxon rank sum test produced a p value (0.95) similar to the p value (0.80) derived from a t-test
applied to the cluster-level rates.
Table 6.15 Estimates of intervention effect using Poisson regression with random effects, rounds 2-4
Poisson regression using random effects, individual data
Intervention
arm Control
arm
Effect 95% CI
estimate
Number of clusters 14 14
Total episodes of 3 conditions 36 31
Total person-years 1,355 1,279
Hospitalisation rate/100 person-years
2.66 2.42
Unadjusted analysis
Rate ratio
1.11 (0.62,1.99)
p value 0.72
Adjusted analysis*
Rate ratio
1.05 (0.58,1.90)
p value 0.88
*Adjusted for insurance status, location, survey round and cluster level baseline rate
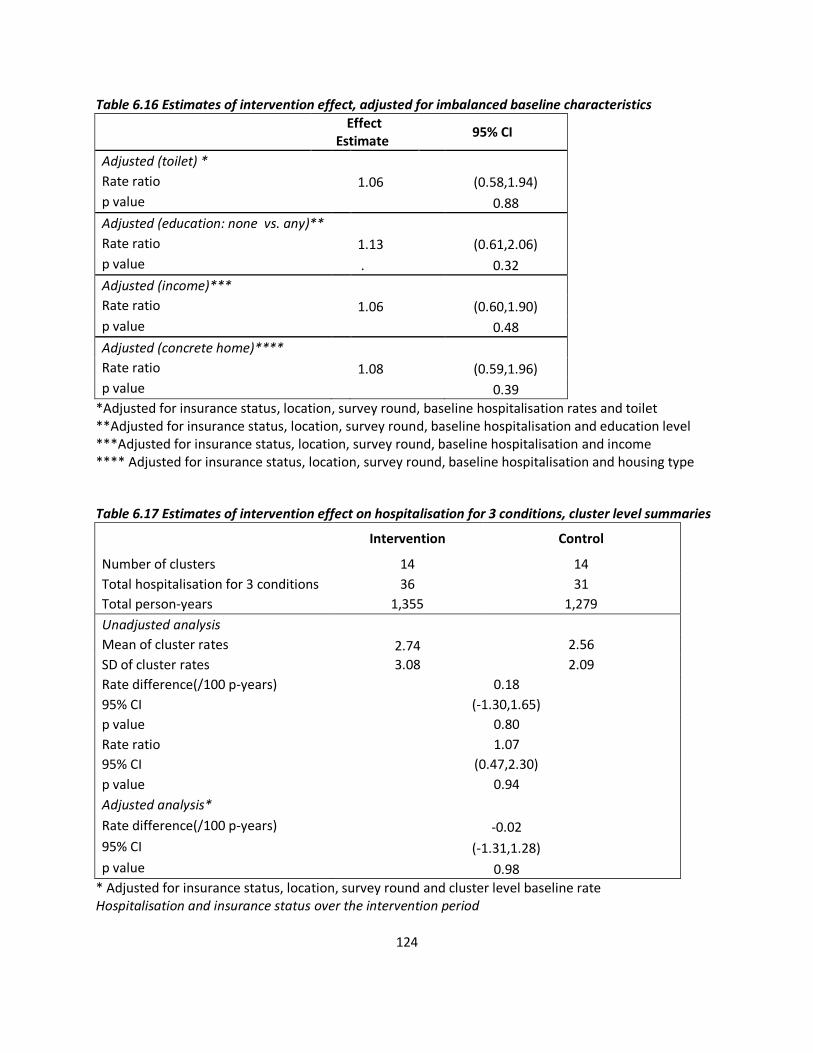
124
Table 6.16 Estimates of intervention effect, adjusted for imbalanced baseline characteristics
Effect
Estimate 95% CI
Adjusted (toilet) *
Rate ratio
1.06 (0.58,1.94)
p value 0.88
Adjusted (education: none vs. any)**
Rate ratio
1.13 (0.61,2.06)
p value . 0.32
Adjusted (income)***
Rate ratio
1.06 (0.60,1.90)
p value 0.48
Adjusted (concrete home)****
Rate ratio
1.08 (0.59,1.96)
p value 0.39
*Adjusted for insurance status, location, survey round, baseline hospitalisation rates and toilet **Adjusted for insurance status, location, survey round, baseline hospitalisation and education level ***Adjusted for insurance status, location, survey round, baseline hospitalisation and income **** Adjusted for insurance status, location, survey round, baseline hospitalisation and housing type
Table 6.17 Estimates of intervention effect on hospitalisation for 3 conditions, cluster level summaries
Intervention Control
Number of clusters 14 14
Total hospitalisation for 3 conditions 36 31
Total person-years 1,355 1,279
Unadjusted analysis
Mean of cluster rates 2.74 2.56
SD of cluster rates 3.08 2.09
Rate difference(/100 p-years) 0.18
95% CI (-1.30,1.65)
p value 0.80
Rate ratio 1.07
95% CI (0.47,2.30)
p value 0.94
Adjusted analysis*
Rate difference(/100 p-years) -0.02
95% CI (-1.31,1.28)
p value 0.98
* Adjusted for insurance status, location, survey round and cluster level baseline rate Hospitalisation and insurance status over the intervention period
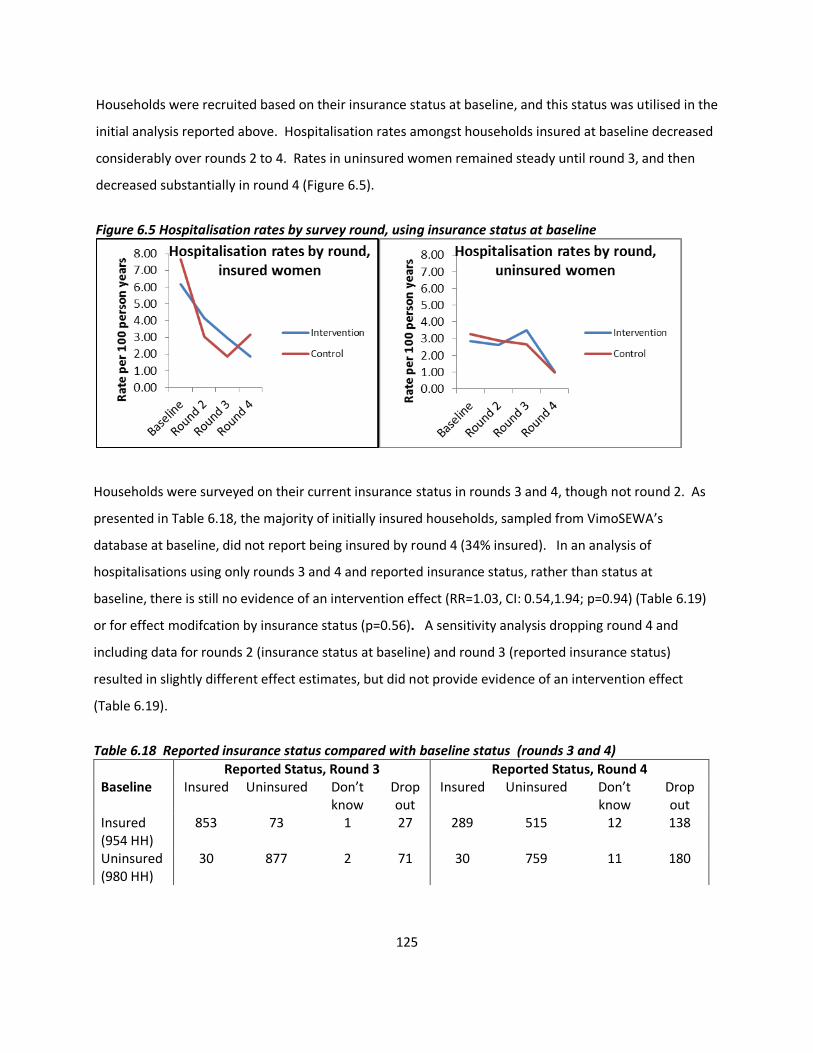
125
Households were recruited based on their insurance status at baseline, and this status was utilised in the
initial analysis reported above. Hospitalisation rates amongst households insured at baseline decreased
considerably over rounds 2 to 4. Rates in uninsured women remained steady until round 3, and then
decreased substantially in round 4 (Figure 6.5).
Figure 6.5 Hospitalisation rates by survey round, using insurance status at baseline
Households were surveyed on their current insurance status in rounds 3 and 4, though not round 2. As
presented in Table 6.18, the majority of initially insured households, sampled from VimoSEWA’s
database at baseline, did not report being insured by round 4 (34% insured). In an analysis of
hospitalisations using only rounds 3 and 4 and reported insurance status, rather than status at
baseline, there is still no evidence of an intervention effect (RR=1.03, CI: 0.54,1.94; p=0.94) (Table 6.19)
or for effect modifcation by insurance status (p=0.56). A sensitivity analysis dropping round 4 and
including data for rounds 2 (insurance status at baseline) and round 3 (reported insurance status)
resulted in slightly different effect estimates, but did not provide evidence of an intervention effect
(Table 6.19).
Table 6.18 Reported insurance status compared with baseline status (rounds 3 and 4)
Reported Status, Round 3 Reported Status, Round 4 Baseline
Insured Uninsured Don’t know
Drop out
Insured Uninsured Don’t know
Drop out
Insured (954 HH)
853 73 1 27 289 515 12 138
Uninsured (980 HH)
30 877 2 71 30 759 11 180
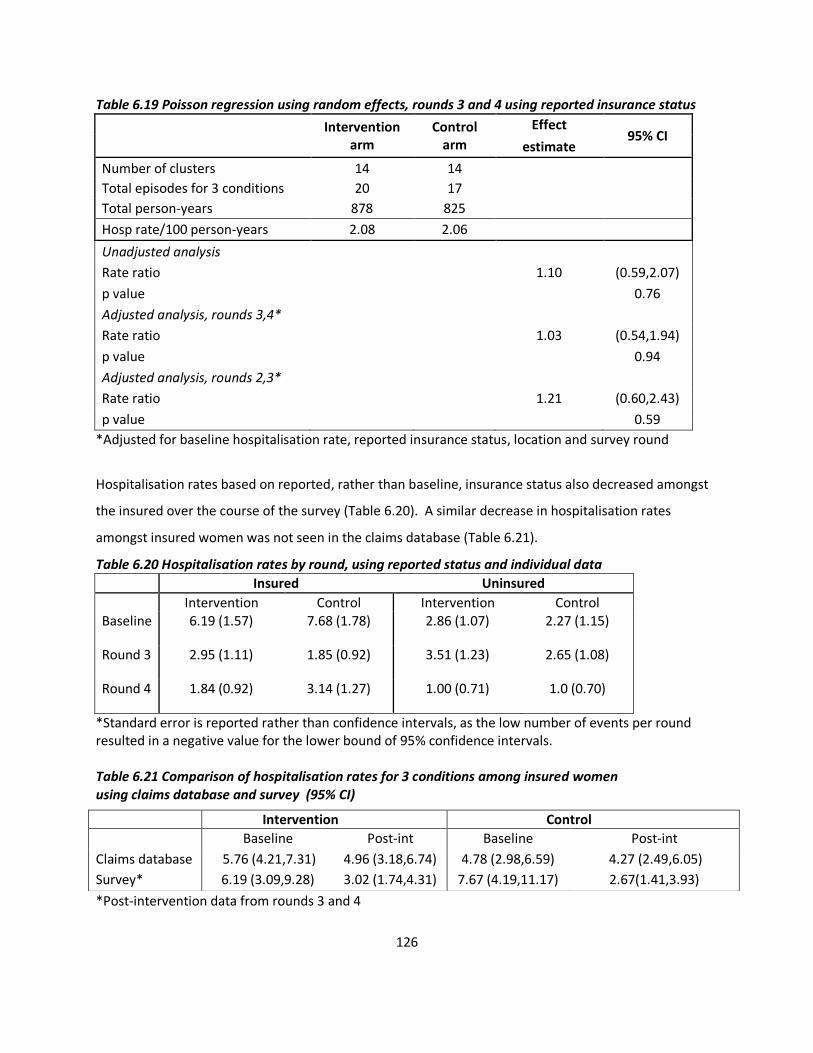
126
Table 6.19 Poisson regression using random effects, rounds 3 and 4 using reported insurance status
Intervention
arm Control
arm
Effect 95% CI
estimate
Number of clusters 14 14
Total episodes for 3 conditions 20 17
Total person-years 878 825
Hosp rate/100 person-years 2.08 2.06
Unadjusted analysis
Rate ratio 1.10 (0.59,2.07)
p value 0.76
Adjusted analysis, rounds 3,4*
Rate ratio 1.03 (0.54,1.94)
p value 0.94
Adjusted analysis, rounds 2,3*
Rate ratio 1.21 (0.60,2.43)
p value 0.59
*Adjusted for baseline hospitalisation rate, reported insurance status, location and survey round
Hospitalisation rates based on reported, rather than baseline, insurance status also decreased amongst
the insured over the course of the survey (Table 6.20). A similar decrease in hospitalisation rates
amongst insured women was not seen in the claims database (Table 6.21).
Table 6.20 Hospitalisation rates by round, using reported status and individual data
Insured Uninsured
Intervention Control Intervention Control Baseline 6.19 (1.57) 7.68 (1.78) 2.86 (1.07) 2.27 (1.15)
Round 3 2.95 (1.11) 1.85 (0.92) 3.51 (1.23) 2.65 (1.08)
Round 4 1.84 (0.92) 3.14 (1.27) 1.00 (0.71) 1.0 (0.70)
*Standard error is reported rather than confidence intervals, as the low number of events per round resulted in a negative value for the lower bound of 95% confidence intervals.
Table 6.21 Comparison of hospitalisation rates for 3 conditions among insured women using claims database and survey (95% CI)
*Post-intervention data from rounds 3 and 4
Intervention Control
Baseline Post-int Baseline Post-int
Claims database 5.76 (4.21,7.31) 4.96 (3.18,6.74) 4.78 (2.98,6.59) 4.27 (2.49,6.05)
Survey* 6.19 (3.09,9.28) 3.02 (1.74,4.31) 7.67 (4.19,11.17) 2.67(1.41,3.93)
127
III. Effect of the health education intervention on 30-day morbidity rates
amongst insured and uninsured adult women
Introduction
This section examines whether the community health intervention had an effect on morbidity rates for
diarrhoea, fever/malaria and gynaecological conditions and compares outcomes based on insurance
status. Information on morbidity episodes experienced in the past 30 days was collected in the
household survey.
Methods
Statistical methods were similar to those utilised in the analysis of hospitalisation rates in Section II.
Crude estimates were adjusted for rural/urban location, insurance status, survey round and cluster level
baseline morbidity rates. A regression model with random effects was fitted using individual-level data,
followed by analysis using cluster level summaries to check the robustness of the model.
Results
Fever/malaria, diarrhoeal illness and gynaecological conditions comprised between 35-56% of reported
morbidity in the past 30 days at baseline (Table 6.22), with very few instances of gynaecological
morbidity reported. Cluster-level morbidity rates were not normally distributed in either arm (Figure
6.6), but rates were not log transformed as one cluster had no episodes of any of the three conditions
(Annex 11). The between cluster variation coefficient k, calculated using baseline data, was 0.40 (urban)
and 0.19 (rural).
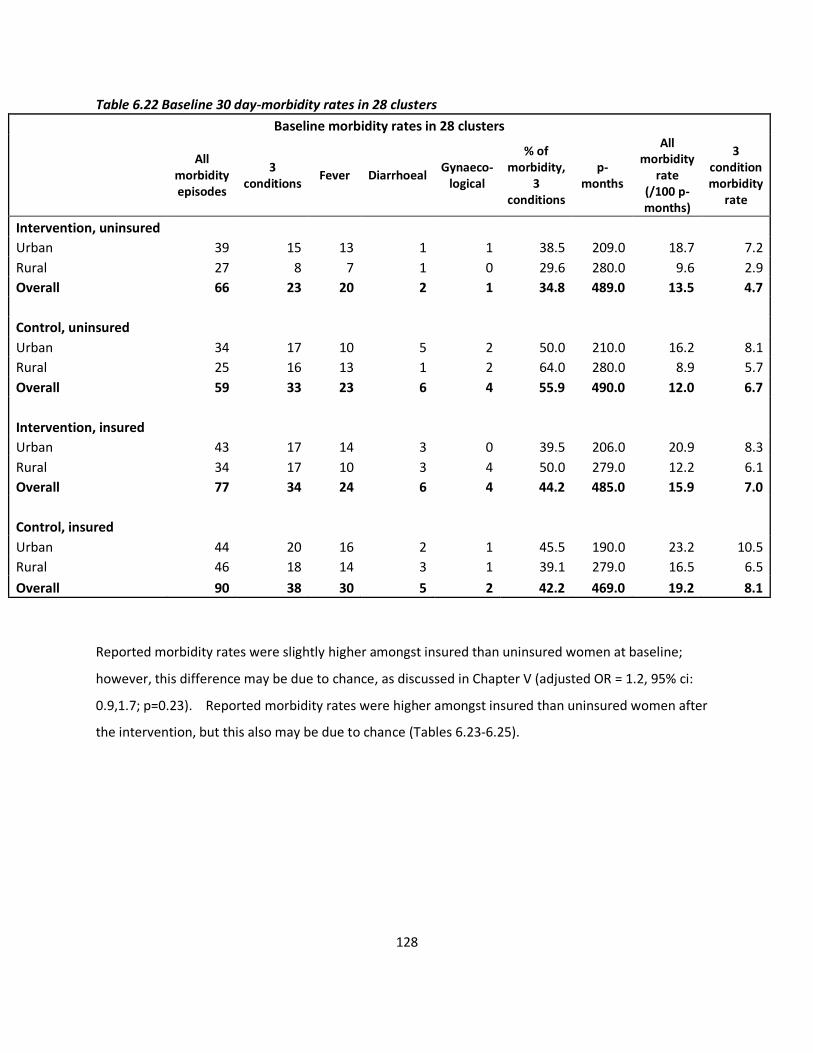
128
Table 6.22 Baseline 30 day-morbidity rates in 28 clusters
Baseline morbidity rates in 28 clusters
All
morbidity episodes
3 conditions
Fever Diarrhoeal Gynaeco-
logical
% of morbidity,
3 conditions
p-months
All morbidity
rate (/100 p-months)
3 condition morbidity
rate
Intervention, uninsured
Urban 39 15 13 1 1 38.5 209.0 18.7 7.2
Rural 27 8 7 1 0 29.6 280.0 9.6 2.9
Overall 66 23 20 2 1 34.8 489.0 13.5 4.7
Control, uninsured
Urban 34 17 10 5 2 50.0 210.0 16.2 8.1
Rural 25 16 13 1 2 64.0 280.0 8.9 5.7
Overall 59 33 23 6 4 55.9 490.0 12.0 6.7
Intervention, insured
Urban 43 17 14 3 0 39.5 206.0 20.9 8.3
Rural 34 17 10 3 4 50.0 279.0 12.2 6.1
Overall 77 34 24 6 4 44.2 485.0 15.9 7.0
Control, insured
Urban 44 20 16 2 1 45.5 190.0 23.2 10.5
Rural 46 18 14 3 1 39.1 279.0 16.5 6.5
Overall 90 38 30 5 2 42.2 469.0 19.2 8.1
Reported morbidity rates were slightly higher amongst insured than uninsured women at baseline;
however, this difference may be due to chance, as discussed in Chapter V (adjusted OR = 1.2, 95% ci:
0.9,1.7; p=0.23). Reported morbidity rates were higher amongst insured than uninsured women after
the intervention, but this also may be due to chance (Tables 6.23-6.25).
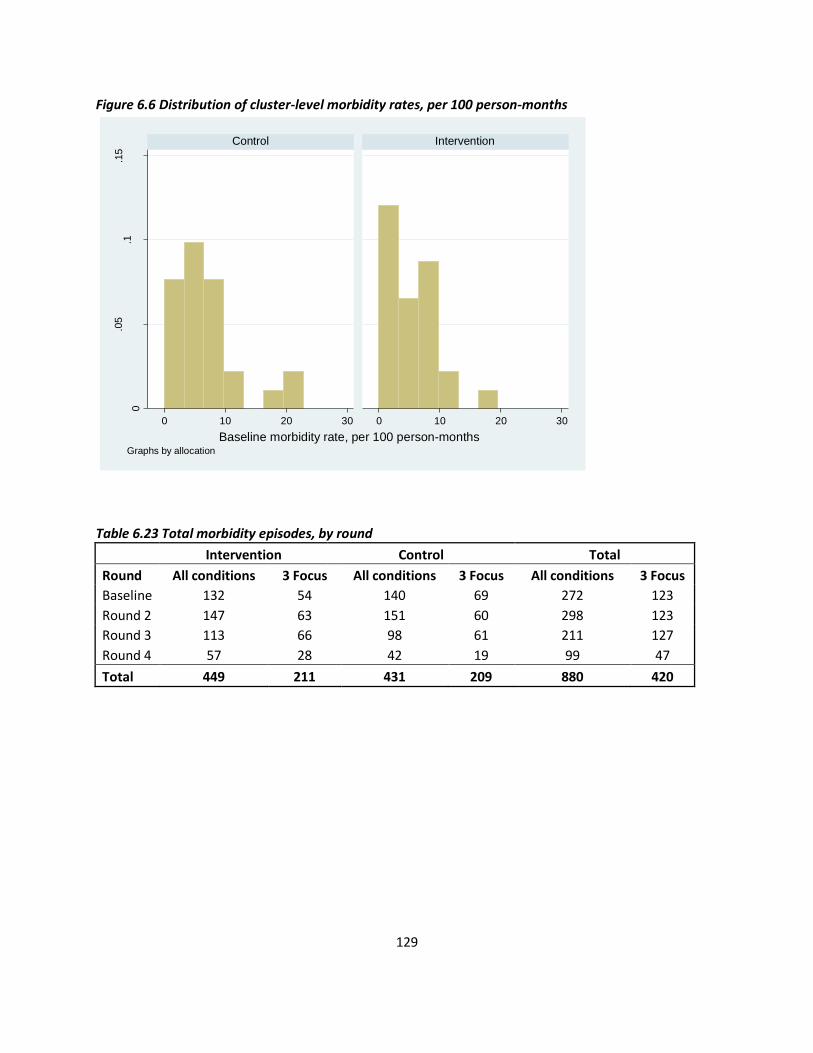
129
Figure 6.6 Distribution of cluster-level morbidity rates, per 100 person-months
Table 6.23 Total morbidity episodes, by round
Intervention Control Total
Round All conditions 3 Focus All conditions 3 Focus All conditions 3 Focus
Baseline 132 54 140 69 272 123
Round 2 147 63 151 60 298 123
Round 3 113 66 98 61 211 127
Round 4 57 28 42 19 99 47
Total 449 211 431 209 880 420
0
.05
.1.1
5
0 10 20 30 0 10 20 30
Control Intervention
Den
sity
Baseline morbidity rate, per 100 person-monthsGraphs by allocation
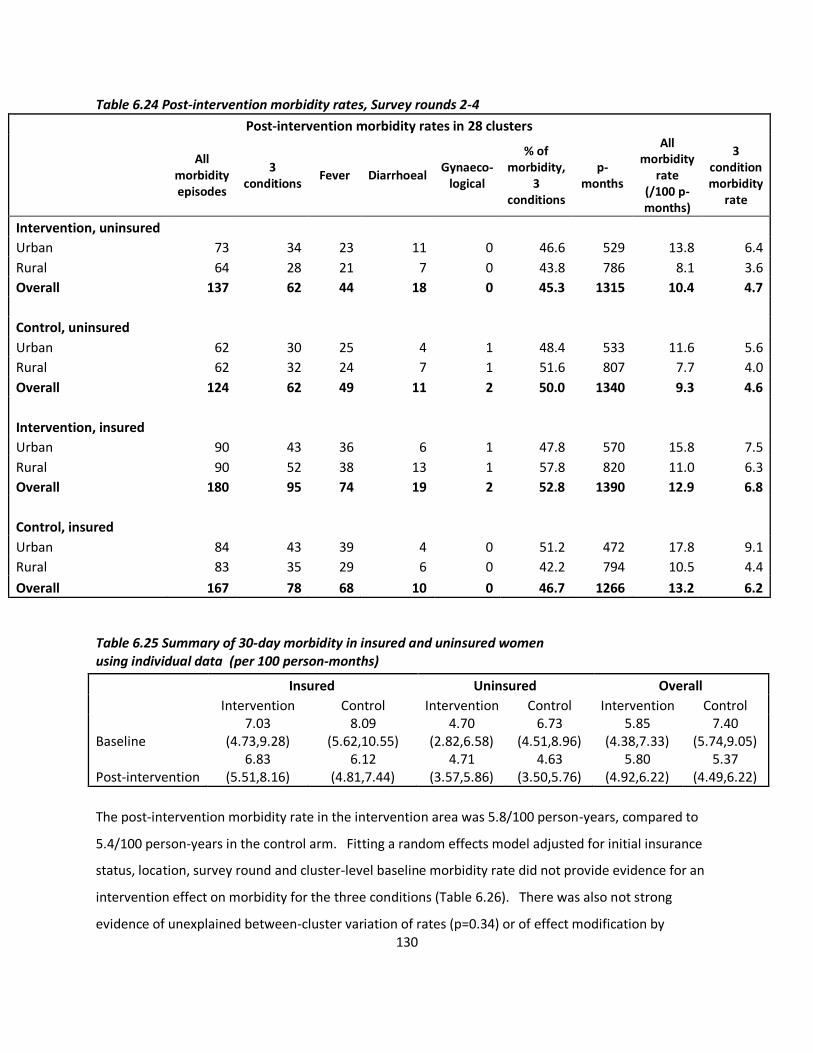
130
Table 6.24 Post-intervention morbidity rates, Survey rounds 2-4
Post-intervention morbidity rates in 28 clusters
All
morbidity episodes
3 conditions
Fever Diarrhoeal Gynaeco-
logical
% of morbidity,
3 conditions
p-months
All morbidity
rate (/100 p-months)
3 condition morbidity
rate
Intervention, uninsured
Urban 73 34 23 11 0 46.6 529 13.8 6.4
Rural 64 28 21 7 0 43.8 786 8.1 3.6
Overall 137 62 44 18 0 45.3 1315 10.4 4.7
Control, uninsured
Urban 62 30 25 4 1 48.4 533 11.6 5.6
Rural 62 32 24 7 1 51.6 807 7.7 4.0
Overall 124 62 49 11 2 50.0 1340 9.3 4.6
Intervention, insured
Urban 90 43 36 6 1 47.8 570 15.8 7.5
Rural 90 52 38 13 1 57.8 820 11.0 6.3
Overall 180 95 74 19 2 52.8 1390 12.9 6.8
Control, insured
Urban 84 43 39 4 0 51.2 472 17.8 9.1
Rural 83 35 29 6 0 42.2 794 10.5 4.4
Overall 167 78 68 10 0 46.7 1266 13.2 6.2
Table 6.25 Summary of 30-day morbidity in insured and uninsured women using individual data (per 100 person-months)
The post-intervention morbidity rate in the intervention area was 5.8/100 person-years, compared to
5.4/100 person-years in the control arm. Fitting a random effects model adjusted for initial insurance
status, location, survey round and cluster-level baseline morbidity rate did not provide evidence for an
intervention effect on morbidity for the three conditions (Table 6.26). There was also not strong
evidence of unexplained between-cluster variation of rates (p=0.34) or of effect modification by
Insured Uninsured Overall
Intervention Control Intervention Control Intervention Control
Baseline 7.03
(4.73,9.28) 8.09
(5.62,10.55) 4.70
(2.82,6.58) 6.73
(4.51,8.96) 5.85
(4.38,7.33) 7.40
(5.74,9.05)
Post-intervention 6.83
(5.51,8.16) 6.12
(4.81,7.44) 4.71
(3.57,5.86) 4.63
(3.50,5.76) 5.80
(4.92,6.22) 5.37
(4.49,6.22)
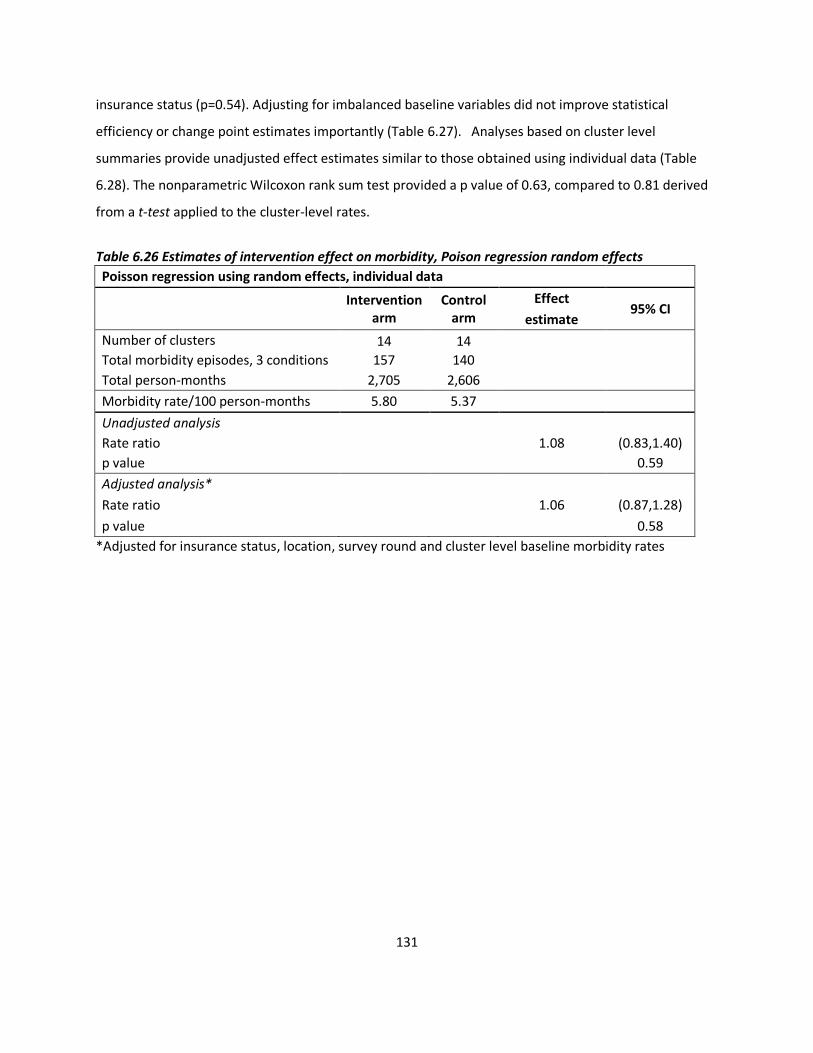
131
insurance status (p=0.54). Adjusting for imbalanced baseline variables did not improve statistical
efficiency or change point estimates importantly (Table 6.27). Analyses based on cluster level
summaries provide unadjusted effect estimates similar to those obtained using individual data (Table
6.28). The nonparametric Wilcoxon rank sum test provided a p value of 0.63, compared to 0.81 derived
from a t-test applied to the cluster-level rates.
Table 6.26 Estimates of intervention effect on morbidity, Poison regression random effects
Poisson regression using random effects, individual data
Intervention
arm Control
arm
Effect 95% CI
estimate
Number of clusters 14 14
Total morbidity episodes, 3 conditions 157 140
Total person-months 2,705 2,606
Morbidity rate/100 person-months 5.80 5.37
Unadjusted analysis
Rate ratio
1.08 (0.83,1.40)
p value 0.59
Adjusted analysis*
Rate ratio
1.06 (0.87,1.28)
p value 0.58
*Adjusted for insurance status, location, survey round and cluster level baseline morbidity rates
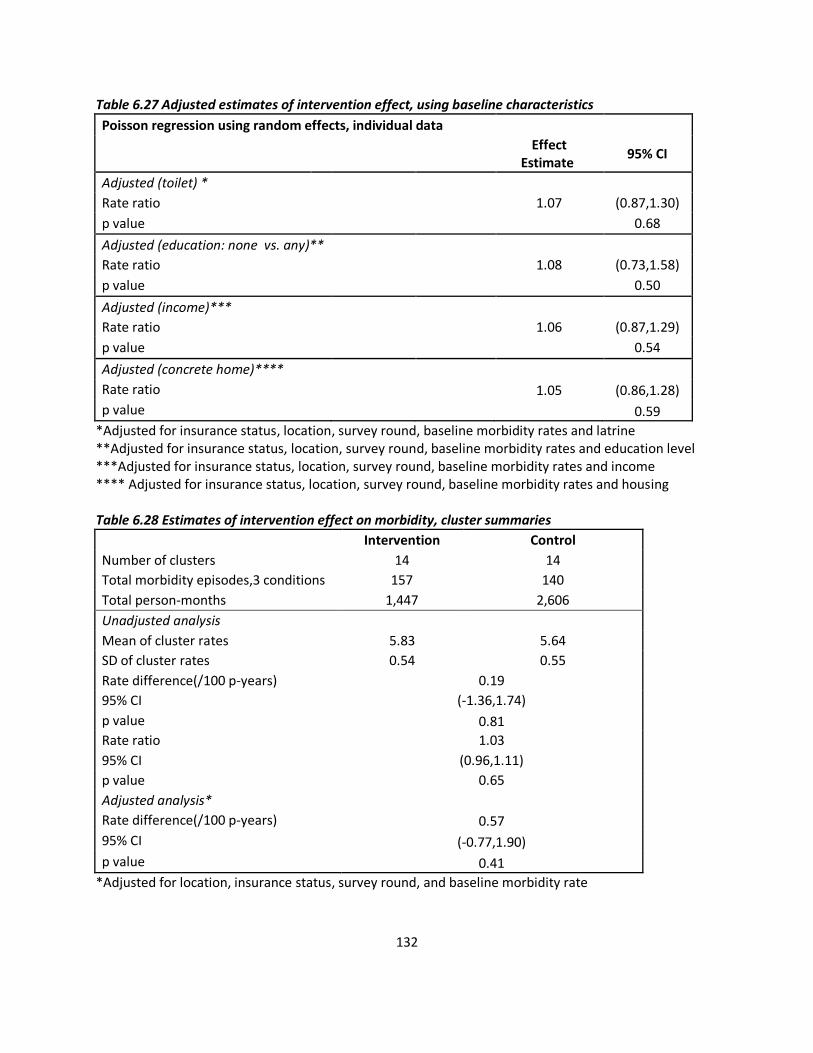
132
Table 6.27 Adjusted estimates of intervention effect, using baseline characteristics
Poisson regression using random effects, individual data
Effect
Estimate 95% CI
Adjusted (toilet) *
Rate ratio
1.07 (0.87,1.30)
p value 0.68
Adjusted (education: none vs. any)**
Rate ratio
1.08 (0.73,1.58)
p value 0.50
Adjusted (income)***
Rate ratio
1.06 (0.87,1.29)
p value 0.54
Adjusted (concrete home)****
Rate ratio
1.05 (0.86,1.28)
p value 0.59
*Adjusted for insurance status, location, survey round, baseline morbidity rates and latrine **Adjusted for insurance status, location, survey round, baseline morbidity rates and education level ***Adjusted for insurance status, location, survey round, baseline morbidity rates and income **** Adjusted for insurance status, location, survey round, baseline morbidity rates and housing Table 6.28 Estimates of intervention effect on morbidity, cluster summaries
Intervention Control
Number of clusters 14 14
Total morbidity episodes,3 conditions 157 140
Total person-months 1,447 2,606
Unadjusted analysis
Mean of cluster rates 5.83 5.64
SD of cluster rates 0.54 0.55
Rate difference(/100 p-years) 0.19
95% CI (-1.36,1.74)
p value 0.81
Rate ratio 1.03
95% CI (0.96,1.11)
p value 0.65
Adjusted analysis*
Rate difference(/100 p-years) 0.57
95% CI (-0.77,1.90)
p value 0.41
*Adjusted for location, insurance status, survey round, and baseline morbidity rate
133
IV. Discussion
Results of the statistical analyses, none of which suggested a positive effect of the intervention, depart
from several studies that have reported evidence of an effect of CHW-led group health education on
preventive health behaviours and some health outcomes. Evaluations of CHW-led group education in
low-income settings have detected evidence of an effect on malaria control efforts and family planning
uptake[76-78]. Studies in the United States have reported increased uptake of pap tests, breast cancer
screening, lifestyle and behavioural changes amongst women belonging to ethnic minority groups in the
United States [69, 72-75]. A complex intervention in Pakistan, in which group education was one
component, detected an effect on neonatal mortality, while a Bangladeshi study did not report evidence
of an effect of CHW-led group education on neonatal mortality[47, 79]. Chapter IX presents a process
evaluation that explores why this evaluation did not detect evidence of an effect, both through
examination of the intervention processes and comparison with findings in other settings. The section
below focuses on the results of the statistical analyses reported in this chapter, followed by discussion of
the strengths and limitations of the evaluation design and procedures.
Randomisation
Control and intervention arms were balanced with regards to age, occupational and marital status as
recorded in the VimoSEWA member database. Utilising a wider range of demographic characteristics
collected in the household survey, intervention and control arms were relatively well balanced, with
some exceptions. Insured women in the control arm appeared worse off than insured women in
intervention households, with lower education levels, household income, and fewer households with
latrines. The proportion of households with a latrine was not balanced across arms for uninsured
households either, but income and housing were similar. SEWA has implemented interventions to
subsidise latrine construction across pockets of Ahmedabad city since 2005. Accordingly, latrine
ownership may not be a consistent indicator of socioeconomic status in this population, though it may
influence health status. The intervention outcomes – reported morbidity and hospitalisation rates and
claims rates – were similar across arms at baseline for both insured and uninsured households,
suggesting that randomisation achieved, in large part, its intended goal.
134
Pre-intervention membership, claims, hospitalisation and morbidity
In both the claims database and survey, mean person-time per insured woman during the period of
interest was less than one year. Upfront payment of the annual fee for new members and renewals of
individual products (life, asset or health) and bundled schemes that include a combination are processed
monthly. Renewal rates are calculated annually, and not disaggregated by product. VimoSEWA reported
an overall renewal rate of 60% before the intervention. Analysis of baseline membership data
suggested that 1/3 of women renewed membership in a health scheme for two consecutive years. This
observed renewal rate is consistent with earlier data from VimoSEWA indicating 22-30% renewal rates,
when all products included health, as opposed to current policies that allow for single product purchase.
Although VimoSEWA has implemented several measures to improve renewal, retention of members
remains a challenge.
Before the intervention, 39% of all adult women claims in the VimoSEWA database were for the three
focus conditions, responsible for 5.4 claims/100 person-years – confirming that a health intervention
aimed at these conditions could potentially address a substantial proportion of claims. Similarly,
approximately one-half of all reported hospitalisations amongst insured and uninsured women in the
baseline survey were for the three focus conditions, of which hysterectomy comprised the largest
proportion. Previous research at VimoSEWA has examined urban and rural areas separately, given
differences in availability of health care services, distances to hospital and demographic
differences[240]. Accordingly, randomisation was stratified on rural/urban location in this study as well.
In this analysis, overall claims rates were higher in urban than rural areas, but this difference could have
arisen by chance. Rural areas were observed to have a higher proportion of claims for the three focus
conditions.
Hospitalisation rates at baseline were approximately twice as high amongst insured women compared
to uninsured women. For insured women, hospitalisation rates were similar to claims submission rates,
suggesting that barriers to claims submission were low. This is a new finding related to scheme
management for VimoSEWA, as an earlier study – conducted before cashless reimbursement
procedures were introduced – found that the rate of claims submission was considerably lower than
hospitalisation rates, due to barriers such as difficulty negotiating claims procedures and
paperwork[186].
135
The reported rates of morbidity in the past 30 days were slightly higher amongst insured women at
baseline, which could have been due to chance. Higher reported morbidity could be suggestive of
adverse selection into the scheme by women more likely to seek treatment. Fever and diarrhoeal
illness comprised one-third to one-half of all reported illness events, with a very low rate of
gynaecological morbidity. Given that hysterectomy was a common reason for hospitalisation, it was
unclear if women did not experience, or did not report, gynaecological conditions in the same manner as
common illnesses such as fever. A summary of seven studies on gynaecological morbidity in India
suggested that under-reporting is common in household surveys; they recommend the use of
experienced interviewers, the use of in-depth research to elicit perceptions of morbidity and detailed
survey questions to improve reporting accuracy[241]. Further, some studies have identified limited
consistency between clinical diagnoses and estimates based on self-reported gynaecological morbidity,
suggesting that research requires multi-disciplinary approaches to estimate frequency of, and women’s
experiences with, gynaecological morbidity[241, 242].
Intervention effect
Statistical analyses were conducted using random effects models fitted to individual data, and
confirmed with analysis based on cluster-level summaries. Both methods provided very similar results
in each analysis, indicating that in this instance 14 clusters per arm appeared adequate to utilise
individual data adjusted for clustering. Estimates of k using baseline data indicated different degrees of
clustering in rural and urban areas; hence they were presented separately to inform future research.
The coefficient k was also calculated using claims, hospitalisation and morbidity data for all conditions
(rather than only the three focused on in this trial) to be 0.39, 0.57, and 0.14 for urban rates and 0.74,
0.26, and 0.30 for rural rates of the respective outcomes.
After 18 months of intervention, analysis of VimoSEWA’s claims data detected no evidence of an effect
on claims for the three focus conditions. Claims rates in intervention and control areas were similar at
the end of the intervention and remained similar to those at baseline. Although an effect on
membership was not expected, the similarity in mean person-time insured per woman across arms
suggests that intensified contact with health workers, who also promote insurance membership, did not
have any major effect on renewals.
136
The trial was designed to detect a 40 percent reduction in claims for the three focus conditions. Though
the data do not suggest any effect of the intervention, the wide confidence intervals around the point
estimates do not preclude the possibility of a smaller effect. All estimates suggest that any effect is
likely to be less than 30 percent. VimoSEWA management had indicated that a reduction lower than 30-
40 percent would not have significant financial bearing on the claims ratio, and in particular would not
be enough to justify funding an education intervention.
Reported hospitalisation and morbidity rates were also similar in intervention and control areas during
and after the 18-month intervention period. Statistical analysis indicated no evidence of an intervention
effect on either outcome. Adjusting for a priori variables – urban/rural location, insurance status,
baseline rates and survey round – as well as those identified at baseline did not change effect estimates
importantly. There was also no evidence that the intervention had differential effects in insured and
uninsured women, although this analysis had low power.
Insurance coverage and hospitalisation
At baseline, there was strong evidence of an association of insurance membership with increased odds
of hospitalisation. Rates amongst insured women were approximately twice those of uninsured
women, in both intervention and control arms. Over 18 months, however, hospitalisation rates
amongst insured women decreased markedly in both arms. Seasonal variation did not explain this
pattern, as rates generally decreased further with each round. Moreover, this decrease over time was
not evident in the claims database: claims rates remained steady in both intervention and control areas
over the intervention period.
If the intervention had an effect on insured women, but the health education messages were spread
through population movement or by CHWs providing similar information in control areas, rates of
hospitalisation could have decreased in both arms. In this case, the true effect of the intervention would
have been underestimated or masked by contamination. Analysis of implementation processes
indicates that contamination by CHWs was unlikely in rural arms, but possible in urban areas (discussed
further in Chapter IX). Women associated with VimoSEWA may have met at organisational or
community events and shared messages with others not exposed to the intervention. However, the lack
137
of a corresponding decrease in claims rates suggests that contamination through population movement
does not explain the decline in reported hospitalisation rates amongst insured women.
A decrease in reported hospitalisation rates, but not in the claims database, could have been a result of
changes in insurance status over time amongst surveyed women. Insured women were recruited based
on current insurance status before the intervention, with the assumption that the majority would
remain insured over most of the study period. However, close to two-thirds of women insured at
baseline reported being uninsured by round four, with minimal crossover of women uninsured at
recruitment. Accordingly, hospitalisation rates amongst women insured at baseline could have
decreased to rates typical of uninsured women when their policies expired. Analysis using reported
insurance status in rounds three and four, rather than status at baseline, also indicated a decrease in
hospitalisation rates among currently insured women. Thus, while women did change insurance status
over the course of the intervention, it does not explain the decrease in reported hospitalisation rates
among insured women.
Rates of hospitalisation decreased in both insured and uninsured women by round four, with the
exception of an increase amongst insured women in the control arm. With a total of only 14
hospitalisations reported in round four, rate estimates are based on a very small number of episodes in
each category. The marked drop in reported hospitalisation episodes from baseline is suggestive of
survey fatigue, a known risk in cohort studies[191]. Reported morbidity was also relatively lower in
round four in both arms, while the claims database did not reflect any change. By the last survey round,
women may have reported no hospitalisations or illness episodes to shorten the interviewer’s visit.
Survey fatigue, however, does not explain why the decrease in hospitalisation rates was restricted to
insured women in rounds two and three.
Recall error may also explain some of the decrease over time and differences between insured and
uninsured women. Insured women may have welcomed the baseline survey as an opportunity to report
on insurance utilisation, or, as related by the survey team, as a medium to convey complaints about
claims servicing. Thus insured women may have reported events that extended beyond the six month
recall period at baseline, while uninsured women had no such incentive. The general consistency of
hospitalisation rates at baseline with the claims database, however, limits the likelihood of extensive
138
recall error at baseline as an explanation of the initially higher rate of reported hospitalisation amongst
insured women. While the data available do not allow for a firm conclusion, the stability of rates
derived from the claims database, compared with increasingly lower reporting of hospitalisation and
morbidity, over survey rounds is most consistent with survey fatigue. Change in insurance status and
recall error may also partly explain the differential decrease between insured and uninsured women,
although the low numbers of reported events prevent further interpretation.
Strengths and limitations
This trial evaluated an add-on education intervention in an ongoing health insurance and CHW
programme. A high proportion of hospitalisations in adult women for diarrhoea, fever and
hysterectomy was confirmed through both insurance claims and a household survey – indicating that
the intervention targeted conditions responsible for a significant proportion of treatment sought by
adult women in the study population. Tracking both insured and uninsured women allowed the
intervention to be examined from a community perspective, rather than solely for the insurance
program.
Implementation of a survey embedded within a community-based organisation helped ensure the
representativeness of the sample, as CHW work areas rather than government records were utilised to
identify eligible households. Similarly, close collaboration with VimoSEWA and SEWA CHWs ensured
that the intervention findings and interpretation of results would be relevant to practice. Lastly, the
utilisation of two data sources, a claims database and household survey, offered several lessons for
implementation of a community-based trial.
The use of routine VimoSEWA data had several advantages. The analysis of the effect of a health
education intervention utilised claims data from the entire insured population, rather than a sample.
The data were not compromised by survey fatigue, recall errors or other limitations of self-reporting
common in household surveys. Administrative data provided a standardised categorisation of reasons
for hospitalisation, as well as detailed information on membership history and product purchase. This
analysis also carried no survey costs for 35 months of membership and claims information across 28
clusters. However, the number of clusters, and hence the extent of membership and claims data utilised
from the database, was limited by the size of the CHW team available in the study area.
139
The analysis of the claims database had four potential limitations. One, the heuristic nature of the
matching exercise between the VimoSEWA database and the CHW-defined trial clusters may have
resulted in error related to cluster size and allocation. Women may have been omitted from the trial
analysis due to inaccurate identification of addresses that fall into a CHW work area, resulting in smaller
cluster sizes and thus lower power to detect an intervention effect. The baseline survey indicated that
2% of insured women were either misclassified or matched incorrectly. If a similar proportion of women
were misallocated between clusters in the claims analysis, an intervention effect may have been
masked. Rates of claims submission may have decreased amongst women exposed to the intervention,
but some women may have been wrongly allocated to a control cluster in the membership database,
leading to an underestimation of any difference in rates between intervention and control arms.
Similarly, women wrongly allocated to treatment clusters in the membership database would not have
been exposed to the intervention, thereby diluting a potential intervention effect. Claims data used in
the analysis was linked to members identified in the matching process, thus errors were likely limited to
one stage of categorisation. Further, errors related to cluster size or allocation were equally likely across
intervention arms.
Two, person-time per woman may have been underestimated if a member was assigned more than one
number, either due to data entry errors, administrative lapses or long periods of time between
renewals. However, since rates were calculated using person time and at the cluster level, this issue
should not alter effect estimates. Three, data on the reason for a claim depended on diagnoses that
could be inconsistent between providers. For example, fever – a leading reason for claims – typically
was not attributed to an underlying ailment in hospital discharge documents. Given high patient loads
and limited diagnostic equipment, providers in this setting typically do not provide more detail for
insurance claims. As there was no change in claims rates after the intervention, any diagnostic
inaccuracy was equally likely in control and intervention areas. Four, the database maintained limited
demographic information on members, limiting the extent to which balance across control and
intervention arms could be assessed.
The household survey expanded the evaluation of the intervention beyond insurance claims to include
hospitalisation and morbidity rates. The survey included more extensive demographic variables and
140
allowed for analysis of whether the intervention had different effects among insured and uninsured
women, although power to detect effect modification would have been low. The method of defining
clusters and listing households by following CHWs on daily rounds ensured that households would not
be left out or misclassified. The sample was thus likely to be inclusive of the most vulnerable, who are
often left off municipal or election records typically used for sample selection procedures.
The survey was conducted in three rounds after the start of the intervention, at six month intervals over
eighteen months. Multiple rounds allowed for shorter recall periods over the duration of the
intervention to limit recall errors – and increased person time under consideration – as opposed to one
endline survey. However, attrition was considerable: close to 300 urban households were lost to
follow-up by round four due to government-led slum demolitions. The demolished households were
primarily in areas close to Ahmedabad city’s main river, the Sabarmati, where longstanding settlements
of workers in the informal economy were displaced by a riverfront park for the growing middle class.
The demolitions were unanticipated, and thus not accounted for in sample size calculations. A slightly
higher number of households were lost to follow up in control areas compared to intervention (264 v.
220). Lastly, the survey was dependent on self-reported morbidity and hospitalisation, the accuracy of
which has been debated extensively in India and beyond [229, 230, 243-247] . Moreover, self-reporting
may have resulted in survey fatigue and potential recall errors, as discussed above.
The analysis was limited by three issues relating to sample size, all of which will have reduced the power
of the trial below the planned level. The sample size should have accounted for higher attrition, and
potentially could have included more insured members to address high membership turnover. Also,
the number of hospitalisation events per cluster was lower than anticipated. Sample size calculations
were based on a review of claims data. The study team assumed that claims data would be an
underestimate of hospitalisation rates, and accordingly anticipated a higher number of hospitalisation
events per cluster. Hospitalisation estimates based on the NSS were not utilised, as the last survey with
hospitalisation data was conducted in 2004. Inclusion of more households per cluster could have been
considered, notwithstanding budgetary issues that led to the initial sample of 70 households per cluster.
Further, the initial estimate of 0.28 for k, considerably lower than that retrospectively calculated with
baseline data, was based on aggregated rural and urban claims data that was not matched to clusters
with the help of grassroots workers, and relied on database categories of illness, rather than manual
141
categorisation into the three conditions as conducted during the trial analysis. Although the number of
clusters was limited by the availability of CHWs, better estimation of between cluster-variation during
the design phase would have made a stronger case to consider a higher sample size per cluster to
improve power and precision, while noting the diminishing returns of increasing sample size given large
values of k.
The analysis could have been strengthened considerably by better cross-verification between the two
data sources. The claims database, which confirmed overall hospitalisation patterns, was accessed only
twice (once before the intervention and three months following its completion). Not having anticipated
the difficulty in linking members to clusters and to the survey sample, the team did not include a local
data manager to access the database more frequently and verify information in the claims database
with grassroots workers throughout the intervention period. Despite several attempts to link data, it
was not possible to use the claims database to verify claims information reported by all of the insured
women in the sample.
Conclusion
This cluster randomised trial did not detect evidence of an effect of the intervention on health insurance
claims, hospitalisation and morbidity related to fever, diarrhoea and hysterectomy/gynaecological
ailments. Accordingly, scale-up of the CHW-led health education intervention was not recommended to
VimoSEWA or for other populations. The intervention process is explored in Chapter IX. The findings of
this study also underscore the need to understand further treatment-seeking patterns related to the
leading causes of hospitalisation amongst adult women in Gujarat. The following two chapters present
results on expenditure and findings of an in-depth examination of hysterectomy.
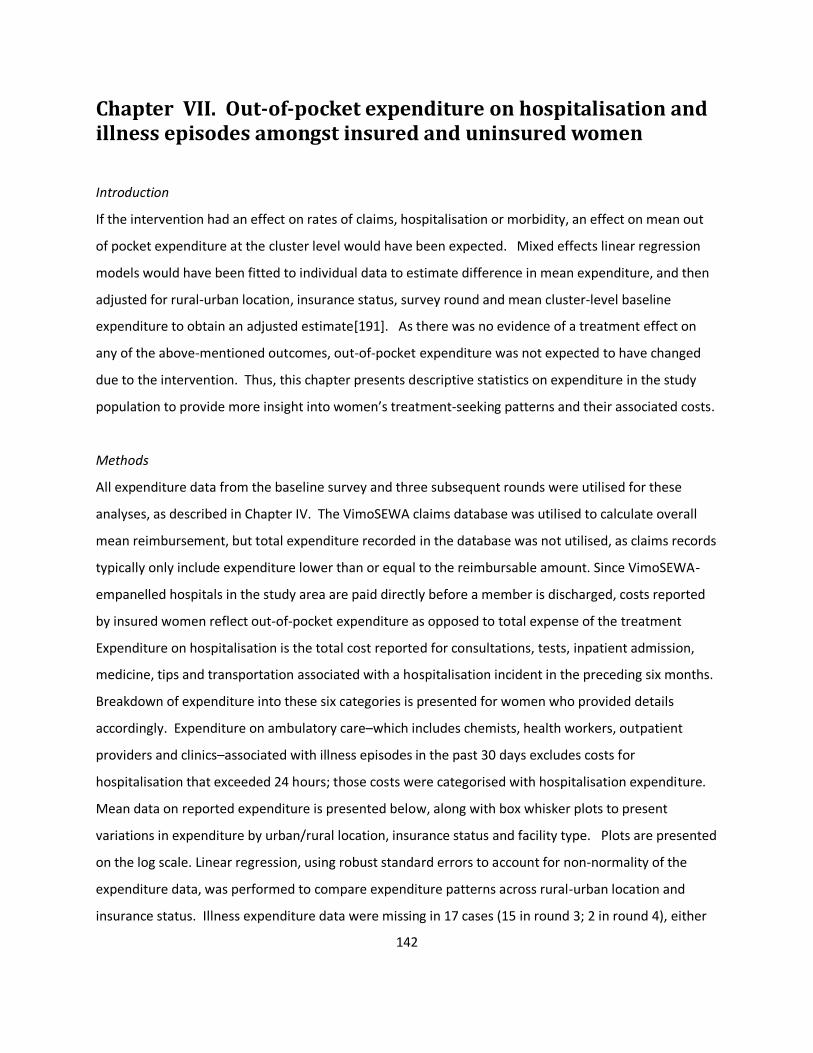
142
Chapter VII. Out-of-pocket expenditure on hospitalisation and illness episodes amongst insured and uninsured women
Introduction
If the intervention had an effect on rates of claims, hospitalisation or morbidity, an effect on mean out
of pocket expenditure at the cluster level would have been expected. Mixed effects linear regression
models would have been fitted to individual data to estimate difference in mean expenditure, and then
adjusted for rural-urban location, insurance status, survey round and mean cluster-level baseline
expenditure to obtain an adjusted estimate[191]. As there was no evidence of a treatment effect on
any of the above-mentioned outcomes, out-of-pocket expenditure was not expected to have changed
due to the intervention. Thus, this chapter presents descriptive statistics on expenditure in the study
population to provide more insight into women’s treatment-seeking patterns and their associated costs.
Methods
All expenditure data from the baseline survey and three subsequent rounds were utilised for these
analyses, as described in Chapter IV. The VimoSEWA claims database was utilised to calculate overall
mean reimbursement, but total expenditure recorded in the database was not utilised, as claims records
typically only include expenditure lower than or equal to the reimbursable amount. Since VimoSEWA-
empanelled hospitals in the study area are paid directly before a member is discharged, costs reported
by insured women reflect out-of-pocket expenditure as opposed to total expense of the treatment
Expenditure on hospitalisation is the total cost reported for consultations, tests, inpatient admission,
medicine, tips and transportation associated with a hospitalisation incident in the preceding six months.
Breakdown of expenditure into these six categories is presented for women who provided details
accordingly. Expenditure on ambulatory care–which includes chemists, health workers, outpatient
providers and clinics–associated with illness episodes in the past 30 days excludes costs for
hospitalisation that exceeded 24 hours; those costs were categorised with hospitalisation expenditure.
Mean data on reported expenditure is presented below, along with box whisker plots to present
variations in expenditure by urban/rural location, insurance status and facility type. Plots are presented
on the log scale. Linear regression, using robust standard errors to account for non-normality of the
expenditure data, was performed to compare expenditure patterns across rural-urban location and
insurance status. Illness expenditure data were missing in 17 cases (15 in round 3; 2 in round 4), either
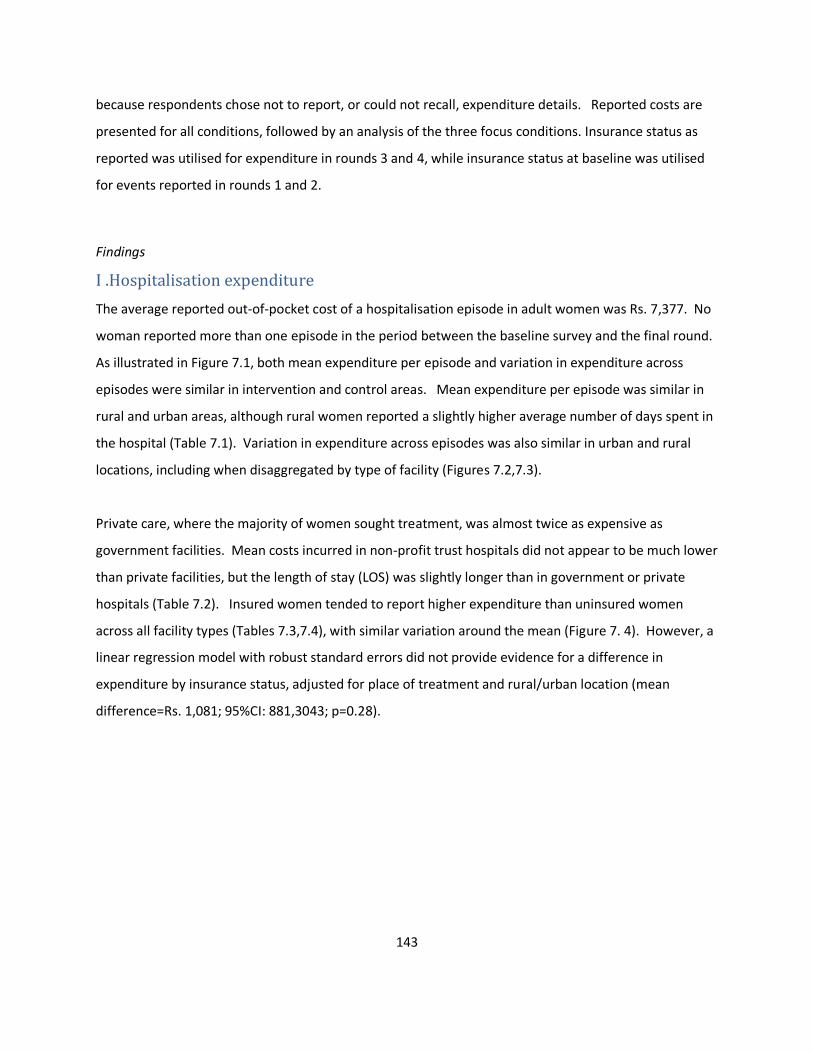
143
because respondents chose not to report, or could not recall, expenditure details. Reported costs are
presented for all conditions, followed by an analysis of the three focus conditions. Insurance status as
reported was utilised for expenditure in rounds 3 and 4, while insurance status at baseline was utilised
for events reported in rounds 1 and 2.
Findings
I .Hospitalisation expenditure
The average reported out-of-pocket cost of a hospitalisation episode in adult women was Rs. 7,377. No
woman reported more than one episode in the period between the baseline survey and the final round.
As illustrated in Figure 7.1, both mean expenditure per episode and variation in expenditure across
episodes were similar in intervention and control areas. Mean expenditure per episode was similar in
rural and urban areas, although rural women reported a slightly higher average number of days spent in
the hospital (Table 7.1). Variation in expenditure across episodes was also similar in urban and rural
locations, including when disaggregated by type of facility (Figures 7.2,7.3).
Private care, where the majority of women sought treatment, was almost twice as expensive as
government facilities. Mean costs incurred in non-profit trust hospitals did not appear to be much lower
than private facilities, but the length of stay (LOS) was slightly longer than in government or private
hospitals (Table 7.2). Insured women tended to report higher expenditure than uninsured women
across all facility types (Tables 7.3,7.4), with similar variation around the mean (Figure 7. 4). However, a
linear regression model with robust standard errors did not provide evidence for a difference in
expenditure by insurance status, adjusted for place of treatment and rural/urban location (mean
difference=Rs. 1,081; 95%CI: 881,3043; p=0.28).
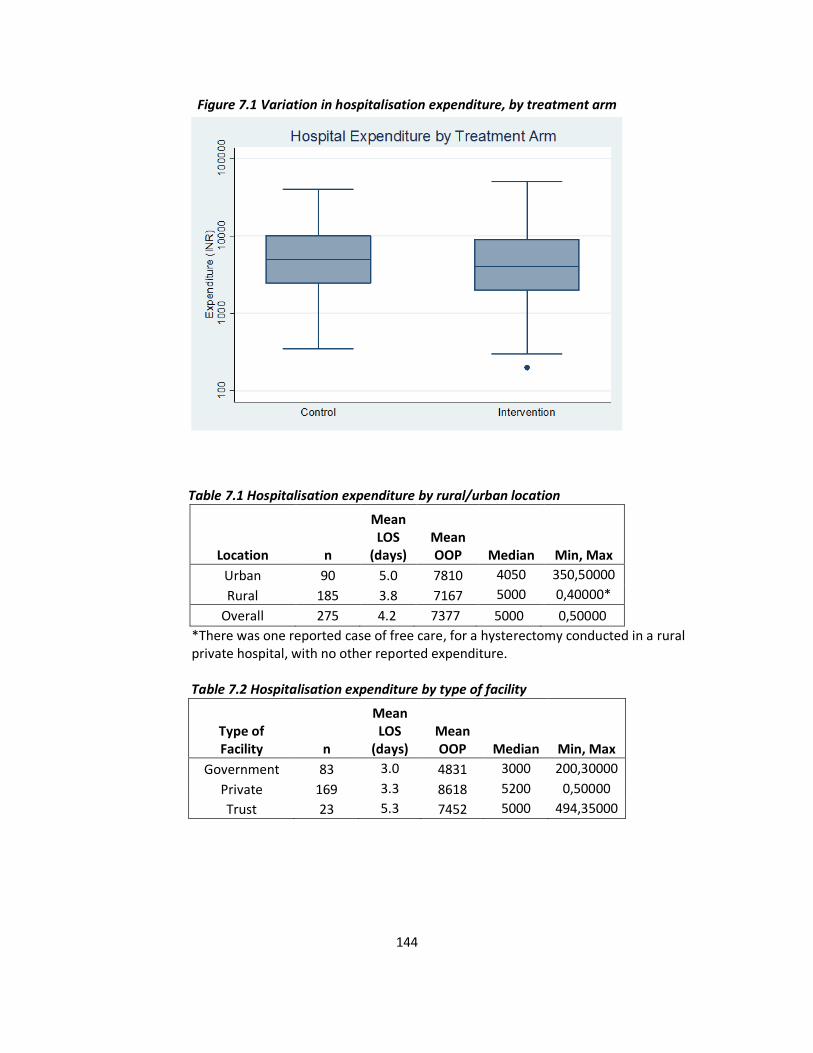
144
Figure 7.1 Variation in hospitalisation expenditure, by treatment arm
Table 7.1 Hospitalisation expenditure by rural/urban location
Location n
Mean LOS
(days) Mean OOP Median Min, Max
Urban 90 5.0 7810 4050 350,50000
Rural 185 3.8 7167 5000 0,40000*
Overall 275 4.2 7377 5000 0,50000
*There was one reported case of free care, for a hysterectomy conducted in a rural private hospital, with no other reported expenditure.
Table 7.2 Hospitalisation expenditure by type of facility
Type of Facility n
Mean LOS
(days) Mean OOP Median Min, Max
Government 83 3.0 4831 3000 200,30000
Private 169 3.3 8618 5200 0,50000
Trust 23 5.3 7452 5000 494,35000
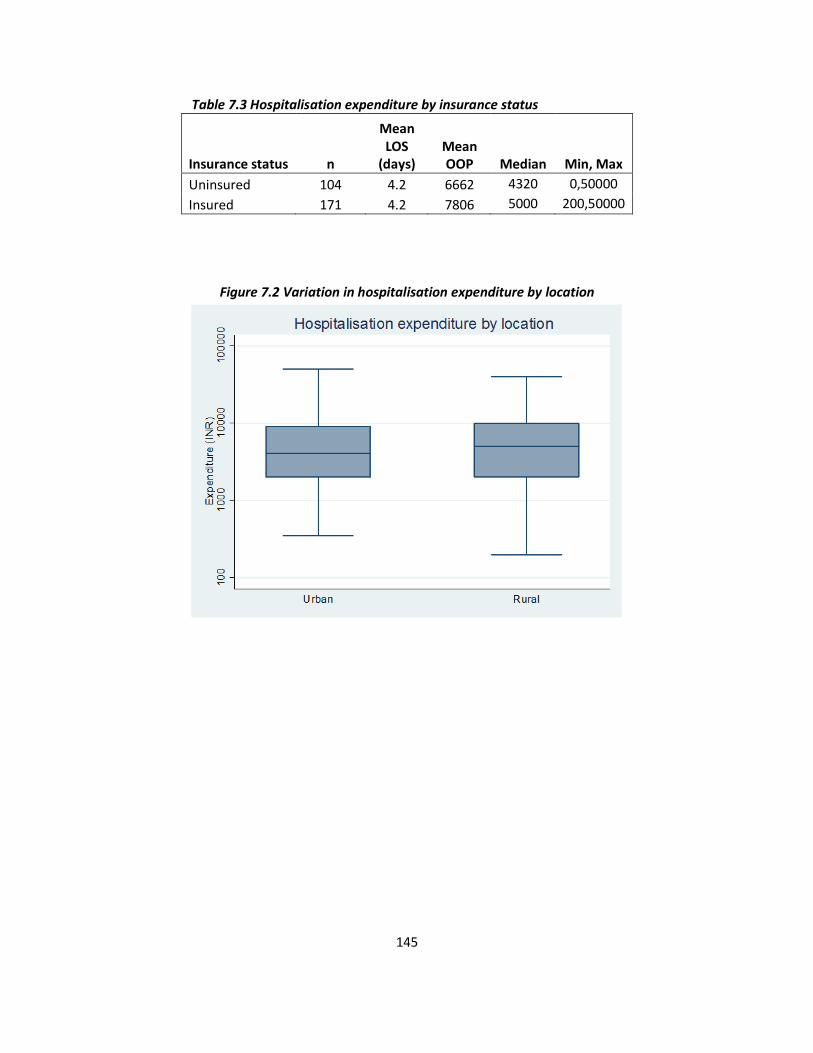
145
Table 7.3 Hospitalisation expenditure by insurance status
Insurance status n
Mean LOS
(days) Mean OOP Median Min, Max
Uninsured 104 4.2 6662 4320 0,50000
Insured 171 4.2 7806 5000 200,50000
Figure 7.2 Variation in hospitalisation expenditure by location
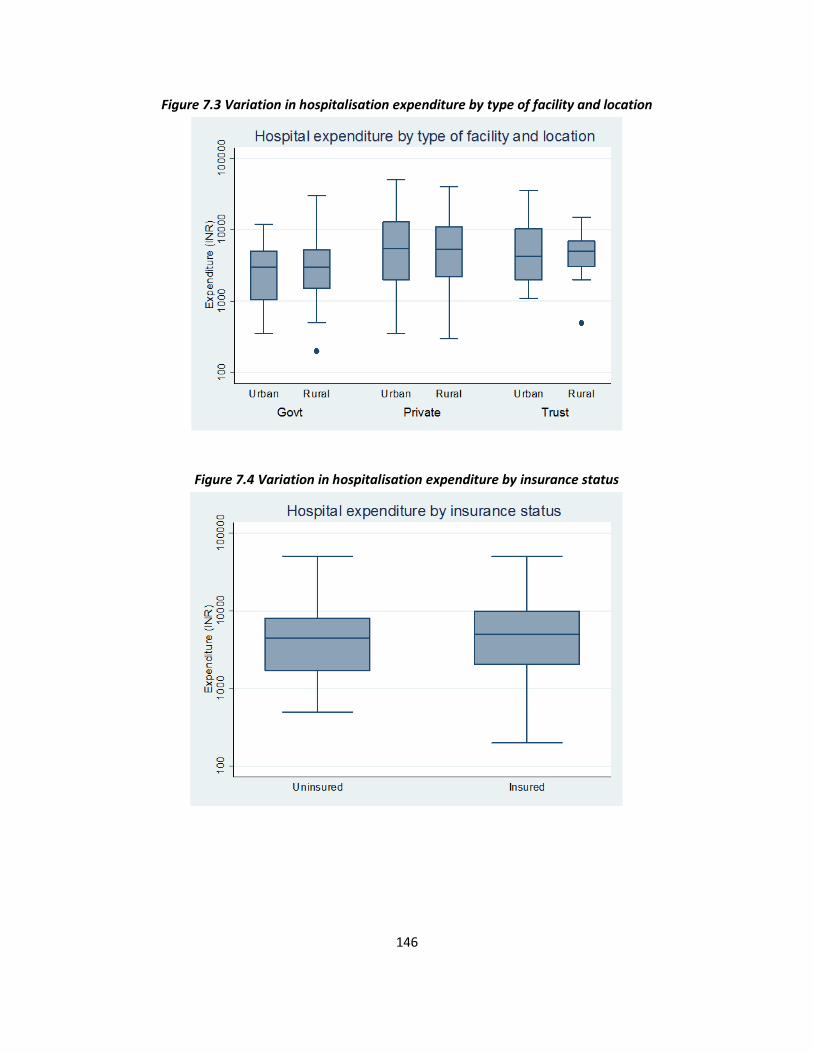
146
Figure 7.3 Variation in hospitalisation expenditure by type of facility and location
Figure 7.4 Variation in hospitalisation expenditure by insurance status
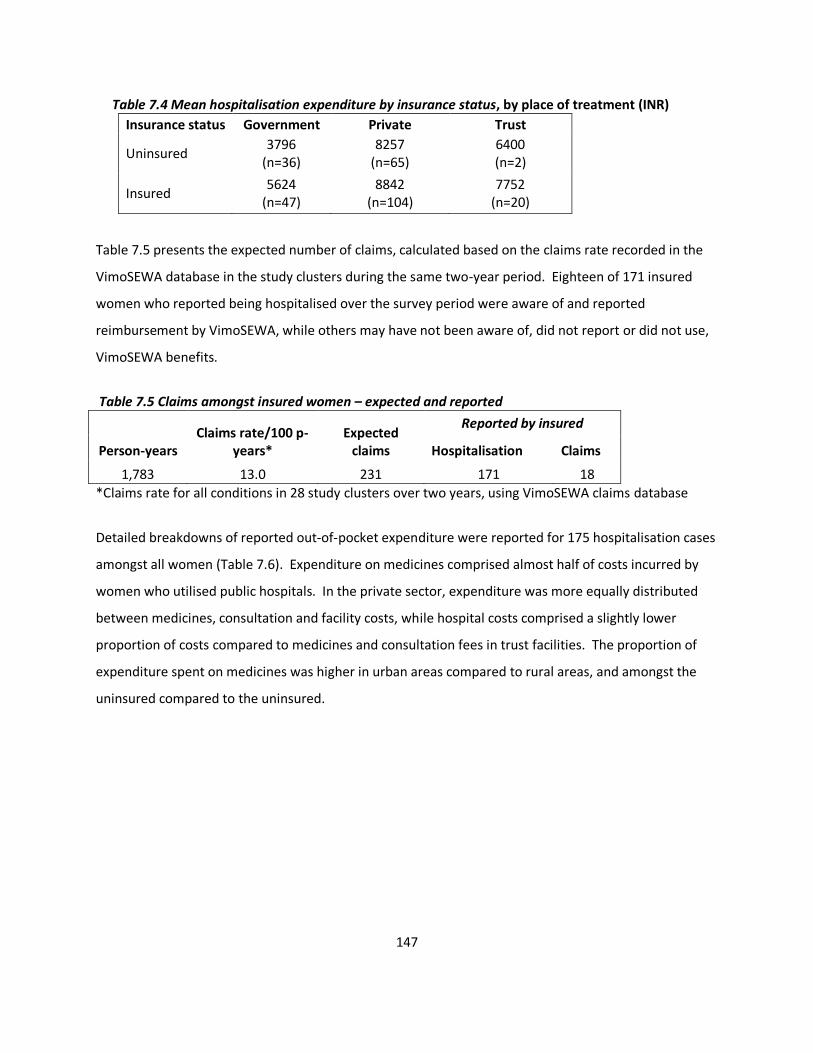
147
Table 7.4 Mean hospitalisation expenditure by insurance status, by place of treatment (INR)
Insurance status Government Private Trust
Uninsured 3796
(n=36) 8257
(n=65) 6400 (n=2)
Insured 5624
(n=47) 8842
(n=104) 7752
(n=20)
Table 7.5 presents the expected number of claims, calculated based on the claims rate recorded in the
VimoSEWA database in the study clusters during the same two-year period. Eighteen of 171 insured
women who reported being hospitalised over the survey period were aware of and reported
reimbursement by VimoSEWA, while others may have not been aware of, did not report or did not use,
VimoSEWA benefits.
Table 7.5 Claims amongst insured women – expected and reported
Person-years Claims rate/100 p-
years* Expected
claims
Reported by insured
Hospitalisation Claims
1,783 13.0 231 171 18
*Claims rate for all conditions in 28 study clusters over two years, using VimoSEWA claims database
Detailed breakdowns of reported out-of-pocket expenditure were reported for 175 hospitalisation cases
amongst all women (Table 7.6). Expenditure on medicines comprised almost half of costs incurred by
women who utilised public hospitals. In the private sector, expenditure was more equally distributed
between medicines, consultation and facility costs, while hospital costs comprised a slightly lower
proportion of costs compared to medicines and consultation fees in trust facilities. The proportion of
expenditure spent on medicines was higher in urban areas compared to rural areas, and amongst the
uninsured compared to the uninsured.
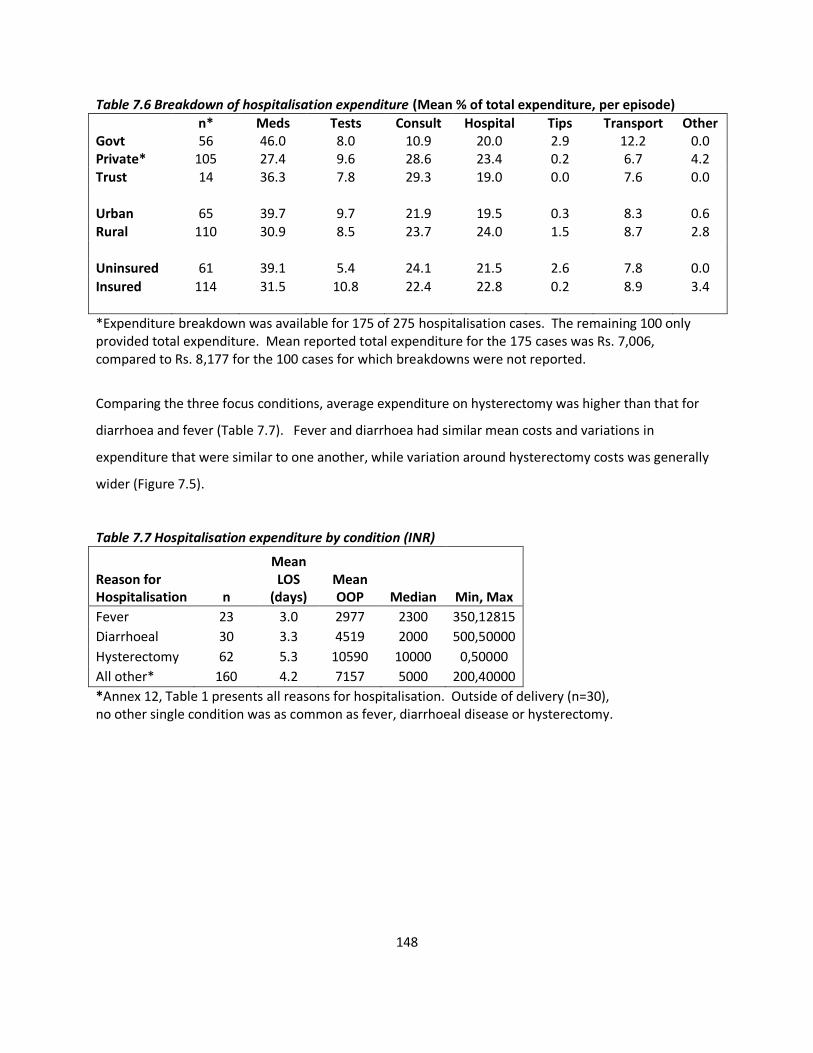
148
Table 7.6 Breakdown of hospitalisation expenditure (Mean % of total expenditure, per episode)
n* Meds Tests Consult Hospital Tips Transport Other Govt 56 46.0 8.0 10.9 20.0 2.9 12.2 0.0 Private* 105 27.4 9.6 28.6 23.4 0.2 6.7 4.2 Trust 14 36.3 7.8 29.3 19.0 0.0 7.6 0.0 Urban 65 39.7 9.7 21.9 19.5 0.3 8.3 0.6 Rural 110 30.9 8.5 23.7 24.0 1.5 8.7 2.8 Uninsured 61 39.1 5.4 24.1 21.5 2.6 7.8 0.0
Insured 114 31.5 10.8 22.4 22.8 0.2 8.9 3.4
*Expenditure breakdown was available for 175 of 275 hospitalisation cases. The remaining 100 only provided total expenditure. Mean reported total expenditure for the 175 cases was Rs. 7,006, compared to Rs. 8,177 for the 100 cases for which breakdowns were not reported.
Comparing the three focus conditions, average expenditure on hysterectomy was higher than that for
diarrhoea and fever (Table 7.7). Fever and diarrhoea had similar mean costs and variations in
expenditure that were similar to one another, while variation around hysterectomy costs was generally
wider (Figure 7.5).
Table 7.7 Hospitalisation expenditure by condition (INR)
Reason for Hospitalisation n
Mean LOS
(days) Mean OOP Median Min, Max
Fever 23 3.0 2977 2300 350,12815
Diarrhoeal 30 3.3 4519 2000 500,50000
Hysterectomy 62 5.3 10590 10000 0,50000
All other* 160 4.2 7157 5000 200,40000
*Annex 12, Table 1 presents all reasons for hospitalisation. Outside of delivery (n=30), no other single condition was as common as fever, diarrhoeal disease or hysterectomy.
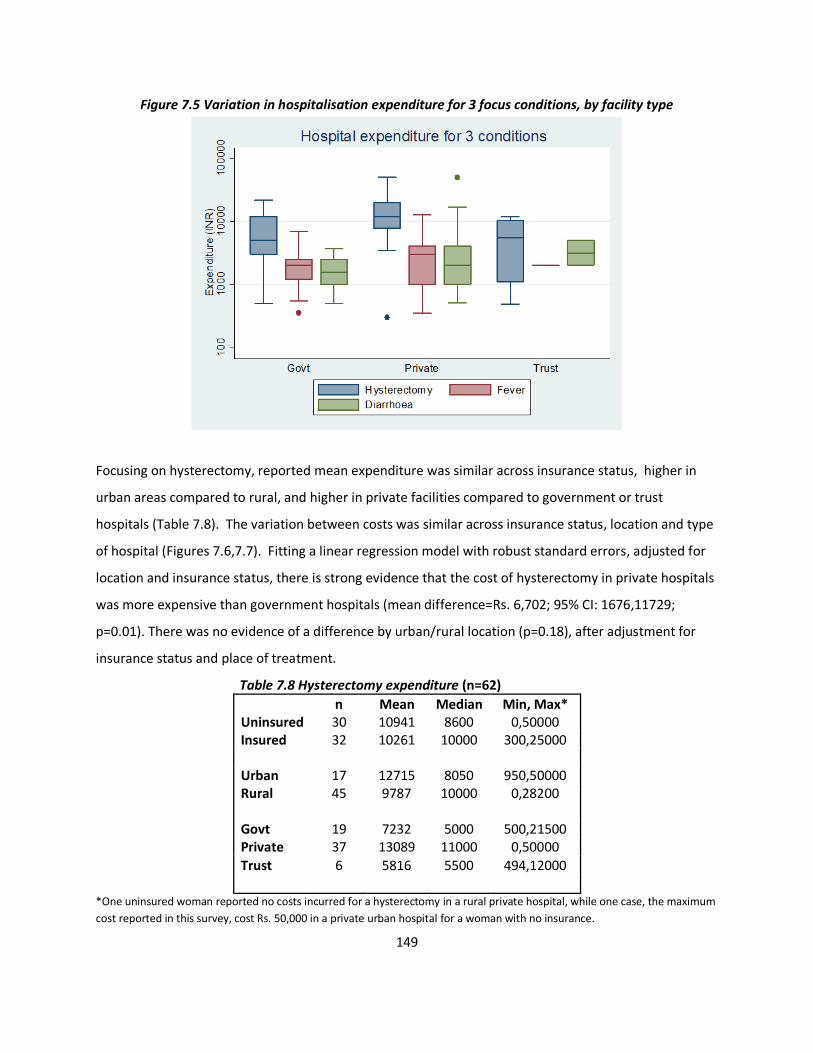
149
Figure 7.5 Variation in hospitalisation expenditure for 3 focus conditions, by facility type
Focusing on hysterectomy, reported mean expenditure was similar across insurance status, higher in
urban areas compared to rural, and higher in private facilities compared to government or trust
hospitals (Table 7.8). The variation between costs was similar across insurance status, location and type
of hospital (Figures 7.6,7.7). Fitting a linear regression model with robust standard errors, adjusted for
location and insurance status, there is strong evidence that the cost of hysterectomy in private hospitals
was more expensive than government hospitals (mean difference=Rs. 6,702; 95% CI: 1676,11729;
p=0.01). There was no evidence of a difference by urban/rural location (p=0.18), after adjustment for
insurance status and place of treatment.
Table 7.8 Hysterectomy expenditure (n=62)
n Mean Median Min, Max* Uninsured 30 10941 8600 0,50000 Insured 32 10261 10000 300,25000
Urban 17 12715 8050 950,50000 Rural 45 9787 10000 0,28200
Govt 19 7232 5000 500,21500 Private 37 13089 11000 0,50000
Trust 6 5816 5500 494,12000
*One uninsured woman reported no costs incurred for a hysterectomy in a rural private hospital, while one case, the maximum
cost reported in this survey, cost Rs. 50,000 in a private urban hospital for a woman with no insurance.
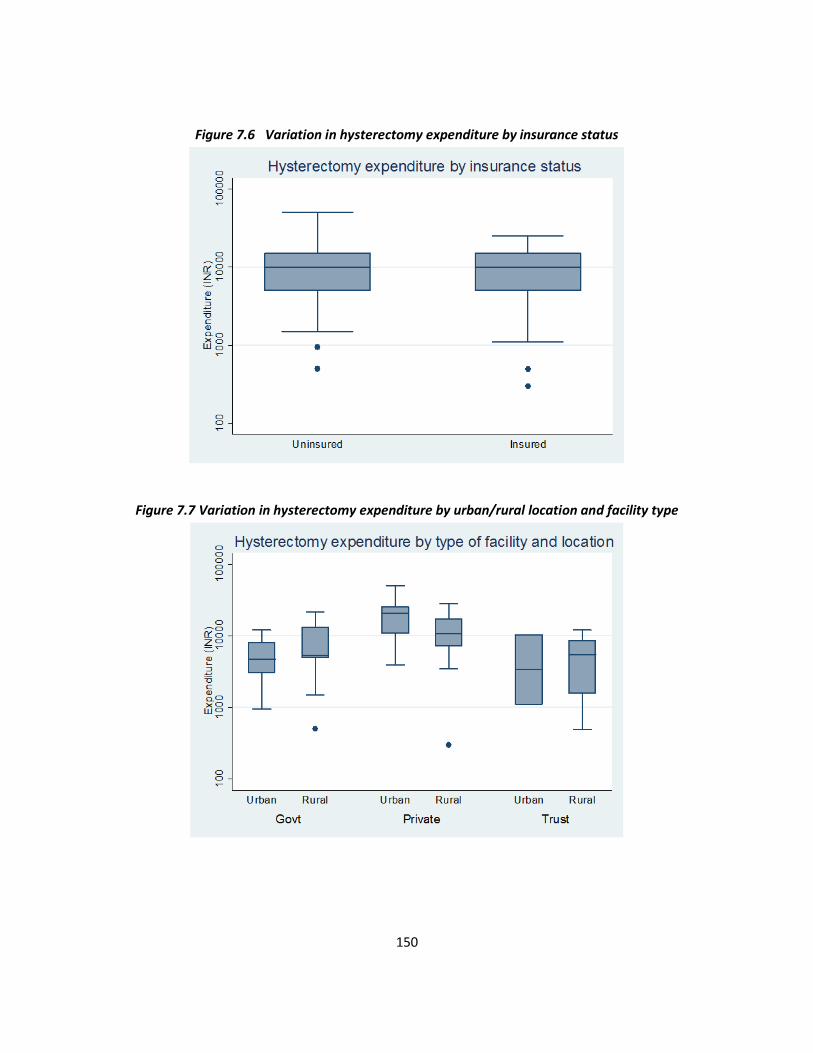
150
Figure 7.6 Variation in hysterectomy expenditure by insurance status
Figure 7.7 Variation in hysterectomy expenditure by urban/rural location and facility type
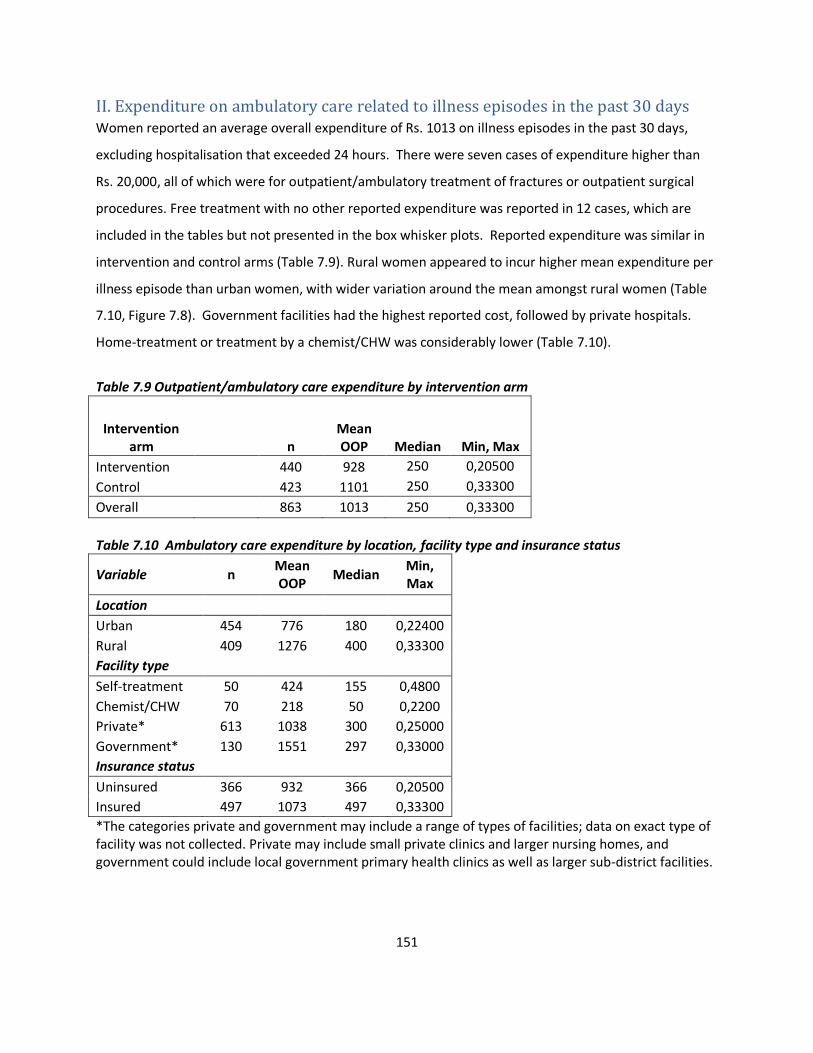
151
II. Expenditure on ambulatory care related to illness episodes in the past 30 days Women reported an average overall expenditure of Rs. 1013 on illness episodes in the past 30 days,
excluding hospitalisation that exceeded 24 hours. There were seven cases of expenditure higher than
Rs. 20,000, all of which were for outpatient/ambulatory treatment of fractures or outpatient surgical
procedures. Free treatment with no other reported expenditure was reported in 12 cases, which are
included in the tables but not presented in the box whisker plots. Reported expenditure was similar in
intervention and control arms (Table 7.9). Rural women appeared to incur higher mean expenditure per
illness episode than urban women, with wider variation around the mean amongst rural women (Table
7.10, Figure 7.8). Government facilities had the highest reported cost, followed by private hospitals.
Home-treatment or treatment by a chemist/CHW was considerably lower (Table 7.10).
Table 7.9 Outpatient/ambulatory care expenditure by intervention arm
Intervention arm
n Mean OOP Median Min, Max
Intervention 440 928 250 0,20500
Control 423 1101 250 0,33300
Overall 863 1013 250 0,33300
Table 7.10 Ambulatory care expenditure by location, facility type and insurance status
Variable n Mean OOP
Median Min, Max
Location
Urban 454 776 180 0,22400
Rural 409 1276 400 0,33300
Facility type
Self-treatment 50 424 155 0,4800
Chemist/CHW 70 218 50 0,2200
Private* 613 1038 300 0,25000
Government* 130 1551 297 0,33000
Insurance status
Uninsured 366 932 366 0,20500
Insured 497 1073 497 0,33300
*The categories private and government may include a range of types of facilities; data on exact type of facility was not collected. Private may include small private clinics and larger nursing homes, and government could include local government primary health clinics as well as larger sub-district facilities.
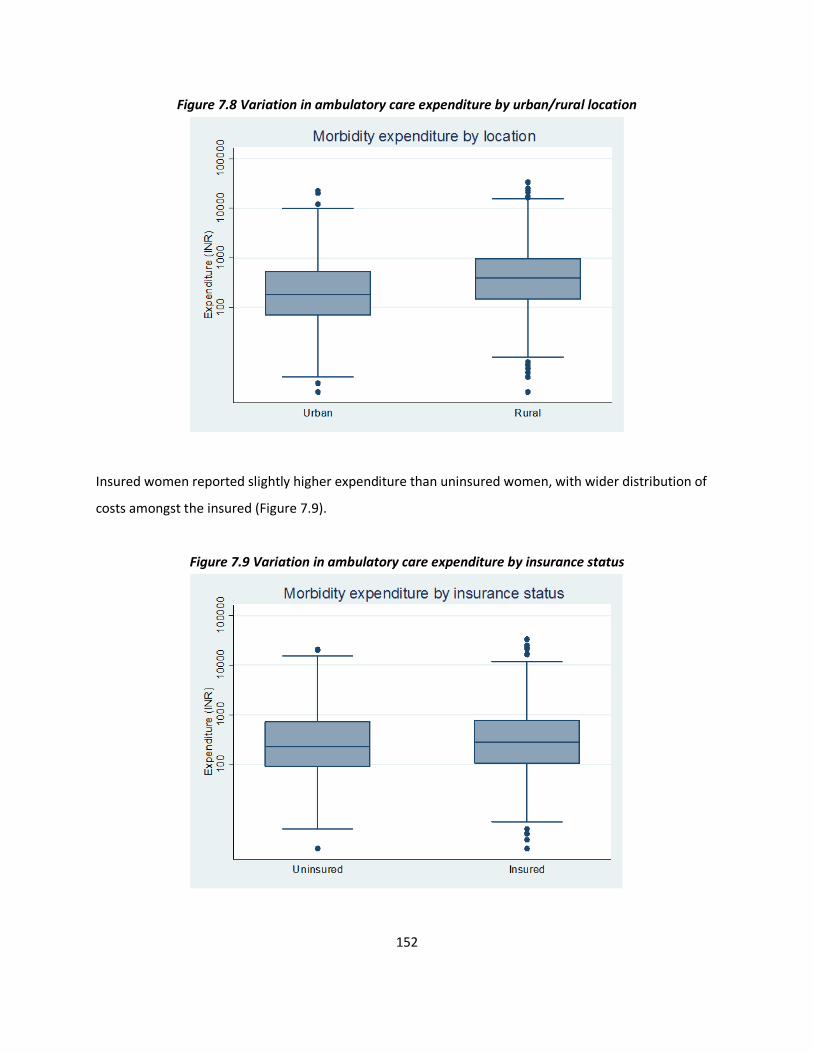
152
Figure 7.8 Variation in ambulatory care expenditure by urban/rural location
Insured women reported slightly higher expenditure than uninsured women, with wider distribution of
costs amongst the insured (Figure 7.9).
Figure 7.9 Variation in ambulatory care expenditure by insurance status
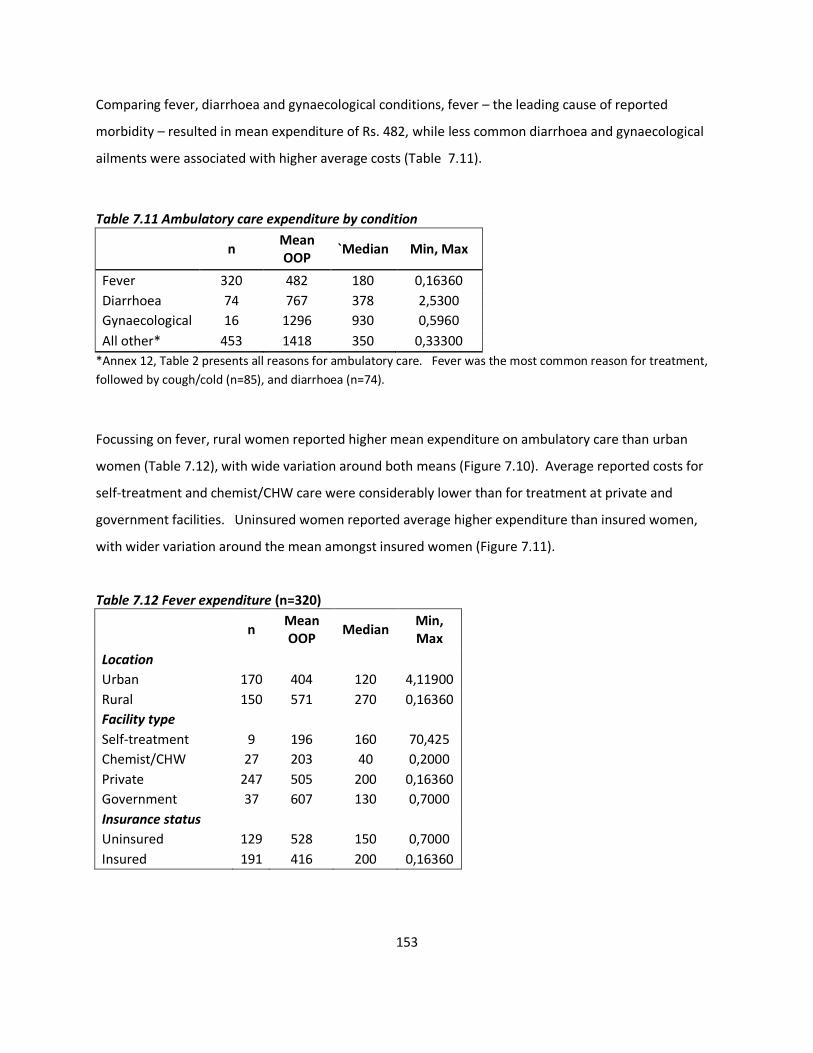
153
Comparing fever, diarrhoea and gynaecological conditions, fever – the leading cause of reported
morbidity – resulted in mean expenditure of Rs. 482, while less common diarrhoea and gynaecological
ailments were associated with higher average costs (Table 7.11).
Table 7.11 Ambulatory care expenditure by condition
n Mean OOP
`Median Min, Max
Fever 320 482 180 0,16360
Diarrhoea 74 767 378 2,5300
Gynaecological 16 1296 930 0,5960
All other* 453 1418 350 0,33300
*Annex 12, Table 2 presents all reasons for ambulatory care. Fever was the most common reason for treatment,
followed by cough/cold (n=85), and diarrhoea (n=74).
Focussing on fever, rural women reported higher mean expenditure on ambulatory care than urban
women (Table 7.12), with wide variation around both means (Figure 7.10). Average reported costs for
self-treatment and chemist/CHW care were considerably lower than for treatment at private and
government facilities. Uninsured women reported average higher expenditure than insured women,
with wider variation around the mean amongst insured women (Figure 7.11).
Table 7.12 Fever expenditure (n=320)
n Mean OOP
Median Min, Max
Location
Urban 170 404 120 4,11900
Rural 150 571 270 0,16360
Facility type
Self-treatment 9 196 160 70,425
Chemist/CHW 27 203 40 0,2000
Private 247 505 200 0,16360
Government 37 607 130 0,7000
Insurance status
Uninsured 129 528 150 0,7000
Insured 191 416 200 0,16360
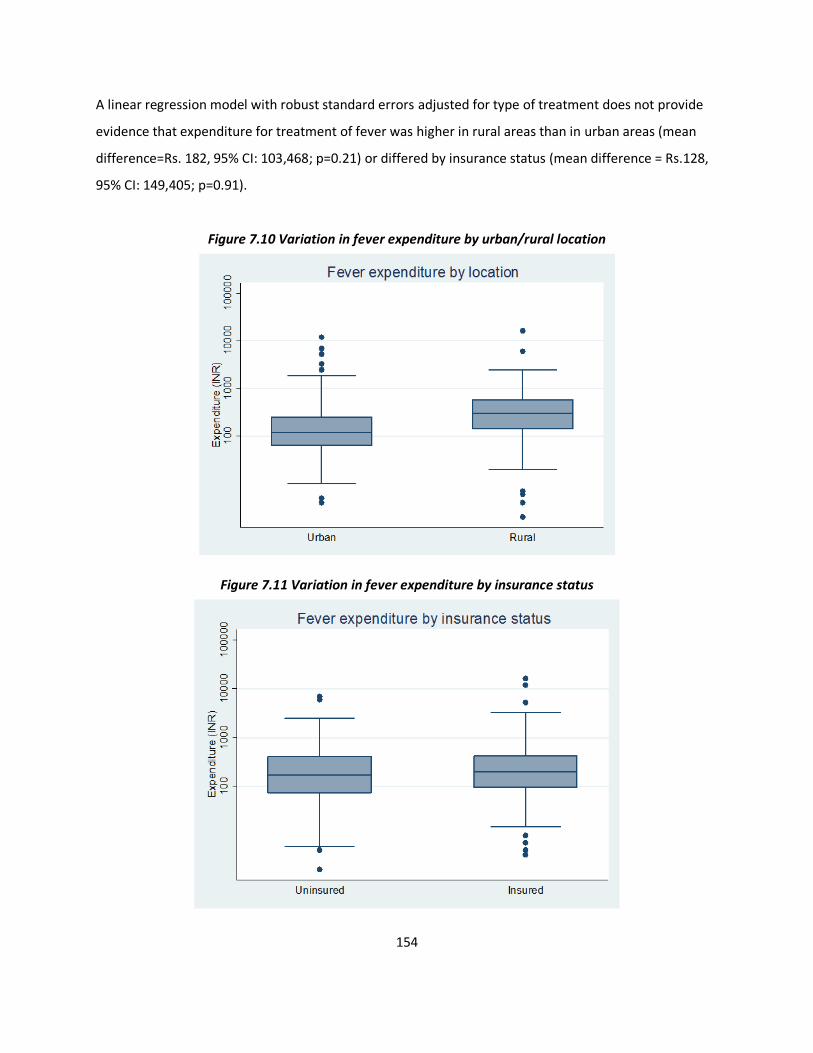
154
A linear regression model with robust standard errors adjusted for type of treatment does not provide
evidence that expenditure for treatment of fever was higher in rural areas than in urban areas (mean
difference=Rs. 182, 95% CI: 103,468; p=0.21) or differed by insurance status (mean difference = Rs.128,
95% CI: 149,405; p=0.91).
Figure 7.10 Variation in fever expenditure by urban/rural location
Figure 7.11 Variation in fever expenditure by insurance status
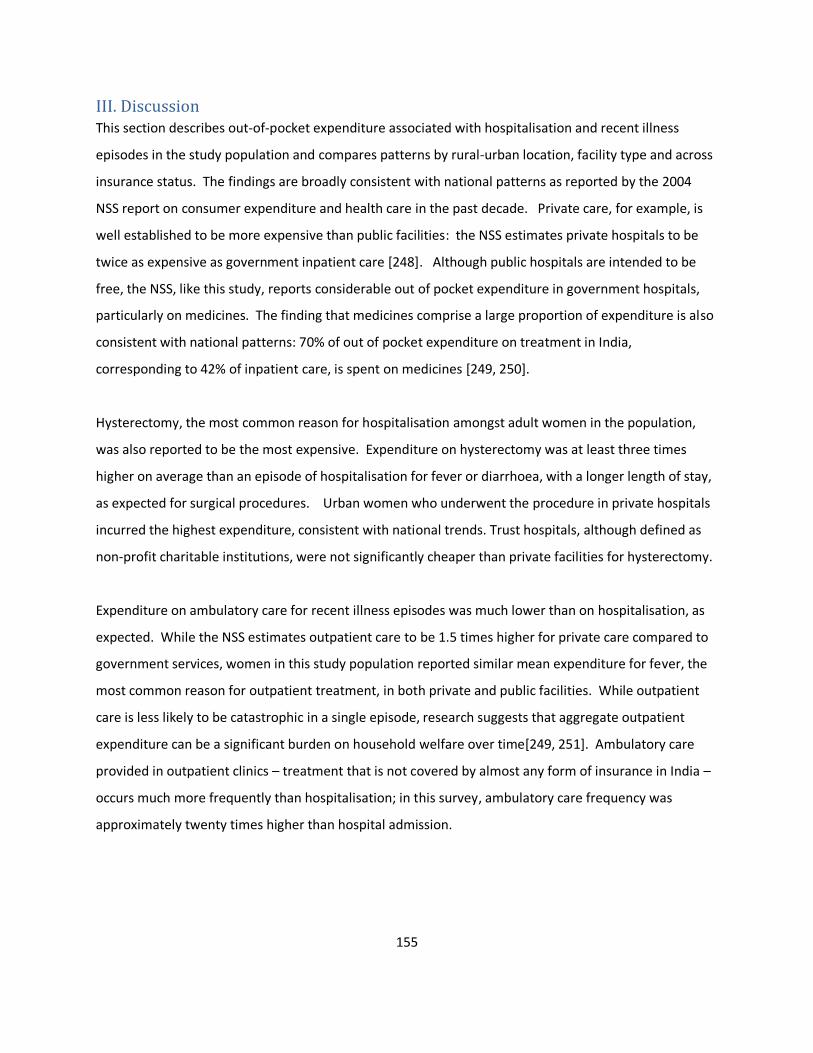
155
III. Discussion This section describes out-of-pocket expenditure associated with hospitalisation and recent illness
episodes in the study population and compares patterns by rural-urban location, facility type and across
insurance status. The findings are broadly consistent with national patterns as reported by the 2004
NSS report on consumer expenditure and health care in the past decade. Private care, for example, is
well established to be more expensive than public facilities: the NSS estimates private hospitals to be
twice as expensive as government inpatient care [248]. Although public hospitals are intended to be
free, the NSS, like this study, reports considerable out of pocket expenditure in government hospitals,
particularly on medicines. The finding that medicines comprise a large proportion of expenditure is also
consistent with national patterns: 70% of out of pocket expenditure on treatment in India,
corresponding to 42% of inpatient care, is spent on medicines [249, 250].
Hysterectomy, the most common reason for hospitalisation amongst adult women in the population,
was also reported to be the most expensive. Expenditure on hysterectomy was at least three times
higher on average than an episode of hospitalisation for fever or diarrhoea, with a longer length of stay,
as expected for surgical procedures. Urban women who underwent the procedure in private hospitals
incurred the highest expenditure, consistent with national trends. Trust hospitals, although defined as
non-profit charitable institutions, were not significantly cheaper than private facilities for hysterectomy.
Expenditure on ambulatory care for recent illness episodes was much lower than on hospitalisation, as
expected. While the NSS estimates outpatient care to be 1.5 times higher for private care compared to
government services, women in this study population reported similar mean expenditure for fever, the
most common reason for outpatient treatment, in both private and public facilities. While outpatient
care is less likely to be catastrophic in a single episode, research suggests that aggregate outpatient
expenditure can be a significant burden on household welfare over time[249, 251]. Ambulatory care
provided in outpatient clinics – treatment that is not covered by almost any form of insurance in India –
occurs much more frequently than hospitalisation; in this survey, ambulatory care frequency was
approximately twenty times higher than hospital admission.
156
Financial security provided by insurance
Although an assessment of the impact of out-of-pocket expenditure on household financial security is
beyond the scope of this study, the data suggest that a single hospitalisation could have significant
financial implications for a household. The average cost per episode (Rs. 7,432) is slightly higher than
the average household monthly income (INR 6,000-7,000), indicating that women may have had to
utilise savings, borrow from others, or sell assets to finance treatment. The average expenditure on
hysterectomy, close to Rs. 11,000, would constitute approximately 15 percent of the average
household’s annual income. Previous research at VimoSEWA and other CBHI schemes in India indicated
that insurance coverage can provide partial protection from catastrophic health expenditure[34]. A
household survey in 2000 found that VimoSEWA members spent 54% less on hospitalisation than
uninsured women, a pattern that remained consistent even if cases were not reimbursed[187].
In this survey, however, insured and uninsured women reported similar expenditure on hospitalisation
(adjusted for place of treatment and rural/urban location), with a similar proportion of overall
expenditure spent on hospital costs. During the survey period, VimoSEWA’s claims database indicates
that claimants were reimbursed an average of Rs. 2,763 for claims for the three focus conditions and Rs
2,598 for all conditions during the two year period. Accordingly, expenditure reported by insured
women would be expected to be lower than that reported by uninsured women.
Factors related to utilisation of VimoSEWA benefits, reporting and recall errors and moral hazard may
explain similar levels of expenditure amongst insured and uninsured women. Specific to VimoSEWA,
insured women may not have utilised their cashless coverage by seeking care in a non-empanelled
hospital or by choosing not to submit a claim at all. VimoSEWA workers either sit in, or regularly visit,
empanelled facilities to ensure claims are adjudicated before a patient is discharged. If an insured
woman did not make contact with VimoSEWA during the admission process or utilised a non-
empanelled hospital, she would have to submit a claim for regular, non-cashless processing, which could
take up to one month for reimbursement. In the survey, 18 of 171 insured women reported knowing
they were reimbursed by VimoSEWA. It is possible that the remainder either (i) were awaiting
reimbursement at the time of the survey (approximately 45 percent of claims utilise the non-cashless
route, which typically adjudicates claims within one month) (ii) did not recall receiving reimbursement,
possibly because it was cashless and did not require extensive paperwork (iii) did not submit a claim for
157
the reported hospitalisation or (iv) were rejected for reimbursement. Approximately 15 percent of
VimoSEWA claims were rejected for reimbursement during the same period in Ahmedabad city and
district.
Another possibility is that women may not have been aware they had VimoSEWA coverage and did not
utilise cashless services or submit a claim, although as primary policyholders this is unlikely.
Administrative procedures involved in submitting a claim, previously identified by VimoSEWA as a
primary barrier to claims, should have been eliminated with the introduction of cashless reimbursement
services [252]. Further research would be required to explore why women would not use a scheme for
which they paid a premium, such as whether they are dissatisfied with the quality of services provided
under the scheme.
Regarding reporting, comparison of VimoSEWA’s claims rate with survey reports indicates a likelihood of
underreported hospitalisation and claims. Applying the claims rate at the time of the survey to the
person-time of insured women surveyed, 293 claims would have been expected. However, insured
women reported only 171 hospitalisations, of which 18 were reported reimbursed. Women may have
underreported hospitalisation or claims due to recall errors, survey fatigue or unwillingness to share
personal health and financial information. While such a pattern would have been equally likely in
intervention and control areas, in these circumstances this analysis of out of pocket expenditure would
result in an underestimate of actual expenditure in this population. Further, insured women may have
recalled expenditure differently due to their interaction with VimoSEWA –or uninsured women recalled
expenditure more carefully due to lack of coverage –resulting in either group inflating or
underestimating expenditure. However, the proportion of insured and uninsured women who
reported breakdowns of expenditure, reflective of detailed recall, was similar.
Lastly, if VimoSEWA-insured women indeed utilised (and did not report) reimbursement, but still
reported similar expenditure, it is possible that insured women were provided more expensive
treatment or charged more for similar treatment, because a portion would be covered by VimoSEWA.
Suggestive of moral hazard, providers or women may have undertaken more tests, for example, which
may explain why insured women also incurred higher expenditure in government and trust facilities
than uninsured women. In this scenario, VimoSEWA may in effect increase risk of catastrophic medical
158
expenditure. Similar findings emerged in an evaluation of China’s national health insurance program, in
which covered members were found to be more likely to incur higher expenditure on health care costs
[253]. Investigation of the actual costs incurred and the role VimoSEWA in either increasing or reducing
medical expenditure is required, which would entail review of medical records at empanelled facilities to
capture both the total cost and amount covered by reimbursement.
This expenditure data, similar to reports of hospitalisation and morbidity, was self-reported and subject
to recall errors, some possible examples of which are discussed above. Breakdowns of expenditure,
available for slightly more than one-half of cases, may not reflect population patterns due to systematic
differences between those who recalled expenditure and those who did not. Mean reported
expenditure for women who could not provide a breakdown was over 15 percent higher, suggesting
either recall errors or different characteristics/treatment-seeking behaviour of women who reported
detailed expenditure. Further, the recall period may have affected the accuracy of reported
expenditure. As hospitalisation was recalled over a six month period, the length of time elapsed since
an event may have limited accuracy, as compared to a shorter recall period. A shorter recall period,
however, would have elicited a lower number of reported hospitalisation episodes. Moreover, if the
respondent was not directly involved in payment procedures–as may be the case with women if they do
not manage family finances–the reliability of reported expenditure data may vary according to dynamics
in the household.
The survey could have been improved through more detailed documentation of overall cost incurred,
types of reimbursement sought and why and how payment was financed, notwithstanding concerns
regarding length of the survey instrument. As discussed in the previous chapter, this analysis would
have been strengthened by systematic cross-verification of use of insurance and amount covered by
VimoSEWA with the claims database. A manual search on the 18 women who reported reimbursement
only matched in nine cases to names of claimants recorded in the VimoSEWA claims database. The
reason for hospitalisation matched in all nine cases.
Overall, patterns of out-of-pocket expenditure in the population suggested that costs incurred by
women for hospitalisation for fever, diarrhoea and hysterectomy were considerable, even in the public
sector. Accordingly, an intervention aimed at reducing the incidence of hospitalisation for these

159
conditions could have also impacted on financial security. The following chapter explores
hysterectomy, the most expensive, as well as most common, cause of hospitalisation for women in the
study population.
160
Chapter VIII. In-depth examination of hysterectomy
This chapter presents two papers that are intended to be submitted for publication. The first paper
presents the findings of an in-depth qualitative study of hysterectomy, followed by a mixed methods
analysis of the incidence and determinants of hysterectomy in the second paper. Tables and figures are
numbered in the same sequence as the thesis.
161
RESEARCH PAPER COVER SHEET
PLEASE NOTE THAT A COVER SHEET MUST BE COMPLETED FOR EACH RESEARCH PAPER
INCLUDED IN A THESIS.
SECTION A – Student Details
Student Sapna Desai
Principal Supervisor Simon Cousens
Thesis Title
Community health worker-led education to change women’s treatment-seeking behaviour: A
cluster randomised trial and qualitative investigation in Gujarat, India
If the Research Paper has previously been published please complete Section B, if not please move
to Section C
SECTION B – Paper already published
Where was the work published?
When was the work published?
If the work was published prior to registration for your research degree, give a brief rationale for its
inclusion
Have you retained the copyright for the work?*
Was the work subject to academic peer review?
SECTION C – Prepared for publication, but not yet published
Where is the work intended to be published? Social Science and Medicine
Please list the paper’s authors in the intended authorship order: Sapna Desai
Stage of publication Not yet submitted
162
Student Signature: Date: 6.2.2015
Supervisor Signature: Date: 6.2.2015
163
I. Qualitative study of hysterectomy
Pragmatic Prevention, Permanent Solution: Women’s Experiences with Hysterectomy in Rural India
Introduction
Hysterectomy, the removal of the uterus, has recently emerged at the centre of health policy debates in
India. In 2013 the Supreme Court, responding to a public interest litigation, ordered three States to
respond to allegations of hysterectomy being performed in unethical circumstances in Bihar, Rajasthan
and Chhattisgarh [254]. The litigation cited a lack of medical indications for hysterectomy, poor quality
of care and no alternative treatment options presented to low-income, rural women. Many media
reports have suggested that unnecessary hysterectomy amongst young women is on the rise, as a result
of profit-motivated practices by private hospitals [116, 117, 255]. In most reports, women are
characterised as passive victims of profit-seeking medical practitioners: headlines read “Forced
hysterectomies, unscrupulous doctors” and “The Indian women pushed into hysterectomies” [118, 256].
Accordingly, hysterectomy has become a powerful tool to critique both privatisation and publicly-
funded health insurance [257, 258].
In 2012 I began exploring hysterectomy in rural Gujarat as a case study of how the medical
establishment interfered unnecessarily with women’s bodies. An epidemiological survey in the area had
estimated low population prevalence – 7 to 9 percent amongst women age 15 and older – but
supported suspicion of unindicated procedures: the majority of cases were conducted in the private
sector, at a relatively young mean age of 37[122]. Yet one-third of women reported utilising public
hospitals, casting doubt on provider profit as the sole motivation. Further, local community health
workers identified biological and social drivers of the procedure, such as agricultural labour resulting in
uterine prolapse, an increase in gynaecological ailments and women’s demand due to menstrual taboos.
Women expressed considerable difficulties due to gynaecological morbidity, particularly excessive
bleeding for which treatment was not available. Most critically, women’s own treatment-seeking
narratives reflected complex negotiations between bodily suffering, socioeconomic structures and the
“micro-physics” [198] of power around them – rather than that of women as submitting to unilateral
164
medical authority. Accordingly, my approach broadened beyond theories of medicalisation, to examine
hysterectomy within the competing concerns and contestations that shape women’s lives[37].
This paper explores the individual, household, socio-economic and health system factors that influence
women’s decisions to undergo hysterectomy, from the accounts of low-income, rural women workers in
the Indian state of Gujarat. I present findings from in-depth qualitative research on the processes
through which women underwent hysterectomies, within the context of their daily lives and broader
environments. I argue that, given the structural and systemic constraints in this setting, women
exhibited “pragmatic agency” in the decision to remove the uterus as treatment for gynaecological
ailments[198]. Positioned within power structures related to labour and work security, gender roles and
a maternal-centric health system, hysterectomy represented a means of freedom from bodily suffering
and future risk – and illustrated how women negotiate medical treatment in spheres beyond the clinical
encounter.
Methodological and analytical approach
Theoretical framework
Medicalisation, the extension of medical power and interference into everyday life[259], has been
contested and expanded through empirical study of its influence on women’s lives. Ethnographies of
women’s health, for example, have explored how cultural, social and political processes shape medical
practice and decision-making [260]. Using Michel Foucault’s distinction of dispersed ‘bio-power’ that
infiltrates daily life, as opposed to power expressed as authoritative control, analyses have positioned
women’s medical experiences beyond that of the physician-patient relationship[261]. This lens draws
attention to, for example, gender dynamics and historical biases that shape medical actions. Towghi’s
exploration of the normalisation of hysterectomy in rural Pakistan is one illustration, in which embedded
gender biases, rather than biological need, influenced practitioners to devise permanent solutions for
the uterus and its ailments[262]. Further, rather than assume women are subjective recipients of
providers’ authority, bio-medical treatment has been conceptualised as defence against other forms of
power[198]. For example, sterilisation in India has been interpreted as a marker of a woman’s transition
to an older generation, thereby allowing a younger woman to establish her position vis-à-vis her mother
in law in a joint family setting [263]. In Brazil, seemingly high rates of caesarean sections reflected low-
165
income women’s assertions of resources in the face of socio-economic and political inequalities, a
narrative which nuances one-way medicalisation of childbirth by providers [199]. Research that has
examined women’s experiences with hysterectomy in high-income countries has similarly identified the
complexity of decision-making processes, as well as the expected variation in influences across settings
and populations [264] [113, 265].
Women’s interactions with medical authority and technology have also been characterised as fluid,
interactive engagements not amenable to dualistic categories such as passive or active bodies, or risk-
benefit calculations [266]. As proposed by de Bessa, drawing on theories of decision-making to
contextualise Brazilian women’s actions to undergo sterilisation, women engage in ongoing “monitoring
and rationalization of options and actions as they emerge in a particular setting” rather than narrow,
one-time treatment decisions [267, 268]. Accordingly, individual perception of bodily risk, not
necessarily based on scientific evidence alone, is a nuanced calculation defined by “cultural beliefs,
moral values, feelings and life circumstances” [203]. This investigation of hysterectomy in rural Gujarat
situates women in their specific cultural, social and political context, wherein they emerge as pragmatic
actors engaged in multi-layered negotiations and decision-making processes [198, 203].
Setting
The study was conducted in a rural district of Gujarat, while I was based at the Self-Employed Women’s
Association (SEWA), a trade union of over 1.7 million women that has been active for over forty years.
SEWA’s members are women workers in India’s vast informal economy: they do not have formal
employer-employee relationships and by default, survive on precarious livelihoods without basic social
protection. As members of SEWA, they access microfinance, health services delivered by local women,
literacy programs and engage in collective bargaining for fair wages and rights to services. A
community-based survey conducted in 2010 with SEWA found that hysterectomy was the leading
reason for hospital admission amongst women in Ahmedabad city and district, both for women insured
by SEWA’s health insurance scheme and for women without insurance, at an average age of 36 [145].
Comprehensive reproductive and sexual health services are limited in Gujarat. Fifty-five percent of
births in Gujarat occur in a health facility, with institutional birth more common amongst women who
are in the highest wealth quintile, have at least ten years’ education, attend antenatal care visits, and
166
live in urban areas [4]. Choice in family planning services is narrow: forty-three percent of currently
married women are sterilised, accounting for 64 percent of all contraceptive use. According to the
National Family Health Survey, lower-income women utilise sterilisation as the primary form of
contraception, while better educated and wealthier women are more likely to utilise temporary
methods. Eighty-two percent of sterilised women utilised a government facility for the procedure, which
includes a financial incentive[4]. The state employs six gynaecologists, with 267 unfilled posts at the
time of this study [172]. In 2009, Gujarat initiated roll-out of the Rashtriya Swasthya Bima Yojana
(RSBY), a national health insurance scheme that provides hospitalisation coverage up to Rs.30,000 in
public and private hospitals for households designated below the poverty line.
Research on the sociocultural determinants of gynaecological morbidity has suggested that Indian
women live in a ‘culture of silence[147]’ – fuelled by gender inequality and social norms – that
proscribes women from using household resources for treatment related to reproductive and sexual
health[148-152]. For example, less than half of women studied in rural Rajasthan, Maharashtra and
Tamil Nadu as well as in urban Mumbai reported seeking treatment for vaginal discharge, menstrual
disorders or abdominal pain[149, 153-156]. However, these findings vary by setting: two studies
amongst low-income women in rural Gujarat and rural Karnataka reported that the majority of women
sought multiple sources of treatment for gynaecological ailments [157, 158]. An ethnography of women
in rural Gujarat attributed reproductive ailments to excessive garmi – heat in the body[158]. Garmi was
linked to ingestion of hot food, allopathic medicines, alcohol consumption and sexual intercourse, as
well as to sterilisation. Women reported avoiding treatment that involved allopathic oral medicines,
due to fear of excessive heat production.
Field approach
The fieldwork employed an ethnographic approach to qualitative data collection, drawing on ten years’
previous experience working as a health program director and researcher with SEWA in the study areas,
and six months of fieldwork focussed on investigating hysterectomy. I was already familiar with modes
of daily living, village dynamics, health services and local terminology in the study setting. Longstanding
familiarity allowed me to interact informally with women: I observed them and their families in daily life,
particularly health-related activities. I accompanied community health workers on home visits, health
care referrals and to group meetings. I also reviewed quantitative data from a household survey and
discussed findings with women and their families, grassroots SEWA health and health insurance workers
167
and government heath staff. Through this process, I identified seven provisional themes to explore in-
depth: women’s experiences with gynaecological morbidity; drivers of women’s demand;
socioeconomic/occupation-related determinants; family/household and intergenerational dynamics;
health insurance status; health provider practices; and physical, emotional and economic consequences
of hysterectomy. Interview guides were utilised to cover a priori themes, but were modified to explore
new themes as they emerged, such as fear of cancer or experience with menstrual difficulties.
Women who had undergone hysterectomy were identified through SEWA’s local community health
workers and referrals from interviews and key informants. I conducted interviews with women who
had hysterectomies until (i) the group represented variation in length of time since the procedure and
insurance status and (ii) no new analytical themes emerged. Thirty-five women were interviewed,
eleven of whom were insured by SEWA and/or the government. Nineteen women had the procedure in
the past five years (seven in the past year) and could provide specific details of the treatment-seeking
process. The remainder offered perspective on longer term effects of hysterectomy. I interviewed five
local gynaecologists, who accounted for 20 of the 35 hysterectomy cases conducted in the area. It was
not logistically feasible to link a specific woman’s case history with her provider to develop case studies,
although I was able to conduct analysis linking women’s cases with the viewpoints of the identified
provider. Where possible, I also read women’s medical case histories and test results if they agreed.
Interviews were conducted individually with 13 key informants and three women with gynaecological
ailments who did not proceed with the operation, as well as in groups with three sets of younger
women who have not had a hysterectomy.
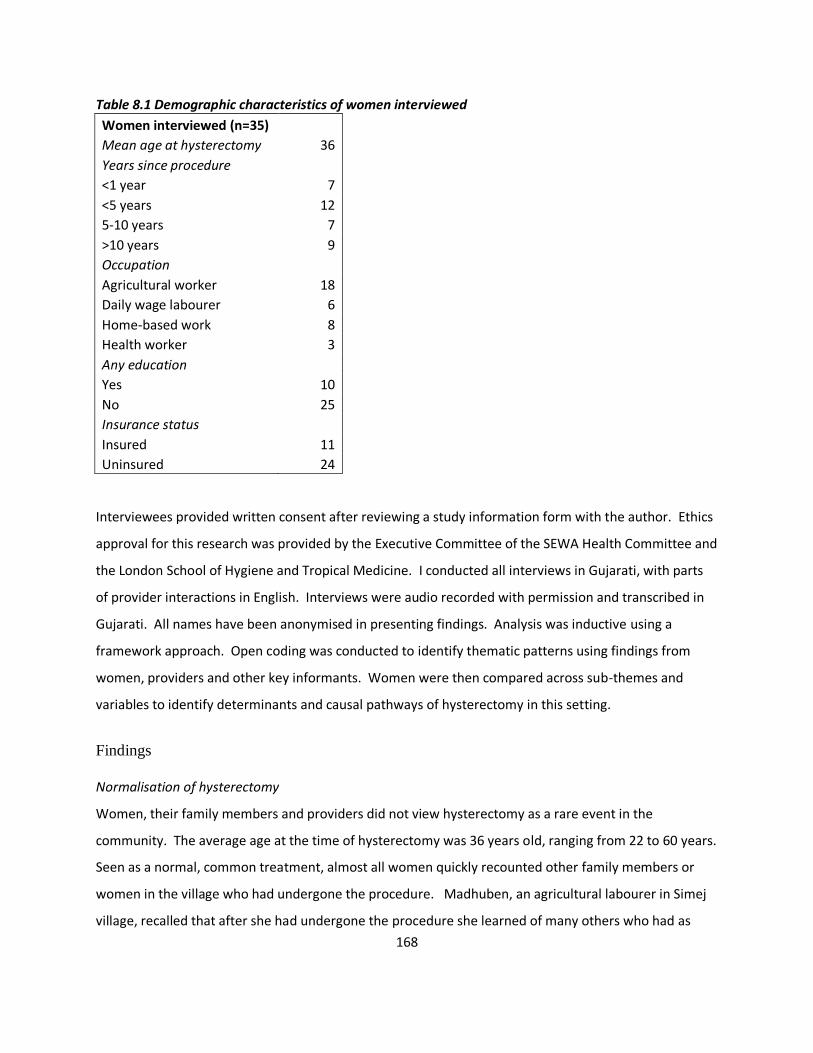
168
Table 8.1 Demographic characteristics of women interviewed
Women interviewed (n=35)
Mean age at hysterectomy 36
Years since procedure
<1 year 7
<5 years 12
5-10 years 7
>10 years 9
Occupation
Agricultural worker 18
Daily wage labourer 6
Home-based work 8
Health worker 3
Any education
Yes 10
No 25
Insurance status
Insured 11
Uninsured 24
Interviewees provided written consent after reviewing a study information form with the author. Ethics
approval for this research was provided by the Executive Committee of the SEWA Health Committee and
the London School of Hygiene and Tropical Medicine. I conducted all interviews in Gujarati, with parts
of provider interactions in English. Interviews were audio recorded with permission and transcribed in
Gujarati. All names have been anonymised in presenting findings. Analysis was inductive using a
framework approach. Open coding was conducted to identify thematic patterns using findings from
women, providers and other key informants. Women were then compared across sub-themes and
variables to identify determinants and causal pathways of hysterectomy in this setting.
Findings
Normalisation of hysterectomy
Women, their family members and providers did not view hysterectomy as a rare event in the
community. The average age at the time of hysterectomy was 36 years old, ranging from 22 to 60 years.
Seen as a normal, common treatment, almost all women quickly recounted other family members or
women in the village who had undergone the procedure. Madhuben, an agricultural labourer in Simej
village, recalled that after she had undergone the procedure she learned of many others who had as
169
well: “Many people have had the operation here. Just recently, Anita in our village, a friend in the next
village, and many more I know have had it.”
Each of five gynaecologists interviewed defined hysterectomy as a common intervention for
dysfunctional uterine bleeding, cysts and fibroids in women 40 years or older after hormonal
management was tried. When asked about younger women, providers stated that they typically tried
hormonal treatment first and only advised hysterectomy after women had completed childbearing.
Hysterectomy was, according to providers, most commonly used amongst rural, low-income women
because it was simultaneously curative and prophylactic, as well as a one-time expenditure. Dr. Patel,
private hospital: “Generally it is better to do hysterectomy [than other procedures] because the [rural]
patient is not going to take continuous treatment and medical management gets costly…and we can’t
say how much that will help anyhow. So it’s better that they have a hysterectomy. And ultimately the
problem gets solved.” In contrast, urban women, as well as wealthier rural women, were seen to
undergo the procedure at lower rates: According to a government doctor, “In the government city
hospitals, a patient has to get many tests. Blood, sonography, medical fitness, etc, and then gets a date
for the surgery. It takes so long, and she gets tired of it. There is a much heavier case load in the city.
Here [in rural practice], I can do a hysterectomy the next day.”
Treatment negotiations
Treatment-seeking patterns were neither linear nor uniform, consistent “behaviour” for an individual
woman. The path to hysterectomy typically started, stopped and wavered over a period of time and
across medical opinions. Although there was variation in the onset, type and severity of symptoms, all
women related the experience of gynaecological morbidity as the initial catalyst for seeing a doctor and
eventually undergoing hysterectomy. Excessive or prolonged bleeding and pain were the most common
complaints, followed by excessive white discharge.
Women’s representations of their thought processes and rationale for hysterectomy varied across a
spectrum. For some, hysterectomy was a last resort, utilised only because other treatment options had
failed. For most women, hysterectomy was seen as a pragmatic means of treating gynaecological
ailments and concurrent prophylaxis to prevent future suffering, while a smaller group viewed it as a
permanent method to attain bodily freedom from menstruation. Menstrual regulations, particularly for
170
but not necessarily limited to Hindu women, included not being able to cook, pray or enter a temple. In
some families, women were also forbidden from touching anyone else or sleeping in their own bed.
Diversity in women’s decision-making processes was not clearly associated with socioeconomic,
educational or health status. Further, how and where women treated gynaecological ailments typically
departed from previous history of seeking health services, including for childbirth. There was little
indication that women who underwent the procedure had a predilection towards medical intervention.
For example, Manjuben avoided medicine and doctors for most ailments, and had delivered both of her
children at home. Outside of sterilisation in a government health centre, she had never undergone a
surgical intervention. When I first met her, she had just recovered from severe back pain for which she
had sought herbal treatment for two months. She typically did not seek allopathic treatment from
hospitals or private providers, primarily because it was too expensive. She had a hysterectomy at age 35
in a non-profit trust hospital for severe abdominal pain, a complaint for which she neither sought
traditional medicine nor was offered less invasive procedures.
Renukaben, a SEWA health worker for eight years, was previously an agricultural labourer in her home
village of Rithila. As a SEWA health worker, she promotes preventive health practices in her village and
provides doorstep primary care services, to help women avoid unnecessary hospitalisation. Her first
two children were delivered at home by a midwife. Her third child was delivered at a local charity
hospital, two weeks after which she was sterilised in a government hospital. After battling severe
menstrual pain and bleeding for several years, she underwent a hysterectomy when she was 30 years
old, in a private hospital.
Few women settled upon the first provider who suggested hysterectomy; they sought two to three
opinions, determining the best situation for their personal health, financial security and familial
convenience. Manjuben, for example, chose the provider whom her in-laws trusted and helped her
choose. She had seen two providers, one close to her village and one in the city, and considered her
choices over the course of several months. Similarly, Renukaben spent over six months seeking
opinions: “After my diagnosis from the SEWA doctor, I went to the government health centre, where they
confirmed I had a cyst. Then I went to a private trust and one more private hospital. All four providers
said I had a big cyst, and that I needed a hysterectomy.”
171
Hysterectomy as counter to medicine
Hysterectomy was articulated as a one-stop intervention which enabled women to lead an otherwise
un-medicalised, healthy life. According to Manjuben, “I thought that I’ll have problems again with my
body, [if I don’t take it out]….after the operation, I am completely fine. After the operation, I knew I will
have my body back. I knew that my health would not suffer anymore. I would have no more worries.”
Nakviben, an agricultural labourer was 22 when she had a hysterectomy, when eldest of her three
children was four years old:
“I had heavy bleeding and a lot of pain. Working was a problem, so I thought to remove it. I
went to a doctor, who said even if you don’t remove it now, after two years you will have to. I
went to three hospitals, who said it was not an emergency but I should remove it later. I tried
the medicine but started vomiting. I hate medicines; even if I have a fever, I don’t take any [oral]
medicine… You see, I had a problem and I didn’t want medicine. So at last, out of frustration, I
removed it. I needed it [the operation] to be healthy.”
Bakuben, an agricultural labourer whose cyst was confirmed by four doctors, believed that that “my
problem will be solved entirely with a hysterectomy. I thought no matter what, I have small children and
I need to do this operation. I need my health to be strong for them.”
The fear of developing cancer in the future was a common reason to undergo hysterectomy as
prophylaxis. Savitriben, a local government child care worker explained that most women were more
scared of cancer, and it was a common topic of conversation in the area. Gajaraben, age 36 at her
hysterectomy four years ago, explained: “I had my periods for 15 days at a time, for 4 months. I went to
two doctors...They said to do the test (sonography) and then said that if I don’t remove it I will definitely
have cancer. You will have problems in the future, whether you take medicines or not….I did not want
cancer in the future. Now I am okay again.
Ishaben, an agricultural labourer had a similar experience after seeing a doctor for excessive white
discharge: “I went to the doctor who explained that I have an infection in my uterus. If the infection
spread, it might have resulted in cancer. So I thought….In the future, cancer will surely come. I had a
172
problem in the present, and I needed to find an immediate and permanent solution. No matter where I
had to find the money from; I had to remove the uterus immediately.”
History of surgical sterilisation was common, however, and appeared to be a normalised exception in
the narrative of an otherwise unmedicalised life. The large majority had undergone tubal ligation in
their mid-twenties – about ten years before undergoing hysterectomy. Like Manjuben and Renukaben,
most women related sterilisation as the normal course of events after childbirth. Women who had
delivered at home later visited a government health centre to undergo sterilisation, for which both
women and health workers received a financial incentive. Family planning options were extremely
limited in government health centres: sterilisation was the primary (and only) family planning method
available. Dr. Meena, an experienced gynaecologist with a history of working with community
organisations reflected on government policy: “Sterilisation is the only way. These people do not
understand family planning or how to plan. This is the answer to the population problem.”
Freedom to work
Women’s identities as workers and caregivers dominated their descriptions of decision-making
regarding hysterectomy. All women were low-income workers, engaged in agriculture, daily wage
labour, home-based work or health/child care work with the government or SEWA. They depended on
their physical strength to earn daily wages and to care for their families. They typically worked long
days, beginning before sunrise to attend to animal husbandry or agricultural duties, before setting out
to labour in other fields, construction sites, or to work at home. After taking a break at midday to
prepare meals, women returned to income-earning activities or turned to household duties till the night.
Most lived in joint families and managed housework – cooking, cleaning, care for children and the
elderly – for at least five to six other family members. Gynaecological ailments were marked by heavy
bleeding, severe pain and weakness. When faced with conditions that caused considerable suffering and
disturbed daily life, women acted to preserve their productivity.
Renukaben had a history of severe menstrual pain, for which she used to take home-based remedies
such as garlic-based mixtures and heat applications. She once collapsed from pain while working in the
fields, and a farmer had to bring her home on his bicycle. After one month of continuous menstrual
bleeding – fifteen years after her symptoms began –she felt she could no longer afford to miss more
173
work or not contribute at home. She went to a SEWA-affiliated doctor and was diagnosed with an
ovarian cyst.
Without any social protection or paid sick leave, women articulated the loss of physical productivity as a
greater risk than the side effects of a surgical procedure. Manjuben was a widow who lived alone; her
two grown sons lived in the city. She depended on her own income from agricultural labour to survive.
When she experienced severe abdominal pain, diagnosed as a symptom of an ovarian cyst, she weighed
her options: “The doctor said the cyst has to be removed. But he said it can return in twelve months,
after which you will have the same problems again. You can try medicines for 4-5 months first to see if
that takes care of it. I thought, instead of having a problem again in six to twelve months, if I just
remove it I can go back to work and earn money. At the age of 35, I do not want to risk the pain
returning, as I have to work for many more years. So I removed it.”
Fear of not undergoing hysterectomy was also rooted in the loss of earning capacity. Women
consistently framed the consequences of failing seriously ill or dying prematurely, either from eventual
cancer or untreated gynaecological morbidity, in terms of loss of productivity. Gajaraben, who labours
in a brick kiln summarised: “You can have a fever, cold, cough or weakness and go to work. But with
these [gynaecological] problems, you can’t work unless you take care of it.” Removal of the uterus,
therefore, represented preservation of a woman worker’s chief resource – her body.
Further, women’s decisions were related to their children’s well-being. Particularly for women in their
mid-thirties who had long-standing ailments, the fear of premature death due to cancer and leaving
their children to fend for themselves was motivation enough to remove their uterus as prophylaxis. The
development from morbidity into cancer was perceived to be inevitable by almost all women.
Bakuben, an agricultural worker who had a hysterectomy at age 32, experienced both pain and
excessive bleeding that sent her to a doctor. She had two children, and had previously worked part-time
as a village midwife. A strong, tall woman, she chopped her crops with a heavy sickle, often one-handed.
“I removed it [my uterus] due to fear of cancer. We have farm work – but when the pain increased I
couldn’t go to the land. I had small kids at home. If I died from cancer, who would take care of them,
feed them?”
174
Informed risk
Women recounted financial difficulties as a result of having the surgery, but in most cases, felt the
benefits–health and work security–outweighed the financial and physical costs. Bakuben, amongst the
poorest of the women I interviewed, took a bond from a money-lender against her land. “My children
are more important than the risk [of mortgaging our possessions and land].” Amongst women with
health insurance, hysterectomies were evenly spread between private, government and trust hospitals.
Three insured women chose not to use their existing insurance coverage because they preferred
hospitals outside of the preferred network. Further, the financial protection offered by SEWA was
minimal, as Champaben explained: “I only got Rs. 2000 from SEWA insurance. That doesn’t even cover
the medicines.” Kariben, insured by SEWA and the government: “After 3 reports, I decided to get the
surgery. I had the Rs. 30 card too [RSBY government insurance], but did not use it because I wanted the
operation only in Teen Murti” [a non-profit charity hospital that was not yet enrolled in the RSBY].
In addition to debt, hysterectomy entailed considerable physical risk before, during and after surgery,
such as blood transfusions, weakness or signs of menopause. Women related little regret, however, as
the initial morbidity was cured. Manjuben, after deciding to have a hysterectomy, was told that she
was too anaemic to undergo surgery.
“Actually I had to stay in the hospital for 1 month. Because I had less blood in my body I had to
wait. The doctor also gave me milk powder for 1 month to drink so that I could gain some
energy. After one month, I still had no blood in the body. I ended up having to take blood.”
After the surgery, she reported having “no tension” now that the pain was gone. Renukaben, who
suffered side effects such as loss of sexual drive and intermittent pain after a hysterectomy,
nevertheless maintained that her health as a whole improved, as the bleeding and severe pain stopped.
Recovery periods were organised well in advance to arrange child care, help with household chores and
if possible, support in income-earning activities. Providers were typically chosen based on convenience
of the designated helper, resulting in some women having surgery near their maternal home if
necessary. Renukaben returned to work at SEWA in one month, while Bakuben and Manjuben waited
two to three months to return to agricultural duties. They relied on family within the household or
female relatives who would visit to help with daily chores in the initial weeks post-surgery.
175
The permanent –and only—solution
Women acted in response to the burden of untreated morbidity and within the confines of limited
health care options. Suffering due to fibroids, cysts and menstrual disorders and the fear of cancer
propelled the belief amongst women that the uterus is a site of risk; hysterectomy became both
treatment and prophylaxis. For providers, the perceived unlikelihood of rural, low-income women to
travel for follow-up visits resulted in the promotion of hysterectomy as a convenient, one-time cure for
menstrual problems, cysts, fibroids and other gynaecological ailments. Willingness to undergo surgery
serves as testament not just to the severity of morbidity in women’s lives, but also to a lack of treatment
options.
When gynaecological morbidity emerged, many women waited to seek treatment. Upon seeing doctors
– typically more than one – some tried medicines for long periods of time, and in one case, a less
invasive procedure to remove cysts. For those with the financial resources or inclination, medical
alternatives to surgery were tried first. Women who had waited to seek treatment primarily had home
births and about half were sterilised. Not being sterilised either reflected an aversion to interventions
or socioeconomic status that nullified the financial incentives of sterilisation. They eventually chose to
have hysterectomies when their symptoms did not improve through hormonal treatment and providers
presented no other option. For many women, medicines were not an option because they were
considered “heat-producing” – seen as an unnatural intervention that could cause imbalance in the
body’s natural functioning, commonly in the form of acidity or stomach problems– as well as
prohibitively expensive (approximately Rs. 700/month) over a longer duration.
Providers, with almost no infrastructure or preparedness to provide gynaecological care outside of
hormonal treatment – which most women could not afford –by default offered hysterectomy as a
‘permanent solution.’ The profit motivation for providers was also seen as an incentive. According to
Manjuben: “We go to doctors with our symptoms. What will they say, except that they will remove the
uterus and cure it? And they make money this way….otherwise how will the doctors eat? They will
never tell you the whole story, because they know you will have a hysterectomy anyway. So they tell you
there is no option…you have to do it.”
176
Some women also expressed demand for the operation as a permanent method to stop menstruation,
particularly due to rules related to menstruating women. When Renukaben got married: “My mother-
in-law bought a separate bed for me to sleep on during menstruation. Up until my father-in-law was
alive, I had to follow certain rules; I couldn’t go to the kitchen or to pray. That’s all over now, and
anyway I don’t have my period anymore.” In Manjuben’s case, freedom from menstruation was a
welcome side effect of a hysterectomy, particularly from rules prohibiting menstruating women from
entering the kitchen or providing religious offerings: “Before the operation, I couldn’t touch anything for
five days….but now, I can prepare food anytime, khichdi-roti, and offer it to God….now some people even
remove it due to frustrations with menstruation.”
Women who explicitly cited menstrual rules as a motivation for hysterectomy were less likely to seek
second opinions or use hormonal treatment. Culturally, menstruating women are considered
‘polluting’: particularly in rural India, they cannot enter the kitchen, temples or sacred places, with more
stringent rules in some communities[14, 158, 159]. Champaben, a manual labourer aged 40 when she
underwent hysterectomy: “I used to have to follow all the [menstrual] rules and became totally
frustrated with the limitations…I did the operation for peace.” Renukaben’s experience as a health
worker reflected this view: “Out of frustration of cleaning everything related to menstruation [cotton
cloths and towels used], some women just get the operation. Where they may not have years ago,
today they have an easy option to stop periods.”
Productive only when reproductive
A cultural emphasis on women’s role as mothers has translated into a conviction – amongst both
women and providers – that the uterus is productive only when reproductive. With the exception of
young women who had not undergone hysterectomy, almost no women, including key informants,
believed the uterus performed essential body functions after childbearing was complete. Manjuben:
“Since we’ve already had our children, our work is done. So we can remove the uterus.”
Provider practices and health system priorities reflected both gender and class biases that render
women to be reproductive agents, devoid of value outside of their role as mothers. According to
Gauriben, a woman who had no children and went to the doctor with severe menstrual pain:
177
“We didn’t know what the reason was for my problem, and the doctor said the uterus will have
to be removed eventually. We also told her that we don’t have any kids. She said that, since you
don’t have the capacity [to have children] there is no point in keeping the kothri [uterus].”
Dr. Samir, a private doctor, stated of low-income rural women: “They start bleeding a lot and don’t take
the proper [hormonal] treatment course. And they are already sterilised. So somehow, the uterus is
neglected or not needed. Ultimately they convert into hysterectomy cases.” Not only did providers
suggest that hysterectomy was appropriate treatment for low-income women because they ‘don’t need
the uterus’ once childbearing was complete, ovaries were also routinely removed to prevent future
cysts. When questioned regarding side effects, while they were aware of effects of premature
menopause on bone density and mental health, most also believed that both the uterus and ovaries
were of limited value by age 40. These organs, like an appendix, were instrumental to a point. Dr.
Gaurang, government doctor: “Basically, if a woman is above 35-36 years, with her kids done, I do a full
hysterectomy with oophorectomy. I do this to be safe, otherwise if they get a cyst they come back and
say what kind of operation was that? So to be safe, I remove everything. […regarding side effects]
Premature ovarian failure anyway happens by 37, 38 years. It’s genetically determined.”
The post-reproductive uterus quite literally served as an instrument, a site of practice, for some
providers. All providers related the popularity of hysterectomy as a method for young, particularly rural,
government doctors to gain surgical skills. Two providers admitted to conducting many hysterectomies
during early career rural postings, acquiring experience which helped perfect their ‘hand’. As a result,
one doctor boasted of being able to conduct eight hysterectomies in one day.
Dr. Samir, a private doctor who previously worked in the government:
“Rural doctors – yes, young doctors should go to rural areas, haath saaf karva mate [to perfect
their ‘hand’]. Why else would they stay there? Job satisfaction comes from doing operations and
learning independently. Earlier they would have only assisted a surgery. I also did a lot more
hysterectomies earlier in my career.”
Another, Dr. Jitin, chose to spend more time in lower-paid rural hospitals because he ‘enjoyed’
conducting hysterectomies, a surgical satisfaction he could not find in his urban practice with lower case
178
loads and more options available. The objectification and dispensability of the uterus was peculiarly
literal in one case: a government provider had covered his office walls with photographs of removed
cysts, fibroids and other relics of uterine surgery. “Hysterectomy karvarnee majaa aavee - I was really
enjoying doing so many hysterectomies here. Nothing compares to the case load here in government.
[While showing me photographs on walls]: I’ve done all of this, all of these cases. [He points to an
ovarian cyst, 8 cms large and a massive cervical growth – five times bigger than the uterus, in photos on
the wall. “Was it cancer?” I ask] No one does pathology here.”
Skewed health system
Interviewed providers reported that between five to fifteen percent of their patients came to their
clinics for gynaecological ailments, while the remainder were obstetric cases. Three of the providers,
two in the private sector and one in government, conducted approximately 15-20 hysterectomies per
month. Two doctors in non-profit charity hospitals conducted one to five hysterectomies per month,
both because they did not feel equipped to operate and because their busy obstetric practices did not
allow time for gynaecological care. None of the clinics was equipped for gynaecological exams. Pap
tests were not available and, at best, women were referred to government-sponsored camps held twice
a month. Trans-vaginal ultrasounds which could detect cysts were not available, nor were basic
ultrasound machines. For example, Renukaben’s cyst was diagnosed through abdominal ultrasound
conducted in an external laboratory.
Locally available public health programs included village health workers delivering iron supplementation
and doorstep antenatal care, along with financial incentives for institutional delivery in both public and
private hospitals. Yet if a woman had non-maternal health concerns, reproductive and sexual health
services were neither locally available nor easily accessible in both public and private facilities. In the
local primary health centre, I observed that pregnant women were weighed, vaccinated and counselled
on specific days, while gynaecological exams were not available as a regular service. Some local
HIV/AIDS centres provided exams and tests to detect sexually transmitted infections.
Women’s fear of cancer reflected further weakness in the health system. Many referred to someone in
their family or village who had died of cancer, presumably due to causes related to the cervix or uterus.
Twelve percent of deaths amongst rural women aged 30-69 years old are attributed to cancer, the
179
leading cause of which is cervical cancer[269]. Yet observation indicated that virtually no cervical cancer
screening programs operated in the area, and health messaging in villages – on health centres,
billboards and on television – primarily focused on maternal and child health, with some space
dedicated to HIV/AIDS and female infanticide. Providers, when questioned if women’s common fear of
cancer was proportionate to local prevalence, felt that poor women were in fact more vulnerable to
cervical cancer due to poor hygiene. None, when specifically asked, cited the human papilloma virus as
connected to cervical cancer. Given the lack of diagnostic equipment in clinics, they could not provide
specific figures on cancer cases detected.
The clinics and hospitals offered few preventive services or minimally invasive procedures for
gynaecological ailments. Private practitioners cited the introduction of a consumer protection act as
motivation for hysterectomy rather than removal of cysts and fibroids which would return, as women
could complain of inadequate treatment when symptoms returned. Another, however, felt that medical
management must be tried first to protect doctors from consumer complaints of unnecessary
hysterectomy. None of the practitioners felt technically equipped to conduct a laparoscopic procedure
such as cystectomy. Updated technical knowledge of non-obstetric care also seemed limited, echoing
earlier findings in India and other developing country settings where doctors reported difficulties
accessing scientific articles and knowledge through the internet and otherwise[270]. Further, none of
the five doctors were aware of the research being conducted globally on the long term effects of
hysterectomy, including the widely researched associations with cardiovascular disease. According to
Renukaben: “Of course doctors have a role in all of this. If they give you proper guidance and give you
medicine, you don’t always have to remove your kothri [uterus]. For example, if you are having
menstruation for a month and no other problem, the doctor should explain all the reasons that this could
happen. Instead he will tell you to remove kothri. He gets the money, but doesn’t give us proper
information.”
Discussion
The striking normalisation of hysterectomy of women in their mid-thirties reflects women’s life
circumstances and the various power relationships they negotiate. Women emerged as pragmatic
actors who negotiate their choices, however constrained or narrow the circumstances [198]. Their
identity as caretakers, workers and producers drove many to seek hysterectomy as freedom from risk,
180
illness or menstruation, with the understanding that the benefits outweighed both present and future
costs [198]. The equating of women’s lives and bodies with motherhood provided an enabling, if not
instrumental, social and health system environment to remove the uterus as routine treatment for
gynaecological ailments. Personal motivations of providers, whether for skill-building or financial profit,
emerged as further evidence of the biases that normalised hysterectomy amongst women in their mid-
thirties. Further, women’s low socioeconomic status appeared to preclude doctors from offering them
other treatment options.
A range of accounts of women’s actions to undergo invasive or potentially unnecessary technological
interventions have cited a myriad of social, cultural and political influences, such as social acceptance,
assertion of the right to quality health care, or to preserve their capacity to labour or manage their
family that drove women’s decisions [199, 263, 271, 272]. As Lock and Kaufert summarise:
“At the site of the individual body, therefore, biopower may be experienced as enabling, or as
providing a resource which can be used as a defense against other forms of power. At the
centre….stands a pragmatic woman willing to use whatever biomedicine can provide in pursuit
of her own goals or the protection of her own independence” [198].
Women’s treatment-seeking paths were rarely a one-stop, or one-way, journey: they assessed options
and considered financial, personal and familial implications over time. Women workers in the informal
economy do not work for extra income for the household; their earnings are typically critical to survival.
Thus gynaecological morbidity not only represented the loss of income, but also the loss of identity as a
productive family member. In this way, bio-medicine and its negotiations were enacted in spheres of
work and family, beyond the provider-patient interaction. By seeking multiple opinions, women in effect
distilled the power imbalance typically ascribed to one provider: they equipped themselves to make
informed decisions.
While women’s accounts indicated they were not passive recipients of medical authority nor embedded
in a ‘culture of silence’, characterisation of their actions solely as resistance or agency must be qualified
– both because they were not expressly articulated as such [273] and in light of the health system. For
women faced with often painful, untreated gynaecological morbidity, a public health system focussed
on maternal health offered few options for gynaecological care[158]. Health services for women in
181
Gujarat have largely been focused on maternal health, particularly recent investments through the
National Rural Health Mission and large donor-funded programmes[169]. As a result, the health system
and providers provide an array of services through pregnancy and childbirth. Yet once women who had
fulfilled their reproductive duties experienced morbidity, providers advised hysterectomy–forgoing
prevention, first-line treatment and referral to alternative services–because it offered a permanent
solution to the now problematic uterus. They seemed neither inclined towards, nor capable of,
managing women’s non-maternal health issues without surgical intervention. The vast majority of
health care in India is sought in the private sector[2]; hysterectomy is not an exception, although it
reflected greater use of public services than for other ailments. While expressing agency in deciding the
terms of a hysterectomy, women in this context were simultaneously constricted by structural, health
system weaknesses. By altogether removing the perceived root cause of illness, providers and women
absolved the health system of its failure to address women’s gynaecological concerns in a primary care
setting.
A focus on women’s agency and decision-making risks ignoring or minimising the importance of why
they sought treatment in the first place. A substantial body of literature over the past two decades has
estimated the prevalence of reproductive and sexual health–related ailments amongst women in rural
India and the lack of appropriate, accessible treatment [151, 152, 274-277]. The extent of the
disruption of gynaecological and menstrual disorders to women’s work has also been documented in
low-income settings [128, 278, 279]. Interviews in this study quickly revealed that women experienced
considerable gynaecological and menstrual ailments – illnesses that compromised their ability to work
and conduct daily activities. Further, agricultural labourers with history of childbirth without skilled
attendance are likely at higher risk of uterine prolapse[280, 281]. Local midwives also perceived an
increase in menstrual irregularities in the study area, ascribed to relatively recent, unrestricted use of
fertilisers and lifestyle changes.
Lastly, the local specificity of risk factors for hysterectomy deserves consideration. The predominance of
sterilisation as contraception amongst young women in India is an extreme pattern, not seen elsewhere
in the world, that has both demographic and health implications [282]. While the immediate health
risks of poor quality sterilisation have been documented, longterm biological effects require more
research [283]. Tubal ligation has been associated with increased risk of menstrual disorders and
182
hysterectomy in studies conducted in the United States, although the evidence is not consistent [284-
288]. Combined with a lack of labour security and very limited treatment options, women in this
setting, particularly those who have undergone sterilisation, may be at a higher biological risk for the
gynaecological morbidity that ultimately leads to hysterectomy. Further, women in previous research
have perceived sterilisation to be the cause of subsequent gynaecological morbidity[154, 158]. Localised
risk factors for (and side effects of) hysterectomy and early menopause in this population are reminder
of how social, cultural and political factors affect, and are affected by, biological processes [289, 290].
Thus, situated and localised accounts of women’s experiences are critical to identifying determinants of
hysterectomy as well as engaging meaningfully with interventions. In Towzi’s ethnography in rural
Pakistan, women were unlikely or unable to seek multiple opinions for treating gynaecological ailments.
Hysterectomy reflected medicalisation processes enacted through a power-imbued colonisation of rural
women’s bodies, fuelled by attitudes towards the uterus and poor women [262]. Women’s experiences
did not suggest the space to negotiate as observed in Gujarat – perhaps reflective of differences in
sociocultural and health care environments. Further, biological vulnerabilities and the experience of
gynaecological morbidity may have differed. Women without access to SEWA’s activities or those in
less developed health systems environments such as Rajasthan and Chhattisgarh are faced with
different negotiations – as underscored by variations in sociocultural determinants of, and treatment-
seeking patterns for, gynaecological ailments observed in different parts of India[153, 154, 156-158,
166]. As a result, interventions and approaches may, and should, vary: in rural Gujarat, a lack of
appropriate, quality gynaecological care emerges as an immediate area for intervention, along with
advocacy to promote women’s health care beyond reproduction, significantly improved family planning
services and deeper analysis of provider incentives.
Conclusion
This account aimed to nuance the conceptualisation of hysterectomy as solely a provider-driven, top-
down interference in women’s bodies. Women’s decisions to undergo hysterectomy in rural Gujarat
were complex negotiations across individual, socioeconomic and health system-related compulsions.
Women’s own perceptions stood in stark opposition to that of the systems around them: they identified
themselves as workers and caretakers, charged with both responsibility and duty. Gender and class
183
biases, however, defined them as essentially reproductive contributors with few options in a weak
health system. When faced with uterine-related ailments that disturbed daily life, these two opposing
characterisations in fact aligned – and normalised hysterectomy as treatment and prophylaxis. Viewed
beyond the medical encounter, hysterectomy is a symptom of the gendered health services,
socioeconomic inequities and insecure labour conditions that marked women’s lives. Accordingly, both
its underlying determinants and long-term effects demand structural, systemic interventions.
184
RESEARCH PAPER COVER SHEET
PLEASE NOTE THAT A COVER SHEET MUST BE COMPLETED FOR EACH RESEARCH PAPER
INCLUDED IN A THESIS.
SECTION A – Student Details
Student Sapna Desai
Principal Supervisor Simon Cousens
Thesis Title
Community health worker-led education to change women’s treatment-seeking behaviour: A
cluster randomised trial and qualitative investigation in Gujarat, India
If the Research Paper has previously been published please complete Section B, if not please move
to Section C
SECTION B – Paper already published
Where was the work published?
When was the work published?
Have you retained the copyright for the work?*
Was the work subject to academic peer review?
SECTION C – Prepared for publication, but not yet published
Where is the work intended to be published? Global Public Health
Please list the paper’s authors in the intended authorship order: Sapna Desai, Oona
Campbell, Tara Sinha, Ajay Mahal, Simon Cousens
Stage of publication Not yet submitted
185
Student Signature: Date: 6.2.2015
Supervisor Signature: Date: 6.2.2015
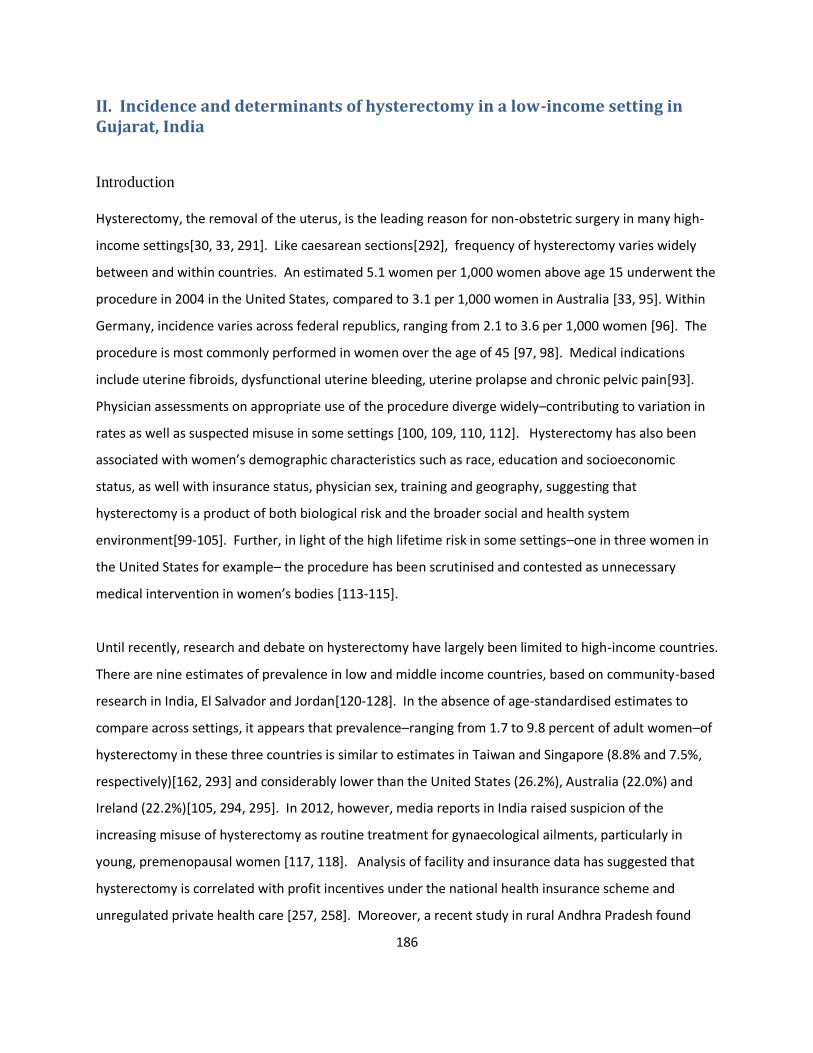
186
II. Incidence and determinants of hysterectomy in a low-income setting in Gujarat, India
Introduction
Hysterectomy, the removal of the uterus, is the leading reason for non-obstetric surgery in many high-
income settings[30, 33, 291]. Like caesarean sections[292], frequency of hysterectomy varies widely
between and within countries. An estimated 5.1 women per 1,000 women above age 15 underwent the
procedure in 2004 in the United States, compared to 3.1 per 1,000 women in Australia [33, 95]. Within
Germany, incidence varies across federal republics, ranging from 2.1 to 3.6 per 1,000 women [96]. The
procedure is most commonly performed in women over the age of 45 [97, 98]. Medical indications
include uterine fibroids, dysfunctional uterine bleeding, uterine prolapse and chronic pelvic pain[93].
Physician assessments on appropriate use of the procedure diverge widely–contributing to variation in
rates as well as suspected misuse in some settings [100, 109, 110, 112]. Hysterectomy has also been
associated with women’s demographic characteristics such as race, education and socioeconomic
status, as well with insurance status, physician sex, training and geography, suggesting that
hysterectomy is a product of both biological risk and the broader social and health system
environment[99-105]. Further, in light of the high lifetime risk in some settings–one in three women in
the United States for example– the procedure has been scrutinised and contested as unnecessary
medical intervention in women’s bodies [113-115].
Until recently, research and debate on hysterectomy have largely been limited to high-income countries.
There are nine estimates of prevalence in low and middle income countries, based on community-based
research in India, El Salvador and Jordan[120-128]. In the absence of age-standardised estimates to
compare across settings, it appears that prevalence–ranging from 1.7 to 9.8 percent of adult women–of
hysterectomy in these three countries is similar to estimates in Taiwan and Singapore (8.8% and 7.5%,
respectively)[162, 293] and considerably lower than the United States (26.2%), Australia (22.0%) and
Ireland (22.2%)[105, 294, 295]. In 2012, however, media reports in India raised suspicion of the
increasing misuse of hysterectomy as routine treatment for gynaecological ailments, particularly in
young, premenopausal women [117, 118]. Analysis of facility and insurance data has suggested that
hysterectomy is correlated with profit incentives under the national health insurance scheme and
unregulated private health care [257, 258]. Moreover, a recent study in rural Andhra Pradesh found
187
that hysterectomy, conducted at an average age of 29 years, also included removal of both ovaries (and
thereby induced premature menopause) in 59% of cases[296]. In response to such findings, two states
have already restricted publicly-funded insurance coverage for the procedure in private facilities[256].
There is very limited population-level evidence on hysterectomy to inform policy decisions in India. Our
own earlier research in Gujarat identified hysterectomy as the leading reason for hospitalisation in the
past six months amongst both insured and uninsured women, but cross-sectional data prevented
comparison with other settings or conclusive findings related to determinants[145]. In light of (i) the
lack of data in India and (ii) the social and health systems factors associated with hysterectomy in other
settings, we conducted a mixed methods analysis, integrating a cohort study and qualitative research, to
estimate incidence, identify predictors and explore the underlying determinants of hysterectomy in a
low-income setting in Gujarat, India.
Setting
Gujarat, a state of 60 million people on India’s Western border, is amongst the top five contributors to
India’s economic growth, with the third highest GDP[168]. The National Rural Health Mission (NRHM),
India’s flagship health programme to improve rural health infrastructure and human resources, was
initiated in 2005 and followed by Rashtriya Swasthya Bima Yojana (RSBY), the national health insurance
scheme that provides hospitalisation coverage up to Rs.30,000 in public and private hospitals for
families with below poverty-line cards. Indicators suggest common use of medical interventions for
reproductive health : fifty-seven percent of births in Gujarat occur in a health facility, with institutional
birth more common among higher-income, educated urban women[3]. Forty-four percent of currently
married women have undergone sterilisation, accounting for 70 percent of all contraceptive use
amongst reproductive aged women. Lower-income women are more likely to utilise sterilisation as a
primary form of contraception, and 85 percent of sterilised women utilised a government facility for the
procedure[3].
This study was conducted alongside a two-year evaluation of a community health intervention
conducted by the Self-Employed Women’s Association (SEWA) in Ahmedabad district and city in Gujarat
between 2010 and 2012. SEWA, a trade union of over 1.5 million women workers in the informal
economy, works towards members’ full employment and self-reliance. It operates a voluntary health
188
insurance scheme (VimoSEWA) that offers coverage for hospitalisation that exceeds 24 hours. Previous
research based at SEWA has identified hysterectomy as a leading reason for insurance claims and
hospitalisation at an average age of 36, as well as identified poor quality of care provided to women for
gynaecological ailments and surgery[138, 141, 145].
Methods
The nature of the research questions called for a mixed methods design. While a quantitative survey
could estimate measures of frequency and individual-level predictors of hysterectomy, understanding
the complexity of social and behavioural factors that influenced women to undergo hysterectomy
required integration of a qualitative approach[297]. Given the lack of previous research in low-income
settings, a mix of quantitative and qualitative data also allowed for triangulation of findings and more
extensive exploration of determinants in this setting[207]. This study utilised two data sources: (i) a
quantitative, population-based cohort study amongst adult women (ii) in-depth ethnographic research
amongst women, health care providers and key informants. As part of the trial, the quantitative survey
was designed first, and included basic questions to estimate prevalence of ever hysterectomy in the
study population. After analysing baseline findings, we decided to (i) add survey questions pertinent to
hysterectomy and reproductive health history to subsequent rounds and (ii) initiate a qualitative study
to explore individual, social and health systems determinants of hysterectomy. The mix of providers and
average age reported in the baseline led to inclusion of in-depth interviews with government health
providers and younger women. All participants reviewed a study information form with researchers and
provided consent to participation and sharing of findings. Identities of all sources have been
anonymised. Ethics approval for quantitative and qualitative components was provided by the Executive
Committee of the SEWA Health Cooperative and the ethics committee of the London School of Hygiene
and Tropical Medicine.
(i) Cohort study
Quantitative data came from four household surveys that collected demographic, health and treatment-
seeking information in a cohort of adult women, as part of a two-year cluster randomised trial to
evaluate the effect of a SEWA health education intervention. The intervention was designed to reduce
insurance claims and hospitalisation for diarrhoea, fever and hysterectomy amongst adult women. The
trial was conducted in 28 clusters over two years. Seventy households were surveyed in each cluster,
189
35 of which were randomly selected from SEWA’s insurance membership database. The remaining 35
were randomly selected from household listings. 1,934 women were recruited in the first round. The
trial was registered as ISCRTN 21290274.
Analysis of the trial indicated no evidence of an effect of the intervention on rates of claim submission,
hospitalisation or morbidity. Accordingly, a cohort analysis to estimate incidence and identify predictors
of hysterectomy included data from both treatment and control areas over all four rounds of the
household survey. Data were entered into a Microsoft Access database and analysed using Stata 11.
The svyset command was utilised to take into account the cluster sampling and sampling weights for
insured and uninsured households. Insured households were over-sampled as part of the trial design,
and all tables except Table 8.2 present weighted proportions so findings are representative of the
general population. Women who reported past hysterectomy prior to the period covered by the
baseline survey were excluded. The incidence of hysterectomy, based on cases reported by the primary
adult respondent over the two-year survey period, was estimated using the exponent of the Poisson
regression coefficient. Crude rate ratios for a range of demographic characteristics such as income,
location, education, insurance status, number of living children and sterilisation history, were estimated
using Poisson regression. Wald tests were utilised to obtain p values for variables with more than one
level. A multivariable Poisson regression model was fitted including variables with crude rate ratios
observed to be associated with (p<0.05), or those that could be theoretically associated with,
hysterectomy. Effect modification was investigated for sterilisation status, education, income and
insurance status.
(ii) Qualitative study
Qualitative fieldwork was conducted by SD, who had worked in the study areas for ten years. Women
who had undergone a hysterectomy were identified over time and through interactions in the
community, as well as through health workers and referrals from other interviewees. Women
interviewed were resident in two rural blocks that were also covered by the quantitative study, but were
not chosen from the survey sample. Women were recruited and interviewed until no new analytical
themes emerged and there was variation in the length of time since the procedure. Thirty-five women
with previous hysterectomy were interviewed. Five gynaecologists, who had performed the
hysterectomy for 20 of the 35 cases selected, were interviewed along with 16 other key informants,
190
including three women with gynaecological ailments who did not proceed with hysterectomy. Three
group discussions were conducted with young women who lived in the study areas.
Interviews were conducted and transcribed in Gujarati. Thematic patterns regarding the decision to
undergo hysterectomy that emerged during interviews were identified using codes. Women were then
compared across individual sub-themes and variables to identify heterogeneity and new themes, which
ultimately led to identification of broad typologies across women’s treatment seeking patterns.
Interview content was also specifically analysed to examine if SEWA health insurance affected the
decision to undergo hysterectomy.
Mixed methods analysis
The mixed methods analysis was both inductive and deductive, in an iterative approach using
triangulation and by ‘following a thread’[208]. The quantitative cohort data were analysed first to
estimate incidence and identify predictors of hysterectomy. A thematic analysis of qualitative data was
conducted next to examine processes and determinants. Next, findings from both sets of data were
triangulated to identify convergence, dissonance and gaps. New analytical themes in either set of data
also led to further analysis in the other. For example, in-depth interviews with women suggested that
views on hysterectomy varied by sterilisation history (a ‘thread’), which prompted quantitative analysis
of effect modification by sterilisation status. Finally, predictors and underlying determinants were
examined together to identify intersections.
Findings
Of the 1,934 women recruited, 318 were lost to follow-up by round four, 239 of whom either migrated
or lost their homes due to slum demolitions during the survey period. 191 women (10%) had undergone
hysterectomy before the period covered by the baseline survey and were excluded from the cohort
analysis. Surveyed women contributed 3,259.4 woman-years at risk. Women surveyed were low-
income women workers of the informal economy, most between the ages of 25-44, and married with at
least two children (Table 8.2). Sixty-two percent of women who were surveyed in round 4 reported
having undergone sterilisation, with mean age at time of sterilisation 27.5 years. Over 70 percent of
women between the ages of 35-54 years reported having been sterilised (Figure 8.1).
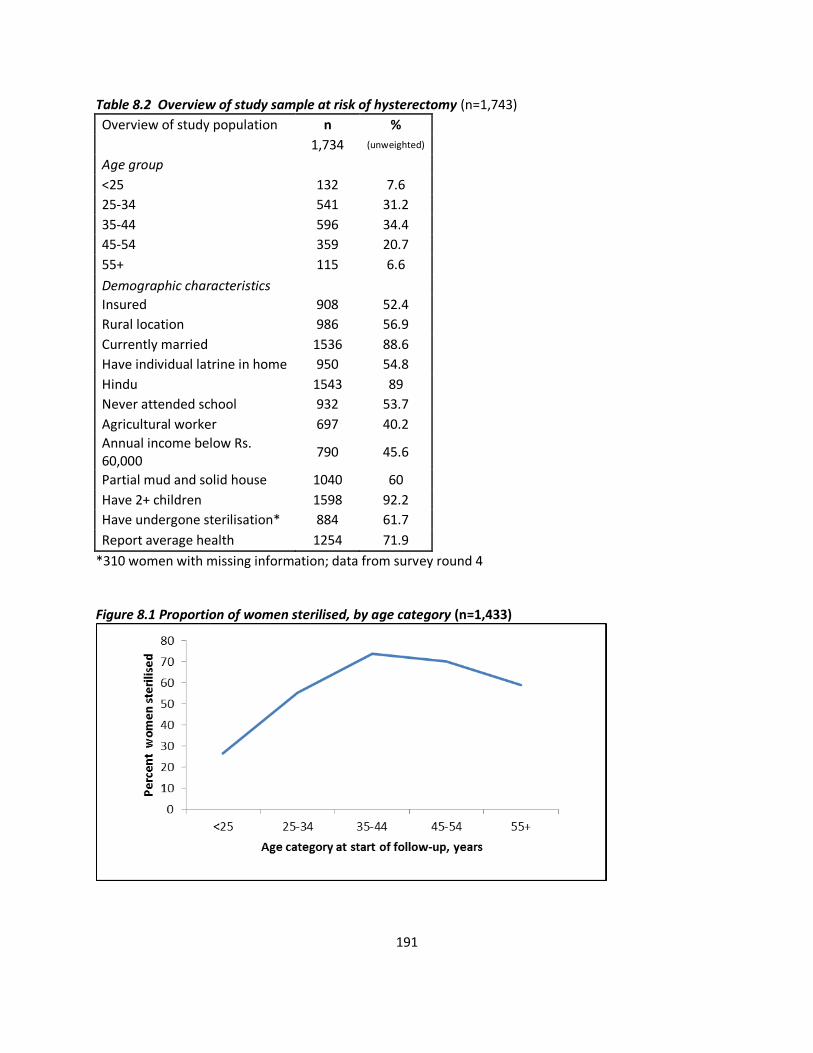
191
Table 8.2 Overview of study sample at risk of hysterectomy (n=1,743)
Overview of study population n %
1,734 (unweighted)
Age group
<25 132 7.6
25-34 541 31.2
35-44 596 34.4
45-54 359 20.7
55+ 115 6.6
Demographic characteristics
Insured 908 52.4
Rural location 986 56.9
Currently married 1536 88.6
Have individual latrine in home 950 54.8
Hindu 1543 89
Never attended school 932 53.7
Agricultural worker 697 40.2
Annual income below Rs. 60,000
790 45.6
Partial mud and solid house 1040 60
Have 2+ children 1598 92.2
Have undergone sterilisation* 884 61.7
Report average health 1254 71.9
*310 women with missing information; data from survey round 4 Figure 8.1 Proportion of women sterilised, by age category (n=1,433)
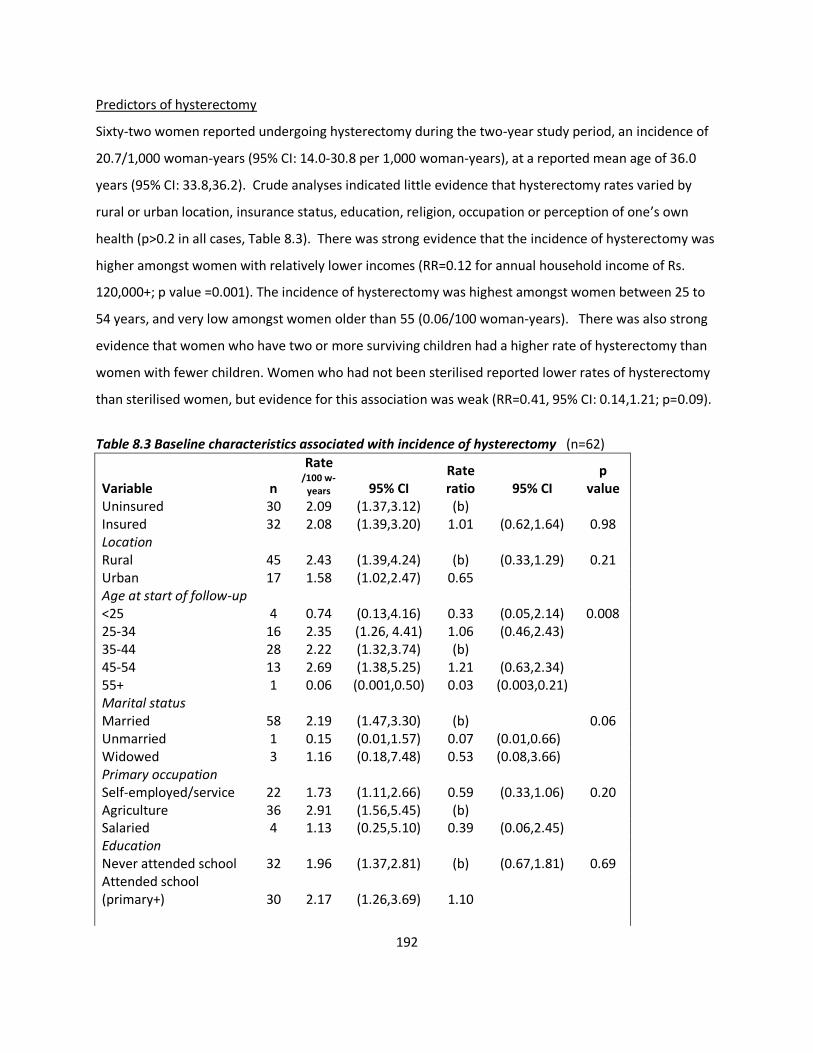
192
Predictors of hysterectomy
Sixty-two women reported undergoing hysterectomy during the two-year study period, an incidence of
20.7/1,000 woman-years (95% CI: 14.0-30.8 per 1,000 woman-years), at a reported mean age of 36.0
years (95% CI: 33.8,36.2). Crude analyses indicated little evidence that hysterectomy rates varied by
rural or urban location, insurance status, education, religion, occupation or perception of one’s own
health (p>0.2 in all cases, Table 8.3). There was strong evidence that the incidence of hysterectomy was
higher amongst women with relatively lower incomes (RR=0.12 for annual household income of Rs.
120,000+; p value =0.001). The incidence of hysterectomy was highest amongst women between 25 to
54 years, and very low amongst women older than 55 (0.06/100 woman-years). There was also strong
evidence that women who have two or more surviving children had a higher rate of hysterectomy than
women with fewer children. Women who had not been sterilised reported lower rates of hysterectomy
than sterilised women, but evidence for this association was weak (RR=0.41, 95% CI: 0.14,1.21; p=0.09).
Table 8.3 Baseline characteristics associated with incidence of hysterectomy (n=62)
Variable n
Rate
/100 w-years 95% CI
Rate ratio 95% CI
p value
Uninsured 30 2.09 (1.37,3.12) (b)
Insured 32 2.08 (1.39,3.20) 1.01 (0.62,1.64) 0.98 Location
Rural 45 2.43 (1.39,4.24) (b) (0.33,1.29) 0.21 Urban 17 1.58 (1.02,2.47) 0.65
Age at start of follow-up
<25 4 0.74 (0.13,4.16) 0.33 (0.05,2.14) 0.008 25-34 16 2.35 (1.26, 4.41) 1.06 (0.46,2.43) 35-44 28 2.22 (1.32,3.74) (b)
45-54 13 2.69 (1.38,5.25) 1.21 (0.63,2.34) 55+ 1 0.06 (0.001,0.50) 0.03 (0.003,0.21) Marital status
Married 58 2.19 (1.47,3.30) (b)
0.06 Unmarried 1 0.15 (0.01,1.57) 0.07 (0.01,0.66) Widowed 3 1.16 (0.18,7.48) 0.53 (0.08,3.66) Primary occupation
Self-employed/service 22 1.73 (1.11,2.66) 0.59 (0.33,1.06) 0.20 Agriculture 36 2.91 (1.56,5.45) (b)
Salaried 4 1.13 (0.25,5.10) 0.39 (0.06,2.45) Education
Never attended school 32 1.96 (1.37,2.81) (b) (0.67,1.81) 0.69 Attended school (primary+) 30 2.17 (1.26,3.69) 1.10
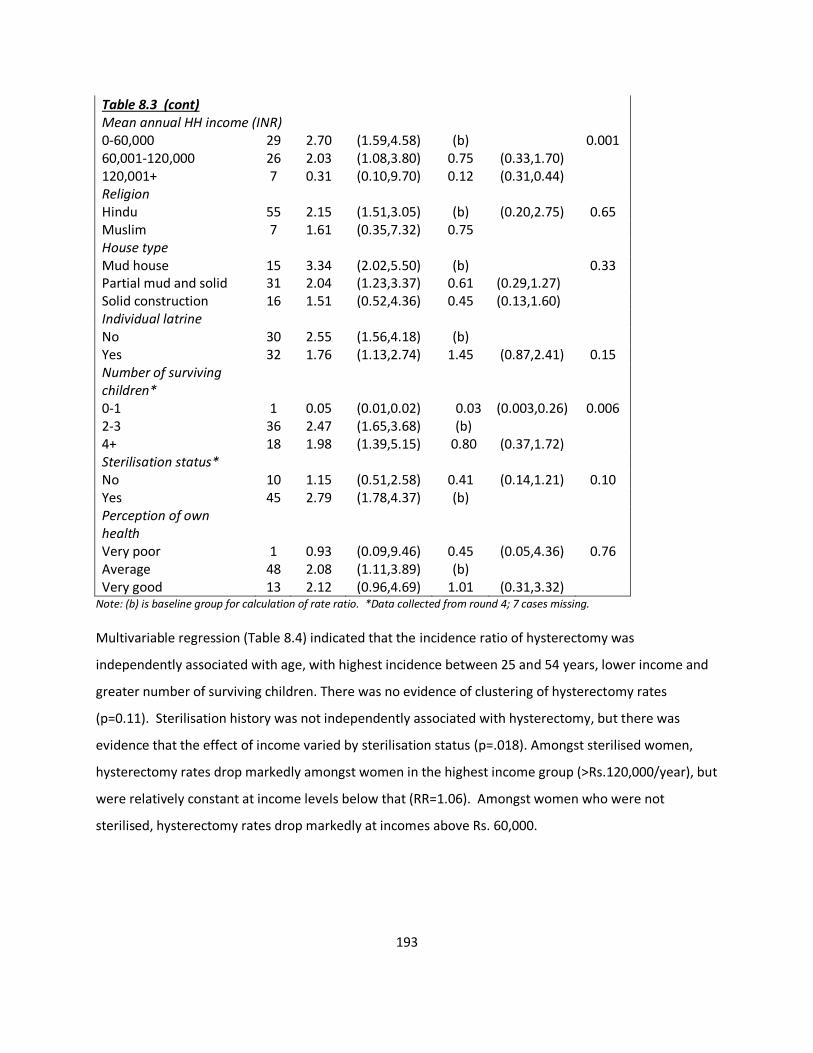
193
Table 8.3 (cont) Mean annual HH income (INR) 0-60,000 29 2.70 (1.59,4.58) (b)
0.001
60,001-120,000 26 2.03 (1.08,3.80) 0.75 (0.33,1.70) 120,001+ 7 0.31 (0.10,9.70) 0.12 (0.31,0.44) Religion
Hindu 55 2.15 (1.51,3.05) (b) (0.20,2.75) 0.65 Muslim 7 1.61 (0.35,7.32) 0.75
House type
Mud house 15 3.34 (2.02,5.50) (b)
0.33
Partial mud and solid 31 2.04 (1.23,3.37) 0.61 (0.29,1.27) Solid construction 16 1.51 (0.52,4.36) 0.45 (0.13,1.60) Individual latrine
No 30 2.55 (1.56,4.18) (b)
Yes 32 1.76 (1.13,2.74) 1.45 (0.87,2.41) 0.15 Number of surviving children*
0-1 1 0.05 (0.01,0.02) 0.03 (0.003,0.26) 0.006 2-3 36 2.47 (1.65,3.68) (b)
4+ 18 1.98 (1.39,5.15) 0.80 (0.37,1.72) Sterilisation status*
No 10 1.15 (0.51,2.58) 0.41 (0.14,1.21) 0.10 Yes 45 2.79 (1.78,4.37) (b)
Perception of own health
Very poor 1 0.93 (0.09,9.46) 0.45 (0.05,4.36) 0.76 Average 48 2.08 (1.11,3.89) (b)
Very good 13 2.12 (0.96,4.69) 1.01 (0.31,3.32) Note: (b) is baseline group for calculation of rate ratio. *Data collected from round 4; 7 cases missing.
Multivariable regression (Table 8.4) indicated that the incidence ratio of hysterectomy was
independently associated with age, with highest incidence between 25 and 54 years, lower income and
greater number of surviving children. There was no evidence of clustering of hysterectomy rates
(p=0.11). Sterilisation history was not independently associated with hysterectomy, but there was
evidence that the effect of income varied by sterilisation status (p=.018). Amongst sterilised women,
hysterectomy rates drop markedly amongst women in the highest income group (>Rs.120,000/year), but
were relatively constant at income levels below that (RR=1.06). Amongst women who were not
sterilised, hysterectomy rates drop markedly at incomes above Rs. 60,000.
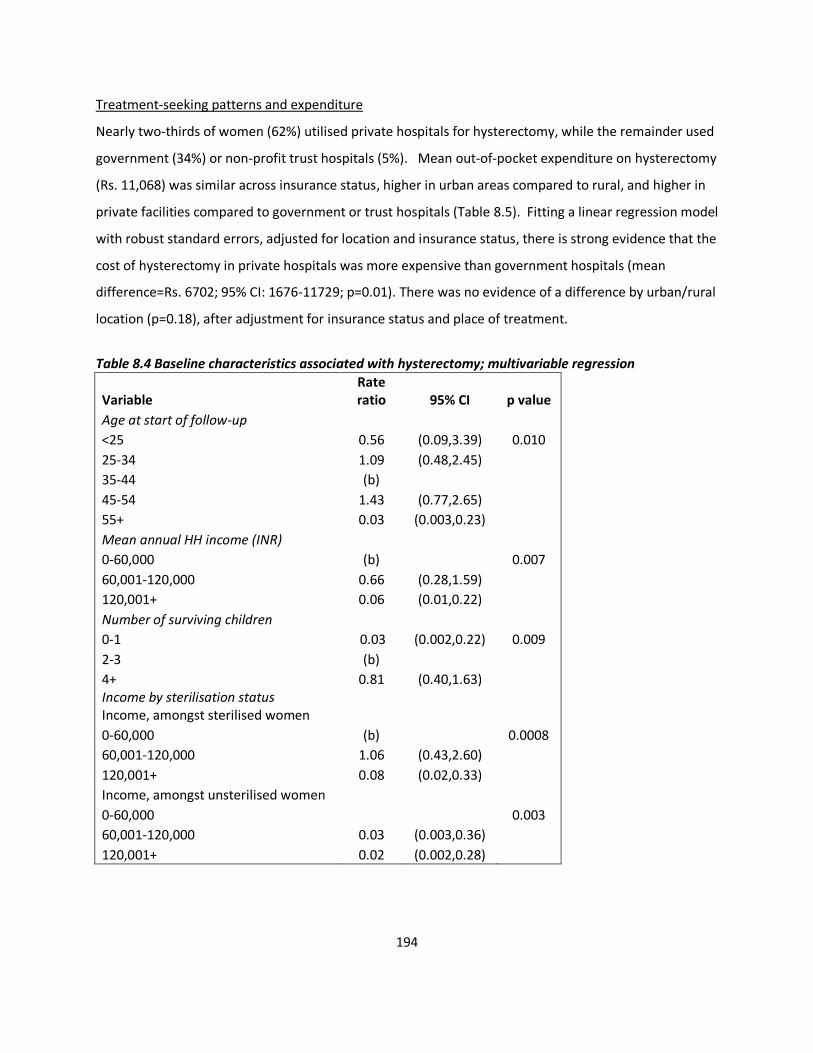
194
Treatment-seeking patterns and expenditure
Nearly two-thirds of women (62%) utilised private hospitals for hysterectomy, while the remainder used
government (34%) or non-profit trust hospitals (5%). Mean out-of-pocket expenditure on hysterectomy
(Rs. 11,068) was similar across insurance status, higher in urban areas compared to rural, and higher in
private facilities compared to government or trust hospitals (Table 8.5). Fitting a linear regression model
with robust standard errors, adjusted for location and insurance status, there is strong evidence that the
cost of hysterectomy in private hospitals was more expensive than government hospitals (mean
difference=Rs. 6702; 95% CI: 1676-11729; p=0.01). There was no evidence of a difference by urban/rural
location (p=0.18), after adjustment for insurance status and place of treatment.
Table 8.4 Baseline characteristics associated with hysterectomy; multivariable regression
Variable Rate ratio 95% CI p value
Age at start of follow-up
<25 0.56 (0.09,3.39) 0.010
25-34 1.09 (0.48,2.45)
35-44 (b)
45-54 1.43 (0.77,2.65)
55+ 0.03 (0.003,0.23)
Mean annual HH income (INR)
0-60,000 (b)
0.007
60,001-120,000 0.66 (0.28,1.59)
120,001+ 0.06 (0.01,0.22)
Number of surviving children
0-1 0.03 (0.002,0.22) 0.009
2-3 (b)
4+ 0.81 (0.40,1.63) Income by sterilisation status
Income, amongst sterilised women
0-60,000 (b)
0.0008
60,001-120,000 1.06 (0.43,2.60)
120,001+ 0.08 (0.02,0.33)
Income, amongst unsterilised women
0-60,000
0.003
60,001-120,000 0.03 (0.003,0.36)
120,001+ 0.02 (0.002,0.28)
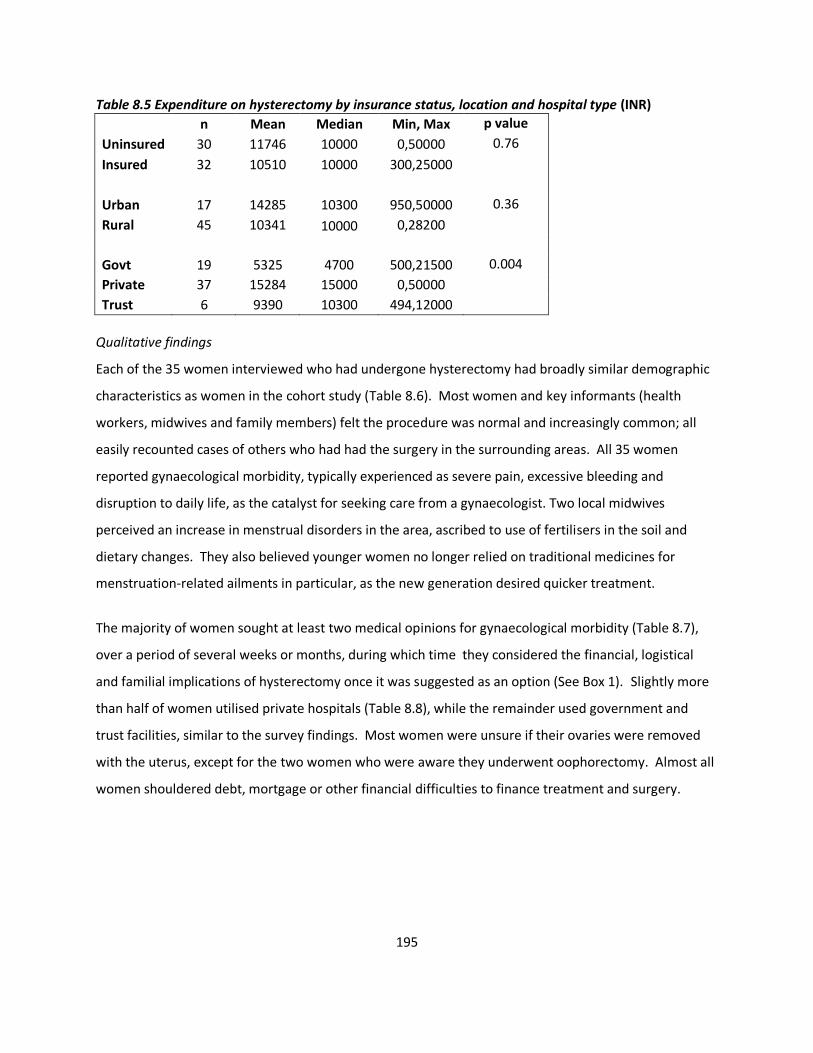
195
Table 8.5 Expenditure on hysterectomy by insurance status, location and hospital type (INR)
n Mean Median Min, Max p value
Uninsured 30 11746 10000 0,50000 0.76
Insured 32 10510 10000 300,25000
Urban 17 14285 10300 950,50000 0.36
Rural 45 10341 10000 0,28200
Govt 19 5325 4700 500,21500 0.004
Private 37 15284 15000 0,50000
Trust 6 9390 10300 494,12000
Qualitative findings
Each of the 35 women interviewed who had undergone hysterectomy had broadly similar demographic
characteristics as women in the cohort study (Table 8.6). Most women and key informants (health
workers, midwives and family members) felt the procedure was normal and increasingly common; all
easily recounted cases of others who had had the surgery in the surrounding areas. All 35 women
reported gynaecological morbidity, typically experienced as severe pain, excessive bleeding and
disruption to daily life, as the catalyst for seeking care from a gynaecologist. Two local midwives
perceived an increase in menstrual disorders in the area, ascribed to use of fertilisers in the soil and
dietary changes. They also believed younger women no longer relied on traditional medicines for
menstruation-related ailments in particular, as the new generation desired quicker treatment.
The majority of women sought at least two medical opinions for gynaecological morbidity (Table 8.7),
over a period of several weeks or months, during which time they considered the financial, logistical
and familial implications of hysterectomy once it was suggested as an option (See Box 1). Slightly more
than half of women utilised private hospitals (Table 8.8), while the remainder used government and
trust facilities, similar to the survey findings. Most women were unsure if their ovaries were removed
with the uterus, except for the two women who were aware they underwent oophorectomy. Almost all
women shouldered debt, mortgage or other financial difficulties to finance treatment and surgery.
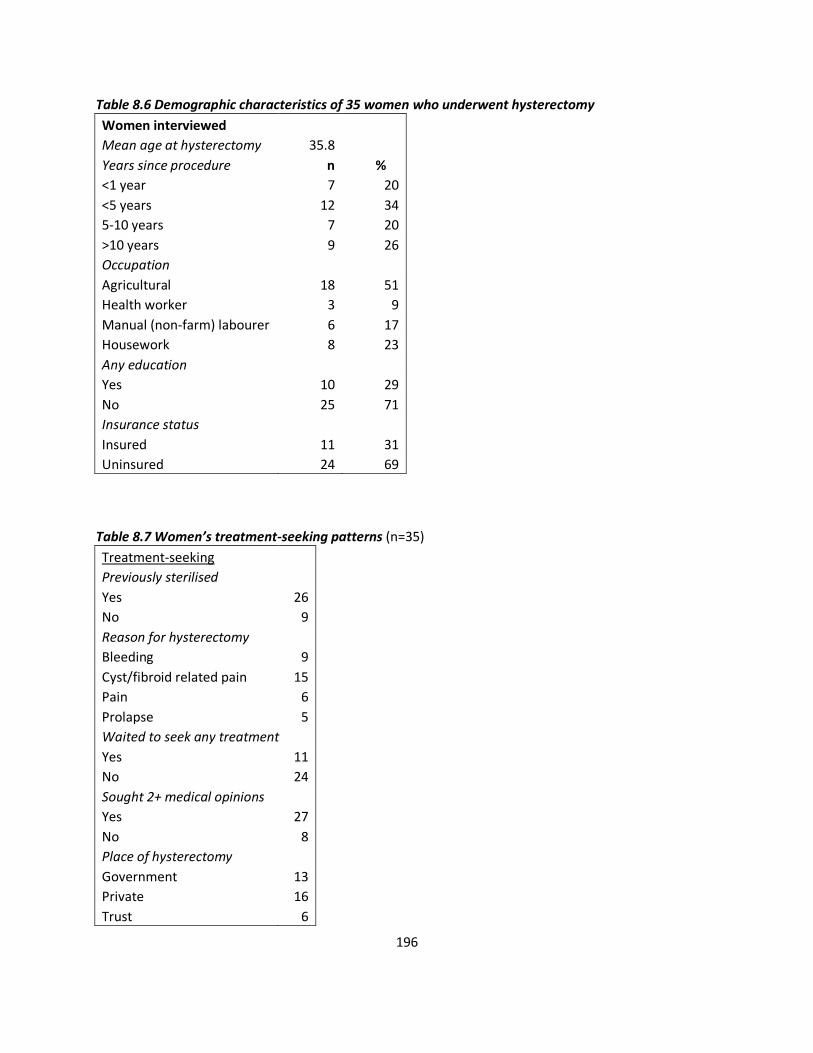
196
Table 8.6 Demographic characteristics of 35 women who underwent hysterectomy
Women interviewed Mean age at hysterectomy 35.8
Years since procedure n %
<1 year 7 20
<5 years 12 34
5-10 years 7 20
>10 years 9 26
Occupation
Agricultural 18 51
Health worker 3 9
Manual (non-farm) labourer 6 17
Housework 8 23
Any education
Yes 10 29
No 25 71
Insurance status
Insured 11 31
Uninsured 24 69
Table 8.7 Women’s treatment-seeking patterns (n=35)
Treatment-seeking
Previously sterilised
Yes 26
No 9
Reason for hysterectomy
Bleeding 9
Cyst/fibroid related pain 15
Pain 6
Prolapse 5
Waited to seek any treatment
Yes 11
No 24
Sought 2+ medical opinions
Yes 27
No 8
Place of hysterectomy
Government 13
Private 16
Trust 6
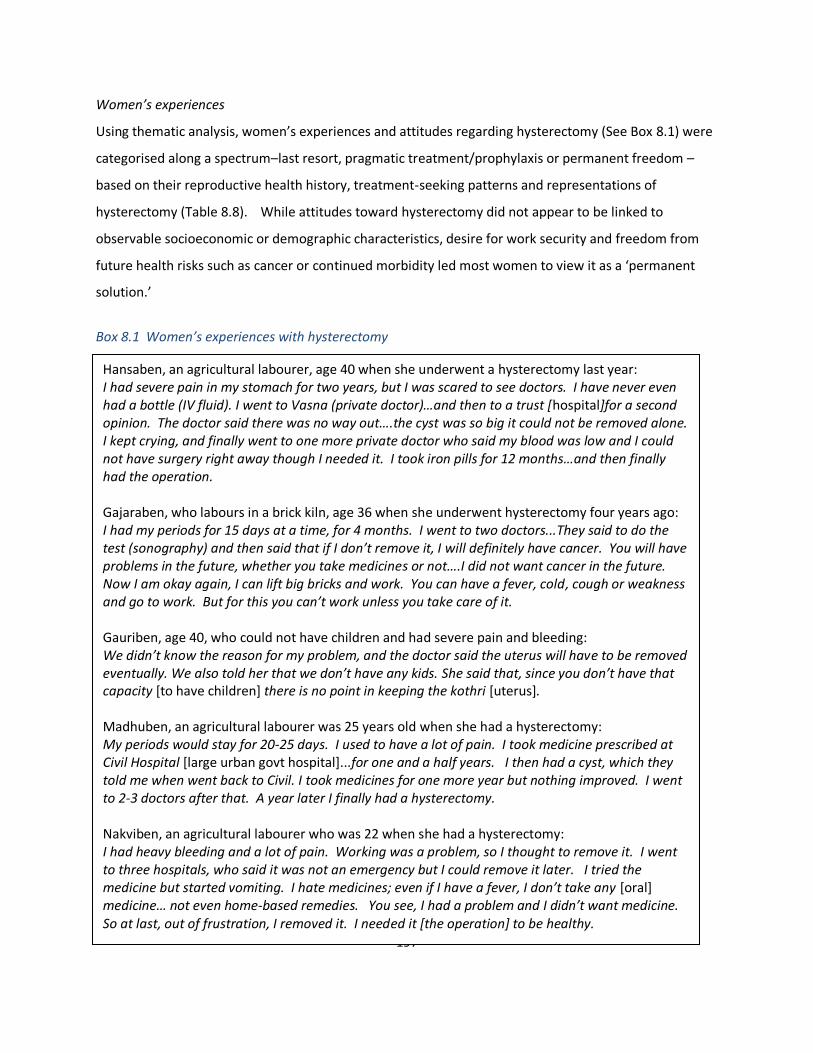
197
Women’s experiences
Using thematic analysis, women’s experiences and attitudes regarding hysterectomy (See Box 8.1) were
categorised along a spectrum–last resort, pragmatic treatment/prophylaxis or permanent freedom –
based on their reproductive health history, treatment-seeking patterns and representations of
hysterectomy (Table 8.8). While attitudes toward hysterectomy did not appear to be linked to
observable socioeconomic or demographic characteristics, desire for work security and freedom from
future health risks such as cancer or continued morbidity led most women to view it as a ‘permanent
solution.’
Box 8.1 Women’s experiences with hysterectomy Women who had undergone sterilisation seemed more comfortable with hysterectomy as a viable
treatment option, rather than a last resort. Three women who did not undergo hysterectomy for
gynaecological ailments were of similar age and demographic characteristics as the other women
interviewed. Each cited fear of surgery as the reason for refusal. One preferred to continue with
hormonal treatment, and a second had felt cured once she underwent menopause.
Hansaben, an agricultural labourer, age 40 when she underwent a hysterectomy last year: I had severe pain in my stomach for two years, but I was scared to see doctors. I have never even had a bottle (IV fluid). I went to Vasna (private doctor)…and then to a trust [hospital]for a second opinion. The doctor said there was no way out….the cyst was so big it could not be removed alone. I kept crying, and finally went to one more private doctor who said my blood was low and I could not have surgery right away though I needed it. I took iron pills for 12 months…and then finally had the operation. Gajaraben, who labours in a brick kiln, age 36 when she underwent hysterectomy four years ago: I had my periods for 15 days at a time, for 4 months. I went to two doctors...They said to do the test (sonography) and then said that if I don’t remove it, I will definitely have cancer. You will have problems in the future, whether you take medicines or not….I did not want cancer in the future. Now I am okay again, I can lift big bricks and work. You can have a fever, cold, cough or weakness and go to work. But for this you can’t work unless you take care of it. Gauriben, age 40, who could not have children and had severe pain and bleeding: We didn’t know the reason for my problem, and the doctor said the uterus will have to be removed eventually. We also told her that we don’t have any kids. She said that, since you don’t have that capacity [to have children] there is no point in keeping the kothri [uterus]. Madhuben, an agricultural labourer was 25 years old when she had a hysterectomy: My periods would stay for 20-25 days. I used to have a lot of pain. I took medicine prescribed at Civil Hospital [large urban govt hospital]...for one and a half years. I then had a cyst, which they told me when went back to Civil. I took medicines for one more year but nothing improved. I went to 2-3 doctors after that. A year later I finally had a hysterectomy. Nakviben, an agricultural labourer who was 22 when she had a hysterectomy: I had heavy bleeding and a lot of pain. Working was a problem, so I thought to remove it. I went to three hospitals, who said it was not an emergency but I could remove it later. I tried the medicine but started vomiting. I hate medicines; even if I have a fever, I don’t take any [oral] medicine… not even home-based remedies. You see, I had a problem and I didn’t want medicine. So at last, out of frustration, I removed it. I needed it [the operation] to be healthy.
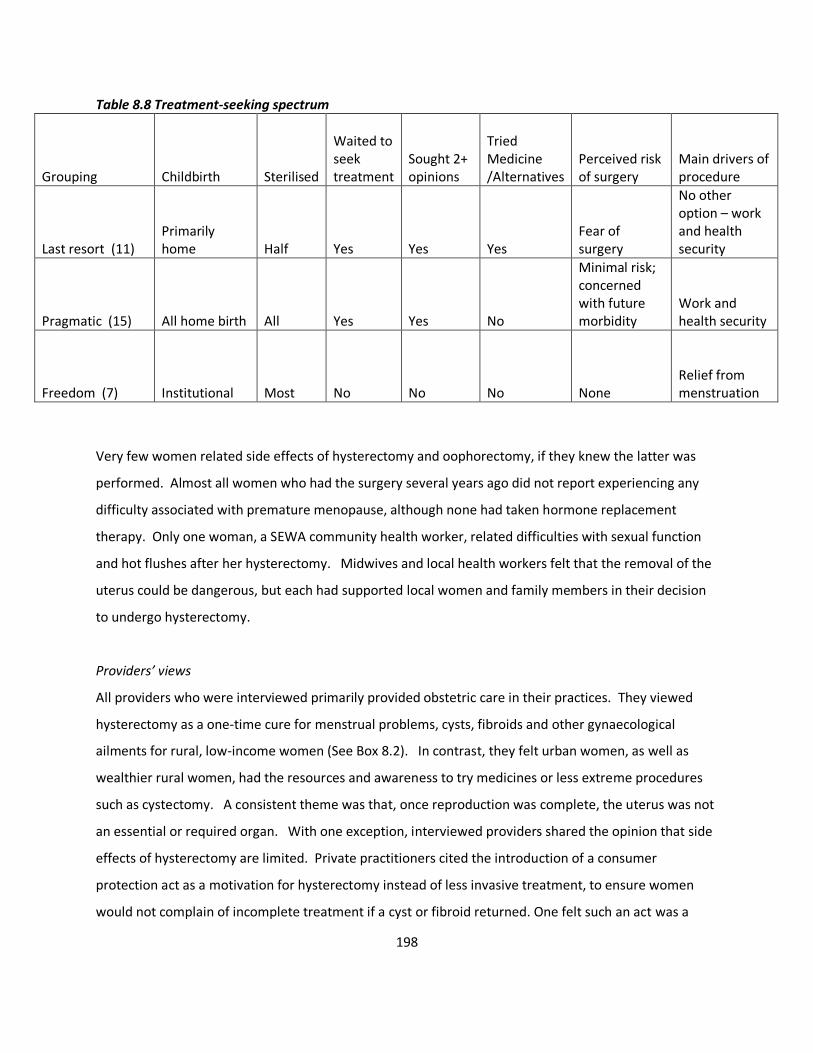
198
Table 8.8 Treatment-seeking spectrum
Grouping Childbirth Sterilised
Waited to seek treatment
Sought 2+ opinions
Tried Medicine /Alternatives
Perceived risk of surgery
Main drivers of procedure
Last resort (11) Primarily home Half Yes Yes Yes
Fear of surgery
No other option – work and health security
Pragmatic (15) All home birth All Yes Yes No
Minimal risk; concerned with future morbidity
Work and health security
Freedom (7) Institutional Most No No No None Relief from menstruation
Very few women related side effects of hysterectomy and oophorectomy, if they knew the latter was
performed. Almost all women who had the surgery several years ago did not report experiencing any
difficulty associated with premature menopause, although none had taken hormone replacement
therapy. Only one woman, a SEWA community health worker, related difficulties with sexual function
and hot flushes after her hysterectomy. Midwives and local health workers felt that the removal of the
uterus could be dangerous, but each had supported local women and family members in their decision
to undergo hysterectomy.
Providers’ views
All providers who were interviewed primarily provided obstetric care in their practices. They viewed
hysterectomy as a one-time cure for menstrual problems, cysts, fibroids and other gynaecological
ailments for rural, low-income women (See Box 8.2). In contrast, they felt urban women, as well as
wealthier rural women, had the resources and awareness to try medicines or less extreme procedures
such as cystectomy. A consistent theme was that, once reproduction was complete, the uterus was not
an essential or required organ. With one exception, interviewed providers shared the opinion that side
effects of hysterectomy are limited. Private practitioners cited the introduction of a consumer
protection act as a motivation for hysterectomy instead of less invasive treatment, to ensure women
would not complain of incomplete treatment if a cyst or fibroid returned. One felt such an act was a
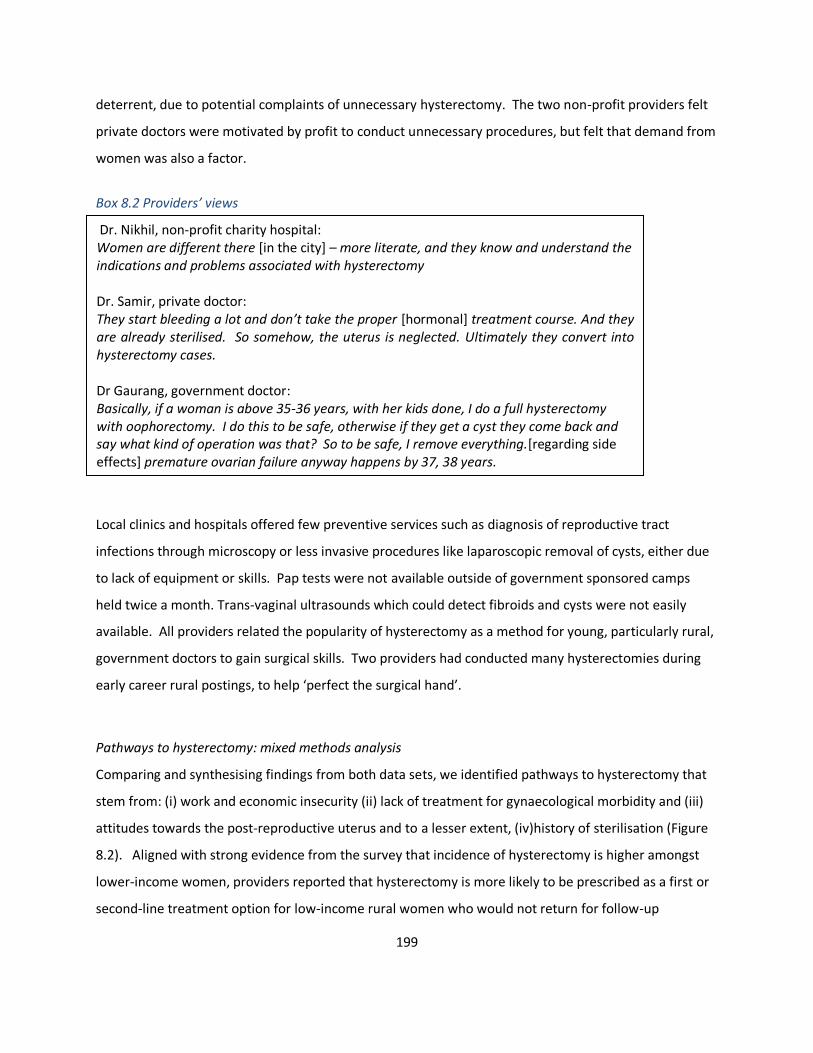
199
deterrent, due to potential complaints of unnecessary hysterectomy. The two non-profit providers felt
private doctors were motivated by profit to conduct unnecessary procedures, but felt that demand from
women was also a factor.
Box 8.2 Providers’ views Local clinics and hospitals offered few preventive services such as diagnosis of reproductive tract
infections through microscopy or less invasive procedures like laparoscopic removal of cysts, either due
to lack of equipment or skills. Pap tests were not available outside of government sponsored camps
held twice a month. Trans-vaginal ultrasounds which could detect fibroids and cysts were not easily
available. All providers related the popularity of hysterectomy as a method for young, particularly rural,
government doctors to gain surgical skills. Two providers had conducted many hysterectomies during
early career rural postings, to help ‘perfect the surgical hand’.
Pathways to hysterectomy: mixed methods analysis
Comparing and synthesising findings from both data sets, we identified pathways to hysterectomy that
stem from: (i) work and economic insecurity (ii) lack of treatment for gynaecological morbidity and (iii)
attitudes towards the post-reproductive uterus and to a lesser extent, (iv)history of sterilisation (Figure
8.2). Aligned with strong evidence from the survey that incidence of hysterectomy is higher amongst
lower-income women, providers reported that hysterectomy is more likely to be prescribed as a first or
second-line treatment option for low-income rural women who would not return for follow-up
Dr. Nikhil, non-profit charity hospital: Women are different there [in the city] – more literate, and they know and understand the indications and problems associated with hysterectomy Dr. Samir, private doctor: They start bleeding a lot and don’t take the proper [hormonal] treatment course. And they are already sterilised. So somehow, the uterus is neglected. Ultimately they convert into hysterectomy cases. Dr Gaurang, government doctor: Basically, if a woman is above 35-36 years, with her kids done, I do a full hysterectomy with oophorectomy. I do this to be safe, otherwise if they get a cyst they come back and say what kind of operation was that? So to be safe, I remove everything.[regarding side effects] premature ovarian failure anyway happens by 37, 38 years.
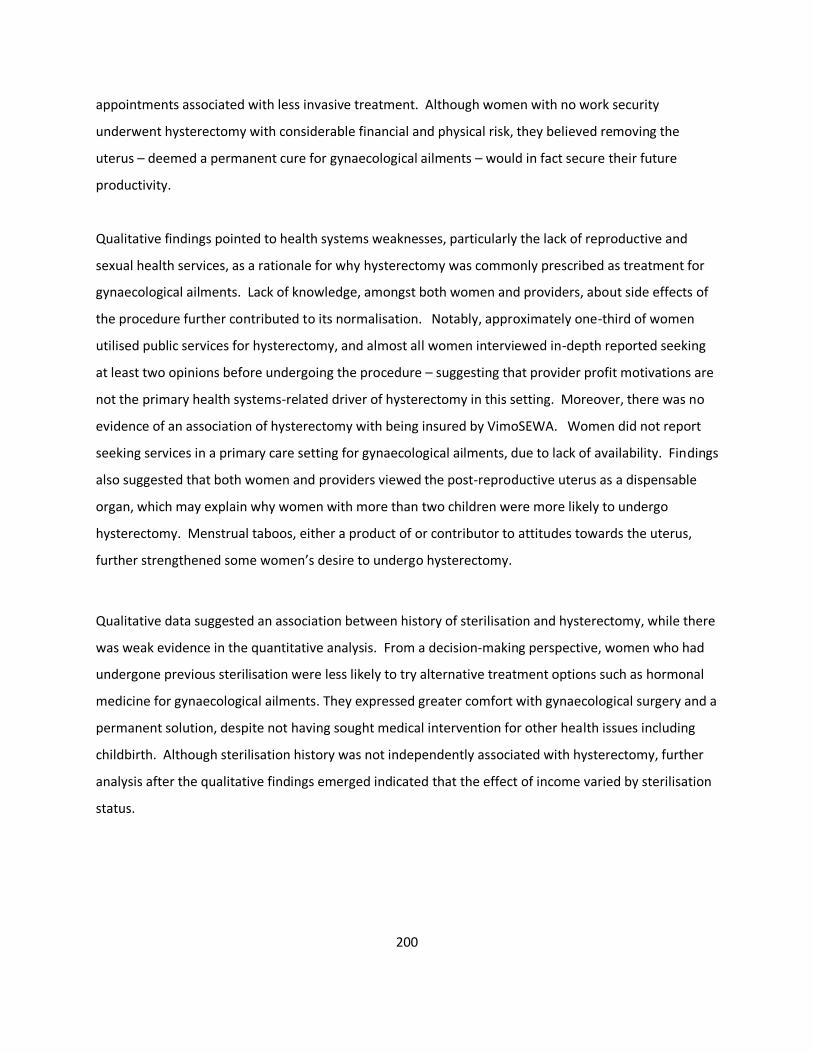
200
appointments associated with less invasive treatment. Although women with no work security
underwent hysterectomy with considerable financial and physical risk, they believed removing the
uterus – deemed a permanent cure for gynaecological ailments – would in fact secure their future
productivity.
Qualitative findings pointed to health systems weaknesses, particularly the lack of reproductive and
sexual health services, as a rationale for why hysterectomy was commonly prescribed as treatment for
gynaecological ailments. Lack of knowledge, amongst both women and providers, about side effects of
the procedure further contributed to its normalisation. Notably, approximately one-third of women
utilised public services for hysterectomy, and almost all women interviewed in-depth reported seeking
at least two opinions before undergoing the procedure – suggesting that provider profit motivations are
not the primary health systems-related driver of hysterectomy in this setting. Moreover, there was no
evidence of an association of hysterectomy with being insured by VimoSEWA. Women did not report
seeking services in a primary care setting for gynaecological ailments, due to lack of availability. Findings
also suggested that both women and providers viewed the post-reproductive uterus as a dispensable
organ, which may explain why women with more than two children were more likely to undergo
hysterectomy. Menstrual taboos, either a product of or contributor to attitudes towards the uterus,
further strengthened some women’s desire to undergo hysterectomy.
Qualitative data suggested an association between history of sterilisation and hysterectomy, while there
was weak evidence in the quantitative analysis. From a decision-making perspective, women who had
undergone previous sterilisation were less likely to try alternative treatment options such as hormonal
medicine for gynaecological ailments. They expressed greater comfort with gynaecological surgery and a
permanent solution, despite not having sought medical intervention for other health issues including
childbirth. Although sterilisation history was not independently associated with hysterectomy, further
analysis after the qualitative findings emerged indicated that the effect of income varied by sterilisation
status.
201
Figure 8.2 Overview of determinants and pathways associated with hysterectomy
202
Discussion
Summary of findings
Our incidence estimate of 20.7/1,000 woman-years (95% CI: 14.0, 30.8), the only estimate of incidence
in India to our knowledge, is at least four times higher than the highest global rates, such as the United
States (5.1/1,000), Germany (3.6/1,000) and Australia (3.1/1,000) [rates in woman-years] [33, 95, 96].
This comparison must be interpreted cautiously, however, due to the demographic characteristics of the
cohort population. Over 85% of respondents were women between the ages of 25-54, comprised mostly
of SEWA members who worked in the informal economy. Since this is also the age group wherein
women have typically completed childbearing and may have higher risk of menstrual disorders
compared to postmenopausal women, they may be at higher risk of hysterectomy than older or younger
women. Accordingly, this study may have overestimated population incidence compared to studies in
high-income countries that include all adult women. Inclusion of respondents’ mother-in-laws and adult
daughters in the household, for example, may have produced lower estimates of hysterectomy
incidence.
There was strong evidence that lower-income, rural women who have completed their families undergo
hysterectomy at higher rates than other women. Our findings suggest that hysterectomy is prescribed
commonly as the first or second-line treatment option for gynaecological ailments, particularly for low-
income rural women. After seeking multiple opinions, women underwent hysterectomy with
considerable financial and physical risk, but with the belief that removing the uterus would secure their
future health and productivity. Attitudes towards the uterus as a dispensable organ – aligned with a
health system that does not provide comprehensive sexual and reproductive health services – have
rendered hysterectomy a ‘permanent solution’ to women’s gynaecological ailments.
Implications for women’s health
In this setting, neither women nor providers were aware of potentially adverse side effects of
hysterectomy–supporting the perception that removal of the uterus and ovaries at young age was
generally beneficial or protective. However, even without removal of the ovaries, hysterectomy has
been associated with earlier onset of menopause[298]. Women who undergo hysterectomy at a mean
age of 36 are at risk of menopause considerably earlier than the estimated global median age at natural
menopause, 51 years [299]. Evidence on the longterm effects of hysterectomy, though inconsistent,
203
also suggests hysterectomy is associated with higher risk of cardiovascular disease, with higher risk
amongst younger women and women who have undergone oophorectomy[300-303]. Recent research
in Taiwan suggests that women who undergo only hysterectomy before age 45 are at a higher risk of
stroke (RR: 2.29 (95% CI, 1.52,3.44)[302]. Further, hysterectomy has been associated with urinary
incontinence and problems with sexual functioning, psychosocial wellbeing and self-image [304-309].
Social and biological determinants
A 1997 editorial in the British Medical Journal opined, “To study the indications for hysterectomy is to
study the interface between medicine and society[310].” Variations in hysterectomy rates by
socioeconomic status, ethnicity and education in high-income settings such as Italy, New Zealand and
the United States [102, 104, 294, 311, 312] generated the notion that hysterectomy is a product of both
social and biological processes[290]. Our data from Gujarat suggests a similar condition in India. Higher
rates amongst lower-income women are of particular concern, as they reflect both immediate health
risks and embedded inequality. Women workers in India’s vast informal economy typically survive on
precarious incomes. As women articulated, gynaecological and menstrual disorders disrupt their work
security, similar to findings in other low-income settings [128, 278, 279]. They therefore viewed
hysterectomy as both pragmatic treatment and prophylaxis, a permanent solution that secured their
future earning capacity. Providers provided differential care based on socioeconomic status, effectively
rendering hysterectomy the ‘only’ treatment option for rural, low-income women as compared to their
urban or wealthier counterparts.
The high proportion of women sterilised in India, most common amongst low-income women, is an
extreme situation not seen anywhere else in the world[282]. In addition to significant health and
demographic implications, sterilisation appears to be related to an increased risk of hysterectomy.
Biologically, tubal ligation has been associated with higher risk of menstrual disorders and
gynaecological ailments in the United States, although evidence is mixed [284-288]. From a decision-
making perspective, women who were sterilised seemed less likely to try alternative treatment options
such as hormonal medicine. They expressed greater comfort with gynaecological surgery and a
permanent solution, despite not having sought medical intervention for other health issues including
childbirth. Widespread, normalised surgical sterilisation may in fact be a precedent for the idea of a
204
permanent solution to reproductive ailments, for both women and providers. Our finding that the
effect of income varies by sterilisation status emphasises the need to understand these linkages further.
Further, belief that the uterus is productive only when reproductive reflected underlying gender biases,
as well as a widespread cultural prioritisation of women’s identity as mothers[260]. Almost no women,
including key informants, believed the uterus performed essential body functions after childbearing was
complete. Moreover, women viewed it as a potential site of cancer – a liability – for which
hysterectomy represented a solution. These findings concur with emerging research in South Asia on the
rationale for hysterectomy to prevent future health problems [262, 313], as well as reflect women’s
pragmatic actions to use bio-medicine as a tool to reduce physical and socioeconomic risk[198].
Implications for health policy and programs
Our findings suggest that hysterectomy is performed without appropriate diagnostic evaluation or
alternative treatments tried. Similar to findings of medical audits in the United States, the lack of clear
clinical guidelines for hysterectomy may leave it subject to misuse[298]. Differential treatment of lower-
income women and use of hysterectomy as ‘practice’ in this setting point to embedded biases in health
care for women–and reflect a culture, including beyond this setting, of unnecessary medical
intervention in women’s reproductive systems[113-115]. The normalisation of hysterectomy also
underscores the complex negotiations between women’s agency and medically unindicated procedures,
as well as the ethical obligations of providers --- both of which require further consideration in the
Indian context[267, 271, 272].
The use of public facilities by over one-third of women in this setting suggests that profit alone is not the
most important driver of hysterectomy. However, health financing incentives may play a role in
promoting hysterectomy amongst low-income women. While SEWA insurance was not associated with
higher hysterectomy incidence–women and providers both cited its low benefit package as why it could
not be a financial incentive–research is required to investigate possible influences of higher coverage
packages offered by government schemes. Further, publicly-funded health insurance can arguably
skew the health system further away from primary care, as it only covers tertiary care procedures or
admission that exceeds 24 hours rather than outpatient services[314].
205
The characterisation of hysterectomy as both prophylaxis and treatment highlights the need to address
the physical and emotional burden of untreated gynaecological morbidity, as reported in several studies
in rural and urban India[151, 152, 274-277]. Providers’ practices in the private, government and trust
facilities were predominantly obstetric; they reported having neither the equipment, time, nor
experience to diagnose or treat gynaecological ailments. Moreover, the health system in Gujarat, as
reflected in policy documents and observation during this study, focuses on maternal and child health
without integrated reproductive and sexual health services at the primary level [169]. Without access
to timely treatment in a primary care setting, women likely approach gynaecologists when conditions
have become significantly more serious, and at a point when only surgical interventions are offered.
Faced with a lack of preventive services for cancer, hysterectomy appears to serve as a prophylaxis –
similar to findings reported in Mexico[315]. Lastly, the potential linkages between sterilisation–already
widely criticised for poor quality of care and coercive policies—and hysterectomy further emphasises
the need for comprehensive reproductive and sexual health services[283, 316].
Strengths and limitations
A primary strength of this study was its mixed methods design, which identified risk factors, suggested
pathways for associations, and raised new hypotheses to explain hysterectomy patterns in one setting.
The use of a cohort to estimate incidence, despite not being representative of all adult females, is an
important contribution to examining hysterectomy in India. The sample, however, was in a low-income
area which limits generalisability to different socioeconomic settings within India or to national
estimates in other countries. Similarly, health is a state subject in India and services vary accordingly;
these findings may be specific to the Gujarat health system. Self-reported hysterectomy is subject to
reporting error, although the short recall periods and importance of a major surgery likely limit recall
errors. Qualitative research may have been biased by the researcher’s affiliation with SEWA, as
interviewees may have felt differing levels of comfort based on their own relationship with the
organisation. Triangulation of results, therefore, provided another means to limit bias in identification
of determinants[207].
Conclusion
The burden of untreated morbidity, combined with attitudes towards the uterus and a health system ill-
equipped to manage women’s gynaecological health needs, has rendered hysterectomy both medically
206
rational and socially acceptable for low-income women. The incidence and determinants of
hysterectomy in this setting call for urgent intervention to curb its seemingly common use for conditions
amenable to less-invasive procedures. Improved access to sexual and reproductive health services
within primary health care services is a first step, including contraceptive choice to reverse the
predominance of sterilisation. Health education on gynaecological ailments and the potential side
effects of hysterectomy, as well as provider training (and health financing) for alternative procedures
also emerge as important needs.
Research at the population level on gynaecological morbidity and hysterectomy is required across India
to monitor trends, identify local determinants and track longterm health effects. Encouragingly, the
National Family Health Survey will initiate collection of population-based data on hysterectomy in its
next round, from which prevalence, facility choice and the association with health insurance can be
examined across settings and over time[317]. Unlike for caesarean sections, there is no globally
recommended appropriate rate of hysterectomy against which Indian trends can be compared[318].
However, experience in other settings suggests that national surveillance and medical audits can
evaluate appropriateness of the procedure and monitor misuse, as well as support development of
clinical guidelines[319, 320]. Most critically, a rights-based approach to women’s health is essential to
promote high quality prevention and treatment choices for women through the life cycle, rather than
‘permanent’ solutions.
207
Chapter IX. Process Evaluation
Introduction
After 18 months of the health education intervention, the cluster randomised evaluation detected no
evidence of an effect on utilisation of health insurance, hospitalisation or morbidity related to diarrhoea,
fever and hysterectomy. This chapter examines why the intervention did not have an effect, with a
focus on the intervention processes and outcomes related to hysterectomy. Although I did not conduct
qualitative research or analyse the intervention processes related to diarrhoea and fever, they are
briefly discussed at the end of this chapter.
Analysis of the trial data estimated an annual incidence of hysterectomy of 21/1,000 women in this
population, approximately four times higher than rates in the United States or Germany[33, 96].
Concurrently conducted qualitative research, presented in Chapter VIII, on the determinants of
hysterectomy suggested that a lack of treatment options – supported by beliefs amongst women and
providers that the post-reproductive uterus is dispensable – normalised hysterectomy as a ‘permanent’
solution for common gynaecological ailments.
The intervention was based on two assumptions: (i) health education was delivered effectively resulting
in increased knowledge and (ii) knowledge translates into behaviour change regarding treatment-
seeking for gynaecological ailments and hysterectomy. The approach to the intervention and evaluation
was to assess effectiveness within existing resources, rather than test efficacy through an intensive,
potentially non-scalable, intervention[321]. This process evaluation synthesises findings from the
evaluation, in-depth research on hysterectomy and mixed methods process data to explore whether and
how CHW-led group education can reduce the incidence of hysterectomy, with a view towards
improving practice.
Methods
As described in Chapter IV, the process evaluation was based on the principles of theory-based impact
evaluation as described by White (2009), particularly the use of a causal chain to understand how the
intervention was intended to have an impact, understanding context and use of mixed-methods[209].
208
Based on the conceptual framework initially designed with CHWs, I developed an intervention causal
pathway (Figure 9.1) after reviewing baseline findings and relevant literature. Quantitative and
qualitative data were collected and analysed at each step, to examine each assumption between inputs
and outcomes, such as: who actually participated in the intervention, whether implementation differed
from the intended plan, and changes in intermediate outcomes that may affected the final outcomes.
Findings from the in-depth qualitative study on hysterectomy (Chapter VIII) provided context on the
social, economic and health systems factors relevant to the intervention, as well as insight into barriers
and facilitators related to treatment-seeking for hysterectomy.
Data sources included: (i) CHW registers and monitoring data (ii) short interviews with 379 participants
to test message recall (iii) qualitative, in-depth interviews with ten participants, 14 CHWs and 2 program
managers (iv) household surveys utilised for the evaluation and (v) observation of intervention sessions.
Process data were interpreted in three steps. Data were: (i) assessed along the causal chain to identify
achievements and breakdowns (ii) contextualised with findings from qualitative research and (iii)
interpreted with a view towards improving practice. Different data sources were triangulated at specific
points in the causal chain, such as using both process and survey data to estimate outreach, or by
combining qualitative interviews and session observations to understand effectiveness. More detail is
found in Chapter IV.
Findings
Intervention implementation
Program managers related that the intervention was readily integrated within existing activities because
it was delivered by experienced, established CHWs. They had longstanding relationships in their
communities; there was no reported difficulty in recruiting women to attend sessions or building
rapport with participants. The senior project manager, who concurrently managed two long term CHW
initiatives, believed implementation surpassed other projects, largely due to comparatively more
intensive monitoring, collection of process data and ongoing research. “They [CHWs] had the mentality
that someone is going to come back and check, to ask us if the work had been done. So this was
different from regular projects – and the [output] results showed for it” Salma, project manager. “The
work on this project is more serious than our regular activities. On other projects, we do not have such
sustained and repeated inputs” (Pramilaben, CHW).
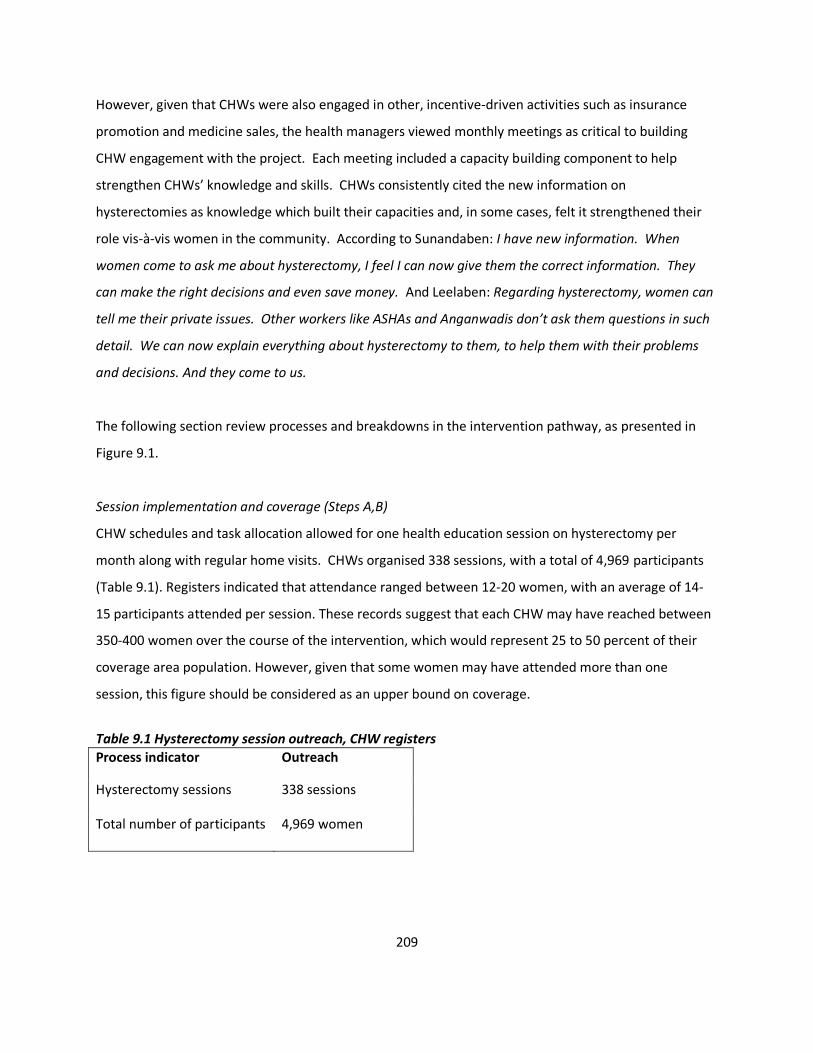
209
However, given that CHWs were also engaged in other, incentive-driven activities such as insurance
promotion and medicine sales, the health managers viewed monthly meetings as critical to building
CHW engagement with the project. Each meeting included a capacity building component to help
strengthen CHWs’ knowledge and skills. CHWs consistently cited the new information on
hysterectomies as knowledge which built their capacities and, in some cases, felt it strengthened their
role vis-à-vis women in the community. According to Sunandaben: I have new information. When
women come to ask me about hysterectomy, I feel I can now give them the correct information. They
can make the right decisions and even save money. And Leelaben: Regarding hysterectomy, women can
tell me their private issues. Other workers like ASHAs and Anganwadis don’t ask them questions in such
detail. We can now explain everything about hysterectomy to them, to help them with their problems
and decisions. And they come to us.
The following section review processes and breakdowns in the intervention pathway, as presented in
Figure 9.1.
Session implementation and coverage (Steps A,B)
CHW schedules and task allocation allowed for one health education session on hysterectomy per
month along with regular home visits. CHWs organised 338 sessions, with a total of 4,969 participants
(Table 9.1). Registers indicated that attendance ranged between 12-20 women, with an average of 14-
15 participants attended per session. These records suggest that each CHW may have reached between
350-400 women over the course of the intervention, which would represent 25 to 50 percent of their
coverage area population. However, given that some women may have attended more than one
session, this figure should be considered as an upper bound on coverage.
Table 9.1 Hysterectomy session outreach, CHW registers
Process indicator Outreach
Hysterectomy sessions 338 sessions
Total number of participants 4,969 women
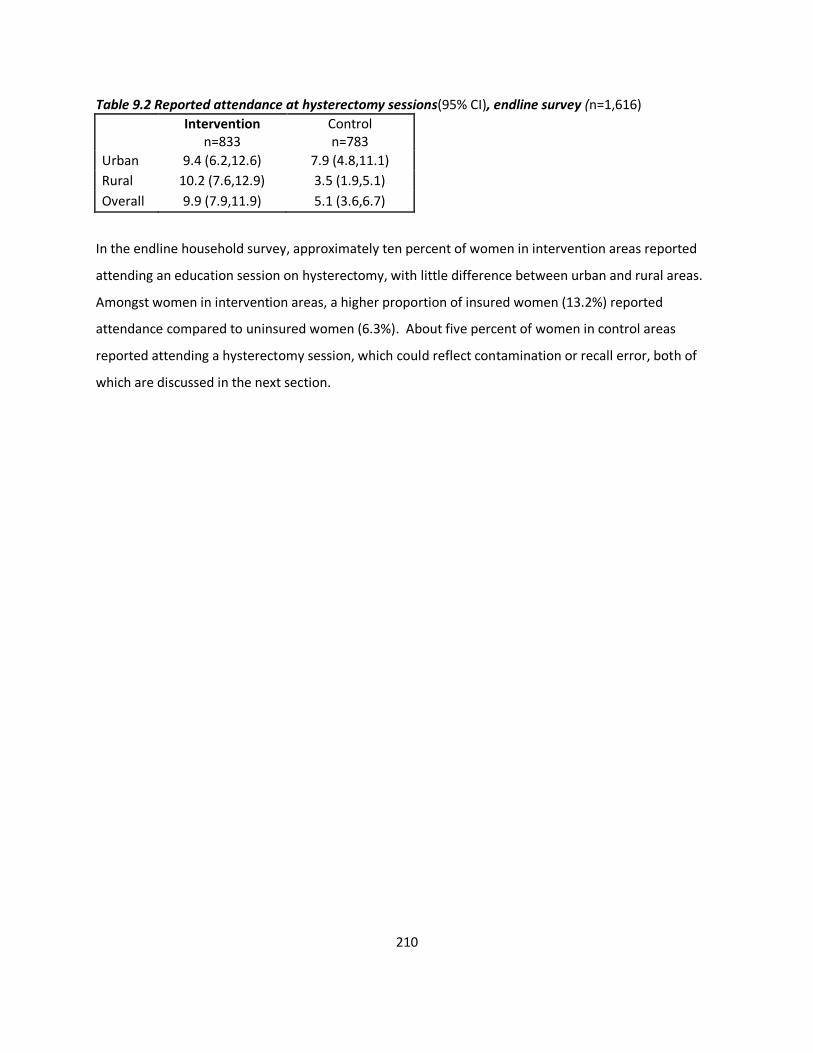
210
Table 9.2 Reported attendance at hysterectomy sessions(95% CI), endline survey (n=1,616)
Intervention
n=833 Control n=783
Urban 9.4 (6.2,12.6) 7.9 (4.8,11.1)
Rural 10.2 (7.6,12.9) 3.5 (1.9,5.1)
Overall 9.9 (7.9,11.9) 5.1 (3.6,6.7)
In the endline household survey, approximately ten percent of women in intervention areas reported
attending an education session on hysterectomy, with little difference between urban and rural areas.
Amongst women in intervention areas, a higher proportion of insured women (13.2%) reported
attendance compared to uninsured women (6.3%). About five percent of women in control areas
reported attending a hysterectomy session, which could reflect contamination or recall error, both of
which are discussed in the next section.
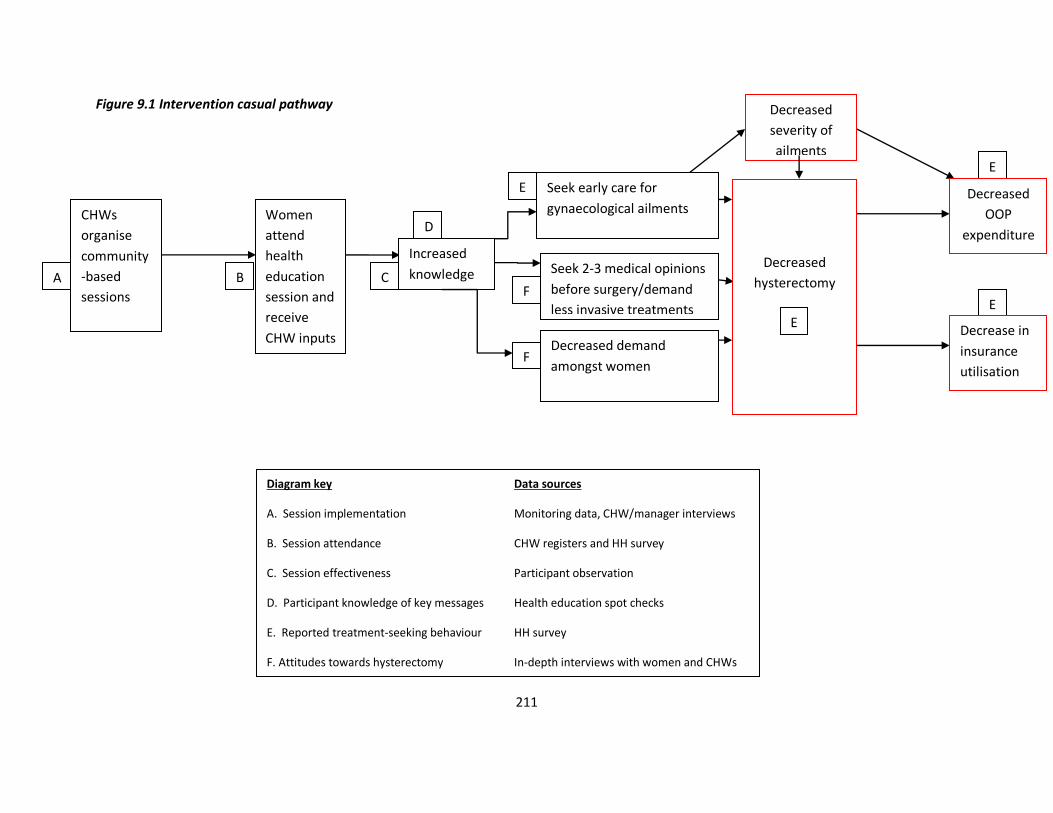
211
Figure 9.1 Intervention casual pathway
C
D
F
E
E
Diagram key Data sources
A. Session implementation Monitoring data, CHW/manager interviews
B. Session attendance CHW registers and HH survey
C. Session effectiveness Participant observation
D. Participant knowledge of key messages Health education spot checks
E. Reported treatment-seeking behaviour HH survey
F. Attitudes towards hysterectomy In-depth interviews with women and CHWs
Women
attend
health
education
session and
receive
CHW inputs
Seek early care for
gynaecological ailments
Increased
knowledge
Seek 2-3 medical opinions
before surgery/demand
less invasive treatments
Decreased demand
amongst women
Decreased
severity of
ailments
Decreased
hysterectomy
E
Decrease in
insurance
utilisation
Decreased
OOP
expenditure
B
E
F
CHWs
organise
community
-based
sessions
A
212
CHWs identified two primary implementation challenges. Logistically, finding space for group meetings
was often difficult or caused delays, particularly in urban slums where most spaces were too small.
Further, the film proved difficult to show during sessions. At first, CHWs depended on renting a DVD
player from a local home, as SEWA interventions had done in the past. Monitoring reviews however,
indicated that the film was not consistently used. Urban CHWs found rental feasible, while rural CHWs
experienced more difficulty with finding DVD players and with intermittent electricity. Mid-way through
the intervention, two DVD players were purchased for use during the project, to ensure availability was
not a barrier. Analysis of process data indicated that 142 sessions (42 percent) had utilised the film.
Session quality (C)
Most CHWs identified the media tools as the key difference between this intervention and their regular
activities. They felt the film in particular was potentially very effective, because it shared local women’s
stories and generated discussion. According to Seemaben, an urban CHW: “Many women are illiterate;
but they can see a film and understand everything” and Chandrikaben, a rural CHW with 22 years’
experience: After we showed the DVD, women who wanted to have a hysterectomy started to talk
about it, whereas they would not have earlier. Some even asked me if they could take it home to show
their children, to start a discussion at home. Bhanuben: “When we watch the DVD, we know that this is
real and happening to women around us.” Several CHWs also noted their satisfaction with the single
topic of hysterectomy in a session, rather than earlier health education programs that covered several
topics at once.
Early observations noted a lack of uniformity in meeting structures and content, partially due to
different delivery styles and communication skills. Thereafter, a communications consultant was
recruited and training focused on how to structure sessions and emphasise key messages through
multiple interactions. Some CHWs had much more experience than others providing health education in
groups, which appeared to help them hold an audience and deliver messages more effectively. Session
observations noted three main findings: (i) message quality improved after the additional training
sessions - a uniform, structured message was provided and reinforced by print media by most CHWs (ii)
sessions that included a film viewing had much livelier and engaged discussion than those without the
film and (iii) variation between CHWs was primarily related to delivery style, rather than session
213
content. Communication skills varied greatly, with no correlation with education or previous training.
Rather, we observed that some women had an innate skill, a sense of how to connect with others while
the remainder imparted information. Although the trial and subsequent analysis detected no evidence
of differences in incidence of hysterectomy across CHW clusters, qualitative observation suggested that
skills levels varied. When two CHWs, Ranjanben and Basantiben, were followed on their daily rounds, a
key difference that emerged was the level of community engagement and trust (See Box 9.1).
Short interviews – spot checks with two questions – with a sample of participants found that 82% of
urban women and 68% of rural women who attended a session recalled that hysterectomy is not the
only treatment option for gynaecological morbidity. 90% of both rural and urban women reported they
would seek at least two opinions before undergoing hysterectomy. There was no notable difference by
CHWs in responses; women in sessions facilitated by either Ranjanben or Basantiben had almost
identical recall scores. In-depth interviews with ten participants indicated that recall of messages was
generally consistent. Four women who were previously not aware of what a hysterectomy entailed
could explain the procedure and what organs would be removed. However, some did not recall:
Ramolaben, a participant in a session one month before I met her again: “I don’t know where the uterus
is. I remember the lady [CHW] telling us about the operation and what can happen, but the doctor
knows everything, we can just ask them…if a doctor says it has to be removed, then you have to remove
it.”
Eight women interviewed, none of whom had undergone hysterectomy, related that the opinion of
doctors would be the most important factor in such a situation. Recall of potential side effects was low,
and understanding of the risk of premature menopause was not clear amongst women interviewed.
Lalitaben, after attending a session, felt that “The CHW said we should not remove the uterus if not
necessary. But if someone has a problem, what else can we do? After the session, I would tell other
women in my family or village, if they can get treated by medicine that is better. If you remove the uterus
you can have other problems too, such as in sexual relations... but if someone has a lot of pain and
problems they may have to remove it, there is no other way. After you remove the uterus you can still
have pain and food won’t digest properly – gas will form.”
214
Two strengths of the sessions were identified as: (i) confidence in the local CHW as a resource person on
hysterectomy and (ii) the emphasis on the importance of seeking multiple opinions. Hansaben, a health
education participant, explained: “I learned that the period goes one day naturally; we don’t have to
remove the uterus for that. Some of our village women just get scared and remove it. After seeing
Ranjanben [CHW] speak, I realised that she will understand and be there to help if I ever have this
problem.” Education sessions were also seen as a catalyst for new conversations on hysterectomy that
can address women’s attitudes towards hysterectomy. CHWs also felt the information was discussed
not only between women but also in the home, now with detailed information on options and side
effects. Salma, the project manager, felt that “Women demand hysterectomies because they don’t have
complete information. Their demand is associated with many old beliefs. If they receive proper
information, there could be a change in demand.”
Box 9.1 Summary of two CHWs followed on daily rounds
Knowledge to behaviour change (Steps D-F)
Ranjanben, a SEWA CHW for over a decade, knew the name of every woman who had had a hysterectomy in her village Rampur and the surrounding four villages. When she walked through the area, women stopped her to ask questions, to request her help for a doctor’s visit, or just to invite her home for a chat. Almost every woman seemed to have a gynaecological complaint – white discharge, excessive bleeding, or pain. When she announced she was holding an education session, women quickly agreed to attend. During education sessions, it was common to have six to seven women stay on afterwards to discuss further with her and with each other. I observed three instances where she suggested and made plans to accompany a woman for a check-up. Ranjanben, who had herself had a hysterectomy several years ago, wished she had known more about hysterectomy earlier, as she felt it was a serious issue in the area. During her sessions, she used personal experience, diagrams and discussion to help explain reproductive anatomy and the implications of a hysterectomy. She made it a point to follow up on all questions, either after the session or at a woman’s home. Basantiben, also an experienced CHW, conducted daily rounds in her rural outreach area in a comparatively mechanical manner. Women stopped to ask her about an insurance claim or medicine sales, but not to ask questions about their health. She approached women or asked to visit them, but the discussion typically did not turn to gynaecological issues. She walked house-to-house to recruit women to attend sessions, often convincing them up until the last moment before the session. She employed the help of the local ASHA worker, who often stayed on in sessions and offered advice to women. Basantiben conducted the session competently, according to the session plan suggested in the trainings. She imparted the correct information, but several women left sessions before they concluded. Some women stayed on to discuss further, or to ask Basantiben to read their medical reports for them. I observed one woman request her help in seeking doctors’ opinions. Basantiben felt that she was performing an important service by teaching women about hysterectomy, but did not pursue the issue with the same vigour as Ranjanben.
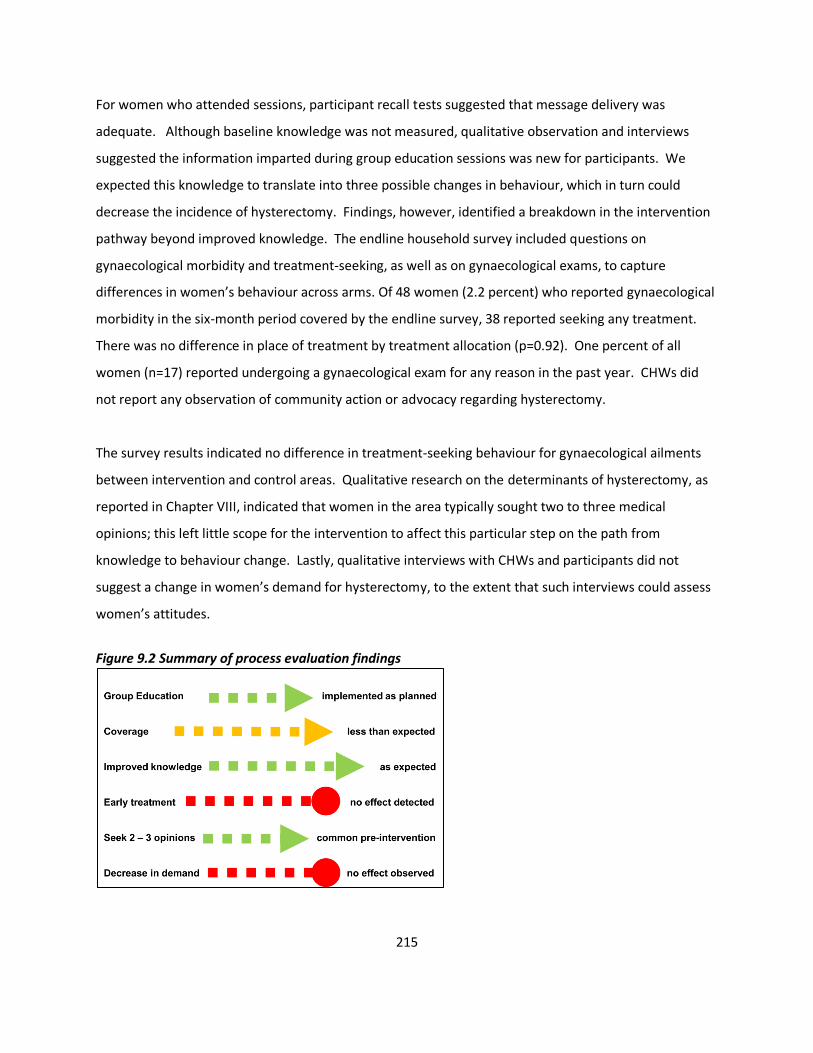
215
For women who attended sessions, participant recall tests suggested that message delivery was
adequate. Although baseline knowledge was not measured, qualitative observation and interviews
suggested the information imparted during group education sessions was new for participants. We
expected this knowledge to translate into three possible changes in behaviour, which in turn could
decrease the incidence of hysterectomy. Findings, however, identified a breakdown in the intervention
pathway beyond improved knowledge. The endline household survey included questions on
gynaecological morbidity and treatment-seeking, as well as on gynaecological exams, to capture
differences in women’s behaviour across arms. Of 48 women (2.2 percent) who reported gynaecological
morbidity in the six-month period covered by the endline survey, 38 reported seeking any treatment.
There was no difference in place of treatment by treatment allocation (p=0.92). One percent of all
women (n=17) reported undergoing a gynaecological exam for any reason in the past year. CHWs did
not report any observation of community action or advocacy regarding hysterectomy.
The survey results indicated no difference in treatment-seeking behaviour for gynaecological ailments
between intervention and control areas. Qualitative research on the determinants of hysterectomy, as
reported in Chapter VIII, indicated that women in the area typically sought two to three medical
opinions; this left little scope for the intervention to affect this particular step on the path from
knowledge to behaviour change. Lastly, qualitative interviews with CHWs and participants did not
suggest a change in women’s demand for hysterectomy, to the extent that such interviews could assess
women’s attitudes.
Figure 9.2 Summary of process evaluation findings
216
Discussion
This intervention was designed to decrease the incidence of hysterectomy through effective delivery of
health education by CHWs. There is limited research on the effect of group education in community
settings on adult health outcomes. Published findings (reviewed in Chapter II) suggest positive effects,
but their limited number also suggests publication bias. A review of research on health education
suggests that this intervention had potential to change behaviour, for three reasons. First, non-
randomised evaluations in India report increased health knowledge amongst women exposed to group
education [86, 87, 89]. Second, group health sessions have resulted in an increase in gynaecological and
breast cancer screening amongst minority women in the United States [69, 72, 322] – an encouraging
indicator given the intervention focus on hysterectomy. Third, CHWs have been shown to be uniquely
positioned to influence behaviour change, through their use of both indigenous knowledge and their
ability to communicate with empathy and locally appropriate language[323].
The delivery mechanism was aligned with two established characteristics of effective CHW programs:
SEWA CHWs were embedded in their communities and were supported through continuous training and
management inputs[50]. Implementation of the targeted number of intervention sessions occurred as
planned, with a range of communication tools. CHWs were able to recruit an adequate number of
women, capitalising on their established rapport in the community to provide education in a group
setting. Information was also disseminated through one-to-one visits and print pamphlets, and may
have spread through women’s interactions with each other socially and through SEWA. However, the
film– expected to be a critical component of the intervention–was only shown in 42% of education
sessions. In the household survey, the overall proportion who reported attendance was considerably
lower (13%) than reflected in monitoring reports (25%), suggesting that monitoring data overestimated
coverage due to repeat attendance or that the survey produced an underestimate of intervention
coverage due to recall error. If a woman did not recall attending a session, however, she was unlikely to
have retained its messages. Accordingly, the survey estimates may reflect effective programme
coverage in intervention areas. An estimated 10.5 percent of women in the population would have seen
the film, which is closer to the proportion who reported attendance in the survey.
217
Evaluation
Assuming that the (i) intervention with film reached 10 percent of the population at risk of hysterectomy
and (ii) the intervention effect was limited to women who attended sessions (iii) the intervention, if
effective, would not have prevented more than 50% of hysterectomies, there would have been, at most,
a 5% reduction in an annual incidence of 21/1,000 woman years, which corresponds to approximately
three cases over the study period. The evaluation was powered to detect a 40% reduction in
hospitalisation for three conditions (diarrhoea, fever, and hysterectomy). At baseline, hysterectomy
comprised 65% of hospitalisations for the three conditions. Given the actual coverage of the
intervention, had it been effective, the evaluation was not powered to detect the reduction in
hysterectomy which might reasonably be expected.
Further, about five percent of women in control clusters reported attending hysterectomy sessions,
which could reflect contamination – and thus further reason why the intervention could not detect an
intervention effect. Contamination through sessions conducted by control area CHWs was unlikely, as
only intervention CHWs were provided with media tools and training on hysterectomies. Women in
control areas may have attended sessions in intervention areas, either while visiting or due to
geographic proximity. In rural areas, distances between villages would likely have prevented geographic
contamination, as reflected in the difference in attendance reported across intervention and control
villages. However in urban areas, where slum pockets covered by CHWs are often contiguous,
contamination was more likely; the similarity in reported attendance across arms in urban areas
supports this possibility.
Some reporting by women in control areas may have also been due to recall error, such as confusing
attendance at hysterectomy sessions with routine health education programs. If this type of recall error
was similar across intervention and control areas, we may have overestimated coverage in the
intervention clusters. It is also possible that the nature of recall error differed between control and
intervention areas. For example, women in control areas may not have been aware of hysterectomy
sessions and therefore more likely to confuse them with other education programs, whereas women in
intervention areas were aware of hysterectomy sessions and less likely to misreport attendance if they
did not attend. The difference in urban and rural reporting patterns appears more consistent with the
explanation that control area attendance was due to contamination, although some degree of recall
218
error cannot be ruled out. Further, insured women in intervention areas reported higher attendance in
intervention areas compared to uninsured women, which suggests that they may have been more
receptive to education sessions, had greater contact with SEWA CHWs, or reported differently than
uninsured women.
Barriers from knowledge to behaviour change
The intervention pathway expected women, equipped with knowledge of hysterectomy and supported
by the local CHW, would: (i) seek early care for gynaecological ailments; (ii) seek at least two medical
opinions before undergoing hysterectomy; or (iii) re-consider their own demand for their procedure in
the light of the potential adverse side effects. Although knowledge of hysterectomy was observed
amongst participants, the process evaluation indicated breakdowns in its translation into behaviour
change (Figure 9.2). The low intensity of the intervention may have limited its effectiveness in changing
care-seeking. CHW-led group education efforts in other settings, such as interventions to promote
breast cancer and cervical cancer screening in the United States, relied on two group sessions –
suggesting that low number of meetings could trigger changes in behaviour [69, 73]. However, the
intervention outcome was receipt of either a pap test or mammography–one time, preventive actions
with logistical support by a CHW and availability of health services—as compared to this attempt to
change treatment of gynaecological morbidity and attitudes towards hysterectomy in a setting with
limited treatment options. A lifestyle intervention to reduce cardiovascular risk which reported
evidence of behavioural and clinical changes was premised on eight sessions and targeted individual
follow up, an approach which may have been more relevant to this setting[74]. Similarly, there is a
moderate body of evidence that supports the effect of home visits by CHWs as a tool to change
behaviour[42, 324]. Although CHWs’ existing responsibilities and limited resources prevented a more
intensive intervention, more structured individual follow-up and home visits could have potentially been
included.
Health system factors and social attitudes may have impeded the translation of knowledge into changes
in treatment-seeking behaviour or attitudes towards hysterectomy. Findings from qualitative research,
detailed in Chapter VIII, conducted with women who had undergone hysterectomy identified several
barriers. For example, the local health system offered limited choices outside of hysterectomy to treat
gynaecological ailments in low-income women. Interviews with providers, as well as earlier research by
219
SEWA, had identified a lack of skills and equipment to conduct less invasive procedures [236]. Further,
providers expressed a preference towards hysterectomy as a one-time solution for rural, low-income
women with gynaecological ailments, attributed to a systemic focus on maternal health services and
beliefs that low-income women would not attend follow-up visits required for other procedures. Thus,
even if increased knowledge had led to demand for less invasive procedures, women were unlikely to be
offered such treatment within the existing health system. Interviewed women related that providers’
opinions were paramount in the decision to undergo hysterectomy. Although women typically sought
two to three opinions, most providers in the area regularly advised hysterectomy as first or second-line
treatment for a range of gynaecological ailments, effectively leaving women with limited options.
Qualitative interviews also suggested that women’s demand for hysterectomy appeared to be linked to
attitudes towards the uterus and the desire to treat painful, often untreated ailments. In-depth
interviews with women who had undergone hysterectomy revealed that most believed the uterus was
dispensable after childbirth. Providers’ views and advice to women encouraged and supported this
view, contributing to the normalisation of hysterectomy as treatment for common gynaecological
ailments. Moreover, quantitative analysis indicated that low-income women underwent hysterectomy
at higher rates. Most women in this area were low-income, daily wage labourers who explained that
they chose to undergo the procedure to preserve their own health and productivity, which had suffered
due to ailments marked by excessive bleeding and pain. In light of limited treatment options,
hysterectomy emerged as an inevitable, pragmatic decision driven both by women’s economic and
health circumstances.
Implications for practice
In a setting with limited knowledge of hysterectomy, CHWs played a natural, sustainable role in
disseminating information. CHW-delivered education was not limited to group meetings; discussions
continued through casual conversation, road-side meetings and individual follow ups in women’s
homes. Education also spilled over into other activities such as referral to services and accompanying
women through the treatment-seeking process. Coverage of the intervention was low, however, which
may have contributed to our failure to detect evidence of an effect. Stronger logistical coordination to
ensure film viewings and a greater number of sessions may have reached more women.
Implementation realities of community-based work, however, presented challenges. For example,
220
intermittent electricity or lack of space for meetings in urban slums required creative solutions or
different intervention delivery mechanisms. The intervention only included one session per month on
hysterectomy because SEWA CHWs were already fully tasked with existing responsibilities and
potentially overburdened – a common challenge to CHW programs – which prevented further outreach
[50]. In-person monitoring of sessions by supervisors would likely have improved delivery quality.
However, financial limitations prevented the recruitment of additional supervisors, and SEWA was
committed to a fully scalable intervention in which existing human resources would be employed.
Our findings also suggest the need to reconsider the intervention focus on individual behaviour change
regarding hysterectomy. Unlike an intervention aimed at handwashing or breastfeeding, wherein
individual action can directly affect health outcomes, treatment-seeking related to hysterectomy is
dependent on health system options, provider practices and women’s socioeconomic circumstances.
Breakdowns in the intervention pathway suggest that, even with improved coverage, an approach
premised on individual action alone would have been insufficient. Recognising the broader
determinants of hysterectomy, this intervention could have utilised CHWs’ positions and group
education processes to address the normalisation of hysterectomy or instigate collective action for
improved gynaecological services. For example, CHWs supported women through treatment-seeking
processes and linked them to other women who have undergone the procedure – creating an informal
network of knowledge and resources. Led by CHWs such as Ranjanben, these networks could have
coalesced eventually into a local movement to demand better health services for women. However,
one session is unlikely to be a sufficient catalyst; the intervention would have required an explicit focus
on CHW-led community action. However, variation in CHW engagement and skills may limit the
effectiveness of an approach dependent on CHWs alone.
Diarrhoea and fever
Although the focus of this process evaluation was hysterectomy, I briefly consider how the intervention
may have had an effect on behaviour related to diarrhoea and fever. Unlike hysterectomy, prevention
of these conditions has been demonstrated to be amenable to individual behaviour change, such as
through handwashing with soap or use of mosquito repellent[325-327]. The baseline survey suggested
that there was potential for health education to address preventive behaviour. While almost all
households reported having soap in their homes, only half (47% rural, 57% urban) of women at baseline
221
reported washing their hands with soap after using the toilet. Close to one-quarter of rural and urban
households reported not taking any precautions against mosquitoes. Qualitative observations of
diarrhoea and malaria sessions, conducted by a SEWA colleague, suggested that message delivery was
adequate but varied by CHW, as found for hysterectomy. Government and television media also
delivered messages on these conditions, albeit sporadically.
At endline, there was no observed difference in reported behaviour regarding handwashing and use of
mosquito repellent, neither between intervention and control areas nor as compared to baseline.
Interventions that have demonstrated evidence of an effect on both handwashing and mosquito
repellent were considerably more intensive campaigns that included distribution of soap or repellent. A
handwashing campaign in Karachi, Pakistan that included weekly education as well as soap distribution
reported a sustained effect on handwashing with soap, while a rural Indian education-only intervention
did not detect evidence of improved behaviours[325, 326, 328]. Further, reviews of interventions to
promote handwashing suggest that knowledge transfer may not be sufficient; emotional messaging or
creation of new social norms, for example, may be more effective[329]. Regarding mosquito repellents,
evidence is limited, though an intervention in Pakistan that distributed DEET mosquito repellent
reported a decrease in infection with p.falciparum, but not p.vivax, malaria[327]. The intervention did
not evaluate health education without distribution of repellent, however. Based on these findings, it
appears that SEWA’s education sessions without distribution of soap or malaria prevention tools may
not have been intensive or innovative enough to trigger a change in behaviour.
CHWs identified several barriers to an intervention effect. Interviews with CHWs revealed that women
did not want to waste soap on handwashing; it was expensive and reserved for bathing. Distribution of
soap, therefore, was suggested for future interventions in addition to continued handwashing
education. Further, CHWs felt that contaminated water supply due to poor sewage systems presented
an intractable challenge to diarrhoea prevention, as women could not afford to boil drinking water.
Regarding malaria-related fevers, CHWs reported that uptake of repellents was patchy and irregular,
also due to perceived expense. As with diarrhoea, they pointed to lack of implementation of
government-led initiatives such as spraying and cleaning. The intervention design would have
benefitted from formative research amongst women on causes of diarrhoea and fever, potentially
innovative methods to change behaviour, barriers to translation of knowledge into behaviour, as well as
222
a stronger advocacy component to address structural determinants such as water supply and anti-
mosquito measures with the government.
Alternative approaches to health education
An alternative approach that departs from CHW-led health education has been illustrated by
interventions with women’s groups in South Asia and Malawi to improve neonatal and maternal health
outcomes. Premised on promotion of critical consciousness rather than one-way health education, the
interventions involved facilitated learning cycles with women’s groups, using interactive tools and joint
action to address both demand for and supply of health services [330]. The trials in Nepal and India
reported reductions in neonatal mortality of 30% and 45%, respectively and a reduction in moderate
maternal depression in India compared to control groups[330, 331]. Both evaluations cited the design
focus on the participatory learning process and community action as key factors in reducing neonatal
mortality. The Nepal team also identified provision and dissemination of health information as
important in changing women’s behaviour[80]. Although the authors explicitly distinguished between
this participatory model and a CHW-led approach, they also questioned, as the Nepal intervention was
implemented in conjunction with government CHWs, if a similar impact would have been found in
CHWs’ absence[330]. An effort to scale-up this intervention model to a larger population in
Bangladesh, however, did not report an intervention effect. The project team identified lack of an
intense focus on community participation and wide geographic coverage of women’s groups as gaps
that precluded an impact[332]. Learning from these experiences, SEWA could have utilised group
sessions to examine hysterectomy in the community and considered an approach that facilitated
collective action towards improved services and financing mechanisms, for example. As members of
India’s largest organisation of women workers, CHWs and local SEWA leaders were well-positioned to
facilitate advocacy at the local and state level, had that emerged as a demand from group meetings.
However, this approach would have entailed more time from CHWs and frequent meetings between
women, which was not feasible within their current task loads.
Another approach to CHW-led group health education is interventions that integrate health education
with microfinance groups. These interventions are relevant in this case for two reasons. One, most of
SEWA’s members are also microfinance clients; health education could feasibly be delivered in tandem
with financial services on a regular basis. Second, women who underwent hysterectomy cited the
223
insecurity of daily wage earnings as a reason to pursue a quicker, permanent solution to gynaecological
ailments rather than longer-term treatment. Thus financial security to the extent provided by
microfinance could potentially support women in negotiating, or financing, different treatment options.
A recent review of studies using a variety of designs suggests a generally positive effect of health
education on knowledge and some improvement in service utilisation and health outcomes amongst
microfinance clients, while noting that more rigorous research is required in this field[82]. In South
Africa, a randomised evaluation of a microfinance and group health education intervention reported a
55% reduction in reported intimate partner violence, with no effect on the two other primary outcomes,
unprotected sexual intercourse or HIV incidence[83]. The higher reported attendance of insured
women suggested that CHWs may have had greater traction amongst women linked to SEWA through
other services, or that insured women were more receptive to group education. In either case, this
finding supports approaches that capitalise upon inter-linkages between existing programs. However,
while an integrated microfinance-health education intervention would build on SEWA’s existing
activities to reduce the economic vulnerability that may promote permanent interventions, it could not
address the lack of treatment options available to women.
Although these two approaches could address structural and health systems determinants of
hysterectomy, the lack of knowledge about hysterectomy suggests that health education remains a
necessary, though not sufficient, intervention in this setting. Our findings suggest that CHWs may not
be the most effective medium, however, in light of time constraints and variation in communication
skills. Mobile technology could potentially standardise and support CHW-led health education efforts
[333], although benefits would have to be considered against financial investment required. Mass
media interventions are one alternative that does not depend on CHWs. Evaluations have reported
moderate evidence for an effect of mass media on health behaviours when situated within multifaceted
interventions [334]. Further, a systematic review suggested that mass media tools can have an effect on
reproductive health behaviours in low-income settings, most commonly contraceptive use[335]. Most
specific to this intervention, a 1984 mass media campaign to reduce hysterectomy rates in Italy
observed a 26% decrease in hysterectomy rates, compared to a 1% increase in a control area with no
education intervention[336].
224
Aside from the delivery mechanism, a theoretical basis for interventions has been identified as critical
for effective health education programs. This health education intervention would have benefited from
an explicit model for behaviour change, as well as an ecological, rather than individual-centric, approach
to reducing hysterectomy. Accordingly, SEWA CHWs’ position as bearers of both technical knowledge
and indigenous experience could have been better capitalised upon through a role as educator-
advocates in the community.
Strengths and limitations
Strengths of this process evaluation included the use of a theoretical framework to examine
assumptions in the causal pathway and the use of multiple sources of data. In-depth qualitative
research provided critical insight into the context and barriers to the intervention, while process data
allowed for assessment of whether and to what extent implementation was achieved. One limitation to
the data was the lack of baseline information on knowledge of hysterectomy; participants’ knowledge in
post-session interviews may not have been attributable to the intervention. Further, verification of
attendance data with names of survey participants may have improved estimates of intervention
coverage. Lastly, my role in designing and implementing the initial stages of the intervention may have
biased interpretation of observations, although insider status may have also allowed for greater
understanding of implementation processes. Interviews with CHWs, similarly, may have presented a
desired picture of the intervention due to previous working relationships.
Approaches to process evaluation
This process evaluation drew from the principles of “theory-based impact evaluation” to identify and
evaluate each step in the causal chain using quantitative and qualitative methods[209]. A 2013 review
of process evaluations of cluster randomised trials, noting that there is no single approach to process
evaluations, suggests that more structure is required in their design and reporting[337]. A proposed
framework includes (i) evaluation of both individual and cluster-level processes (ii) documenting context
pre-intervention and (iii) evaluating the theoretical model of an intervention and its implementation,
with clear rationale provided for specific processes and methods chosen by researchers. In another
approach, Pawson and Tilley’s theory of realist evaluation provides a framework that highlights the
importance of mechanisms and context in understanding intervention outcomes[338]. Realist
evaluation—based on the configuration “Outcomes=Mechanism + Context”—explains what
225
components, for whom and how an intervention may generate change, by focussing on the actors
targeted in the intervention, within their specific conditions and social reality. Based in a realist
evaluation approach, Wight and Obasi suggest four key areas of data collection and analysis to structure
a process evaluation: (i) extent and quality of programme delivery (ii) intervention mechanisms (iii)
context and (iv) differential responses of target groups[339]. Focusing on these four aspects allows for
consideration of how design and implementation could have been improved, while calling attention to
how interventions are linked to their cultural social, economic and cultural context.
This process evaluation focused on the extent and quality of implementation at the individual level, with
some analysis of CHW-level variation and differential responses of insured and uninsured women.
Intervention context, although provided retrospectively by qualitative research on hysterectomy, should
have been considered for all three conditions as part of the intervention design as well as during the
process evaluation. Further, more focus on intervention mechanisms, both theoretically and
empirically, would have provided important insight into this intervention, as well as informing future
programmes. Lastly, the use of both quantitative and qualitative methods specific to the process
evaluation could have been strengthened by considering the sequence, such as conducting qualitative
analysis before the intervention outcomes were evaluated[340].
Conclusion
A cluster randomised trial and this process evaluation indicated that SEWA’s CHW-led intervention did
not result in a detectable change in hysterectomy incidence. Observations suggested that the
intervention at best supported women in making informed decisions, albeit strongly constrained by
limited health system options. Future interventions can capitalise on the potential of CHWs as social
catalysts to address demand and supply of health services, in addition to or in place of information
dissemination. The lack of knowledge amongst women about hysterectomy calls for continuation of
community-based health education efforts, although not necessarily through CHWs. Along with
information, a comprehensive approach that addresses provider practices and health system priorities is
required to expand options available to women for gynaecological treatment.
226
Chapter X. Conclusion
I. Summary of findings This thesis examined three interrelated questions: (i) the effect of a CHW-led group health education
intervention on treatment-seeking behaviour and morbidity related to diarrhoea, fever and
hysterectomy (ii) the influences on, and predictors of, the decision to undergo hysterectomy and (iii)
how hysterectomy could be affected by a health education intervention. Since hysterectomy was
the leading reason for hospitalisation, understanding why women undergo the procedure was
critical to assessing whether and how a health education intervention could be effective in this low-
income setting in Gujarat, India.
CHW-led health education intervention
SEWA implemented a CHW-led group health education intervention for 18 months in rural and
urban Gujarat, amongst VimoSEWA-insured and uninsured women. The primary intended outcome
of the intervention was a reduction in insurance claims amongst VimoSEWA-insured women related
to diarrhoea, fever and hysterectomy. Secondary outcomes were reduced hospitalisation and
morbidity amongst insured and uninsured women for the three conditions. The VimoSEWA claims
database tracked claims amongst insured women, and four rounds of a household survey collected
self-reported morbidity and treatment-seeking history amongst a sample of insured and uninsured
women over two years. At baseline, both data sources confirmed that hysterectomy, diarrhoea and
fever comprised the majority of claims and reported hospitalisation events in the six months
preceding the intervention.
The intervention was evaluated by a cluster randomised trial in 28 clusters, in which 14 CHWs were
randomised to implement the intervention. They implemented group education sessions on the
three conditions, using communication tools that included a film and participatory games. The
evaluation did not detect evidence of an intervention effect on claims, hospitalisation or morbidity
related to fever, diarrhoea and hysterectomy, although the results do not rule out the possibility of a
smaller effect than expected. There was no evidence of effect modification by insurance status or
urban/rural location.
A process evaluation focussed on hysterectomy, the leading cause of hospitalisation, indicated that
the coverage and quality of the education sessions was lower than expected, and varied by CHW.
Qualitative research suggested that health education had the potential to improve women’s
227
knowledge and reduce demand for hysterectomy. Their treatment-seeking decisions, however,
were limited in practice by a lack of treatment options for gynaecological ailments. The
intervention focused on individual behaviour change, but did not address the health system and
social factors that normalised hysterectomy. SEWA’s intervention could have been strengthened by
capitalising on CHWs’ potential to influence community action, as well as by considering long-term
interventions focussed on providers’ behaviour and advocacy for comprehensive women’s health
services.
Insured and uninsured women
The household surveys provided important insights into women’s treatment-seeking behaviour and
enabled comparisons between insured and uninsured women. At baseline, Vimo-SEWA insured
women were slightly older, more likely to be employed, and widowed, and in rural areas, less
educated that uninsured women. Insured women were more likely to perceive their own health as
average, compared to uninsured women who tended to report higher levels of very good health.
However, reported recent morbidity, type of illness and outpatient treatment were similar among
insured and uninsured women. There was strong evidence of higher odds of hospitalisation
amongst insured women, for all causes. These findings suggest that insured women behave
differently when making health care decisions, as seen in higher utilisation of trust hospitals, for
example. Since VimoSEWA only covers hospitalisation events, adverse selection and/or provider
moral hazard cannot be ruled out as explanation for these patterns.
Findings over the intervention period suggest further differences between insured and uninsured
women. Over the four survey rounds, a notably higher decrease in reported hospitalisation
amongst insured women, but not in the claims database, suggested that insured women recalled or
reported treatment differently than uninsured women. Also, insured women reported higher
attendance at intervention education sessions than uninsured women. They may have been more
receptive to CHW activities as a result of active SEWA linkages through VImoSEWA’s programs.
Alternatively, insured women may have been more inclined towards preventive health education,
due to different characteristics that led them to enrol in VimoSEWA in the first place. Insurance
status, however, was not static or continuous: the majority of women insured at baseline did not
renew their insurance the next year. This research points to the need for further investigation of
associations between insurance coverage and women’s health care decision-making processes.
228
Hysterectomy
Hysterectomy was the leading cause of hospitalisation for uninsured and insured women. Analysis
of the study cohort over two years provided the first estimate of hysterectomy incidence in India–
20.7/1,000 woman-years – which is considerably higher than that reported in high-income settings.
Qualiative research amongst women, providers and other key informants suggested that women
decided to undergo hysterectomy to preserve their productivity as workers and caregivers, in a bid
to achieve freedom from future risk. The health system and providers offered few options for low-
income women to treat gynaecological ailments. Combined with a common view that the uterus was
dispensable post-childbearing, hysterectomy was a normalised treatment option for menstrual
irregularities, fibroids and cysts for women in their mid-thirties. Women sought two to three
opinions, typically in both public and private hospitals, before undergoing hysterectomy.
Approximately two-thirds of women reported utilising private services for hysterectomy. The
remainder utilised government hospitals, while a small proportion opted for non-profit trust
hospitals. Average reported out-of-pocket expenditure for hysterectomy was considerably higher
than a household’s monthly income; almost all women who utilised private or trust hospitals
reported borrowing funds to finance treatment.
A mixed methods analysis identified predictors and determinants of hysterectomy in this setting.
There was strong evidence that incidence of hysterectomy was higher amongst lower income
women and women who had completed childbearing, with no evidence of a difference between
insured and uninsured women. Women’s financial insecurity and provider attitudes towards low-
income women converged to favour hysterectomy as a one-time permanent solution, rather than
longer term, less-invasive options for gynaecological ailments. Women who had previously
undergone tubal ligation reported higher rates of hysterectomy, which could reflect higher biological
vulnerability to gynaecological morbidity associated with sterilisation, as well as women’s own
predisposition towards one-time surgical interventions.
A relatively low mean age at the procedure (36 years), along with the health implications of early
menopause, supports the case for interventions in this setting to reduce medically unindicated
hysterectomy. Education on hysterectomy remains an important need for women to make informed
decisions, provided options are available to them. Improvement in the availability and quality of
women’s health services, including family planning options beyond sterilisation is critically required
– as well as efforts to address attitudes towards dispensability of the uterus – to reverse the
normalisation of hysterectomy
229
II. Strengths and limitations
This research study, on the whole, benefited from being embedded within a grassroots women’s
health program. The intervention, had the evaluation detected evidence of an effect, would have
been scalable and sustainable within SEWA. In light of a relatively low budget, the intervention and
evaluation were designed to test effectiveness within an existing program, rather than efficacy of an
intervention that would have required higher investments in human resources for dedicated
implementation support and supervision[321]. While leaning towards effectiveness may have
limited the quality of implementation or monitoring – which may have resulted in lower coverage of
film viewings or limited data on participants – the intervention was implemented in ‘real-life’
conditions relevant for CHW programs in low-income settings outside of Gujarat. Implementation
lessons, such as the difficulty of tracking addresses in informal settlements, are likely to be widely
applicable to community-based organisations in similar environments.
Another strength of this study was its mixed methods approach to understanding where the
intervention had succeeded and failed. The combination of a cluster randomised trial and
quantitative and qualitative process data collection enabled rigorous evaluation along the
intervention causal pathway. Findings at each point of the causal chain, such as the extent of
coverage, effectiveness of health education on recall and effect on treatment-seeking behaviour,
were individually relevant for the implementation of CHW-led health education in other settings.
The synthesis of findings allowed for a comprehensive understanding of whether, how and why the
intervention could have an effect on women’s health and treatment-seeking behaviour in this
setting. Similarly, the use of a mixed-methods approach to hysterectomy enabled examination of
incidence, predictors and determinants within their social and cultural context.
The findings on hysterectomy also provided in-depth insight into drivers of women’s behaviour
regarding the procedure. It identified roots of women’s actions and intention and the role of their
social and cultural environment in shaping behaviour, as well as the processes by which they sought
health care. These findings provide critical information required for a comprehensive, theory-based
behaviour change intervention to reduce hysterectomy. For example, an intervention rooted in
social cognitive theory may be developed to address the multiple layers of influence on women’s
behaviour regarding hysterectomy, particularly the social and health systems factors that drive
individual behaviour. The findings from this study also underscore challenges when designing
theory-based behaviour change interventions, such as acknowledging the competing interests in
230
women’s lives who work in the informal economy and the importance of deep-seated, religious
notions such as menstrual pollution in shaping individual decisions.
Limitations of the study related both to the design process and the evaluation. The lack of an
explicit theory of behaviour change and for the intervention limited both the quality of the
intervention as well as process assessment of its outcomes. Applying a behaviour change model
from the outset may have strengthened the quality of the intervention, as well as flagging the need
for more qualitative/formative research before the intervention was implemented. Further, the
interventions would have benefitted from more in-depth consideration of the available evidence.
Although some evidence supported the promotion of handwashing and insect repellent, feasibility in
this context may have called for a different approach, such as distributing soap through social
marketing or linking with government promotion of bed-nets. The evaluation design could have
been strengthened by accounting for attrition and survey fatigue when estimating sample size. The
evaluation utilised self-reported data in the household survey, which may have been subject to recall
error. Specific steps that could have been taken to improve the intervention and evaluation design
are discussed in the next section.
Lastly, my role in the study was both an advantage and a potential source of bias. Several years’
experience working with SEWA strengthened my ability to understand the context of the
intervention. Insider knowledge and comfort with CHWs allowed me to ask questions and observe
situations in a manner that an outsider may not have been able to. Understanding nuances of the
implementation in this setting helped me to identify potential intervention breakdowns and elicit in-
depth responses from CHWs. However, my position as a former supervisor may have biased
observations and interpretation of some findings. CHWs may have not felt comfortable sharing
weaknesses or interacting with me as a researcher rather than colleague. My interpretation of
results may also have been biased as a result of my own closeness to the intervention and
organisation. I aimed to limit bias by employing reflexivity, resigning from an implementation role,
and limiting my engagement thereafter to that of a researcher, rather than manager. Moreover, the
analysis utilised multiple sources of data, in an attempt to reduce bias and strengthen interpretation.
231
III. Reflections
I was in the fortunate position of identifying research questions and pursuing a PhD after being
involved in grassroots implementation of women’s health programs. By conducting a range of
analyses – a cluster randomised trial, cross-sectional survey, cohort study, qualitative research and
intervention process evaluation – I was able to synthesise findings from multiple perspectives, while
gaining rigorous research training. Stepping back, however, I also recognise there were several
aspects of the intervention design and research that I would approach differently in the future.
Intervention design
The health education interventions were designed to address three leading causes of hospitalisation
claims using SEWA’s existing resources. This approach ensured that the interventions, if effective,
could be sustained and expanded to a larger population. Given resource constraints, however,
focussing the interventions on one condition may have improved coverage and quality, as well as
allowed for a more in-depth intervention. For example, had only hysterectomy (as the leading
reason for hospitalisation) been addressed, CHWs could have organised more sessions and reached
more women. Further, in-depth research on the determinants of hysterectomy should have been
conducted before the intervention design, to provide perspective on required interventions, causal
pathways and potential barriers. Addressing only one condition would also have allowed for a
wider range of interventions within existing resources. Multiple forms of health education could
have been developed, for example, which may have mitigated the dependence on inconsistent film
viewings. This approach, however, would have required a larger sample size – and potentially higher
budget – to detect an effect on the incidence of hysterectomy
A more rigorous, evidence-based approach to the intervention was required to identify intervention
content and feasible delivery mechanisms. Adoption of an explicit theoretical framework for
behaviour change from the outset, such as a social cognitive or health belief model, would have
strengthened both the design and evaluation of the intervention, even within limited resources.
Although the pressures of implementation often favour a heuristic approach to interventions (in my
experience), this project should have taken better account of the evidence base, albeit limited, on
CHW-led group education. We could have considered a combination of home visits and group
education, more intensive contacts, or alternative forms of non CHW-led health education. Lessons
learnt from participatory women’s groups could have been applied in this setting, to capitalise on
CHWs’ potential to catalyse community action or affect women’s attitudes towards hysterectomy,
232
although this would have required a much more intensive intervention. A targeted approach to
hysterectomy to women outside of CHW-led sessions could have also been considered, such as
outreach with women attending health clinics for gynaecological ailments.
Evaluation approach
A cluster randomised trial represents the most rigorous approach to evaluate the causal effects of an
intervention, provided design and number of clusters are appropriate. The project budget –
approximately USD 200,000 over three years – was considerably lower than most evaluation studies;
the evaluation is testament to the capacity of community organisations to conduct rigorous trials.
However, the project could have managed data resources differently. Use of the VimoSEWA claims
database was a cost-effective opportunity to address limitations of survey data, but its potential was
not maximised. A data analyst should have been allocated to cross-verification of reported
hospitalisation amongst insured women between the VimoSEWA database and household survey.
Linked analyses between the database and survey could have also provided insight into recall errors
and women’s selective use of insurance benefits. Similarly, improved monitoring data on
participants could have estimated double-counting, provided demographic information and helped
limit contamination. While contamination is a potential factor for any study with a concurrent
control group, careful monitoring and follow-up with participants in this case may have identified
whether women in control areas attended education sessions.
A baseline survey conducted earlier in the design process would have provided baseline
hospitalisation rates and a better estimation of k – both of which could have improved power
through a higher sample size per cluster, to the extent budgetary limitations would have allowed.
Relevance of the findings was assured, as the intervention and studies emerged from concrete needs
articulated by women, CHWs and VimoSEWA. However, although VimoSEWA identified a 30-40%
reduction in claims as worthwhile for an intervention, the baseline survey reported a small number
of hospitalisation events per cluster, suggesting that this level of reduction was likely unrealistic.
Further, the evaluation may have been too ambitious in its aspiration to address three ailments,
across both urban and rural populations and amongst both insured and uninsured women. Focus on
one condition may have allowed for stronger interventions, better implementation monitoring and
improved analyses. Evaluation of the effect on one condition would have enabled cross-verification
and triangulation of several data sources such as hospital records, resulting in in-depth findings that
could inform both women’s health policy and practice. Limiting the intervention to either a rural or
233
urban setting may have limited contamination and improved monitoring, but would have decreased
the number of clusters for the evaluation.
In conclusion, while recognising the myriad issues raised by the initial claims analysis, in the future I
would adopt a comparably narrow topic focus for the intervention and research studies. This
research demonstrated to me that adopting a ‘feminist epidemiology’ approach in practice – one
that (i) determined intervention priorities through examining women’s overall hospitalisation
patterns (ii) reported on morbidity, treatment and expenditure (iii) identified predictors and
underlying social, political and cultural determinants and (iv) focussed on women at each stage–
required not only a mix of methods but also a commitment to understanding one issue in-depth in
this study. In light of the budget, a focussed approach may have improved quality and feasibility of
the intervention and evaluation, without compromising on the mix of methodological approaches
utilised to understand and address women’s health.
IV. Contributions to research, policy and practice
CHW-led health education
This study contributes to the evidence base on CHW-led group education in low-income settings.
The lack of evidence of an effect and the process findings highlight important factors to consider
when implementing such interventions. Given the variation of CHW definitions across settings,
description of their roles should be part of design and evaluations, ideally through observation. By
following CHWs on daily rounds, I observed their potential to address women’s attitudes towards
hysterectomy and treatment-seeking decisions, for example – a finding that would not have
emerged from managerial descriptions of their tasks. Further, observations during the process
evaluation suggested that CHWs were not the most effective mechanism for health education in this
setting. Design of CHW-led interventions should consider (i) CHW skill levels (ii) available time and
(iii) what aspect of health behaviour or outcomes they can address. SEWA CHWs were only able to
conduct one hysterectomy session per month, which did not translate into realistic potential to
reduce the population incidence of hysterectomy. The wide variety and range of CHW roles – from
social activism to direct service delivery – requires a strong theoretical basis to identify the type of
intervention CHWs can deliver. In this case, SEWA CHWs appeared to be more suited to a social
activist role, whereas CHWs in service delivery settings may be more adept at health education.
Similarly, health education interventions require both a theoretical framework and assessment of
which, and what combination, of delivery mechanism is most feasible for CHWs.
234
Hysterectomy
The findings of this study strongly support the need for more research on the epidemiology of
hysterectomy, its determinants and health systems factors through both community-based and
nationally representative surveys in India. The baseline findings helped initiate a national advocacy
meeting, held in New Delhi in August 2013, to discuss hysterectomy trends with researchers,
policymakers and activists. Most significantly, the meeting resulted in commitment from the
Ministry of Health to include three questions on hysterectomy, taken directly from those used in this
baseline survey, in the next round of the National Family Health Survey. The estimated incidence,
mean age and determinants of hysterectomy in rural Gujarat highlight the need for interventions to
address (i) the normalisation of hysterectomy (ii) available options for treating gynaecological
ailments and (iii) provider attitudes towards intervention in women’s bodies. In addition, health
policymakers should consider systematic monitoring of hysterectomy at the population and facility
level that includes medical audits, provider training and monitoring and expansion of sexual and
reproductive health services. Lastly, the findings also underscore the importance of a mixed
methods approach to contextualise women’s treatment-seeking decisions and to explain how
predictors such low-income status increase the likelihood of hysterectomy. Incorporating women’s
voices resulted in a different, more complicated narrative than the unilateral application of medical
authority–one of pragmatic agency and multiple negotiations—and called attention to the broader
circumstances that define women’s choices. Future research on hysterectomy requires similar
approaches to examining both population data and individual experiences, in order to identify wider
trends as well as localised risk factors.
SEWA Health and VimoSEWA
Research findings were shared with VimoSEWA, SEWA CHWs and local stakeholders in Gujarat in
June 2014. VimoSEWA management expressed the need for more research to explore adverse
selection and moral hazard in its population. Health education has presented a longstanding, almost
divisive, challenge to SEWA Health. While it is promoted based on a principle, to fulfil women’s
needs for health information, the lack of perceived effect through practice and now, as observed
through this evaluation, have suggested other approaches should be tried. CHWs and managers
have also grappled with the balance between developing evidence-based interventions to address
specific issues and a holistic approach to health that works in tandem with microfinance and
livelihoods interventions. Notably, donors have increasingly encouraged the former approach.
CHWs continue to utilise the communication materials for diarrhoea, fever and hysterectomy in
both intervention and control areas, but not through a targeted or planned group approach at the
235
moment. The health team is considering design of an advocacy and provider monitoring intervention
for hysterectomy.
The findings suggest that SEWA could adopt a more focussed approach to CHW-led interventions,
reconsider methods of health education and maximise the potential of CHWs to catalyse community
action. SEWA CHWs span components of service delivery and social activism, a combination which
allowed for a wide range of interactions with women in the community but may have also limited
measurable change. In addition, this experience demonstrated the importance of regular analysis
of claims patterns and collection of population-based data to track women’s treatment-seeking
patterns. The value of VimoSEWA’s claims database must be capitalised upon further, through
regular analysis and dissemination. As a grassroots movement with wide reach and diverse
activities, SEWA can implement health interventions, experiment with financing mechanisms as well
as sustain advocacy campaigns. A final recommendation, therefore, is that SEWA promote an
evidence-based, comprehensive women’s health approach to hysterectomy through a combination
of direct intervention and long term efforts. Building on the findings of this research, SEWA can
demonstrate in practice why and how health interventions must integrate the social, economic and
political realities of women’s lives.
236
References
1. WHO, Women and health: today's evidence tomorrow's agenda. 2009, Geneva: World Health Organization.
2. NSSO, Morbidity, Health Care and the Condition of the Aged. 2004. 507((60/25.0/1)). 3. IIPS, District Level Household and Facility Survey (DLHS-3) 2007-08, Gujarat. 2010, Indian
Institute of Population Studies Mumbai. 4. IIPS/ORCMacro, National Family Health Survey-3. 2006, Indian Institute of Population
Sciences. 5. Sundar, R. and A. Sharma, Morbidity and Utilisation of Healthcare Services: A Survey of
Urban Poor in Delhi and Chennai. Economic and Political Weekly, 2002: p. 4729-4740. 6. Dror, D.M., O. van Putten-Rademaker, and R. Koren, Incidence of illness among resource-
poor households: Evidence from five locations in India. Indian Journal of Medical Research, 2009. 130(2): p. 146-154.
7. Bamji, M.S., et al., Health and nutrition problems and health care seeking practices of rural women and children-lessons for health and nutrition entrepreneur's training. Indian Pediatrics, 2000. 37(7): p. 807-808.
8. Ravindran, T.K.S., Women’s Health in a Rural Poor Population in Tamil Nadu’. Women's Health in India, 1995: p. 175-211.
9. Madhiwalla, N., et al., Health, Households, and Women's Lives: A Study of Illness and Childbearing Among Women in Nasik District, Maharashtra. 2000, Cehat.
10. Bhatia, J. and J. Cleland, The contribution of reproductive ill-health to the overall burden of perceived illness among women in southern India. Bulletin of the World Health Organization, 2001. 79(11): p. 1065-1069.
11. Khan, K.B., Understanding the gender aspects of tuberculosis: a narrative analysis of the lived experiences of women with TB in slums of Delhi, India. Health Care Women Int, 2012. 33(1): p. 3-18.
12. Visaria, L., et al., Abortion in India - emerging issues from qualitative studies. Economic and Political Weekly, 2004. 39(46): p. 5044-5052.
13. D'Cruz, P., Moments of truth: the experiences of wives in HIV / AIDS affected nuclear households in Mumbai. Journal of Comparative Family Studies, 2003. 34(2): p. 255-281.
14. Garg, S., N. Sharma, and R. Sahay, Socio-cultural aspects of menstruation in an urban slum in Delhi, India. Reproductive Health Matters, 2001. 9(17): p. 16-25.
15. Kaur, R. and S. Garg, Domestic violence against women: a qualitative study in a rural community. Asia Pac J Public Health, 2010. 22(2): p. 242-51.
16. Kaushal, M., et al., Breastfeeding practices and health-seeking behavior for neonatal sickness in a rural community. Journal of Tropical Pediatrics, 2005. 51(6): p. 366-376.
17. O'Neil, J., et al., Dhandha, dharma and disease: traditional sex work and HIV/AIDS in rural India. Social Science and Medicine, 2004. 59(4): p. 851-860.
18. Pereira, B., et al., The explanatory models of depression in low income countries: listening to women in India. J Affect Disord, 2007. 102(1-3): p. 209-18.
19. Ravindran, T.K.S., R. Savitri, and A. Bhavani, Women's experiences of utero-vaginal prolapse: a qualitative study from Tamil Nadu, India. Safe Motherhood Initiatives: Critical Issues, 1999: p. 165-72.
20. Kielmann, K., Theorizing health in the context of transition: the dynamics of perceived morbidity among women in peri-urban Maharashtra, India. Medical Anthropology, 2002. 21(2): p. 157-205.
21. Evans, C. and H. Lambert, Implementing community interventions for HIV prevention: Insights from project ethnography. Social Science and Medicine, 2007. 66(2): p. 467-478.
237
22. Jeffery, R., P. Jeffery, and M. Rao, Safe Motherhood Initiatives: Contributions from small-scale studies. Indian Journal of Gender Studies, 2007. 14(2): p. 285-294.
23. Krishnan, S., Do structural inequalities contribute to marital violence? Ethnographic evidence from rural South India. Violence Against Women, 2005. 11(6): p. 759-75.
24. Ram, K., Medical management and giving birth: responses of coastal women in Tamil Nadu. Reproductive Health Matters, 1994(4): p. 20-6.
25. Shahmanesh, M., et al., HIV prevention while the bulldozers roll: exploring the effect of the demolition of Goa's red-light area. Social Science and Medicine, 2009. 69(4): p. 604-12.
26. Van Hollen, C., Moving targets: routine IUD insertion in maternity wards in Tamil Nadu, India. Reproductive Health Matters, 1998. 6(11): p. 98-106.
27. Patel, V., G. Andrew, and P.J. Pelto, The psychological and social contexts of complaints of abnormal vaginal discharge: A study of illness narratives in India. Journal of Psychosomatic Research. 64(3): p. 255-262.
28. Ekman, B., Community-based health insurance in low-income countries: a systematic review of the evidence. Health Policy and Planning, 2004. 19(5): p. 249.
29. Ranson, M.K., Reduction of catastrophic health care expenditures by a community-based health insurance scheme in Gujarat, India: current experiences and challenges. Bulletin of the World Health Organization, 2002. 80(8): p. 613-621.
30. Spilsbury, K., et al., Persistent high rates of hysterectomy in Western Australia: a population-based study of 83 000 procedures over 23 years. BJOG, 2006. 113(7): p. 804-9.
31. Vessey, M.P., et al., The epidemiology of hysterectomy: findings in a large cohort study. Br J Obstet Gynaecol, 1992. 99(5): p. 402-7.
32. Ong, S., et al., Prevalence of hysterectomy in Ireland. Int J Gynaecol Obstet, 2000. 69(3): p. 243-7.
33. Whiteman, M.K., et al., Inpatient hysterectomy surveillance in the United States, 2000-2004. Am J Obstet Gynecol, 2008. 198(1): p. 34 e1-7.
34. Devadasan, N., et al., Indian community health insurance schemes provide partial protection against catastrophic health expenditure. BMC health services research, 2007. 7(1): p. 43.
35. Pearce, N., Traditional epidemiology, modern epidemiology, and public health. American Journal of Public Health, 1996. 86(5): p. 678-683.
36. Krieger, N., Epidemiology and social sciences: towards a critical reengagement in the 21st century. Epidemiologic Reviews, 2000. 22(1): p. 155-163.
37. Inhorn, M.C. and K.L. Whittle, Feminism meets the “new” epidemiologies: toward an appraisal of antifeminist biases in epidemiological research on women's health. Social Science & Medicine, 2001. 53(5): p. 553-567.
38. Kaufert, P., Through women’s eyes: The case for a feminist epidemiology. Healths/tariffing, 1988. 10: p. 10-13.
39. Freedman, L. and D. Maine, Facing Facts: The Role of Epidemiology in Reproductive Rights Advocacy. Am. UL Rev., 1994. 44: p. 1085.
40. Walt, G., CHWs: are national programmes in crisis? Health Policy and Planning, 1988. 3(1): p. 1-21.
41. Viswanathan, M., et al., Outcomes and costs of community health worker interventions: A systematic review. Medical Care, 2010. 48(9): p. 792-808.
42. Gilmore, B. and E. McAuliffe, Effectiveness of community health workers delivering preventive interventions for maternal and child health in low- and middle-income countries: a systematic review. BMC Public Health, 2013. 13(847).
43. Glenton, C., et al., Barriers and facilitators to the implementation of lay health worker programmes to improve access to maternal and child health: qualitative evidence synthesis. Cochrane Database Syst Rev, 2013. 10: p. CD010414.
238
44. Smith Paintain, L., et al., Community health workers and stand-alone or integrated case management of malaria: a systematic literature review. The American journal of tropical medicine and hygiene, 2014. 91(3): p. 461-470.
45. Perry, H.B., R. Zulliger, and M.M. Rogers, Community health workers in low-, middle-, and high-income countries: An overview of their history, recent evolution, and current effectiveness. Annual Review of Public Health, 2014. 35: p. 399-421.
46. Kallander, K., et al., Mobile health (mHealth) approaches and lessons for increased performance and retention of community health workers in low-and middle-income countries: a review. Journal of Medical Internet Research, 2013. 15(1): p. e17.
47. Bhutta, Z.A., et al., Improvement of perinatal and newborn care in rural Pakistan through community-based strategies: A cluster-randomised effectiveness trial. The Lancet, 2011. 377(9763): p. 403-412.
48. Lewin, S., et al., Lay health workers in primary and community health care for maternal and child health and the management of infectious diseases. Cochrane database of systematic reviews (Online), 2010. 3: p. CD004015.
49. Haines, A., et al., Achieving child survival goals: potential contribution of community health workers. The Lancet, 2007. 369(9579): p. 2121-2131.
50. Lehmann, U. and D. Sanders, Community health workers: What do we know about them? The state of the evidence on programmes, activities, costs and impact on health outcomes of using community health workers. World Health Organization, 2007. 2: p. 1-42.
51. Bhutta, Z.A., et al., Global experience of community health workers for delivery of health related millennium development goals: a systematic review, country case studies, and recommendations for integration into national health systems. Global Health Workforce Alliance, 2010.
52. Arvey, S.R. and M.E. Fernandez, Identifying the core elements of effective community health worker programs: a research agenda. American journal of public health, 2012. 102(9): p. 1633-1637.
53. Organization, W.H. Health education 6 June 2015]; Available from: http://www.who.int/topics/health_education/en/.
54. Glanz, K., B.K. Rimer, and K. Viswanath, Health behavior and health education: theory, research, and practice. 2008: John Wiley & Sons.
55. Simonds, S., Health education in the Mid-1970s: State of the Art. Preventive Medecine, 1976. 56. Painter, J.E., et al., The use of theory in health behavior research from 2000 to 2005: a
systematic review. Ann Behav Med, 2008. 35(3): p. 358-62. 57. Munro, S., et al., A review of health behaviour theories: how useful are these for developing
interventions to promote long-term medication adherence for TB and HIV/AIDS? BMC Public Health, 2007. 7(1): p. 104.
58. Bandura, A., Health promotion by social cognitive means. Health education & behavior, 2004. 31(2): p. 143-164.
59. McAlister, A.L., C.L. Perry, and G.S. Parcel, How individuals, environments, and health behaviors interact. HEALTH BEHAVIOR, 2008. 169.
60. Green, E.C. and E. Murphy, Health Belief Model, in The Wiley Blackwell Encyclopedia of Health, Illness, Behavior, and Society. 2014, John Wiley & Sons, Ltd.
61. Champion, V.L. and C.S. Skinner, The health belief model. Health behavior and health education: Theory, research, and practice, 2008. 4: p. 45-65.
62. Montano, D.E., et al., Theory of reasoned action, theory of planned behavior, and the integrated behavioral model. 2008.
63. Proschaska, J., et al., The transtheorical model and stages of change. Health behavior and health education: theory, research, and practice. 2nd ed. San Francisco (CA): Jossey Bass, 1997: p. 60-84.
239
64. Weinstein, N.D., P.M. Sandman, and S.J. Blalock, The Precaution Adoption Process Model. Health behavior and health education: Theory, research, and practice, 2008. 4: p. 123-147.
65. Weinstein, N.D., The precaution adoption process. Health psychology, 1988. 7(4): p. 355. 66. Evans, C. and H. Lambert, The limits of behaviour change theory: condom use and contexts of
HIV risk in the Kolkata sex industry. Cult Health Sex, 2008. 10(1): p. 27-42. 67. Prost, A., et al., Women's groups practising participatory learning and action to improve
maternal and newborn health in low-resource settings: a systematic review and meta-analysis. The Lancet, 2013. 381(9879): p. 1736-1746.
68. Leatherman, S., et al., Integrating microfinance and health strategies: examining the evidence to inform policy and practice. Health Policy and Planning, 2012. 27(2): p. 85-101.
69. Mock, J., et al., Effective lay health worker outreach and media-based education for promoting cervical cancer screening among Vietnamese American women. Am J Public Health, 2007. 97(9): p. 1693-700.
70. Lam, T.K., et al., Encouraging Vietnamese-American women to obtain pap tests through lay health worker outreach and media education. Journal of General Internal Medicine, 2003. 18(7): p. 516-524.
71. Nguyen, T.T., et al., Papanicolaou testing among Vietnamese Americans: results of a multifaceted intervention. Am J Prev Med, 2006. 31(1): p. 1-9.
72. O'Brien, M.J., et al., Community health worker intervention to decrease cervical cancer disparities in Hispanic women. J Gen Intern Med, 2010. 25(11): p. 1186-92.
73. Nguyen, T.T., et al., Breast cancer screening among Vietnamese Americans: a randomized controlled trial of lay health worker outreach. Am J Prev Med, 2009. 37(4): p. 306-13.
74. Balcazar, H.G., et al., A promotores de salud intervention to reduce cardiovascular disease risk in a high-risk Hispanic border population, 2005-2008. Preventing chronic disease, 2010. 7(2): p. A28.
75. Koniak-Griffin, D., et al., A community health worker-led lifestyle behavior intervention for Latina (Hispanic) women: Feasibility and outcomes of a randomized controlled trial. Int J Nurs Stud, 2015. 52(1): p. 75-87.
76. Malwenna, L.I., P.L. Jayawardana, and A. Balasuriya, Effectiveness of a community based health educational intervention in reducing unmet need for modern methods of family planning among ever married reproductive age women in the Kalutara district, Sri Lanka. International Journal of Collaborative Research on Internal Medicine and Public Health, 2012. 4(4): p. 344-361.
77. Eriksen, J., et al., Effectiveness of a community intervention on malaria in rural Tanzania - a randomised controlled trial. African Health Sciences, 2010. 10(4): p. 332-340.
78. Kroeger, A., et al., Health education for community-based malaria control: an intervention study in Ecuador, Colombia and Nicaragua. TROPICAL MEDICINE AND INTERNATIONAL HEALTH, 1996. 1(6): p. 836-46.
79. Baqui, A.H., et al., Effect of community-based newborn-care intervention package implemented through two service-delivery strategies in Sylhet district, Bangladesh: a cluster-randomised controlled trial. Lancet, 2008. 371(9628): p. 1936-44.
80. Morrison, J., et al., Understanding how women's groups improve maternal and newborn health in Makwanpur, Nepal: a qualitative study. International Health, 2010. 2(1): p. 25-35.
81. Nair, N., et al., Explaining the impact of a women's group led community mobilisation intervention on maternal and newborn health outcomes: The Ekjut trial process evaluation. BMC International Health and Human Rights, 2010. 10(1).
82. Leatherman, S., et al., Integrating microfinance and health strategies: examining the evidence to inform policy and practice. Health Policy and Planning, 2011.
240
83. Pronyk, P.M., et al., Effect of a structural intervention for the prevention of intimate-partner violence and HIV in rural South Africa: a cluster randomised trial. Lancet, 2006. 368(9551): p. 1973-1983.
84. Kim, J., et al., Assessing the incremental effects of combining economic and health interventions: the IMAGE study in South Africa. Bulletin of the World Health Organization, 2009. 87(11): p. 824-832.
85. Hamad, R., L.C.H. Fernald, and D.S. Karlan, Health education for microcredit clients in Peru: a randomized controlled trial. BMC Public Health, 2011. 11(51).
86. Aggarwal, A.K. and M. Duggal, Knowledge of men and women about reproductive tract infections and AIDS in a rural area of north India: impact of a community-based intervention. J Health Popul Nutr, 2004. 22(4): p. 413-9.
87. Dongre, A.R., P.R. Deshmukh, and B.S. Garg, The effect of community-based health education intervention on management of menstrual hygiene among rural Indian adolescent girls. World health & population, 2007. 9(3): p. 48-54.
88. Dongre, A., P. Deshmukh, and B. Garg, Process documentation of health education interventions for school children and adolescent girls in rural India. Education for Health, 2009. 22(1): p. 128.
89. Rao, R.S., et al., Acceptability and effectiveness of a breast health awareness programme for rural women in India. Indian J Med Sci, 2005. 59(9): p. 398-402.
90. Lehmann, U., Successes and failures in community-based interventions: What roles can community health workers play? Tropical Medicine and International Health, 2009. 14: p. 27-28.
91. Bhutta, Z.A., et al., Improvement of perinatal and newborn care in rural Pakistan through community-based strategies: a cluster-randomised effectiveness trial. Lancet, 2011. 377(9763): p. 403-412.
92. Baskett, T.F., Hysterectomy: evolution and trends. Best Practice and Research Clinical Obstetrics and Gynaecology, 2005. 19(3): p. 295-305.
93. Carlson, K.J., D.H. Nichols, and I. Schiff, Indications for Hysterectomy. New England Journal of Medicine, 1993. 328(12): p. 856-860.
94. Leape, L., et al., Hysterectomy: Clinical Recommendations and Indications for Use. 1997, RAND Washington, DC.
95. Hill, E.L., M.L. Graham, and J.M. Shelley, Hysterectomy trends in Australia--between 2000/01 and 2004/05. Aust N Z J Obstet Gynaecol, 2010. 50(2): p. 153-8.
96. Stang, A., R.M. Merrill, and O. Kuss, Hysterectomy in Germany: a DRG-based nationwide analysis, 2005-2006. Dtsch Arztebl Int, 2011. 108(30): p. 508-14.
97. Lykke, R., et al., Hysterectomy in Denmark 1977-2011: changes in rate, indications, and hospitalization. Eur J Obstet Gynecol Reprod Biol, 2013. 171(2): p. 333-8.
98. Wu, J.M., et al., Hysterectomy rates in the United States, 2003. 2007. 110: p. 1091-1095. 99. Bickell, N.A., et al., Gynecologists' sex, clinical beliefs, and hysterectomy rates. American
Journal of Public Health, 1994. 84(10): p. 1649-1652. 100. Gimbel, H., B. Ottesen, and A. Tabor, Danish gynecologists' opinion about hysterectomy on
benign indication: results of a survey. Acta Obstet Gynecol Scand, 2002. 81(12): p. 1123-31. 101. Einarsson, J.I., et al., Minimally invasive hysterectomies—a survey on attitudes and barriers
among practicing gynecologists. Journal of minimally invasive gynecology, 2010. 17(2): p. 167-175.
102. Materia, E., et al., Hysterectomy and socioeconomic position in Rome, Italy. J Epidemiol Community Health, 2002. 56(6): p. 461-5.
103. Palmer, J.R., et al., Correlates of hysterectomy among African-American women. Am J Epidemiol, 1999. 150(12): p. 1309-15.
241
104. Dharmalingam, A., I. Pool, and J. Dickson, Biosocial determinants of hysterectomy in New Zealand. Am J Public Health, 2000. 90(9): p. 1455-8.
105. Byles, J.E., G. Mishra, and M. Schofield, Factors associated with hysterectomy among women in Australia. Health & Place, 2000. 6(4): p. 301-308.
106. Edozien, L.C., Hysterectomy for benign conditions. Vol. 330. 2005. 1457-1458. 107. Johnson, N., et al., Methods of hysterectomy: systematic review and meta-analysis of
randomised controlled trials. Vol. 330. 2005. 1478. 108. Geller, S.E., L.R. Burns, and D.J. Brailer, The impact of nonclinical factors on practice
variations: the case of hysterectomies. Health Services Research, 1996. 30(6): p. 729-750. 109. Bernstein, S.J., et al., The appropriateness of hysterectomy: a comparison of care in seven
health plans. Jama, 1993. 269(18): p. 2398-2402. 110. Bickell, N.A., et al., A matter of opinion about hysterectomies: experts' and practicing
community gynecologists' ratings of appropriateness. American Journal of Public Health, 1995. 85(8_Pt_1): p. 1125-1128.
111. Stewart, E.A., L.T. Shuster, and W.A. Rocca, Reassessing hysterectomy. Minnesota medicine, 2012. 95(3): p. 36.
112. Broder, M.S., et al., The appropriateness of recommendations for hysterectomy. Obstetrics & Gynecology, 2000. 95(2): p. 199-205.
113. Cloutier-Steele, L., Misinformed Consent: Women's Stories About Unnecessary Hysterectomy. 2003: Next Decade, Inc.
114. Angier, N., In a Culture of Hysterectomies, Many Question Their Necessity, in New York Times. 1997: New York, NY.
115. West, S. and P. Dranov, The hysterectomy hoax. Doubleday,. New York, 1994. 4: p. 21-21. 116. Chaudhuri, M., Women's groups and fertility experts campaign to reduce prevalence of
hysterectomy in India. Bmj-British Medical Journal, 2013. 347. 117. Singh, S., 16,000 ‘illegal’ hysterectomies done in Bihar for insurance benefi, in Indian Express.
2012: New Delhi. 118. BBC. The Indian women pushed into hysterectomies. 2013 [cited 2014 5 October]; Available
from: http://www.bbc.com/news/magazine-21297606. 119. WorldBank. Country and Lending Groups. 2014 [cited 2014 3 November]; Available from:
http://data.worldbank.org/about/country-and-lending-groups#South_Asia. 120. Singh, A. and A.K. Arora, Why hysterectomy rate are lower in India. Indian Journal of
Community Medicine, 2008. 33(3): p. 196-197. 121. Bhasin, S.K., et al., An Epidemiological Study of Major Surgical Procedures in an Urban
Population of East Delhi. Indian Journal of Surgery, 2011. 73(2): p. 131-135. 122. Desai, S., T. Sinha, and A. Mahal, Prevalence of hysterectomy among rural and urban women
with and without health insurance in Gujarat, India. Reproductive Health Matters, 2011. 19(37): p. 42-51.
123. Shakhatreh, F.M., Epidemiology of urinary incontinence in Jordanian women. Saudi Med J, 2005. 26(5): p. 830-5.
124. Barghouti, F.F., et al., Prevalence and risk factors of urinary incontinence among Jordanian women: impact on their life. Health Care Women Int, 2013. 34(11): p. 1015-23.
125. Ozel, B., et al., Prevalence and risk factors for pelvic floor symptoms in women in rural El Salvador. Int Urogynecol J Pelvic Floor Dysfunct, 2007. 18(9): p. 1065-9.
126. Sarna, A., et al., Sexually transmitted infections and reproductive health morbidity in a cohort of female sex workers screened for a microbicide feasibility study in Nellore, India. Global journal of health science, 2013. 5(3): p. 139-149.
127. Kaur, S., I. Walia, and A. Singh, How menopause affects the lives of women in suburban Chandigarh, India. Climacteric, 2004. 7(2): p. 175-180.
242
128. Patel, V., et al., The burden and determinants of dysmenorrhoea: a population-based survey of 2262 women in Goa, India. BJOG, 2006. 113(4): p. 453-63.
129. Kamath, A. and R.R. Pai, Retrospective study of gynaecological malignancies in less than 35 years of age in Southern India. Journal of Clinical and Diagnostic Research, 2012. 5(6): p. 1251-1255.
130. Chaturvedi, V., et al., Pattern and frequency of uterine pathologies among hysterectomy specimens in rural part of northern India: A retrospective secondary data analysis. Indian Journal of Community Health, 2014. 26(1): p. 103-106.
131. Pandey, D., et al., An Audit of Indications, Complications, and Justification of Hysterectomies at a Teaching Hospital in India. International Journal of Reproductive Medicine, 2014. 2014.
132. Rahim Rather, G., Y. Gupta, and S. Bardhwaj, Patterns of lesions in hysterectomy specimens: A prospective study. JK Science, 2013. 1(1): p. 63-68.
133. Sharma, C., et al., Gynecological diseases in rural India: A critical appraisal of indications and route of surgery along with histopathology correlation of 922 women undergoing major gynecological surgery. Journal of mid-life health, 2014. 5(2): p. 55-61.
134. Tiwana, K.K., et al., Histopathological Audit of 373 non oncological hysterectomies in a teaching hospital. Pathology Research International. 2014(2014): p. 5.
135. Sudeepa, D., S. Madhukumar, and V. Gaikwad, A study of the profile of hysterectomy acceptors in rural Bangalore. Indian Journal of Public Health Research and Development, 2013. 4(4): p. 285-288.
136. Kashyap, V. and S. Sharma, Age and causes of cancer and non-cancer hysterectomy amongst Hindu and Muslim patients. Indian Journal of Community Health, 2013. 25(2): p. 193-196.
137. Chatterjee, S. and R. Laxminarayan, Costs of surgical procedures in Indian hospitals. BMJ open, 2013. 3(6).
138. Ranson, M.K. and K.R. John, Quality of hysterectomy care in rural Gujarat: the role of community-based health insurance. Health Policy Plan, 2001. 16(4): p. 395-403.
139. Mamidi, B.B. and V. Pulla, Hysterectomies and Violation of Human Rights: Case Study from India. International Journal of Social Work and Human Services Practice, 2013. 1(1): p. 64-75.
140. Kameswari, S. and P. Vinjamuri, Medical Ethics in the Health Sector – A case study of Hysterectomy in Andhra Pradesh. 2010, Life HRG.
141. Desai, S., Keeping the 'health' in health insurance. Economic and Political Weekly, 2009. 44(38): p. 18-21.
142. Seshadri, T., et al., Impact of RSBY on enrolled households: Lessons from Gujarat. BMC Proceedings, 2012. 6.
143. Reddy, S. and I. Mary, Rajiv Aarogyasri Community Health Insurance Scheme in Andhra Pradesh, India: A comprehensive analytic view of private public partnership model. Indian J Public Health, 2013. 57(4): p. 254-259.
144. Venkatesh, G.M. and S. Metri, Does community based health insurance increase access to health care. International Journal of Biomedical Research, 2011. 2(5): p. 316-319.
145. Desai, S., et al., Understanding CBHI hospitalisation patterns: a comparison of insured and uninsured women in Gujarat, India. Bmc Health Services Research, 2014. 14.
146. Sharma, J.B., et al., A preliminary survey of patients' views on awareness, information, choices and expectations in women undergoing hysterectomy. J Indian Med Assoc, 2004. 102(6): p. 304-6, 308.
147. Dixon-Mueller, R. and J. Wasserheit, The culture of silence. Reproductive tract infections among women in the Third World. 1991.
148. Char, A., Womens perception of their reproductive health before and after sterilization in rural Maharashtra India. Asia-Pacific Population Journal, 2001. 16(2): p. 63-74.
149. Prasad, J.H., et al., Reproductive tract infections among young married women in Tamil Nadu, India. International Family Planning Perspectives, 2005: p. 73-82.
243
150. Sabarwal, S. and K. Santhya, Treatment-seeking for symptoms of reproductive tract infections among young women in India. International perspectives on sexual and reproductive health, 2012: p. 90-98.
151. Bhatnagar, N., et al., The silent epidemic of reproductive morbidity among ever married women (15-49 years) in an urban area of Delhi. J Community Health, 2013. 38(2): p. 250-6.
152. Bang, R.A., et al., High prevalence of gynaecological diseases in rural Indian women. The Lancet, 1989. 333(8629): p. 85-88.
153. Santhya, K., Treatment seeking for Reproductive Illness in Rural Tamil Nadu. Reproductive health in India: new evidence, 2008: p. 252.
154. Oomman, N., Examining Determinants of Gynaecological Morbidity from Women's Perceptions in Rural Rajasthan. Reproductive health in India: new evidence, 2008: p. 159.
155. Ramasubban, R. and B. Rishyasringa, Weakness (‘ashaktapana’) and reproductive health among women in a slum population in Mumbai. Cultural perspectives on reproductive health, 2001: p. 13-37.
156. Barua, A. and K. Kurz, Reproductive health-seeking by married adolescent girls in Maharashtra, India. Reproductive health matters, 2001. 9(17): p. 53-62.
157. Bhatia, J.C. and J. Cleland, Health-care seeking and expenditure by young Indian mothers in the public and private sectors. Health Policy and Planning, 2001. 16(1): p. 55-61.
158. Joshi, A., M. Dhapola, and P.J. Pelto, Gynaecological problems: Perceptions and treatment seeking behaviours of rural Gujarati women. Reproductive Health in India: New Evidence, New Delhi: Rawat Publications, 2008: p. 133-158.
159. George, A., It happens to us: menstruation as perceived by poor women in Bombay. 1994. 160. Hsieh, C.H., et al., Long-term effect of hysterectomy on urinary incontinence in Taiwan.
Taiwanese Journal of Obstetrics & Gynecology, 2011. 50(3): p. 326-330. 161. Kirss, F., K. Lang, and R. Tuimala, Feminine life-course of Estonian women born in 1937-47: a
questionnaire survey. Acta Obstet Gynecol Scand, 2006. 85(2): p. 224-8. 162. Lam, J.S., et al., Female reproductive factors and major eye diseases in Asian women -the
Singapore Malay Eye Study. Ophthalmic Epidemiol, 2014. 21(2): p. 92-8. 163. Parazzini, F., et al., Hysterectomy rates for benign conditions are declining in Lombardy, Italy:
1996-2010. European Journal of Obstetrics & Gynecology and Reproductive Biology, 2014. 178: p. 107-113.
164. Chao, Y.M.Y., et al., Appropriateness of hysterectomy in Taiwan. Journal of the Formosan Medical Association, 2005. 104(2): p. 107-112.
165. Jejeebhoy, S. and M. Koenig, The social context of gynaecological morbidity: Correlates, consequences and health seeking behaviour. Investigating reproductive tract infections and other gynaecological disorders, 2003: p. 30-81.
166. Koenig, M. and S. Jejeebhoy, Reproductive health in India: new evidence. 2008: Rawat Pubns. 167. BMJ, India will collect data to tackle overuse of hysterectomy. BMJ 2013;, 2013. 347:f5368. 168. VMW, Economy of the Federal States For Year 2010 & Population for Year 2011. 2010. 169. NRHM, Outcome Analysis of Program Implementation Plan (Gujarat). 2011. 170. Office of Registrar General and Census Commissioner, G.o.I., Special Bulletin on Maternal
Mortality in India. 2009. 171. Office of Registrar General and Census Commissioner, G.o.I., Provisional Population Totals
Paper. 2011: New Delhi. 172. Singh, A. Public Private Partnership: The Way Ahead. 2008 [cited 2011 March 3]; Available
from: http://mohfw.nic.in/NRHM/GOA%20Workshop/PDFs/02-05-08_pdf/Pre%20Lunch/Dr%20Amarjeet%20Singh.pdf.
173. MOHFW, Report of the National Commission on Macroeconomics and Health. 2005. 174. RSBY. RSBY in Gujarat. [cited 2014 6 April ]; Available from:
http://rsbygujarat.org/FAQ’S.html.
244
175. Bhatt, E., We are Poor but So Many. 2005, New York: Oxford University Press. 176. SEWA. SEWA Annual General Meeting. 2015 [cited 2015 2 February]; Available from:
http://www.sewa.org/Fifty-five.asp. 177. Jhabvala, R., S. Desai, and J. Dave, Social Income and Insecurity: Joining SEWA Makes a
Difference. SEWA Academy Working Papers, 2010. 178. Sinha, S., Social Security for Women Workers in the Informal Economy, in Social Security as a
Human Right. 2007, Springer. p. 117-128. 179. WHO, Strengthening the performance of community health workers in primary health care.,
in WHO Technical Report Series. 1989. 180. Ministry of Labour, I., State wise and employment wise minimum wages, 2010-11. 2011. 181. Devadasan, N., et al., The landscape of community health insurance in India: An overview
based on 10 case studies. Health policy, 2006. 78(2-3): p. 224-234. 182. VimoSEWA, Key Performance Indicators. 2012: Ahmedabad. 183. Gujarat, G.o. Ahmedabad District Enrolment Details 2013 27 May 2013]; Available from:
http://rsbygujarat.org/DistrictDetails.html?DID=07. 184. IIPS/ORCMacro, National Family Health Survey-3 Gujarat State Report. 2006, Indian Institute
of Population Sciences. 185. Ranson, M.K., et al., Making health insurance work for the poor: learning from the Self-
Employed Women's Association's (SEWA) community-based health insurance scheme in India. Social Science & Medicine, 2006. 62(3): p. 707-720.
186. Sinha, T., et al., Barriers to accessing benefits in a community-based insurance scheme: lessons learnt from SEWA Insurance, Gujarat. Health Policy and Planning, 2006. 21(2): p. 132.
187. Ranson, K., The Impact of SEWA’s Medical Insurance Fund on Hospital Utilization and Expenditure in India. , in Health Nutrition and Population Discussion Paper. 2001, World Bank: Washington, D.C.
188. WHO, Malaria Country Profile. 2008, World Health Organisation Geneva. 189. Yadav, R., et al., The burden of malaria in Ahmedabad city, India: a retrospective analysis of
reported cases and deaths. Annals of Tropical Medicine and Parasitology, 2003. 97: p. 793-802.
190. Campbell, M.K., et al., Consort 2010 statement: extension to cluster randomised trials. Vol. 345. 2012.
191. Hayes, R.J. and L.H. Moulton, Cluster Randomised Trials. 2009, Boca Raton, FL: Chapman & Hall/CRC.
192. Ivers, N.M., et al., Allocation techniques for balance at baseline in cluster randomized trials: a methodological review. Trials, 2012. 13: p. 120.
193. Bennett, S., et al., Methods for the analysis of incidence rates in cluster randomized trials. International Journal of Epidemiology, 2002. 31(4): p. 839-846.
194. Kirkwood, B.R. and J.A. Sterne, Essential medical statistics (2nd ed.). 2003, Oxford: Blackwell Science.
195. Donner, A. and N. Klar, Methods for comparing event rates in intervention studies when the unity of allocation is a cluster. American Journal of Epidemiology 1994. 140: p. 279-289.
196. Green, J. and N. Thorogood, Qualitative methods for health research. 2013: Sage. 197. Pelto, G.H. and P.J. Pelto, Anthropological research: The structure of inquiry. 1978:
Cambridge University Press. 198. Lock, M. and P.A. Kaufert, Pragmatic women and body politics. 1998: Cambridge University
Press. 199. Behague, D.P., Beyond the simple economics of cesarean section birthing: women's
resistance to social inequality. Culture, Medicine and Psychiatry, 2002. 26(4): p. 473-507. 200. Lock, M. and V.-K. Nguyen, An anthropology of biomedicine. 2010: John Wiley & Sons. 201. Conrad, P., Medicalization and social control. Annual review of Sociology, 1992: p. 209-232.
245
202. Illich, I., Medical nemesis. New York: Pantheon, 1976. 203. Williams, S.J. and M. Calnan, The ‘limits’ of medicalization?: modern medicine and the lay
populace in ‘late’modernity. Social Science & Medicine, 1996. 42(12): p. 1609-1620. 204. Gale, N.K., et al., Using the framework method for the analysis of qualitative data in multi-
disciplinary health research. BMC medical research methodology, 2013. 13(1): p. 117. 205. Ritchie, J., et al., Qualitative research practice: A guide for social science students and
researchers. 2013: Sage. 206. Bernard, H.R., Research Methods in Anthropology. 2006, Lanham, MD: AltaMira Press. 207. Creswell, J.W., Research design: Qualitative, quantitative, and mixed methods approaches.
2013: Sage publications. 208. O’Cathain, A., E. Murphy, and J. Nicholl, Three techniques for integrating data in mixed
methods studies. Bmj, 2010. 341. 209. White, H., Theory-based impact evaluation: principles and practice. Journal of development
effectiveness, 2009. 1(3): p. 271-284. 210. Soors, W., et al., Community Health Insurance and Universal Coverage: Multiple paths, many
rivers to cross, in World Health Report Background Report. 2010, WHO: Geneva. 211. Radermacher, R., et al., What do we know about the impact of microinsurance? 2010,
Microinsurance Academy: New Delhi, India. 212. Carrin, G., M.P. Waelkens, and B. Criel, Community based health insurance in developing
countries: a study of its contribution to the performance of health financing systems. Tropical Medicine & International Health, 2005. 10(8): p. 799-811.
213. Aggarwal, A., Impact Evaluation of India's Yeshasvini Community-Based Health Insurance Scheme. Health Economics, 2010. 19: p. 5-25.
214. Gnawali, D.P., et al., The effect of community-based health insurance on the utilisation of modern health care services: Evidence from Burkina Faso. Health Policy, 2009. 90: p. 214-222.
215. Rao, K.D., et al., An experiment with community health funds in Afghanistan. Health Policy and Planning, 2009. 24: p. 301-311.
216. Chankova, S., S. Sulzbach, and F. Diop, Impact of mutual health organizations: evidence from West Africa. Health Policy and Planning, 2008. 23(4): p. 264.
217. Franco, L.M., et al., Effects of mutual health organizations on use of priority health-care services in urban and rural Mali: a case-control study. Bulletin of the World Health Organization 2008. 86(11): p. 830-838.
218. Robyn, P.J., et al., Health insurance and health-seeking behaviour: Evidence from a randomized community-based inusrance rollout in rural Burkina Faso. Social Science & Medicine, 2012. 75: p. 595-603.
219. Michielsen, J., et al., Can health insurance improve access to quality care for the Indian poor? International Journal for Quality in Healht Care, 2011. 23(4): p. 471-486.
220. Acharya, A., et al., The Impact of Health Insurance Schemes for the Informal Sector in Low- and Middle-Income Countries, in Systematic Review, E. Centre, Editor. 2012, Social Science Research Unit, Institute of Education, University of London: London.
221. Devadasan, N., et al., Community health insurance in Gudalur, India, increases access to hospital care. Health Policy and Planning, 2010. 25(2): p. 145.
222. Dror, D.M., et al., Field based evidence of enhanced healthcare utilization among persons insured by micro health insurance units in Philippines. Health policy, 2005. 73(3): p. 263-271.
223. Criel, B., P. Van der Stuyft, and W. Van Lerberghe, The Bwamanda hospital insurance scheme: effective for whom? A study of its impact on hospital utilization patterns1. Social Science & Medicine, 1999. 48(7): p. 897-911.
224. SEWA, Annual Report. 2012, SEWA Ahmedabad, India.
246
225. Gumber, A. and V. Kulkarni, Health insurance for informal sector: case study of Gujarat. Economic and Political Weekly, 2000: p. 3607-3613.
226. Devadasan, N., et al., Community health insurance in India: an overview. Economic and Political Weekly, 2004: p. 3179-3183.
227. Wang, H., et al., Adverse selection in a voluntary Rural Mutual Health Care health insurance scheme in China. Social Science & Medicine, 2006. 63(5): p. 1236-1245.
228. Dercon, S. and M. Kirchberger, Literature review on microinsurance, in Microinsurance Papers. 2008, International Labor Organization: Geneva.
229. Sen, A., Health: perception versus observation. Bmj, 2002. 324(7342): p. 860-861. 230. Subramanian, S.V., et al., Are self-reports of health and morbidities in developing countries
misleading? Evidence from India. Social Science & Medicine, 2009. 68(2): p. 260-5. 231. Jütting, J.P., Do community-based health insurance schemes improve poor people's access to
health care? Evidence from rural Senegal. World Development, 2004. 32(2): p. 273-288. 232. Devadasan, N., et al., ACCORD community health insurance: Increasing access to hospital
care. Economic and Political Weekly, 2004: p. 3189-3194. 233. Gumber, A., Hedging the health of poor: the case for community financing. 2001, The World
Bank: Washington DC. 234. Sinha, T., S. Desai, and A. Mahal, Hospitalized for fever? Understanding hospitalization for
common illnesses among insured women in a low income setting Health Policy and Planning, 2013.
235. Desai, S., T. Sinha, and A. Mahal, Prevalence of hysterectomy among rural and urban women with and without health insurance in Gujarat, India. Reprod Health Matters, 2011. 19(37): p. 42-51.
236. Ranson, M.K. and K.R. John, Quality of hysterectomy care in rural Gujarat: the role of community-based health insurance. Reproductive Health Matters, 2002. 10(20): p. 70-81.
237. Ranson, M.K., et al., Equitable utilisation of Indian community based health insurance scheme among its rural membership: cluster randomised controlled trial. BMJ, 2007. 334(7607): p. 1309.
238. Smith, K.V. and S. Sulzbach, Community-based health insurance and access to maternal health services: evidence from three West African countries. Social Science & Medicine, 2008. 66(12): p. 2460-2473.
239. Hounton, S., P. Byass, and B. Kouyate, Assessing effectiveness of a community based health insurance in rural Burkina Faso. BMC Health Serv Res, 2012. 12: p. 363.
240. Kent Ranson, M., et al., Making health insurance work for the poor: learning from the Self-Employed Women's Association's (SEWA) community-based health insurance scheme in India. Social Science & Medicine, 2006. 62(3): p. 707-720.
241. Koenig, M., et al., Investigating women's s gynaecological morbidity in India: Not just another KAP survey. Reproductive Health Matters. 6(11): p. 84-97.
242. Patel, V., et al., Why do women complain of vaginal discharge? A population survey of infectious and pyschosocial risk factors in a South Asian community. International Journal of Epidemiology, 2005. 34(4): p. 853-862.
243. Salomon, J.A., A. Tandon, and C.J.L. Murray, Comparability of self rated health: cross sectional multi-country survey using anchoring vignettes. Bmj, 2004. 328(7434): p. 258.
244. Madhiwalla, N., Experiences in health research with women. Issues in medical ethics. 9(1): p. 12.
245. Bhatia, J. and J. Cleland, Methodological issues in community-based studies of gynecological morbidity. Studies in Family Planning, 2000. 31(4): p. 267-73.
246. King, G., et al., Enhancing the validity and cross-cultural comparability of measurement in survey research. American Political Science Review, 2003. 97(04): p. 567-583.
247
247. Kielmann, K. and M. Bentley, Thresholds of morbidity among women in a peri-urban community of Maharashtra, India: conceptual and methodological issues. Journal of Health Psychology, 2003. 8(5): p. 525-38.
248. Selvaraj, S. and A. Karan, Deepening health insecurity in India: evidence from National Sample Surveys since 1980s. Economic & Political Weekly 2009. 44: p. 55-60.
249. Shahrawat, R. and K.D. Rao, Insured yet vulnerable: out-of-pocket payments and India’s poor. Health Policy and Planning, 2011.
250. Garg, C. and A. Karan, Reducing out-of-pocket expenditures to reduce poverty: a disaggregated analysis at rural-urban and state level in India. . Health Policy and Planning 2009. 24:: p. 116-128.
251. Bhandari, L., P. Berman, and R. Ahuja, The Impoverishing Effect of Healthcare Payments in India: New Methodology and Findings. 2010.
252. Ranson, M.K., The SEWA medical insurance fund in India. Health financing for poor people: resource mobilization and risk sharing, 2004.
253. Wagstaff, A. and M. Lindelow, Can insurance increase financial risk?: The curious case of health insurance in China. Journal of Health Economics, 2008. 27(4): p. 990-1005.
254. HRLN. Supreme Court issues Notices to Rajasthan, Chhattisgarh and Bihar State Governments in Petition on Unethical and Unlawful Hysterectomies. 2013 [cited 2014 2 October]; Available from: http://www.hrln.org/hrln/reproductive-rights/pils-a-cases/1264-supreme-court-issues-notices-to-rajasthan-chhattisgarh-and-bihar-state-governments-in-petition-on-unethical-and-unlawful-hysterectomies.html.
255. Iyer, M., Needless hysterectomies on poor women rampant across India, in Times of India. 2013: New Delhi.
256. Majumdar, S. Forced hysterectomies, unscrupulous doctors. 2013 [cited 2014 5 October ]; Available from: http://southasia.oneworld.net/news/forced-hysterectomies-unscrupulous-doctors#.VDLCF1fgJRE.
257. Jain, Y. and R. Kataria, Diagnosis of a prolapse, in The Hindu. 2012. 258. Oxfam. Unregulated and Unaccountable: . 2013 [cited 2014 24 November]; Available from:
http://policy-practice.oxfam.org.uk/publications/unregulated-and-unaccountable-how-the-private-health-care-sector-in-india-is-pu-268392.
259. Illich, I., The medicalization of life. Journal of Medical Ethics, 1975. 1(2): p. 73-77. 260. Inhorn, M.C., Defining women's health: A dozen messages from more than 150
ethnographies. Medical Anthropology Quarterly, 2006. 20(3): p. 345-378. 261. Sawicki, J., Disciplining mothers: Feminism and the new reproductive technologies. Feminist
theory and the body: A reader, 1999: p. 190-202. 262. Towghi, F., Cutting inoperable bodies: particularizing rural sociality to normalize
hysterectomies in Balochistan, Pakistan. Medical anthropology, 2012. 31(3): p. 229-248. 263. Säävälä, M., Understanding the Prevalence of Female Sterilization in Rural South India.
Studies in Family Planning, 1999. 30(4): p. 288-301. 264. Entwistle, V.A., Z.C. Skea, and M.T. O’Donnell, Decisions about treatment: interpretations of
two measures of control by women having a hysterectomy. Social science & medicine, 2001. 53(6): p. 721-732.
265. Galavotti, C. and D. Richter, Talking about hysterectomy: the experiences of women from four cultural groups. Journal of women's health & gender-based medicine, 2000. 9: p. S63.
266. Gunson, J.S., “More natural but less normal”: Reconsidering medicalisation and agency through women’s accounts of menstrual suppression. Social Science & Medicine, 2010. 71(7): p. 1324-1331.
267. de Bessa, G.H., Medicalization, reproductive agency, and the desire for surgical sterilization among low-income women in urban Brazil. Medical Anthropology, 2006. 25(3): p. 221-263.
248
268. de Bessa, G.H., REPRODUCTIVE AGENCY AMONG LOW-INCOME WOMEN IN BRAZIL. ENCYCLOPEDIA OF PSYCHOLOGY OF DECISION MAKING: p. 571.
269. Dikshit, R., et al., Cancer mortality in India: a nationally representative survey. The Lancet, 2012. 379(9828): p. 1807-1816.
270. Geyoushi, B.E., Z. Matthews, and R.W. Stones, Pathways to evidence-based reproductive healthcare in developing countries. BJOG: An International Journal of Obstetrics & Gynaecology, 2003. 110(5): p. 500-507.
271. Lopez, I., Agency and constraint: Sterilization and reproductive freedom among Puerto Rican women in New York City. Urban Anthropology and Studies of Cultural Systems and World Economic Development, 1993: p. 299-323.
272. Unnithan-Kumar, M., Female selective abortion–beyond ‘culture’: family making and gender inequality in a globalising India. Culture, health & sexuality, 2010. 12(2): p. 153-166.
273. Kielmann, K., Barren ground: contesting identities of infertile women in Pemba, Tanzania. CAMBRIDGE STUDIES IN MEDICAL ANTHROPOLOGY, 1998: p. 127-163.
274. Santhya, K. and S.J. Jejeebhoy, Sexual and reproductive health needs of married adolescent girls. Economic and Political Weekly, 2003: p. 4370-4377.
275. Bhatia, J.C. and J. Cleland, SELF-REPORTED SYMPTOMS OF GYNECOLOGICAL MORBIDITY AND THEIR TREATMENT IN SOUTH-INDIA. Studies in Family Planning, 1995. 26(4): p. 203-216.
276. Bhatia, J.C., et al., Levels and determinants of gynecological morbidity in a district of South India. Studies in Family Planning, 1997. 28(2): p. 95-103.
277. Latha, K., et al., Prevalence of clinically detectable gynaecological morbidity in India: results of four community based studies. Journal of family welfare, 1997. 43(4): p. 8-16.
278. Harlow, S.D. and O.M.R. Campbell, Menstrual dysfunction: A missed opportunity for improving reproductive health in developing countries. Reproductive Health Matters, 2000. 8(15): p. 142-147.
279. Black, K.I. and I.S. Fraser, The burden of health associated with benign gynecological disorders in low-resource settings. International Journal of Gynecology and Obstetrics. 119: p. S72-S75.
280. Bodner-Adler, B., C. Shrivastava, and K. Bodner, Risk factors for uterine prolapse in Nepal. International Urogynecology Journal, 2007. 18(11): p. 1343-1346.
281. Ravindran, T.S., R. Savitri, and A. Bhavani, Women’s experiences of utero-vaginal prolapse: a qualitative study from Tamil Nadu, India. Safe motherhood initiatives: critical issues, 1999: p. 166-172.
282. Matthews, Z., et al., Does early childbearing and a sterilization-focused family planning programme in India fuel population growth? Demographic Research, 2009. 20(28): p. 693-720.
283. Mavalankar, D.V. and B. Sharma, The Quality of Care in Sterilisation Camps: Evidence from Gujarat Chapter 14. 1999.
284. Hillis, S.D., et al., Higher hysterectomy risk for sterilized than nonsterilized women: findings from the U.S. Collaborative Review of Sterilization. OBSTETRICS AND GYNECOLOGY., 1998. 91(2): p. 241-6.
285. Ozerkan, K., et al., Menstrual pattern following tubal sterilization. Medical Science Monitor, 2010. 16(4): p. CR197-CR201.
286. Olenick, I., The risk of hysterectomy quadruples after women undergo sterilization. Family Planning Perspectives, 1998. 30(6): p. 297.
287. Moradan, S. and R. Gorbani, Is previous tubal ligation a risk factor for hysterectomy because of abnormal uterine bleeding? Oman Medical Journal, 2012. 27(4): p. 326-328.
288. Nankali, A., et al., Relationship between tubal ligation and risk of hysterectomy. Iranian Journal of Obstetrics, Gynecology and Infertility, 2012. 15(11): p. 16-21.
249
289. Lock, M., Encounters With Aging: Mythologies of Menopause in Japan and North America. 1993, Berkeley, University of California Press.
290. Brotherton, P.S. and V.-K. Nguyen, Revisiting Local Biology in the Era of Global Health. Medical anthropology, 2013. 32(4): p. 287-290.
291. Stankiewicz, A., L. Pogany, and C. Popadiuk, Prevalence of self-reported hysterectomy among Canadian women, 2000/2001-2008. Chronic Diseases and Injuries in Canada, 2014. 34(1): p. 30-35.
292. Gibbons, L., et al., The global numbers and costs of additionally needed and unnecessary caesarean sections performed per year: overuse as a barrier to universal coverage. World health report, 2010. 30: p. 1-31.
293. Hsieh, C.H., et al., Risk factors for urinary incontinence in Taiwanese women aged 20-59 years. Taiwan J Obstet Gynecol, 2008. 47(2): p. 197-202.
294. Erekson, E.A., et al., Socioeconomic indicators and hysterectomy status in the United States, 2004. J Reprod Med, 2009. 54(9): p. 553-8.
295. Ong, S., et al., Prevalence of hysterectomy in Ireland. International Journal of Gynecology & Obstetrics, 2000. 69(3): p. 243-247.
296. Kameswari, S. and P. Vinjamuri, Case Study on Unindicated Hysterectomies in Andhra Pradesh. 2013, Life-Health Reinforcement Group: National Workshop on Rising Hysterectomies in India, August 2013.
297. Lingard, L., M. Albert, and W. Levinson, Grounded theory, mixed methods, and action research. Bmj, 2008. 337(aug07_3): p. a567-a567.
298. Farquhar, C.M., et al., The association of hysterectomy and menopause: a prospective cohort study. BJOG: An International Journal of Obstetrics & Gynaecology, 2005. 112(7): p. 956-962.
299. Gold, E.B., et al., Factors Associated with Age at Natural Menopause in a Multiethnic Sample of Midlife Women. American Journal of Epidemiology, 2001. 153(9): p. 865-874.
300. Rocca, W.A., et al., Hysterectomy, oophorectomy, estrogen, and the risk of dementia. Neurodegener Dis, 2012. 10(1-4): p. 175-8.
301. Ingelsson, E., et al., Hysterectomy and risk of cardiovascular disease: a population-based cohort study. Eur Heart J, 2011. 32(6): p. 745-50.
302. Yeh, J.S., et al., Hysterectomy in young women associates with higher risk of stroke: A nationwide cohort study. International Journal of Cardiology, 2013. 168(3): p. 2616-2621.
303. Fletcher, H.M., et al., Cardiovascular disease risk factors in menopausal Jamaican black women after hysterectomy and bilateral oophorectomy: an observational study. West Indian Med J, 2010. 59(6): p. 625-32.
304. Rodriguez, M.C., et al., Assessment of sexuality after hysterectomy using the Female Sexual Function Index. J Obstet Gynaecol, 2012. 32(2): p. 180-4.
305. Hunter, M.S., et al., Prevalence, frequency and problem rating of hot flushes persist in older postmenopausal women: impact of age, body mass index, hysterectomy, hormone therapy use, lifestyle and mood in a cross-sectional cohort study of 10,418 British women aged 54-65. BJOG, 2012. 119(1): p. 40-50.
306. Hoga, L.A.K., et al., Psychosexual Perspectives of the Husbands of Women Treated With an Elective Hysterectomy. Health Care for Women International, 2012. 33(9): p. 799-813.
307. Cabness, J., The psychosocial dimensions of hysterectomy: private places and the inner spaces of women at midlife. Soc Work Health Care, 2010. 49(3): p. 211-26.
308. Bayram, G.O. and N.K. Beji, Psychosexual adaptation and quality of life after hysterectomy. Sexuality and Disability, 2010. 28(1): p. 3-13.
309. Brown, J.S., et al., Hysterectomy and urinary incontinence: a systematic review. The Lancet. 356(9229): p. 535-539.
310. Lilford, R.J., Hysterectomy: will it pay the bills in 2007? Treatment of choice for cancer, but a choice of treatment for menorrhagia, 1997. 314(7075): p. 160.
250
311. Bower, J.K., et al., Black-white differences in hysterectomy prevalence: the CARDIA study. American Journal of Public Health, 2009. 99(2): p. 300-307.
312. Hautaniemi, S.I. and L. Leidy Sievert, Risk factors for hysterectomy among Mexican-American women in the US southwest. Am J Hum Biol, 2003. 15(1): p. 38-47.
313. Nilangi, S., Why do young women accept hysterectomy? Findings from a study in Maharashtra, India. International Journal of Innovation and Applied Studies, 2014. 8(2): p. 579-585.
314. Selvaraj, S. and A.K. Karan, Why publicly-financed health insurance schemes are ineffective in providing financial risk protection. Economic & Political Weekly, 2012. 47(11): p. 61-68.
315. MacLean, R., In Mexico, hysterectomy is often used as treatment for cervical abnormalities. International Family Planning Perspectives, 2005. 31(2): p. 96-97.
316. Das, A. and S. Contractor, India’s latest sterilisation camp massacre. BMJ, 2014. 349: p. g7282.
317. Kay, M., India will collect data to tackle overuse of hysterectomy. Vol. 347. 2013. 318. Moore, B., Appropriate technology for birth. The Lancet, 1985. 326(8458): p. 787. 319. Dyck, F.J., et al., Effect of surveillance on the number of hysterectomies in the province of
Saskatchewan. New England Journal of Medicine, 1977. 296(23): p. 1326-8. 320. Hansen, C.T., et al., Establishment of a national Danish hysterectomy database: preliminary
report on the first 13,425 hysterectomies. Acta Obstet Gynecol Scand, 2008. 87(5): p. 546-57. 321. Bryce, J., et al., The Multi-Country Evaluation of the Integrated Management of Childhood
Illness Strategy: Lessons for the Evaluation of Public Health Interventions. American Journal of Public Health, 2004. 94(3): p. 406-415.
322. Nguyen, T.T., et al., Breast cancer screening among Vietnamese Americans: a randomized controlled trial of lay health worker outreach.[Erratum appears in Am J Prev Med. 2010 Apr;38(4):464]. American Journal of Preventive Medicine, 2009. 37(4): p. 306-13.
323. Pinto, R.M., S.B. da Silva, and R. Soriano, Community Health Workers in Brazil’s Unified Health System: A framework of their praxis and contributions to patient health behaviors. Social science & medicine, 2012. 74(6): p. 940-947.
324. Gogia, S. and H.S. Sachdev, Home visits by community health workers to prevent neonatal deaths in developing countries: a systematic review. Bulletin of the World Health Organization, 2010. 88(9): p. 658-666B.
325. Bowen, A., et al., Sustained improvements in handwashing indicators more than 5 years after a cluster-randomised, community-based trial of handwashing promotion in Karachi, Pakistan. Tropical Medicine & International Health, 2013. 18(3): p. 259-267.
326. Luby, S., et al., Microbiologic effectiveness of hand washing with soap in an urban squatter settlement, Karachi, Pakistan. Epidemiology and infection, 2001. 127(02): p. 237-244.
327. Rowland, M., et al., DEET mosquito repellent provides personal protection against malaria: a household randomized trial in an Afghan refugee camp in Pakistan. Tropical Medicine & International Health, 2004. 9(3): p. 335-342.
328. Biran, A., et al., The effect of a soap promotion and hygiene education campaign on handwashing behaviour in rural India: a cluster randomised trial. Tropical Medicine & International Health, 2009. 14(10): p. 1303-1314.
329. Curtis, V.A., L.O. Danquah, and R.V. Aunger, Planned, motivated and habitual hygiene behaviour: an eleven country review. Health Education Research, 2009. 24(4): p. 655-673.
330. Manandhar, D.S., et al., Effect of a participatory intervention with women's groups on birth outcomes in Nepal: cluster-randomised controlled trial. Lancet, 2004. 364(9438): p. 970-979.
331. Tripathy, P., et al., Effect of a participatory intervention with women's groups on birth outcomes and maternal depression in Jharkhand and Orissa, India: a cluster-randomised controlled trial. Lancet (North American Edition), 2010. 375(9721): p. 1182-1192.
251
332. Azad, K., et al., Effect of scaling up women's groups on birth outcomes in three rural districts in Bangladesh: a cluster-randomised controlled trial. Lancet, 2010. 375(9721): p. 1193-1202.
333. Braun, R., et al., Community health workers and mobile technology: a systematic review of the literature. PloS one, 2013. 8(6): p. e65772.
334. Wakefield, M.A., B. Loken, and R.C. Hornik, Use of mass media campaigns to change health behaviour. The Lancet, 2010. 376(9748): p. 1261-1271.
335. Naugle, D.A. and R.C. Hornik, Systematic review of the effectiveness of mass media interventions for child survival in low-and middle-income countries. Journal of health communication, 2014. 19(sup1): p. 190-215.
336. Domenighetti, G., et al., EFFECT OF INFORMATION CAMPAIGN BY THE MASS MEDIA ON HYSTERECTOMY RATES. The Lancet. 332(8626): p. 1470-1473.
337. Grant, A., et al., Process evaluations for cluster-randomised trials of complex interventions: a proposed framework for design and reporting. Trials, 2013. 14(1): p. 15.
338. Pawson, R. and N. Tilley, Realistic evaluation. 1997: Sage. 339. Wight, D. and A. Obasi, Unpacking the black box: the importance of process data to explain
outcomes, in Effective sexual health interventions: issues in experimental evaluation. , J. Stephenson, J. Imrie, and C. Bonell, Editors. 2003, Oxford University Press: Oxford. p. 151-66.
340. Oakley, A., et al., Process evaluation in randomised controlled trials of complex interventions. BMJ : British Medical Journal, 2006. 332(7538): p. 413-416.
252
List of Annexes
Annex 1 Literature Search: Women’s morbidity patterns in India
Annex 2 Overview of articles reviewed on CHW-led group education
Annex 3 Survey instruments
Annex 4 Hysterectomy interview guides
Annex 5 Process evaluation guides
Annex 6 Information sheets and study protocol for survey
Annex 7 Information sheets for qualitative research
Annex 8 Ethical approvals
Annex 9 Baseline claims rates
Annex 10 Baseline hospitalisation rates
Annex 11 Baseline morbidity rates
Annex 12 Tables on causes of hospitalisation and morbidity
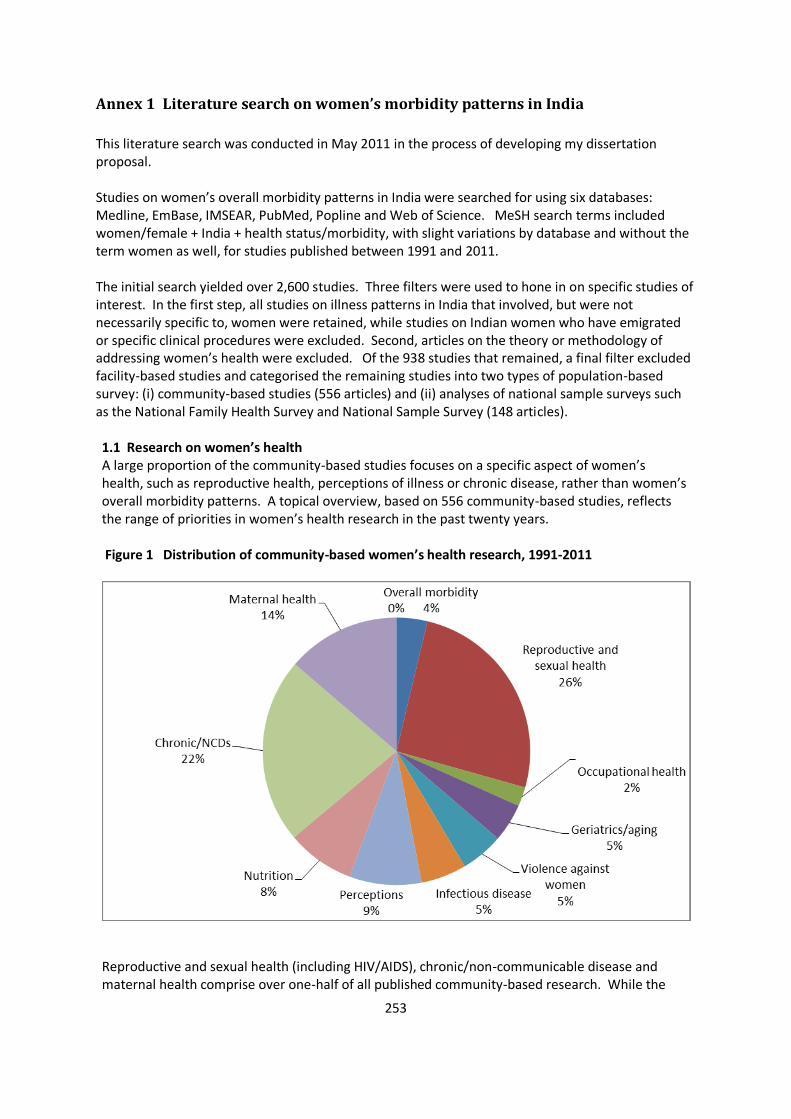
253
Annex 1 Literature search on women’s morbidity patterns in India
This literature search was conducted in May 2011 in the process of developing my dissertation proposal. Studies on women’s overall morbidity patterns in India were searched for using six databases: Medline, EmBase, IMSEAR, PubMed, Popline and Web of Science. MeSH search terms included women/female + India + health status/morbidity, with slight variations by database and without the term women as well, for studies published between 1991 and 2011. The initial search yielded over 2,600 studies. Three filters were used to hone in on specific studies of interest. In the first step, all studies on illness patterns in India that involved, but were not necessarily specific to, women were retained, while studies on Indian women who have emigrated or specific clinical procedures were excluded. Second, articles on the theory or methodology of addressing women’s health were excluded. Of the 938 studies that remained, a final filter excluded facility-based studies and categorised the remaining studies into two types of population-based survey: (i) community-based studies (556 articles) and (ii) analyses of national sample surveys such as the National Family Health Survey and National Sample Survey (148 articles). 1.1 Research on women’s health A large proportion of the community-based studies focuses on a specific aspect of women’s health, such as reproductive health, perceptions of illness or chronic disease, rather than women’s overall morbidity patterns. A topical overview, based on 556 community-based studies, reflects the range of priorities in women’s health research in the past twenty years. Figure 1 Distribution of community-based women’s health research, 1991-2011
Reproductive and sexual health (including HIV/AIDS), chronic/non-communicable disease and maternal health comprise over one-half of all published community-based research. While the
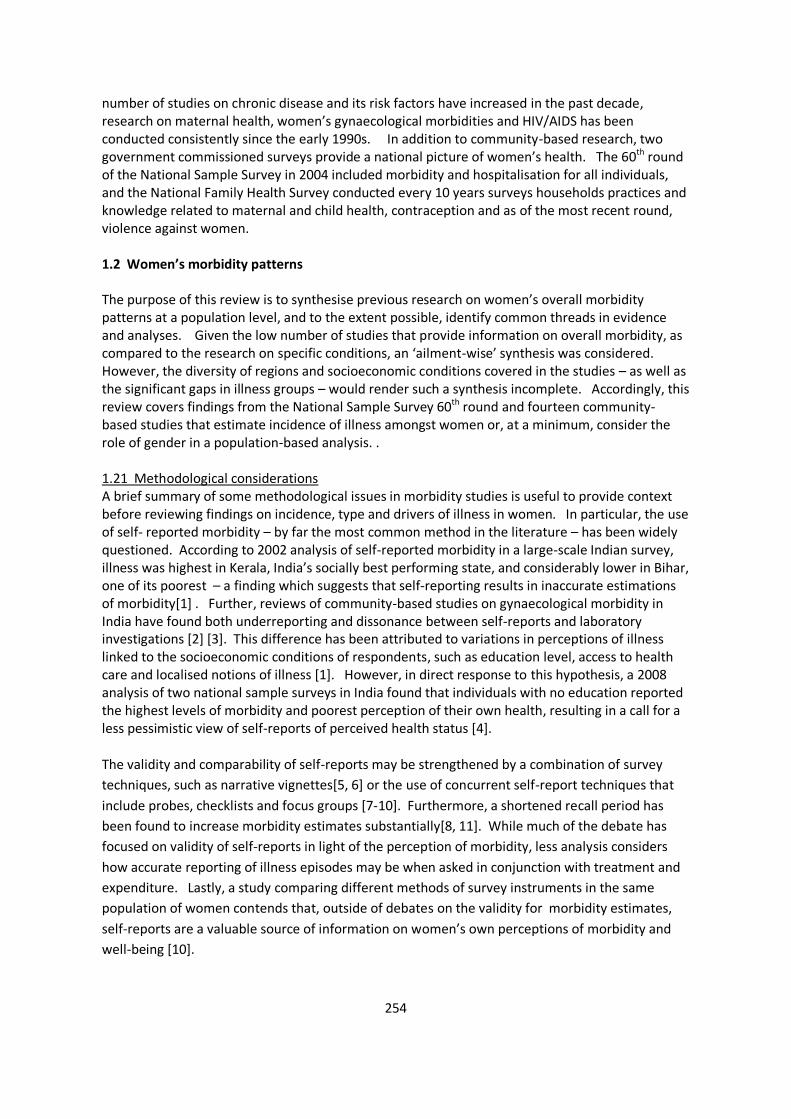
254
number of studies on chronic disease and its risk factors have increased in the past decade, research on maternal health, women’s gynaecological morbidities and HIV/AIDS has been conducted consistently since the early 1990s. In addition to community-based research, two government commissioned surveys provide a national picture of women’s health. The 60th round of the National Sample Survey in 2004 included morbidity and hospitalisation for all individuals, and the National Family Health Survey conducted every 10 years surveys households practices and knowledge related to maternal and child health, contraception and as of the most recent round, violence against women. 1.2 Women’s morbidity patterns The purpose of this review is to synthesise previous research on women’s overall morbidity patterns at a population level, and to the extent possible, identify common threads in evidence and analyses. Given the low number of studies that provide information on overall morbidity, as compared to the research on specific conditions, an ‘ailment-wise’ synthesis was considered. However, the diversity of regions and socioeconomic conditions covered in the studies – as well as the significant gaps in illness groups – would render such a synthesis incomplete. Accordingly, this review covers findings from the National Sample Survey 60th round and fourteen community-based studies that estimate incidence of illness amongst women or, at a minimum, consider the role of gender in a population-based analysis. . 1.21 Methodological considerations A brief summary of some methodological issues in morbidity studies is useful to provide context before reviewing findings on incidence, type and drivers of illness in women. In particular, the use of self- reported morbidity – by far the most common method in the literature – has been widely questioned. According to 2002 analysis of self-reported morbidity in a large-scale Indian survey, illness was highest in Kerala, India’s socially best performing state, and considerably lower in Bihar, one of its poorest – a finding which suggests that self-reporting results in inaccurate estimations of morbidity[1] . Further, reviews of community-based studies on gynaecological morbidity in India have found both underreporting and dissonance between self-reports and laboratory investigations [2] [3]. This difference has been attributed to variations in perceptions of illness linked to the socioeconomic conditions of respondents, such as education level, access to health care and localised notions of illness [1]. However, in direct response to this hypothesis, a 2008 analysis of two national sample surveys in India found that individuals with no education reported the highest levels of morbidity and poorest perception of their own health, resulting in a call for a less pessimistic view of self-reports of perceived health status [4]. The validity and comparability of self-reports may be strengthened by a combination of survey
techniques, such as narrative vignettes[5, 6] or the use of concurrent self-report techniques that
include probes, checklists and focus groups [7-10]. Furthermore, a shortened recall period has
been found to increase morbidity estimates substantially[8, 11]. While much of the debate has
focused on validity of self-reports in light of the perception of morbidity, less analysis considers
how accurate reporting of illness episodes may be when asked in conjunction with treatment and
expenditure. Lastly, a study comparing different methods of survey instruments in the same
population of women contends that, outside of debates on the validity for morbidity estimates,
self-reports are a valuable source of information on women’s own perceptions of morbidity and
well-being [10].
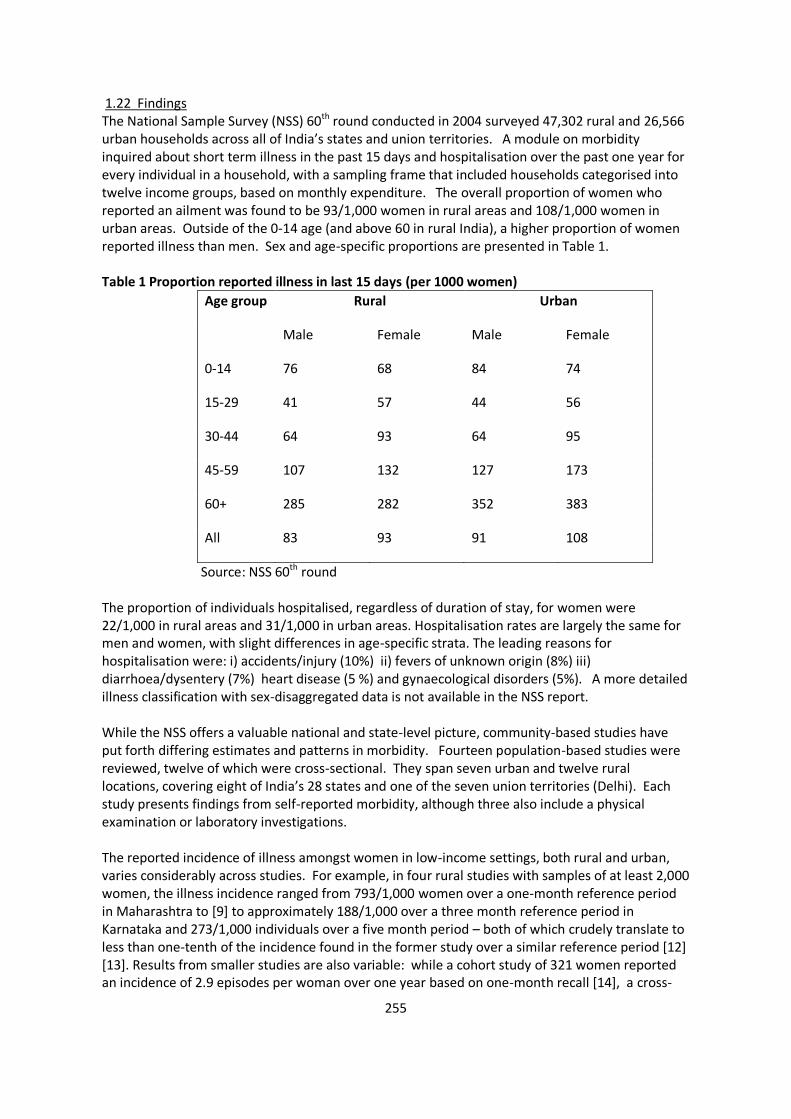
255
1.22 Findings The National Sample Survey (NSS) 60th round conducted in 2004 surveyed 47,302 rural and 26,566 urban households across all of India’s states and union territories. A module on morbidity inquired about short term illness in the past 15 days and hospitalisation over the past one year for every individual in a household, with a sampling frame that included households categorised into twelve income groups, based on monthly expenditure. The overall proportion of women who reported an ailment was found to be 93/1,000 women in rural areas and 108/1,000 women in urban areas. Outside of the 0-14 age (and above 60 in rural India), a higher proportion of women reported illness than men. Sex and age-specific proportions are presented in Table 1. Table 1 Proportion reported illness in last 15 days (per 1000 women)
Age group Rural Urban
Male Female Male Female
0-14 76 68 84 74
15-29 41 57 44 56
30-44 64 93 64 95
45-59 107 132 127 173
60+ 285 282 352 383
All 83 93 91 108
Source: NSS 60th round The proportion of individuals hospitalised, regardless of duration of stay, for women were 22/1,000 in rural areas and 31/1,000 in urban areas. Hospitalisation rates are largely the same for men and women, with slight differences in age-specific strata. The leading reasons for hospitalisation were: i) accidents/injury (10%) ii) fevers of unknown origin (8%) iii) diarrhoea/dysentery (7%) heart disease (5 %) and gynaecological disorders (5%). A more detailed illness classification with sex-disaggregated data is not available in the NSS report. While the NSS offers a valuable national and state-level picture, community-based studies have put forth differing estimates and patterns in morbidity. Fourteen population-based studies were reviewed, twelve of which were cross-sectional. They span seven urban and twelve rural locations, covering eight of India’s 28 states and one of the seven union territories (Delhi). Each study presents findings from self-reported morbidity, although three also include a physical examination or laboratory investigations. The reported incidence of illness amongst women in low-income settings, both rural and urban, varies considerably across studies. For example, in four rural studies with samples of at least 2,000 women, the illness incidence ranged from 793/1,000 women over a one-month reference period in Maharashtra to [9] to approximately 188/1,000 over a three month reference period in Karnataka and 273/1,000 individuals over a five month period – both of which crudely translate to less than one-tenth of the incidence found in the former study over a similar reference period [12] [13]. Results from smaller studies are also variable: while a cohort study of 321 women reported an incidence of 2.9 episodes per woman over one year based on one-month recall [14], a cross-
256
sectional study of 348 households with fourteen-day recall reported 80/1,000 women ill [15]. This range also emerges in urban studies: a cross-sectional study amongst slum dwellers in Mumbai found 571/1,000 women ill in the past month, compared to a cohort study in Delhi that found 750/1,000 persons (sex breakdown not available) reported an illness in the same time period, albeit with weekly reporting [11]. While a cross-sectional study found 166/1,000 illnesses over a five month recall period [13], a large study of urban slums reported 104/1,000 women ill in Delhi and 83/1,000 in Chennai over a one-month period [16]. Overall, the findings, even if crudely standardised to a one-month reference period, are vastly different from one another as well as the NSS. Regional diversity may be one explanation: two multi-site studies found that illness incidence varied considerably by geographic location in similar socioeconomic groups [16, 17]. The pattern of illnesses reported were largely similar: fever, respiratory illness and gynaecological morbidities emerged as the most common reported illnesses amongst self-reports [9, 16, 18,19]. In a study that utilised medical examinations for depression, anaemia and reproductive tract infections amongst women, the latter comprised the largest proportion of illness episodes of the three[20]. A similar ranking exercise conducted with self-reported illness amongst a cohort of married women under 35 years found that circulatory/respiratory illnesses were the most prominent, followed by reproductive and infective/parasitic illnesses [14]. Notably, two health utilisation studies did not find gynaecological ailments to be amongst the top illness episodes, perhaps because the survey focused on expenditure [11, 16]. Some studies – particularly those focused on economic impact of illness or health service utilisation – did not report sex-disaggregated illness patterns or link treatment behaviour to of type of illness. Both the NSS and community-based studies largely converge on basic patterns: reported morbidity is consistently higher amongst adult women than men, with a few exceptions. Living conditions and socioeconomic status emerged as indicators of illness, although it is useful to note that the reporting of morbidity itself may be linked to socioeconomic or geographic context. While the patterns of reported are also similar – mainly primary and gynaecological illness –the NSS data only concerns hospitalisation while the community-based studies largely do not differentiate by treatment patterns. 1.3 Analysis The primary strength of this combination of one national and several community-based studies is a nuanced perspective of overall morbidity amongst women, with a wide range of estimates and insight into different aspects of women’s health. Despite the considerable variation, the existing research offers the evidence that reported morbidity is higher amongst women in most settings. The predominant burden of respiratory illness, reproductive –related disorders and fevers point to the need for further understanding to inform public health interventions, particularly for preventable and primary illness. This diversity in findings underscores the critical role of methodology in measuring morbidity. Each study utilised different definitions and classification methods for illness and treatment, thus limiting comparability, while the low number of studies prevents any assessment of relative accuracy. In consideration of the ongoing debates, this review notes that (i) validity checks or a combination of survey techniques is a desirable complement to self-reported morbidity (ii) there is a need for further research on methodological issues, including standard variables for comparability.
257
A broader methodological limitation of the existing studies is that most of the studies are either epidemiological or economic in nature, but rarely both. A lack of illness information in health utilisation studies prevents analysis of implications for resource allocation, rationing of care and prevention. Similarly, epidemiological studies that do not track treatment and expenditure rely largely on self-reporting of symptoms or episodes to understand the severity, perception and economic impact of illness. A combined economic-epidemiological approach, as adopted by the NSS and three of the reviewed studies, offers a potentially powerful assessment of women’s health from multiple perspectives. Moreover, only four of the studies analysed correlates of illness in a multivariate setting – one of which found gender to be insignificant explanation for illness patterns [17]. Most critically, the combined information of fourteen community studies over twenty years and one national survey is not sufficient to set priorities at a local or national level for women’s health. The sheer lack of studies on women’s overall morbidity patterns – a limitation in of itself – also raises questions about the production of research knowledge and determinants of research agendas. There is also limited insight at present on potentially important associations to explain morbidity patterns amongst women. While it could be argued that the National Sample Survey provides sufficient information on women’s overall morbidity, it is clear that community-based studies may capture nuances that a large-scale survey may not, potentially improve validity of self-reports through the use of different methods, as well as serve as a localised evidence base to inform policy and programs. A need for more systematic and analytical research on women’s morbidity patterns emerges, as does the importance of using a combination of methods to enhance current understanding of women’s health needs in India. References 1. Sen A: Health: perception versus observation. Bmj 2002, 324(7342):860-861. 2. Koenig M, Jejeebhoy S, Singh S, Sridhar S: Investigating women's gynaecological morbidity in India: not just another KAP survey. Reproductive Health Matters 1998, 6(11):84-97. 3. Bhatia J, Cleland J: Methodological issues in community-based studies of gynecological morbidity. Studies in Family Planning 2000, 31(4):267-273. 4. Subramanian SV, Subramanyam MA, Selvaraj S, Kawachi I: Are self-reports of health and morbidities in developing countries misleading? Evidence from India. Social Science & Medicine 2009, 68(2):260-265. 5. King G, Murray CJL, Salomon JA, Tandon A: Enhancing the validity and cross-cultural comparability of measurement in survey research. American Political Science Review 2003, 97(04):567-583. 6. Salomon JA, Tandon A, Murray CJL: Comparability of self rated health: cross sectional multi-country survey using anchoring vignettes. Bmj 2004, 328(7434):258. 7. Nyblade L, Edmeades J, Pearson E: Self-reported abortion-related morbidity: a comparison of measures in Madhya Pradesh, India. International perspectives on sexual and reproductive health 2010, 36(3):140-148. 8. Madhiwalla NJA: Morbidity Among Women In Mumbai City: Impact of Work and Environment. . Economic and Political Weekly 1997, 32 ((43).):p. ws. 38-ws. 49. 9. Madhiwalla N, Nandraj S, Sinha R, Health CfEI, Themes A: Health, Households, and Women's Lives: A Study of Illness and Childbearing Among Women in Nasik District, Maharashtra. In.: Cehat; 2000. 10. Kielmann K, Bentley M: Thresholds of morbidity among women in a peri-urban community of Maharashtra, India: conceptual and methodological issues. Journal of Health Psychology 2003,
258
8(5):525-538. 11. Das J: Short but not Sweet. World Bank Development Research Group Policy Research Working Paper 2003, 2971. 12. Sen G, Iyer A, George A: Systematic hierarchies and systematic failures: gender and health inequities in Koppal District. Economic and Political Weekly 2007, 42(8):682-690. 13. Majumder A: Epidemiologic Profile and Utilisation of Health Care in North Bengal. Journal of Human Ecology 2006, 19(4):289-298. 14. Bhatia J, Cleland J: The contribution of reproductive ill-health to the overall burden of perceived illness among women in southern India. Bulletin of the World Health Organization 2001, 79(11):1065-1069. 15. Asthana S: Variations in poverty and health between slum settlements: contradictory findings from Visakhapatnam, India. Social Science & Medicine 1995, 40(2):177-188. 16. Sundar R, Sharma A: Morbidity and Utilisation of Healthcare Services: A Survey of Urban Poor in Delhi and Chennai. Economic and Political Weekly 2002:4729-4740. 17. Dror DM, van Putten-Rademaker O, Koren R: Incidence of illness among resource-poor households: Evidence from five locations in India. Indian Journal of Medical Research 2009, 130(2):146-154. 18. Bamji MS, Murthy PVVS, Kumar KVSR, Bhargavi D, Devyani D: Health and nutrition problems and health care seeking practices of rural women and children-lessons for health and nutrition entrepreneur's training. Indian Pediatrics 2000, 37(7):807-808. 19. Ravindran TKS: Women’s Health in a Rural Poor Population in Tamil Nadu’. Women's Health in India 1995:175-211. 20. Patel UV, Yadav S: Reproductive and general health problems among women in the reproductive age group in Jamnagar. Health and Population Perspectives and Issues 2006, 29(4):212-223.
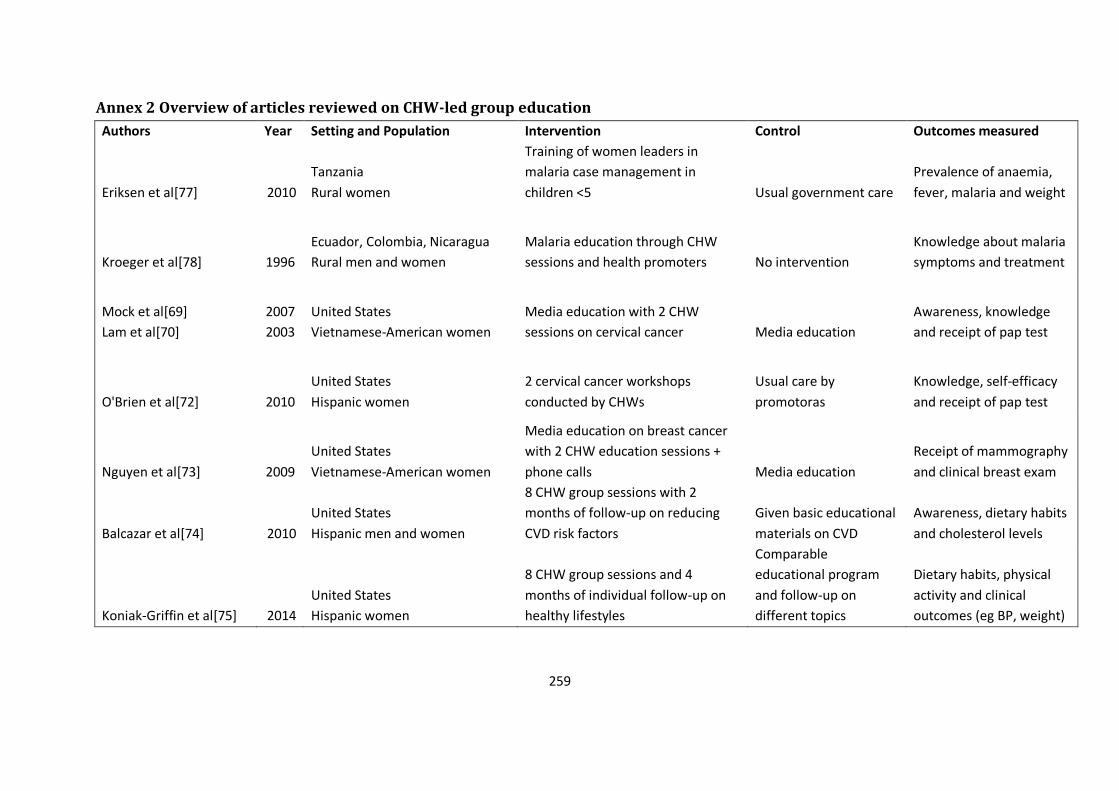
259
Annex 2 Overview of articles reviewed on CHW-led group education
Authors Year Setting and Population Intervention Control Outcomes measured
Eriksen et al[77] 2010
Tanzania
Rural women
Training of women leaders in
malaria case management in
children <5 Usual government care
Prevalence of anaemia,
fever, malaria and weight
Kroeger et al[78] 1996
Ecuador, Colombia, Nicaragua
Rural men and women
Malaria education through CHW
sessions and health promoters No intervention
Knowledge about malaria
symptoms and treatment
Mock et al[69]
Lam et al[70]
2007
2003
United States
Vietnamese-American women
Media education with 2 CHW
sessions on cervical cancer Media education
Awareness, knowledge
and receipt of pap test
O'Brien et al[72] 2010
United States
Hispanic women
2 cervical cancer workshops
conducted by CHWs
Usual care by
promotoras
Knowledge, self-efficacy
and receipt of pap test
Nguyen et al[73] 2009
United States
Vietnamese-American women
Media education on breast cancer
with 2 CHW education sessions +
phone calls Media education
Receipt of mammography
and clinical breast exam
Balcazar et al[74] 2010
United States
Hispanic men and women
8 CHW group sessions with 2
months of follow-up on reducing
CVD risk factors
Given basic educational
materials on CVD
Awareness, dietary habits
and cholesterol levels
Koniak-Griffin et al[75] 2014
United States
Hispanic women
8 CHW group sessions and 4
months of individual follow-up on
healthy lifestyles
Comparable
educational program
and follow-up on
different topics
Dietary habits, physical
activity and clinical
outcomes (eg BP, weight)
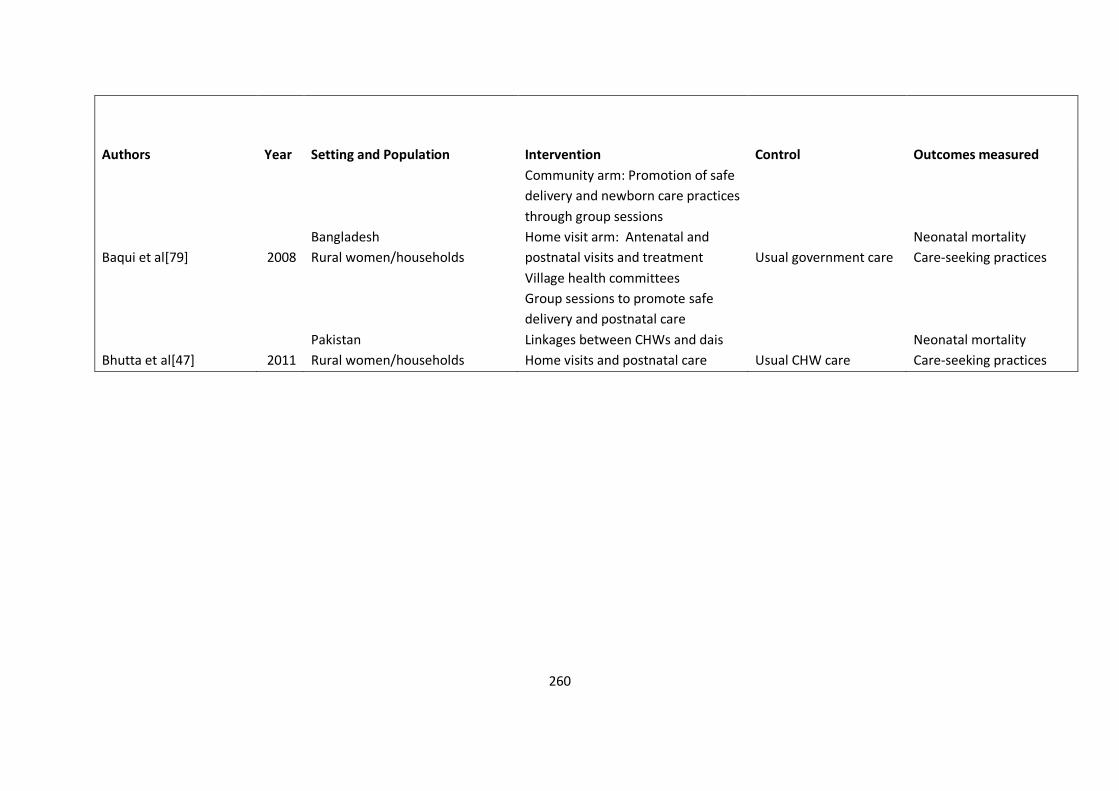
260
Authors Year Setting and Population Intervention Control Outcomes measured
Baqui et al[79] 2008
Bangladesh
Rural women/households
Community arm: Promotion of safe
delivery and newborn care practices
through group sessions
Home visit arm: Antenatal and
postnatal visits and treatment Usual government care
Neonatal mortality
Care-seeking practices
Bhutta et al[47] 2011
Pakistan
Rural women/households
Village health committees
Group sessions to promote safe
delivery and postnatal care
Linkages between CHWs and dais
Home visits and postnatal care Usual CHW care
Neonatal mortality
Care-seeking practices
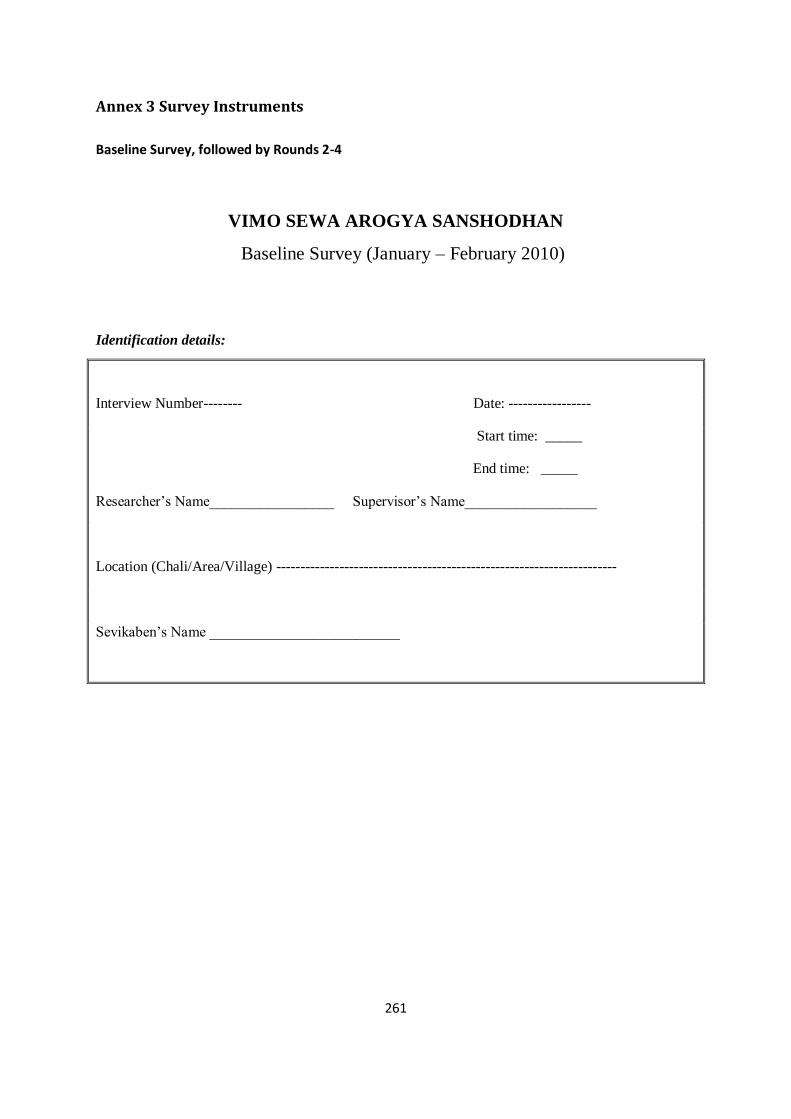
261
Annex 3 Survey Instruments
Baseline Survey, followed by Rounds 2-4
VIMO SEWA AROGYA SANSHODHAN
Baseline Survey (January – February 2010)
Identification details:
Interview Number-------- Date: -----------------
Start time: _____
End time: _____
Researcher’s Name_________________ Supervisor’s Name__________________
Location (Chali/Area/Village) ----------------------------------------------------------------------
Sevikaben’s Name __________________________

262
Section 1: BACKGROUND INFORMATION
(Note: Please place a mark in the appropriate box provided with options wherever applicable).
A. PERSONAL DETAILS
1. Respondent’s Full Name: _____________________________________________
2. Address: ___________________________________________________________
3. Are you a member of SEWA? (1) Yes □ (2) No □
4. If yes, for how many years have you been a member? _ _ ._ _ (YY.MM)
5. Do you have any of SEWA’s insurance products? (1) Yes □ (2) No □
6. Mother tongue: (1) Gujarati (3) Marwari (5) Other (specify) ______
(2) Hindi (4) Marathi
7. Religion:
1. Hindu 4. Christian
2. Muslim 5. Other, specify _______
3. Sikh
8. For how many years have you been staying at the present house? _ _ . _ _ (YY.MM)
(If the respondent is residing for less than one year, then skip to section B. Do not ask questions 9 and
10).
9. Where did you stay one year ago? __________________________________
10. How long do you plan to stay in this house? _ _ . _ _ (YY.MM)

263
B. HOUSEHOLD INFORMATION
(Definition of Family: Those members of the household who cook and have meals from the same
kitchen).
Complete the following table for each person living in the house, starting with the respondent first as
well as any household persons who have died in the past 6 months preceding the survey. Fill in the
name first then fill the details horizontally from 3rd column. Put an * after the names of the expired
members.
11. Total Family Members: _ _ (1) Joint family (2) Nuclear family
1
Sr.
No
2
Name
3
Age
4
Sex
[code]
5
Relation with
Respondent
[code]
6
Marital
Status
[code]
7
Education
[code]
8
Still
Studying?
[code]
9
Any other
source of
earning
per
month?
(rent,
pension,
scholarshi
p etc)
10
Do you
work/help
in work in
the
present
year?
[code] 1.
2.
3.
4.
5.
6.
7.
Coding categories:
4 Sex 5 Relation with the respondents 6 Marital
Status
7 Education 8 Still studying
1 Male 1. Self 1. Married 0 illiterate (Not gone
in school)
1. Yes
2
Female
2. Husband 2. Un
married
K kinder garden 2. No
3. Son/ Daughter 3. Divorcee 1-12 Classes (write
actual class)
99. 0-3 years
4. Mother/ Father 4. Widow/
Widower
13 Graduate (1,2,3
years)
5. Parents in law 5. Separated 14 Post Graduate (1, 2
years)
9 Any other
source of earning
per month?
6. Son/ Daughter in law 15 Technical
Education (diploma
course)
1. Government
help
7. Brother/ Sister 16. Vocational
training
2. Scholarship
8.Grandson/ Grand Daughter 17. Any other 3. Pension
9. Niece/ Nephew 77. Can read and write 4. Rent
10. Uncle/ Aunt 88. Don't know 5. Money sent
by employed
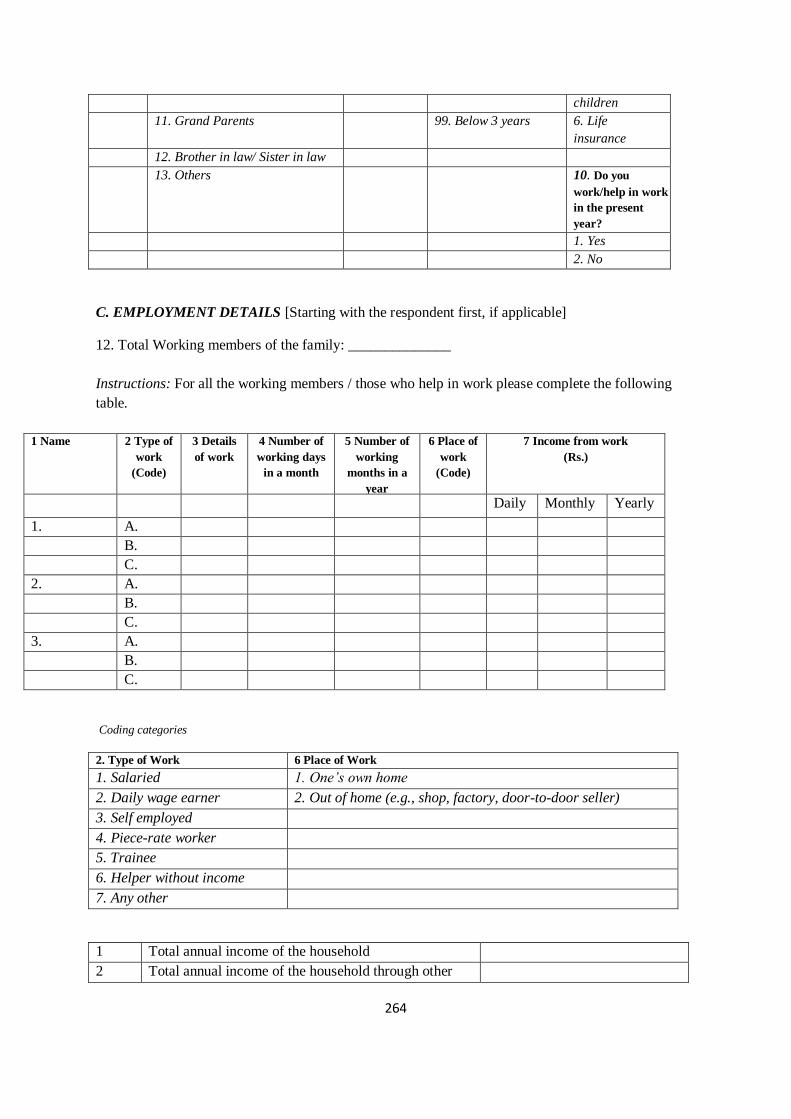
264
children
11. Grand Parents 99. Below 3 years 6. Life
insurance
12. Brother in law/ Sister in law
13. Others 10. Do you
work/help in work
in the present
year?
1. Yes
2. No
C. EMPLOYMENT DETAILS [Starting with the respondent first, if applicable]
12. Total Working members of the family: ______________
Instructions: For all the working members / those who help in work please complete the following
table.
1 Name 2 Type of
work
(Code)
3 Details
of work
4 Number of
working days
in a month
5 Number of
working
months in a
year
6 Place of
work
(Code)
7 Income from work
(Rs.)
Daily Monthly Yearly
1. A.
B.
C.
2. A.
B.
C.
3. A.
B.
C.
Coding categories
2. Type of Work 6 Place of Work
1. Salaried 1. One’s own home
2. Daily wage earner 2. Out of home (e.g., shop, factory, door-to-door seller)
3. Self employed
4. Piece-rate worker
5. Trainee
6. Helper without income
7. Any other
1 Total annual income of the household
2 Total annual income of the household through other
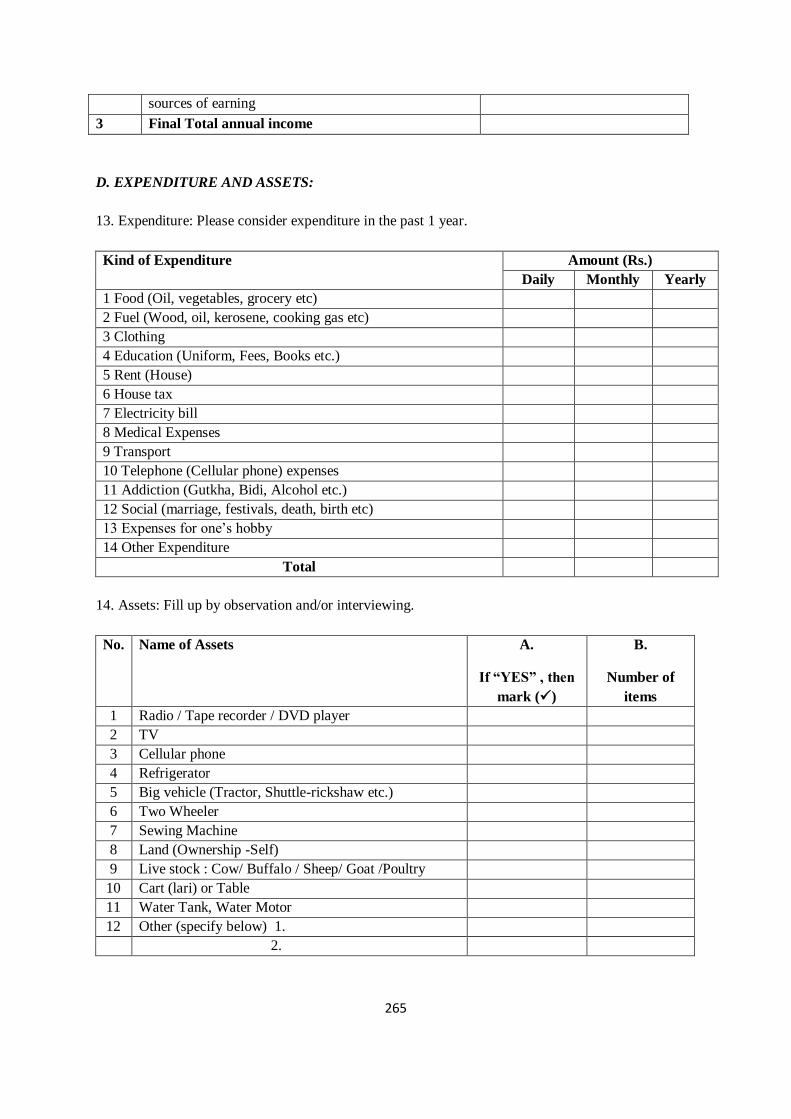
265
sources of earning
3 Final Total annual income
D. EXPENDITURE AND ASSETS:
13. Expenditure: Please consider expenditure in the past 1 year.
Kind of Expenditure Amount (Rs.)
Daily Monthly Yearly
1 Food (Oil, vegetables, grocery etc)
2 Fuel (Wood, oil, kerosene, cooking gas etc)
3 Clothing
4 Education (Uniform, Fees, Books etc.)
5 Rent (House)
6 House tax
7 Electricity bill
8 Medical Expenses
9 Transport
10 Telephone (Cellular phone) expenses
11 Addiction (Gutkha, Bidi, Alcohol etc.)
12 Social (marriage, festivals, death, birth etc)
13 Expenses for one’s hobby
14 Other Expenditure
Total
14. Assets: Fill up by observation and/or interviewing.
No. Name of Assets A.
If “YES” , then
mark ()
B.
Number of
items
1 Radio / Tape recorder / DVD player
2 TV
3 Cellular phone
4 Refrigerator
5 Big vehicle (Tractor, Shuttle-rickshaw etc.)
6 Two Wheeler
7 Sewing Machine
8 Land (Ownership -Self)
9 Live stock : Cow/ Buffalo / Sheep/ Goat /Poultry
10 Cart (lari) or Table
11 Water Tank, Water Motor
12 Other (specify below) 1.
2.

266
Section 2: HOUSING INFRASTRUCTURE
Housing
15. Ownership of the house
(1) Female member’s (Respondent’s) ownership □ (2) Husband’s ownership □
(3) Other family member’s ownership □____________ (4) Don’t know □
(5) Rented □ (6) Any other ___________
16. Type of house (observe)
(1) Kaccha □ (2) Semi pucca □ (3) Pucca □
17. What is the main source of light in your home ?
Note: (All respondents should be asked, “Do you use solar light at your home”?)
(1) Electricity □ (2) Solar □
(3) Oil/kerosene □ (4) Other specify_______
Water and Sanitation:
18. What is your source for drinking water? (Multiple responses are possible)
(1) Tap (individual) □ (2) Tap (shared) □ (3) Neighbour’s house □ (4) Well □ (5) Hand pump (individual) □ (6) Hand pump (shared) □ (7) Pond/ River/ Lank □ (8) Canal □ (9) Tanker □ (10) Other specify _________
19. How far is this water source from your home?
(1) 0 - 15 minutes □ (2) 16 - 30 minutes □ (3) 31 to 45 minutes □
(4) 46 - 60 minutes □ (5) Other specify _________
20. Do you do anything to make your water safe to drink ?
(1) Boil □ (2) Filter □ (cotton cloth, plastic filter etc) (3) Nothing □ (4) Other____________________________________
21. Do you use chlorine tablets to make your water safe to drink? (1)Yes □ (2) No □
(1) If yes than why ________________________________________________
(2) If no than why _________________________________________________
22. How do you take drinking water from holder?
(1) Through hands □ (2) Through Doyo □
(3) Holder/Pot with tap □ (4) Other ___________________________________
23. Do you have toilet at your home? Yes □ No □

267
23.1 If no then where do you go for toilet?
(1) Outside home in open fields/space □ (2) Public toilets □
(3) Pay and use toilets □ (4) Other.____________________
24. Do you keep soap at home? Yes □ No □
If yes, when do you wash your hands?
(1) Prior to cooking □ (2) After using the toilet □
(3) When children’s hands get dirty □ (4) Before eating____________
If no, then why don’t you wash your hands with soap?
____________________________________________________________________
25. What kind of precautions do you use for mosquitoes?
(1) Mosquito Net □ (2) Neem leaves □
(3) All Out/Good Knight mat □ (4) Jadi butti of SEWA □
(5) Odomos/any other ointment □ (6) Nothing is used □
(7) Any other_________________________________________________________
26. What kind of fuel is used for cooking?
(1) Wood □ (2) Coal □ (3) Kerosene (primas) Stove □
(4) Gas cylinder □ (5) Gobar gas □
27. Where is your stove situated?
(1) In the Kitchen □ (2) Outside □ (3) At both the places □
28. If, it is in the kitchen then is there any ventilation facility available?
(1) Yes □ (2) No □
If yes, please indicate the
same_________________________________________________________________
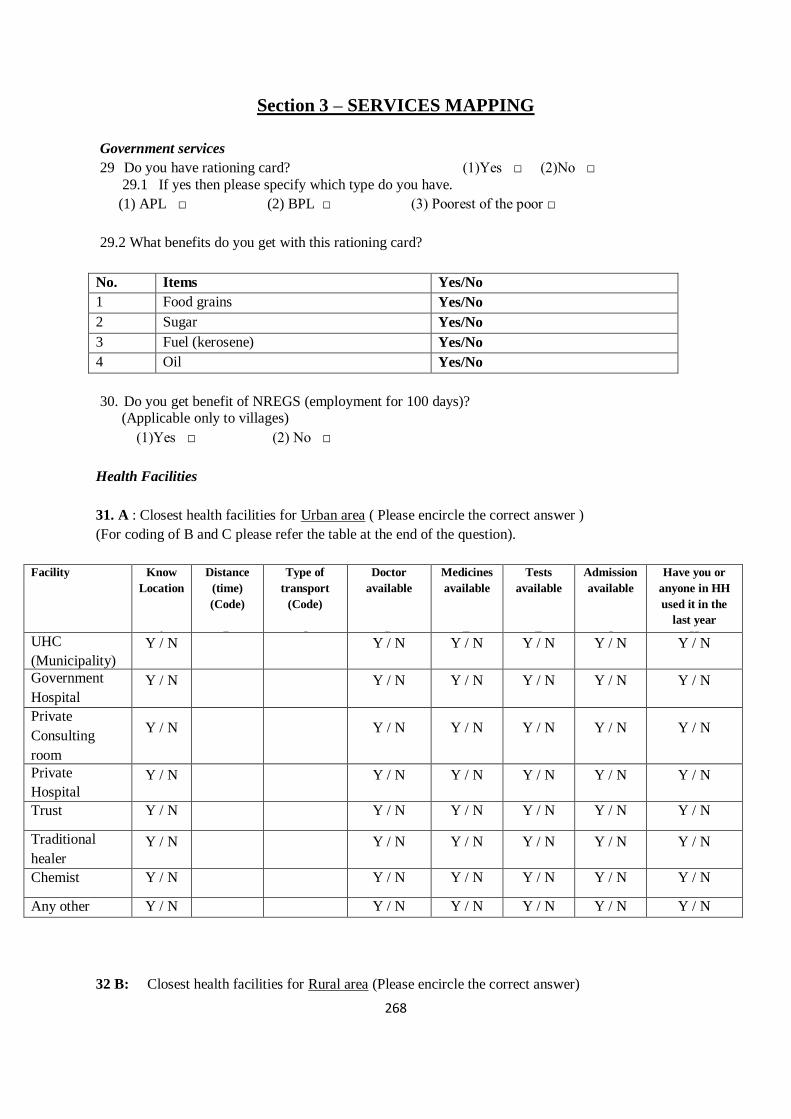
268
Section 3 – SERVICES MAPPING
Government services
29 Do you have rationing card? (1)Yes □ (2)No □
29.1 If yes then please specify which type do you have.
(1) APL □ (2) BPL □ (3) Poorest of the poor □
29.2 What benefits do you get with this rationing card?
No. Items Yes/No
1 Food grains Yes/No
2 Sugar Yes/No
3 Fuel (kerosene) Yes/No
4 Oil Yes/No
30. Do you get benefit of NREGS (employment for 100 days)? (Applicable only to villages)
(1)Yes □ (2) No □
Health Facilities
31. A : Closest health facilities for Urban area ( Please encircle the correct answer )
(For coding of B and C please refer the table at the end of the question).
Facility Know
Location
A
Distance
(time)
(Code)
B
Type of
transport
(Code)
C
Doctor
available
D
Medicines
available
E
Tests
available
F
Admission
available
G
Have you or
anyone in HH
used it in the
last year
H UHC
(Municipality) Y / N Y / N Y / N Y / N Y / N Y / N
Government
Hospital
Y / N Y / N Y / N Y / N Y / N Y / N
Private
Consulting
room
Y / N Y / N Y / N Y / N Y / N Y / N
Private
Hospital
Y / N Y / N Y / N Y / N Y / N Y / N
Trust Y / N Y / N Y / N Y / N Y / N Y / N
Traditional
healer
Y / N Y / N Y / N Y / N Y / N Y / N
Chemist Y / N Y / N Y / N Y / N Y / N Y / N
Any other
Y / N Y / N Y / N Y / N Y / N Y / N
32 B: Closest health facilities for Rural area (Please encircle the correct answer)
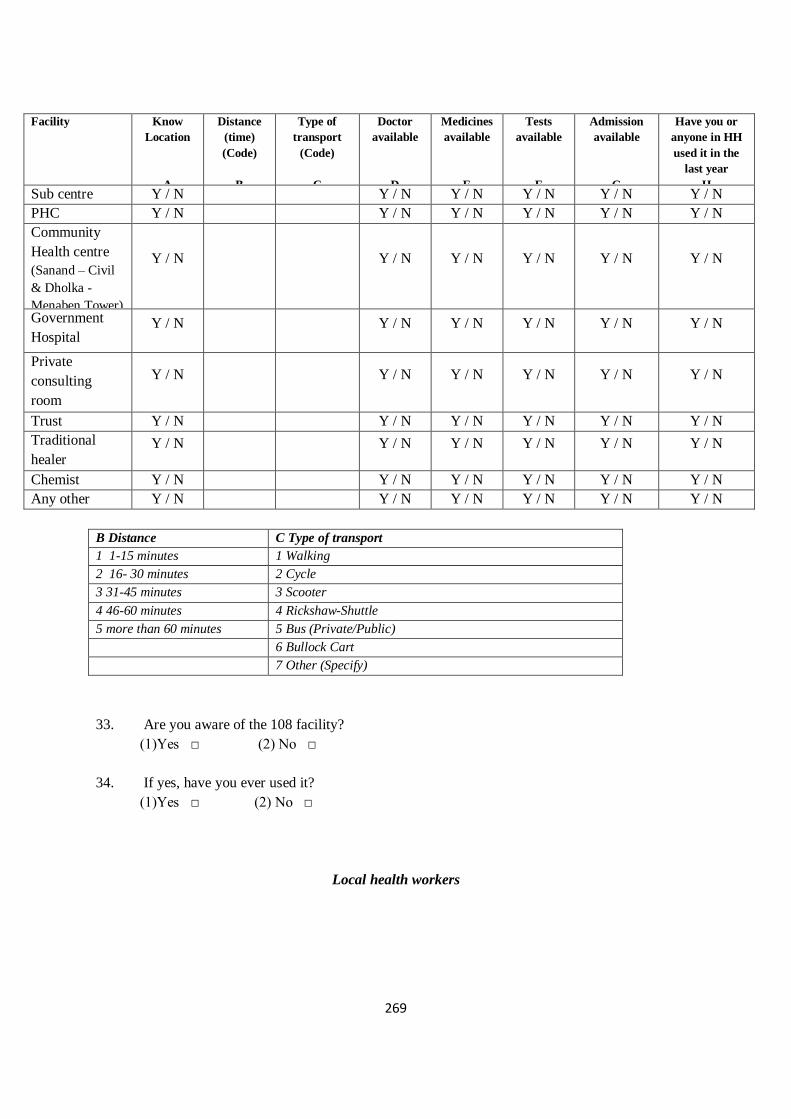
269
Facility Know
Location
A
Distance
(time)
(Code)
B
Type of
transport
(Code)
C
Doctor
available
D
Medicines
available
E
Tests
available
F
Admission
available
G
Have you or
anyone in HH
used it in the
last year
H Sub centre
Y / N Y / N Y / N Y / N Y / N Y / N
PHC Y / N Y / N Y / N Y / N Y / N Y / N
Community
Health centre
(Sanand – Civil
& Dholka -
Menaben Tower)
Y / N Y / N Y / N Y / N Y / N Y / N
Government
Hospital Y / N Y / N Y / N Y / N Y / N Y / N
Private
consulting
room
Y / N Y / N Y / N Y / N Y / N Y / N
Trust Y / N Y / N Y / N Y / N Y / N Y / N
Traditional
healer Y / N Y / N Y / N Y / N Y / N Y / N
Chemist Y / N Y / N Y / N Y / N Y / N Y / N
Any other
like Grocery
shop
Y / N Y / N Y / N Y / N Y / N Y / N
B Distance C Type of transport
1 1-15 minutes 1 Walking
2 16- 30 minutes 2 Cycle
3 31-45 minutes 3 Scooter
4 46-60 minutes 4 Rickshaw-Shuttle
5 more than 60 minutes 5 Bus (Private/Public)
6 Bullock Cart
7 Other (Specify)
33. Are you aware of the 108 facility?
(1)Yes □ (2) No □
34. If yes, have you ever used it?
(1)Yes □ (2) No □
Local health workers
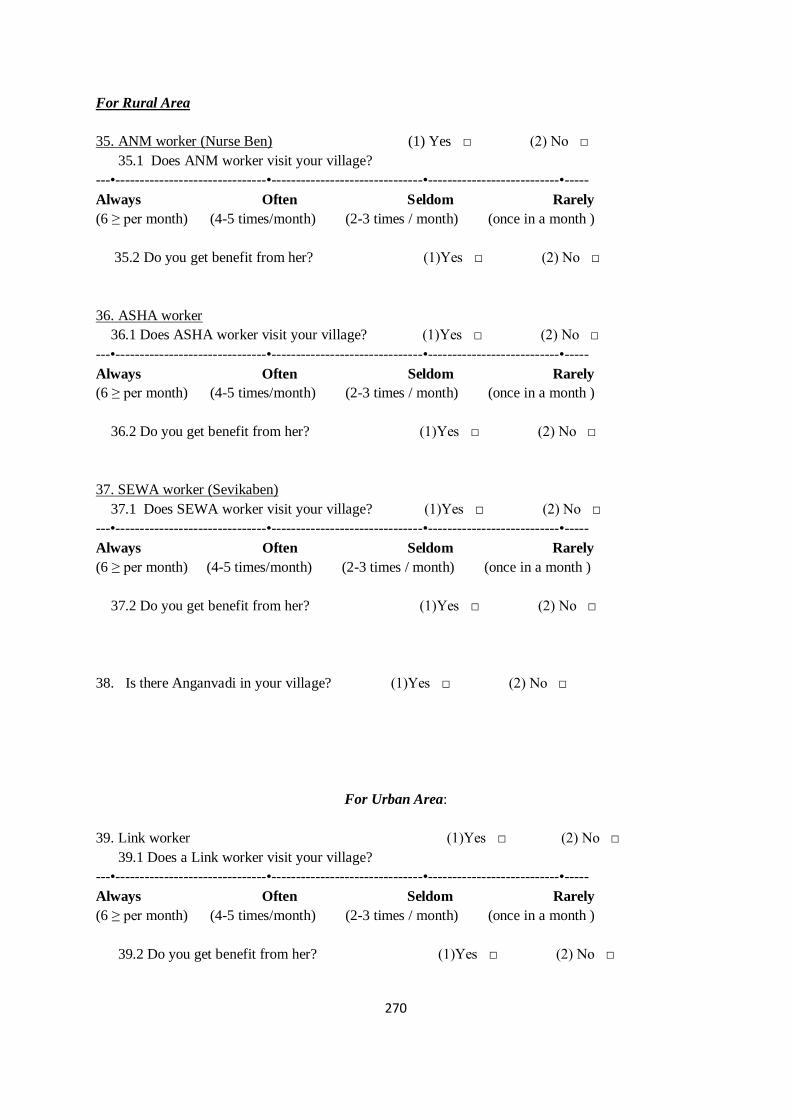
270
For Rural Area
35. ANM worker (Nurse Ben) (1) Yes □ (2) No □
35.1 Does ANM worker visit your village?
---•-------------------------------•-------------------------------•---------------------------•-----
Always Often Seldom Rarely
(6 ≥ per month) (4-5 times/month) (2-3 times / month) (once in a month )
35.2 Do you get benefit from her? (1)Yes □ (2) No □
36. ASHA worker
36.1 Does ASHA worker visit your village? (1)Yes □ (2) No □
---•-------------------------------•-------------------------------•---------------------------•-----
Always Often Seldom Rarely
(6 ≥ per month) (4-5 times/month) (2-3 times / month) (once in a month )
36.2 Do you get benefit from her? (1)Yes □ (2) No □
37. SEWA worker (Sevikaben)
37.1 Does SEWA worker visit your village? (1)Yes □ (2) No □
---•-------------------------------•-------------------------------•---------------------------•-----
Always Often Seldom Rarely
(6 ≥ per month) (4-5 times/month) (2-3 times / month) (once in a month )
37.2 Do you get benefit from her? (1)Yes □ (2) No □
38. Is there Anganvadi in your village? (1)Yes □ (2) No □
For Urban Area:
39. Link worker (1)Yes □ (2) No □
39.1 Does a Link worker visit your village?
---•-------------------------------•-------------------------------•---------------------------•-----
Always Often Seldom Rarely
(6 ≥ per month) (4-5 times/month) (2-3 times / month) (once in a month )
39.2 Do you get benefit from her? (1)Yes □ (2) No □
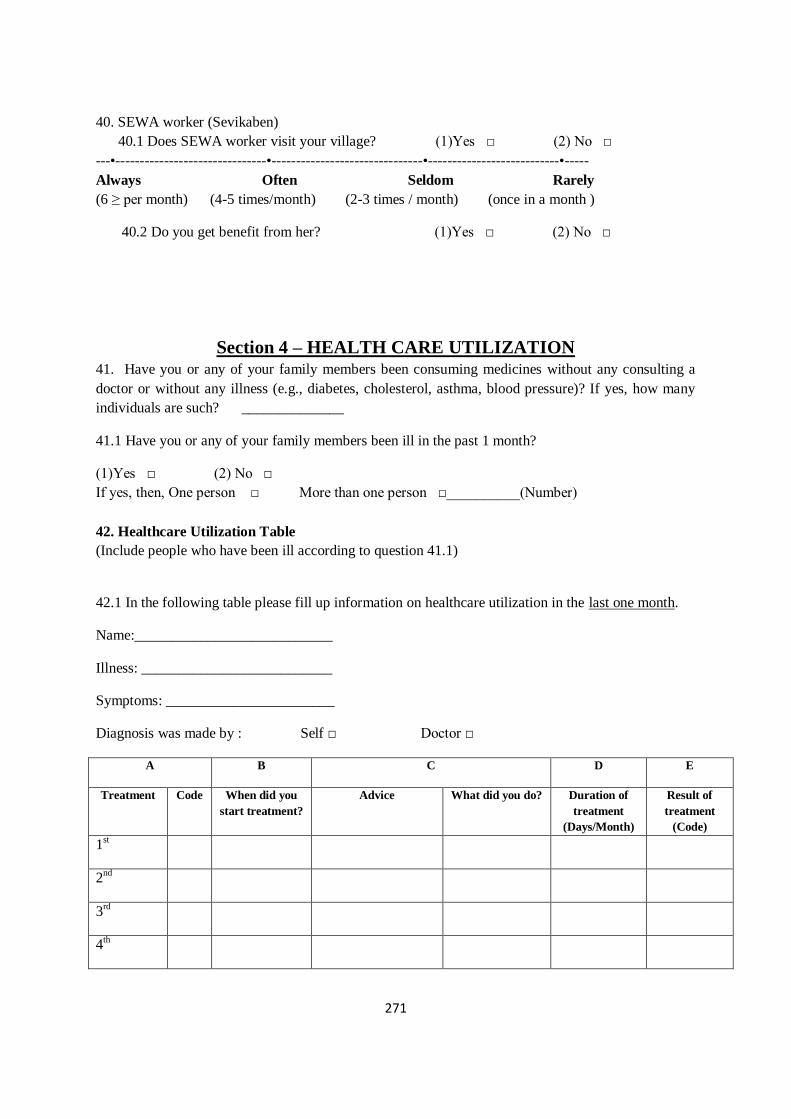
271
40. SEWA worker (Sevikaben)
40.1 Does SEWA worker visit your village? (1)Yes □ (2) No □
---•-------------------------------•-------------------------------•---------------------------•-----
Always Often Seldom Rarely
(6 ≥ per month) (4-5 times/month) (2-3 times / month) (once in a month )
40.2 Do you get benefit from her? (1)Yes □ (2) No □
Section 4 – HEALTH CARE UTILIZATION 41. Have you or any of your family members been consuming medicines without any consulting a
doctor or without any illness (e.g., diabetes, cholesterol, asthma, blood pressure)? If yes, how many
individuals are such? ______________
41.1 Have you or any of your family members been ill in the past 1 month?
(1)Yes □ (2) No □
If yes, then, One person □ More than one person □__________(Number)
42. Healthcare Utilization Table
(Include people who have been ill according to question 41.1)
42.1 In the following table please fill up information on healthcare utilization in the last one month.
Name:___________________________
Illness: __________________________
Symptoms: _______________________
Diagnosis was made by : Self □ Doctor □
A B C D E
Treatment Code When did you
start treatment?
Advice What did you do? Duration of
treatment
(Days/Month)
Result of
treatment
(Code)
1st
2nd
3rd
4th
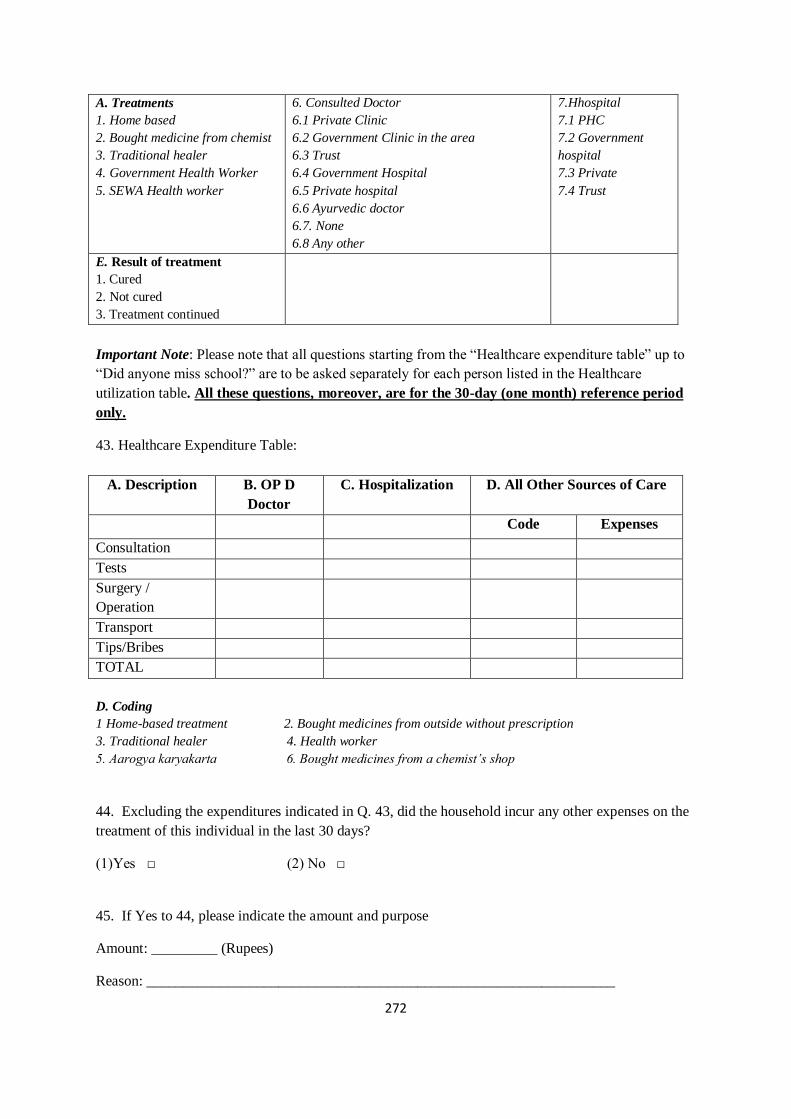
272
A. Treatments
1. Home based
2. Bought medicine from chemist
3. Traditional healer
4. Government Health Worker
5. SEWA Health worker
6. Consulted Doctor
6.1 Private Clinic
6.2 Government Clinic in the area
6.3 Trust
6.4 Government Hospital
6.5 Private hospital
6.6 Ayurvedic doctor
6.7. None
6.8 Any other
7.Hhospital
7.1 PHC
7.2 Government
hospital
7.3 Private
7.4 Trust
E. Result of treatment
1. Cured
2. Not cured
3. Treatment continued
Important Note: Please note that all questions starting from the “Healthcare expenditure table” up to
“Did anyone miss school?” are to be asked separately for each person listed in the Healthcare
utilization table. All these questions, moreover, are for the 30-day (one month) reference period
only.
43. Healthcare Expenditure Table:
A. Description B. OP D
Doctor
C. Hospitalization D. All Other Sources of Care
Code Expenses
Consultation
Tests
Surgery /
Operation
Transport
Tips/Bribes
TOTAL
D. Coding
1 Home-based treatment 2. Bought medicines from outside without prescription
3. Traditional healer 4. Health worker
5. Aarogya karyakarta 6. Bought medicines from a chemist’s shop
44. Excluding the expenditures indicated in Q. 43, did the household incur any other expenses on the
treatment of this individual in the last 30 days?
(1)Yes □ (2) No □
45. If Yes to 44, please indicate the amount and purpose
Amount: _________ (Rupees)
Reason: ________________________________________________________________
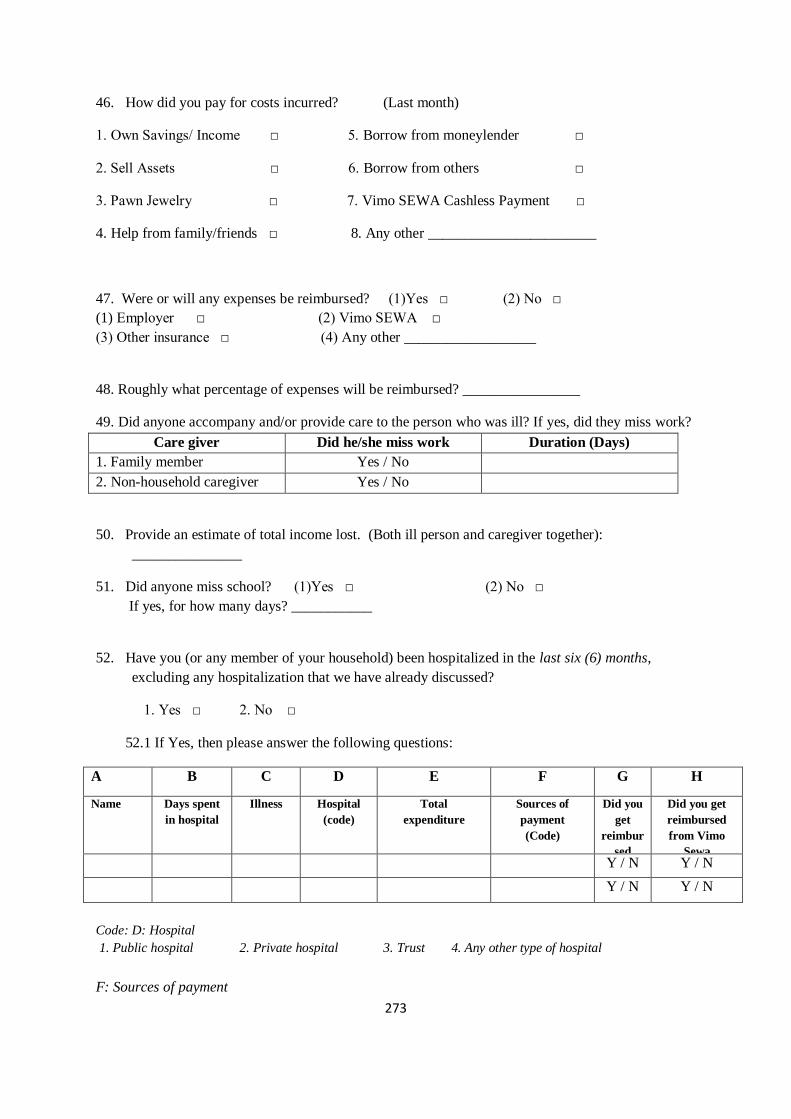
273
46. How did you pay for costs incurred? (Last month)
1. Own Savings/ Income □ 5. Borrow from moneylender □
2. Sell Assets □ 6. Borrow from others □
3. Pawn Jewelry □ 7. Vimo SEWA Cashless Payment □
4. Help from family/friends □ 8. Any other _______________________
47. Were or will any expenses be reimbursed? (1)Yes □ (2) No □
(1) Employer □ (2) Vimo SEWA □
(3) Other insurance □ (4) Any other __________________
48. Roughly what percentage of expenses will be reimbursed? ________________
49. Did anyone accompany and/or provide care to the person who was ill? If yes, did they miss work?
Care giver Did he/she miss work Duration (Days)
1. Family member Yes / No
2. Non-household caregiver Yes / No
50. Provide an estimate of total income lost. (Both ill person and caregiver together):
_______________
51. Did anyone miss school? (1)Yes □ (2) No □
If yes, for how many days? ___________
52. Have you (or any member of your household) been hospitalized in the last six (6) months,
excluding any hospitalization that we have already discussed?
1. Yes □ 2. No □
52.1 If Yes, then please answer the following questions:
A B C D E F G H
Name
Days spent
in hospital
Illness Hospital
(code)
Total
expenditure
Sources of
payment
(Code)
Did you
get
reimbur
sed
Did you get
reimbursed
from Vimo
Sewa
Y / N Y / N
Y / N Y / N
Code: D: Hospital
1. Public hospital 2. Private hospital 3. Trust 4. Any other type of hospital
F: Sources of payment

274
1. Own Savings/ Income □ 5. Borrow from moneylender □
2. Sell Assets □ 6. Borrow from others □
3. Pawn Jewelry □ 7. Vimo SEWA Cashless Payment □
4. Help from family/friends □ 8. Any other _______________________
53. Hospitalization Expenditure Table
A. Description B. Hospitalization
Medicines
Doctors’ fee and operation expenses
Tests
Hospital charges
Transport
Tips/Bribes
TOTAL
Has the family incurred any other expense for the treatment of the ill member in the past 6 months
excluding the ones mentioned in Question 53?
53.1 If yes, then please specify the amount: ________________(Rupees)
Reason:____________________________________________________________
What percentage of these expenses will be reimbursed? __________________________
54. Had anyone accompanied the patient for care giving?
Care giver Did he/she miss work Duration (Days)
1. Family member Yes / No
2. Non-household caregiver Yes / No
55. Provide an estimate of total income lost. (Both ill person and caregiver together):
_______________
56. Did anyone miss school? (1)Yes □ (2) No □
If yes, how many days? ___________

275
Section 5: PREGNANCY AND IMMUNIZATION
57. Has anyone in your family been pregnant in the past year?
1. Yes □
2. No □ 3. Miscarriage/Medical termination of Pregnancy □
58. Where was the delivery conducted?
1. Home □
2. Government Hospital □ 3. Private hospital □
4. Trust hospital □
5. Any other specify_________________________________________
59. Did you get benefit of JSY or Cheerajanjivi (Government) schemes?
(1) Yes □ (2) No □
(Write a narrative report if applicable)
_____________________________________________________________
_____________________________________________________________
_____________________________________________________________
60. Do you immunize your children? (Age group 0-6 years)
(1) Yes □ (2) No □ (3) Not applicable □
61. Do children in your household attend the balwadi / anganwadi?
(All children in the age group 0-6)
(1) Yes □ (2) No □ (3) Not applicable □
62. If yes than how many children from your family do attend the same? _________.
63. Has anyone in your family ever undergone a hysterectomy?
(1) Yes □ (2) No □
If No, then skip to Section 6.
If yes,
64. What was her age when she underwent the surgery? --------
65. What was the reason given by the doctor for the necessity of the operation?
66. In which hospital the operation was performed? (1) Public □ (2) Private □
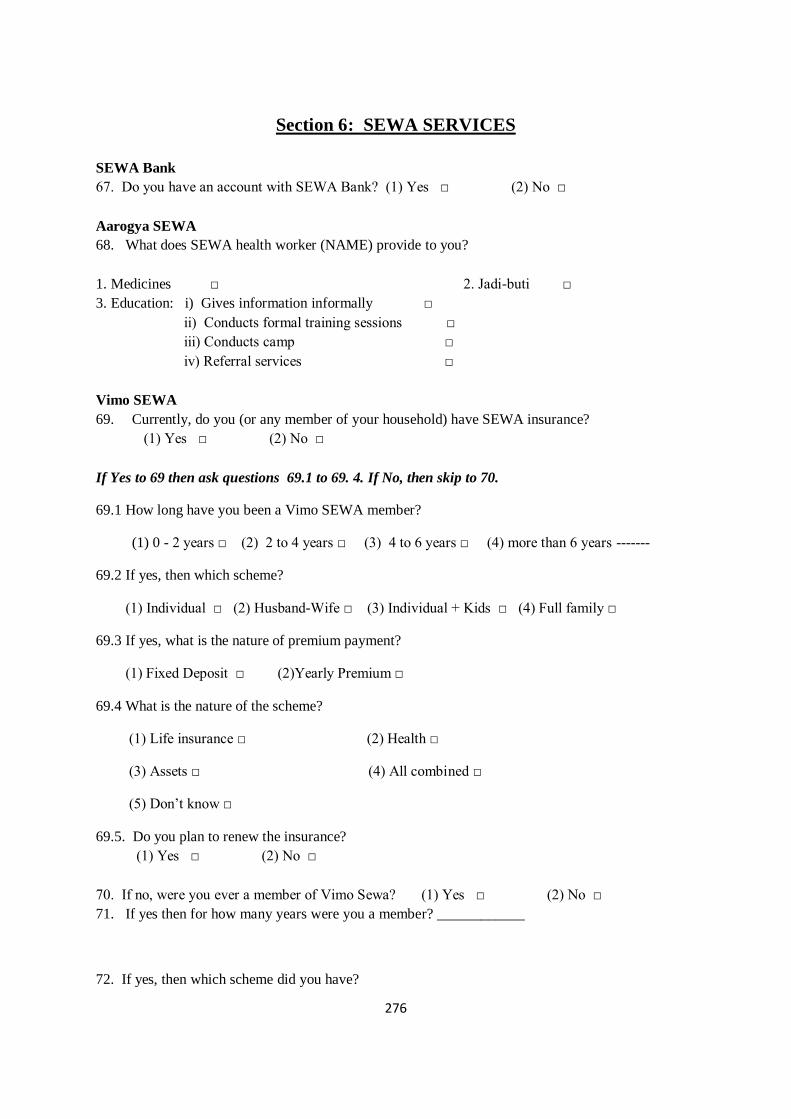
276
Section 6: SEWA SERVICES
SEWA Bank
67. Do you have an account with SEWA Bank? (1) Yes □ (2) No □
Aarogya SEWA
68. What does SEWA health worker (NAME) provide to you?
1. Medicines □ 2. Jadi-buti □
3. Education: i) Gives information informally □
ii) Conducts formal training sessions □
iii) Conducts camp □
iv) Referral services □
Vimo SEWA
69. Currently, do you (or any member of your household) have SEWA insurance?
(1) Yes □ (2) No □
If Yes to 69 then ask questions 69.1 to 69. 4. If No, then skip to 70.
69.1 How long have you been a Vimo SEWA member?
(1) 0 - 2 years □ (2) 2 to 4 years □ (3) 4 to 6 years □ (4) more than 6 years -------
69.2 If yes, then which scheme?
(1) Individual □ (2) Husband-Wife □ (3) Individual + Kids □ (4) Full family □
69.3 If yes, what is the nature of premium payment?
(1) Fixed Deposit □ (2)Yearly Premium □
69.4 What is the nature of the scheme?
(1) Life insurance □ (2) Health □
(3) Assets □ (4) All combined □
(5) Don’t know □
69.5. Do you plan to renew the insurance?
(1) Yes □ (2) No □
70. If no, were you ever a member of Vimo Sewa? (1) Yes □ (2) No □
71. If yes then for how many years were you a member? ____________
72. If yes, then which scheme did you have?
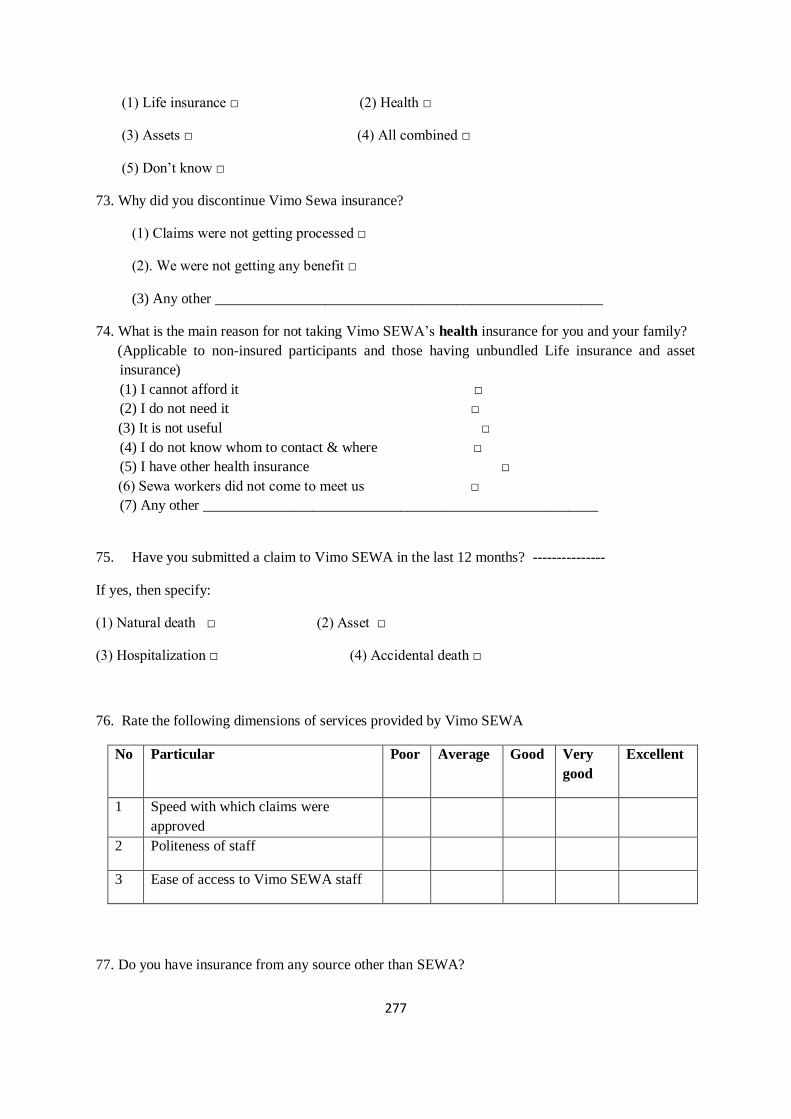
277
(1) Life insurance □ (2) Health □
(3) Assets □ (4) All combined □
(5) Don’t know □
73. Why did you discontinue Vimo Sewa insurance?
(1) Claims were not getting processed □
(2). We were not getting any benefit □
(3) Any other _____________________________________________________
74. What is the main reason for not taking Vimo SEWA’s health insurance for you and your family?
(Applicable to non-insured participants and those having unbundled Life insurance and asset
insurance)
(1) I cannot afford it □
(2) I do not need it □
(3) It is not useful □
(4) I do not know whom to contact & where □
(5) I have other health insurance □
(6) Sewa workers did not come to meet us □
(7) Any other ______________________________________________________
75. Have you submitted a claim to Vimo SEWA in the last 12 months? ---------------
If yes, then specify:
(1) Natural death □ (2) Asset □
(3) Hospitalization □ (4) Accidental death □
76. Rate the following dimensions of services provided by Vimo SEWA
No Particular Poor Average Good Very
good
Excellent
1 Speed with which claims were
approved
2 Politeness of staff
3 Ease of access to Vimo SEWA staff
77. Do you have insurance from any source other than SEWA?

278
(1) Yes □ (2) No □
If Yes, please specify_____________________________________________________
78. Overall how would you rate your own health?
Very
Poor
Poor Average Good Very good Excellent
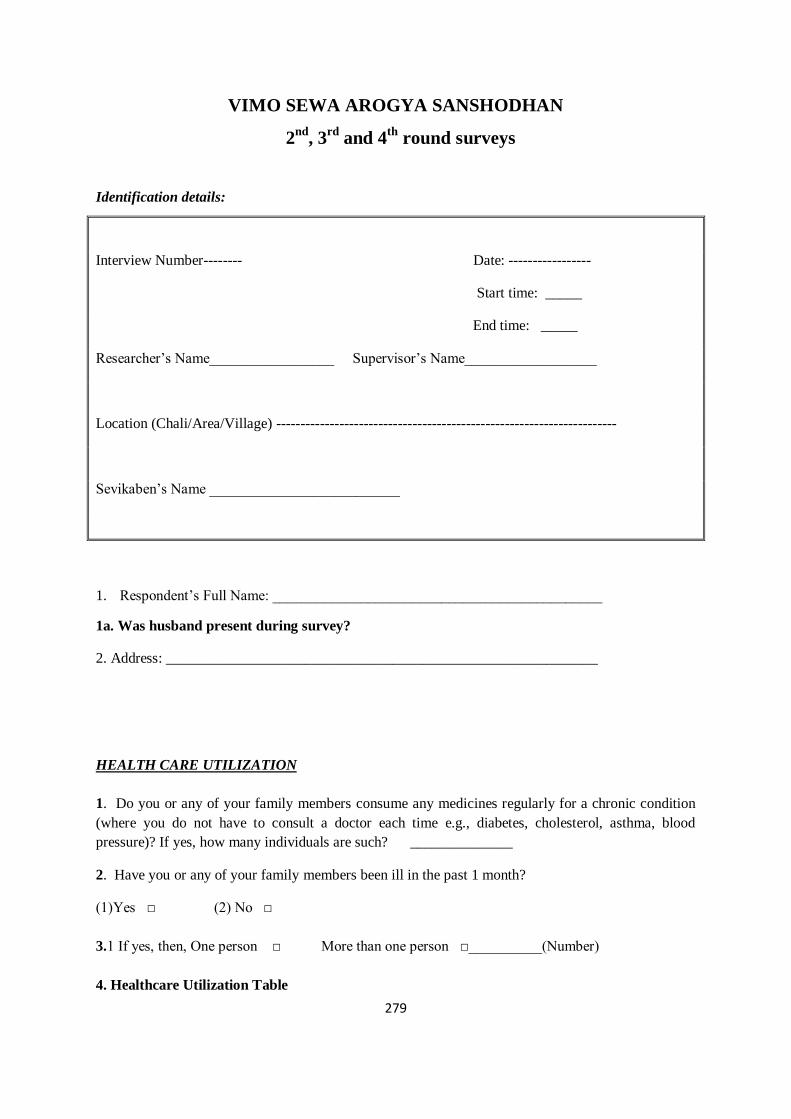
279
VIMO SEWA AROGYA SANSHODHAN
2nd
, 3rd
and 4th
round surveys
Identification details:
Interview Number-------- Date: -----------------
Start time: _____
End time: _____
Researcher’s Name_________________ Supervisor’s Name__________________
Location (Chali/Area/Village) ----------------------------------------------------------------------
Sevikaben’s Name __________________________
1. Respondent’s Full Name: _____________________________________________
1a. Was husband present during survey?
2. Address: ___________________________________________________________
HEALTH CARE UTILIZATION
1. Do you or any of your family members consume any medicines regularly for a chronic condition
(where you do not have to consult a doctor each time e.g., diabetes, cholesterol, asthma, blood
pressure)? If yes, how many individuals are such? ______________
2. Have you or any of your family members been ill in the past 1 month?
(1)Yes □ (2) No □
3.1 If yes, then, One person □ More than one person □__________(Number)
4. Healthcare Utilization Table

280
(Include people who have been ill according to question 2)
4.1 In the following table please fill up information on healthcare utilization in the last one month.
4.2 When in the last month did this person fall ill?
a) In the past week?
b) In the last two weeks?
c) In the last month (2-4 weeks)?
Name: ___________________________
Person number
Sex
Relationship to respondent
Illness: __________________________
Symptoms: _______________________
Diagnosis was made by: Self □ Doctor □
A B C D E
Treatment Code When did you
start treatment?
Advice What did you do? Duration of
treatment
(Days/Month)
Result of
treatment
(Code)
1st
2nd
3rd
4th
A. Treatments
1. Home based
2. Bought medicine from chemist
3. Traditional healer
4. Government Health Worker
5. SEWA Health worker
6. Consulted Doctor
6.1 Private Clinic
6.2 Government Clinic in the area
6.3 Trust
6.4 Government Hospital
6.5 Private hospital
6.6 Ayurvedic doctor
6.7. None
6.8 Any other
7.Hospital
7.1 PHC
7.2 Government
hospital
7.3 Private
7.4 Trust
E. Result of treatment
1. Cured

281
2. Not cured
3. Treatment continued
Important Note: Please note that all questions starting from the “Healthcare expenditure table” up to
“Did anyone miss school?” are to be asked separately for each person listed in the Healthcare
utilization table. All these questions, moreover, are for the 30-day (one month) reference period
only.
5. Healthcare Expenditure Table:
A. Description B. OP D
Doctor
C. Hospitalization D. All Other Sources of Care
Code Expenses
Consultation
Tests
Surgery /
Operation
Transport
Tips/Bribes
TOTAL
D. Coding
1 Home-based treatment 2. Bought medicines from outside without prescription
3. Traditional healer 4. Health worker
5. Aarogya karyakarta 6. Bought medicines from a chemist’s shop
6. Excluding the expenditures indicated in Q. 4, did the household incur any other expenses on the
treatment of this individual in the last 30 days?
(1)Yes □ (2) No □
7. If Yes to 5, please indicate the amount and purpose
Amount: _________ (Rupees)
Reason: ________________________________________________________________
8. How did you pay for costs incurred? (Last month) Multiple answers allowed
1. Own Savings/ Income □ 5. Borrow from moneylender □
2. Sell Assets □ 6. Borrow from others □
3. Pawn Jewelry □ 7. Vimo SEWA Cashless Payment □
4. Help from family/friends □ 8. Any other _______________________
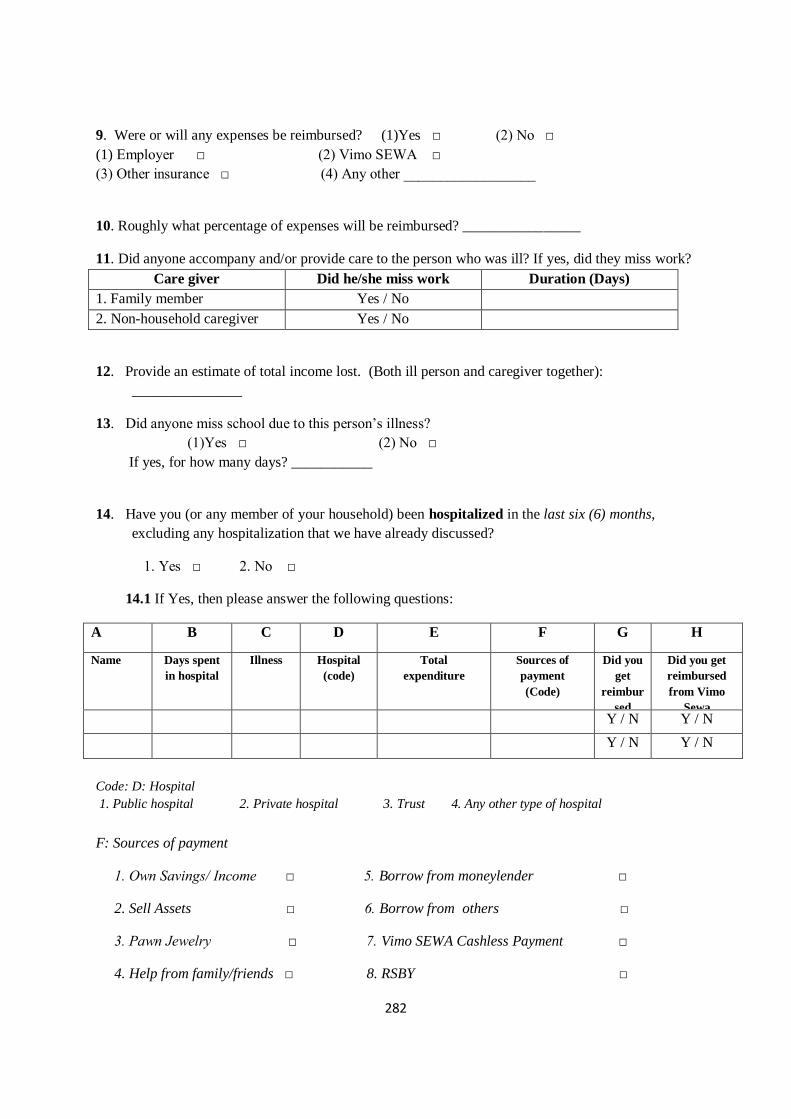
282
9. Were or will any expenses be reimbursed? (1)Yes □ (2) No □
(1) Employer □ (2) Vimo SEWA □
(3) Other insurance □ (4) Any other __________________
10. Roughly what percentage of expenses will be reimbursed? ________________
11. Did anyone accompany and/or provide care to the person who was ill? If yes, did they miss work?
Care giver Did he/she miss work Duration (Days)
1. Family member Yes / No
2. Non-household caregiver Yes / No
12. Provide an estimate of total income lost. (Both ill person and caregiver together):
_______________
13. Did anyone miss school due to this person’s illness?
(1)Yes □ (2) No □
If yes, for how many days? ___________
14. Have you (or any member of your household) been hospitalized in the last six (6) months,
excluding any hospitalization that we have already discussed?
1. Yes □ 2. No □
14.1 If Yes, then please answer the following questions:
A B C D E F G H
Name
Days spent
in hospital
Illness Hospital
(code)
Total
expenditure
Sources of
payment
(Code)
Did you
get
reimbur
sed
Did you get
reimbursed
from Vimo
Sewa
Y / N Y / N
Y / N Y / N
Code: D: Hospital
1. Public hospital 2. Private hospital 3. Trust 4. Any other type of hospital
F: Sources of payment
1. Own Savings/ Income □ 5. Borrow from moneylender □
2. Sell Assets □ 6. Borrow from others □
3. Pawn Jewelry □ 7. Vimo SEWA Cashless Payment □
4. Help from family/friends □ 8. RSBY □

283
9. Any other _______________________
15. Hospitalization Expenditure Table
A. Description B. Hospitalization
Medicines
Doctors’ fee and operation expenses
Tests
Hospital charges
Transport
Tips/Bribes
TOTAL
16. Has the family incurred any other expense for the treatment of the ill member in the past 6 months
excluding the ones mentioned in Question 14?
17.1 If yes, then please specify the amount: ________________(Rupees)
Reason:____________________________________________________________
18. Were or will any expenses be reimbursed? (1)Yes □ (2) No □
(1) Employer □ (2) Vimo SEWA □
(3) Other insurance □ (4) Any other __________________
19.. What percentage of these expenses will be reimbursed? __________________________
20. Had anyone accompanied the patient for care giving?
Care giver Did he/she miss work Duration (Days)
1. Family member Yes / No
2. Non-household caregiver Yes / No
21. Provide an estimate of total income lost. (Both ill person and caregiver together):
_______________
22. Did anyone miss school? (1)Yes □ (2) No □
If yes, how many days? ___________
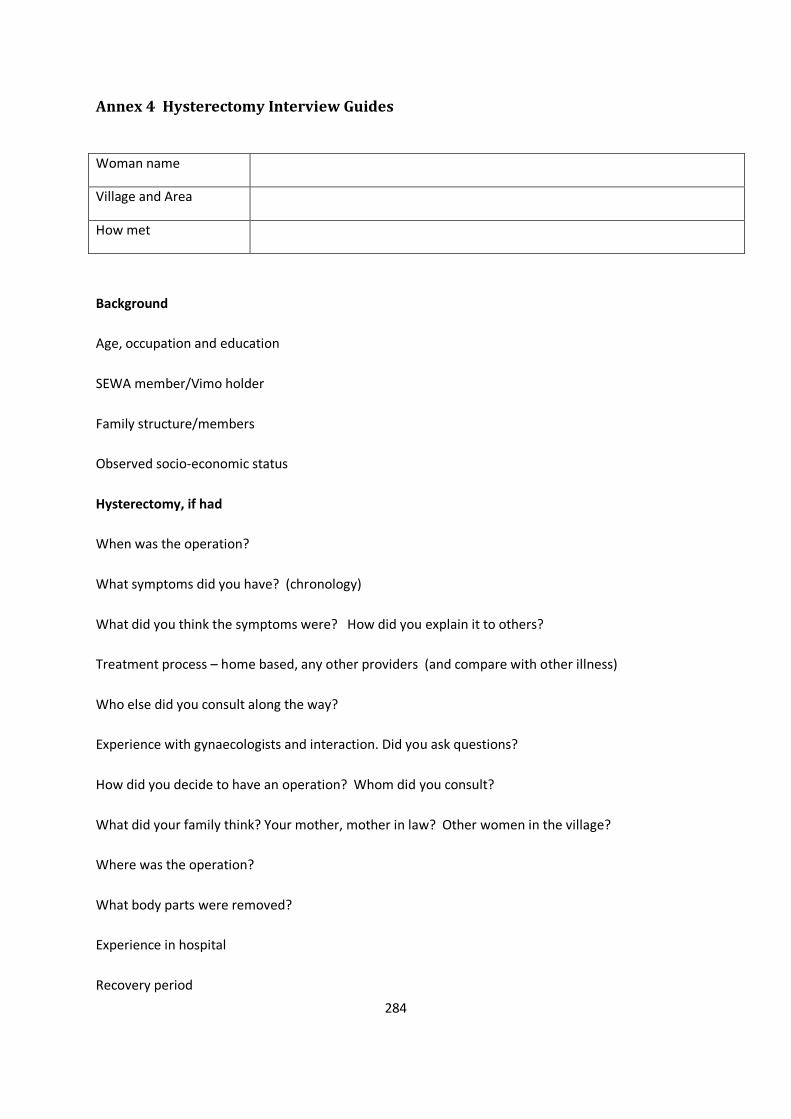
284
Annex 4 Hysterectomy Interview Guides
Woman name
Village and Area
How met
Background
Age, occupation and education
SEWA member/Vimo holder
Family structure/members
Observed socio-economic status
Hysterectomy, if had
When was the operation?
What symptoms did you have? (chronology)
What did you think the symptoms were? How did you explain it to others?
Treatment process – home based, any other providers (and compare with other illness)
Who else did you consult along the way?
Experience with gynaecologists and interaction. Did you ask questions?
How did you decide to have an operation? Whom did you consult?
What did your family think? Your mother, mother in law? Other women in the village?
Where was the operation?
What body parts were removed?
Experience in hospital
Recovery period
285
Impact on work
Cost and payment method.
Insurance (if yes, experience)
Health status now? Any side effects? (personal, emotional, financial, family, husband)
How would you characterise the entire experience – positive, difficult, etc? Not sure if appropriate
What would you suggest to other women in the village with symptoms like yours?
General health care
Health care - where, who, and why for regular illness
Recent illness and/or hospitalisation events and treatment sought
Generally, what health care for gynaecological or menstrual difficulty? Childbirth?
Menstruation in home - rules, what it means, any difficulty?
Gynaecological morbidity – Past experience with morbidity, its treatment and with gynaecologists.
286
Interview guide – Providers
Provider name
Location
Training & years of
practice
How identified
Frequency of hysterectomy operations (per week/month) and thoughts
Primary causes
Treatment procedures and protocol (what done first for symptoms)
Thoughts on prevalence and determinants of gynaecological morbidity and of hysterectomy
Women’s response to prescription of hysterectomy
Women’s ability to pay and effect on treatment choice
Need for interventions?
287
Annex 5 Process Evaluation Guides
Observation guide for health education sessions
Setting
CHW Name
Village and Area
Time and Length
Setting
# of women
Occupation categories
Approx age group
Notes on session attendance
How session began
Session Delivery and Content
CHW communication style (discussion, classroom etc)
How hysterectomy introduced and defined
Causes explained
Side effects
Treatment options
Types of questions asked/discussion points
Nature of participation in discussion
Other topics covered
General observations
Potential women to meet later
288
Interview guide – education session participants
Woman name
Village and Area
How met
Background
Age, occupation and education
SEWA member/Vimo holder
Family structure/members
Observed socio-economic status
Her thoughts on and/or previous experience regarding:
Menstruation – what does it mean to you? Rules or restrictions in household, any difficulty, beliefs
on links to illness? Probe if menstruation comes up later.
Health care - where, who, and why for regular illness
Recent illness and/or hospitalisation events
Generally, what health care for gynaecological or menstrual difficulty? Childbirth?
Gynaecological morbidity – Past experience with morbidity, its treatment and with gynaecologists.
Ever had an exam? Why?
Health insurance
Influences on health care decisions – family, others?
Session
Why attended health education session
289
Thoughts on session, the CHW and information provided
Main points she recalls
What points were new? What do you think of the information – is it relevant to you?
What do you think you would do if doctor ever prescribed hysterectomy? Not sure about this
question
Whom would you speak to for further information or questions?
290
Short interview guides to test recall
(Conducted separately by topic)
Malaria
1. Where can you get free medicine for malaria?
Govt/PHC/ASHA
2. If you start malaria medicine, when should you stop taking it?
After completing the full course of medicine
3. What should you do to prevent being bitten by mosquitoes?
Fumigation
All-Out
Diarrhoea
4. What is the best way to prevent diarrhoea?
Washing hands with soap
6. When are the two times/occasions when it is essential to wash hands with soap?
Before eating
After using the toilet
7. What is the first course of treatment when someone has diarrhoea?
Give them ORS made with boiled water
8. This is an ORS packet. How will you make the solution?
Boil water
Measure water
Shows measuring cup Yes/No
Hysterectomy
9. Is a hysterectomy always necessary?
10. For what reasons do women have a hysterectomy?
11. What should you do after the doctor says you should have a hysterectomy?
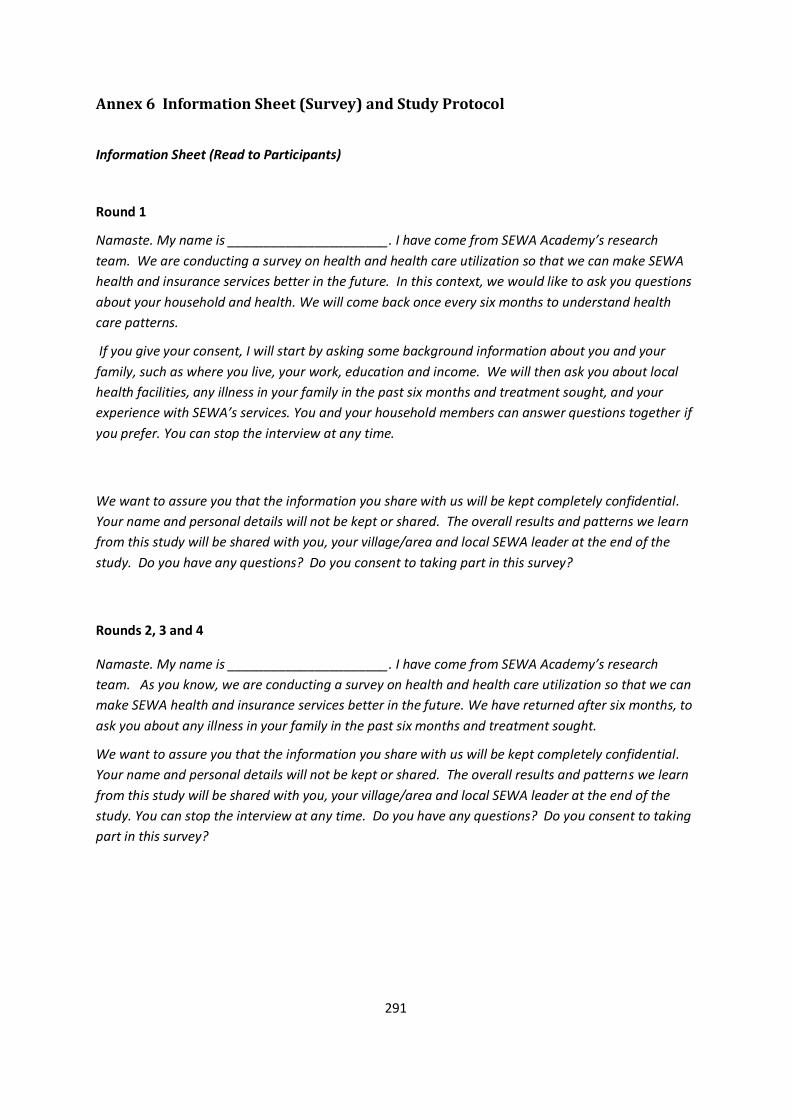
291
Annex 6 Information Sheet (Survey) and Study Protocol
Information Sheet (Read to Participants)
Round 1
Namaste. My name is ______________________. I have come from SEWA Academy’s research
team. We are conducting a survey on health and health care utilization so that we can make SEWA
health and insurance services better in the future. In this context, we would like to ask you questions
about your household and health. We will come back once every six months to understand health
care patterns.
If you give your consent, I will start by asking some background information about you and your
family, such as where you live, your work, education and income. We will then ask you about local
health facilities, any illness in your family in the past six months and treatment sought, and your
experience with SEWA’s services. You and your household members can answer questions together if
you prefer. You can stop the interview at any time.
We want to assure you that the information you share with us will be kept completely confidential.
Your name and personal details will not be kept or shared. The overall results and patterns we learn
from this study will be shared with you, your village/area and local SEWA leader at the end of the
study. Do you have any questions? Do you consent to taking part in this survey?
Rounds 2, 3 and 4
Namaste. My name is ______________________. I have come from SEWA Academy’s research
team. As you know, we are conducting a survey on health and health care utilization so that we can
make SEWA health and insurance services better in the future. We have returned after six months, to
ask you about any illness in your family in the past six months and treatment sought.
We want to assure you that the information you share with us will be kept completely confidential.
Your name and personal details will not be kept or shared. The overall results and patterns we learn
from this study will be shared with you, your village/area and local SEWA leader at the end of the
study. You can stop the interview at any time. Do you have any questions? Do you consent to taking
part in this survey?
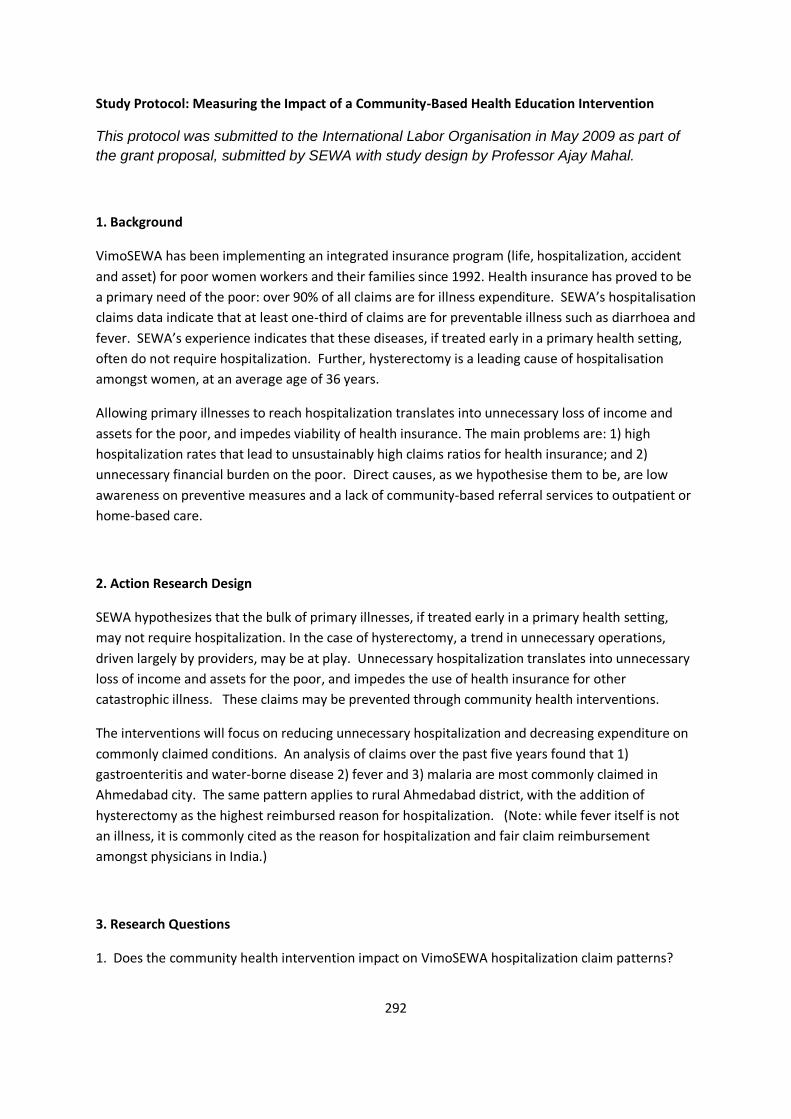
292
Study Protocol: Measuring the Impact of a Community-Based Health Education Intervention
This protocol was submitted to the International Labor Organisation in May 2009 as part of
the grant proposal, submitted by SEWA with study design by Professor Ajay Mahal.
1. Background
VimoSEWA has been implementing an integrated insurance program (life, hospitalization, accident
and asset) for poor women workers and their families since 1992. Health insurance has proved to be
a primary need of the poor: over 90% of all claims are for illness expenditure. SEWA’s hospitalisation
claims data indicate that at least one-third of claims are for preventable illness such as diarrhoea and
fever. SEWA’s experience indicates that these diseases, if treated early in a primary health setting,
often do not require hospitalization. Further, hysterectomy is a leading cause of hospitalisation
amongst women, at an average age of 36 years.
Allowing primary illnesses to reach hospitalization translates into unnecessary loss of income and
assets for the poor, and impedes viability of health insurance. The main problems are: 1) high
hospitalization rates that lead to unsustainably high claims ratios for health insurance; and 2)
unnecessary financial burden on the poor. Direct causes, as we hypothesise them to be, are low
awareness on preventive measures and a lack of community-based referral services to outpatient or
home-based care.
2. Action Research Design
SEWA hypothesizes that the bulk of primary illnesses, if treated early in a primary health setting,
may not require hospitalization. In the case of hysterectomy, a trend in unnecessary operations,
driven largely by providers, may be at play. Unnecessary hospitalization translates into unnecessary
loss of income and assets for the poor, and impedes the use of health insurance for other
catastrophic illness. These claims may be prevented through community health interventions.
The interventions will focus on reducing unnecessary hospitalization and decreasing expenditure on
commonly claimed conditions. An analysis of claims over the past five years found that 1)
gastroenteritis and water-borne disease 2) fever and 3) malaria are most commonly claimed in
Ahmedabad city. The same pattern applies to rural Ahmedabad district, with the addition of
hysterectomy as the highest reimbursed reason for hospitalization. (Note: while fever itself is not
an illness, it is commonly cited as the reason for hospitalization and fair claim reimbursement
amongst physicians in India.)
3. Research Questions
1. Does the community health intervention impact on VimoSEWA hospitalization claim patterns?
293
2. Does the health intervention impact on a) health outcomes b) health care use c) expenditure and
d) knowledge – for those insured by VimoSEWA – for commonly claimed conditions?
3. Does the health intervention impact on a) health outcomes b) health care use and c) expenditure
– for those uninsured by VimoSEWA - for commonly claimed conditions?
4. Health Interventions
The health intervention will include:
a) In-depth group health education sessions on waterborne disease, malaria and hysterectomy. Each session uses a range of new media tools like participatory games, film and stories. Hand soap will be provided to all participants in group education, after a session on the benefits of handwashing. Community media on these three illnesses (wall paintings, posters etc)will be utilised in treatment areas alone,
b) Individual referrals to outpatient facilities for these three illnesses (treatment of gynaec ailments in the case of hysterectomy) and one-to-one education.
c) Monthly capacity building CHWs on health education. During the course of the 2 year project, only the 14 selected CHWs will participate in additional training sessions.
5. Methodology
The study is a cluster randomized trial, in which each community health worker (CHW) area of work
is defined as a discrete “cluster”. 28 CHWs from Ahmedabad city and Ahmedabad district will
participate in the study. Of these, 14 will be randomly selected to deliver the added health
interventions. The other 14 will continue their regular activities.
5.1 Sampling
In each of the 28 clusters, 70 households will be surveyed 5 times over 2 years. The study begins
with a baseline study, followed by six-monthly surveys that will track health-seeking behaviour, i.e.
illness in the household over one month, treatment and costs for each illness, and hospitalization
over the past 6 months.
Basic Assumptions (Set I)
a. Number of clusters = 28 b. Significance level of tests = 0.05 and 0.10 c. Minimum Effect sizes: 0.20 and 0.25
Number of Clusters
294
The number of clusters is 28, which refers to the number of SEWA health workers. The intervention
will be at the level of CHWs, that is, it will be directed towards all SEWA members, insured and
uninsured, who live her ‘area of activity.’ In the urban areas, this refers to a collection of ‘chalis’ (a
locality/set of streets) and in the rural areas, this usually refers to a set of villages, on average about
five (5) per CHW.
Minimum Effect Size
We will work with a minimum effect size (ME) of around 10-20% of all claims made for
hospitalizations under the SEWA insurance plan. The main point is that an effect size of less than 10-
20 percent (or about 25-50 percent of the “unnecessary” hospitalizations as perceived by SEWA) is
probably is not cost-effective. The unnecessary hospitalizations relate to diarrhea and malaria that
are either treatable at home, or hysterectomies in younger age groups that are actually unneeded
and probably supplier driven.
Basic Assumptions (Set II)
To get at the appropriate sample sizes, we need to clarify a number of issues. The first set of issues
has to do with assignment of SEVIKAs into treatment and control groups. One way to do this is to
undertake a simple random assignment into treatment and control CHWs. The main problem with
such an approach is that it is possible that in any single random draw, the assignment may result,
purely by chance, in very ‘unbalanced’ (or unequal) baseline values of key explanatory variables
among treatment and control CHWs. This is so even if, in an expectation sense, random assignment
leads to balanced values of the variables in question
There are several ways to address the concern of the previous paragraph. The first is to use what are
referred to as “re-randomization” strategies – that is, to redo the random assignment if the initial
assignment results in unbalanced baseline values. Bruhn and McKenzie (2008) argue against this
approach because it is likely to lead to substantial losses in degrees of freedom in the estimation of
the treatment effect. This approach is not suitable for our work given the small number of CHWs.
Another is to adopt a ‘blocking strategy’ – that is, to stratify CHWs into groups and randomize within
groups. An extreme version of this approach is ‘pair-wise’ matching where we randomize among
SEVIKA-pairs matched according to a number of pre-set criteria.
We adopt a strategy whereby we undertake randomization separately in two main blocks, rural
and urban. The main reason for doing so is simplicity and also because the rural-urban differential
explains about 30% of the variation in claim-rate use. We decided against pair-wise matching simply
because the marginal gains of adopting that strategy were unclear.
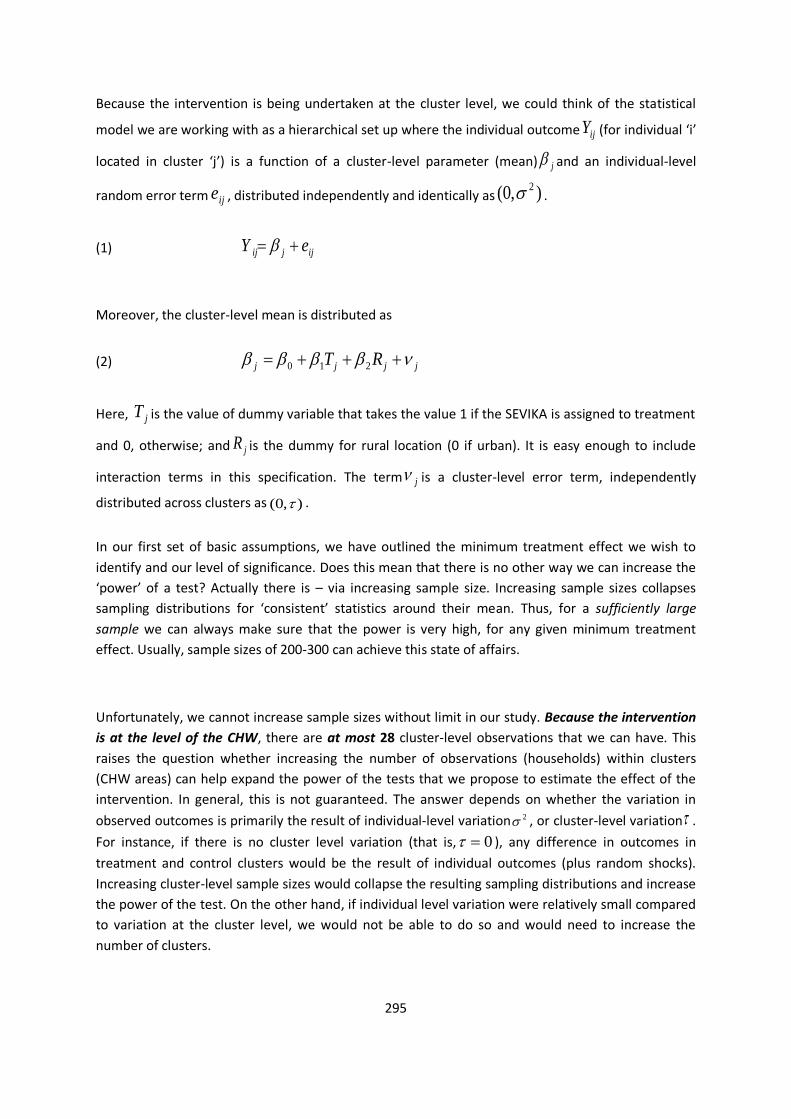
295
Because the intervention is being undertaken at the cluster level, we could think of the statistical
model we are working with as a hierarchical set up where the individual outcome ijY (for individual ‘i’
located in cluster ‘j’) is a function of a cluster-level parameter (mean) j and an individual-level
random error term ije , distributed independently and identically as ),0( 2 .
(1) ijjij eY
Moreover, the cluster-level mean is distributed as
(2) jjjj RT 210
Here, jT is the value of dummy variable that takes the value 1 if the SEVIKA is assigned to treatment
and 0, otherwise; and jR is the dummy for rural location (0 if urban). It is easy enough to include
interaction terms in this specification. The term j is a cluster-level error term, independently
distributed across clusters as ),0( .
In our first set of basic assumptions, we have outlined the minimum treatment effect we wish to
identify and our level of significance. Does this mean that there is no other way we can increase the
‘power’ of a test? Actually there is – via increasing sample size. Increasing sample sizes collapses
sampling distributions for ‘consistent’ statistics around their mean. Thus, for a sufficiently large
sample we can always make sure that the power is very high, for any given minimum treatment
effect. Usually, sample sizes of 200-300 can achieve this state of affairs.
Unfortunately, we cannot increase sample sizes without limit in our study. Because the intervention
is at the level of the CHW, there are at most 28 cluster-level observations that we can have. This
raises the question whether increasing the number of observations (households) within clusters
(CHW areas) can help expand the power of the tests that we propose to estimate the effect of the
intervention. In general, this is not guaranteed. The answer depends on whether the variation in
observed outcomes is primarily the result of individual-level variation 2 , or cluster-level variation .
For instance, if there is no cluster level variation (that is, 0 ), any difference in outcomes in
treatment and control clusters would be the result of individual outcomes (plus random shocks).
Increasing cluster-level sample sizes would collapse the resulting sampling distributions and increase
the power of the test. On the other hand, if individual level variation were relatively small compared
to variation at the cluster level, we would not be able to do so and would need to increase the
number of clusters.
296
The key parameter for this purpose, intra-class correlation parameter , where
(3) 2
Thus, the greater is, the lower the possibility of enhancing power by increasing the number of
households sampled per cluster (for a given minimum treatment effect and level of significance)
(Spybrook et al. 2008).
Power Calculations
For the purpose of this exercise, in addition to information on ‘minimum effect size’, the number of
clusters and the size of the test of significance, we also need to know (a) the magnitude of and
(b) the proportion of variation in health care utilization and claim rates that could be explained by
location in rural and urban areas. Moreover, we need to know not only for SEWA claim rates but
potentially for other variables that we are interested in – outpatient care use, overall
hospitalizations and so forth.
Estimating the intra-class correlation
There are three ways to calculate the intra-class correlation parameter. The first method is to rely
on data on SEWA claim rates. The main advantage here is that data are available for each SEVIKA
area. The main disadvantage is that are data are available only for hospitalization claim rates, and do
not include any hospitalizations for which claims were not submitted to SEWA (this includes all
uninsured by SEWA as well) and any outpatient visits. The second method is to rely on National
Sample Survey (NSS) household survey data (for 2004) for rural and urban areas by district in
Gujarat. The main advantage is that now the data are available both for outpatient and for inpatient
care for the sample of individuals, separately for rural and urban areas. The main disadvantage is
that NSS data are not representative of the population at the district level, and are certainly not
reflective of the distribution across SEVIKAs in Ahmedabad district, the area of the planned study.
While the NSS data contain no information about household insurance status, it is safe to presume
that they reflect on average the situation in uninsured households, given the vast majority are
uninsured. The third method is to revisit the whole issue of household sample size after undertaking
a baseline survey to collect information on outpatient and inpatient care, separately by insurance
status and for rural and urban SEVIKA areas. The main drawback is that reliance on the baseline to
devise sample sizes for each cluster is limited by the sample size for the baseline itself. On the other
hand, it can help in deciding upon the type of stratification adopted for this study (and in principle
for future sample sizes).
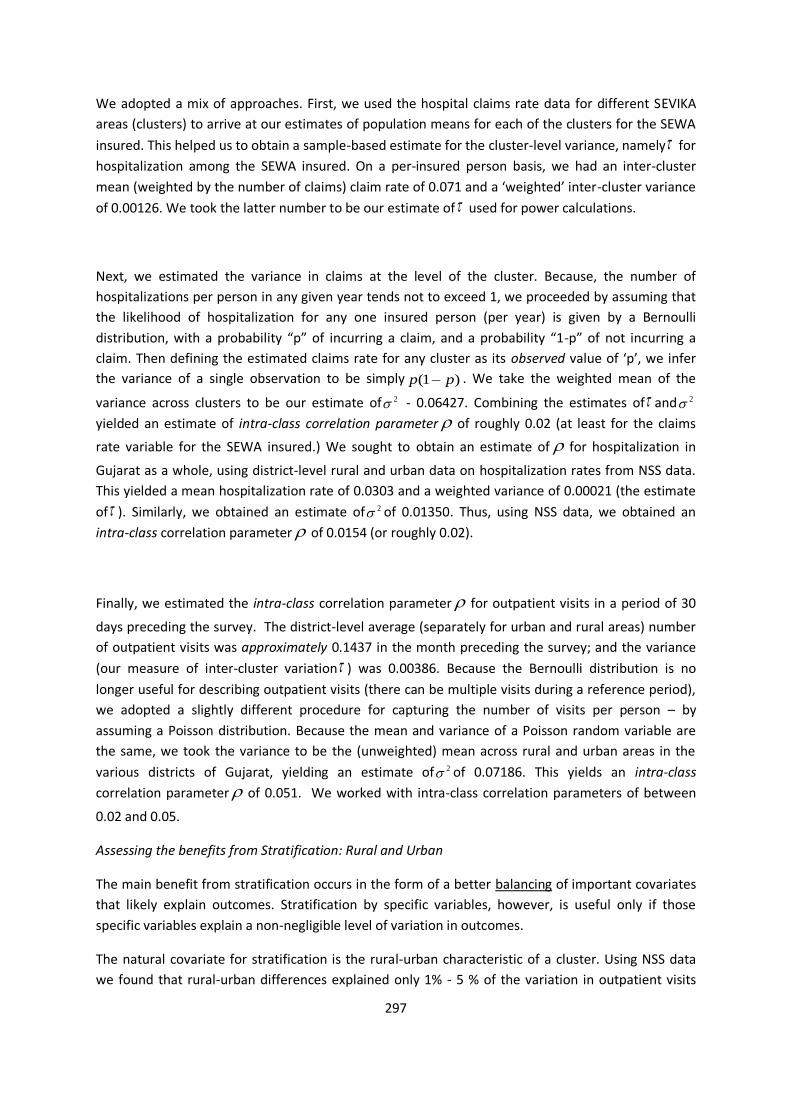
297
We adopted a mix of approaches. First, we used the hospital claims rate data for different SEVIKA
areas (clusters) to arrive at our estimates of population means for each of the clusters for the SEWA
insured. This helped us to obtain a sample-based estimate for the cluster-level variance, namely for
hospitalization among the SEWA insured. On a per-insured person basis, we had an inter-cluster
mean (weighted by the number of claims) claim rate of 0.071 and a ‘weighted’ inter-cluster variance
of 0.00126. We took the latter number to be our estimate of used for power calculations.
Next, we estimated the variance in claims at the level of the cluster. Because, the number of
hospitalizations per person in any given year tends not to exceed 1, we proceeded by assuming that
the likelihood of hospitalization for any one insured person (per year) is given by a Bernoulli
distribution, with a probability “p” of incurring a claim, and a probability “1-p” of not incurring a
claim. Then defining the estimated claims rate for any cluster as its observed value of ‘p’, we infer
the variance of a single observation to be simply )1( pp . We take the weighted mean of the
variance across clusters to be our estimate of 2 - 0.06427. Combining the estimates of and 2
yielded an estimate of intra-class correlation parameter of roughly 0.02 (at least for the claims
rate variable for the SEWA insured.) We sought to obtain an estimate of for hospitalization in
Gujarat as a whole, using district-level rural and urban data on hospitalization rates from NSS data.
This yielded a mean hospitalization rate of 0.0303 and a weighted variance of 0.00021 (the estimate
of ). Similarly, we obtained an estimate of 2 of 0.01350. Thus, using NSS data, we obtained an
intra-class correlation parameter of 0.0154 (or roughly 0.02).
Finally, we estimated the intra-class correlation parameter for outpatient visits in a period of 30
days preceding the survey. The district-level average (separately for urban and rural areas) number
of outpatient visits was approximately 0.1437 in the month preceding the survey; and the variance
(our measure of inter-cluster variation ) was 0.00386. Because the Bernoulli distribution is no
longer useful for describing outpatient visits (there can be multiple visits during a reference period),
we adopted a slightly different procedure for capturing the number of visits per person – by
assuming a Poisson distribution. Because the mean and variance of a Poisson random variable are
the same, we took the variance to be the (unweighted) mean across rural and urban areas in the
various districts of Gujarat, yielding an estimate of 2 of 0.07186. This yields an intra-class
correlation parameter of 0.051. We worked with intra-class correlation parameters of between
0.02 and 0.05.
Assessing the benefits from Stratification: Rural and Urban
The main benefit from stratification occurs in the form of a better balancing of important covariates
that likely explain outcomes. Stratification by specific variables, however, is useful only if those
specific variables explain a non-negligible level of variation in outcomes.
The natural covariate for stratification is the rural-urban characteristic of a cluster. Using NSS data
we found that rural-urban differences explained only 1% - 5 % of the variation in outpatient visits
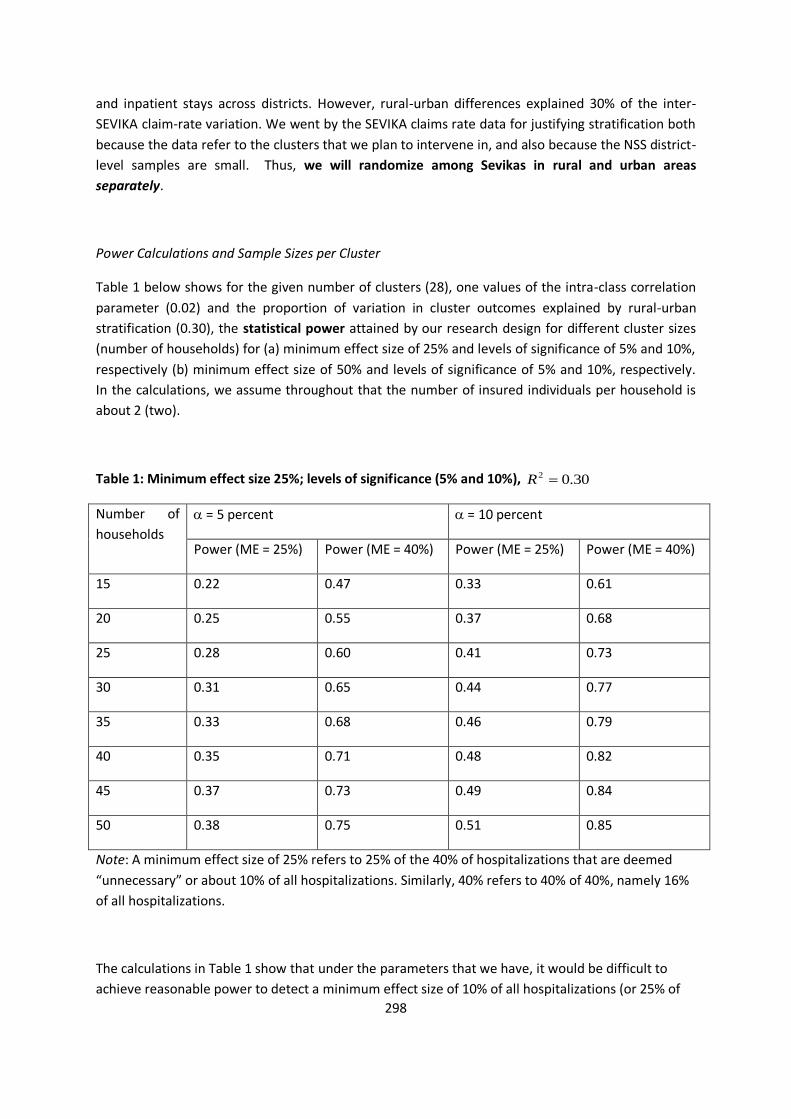
298
and inpatient stays across districts. However, rural-urban differences explained 30% of the inter-
SEVIKA claim-rate variation. We went by the SEVIKA claims rate data for justifying stratification both
because the data refer to the clusters that we plan to intervene in, and also because the NSS district-
level samples are small. Thus, we will randomize among Sevikas in rural and urban areas
separately.
Power Calculations and Sample Sizes per Cluster
Table 1 below shows for the given number of clusters (28), one values of the intra-class correlation
parameter (0.02) and the proportion of variation in cluster outcomes explained by rural-urban
stratification (0.30), the statistical power attained by our research design for different cluster sizes
(number of households) for (a) minimum effect size of 25% and levels of significance of 5% and 10%,
respectively (b) minimum effect size of 50% and levels of significance of 5% and 10%, respectively.
In the calculations, we assume throughout that the number of insured individuals per household is
about 2 (two).
Table 1: Minimum effect size 25%; levels of significance (5% and 10%), 30.02 R
Number of
households
= 5 percent = 10 percent
Power (ME = 25%) Power (ME = 40%) Power (ME = 25%) Power (ME = 40%)
15 0.22 0.47 0.33 0.61
20 0.25 0.55 0.37 0.68
25 0.28 0.60 0.41 0.73
30 0.31 0.65 0.44 0.77
35 0.33 0.68 0.46 0.79
40 0.35 0.71 0.48 0.82
45 0.37 0.73 0.49 0.84
50 0.38 0.75 0.51 0.85
Note: A minimum effect size of 25% refers to 25% of the 40% of hospitalizations that are deemed
“unnecessary” or about 10% of all hospitalizations. Similarly, 40% refers to 40% of 40%, namely 16%
of all hospitalizations.
The calculations in Table 1 show that under the parameters that we have, it would be difficult to
achieve reasonable power to detect a minimum effect size of 10% of all hospitalizations (or 25% of
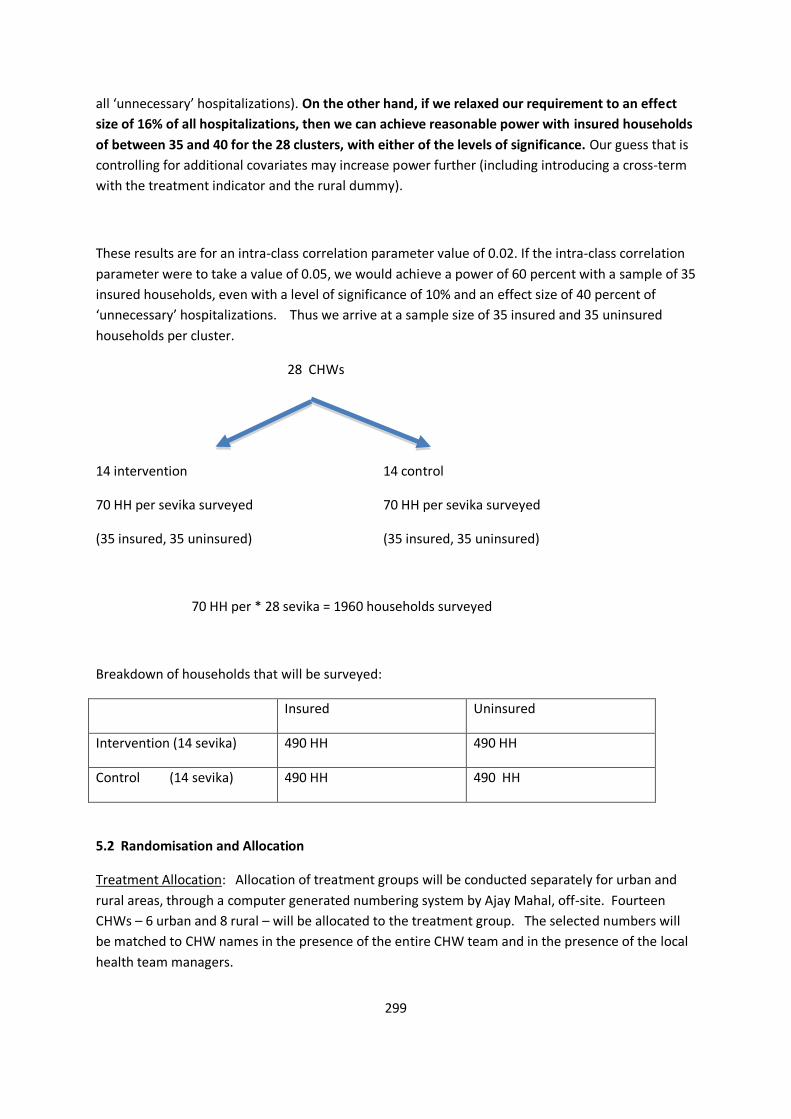
299
all ‘unnecessary’ hospitalizations). On the other hand, if we relaxed our requirement to an effect
size of 16% of all hospitalizations, then we can achieve reasonable power with insured households
of between 35 and 40 for the 28 clusters, with either of the levels of significance. Our guess that is
controlling for additional covariates may increase power further (including introducing a cross-term
with the treatment indicator and the rural dummy).
These results are for an intra-class correlation parameter value of 0.02. If the intra-class correlation
parameter were to take a value of 0.05, we would achieve a power of 60 percent with a sample of 35
insured households, even with a level of significance of 10% and an effect size of 40 percent of
‘unnecessary’ hospitalizations. Thus we arrive at a sample size of 35 insured and 35 uninsured
households per cluster.
28 CHWs
14 intervention 14 control
70 HH per sevika surveyed 70 HH per sevika surveyed
(35 insured, 35 uninsured) (35 insured, 35 uninsured)
70 HH per * 28 sevika = 1960 households surveyed
Breakdown of households that will be surveyed:
Insured Uninsured
Intervention (14 sevika) 490 HH 490 HH
Control (14 sevika) 490 HH 490 HH
5.2 Randomisation and Allocation
Treatment Allocation: Allocation of treatment groups will be conducted separately for urban and
rural areas, through a computer generated numbering system by Ajay Mahal, off-site. Fourteen
CHWs – 6 urban and 8 rural – will be allocated to the treatment group. The selected numbers will
be matched to CHW names in the presence of the entire CHW team and in the presence of the local
health team managers.
300
Household selection : Households with health insurance will be randomly selected from
VimoSEWA’s membership database through computer-generated numbering within each cluster.
An equal number of households from the uninsured population will be selected in the same cluster
in a two-step process. First, the research team will list all uninsured households in a cluster by
following a community health worker on her rounds, so that no household was excluded,
particularly as many slum settlements are not listed in government rosters. Next, 35 households will
be randomly selected through a computer-generated numbering process for each cluster. In total,
1,960 households in 28 clusters will be sampled.
6. Evaluation
Five rounds of household surveys will be evaluated for effects on insured women, uninsured and a
comparison of the two groups. Qualitative analysis of the intervention process and women’s health
seeking behaviour will be conducted, with methodology determined after the baseline findings are
available. Cost-effectiveness of the intervention will be assessed through analysis of claim ratios as
well as overall health benefits measured by hospitalisation and average out-of-pocket expenditure.
7. Data collection
Data will be collected by SEWA Academy’s research team and entered into a Microsoft Access
database by dedicated data operators. Field surveyors will be monitored by SEWA Academy
supervisors. All forms will be checked on-site, and then reviewed after entry independently by
supervisors. Inconsistencies will be raised with the PI.
8. Replicability
Results from this project will inform VimoSEWA’s approach in all of its program areas in Gujarat and
six other states of India. SEWA’s national federation, SEWA Bharat, already implements health
programs in Bihar, Rajasthan, Delhi and West Bengal – and thus are natural sites for replication of
this converged approach. In India, the National Health Insurance Scheme, Rashtriya Swasthya Bima
Yojna (RSBY), is being rolled out for families below the poverty line. In some states, government
community health workers are the focal point for promotion and claim servicing. Thus if these
results indicate the specific community health activities that impact on health seeking behaviour and
claim ratios, there is clear potential for national replication. Further, findings will have far-reaching
effects on the implementation of health insurance amongst the poor at a global level. A high
incidence of primary illness likely impedes the viability of health insurance, regardless of region.
Based on VimoSEWA’s experience, governments, insurance companies and implementing agencies
can integrate community health with health insurance. Where VimoSEWA works directly, replication
will be achieved through program implementation. At the national level, VimoSEWA can serve as a
301
technical advisor to RSBY implementation teams, including insurance companies, on how to
integrate health education into health insurance services. We can also share lessons learned through
our partners in Indian microfinance networks such as CLASS and Sadhan. Globally, VimoSEWA will
share findings and technical expertise through our partnerships in organisations such as ICMIF,
HomeNet and WIEGO.
9. Innovation
Providing community health services with health insurance, as a means to prevent unnecessary
hospitalization, is an innovation that has not been systematically implemented in any
microinsurance programs in India or most of the developing world. Thus our innovation has the
potential to transform the delivery of health insurance services. Moreover, there is virtually no data
on the “health” component of health insurance, i.e. the illness pattern of health insurance claims by
the poor. This project will create the foundation for an evidence base on why and how health
services can be integrated with health insurance.
Secondly, this project can serve as a model for how a microinsurance program can partner with the
public health system and government schemes, such as the National Rural Health Mission (NRHM)
and RSBY in India. Since our approach is based on a local grassroots woman worker – akin to the
village-based community health worker (ASHA) of the NRHM – who provides both health and
insurance services, this innovation can be a model for an integrated, government-led scale up of
health and insurance. The action research component is an innovation in of itself. Literature reviews
indicate that virtually no research has been conducted on the impact of health services on health
insurance in a community-based setting. Given that health insurance is increasingly promoted as a
key intervention for poverty alleviation, research and evidence are critical. Further, an experiment of
this kind can catalyse similar efforts to create a solid evidence base.
10. Lessons
This project will create both an implementation model and evidence base for integrating health
activities with health insurance. We will learn if health education and referrals truly can reduce
avoidable hospitalization, which in turn will reduce claim ratios and improve viability of health
insurance. This initiative will provide specific evidence on what components, and how, health
activities are effective – thus it will contribute to the “implementation science” of health insurance.
We will also learn the cost-benefit of health with health insurance, i.e. how much an investment in
health can reduce both claims and illness expenditure. Through qualitative research, this project will
also provide insight into health seeking behaviour, on why people choose specific care at a point in
time. For example, we will learn for whom, and for what illness insurance is used, and importantly,
why. Overall, this project will allow us to determine 1) if health programs do have an impact on
reducing claims for primary illness; 2) how this approach can be implemented in a viable model; and
3) the direct, insurance-related cost benefit of investing in health.
302
11. Potential Benefits
Potential benefits will include: 1) 1,960 women and their family members will have obtained health
services that can reduce illness expenditure. 2) Decrease in claim ratio by 19% points in Ahmedabad
city and 14% points in Ahmedabad district. 3) Decrease in cost to customer (reduction in work days
lost and expenditure on illness) by 4% points, based on total cost to patient. 4) Decrease in
hospitalization for preventable primary illness. We anticipate a 30% reduction in hospitalization for
leading illnesses. As this is a new approach, we will closely monitor claims to estimate the
quantitative impact of the interventions. 5) Decrease in cost of health care due to referral linkages,
cashless linkages, increase in utilization of public hospitals and preventive health information. 6)
Decrease in selling of assets or borrowing for illness. 7) Increase in women seeking health care
services. Being the policyholders, women will be encouraged to seek health care, including
preventive health information, to promote a higher priority for their health.
12. Risks
Health insurance itself may be an incentive for hospitalization, as care can be purchased at a lower
cost. Thus despite health education and referrals, there is a possibility that hospitalization rates will
not decrease significantly. Mitigating factors include: 1) Out of pocket expenditure may still decrease
due to VimoSEWA’s focus on linkages with government and trust hospitals 2) A focus on disease
prevention, early identification, and outpatient services, so that hospitalization is not required.
Further, implementing the intervention study without spillover effects will be a risk for action
research results. We will ensure that control and intervention wards in Ahmedabad city, and villages
in Ahmedabad district, are far enough from each other to avoid spillover. For this reason, we have
chosen to employ a grassroots research team, rather than have local insurance promoters
implement the simple survey, to avoid bias.
303
Annex 7 Information sheet (Qualitative research)
1. Information and consent forms (Used in Gujarati)
Information sheet and consent form for women who have undergone hysterectomy (n=30)
Hello. My name is Sapna Desai. I have worked here with SEWA for several years. VimoSEWA has
found that hysterectomy is common in Ahmedabad and this research aims to understand women’s
experiences and the reasons why they undergo the operation.
I hope to speak with around 30 women in this area and I have come to speak to you because 1) you
submitted a claim to VimoSEWA for a hysterectomy OR (2) ______ (SEWA community health
worker) suggested I speak with you.
If you agree to take part, I would like to spend about 45 minutes to one hour discussing your
experience and opinions. During the interview some written notes will be taken, and with your
permission, the session will be tape-recorded. Taking part in the research is entirely voluntary and
you can stop the interview without having to give a reason.
Anything we discuss will be confidential, and I will not use your name to identify anything you share.
After I speak to women and local providers, I will write up the overall findings in Gujarati and English.
A SEWA health worker and I will come back to share what we have learned.
Do you have any questions you would like to ask me about this research? Would you be willing to
speak with me about your experience? If yes, could you sign here to indicate that you agree to this
conversation and for me to write up the findings? May I tape record our conversation? Or would
you prefer I take notes?
Consent by participant
1. “I have read the information sheet concerning this study and I understand what will be required of me and what will happen if I participate in this interview.”
2. “My questions concerning this study have been answered by Sapna Desai.”
304
3. “I understand that at any time I may withdraw from this study without giving a reason.”
4. “I do/do not agree to the interview being recorded.” (please delete as appropriate)
5. “I agree to take part in this study.”
6. “I do/do not agree to be quoted anonymously in any publications arising from this study” (please delete as appropriate)
Name of participant ………………………………..……………………….
Signed ……......................................... Date …..............................................

305
Information sheet and consent form for women who have not undergone hysterectomy (n=10)
Hello. My name is Sapna Desai. I have worked here with SEWA for several years. VimoSEWA has
found that hysterectomy is common in Ahmedabad and this research aims to understand women’s
experiences and the reasons why they undergo the operation. I have already spoken to 30 women
in this area who have undergone a hysterectomy.
I hope to speak with around 10 women in this area who have not had the operation to understand
my findings further. ______ (SEWA community health worker) OR __________ suggested I speak
with you.
If you agree to take part, I would like to spend about 45 minutes to one hour finding out about your
experience and opinions. During the interview some written notes will be taken, and with your
permission, the session will be tape-recorded. Taking part in the research is entirely voluntary and
you can stop the interview without having to give a reason.
Anything we discuss will be confidential, and I will not use your name to identify anything you share.
After I speak to women and local providers, I will write up the overall findings in Gujarati and English.
A SEWA health worker and I will come back to share what we have learned.
Do you have any questions you would like to ask me about this research? Would you be willing to
speak with me about your experience? If yes, could you sign here to indicate that you agree to this
conversation and for me to write up the findings? May I tape record our conversation? Or would
you prefer I take notes?
Consent by participant
1. “I have read the information sheet concerning this study and I understand what will be required of me and what will happen if I participate in this interview.”
2. “My questions concerning this study have been answered by Sapna Desai.”
3. “I understand that at any time I may withdraw from this study without giving a reason.”
4. “I do/do not agree to the interview being recorded.” (please delete as appropriate)

306
5. “I agree to take part in this study.”
6. “I do/do not agree to be quoted anonymously in any publications arising from this study” (please delete as appropriate)
Name of participant ………………………………..……………………….
Signed ……......................................... Date …..............................................
307
Information sheet and consent form for health care providers (n=5)
Hello. My name is Sapna Desai. I have worked here with SEWA for several years and am also
pursuing a PhD at the London School of Hygiene and Tropical Medicine. We are conducting a trial to
test the effectiveness of health education with women, in particular if it changes the way they seek
care.
VimoSEWA has found that hysterectomy is common in Ahmedabad and this research aims to
understand women’s experiences and the reasons why they undergo the operation. I am also
speaking to 30 women in this area who have undergone a hysterectomy and 10 who have not.
If you agree to take part, I would like to spend about 30 minutes to ask you about your experience
and opinions. During the interview some written notes will be taken, and with your permission, the
session will be tape-recorded. Taking part in the research is entirely voluntary and you can stop the
interview without having to give a reason.
Anything we discuss will be confidential, and I will not use your name to identify anything you share.
After I speak to women and local providers, I will write up the overall findings in Gujarati and English.
I will come back to share what we have learned.
Do you have any questions you would like to ask me about this research? Would you be willing to
speak with me about your experience? If yes, could you sign here to indicate that you agree to this
conversation and for me to write up the findings? May I tape record our conversation? Or would
you prefer I take notes? May I quote you anonymously in any publications that arise from this
study?
Consent by participant
1. “I have read the information sheet concerning this study and I understand what will be required of me and what will happen if I participate in this interview.”
2. “My questions concerning this study have been answered by Sapna Desai.”
3. “I understand that at any time I may withdraw from this study without giving a reason.”
4. “I do/do not agree to the interview being recorded.” (please delete as appropriate)

308
5. “I agree to take part in this study.”
6. “I do/do not agree to be quoted anonymously in any publications arising from this study” (please delete as appropriate)
Name of participant ………………………………..……………………….
Signed ……......................................... Date …..............................................
309
Information sheet and consent form for women who participated in SEWA education sessions
(n=10)
Hello. My name is Sapna Desai. I have worked here with SEWA for several years. We met at the
health education session on ______ conducted by _______ in your village OR ____ suggested I speak
with you.
VimoSEWA has found that hysterectomy is common in Ahmedabad and this research aims to
understand more about women’s opinions on hysterectomy and SEWA’s education sessions on the
topic. I hope to speak with around 10 women in this area who have participated in the sessions.
If you agree to take part, I would like to spend about 45 minutes to an hour to discuss your
experience and opinions. During the interview some written notes will be taken, and with your
permission, the session will be tape-recorded. Taking part in the research is entirely voluntary and
you can stop the interview without having to give a reason.
Anything we discuss will be confidential, and I will not use your name to identify anything you share.
I will write up the overall findings in Gujarati and English. I will share them with you, and SEWA will
also use your thoughts to improve their education sessions.
Do you have any questions you would like to ask me about this research? Would you be willing to
speak with me about your experience? If yes, could you sign here to indicate that you agree to this
conversation and for me to write up the findings? May I tape record our conversation? Or would
you prefer I take notes?
Consent by participant
1. “I have read the information sheet concerning this study and I understand what will be required of me and what will happen if I participate in this interview.”
2. “My questions concerning this study have been answered by Sapna Desai.”
3. “I understand that at any time I may withdraw from this study without giving a reason.”
4. “I do/do not agree to the interview being recorded.” (please delete as appropriate)

310
5. “I agree to take part in this study.”
6. “I do/do not agree to be quoted anonymously in any publications arising from this study” (please delete as appropriate)
Name of participant ………………………………..……………………….
Signed ……......................................... Date …..............................................

311
Annex 8 Ethical Approvals
Ethical approvals from SEWA Health Cooperative and London School of Hygiene and Tropical
Medicine are attached.
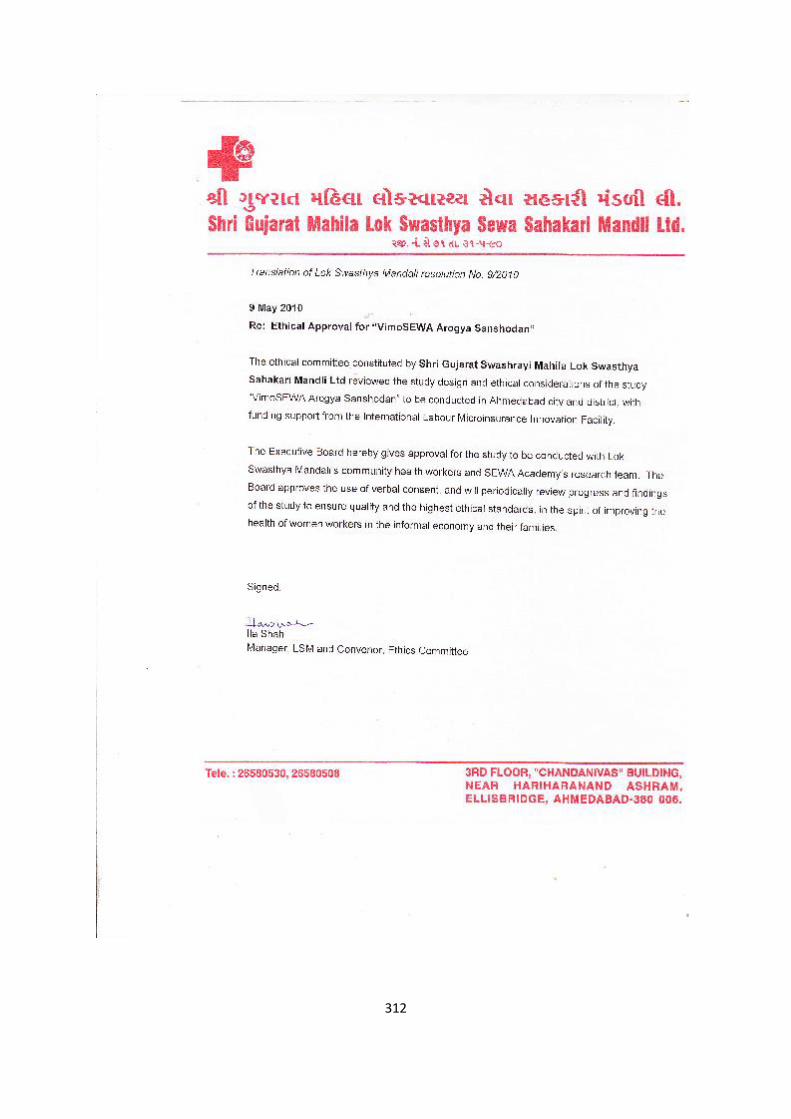
312
313
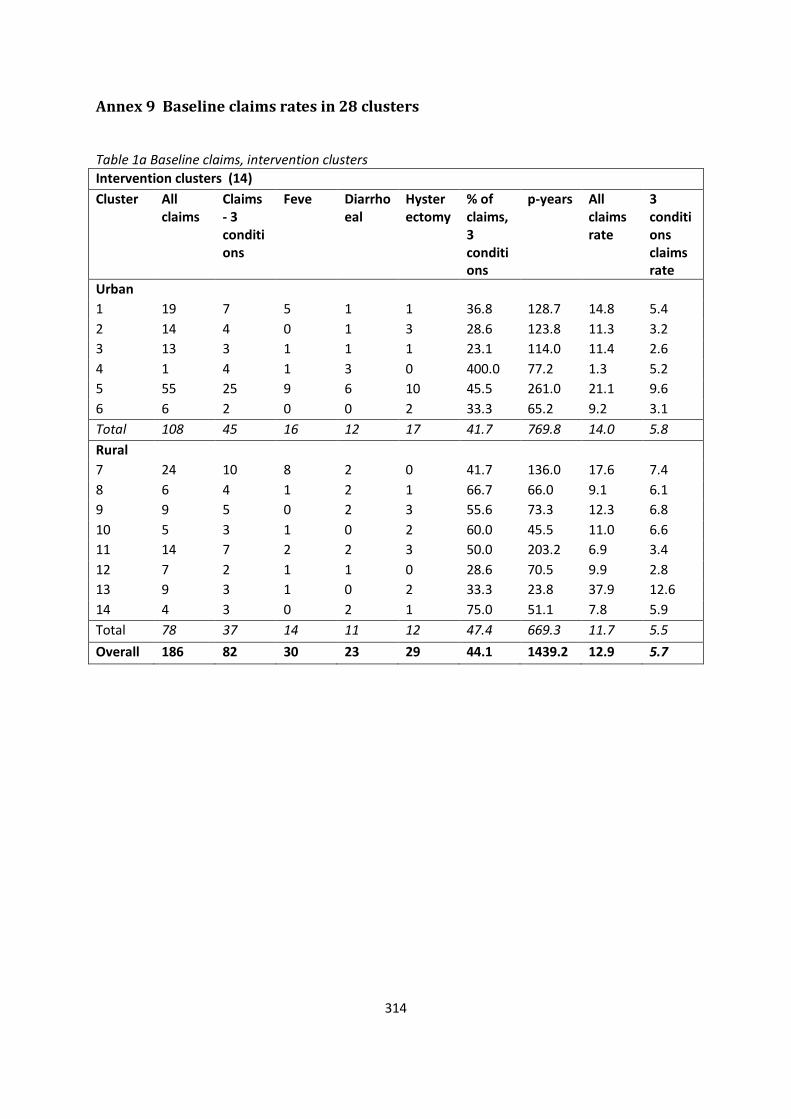
314
Annex 9 Baseline claims rates in 28 clusters
Table 1a Baseline claims, intervention clusters
Intervention clusters (14)
Cluster All claims
Claims - 3 conditions
Feve Diarrhoeal
Hysterectomy
% of claims, 3 conditions
p-years All claims rate
3 conditions claims rate
Urban
1 19 7 5 1 1 36.8 128.7 14.8 5.4
2 14 4 0 1 3 28.6 123.8 11.3 3.2
3 13 3 1 1 1 23.1 114.0 11.4 2.6
4 1 4 1 3 0 400.0 77.2 1.3 5.2
5 55 25 9 6 10 45.5 261.0 21.1 9.6
6 6 2 0 0 2 33.3 65.2 9.2 3.1
Total 108 45 16 12 17 41.7 769.8 14.0 5.8
Rural
7 24 10 8 2 0 41.7 136.0 17.6 7.4
8 6 4 1 2 1 66.7 66.0 9.1 6.1
9 9 5 0 2 3 55.6 73.3 12.3 6.8
10 5 3 1 0 2 60.0 45.5 11.0 6.6
11 14 7 2 2 3 50.0 203.2 6.9 3.4
12 7 2 1 1 0 28.6 70.5 9.9 2.8
13 9 3 1 0 2 33.3 23.8 37.9 12.6
14 4 3 0 2 1 75.0 51.1 7.8 5.9
Total 78 37 14 11 12 47.4 669.3 11.7 5.5
Overall 186 82 30 23 29 44.1 1439.2 12.9 5.7
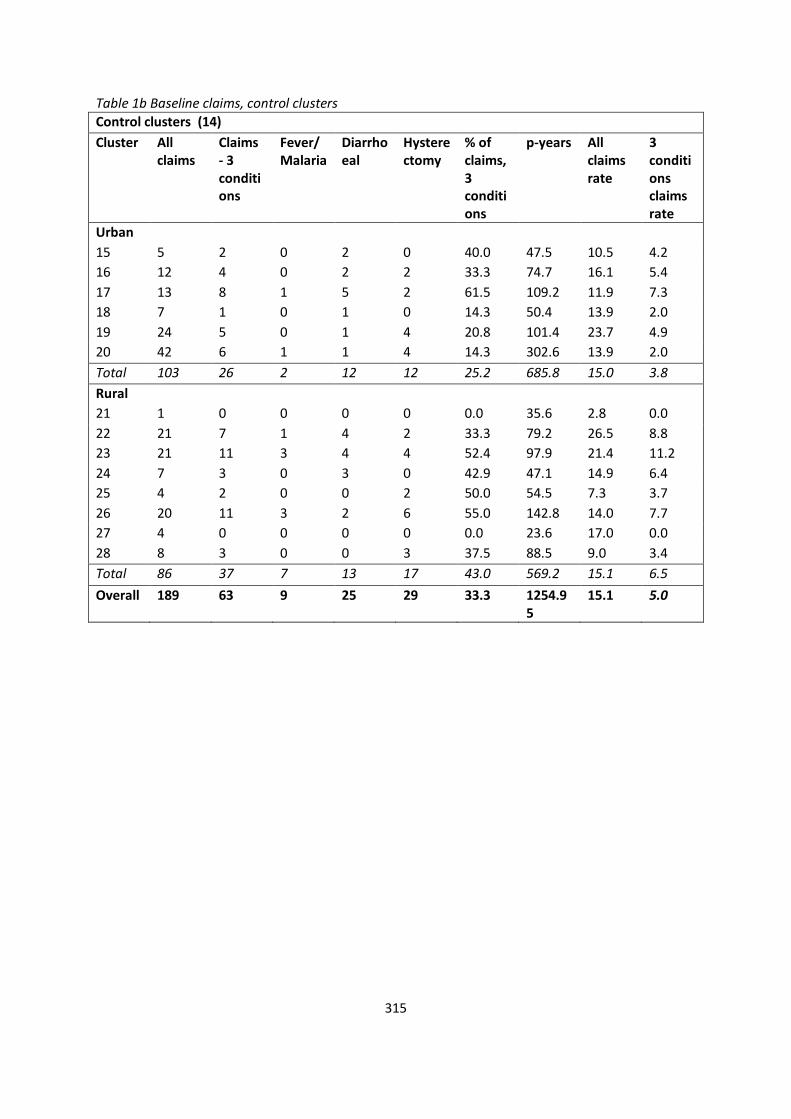
315
Table 1b Baseline claims, control clusters
Control clusters (14)
Cluster All claims
Claims - 3 conditions
Fever/Malaria
Diarrhoeal
Hysterectomy
% of claims, 3 conditions
p-years All claims rate
3 conditions claims rate
Urban
15 5 2 0 2 0 40.0 47.5 10.5 4.2
16 12 4 0 2 2 33.3 74.7 16.1 5.4
17 13 8 1 5 2 61.5 109.2 11.9 7.3
18 7 1 0 1 0 14.3 50.4 13.9 2.0
19 24 5 0 1 4 20.8 101.4 23.7 4.9
20 42 6 1 1 4 14.3 302.6 13.9 2.0
Total 103 26 2 12 12 25.2 685.8 15.0 3.8
Rural
21 1 0 0 0 0 0.0 35.6 2.8 0.0
22 21 7 1 4 2 33.3 79.2 26.5 8.8
23 21 11 3 4 4 52.4 97.9 21.4 11.2
24 7 3 0 3 0 42.9 47.1 14.9 6.4
25 4 2 0 0 2 50.0 54.5 7.3 3.7
26 20 11 3 2 6 55.0 142.8 14.0 7.7
27 4 0 0 0 0 0.0 23.6 17.0 0.0
28 8 3 0 0 3 37.5 88.5 9.0 3.4
Total 86 37 7 13 17 43.0 569.2 15.1 6.5
Overall 189 63 9 25 29 33.3 1254.95
15.1 5.0
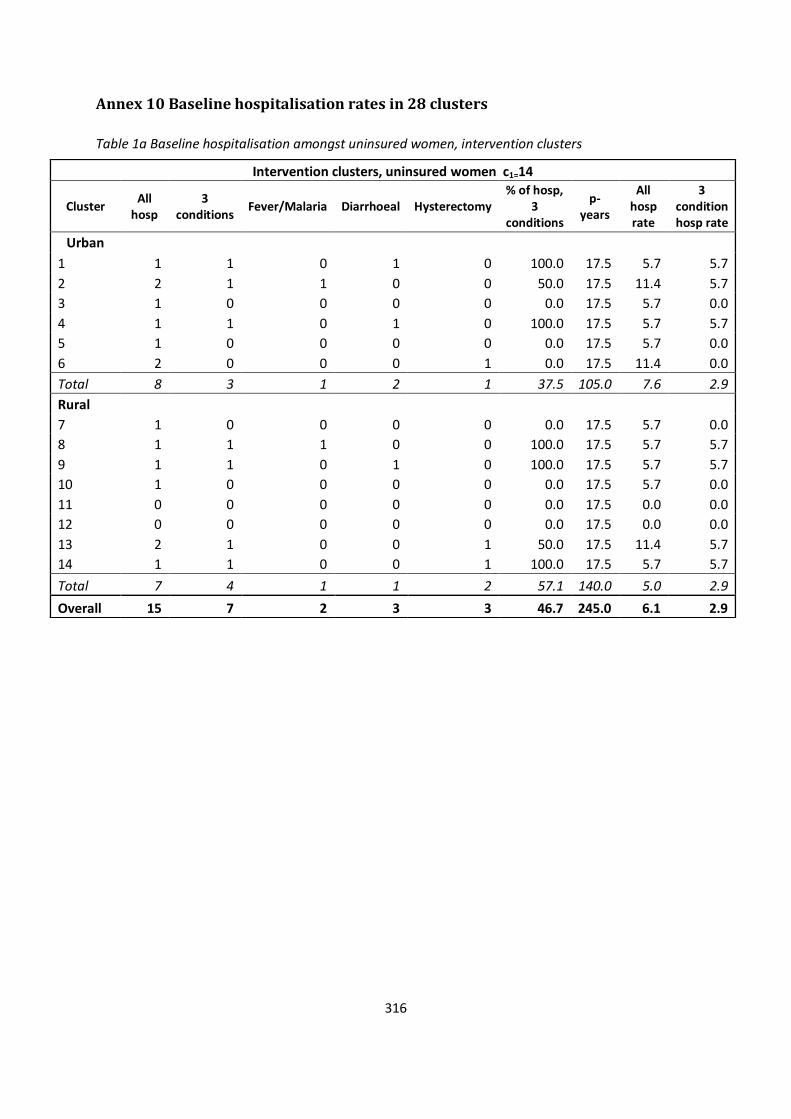
316
Annex 10 Baseline hospitalisation rates in 28 clusters
Table 1a Baseline hospitalisation amongst uninsured women, intervention clusters
Intervention clusters, uninsured women c1=14
Cluster All
hosp 3
conditions Fever/Malaria Diarrhoeal Hysterectomy
% of hosp, 3
conditions
p-years
All hosp rate
3 condition hosp rate
Urban
1 1 1 0 1 0 100.0 17.5 5.7 5.7
2 2 1 1 0 0 50.0 17.5 11.4 5.7
3 1 0 0 0 0 0.0 17.5 5.7 0.0
4 1 1 0 1 0 100.0 17.5 5.7 5.7
5 1 0 0 0 0 0.0 17.5 5.7 0.0
6 2 0 0 0 1 0.0 17.5 11.4 0.0
Total 8 3 1 2 1 37.5 105.0 7.6 2.9
Rural
7 1 0 0 0 0 0.0 17.5 5.7 0.0
8 1 1 1 0 0 100.0 17.5 5.7 5.7
9 1 1 0 1 0 100.0 17.5 5.7 5.7
10 1 0 0 0 0 0.0 17.5 5.7 0.0
11 0 0 0 0 0 0.0 17.5 0.0 0.0
12 0 0 0 0 0 0.0 17.5 0.0 0.0
13 2 1 0 0 1 50.0 17.5 11.4 5.7
14 1 1 0 0 1 100.0 17.5 5.7 5.7
Total 7 4 1 1 2 57.1 140.0 5.0 2.9
Overall 15 7 2 3 3 46.7 245.0 6.1 2.9
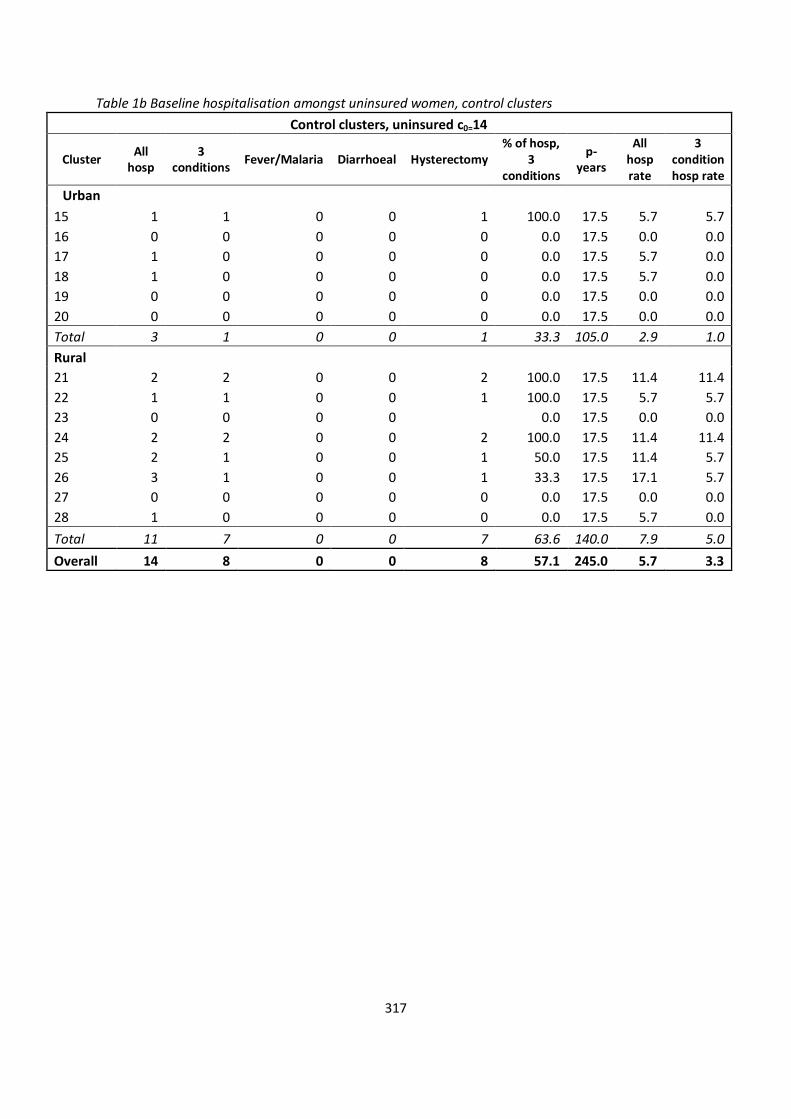
317
Table 1b Baseline hospitalisation amongst uninsured women, control clusters
Control clusters, uninsured c0=14
Cluster All
hosp 3
conditions Fever/Malaria Diarrhoeal Hysterectomy
% of hosp, 3
conditions
p-years
All hosp rate
3 condition hosp rate
Urban
15 1 1 0 0 1 100.0 17.5 5.7 5.7
16 0 0 0 0 0 0.0 17.5 0.0 0.0
17 1 0 0 0 0 0.0 17.5 5.7 0.0
18 1 0 0 0 0 0.0 17.5 5.7 0.0
19 0 0 0 0 0 0.0 17.5 0.0 0.0
20 0 0 0 0 0 0.0 17.5 0.0 0.0
Total 3 1 0 0 1 33.3 105.0 2.9 1.0
Rural
21 2 2 0 0 2 100.0 17.5 11.4 11.4
22 1 1 0 0 1 100.0 17.5 5.7 5.7
23 0 0 0 0
0.0 17.5 0.0 0.0
24 2 2 0 0 2 100.0 17.5 11.4 11.4
25 2 1 0 0 1 50.0 17.5 11.4 5.7
26 3 1 0 0 1 33.3 17.5 17.1 5.7
27 0 0 0 0 0 0.0 17.5 0.0 0.0
28 1 0 0 0 0 0.0 17.5 5.7 0.0
Total 11 7 0 0 7 63.6 140.0 7.9 5.0
Overall 14 8 0 0 8 57.1 245.0 5.7 3.3
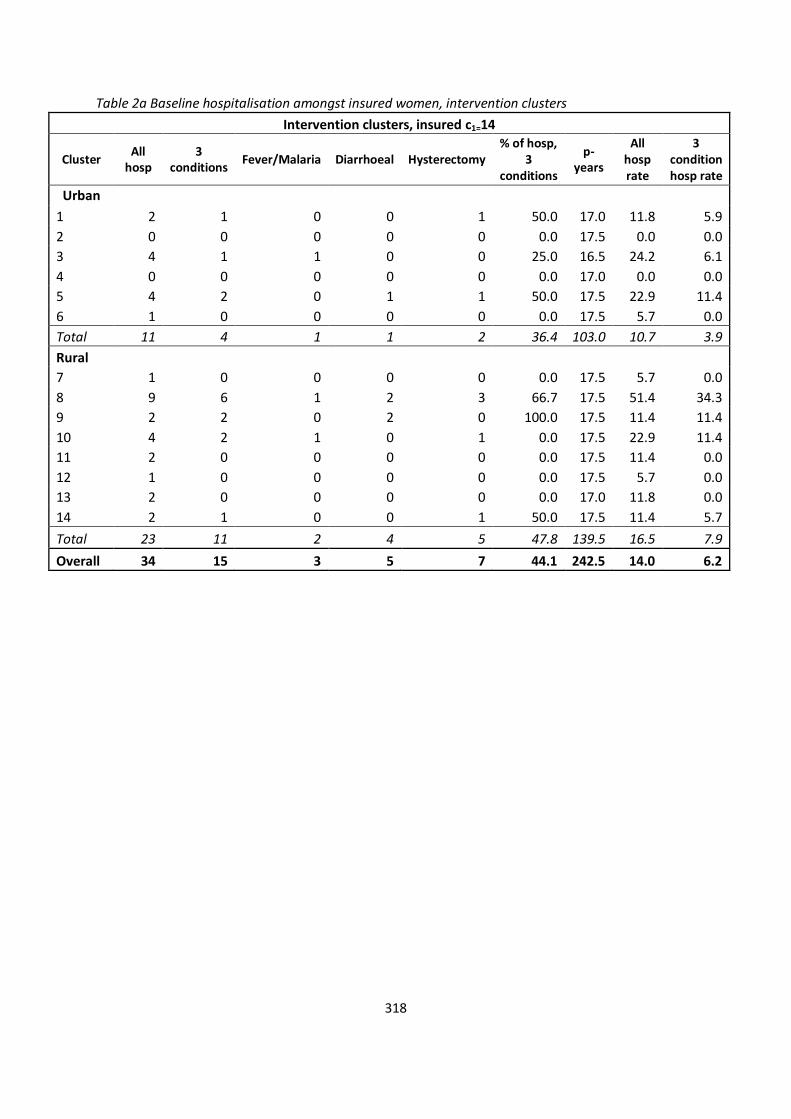
318
Table 2a Baseline hospitalisation amongst insured women, intervention clusters
Intervention clusters, insured c1=14
Cluster All
hosp 3
conditions Fever/Malaria Diarrhoeal Hysterectomy
% of hosp, 3
conditions
p-years
All hosp rate
3 condition hosp rate
Urban
1 2 1 0 0 1 50.0 17.0 11.8 5.9
2 0 0 0 0 0 0.0 17.5 0.0 0.0
3 4 1 1 0 0 25.0 16.5 24.2 6.1
4 0 0 0 0 0 0.0 17.0 0.0 0.0
5 4 2 0 1 1 50.0 17.5 22.9 11.4
6 1 0 0 0 0 0.0 17.5 5.7 0.0
Total 11 4 1 1 2 36.4 103.0 10.7 3.9
Rural
7 1 0 0 0 0 0.0 17.5 5.7 0.0
8 9 6 1 2 3 66.7 17.5 51.4 34.3
9 2 2 0 2 0 100.0 17.5 11.4 11.4
10 4 2 1 0 1 0.0 17.5 22.9 11.4
11 2 0 0 0 0 0.0 17.5 11.4 0.0
12 1 0 0 0 0 0.0 17.5 5.7 0.0
13 2 0 0 0 0 0.0 17.0 11.8 0.0
14 2 1 0 0 1 50.0 17.5 11.4 5.7
Total 23 11 2 4 5 47.8 139.5 16.5 7.9
Overall 34 15 3 5 7 44.1 242.5 14.0 6.2

319
Table 2b Baseline hospitalisation amongst insured women, control clusters
Control clusters, insured c1=14
Cluster All
hosp 3
conditions Fever/Malaria Diarrhoeal Hysterectomy
% of hosp, 3
conditions
p-years
All hosp rate
3 condition hosp rate
Urban
15 3 2 2 0 0 66.7 15.0 20.0 13.3
16 1 1 1 0 0 100.0 16.5 6.1 6.1
17 1 0 0 0 0 0.0 17.0 5.9 0.0
18 0 0 0 0 0 0.0 11.5 0.0 0.0
19 6 4 3 0 1 0.0 17.5 34.3 22.9
20 2 0 0 0 0 0.0 17.5 11.4 0.0
Total 13 7 6 0 1 53.8 95.0 13.7 7.4
Rural
21 1 1 0 1 0 100.0 17.5 5.7 5.7
22 5 2 0 0 2 40.0 17.5 28.6 11.4
23 1 0 0 0 0 0.0 17.0 5.9 0.0
24 3 1 1 0 0 33.3 17.5 17.1 5.7
25 2 1 0 0 1 50.0 17.5 11.4 5.7
26 3 3 0 1 2 100.0 17.5 17.1 17.1
27 3 1 0 0 1 33.3 17.5 17.1 5.7
28 5 2 0 0 2 40.0 17.5 28.6 11.4
Total 23 11 1 2 8 47.8 139.5 16.5 7.9
Overall 36 18 7 2 9 50.0 234.5 15.4 7.7
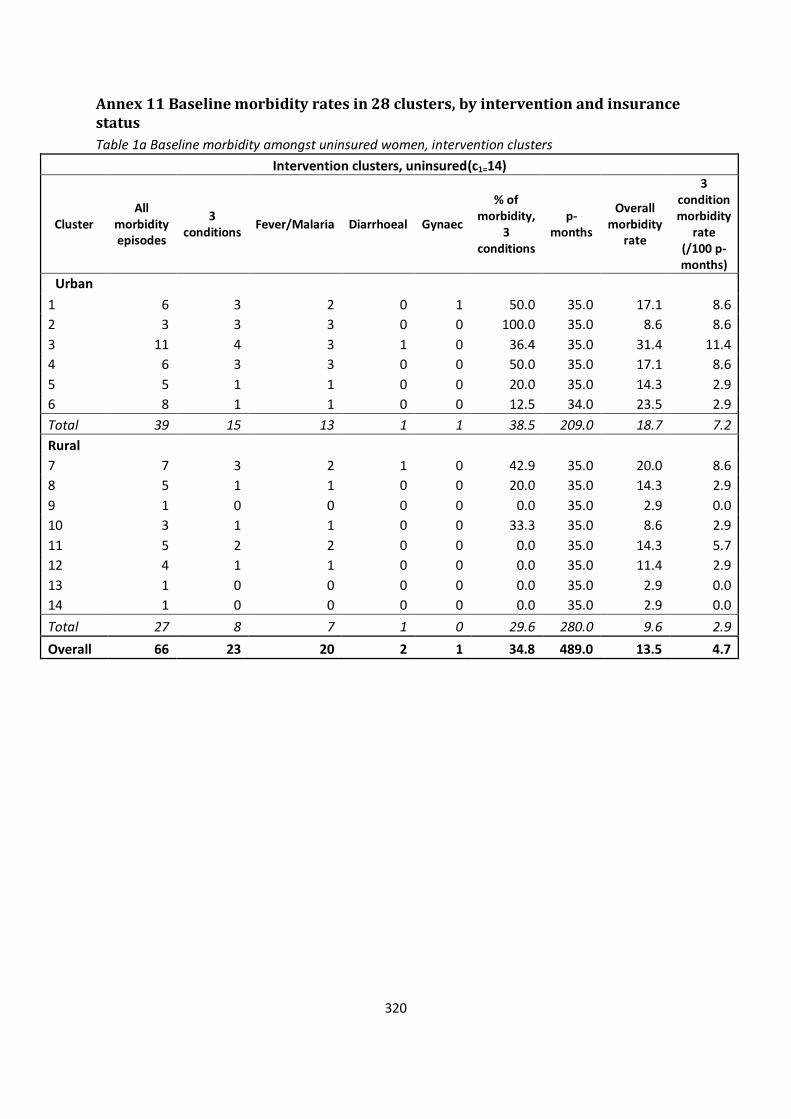
320
Annex 11 Baseline morbidity rates in 28 clusters, by intervention and insurance status
Table 1a Baseline morbidity amongst uninsured women, intervention clusters
Intervention clusters, uninsured(c1=14)
Cluster All
morbidity episodes
3 conditions
Fever/Malaria Diarrhoeal Gynaec
% of morbidity,
3 conditions
p-months
Overall morbidity
rate
3 condition morbidity
rate (/100 p-months)
Urban
1 6 3 2 0 1 50.0 35.0 17.1 8.6
2 3 3 3 0 0 100.0 35.0 8.6 8.6
3 11 4 3 1 0 36.4 35.0 31.4 11.4
4 6 3 3 0 0 50.0 35.0 17.1 8.6
5 5 1 1 0 0 20.0 35.0 14.3 2.9
6 8 1 1 0 0 12.5 34.0 23.5 2.9
Total 39 15 13 1 1 38.5 209.0 18.7 7.2
Rural
7 7 3 2 1 0 42.9 35.0 20.0 8.6
8 5 1 1 0 0 20.0 35.0 14.3 2.9
9 1 0 0 0 0 0.0 35.0 2.9 0.0
10 3 1 1 0 0 33.3 35.0 8.6 2.9
11 5 2 2 0 0 0.0 35.0 14.3 5.7
12 4 1 1 0 0 0.0 35.0 11.4 2.9
13 1 0 0 0 0 0.0 35.0 2.9 0.0
14 1 0 0 0 0 0.0 35.0 2.9 0.0
Total 27 8 7 1 0 29.6 280.0 9.6 2.9
Overall 66 23 20 2 1 34.8 489.0 13.5 4.7
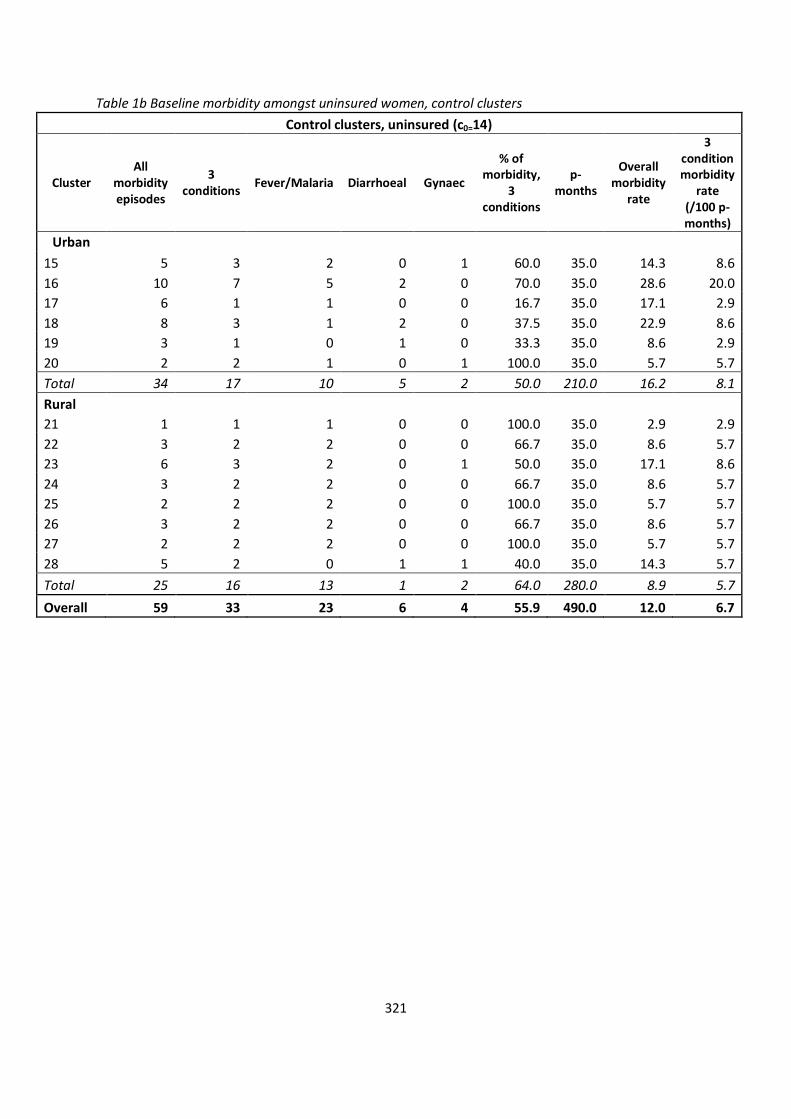
321
Table 1b Baseline morbidity amongst uninsured women, control clusters
Control clusters, uninsured (c0=14)
Cluster All
morbidity episodes
3 conditions
Fever/Malaria Diarrhoeal Gynaec
% of morbidity,
3 conditions
p-months
Overall morbidity
rate
3 condition morbidity
rate (/100 p-months)
Urban
15 5 3 2 0 1 60.0 35.0 14.3 8.6
16 10 7 5 2 0 70.0 35.0 28.6 20.0
17 6 1 1 0 0 16.7 35.0 17.1 2.9
18 8 3 1 2 0 37.5 35.0 22.9 8.6
19 3 1 0 1 0 33.3 35.0 8.6 2.9
20 2 2 1 0 1 100.0 35.0 5.7 5.7
Total 34 17 10 5 2 50.0 210.0 16.2 8.1
Rural
21 1 1 1 0 0 100.0 35.0 2.9 2.9
22 3 2 2 0 0 66.7 35.0 8.6 5.7
23 6 3 2 0 1 50.0 35.0 17.1 8.6
24 3 2 2 0 0 66.7 35.0 8.6 5.7
25 2 2 2 0 0 100.0 35.0 5.7 5.7
26 3 2 2 0 0 66.7 35.0 8.6 5.7
27 2 2 2 0 0 100.0 35.0 5.7 5.7
28 5 2 0 1 1 40.0 35.0 14.3 5.7
Total 25 16 13 1 2 64.0 280.0 8.9 5.7
Overall 59 33 23 6 4 55.9 490.0 12.0 6.7
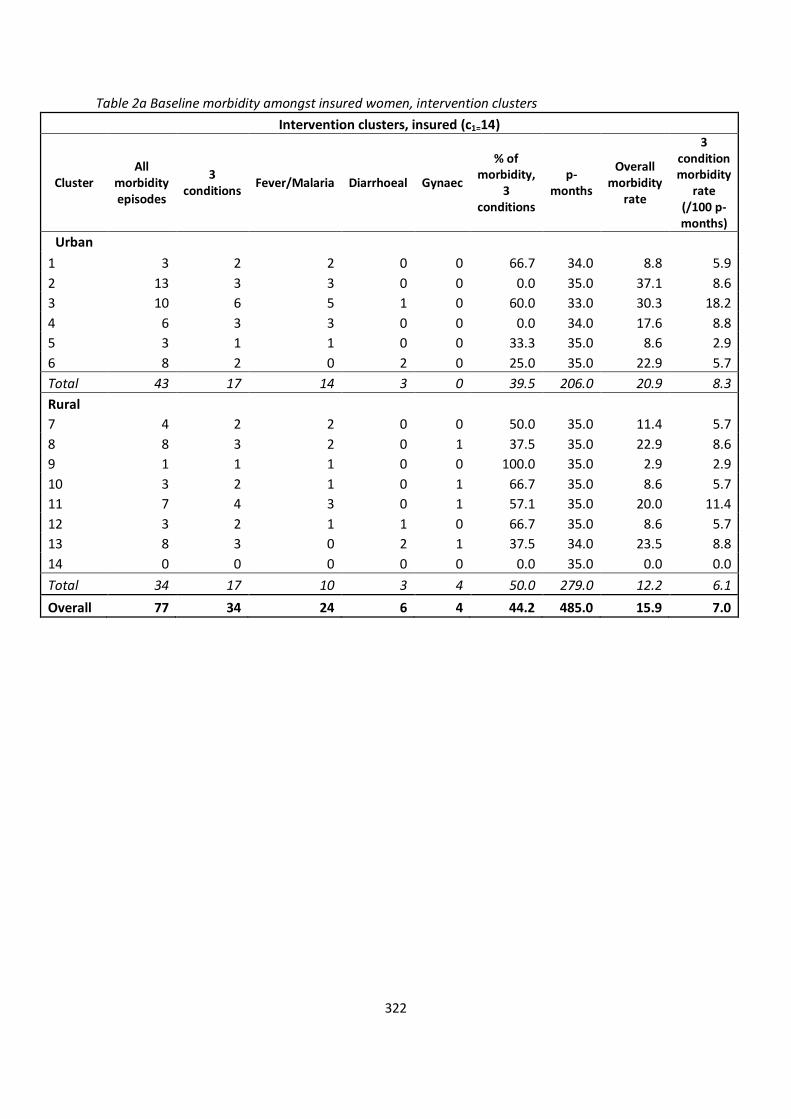
322
Table 2a Baseline morbidity amongst insured women, intervention clusters
Intervention clusters, insured (c1=14)
Cluster All
morbidity episodes
3 conditions
Fever/Malaria Diarrhoeal Gynaec
% of morbidity,
3 conditions
p-months
Overall morbidity
rate
3 condition morbidity
rate (/100 p-months)
Urban
1 3 2 2 0 0 66.7 34.0 8.8 5.9
2 13 3 3 0 0 0.0 35.0 37.1 8.6
3 10 6 5 1 0 60.0 33.0 30.3 18.2
4 6 3 3 0 0 0.0 34.0 17.6 8.8
5 3 1 1 0 0 33.3 35.0 8.6 2.9
6 8 2 0 2 0 25.0 35.0 22.9 5.7
Total 43 17 14 3 0 39.5 206.0 20.9 8.3
Rural
7 4 2 2 0 0 50.0 35.0 11.4 5.7
8 8 3 2 0 1 37.5 35.0 22.9 8.6
9 1 1 1 0 0 100.0 35.0 2.9 2.9
10 3 2 1 0 1 66.7 35.0 8.6 5.7
11 7 4 3 0 1 57.1 35.0 20.0 11.4
12 3 2 1 1 0 66.7 35.0 8.6 5.7
13 8 3 0 2 1 37.5 34.0 23.5 8.8
14 0 0 0 0 0 0.0 35.0 0.0 0.0
Total 34 17 10 3 4 50.0 279.0 12.2 6.1
Overall 77 34 24 6 4 44.2 485.0 15.9 7.0
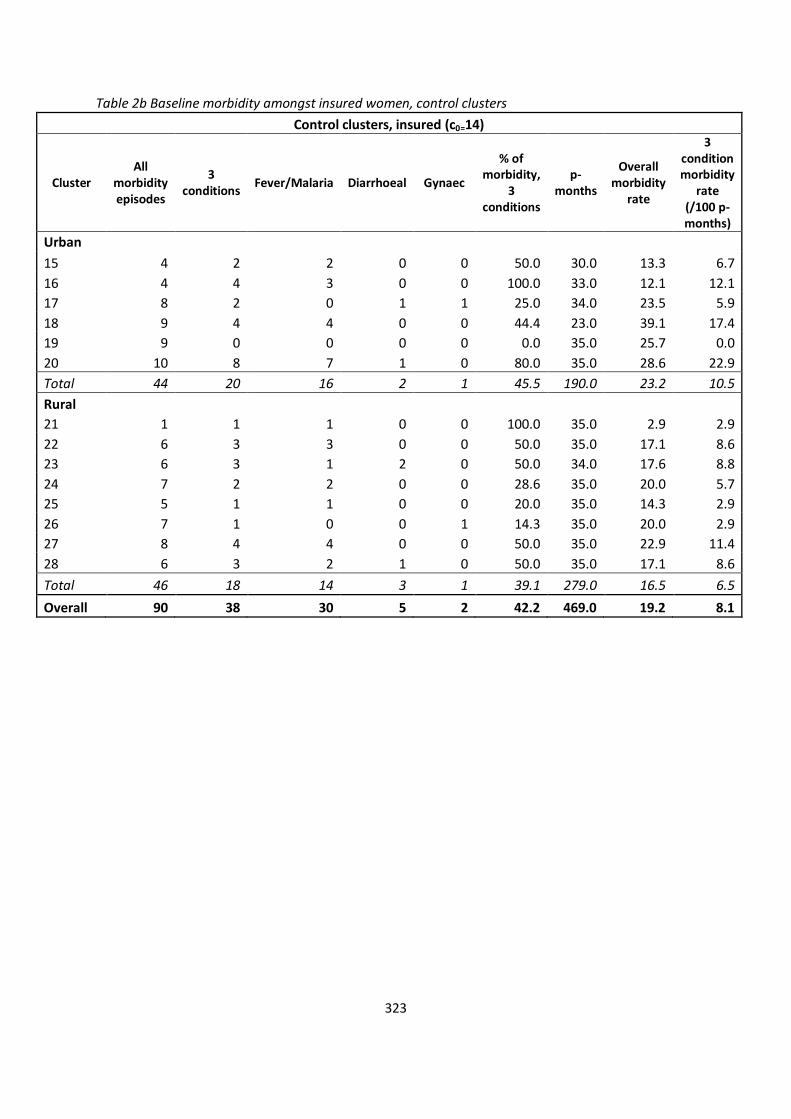
323
Table 2b Baseline morbidity amongst insured women, control clusters
Control clusters, insured (c0=14)
Cluster All
morbidity episodes
3 conditions
Fever/Malaria Diarrhoeal Gynaec
% of morbidity,
3 conditions
p-months
Overall morbidity
rate
3 condition morbidity
rate (/100 p-months)
Urban
15 4 2 2 0 0 50.0 30.0 13.3 6.7
16 4 4 3 0 0 100.0 33.0 12.1 12.1
17 8 2 0 1 1 25.0 34.0 23.5 5.9
18 9 4 4 0 0 44.4 23.0 39.1 17.4
19 9 0 0 0 0 0.0 35.0 25.7 0.0
20 10 8 7 1 0 80.0 35.0 28.6 22.9
Total 44 20 16 2 1 45.5 190.0 23.2 10.5
Rural
21 1 1 1 0 0 100.0 35.0 2.9 2.9
22 6 3 3 0 0 50.0 35.0 17.1 8.6
23 6 3 1 2 0 50.0 34.0 17.6 8.8
24 7 2 2 0 0 28.6 35.0 20.0 5.7
25 5 1 1 0 0 20.0 35.0 14.3 2.9
26 7 1 0 0 1 14.3 35.0 20.0 2.9
27 8 4 4 0 0 50.0 35.0 22.9 11.4
28 6 3 2 1 0 50.0 35.0 17.1 8.6
Total 46 18 14 3 1 39.1 279.0 16.5 6.5
Overall 90 38 30 5 2 42.2 469.0 19.2 8.1
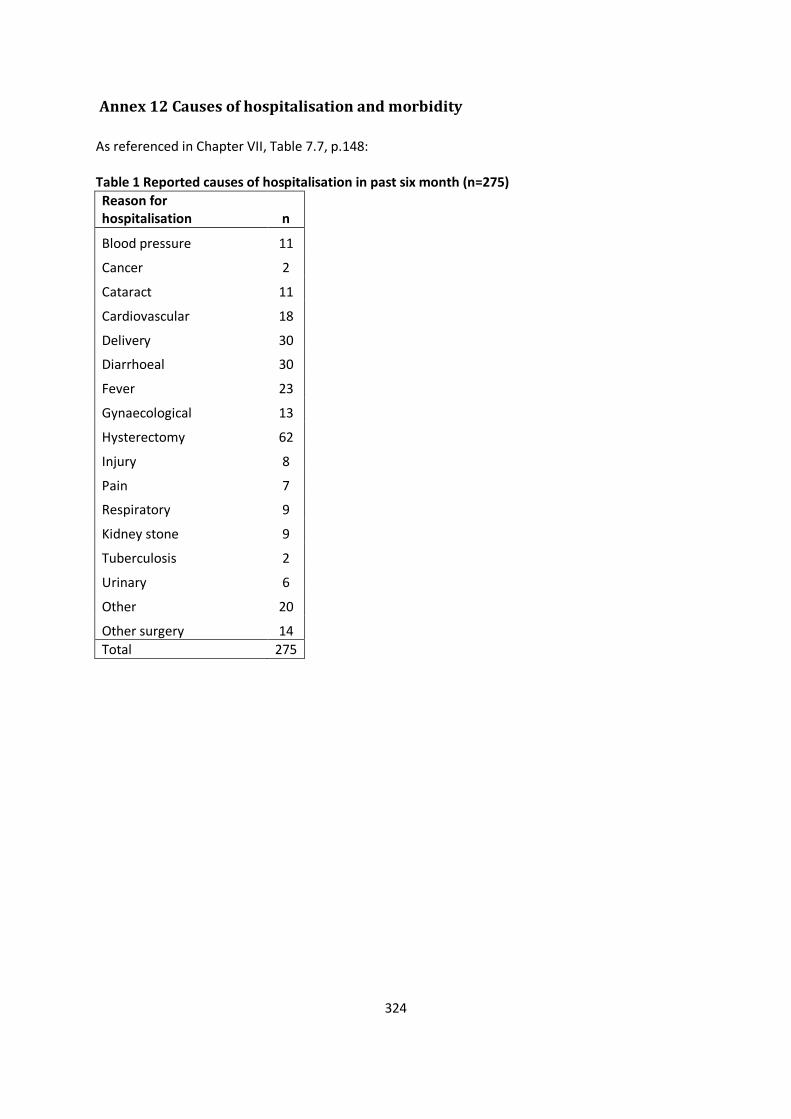
324
Annex 12 Causes of hospitalisation and morbidity
As referenced in Chapter VII, Table 7.7, p.148: Table 1 Reported causes of hospitalisation in past six month (n=275)
Reason for hospitalisation n
Blood pressure 11
Cancer 2
Cataract 11
Cardiovascular 18
Delivery 30
Diarrhoeal 30
Fever 23
Gynaecological 13
Hysterectomy 62
Injury 8
Pain 7
Respiratory 9
Kidney stone 9
Tuberculosis 2
Urinary 6
Other 20
Other surgery 14
Total 275
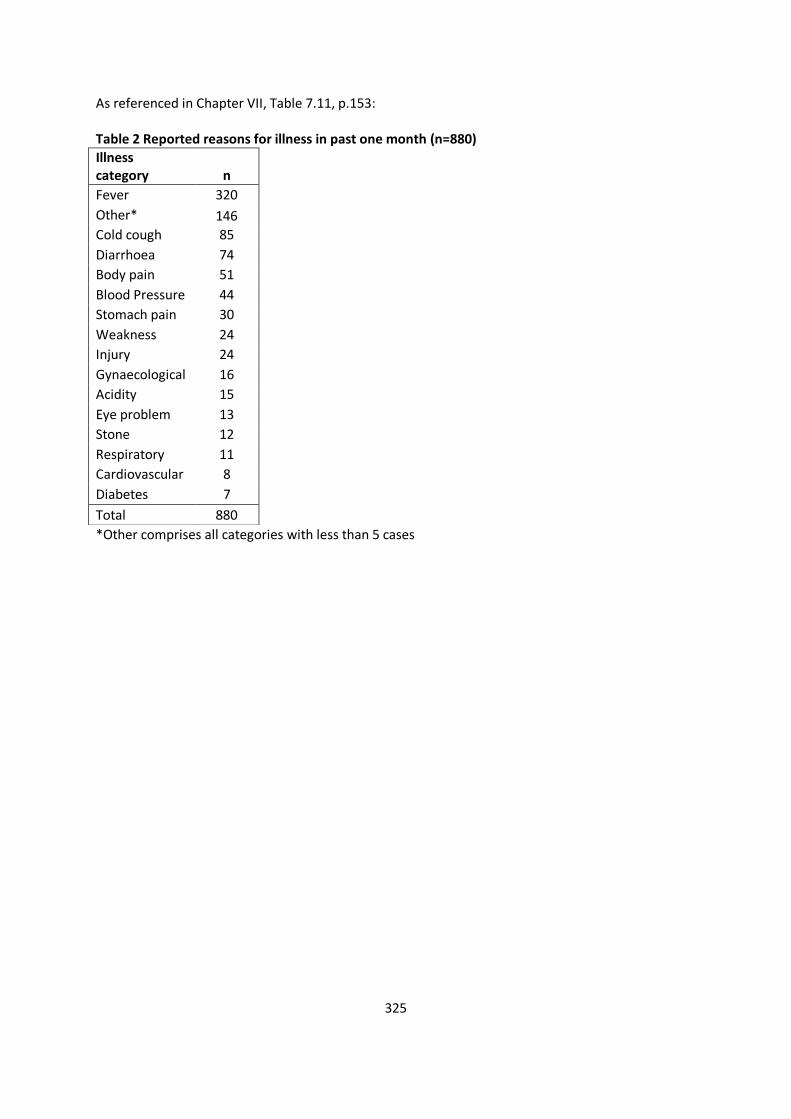
325
As referenced in Chapter VII, Table 7.11, p.153: Table 2 Reported reasons for illness in past one month (n=880)
*Other comprises all categories with less than 5 cases
Illness category n
Fever 320
Other* 146
Cold cough 85
Diarrhoea 74
Body pain 51
Blood Pressure 44
Stomach pain 30
Weakness 24
Injury 24
Gynaecological 16
Acidity 15
Eye problem 13
Stone 12
Respiratory 11
Cardiovascular 8
Diabetes 7
Total 880