
Department of the Interior Water-Supply and Irrigation Papers
379
-
Upload
khangminh22 -
Category
Documents
-
view
1 -
download
0
Transcript of Department of the Interior Water-Supply and Irrigation Papers


Sum CONGRESS , HOUSE OF RE
DEPARTMENT OF T H E INTER I OR
WATER-SUPPLY
AND
IRRIGAT ION PAPERS
OF T HE
UNITED STATES GEOLOGICAL SURVEY
(I)
Z
N O .
N‘
x‘
RECONNAISSANCES OF KERN AND YUBA RIVERS, CA
’
LIFORNIAs
OLMSTED AND MANSON
WASHINGTONGOVERNMENT PRINT ING OFFICE
1 9 0 1


UNITED S TATES GEOLOGICAL SURVEY,
CHARLES D . WALCOT T , DIREC T OR
PHYSICALCHARACTERISTICS OFKERNRIVERCALIFORNIA
F R AN K H O L M S T E D
RECONNAISSANCEOFYUBA RIVER, CALIFORNIA
M AR S D E N M AN S ON
WASHINGTONGOVERNMENT PRINT ING OFFICE
1 9 0 1


CONT ENT S
PHYS ICAL CHARACT ERIS T ICS OF KERN RIVER, CAL IFORNIA,
BY FRANK H.
OLMS T ED
Introduction
Physical features
Volume
Power possibilities
RECONNAISSANCE OF YU BA RIVER CAL IFORNIA,BY MARSDEN MANSON .
Watershed
T opography i
Natural storage of water in Yuba River BasinArtificial storage possibilities
Comparison of low-water discharge from a timbered area with that
from a comparatively treeless area
Dischargemeasurements of Yuba River and its tributaries
INDEX


ILLU S TRAT IONS
PLAT E I . View of Kern River near Kernville
II . View of gaging sta tion on North Fork of Kern River
III. Map of upper Kern River
IV . A, Head of South Fork of Yuba River and Lake Spaulding ; B
Yuba River in the foothills
V . A , Canyon of Middle Fork of Yuba River ; B ,Middle Fork near
Freeman’s crossing
VI . A , English reservoir site on Middle Fork or Yuba River ; B ,Small
dam of English reservoir
VII . A ,BrownsValley Irrigation District dam fromabove ; B ,
Browns
Valley Irrigation Distr ict dam from below
VIII . A , Second-growth forest destroyed by fire ; B ,
Head of South Yuba
FIG . 1 .
(O
ca
mp-
cm
q
12.
13 .
14 .
1 5 .
1 6 .
1 7 .
18.
Canal Company s di tchMap showing minor drainage basins of upper Kern River
Profile of Kern River.
View of mountain valley in Kern River Basin
Profile of South Fork of Kern River
Map showingo points of streammeasurements
Diagram showing synchronous discharge and temperature observa
tions at First Point of Measurement
Plan of reservoir site of Kern River CompanyCross sect ion of proposed dam site of Kern River Company on
S almon CreekPlan of reservoir S i te of Kern-Rand Electric Power Company
10.
1 1 .
Plan of dam site of Kern-Rand Electric Power CompanySectional elevation of dam proposed by Kern-Rand El ctric Power
CompanyVertical section of tower for damproposed by Kern
-Rand Electric
Power Company ,showing arrangement of gates
Sectional. elevation and plan of gate tower for dam proposed by
Kern-Rand Electric Power CompanyMap of Yuba River , showing location of gaging stations
Diagram showing depth of snow at Lake FOI dyce
Curve showing relation of gage height to discharge of Yuba RiverCui ve showing relation of gage height to discharge of North Fork
of Yuba River
Curve showing relation of gage height to discharge of Middle Fork
of Yuba River


LET TER OF TRANSMIT TAL .
DEPARTMENT OF T HE INT ERIOR ,
UNITED STAT ES GEOLOGICAL SU RVEY
DIVISION O F HYDROGRAPHY ,
Wasinngton ,D . Rfarch 6 , 1 901 .
S IR : I have the honor to transmit herewith two manuscr ipts forpublication together in the series of papers upon water supply and
irrigation .
T he first manuscript is by Mr. Frank H . Olmsted , a civil engineerof southern California ,
and relates to the physical characteristics of
the catchment area of Kern River , California . In this paper the
author describesthe dra inage basin and estimates the amount of
water coming from it and the power available from a complete ut ilization of the various.portions of the Stream. He also d iscusses theuti lization of this power in pumping for irrigation .
T he ultimate development of a considerable portion of the aridregion depends not only . upon complete storage and control of thestreams
, but upon the largest possible use of the power which may be
generated in the upper or steeper portions of the channel and trans
mitted electrically out upon the plains, to be used '
in b ringing to thesurface themoisture which has sunk below the reach of the roots of theplants. By thismeans the area of cultivation can be greatly extended ;and ,
as shown by Mr. Olmsted,the cost of pumping thiswater and
applying it to the soi l may ,under favorable conditions, be less than
that of obtaining a supply by gravity .
In earlier pamphlets of this series of Water- Supply Papers the uti lization of wind power for this purpose has been discussed
,the
efficiency of the windmill has been described , and the advantages dueto the small cost and independent construction of each mill havebeen shown . Where, however , it is practicable to obta in electricpower at small cost
, pumping plant'
s Operated by electricity can be
widely distributed and may have certain advantages over the windmill . It is therefore important , in any discussion of the method of
utilizing the water resources, to bring to public attention the possibledevelopments along this line .
T he second manuscript presented herewith has been prepared byDr. Marsden Manson ,
and relates to Yuba River,a tributary of the
Sacramento. Dr . Manson discusses the physica l conditions and storage possibi lities of this stream,
bringing out particularly the importance of preserving the forest cover on the upper catchment basin,
9

1 0 LET T ER OF T RANSMIT T AL .
and,if possible , increasing this by artificial means ; and shows by
estimates the possible increase of ava ilable water through completeafforestation of the area . T he relation of forests to river flow is
believed to be of great importance , and is a matter upon which precise data are needed . It is hoped that as the systematic river meas
urements continue it will be possible to state more and more defi
nitely the precise relation which the forest cover bears to the behaviorof the stream.
T he protection of the forests by the creation of reservations and
the conservation of the waters through reservoirs constructed withinthese various reservations are of such vita l importance to the utilization of the arid lands of theWest
,both by d irect irrigation and by
the creation of power for pumping water , that a ll matters pertainingto these subjects have interest to the citizens of the country as the
great landowners.
It is for these reasons that these manuscripts are presented as con
tributions to a larger knowledge of the subject .
Very respectfully ,F . H . NEWELL
,
Hydrographer in Charge.
Hon . CHARLES D . WAL COT T,
Director United S tates Geologica l Swrvey .

PHY SICAL CHARACTERISTICS OF KERNRIVER
,CALIFORNIA
,WITH SPECIAL
REFERENCE TO ELECTRIC POWERDEVELOPMENT .
By FRANK H . OLMS T ED .
IN T ROD U C T ION .
T he development of southern Ca lifornia has been retarded by
three factors which are still operative ; ( 1 ) Distance from the world’smarkets and commercia l centers ; (2) Shortage of water ; (3) lack of
cheap fuel and power . Volumes might be written in regard to therelation which the development of water in southern Californ ia bearsto the progress of the people ,
but broadly stated it may be Said thatthe real development of this section will be defined and limited bythe amount of water ava ilable for irrigati on from San Diego to SantaBarbara and from S an Pedro to the desert on the east . Regardingcheap fuel and power
,neither Los Angeles, the commercial center of
this section,nor any other p lace in Southern California has h ad it
,
and even now,When it is reasonable to suppose that the loca l oil
industry is at its best,the price of oil is approaching $1 a
.
barrelof 42 ga llons ; or
,expressed d ifferently ,
the cost of oil as fuel isequa lto bituminous coa l at $4 a ton . During the last five yearsLosAngeleshas had an industrial awakening correspond ing to this decrease in thecost of fuel from $7 or $8 a ton to $4 a ton .
During the first year of its advent in the Los Angeles market thecost of oil ranged between and $1 a barrel . Most of the usersofcoal at that time found it economical to change thei r grates to Oil
burners, but since 1 896 the tendency of the oil market has beenupward , until now the cost of oil is 5 to $1 a barrel . At a
barrel o il as fuel is no cheaper than Ga llup coa l at $7 a ton,except
that usually the oil feeder is arranged so as not to require an attendi
ant , thus saving the wages of a stoker . In carload lots,the cost of
Wellington bituminous coa ls is about $1 a ton more than the Easternlignites ; and
, limited as the output has been ,at present it virtua lly
1 1

1 2 “RECONNAISSANCE OF KERN RIVER,CALIFORNIA. [No . 4
controls the Los Angeles market . During at least half of the yez
the demand in Los Angeles is so near the greatest available supp]that outside orders for coal are not sought . T he oil supply has 0 0 ]
tributed to the industria l advancement of southern California,an
there are many reasons for believing that with cheap electric powc
FIG . 1 .-Map showing minor drainage basin; of upper Kern River .
the manufactures and industries of southern California in gener
and of the city of LOS Angeles in particular , would quicklyand that t heir growth would be upon a safer foundatio
broader basis. T he future outlo
hope for much better fuel rates,

OLM S T ED .] INTRODU CT ION 1 3
Sa lt Lake Ra ilroad assured ; but there is good reason to expectcheaper power, and if this expectation.
is rea lized ,the greater part of
the power must come from Kern River .
PH Y S IGAL FEAT U RES .
Kern River rises on the Western S lope of the S ierra Nevada,the
greatest mounta in range in the United States. For a d istance of 1 00
miles the average elevation of this crest line ismore than feetabove the sea
,and so great is the run - off that w ithin the first 1 5 miles
of its course the river receives 80 per cent of its total summer flow at
the mouth of its canyon 1 00 miles away . T he drainage area of the
stream above the -latter point is squaremiles. Fig . 1 is a map
Showing the d istribution of this dra inage area,the minor dra inage
basins being outlined and their respective areas given . T he following tables give the names and the respective areas of these minordra inage basins
Area s of minor dra inage basins of North Fork of Kern River.
Square
Headwaters
Whitney CreekSmall Creek _
,
Ninemile CreekMenache Creek
T rout Meadow Creek
Harris Creek
T ibbetts Creek
Brush Creek
Safmon Creek
Corral and other creeks .
L ittle Kern River
Needles Cree’
k
Clark Creek
Jackson Creek ”
Wade Creek
T obias and other creeks“
Bull Run Creek
T illy Creek
T o tal to junction of South Fork 0
Areas of minor dra inage ba sins of S outh Fork of Kern River .
Headivaters
Fish Ci'eek
Middle tributaries
Lower tributaries from north_
Lower tributaries from south
T otal to junction with North Fork 1,004 . 8

RECONNAIS SANCE OF KERN RIVER, CALIFORNIA. [NO . 46.
Dra inage a rea s of Kern River.
N orth Fork
S outh Fork
T ributaries from north side after junction
T ri butaries from south side after junct ion
T otal 2 , 349 . 3
T he length of Kern River from King River summit,on its ma in
fork,to the mouth of the canyon above Bakersfield is 11 8 mi les.
T he channel is in granite ,and
,with “the exception of a few drops in
the lower reaches of the stream,the grades are fa irly un iform. In
6 0mi les
F IG . 2.
—~Profi le of Kern River .
the 62miles above Kernville the stream falls" feet,and in the 48
miles below Kernvi lle it fa lls about feet ; A V iew of the rivernear Kernv ille is Shown in PI. I
,and a profi le of the stream in fig. 2 .
F ig . 3 is a View of a mounta in valley in the basin of the river.
T he South Fork of the stream,which rises just‘ south; of C irque
Peak , is 83 miles long to its jun'
ction'
wit'
h the North (or main) Forkat Isabel la . T he mainrange of the S ierra Nevada drops Off rapidlyjust south of C irque Peak,
which may account in a“large measure for
the comparat ively small flow of the South Fork . This branch of
Kern ‘River possesses one decided advantage over the other branch ,


1 6 RECONNAIS SANCE OF KERN RIVER , CALIFORNIA. [No . 46
gravity lines. Power applied to the pumping of water from the
gravel bedswhich underlie most of the California streamswhere the)debouch from their canyons at once solves. the diffi culty ; and whenthe wa ter plane is not far below the surface thismethod of irrigat ior
FI G . 5.—Map showing points of streammeasurements.
is in many ways more convenient and perhaps not more expensi
than the ord inary canal .V OL U BIE .
From daily measurements continued through a series of years t
run-off of Kern River Basin Is well established ,though the precip


OLMST EDJ VOLUME . 1 7
tion and the local d ischarges in the watershed are still in question .\
Mr . Henry Hawgood , Mem. Inst . of C . E. who hasmade a careful studyof the physical cond itions existing in the watershed of Kern River
,
more particularly in that of the North Fork,has est imated the annual
precipitation for the North Fork above Isabella at inches,with
a run- off of inches. This would give a mean annual flow of
the North Fork of 982 second -feet . Mr . Hawgood estimates the ra infall of the entire basin at 23 inches
,and the mean run-off at
inches. On this last assumption the mean d ischarge of Kern Riverat itsmouth would be second - feet . As a fact
,
'
however,for the
last five years ( 1 895— 1 899)— a period of exceptional drought in the
basin— the stream has had a mean annual discharge at First Point ofMeasurement , near Bakersfield (see map ,
Pl . III ) , of 864 second-feet,
or 64 per cent of the normal assumed by M r. Hawgood .
In June,1 900
,stream measurements made by the writer above
Kern Lake about 90 miles above First Point of Measurement,showed
that,when considered with measurements made at the latter place
and making a time allowance for the distance between,the discharge
of the upper part of the stream was 99 per cent of that of the lowerpart . T he loss in volume in the passage of 939 second - feet of water(the amount flowing in the river j ust above Kern Lake on June 27
,
1 900) fromKern Lake to Bakersfield can not be stated accurately ,
but in the lower reaches of the stream,from Isabella to Bakersfield
,
where the cond itions are S imilar,the loss when the flow was
second - feet was determined by the writer to be second - feet to themile . On this basis, on June 27 , 1 900 , the flow of the North Fork justabove Kern Lake was equa l to 83 per cent of the flow of Kern Riverat First Point of Measurement . Fig. 5 is a map Showing the pointswhere streammeasurementswere made
,and the following table gives
the dates of the measurements and the d ischarge in second - feet,the
numbers in the table corresponding to the numbers on the map .
Discharge measurements of Kern River and tributar ies a t p oints shown on map(fig.
Location . Date . D ischarge . Loca t ion . Date . Discharge .
1900.
S ee -f t(First Point ofMeasure
ment . )June 19June 20June 21June 22

1 8 RECONNAIS SANCE OF KERN RIVER, CALIFORNIA. [No. 46.
S ince September , 1 893 , the Kern County Land Company hasmadecareful da i ly measurements of the flow of Kern River at F irst Pointof Measurement . At Rio Bravo ranch
,in sec . 1 1
,T . 29 S .
,R . 29 E.
,
M . D . M .,871 miles above F irst Point of Measurement , the flow of the
river has beenmeasured formany years by the S tate engineer of Cali fornia . It
.
is estimated by Mr . James,chief engineer of the Kern
County Land Company ,that there is a loss of 50 second- feet between
these gaging stations. T he accompany ing tables give the monthlydischarge of the r iver at Rio Bravo ranch for the years 1 878— 1 884
,
inclusive ,and at
’
F irst Point of Measurement for the years 1 893—1 900
,
inclusive . On page 22 is a comparat ive table of the estimated dailydischarge of the river during 1 900 at First Point of Measurement andj ust below Tobias Creek ,
which is 1 7 mi les above the mouth of the
South Fork of Kern River and about 2 miles above the mouth of Sal
mon Creek , and enters the North Fork from the east .
On pages 22 and 23 is a table of miscellaneous discharge measurements of Kern River and its tributaries, and on the latter page are
tables of rainfall at three places in Kern River Basin .
Estima ted monthly discharge of Kern River a t Rio Bravo ranch.
Discharge in second-feet . Run-Off.
Month .
Mean .
N ovemberDecemberJanuary
0
S eason
S eason 850, 361I


RECONNAI SSANCE OF KERN RIVER ,CALIFORNIA. [No . 46
Estima ted monthly discha rge of Kern River a t First Point of Measurement.
[Dra inage area used in p revious reports, square miles ]
Discharge in second -feet . Run-off .
Month .
Mean .
T he y ear 533 , 252
January 0
FebruaryMarch
T he y ear 1 , 413 058
T he y ear
February
T he y ear

om srm ] VOLUME . 21
Estima ted monthly discharge of Kern River a t First Point of Measurement— Cont’d .
Month .
Mean .
JanuaryFebruaryMarchAprilMayJ uneJulyAugustS eptemberOctoberNovemberDecember
T he y ear 251 , 743
JanuaryFebruaryMarchApril
T he year
T he y ear
T hirteen-
year mean of the discharge of Kern River ,as comp i led from theforegoing
records of the S ta te engineering dep artment and the Uni ted S ta tes Geologica l
Survey.
S eason and y ear . Discharge .
- a
T h irteen-
year mean

22 RECONNAISSANCE OF KERN RIVER, CALIFORNIA. [Na /16 .
Estimated da i ly discharge .of Kern River for 1 900.
August . S eptember . October .
First Just be First Just be First Just be First Just bePoint of low Point of low Point of low Point of lowMeasure T obias Measure T obias Measure T obias Measure T obiasment . Creek . ment . Creek . ment . Creek . ment . Creek .
S ec.-f t. S ea -f t.
Q
Mean 166 . 45 228 . 91
Miscellaneous discha rgemeasurements of Kern River and i ts tributaries.
Date . S tream. L ocality . Hy drographer .
Feet.
North Fork of Kern F . H . Olmsted
River .
Basin Creek R a n k i n s ranch ,
S outh Fork of Kern Walkers Basin .
River . 700 feet above juncNorth Fork of Kern t ion .
River . Hooper’smill bridgeBull Run Creek Near mouthT obias Creek - _doAnt Creek AtmouthS almon Creek -doCorral Creek Near mouth
SouthNeedlesCreek At Needles Peak
A”channel , above
Jun c t i o n w i t hS outh Fork .
B channelC ”
channelD channel700 feet above
’
unc
tion w i t h or thFork .
At mouth
A t engineers’
o l dcamp
S ec. 6 , T . 22 S . , R. 36 EMenache MeadowsFirst Point of Meas
urement .

OLMS T ED . ] VOLUME . 23
Miscellaneous dischargemeasurements of Kern River and i ts tributaries— Cont’d .
Date . S tream. L ocality . Hydrographer .
Clark CreekJackson CreekWade CreekNor th NeedlesCreekLittle Kern RiverT ibbetts CreekHarris CreekOnemile CreekNorth Fork of KernRiver .
Whijtney Creeko
Creek south of BaldMountain .
North Fork of KernRiver .
S outh Fork of KernRiver .
T ibbet ts CreekNorth Fork of BrushCreek .
Brush CreekNorth Fork of Kern"River .
Salmon CreekSout h Fork of KernRiver .
Powers ditchNei ls ditchHooper ’smill ditch
Precip i ta tion in Kern River Basin.
DAUNT .
[Observer , Mountain Home sawmill . ]
KERNVILLE .
[Observer , S tephen Barton , Isabella ]
S eason . Sept . Oct . Dec . Jan. Feb . Mar . Apr . May . June . July . Aug . T otal .
00 12. 0800 4 . 50
00 5 . 3800 5 . 69
MOUNT BRECKENRIDGE.
[Observer , G . Otterman . ]
Dry Meadows
-dodo
At Needles PeakAt junction withKern River .
1 mi le above mouthAt mouth1 mile below KernLake .
feet above junction with LittleKern River .
At tunnel in divideAt lava bridge
800 feet above KernLake.
Menache Meadows
At 8 300 feet elevat ionAt 5 800feet elevation
Above North ForkAt new gaging sta
tion f e e tabove junctionwithS outh Fork .
At Horse MeadowsT . 25 S . , R. 35 E
Near headIsabella
At gaging stat ion onKern River .

24 RECONNAIS SANCE OF KERN RIVER, CALIFORNIA. [No . 46 .
T he rain gage at D’
aunt isat the Mounta in Home Sawmill,near the
d ivide between Kern and Kaweah r ivers,and at anelevat ion of
feet . Kernville is at -
an elevation of feet,and Mount Brecken
ridge at an elevation of feet .
From the d iagram (fig. 6 ) showing synchronous discharge and tem
perature observations at F irst Point of Measurement forthe monthsof April , May ,
and June , 1 897— the particular seasonof the year whenthe factor of snow enters prominently into the regimen of the
"
r iverwe gather , by
'
connecting the peak points of flow and temperature,that ordinar ily it requires about forty -seven hours for the streamwaters to pass from the snow line
,about 1 00 miles up the river
,to
Sec -ft . Degrees.
F IG . 6.—Diagram showing synchronous
' discharge and temperature observa
tions a t First Point of Measurement . Dotted lines are temperature curves;
heavy lines are discharge curves.
F irst Point of Measurement . Under ordinary circumstances themelting of snow below the 7
,000- foot contour would accompany a low gage
and the mean velocity would of course be relatively slow compare (with a larger stream. T he run -off of the heavy snowswould s tar
certa inly not lower than the - foot contour,and invariably woulc
be accompan ied by a genera l breaking up of winter in the b ighemountains, resulting in a high gage throughout the entire streamfrom which we may infer that there is no marked difference in th
t ime required for the passage of snow water between points asmuc.
as 30 miles apart to the canyon mouth . When the Spring rise beginthe mean velocity of the stream waters from the snow line
,60 mile

om smn q POWER POS SIBILIT IES . 25
up ,to First Point of Measurement must be about feet per second .
IVhen the snow line reaches the - foot contour , 100miles upstream,
the flood velocity is approximately feet per second . This 1 . 2 footper
-second play in velocity between high and low snow water gage in
the stream represents the only data ava ilable for estimating, even
crudely ,the velocity-slope I elations during the remainder of the year .
P OWER P OS S IB IL I T IE S .
Elevations and distances have been and sti ll are to a certain extentassumptions, and wereit not that the data in some form is in demand ,it certa inly would be desirable to possess more basic information of
Kern River Basin before undertaking to even outline the power
possibilities of the stream. T he flood period of the year isMay and
J une ; the minimum flow occurs in September and October . Duringextremely dry years the flow at F irst Point of Measurement drops to80 second - feet
,with a probable mean for the month in which this
occurs of,say ,
1 00 second - feet .
In the reach between First Point of Measurement and Isabella thestream has been affected by losses from evaporation and seepage and
by increment in flow due to the South Fork,Clear Creek , and other
small tributaries. T he~
net result of these plus and minus factors isestimated to be a loss between t hese points of 1 22 second - feet . Calling this loss 1 20 second - feet
,and taking the -minimum flow at First
Point of Measurement (80 second- feet ) , we have, as the least flow of
the river at the latter place , 200 second - feet . Between Isabella and
F irst Point of Measurement the fall is about feet, giving more
than theoretical horsepower . At Isabella the mean flow for
the full year 1 899 was 588 second - feet,for 1 898 it was 4 69 second - feet
,
and for 1 897 it was second- feet . Below Isabella the topographyon . the right bank is not unfavorable for the construction of a largecanal
,but the immense bowlders which cover the southern and west
ern sides of the Greenhorn Mountains,and which are constantly in
transit down the slopes, are not an economical. factor in canal construction .
Of the total flew of Kern River at F irst Point of Measurement80 per cent passes Funstons on the North Fork
,or a point of equal
elevation feet) on the South Fork ,which would be about mid
way between the lower end of Menache Meadows and the mouth of
Fish Creek . T he theoretical power possibilities of the stream belowthese placesWould be , then , about horsepower, which , for a
watershed of square miles in an arid region ,evidences the
remarkable advantages of the stream,so far as grades and d ischarge
are concerned , for electrical-power development .T he Kern River Company ,
which has been engaged for the last fouryears in securing rights of way (nowapproved by the Department ofthe Interior) , and in arranging preliminaries incident to the construe

26 RECONNAI SSANCE OF KERN RIVER, CALIFORNIA. [no-46 .
tion of so large a plant , has as yet accomplished nothing in thewayof actua l building. A plan of the reservoir
‘
site of the company isshown in fig. 7 . T he diversion works of their power canal will be in
FIG . 7 .— P1an of reservoir site of Kern River Company . Area , acres; storage capacity ,
acre-feet ; height of dam, 72 feet .
the lower end of the town of Kernville, where the river forks. T he
West Fork is to be deepened so that during low stages this branchwill gather all of the water of the river
,and a low training wall
,over
which floods of the riverWill pass, wi ll be built . T he head gate will

28 RECONNAISSANCE OF KERN RIVER, CALIFORNIA. [No . 46 .
T he company’s estimate of the cost of construct ion of the plant andl ines for the transmission of the current to Los Angeles is, approximately ,
Using direct-connected motor and centrifugalpumps, with 30 feet depth of wheel pit and 20 feet additional lift , andassuming the duty of water to be 8 acres per miners’ inch , horsepower would irrigate 100 acres at the rate of
,say , per acre per
annum. This would be on the basis of a 50-foot lift and a rate of 2
cents per horsepower per hour for the current . T he efficiency of
pumping plants ranges from 20 to 68 per cent— frequently plants arecondemned solely because of a lack of skillful assembling of the units.
Electric motive power possessesmany advantages over either steamor gasoline plants for pumping water , and in actual cost of service itmay be questioned whether it is not to be compared with many wellmanaged canal systems of the S tate . T he Kern Land Company hastwenty
-five pumping plants in operation near Bakersfield , each delivering from to gallons a minute . These plants each consistof four wells in a line
,sunk to a depth o f 80 to 1 30 feet through strata
of alluvial loam,clay ,
and water-bearing sand T he wells are casedwith galvanized iron,
1 3 inches in d iameter,No . 1 6 gage, perforated
with vertical slits opened one- S ixteenth of an inch . It was the prae
tice of Mr . Lewis A . Hicks,the engineer in charge of this work
,to
land the casing in clay ,and to perforate for all sand below a depth
of 30 feet . Surface waterwas generally encountered at about 1 5 feet .In each plant the four wells are 6 feet apart on centers, and by experiment it was found that the flow from the four was generally a
more than double that from one . T he total lift for most of
plants was about 35 feet .
Aftermany experiments to determine the pump best suited toconditions
,a centrifugal pump ,
connected directly to the motoworking on a vertica l rod
,all thoroughly bolted to steel f
was found to give the greatest efficiency and the leastoperation— one attendant looks after ten plants, and theremonths when the plants were in operation
that the rate of 14 cents per horsepower per hour could be 111
in Antelope Valley or farther south in San Fernando Valleyular demand
, but there is no good reason why a 2-cent rate 0
be ma intained by any of the Kern River companies.
T he 68 per cent efficiency obtained in many of the Kern Lapany
’s
‘
plants deserves more than passing notice . In ele
driven pumping plants 55 per cent efficiency (reckonedmeter consumption to the foot -pounds ra ised ) is very good ,this is

om smm POWER POSSIBILIT IES . 29
merits a deta iled description . T he follow ing is quoted from one of
Mr . Hicks’s reports
T he pumps are of the Pit type , provided with 1 0-inch outlet , automatic balance ,
heavy shaft , and runnersof special curvature adapted to the speed and height of
lift , and a delivery of 5 to 6 cubic feet per second . T he bearings are provided
with sight-feed oil cups, and the feed on the upper bearing is upward against the
water with which the stuffing-
gland chamber is filled . T he chamber is provided
with a gage glass to ,
enable the attendant to note any leak through the packing .
T he pump is bolted to cast-iron pedestal set o n a wooden base ,and the steel
angleswhich support the motor are attached to the same pedestal .~ T ~he a ssem
bling of the pumps and frame was accomplished in the shops, and the completedunit was hauled to its destinat ion and lowered into place on the floor of the pit ,
only requiring to be guyed to a perpendicular position in the anchor frame to be
ready to receive the motor . T he adjustment of the thrust of the pump can be
altered so as to carry the entireweight of the motor and shafting or such portion of
it asmay be desirable . It has been found preferable to separate themwith 100 to200 pounds down thrust , as there is a tendency to bow out the shaft between
bearings if it is thrown into compression wi th resulting vibration . T he motor
is provided with adjusting screws, so that its position in vertical or horizontal
planes can be easily changed with a hand wrench . T he pump ,motor
,and frame
constitute a self-contained unit , so that any settlement of foundation does not
Feet .
Feet . 0 200 250 450 500
FIG . 8.— Cross sect ion of proposed dam site of Kern River Company on Salmon Creek .
alter‘
the relative position of ei ther machine,and can be quickly rectified ,
should i t
occur,by guying the frame back to a vertical position . T he motors used for this
installation are the ordinary type of 30-horsepower inductivemotor
, equipped with
special end shields to adapt them for vertical use . T he oiling is accomplished bymeans of centrifugal force , which is utilized to lift the oil from the inside periph
ery of a revolving cup to the top of the bearings, whence it returnsto the oil cups
through oil grooves along the shaft . T he motors are wound for a potential of 550
volts, and as the transformers at these pointscan be connected up to 605 volts, the
efiective heating overload is greatly reduced .
T he Kern River Company’s transmission line from the power stationat the mouth of Clear Creek to Los Angeles would be 1 05 mi les long,map measurement , and 1 08 miles when the vertica l departures are
considered . T he line. begins at an elevation of feet, and its
southern termina l at Los Angeles is 350 feet above the sea . A number of mounta in ranges would be crossed ,
but a large proportion of
the line would be over good ground , and it is believed that the highestelevation reached feet , at
C
Tehachapi ) will offer no seriousobstacles to a daily inspection of the pole line .
A reservoir on Salmon Creek , a tributary of Kern River,is planned
by the Kern River Company for the storage of acre-feet of

3 0 RECONNAISSANCE OF KERN RIVER , CAL IFORNIA. [No . ia
water . About acres can be made tributary to this intake , anc'
it is hoped that with this catchment basin and the precipitation fronan elevation of feet on this divide the reservoir will sup
plement the flow of Kern River to 400 second- feet during the particular season of any year when the normal flow is below that figureF ig . 8 is a cross section of the dam S ite on Salmon Creek . It is in z
F I G . 9.— Plan of reservoir site of Kern-Rand Electric Power Company . Area , acres; sto
age capacity , acre-feet ; height of dam, 65 feet above stream bed .
granite canyon ,with clean bed rock on bottom and sides. T he widt
at the bottom is 1 25 feet between walls; the top width at the 75 -fo
level would be 390 feet . A rock -fill dam is estimated to requirecubic yards of material and to costT he utilization of the h igher reaches of Kern River for powe
purposes will certa inly be accomplished in time , but for the presen
1 Reservo irs for Irrigation , Water Power , and Domestic Water Supply , by J . D . S chuy ler .

LMST ED J POWER POS SIBILIT IES . 3 1
nd With the disinclination of electrica l engineers to recommendhe transmission of power to d istances greater than 1 00 miles
,it is
oubtful Whether the market outside of Los Angeles will warranthe outlay ; and the latter city is so far away from the upper r iver as
FIG . 10.
— Plan of dam site of Kern-Rand Electric Power Company .
no preclude, for the present at least,supply ing it w ith power from
Jhat source .
T he Kern-Rand Electric Power Company, of Los Angeles, purposes30 construct a rock-fill dam on the South Fork of Kern River
,at
Menache Meadows, and an initial power stat ion near the upper end

RECONNAI S SAN CE OF KERN RIVER ,
’
CA
South ForkV alley , about miles
trable during at least the colder ha lf of the

om smm POWER POS S IBILIT IES . 33
Cap aci ty of Menache Meadows reservoir si te.
Height above base of dam. Capaci ty .
F eet.
Fig . 9 is a plan of the reservoir site of the Kern -Rand ElectricPower Company in Menache Meadows
,fig . 1 0 is a plan of the dam
site,and figs. 1 1
,1 2
,and 1 3 are details of the dam proposed . T he
material at the dam site is apparently hard. granite , overla in withearth
,sand , and gravel . T he dam site is at an elevation of feet
above the sea,and consequently snow and frost preva il there during
the winter months. There is no wagon road to the damsite,and the
cost of making one would add very materially to the cost of the dam.
T he drainage area tributary to this reservoir being all above an elevation of feet
,naturally has the greater part of its precipitation in
the form of snow . Thismakes the run -off an uncerta in quantity ,and
leaves the proper height for the dam a diffi cult question to decide .
Taking all of these considerations into account,the engineers of
the company were led to select a loose rock-fill dam faced with earthas the most economical and serviceable for the locality . On accountof the possible action of frost
,flatter slopes were given the rock faces
than are absolutely necessa ry to make the dam heavy enough to
resist the water pressure . SO far as, possible , the material found in
the immediate vicinity of the damwi ll be used in its construction,
and the outlet” ,ates, and connections have been designed so that all
of their parts can easily be transported on mules over a steep mountain tra il . T he crest of the dam was fixed at 65 feet above the nat
ural surface of the ground at the damsite . This height can ,however
,
be increased to 95 feet , if it is found that a larger I eservoir capacitycould be supplied , at a proportionate increase in cost . It is proposedto excavate all of the rock required in the construction of the dam on
the north S ide, forming a suitable wasteway in the solid rock,capable
of d ischarging a stream of water 1 00 feet wide and 9 feet deep at a
velocity of 6 feet per second— a volume of cubic feet per second .
As each foot rise of water over the bottom of the wasteway repre
sents about 5 ,000 acre-
,feet 9 feet I lse of water in the wasteway would
increase the volume in the reservoir to acre- feet . This,in
addit ion to the water running through the. wasteway and outlet,
would make more than acre—feet,which
,if it all came. in
twenty- four hours, would represent a run- off of about 55 inches. It
IRR 46— 01— 3

34 RECONNAI S SANCE OF KERN RIVER, CALIFORNIA. [No . 46 .
is believed that a wasteway'
of this size would make the dam abso
lutely safe against any possibility of the water ever flowing over the
top . T he capacity of the reservoir with a dam 65 feet b igh , '
as now
S CALE2 3 4 FT .
FIG . 1 2.
— Ver tical section of tower for_dam proposed by Kern -Rand Electric Power Com
pany , showing arrangement of gates.
proposed , would be acre - feet ; and if the damwere ra ised hereafter to a height of 85 feet the capacity of the reservoir would bnearly trebled .

36 RECONNAI SSANCE OF'
KERN RIVER , CALIFORNIA. [No . 46 .
Shutting off the water after it has fallen to an elevation of feet,
or 35 feet above the base of the dam. This would prevent the necessity of emptying the reservoir for the purpose of making repa irs tothe gates.
Following are the estimates for three S izes of the dam proposed
Estima te of cost of a 75 -foot damwi th slop es 1 to 1 and 4 to 1 .
Loose rock , 73 000 cubic yards; or cubic yards solid
at $1 . 50
Earth ,55 ,870 cubic yards at $0. 25
Extra labor on cubic yards laid by hand ,at $1
T unnel , 350 feet at $12 _
T ower , gates, and connectionsGuide walls
, etc . , at wasteway
Engineering and cont ingenc ies, 1 0 per cent
T ota l 130, 754 . 25
Estima te of cost of -foot damwi th slop es 1 7} to 1 and g to 1 .
Loose rock, cubic yards; or cubic yards solid
at
Earth,
cubic yards at $0. 25
Extra labor on‘
~
6 ,000 cubic yards laid by hand , at $1
T unnel , 350 feet at $12
T ower , gates, and connect ions
Guide walls, etc .,at wasteway
Engineering and conti ngencies, 1 0 per cent
T otal 1 49,674 . 25
Estimate of cost of 95 -foot damwi th slop es 1 to 1 and 4 to 1 .
Loose rock , cub ic yards; or cubic yards so lid at
Earth , 70, 000 cubic yards at
Extra labor on cub ic yards, at $1
T unnel , 350 feet at $12
T ower , gates, and connections, with bridge to tower
Guide wal ls etc at wasteway
Engineering and contingencies, 10 per cent
T otal
T h e foregomg estima tes are based 0 11 the Supposition that the rockwill be hard enough to stand vertically around the tower and tha t the.
tunnel will not need lining .
T he transmission line from the power plant in sec . 14,T . 25 S .
,R .

om smm 0 POWER POS S IBILIT IES . 37
35 E.,M . D . M . , to Randsburg, 43 miles d istant , would be over as fine
a country for a pole line as can well be found— easy slopes, virtua llyunimproved and without tree growth . W ith very few exceptions awagon could be driven
,without road work
,along the transmission
line f rom the power plant to Randsburg . T he highest elevationreached on the pole line would be at Wa lkers Pass
,feet above
sea level,and at that point the snow lasts only a few days and would
never interfere with the regular patrol of the line .
T he following is an approximate estimate of the cost of generatingand transmitting electric current from the South Fork power house ,for a delivery in Rands rg of 900 horsepower, with conduit and polel ine capacity for 450 add itional horsepower :
Estima te of cost of genera ting and transmi tting electric current from S outh Fork
p ower house to Randsburg.
Diversion in bed rock and 100 feet of rock channel
Regulating gate
Riveted-steel pipe ,feet of 30-inch , gage No . 12 , at
Pipe work in canyon ,feet
Flume , feet at $3
T unnel,
feet at $10
Canal in earth ,feet
, with concrete lining
Canal in rock,
feet at per foot run
S iphon , feet at $3
Penstock,
feet at $4 .
Water wheels
Power houses, two ,
fireproofWire for transmitting current , 900 horsepower , delivered 43
milesT elephone
L ine poles ( 43 miles, 40 to themile ) , and placing same
Electric machinery
Distribution of current at Randsburg
Contingenc ies, 1 5 per cent - b
T otal 1 95, 777
A landslidehas blocked the canyon and created a lake of about 40acres area on the North Fork of Kern River j ust below the mouth of
Whitney Creek and above the mouth of the L ittle Kern . This lake,
known as Kern Lake,the Ca lifornia S tate engineering department
,in
its investigationsof the Kern River dra inage basin ,has considered as a
possible reservoir site . At the lower end of the lake the cliffs toweralmost vertica lly above it to heights ranging from to feet
,
and estimates have been made for the blasting of large fragments intothe dam site , forming a loose rock-fill dam. T he capacity of the
reservoir at the 220- foot level would be acre- feet . T he S tate

38 RECONNAIS SANCE OF KERN RIVER , CALIFORNIA. [NO-46.
engineering department considered the possibility of paving the mass
of rock thus thrown down to a uniform surface and covering it withasphalt . T he width of the canyon at the site is only 1 00 feet at thebottom and 400 . feet at a height of 230 feet above the stream bed .
There would be no question about the ability of the dra inage basinto fill the reservoir annually , and if it is possible to construct such a
dam at this place the site probably would be of va lue for replenishing the late summer flow for power and irrigation .

RECONNAISSANCE OF Y UBA RIVERCALIFORNIA .
By MARSDEN MANSON.
WAT ER SHED .
Yuba River is a tributary ,of Feather River , which it entersat Marys
ville,30 miles above its mouth . It drains about square miles
of the western slope of the S ierra Nevada , comprising portions of
S ierra ,Nevada , Plumas, and Yuba counties. T he extreme length
of the watershed is about 60 miles, the extreme Width 36 miles. In
addition to the length“
given there are about 1 1 miles of channel inthe valley between the foothills and Feather River . In size Yuba
in the Sacramento Va lley . Its extreme low-water dis
360 cubic feet per second , 1 itsmean winter dischargefeet
,
per second,and its flood discharge cubic
second .
2 For the lower 1 0 miles of its course in the footriver is greatly clogged with debris from hydraulic-miningstimated at many million cubic yards) , and is between levees
0 year tomeet the overflow causedthe area between them. T he channel of the river inhas been filled with cobbles and gravel to a depth of
1 00 feet . (See Pl . IV ,B . ) From the foothills to themouth
er at Marysville the channel is over a surface of gravel ,clay ,
recently built up from the mines above . T he chan~
regular and change from winter to winter and sometimesr . It is therefore impracticable to establish low~
ons which would serve for more than one summer
natural discharge would be . T he large mining companies— thethe Nor th Bloomfield Gravel and Mining Company , the Milton
Company , the Eureka Lake and Yuba Canal Company , and others
during the winter and spring months for use during per iods of low(1 the early autumn.
estimated by Mr . Hubert V ischer , Asst . Engr . , U . S . Engrs., at
H . R . Doc . No . 431 , F ifty -sixth Congress, second session, p . 12.

40 RECONNAISSANCE OF YU BA RIVER , CALIFORNIA. INO. 46.
T he Changes in the bottom and in theposition of the channel are SO
great that the gagings at the flood stages of the river would be unsatisfactory ,
and if undertaken from boatswould be highly dangerous,if not impossible .
T he drainage basin is subd ivided into five small basins,namely ,
North Fork ,with a dra inage area of squaremiles ; Middle Fork ,
with a. dra inage area of 21 8 square miles ; South Fork , with a drainage area of 360 square miles ; Deer Creek , with a dra inage area of
squaremiles; and Dry Creek , with a drainage area of squaremiles. In addition to these an area of square miles dra ins intothe ma in Stream above the 1 00- foot contour . Dry Creek jo ins YubaRiver from the north just as it leaves the foothills. T he other streamsunite in the mounta ins. T he forks are perenn ia l in flow
,but the
French
0 A
I
{lot/6 027 City
[z]
Gaging S ta tions
Yuba River a t Par /rsBar2 M/dd/e [b f /r3 ”of f/1 far /r above”be f i n/er4 Nor/fr f or/r a )
‘fl own/éV/We
F I G . 14 .
— Map of Yuba River ,showing locat ion of gaging sta tions.
discharge of the two creeks mentioned (Deer and Dry ) becomes
insignificant in the late summer and early autumn .
As they merge into the valley the S ierra foothills have an elevat ionof about 1 00 feet above tide . T he watershed risesgently ,
in roundedand broken mounta ins
,to the crest of the S ierra ,
which at the headwaters of the Yuba is at a mean elevation of about feet
,with
peaks rising to a height of feet . From Mount L incoln— a peakCommon
.to the watersheds of Yuba
,American
,and Truckee rivers
to a point about mi les northeast of Mount Webber,the summit Of
the S ierra divides the watershed of YubaRiver from that of T rIICkeeRiver
,which d ischarges into Humboldt Basin . Farther north from
Mount Webber there i s a secondary crest which d ivides the watersheds of Yuba and Feather rivers
,the watershed of the latter stream
reaching farther east,to a less elevated d ivide in which the passes
are lower than those of the easterly crest .

u. s.GEOLOG ICA L S U RVEY WAT ER -S U P P LY PA PER NO. 4 6 PL. IV
HEAD OF SO U T H FORK OF YU BA RIVER AND LAKE S PAU LDING .
B . YU BA RIVER FOOT H ILLS .


4 2 RECONNAIS SANCE OF YU BA RIVER, ‘CALIFORNIA . INO. 46 .
20 miles to thewestward . This broad surface hasb een denuded byglacial action ,
and the harder nature of the granite has not permitteda deep soil to form. T he area is therefore less heavi ly timbered thanthe dra inage areas of the other two forks
,and its accessibility has
caused it to suffer more severely from the ax of the lumberm‘
an .
This topography gives a broader and more gently sloping surfacethan characterizes the headwaters of other S ierra Nevada streams.
T he surface is marked by nearly 100 glacia l lakelets and valleys,afford ing many excellent reservoir siteswhich have been or are beingutilized . This elevated watershed receives a mean annual precipitation of 60 inches
,most of which is in the form of snow . T heslow
melting of the snow ma inta ins the discharge of tributaries until Juneor Ju ly ,
which,with the natural and artificial reservoirs
,makes the
South Fork of the Yuba a highly valuable and reliable source of
water supply .
NAT U RAL S T ORAGE OF WAT ER IN Y U BA.R IVER BAS IN
Precipitation upon the dra inage basin of Yuba River 1 8 dependentupon
'
the southerly or winter extension of the north temperate rainbelt . DuIi ng the summer months the more northerly position of thisbelt leaves California in the comparatively rainless region betweenthe north temperate and equatorial rain belts. T he rains and snows
,
therefore,fall from October to Apri l , with little or no rainfall of
moment fromMay to September , so that during the lattermonths thestreams depend upon either natural or artificial storage . Naturalstorage is by snow and the slow run-off of water retained in afforestedand brush - covered soils. On the S outh Fork artificia l storage hasreached a very effective stage . T he precipitation ranges from 20
inches at Marysville, in the valley ,to 70 inches at the summit of the
S ierra .
1
Snow storage of water is depended on during the latter part of Apri land into July ,
the run-OE unti l June being superabundant for all purposes, but in July it begins to fall below the necessities of dependentindustries
,and it remainsbelow until the autumnal ra ins occur . Snow
storage has been made a subject of extended observation by Mr .
W . F . Englebright , chief engineer of the South Yuba Cana l Company ,
through whose courtesy the writer hasbeen enabled to p repare amost
instructive diagram of the accumulation,depth , and rate of melting of
snow at Lake Fordyce (fig . This lake has an elevation of
feet above tide level, ,and is in a region overwhich the annual precipita
tion in ra in andmelted snow is 70 inches. Snowb egins to accumulatelate in November
,and reaches itsmaximum depth in packed snow in
March . During the wintermonths the lower readings on the gage rod
following higher readings generally indicate a packing of the snow .
1 T hese figures are taken from a map prepared , under the writer’sdirection , for the California
Water and Forest Association , showing the drainage areas, the mean annual ra infall, and the
distribution of forests throughout the S tate .

U . S . GEOLOGICA L S U RVEY WAT ER - S U P P LY PA PER NO. 4 6 P L . V
4 . CANYON OF M IDDLE FORK OF YU BA RIVER.
B . M IDDLE FORK YU BA RIVER NEAR FREEMAN'
S C ROS S ING .


MANSON ] NAT URAL ST ORAGE . 43
Meltingbegins in March and continues quite regularly until the middle of June or early July . Short storms during April and May causeoffsets in the curve , which resumes a parallel line . A seriesof cold andheavy storms in April, 1 896 , caused the snow to last until July 5 , whilethe clear , warm Spring of 1 897 caused it to disappear on June 7 .
During the latter half of April , by means of daily reports by telephone, Mr . Englebright is enabled
,through diagrams upon a larger
scale, to approximate to within a few days the duration of the snow
supply and the beginning of the draft on the reservoirs. Data and
studies of this kind are very valuable, and suggest the importance of
stations above the snow line as a means of determining the volume of
Snow storage ava ilable at different seasons and the ratio between'
the
volumestored by snow and that stored by reservoirs. T he dischargeof the streams ismaintained by snow during the spring and for half of
FIG. 15 .— D iagram showing depth of snow at Lake Fordy ce .
the summer months, and the volume and rate of the discharge can be
foretold with reasonable accuracy by daily readings of gages properlylocated .
ART IF I C IAL S T ORAGE POS S I B IL I T IE S
T he natural facilities for the storage of stormwaters are particu
larly favorable in the upper third of the dra inage basin of the SouthFOrk . T he demands for large volumes of water under high pressureto operate the mines in the middle and lower portions of that
‘
drain
age _basin and those'
on Bear and American rivers were met by the
construction of large and expensive canals and storage reservoirs.
Just above the great bend north of the head of Bear River and at the
head of the steep canyon of the”
South Fork is a broad,flat
, glacia lvalley which has been converted into a lake by the construction of a
stone dam. This lake,known as Lake Spaulding a nd shown in PI.
IV,A
,has a capacity of cubic feet , and is the lower and
controlling reservoir of a series embracing the avai lable storage and

44 RECONNAIS SANCE OF YUBA RIVER, CALIFORNIA. [No . 46 .
supply above . This supply is derived from about 1 20 square miles,upon which the mean annual precipitation in rain and melted snowis about 5 feet . T he following is a list of the storage reservoirs
S torage reservoirs in Yuba River Basin.
Name of reservoir . Elevat ion . Area . Capacity f
MeadowS t irlingWh i te RockPeak Lakes ( three)FordyceLost RiverFallcreek Lakes (six)S pauld ingSummit LakeBear Valley
T otal
a Records lost . b cubic feet .
T he aggregate area of these reservoirs is squaremiles, and theyare filled to an average depth of feet
,thus giving storage
‘
for
about 1 2 per cent of the mean annual precipitation upon the tributary area
,the rema inder going to waste and to swell the floods which
devastate the valley . It is possible , by ra ising the dams and enlarg
ing the canals, to utilize a considerable additional portion of the pre
cipitation . T he conditions favorable to the conservation of water onthe upper third of the dra inage basin of the SouthFork are far greaterthan in the lower two- thirds of that basin or in the basin of the otherforks.
On the upper portion of Canyon Creek , a tributary of the SouthFork
,the Eureka Lake and Yuba Canal Company and the North
Bloomfield Gravel and Mining Company have the following storage
reservoirs:S torage reservoirs on upp er p ortion of Canyon Creek.
Name of reser
voir .
Area . Height . Capacity . Cost .
$151 , 521
0
T he dra inage area tributary to these reservoirs is squaremiles, and it receives a total precipitation during an average year of

U . S . GEOLOG ICA L S U RVEY WAT ER - S U P P LY PA PER NO . 4 6 P L . VI
A. ENGL IS H RES ERVO IR ON M IDDLE FORK O F YU BA RIVER.
B . S MALL DAM O F ENGL IS H RES ERVO IR.


4 6 RECONNAIS SANCE OF YUBA RIVER, CALIFORNIA. [No . 46.
Assuming that art ificial storage on the North Fork and the MiddleFork could be developed to a capacity equal to that above the LakeSpauldingdam,
there would t hen be in Servicean area of squaremiles with water at an average depth of feet
,or
cubic feet . T he mean annual precipitation in the dra inage basin of
Yuba River is cubic feet . T he total ultimate artifi
cial'
storage is less than per cent of this precipitation ,and could
hardly be recognized in a gaging Of the total run -off. Moreover,in
the storage of water for industria l purposes the uncertainty of the
character of the seasonal ra infall makes it prudent and desirable topermit the reservoirs to fill during the earlier ra ins, and not leave thehusbanding of a supply to possible succeeding ra ins. Hence it generally happens that when the heavy storms of the late winter and
Springmonths occur the reservoirs are full and the flood wave passesdown without being d iminished by the reservoirs. This is also trueto a limited extent of regions above the snow line, where the unmeltedSnow constitutes a reservoir of far greater capac ity than ordinarily isobta ined by building dams.
“It happens that when late warm ra ins or
rapid melting of the snows occurs the reservoirs are a lready full , andconsequently do not diminish the flood volume .
It would appear , therefore, that however useful artificia l reservoirsare for domestic and industrial purposes they can not be relied upon,
except under unusual conditions, to decrease the heights of late winter and spring floods
,and We must look elsewhere for a solution of
that problem.
COMPARISON OF LOW -WAT ER DIS CHARGE FROM A T IMBERED AREA
W ITH T HAT FROM A COMPARAT IVELY“TREELES S AREA.
On‘
the south fork of the North Fork is a watershed area of 1 39
square miles, which was gaged on September 1 9, 1 900, after three suc
cessive seasons of deficient rainfall,and gave a minimum run-off of
1 1 3 second - feet,or second - foot per square mile. This area is
well covered with timber and brush , and in 1 20. days it gives a minimum run-off of cubic feet .T he dra inage basin of the North Fork ismore heavily timbered than
the basins of the other forks,and consequently it has a deeper soil
,
and,although only one- tenth of the total dra inage area , it furnishes
75 per cent of the low-water flow of the entire dra inage basin aboveParks Bar .
On the south fork above Lake Spauld ing there is a watershed of
1 20 square miles, which has heretofore been described as comparatively barren of timber
,the t imbered areaswhich once existed having
been denuded . (See Pl . VIII , A. ) T he run-off of this area is practically nothing for 1 20 days of the year, due to the absence of forestsand

U . S .GEOLOG ICA L S U RVEY WAT ER - S U P P LY PA PER NO. 4 6 PL . VII
A. BROWNS VALLEY IRRIGAT ION DIS T RICT DAM FROM ABOVE.
B . BROWNS VALLEY IRRIGAT ION DIS T RIC T DAM FROM BELOW


.NSON. ] DISCHARGE MEASUREMENT S. 4 7
ush . If this area were afforested and gave a minimum run - off of
8second- foot per squaremile“,the d ischarge would be 1 00 second - feet
,
uivalent to an effective storage capacity of cubic feet .
I is minimum low-water discharge of 1 00 second - feet for 1 20 days
equivalent to more than half the storage capacity of all the reser
Iirs above Lake Spaulding dam,which aggregate 5
,000
,000 cubic
et .
’
As the basis of this estimate is extreme low-water discharge,may be assumed that by affore‘
sting . the watershed this costly and
.tensive system of reservoirs could safely be drawn upon for doubleeir present capacity . As what is true of portions of the watershedtrue of the watershed as a whole, aggregating as it does
Ouare miles, the value of afforesting the area becomes apparent .
It appears to the writer that the solution of the problem of storage
flood waters is not the retention of a small percentage of the stormtters behind dams
,but the application of storage over the entire
ttershed by the systematic protection and extension of forest-covad and brush- covered areas.
[S CHARGE MEAS U REMEN T S OF Y U BA R IV ER AN D I T S
T R IB U T ARIE S .
The accompany ing tables of low-water d ischarge measurements of
Iba River and its forks are based upon observations and gagings
8 5 0 2 5 7 . 5 0 0 15 0 0 2 5 0 0 3 0 0 0
FIG . 16.— Curve show ing relation of gage height to d ischarge of Yuba River.
MIG by Mr . H. D . H . Connick,under the d irection of the writer,
iring the months of June,July ,
August , September , and October,00. T he precipitat ion ,
during the wet season preced ing these gaggswas about two-thirds to three- fourths of the mean annua l ra in

RECONNAIS SANCE OF YU BA RIVER, CALIFORN IA.
fall . T he precipitation during the two preceding. wet seasons was
still further below the'
normal .
T he location of the gaging stations is Shown on the map ,fig. 1 4
,
page 40. T he gagingswere made with a large Price meter furnishedby the United S tates Geological Survey . T he usual method was pursued
,namely ,
the cross section wasdiv ided into subsections of 5 feeteach
,and the velocitieswere observed for three minutes for each foot
of d epth . T he integra l of the discharges thusascertained divided bythe tota l cross sectional area determined the mean velocity . T he
volumes thus determined for various stages were platted as a curveof
i
'
discharge , using gage heights and discharges as ordinates, fromwhich curve intermediate discharges were estimated to fill " out thetables. For d ischarge curves, see figs. 1 6,1 7 , and 1 8 .
Da i ly discharge of Yuba River a t Pa rks Ba r B r idge dur ing the month of July ,
1 900.
Gage heigh t .
Area of Mean ve
section . locity .
Discharge .
6 a .m. 6 p .m.
Squa re Feet p er S econd
feet. second .
T otal

U . S . GEOLOG ICA L S U RVEY WAT ER - S U P P LY PA PER NO. 4 6 PL. VIII
A. S ECOND-GROWT H FORES T DES T ROYED BY FIRE.
B . HEAD OF S OU T H YU BA CANAL COMPANY’
S DIT CH.


50 RECONNAISSANCE CE YUBA RIVER, CALIFORNIA. [NO . 4G.
Da i ly d ischa rge of Yuba River a t Parks Ba r .B ridge during themonth of October1 900 .
Discharge .
6 a . m. 6 p . m.
NOT E — On the evening of October 4 gage No . 1 was washed out . All subsequent read ing
1werg1 made on gage No . 2. Equation : Gage No . 2+2. 2=gage No . 1 . T hus: gage
eig t .
Da i ly discharge of NorthFork of Yuba River a t Yuba Power Comp any’sdamdur inc
themonth of July ,1 900 .
Gage heigh t .
Area of Mean ve
section . locity .
D i scharge .
6 a . m. 6 p . m.
S q. f t. F t.p er sec.
196 . 4
o
T otal

MAN SON ] DI S CHARGE MEASUREMENT S . 5 1
Da i ly discharge of Nor th Fork of Yuba River a t Yuba Power Comp any’s dam
during themonth of August, 1 900 .
Gage height .
Discharge .
6 a .m. 6 p . 1 11 .
S q. f t . F t .p er sec .
- n
o
- n n u —d - u - n
- d
_ Q
T otal
Da i ly discharge of North Fork of Yuba River a t Yuba Power Comp any’s dam
during the month of S ep tember ,1 900.
Gage height .
Discharge .
6 a . In. 6 p . m.
710, 830, 800

52 RECONNAISSANCE OF YU BA RIVER, CALIFORNIA. [No . 46 .
9 5 6 7 7 7 . 5 0 0 10 0 0 S EC : $ T. 5 0 0
FIG . 17.—Curve showing relation of gage FIG . 18.
— Curve showing relation of
heigh t to discharge of North Fork o f gage height to d ischarge of Middle
Yuba River . Fork of Yuba River .
Da i ly discha rge of North Fork of Yuba River a t Yuba Power Comp any’s dam
during the month of October , 1 900 .
G age he ight .
Discharge .
6 a . m. 6 p . m.

MANSON J DI SCHARGE MEASUREMENT S . 53
Da i ly discha rge of Middle Fork Of Yuba River a t Freeman 3,br idge during the
month of July ,1 900.
Gage helgh t .
Area of Mean ve
sect ion . locity .
Dl schargeDay .
6 a . In .
Feet. Feet .
T otal
Da i ly discharge of M iddle Fork Of Yuba River a t Freeman’s bridge during the
month of August, 1 900 .
Gage he1ght .,
Area of Mean ve
section. locity ,
D ischarge .
6 a .m.
S q.f t. F t.p er sec.
- n - O
- Q
T otal 192, 530, 304

54 RECONNAIS SANCE OF YUBA RIVER , CALIFORN IA. {No . 46 .
Da i ly discha rge of. Middle Fork of Yuba River a t Freeman’s bridge during themonth of S ep tember , 1 900.
Gage height .
Area of Mean ve
sect ion . locity .
D 1scharge .
6 a . 1n . 6 p . 113 .
S q. f t. Ft . per sec.
- J
- o - Q
- IZ IIIZ IIZIZ Z
- Q
- fi - O
Discha rge of Middle Fork of Yuba River a t Freeman’s bridge during themonth of
October , 1 900.
D ischarge .
6 a . m. 6 p . m.

INDEX .
Altitudes. S ee Elevations.
Ant Creek , discharge measurement of
Bald Mounta in , creek south of , discharge
measuremen t of
Barton , S . , rainfall recordskept byBasin Creek , dischargemeasurement Of
Browns Valley Irriga tion District , damof , views of
reservoir and power plant ofBrush Creek , dischargemeasurement of
drainage area Of
Bull Run Creek , discharge measurement
of 23
dra inage area of 13
California , southern , development Of —13
Cany on Creek storage reservoirs along 44—4 5
Clark Creek , discharge measurement of 23
drainage area of 13
Coal and oil industries, development of ,
in southern California
Connick ,H . D . H ., work of
Corral Creek , dischargemeasurement Of
drainage area Of
Cost , electr ic power , generating and
transmitting 27—28 , 37
irrigation by pump ingpower plants proposed 28
reservoir proposed on S almon Creek 30
storage reservoirs in Kern River
Basin _
storage reservoirs in Yuba River
Basin
Dam si tes, Kern River , figures Show
ing
Yuba River ,figures show ingDaunt , elevation Of 24
precipitation at 23Deer Creek drainage area of 40
Discharge and gage height , curves Show
ing relation between on Yuba
RiverDischarge and temperature Observations
(synchronous) , d iagram showing ,
on Kern Riverfeatures ofDischargemeasurements KernRiver and
tributaries
Yuba River and tributar ies .
Drainage basins, Kern River, areas ofYuba River , areasof
Dry Creek , drainage area Of
Efficiency of pumping plants, discussionof 28—29
Electric power , advantages of
cost of generating and transmit tingpr ices pa id for
Electric-power plants, cost of OperatingKern River Company ’s proposed
o
- . o
l
u n p
0 c
23
drainage area of 13
James, Mr . , cited 18
Kern Lake , water storage proposed in 37—38Kern Land Company , pumping plants of 28—29
55
Page.
9—10, 28
37
27
25—28,
29—37
Elevat ions, Kern River Basin 13 24 25 29, 30, 37
Yuba River Basin 42
Englebr ight ,W . F . , acknowledgmentsto 42
investigations by , regarding snow
storage
English reservoir site , features of
v iews of
Erosion in Yuba River Basin extent of
Evaporation , Kern River _ _
First Point of Measurement , discharge
and temperature Observat ions
(synchronous) at diagram show
ing
d ischarge measurements at
volume of Kern River at
Fish Creek , dra inage area of
Forest , second -
growth , destroyed by fire
V iew showing
Forest cover , extent and character of , in
Yuba River Basin 41—42
va lue of , to streamfl ow 9—10, 41 , 46—47
Gage height and discharge , curves show
ing relation between , on Yuba
River
Gaging stations, Kern River map show
ing location of
Yuba River ,map Showing location Of
HarrisCreek , d ischargemeasurement of
drainage area of
Hawgood , H ., c ited
water wheel and power plant de
signed by
Hicks, L . A. , quoted , on pumping plantsdesigned by
well -construction methods Of
Hooper ’s mill ditch , discharge measure
ment of
Irrigation ,cost of , by pumping
methods proposedneed of
Isabella , volume of Kern River atJackson Creek , discharge measurement

5 6 INDEX .
Kern-Rand Electr ic Power Company ,
dam proposed by , figures Show
ing 32
dam site of , plan of 31
reservoir proposed by 31—37
reservoir si te of, plan Of 30
Kern River ,discharge and temperature
observa tions (synchronous) on ,
d iagram showing
d ischarge measurements of
discharge measurements of , map .
showing pointsOfd rainage area of
drainage basins of , areas of
drainage basins of upper , map Show
evaporation of
fall or S lope of
flood per iod of
gaging stations on.map showing loca
tion of
horsepower available along
irrigation along
length of
maps ofphysica l features ofpower possibilities of
run -OE in basin of
seepage a long
V iew of , near Kernvillevolume of
KernRiver , NorthFork . S eeNorth Forkof Kern River .
Kern River , S outh Fork . S ee S outh For k
of Kern River .
Kern River Basin , e levations in 13,
24 25 29 30, 37
mountain valley in ,view of 15
precipita tion in 1 6—17 , 23—25 , 32
run-off in 13 , 17 18—21Kern River Company , power proj ectsof 25-28,
29- 37
reservoir site of , plan of 26
Kernville , elevat ion of 24
precipitation at 23
Lake Fordy ce , elevation of . 42
snow storage at 42—43
snow storage at diagram Showing
depth of
Lake Spaulding , V iew showing
wa ter storage in
L it tle Kern River discharge measure
ment of
drainage area of
Los Angeles, coal and oil industries at
development of
electric power a t , pricespaid forMarysville , p rec ipitation at
Menache Creek , drainage area of
Menache Meadows, reservoir proposedMiddle Fork ofYuba River , discharge and
gage height of , Curve show ing re
lation between
discharge measurementsof
n o .
- 1
- q
—0
—. o
Run-off ,Kern River BasinNorth Fork of Yuba RiverS outh Fork of Yuba River
13,17 , l .
M iddle Fork of Yuba R iver Continued .
drainage area of
physical features ofreservoir site on
Views on _
Mount Breckenridge , elevation of
precipita tion at
Mountain Home sawmill rainfall recordskept byNeedlesCreek , drainage area of
Neils d itch , discharge measurement of
Newell , F . H . letter Of transmitta lN inemile Creek , drainage area of
North Fork of Brush Creek discharge
measurement of
Nor th Fork of Kern River , d ischarge
measuremen ts of
drainage basins of , areas of
gaging station on , View of
precipitat ion a long
run-Off in basin of
volume of
North Fork of Yuba River discharge andgage height Of , curve showing re
lat ion between
d ischarge measurementsOf
drain'
age area of
physical features ofreservoir sites on
run-off in basin of
North NeedlesCreek dischargemeasure
ment-Of
Oil and coal industr ies, development of
in southern Californ ia
Onemile Creek , discharge measurement
Otterman , G . , rainfall recordskept byPhysical features,Kern River
Yuba River
Power possibilit ies Kern RiverYuba River
Power transmission , cost of 27—2E
d istances recommended by engineers
for , limi t ofPowersditch , dischargemeasurement of
Precipitat ion ,Kern River Basin 16 —25
Yuba River Basin 44
Pumping plants, features and effi ciency
Rainfall . S ee Precipi tation .
Reservoir sites,Kern River , views of
YubaRiver , v iews of
Reservoirs,Kern River Basin , cost , capacReservoirs and reservoir sites, Yuba
River Basin , cost , capacity , et c . of 4:
Reservoirs proposed ,Kern L ake 3'
Kern-Rand Elec tric Power Company(MenacheMeadows)KernRiver Company
S almon CreekRio Bravo ranch , volume of Kern River


DEPART MENT OF T HE INT ER IOR
WATER-SUPPLY
AND
OF T HE
UNITED STATES GEOLOGICAL
N o .
OPERAT IONS AT RIVER STAT IONS,1900.
—4l I
WASHINGTONGOVERNMENT PRINT ING OFFICE
1 9 0 1

IRRIGAT ION REP ORT S
T he following list contains titlesand brief descriptionsof the principal reportsrelating towater supply and irrigation prepared by
“the U nited S tates
“
Geological
Survey S ince 1890:1 8 9 0 .
FirstAnnual ReportOf the U nited S tates Irrigation Survey, 1890 ; octavo , . 123 pp.
Printed asPart II , Irrigation , of the T enth Annual Report of the U nited S tates Geological Survey , 1888—89.
‘
Contains a statement of the orig in of the Irrigation S ur vey , a preliminary report on the or g aniza tion and prosecution Of the survey of the. arid lands forpurposes of irrigat ion, and-report ofw ork done during 1890.
1 8 9 1 .
SecondAnnual Report of theU nited S tatesIrrigation Survey , octavo , 395 pp.
Published as Part II , Irrigation , Of the -Eleventh Annual Report of the U nited S tatesGeological Survey , 1889—90. Contains a description of the hydrography of the arid regionand of the engineering
Opera tions carried on by the Irrigat ion Survey dur ing 1890 ; alsothe statement of the irector of the Survey to the House Committee on Irr igation, and
2t
fl1
1er papers, including a bibliography of i rrigation li terature. Illustrated by 29platesandgures.
T hird'
Annual Report of theU nited S tatesIrrigation Survey ,1891 ; octavo ,
576 pp.
Printed asPart II of the T welfth Annual Report of the U nited S tatesGeological Sur "
vey , 1890—91 . Contains Report upon the locat ion and survey of reservoir sites during thefiscal y ear ended June 30, by A. H . T hompson ;“Hydrography '
of the arid regions,”
T3013
. H .Newell ; Irrigation in India ,” by HerbertM .Wilson. Illustrated by 93 plates and
gures.
Bulletins of the Eleventh Census of the U nited S tates upon irrigation, preparedby F . H . Newell ; quarto.
NO. 35 , Irrigation in Arizona ; NO 60,Irrigation in New Mexico ; No . 85 ,
Irrigation in U tah ; No . 107 , Irrigati on in Wyoming ; No. 1 53 , Irrigation in 4
Montana ; NO . 1 57 , Irrigation in Idaho ; NO . 1 63 , Irrigation in . Nevada ; NO.
178 , Irrigation in Oregon ; No . 193 , Artesian wells for irrigation ; No. 198,Irrigation in Washington.
1 8 9 2 .
Irrigation of western U nited S tates, by F . H . Newell ; extra census bulletin NO.
23, September 9 , 1 892 ; quarto , 22 pp.
Contains tabulations showing the total number , average size , etc . , of irrigated holdings.the total area and average S ize of irrigated farms in the subhumid regions, the percen tageOf number of farms irrigated , character of crops, value of irr igated lands, the avera
ge cost
of i rr igat ion , the investment and profits, toge ther with a resumeOf the water supp y anda descript ion of irrigat ion by artesian wells. Illustrated by colored maps showmg thelocation and relative extent of the irrigated areas.
1 8 9 3 .
T hirteenth Annual Report of the United S tatesGeological Survey , PartIII
,Irrigation ,
1893 ; octavo ,486 pp .
Consists of three papers: “Water supply for irrigat ion ,
” by F. H. Newell ;“American
irriga tion engineering”and“Engineering results of the Irrigation Survey ,
” by HerbertM . Wilson ; “Construction of tOpogra hic maps and selection and survey of reservoir -1
sites,
” by A. H . T hompson. Illustrate by 77 plates and 119 figures.
A geological reconnoissance in central Washington , by Israel Cook Russell , 1893octavo ,
108 pp . ,1 5 plates. Bulletin No. 108 of the U ni ted S tates Geological
Survey ; price , 1 5 cents.
Conta ins a description of the examination of the geologic structure in and adjacent tothe drainage basin of Yakima River and the grea t plains of the Columbia to the east of
'
this area , with special reference to the occurrence of artesian waters.
1 8 9 4 .
Report on agriculture by irrigation in the western part of the U nited S tatesat theEleventh Census, 1 890, by F . H . Newell , 1894 ; quarto , 283 pp.
ConsistsOf a general description of the condition Of irrigation in the U nited S t ates. the
area irrigated , cost of .works, their value and profits; also describes the water supply , the
value of water , of artesian wells, reservoirs, and other details; then takes up eaCh S tateand T erritory in order . giving a general description of the condition of agriculture by irri
gation, and discusses the physical cond itions and local peculiarities in each county .
Fourteenth Annual Report of theU nited S tatesGeological Survey ,1 892—93 , in two
"parts; Part II , Accompanying papers, 1894 ; octavo ,
_597 pp.
Contains papers on“Potablewaters of the eastern U ni ted S tates,” by W J McGee;
Natural mineral waters Of the U nited S tates,” by A . C . Peale ; and
“Results of streammeasurements,” by F . H . Newell. Illustrated by .mapsand d iagrams.
(Continued on third page of cover.)IRR 47

DEPARTMEN T OF T HE INTER I OR
WATER-SUPPLY
AND
OF T HE
UNITED STATES GEOLOGICAL SURVEY
N o .
WASHINGTONGOVERNMENT PRINT ING OFFICE
1 9 0 1


UNITED STATES GEOLOGICAL SURVEY
CHARLES D. WALCOT T , DIRECT OR
OPERATIONS AT RIVER STATIONS,1900
AREPORT OF THE
DIVISION OFHYDROGRAPHY
OF T HE
U NIT ED ST AT ES GEOLOGICAL SU RVEY
P A R T I
WASHINGTONGOVERNMENT PRINT ING OFFICE
1 9 0 1


LET TER OF TRANSMIT TAL .
DEPARTMENT OF THE INT ERIOR ,
UNITED STATES GEOLOGICAL SURVEY,
DIVIS ION OF HYDROGRAPHY,
Washington , D . G.,March I
,1 901 .
SIR : I have the honor to transmit herewith a manuscript giving theresults of operations at various river stations in 1 900
,and request
that it be published in the series of Water-Supply and IrrigationPapers. In order to comply with the law limiting these papers to100 pages, it is necessary to divide the material . This has been donen a general geographic basi s, following the precedent of Water
Supply Papers NOS . 35 to 39,relating to S imilar operations for the
year 1 899 . In the first paper are introductory remarks and the datarelating to New England and Eastern streams. T he succeedingpapers take up in order the rivers flowing into the Atlantic Ocean ,
then those tributary to the Ohio and Mississippi rivers,the Great
Lakes,Missouri River and the Rio Grande, the interior basin ,
and
finally those flowing into the Pacific Ocean ,from north to south
,end
ing with the data relating to the streams of southern California .
T he general conclusions drawn from the operations at the riverstations
,together with
'
d iagrams, maps, and illustrations, are beingprepared for publication in Part IV of the Twenty -second AnnualReport , this being designed to be in form and substance S imilar toprecedingvolumesknown as Part IV of the Eighteenth to the Twentyfirst Annual Reports.
Very respectfully ,
F . H . NEWELL,
Hydrographer in Charge.
Hon . CHARLES D . WALCOT T,
Director United S tates Geologica l Survey .


1 0 OPERAT IONS AT RIVER STAT IONS,1900 .
— PART I . [No . 47.
Virginia andWest Virginia : Prof . D. C . Humphreys,Washington and LeeUni
versity Lexington, Virginia.
Washington : Sydney Arnold , civil engineer , North Yakima ; Wi lliamJ . Ware,
civil engineer , Port Angeles.
Wyoming : A. J . Parshall , civil engineer , Cheyenne.
In a number of instances related data have been inserted,Such as
results of computation of daily flow at milldams made by localengineers and data of river heights obtained from the United StatesWeather Bureau or the Corps of Engineers
,United States Army .
Reference to these facts, mainly unpublished , has been or will bemade in other publications of this Survey ,
and they are thereforeplaced in consecutive order for conven ience of reference .
T he methods of measuring the discharge Of various streams and of
preparing the computations have been described on pages 1 8 to 30 ofthe N ineteenth Annual Report , Part IV , and on pages 20 to 22 of the
Twentieth Annua l Report , Part IV .
MET HOD OF U S ING S T REAM GAGING S FOR T HE COM PU T AT ION
OF W AT ER POW ER.
l
One of the objects of the gagings which are made .by the UnitedS tates Geological Survey is to assist engineers in the estimation of
available power on the larger streams of the United S tates. In an
article by John W . Hays in the Manufacturers Record of January1 0
,1 901
,there is given a description of the use which he hasmade 0
the daily recordspublished by theMr . Hays are of such general inteSpeaking generally ,
to determinit is necessary to know the fall and the flow
determined by an engineer , but the flow of
still very uncertain . U sually ,
'
an engineer,
able data of the stream being studied and
streams, mustand minimumOften the onlystream has be
extreme low water a variation in levelthequantity Ofwater passing asmuch amisleading may be a S ingle gage or
reinforced by the assurance of casuallow as it ever gets.
”Yet it is upon such dat
prospective power have been made, millsinstalled
,only to have the first dry season sh
estimateswere greatly in error . Then has fodam for storage , which has rarely met
1 Report of H. A. Pressey .

METHOD OF U S ING S TREAM GAGINGS . 1 1
shut-downs, the inevitablesteam auxiliary Comes, and with it regret ,on the part of the owners, that hydraulic developmentwas attempted .
T he method described by Mr . Hays in the article referred to has
been used in computationsmade from t ime to time of the ava ilablepower of the Potomac and other streams
,and found to be reliable and
convenient . Mr. Hays i llustrates the method by quoting the recordof Deep River , in North Carolina
,aspublished by the Geological Sur
vey . T he various stages Of that river for 1 899,as read on the gage
Jf the Survey ,are given in the following table
Da i ly gage height, in feet, of Deep River a t Moncure,North Carolina , for 1899.
Feb . Mar . Apr . May . June . July . Aug . S ept . Oct .
AS will be seen from an inspection of the foregoing table , the rec
)rds kept by the Geological Survey Show the stage of water Of eachItreammeasured on each day of the year , and the rating table , whichS computed from numerous measurements
,shows the quantity of
vater passing at each reading of the gage . These data maymost conzeniently be applied by ’
develOping a table as followsIn the first column arrange in order all graduations of the gage rod
Tom the lowest to the highest . In the,
succeeding columnswrite oppo;ite each gage height the following (a ) T he number of days during.he year on which the gage read that particular height ; (b) the equivtlent volume in second-feet ; (c) the effective head ; (d) the equivalentgross horsepower ; (e) the number of days during the year on which) ower would have been lessened by low water and by high water ,respectively . By way of illustration : T he gage read feet on 1 7
lays, equivalent to a volume of 380 second - feet,
"
an effective head of
I6 .4 feet , and a gross horsepower of which would be - lessened

1 2 O PERAT IONS AT RIVER S TAT IONS , 1900.
— PART I .
‘
INo . 47.
on 1 21 days by deficient water and on 227 days by high water in the
ta ilrace . If the gage read ings at Moncure station fromthe records of
the year 1 899 be thus assembled and the variation of the effectivehead be noted ,
there results the following table :
T able showing method of determining the da i ly avai lable horsep ower of a streamfromrecords kept by the Uni ted S ta tesGeologica l Survey, using the gage heightsof Deep River a t Moncure, North Carolina , for the year 1 899 as a basis.
Rat io of diminution tototal annual power.
T otal . T otal.
An inspection of the foregoing table will Show to what extent anypower plant which might have been installed at this place woulc
’
have been affected by variations in the flow of the river during thtyear 1 899, the number of days on which the power would have beeidiminished by high and low water , respectively ,
and the exact amoun'
of Such diminution . For instance,the power would have variet
from horsepower gross at extreme low water to horsepower gross at extreme high water. There would have been but our
‘
day on which h orsepower gross could not have been realizedaboiI t two hundred days 0 11 which horsepower gross could no
have been realized,and two hundred and fifty days on which

1 4 OPERAT IONS AT RIVER STAT IONS , 1900.— PART I . [NO- 47 .
Summarizing, _the tota l horsepower days 365 ) are
the total steam horsepower days are or nearly 25 per cent ,and steam power would have been required on 1 77 days of the year
1 899 .
For conciseness, the factors of wheel efficiency and partial gate are
not considered in this estimate . A fair rating of the power of DeepRiver at this place would be horsepower continuous, orhorsepower for day flow only ,
on a basis of thirty days’ deficiencybyreason of the dry season and thirty days’deficiency when the headwould be decreased 1 0 per cent or more by flood water in the tai lrace .
In the article referred to Mr . Hays also shows, basing his computations upon the Geological Survey records
,thatWhile in ordinary sea
sons,from the run-Off Of a dra inage area of 1 2 square miles on Broad
River we may expect 1 horsepower per foot of fall of the stream,it
will require the run-off from a drainage area of 60 square milesto furnish 1 horsepower per foot Of fall on Neuse River , 45 square miles on
Cape Fear , T ar, Deep ,and Haw rivers
,30 square miles on Roanoke
River,20 square miles on Yadkin River
,1 5 square miles on lower
Catawba River, and 1 2 square miles on upper Catawba and FrenchBroad rivers.
As the number of stations on any one stream is necessarily limited ,it becomes desirable to apply the data obtained at one point to otherpoints on the same stream. This may be done by determining therelative dra inage areas. It Should be noted
,however, that the effi
ciency of a stream increases as the headwaters are approached . Dur
ing the dry season of 1 897 Yadkin River had nearly 331, per cen
greater efficiency at Salisbury than at Norwood , and thenearly 20 per cent greater effi ciency at the CatawbaHickory ,
North Carolina,than it had at Rockhill
,South Carolina
Neuse River has the lowest efficiency of any stream in North Carolina
,its drainage area ly ing wholly in the eastern section of the State
where the geological formation is not conducive to perennial springsand during the dry season of 1 897 the run-off for that river at SelmaNorth Carolina
,was only 1 5 per c
ney ,South Carolina
,for the same dra inage area .
Of the latter stream lies wholly in the mountains;stream lies in the lowlands. In the year 1 897 the
the Neuse was 105 times itsminimum flow,while t
of the Broad was only 24 times itsminimumflow.
are excellent illustrations of the effect of physicaleffi ciency of flow
,and the physical conditions are
such as to give greater efficiency as the headwatersA knowledge of the greatest flood volume of a str
tial in the construction of hydraulthat the fa ilure of dams may in n
lackto w

MEASUREMENT OF SEDIMENT . 1 5
nstance : T he maximum flood of the Roanoke in 1 897 (gage heightof 28 feet at Neal , North Carolina ) was about 7 second- feet per squareai le . In the same year T ar River gave a flood discharge of 6 secondect, Neuse River a flood discharge of 7 second- feet , Cape Fear Riversecond - feet
,Yadkin River '
1 0 second-feet , and Broad River 1 3
econd -feet,while the Catawba developed a flood of 26 second- feet
o the Square mile. T he greatest flood ever recorded on the Cape‘
ear at Fayetteville , North Carolina,was a gage height of 58 feet
bove low water and a discharge of only 1 3 second -feet per squarefi le
,or half that Of the Catawba in 1 897 .
MEAS U REMENT OF S ED IM EN T .
1
T he followingmethod has been employed formeasuring the amountf sediment held in suspension by streams in Arizona : By means of
small bottle attached to a hollow rod,sampleswere taken fromvari
us parts of the stream and collected in a bucket . After thoroughfixing, the water in the bucket represented as nearly as possible theverage condition of the water flowing in the stream. A measureduantity Of this water
,usually 1 00 cub ic centimeters, was placed in
tubular graduate Of glass divided into cubic centimeters. Ordiarily thiswas allowed twenty - four hours to settle
,but if longer time
asrequired for thorough settlement , itwasa llowed . T he clear liquid'
as then decanted and rejected,leaving a small quantity of water
'ith the sediment in the bottom. If the amount of sediment wasi considerable , another sample was added
,taken on the day following
1 at on which the first sample was procured , and after settlement ita s decanted in like manner
,the process being repeated from day to
ay until a suffi cient quantity of sediment had accumulated to makereading on the scale Of the glass graduate . Under ordinary condi
.Ons,when the streamwas not in flood
,it sometimes required thirty
ays to accumulate samples which would Show 2 or 3 cubic centime3rS of sediment
,but at times of flood a largequantity of sediment was
Jmetimes obtained from a S ingle sample of 1 00 cubic centimeters,in
'hich case the quantity of sediment was ascertained by reading ,and
new determination was started on the following day . T he totaluantity of sediment Obta ined from the samples or series of samplesa s divided by the quanti ty of water used in the accumulation
,and
ratio was thus established which was applied to the tota l volumeowing in the river .
It was found that the ’mud Obta ined from these samples was of a
ery thin consistency and contracted greatly upon being dried . T o
etermine the amount of this contraction for Gila River water a numer of laboratory testsWere made . T he residue was dried at 1 00
°
C .,
nd the dried materia l was weighed , its Specific gravity also beingetermined . Asmight be expected , the results of these testswere by
1 Repor t of A. P . Davis.

1 6 OPERAT IONS AT RIVER S TAT IONS , 1900.
— PART 1 . [No . 4
no means uniform,but the mean of the .tests made indicated abou
one part of dry matter to five parts Of mud ,which factor has bee
used in reducing Observat ions Of this kind . In other words,it i
assumed that after complete settlement the mud in the bottom of th
water sample consists of one part of Solid matter and“four parts
water .
T he foregoing method requires very l ittle Skill and time , and thapparatus used is extremely S imple . T he error of the determinatiorliesmainly in the assumption Of the factor used in reducing the muto solid matter
,and it is probably considerable .
Another method which is now undergoing test is.
as follows : Sanples of water are obta ined in the manner already described , andmeasured quantity is poured upon an ordinary filter paper in a fu1
nel and is filtered as in the chemical laboratory . If the residueinconsiderable the process is repeated until a measurable quantity (
sediment is obta ined , which is dried and afterwards is weighed . T I.
reduction ismade in the same way as in the first method,that is
,th
quant ity Of water used is to the sediment Obtained as the quantitof water flowing in the stream is to the quantity of silt carried isuspension .
Thismethod,to be used with any considerable degree of accurac‘
requires the use of a pair of delicate sca les. T he error of the dete
mination consists partly in the -errors Of Observations, which would Igreater than by the first method , unless great Skill is employed in tfiltering and weighing of the sediment
,but chiefly in determining
assuming the specific gravity of the silt Obta ined , as it is volume a
not weight that ord inarilv is required . It is believed , howewhere the necessary instruments and skill are ava ilable itmore accurate than the first method .
T he method of estimating the turbidity by measurement 0is inaccurate in any country where the water is stained toS iderable degree by leaves and roots with which it comes inThis is clearly shown by the writer’s experience on S lu
in Nicaragua ,notably the San Francisco and Deseado rivers.
the latter stream it was sometimes desired to gage the river inabsence of the electric recording apparatus, but attempts to doshowed that it was impossible to observe the revolutions of the mmore than 6 inches beneath the surface of the stream
,owing to
opacity of the water . At the same time sediment sampleswere setand accumulated for sixtyquantity of solid matter
,Showing that the water was free
ment , the dense Opacity being caused entirely by vegetableduced by the leaves, roots, and bark Of the dense tropicalwith which it came in contact . However
,vegetable stain
ment are seldom found in considerable degree in the same
only sluggish waters rema in long enough in contact withto become colored
,and these” carry but little sediment

MEASUREMENT OF SEDIMENT . 1 7
cases opacity observations can profitably be used by carefully notingthe true cause of the opacity .
Mr. Allen Hazen ,member American Society Of Civil Engineers,
after reading t he foregoing description ,made the following com
ments
Of course the aggregate amount of sediment carried by a stream, consideredwith
reference to its tendency to fill a reservoir ,is very different from the average
amount of sediment carried by the water froma waterworks standpoint . In the
first case . themaximum amount of sediment occurs, generally speaking , at times
ofmaximum discharge , and ,formost streamswith which 1 am familiar , so large
a percentage of the sediment as to be-
practically the whole Of it would be carried
by the water in floods occupying but a few ‘ days in each year. T he average
amount of sediment in the water taken for waterworks purposes, on the other
hand ,represents the average of the amounts in substantially equal volumes of
water taken fromthe streameach day in the year. In comparing different streamswith one another , I think it wouldmake a great differencewhichmethod wasused.
T he statements regarding the colors Of the waters in Nicaragua are of great
interest . Of course color is an element of disturbance in any Optical method of
measuring turbidity . Computations and experiments conducted by Mr. Whippleand myself Show , however , that water with a color which will be tolerated as a
municipal supply , or which is capable of being decolorized at a reasonable cost ,
is not so highly colored asto affect the turbidity reading to a notable extent. T he
most deeply colored waterswith which I have had experience have not muchexceeded on the platinumscale. T hewaters fromNicaragua referred tomusthave had colorsmany times deeper than this, and it would be very interesting tohave accurate determinations of their colorsmade.
Mr . GeorgeW . Fuller,associatemember of the American Society Of
Civil Engineers, made the following comments upon the methodsdescribedT he determination of turbidity is a very important matter in connection with
variouswater problems. Various methods are practiced for its determination ,
and thus far no standard method obtains. Apparently the standard silica solu
tion is going to accomplish a great deal in thisdirection. Careful studies of this
method are now being made at New Orleans, and the results are very promising .
Messrs. Whipple and Jackson first described the standard silica solutionmethodin the T echnologyQuarterly ,
”Vol. X II , NO. 4 .
T hemethod used by Mr . Davis in Arizona was tried by myself at Louisville forseveral months, side by side with gravimetric determinati ons. It was found that
the individual resultswere quite variable , although for the purpose for which he
used them themethod is probably much more satisfactory than under the condi
tions to which it wasput in getting an accurate record of the rapidly changing
Ohio River water.
T he second method mentioned by Mr. Davis strikes me as a more satisfactoryone, when reasonable facilities are avai lable for carrying it out. It does not
appear to me that i t is somuch the specific gravity of the sediment as the per
centage of voids as actually found in the bottom of the reservoirs, that would
materially affect the correctness of the estimates as to volume. T hismethod hasbeen used for a great many years on the Missouri and Mississippi rivers, and isdescribed in theEuropean text-books onwater analysis. With coarse-
grained tur
bidity it seems to work very well , and , all things considered , I presume that as alaboratory method it is entitled to high rating.
With the Ohio River water , which contains a considerable percentage of very
IRR 47— 01— 2

1 8 OPERAT IONS AT RIVER ST AT IONS,1900.
— PART I . [no . 47.
fine clay , this method was not found to be practicable , as the clay would pass
through a dozen or more thicknesses of the finest filter paper , to say nothing of
the length of time necessary for filtering the clay. On that work it was the prac
tice to determine the total residue on evaporation of the water as collected , and
then of the filtrate after passing the water through a Pasteur filter . T he sus
pended matter could then be obtained by the difference , and the results were
quite satisfactory when the amount of sedimentwasnot too low. T here isa slight
error in this procedure due to the Pasteur filter sometimes absorbing and sometimes giving off dissolved substances. T aking everything into consideration , the
standard silica solution seems to be the more‘ practicable procedure at present
for routine work , especially when used with a diaphanometer (see T echnologyQuarterly , Vol . X II, NO. AtNew Orleans thismethod isbeing depended upon
very largely , although theweight of suspended matter is being determined by thesamemethod as at Cincinnati , as frequently as time allows, in order to establish
the ratio between the silica turbidity and the weight of suspended matter.
T here are , of course .many instanceswhere turbidity and dissolved color are both
present in the samewater . Asa general proposition , however , thisdoesnot seemtobe true , as the very highly turbid waters below the glacial drift formation do not
generally Contain much . color. S trictly Speaking , however , such a statementwould apply only to large rivers, and not to very small streams, which are influ
enced by swamps. On the other hand , _those streams for the most part on the
drift or in the neighborhood of swamps, and which are highly colored , do not , as
a rule, contain sufficient turbidity to justify any elaborate records of the sus
pendedmatter.
In future years the amount Of dissolved vegetable matter giving color to a
water is bound to be a factor . Information upon this subject is very desirable.
.As suggested by Mr . Hazen, it is likely that thismatter could best be handled inthe field by a graduated color scale on glass, the different tintsor depths of colorto
be obtained progressively by the use of different shades of color , or different thick
nesses of glass, as found most expedient .
T ES T S T O DET ERM INE THE ACCU RACY OF DIS CHARGE MEAS
U REMENT S OF NEW YORK S T AT E CANAL S AND FEEDERS .
1
During the summer of 1 900 the S tate of NewYork undertook investigations to determine the flow,
seepage, and evaporation of its canalsT he work was under the immediate supervision of Mr . E. Kuichling,
member American Society Of C ivil Engineers. Carefulmeasurementswere made by means of floats and current meters at various pointsonthe
“Erie Canal and its branches. After completing the work .
it was
thought wise to investigate the methods and determine the accuracyof the measurements taken . These special experiments were madeunder the direction of Prof . G . S . Williams, in charge of thehydrauliclaboratory at Cornell University ,
assisted by the writer, by Mr. W . P .
Boright , civil engineer, and by members of the senior class in experi
mental hydraulics at the university . Float and meter measurementswere made in the flume at the hydraulic laboratory ,
and the resultswere “compared to determine the variation between the two methodsof measurement . It is thought that a brief description of the generalmethod applied and Of the results Obtained will be o f interest toengineers.
1 Report of E. C . Murphy .

NEw YORK STAT E CANALS AND FEEDERS . 1 9
T hemovement of water in canals and feeders is quite different fromthat of a natural stream. This difference is due ma inly to lockageand to irregular feed from one section to another
,which cause rapid
fluctuatiOns of the surface level and Of the velocity - in some casesthe surface level dropped several inches in a few seconds and the
velocity increased from 25 to 50 per cent . T he d isturbance of the
water at a given placemay be due either to lockage or to feed at one
or both ends of the section . T he water that isneeded in a lower levelshould be passed through a culvert . Ordinarily ,
however , it ispassedthrough the look by Opening one ormore valves in the gates. In somecases four such valves are Opened at once for a few minutes, butas a rule only . one is Opened for a longer time . It will readily beseen ,
then,that when a boat
’
is passing in or out of a section which isbeing gaged , or is entering or leaving Short adjacent sections
,the
water in that section is in a very disturbed condition . T he length of
time required for it to return to a normal condition after one of thesedisturbances, depends to some extent on the velocity of the Water .
T he greater the velocity ,the quicker it will return to normal condi
tion ; for very low velocities it. requires hours to quiet down . In one
case, with a steady gage, it was impossible to obta in -a S ingle gaging(which required only five minutes) in a whole day . It wi ll readily beseen that , to be Of any value, dischargemeasurements under such con~
ditiOnsmust be made quickly . Even when. the surface did not fluc
tuate the work was often stopped by one or more boats passing the
place Of measurement . Instantaneous measurements of dischargeand a continuous record of surface fluctuations at the point of measurement are desirable . This was approximated by making a rod
gaging in from four to tenminutes and reading the surface fluctuations every thirty to S ixty seconds.
T wo instruments were used to measure the velocity ,V iz
,float rods
and current meter . T he float rods used were inches in diameter ,of wood
,and weighted at the lower end with iron pipe and lead Of the
same diameter,SO as to float upright . By adjusting the weight at
the lower end the immersed length Of the rod may bear any ratio tothe depth of the water in which it floats. If the immersed length isequal to the depth , the speed Or velocity of the rod is very nearly thatOf the average velocity of the water in the vertica l plane in which therod moves. On .
account Of the action of the wind on the part of
the rod which projected above the surface of the water,that part of
the rod was limited in length to about 8 inches. ExtensionsOf therod were used when the depth required them.
In thiswork it was not possible to have the depth of immersion of
the rodsmore than about 90 per cent of the depth of the water,on
account of inequalities in the bottomsand sidesof the canals. Neitherwas it advisable to have rods of many lengths, on account of the laborrequired to transport them fromplace to place . Rods of three lengthswere carried , viz , 1 8, 40, and 8 0 inches, which , with a set of exten

20 OPERAT IONS AT RIVER STAT IONS , 1 900.
—PART I .
S ions to use on either the 40- inch or the 80- inch rods, gave five lengths.
From these were selected those that could be used with the greatestdepth of immersion and which would not project more than 8 inchesout of the water . T he discharge of the channel wasc omputed froma number Of gagings made very rapidly ,
when the surface fluctuatedlittle , with different depths of immersion . It is very desirable thatresults obtained in thisway Should be tested by comparing themwithresults Obta ined under the same conditions by a more accuratemethodof measurement .
T wo kinds of testswere made : ( 1 ) Rod discharge by one party withrod discharge by the other party , and rod discharge with meter discharge, made on the canals and feeders under actual conditions ; and(2) rod discharge and meter discharge with discharge over standardweir
,made in the hydraulic laboratory of Cornell University .
T he discharge of the Erie Canal at Rochester was measured simultaneously with rods by two parties, and was again measured S imultaneously with rods by one party and with meter by another party .
At Lockport a S imilar comparison of rod discharge with meter d ischarge was made . S imilar comparisons of rod discharge with rod
discharge and of rod discharge with meter discharge were made on
the Black River Canal at Boonville and on the Glens Falls feeder at
Glens Falls. A comparison of the rod measurements of one partywith the simultaneous rod measurements of the other party will showthe error in measuring the loss of water between stations, and a com
parison Of the meter measurementsmade on the canalswith themetermeasurementsmade in the hydraulic laboratory at Cornell will serveto tie together the two sets of tests.
T he common method of measuring discharge with a current meter,by observing the velocity at many points in a cross section , could notbe used in this work because it required too much time . T wo morerapid methodswere used
,viz
,the six- tenthsmethod and the integrat
ing method . T he formermethod consists in making a S ingle observation in each vertica l at a distance fromthe surface equal to six-tenthsof the depth of the water . It genera lly gives, as do the float rods
,the
mean velocity in a vertica l in one Observation . T he integratingmethod is more rapid than the six- tenths method , but it is nOt so
accurate . It consists in moving the meter from the bottom to the
surface and from the surface to the bottom several times while it isbeing carried from one S ide of the channel to the other . In thisworkthe integrating method was Only used as a check on the resultsObta ined by the S ix-tenthsmethod .
T he current meter has a small revolving wheel with a rate ofmotionproportiona l to the velocity of the water in which it is held . Beingsmall , one observation with this wheel gives the mean velocity foronly a few square inches, and it is necessary to held it in severa lplaces in a vertical in order to get the mean velocity in that vertical ,

22 OPERAT IONS AT RIVER ST AT IONS,1900 .
—PART I . [No. 47.
T he discharge of the weir is known for any head on it,SO that a
simple measurement of the head gives the discharge of the canal .T he discharge can then be measured with rods or current meter andcompared with the weir discharge, and thus the error by the rods ormeter be determined . T he weir is 220 feet above the pointwhere therod measurements were made
,and 1 5 feet below it are baffleboards
for quieting the water . About 70 feet below the meter section is abulkhead ,
'
and at the side of it are two rectangular gates. Duringthe experiments
'
the water passed out Of the canal through two horizontal slits in the bulkhead , used to secure velocity in all of the
water section . At the higher velocities some water passed out underone of these gates. T he width of the Cornell channel was only fromone- fourth to one-half that of the channels in which the field com
parisons were made . At Cornell the water was probably moving in a
more disturbed condition than in the canalsand feeders. T he retarding effect Of bottom and S ideswas less in the former channel than inthe latter
,and the depth of water and the area of the channel were
measured with greater accuracy at Cornell than on the canals.
T he results of the field comparisons are given in the followingtable
Results Of field comp arisons.
Place . Date .
”r . Qm.
v
V’r =mean velocity found by party No . 1 , with rods
V”r=mean veloci ty found by party No. 2, with rods.
Vm=mean velocity found with meter , using six-tenthsmethod .
Q’r =discharge found by party NO 1 , with rods.
Q”r=discharge found by party No . 2, with rods.
Qm=discharge found withmeter , using S ix-tenthsmethod .
In the Lockport and Glens Falls comparisons the meter was suspended from a bridge bymeans of an insulated wire . In the Rochester and Boonville comparisons it 'was suspended froma boat bymeanof the same wire . T he conditionswere very good during the Lockport comparisons. There Was very little wind , the surface did nofluctuate, there was a good measurable velocity in all parts of th
cross sections, and no curve near‘
to disturb the direct flow of th
water . T hemeter discharge will be seen to agree closely with the t odischarge.
Cuff t. Cu . f‘
t . Cu . f t.
Feet . per scc. per sec. p er sec.
1 . 531 805 . 70 799. 85736 251 . 57
297 82929 301 . 35 310. 83939 307 . 08
227 221 . 079 238 . 81 228 . 66
1 1 1 1 233 . 54 234. 70164 . 73

NEW YORK S TAT E CANALS AND FEEDERS . 23
T he conditions were not so good in the Rochester comparisons.
T he lower gaging station was too near a curve in the canal . T he
time of run of the individual rods at the same point differs by a con
siderable amount , much more than at the upper station . On the
afternoon of September 20 the surface did not fluctuate much , butrain interfered somewhat with the work . T he meter discharge forthat day is 7 per cent greater than the corresponding rod discharge.
T he next day ,September 21 , the surface fluctuated somewhat , but
not more than while much of the regular gaging work was beingdone . T he rod discharge measurements for that day differ by per
cent , and the average meter d ischarge is larger than the rod dischargeby per cent .
At Boonville the conditions were all good . T he rod dischargesagree closely ,
as does one of the meter measurements with the correspond ing rod measurement .
T he Glens Falls comparisons are not very good— the upper gagingstation was too near
‘
a curve,
'
and there was a strong probability of
leakage from the feeder between the points where the rod measurements were made . There was no leakage visible On the surface
,but
the point where themeasurements were made is only a Short distancebelow the portion of the feeder which is noted for its large leakage,SO that there probably was some leakage here , a lthough it does not
Show on the surface .
For the reasons stated we believe that the results of the GlensFalls comparisons should be
'
given little weight, and that those at
Rochester Should be given only half the weight of those at Lockportand Boonville.
Results of exp eriments a t Cornell hydraulic labora tory .
‘
Rod gagings in canal .
Immersion , 75 per Immersion , 90 perDate . cent . cent .
Referred Depth ofto stand
water .
ard weir.
F t .p er Cu .f t.sec. p er sec.
1 A recomputation of this data gave results sl ightly d ifferent from those contained in this
report .

24 OPERAT IONS AT RIVER S TAT IONS , 1900.
— PART I . [No- 47.
Results of exp eriments a t Cornell hydraulic laboratory— Continued .
Current -meter gagings in canal .
Small Pricemeter (No .
Smalgfgi
iggr
r
gfe
xge
gtfilgg
Date.
Sgégzggf
s I
fiififiififg Analy tical . Graphical .
Veloc Dis~
ity .
_charge.
Error in discharge computed by different methods when re
ferred to standard weir .
ROd measure Meter measurementsments.
Date .
S ix-tenths Or'
dimethod . nary
Immer ~ Immer Inte Ordir
sion , 75 sion , 90 grating naryputedper cent . per cent.
Analy t Graph method . method .
fromve
ica l. ical . locitycurves.
NOT E — Minus S ign indicates that the d ischarge is great er than that by standard we ir ; plusS ign indicates that i t is less than that by standard weir .
Referring to the Rochester comparisons, it must not be inferredthat because the rod discharges found by the two parties on Sep
tember 21 agree closely ,and the meter and rod discharges of the
20th differ by 7 per cent of the rod discharge, that this d ifierence is

26 OPERAT IONS AT RIVER STAT IONS , 1900.
— PART I . (no w.
consecutive 50-second periods were counted as before. These obser
vations gave four'
measurements of velocity ,covering a period of 50
seconds each , in these six verticals, at S ix»tenths of the depth belowthe surface . These points were platted , using the distance fromthe side of the canal as abscissa '
and the revolutions in 1 00 secondsasordinate , and a mean curve was drawn . T he mean number of revolutions for the whole cross section was computed from this curve and
converted into mean velocity by the use of a rating table. T he d is
charge was then found by multiplying the mean velocity by the crosssectional area . T he discharge was also found
,analytically , without
platting the points . and drawing a mean curve . T he differencebetween the weir discharge and the meter discharge, expressed in percent
,as found by these two processes, is given in the table on page
24 . AS a rule,the discharge found by using the curve ismore accu
rate than that found without it .
In the integrating method the meter was moved in the followingway : Its center started at foot from the bottom and 1 foot fromthe S ide of the canal , and passed slowly to the
'
surface at feet fromthe side
,then to foot from the bottom and 8 feet from the S ide ;
then to the surface at feet from the S ide ,then to foot from
the bottom and 1 5 feet from the side . T he time at the beginning andend of thisOperation wasnoted , and the revolutions of the meter wheelwere counted , as indicated by the buzzer. T he meter was then car
ried back over the same path at about the same speed , the time O
passage being noted and the revolutions Of the meter wheel countedas before . T he discharge was computed by dividing the L
sum of th
revolutions of the meter wheel in the passage across the canal anback aga in by the corresponding time, converting this into velocitand multiplying by the cross-sectional area .
In the ordinary method the meter was held by a rod at five pointin the same S ix verticals in which the other meter was held , andnumber of revolutions of the meter wheel , in S ingle periods of 60ouds each ,were read froma recorder. T he pointsin theusually 1% inches, 1 foot , aone other point betweenplete revolutions, while wbe recognized . Ththismeter has beenc omputed in two wayrevolutions per second of themeter wheelS ide of the canal to the other , at the five
been computed and platted and a curvewhich the meansection has beenuse of the ratingby using with tsame t ime with

NEw YORK STAT E CANALS AND FEEDERS . 27
into velocity and platted on a large scale,the velocity at six- tenths
the depth being platted therewith and a mean velocity curve drawnamong the points
~
(not necessarily connecting them) , fromwhich themean velocity for the whole cross section was found . T he dischargefound from the meanvelocity computed in the latter way is givenin the table on page 24 , also the velocity found by the ordinarymethod .
Meter NO . 351 used in the ordinary way did not work well onNovember 1 . T he wheel d id not turn continuously for the smallvelocity foot per second , but would stop for a few secondsand then start again . T he other meter (No . 363) worked much betterfor the same velocity . T he rating tables
,however
,indicate that the
latter meter will measure a smaller velocity than the former . It
Should be said that the rating table for meter No . 351 , which was usedto convert revolutions
.
into velocity ,is for the meter suspended by a
cable and not held by a rod . There was not sufficient time to rate it
on a rod before making the computations.
In the table on pages 23 and 24 two va lues of depths are given ; theone in the third column on page 23 is the mean depth for the 40 feetof. distance passed over by the rods
,the other (third column ,
top of
page 2 4 ) is the mean depth at the meter station , and is for a distanceof 1 5 feet . T wo values of discharge of the standard weir are given foreach experiment , the one in the second column being the average forthe period during which discharge wasmeasured by rods and meter,using the ordinary method ; the other being for the period duringwhich the discharge wasmeasured bymeter , using the six-tenths andintegrating methodsIt will be seen from the table on pages 23 and 24 that the rod dis
charge and the meter discharge for the six- tenthsmethod and for the
integrating method are greater than the weir discharge, and that themeter discharge by the ordinary method is less than the weir discharge . T he S ign used is that of the correction to be applied to the
meter or rod discharge to obtain the standard weir discharge . T he rod
discharge for 90-
per cent rod immersion is on an average about 2 percent greater than the weir d ischarge , and the rod discharge for 75-percent rod immersion and themeter discharge by the S ix-tenthsmethodare each on an average per cent greater than the weir discharge.
T he variation from the weir discharge , which we will call the error,
is in each case slightly greater for the lower velocities than for the
higher velocities. T he extreme percentage difference between any
discharge and_the mean of all the corresponding discharges is about
per cent . T he error in the discharge as found with the currentmeter, using the ordinary method , is seen to increase as the velocitydecreases, and the error in the meter discharge
'
as found by the integrating method is seen to also increase as the velocity decreases. It
also increases as the Speed at which the meter is carried through thewater increases. Thiswe know must ‘be the case
,since the velocity
indicated by the meter is the resultant of the velocity of the water

28 OPERAT IONS AT RIVER STAT IONS , 1900.
— PART . 1 . [No. 47 .
and the velocity of themeter as it ismoved through the water . Whenthe velocity of t he water is small
,doubling the Speed of the meter
will nearly double the indicated velocity . In the following table isgiven the speed , in feet per second , of the meter, also the percentageof difference between the true velocity and the velocity as found bythe integrating method . For a given speed of meter , the error isseen
to be greater for the low velocities than for the higher, and for anygiven velocity of wa ter the error increases with the Speed of themeter .
Table showing efiect of change of sp eed of meter in the integra tingmethod , com
puted fromexp eriments a t Cornell Universi ty.
( S )S peed of (V )Date . meter , inte T rue ve
grat ing locity .
method .
CONCLU SIONS .
Assuming that the d ischarge given for the Cornell University wei ris correct , the greatest percentage error in discharge when measuredwith rodsOf 90 per cent depth of immersion is per cent . T he
range of percentage errors, omitting that on November 27 for velocity ,
foot per second,is 4 per cent , the mean error for all depths and
velocities is 2 per cent , and the greatest variation from thismean isper cent . T he greatest percentage error in the discharge when
measured with rods of 75 per cent depth of immersion is per cent .T he range of these percentage errors
,omitting that on November 24
for the velocity of feet per second,is per cent . T he mean
error for all depths and velocities is per cent , and the greatestdeparture from thismean is per cent . T he greatest percentageerror in the discharge as found wi th the current meter, using the six
tenths method,is per cent , and the range of these percentage
errors is per cent . T he mean percentage error for all depthsand veloci ties is per cent , and the greatest departure from thismean is per cent .
From these facts we may conclude ( 1 ) that a discharge measure

30 OPERAT IONS AT“RIVER STAT IONS
,1900.
— PART I . [N0 . 47.
Da i ly discharge, in second-feet, of Kennebec River a t Wa tervi lle, Ma ine, for 1 899.
[Drainage area . square miles ]
Feb . Mar . S ept . Oct . Nov. Dec .
Mean
Da i ly d ischa rge, in second-feet, of Kennebec River a t Wa tervi lle, Ma ine, for 1 900.
Jan . Feb . Mar . July . Aug .
n n n n n n n n
Mean

MAINE. 3 1
COBBOSSEECONTEE RIVER AT RESERVOIR DAM NEAR AU GU STA,MAINE .
This river is described in the N ineteenth Annual Report , Part Iv,
pages79 and 80. T he record of the dischargemeasurements from 1 890
to 1 899, inclusive , will be found inWater-Supply Paper NO . 35, pages
28 to 33 . T he following measurements of da ily discharge for 1 900
were furnished by Mr . Alexander H . Twombly ,engineer of the Forest
Paper Company ,of Yarmouthville , Ma ine . T he measurements are
made at the reservoir dam,where the discharge of the river iscontrolled
by gates, except during flood stages. T he gates are closed on Sun
days and no water is allowed to pass. T he great Cobbosseeconteedam furnishes a supplementary supply to the reservoir below ,
and
water is occasionally drawn from it .
Dai ly discharge, in second-feet, of Cobbosseecontee River a t upp er dam near
Augusta ,Ma ine, for 1 900 .
[Drainage area , 230 square miles ]
Jan. Feb . Apr . May . July . Aug . S ept . Oct . Nov . Dec .
Q n
O - c
- s
a Water Shut back on S unday when under control .
ANDROSCOGGIN RIVER AT RUMFORD FALL S,MAINE .
This river receives the dra inage from the Rangeley and other lakesnear the border line between Maine and New Hampshire . It flows ina southerly and southeasterly direction,
descending with rapid fall ,and is one Of the most valuable streams in New England for waterpower purposes. It is described in the Nineteenth Annual Report ,Part IV , pages 84 to 97 . Figures of da ily discharge will be found inWater-Supply PapersNo . 27
, pages 1 4 to 1 6 . and NO . 35, page 28 ; also

32 OPERAT IONS AT RIVER ST AT IONS,1 900.
— PART I . (No . 47.
in the Twentieth Annua l Report , Part IV , pages 67 to 69. Figuresof monthly discharge for the year 1 899 will be found in the Twentyfirst Annual Report , Part IV , page 57 .
T he following table of the daily discharge Of -Androscoggin River forthe year 1 900 has been furnished by Mr . Charles A . Mixer , residentengineer of the Rumford Falls Power Company ,
who states that notable features of the discharge of the river for that year ( 1 900) are thehigh maximum discharge and the high average for February . Thereis no previous record or recollection of thaws or rains in that sectionduring that month
,but in February ,
1 900,there were two such peri
odsof thawing and ra infall . T he precipitation for themonth wasinches, the greatest on record
,most of i t in the formof rain . In 1 898
the precipitation amounted to inches, but all in the formof snow,
SO that the effect on the river wasnot apparent unti l Spring.
Da i ly discharge, in second-feet, of Androscoggin River a t Rumford Fa lls, Ma ine,
for 1 900 .
[Drainage area , square miles ]
Jan . Feb . Mar . June . July . S ept . Oct . Nov . Dec .
n. "n u - O
- r
v - 0
‘ Q - C - Q
ci t - Q - C Q O - u
Mean
MERRIMAC RIVER AT LAWRENCE,MASSACHU SET T S .
Careful recordsof the flow of this river at Lawrence, Massachusetts,have been kept for more than fifty years, but they have never beenpublished in full . Figures fordischarge from 1 890 to 1 897 wer
Report , Part IV , pages 1 1 3 to 1 1 5,and similar figures for 1 898
Twentieth Annual Report , Part IV , page 73 . InWater- SupplyNo . 35 will be found the figures for the da ily discharge for 1 897and 1 899. T he figures for 1 900 are published herewith .

3 4 . OPERAT IONS AT RIVER STAT IONS , 1900.
— PART I . [No . 47.
Run-017°
of S udbury River and Lake Cochi tua tewa tersheds, in second-feetper squaremi le, for 1 900.
Sudbury Lake COMonth . River chituate Month.
watershed . watershed .
January 1 . 060 AugustFebruary 4 . 136 S eptember
OctoberNovember
1 . 641 December455293 Mean
MYST IC LAKE,MAS SACHU SET T S .
This lake has been a source of water Supply for the city of Charlestown
,Massachusetts, S ince 1 864 . A brief description of the watershed
isgiven inWater-Supply PaperNo . 35, page 39, and on page 40 the run
off,in inches, for the watershed from 1 878 to 1 897
,inclusive . Records
for 1 898,1 899
,and 1 900 are not available, although Observations have
been continued . T he lake isno longer used asa source of water supply .
CONNECT ICU T RIVER AT ORFORD,NEW HAMPSHIRE .
This river has its source in Connecticut Lake, in the extreme northern portion of New Hampshire . A gaging and Observat ion stationwas established August 6 , 1 900, by E. G . Paul , on the covered highway bridge over the river between Orford , New Hampshire, and Fairlee , Vermont , about 75 miles from the source Of the stream. T he
gage for making Observations of they ariations in the height of waterin the river consistsof a scaleboard 20 feet long, graduated to feet andtenths
,fastened horizontally to the inside timberson the upper side of
the bridge , 1 25 feet from the left-bank abutment,and a steel sash
chain running over a S ide pulley with a 5 -
po‘und weight , the length
of the cha in from the extreme end of the weight to the copper-rivetmarker being . 42 . 95 feet .
T he Observer is Frank H . Gardner,of Orford
,New Hampshire.
One discharge measurement wasmade during 1 900, as followsAugust 7 : Gage height , feet; discharge ,
second-feet .
Da i ly gage height, infect, of ConnecticutRiver a t Orford ,NewHamp shire,for 1 900.
Aug . S ept . Oct . Nov . Dec . Aug. S ept . Oct . Nov .

MAS SACHU SET T S AND CONNECT ICU T . 35
CONNECT ICU T RIVER AT HOLYOKE,MASSACHU SET T S .
Measurements have been made of the flow of Connecticut Riverat
'
Holyoke for many years. For records see Water- Supply Paper
NO . 35, pages 40 to 42 . T he figures are furn ished by Mr . A . F . S ick
man ,assistant engineer of the -HolyokeWater Power Company . T he
record for the year 1 900 is not ava ilable .
CONNECT ICU T RIVER NEAR HART FORD,CONNECT ICU T .
Observations of the height of Connecticut River near Hartford are
made by the Connecticut River bridge and highway district , EdwinD . Graves
,chief engineer, as noted in the Twentieth Annual Report ,
Part IV, page 77 . Daily readings from February 8, 1 896 , to Jan
uary 1 , 1 899, were published in Water- Supply Paper No . 35 , pages 42
to 44 . T he record for 1 900 is given in the following table :
Da i ly gageheight, infect, of ConnecticutRiver nea rHartford , Connecticut,for 1 900 .
Mar .
‘
Apr . May . -Oct . Nov Dec .
HOU SAT ONIC RIVER AT GAYLORDSVIL LE,CONNECT ICU T .
This gaging station was established October 24 , 1 900, by E. G . Paul .It is near Merwinsville Station ,
on the New York and New HavenRailroad . Gage
-height Observations are made by means of a weightsuspended by a sash cha in from the covered bridge across the river .
T he distance from the extreme end Of the weight to the copper-rivetmarker in the chain is feet . T he distance from the center of theS ide pulley to the datumof the gage is feet . T he gage is referredto a 1 6-f oot scaleboard , graduated
'
to feet and tenths,fastened hori
zontally to‘
the'
woodwork on the inside of the covered bridge . T he

36 OPERAT IONS AT RIVER STAT IONS , 1900 .
— PART I . [No . 47.
Observer is G . H . Monroe,
'
a farmer living within a Short distance of
the station . As the cross section of the river channel at the bridgewas not favorable for making discharge measurements, a cable wasstretched across the stream 14miles below the bridge. T he span of
the cable is 200 feet . It is supported onthe right bank by timbers 25feet high , and is anchored to a large rock which was placed 5 feetbelow the surface of the ground . On the left bank the cable is fastened to a large sycamore tree , and is anchored to the base of a largeoak tree by means Of a turn-buckle. A tag wire with markers every
1 0 feet was placed above the cable . T he initial point of sounding isthe large sycamore tree which supports the cable on the left“bank .
During 1 900 the following discharge measurements were made byMr . Paul
August 9 : Gage height , feet ; discharge , 450 second-feet.
August 10 : Gage height , feet ; discharge, 422 second-feet .
October 20 : Gage height , 3 feet ; discharge , 303 second-feet .
October 24 : Gage heigh t, feet ; discharge , 370 second-feet .
Da i ly gage height, in feet, of Housa tonic River a t Gaylordsvi lle, Connecticut, for
1 900.
Nov . Dec . Nov . Nov . Dec .
MISCELLANEOU S MEASU REMENT S OF S TREAMS NEAR GREATER
NEW YORK .
Measurements of the discharge of three small streams near the cityof New York were made by E. G . Paul in 1 900 . These streamsTenmile River
,Wallkill River, and Esopus Creek— have been under
consideration as possible sources for increasing the water supply of
Greater New York . Following are the discharge measurementsmadeby Mr . Paul :
M iscellaneousmeasurements of streams near Grea ter New York.
Date. S tream. Locality .
T enmile River - u . Webatuck ,N. Y- do do
Wallkill River Rockford Bridge ,N . Y
Esopus Creek BrodheadsBridge , N. Y

Loca tion of gaging sta tions on New York streams.
S tream. Location . Kind of stat ion . Duration of record . Gage reader .
1
n u- ‘ s
Dam andmill
Dam andmills
- 0 —0
a NO record February 1 to May 9, 1900, inclusive .
bNO record December , 1899. and February ,1900.
cNO record October 3, 1899 , to April 7 , 1900, inclusive .
d NO record April .1 , 1899, to August 31 , 1900, inclusive .
c N o record August and S eptember , 1899, and February and May , 1900.
f N0 record August , 1899, to Apr il , 1900.
In the foregoing table there have been included a number of riverswhich belong to the Great Lakesdrainage , descriptionsofwhich will befound in Water- Supply Paper No. 49, the same being Part III of thisseries
,a geographic arrangement of the streams having been followed ,
as in former years. T he streams referred to are Seneca River at Baldwinsville
,Chittenango Creek at Bridgeport , Oneida Creek at Kenwood ,
WestBranch of Fish Creek atMcConnellsville, OswegoRiver atMinettoand at high dam, Salmon River above Pulaski , Moose River below Mc
Keever,Beaver River, and Black River at Huntingtonville .
T he following table gives the results of current-metermeasurementsmade on the principal of these streams during the year 1 900. Amodified form of the Price meter which has been adopted by the
United States Geologica l Survey was used . T he usual mode Of pro
cedurewas to submerge themeter six- tenthsof the depth of the stream,
at measured intervals across the channel , and record the revolutionsfor a period of 1 00 seconds. In cases of doubt , surface and bottom
Oct . 1 , 1898, to Nov .
Oct . 16 , 1898 , to Jan .
S ept . 20, 1898, to S ept .
S ept .
— Cont’d
Oct . 7, 1898 —Cont’d a
S ept . 23 , 1 898— Cont’
d
S ept . 23 , 1898 -Cont’d
Oct . 1 , 1898— Cont’d
S ept . 23 , 1898, to July5
May 2 , 1900, to Oct . l 3 ,
1900 .
_July 6 , 1900 —Cont’dJune , 1900— Cont
’d
Feb . 1 . 1899— Cont’d c
Dec . 8 , 1898— Cont’d
Mar .12 , l898— Cont’dd
.Tuly 22, 1900 —Cont’d
Nov . l , l895— Cont’d
Dec . 1 , 1895 Cont’d
Dec . 1 , 1887— Cont’d
Nov . l2 , 1898— Cont’d _
S ept . 16 , 1898~ Cont
’d
Oct . 4 , 1898, to Dec .
3 1 , 1900. e
S ept . 13,1898— Con’d f
Apr .— Cont
’d
S ept . 14, 1900— Cont’d
S ept . 4 , 1900— Cont’dJune — Cont’d
Feb . 22 , 1897— Cont’d

NEw YORK . 39
velocities were also taken ,or
,as a check , the flowwas determined by
the integrating method . Many of these measurementswere made at
places where permanent stations have not been mainta ined , and thegage-height figures given are the distances to water surfacemeasuredfromsome fixed point of reference , usually the Coping of either a pieror an abutment . In addition to the results included in the table , 35current-meter measurements have been made in headraces, feeders,power canals, and other channels, to determine the leakage of dams,the flow through turbines, and the amount of diversions. T he resultsof these measurements will be found in connection with the descrip
tions Of the various gaging stations.
Summary of current-meter measurements of New York streams during 1 900.
Point of measure Hy drogra Gage DisDate . S tream. Locat 1on . ment . pher . height charge.
Mohawk River Riverside Bridge
do Rome
do
do _ . RidgeMills
do _ -do _
Or iskany Creek OriskanyWest Canada T w i n R o c kCreek . Bridge .
MiddlevilleMohawk River L ittle Falls S uspension bridge
do _ -do Astronga BridgeEast C a n a d a Dolgeville Iron highway bridgeCreek .
do - do .
do do
S choharie Creek Fort Hunter
do -do 2 26do -dodo -do
- _do -do
-do
ge n - u Mill Point .
o _
Molaawk River S ch
gnectady Freeman
’s bridge
o
- _do - doIndianRiver S abael
S chroonRiver Warrensburg
BaldwinsvilleBridgeport
T hree miles'
aboveMinetto .
T wo miles abovePulaski .
T wo miles belowWatertown .
T wo miles a b o v e R. E .HortonRome .
Below Erie Cana l -dofeeder dam.
Above Erie Canal dofeeder dam.
At highway bridge H .A. Presseyabove dam.
In channel below R.E .Hortondam.
Wood road bridge dodo
dodododo
do doBelow n h Falls dodam.
West Shore r a i l H .A. Presseyroad bridge .
Erie Canal aqueduct E . D .WalkerInflow to Mohawk R.E .HortonBelow aqueduct ; in E . D .Walkerfiow to Mohawk .
T otal outflow a t dodam.
Below aqueduct ; in doflow to Mohawk
dododo
do doBelow Indian Lake R.E.Hortondam.
Two mi les above doWarrensburg .
One mile a b o v e domouth .
Highway bridge be dolow papermill .
Highway bridge be dolow Dun c a n 85Co .
’s dam.
Highway brIdge be1 0 w ButternutCreek .
Headrace a b o v e
mill .

40 OPERAT IONS AT RIVER STAT IONS , 1900 .
— PART I . [N0 . 47.
F ield work was begun so late that in many instances current-metermeasurements to check the calculated flow over dams during highwater could not be made . Additional meter measurements are alsoneeded at all of the Current-meter stations to establish d ischargecurves. This report must therefore be considered as in some degreepreliminary .
For mill streams,where the water is held back as pond storage
during the dry season , and where themills are stopped on Sundays orholidays, it is impossible to determine the natura l regimen of flow .
If at the time the water wheels are stopped the water stands belowthe level of the crest of the dam
,the flow in the stream channel below
will be nil,or at best will only equa l the leakage of the dam,
flumes,
or penstocks. With regard to estimation of Sunday flow ,no uniform
rule has been followed . In some of the Older records the Sunday flowduring the dry season has beentaken as the mean of the calculatedflow for the preceding and following days, and in cases where thismethod had previously been used it hasbeen adhered to in computingthe daily discharge of the streams. In other instances the daily flowgiven in the table is that shown by the gaging record , and representsas nearly asmay be the actua l amount of water flowing in the streamchannel below the dam
,but it may be quite different fromthe amount
entering the pond above the dam.
T he relation existing between the canals of New York and the
streams of the central portion of the S tate is very complicated . In
many cases diversion from the headwaters of the streamsfor the sup
ply of canals virtually reduces their effective dra inage areas. AS a
result , the watersheds during the summer may be materially less inarea
,and in their water-
y ielding characteristics may differ widelyfrom the region tributary to the streams when the canals are not inoperation . It is evident that the run -off from such streams is notcomparable with that from streams having an undisturbed regimen .
It often happens that a S ingle gage reading taken at or near the culmination of a flood Shows a larger flow than the mean for any singleday . T he results of such isolated observations, together with otherdata relative to extremes of flow
,have been given for a number of
stations.
T he drainage areasof the various streams above the gaging stationsand at other points are given in the following table :
Drainage areas of New York streams.
S tream. Location . Area .
Batten Kill a Atmouth
Beaver River - doAbove BeaverBelow Beaver
a Hudson River tributary . b U pper Hudson storage surveys.

MOHAWK RIVER GAGING STAT IONS .
Gaging records‘
have been kept on this stream at the following damsand mills : Rome waterworks pumping station at Ridge Mills, lowerdam at Little Falls, New York State dam at Rexford F lats, and West
Troy Company’sdam at Dunsbach Ferry .
’ A current-meter station at
Freeman’s bridge , below Schenectady ,
has also been maintained .
An important series of gagings has also been instituted on MohawkRiver by the New York S tate canal survey ,
under the direction of
Edward A . Bond,State engineer and surveyor . A statement regard
ing these gagings has been furnished by Mr . D . J . Howell, consultingengineer of the New York S tate canal survey . Gages
“
have beenerected at various places a long the stream
,fromHerkimer to the
confluence of the river with Hudson River at Cohoes,both above and
below each dam and near the points of inflow of the more importanttributaries, and the positions of the gage zeros have been determinedwith reference tomean tide as a datum. Gages previouslymaintainedby the Un ited States Geological Survey have been used whereverava ilable. Observersare employed to take simultaneous da ily readings of the gages, fromwhich the S lope of thewater surface for eachlevel or division will be determined and the velocity of flow computed .
It is the intention to take cross sections of the stream channels in eachlevel
,at different stages, and tomake current-meter or other discharge
measurements during high water .
T he regimen of Mohawk River during the navigation season is
undoubtedly influenced to a large extent by the Erie Canal,which
runs para llel to it from Rome to Cohoes. T he water supply of the
Erie Cana l east of the summit level at Rome is,with a single excep
tion,derived from Mohawk River and its tributaries. T he State
dams and feeders are located as follows
L oca tion of S ta te dams and feeders.
S tream. Locat ion .
Delta , 6 miles above Rome .
Rome .
Oriskany .
Little Falls.
Fivemile or Rocky Ri ft dam.
Fort Hunter.
Rexford Flats.
A large diversion from the watershed at these feeders is in somemeasure counterbalanced by return water to the main channel , fromseepage through canal and feeder banks, and from flow over waste
weirs.
T he gaging records at Rexford Flats and at L ittle Falls indicatethat during the navigation season the y ield of the watershed
,in

NEw YORK . 43
second—feet per'
squaremile, and frequently ,also, the actual flow Of
the river,in second - feet
,is considerably less at the former station
than at the latter station . T he drainage area above Rexford Flats issquare miles, or times .that at L ittle Falls, which is
square miles. This fact appears to be confirmed by the other gagingrecords kept on the stream
,but the results of these have not been
sUfficiently worked up to permit a fina l discussion of the subject atthis timef T he diminished water-
yielding capacity of the lowerMohawk Basin may be attributed in part to the low water of S choharie Creek . T he tota l drainage area of that creek is 947 squaremiles, Weir measurements at Schoharie Fa lls Show that the flowsometimes falls below 50 second- feet . During practically the entiresummer nowater flows over the crest of the State dam at Fort Hunter ;the major portion of the flow is diverted to the Erie Cana l feeder, andthe remainder leaks through the dam. During the summer of 1 900
,
from June to October,inclusive
,the d irect inflow to theM ohawk from
this tributary did not,with the exception of a few days, exceed 45
second - feet,or second - foot per square mile .
MOHAWK RIVER AT RIDGE MILL S,NEW YORK .
A description of this stat 1on will,be found in Water- Supply Paper
NO . 35, page 45 . During the present season ( 1 900) the Ca lculated d is
charge Of the turbines has been made to depend on current-metermeasurements, instead of on the Observed wheel-gate Openings, asformerly .
T able showing rela tion Of sp eed of pump s to wa ter flowing in ta i lrace.
5Measured flowDate .
in tailrace .
Rev . p er mi n
August 23
T he d ischarge of the turbines is sensibly proportiona l to the rate at
which the waterworks pumpswhich they dr ive are run ,and a
'
stra ight
line diagram has been prepared ,using the foregoing data ,
fromwhichthe flow through the turbines has been estimated .
On August 23 , when no water was flowing oVer . the crest,a meas
urement of the leakage of the damw as made in the stream channelbelow ; it was found to be 20
,
second - feet,and an allowance of
‘
thatamount has been made in estimating the da ily flow . T he results of
other meter measurements at this station,and in the vicinity ,
will befound in the table on page 39.
T he gaging record at RidgeMills doesnot include any allowance for

OPERAT IONS AT RIVER S T AT IONS , 1 900.
— PART I . [N0 ~ 47
diversion to Black River Cana l at the Delta feeder , 4 miles upstream,
nor for return water from seepage and wasteweirs.
Da i ly discharge, in second-feet, of Mohawk River a t Ridge Mi lls, New York, for
1 898 .
[Drainage area , 153 square miles ]
Oct . a Nov . a Dec . a
Mean
a Revised figures.
Da i ly d ischa rge, in second feet, of MohawkRiver a tRidgeMi lls, New York, for 1 899.
Jan .a Feb .a Mar .a Apr .a June . July . Aug . S ept . Oct . Nov . a Dec .a
Mean 226 81 278
a Revised figures.

46 OPERAT IONS AT RIVER STAT IONS, 1 900.
— PART I . [No . 47.
Obta ined,at t he beginning of the navigation season of 1 900 a gage
was placed in the forebay between the screen rack and the feedergates.
Current-meter measurements have been made in the Oriskanyfeeder, as follows :
Current-meter mea surements in Oriskany feeder .
Date .:Hydrographer .
Computed dIS ‘
charge .
October 1 5 1898 W . D. Lockwood
DoApril 28 , 1900 R . E. HortonMay 29, 1900
During the dry season the gateways leading to the feeder are wideOpen and the water flows through unobstructed , as in an open channel ,So that the formula for discharge through orifices can not be applied .
In this connection the d ifficulties encountered in gaging the flow in
canal feeders are worthy of comment . Broadly speaking, the amountof water required for the supply Of canals is proportional to lockageand evaporation jointly ,
with, perhaps, a constant factor added for
seepage losses. As a matter of fact,however
,the rate of flow in
the feeder often fluctuates,within wide limits, severa l times a day .
Usually gates are placed in both the inlet and the outlet ends of the
feeder channel . T he height of the water in the feeder'
is influencedby the height of the water in the canal and in the supply pond above,while the velocity of flow may be varied by changes in the gate open
ings at either end . Isolated discharge measurements are of value ina general way , but it may be said that nothing short of a continuousrecord
,both Of the stage of the water in the feeder and of its velocity
of flow,will serve to determine the actual d iversion from day to day .
Da i ly d ischa rge, in second-feet, of Oriskany Creek a t Oriskany , New York ,for 1 898 .
[Drainage area , 1 44 square miles ]
Dec .
Mean

NEw YORK . 47
Dai ly discharge, in second-feet, Of Oriskany Creek a t Oriskany ,New York ,for 1899 .
Nov . Dec .
Da i ly discharge,in second-feet, of Oriskany Creek a t Oriskany , New York, for 1900.
Jan. Feb . Mar . Apr . Ma y . June . July . Aug .
Mean 199 378 386 488 136 95 100 103

48 OPERAT IONS AT RIVER STAT IONS , 1 900.
— PART I .
SAUQU OIT CREEK AT NEW YORK MILLS,NEW YORK .
A description of this station will be found in Water-Supply PaperNO. 35
, page 48 . During the summer little water flows over the dam,
the entire volume being used to drive the water wheels in the adjoinIng cotton mills. T he leakage of the damwas measured by currentmeter onMay 31 , and was found tob e second-feet .
This stat ion was discontinued October 1,1 900.
Da i ly discharge, in second-feet, Of S auquoi t Creek a t New York Mi lls, New York,
for 1 898 .
[Drainage area , 52 square miles ]Nov.
I ZIZIII IZ Z IZ II Mean
Sunday .
Da i ly discha rge, in second-feet, of S auquoi t Creek a t New York Mi lls, New York,for 1 899 .
Jan . Feb . Mar . Apr . May . June . July . Aug . S ept . Oct . Nov . Dec .
— w m fl

OPERAT IONS AT RIVER STAT IONS , 1900.
— PART I . [No . 47.
T he dra inage areas at the different gaging stations are as follows
Dra inage areas Of West Canada Creek.
Square miles.
At mouthAt MiddlevilleAt T renton FallsAt Twin Rock Bridge
Da i ly gage height, in feet, of West Canada Creek a t Twin Rock B ridge, New York,
for 1 900.
Nov . Dec .
- n - .n
- o
WEST CANADA CREEK AT MIDDLEVILLE,NEW YORK .
A description of this station will be found in Water- Supply PaperNo . 35
, page 49 . In the past the principal element of uncertaintywith regard to this record was considered to be the leakage of the
dam,etc .
,which had been taken at 50 second - feet . Current-meter
measurementsweremade on September 1 0, 1 900, to determine the leakage of the dam and the low-water flow of the stream at this stationwith the following results :
S econdfeet .
Highway bridge belowdam,measured flow inmain streamchannel 1 13
Measured flow in hydraulic canal
T otal flow by current-meter measurements
T he calculated flow from the gage record is as follows
Flow over dam, gage reading foot
Leakage previously estimated
T otal flow in main channel
Calculated diversion to water wheels
T otal estimated flow 241
Unfortunately no current-meter measurements to check the calcu
lated flow during high water have been made . T he highest waterObserved was in August
,1 898
,when it reached a depth of feet on
the crest of the Middleville dam. T he discharge at that time can not
accurately be estimated , as a part of the water flowed around the end
of the dam and passed overland to the stream channel below . Highwater marks at the Newport dam indicate that the spring freshet dis~

NEw YORK . 5 1
charge has been as great as second - feet , or second - feet persquare mile , from a dra inage area of 472 square miles. T he lowestwater in this stream occurs on Sundays, when the flow is held back ,as pond storage, by dams above Middleville . Aside from this, themost notable low-water period was September 2 to 1 2 , inclusive , 1 899,the mean flow at Middleville for eleven days being 1 83 second -feetper square mile .
Da i ly discha rge, in second-feet, of West Canada Creek a t M iddleville, New York,
for 1 898 .
[Drainage area , 519 square miles ]
Nov. Dec .
Mean
Sunday .
Da ily discha rge, in second-feet, of West Canada Creek a t M iddlevi lle, New York,
for 1899.
Feb . Mar . Apr . May . June . July . Aug . S ept . Oct .
Mean 397 324 235
Sunday .

52 OPERAT IONS AT RIVER STAT IONS , 1900.
—PART I .
Da i ly discharge, in second-feet, of West Canada Creek a t Middlevi lle, New York,for 1 900.
Jan. June .
Mean 924
a NO record for February , March , and April .
Sunday .
MOHAWK RIVER AT L IT T LE FALL S,NEW YORK .
This gaging station,which has been described in Water- Supply
Paper No . 35, page 51 , is located at the lower (Gilbert’s) dam at L ittle
Falls. Current-meter measurements have beenmade to check the calculated flows, with very satisfactory results. They are as follows :
October 20 to 21,1898, at suspension bridge 2 miles below Little Fal ls,
W . D. Lockwood ,hydrographer :
T otal flow by current meter
Computed flow (mean of two days)
May 1 , 1 900, at suspension bridge 2 miles below Little Falls, R . E. Horton,
hydrographer
T otal flow by current,
meter
Computed flow over damComputed diversion to G ilbert
’smill
Computed diversion to papermill
T otal computed flowMay 23
,1900, at Astronga Bridge, Little Falls, R. E. Horton ,
hydrog
rapher
T otal flow by current meterComputed flow over damComputed diversion to G ilbert
’smill
Computed diversion to papermill
T otal computed flow

54 OPERAT ION S AT RIVER S T AT IONS , 1900.
— PART I . [No . 47.
T he most notable low -water period was August 3 -
to August - 1 0,
inclusive,1 899
,the mean flow for eight days being only 1 20 second
feet,or second - foot per Square mile.
Da i ly discha rge, in second-feet, of Mohawk River a t L i ttleFa lls,New York
, for 1 898 .
[Dra inage area ,square miles ]
a h
Mean
S unday .
Da i ly discharge, in second-feet, ofMohawkRiver a t L i ttleFa lls.New York, for 1 899 .
J an . Feb . Mar . May . June . July Aug . S ept . Oct . Nov . Dec .
Mean 803 223
Sunday .

NEW YORK .
Da i ly discharge, in second-feet, of MohawkRiver a tL i ttleFa lls, New York , for 1 900.
Jan . Feb . Mar . May . June . July . Aug . S ept . Oct .
- n n ' o Q
n u n - n n n a c o n o- o - c
Sunday .
EAST CANADA CREEK AT DOLGEVILLE,NEW YORK .
A description of this station,together with the estimated dai ly d is
charge as originally computed , June to December , 1 899, will be foundin Water- Supply Paper No . 35
, page 52 . A new rating table for thedamhas been prepared , using coefficients of discharge derived fromFreeman
’s experiments on a model Of the round- crested portion of the
Croton dam,which apparently corresponds closely wi th the ogee sec
tion of the Dolgeville dam,as regards friction on the crest
, verticalcontraction of the nappe, and siphonage .
1
In computing the record here given ,the new rating table has been
used,beginning June 1
,1 899. T he flow through the turbines has
also been computed from current -meter measurements made in thetailrace of the electric power plant , instead of fromthe Observed headand the gate Openings of the water wheels, as formerly . T he effectof these changes has been to slightly increase the extreme high-water
and low-water flows, the estimated . flow for mean stages remainingsubstantially the same .
1 S ee Repor t on New York’sWater Supply , made to Bird S . Coler , comptroller by JohnR. Freeman, p . 137.
4 , 673 645 *395 481 629 667 4,845
761 509 *545 849 *4 , 027
515 455 881311 339 503 499
644 *93 503 491*2 , 443 505 284 503 493
1 , 658 760 788 274 629 *282 5 , 727*625 195 228
'
449
374 *326 665 *4 , 725
876 452 294 747754 153 326 747754 *181 200 499
*2 , 132 864 694 365 483 598 2 , 388
864 666 515 *459 2 178896 *545 377 691801 668 *461*555 724 515
1 , 778 702 826 874 713 9831 , 882 599 754 *745 501 881 1 , 825*1 , 745 561 794 651 492 7851 , 732 650 494 599 *622
579 494 564437 499 643*72 696 475 953
1 165 474 527390 915474 689 819
751 474 657 914751 674 652723 740 874 959 *668 4 734
E 9

56 OPERAT IONS AT RIVER STAT IONS , 1900.
— PART I . (No . 47.
Current-meter measurements were made from the bridge acrossthe ta ilrace below the power plant , as follows :Current-meter measurements of flow in ta i lrace a t Dolgevi lle electric-light and
p ower dam.
Gate openFlow in tail ing of 36Date .
race . inchWheel .
wheels.
S econd -feet . Per cen t.
84 NO. 2 .
76 . 38 No. 2.
63 . 28 No. 1 .
80 . 38 No . 1 .
Only one of the two 36 - inch V ictor turbines was running in eachinstance
,together with the 1 5- inch exciter wheel . T he depthsof gate
openings of the 36 - inch wheels are shown in the foregoing table . T he
1 5 - inch exciter wheel ran at thirteen-hundredths gate in each case .
T he head on the wheels was 72 feet . Observations of the wheel—gateOpenings were taken at the beginning and end of each test
,and the
average is given in the table.
T he results of the current-meter measurements of the total flow of
the stream have been given in the general table on page 39.
T he relation between the metered and calculated flows on differentdays is shown in the following tables, from gage read ings taken at
the time the measurements were madeCurrent-meter measurements of East Canada Creek.
Flow in tail Flow overDate .
race . dam.
T otal flow .
S econd-feet. S econd-feet. S econd -feet.84 328 4 12
76 376 452
80 108
a Measured in stream channel above point of confluence with tailrace .
Ca lcula ted flow of East Canada Creek.
Crest gage FlowOver Flow in tailDate .
reading . dam. race.
T otal flow .
S econd -feet. S econd-feet. S econd -feet.282
362
In the first two cases the total flow was measured a t the Dolgevillebridge above the dam
,and the difference between the observed and
calculated flows in the first inst ance is probably due to pond storage.
T he accompany ing tables of mean daily flow show the amount ofwater passing down the stream from the dam each day , with the excep
tion of Sundays, forwhich the flow has been taken as a mean between

58 OPERAT IONS AT RIVER STAT IONS,1900.
—PART I .
Da i ly discharge, in second-feet, of East Canada Creek a t Dolgeville, New York,for 1 900.
Feb . Oct . Nov . Dec .
Mean
a No record . Sunday .
CAYADU T TA CREEK NEAR JOHNST OWN,NEW YORK .
A description of this station will be found in '
Water- Supply PaperNO . 35
, page 53 . T he record is kept at the dam of the JohnstownElectric Light and Power Company ,
1 mile below Johnstown . S incethe establishment of the station standard sharp
- crested gaging weirshave been erected by Prof . Olin H . Landreth
,C . E. One of these
weirs has been placed across the main stream above the head of slackwater from the dam. A second weir has been placed in the tailracebelow the power house .
During the summer the water doesnot ordinarily flow over th e dam,
which is practically tight , but the entire flow passes through the turbines. A series of gagings at the tailrace weir has been made inOrder to determine the discharging capacity of the water wheelswhenrunning under different conditions.
Dams are located at frequent intervals along the stream,and dur
ing the dry season the amount of flow from one to another is largelycontrolled by the water wheels.

NEw YORK . 59
) ai discharge, in second-feet, of Cayadutta Creek near Johnstown, New York,
for 1 898 .
[Drainage area , 40 squaremiles ]
Mean
Sunday .
)a ily discharge, in second-feet, of Cayadutta Creek near J ohnstown ,New York,for
1 899 .
Jan . Feb. Mar . Apr . May . June . July . Aug . S ept . Oct . Nov . Dec .
- n
- m
Mean 39 31 74 251 31 20

60 OPERAT IONS _AT RIVER S TAT ION S , 1 900.
— PART I .
Da i ly discharge, in second-feet, of Cayadutta Creek near Johnstown New York,for 1 900.
Mar . Apr . May . June . Aug . S ept .
Mean 62 137
* Sunday .
NOT E .
-Records for October , November , and December are not available at present .
SCHOHARIE CREEK AT FORT HUNTER,NEW YORK .
Schoharie Creek rises on the western slope of the Catskill Mountains. In its lower stages it flows through a long, flat valley ,
in a
stream bed covered with cobbles and gravel , over which the waterfinds itsway in a thin sheet during the dry season .
T he S tate dam at Fort Hunter is near the mouth of the stream, and
high water fromMohawk River backs up to the toe of the dam. T he
condition existing at this station during the summer months has beendescribed in connection with the Mohawk River g aging stations
,
page 42 . A record has been kept of the elevation of the water surfacein the pond above the dam,
and also in the channel below the dam.
T he average difference , or head , is feet,and it isnearly constant ,
except when water falls below the crest level above the dam.
T he dam is of timber backed with gravel , and there are a numberof leaks above the gravel line 2 feet below the crest . During the
summer this leakage represents practically the total inflow fromSchoharie Creek to the Mohawk ; Current -meter measurements of
the leakage were made below the Erie Canal aqueduct,at a point
where the entire flow is concentrated in a narrow channel .

62 OPERAT IONS AT RIVER S TAT IONS , 1900.
— PART 1 . [No . 3
Da i lyd ischarge, in second-feet, of S choharie Creek a t Fort Hunter ,New York
, fol
1 898 .
[Drainage area , 947 square miles ]
_ .I
- p _e o
Da i ly discha rge, in second-feet, of S choharie Creek a t Fort Hunter , New York,
.
fo1 899 .
July . Aug . S ept . Oct. N ov
a
Mean 187 142_
916
NOT E.—No record for December .

NEw YORK . 63
Da i ly discharge, in second-feet, Of S choharie Creek a t For t Hunter New York , for1 900 .
May . June . July .
Mean‘
561
NOT E .—NO record for February ; station abandoned July 31 .
SCHOHARIE CREEK . AT ERIE CANAL AQU EDU CT , NEw YORK .
’
T he Erie Canal Crosses SchoharieCreek between the Fort Hunterzl am and Mohawk River . A gaging stat ion was established at the
aqueduct on May 2, 1 900, by Prof . E. D . Walker . A current -meter
measurement of the flow through the archways of the canal aqueductwasmade by him on that day ,
the result being a discharge of
second - feet,wi th a gage height of feet . Owing to cross currents
above the aqueduct,the conditions are not favorable for meter meas
urements,and the station was abandoned on October 1 3 . T he record
is chiefly of interest in connection with S lopemeasurementsof MohawkRiver
,described elsewhere (p .

64 OPERAT IONS AT RIVER S T AT IONS , 1900.
— PART 1 . [NO . 47 .
Da i ly gage height, in feet, of S choha rie Creek a t Erie Cana l aqueduct , New York
for 1 900 .
June . July Aug . S ept . Oct . May . June . July . Aug . S ept
- Q
- r
SCHOHARIE CREEK AT MILL POINT,NEW YORK
T he current-meter station was established at the Mill Point highway bridge on July 5 , 1 900, by Prof . E. D . Walker . T he stream bec
’
is stony and fa irly permanent . T he channel is of nearly constanwidth at all stages of the stream. T he following current-meter measurements were made by Professor Walker
July 5 : Gage height , foot ; discharge , 87 second-feet.
August 22 : Gage height , foot ; discharge ,1 4 1 second-feet .
Da i lygageheight, in feet, Of S choha rie Creek a t M i ll Point, New York, for 1 900.
July . Aug . S ept . Oct . Nov . Dec . July . Aug . S ept . Oct . Nov .
SCHOHARIE CREEK AT S CHOHARIE FALL S,NEW YORK .
A dam and power plant have been erected by the EmpiP ower Company ,
of Amsterdam,New York , at S choharie
miles fromAmsterdam. T he dam is Of masonry ,backed with
It has a flat crest , nearly level , 380 feet long, 1 footon the upstream face Of approximately 24 to 1 . Tpleted early in the summer of 1 900
,and a record of the depth
flowing over the ma in Spillway was kept by the engineers of
pany from July 1 8 to December 31 . Some further data are

66 OPERAT IONS AT RIVER S TAT IONS , 1 900.
— PART I . [No . 47.
remained under his supervision until October 1 , 1 900 . A descriptionof this station is conta ined in Water- Supply Paper NO . 35
, page 55 .
T he following cur rent—meter measurements were made by ProfessorWalker
April 3 , 1899 : Gage height , feet ; discharge , second -feet .
May 26 , 1899 : Gage height , feet ; discharge , second-feet .
June 30 ,1899 : Gage height , feet ; discharge , 482 second
-feet .
May 1 2 , 1900 : Gage height , feet ; discharge. second-feet .
July 17 1900 : Gage height , feet ; discharge , 667 second-feet .
August 21 , 1900 : Gage height , feet ; discharge ,976 second-feet.
A rating curve for the cross section at this station has not yet beenprepared ;
Da i ly gage height, in feet, of Mohawk River a t S chenectady ,New York, for 1900 .
Apr . May . Aug .- S ept . Nov . Dec.
n n n n n n n nn n n n n n n n- v - c - n
MOHAWK RIVER AT REXFORD FLAT S,NEW YORK .
This station,which is located at the New York S tate feeder dam
miles below Schenectady ,is described inWater-Supply Paper No . 3
page 57 .
T he accompany ing tables of da ily and monthly mean flow
the amount diverted to the Erie Canal . They therefototal inflow of Mohawk River at this point , whichgreater than the amount which passe
during the season of canal navigation

NEw YORK . 67
the canal has been used . C urrent-meter measurements in the Rex
ford Flats feeder gave the following results :
Current-meter measurements in Rexford F la tsfeeder .
Da te . Hydrographer .
cagdffv
gei
dl
er .
October 27 , 1898 W . D. LockwoodJune 25 , 1900 R . E. Horton
These results were compared with the mean rate of evaporationfrom a water surface
,as determined for severa l years at Rochester , 1
and i t was found that an apparently constant relation existed betweenthe two . T he diversion for the rema ining months of the canal season has been estimated from the observed evaporation ,
as follows :
Estima ted monthlyflow in Rexford F la tsfeeder .
S econd ~feet .
May 200
June 260
July 290
August 270
September 220
October 148
T he flow over the dam— that is,the amount of water passing down
stream from Rexford Flats— compares with the total flow as follows
Table showing rela tion of flow over Rexford F la ts dam to tota l inflow of feeder .
T t l' E
lowgoel
fpw
o a In am In owMonth .
flow. less diversion) .
S econd ~f eet S econd-f eet.
981 761
T he water did not fall below the crest of'
the dam during the . summer of 1 900
,so that it was not possible to make measurements of the
leakage, or a new profile of the crest,which isgreatly needed . During
high water for several days of the year 1 900 the water on the downstream S ide of the dam rose above the crest level and the damwascompletely submerged . Experiments on the flow over a similar sub
merged weir are not available,and the high-water flows have been
taken from the usual discharge curve . On the morning of February1 S ee annual reports of the executive board of the city of Rochester , 1892 to 1899, inclusive .

68 OPERAT IONS AT RIVER S TAT IONS , 1900.
— PART 1 .
1 4,1900, the water atta ined a depth of feet on the crest of the
dam,corresponding to a discharge of second - feet
,or second
feet per square mi le . This is the highest water observed since the
record was started .
During 1 900 the following discharge measurements were made byProf . E. D . Wa lker
,at Freeman’s bridge, 3 miles above the Rexford
Flats gaging stationMay 12 : Gage height , feet ; discharge , second-feet .
July 1 7 : Gage height, feet ; discharge , 667 second-feet .
August 21 : -Gage height , feet ; discharge , 976 second-feet .
Da i ly d ischa rge, in second-feet, of Mohawk River a t Rexford Fla ts, New York,f0 71 898 .
[Dra inage area , square miles ]
- ' l
Da i ly d ischarge, in second-feet, of Mohawk River a t Rexford F la ts, New York, foi
1 899 .
May . June . S ept . Oct . Nov . Dec.
Mean 980

70 OPERAT IONS AT RIVER S TAT IONS , 1 900.
— PART I . [No . 47.
T he record at Dunsbach Ferry was established primarily for thepurpose of checking a system of levelswhich were run for theU nited
States Board of Engineers on DeepWaterways, by D . J . Howell,C . E.
,
who furnished the record to the Geological Survey . No record waskept from April 1 , 1 899, to July 31 , 1 900.
T he drainage area above the station at Dunsbach Ferry issquare miles.
Da i ly gage height, in feet, of Mohawk River near Dunsbach Ferry , New York, for
1 898 .
Mar . Apr . June . Aug . S ept . Oct . Nov . Dec .
Da i ly gage height, in feet, of MohawkRiver near Dunsbach Ferry ,New York
, for1 899 .
Mar .

NEw YORK . 7 1
Dai ly gage height, in feet, of Mohak iver near Dunsbach Ferry , New York, for
1 900.
Aug . Sept . Oct . Nov . Dec . Aug . S ept . Oct . Nov . Dec .
n c - Q n
INDIAN RIVER AT INDIAN LAKE DAM,NEW YORK .
Ind ian River,a tributary of the upper Hudson ,
has a precipitousforested mountain area of 1 46 square miles in eastern HamiltonCounty . In 1 898 a masonry storage damwas built at the foot of
Indian Lake , replacing _
the lumbermen’s dam which was formerlythere
,and raising the level of the artificial lake so formed 23 feet .
T he storage capacityof the present lake is cubic feet,
the area of itswater surface is acres, and the elevation of the
Spillway crest abovemean tide is feet . T he damwas built by a
federation of water-
power userson Hudson River , in cooperation withthe S tate of New York ,
under the direction of Mr . George W . Rafter,
engineer in charge , the primary object being to store flood waters fromthis dra inage area ,
to be turned into the Hudson during the low-water
period of the year , thereby equalizing to some extent the flow of thatstream. Water is also used for sluicing logs during the river drivingseason .
1
S ince July 22, 1 900,a gaging record has been kept at the dam,with
a View to determining the total outflow from this reservoir . T he factsrecorded are the elevation of the water surface in the reservoir
,the
depth of water flowing over the spillway or flashboards,the depth of
opening and the head on themain and subsidiary logways, and the depthof the opening and the effective head on each of the 5 - foot S luice gates.
These data enable a calculation of the outflow fromthe reservoir to bemade , and ,
by comparison with gaging records kept on Hudson Riverat Fort Edward and Mechanicsville
,the effect of storage on the low
water flow of the latter river can be determined .
A meteorological station has been established at the dam by the
United StatesWeather Bureau,and records are kept of the rainfall
,
temperature, etc . T he regimen of flow of Indian River below the
dam is largely artificial,though in the course of a year or more the
total annual run-off of the drainage area will appear in the stream,
1 Engineer ing News, May 18, 1899.
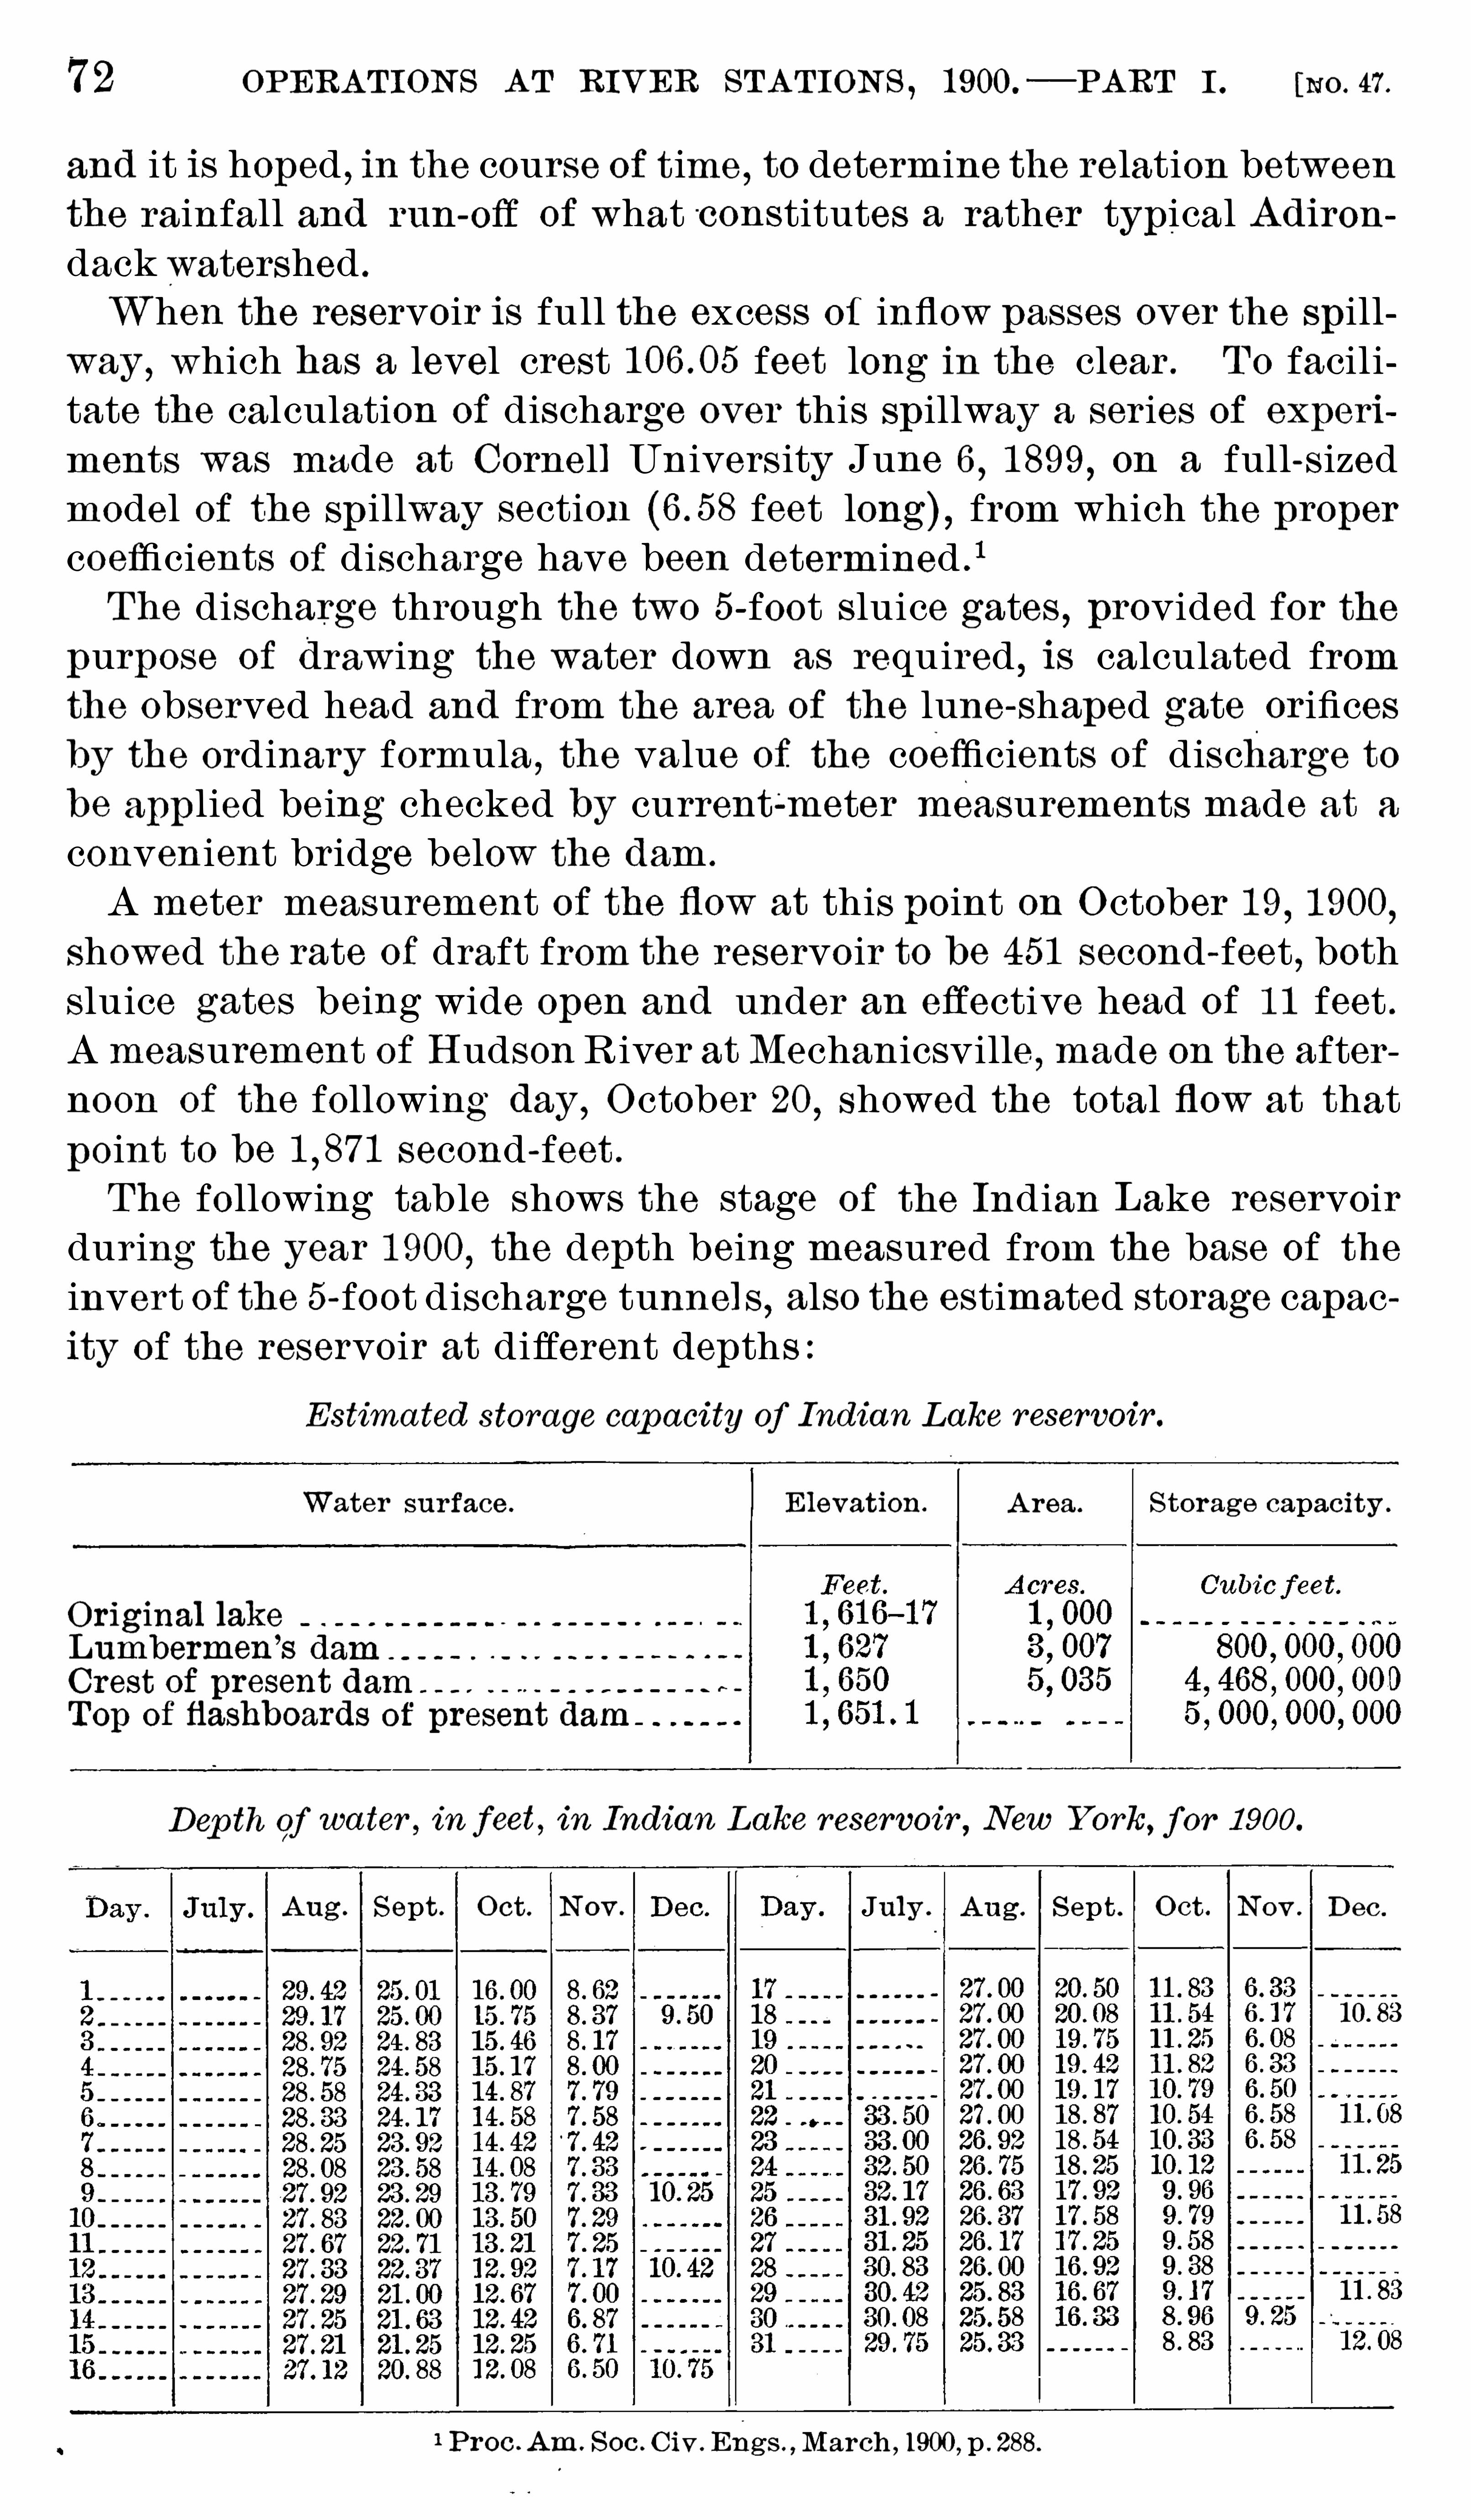
72 OPERAT IONS AT RIVER STAT IONS , 1900.
— PART I . 1116 47.
and it ishoped , in the course of t ime , to determine the relation betweenthe rainfall and run-off of what constitutes a rather typical Adirondack watershed .
When the reservoir is full the excess of inflow passes over the spillway ,
which has a level crest feet long in the clear . T o facilitate the calculation of discharge over this spillway a series of experi
ments was made at Cornell University June 6 , 1 899, on a full-sizedmodel of the Spillway section feet long) , fromwhich the propercoefficients of discharge have been determined .
1
T he discharge through the two 5 -foot sluice gates, provided for thepurpose of drawing the water down as requir
,ed is calculated from
the observed head and from the area of the lune shaped g ate orificesby the ordinary formula ,
the va lue of the coefficients of discharge tobe applied being checked by current meter measurementsmade at a
convenient bridge below the dam.
A meter measurement of the flow at thispoint on October 1 9, 1 900,showed the rate of draft fromthe reservoir to be 451 second- feet
,both
sluice gates being wide open and under an effective head of 1 1 feet .Ameasurement of Hudson River at Mechanicsville
,made on the after
noon of the following day , October 20, showed the total flow at thatpoint to be second - feet .
T he following table shows the stage of the Indian Lake reservoirduring the year 1 900, the depth being measured from the base of the
invert of the 5-foot discharge tunnels, also the estimated storage capacity of the reservoir at different depths :
Estimated storage cap aci ty Of Indian Lake reservoir .
Water surface . Elevation. Area . S torage capacity .
Original lakeLumbermen s damCrest of present damT op of flashboards of presentdam
Dep th of wa ter , in feet, in Indian Lake reservoir , New York, for 1 900.
Aug . S ept . Oct . Nov . July . Aug . S ept . Oct . Nov . Dec .
I II :
1 Proc .Am. Soc . Civ . Engs. ,March , 1900, p . 288.

74 OPERAT IONS AT RIVER ST AT IONS,1900.
— PART I .
Da ilydischarge, in second-feet, of S chroon River a t Warrensburg , New York, for1 899 .
[Drainage area , 563 squaremiles ]
Jan. Feb . May . June . Aug . S ept . Oct . Nov . Dec.
- ‘ I~ n 0
Mean 606 478 150 234
Sunday .
Da i ly discharge, in second-feet, of S chroon River a t Warrensburg, New York, for1 900.
July . Aug . Sept . Nov . Dec .
- ¢ n
- n . - fl ‘
- Q
Mean " 528 474 285 488 530
Sunday .

NEw YORK . 75
HUDSON RIVER AT FORT EDWARD,NEW YORK .
Thisstation ,located at the damof the International Paper Company
ras established in 1 895,by George W . Rafter
,member American
lociety of Civil Engineers, i n connection with upper Hudson storage
urveys. . T he damis of timber,on S late rock foundation
,and has but
lttle leakage . T he crest is stra ight , very nearly level , and feet11 length . T he zero of the crest gage stands at the level of the lip of
he dam proper . Flashboards from 15 to 1 8 inches in height are usu,llymainta ined on the dam. A record iskept of the height of the flashioards and of the times of their setting and removal .In the adjoin ing mill there are 62 water wheels
,nearly all of mod
=rn types, which have been tested at the Holyoke flume . A record iscept of the daily run of each wheel , in hours, as well as of the workng head , which usually is 1 9 feet . T he discharge through the tur
) ines is estimated from diagrams expressing theflow as a functionif the working head and the number of wheel-hours run .
In the winter of 1 896— 97 a flood spillway was cut around the southnd of the dam
,over which the water flows whenever it reaches the
evel of the crest of the flashboards. T he profile Of the spillway isfery irregular, and causes some uncertainty in the calculated flowsluring high water .
When the flashboards are Off the flow is computed by means of the
East Indian Engineers’ formula ; 1 when they are on the flow is com) uted by Francis’s well-known formula for sharp-crested weir. Dur
.ng the dry season little water passes over the dam,the entire flow
Jeing employed to drive t he turbines. A current-meter measurenent wasmade at the highway bridge below the dam on July 26 , 1 900,tnd the flow was found to be second - feet .
1 Mullin’s Irrigat ion Mar.aal .

76 OPERAT IONS AT RIVER STAT IONS ,“1900.
— PART I . [No . 47.
Da i ly discharge, in second-feet, of Hudson River a t Fort Edward, New York
, for1 899 .
[Drainage area , square miles ]
June . S ept . Oct . Nov.Dec .
Mean 3 , 527 1 , 347 1 , 033 5 , 098
Sunday . a No record .
Da i ly discharge, in second-feet, of Hudson River a t Fort Edward , New York, for
1 900 .
Nov . Dec .
- O ‘
Mean
* Sunday .

78 OPERAT IONS AT RIVER STAT IONS ,— PART 1 .
Da i lyd ischarge, in second-feet, of Hudson River a t Mechanicsvi lle, New York, for
[Dra inage area , square mi les ]
Jan . Feb . Apr . May . June . Aug . S ept .
Mean
a Discharge August 25 to S eptember 4 approximate , owing to irregular flashboards.
* Sunday .
for 1 899 .
Jan . Feb . June . July . Aug . S ept . Oct .
Mean
S unday .

NEw YORK . 79
Da i ly discha rge, in second-feet, Of Hudson River a tMechanicsvi lle, New York, for
1 900.
Day . Mar .,
June . Oct . Nov . Dec .
Mean
* Sunday .
CROT ON RIVER AT OLD CROT ON DAM,NEW YORK .
Records Of the y ield of the Croton watershed have been preparedby the engineers of the aqueduct commIS S Ion . Tables of the monthlydischarge of the river
,in second - feet
,for the years 1 870 to 1 898, inclu
sive,were printed in the Twentieth Annual Report , Part IV , page 83,
and in the Twenty-first Annual Report , Part IV , page 75 , is a tableof the rainfall and run-OH of the watershed for the years 1 868 to 1 899,inclusive . T he following table, furnished by Mr . W : R . Hill
,chief
engineer of the aqueduct commission,is the record for 1 900 . T he
figures of r ainfall are those obtained at Boyds Corners, in CrotonBasin.

80 OPERAT IONS AT RIVER STAT IONS , 1900.
— PART I .
Estima ted monthly discharge of Croton River a t old Croton dam, New York, for1 900.
[Drainage area , 338 square miles ]
Run-OE.
M onth . Discharge . T otal.P
Rainfall .er square
mile .
Depth,
DELAWARE RIVER AT LAMBERTVILLE,NEW JERSEY .
This station,which was established July 23 , 1 897 , by E. G . Paul
,is
described in Water- Supply Paper No . 35, page 62 . T he results of
measurements for 1 899 will be found in the Twenty-first AnnualReport , Part IV , page 77 During 1 900 the following measurementsof discharge were made by Mr . Paul :
May 22 : Gage height , feet ; discharge , second-feet.
S eptember 27 : Gage height , feet ; discharge , second-feet.
Da i ly gage height, in fect, of DelawareRiver a t Lambertvi lle, New Jersey, for 1 900.
Feb . Mar . May . June . July . Aug . S ept . Oct .
n
a Frozen.

82 OPERAT IONS AT RIVER STAT IONS,1900.
— PART 1 .
Da i ly discha rge, in second-feet, of Tohickon Creek a tPoint P leasant, Pennsylvaniafor 1 884.
Jan. Feb . Mar . Apr . May . June . Aug . S ept . Oct . Nov. Dec
— i
Mean 703 990 25 7 12
Da i ly d ischarge, in second-feet, of Tohickon Creek a t Point Pleasant, Pcnnsylvanifor 1 885 .
Feb . Mar . Apr . May . June . July . Aug'
. S ept . Oct . Nov.
C - Q Q- n n - ~p
Mean C 340 44 7 20 3

PENNSYLVANIA. 83
Da i ly discha rge, in second-feet, of T ohickon Creek a t Point Pleasant, Pennsylvania ,
for 1 886.
July . Aug . Sept . Oct .
Mean 69 9 2 4
Da i ly discharge, in second-feet, Of Tohickon Creek a tPointP leasant , Pennsylvania ,
for 1 887 .
Jan. Feb. Mar . Apr . June . Aug . S ept . Oct. Nov . Dec .
- d
-Q cu

84 OPERAT IONS AT RIVER STAT IONS , 1900.
— PART 1 . 1110 47 .
Da i ly discha rge, in second-feet, of T ohickon Creek a tPointPleasant, Pennsylvania ,
for 1888 .
Feb . Mar . Apr . June . July . S ept . Oct . Nov . Dec .
Mean 556 15 7 499 138
Da i ly discharge, in second-feet, Of Tohickon Creek a tPoint P leasant, Pennsylvania ,
for 1 889.
Jan . Feb. Mar . Apr . May . July . Aug . S ept . Nov .
Mean 389 149 341 264 570 334 317

86 OPERAT IONS AT RIVER ST AT IONS,1900 .
—PART I . [No . 47.
Da i ly discharge, in second feet, of Tohickon Creek a t Point P leasant, Pennsylvania ,
for 1 892.
Jan . Feb . Apr . May . June . July . Aug . S ept . Oct .
Mean 580 433 77 188 65 45 8
Da i ly discha rge, insecond-feet, of Tohickon Creeka t Point Pleasant, Pennsylvania ,
for 1898 .
Jan . Feb . Mar . Apr . May . June . Oct . Nov. Dec .
Q Q Q Q Q Q QQQ Q Q Q Q QQ
o n .. - u .
— A \_
Mean 333 55

PENNSYLVANIA. 87
Da ily discharge, in second fcct, of Tohickon Creek a tPointP leasant, Pennsylvania ,
for 1 894.
Jan. Feb . Mar . Apr . May . June . July . Sept . Oct . Nov. Dec .
Mean 373 275 209 760 49
Da i ly discharge, in second-feet, Of Tolj
is
ickon Creek a t Point Pleasant, Pennsylvania ,
or 1 895 .
Jan . Feb . Mar . Apr . May . June. July . Aug. S ept . Oct . Nov. Dec .
—tn — _ tfi

88 OPERAT IONS AT RIVER S TAT IONS,1900.
— PART I . [No . 47.
Dai ly discharge, in second-feet, of T ohickon Creek a t Point P leasant, Pennsylvania ,
for 1896 .
Jan.
'
Feb . Mar . Apr . May . July . Aug . Oct. Nov. Dec.
Mean 435 486 67 27 16 225 16 102 94
Da i ly discharge, in second-feet, Of T ohickon Creek a tPointPleasant, Pennsylvania ,
for 1 897 .
- Day . Jan . Feb . Mar . Apr . May . June . July . Aug . S ept . Oct . Nov . Dec .
- ‘ O D - u O .

90 OPERAT IONS AT RIVER S TAT IONS , 1900.
— PART I . [No . 47.
NESHAMINY CREEK,PENNSYLVANIA
,BELOW THE FORKS .
This station,which was established in 1 884
,is described in the
Twentieth Annual Report , Part IV , pages 1 03 and 1 04 . T he samereport contains also (pages 1 04 to 1 08) the figures for monthly flow forthe years 1 890 to 1 898 , inclusive, as well as diagrams of discharge forthe same period . Water-Supply Paper NO . 35 conta ins
,on page 65 ,
a table Of daily discharge for 1 899. T he resultsby months and a d ia
gram Of the da ily discharge for that year are given on page 86 Of the
Twenty -first Annual Report , Part IV . T he following tables give thedaily d ischarge of this stream from 1 884 to 1 900
,inclusive .
Da i ly discharge, in second-feet, of Neshaminy Creek,Pennsylvania ,
below the forks,for 1 884.
[Drainage area , square miles ]
Day . June . July . Aug . S ept . Oct . Nov . Dec . Day . July . Aug . S ept . Oct . NOV . Dec .
Q Q Q Q Q Q Q Q Q Q Q
r
. I - 0 Q
Da i ly discharge, in second-feet, of Neshaminy Creek, Pennsylvania , below theforks,for 1 885 .
Feb . Mar . Apr . May . July . Aug . S ept . Oct . Nov . Dec .
Q


92 OPERAT IONS AT RIVER S TAT IONS,1900.
— PART I . [No . 47.
Da i ly discharge, in second-feet, of Neshaminy Creek,Pennsylvania ,
below theforks,
Jan . Feb . IMar . Apr . May . June. July . Aug . S ept . Nov. Dec .
— fi
Mean 592 850 64 25
Da i ly discha rge,in second feet, of Neshaminy Creek, Pennsylvania , below theforks,
for 1889.
Jan . Feb . Mar . Apr . May . June . July . Aug .

94 OPERAT IONS AT RIVER S T AT IONS , 1900.
— PART I . [No . 47.
Da i ly discharge, in second-feet, of Neshaminy Creek,Pennsylvania , below theforks,
for 1 892 .
J an . Feb . Mar . Apr . May . July .
_Aug . S ept . Nov . Dec .
Mean 627 125 431 66 24
Da i ly discha rge, in second-feet, of Neshaminy Creek ,Pennsylvania , below theforks,
for 1 893 .
Feb . Mar . May . June . Oct . NOV . Dec .
- n
n n a
Mean 661 358

PENNSYLVANIA. 95
(Da i ly discharge, in second-feet, of Neshaminy Creek, Pennsylvania ,below theforks,
for 1 894 .
Feb . Mar . May . June . Oct . NOV . Dec .
Mean 37 895
Da i ly discharge, in second-feet, of Neshaminy Creek;>Pennsylvania , below theforks,for 1 895 .
Feb . Mar . Apr . June . Aug . S ept . Oct . Nov . Dec .
-n “
Mean 237 515 7 10
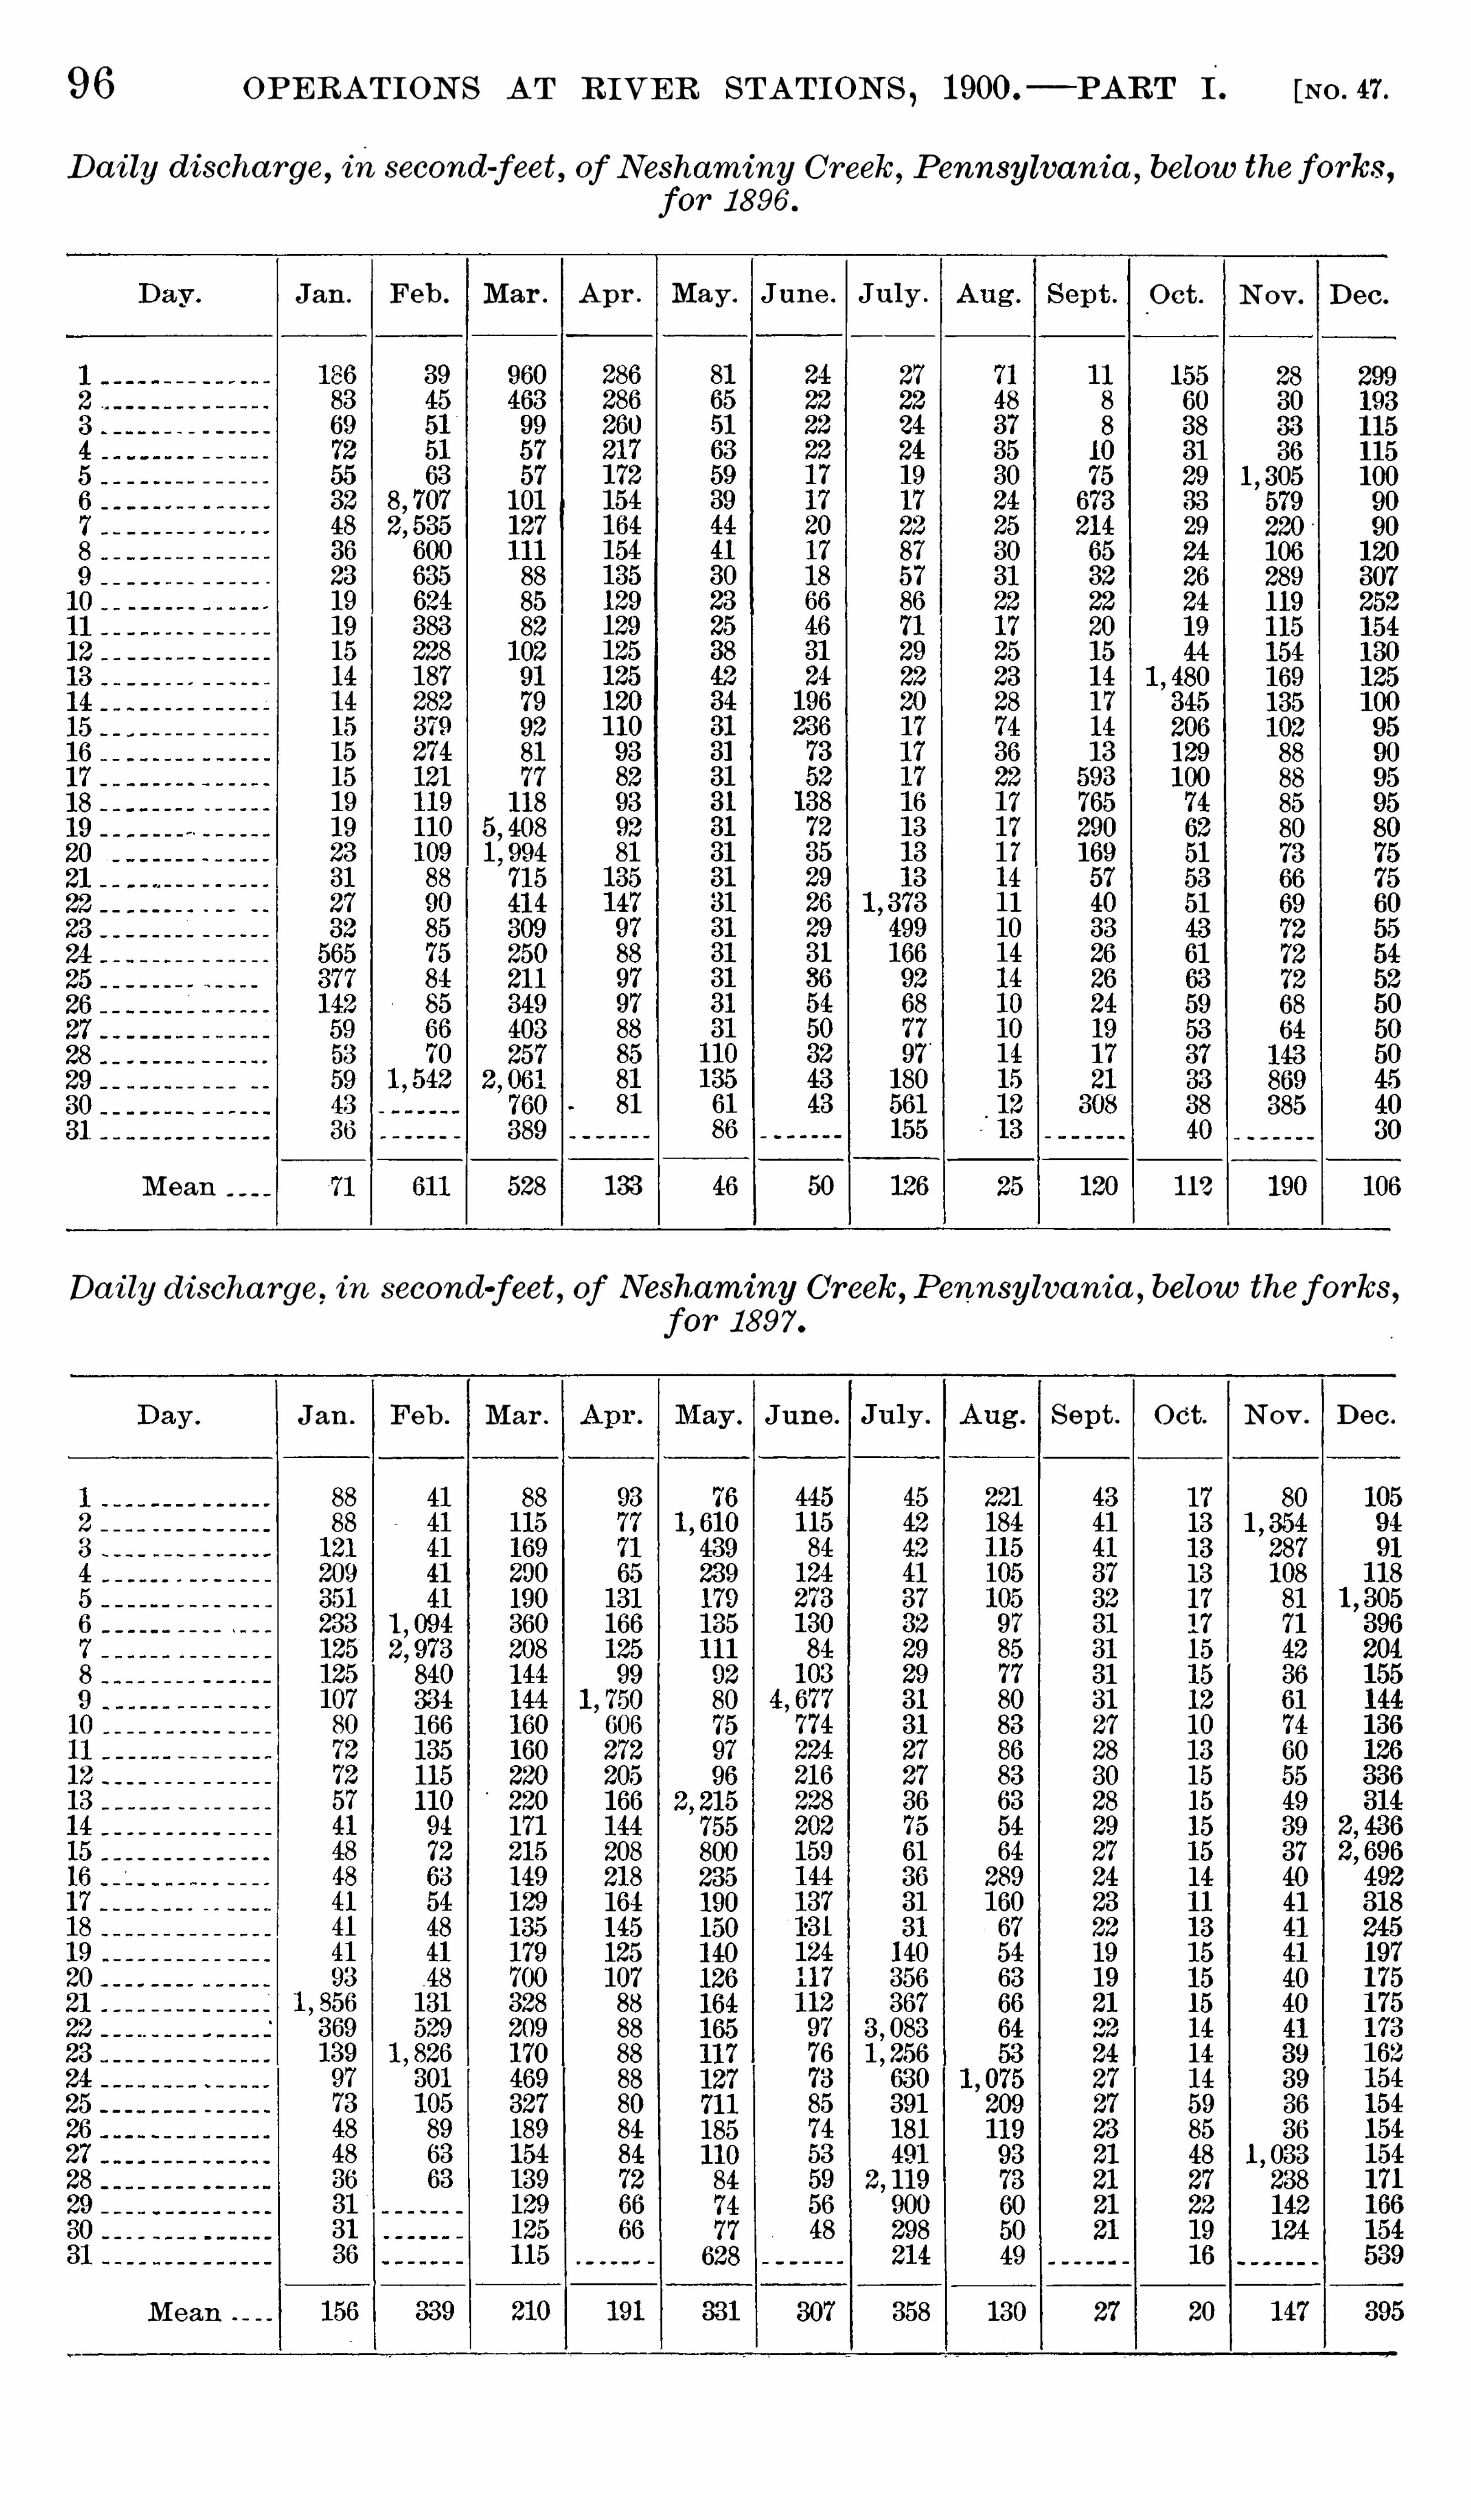
96 OPERAT IONS AT RIVER S T AT IONS , 1900.
— PART I. [No . 47.
Da i ly discha rge, insecond-feet, of Neshaminy Creek, Pennsylvania ,below theforks,
for 1 896 .
Jan . Feb . Mar . Apr . May . June . July .
_
Oct . Nov. Dec .
- q
Mean 528 133 50 1 12
Da i ly discha rge, in second-feet, of Neshaminy Creek, Pennsylvania ,below theforks,
for 1 897 .
Jan . Feb . Mar . June . S ept . Oct. Nov . Dec .
Mean 27 20

98 OPERAT IONS AT RIVER ST AT IONS , 1 900.
— PART I . [No . 47 .
Da i ly discharge, in second-feet, of Neshaminy Creek, Pennsylvania , below theforks,for 1 900.
Jan . Feb . Mar . Apr . May . June . July . Aug . S ept . Oct . Nov . Dec .
— n —n
1 731941 82 725188 431
2 302 209533 205521 224
228213
339 201322 176379 154
135566 1 15
358 105340 105191 147142 176142 1541 73139 457
214
L, 8G5 1 75930 139463 1 73338 1 15355 101
375 1 89
1461 16105
hi eami 378
PERKUMHEN CREEK AT FREDERHflQPENNSYLVANLM
Measurements Of this creek were begun On August 20, T he
station is described in the Twentieth Annual Report , Part IV , pages
89 and 90,followed by tables Of monthly flow for the years 1 890 to 1 899,
inclusive . Water-Supply Paper NO. 35 conta ins tables Of the dailydischarge for the entire period from 1 884 to 1 899
,inclusive . Dia
grams Of da ily discharge , constructed from these tables, were published in the Twenty -first Annual Report , Part IV , pages 79 and 80
and figures for the monthly flow for 1 899 on page 78 Of that report .
T he following records Of daily discharge for 1 900 are furnished byMr . John E. Codman ,
hydrographer Of the water department Of
Philadelphia .

PENNSYLVAN IA. 99
Da i ly discharge, in second-feet, of Perkiomen Creek a t Frederick, Pennsylvania ,
for 1 900.
Jan . Feb . July . Aug . S ept . Oct. NOV . Dec.
Mean
[Continued in Water-Supply Irrigation Paper NO .


VVAT ER S U P P LY AND IRRIGAT ION PAPERS .
Pumping waterI
fOr Irrigration ,
“
by Herbel t MI
. Wilson, 1896 .
2 . Irrigation near Phoenix,Arizona , byArthur P . Davis, 1897 .
Sewage irrigation, by GeorgeW. Rafter ,1897.
4. A reconnoissance in southeasternWashington, by Israel C. Russell , 1 897.
5 . Irrigation practice on the Great Plains, by E. B . Cowgill , 1 897 .
I
'
U nderground waters of southwestern Kansas ,by ErasmusHaworth ,1 897 .
7 . S eepage waters of northern U tah ,by samuel Fortier , 1897.
8 . Windmills for irrigation ,by E. C . Mui phy ,
1897.
Irrigation near Greeley , Colorado , by David Boyd , 1 897.
10. Irrigation in Mesilla Valley , NewMexico, by F .C . Barker , 1898.
River heights for 1 896 , by Arthur P . Davis, 1897.
Underground Waters of southeastern Nebraska , by N . H. Darton , 1898.
13 . Irrigation systems In T exas, by W. F . Hutson ,1 898.
New testsof pumpsandwater liftsused In irrigation,byO. P . Hood , 1898.
1 Operations at river stations, 1 897, Parts I II, 1898.
1 7. Irrigation near Bakersfield, California ,by C . E. G Iunsky , 1 898.
18. Irrigation near Fresno , California , by C . E. Gransky,1898 .
Irrigation near Merced , California , by C . E. Grunsky ,1 89E)
I
.
20. Expei imentswi th windmills, by T homas 0 . Perry ,1899.
21 . Wells Of northern Indiana , by Frank Leverett , 1899.
22. S ewage irrigation ,Part II , by GeorgeW . Rafter , 1 899.
23 . I’Vater- 1 ight problems Of Bighorn Mountains,by Elwood Mead
,1 899.
. Wa er resourcesOf the S tateOfNewYOrk , Par ,tsI II , b .yG W. Rafter18
26. Wellsof southern Indiana ( continuation Of NO by FrankLeverett , 1
27, 28. Operations at rivei stations, 1898 , PartsL II, 1899.
29. Wellsand windmills in Nebraska , by Erwin Hinckley Barbour , 1899.
30. Water resourcesof the lower peninsula of Michigan, byAlfred C . Lane,
31 . Lower Michiganmineral waters, by Alfred C . Lane,
32. Water resources Of Porto Rico ,by H .M .Wilson, 1 900.
33. S tmage ofWater on G i a River ,Arizona ,by J . B . Lippincott , 1 900.
34 . Geology and water resources of southeastern S . Dak . ,by J . E. TOdd ,
3 ) —39. Operations at I iver stations, 1899, Parts I- V , 1900.
40. T heAustin dam, by T homas U . T aylor , 1900.
4 1,4s. T he windmill : i ts efficiency and use , Parts I , II , by
I
E. c . Murphy , ,
1901
43. Conveyance of water in irrigation canals, etc. , by S amuel Fortier , 1901 .
44. Profiles of rivers, by Henry Gannett , 1901 .
45. Water storage on Cache ( reek , California , by Albert E. Chandler, 1901.46. Reconn. ofKern and
‘ruba rivers, Cal. , .byF H. Olmsted andM.Manson
,19
47—52. Operationsat river stations, 1 900, Parts I—VI , 1 901 .
Other papers are in variousstagesof preparation. PrOViS i
printing these by the following clause in theI
sundry civil a
tions for the year 1 896- 97
Provided , T hat hereafter the reports OfI
the Geological Sur
demands,such as to‘
have all Of the seriessent.Application for these papei s should bemade either tomembers0
THEDIRECTOR, UNITEDSTATES GEOLOGICAL SURVEY, _
I
WA

/5’I 4 g .
DEPAR T MEN T OE TR E INTER I OR
OF THE
UNITEDSTATES GE
OPERAT IONS AT RIVER STAT ioNS , 1900.—PART II
WASHINGTONGOVERNMENT PRINT ING"OFFICE
1 9 O1

IRR IGAT ION”
REP ORT S .
T he following list contains titles and brief ,descriptions Of the principal reports
relating to water supply and irrigation prepared by the U nited S tatesGeological
Survey since 18901 8 9 0 .
First Annual Report of the U nited S tates Irrigation Survey , pp.
Printed as Part II , Irriga tion , Of the T enthAnnual Report of the U nited S tates GeologicalS urvey , 1888—89. Contains a statement of the origin of the Irrigation Survey , a preliminaryrepor t on the organizat ion and prosecut ion of the survey of the arid lands for purposes ofirrigation, and repor t of work done during
1 8 9 1 0'
SecondAnnual Report Of the U nited S tates Irrigation Survey, 1891 ; octavo , 395 pp.
»
PublisheGeologicaland Of the
statement
190 figures.
BulletinsOf the Eleventh Census of the U nited S tates upon
F . H . Newell ; quarto .
NO. 35 , Irrigation in Arizona ; No. 60, Irrigation in
Irrigation in U tah ; NO. 1 07 , Irrigation in Wyoming ;Montana ; NO. 1 57 , Irrigation in Idaho ; No. 1 63 , Irrigati
Irrigation in Oregon ; No. 193 , Artesian wells for irrigation ;tion in Washington.
1 8 9 2 .
Irrigation of western U nited S tates, by F. H . Newell ; extra censusSeptember 9 , 1892 ; quarto, 22 pp.
With a
ustrated b
1 8 9 3 .
T hirteenth Annual Report of the U nited S tates Geological Survey , 1891—92, PIII, Irrigation , 1893 ; octavo, 486 pp.
F. H. Newell ;“Ameri
Survey ; price, 1 5 cents.
Contains a description of the examination of the geolo'
c Structure in and adjacenthe dra inage hasmof Yakima River and the great plains o the Columb ia to the east ofarea , wi th special reference to the occurrence of artesian waters.
1 8 9 4 .
Report on agriculture by irrigation in the western part Of the United S tates atEleventh Census, 1890, by F. H . Newell , 1894 ; quarto, 283 pp.
parts; Part II , Accompanying papers, 1894 ; potavo , 597pp.
Contains papers on“Potable waters of the eastern U nited S tates,
” by W J McGee;Naturalmineral watersof the United S tates,” byA. C . Peale ; Resultsof streammeasurevments,
” by F. H. Newell. Illustrated by maps and diagrams.
mm48 (Continued on third page ercOver. )


UNITED STATES GEOLOGICAL SURVEY
CHARLES D. WALCOT T , DIRECT OR
OPERA TIONS AT RIVER ST A TIONS,1900
AREPORT OF THE
DIVISIONOFHYDROGRAPHY
OF T HE
UNITED STATES / GEOLOGICAL SURVEY
P A R T I I
WASHINGTONGOVERNMENT PRINT ING OFF ICE
1 9 0 1


1 06 CONT ENT S
Measurements at river stations— Continued .
Savannah River near Calhoun Falls, South Carolina
Savannah River at Augusta , Georgia
Broad River (Of Georgia ) near Carlton , Georgia
Oconee River near Dublin , Georgia
Yellow River at Almon , Georgia
T owaliga River near Juliette , Georgia
Ocmulgee River at Macon , Georgia
Flint River at Albany , G eorgia .
Flint River at Woodbury , Georgia
Chattahoochee River at Oakdale , Georgia
Chattahoochee River at West Point , Georgia
Etowah River at Canton , G eorgia
Coosawattee River at Carters, Georgia
Oostanaula River atR esaca , G eorgia
Coosa River at Rome, Georgia
Coosa River near Riverside ,Alabama
Coosa River at LocksNos. 4 and 5 , Alabama
T allapoosa River near Susanna ,Alabama
T allapoosa River near S turdevant ,AlabamaT allapoosa River near Milstead ,
Alabama
Alabama River at Montgomery ,Alabama
Alabama River at S elma ,AlabamaBlackWarrior River at T uscaloosa ,Alabama
BlackWarrior River near Cordova ,AlabamaHillabee Creek near Alexander City ,Alabama
T alladega Creek at Nottingham,Alabama
Big Sandy Creek near Dadeville,Alabama
T ombigbee River at Columbus, MississippiT ombigbee River near Epes,Alabama
Youghiogheny River at Friendsville , Maryland
Cheat River near U neva ,West Virginia
New River at Radford, Virginia
Greenbrier River at Alderson ,West Virginia
North Fork Of New River at Weaversford , North Carolina
South Fork of New River -at New River , North Carol ina
New River near Oldtown , Virginia
New River at Fayette ,West Virginia
South Fork Of Holston River at Bluff City ,T ennessee
Watauga River at Butler ,T ennessee
Roan Creek at Butler ,T ennessee
Elk Creek at L ineback ,T ennessee
Nolichucky River near Chucky Valley ,T ennessee
French Broad River near Asheville , North Carolina
French Broad River at Oldtown ,T ennessee .
Pigeon River at Nep rt , T ennessee
T uckasegee River a t Bryson , North Carolina
L i ttle T ennessee River at Judson, North Carolina
Hiwassee River at Murphy , North Carolina
Hiwassee River at Reliance ,T ennessee
Hiwassee River at Charleston ,T ennessee
T occoa River near Blueridge , Georgia
T ennessee Riverat Knoxville ,T ennessee
T ennessee River at Chattanooga , T ennessee

OPERATIONS AT RIVER STATIONS,1900.
P AR T I I .
DIEAS U REMEN T S AT RIVER S T AT ION S J
W ISSAHICKON CREEK NEAR PHILADELPHIA,PENNSYLVANIA.
This station is described in the Twentieth Annua l Report , Part IV ,
) age 94 , followed by tables Of monthly flow for 1 897 and 1 898 . In
Water-Supply Paper NO . 35, page 74 , will befound the figures for the
laily discharge for 1 899, ending with June 5 , when the Observationsvere discontinued temporarily ,
and were not again resumed until[uly 1 , 1 900. T he figures for monthly flow for 1 899 and diagrams Of
laily discharge for the entire period Of Observation ( 1 897 to 1 899,
.nclusive) will be found in the Twenty -first Annual Report , Part IV ,
) ages 81 and 82 . T he following tables conta in the figures for the da ilylischarge fromwhich the diagramswere constructed ,
aswell as thosefor 1 900, diagram for which is not yet
'
plotted .
Da i ly discharge, in second-feet, of W'
issahickon Creek near Phi ladelphia ,Penn
sylvania , for 1 897 .
[Drainage area , square miles ]
June . NOV .
Mean 204 147
1 Continued fromWater-Supply and Irrigation Paper No . 47.

1 08 OPERAT ION S AT RIVER STAT IONS , 1900.
— PART II . [No . 48 .
Da i ly discha rge, in second-feet, of Wissahickon Creek near Phi ladelp hia , Pennsyl
vania, for 1 898 .
J an . Feb . June . July . Oct .
I
NOV . Dec .
- n
- 0
—n
Mean 1 10 43 1 11 28
Da i ly discharge, in second-feet, of Wissahickon Creek near Phi ladelphia , Pennsylfi
vania , for 1 899.
Jan. Feb . Mar . Apr . May . Jan . Feb . Mar . Apr . May . June.
—'o

OPERAT IONS AT RIVER ST AT ION S , 1900.
— PART II . [N0 o 48.
T ota lmonthly yield of S chuyki ll River above Phi ladelphia , Pennsylvania .for 1 900.
Month . Yield . Month . Yield .
Cubic f eet .January 6 , 610, 500 , 000 JulyFebruary 33 , 771 , 128 , 000 AugustMarch S eptember
5 , 730, 472 , 000 October978, 000June 2 , 743 , 671 , 000 December
NORT H BRANCH OF SU SQU EHANNA RIVER AT W ILKESBARRE,PENN
SYLVANIA .
This station,which was established by E. G . Paul March 30
,1 899
,
is described in Water - Supply Paper No . 35, page 76 . T he results Of
measurements for 1 899 w ill be found in the Twenty -first AnnualReport , Part IV , page 88 . A bench mark was established September26
,1 900
,being the extreme west end Of the stone doorsill Of the north
entrance to the Coa l Exchange Building, at feet above datumOf the gage . During 1 900 two measurements Of discharge were madeby Mr . Paul
,as follows .
May 20 : Gage height , feet ; discharge , second-feet .
September 26 : Gage height , feet ; .discharge , 961 second-feet.
T he measurement of September 26 wasmade at Retreat , Pennsylvania ,
1 0 miles below W ilkesbarre .
Da i ly gage height, in feet , of North B ranch of Susquehanna River a t Wi lkesba rrePennsylvania , for 1 900 .
Jan. Feb . Mar . Apr . May . June . July . Aug .
a Ice backed water at gage .

PENNSYLVAN IA. 1 1 1
BRANCH OF SU SQU EHANNARIVER AT DANVILLE ,PENNSYLVANIA.
This stat ion,which was established March 25 , 1 899, by E. G . Paul
,
described in IVater-Supply Paper NO . 35, page 77 T he results Of
easurements for 1 899 will be found in the Twenty -first Annualeport ,
‘
Part IV, page 89. A bench mark was established
,being the
xtreme south end Of the stone doorsill at the east entrance Of the
ity filtering plant , at feet above datum Of the gage . During900 two measurements were made by Mr . Paul
,as follows
May 20 : Gage"
height , feet ; discharge, second-feet.
September 25 : Gage height , foot ; discharge, 822 second-feet .
a i ly gage height, in feet, of North Branch of S usquehanna River a t Danvi lle
Pennsylvania , for 1 900 .
Feb . . Mar . Apr . June . July . Aug . S ept . Oct . Nov . Dec .
a River frozen .
WEST BRANCH OF SU SQUEHANNA RIVER AT ALLENWOOD,PENN
SYLVANIA.
This station,which was established by E. G . Paul March 23
,1 899
,
5 described in Water~Supply Paper NO. 35, page 78 . T he results Of
neasurements for 1 899 will be found in the Twenty -first Annua lReport , Part IV , page 90 . A bench mark was established on Septem)er 24
,1 900 . It consists Of a copper bolt set in the capstone Of the
wing wall on the lower side Of the west end Of the bridge , and is
feet above datum Of the gage . During 1 900 two measurements»f discharge were made by Mr . Paul
, as followsMay 1 9 : Gage height , feet ; discharge, second-feet.
September 24 : Gage height , feet ; discharge , 5 1 1 second-feet.

1 1 2 OPERAT ION S AT RIVER ST AT IONS , 1900.
— PART II . [No . 48 .
Da ily gage height.“in feet, of west B ranch of Susquehanna River a t Allenwood ,
Pennsylvania , for 1 900.
Mar . June . Aug . S ept . Oct . Nov . Dec .
n n n n n n n n
- u —w - o n v
JUNIATA RIVER AT NEWPORT ,PENNSYLVANIA.
T his station ,which was established March 21
,1 899
,by E . G . Paul
,
is described in Water- Supply Paper No . 35, page 79. T he results of
measurements for 1 899 will be found in the Twenty-first AnnualReport , Part IV , page 91 . T he bench mark is the extreme east end
of the stone doorsill of. the south entrance of Butz’sstore
,on the right
bank,and is feet above datum of the gage . During 1 900 two
measurements of discharge were made by Mr. Paul , as follows :
May 1 7 Gage height , feet ; discharge ,second-feet.
September 22 : Gage height , feet ; discharge , 4 18 second-feet.

1 1 4 OPERAT IONS AT RIVER S T AT IONS , 1900.
— PART II . [No . 48 .
Da i ly gage height, in feet, of S usquehanna River at H a rrisburg ,Pennsylvania ,
for 1 900 .
Jan . Feb.
‘May . June . July . Aug .
o
MISCELLANEOU S D ISCHARGE MEASU REMENT S IN PENN SYLVANIA.
.During the year 1 900 the following measurements of the Pennsyl
van ia Canal and of Lehigh River were made by E. G . Paul :
M iscellaneous discha rgemeasurements in Pennsylvania during 1 900.
Date . S tream. L oca lit y .
1 900.
May 1 6 Pennsylvania Canal HarrisburgMay 1 8 do
September 21 do
May 1 8 _do S teelton
September 23 - do
May 1 8 _do HighspireSeptember 23 : ~ do _do
S eptember 26 _ do Nanticoke
S eptember 27 _ Lehigh River Easton , G lendon Bridge

MARYLAND AND \VES T VIRG IN IA. 1 1 5
PATAPSCO RIVER AT WOODST OCK ,MARYLAND .
This station ,which was established August 6 , 1 896 , by E . G . Paul ,
is located at \the county bridge on the road fromWoodstock to Gran
ite,Maryland , 1% miles below the junction of the North B ranch . It
is described in Water-Supply Paper No . 35, page 83
,where will a lso
be found the gage heights for 1 899 . T he d ischarge measurements for1 899were published in the Twenty-first Annual Report , Part IV , page
94 . During 1 900 thefollowingmeasurementsweremade by Mr . PaulJune 29 : Gage height , feet ; discharge ,
1 65 second-feet .
S eptember 29 : Gage height , feet ; discharge , 1 52 second-feet .
Da i ly gage height, in feet , of Pa tapsco River a t Woodstock , Ma ryland,for 1 900 .
Apr . May . June . July .
a No record for December . bJune 16 to 30, no read ings; ga ge broken .
NORTH BRANCH OF PO'
T OMAC RIVER AT PIEDMONT,WEST V IRGINIA .
This station,which was established January 27 , 1 899, by E. G . Paul
is located at the highway bridge connecting Luke , Mary land , withP iedmont
,West V irginia . It is described in Water - Supply Paper
No . 35, page 84 , where will be found gage heights and d ischargemeas
urements for 1 899. During 1 900 the followingmeasurements weremade by Mr . Paul
February 22 : Gage height , feet ; discharge , 735 second-feet .
June 20 : Gage height . feet ; discharge , second- feet.
S eptember 12 : Gage height , feet ; discharge , 34 second- feet .
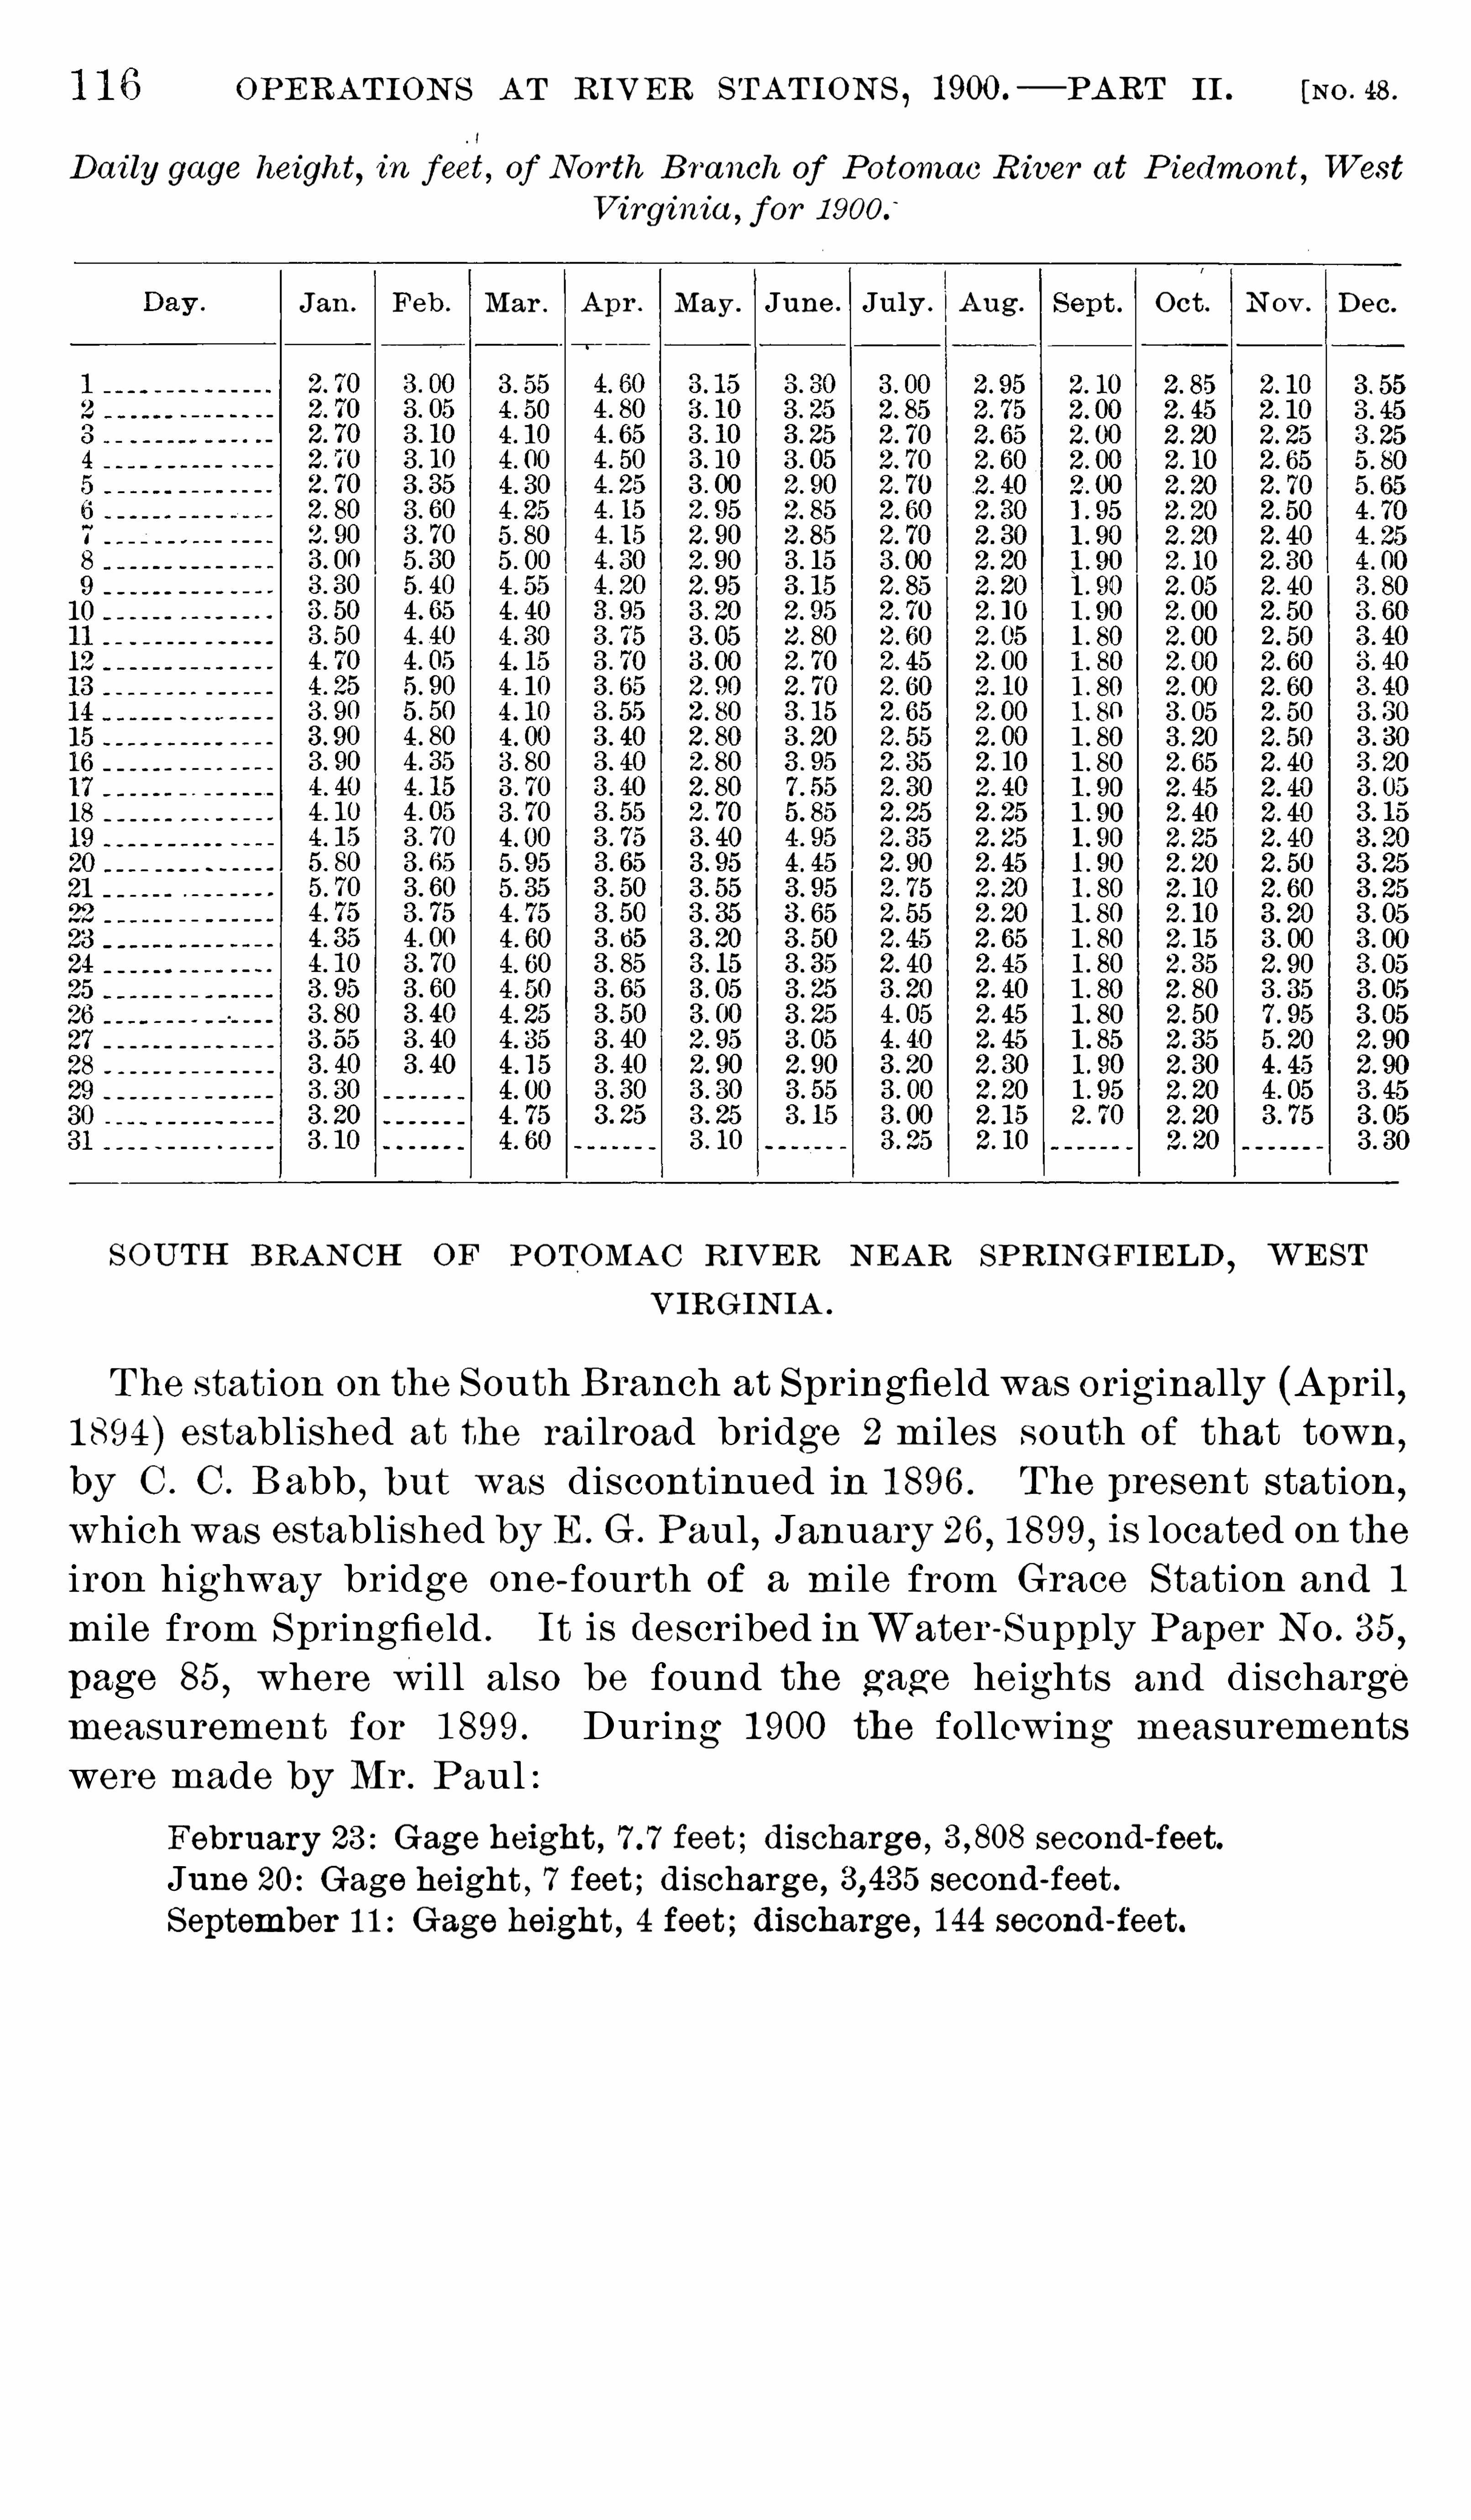
OPERAT IONS AT RIVER S TAT IONS,1900 .
— PART I I . [No . 48 .
Da i ly gage heigh t, in feet, of North B ranch of Potomac River a t Piedmont,West
Virginia , for
Jan . Feb . Mar . Apr . May . June . July . Aug . Oct . N ov . Dec .
- D
- u
- c
— p
- o
SOU TH BRANCH OF POT OMAC RIVER NEAR SPRINGFIELD,WEST
VIRGINIA .
T he station on the South Branch at Springfield wasoriginally (April ,1 894 ) established at the ra i lroad bridge 2 mi les south of that town
,
by C . C . B abb, but was discontinued in 1 896 . T he present station
which was established by E. G . Paul,January 26 , 1 899, is located on the
iron highway bridge one- fourth of a mile from Grace S tation and 1
mile from Springfield . It is described inWater -Supply Paper No . 35,
page 85,where Wi ll also be found the gage heights and discharge
measurement for 1 899 . During 1 900 the following measurementswere made by Mr . Paul :
February 23 : Gage height , feet ; discharge , second-feet.
June 20 : Gage height , 7 feet ; discharge , second-feet .
September 1 1 : Gage height , 4 feet ; discharge , 1 44 second-feet.

OPERAT IONS AT RIVER S TAT IONS , 1900.
— PART II . [w e
Da i ly gage height“,in feet , ofAntietamCreek near S harp sburg ,
Maryland , for 1 906
Dav .
" ‘ Mar . May . June . July . Aug . S ept ; “Nov .
u a o o
. 0
O O O O O O O O O O O O O O
NORTH AND SOU TH RIVERS AT PORT REPU BLIC ,VIRGINIA
These sta tionswere established inAugust, 1 895 . They are describe¢in Water-Supply Paper No . 35
, page 86,where records of past mea
urements will be found . Both stationswere discontinued on April1 899 .
NORTH BRANCH OF SHENANDOAH RIVER NEAR RIVERT ON,VIRGINI
This station,which was established June 26
,1 899
,by Arthur
Davis,is about 2 mi les northwest of Riverton . It is described
Water-Supply Paper No . 35, page 88, where will be found records
discharge measurementsmade during 1 899. During 1 900 the folloing measurementswere made by E. G . Paul
February 13 : Gage height , feet ; discharge, 645 secondefeet.June 18 : Gage height, feet; discharge , second-feet.
September 10 : Gage height , feet ; discharge, 1 46 second-feet .

VIRGIN IA. 1 1 9
Dai ly gage height, in feet, of North Branch of S henandoah River nea r Riverton ,
Virginia , for 1 900.
Mar . Ap r . May . June . July . Aug . S ept . Oct .
- n - 0 0
o o o o o o o o o o o o o o
SOU TH BRANCH OF SHENANDOAH RIVER AT FRONT ROYAL,VIRGINIA.
This station was established by Arthur P . Davis on June 26,1 899.
[t is described inWater-Supply Paper No . 35, page 89, where will also
be found record of discharge measurement made in 1 899 . During1900 the followingm
'
easurements were made by E. G . PaulFebruary 1 4 : Gage height , feet : discharge, second-feet.
June 19 : Gage height , feet ; d ischarge, second-feet .

1 20 OPERAT IONS AT RIVER S TAT IONS , 1900.
—'
PART I I . (Ne w.
Da i ly gage height, in feet, of S outh B ranch of S henandoah River a t Front Roya l
Virginia , for 1 900 .
Jan . Feb . Mar . Apr . May . July . Aug . S ept . Oct . Nov . Dec .
SHENANDOAH RIVER AT MILLVILLE,WES T V IRGINIA .
Th is station ,which was established April 1 5 , 1 895 , is 4 miles above
the mouth of Shenandoah River . It is described in Water-SupplyPaper No . 35
, pages 90 and 91 . Records of measurements for 1 899
will be found in the Twenty -first Annual Report , Part IV , page 96 .
During 1 900 the following measurementsweremade by E . G . Paul
February 24 : Gage height , feet ; discharge, second-feet.
June 19 : Gage height , feet discharge ,second-feet .
September 15 : Gage height , foot ; discharge , 500 second-feet.

1 22 OPERAT IONS AT RIVER , STAT IONS , 1900.
— PART I I . [No. 48.
of the gage , which was not recorded ,and therefore it has been neces
sary to d iscard the records during those two years— that is,1 896 and
1 897 .
On January 25 , 1 898 , the gage wire was compared with the benchmark ,
and the observations S ince that date have been referred to thisdatum. T he bench mark to which the gage has been referred is a
Copper bolt in a large capstone on the lower wing wa ll of the north
abutment , about 1 0 feet from the north end of the first iron truss and
feet above the datum of the gage. T he length of the cable o i
the wire gage is feet . T he measurements of 1 895 are consid
ered correct within themselves,but there was a difference betweeI
the datum of that gage and'
that of the present standard of footmaking it necessary to deduct that amount from the gage readingsof 1 895 in order to reduce them to the present datum. Tables of thecorrected gage heights and of the discharge measurements computet
'
from them are published herewith .
T he flood discharge of February 23 , 1 897 , is also considered correctand is given in the table of discharge measurements. There is n (
change in the published discharge measurements or the gage heightsfor 1 898
,1 899
,and 1 900
,but they are reproduced here in order t (
bring together all of the records that could be reduced to one standard
Dischargemeasurements of Potomac River a t Point of Rocks, Maryland .
Date . Discharge . Date . Discharg
January 25O Q - n - C o
- C 0 fi
- Q - 0
a O
June 28October 2
-l

MARYLAND. 1 23
Da i ly gage height, in feet,of Potomac River a tPoint of Rocks, Maryland , f or 1 895 .
June . July .
a
Da ily gage height, in feet, of Potomac River a t Point of Rocks, Maryland ,for
Jan. Feb . Mar . Apr . May . June . Aug . S ept . Oct . Nov. Dec .

1 24 OPERAT IONS AT RIVER S T AT IONS , 1900.
— 4PART II . [No . 48.
Da i ly gage height, in feet, of Potomac River a t Point of Rocks, Ma ryland , for 1 899.
Jan . Feb . Mar . May . June . Aug . S ept . Oct . Nov . Dec .
Da i ly gageheight , in feet, of PotomacRiver a t Point of Rocks, Ma ryland , for 1 900.
Jan . Feb . Apr . May . June . July . Aug . S ept . Oc t . NOV . Dec .
“
- n n c o u o
- c

1 26 OPERAT IONS AT RIVER S TAT IONS , 1900.
— PART II . [No . 48.
Da i ly gage height , in feet, of Rock Crecha t Z oologica l Park,District of Columbia ,
for 1 900.
Aug . S ept . Oct . Nov .
APPOMAT T OX RIVER _AT MAT T OAX,V IRGINIA.
This station was established in.August , 1 900, at the crossing of the
Southern Railway ,27 miles southwest of Richmond . T he gage rod
,
which is on the guard ra il of the bridge , is la id off to feet and tenths,graduationsbeing indicated by brassnails. T he zero of the rod isfeet from the west end of the bridge, on the upstreamside . T he outerrim of the pulley is foot from the zero of the rod ; the distancefrom the end of the weight to the pointer on the wire rope is
feet . When the gage reading is 1 foot the water level is feetbelow the top surface of the upper chord of the bridge, upstream Side
,
and at the zero of the gage .
T he river here is straight for a considerable distance above the
station,but there is an abrupt bend about 100 feet below the bridge .
T he river is very narrow,and at the low stage at which the gage was
placed the current velocity is not very well distributed , there beingpractically no current for several feet next to the west bank . It was
possible, however , to secure a good gaging ,and old residents stated
that the river was at the lowest stage it had reached in fourteen years.
T he Mattoax railroad station is located on the west bank of the river,and J . 0 . Carter
,the station agent , is the observer . During 1 900 the
following measurements were made by E. W . Myers
August 25 : Gage height , 1 foot ; discharge ,
-1 96 second-feet .
November 1 : Gage height , foot ; discharge, 1 77 second-feet.

VIRGINIA. 1 27
Da i ly gage height, in feet, of App oma ttox River a t Ma ttoax, Virginia , for 1 900.
Aug . Sept . Oc t . Nov . Dec . S ept . Oct . Nov . Dec.
- 9
o
NORTH (OF JAMES ) RIVER AT GLASGOW,VIRGINIA.
This station ,which was established August 21 , 1 895 , by C . O. Babb
and D . C . Humphreys, is at the East Glasgow county bridge about 1mile above the mouth of the river . It is described in Water-SupplyPaper No . 35
, pages 95 and 96 . Records of measurementsmade in1 899 will be found in the Twenty -first Annual Report , Part IV , page
107 . During 1 900 the following measurements were made by D . O.
HumphreysMarch 5 : Gage height, feet ; discharge , second-feet .
June 26 : Gage height , feet ; discharge ,600 second-feet.
August 4 : Gage height , foot ; discharge, 252 second-feet .
December 19 : Gage height , feet ; discharge , 398 second-feet.
Da ily gage height, in feet, of North (of James) River a t Glasgow,Virginia
1 900 .
Jan . Feb . Mar . Apr . June . July . Oct . Nov. Dec .
- 0
c v .
a Interpo lated .

OPERAT IONS AT RIVER S TAT IONS , 1900 .
— PART I I . [No . 48.
JAMES RIVER AT BU CHANAN ,VIRGINIA.
This station,which was established August 1 8 , 1 895 , by C . C . Babb
and D . C . Humphreys, is located about 20 miles above the mouth of
North'
River and a half mile above the mouth of Purgatory Creek .
It is described in Water-Supply Paper No . 35, page 97 . Records of
measurements for“1 899 .will be found in the Twenty -first Annual
Report , Part IV , page 1 08 . During 1 900 the following measurementswere made by D . C . Humphreys :
March 30: Gage height , feet ; discharge, second-feet .
June 28 : Gage height , feet ; discharge , second-feet .
August 4 : Gage height , feet ; discharge, 523 second-feet .
August 21 : Gage height feet ; discharge , 374 second-feet.
December 20 : Gage height , feet ; discharge, second-feet .
Da ily gage height, in feet, of JamesRiver a t Buchanan ,Virginia , for 1 900.
Mar . Oct . Nov . Dec .
JAMES RIVER AT CART ERSV IL LE,V IRGINIA.
This station ,which was established January 1 , 1 899, by D . C . Hum
phreys, is located at the highway bridge crossing the James at CarterSVille, a half mile from the railroad station and 50 mi les aboveRichmond
,V irginia . It is described in“l ater-Supply Paper No. 35
,
page 98,together with a number of other gages that have been
installed on this river . Records of measurements for the year 1 899

1 30 OPERAT IONS AT RIVER S TAT IONS , 1900.
— PART I I . [Nets
Da i ly gage height, in feet, of J amesRiver a t Holcomb Rock,Virginia , for 1 900 .
Feb . Mar . Apr . May . June . July . Aug . S ep t . Oct . Nov .
- _a - l
- n
c c
ROANOKE RIVER AT ROANOKE ,V IRGINIA.
This station,which was established by D . C . Humphreys, July 1 1 ,
1 896,is located at the edge of the city of Roanoke , on the Walnut
street car line . It is described in Water- Supply Paper No . 36, page
1 07 and record of discharge measurements for 1 899 will be found inthe Twenty -first Annual R eport , Part IV , page 1 1 0. During 1 900 thefollowingmeasurementsweremade by D . C . Humphreys :
March 29 : Gage height , feet ; discharge, 879 second-feet.
May 5 : Gage height , feet : discharge, 298 second-feet .
June 26 : Gage height , feet ; discharge , 639 rsecond-feet .
July 30 : Gage height , foot ; discharge ,1 49 second-feet .
August 21 : Gage height , foot ; discharge , 92 second-feet.
December 1 9 : Gage height , feet ; discharge, 307 second-feet.

VIRGINIA AND NORTH CAROLINA. 1 3 1
Da i ly gage height, in feet, of Roanoke River a t Roanoke, Virginia , for 1 900 .
Mar . Apr . May . June . Aug . S ept . Oct . Nov . Dec .
- ~ h
- Q Q
- 0 '
- A
a Interpolated . bEstima ted ; repairing bridge .
ROANOKE RIVER AT NEAL,NORTH CAROL INA.
This station is described in Water-Supply Paper No . 36, page 1 09.
T he river bed is muddy and is likely to cut. out in seasons of highwater
,and both banks are subject to overflow
,sometimes covering
the flood plain of the river to a depth of 1 0 or more feet and reachingat times a width of nearly 2 miles. T he highest recorded water at
thisstation occurred onMarch 23,1 899
,when the gage reached a height
of 30 feet and the dischargewas probably second-feet ; the lowestrecorded water was fromSeptember 1 9 to 22 , 1 897 , when the gage read
and the discharge wasprobably second- feet,making themax
imum flow 4 13 times theminimumflow . T he drainage area above thestation is square miles, largely forest covered and including a
variety of topographic forms, from the mountains of the upper partof Dan and S taunton rivers to the extensive swampsto be found along
the lower part of the basin . T he stream issubject to sudden rises and
falls,but the period of high water lasts several days. T he observer
is the bridge watchman ,W . M . Adams
,of Kelford
,North Carolina .
Records of measurements will be found as follows : For 1 896,Eight
eenth Annual Report , Part IV , page'
48 ; for 1 897 , N ineteenth AnnualReport , Part IV , page 1 81 ; for 1 898, T wentieth Annual Report , PartIV , page 1 42 ; for 1 899
,Twenty-first Annual Report , Part IV , page

1 32 OPERAT IONS AT RIVER ST AT IONS, 1900.
— PART II . [No- 48 .
1 1 1 . During 1 900 the following measurements were made by E. WMyers :
February 10 : Gage height , feet ; discharge , second-feet .
April 10 : Gage height , feet ; discharge second- feet .
April 1 1 : Gage height , feet ; discharge, second feet .
April 24 : Gage height , feet : discharge, second-feet.
May 1 1 : Gage height , feet ; discharge, second-feet .
June 30: Gage height , feet ; discharge , second-feet .
August 10 : Gage height, feet ; discharge , second-feet.
November 2 : Gage. height , feet ; discharge second-feet .
Da i ly gage height, in feet , of Roanoke River a t Nea l , North Carolina, for 1 900.
Jan . Feb .
‘
Mar . May . June . July . Aug . S ept . Oct . Nov. Dec.
n n n n n n n n n n n n n n
n
DAN RIVER AT SOU TH BOS T ON,VIRGINIA.
This station ,which was established August 27 , 1 900, by E. W .
Myers, is located in the town of South Boston,V irginia ,
on the
railroad bridge of the Norfolk and Western Railroad which crossesthe river at that place . T he gage rod is la id off on the . downstreamguard rail of the bridge
,the graduations being indicated by brass
nails driven into the rai l . T he zero of the rod is exactly -OVer the
center of the first span from the north end . .of the bridge. T he dis;
tance between the zero of the rod and '
t he outer rim of the pulleyis feet and the distance between the end of the weight and the
pointer on the wire rope is feet . When the gage reading is 1foot the water surface is feet below the top of the head of the
nut on the pin connecting the two tension rods with the lower chordof the bridge, this pin being on the lower side of the bridge and
exactly opposite the zero of the gage . This is a very good station for

OPERAT IONS AT RIVER S TAT IONS , 1900.
— PART II . [No . 48 .
Da i ly gage height, in feet, of S taunton River a t Randolph ,Virginia , for 1 900.
Dec .
n —w v
TAR RIVER AT TARBORO,NORTH CAROLINA.
This station is descr ibed in Water- Supply Paper No . 36, page 1 10.
Extensive sand bars have formed in the channel during periods ofextreme low water
,and they mod ify very materia lly the relation
between the gage height and the discharge at low stages of the river .
T he highest recorded flood was on February 1 1 , 1 899, when the gageheight was 25 feet and the discharge was probably 1 9, 850 second- feet .
T he lowest recorded flow was on November 2, _1 900
,the d ischarge
being 87 second - feet,the maximum flow thus being about 21 8
'
timesthe minimum flow . T he observer is R . H . Williams
,who reads the
gage once a day during ordinary stages of the river,but oftener
during floods. Measurements of discharge are made at the statioand occasionally at the highway bridge crossing the stream abou200 yards above
,as the lower section is sometimes obstructed by raft
of logs. Records of flow during 1 899 will be found in the Twentyfirst Annual Report , Part IV , page 1 1 2 . During 1 900 the followin
measurements“were made by E. W . Myers :
April 1 1 : G age height , feet ; discharge , second-feet .
April 23 : Gage height , feet ; discharge ,second-feet .
May 18 : Gage height , feet ; discharge ,second -feet.
June 30 : Gage height , feet , discharge , second-feet .
August 9 : Gage height , foot , discharge , 37 1 second-feet.
November 2 : Gage height , foot ; discharge, 87 second-feet.
November 21 : Gage height , foot ; discharge , 4 1 2 second-feet .

NORTH CAROLINA. 1 35
Da i ly gage height , in feet, of T ar River a t T a rboro , N orth Carolina , for
NEU SE RIVER AT SELMA,NORTH CAROLINA .
This station is described in Water- Supply Paper No . 36, page 1 1 1 .
he maximum flood of which there.is any record was on February 9,
the water reached a height of 21 feet on the gage, with a
schargeOf second- feet . T heminimumflow occurredvery severe drought of 1 897 , the lowest gage height beingon October 1 7 and 1 8
,and the discharge 75 second - feet ,
ximum flow about 1 60 times the minimum flow . T he
above the station is square miles. Records of
99 will be found in the Twenty -first Annual Report ,1 1 4 . During 1 900 the following measurements Were
ade by E. W . Myers :
February 8 : Gage height , feet ; discharge , second-feet .
April 12 : Gage height , feet ; discharge , second-feet.
April 24 : Gage height , feet ; discharge, second-feet.
May 1 7 Gage height , feet ; discharge , 461 second -feet.
June 27 Gage height , feet ; discharge , 590 second-feet.
August 10: Gage height , foot ; discharge, 139 second-feet .
November 6 : Gage height , 4.60 feet ; discharge, second-feet.
November 22 : Gage height , foot ; discharge, 243 second-feet.

1 36 OPERAT IONS AT RIVER STAT IONS , 1900 .
— PART II . [No . 48.
Da i ly gage height, in feet, of Neuse River a t S elma , North Carolina , for 1 900.
Jan . Feb . Mar . Apr . May . June . July . Aug . S ept . Oct . Nov. Dec.
C
DEEP RIVER AT CUMNOCK ,NORTH CAROL INA.
This station was established June 29, 1 900, by E. W . Myers. It is
300 yards northwest of the rai lroad station at Cumnock . T he wir
gage , which is graduated to feet and tenths,is na i led to the guar
rail of the bridge. T he water surface is feet below the top o
the lower chord at the S ide of the tension rod supporting the floobeam Opposite the gage. T he initial point of sounding is at the northwest end of the bridge . T he channel isstraight for several hundrefeet above and below the bridge, but the current is rather sluggish duing low water . T he bed of the stream ismuddy ,
with some bowlderT he observer is J . A . Rollins, a watchman at Cumnock . During 1 90the following measurements were made by E. W . Myers
June 29 : Gage height , feet ; discharge, 540 second-feet .
August 1 1 : Gage height , feet ; discharge, 1 1 2 second-feet .
November 5 : Gage height , feet ; discharge, second-feet.
December 1 9 : Gage height , feet ; discharge , 1 99 second-feet.

1 38 OPERAT IONS AT RIVER STAT IONS,1900.
— PART II . [No . 48.
Da i ly gage height, in feet, of Cap e Fea r River a t Fayettevi lle, North Ca rolina , for1 900.
Mar . Apr . Dec .
’
YADKIN RIVER AT SILOAM ,NORTH CAROLINA.
On August 2 , 1 900, a temporary station was established on YadkinRiver at S iloam
,North Carolina ,
by Cleveland Abbe , j r .
,and N . C .
Curtis. Many miscellaneous measurements were also made on the
upper tributariesof the Yadkin in connectionwith the genera l hydrographic
/ study of the southern Appalachian region ,records of which
wil l be found in Water - Supply Paper No . 49.
T he gaging station at S iloam is located on the north bank of the
river, in a clump of overhanging trees, 50 yards above Ha ll’s ferryand one -third of a mi le south of the S iloam station
,on the Wilkesboro
division of the Southern Railroad . T he gage rod,which is graduated
to feet and tenths,is
i
securely braced in a clump of trees.
“T he gage is
referred to a bench mark on the south bank in a clump of three sycamores at the water
’s edge , 25 feet above the ferry . landing. A notch
cut on the outermost tree is 8 feet from the root,and the bench mark
is the top of the knot Opposite this notch . T he reading of the gage
on August 2 , 1 900, was feet,equal to feet on the old gage,
referred to the bench mark across the river,measuring to the surface
of the water . T he river is sa id to rise not more than 9 feet in ordinary freshets, but in 1 898, as shown by flood marks and according toverbal accounts, it must have risen to about 1 6 feet on the presentgage. T he initial point of sounding is on the right bank , at the
outer edge of the first stake on the upstream side of the rod . T he
banks are high and rarely are submerged . T he bed of the stream is

NORTH CAROLINA. 1 39
gravel and sand , slightly shift ing. T he dra inage area of the river at
this station is square miles. T he observer is C . E. S cott,of
S iloam. During 1 900 the following measurements were made by
N . C . CurtisJuly 1 1 : Gage height , feet ; discharge , second feet .
August 3 : Gage height, feet ; discharge , second-feet .
October 31 : G age height , feet ; discharge , second-feet .
Da i ly gage height, in feet, of Yadkin River a t S i loam, North Ca rolina for 1 900.
Oct . Nov . Dec . S ept . Oct .
Q Q Q Q Q Q
- O - o
a No record .
YADKIN RIVER AT SALISBU RY,NORTH CAROL INA.
This station is described in Water-Supply Paper No . 36, page 1 1 6 .
Owing to the inconvenient location of the railroad bridge fromwhichthe measurements were made and its height above the water
,the
gaging station wasmoved June 1 , 1 899, to the new iron highway bridgeabout 300 yards above the railroad bridge ,
the new gage reading thesame as the old . In its new position the 1 0- foot mark on the rod is
opposite the center of the first ‘
strut from the west end of the secondspan from the west end of the bridge , on the downstream side . T he
rod isof pine, 3 incheswide , well painted , graduated to feet and tenths,and securely nailed to the inner surface of the guard rail
,the top of
the rod being flush with the top of the rail . T he distance between thezero of the rod and the outer rimof the pulley is feet
,and between
the end of the weight and the pointer on the wire feet . T he
observer is J . T . Yarbrough , keeper of the bridge. T he stream hereis about the same width as at the railroad bridge, and the section is afairly good one for gaging purposes, the bottom for the greater part of
the width of the stream being hard and rocky . At times the currentis very materia lly modified by large quantities of -driftwood lodgingagainst the piers, but it is thought better results can be obta ined thanat the old station. Although this stream issubject to periods of com
paratively low flow,theminimumrun-off is large . T he lowest recorded
flow was 900 second - feet,occurring in September and October
,1 897 .
T he highest flood of which there is any record occurred on March 20,

1 40 OPERAT IONS AT RIVER ST AT ION S , 1 900.
— PART II . [No . 48 .
1 899,the gage height being feet and the measured d ischargecubic feet per second
,Showing the maximum discharge to be
nearly 1 28 times the minimum discharge .
Records of flow during 1 899 will be found in the Twenty -first
Annual Report , Part IV , page 1 20 . During 1 900 the following measurements were made by E. W . Myers :
February 13 : Gage height , feet ; discharge, second-feet.
April 1 4 : Gage height , feet ; discharge , second-feet .
May 1 9 : Gage height , feet ; discharge, second-feet.
May 25 : Gage height , feet ; discharge , second -feet .
August 18 : G age height , feet ; discharge , second feet.
November 9 : Gage height , feet ; discharge , second-feet.
December1 7 Gage height , feet ; discharge , second-feet.
Da i ly gage height, in feet, Of Yadkin River a t S a lisbury , North Ca rolina , for 1 900.
Mar . Apr . May . July . Aug . S ept . Oct .
o n o
n un - n
n n n n n n n n
YADKIN RIVER AT NORWOOD,NORTH CAROL INA .
This station was abandoned January 1 , 1 900, and no measurementshave been made since that date . A description of the station and
records of discharge measurements will be found in Water-SupplyPaper No . 36
, page 1 1 8 ; also in the Twenty-first Annual Report , PartIV
, page 1 21 .
CATAWBA RIVER NEAR MORGANT ON,NORTH CAROL INA.
During the summer of 1900 a hydrographic investigation wasmadeof the southern Appalachian region . For the purpose of the study ,temporary stationswere established on CatawbaRiver nearMorganton
,

1 42 OPERAT IONS AT RIVER S TAT IONS , 1900 .
— PART II . [Nous
L INVILLE RIVER NEAR BRIDGEWAT ER,NORTH CAROL INA.
This station,one of t he temporary stations established in connec
tion with the hydrographic investigationsof the southern Appalachia]region ,
was established July 3 , . 1 900 . It is located at Poole’smill,jus
above the ford on the road between Morganton and Marion . Thgage is near the tailrace of the mill
,and the gagings are made abou
200 feet farther down . T he bed is extremely rough and rocky ,th
current being swift during high water . There are no bridges acrosthis stream
,and high-water measurements are therefore difficult t
obtain . T he bench mark is a cross cut on the rocky cliff on the lei
bank of the stream. T he initia l point of sounding is at the end of
log sunk in the sandy right bank . T he drainage area at this statio:is square miles. T he observer is J . A . Cooper , mi ller . T he foi
lowing measurements were made during 1 900 :
June 14 : Gage height , feet ; discharge, 104 second-feet .
July 3 : Gage height , feet ; discharge, 21 6 second-feet.
July 10 : Gage height , feet ; discharge , 1 16 second-feet.
August 1 7 : Gage height , feet ; discharge, 78 second-feet .
September 21 : Gage height , feet ; discharge, 55 second-feet.
Da i ly gage height, in feet, of Linvi lle River near Bridgewa ter ,North Carolinc
for 1 900.
July . Aug . July . Aug . S ept .
n n n n n n n n n n n n n n n
Q Q Q Q Q Q Q QQ Q Q Q Q Q Q
JOHN RIVER NEAR MORGANTON,NORTH CAROLINA.
This station was established June 1 7 1 900,by H . A . Pressey a
E. W . Myers, at the highway bridge on the road from MorgantonLenoir . A wire gage is suspended from the bridge , and
are made on a gage rod nailed to the guard ra il on the dside of the bridge. T he river channel is straight fOr 200and 300 feet below the station . T he banks are high and
rocky and permanent in section . T he drainage area at t

NORTH CAROLINA. 1 43
bout a third of a mile from the bridge . T he followingmeasurements'
ere made during 1 900June 13 : Gage height , feet ; discharge ,
465 second-feet.
June 1 9 : Gage height , feet ; discharge , second-feet .
July 6 : Gage height , feet ; discharge ,51 1 second- feet .
August 8 : Gage height , feet ; discharge , 1 35 second -feet .
S eptember 24 : Gage he ight , feet ; discharge , 148 second -feet .
November 7 : Gage height , feet ; discharge, 367 second -feet .
a ily gage height, infeet, of J ohn River nea r Morganton ,North Ca rolina,for
n n n n n
a No record fromAugust 19 to S eptember 9, inclusive .
CATAWBA RIVER AT CATAWBA,NORTH CAROLINA.
This station was originally established in July ,1 896
,but was aban
oned December 31,1 899 . On June it was reestablished as
temporary station to assist in the study of the hydrography of the
) uthern Appalachian region . T he measurements are made from the
outhern Ra ilway bridge about a fourth. of a mile east of t he railwayiation . T he wire gage is suspended from the bridge and is referredthe painted gage rod
,which is divided into feet and tenths
.
and
ailed to theguard rail . T he initia l point of sounding is on the west
nd of the bridge. T he channel is stra ight above and below the sta
.on,and the current is moderately swi ft . T he
.
banks are high , and1e bed is composed of gravel and
'
fine sand . T he'
observer is C . A .
teed, jr .
, clerk in the post-othee at Catawba . During 1 900 the fol
)wing measurements were made by E. W . Myers :
July 3 : Gage height feet ; discharge , second-feet .
August 14 : Gage height, feet ; discharge, 914 second-feet .
November 7 : Gage height , feet ; discharge , second-feet .
December 18 : Gage height , feet ; discharge , second-feet .

1 44 OPERAT IONS AT RIVER STAT IONS , 1900.
— PART 1 1 . [No . 48.
Da i ly gage height, in feet, of Ca tawba River a t Ca tawba ,North Ca rolina , for 1 900.
Nov .
a No record .
CATAWBA RIVER AT ROCKH ILL ,SOU TH CAROLINA.
This station,which is described inWater-Supply Paper No . 36
, pag
1 21,was established September 3 , 1 895 . During the last year a dam
has been constructed across the river about 6 miles above the gagin
station,and it isprobable that thiswill mod ify the flow to some extent
particularly at low stages. T he maximum flood of which there is anrecord at this station occurred March 20
,1 899
,the water reaching
height of feet on the gage, with a probable discharge of abousecond - feet . T he lowest stage of flow occurred in Septembe
of 1 895‘
and 1 896,when a gage height of foot was reached
,th
probable discharge being second - feet . During 1 900 the following measurements were made by E. W . Myers :
February 21 : Gage height , feet ; discharge , second-feet.
February 22 : Gage height , feet ; discharge, second -feet .
April 13 : Gage height , feet ; discharge, second-feet .
April 21 : Gage height , feet ; discharge , second-feet .
May 21 : Gage height , feet ; discharge, second-feet
July 4 : Gage height , feet ; discharge ,second-feet .
August 1 6 : Gage height , feet ; discharge ,second -feet.
October 26 : Gage height , feet ; discharge , second-feet.

1 46 OPERAT IONS AT RIVER S TAT IONS , 1900.
— PART -I I .
Da i ly gage height, in feet, of Broad River ( of the Ca rolinas) a t Dellinger ,
Carolina , for 1 900.
Nov .
- o
- n
BROAD RIVER (OF THE CAROLINAS ) NEAR AL ST ON,SOU TH CAROL INA
T hiss tation is described in VVater- Supply Paper No . 36, page 1 25
T he river is straight for a long distance above and below the stationbut the current is at an angle with the bridge . T he currentis ample and is very uniform throughout the section . T he observeis G . M . Heron , a farmer living near the station . T hemaximumflooat this station wason April 22 , 1 900, when the gage height wasfeet and the probable discharge about second - feet . T he minimum flow was reached October 3 , 1 899, the discharge being sec
ond - feet . T he maximum discharge is, therefore , about 62 times thminimum flow . During 1 900 the follow ing discharge measurements
were made by E. W . Myers
February 26 : G age height , feet ; discharge ,second- feet.
April 18 : Gage height , feet ; discharge not measured
April 20: Gage height , feet ; discharge , second-feet .
May 22 : Gage height , feet ; discharge,second-feet .
July 5 : Gage height , feet ; discharge , second-feet .
August 17 : Gage height , feet ; discharge , second-feet.

SOU T H CAROLINA. 1 47
Dai ly gage height, in feet, of B road River ( of the Ca rolinas) nea r Alston , S outh
Carolina ; for 1 900.
Jan . Feb . Mar . S ept . Oct . Nov . Dec .
SALU DA RIVER AT WATERLOO,SOUTH CAROL INA.
This Station is described in Water-Supply Paper No . 36, page 1 26 .
Records of flow during 1 899 will be found in the Twenty -first Annua lReport , Part IV‘
, page 1 29 . During 1 900 the following measurementswere made by E. W . Myers
February 23 : Gage height , feet ; discharge , second -feet.
April 19 : Gage height , feet ; discharge , second-feet.
May 22 : Gage height , feet ; discharge ,757 second-feet.
July 5 : Gage height , feet ; discharge , second-feet .
August 17 : Gage height , feet ; discharge 917 second-feet .
November 10 : Gage height , feet ; discharge , 854 second-feet .

1 48 OPERAT IONS AT RIVER S T AT IONS , 1900.
— PART II . [No . 48 .
Da i ly gage height, in feet, of S a luda River a t Wa terloo , S outh Ca rolina , for 1 900.
Jan . Feb . Mar . May .
‘ June . S ept . Oct . Nov . Dec .
-v
. . n . - Q
TALLU LAH RIVER AT TALLU LAH FALL S , GEORGIA.
This station was established August 29, 1 900 , and records of . gageheightswere obta ined until Oc tober 1 9
,1 900
,when the observer left
Tallulah Falls,and no readings have been made since that time .
Measurements are made from the wagon bridge across the river abouta half mile above the head of the falls. T he bridge is a single ironspan about 100 feet long . T he gage is a vertical rod 1 0 feet long,graduated to feet and tenths
,na iled to a 2- inch by 4 - inch pine tim
ber , and the whole Spiked to a tree on the left bank of the river about50 feet above the bridge. T he observer is T . A . Robinson , proprietorof the Robinson Hotel . During 1 900 the following measurementswere made by Max Hall and J . C . Conn
August 29 : Gage height , 1 foot ; discharge ,252 second-feet .
December 2 1 : Gage height , 2 feet ; discharge , 963 second-feet .
Da i ly gage height , in feet , of T a llulah River a t T a llulah Fa lls, Georgia , for 1 900.
S ept . Oct .

1 50 OPERAT IONS AT RIVER S T AT IONS , 1900.
— PART II . [N0 . 48.
Part IV, page 1 34 . During 1 900 the followingmeasurement wasmade
by Max Hall :March 1 : Gage height , feet ; discharge , second -feet .
Da i ly‘
gage height, in feet, of S avannah River nea r Ca lhoun Fa lls, S outh Ca ro
lina, for 1 900 .
Jan . Feb . Mar . Apr . May . June . July . Aug . Sept . Oct .
SAVANNAH RIVER AT AU GU STA,GEORGIA .
Observations of river heights have been ma inta ined at the’
highway
bridge in the city of Augusta S ince 1 875 . T he station is described iWater - Supply Paper No . 36
, page 1 30. T he gage heights as pub
lished are the average of four da ily readings reduced to feet and hundredths. Discharge measurements are made at the North Augusthighway bridge . Records of flow during 1 899 will be found in th
Twenty -first Annual Report , Part IV , page 1 35 . During 1 900 on
measurement wasmade by B . M . Ha ll,as follows
August 28 : Gage height , feet ; discharge , second-feet.

GEORGIA. 1 5 1
Da ily gage height, in feet, of S avannah River a t Augusta , Georgia , for 1 900.
Jan. Feb . Mar . Apr . May . June . Nov . Dec.
BROAD RIVER (OF GEORGIA) NEAR CARL TON,GEORQGIA.
This station,established May 27 1 897
,is located on the bridge of
the Seaboard Air Line 3 miles east of Carlton,Georgia ,
and 3 milesabove the mouth of the South Fork . A description of the station isgiven in Water-Supply Paper No . 36
, page 1 31 . T he gage was lastverified on October 1 7 , 1 900. Records of flow for 1 899 will be foundin the Twenty-first Annual Report , Part IV , page 1 32 . During 1 900the following measurements were made by MaxHall :
February 1 6 : Gage height, feet; discharge , second-feet .
March 30: Gage height , feet ; d ischarge,second-feet.
May 3 : Gage height , feet ; discharge , second-feet.
October 1 7 Gage height , feet ; discharge, 661 second-feet.

1 52 OPERAT IONS AT RIVER STAT IONS , 1900.
— PART II . [w e
Da i ly gage height, in feet , of B road River ( of Georgia ) near Carlton , Georgia ,
for 1 900 .
Jan . Feb . Mar . Apr . May . June . July . Aug . S ept . Oct . Nov. Dec .
OCONEE RIVER NEAR DU BL IN ,GEORGIA.
This station was established by the United S tatesWeather Bureain 1 894
,was discont inued on April 30, 1 897 , and was reestablishe
by the Georgia geological survey on February 1 1 , 1 898 . S ince October 1 5 , 1 898, the station has been maintained by the United StateWeather Bureau . It is located about a half mi le east of DublinGeorgia ,
and is described in Water-Supply Paper No . 36, page 1 33
Records of measurement will be found as follows : For 1 898,Twen
tieth Annual Report , Part IV , page 1 70 ; for 1 899, Twenty-first AnnuaReport , Part IV , page 1 36 . During 1 900 the following measurements of Oconee River at Dublin were made by B . M . Hall and hiassistants
April 1 2 : Gage height , feet ; discharge , second-feet.
December 7 : Gage height , feet ; discharge, second-feet.

1 54 OPERAT IONS AT RIVER S TAT IONS,1 900.
— PART II . [No . 48 .
Da i ly gage height, in feet, of Yellow River a t Almon , Georgia , for 1 900.
Jan . Feb . Mar . NOV . Dec .
- n
T OWALIGA RIVER NEAR JU LIET TE ,GEORGIA .
This stat ion was established on the Southern Ra ilway bridge 23miles north of Juliette
,Georgia ,
May 5,1 899
, but observations of
gage heights were not started unti l November 2,1 899. A description
of the station wi ll be found in Water-Supply Paper No. 36, page
1 36 . Bench mark No . 1 is an iron girder 40 feet from the left end of
the bridge and is feet above gage datum. W . L . Jackson,a
farmer living near the station (post- office address, Berner, Georgia ) ,is the observer . Records of measurementsmade during 1 899 wi ll befound inWater- Supply -Paper No. 36
, page 1 36 . During 1 900 the
following measurements were made by B . M . Ha ll and his assistants :February 1 7 Gage height, feet ; discharge , second-feet.
April 3 : Gage height , feet ; discharge, 348 second-feet.
December 8 : Gage height , feet ; discharge, 468 second-feet .

GEORGIA. 1 55
Da i ly gage height, in feet, of T owa liga River near Juliette, Georgia , for 1 900 .
May . June. July . Aug . S ept . Oct . Nov. Dec.
OCMU LGEE RIVER AT MACON,GEORGIA.
This station was established by the United StatesWeather BureauJanuary 21 , 1 893 , and measurementswere begun by the United S tatesGeological Survey in 1 895 . T he station is described in Water- SupplyPaper No . 36
, page 1 36 . During the year 1 900 Mr . T . S . Collins,of
the United S tatesWeather Bureau , put in a new gage on the centerpier of the bridge on which the old gage was placed , and referred it tothe same datum as the old gage . T he old gage is still in place, is ingood condition
,and is still used except during low water
,when mud
accumulates around its base at a higher level than the river . T he
new gage was put in to save cleaning away the mud from the bottomof the old gage . Records of measurements for 1 899 wi ll be found inthe Twenty-first Annual Report , Part IV , page 1 39 . During 1 900 thefollowing measurements were made by B . M . Hall and his assistants:
April 13 : Gage height , feet ; discharge, second- feet.
November 20 : G age height , feet : discharge, second-feet.
December 6 : Gage height , feet ; discharge , second-feet.
December 21 : Gage height, feet ; discharge, second-feet.

156 OPERAT IONS AT RIVER STAT IONS,1900.
— PART II. (No. 48.
Dai ly gage height, in feet, of Ocmulgee River a t Macon , Georgia , for 1 900.
Jan . Feb . Mar . Apr . May . June . July . Aug . Oct . Nov. Dec .
FL INT RIVER AT ALBANY,GEORGIA.
This station ,which is described in Water-Supply Paper NO. 36
,
page 1 38,was originally established by the United StatesWeather
Bureau on April 1 0, 1 893, and has been maintained from that date tothe present time . In 1 898 the gage was washed out by a freshet
,but
soon afterwards it was replaced . T he present rod is located at the
foot of Broad street,just below the county bridge . It is a pineboard ,
and is in two sections. T he first section ,which reads from 0 to
feet,is spiked to a cypress stump which stands at the edge of the
water ; the second section,which reads from feet to 30 feet , is
spiked to a cypress pole . T he bench marks are as follows : ( 1 ) T hetop of the rail at the ra ilroad station of the Plant System,
beingfeet above the zero of the gage and 1 84 feet above mean sea level
,
making the elevation of the zero of the rod feet above sea level ;(2) a cut in the lower iron pier of the count y bridge 1 0 feet abovegage datum and feet above mean sea level ; and (3) a spike inthe corner of Mase Company
’swarehouse
,corner of Broad and Front
streets,
feet above gage datum. T he highest water recordedwas on March 25
,1 897
,when the height of feet was reached
,and
the lowest point recorded since the commencement of the recordwas on October 9, 1 895 , when the reading was foot . T he dangerline is at 20 feet . Discharge measurements are made at the
‘countyhighway bridge in Albany ,
a steel structure in two spans of 1 30 feeteach , with two approaches of 31 5 and 205 feet , respectively .

1 58 OPERAT IONS AT RIVER S TAT IONS , 1900.
— PART 1 1 . [No . 48 .
(the top of the iron girder under the cross-ties at a point 1 2 feet to theleft of the center p ier ) , which is 27 feet above the zero of the gage ,the zero of the gage being feet above sea level . This gage wasmainta ined by the Georgia geological survey until November 1 , 1 900,when it was adopted by the United S tatesWeather Bureau as a -halfyear station ,
instead of the one at Reynolds, Georgia . During 1 900the followingmeasurementsweremade by B .M . Hall and hisassistants :
March 29 : G age height , feet ; discharge, second-feet.
May 2 : Gage height , feet ; discharge , second-feet .
December 12 : Gage height , foot ; discharge , 998 second-feet.
December 21 : Gage height, feet ; discharge , second-feet.
Da i ly gage height, in feet, of F lint River a t Woodbury , Georgia , for 1 900 .
May . Junef
CHAT TAHOOCHEE RIVER AT OAKDALE,GEORGIA.
T wo gaging stations are ma intained on Chattahoochee River, oneat Oakdale
,8 miles northwest of Atlanta
,and the other at West
Pomt , Georgia ,where the river reaches the Alabama State line . T he
station a t Oakdale was established October 1 7 1 895,and is descr ibed
in Water - Supply Paper No . 36, page 1 39. T he results of measure
ments during 1 899 will be found in the Twenty -first Annual Report ,Part IV
, page 1 40. During 1 900 the following measurements weremade by B . M . Hall and his assistants :
January 4 : Gage height , feet ; discharge, second-feet.
March 27 : Gage height ; feet ; discharge, second-feet .
July 6 : Gage height , 4 feet ; discharge, second-feet.S eptember 1 2 : Gage height , feet ; discharge , second-feet .
November 29 : Gage height , feet ; discharge, second -feet.

GEORGIA. 1 59
Jan . Feb . Mar . Apr . May . June . July . Aug . Oct . Nov . Dec .
CHAT TAHOOCHEE RIVER AT WEST POINT , GEORGIA.
This station was established July 30, 1 896 , on the highway bridgein West Point
,Georgia ,
about 500 feet below the railroad bridge. It
is described. in Water- Supply Paper No . 36, page 1 42 . T he gage was
last verified December 4,1 900. T he observer is C . E. Melton . T he
results of measurements during 1 899will be found in the Twenty-first
Annual Report , Part“
IV, page 1 4 1 . During 1 900 the following meas;
urements were made by B . M . Hall and his assistants :
January 20 : Gage height , feet ; discharge , second-feet .
February 24 : Gage height , feet ; discharge, second-feet .
August 22 : Gage height , feet ; discharge , second-feet.
December 4 : Gage height , feet ; discharge , second-feet.

1 60'
OPERAT IONS AT RIVER STAT IONS , 1900.
— PART II . [No -48.
Da i ly gage height, in feet, of Cha ttahoochee River a t West Point, Georgia , for1 900 .
Jan . Feb . Mar . Ap r . May . July . Aug. Oct . Nov ; Dec .
ET OWAH RIVER AT CANTON,GEORGIA.
This station was established by the United StatesWeather BureauMarch 1 2
,1 892 . It is located on the i ron highway bridge about
feet north of the Atlanta,Knoxville and Northern Ra ilway station at
Canton and about a half mile north of Canton Creek . T he gage is a
vertical timber attached to the upstream side of the left-bank pier of
the bridge , and is graduated to feet and tenths. Owing to high waterat the time the gage was put in it was set 1 foot higher than intended .
Recognizing the error,the gage-height records were begun by adding
1 foot to the actual readings. It was the intention to lower the gage assoon as the water went down
,but this has not been dOne , so that all of
the gage heights and dischargemeasurements have been based on the
rod with the zero point set 1 foot lower than the actual rod . T he gagewill probably be lowered to its proper place during the year 1 901 .
This station is described in Water-Supply Paper No . 36, page . 1 43 .
Records of measurements during 1 899 will be found in the Twentyfirst Annual Report, Part IV , page 1 45 . During 1 900 the followingmeasurements were madeb y B . M . Ha ll and his assistants :
February 27 Gage height , foot ; discharge, second-feet .
May 1 9 : Gage height , feet ; discharge, second-feet.
December 1 : Gage height , foot ; discharge, 81 6 second-feet.

1 62 OPERAT IONS AT RIVER S TAT IONS , 1900.
— PART I I . [No . 48 .
Da i ly gage height, in feet of Coosawa ttee River a t Ga rters, Georgia , for 1 900 .
Nov .
a No record August 26 to November 3.
OOSTANAU LA RIVER AT RESACA,GEORGIA.
This station was established July 27 1 896,on the iron bridge of the
Western and Atlantic Railroad in the town of Resaca,Georgia ,
feet from the ra ilroad station . It is described inWater-Supply PaperNo . 36
, page 1 46 . Recordsofmeasurements during 1 899 will be foundin the Twenty -first Annual Report , Part IV , page 1 47 . During 1 900the following measurements were made by O . P . Hall
April 30 : Gage height , 8 feet ; discharge. second-feet.
May 1 5 : Gage he ight , feet ; discharge , 1 ,466‘
second-feet .
May 25 : Gage height , feet ; discharge . second-feet.
December 1 1 : Gage height , feet ; discharge , second-feet.


1 64 OPERAT IONS AT RIVER S TAT IONS , 1900.
— PART II . [No . 48.
Da i ly gage height, in feet, of Coosa River a t Rome, Georgia , for 1 900.
May . June,July . Aug . Sept. NOV . Dec.
- n - Q
COOSA RIVER NEAR RIVERS IDE,ALABAMA.
This station,established September 25 , 1 896 , is at the bridge of the
Southern Ra ilway near Riverside . It is described in Water- SupplyPaper No . 36
, page 1 49 . Records of measurements during 1 899 wil'
be found in the Twenty -first Annua l Report , Part IV , page 1 50. Dur
ing 1 900 the following measurements were made by Max Hall andothers
February 10 : Gage height , feet ; discharge , second-feet .
March 21 : Gage height , feet ; discharge , second -feet .
May 5 : Gage height , feet ; discharge , second-feet.
August 2 1 : Gage height , feet ; discharge , second-feet.
December 28 : Gage height , feet ; discharge, second-feet .

1 66 OPERAT IONS AT RIVER S TAT IONS,1900.
- PART II . [No . 48.
Da i ly gage height, in feet, of Coosa River a t Loch NO. 4 , Alabama , for 1 900.
July . Aug . Oct .
n u —g
TALLAPOOSA RIVER NEAR SU SANNA,ALABAMA.
This station wasestablished July 27 1 900,by J . R . Hall . It is located
at the mouth of B lue Creek,which is 1 0 feet above the east landing
of McCarty’s ferry ,
1 3 miles southwest of Dadeville,and 3 miles from
Susanna,the nearest post
-office . T he rod is graduated to feet andtenths; it is 1 8 feet long,
and is na i led vertically to a tree over
hanging the water on the south side of the creek at the junction of the
creek and the river . T he gage is referred to a benchmark on a whitehickory tree about 40 feet from the rod on the south bank of the creek
,
and is feet above tide water . Discharge measurements are
made from a boat held in place by a wire stretched acrossthe r iver,
upon which the d istances from the in itial point are tagged . T he sec
tion is an exceptionally good one,depth and current be ing almost
uniform the entire width of the stream. T he observer is T . A . Walls.
a farmer who lives 1 mi le from the station . During 1 900 the following measurements were made by James R . Ha ll
July. 27 : Gage height , feet ; discharge ,second-feet.
August 9 : Gage height , feet ; discharge ,second-feet .
S eptember 28 : Gage height , fee t ; discharge, second-feet.
November 24 : Gage height , feet ; discharge, second-feet.

ALABAMA. 1 67
Da ily gage height, in feet, of T a llap oosa River nea r Susanna ,Alabama
, for 1 900 .
Aug . S ept . Oc t . N ov . Aug . S ept . Oct . NOV . Dec.
- n
- a - n
- uO
TALLAPOOSA RIVER NEAR ST U RDEVANT,ALABAMA .
This station was established July 1 9,1 900
,by J . R . Hall . It is
located at the Columbus and Western Railroad b ridge a fourth of a
mile west of Sturdevant . T he gage rod is 20 feet high , and is graduated to feet and tenths. It is in two sections and is fastened vertially ,
the shorter section to a post at the edge of”
the water on the
ast bank about 20 feet below the bridge, and the longer section to
the first stone pier from the east bank . It is so set that when the
water rises abovethe Short section it is on the long section,and the
read ings are madeas from one continuous rod . T he initia l point ofsounding is the east end of the bridge . T he section is broken by
three piers and by some large rocks below the bridge . T he gage is
referred to a bench mark consisting of -
a na il in the southwest cornerof pier No . 2
,east side of river
,feet above tide water and
feet above the zero of the gage .
“
T he observer is B . F . Neighbors,farmer a nd postmaster at Sturdeva’
nt,who lives a fourth of a mile
from the station . During 1 900 the follow ing measurements were
made by James R . Hall :July 20 : Gage height , feet ; discharge ,
second - feet.
August 13 : Gage height, feet; discharge , Second-feet.
Da i ly gage height, infeet, of T a llap oosa River near S turdevant, Alabama , for 1 900.
Aug . S ept . Oct . NOV . Dec . July . Aug . S ept . Oct . Nov . Dec .
- P

1 68 OPERAT ION S AT RIVER S T AT ION S , 1900.
— PART II . [No . 48 .
TALLAPOOSA RIVER NEAR M ILST EAD,ALABAMA .
This station was established August 7 , 1 897 , at the bridge of the
Ta llassee and Montgomery Ra ilway ,about a fourth of a mi le frOII
Milstead . It is described in Water- Supply Paper NO . 36 , page 1 52 ,
T he gage was last verified December 3 , 1 900. Records of d ischargemeasurements for 1 899 will be found in
“
the Twenty -first AnnuaReport , Part IV , page 1 5 1 . During 1 900 the following measurementswere made by Max Ha ll :
February Gage height , feet : discharge , second-feet .
March 5 : Gage height , feet : d ischarge , 7 ,088 second- feet.
December '
3 : Gage height , feet ; discharge , second-feet .
Da i ly gage height , in feet, of T a llap oosa River nea r M i lstead ,Alabama for 1 900
Jan . Feb . July . Aug . S ept . Nov . Dec
s - c
ALABAMA RIVER AT MONT GOMERY,ALABAMA.
This station was established by the United S tates Engineer Corpsnumber of years ago ,
at the Montgomery wharf , near .the union pas
senger station at the foot of Commerce street . T he readings are umtaken by the Weather Bureau , and copies are furnished to the Geclogical Survey . T he stat ion is described in Water-Supply Paper Nc
36, page 1 53. No measurementswere made in 1899 '
or previous yearsDuring 1 900 one measurement wasmade by MaxHall
,as follows :
March 6 : Gage height , feet ; discharge , second-feet.

1 70 OPERAT IONS AT RIVER S T AT IONS,1900.
— PART II . [No . 48 .
Da i ly gage height, in feet , of Alabama River a t S elma , Alabama , for 1 900 .
Apr .
’
May . June . July . S ept . Oct . NOV . Dec .
- 0
up
BLACK IVARRIOR RIVER AT T U SCALOOSA,ALABAMA.
A continuous record of the gage heights at Tusca loosa has beenkept by the Un ited S tates Engineer Corps since 1 889 . During 1 895and 1 896 a number of d ischargemeasurementswere made
,fromwhich
a rat ing table was established . S ince that time measurementsOf flowand computations of the d ischarge have been made regularly by theUnited S tates Geological Survey . T he stat ion is described inWater
Supply Paper No . 36, page 1 5 6 . T he records are furnished by R . C .
McCa lla, jr .
,United S tates assistant engineer . Records of measure
ments during 1 899 will be found in the Twenty -first Annual ReportPart IV
, page 1 53 . No measurements were made during the year
1 900 .

ALABAMA. 1 7 l
a t Tusca loosa ,Alabama,for 1 900 .
Apr . May . June . July . Aug . S ept . Nov . Dec .
'
BLACK WARRIOR RIVER NEAR CORDOVA,ALABAMA .
This station i s loca ted at the Kansas C ity ,Memphis and Birming
hamRailroad bridge three - fourths of a mile from Cordova ,Alabama .
T he gage was established by the Un ited States'
Weather Bureau,but
recordswere d iscontinued by that bureau some time ago . From 1 2
to 55 feet the gage is a vertical timber bolted to the inside of the
bridge pier on the left bank of the river . Below 1 2 feet the gage wassloping, but it was Out of posi t ion and could not be used when the
station Was established by the Geologica l Survey on May 1 900,so
a short new section was put in at tha t time . This section is a 2- inchby .10- inch plank , graduated to feet and tenths
,marked with nails
from feet to + 1 2 5 feet , and spiked to a willow tree on the rightbank of the river about 200 feet below the bridge . T he bench markis the top of the stone pier on the left bank
,and is feet above
the zero of the gage. Measurements are made from the ra ilroadbridge ,
which is a single -span ,iron
,through bridge 300 feet long .
T he section is a good one . T he observer is A . B . Logan ,who lives on
the right bank of the river,only a few hundred feet from the end of
the bridge . During 1 900 one measurement was made by Max Hall,
as followsMay 2 1 : G age height , foot ; discharge, 747 second
-feet.

1 72 OPERAT IONS AT RIVER S T AT IONS , 1900 .
— PART I I . [w e
Da i ly gage height , in feet, of B lack W'
arrior River near Cordova,Alabama , for
H ILLABEE CREEK NEAR ALEXANDER CIT Y,ALABAMA.
Fhis station,which was established August 29 , 1 900, by J . R . Hall
,
is located 65 miles northeast o f Alexander City ,on the road leading
from tha t town to Newsite . T he gage , which isgraduated to feet andtenths and is placed vertically ,
is in two sections,the short section
,
which reads from 0 to feet,being fastened to a post in the edge
of the water -on the north bank 20 feet from the upstream side of the
bridge ,the long section
,which reads from feet to 1 6 feet
,being
fastened to the upstream end of the first pier on the north bank,and
arranged so that when wa ter rises above the short section the readingsare made from the long one
,both sections being easi ly read fromthe
north approach to the bridge . T he initial point of sounding is on the
south side of the first pier on the north bank . T he gage is referredto a bench mark a t the top of a chord on the downstream side of the
bridge at the second pier from the north bank,and is feet above
the zero of the gage . T he bridge is in three spans having a tota llength of 276 feet
,with a north approach of 1 1 6 feet and a south
approach of 1 24 f eet,making a tota l
,over all
,of 51 6 feet . T he
observer is J . H . Chisholm,a farmer
, post-office address Alexander
City , Alabama . During 1 900 the following measurements were madeby James R. Hall :
August 29 : Gage height, feet ; g
discharge ,184 second-feet .
November 28 : Gage height , 2 feet ; discharge , 390 second-feet.

1 74 OPERAT IONS AT RIVER ST AT IONS,1900 .
— PART II . [No . 48 .
BIG SANDY CREEK NEAR DADEVILLE,ALABAMA.
This station ,which was established by J . R . Hall August 2 , 1 900, is
located about 4% miles southwest of “Dadeville, at the highway bridgeon the Dadeville- Susanna road . T he gage , which isgraduated to feetand tenths, is 1 6 feet high and is fastened vertically to the first pieron the north side of the creek . T he initial point of sounding is at
the gage rod . T he section isgood for ordinary or flood measurements,
but is rather wide and Shoaly for low-watermeasurements. T he lattercan
,however
,be made a short distance from the gage . T he Observer
is L . H . Finch,a farmer who lives 200 yards from the station
, postOffice address, Dadeville , Alabama . During 1 900 the following measurements were made by James R . Hall
July 6 : Gage height , feet ; discharge, 260 second - feet .
August 8 : Gage height , foot ; discharge , 1 10 second-feet.
August 8 : Gage height , foot ; discharge,1 1 6 second -feet .
August 25 : Gage height , feet : discharge, 281 second-feet .
November 1 6 : G age height , feet ; discharge , 1 55 second-feet .
December 31 : Gage height , feet ; discharge, 870 second-feet .
T he measurements of August 8 and November 1 6 were made a halfmile below Smith’s bridge .
Da i ly gage height, in feet, of B ig S andy Creek near Dadevi lle, Alabama , for 1 900 .
Aug . S ept . Oct . Nov . Dec . Aug . S ept . Oct . Nov .
”
Dec .
- a
T OMBIGBEE RIVER AT COLUMBU S,MIS S IS S IPPI .
This station is located about feet below the highway bridge1amiles from the Southern Ra ilway depot at Columbus. T he rod
,
which is in three sections,is fastened vertically to the rock bluff on
the left bank . It is a 3- inch by 1 0- inch p ine timber 45 feet long ,
marked with brass figures and copper nai ls, the graduation extendingfrom feet to + 40 0 feet . T he initial point of sounding is theend of the iron bridge , right bank ,
downstream side . Bench markNo. 1 is 250 feet from the initia l point of sounding. T he bridge flooris feet above the zero of the rod
,and the top of the iron girder

MIS S IS S IPPI AND ALABAMA. 1 7 5
er the floor timbers is feet above the zero . Bench mark No .
the top of the rail at the depot of the Southern Ra ilway ,and is
feet above gage datumand feet abovemean sea level . T he
the river at low water is 1 60 feet . T he maximum recordedthe river was on Apri l 8 , 1 892 , when the gage registered 42
T he lowest recorded height was on October 26 , 1 893 , when thereading was feet . T he danger line is at 33 feet . Nomeasents of d ischarge were made during 1 900.
gage height, in feet. of T ombigbee River a t Columbus M ississipp i , for 1 900.
May . June . July . Aug . S ept . Oct . Nov . Dec .
T OMBIGBEE RIVER NEAR EPES,ALABAMA .
A record of gage heights has been kept at this station for the lastten years by the Alabama Great Southern Ra ilway Company .
gage is painted on'
the center brick pier of'
the railway bridge of thatcompany across the Tombigbee a half mile east of Epes, and is
referred to two bench marks,the first
,the top of the iron girder at
the third crossbeam a t the station,80 feet from the right-bank end of
the i ron bridge , is feet above datum of gage , the second,the top
of the cross-tie or the base of the ra il at the station,80 feet from the
right-bank end of the iron bridge,is feet above datum of gage.
T he west bank of the river is a solid wall of limestone,the east bank
is flat and is subject to overflow . T he trestle at the east end of the

1 76 OPERAT IONS AT RIVER S TAT IONS,1900 .
— PART II . {No . 48.
bridge . is seven -eighths of. a mi le long . T he section is good ,though
the water is very deep and rather swift .
'
Da ily gage height, in feet , of T ombigbee River near Ep es, Alabama , for 1 900.
May . S ept . Oct . Nov . Dec .
n - c gn u —Q
v
- p _
YOU GHIOGHENY RIVER AT FRIENDSVIL LE,MARYLAND .
This station,whichwasestablished by E . G . Paul onAugust 1 7 , 1 898
is located at the iron highway bridge connecting the east and west
port ions of the V illage . It is described in Water- Supply Paper No .
36, page 1 59 . Records of measurements for 1 899 will be found in the
Twenty - first Annua l Report , Part IV , page 1 56 . During 1 900 the
following measurements were made by E. G . Paul and C . R . Olberg :
February 1 5 : Gage height , feet ; discharge , second-feet .
June 26 : Gage height . feet ; discharge ,36 1 second-feet.
September 1 3 : Gage height , feet ; discharge, 48 second- feet .

1 78 OPERAT IONS AT RIVER S TAT IONS , 1900.
— PART II . [No . 48 .
NEW RIVER AT RADFORD,V IRGINIA.
This station ,which was established by D . C . Humphreys on August
1,1 898
,the gage having been erected by the Un ited S tatesWeather
Bureau , is described in Water- Supply Paper NO . 36, page 1 61 . On
account of the inaccuracies of the Weather Bureau gage , a wire gagewas put in February 23
,1 900
,the zero being on the same level as
that of the old gage . T he observer is T . M . Brady . Records of
measurements for 1 899 w ill be found in Water- Supply Paper No .
page 1 62 . During 1 900 the following measurements were made byD . C . Humphreys :
February 23 : Gage height , feet ; discharge , second- feet .
February 24 : Gage height , feet ; discharge , second-feet .
March 30 : Gage height, feet ; discharge, second - feet.
June 2 7 : Gage height , feet ; discharge ,second-feet .
July 28 : Gage height , feet ; discharge, second- feet .
August 22 : _Gage height , ( ischarge , second -feet .
December 20 : Gage height , 0 foot ; discharge , second-feet .
Da i ly gage height , in feet, Of New River a t Radford ,Virginia , for 1 900.
June . Oc t . Nov . Dec.
- 0 - o u
n o - o n o
- o
GREENBRIER RIVER AT ALDERSON,WEST V IRGINIA.
This station,which was established by C . C . Babb and D . C . Hum
phreys on August 1 , 1 895 , is described inWater-Supply Paper No . 36,
page 1 63. Records of measurements during 1 899 will be found in theTwenty-first Annual Report , Part IV , page 1 59 . During 1 900 the followingmeasurements were made by D . C . Humphreys :
March 31 : Gage height , feet ; discharge, second-feet .
June 29 : Gage height , feet ; discharge , 564 second-feet.

WES T VIRGINIA AND NORTH CAROLINA. 1 79
July 24 : Gage heigh t , feet ; discharge , 493 second- feet .
August 20 : Gage height , feet ; d ischarge , 1 48 Second-feet .
December 21 : Gageheight , feet ; d ischarge , 834 second-feet .
a i ly gage height, in feet, of Greenbrier River a tAlderson ,West Virgi ni a ,for 1 900.
Mar . Aug . S ept . Nov . Dec .
NORT H FORK OF NEW RIVER AT WEAVERSFORD,NORT H CAROL INA .
During the summer Of 1 900 a specia l investigati on of the hydrographic conditions of the southern Appa lachian region wasmade bythe Un ited S tatesGeological Survey . Temporary stationswere established on several of the largest r ivers
,among these being the North
Fork and the South Fork of New River . A station was also established on New River near Oldtown
,V irginia . T he regular station on
New River , which is at Fayette , West V irginia ,has been continued .
Descriptions of these temporary stations and the gage heightsobta inedare given on the following pages.
T he station atWeaversford was established July 27 1 900,by Cleve
land Abbe , jr . , and N . C . Curtis. T he nearest ra ilroad station is at
NorthWilkesboro ,40 miles distant
,and the Weaversford post-office is
a fourth of a mile from the gaging station,which can only be reached
by private conveyance . T he gage rod is feet long,and is divided
into feet and tenths. It ismailed to the downstreamvertica l timber of
the forebay of Dixon’smill . T he dischargemeasurementsare made bywading at a comparatively shallow ford
,not much used and not on a
public highway ,located 400 yards below the house of Mr . Dixon
,the
owner of the mill . T he initial point of sounding is on the right bank ,at the outer edge of a fence post opposite the ford where measurementsare made. T he banks are high and have been overflowed only

1 80 OPERAT IONS AT RIVER STAT IONS , 1900.
— PART II .
once,V iz
,in 1 878 . T he bed of the stream is rocky and gravelly , and
is constant in form. T he observer is C. L . Nelson, post-Offi ce address
Weaversford,
“
Ashe County , North Carolina . T he gage heights for1 900 will be published next year . During 1 900 the followingmeasurements were made by N . C . Curtis and C leveland Abbe
, jr .
July 28 : Gage heigh t , foot ; discharge ,536 second-feet .
October 27 : Gage heigh t , foot ; discharge , 708 second-feet.
SOU TH FORK OF NEW RIVER AT NEW RIVER,NORT H CAROL INA.
This station was established July 28 , l 900,'
by Cleveland Abbe , jr.,
and N . C . Curtis. T he nearest railroad station is North W ilkesboro,
30 miles distant,and the gaging station can only be reached by pri
vate conveyance . T he d ischargemeasurements are made by wad ingacross a ford a half mile above the confluence of the North and Southforks of New River and about 1 miledownstream from the gage at
Warden’s store . T he gage is a wire cord running over a bolt driven
into a locust tree,and reads on a horizontal scale d ivided into feet
and tenths. T he pointer or index on the gage wire is feet fromthe extreme tip of the double window -sash weightswhich are attached .
When the latter rest onthe bottom,the index stands opposite 1 foot
on the scale,Which is read direct . T he initia l point of sounding is a
notch on the stream side of the second small poplar on the left of theroad going toward the stream and Opposite the ford . T he channel isstraight , the current fa irly swift
,and the banks are low and
“seldom“
overflow . T he bed of the stream isrocky ,with bowlders and cobbles.
T he dra inage area at this stati ‘on is square miles. T he observeris F . R . Warden
,a storekeeper located about 75 yards downstream
from the gage . During 1 900 the following measurements were madeby N . C . Curtis and Cleveland Abbe
, jr
July 28 : Gage height , feet ; discharge , 75 1 second-feet.
October28 : Gage height , feet ; discharge ,second-feet .
Da i ly gage height, in feet, of S outh Forltof NewRiver a t New River , North Caro
lina , for 1 900 .
lJuly . Aug . S ept . Oct . NOV . Dec . Aug . S ept . Oct . NOV . Dec .
—Q

1 82 OPERAT IONS AT RIVER S TAT ION S , 1900 .
— PART II . [No . 48.
Da i ly gage height , in feet, of New River a t Fayette, West Virginia , for 1 900.
Feb . Mar . Apr . June . July . Aug . S ept . Oct . NOV . Dec .
- n—u o v s
O
a Gage broken ; no record .
SOU TH FORK OF HOL S T ON RIVER AT BLU FF CIT Y,T ENNES SEE .
Thisstation wasorigina lly established by the Un ited S tatesWeatherBureau at the highway b ridge at Bluff City . Readings were begunJuly 1 7 1 900
,by the United S tates Geological Survey ,
in connectionwith the genera l hydrographic investigation of the southern Appalachian region . T he g age is a 4 - inch by 8 - inch timber bolted to the
downstream side of the stone pier . T he in itia l point of sounding ison the north end of the bridge
,downstream side . T he channel is
straight for about 500 feet above and below the bridge, and the cur
rent is swift . T he north bank is high , but the south bank is subjectto overflow at the bridge . T he bed is rocky and constant in section .
T he dra inage area is square miles. 0 . V . Cox is the observerDuring 1 900 the following measurements were made by E. W . Myers
and L . V . Branch :July 17 G age height , foot ; discharge ,
378 second-feet .
August 1 6 : Gage height , foot ; discharge ,329 second-feet .
September 25 : Gage height , feet ; discharge , 791 second-feet.
November 8 : G age height . foot ; discharge , 681 second-feet.
December 27 Gage height , foot ; discharge, 392 second-feet.

T ENNESSEE . 1 83
Da ily gage height , in feet, of S outh Fork of Holston River a t Bluff C i ty ,T ennessee
,
for 1 900.
S ept . Oct . NOV . Dec . Aug . S ept . Oct . N ov . Dec .
‘
- v .
u n - n
WATAU GA RIVER AT BU T LER,TENNESSEE .
In connection with the genera l hydrographic investigation of the
southern Appalachian region , stations were established on WataugaRiver and on Roan Creek at Butler , Tennessee ; also on Elk Creek at
Lineback,Tennessee . Descriptions of these Stations and records of
the gage heightsand discharge measurements are given on the following pages. T he station on Watauga River at Butler is about 1 00yards below the mouth of Roan Creek . It was established August
T he gage rod ,which . is graduated to feet and tenths, is
nailed to_a tree on the right bank . Measurements are made from the
highway bridge . T he initial point of sounding is at the downstreamend of the guard rai l . T he channel is stra ight above and below the
station, and the current is swift . T he banks are high , and the bed is
sandy and rocky . T he drainage area is 261 square miles. T he
Observer isEdgar L . Shull . During 1 900 the following measurements
were made by E. W . Myers and L . V . BranchJuly’
30 : Gage height , feet ; discharge , 434 second-feet.
August 7 : Gage height , foot ; discharge , 214 second-feet.
August 1 7 : Gage height , foot ; discharge, 166 second-feet.
October 6 : Gage height , feet ; discharge , 238 second-feet .
November 7 : Gage height , feet ; discharge , 591 second-feet.
December 28 : Gage height , feet ; discharge , 31 1 second- feet .
Da i ly gage height, in feet, of Wa tauga River a t Butler , T ennessee, for 1 900 .
S ept . Oct . Nov. Dec . Aug. S ept . Oct . Nov . Dec .
n un

OPERATIONS AT RIVER ST AT IONS , 1900.
—PART II .
ROAN CREEK AT BU T LER,T ENNESSEE .
This station was established August 8 , 1 900 . T he gage is a verticalrod na iled to a tree on the left b ank of the stream
,at Cole S cott’s
gristmill , about a half mi le above the mouth of the creek . Measurements are made from the highway bridge at the mouth of the creek
,
the initia l point of sounding being on the right bank ,at the end of the
upstreamguard ra il . T he left bank is low and is subject to overflowT he bed , is composed of sand and mud . T he drainage area is
square miles. T he observer isW . N . Bridges, of Butler.
During 1 900 the followingmeasurementswere made by E. W . Myers
and L . V . Branch :July 30 : G age height , feet ; discharge ,
137 second-feet .
August 7 : Gage height , feet ; discharge, 65 second- feet .
August 17 Gage height , foot ; discharge , 58 second-feet.
October 6 : Gage height , foot ; discharge ,52 second-feet .
November 7 : Gage height , feet ; discharge ,1 7 1 second -feet .
December 28 : Gage height , feet ; discharge , 82 second-feet .
Da i ly gage height, in feet, of Roan Creek a t Butler,T ennessee
, for 1 900.
S ept. Oct . Aug . S ept . Oct . Aug . S ept . Oct .
- u - . c
ELK CREEK AT L INEBAC K,T ENNES SEE .
This station was established August 8 , 1 900 . T he gage rod is na iledto a tree on the left bank
,1 00 yards below the L ineback post-Office .
Gagings are made by wading . T he banks a re low and are subject tooverflow . T he channel is straight and the current is swift . T he
dra inage area is . square miles. T he observer is Dove Lineback,
of L ineback,Tennessee . During 1 900 the following measurements
were made by E. W . Myers and L . V . Branch :August 9 : Gage height , feet ; discharge , 70 second -feet .
August 17 Gage height , feet ; discharge 56 second- feet .
October 6 : Gage height , feet ; discharge, 53 second-feet.
. 85
. 93
. 86
. 84
. 85
. 80
. 82
0 7375
1 00l 65
2 501 301 051 0093
95
0 8790
858882
80
80
80817880
24
2728
30

1 86 OPERAT IONS AT RIVER ST AT IONS , 1900.
— PART II . [NO . 48.
FRENCH BROAD RIVER NEAR‘
ASHEVILLE,NORTH CAROL INA.
This station , which was established by C . C . Babb in September,1 895 , is located at the B ingham S chool iron highway bridge , 3 mileswest of Asheville , and is reached by electric car from that place . It
is described in Water-Supply Paper No . 36, page 1 65 . Records of
measurements for 1 899 will be found in the Twenty -first AnnualReport , Part IV , page 1 60 . During 1 900 the following measurementswere made by E . W . Myers, R . E. Sh
'
uford,and others :
Discharge measurements of French B road River near Ashevi lle, North Carolina
GageDatehe ight .
Ekxxzft.
D ischarge . Date .
hgizgile
t .
Discharge.
1900.
S eptember 6S eptember 13S eptember 19October 13October 23November 20December 14December 30
Da i ly gage height, in feet, of French Broad River nea r Ashevi lle, North Carolina ,
for 1 900.
Mar . June . July . Aug . S ept .

T ENNES SEE .
FRENCH BROAD RIVER AT OLDT OWN ,T ENNESSEE .
This is one of the temporary stations established in connection withthe general hydrographic study of the southern Appalachian region .
Another temporary station was established on P igeon River , a tributary of the French Broad , and many miscellaneous measurementswere made on the French Broad and its tributaries, the resultsof which are given in Paper No . 49 . T he Oldtown. station on the
French Broad was established September 4 , 1 900, on the highwaybridge across the river at that town ,
which is 2 miles north of New
port , Tennessee. T he bridge is a 4 -span Iron structure , with woodenhand rails. T he gage is securely nailed to the second span from the
south end of the bridge . T he 1 4 - foot mark is the end of the rod , whichis butted aga inst the north Side of the first strut from the south end
'
of the span ,on the downstream side . T he outer rim of the pulley is
foot from the zero of the rod,and the distance between the end
of the weight and the pointer on the wire is feet . When thegage reads 1 foot , the water level is feet below the top Surface of
the lower chord directly below the zero of the gage rod . T he river isstraight for a long distance above and below the bridge ,
and the veloc
ity of the current is well distributed all theway across,though at the
low stage at which measurement wasmade,some places had a velocity
too small to give satisfactory results. Almost the entire distanceacross the bottom seems to be of fine sand . T he observer is'
J akeOdell
,Newport , Tennessee . During 1 900 the followingmeasurements
were made by E . W . Myers and L . V . BranchSeptember 4 : Gage height , 1 foot ; discharge , 867 second-feet .
November 2 : Gage height , feet ; discharge , second-feet.
December 1 5 : Gage height , feet ; discharge ,second-feet.
December 26 : Gage height, feet ; discharge, second-feet .
Dai ly gage height, in feet, of French Broad River a t Oldtown , T ennessee, for 1 900.
Nov . Dec . Sept . Oc t . NOV . Dec .
a No record S eptember 23 to October 14 , inclusive.

1 88 OPERAT IONS AT RIVER ST AT IONS , 1 900.
— PART II . [No . 48.
PIGEON RIVER AT NEWPORT,TENNESSEE ;
This station was established September 4 , 1 900, on the wagon bridgeat theupper end of the town of NeWport , about 1 00 yards above therailroad bridge . T he course of the river is straight for several hundred yards above and for about 50 yards below the bridge. T he cure
rent at extreme low water is very sluggish . At even the lowest gageheights the water isvery deep . T he bottom is smooth , being of rock ,in many places overla in with mud . T he 1 5 - foot mark of the rod
,or
the end,is abutted firmly against the east side of the first strut
from the west end of the bridge, on the downstream side . T he dis
tance between the zero of the rod and the outer rim of the pulleywheel is foot
,and from the end of the weight to the pointer on
the wire the distance is f eet . When the gage reading is 1 foot ,the water level is feet below the top surface of the lower chorddirectly beneath the zero of the gage rod . T he rod is of hard pine ,
well painted and divided into feet and tenths. T he d ra inage area is
655 square miles. T he Observer isH . M . Boyer , proprietor of a liverystable at Newport . During 1 900 the following measurements weremade by E. W . Myers and L . V . Branch
S eptember 4 : Gage height , foot ; discharge, 356 second-feet .
November 2 : Gage height , foot ; discharge , 544 second-feet .
December 1 5 : Gage height , feet ; discharge , 691 second -feet.
December 26 : Gage height , 2 feet ; discharge, 935 second-feet.
Da i ly gage height , in feet, of PigeOn River a t Newp ort, T ennessee, for 1 900.
S ept . Nov . Dec .
- n - Q
- n
n - Q - n
Q Q Q Q - Q Q g
- c o o o o o o o oC ‘ C D
a N0 record S eptember 16 to November 18, inclusive .
T U CKASEGEE RIVER AT BRYSON,NORTH CAROL INA.
This station is described in Water- Supply Paper No . 36, page 1 67 .
Results of measurements during 1899 will be found in the TwentyFirst Annual Report , Part IV, page 1 62 . During 1 900 the followingmeasurementswere made by E. W . Myers and R . E. Shuford

1 90 OPERAT IONS AT RIVER STAT IONS,1900.
— PART II . [NO- 48 .
Da i ly gage height, in feet, of L i ttle T ennessee River a t Judson , North Carolina ,
for
Jan . Feb . Mar . Ap r . June . July . S ept . Oct .
u
H IWASSEE RIVER AT'
MU RPHY,NORTH CAROL INA.
This station is described in Water-Supply Paper No . 36, page 1 69.
T he observer isWilliam Mingus, of Murphy . Records of measurements during 1 899 will be found in the Twenty -first Annual Report ,Part IV , page 1 65 . During 1 900 the following measurements weremade by E. W . Myers and R . E. Shuford
Discha rgemeasurements of H iwassee River a t Murp hy ,North Carolina .
Date .
hga
ie
t .
Discharge . Date .
hgia
gii .
Discharge .
S ea -f t . 1900.
S eptember 94, 567 November 181 , 466 December 13755 December 13
3 , 405 December 281 , 155

NORTH CAROLINA AND T ENNES SEE. 1 91
Jan . Feb . Mar . Apr . May . June . July . Aug . S ept . Oct .
HIWASSEE RIVER AT REL IANCE,T ENNESSEE .
Thisstation was established by O . P . Hall on August 1 7 1 900.
T he gage is a vertical timber, graduated to feet and tenths, spiked to
a tree on the right bank of the river about 200 feet above the Atlanta,
Knoxville and Northern Railroad bridge, and very near the ferrylanding. Measurements are made from the railroad bridge , a new
steel structure of three Spans of“
1 40 feet each,which has recently been
substituted for the old wooden bridge . Bench mark No . 1 is a nai lin a hickory tree on the right bank of the river
,about 1 00 feet above
the end of the bridge and feet above the zero of the gage . Benchmark No . 2 is the base of ra il 40 feet fromthe right-bank end of bridge ,and is24 . 70 feet above the zero of the gage . At ordinary stages the riveris about 350 feet wide at this point , and the section is a fa irly goodone
,but at low stages the current becomes very sluggish . T he
observer is C . V . Higdon ,a ferryman who lives near the gage . Dur
ing 1 900 the following measurements were made by O . P . HallAugust 17 Gage height , feet ; discharge , second-feet .
September 3 : Gage height , feet ; discharge, second-feet.
November 30 : Gage height , feet ; discharge , second -feet .
December 19 : Gage height, feet ; discharge , second-feet .

1 92‘
OPERAT IONS AT RIVER STAT IONS , 1900.
— PART II . [No . 48
Da i ly gage height, in feet, of H iwassee River a t Reliance, T ennessee, for 1 900.
Dav . Nov . Dec . Aug . S ep t . Oct . NOV. Dec.
HIWAS SEE RIVER AT CHARLEST ON,T ENNESSEE .
This stat ion was originally established by the United StatesEngineer Corps, but is now ma intained as a half-year station by the
United S tates Weather Bureau . It is described in Water- SupplyPaper No . 36
, pages 1 70 and 1 7 1,where wi ll also be found the records
of measurements .made during 1 899. During 1 900 the followingmeasurements were made by Max Hall
March 1 4 : Gage height , feet ; discharge , second -feet.
April 25 : Gage height , 4 feet ; discharge , second-feet .
December 8 : G age height , feet ; discharge , second-feet .
Da i ly gage height, in feet , of H iwassee River a t Charleston , T ennessee, for 1 900.
Mar . Apr . May . July . Aug . S ept . Oct . Nov . Dec .
- 0 - Q on

1 94 OPERAT IONS AT RIVER STAT IONS , 1900.
—PART II . [No . 48 .
of the river , j ust below the mouth of the West Knoxville Bayou and
about feet below the temporary gage at the Knoxville ‘
and
Augusta Railroad bridge . The gage , which is graduated to feet andtenths, is in two sections; the first
,a sloping section made of a 2- inch
by 4- inch pine timber spiked on top of ah 8- inch by 8- inch oak sill well
bolted to piles and embedded in crushed stone, reading frOm — 2 feetto 1 2 feet ; the second , a vertical section of standardWeather
;
Bureaupattern ,
brass scale,screwed to one of the bents of the railroad trestle
across theWest Knoxville Bayou , about 50 feet from the bank of the
river and fromthe l ping gage, reading from 1 2 feet to feet . T he
gage is fastened to the upstream post of the bent facing away from the
river . T he zero of the gage is feet above sea level . T heb ench
mark is a cross in the stone on the east corner of the base to the rightbank pier of the Knoxville and Augusta Ra ilroad bridge, and isfeet above sea level and feet above the zero of the gage . T he gage
was located for the Un ited StatesWeather Bureau by theUnited S tatesEngineer Corps. Da ily records are kept by the Un ited S tatesWeatherBureau and are furnished to the Geological Survey . Measurementsare made at the Cherokee h ighway bridge 2 miles below the new
gage . This bridge is a three-span iron structure and is about 80 feetabove low water . T he width of the river at low water is 550 feet .
T he section is a good one , but the current is rather sluggish at low
water . During 1 900 the following measurements were made by Max
HallApril 25 : Gage height , feet ; discharge , second-feet .
December 7 Gage height , feet ; discharge, second-feet .
Da ily gage height, in feet, of T ennessee River a t Knoxvi lle, T ennessee, for 1 900.
Jan . Feb . Mar . Apr . May . June . July . Aug. S ept . Oct .
- n

T ENNES SEE . 1 95
T ENNES SEE RIVER AT CHAT TANOOGA,T ENNES SEE
This station was established in 1 879, at the foot of Lookout street ,ust below Chattanooga Island , by the S ignal Corps of the Unitedates _Army ; but since July 1
,1 891
,it has been in charge of the
au. During the year 1 900 a new gage was established .
timber bolted to the south side of the third stone pierh end of the bridge . Gage heights are obta ined fromUnited S tatesWeather Bureau Observer . Records of
made during 1 899 will be found in the Twenty -first
Part IV , page 1 68 . During 1 900 the following meas
ents were made by MaxHall and othersMarch 13 : Gage height , feet ; discharge , second-feet .
July 27 Gage height , feet ; discharge,-second-feet.
i ly gage height, in feet , of T ennessee River a t Cha ttanooga ,T ennessee for 1 900.
Mar . Apr . May . June . July . Aug . S ept . Oct . NOV . Dec :
a Frozen.
[Continued in Water-Supply Paper No . 49,where will be found
iumerous miscellaneous measurements of streams in the southernAppalachian region . ]


WAT ER-SUPPL Y AND IRRIGAT ION PAPERS .
1 . Pumping water for irrigation, by Herbert M . Wilson,1 896.
2 Irrigation near Phoenix, Arizona , by Arthur P. Davis, 1897.
3. Sewage irrigation ,by GeorgeW. Rafter , 1897.
f4 . Areconnoissance in southeasternWashington,by Israel C . RusSell , 1897.5 . Irrigation practice on theGreat Plains, by E. B. Cowgill , 1897.
6. Underground waters of southwestern Kansas, by ErasmusHaworth, 1897.7. Seepage waters of northernU tah , by Samuel Fortier ,8. Windmills for irrigation,
by E. C . Murphy , 1897.
9. Irrigation near Greeley , Colorado by David Boyd ,1897.
10. Irrigation ln Mesilla Valley , New Mexico, by F. C . Barker, 1898.
1 1 . River heights for 1896 , by Arthur P. Davis, 1897.
12. U nderground waters of southeastern Nebraska , by N . H . Darton, 1898.
13. Irrigation systems in T exas, by W. F . Hutson ,1 898.
14 . New tests of pumps and water liftsused in irrigation, by O. P . Hood , 1
Operations at river stations, 1897 , Parts I , II , 1898.
17. Irrigation near Bakersfield , California , by C . E. Grunsky , 1898.
18. Irrigation near Fresno , California , _by C . E. Grunsky ,1 898.
19. Irrigation near Merced, California , by C . E. Grunsky , 1899;
20. Experimentswi th windmills, by T homas 0 . Perry , 1899.
21 . Wells of northern Indiana, by Frank Leverett , 1899.
22. S ewage irrigation, Part II , by GeorgeW. Rafter , 1899.
23. Water-right problemsof Bighorn Mountains, by ElwoodMead , 1899.
24 , 25 . Water resourcesof the S tateofNewYork ,PartsI , II, by G .W.Rafter, 1
26. Wellsof southern Indiana ( continuation of No. by Frank Leverett , 1
27 , 28. Operations at river stations, 1898 , Parts I , II , 1899.
29. Wells and windmills in Nebraska , by Erwin Hinckley Barbour, 1899.
30. Water resourcesof theLowerPeninsula ofMichigan , byAlfredC . Lane, 1
31 . Lower Michiganmineral waters, by Alfred C. Lane, 1899.
32. Water resourcesof Puerto Rico , by H. M.,
'
Wilson,1900.
33. S torage of water on Gila River, Arizona , by J .B . Lippincott, 1900.
34. Geology and water resources of southeastern S . Dak. , by J . E. T odd , 1900.
35 -39. Operationsat river stations, 1899, Parts I—V , 1900.
40. T heAustin dam, by T homas U . T aylor , 1900.
T he windmill : its efficiency and use , Parts I, II, by E. C . Murphy , 1901
43 . Conveyance of water in irrigation canals, etc . by Samuel Fortier, 1901 . t44. Profiles of rivers, by Henry Gannett , 1901 .
45 . Water storage on Cache Creek , California , by Albert E. Chandler , 1901 .46. Reconn . ofKern andYuba rivers, Cal . , byF .H.Olmsted andM .Man
47- 52. Operations at river stations, 1900. Parts I—VI , 1901 .
Other papers are invarious stages of preparation. Provision hasbeen
tionsfor the year 1896—97
granted whenever practicable , but it is impossibledemands, such asto have all of the series sent.
Application for these papers should bemade either toMembersof CongressorTHEDIRECTOR, UNITEDSTATES GEOLOGICAL SURVEY,WASHINGTON, D. 0.
1RR 48

DEPAR T M EN T OF T HE IN T ER IOR
WATERfSUPPLY
OF THE
UNITEDSTATES GEOLOGICALSURVEY
N o . 4 9
OPERATIONS AT RIVERSTAT IONS ,
WASHINGTON
GOVERNMENT PRINT ING OFFICE
1 9 0 1

IRRIGAT ION REPORT S .
T he following listcontains titles andbrief desci iptions of the principalrelating to water supply and irrigation , prepared by the U nited S tatesGeSurvey since 1890
1 8 9 0 .
FirstAnnual Report of the U nited S tates Irrigation -Survey , 1890; octavo ,
Printed asPart II , Irrigation ,
Survey , 1888- 89. Conta insa stareport on the organization andirrigation , and repor t of work
1 8 9 1 .
SecondAnnual Report of the U
papers. includingfigures.
T hird Annual Repo
Printed asPart1 890—91 . Containsear ended June. H . Newell ;
“Ir
1 90 figures.
F . H . Newell ; quarto.
Irrigation in Utah ; NO. 1
Montana ; No. 157 , Irrigati
Irrigation in Oregon ; No. 1 93 , Artesian wells for irrigation ; No. 198 ,tion inWashington.
1 8 9 2 .
Irrigation of western U nited S tates, by F. H. Newell ; extra census bullet23 , S eptember quarto , 22 pp .
Contains tabulations showing the total number, average size , etc. , of irrigatedthe total area and average size of irrigated farms in the subhumid regions, the pof number of farms irrigated , character of crops, value of irrigated lands, theof i i rigation , the investment and profits, together with a resume of the wa descripti on of irrigation by artesian wells. Illustrated by colored mapslocation and relative extent of the irrigated areas.
1 8 9 3 .
T hirteenth Annual Report of the U nited S tates Geological Survey , 1891- 92 , PartIII , IrrigatiOn,
1893 ; octavo , 486 pp.
Consists of three papers:“Water supply for irrigation,
” by F . H . Newell “AmericaniMrri ation engineering
”and Engineering results of the Irrigation Survey ,
” by Herbertilson ; Construction of topograph icmapsand selection and survey of reservoir sites,
”
by A . H T hompson. Illustrated by 77 plates and 1 19 figures.
A geological reconnoissance in central Washington , by Israel Cook Russell, 1893 ;octavo ,
108 pp. , 1 5 plates. Bulletin No. 108 of the U nited S tates Geological
Survey ; price, 1 5 cents.
Containsa descrip tion of the examination of the g gieolo 0 structure in and adjacenthe drainage basin Of Yak ima River and the great plainsogfl the Columbia to the ea
Jst of
area , with special reference to the occurrence of artesian waters.
1 8 9 4 .
Report on agricultureby irrigation in thewesternpart of the United StatesatEleventh Census, 1890, by F . H . Newell , 1894 ; quarto ,
283 pp.
ted S tates
parts; Part II, Accompanying papers, 1894 ; octavo, 597 pp.
Contains papers on“Potable waters of the eastern U nited S tates,
” byNatural mineral watersof the U nited S tates by A. C Peale ; Results of strea
urements,” by F. H . Newell Illustrated by mapsyand d i agrams
iRR 49
(Continued On third pageOf cover . )


UNITED STATES GEOLOGICAL SURVEYCHARLES D . WALCOT T ,
D IRECT OR
OPERATIONS AT RIVER STATIONS,1900
AREPORT OF THE
DIVISION OFHYDROGRAPHY
OF T HE
UNITED STATES GEOLOGICAL SURVEY
I J A R I I’I I I
WASHINGTONGOVERNMENT PRINT ING OFFICE
1 9 0 1


202 CONT ENT S
Measurements at river stations— Continued .
Laramie River near U v’
a , WyomingNorth Platte River at Orin Junction , WyomingNorth Platte River near Guernsey , WyomingNorth Platte River at Gering , Nebraska
North Platte River .at Camp Clarke Nebraska
North Platte River at North Platte ,Nebraska
South Platte River
South Fork of South Platte River at Lake Cheesman, Colorado
South Platte River near Platte Canyon , Colorado .
South Platte River at Denver , Colorado
South Platte River at Orchard , Colorado
S outh Platte River at Julesburg ,Colorado
Bear Creek near Morrison , Colorado
Clear Creek at Forkscreek , Colorado
South Boulder Creek near Marshall , Colorado
Boulder Creek near Boulder , Colorado
S t . Vrain Creek near Lyons, Colorado . H .
Big T hompson Creek near Arkins, ColoradoCache la Poudre River near Fort Collins, Colorado

OPERATIONS AT RI VER STATIONS,1900.
P AR T I I I .
MEASU REMEN T S AT RIVER S T AT I ODTS .
1
MISCELLANEOU S MEASU REMENT S OF ST REAMS IN SOU THERN APPA
LACHIAN REGION
A hydrographic investigation of the southern Appalachian regionwas made during the field season of 1 900 . A detailed report of thework will appear in a later publication . During the progress of the
investigation a large number of measurements were made of variousstreams, as shown in the following tables. T he tables are arrangedin geographic Order , commencing With the more northerly streams
,
which drain into the Atlantic Ocean,and ending with those which
belong to the Gulf drainage .
Miscellaneous dischargemeasurements of Yadkin River and i ts tributa ries.
Gage DisDate . S tream. Locality . Hydrographer .
height . charge
Wilkesboro, N . C
doSecond ford below Patteson
’s mill, North Carolina .
dododo
Elk Creek Onéa-f
éiurth mile above ford ,
do -do-do do - dodo -do
S tony Creek Footbr idge a t C o l b e r t s , doNorth Carolina .
do -dodo -dodo -do
Louis Fork of Yad Footbridge on Mount Pleas dokin River . ant road , North Carolina .
do -do - do .
do -dodo - do -do
1 Continued fromWa ter-Supply Paper No . 48.

204 OPERAT IONS AT RIVER S TATIONS , 1900.
— PART III ; [No . 49.
Miscellaneous discha rgemeasurements of Yadkin R iver , etc — Continued .
Da te . S tream. L ocality . Hydrographer .
1900.June 23 Reddie River N . C . Curt isJuly 12 -do
Aug . 4 - doOct . 1 - doJune 23 Mulberry River
July 3 doAug . 4 do
S ep t . 27 doNov. 2 doJune 25 Roaring River
July 9 doAug . 4. do - _doS ept 27 do
Nov . 2 do - .doS ept . 27 Big BugaboOCreek F0 1 d of rOad from ROaring
River to Elk in , N . C .June 25 Big Elkin River G 1 eensboro and W ilkesboroR R . b i idge , NOI th Carolina .July 9 do
Aug . 4 -do
S ep t . 27 - doJune 26 Mitchell RiverJuly 10 doAug . 3 - doS ept . 28 doN ov . 1 - doJune 26 Fisher River Greensboro and W ilkesboro
R . R . trestle , North Carolina .July 10 do
Aug . 3
S ept . 28 - doNov . 1 _doJune 27 Ararat RiverJuly 1 1 doAug . 2 doS ep‘
t . 29 doOc t . 31 do
Miscellaneous d ischargemeasurements of Ca tawba River and i ts tributaries.
Date . S tream. L ocal ity . Hydrographer .
11815
53 chISI'S
ge
1900.June 28 Catawba River Oldfort , N . CAug . 20 do doS ept 20 do doJune 28 Mill Creek doAug . 20 doS ept . 20 do doJune 28 Jarret t Creek Near Oldfort , N . CDo Curtis Creek T wo hundred feet above ford
of Oldfort road , Nor th Carolina .
do s
Buck Creekdo
North Fork of Cata
gvba River .
o
do
Nor
gh W'
ilkesboro , N . C0
doT restle of Greensboro andW i l k e sb o r o division of
S outhern R. R North Carolina .
-doGreensboro and WilkesboroR. R . bridge , North Caroina .
Near ford of main road ,
Ngrth Carolina .
o
T wo hundred feet above fordof main road , North Carolina .
-doOne-eighthmile above mouth
at Ir
li a in ford .North Carolina( . o
First ford above mouth ,
Nor th Carolina .

2 06 OPERAT ION S AT RIVER ST AT IONS,
1
1900.
— PART I II . [No - 49.
Jil iscellaneous d ischa rgemeasurements of B road River, eta
— Continued .
Da te . S tream. Loca lity . Hy drographer .
Cox’s br idge , North Carolina .
Near S aluda , on Howard Gaproad . NOI th Ca i olina .
Cove Creek Near mouth . North CarolinaWhite Oak Creek One -half mile above mouth .
North Carolina .
S econd Broad River One and one -halfmileseast ofForest City , N . C .
Bridge on Ruthe i fordtonMorganton road , NorthCarolina .
do
Onemile abovemouth , North
Cai olina .
At mouth , North Carolina- do-do
M iscella neous discha rge measurements of -S outh S a luda Creek and i ts tr ibuta ries.
Da te . S tream. L ocality . Hy drographer .
1900.
S ept . 7 S outh S a luda Creek FreemanBridge ,belowmouth N . C . Curtisof M idd le S aluda Creek ,North Carol ina .
T wo miles above mouth of
Midd le S aluda Creek ,NorthCarolina .
Oct . 14 do
S ept . 7 M iddle S aluda Creek Onemile abovemouth , Nor th do
Carolina .
Oct . 13 doS ept . 7 North S aluda Creek Iron bridge atMariet ta , N . C
Oct . 13 doS ept . 6 do Bridge on L ima -Cle veland
Mills road , North Carolina .
Do do T womilesbelowHumphrey ’s
store , North Caro lina .
Do Fall Creek Bridge on road to L ima , N . C
a Estima ted .
M iscellaneous discha rgemeasuremen ts of Tuga loo River tr ibuta ries.
Date . S tream. Locality . Hydrographer .
1900.
Dec . 21 S outh Prong of Pan Near T urnerville , Ga
the i Creek .
Do Panther Creek doDo T iger Creek N inemi le snor th of T allulah Falls,Ga
Dec . 22 - do S ixmiles south of Clay ton GaDo S cott Creek Clayton. GaDo T impson Creek Five miles from Clay ton , Ga
Dec . 23 T allulah River Burton, GaDec . 24 S tekoa Creek One mile east of Clay ton, GaDo ChattoogaRiver RogersFord , Georgia
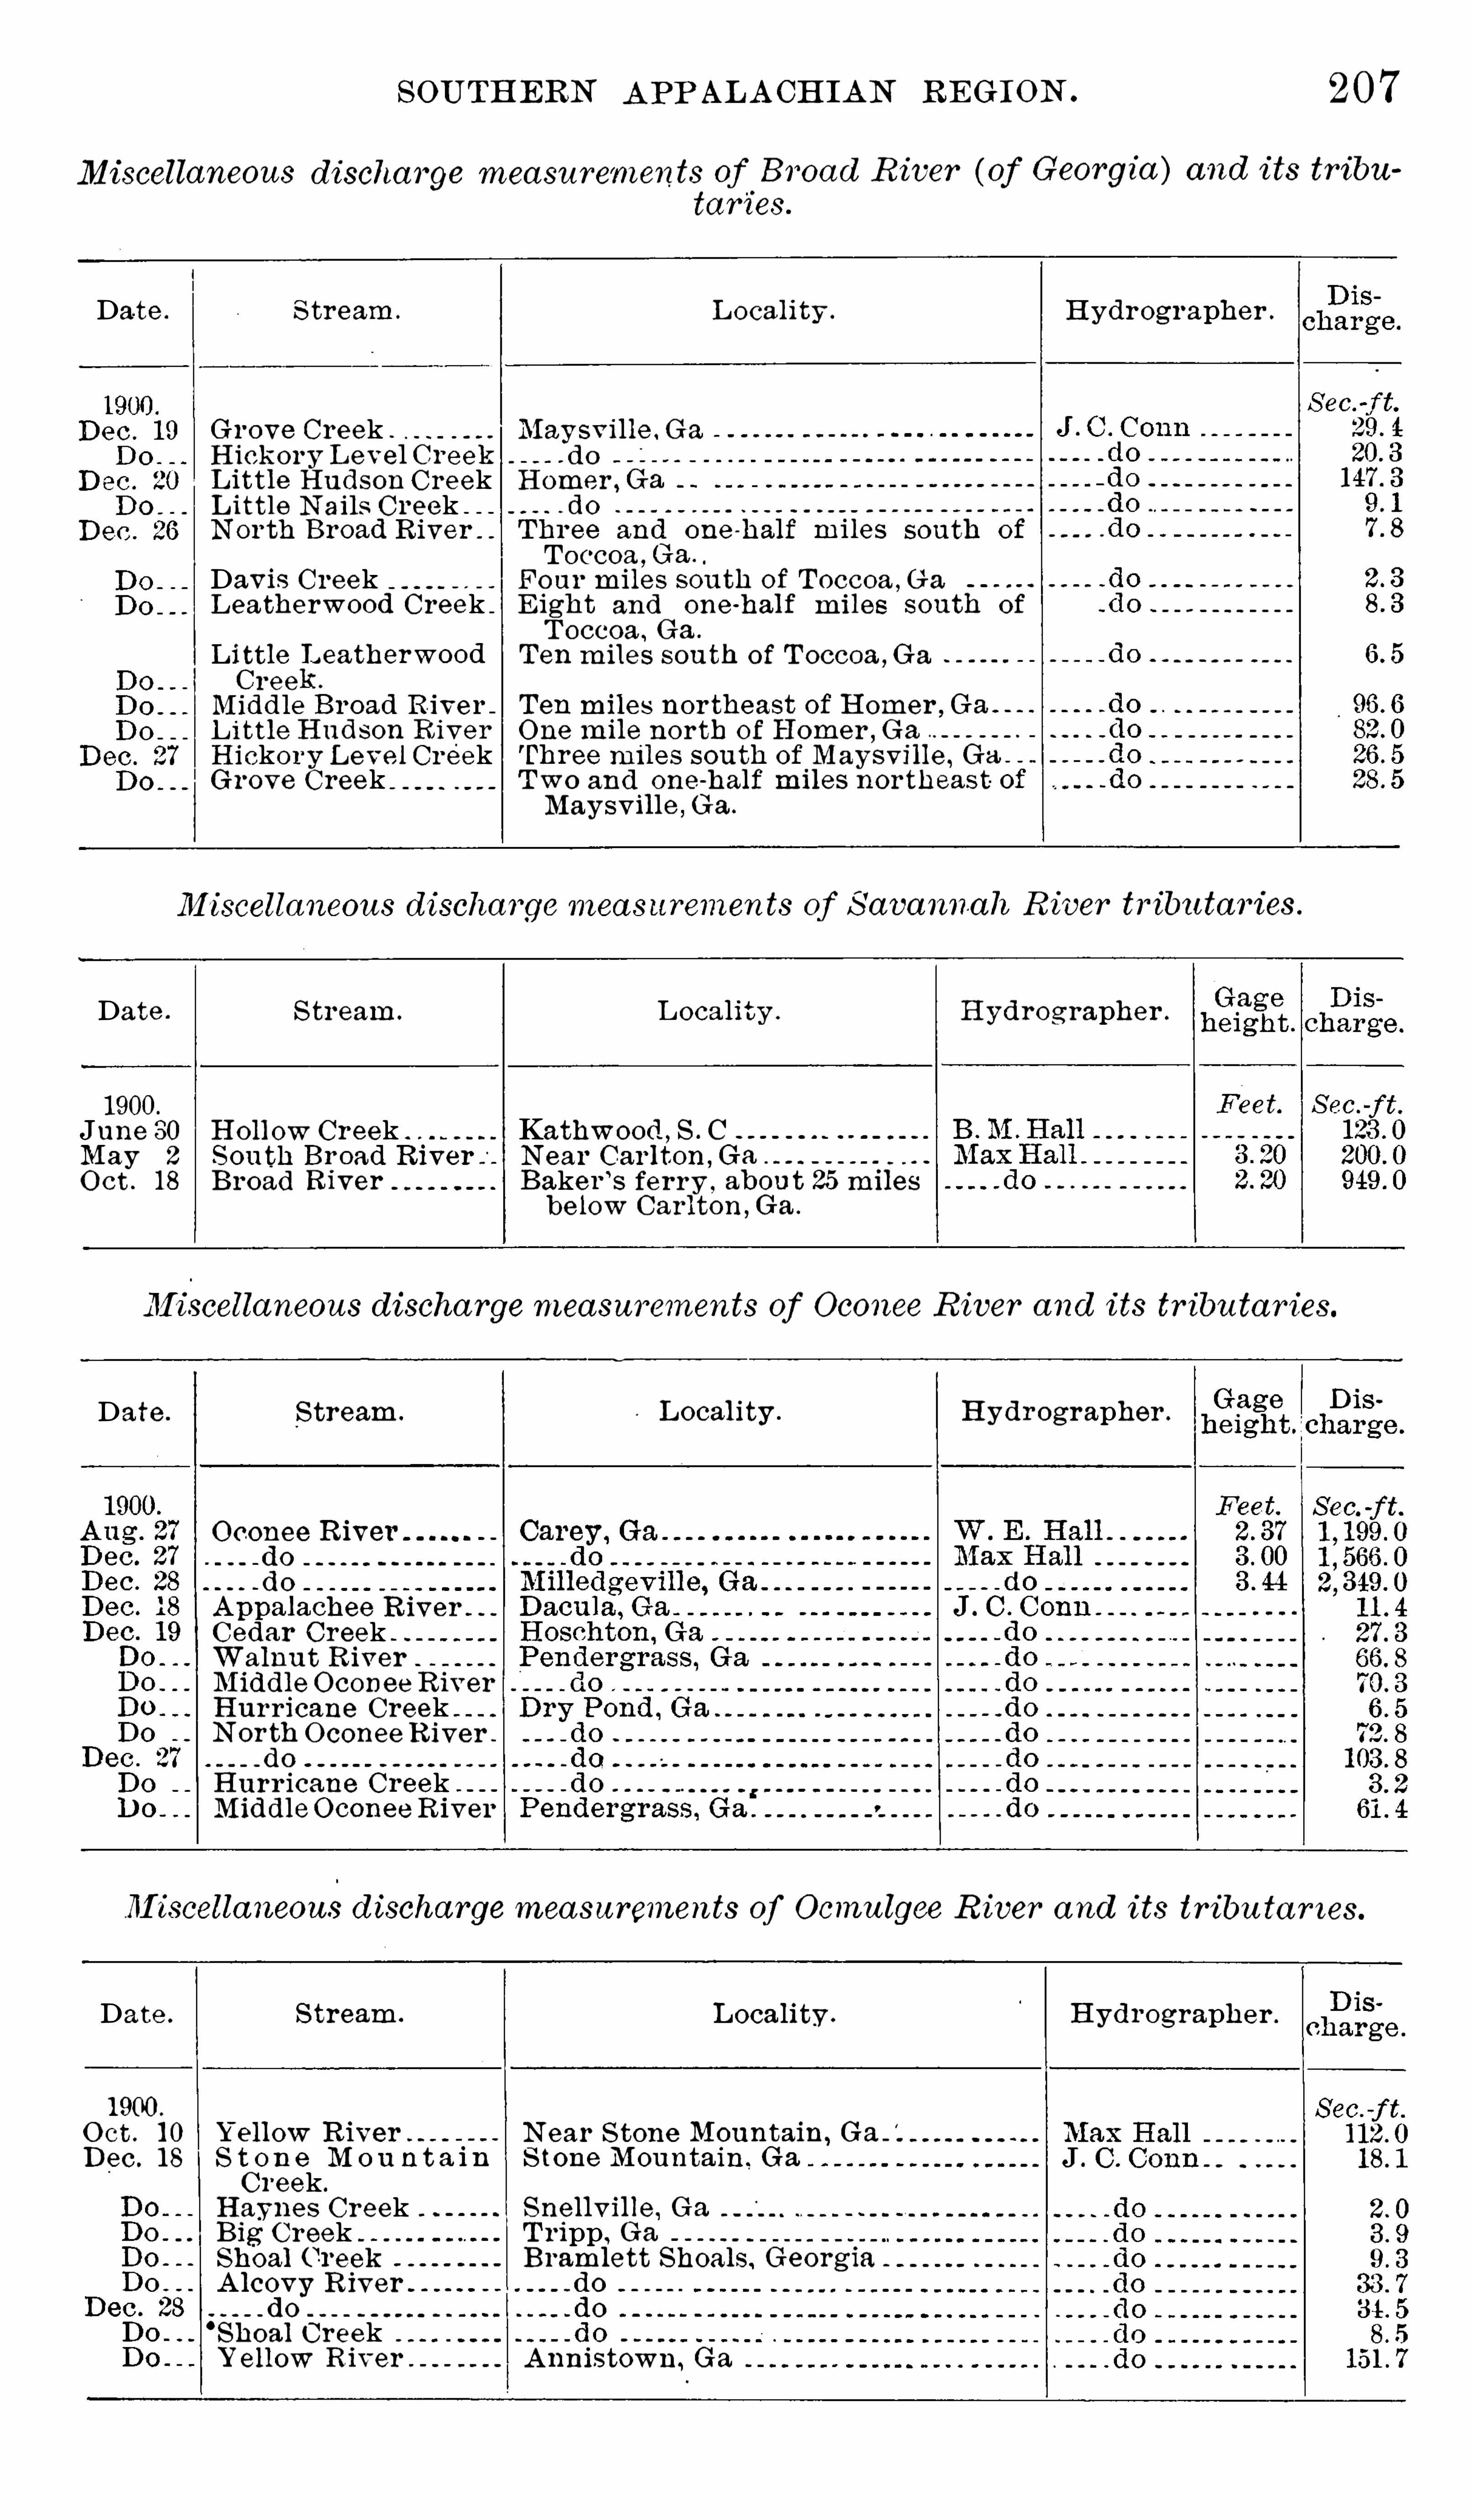
SOU THERN APPALACHIAN REGION . 207
Miscellaneous discharge measurements of Broad River ( of Georgia ) and i ts tributaries.
Date . S tream. Loca lity . Hydrographer .
Grove Creek . Maysville Ga
HickOI y Lewel C 1 eek do
L ittle Hudson Creek Homer , Ga
L ittle Nails C 1 eek do
North Broad River T hree and one -half mi les south of
T occoa , Ga .Davis Creek Four miles south of T occoa , Ga
Leatherwood Creek Eight and one-half mi les south of
T occoa , Ga .
L i
étle{geatherwood T enmiles south of T occoa , Ga
ree
Middle Broad River T enmiles northeast of Homer , Ga
L i ttle Hudson River One mile north of Homer , Ga
Hickory Leve l Creek T hree miles south Of Maysville , Ga
Grove Creek T wo and one-half milesnortheast ofMaysville , Ga .
Miscellaneous dischargemeasurements of S avannah River tributaries.
Date . S tream. L ocality . Hydrographer .
1900.June 80 Hollow Creek Kathwood , S . CMay 2 S outh Broad River .
' Neal Carlton , Ga
Oct . 18 Broad River Bake1 s ferry , about 25 mi lesbe low Carlton , Ga
Miscellaneous dischargemeasurements of Oconee River and i ts tributaries.
Date . S tream.1 Locality . Hydrographer .
Oconee Riverdo _
-doAppalachee RiverCedar CreekWalnut RiverMiddleOconeeRiverHurricane CreekNorth OconeeRiver
doHurr icane CreekMiddleOconeeRiver
Miscellaneous dischargemeasurements of Ocmulgee River and i ts tributa ri es.
Da te . S tream. Locality . Hydrographer
1900.
Oct . 10 Yellow River Near S tone Mountain , Ga - L
Dec . 18 S t one M o u n t a i n S tone Mountain , Ga
Creek .
Haynes Creek . Snellville , GaBig Creek T ripp , GaShoal CI eek Bramlett Shoals GeorgiaAlcoivy River -do
-
‘Shoal CreekYellow River Annistown, Ga

208 OPERAT IONS AT RIVER STAT ION S , 1900.
—PART III . 1110 49.
Miscellaneous discha rgemeasurements of Cha ttahoochee River and i ts tributa ries.
Date . S tream. L oca lity . Hydrographer .
Cane Creek Near Dahlonega , Ga
Yahoola Creek -do
Chestatee RiverS ingleton ditch doYahoola ditch do
Yahoola Creek Five miles above Dahlonega , Ga
Cane Creek Five miles nor th of Dahlonega , Ga
Wards Creek At mouth , Georgia
Charles Creek Near Louisv ille , Ga
T ates Creek Onemile abovemouth , GeorgiaMill Creek Near mouth , G eorg ia
T urner Creek do
Shoal Creek Above mining d itch. Geol giaChestatee River Below T urne1 Creek. Geo1 g iaT own Creek S ixmiles above mouth Georgia
-do T womi les above mouth, GeorgiaLoud ditch Near Henesey , Ga
Jennies Creek Near Pleasant Retreat , Ga
E. T essantee Creek At mouth , GeorgiaT essanteeRiver Near Pleasant Ret i eat , GaS hoal Creek Nearmouth , Ge0 1 gi aDukes Creek T wo mi les above mouth GeorgiaChat tahoocheeRiver Nacoochee , Ga
S antee Creek Atmouth , Ge0 1 giaS oque River Porter Mills, Georgia
Flat Shoa ls Creek Johnson smi ll , nea1 West Point , GaL ittle River Creek Nea1 L and , Georgia
G lades Creek F ive milesnortheast of Demorest GaHazel Creek Demorest , Ga
Miscellaneous dischargemeasurements of Etowah River and i ts tributa ries.
Date . Locality . Hydrographer
L i ttle River Arnold’smill . Georgia
Smithwick Creek Between Arnold ’s mill , Georgia , and
Creighton , Ga
Buzzard F l o p p e r do
Creek .
Board T ree Creek do
S ittingdown Creek Creighton , GaEtowah Rive1 Nea1 Hightower , Ga
Cogburns Creek do
Ye llow Creek Nea1 mouth , Georg ia
Amicalola River About 3mi lesabovemouth , GeorgiaSpr iggs Creek One mi le below Summerour place ,
Georgia .
L i
ét le
kAmi c a l o ] a Below Amicalola Falls.Georgia .
ree
Big Amicalola Creek Near Afton post -Oth ee , Ga
SpriggsCreek Near Juno post -office ,
Carder Creek Near mouth , GeorgiaParks CreekPigeon Creek Near Dawsonville , GaShoal Creek“Etowah River Near Auraria , Ga
W e st Am i c a l o l a Langston Ford , GeorgiaCreek .
Crane Creek BelowAmicalola Falls GeorgiaCarder Creek Nea1 Emma . Ga
Spr iggs Creek At S priggs Ford GeorgiaParks Creek Near Parks place , Geoi
b
gi a
M ill Creek Near mouth , Georgia
N imblewill Creek One mile above mouth , GeorgiaEtowah River Below mouth of N imblewill Creek ,
Georgia .
Montgomery Creek Near Randa , GaEtowah River Near Cartersv ille , GaPetits CreekPumpkinV ine Creek - doT own Creek Alice . Ga

21 0 OPERAT IONS AT RIVER STAT IONS , 1 900.
— PART 1 1 1 .
M iscellaneous dischargemeasurements of Coosa River tributar ies.
Date . S tream. L ocality . Hy drographer .
charge
1900.
Aug . 1 5 T al ladega Creek Kymulga , AlaAug T allesschatchee Creek Childe1
°
sburg ,AlaAug . 17 Hatchett Creek G oodwater ,Ala
M iscellaneous d ischa rgemeasurements of T a llap oosa River and i ts tributaries.
Date . S tream. L oca li ty . Hydrographer .
charge .
1900.
Apr . 7 T allapoosa River Muscad ine ,Ala
Aug . 2 L ongaha tchee Creek Meader’s bridge ,Alabama
Aug . 3 Blue Creek S usa 11na .A1aAug . 28 Elkhatchee Creek Island Home .AlaAug . 30 T imber Cut Creek W elche
’s ferry ,Alabama
NOV . 1 T a llapoosa Creek Cherokee Bluff ,Alabama
Dec . 12 Cha t tasafkee Creek Dadevi lle ,AlaDo S andy Creek Near Dadeville .Ala
JlI iscella neous discha rgemeasurements of New River and i ts tributaries.
Gage DisDate . S tream. Loca lity . Hydrographer .
height charge
S outh Fork of N ew Riverside , N . CRivel .
- do
Flannery FOrk
doMiddle Fork
- doEast Fork
doMeat Camp Creek
- doElk CreekOld Field CreekGap Creek One eig
“
hthmile abovemouth ,
NOI th CarolinaBeaver Creek At mouth , North Carolina
Mulberry Creek Near mouth. Nor th CarolinaPrather Creek One and one -halfmilesbelow
S cottville , N . C .
Nfir th Fork of New One mile below Creston , N . CIver .
do One-half mile from Creston,
N . C . , on road to S olitude ,
T hree T op Creek . Creston , N . C .
doBig Laurel Creek One hundred yards above
dmouth , North Carolina .
O
Buffa lo Creek One-eighthmile abovemouth ,
(1Nor th Carolina
o
Horse Creek One -fourthmile abovemouth ,
North Carolina-do
Below Peasley S mill , North
Carolina .
d- o
T wo mi les above mouth , V ir
ginia .
do .
Ford of Boone—Blowing Rockroad . Nor th Carolina .
Ford of Boone — Aho road ,
Ngrth Carolina .
0
- do
One-four th mile below Mor
etz , N . C .
do .
Elk crossroads, North Carolina


2 1 2 OPERAT IONS AT RIVER STAT IONS , 1900.
— PART III . [No - 49.
Miscellaneous discha rgemeasurements of French B road River , etc — Continued .
Da te . S tream. Locality . Hydrographer .
North Fork of Swan
nanoa RiverFlat CreekBeaver Dam Creek
-doLees C I eek
do .
Newfound C1 eek.
do
doReagt
és CI eek
"
rat cféé'
li III:do
S and y Mush Creek-dod o
T urkey Creekdo
Big Ivy River
L V Branch-do
M iscellaneous discha rgemeasurements of Nolichucky River and i ts tributa ries.
Da te . S tream. Loca lity . Hydrographer .
112121
53: chare eb
Nolichucky River Erwin , T enn- do
T oe River Near Huntdale , N . Cd- O -do
No1 th T oe River Sprucepine , N C- do do-do do-do do
do Plumtree , N. Cdo At £0 1 (1 of L inville - Cranberry
road , N orth Carolina .Kentucky Fork of At mouth , North CarolinaNorth T oe River .
Wh ite Oak Creek do
Horse Creek do _
do - do
Squirrel Creek One -four thmile abovemouth ,
North Carolina .
Roar ing Creek At mouth , North Carolina
Plum T ree Creek Plumtree , N . CHenson Creek Atmouth , North Carolina
T hreemile Creek Near Old post -Office at Elsie ,
doNea
é' S prucep ine , N Co _
S prucep ine , N . C .
T hree miles above Swannanoa post -oth ee , N . C .
T womi les belowBlackMoun
tain S tation ,N . C .
Fift y yards above mouth ,
North Carolina .
doOlivet te , N . C
doAt mouth , Nor th CarolinaT hree -fourths mile abovemguth , North Carolina .
0
At mouth North Carolina
doBailey . N C
- do-do
Blagikwell Spr ings. N Co
One-eighthmile be lowmouth'
of Bull Creek , North Carolina .
- do
One hundred yards abovemouth . North Carolina .
Onemile abovemouth , North
Carolina .
At mouth , North Carolina
One hundr ed yards abovemouth , Nor th Carolina .
T wo hundred yards abovemouth , North Carolina .
Near Hot S prings, N . C

2 1 4 OPERAT IONS AT RIVER STAT IONS . 1900.
— PART III . [No . 49.
M iscellaneous discha rgemeasurements of Nolichucky River , etc — Continued .
Date . S tream. L ocali ty . Hydrographer .
Bowlen Creek Near Burnsville , N . C .
do - doPrice Creek do
do -doBald Creek do
do doElk S hoal Creek At mouth . North CarolinaB a l d M oun t a i n Onemi le abovemouth , North
o
L ittle Bald Moun At mouth , North Carolinatain Creek .
doBig Creek
do
fi n d
M iscellaneous discharge measurements of S outh Fork of Holston River and i ts
tri butari es.
Date . S tream. Locality . Hydrographer .
1900.July 23 S outh Fork of H0 1 Belowmouth of Middle Fork ,ston River . Virginia .
Oct . 3 doJuly 28 Belowmouth of Laurel Fork,
V irginia .
Oct . 8 doJuly 28 Abovemouth of Laurel ForkV irg inia .
Oct . 8 do doJuly 27 do Rye Val ley , VirginiaOct . 1 doJuly 27 J im S cot Branch Atmouth VirginiaOct . 1 do -doJuly 27 Pomer Creek doOct . 1 do doJuly 27 Hogtrough Creek L ower ford ofmain i oad , Vir
ginia .
Oct . 2 do doJuly 27 S t . Clair Creek At mouth V irginia
Oct . 2 -do doJuly Grose Creek -doOct
y "
2 doJuly 27 Mi ll Creek One mile above mouth , Vir
ginia .
Oct . doJuly 28 Rush Creek Ford 100 y ards above mouth ,
Virginia .
Oct . 2 do doJuly 28 Laurel Fork of H0 1 One-half mile below Damas
ston River . cus,Va .
Oct . 3 doJuly 29 do Near Laurel bloomery , T ennessee.
DO do One -half mile above Laurel
bloomery , T ennessee .
Do Atcheson Creek Near head of Laurel , T enn
DO White T op Creek At mouth , VirginiaOct . 2 -doJuly 28 Beaver DamCreek Damascus, Va
Oct . 3 doJuly 23 Fifteenmile Creek At mouth ,VirginiaS ept 27 doJuly 21 DentonValley CreekS ept 27 doJuly 21 Wolf Creek Lower ford of main road up
the r iver , Virginia .July 23 doS ept 27 do .
Ju y 2 1 Spring Creek One mile above mouth ,V ir
ginia .
Sept . 27 do do
a Almost dry .

SOU T HERN APPALACHIAN REGION . 21 5
Miscellaneousdischa rgemeasurementsof S outh Fork of HolstonRiver ,etc.
Date . S tream. Local ity .
Jacobs Creek At mouth , T ennessee
do -do
S harp Creek -do
do do
Fishdam Creekgo
oJonah Creek dodo
Riddle Creek do
do -do
T homas Creek Below railroad bridge , T ennessee .
S inking Creek Atmouth , T ennessee
do - do
do One half mile above Paperv ille, T enn .
One-half mile above mouth ,
T ennessee .
Hatcher CreekMiddle Holston Five milesabove mouth , Vir
giniado -do
Middle Fork ofHols S evenmile ford ,Virginiaton River .
-do Above mouth of Bear Creek ,Virginia .
do -do
BeagCreek At mouth , VirginiaO
S taleys Creek Man on ,Va
Hungry M o t h e r Ford of main road fromMa
Crieek . rion , Va .
o
Byaé'
s Creek At mouth. Virginiao
Walker Creek Fifty yards above mouth ,
Virginiado -do
Hutésons Branch At r
amuth , Virginiao
Halls Creek doCedar Creek doHogthief Creek One-half mile above mouth ,
(1Virginia .
o
Hydrographer .
n o c q
n —Q o- p
Gage Disheight . charge.
Miscellaneous dischargemeasurements of Wa tauga River and its tributaries.
Date . S tream. Locality .
Watauga River Elizabethton , T enndo dodo dodo -do
do - dodo -do
do -dodo Watauga Falls,N . C
-do - dododo One mile above Shull
’s mill ,
dNorth Carolina .
0
Boone Fork of Wa
tauga River .
doMoody Mill Creek do
Laurel Creek (up -do
per ) .- .do - odDutch Creek Valle Cruces,N . C-do do
Cove Creekdo -do
S hull’smill , North
Atmouth North Carolina
At mouth North Carolina
Hydrographer .
o n
Gage Disheight . charge .

21 6 OPERAT IONS AT RIVER ST AT IONS , 1900.
— PART 1 1 1 . [Ne w
Miscellaneous dischargemeasurements of Wa tauga River , etc.— Continued .
Date . S tream. Loca lity .
Cove Creek Abovemouth of Brushy Fork ,L . V . Branch
North Carolina .
Bréush Fork of Cove At mouth , North Carolina doree
Rockhouse Creek dodo E. W . MyeI S
Laurel Creek ( lower ) L . V . Branchdo E . W . Myers
Beaver DamCreek Near Leander ,N C L .V . Branchdo E. W . Myers
Beech Creek Abovemouth of Fogey Creek , L .V . BranchNorth Carolina
do E. W . My ersFogey Creek At mouth , North Carolina L . V . Branch
- do E. W . MyersBig Dry Run One -eighth mile abovemouth ,
L . V . BranchNorth Carolina .
Elk Creek One -half mile below mouth - do
of the L ittleElk , T ennessee .
S outh Fork of Elk At BannersElk , North Caro do
Creek . lina .
- do E. W . MyersNorth Fork of Elk L .V . Branch
Creek .
do E. W. MyersCranberry CI eek Cranberry , N . C L . V . Branch
Blevins Creek do doLittle Elk Creek At mouth , North Carolina do .Dark Ridge Creek One half mile above mouth , do
T ennessee .
Roan Creek Above mouth of M ill Creek , E. W . MyersT ennessee .
Key S tation , T enn L . V . BranchNear mouth , T ennessee do
At Shoun crossroads, T en -doh essee .
doAt mouth , T ennessee F . W. MyersMouth of Doe ( town ) , T enn - do
L . V . Branch
E. W . MyersIvyspring post -offi ce , T en L . V . Branchnessee .
S tony Creek One-half mile above mouth , doT ennessee .
do d- O E. W. Myersdo do . Ernest Graves
DoeRiver Above Elizabethton, T enn L . V . Branchdo -do - oddo do E. W . My ersdo do Ernest Gravesdo Near Allentown , T enn L . V . Branch
-do -do dodo -do E . W . Myersdo T womiles belowRoan Moun L . V . Bra
ynch
ta in , T ennessee .
She ll Creek At mouth , T ennessee doWilson Creek One mile above mouth , T en do
nessee .
Little DoeRiver Allentown, T enn dodo do E.W . Myersdo -do -do
Laurel Fork of Doe do L . V . BranchRiver .
do do - dodo do E. W . My ersdo _do -do
Gap Creek Atmouth , T ennessee L . V . Branchdo -do E . W . Myers
Buffalo Creek do L . V . Branchdo - . do E. W . My ers
S ink ing Creek Lower ford of Johnson City L V BranchElizabethton road , T ennes
Oct . 4 - .doJuly 19 Brush Creek Near Carter , T ennAug . 16 doS ept . 24 do

21 8 OPERAT IONS AT RIVER ST AT ION S,1900.
— PART III . [No . 49 .
Miscellaneous dischargemeasurements of H iwassee River , etc — Continued .
Date . S tream L ocality . Hydrographer .
1900.
Aug . 17 L ost Creel Near Reliance , T enn
S ept . 4 do - do
Aug . 17 Ellis Creek doDO Spring CI eek At mouth , T ennessee
S ep t . 4 do doAug . 18 Childers Creek Near Reliance . T ennDo _ Spring Creek Spr ingtown , T ennDo Conasauga Creek Mecca , T en -n
S ept . 3 do Near Jalapa , T enn
M iscellaneousdischargemeasurements of T occoa'
Okoee) a River and i tstributa ries.
Date . S tream. Locality . Hydrograph er .
GEORG IA.
Weavers Creek Near Blueridge
S tarr Creek Near Morganton
German Creek doWilscots Creek Near WilscotsPersimmon Creek“T occoa Rive1 _ DialNoontootly Creek Near mouthBig Creek T hree miles fromNoontootly CreekSkeinah Creek One mile above mouthRock Creek Near mouthCoopersCreek One mile above mouthT occoa River GaddistownSuches Creek Near GaddistownMi ll Creek One mile abovemouthT occoa River One-half mile above Mill Creek
T ENNES SEE .
Aug . 15 S ylco Creek At mouthDo _ Greasy Creek .
Aug 16 Okoee ( T o c c o a ) ParksvilleRiver .
DO Bakers Creek . - doS ep t . 4 Greasy Creek Above mOuth of Rock CreekS ept . 5 Ol
fioee T o c c o a ParksvilleIver .
a After entering T ennessee the T occoa is known asOkoee River .
OLENTANGY RIVER AT COLUMBU S , OHIO .
This station was established November -22,1 898
,at the F ifth ave
nue bridge, Columbus. It is described in Water- Supply Paper No .
36, page 1 75 . T he Observations Of river heights are made under the
general direction Of Prof . C . N . Brown,of the Ohio S tate University .
Records Of measurements for 1 899 will be found in the Twenty -first
Annual Report , Part IV , page 1 69. A number Ofmeasurementsmadein the latter part of 1 899 were not published in the foregoing reports,and they ,
together with a measurement made on March 8 , 1 900, aregiven in the following list
October 13 , 1899 : Gage height , 1 foot ; discharge, 7 secondffeet .
October 13 , 1899 : Gage height , 1 foot ; discharge, 7 second-feet .
Octoben 1 4 , 1899 : Gage height , 1 foot ; discharge , 7 second-feet.

OHIO. 2 19
October 20, 1899 : Gage height , 1 foot ; discharge. 7 second-feet .
November 17 1899 : Gage height , feet ; discharge, 44 second-feet .
December 2 , 1899 : Gage height , feet ; discharge, 1 5 second-feet.
March 8 , 1900: Gage he ight , feet ; discharge, Second-feet.
Da i ly gage height, in feet, of Olenta ngy River a t Columbus, Ohio , for 1 900.
Jan . Feb . Mar . Ap r . May . June . July . Aug . S ept . Oct . Nov . Dec .
- Q
- fi
n n n n n n n n n n n n n n
t n “
n - C
SCIOT O RIVER AT COLUMBU S,OHIO .
This station was established November 22,1 898
, at the Grandviewavenue bridge ,
Columbus. It is described in Water-Supply PaperNo . 36
, page 1 76 . T he Observations are made under the generaldirection Of Prof . C . N . Brown
,Of the
'
OhiO State Un iversity . Meas
urements for the year 1 899 will be found in the Twenty-first AnnualReport , Part IV , page 1 70 . A number of measurementsmade in thelatter part Of 1 899 were not published in the foregoing reports, andthey ,
together with the measurementsmade in 1 900, are given in the
following table :
Discha rgemeasurements of S cioto River a t Columbus, Ohio .
Date .
biggie} . Discharge . Date .
hggfhi .
Discharge .
14 Dec . 2, 189913 Jan . 18, 190014 Feb . 15 , 1900 .
33 Mar . 7 , 1900

220 OPERAT IONS AT RIVER STAT IONS , 1900 .
— PART II I . [No . 49.
Da i ly gage River a t Columbus, Ohio , for 1 900.
June. Oct . Nov.
MAUMEE RIVER NEAR VVAT ERV ILLE,OHIO .
Th is station was established on November 1 9,1 898
, by H . A . Pres
sey and B . H . Flynn . It is located at the highway bridge near Water
ville ,the gagings beingmade on the downstream S ide . It is described
in Water- Supply Paper NO. 36, pages 1 78 and 1 79
,where will also be
found the results‘
Of the discharge measurementsmade during 1 899 .
During 1 900 the following measurementswere made by B . H . FlynnJuly26 : Gage height , feet ; discharge , second-feet .
November 24 : Gage height , feet ; discharge , second-feet.
Da i ly gage height , in feet, of Maumee River nea r Wa tervi lle, Ohio , for 1 900.
Sept . Oct . Nov . Dec .
- Q

222 OPERAT IONS AT RIVER STAT IONS , 1 900.
— PART III . [No . 49.
Da i ly gage height, in feet , of S andusky River a t Fremont, Ohio , for 1 900.
Jan . Feb . June . Aug . S ept . Oct . Nov . Dec .
Q Q Q Q Q Q Q Q Q Q QQQQ
Q - O O - l ‘
Q
SENECA RIVER AT BALDW INSVILLE,NEW YORK .
Records Of the stations on the New York streamsw hich belong tothe coast drainage will be found inWater-Supply Paper NO . 4 7
, pages42 to 80. A number Of the streams Of that S tate on which Stationshave been established belong to the Great Lakesdrainage , and following the geographic arr angement which has been determined upon forthe publication Of the records contained in these reports, the recordsfor these stations are inserted On this and the following pages. T he
methods employed in the gaging Of these streams isdiscussed on pages
37 to 4 1 Of Water-Supply Paper NO . 47,where will also be found a
list Of the gaging stations in New York State,a table Of the current
meter measurementsmade during 1 900, a table Of the drainage areas,
and other interesting information .
T he gaging station on Seneca River at Baldwinsville isdescribed inWater-Supply Paper NO. 36
, page 1 83 . This river drains the centrallake region Of New York . T he out lets Of Ot isco , Skaneateles, andOwasco lakes are crossed by Erie Canal , and a portion Of their flowis intercepted for water-supply purposes. Water from Lake Eriefeeds the main canal as far as Port Byron . Some Of thiswater is discharged into Seneca River , and thence is delivered into Lake Ontario .
T he upper reachesof Seneca River are canalized , forming theCayugaand Seneca canals, while dams On the lower portion admit Of S lackwater navigation ,
forming a part of Oswego Canal . During the summer but littlewater flows over the dam at Baldwinsville . In times Of

NEw YORK . 223
low water the mills are allowed to run a certain number Of hours during the day ,
or until the supply accumulated in the pond above the
dam is drawn down to a certa in level . T he water isdiverted throughthree power cana ls, and is conducted to the waterwheels by means Of
short lateral channels. T he lOS S through leakage Of wheel gates,flumes, and penstocks is considerable .
T he following current-metermeasurementswere made at Baldwinsville :June 1 1
,1900 S econd - feet .
Amos raceOswego Canal
Main stream at railroad bridge1
T otal flow
September 1 1 , 1 900 ( 11 0 water flowing over dam)South S ide Canal
Oswego Canal
Amos race
T otal fiow
T he Baldwinsville record Shows a relatively low run-Off for thisStream. T he 1 900 record is withheld for the present , add itiona lmeasurements to determine leakage , etc .
,being needed .
CHIT TENANGO CREEK AT BRIDGEPORT,NEW YORK .
This station is described in Water- Supply Paper NO. 36, page 1 84 .
A current-meter measurement was made at a highway bridge belowthe inflow of Butternut Creek ,
near Bridgeport , on June 1 6 , 1 900, andthe total flow of Chittenango Creek at that point was found to be 95second- feet . T he stage of the stream
,as shown by the record kept
at Bridgeport , was uniform for several days. T he mean flow,as
computed from the gage readings was 95 second - feet for June 1 5 and
1 6 . There is no Opportunity to measure separately .the dischargethrough the turbines or the leakage Of the dam at this station
,and
an allowance Of 1 5 second - feet has been made for the leakage Of the
dam and the dike leading to the old sawmill . T he sawmill,S ituated
on the left side Of the stream,runs very irregularly . T he water
wheels are Old,and the penstocks leak considerably . On June 1 6 a
current-meter measurement wasmade in the headrace leading to thesawmill : T he water wheels were running, and the flow was found tobe second-feet .
T he relatively low run-Off fromthe watershed Of Chittenango Creek,asshown in the accompany ing tables,may be attributed to the d iversionof a port ion Of the flow to supply the summit level Of Erie Canal .State dams are located on the main stream at Chittenango ,
and on
its two tributaries, Limestone Creek and Butternut Creek . CazenoviaLake, Erieville, De Ruyter, and Jamesville reservoirs impound stor
1 Including S outh S ide Cana l .

224 OPERAT IONS AT R IVER ST AT IONS , 1 900.
— PART III . [N0 . 49.
age, by wh ich the flow is regulated to some extent . Water is alsodiverted from T ioghnioga River , entering the Orville feeder throughLimestone Creek .
Additional information in regard to this creek will be found in
Water- Supply Paper NO . 47, pages 37 to 4 1
,in a paper entitled“Methods employed in the gaging Of New York streams during the
year
Da i ly d ischarge, in second-feet, of Chi ttenango Creek a t Bridgeport, New York
for 1898 .
[Drainage area , 307 square miles ]
- 0 - C
Mean
a Sunday .
Da i ly d ischa rge, in second-feet, of Chi ttenango Creek a t Bridgeport , New York,
for 1 899 .
June . July . Aug .
- Q
- . Q
- Q o fl v fl fi ‘ .
- o
- o
Mean
0 Sunday .

226 OPERAT IONS AT RIVER STAT IONS , 1900.
— PART II I . two . 1 9 .
At Oneida is a S tate dam divertingwater for the supply of the summit level of Erie Canal . NO measurements Of diversion to the feederhave been made . Practically the entire flow of Oneida Creek
,less
leakage of the dam,is taken for this purpose during the low-water
season .
Additiona l information in regard to this creek will be found in“l ater- Supply Paper NO . 47, pages 37 to 4 1
,in a paper ent itled“Methods employed in the gaging Of New York streams during the
year
Da i ly discha rge, i n second-feet,of Oneida Creek a t Kenwood , New York, for 1 898 .
[Dra inage area , 59 squaremiles ]
Dec .
Mean
a Sunday .
Da i lg discharge, in second-feet, of Oneida Creek a t Kenwood ,New York, for 1899 .
- u
Mean 1 17
a Sunday .
NOT E — No record for August and S eptember .


228 OPERAT IONS AT RIVER S T AT ION S , 1 900 .
— PART I I I . [NO- 49
Da i ly discharge, in second -feet, of West Branch of Fish Crmk a t McConnel-lsvi lle,
New York, for 1 898 .
[Dra inage area ,187 square miles ]
NOV . Dec . Nov . Dec .
a Sunday .
Da i ly discha rge, in second-feet. of W'
est B ranch of Fish Creek a t McConnellsvi lle,
New York, for 1899.
Mar . Apr . May . Jan . Feb . Mar . Apr .
n n n n n n n n
a Sunday .

230 OPERAT IONS AT RIVER S T AT IONS , 1900.
— PART II I . [No . 49.
weight gage is used , being suspended from a framework projectingover the water beyond the low-water margin . T he position Of the
Weight when the gage reads zero has been determined with referenceto a fixed bench mark . T he gage is SO arranged that the readingsare reversed , thus, would be extreme low water
,and when the
water rises the readings are less. Morning and evening readings are
taken ,usually twelve hours apart , and the average Of the two read
ings is given in the table .
A current-meter measurement was made at the cable station on
S eptember .1 5 . T he mean gage height during the measurement wasfeet , and the discharge second - feet . This does not include
the diversion through Oswego Cana l . T he lowest water on this streamusually occurs Sundays, due to the stopping Of Water wheels and the
consequent refilling Of ponds.
In this connection reference may be made to the gaging recordwhich wasmainta ined by the United S tates Board Of Engineers 0 1 1Deep Waterways on Oswego River at the Oswego Falls dam fromNovember
,
'
1 898,to May ,
1 899,inclusive . A description of this sta
tion will be found in Water-Supply Paper NO . 36, page 1 88 .
T he dra inage areas tributary to Oswego River at the different gaging stations
'
are as follows
Dra inage a rea s of Oswego River .
AtmouthAt high damnear Oswego
At cable station
At Fulton
Additional information in regard to this river will be found inWater-Supply PaperNO . 4 7 pages 37 to 4 1 , in a paper entitled “MethOds employed in the gaging Of New York streams during the year
Da i ly gage height, in feet, of Oswego River aboueM inetto ,New York, for 1 900.
Nov . Dec . S ept . Oct . Nov . Dec .
a No record . bNew weigh t gage . cU sed board gage .

NEW YORK . 23 1
OSWEGO RIVER AT HIGH DAM NEAR OSWEGO,NEW YORK .
A description Of this station ,with tables Of daily gage heights, will
be found in Water-Supply Paper NO . 36, page 1 89. T he dam is of
masonry ,with a crest feet long. Flashboards are ma intained
On the dam.
during the greater part Of the year . When fiashboards
are on ,the flow over the dam hasbeen computed bymeansOf Francis’s
formula,with a constant coeffi cient Of In estimating the flow
over the dam when fiashboards are removed a d ischarge curve hasbeen prepared ,
uS ing coefficients in the weir formula derived fromCornell University experiment NO . and taking into considerationirregularities in the profile of the crest .
A headrace at the left.
end Of the dam d iverts water to supplypower to an electric - light plant and to thewaterworkspumping station .
There are 8 water wheels in use . A regul ar record Of the run Of the
water wheels has not been kept, and the d iversion for this purposehas been estimated fromcurrent-metermeasurements in the headrace .
Power diversions a t high dam nea r Oswego .
Working MeasDate . head on ured d iswheels. charge .
1900.
Three pairs Of water wheels,which were in operation when the fore
going measurements were made,are run twenty
-four hours a day
Taking the average Of the foregoing measurements and adding 1 05
second - feet for the additiona l pa ir of wheels,the diversion for water
power has been estimated at 450 second -feet,as a round figure .
T he flow from an auxiliary spillway in the end Of the headrace hasbeen ca lculated from the weir formula
,using coefficients derived by
Bazin for a dam hav ing a S imilar crest section .
Some uncerta inty attaches to the record at this station during the
Spring months, owing to the carrying away Of the fiashboards by highwater at dates not defin itely ascerta inedIn the accompanying tables of monthly and daily mean flow no
allowance has been made for d iversion to Oswego Canal .Additional information will be found in Water- Supply Paper No .
4 7, pages 37 to 4 1
,in a paper entitled “Methods employed in the
gaging Of New York streams during the year1 S ee Proc . Am. S oc . C . E. , March , 1900, p . 274 .

232 OPERAT IONS AT RIVER ST AT IONS , 1 900.
— PART III .
Da i ly d ischa rge, in second-feet, of Oswego River a t high dam nea r Oswego ,New
York, for 1 897 .
Nov .
IMEan
a Sunday .
Da i ly discha rge, in second-feet,of Oswego River a t high dam near Oswego , New
York, for 1 898 .
Aug . S ept . Oct .
. g
925
a Sunday .

234 OPERAT IONS AT RIVER STAT IONS , 1900 .
— PART III . [No . 49.
SALMON RIVER ABOVE PU LASKI,NEW YORK.
A current-meter station was established on this stream September 5 ,1 900. It is located at a highway bridge 2 miles from the V i llageOf Pulaski . T he stream bed isOf gravel , the banks are bold , and thechannel
'
bottom is nearly flat . T he gage board is attached to the cen
ter pier Of the bridge , and readings are taken twice da ily ,at 6 a . m.
and at 7 p . m. T he mean Of the two Observations for each day is
given in the table . A current-meter measurement made on September 4 showed a discharge Of 1 03 second - feet . T he mean gage read ingduring the measurement was feet . There are 3 dams at Pulaski ,furnishing power to 1 4 establishments. T he total effect ive headObtained varies, with the stage of the stream
,from 24 feet to 36 feet .
There is an undeveloped power , with a precipitous fa ll Of 1 1 0 feet ,at Salmon Falls. In November
,1 898
,a gaging stat ion was estab
lished by the United States Board Of Engineers on Deep Waterways
1 mile above these falls,but it was abandoned in June
,1 899 . A
description Of the station will be found in Water-Supply Paper NO.
36, page 1 90 . T he drainage above the abandoned gaging station is
1 91 squaremiles,while that above the bridge stat ion near Pulaski is
264 square miles.
Additional information regarding this river will be found in VVaterSupply Paper NO . 47
, pages 37 to 4 1,in a paper entitled “Methods
employed in the gaging Of New York streams during the year
Da i ly gage height, in feet, of S a lmon River above Pulaski , New York , for 1 900 .
S ept . Oct . Nov . Dec . Sept . Oc t . NOV . Dec.
MOOSE RIVER AT MOOSE RIVER,NEW YORK .
On June 5 , 1 900, a gaging station was established on this stream at
Moose River,4 miles below the McKeever railroad station . T he sec
tion Of the channel chosen to be spanned by a cableway has a widthOf 225 feet , with a nearly fiat gravel bottom. A vertical gage boardwas attached to a pile driven out in the stream beyond the low-water
margin and protected from ice and logs by a floating boom anchoredupstream.
‘Moose River is characterized throughout its entire course by rifts

NEW YORK . 235
and rapids. Topographically the watershed is rocky , precipitous,and mostly timbered . T he dra inage area above the gaging station is346 square miles. An area Of 4 1 square miles in the headwaters issubject to regulation by storage , controlled by a S tate dam at Old
Forge, at the foot Of the Fulton Lakes.
- There are numerous undevelOped water powers on the stream
,includ ing two falls near LyOnS
dale, where a head'
of 30 or more feet might be Obta ined , and another(Millers Falls) Of nearly equal height below the town Of Moose River .
Water power is developed at 8 dams,a total fall Of 225 feet being
utilized,the aggregate capacity Of the turbines installed being more
than horsepower .
l
NO current-meter measurements have thus far been made . Gage
read ings are taken twice da ily ,morn ing and evening,
and the mean
Of the two read ings for each day is given in the accompany ing table .
Add itiona l information in regard to this river will be found inWater-Supply PaperNO . 47 pages37 to 4 1 , in a paper entitled“Methodsemployed in the gaging Of New York streams during the year
Da i ly gage height, in feet, of Ilfoose River a t Moose River , New York, for 1 900.
June . July . Aug . S ept . Oct . Nov . June . July . S ept . Oct . Nov .
- Q
BEAVER RIVER,NEW YORK .
'
Beaver River rises in the western part Of Hamilton County ,crosses
Herkimer County ,and emerges from the Ad irondacks at the town Of
Number Four; on the Lewis County line. T he flow from the tributary watershed above Beaver
,comprising an area Of 1 53 squaremiles
,
or per cent Of the entire drainage area,is regulated by storage
in the Beaver Flow or S tillwater, an artificial lake formed by a timberdam 1 6 feet high . In addition to the reservoir formed by the Statedam at Beaver
,there are within this region more than 50 natural
lakes,including Red Horse Cha in
,SO that a compara tively un iform
flow ismainta ined throughout the summer season .
An examination Of Beaver River with reference. to facilities for gaging wasmade early in July ,
1 900 . T he almost continuous rapids inthe upper reaches Of the stream limit the desirable S ites for gagingstations to the stream channel below Beaver Falls
,4 miles from its
confluence with Black River at Castorland . Arrangements were

236 OPERAT IONS AT RIVER STAT IONS , 1900.
— PART I II . [N0 49.
made for the establishment Of a cable station,but owing
.
to the pres
ence of log rafts in the stream during the greater portion Of the
summer the record has not yet been started .
From‘
the State dam at Beaver to the town Of Number Four,a d is
tance Of 1 0 miles, the stream consists Of numerous bowlder rapids,a lternating with short stretches Of smooth water . Above Beaver
Lake there is a high fall , forming a descent Of 60 feet within a d is
tance of 400 or 500 feet . From the foot Of Beaver Lake to Belfort,a
distance of 1 2 miles, the stream channel continues rocky and pre
cipitous, a lthough the adjacent watershed is sandy and for the most
part covered with t imber . Eagle Falls, 2 miles below Beaver Lake,
consists Of a series of cascades,aggregating a descent Of 75 feet .
There are a number Of other undeveloped . water powers in thisV icin ity .
Water power is developed at Beaver Falls,at Croghan ,
and at
Belfort , aggregating horsepower , at five dams, and utilizing a
fall Of 1 33 feet . There is a lso an abandoned power at Tisses Falls,
below Belfort,where a tota l head Of 60 feet could be Obta ined . Power
is developed at Belfort,under a head Of 50 feet
,for the generation Of
electr icity which is transmitted to ad jacent towns,a distance Of 1 6
miles.
Ra infall and other meteorological records have been kept S inceJanuary ,
1 889,at Number Four
,in the heart Of the timber- covered
portion Of the watershed .
Additiona l information regarding this river will be found inWater
Supply Paper NO . 4 7, pages 37 to 4 1 , in a paper ent itled“Methods
employed in the gaging Of New York streams during the year 1 900
BLACK RIVER AT HU NT INGT ONVILLE DAM,NEAR WAT ERT OWN
,NEW
YORK .
A description of this station,includ ing tables Of daily gage heights,
will be found in Water-Supply Paper NO . 36, page 1 91 . T he entire
flow Of Black River at this point , aside from leakage and a slightdiversion for the municipa l water supply Of Watertown
, passes over
the Huntingtonville dam. T wo or more readings Of the crest gageare taken da ily ,
and the mean of the readings frommidnight to midnight has been used in estimating themean da ily flow . In computingthe flow over the dam
,an allowance Of 200 Second- feet has been made
for leakage through seams and crevices in the limestone rock underly ing the dam. This amount has been arrived at from an estimate Of
the size Of the orifices and the head on the same,when the water was
drawn down in the summer Of 1 897
There is no way to check direct the flow during high water immed iately below the dam
,but a current-meter measurement was made
at Glenpark Bridge on June 6,1 900
,which gave a total flow of
second - feet .
T hemean da ily flow for the years 1 897 , 1 898 , 1 899, and 1 900 is given

238 OPERAT IONS AT RIVER S T AT IONS , 1900.
— PART II I . [No . 49.
Da i ly discha rge, in second-feet, of B lack River a t Hun'
tingtonvi lle dam,New York,
for 1 898 .
May . June . Nov . Dec .
n n n n n n n n n n n n
h
n - n n u - n n q u fl c
d h - d
a Sunday .
Da i ly d ischarge, in second-feet , of B lack River a t Huntingtonvi lle dam,New York,
for 1 899.
Mar . Ap r . May . June . July . Aug . Sept . Oct .
Mean 897
a Sunday .
a 3 , 9l5
a 8 , 1 16
a 13 806
3 , 775a4 , 484
a 24, 9503 , 500
a2, 393
a20 350 3 362U
005 O

MICHIGAN . 239
Dai ly discha rge, in second-feet , of Black River a t Huntingtonvi lle dam, New York,
for 1 900 .
Mar . Aug . S ept . Nov . Dec .
Mean
a Sunday . b S luice gates Open .
GRAND RIVER,MICHIGAN .
1
This is the largest stream in the State . Its drainage basin ,which
includes a total area of square miles,is S ituated in the central
portion o f the lower pen insula , and drains into Lake Michigan . It
lies in the southern border of thepine belt and is for the most partcleared . Occasional tractsof forest remain ,
however,as
,for example ,
S locum’s Grove, in Muskegon County ,
which forms a part Of the
dra inage basin of Crockery Creek,and contains between and
acres of hardw ood and hemlock timber , now being lumbered .
T he basin is overlain with glacial drift ‘
deposits,'
including sand,clay ,
overwash , gravel , and till , with outcroppings of rock at rare intervals.
A stratum of limestone,said to be 52 feet thick
,appears in the east
S ide of the bed of Grand River at Grand Rapids, 100 feet above the
Pearl street bridge. It dips in a northeasterly direction ,at a S lope of
50 feet to the mile, and does not appear in the west side cana l . T he
watershed receives an annual ra infall vary ing from 25 inches in
the region of the headwaters to 30 or 35 inches near the mouth of theriver . From the foot Of the rapids formed by the limestone ledge at
Grand Rapids to the mouth of the river at Lake Michigan the flow is
1 Report of Rober t E . Horton.

240 OPERAT IONS AT RIVER STAT ION S ,‘
1900.
—PART IiI . [No . 49.
very sluggish ; the fall in this portion is given below ,from levels run
by Mr . Fred Morley ,United States assistant engineer .
Fa ll of Grand River between Grand Rap ids and i tsmouth .
S ection .
G rand Rapids to GrandvilleGrandville to Lamont
L amont to Grand Haven
In the upper half Of this stretch of the river the immediate banksof the stream are high ,
sometimes forming natural levees at elevat ions greater than that of the adjacent flood plain . Mr . Morley statesthat below Lamont bayous and low swamps are common between theriver banks and the foothills bordering the valley . T he valley as a
whole is narrow ; gravel bluffs from 50 to 60 feet high occasionallystand close to the stream. T he r iver below Grand Rapids has beenadjudged navigable , and a project hasbeen formed for its canalization
,the plan being for a waterway, with a navigable depth of 1 0 feet ,
connecting the city of Grand Rapids with Lake Michigan .
T he drainage areas of thema in stream and its tributariesat variouspoints are given in the follo
'
wing table
Dra inage areas of Grand River and i ts tributaries.
S tream. Location . Area .
G rand River Above LansingRed Cedar River Above mouth
G rand River Below mouth of Red Cedar River .
Above Port landLookingglass River Above mouth
G rand River Below mouth of L ook ingglassRiverAbove Ly ons
Maple River Above Maple RapidsDo Above mouth
G rand River Below mouth of Maple RiverDO At IoniaDO Above L owell
Flat River Atmouth
G rand River Below mouth of Flat RiverT hornapple River Above mouthGrand River Above Grand Rapidswat er -power dam
DO Above mouth
T he watershed is comparatively flat . T he total fall Of the riverfrom the extreme headwaters to the mouth , a distance of more than200 miles, is about 350 feet .

24 2 OPERAT IONS AT RIVER S TAT IONS , 1 900.
— PART I II . [No . 49.
T he results Of the gage readings for the year 1 891 , referred to theLake Michigan datum,
are given in the follow ing table :
Gage heights, in feet, Of Grand River a t va r iousp oints.
Mean gage he ights. Highest observed . L owest observed .
Month .
Float measurements of the flow of Grand River were made by Mr .
Morley during the low-water period of 1 891,as follows : 1 July 21
,
milesbelow Grand Rapids; August 1 8 , milesbelowGrand Rapids.
Rod floats were run across the stream at intervals of 1 0 feet,and
were timed while passing downstream a distance Of 1 00 feet . Fromthese measurements the minimum flow of 1891 was estimated at
second - feet,the corresponding stage on the Grand Rapids gage being
feet .
In addition to the foregoing, Mr . Morley calculated the flow at various stages, frommeasured slopes and sections
,by means of Kutter’s
formula,with the following results :
Ca lcula tedflow of Grand River nea r Grand Rap ids.
Gage Correheight sponding Area of Wetted Hydraulic
on gage cross sec perim radiusS lo e
Grand heigh t at t ion. eter . Ap
Rapids discharge (A ) (P ) p=R
gage . section .
A nearly continuous record of the stage of Grand River at the Chi
cago and West Michigan Railroad bridge, 1 mile below the dam in
Grand Rapids, has been kept S ince May 26 , 1 897 . A copy Of this rec
ord has been furnished by GeorgeW . Bunker , Un ited S tates assistant1 Report on Survey of Grand River below Grand Rapids, War Department , 1892.

MICHIGAN . 24 3
engineer . T he daily gage heights, referred to the Lake Michigandatum,
are given in the following tables
Dai ly gage height , in feet, of Grand River a t Grand Rap ids, M ichigan , for 1 897 .
Da i ly gage height, in feet, of Grand River a t Grand Rap ids, M ichiga n, for 1 898 .
July . Aug . S ept .

244 OPERAT IONS AT RIVER STAT IONS , 1900.
— PART III . [No . 49.
Da i ly gage height, in feet, of Grand River a t Grand Rap ids, Michigan , for 1899 .
Jan. Feb . June . July . Aug . Oct . Nov. Dec .
- 0
Da i ly gage height, in feet , Of Grand River a t Grand Rap ids, M ichigan , for 1 900
Jan . Feb . Jan . Feb . Mar . Apr .
- q
- O ,
In 1 899 the following measurements Of the volume of fiOW-
Of the
streamwere made under Mr . Bunker’s direction . T he measurementswere made by means of rod floats spaced at intervals of 20 feet acrossthe channel , and timed through a distance of 1 00 feet .

246 OPERAT IONS AT RIVER STAT IONS , 1900.
— PART III . [No . 49.
T wo gagings of the low-water flow of Thornapple River were made
by L . W . Anderson on September 1 4,1 899
,near the mouth of the
stream and just -above the village of Ada . T he velocitieswere determined by means of both surface and rod floats, which were timedwhile passing through 1 00- foot sections. T he flow was found to be1 55 second - feet , or second -foot per square mi le from a drainagearea of 824 square miles.
Floa t measurements of Flat River about 731; miles abO-
ve
'
itsmouth
have been made by R . J . M . Danley . Soundings were taken every 1 0
feet across the channel , and rod floatswere put in at the same intervals. T he velocity was determined by timing the floatswhile passinga distance Of 200 feet . T he drainage area above the point of measurement is 556 square miles, 4 6 ,
square miles less than at the mouthof the stream.
Dischargemeasurements Of Fla t River about mi les above i tsmouth.
Date . Discharge .
Mr . Danley states that these measurements represent extreme low
water preceded by a period Of sixweekswith little or no rain .
Arrangements have been made with L . W . Anderson,C . E.
,for the
continuation of gagings of Grand River at Grand Rapids, A gagehas been placed at the Fulton street bridgewhere observations of thestage of the water are taken twice da ily . Current-meter measurements of the flow will be made , fromwhich , with the measurementsa lready available , a rating curve for the Grand Rapids cross sectioncan be prepared .
A station has also been established on Grand River at the Schuy lerstreet bridge inNorth Lansing. T he river freezes over through nearlyits entire length above Lansing, and in the spring large quantities Ofice are brought down . At the point selected for gaging, however, theriver does not freeze over , owing to the presence of a daman eighth ofa mile above .
T wo miles above the North Lansing gaging station Grand Riverreceives the drainage fromRed Cedar River , on which a gaging sta
tion was established in Jannary , 1 901 . T he gage is located at the
Grand Trunk Ra ilroad bridge on the grounds of the Michigan Agricultural College . T he stream is narrow,
with gravel bed and withoutflood plains; the current ismoderate .
T he station on Red Cedar River,aswell as that at North Lansing
on Grand River,is under the immediate direction of Prof. H . K .
Vedder,of the Michigan Agricultural College .

MICH IGAN . 247
T he dra inage areas above the stations are as follows
Dra inage areas above gaging sta tions.
River . Loca t ion.
T he fall and the power in use at the principa l dams on the mainriver and its branches are given in the following table . There is nostorage developed on the stream. T he dams are of timber
,usually
provided with logways, though the logging industry on the river isnow practically at an end . During the winter months anchor ice isa frequent source of annoy ance to water—power users. T he present
development involves two power canals which run parallel with theriver .
Develop ed wa ter p owers on Grand River and i ts tributaries.
Effective head or fall .
S tream. Location.
Least . Average
Grand River Grand RapidsDO Ly onsDO T hreemilesabove
Lyons.
DO Por tlandDo -doDo Grand LedgeDo do
DO North LansingDo Eaton RapidsDo WinfieldDO Jackson
Buck Creek GrandvilleRogue River Ch i ldsdale
Do RockfordPor ter Creek EdgertonT hornapple River Ada
Do AlaskaDO LabargeDo Middleville
Flat River LowellDo T hree milesabove 12
Lowell .Alton
Do Beld ingDo G reenville
L ookinglassRikr'
éi PortlandRed Cedar River Okemos
DO W illiamstown
Water power was originally developed at Grand Rapids in 1 836 by
the construction of a rubble diverting or wing dam on the limestone
ledge at the east side of the stream. In 1 851 — 52 a dam was builtacross the stream and the w idth of the east
’
S ide canal was increasedto 60 feet , with the intention of providing slack -water navigation pastthe Long Rapids at this point . In 1 866 W . T . Powers purchased the

248 OPERAT IONS AT RIVER ST AT IONS , 1900.
-PART I II . [No . 49.
water privilege on the west S ide of the stream, and joined with the
power users on the east side to build the present timber dam,the crest
line of which is 678 feet long. T he east side canal is feet longand the west S ide canal feet long.
Where the space between the canals and river does not permit ofthe erection of mills or factories, wheel pits are placed at the river’sedge and the power is carried to the mills by telodynamic transmission .
Each canal is entitled to half the flow Of the stream. Water privileges on the east S ide were sold by priority ,
beginning at the lower endof the cana l . T he flow in the west S ide canal , constituting half of thepower of the stream,
was divided into 66 equa l parts or runs. T he
net'power of one run of stone , at the ord inary stage of the stream
and under a head of 1 24 feet , has been fixed at 1 5 horsepower . On
this basis the ordinary effective power ava ilable at Grand Rapids isestimated at horsepower . T he power is utilized in the manufacture Of furniture ,
in flour mills, machine,iron
,and brass works
and for the generation of electricity . In addition power is trans
mitted electrically to Grand Rapids from the plant of the Peninsular Electric Company on Flat River
,above Lowell . T he transmis
sion line is 1 6 miles long,the tension 1 0
,000 volts.
T he foregoing list of water powers does not include a number of
rura l grist and feed mills on the smaller tributaries,some of themvery
small,only permitting the mills to run intermittently by holding back
the flow as pond storage. Abandoned sites where dams have beenwashed out are not infrequently found . These were used to supplypower for sawmills which have long S ince ceased to be operat ivethrough lack of timber supply .
T he fa ll at Grand Rapids aggregates 1 8 feet , and the avai lablepower could be greatly increased by constructing a new dam
,increas
ing the head , and conCentrating’
the entire flow in one wheel pit , forthe generat ion of electricity . It is estimated that an average of
horsepower net can be obta ined 8 months of the year , from May to
December ,'
while during the four Spring months a minimum of
horsepower will -be ava ilable , with the exception of a' few days, when
the head will be reduced by backwater to 6 feet or less. T he plancontemplates the erection of a 1 2 - foot concrete dam
,the construct ion
of a power canal a long the stream bed , and the excavation of the ta ilrace channel 2 ; feet below the present bed of the river . It wouldadmit of the filling in of the present power canals and the reclamation of va luable land along the river front .
1
T he ava ilable power of thema in stream is for the most part utilized .
It is stated tha t a S ite exists between Lyons and Portland where a
head of 1 2 feet could be obtained by the erection of a dam 1 0 feet1 Report on Development ofWa ter Power , Grand Rapids, M ich igan . Rae and Monroe , Chicago ,
1899.

250 OPERAT IONS AT RIVER ST AT IONS,1 900.
— PART III . [No . 49 .
passes over the main Spillway or through,
the turbines.
‘
Water iscarried from the pond to the power house by a short headrace sepa
rated from the stream channel by a crib breakwater .
T he power house contains two pairs of 35 - inch Lefiel standard turbines on horizontal Shafts. T he water wheels are connected to electrical generators by endless rope drives. T he power will be used fordriving machinery in the adjoining cement mills,
\
and the load and
consequent discharge of the turbines will be fairly constant . T he
record kept for the water wheels includes working head , hours run
per day , and average width Of gate opening for each pair of wheels,
as indicated by the Lombard governors.
A gaging of Muskegon River at Big Rapids was made August 271 881 , by Frederick P . S tearns, civil engineer, and the discharge wasfound to be second-feet . T his amount is taken as the ordinary ,
flow,and is used in partitioning the water power among the severa l
privileges at B ig Rapids.
T he Newaygo dam is the first one above the mouth of the stream.
An effective head of 1 4 feet is obta ined there . Power isalso developedat Big Rapids, where there are two dams. T he lower damis a roughtimber structure, built with a V iew to its use in log driving . One
hundred and seventy -two horsepower is now in use for the genera
tion of electricity ,thehead Obtained being 8 feet . At the upper damin
Big Rapids power is distributed through two lateral hydraulic canals.
T he total flow is estimated as equivalent to the discharge through an
orifice of square inches area under a head of 8 feet , with a
coefficient of contraction of Each user is entitled to installwheels having a certain number of square inches vent . T he headvaries from 64 to 1 1 feet , the average or ordinary head be ing 8 or 9feet . T he rated power of the turbines installed is 668 horsepower .
It is stated that but 350 horsepower is actually in use . T he power
utilized at Newaygo and B ig Rapids aggregates horsepower .
Aside from the foregoing,there is no power developed within the
drainage basin ,except in a small way on certain tributaries.
From the vicinity of Evart to Newaygo ,Muskegon River flows
between high banks, and has a rapid fall . Levels,which have been
run for this purpose, Show that within a distance of 10 miles, 5 mi leseach way from Big Rapids, there is a total fall Of 1 04 feet. Of this1 6 feet is now utilized
,leaving an available fall of 88 feet . There
are favorable S ites for the location Of dams,so that practically the
entire fall could be economically developed . At Rogers’s bridge , 6mi les below Big Rap ids, surveys have been made for the erection of
a dam to give a head of 35 feet .
In connection with power development , good Opportunities existfor the conservation of flow by artificial storage. T he water-surfaceareas of the principal lakes of the watershed and of the tributarydrainage which they control is given below .

MICHIGAN . 25 1
Dra inage and surfa ce a reas of lakes in Muskegon River wa tershed .
Dra in WaterLake .
age area . surface .
Muskrat Lake and group 3.
Clam LakesHigginsLake
0
Houghton Lake (not including Higgins Lake )Higgins and Houghton lakes
In the upper portion Of the watershed there is a total lake area of
about 1 10 square miles. Formerly a lumbermen’s dam was maintained for the purpose Of flooding logs betweenHoughton and Higginslakes, but this has been washed out . A properly constructed damat this S ite would flow an area of 1 5 square miles and Would y ield a
storage of cubic feet per foot Of depth . A lumbermen’sdam,
built Of logs and earth,which still remains about a mile below
the foot of Houghton Lake,raises the water level in that lake 4 feet,
providing a storage of,in round numbers
,cubic feet .
ThomasH . Coughlin , superintendent of the Muskegon Booming Company ,
states that a dam could be constructed at this site which wouldadmit of a total storage 8 feet in depth and would greatly increase theflooded area over that of the present lake .
HURON RIVER,MICHIGAN .
This river receives dra inage from a broad , flat basin interspersedwith lakes
,situated in southeastern Michigan . T he inland basin is
connected with Lake Erie by a long, narrow valley ,in which occursa
large portion of the fall and available power Of the stream.
1 A gagingstation has been established at Ann Arbor
,under the immediate
charge Of Prof . J . B . Davis,of the University of Michigan . Current
meter measurements are made from a temporary bridge or by fording.
T he stream at this point iswinding. It flows in a Shallow channel,
and ordinarily does not overflow its banks. T he bed is generally of
gravel . T he river usually freezes over during the winter, except
immediately below the dams. Natural storage in the numerous lakesand marshes regulates the flow to some extent . T he character of the
watershed has changed somewhat in recent years. Areas of tamarack swamp lands, the soil of which was formerly a quaking bog, havebeen cleared and dra ined and are now under cultivation . T he dra inage area above the mouth of the river is square miles ; aboveAnn Arbor it is 84 1 square miles. A gaging Of the bank - full flow Of
the streamat the Geddes dam,3 mi les belowAnn Arbor
,wasmade by
Professor Davis, and the estimated discharge was second - feet .T he Geddesdamhas a flat crest and is practically water tight . T he
1A report on the wa ter power of Huron River , by James T . Greenleaf. C . E . , was published inthe T enth Census of the United S tates, Vol. X VI , Water Power , Pt . I , pp . 443-495 .

252 OPERAT IONS AT RIVER S TAT ION S , 1900.
— PART I II . [No . 49.
length Of the crest is 200 feet and the depth Of water on the. crest atthe time the measurement wasmade was feet .
T HU NDER BAY RIVER,MICHIGAN .
Thunder Bay River is joined by two large branches 8 and 1 0 milesabove itsmouth , respectively
“
. These branches, as well as the mainstream,
are further subdivided at short distances upstream, so thatthe river is of relatively small magnitude, except for a few milesnear its mouth , where occurs the outcrop of the Traverse shales.
It is in passing over this rock ledge that the most rapid fa ll Of thestreamoccurs. T he drainagearea was formerly heavily timbered withMichigan pine. Most of the pine has, however, been cut , but a largeamount of small conifers, hard woods, white birch , and Cedar remains,so that the watershed may be considered as representing a forestedrather than a Cleared area . A record of precipitation iskept at Alpena ,
near the mouth of the stream. T he outcrop of the Traverse and S t .
Clair shales crosses the watershed in a northeast-southwest direction,
crossing the river channel a few miles west of Alpena . T he surfaceabove the line of this outcrop is almost continuous limestone
,com
posed of calcium carbonate of 96 to 98 . per cent purity , small areasbeing covered with sand or with thin drift deposits.
No water powers of importance have been developed on eitherOf the branches. On the main stream there are two power dams.
T he lower one , which is at Alpena ,was constructed in 1 862 . It is
1 mile from the head of Thunder Bay ,an arm of Lake Huron } T he
river is navigable to the dam,forming a harbor . T he dam and
privileges of the river are owned jointly by the Alpena WaterworksCompany and the Alpena Booming Company . T he water wheelsinstalled have a rated capacity of 864 horsepower under -a head of 9
feet . T he power is used for pumping the municipal water supplyand for the generationof electricity . T he second dam is at the mi llof the F letcher Paper Company ,
4 miles above Alpena , and
horsepower is developed from a fall of 1 7 feet . T he only dams abovethe Fletcher mills are those used for floating logs. Spruce dam,
at
Long Rapids, gives a head of 7 or 8 feet . At Lower Rapids a headof 20 feet could be Obta ined by the construction of a dam.
T he dra inage basin of ThunderBay River contains thirty lakes, withan average area of about 1 square mile. In addition to these is Hubbard Lake ,
which has a water surface of square miles. A timberdam at the foot of the latter lake produces a storage depth of 5 feet
,
with an aggregate storage capacity of cubic feet,equiva
lent to a flow of 68 second- feet for thirty days. A similar dam at the
foot of Beaver Lake gives a storage depth of 6 feet . T he water fromBeaver Lake is used chiefly for driving logs.
T he limestone area contains numerous sink holes, Often deep and
precipitous. Surface water entering these pits disappearswith greater

25 4 OPERAT IONS AT RIVER STAT IONS , 1900.
— PART III . [No . 49 .
Indiana and 300 in Michigan . No storage is developed on the stream.
T he drainage areas Of the river and its more important tributariesare given in the following table
Dra inage a reas of S t. Josep h .River and i ts tributaries.
S tream. Location. Area .
Above T hree RiversAbove mouth
dodo
Below T hree RiversAbove NilesAbove mouthBelow mouth of Dowagiac RiverAbove mouth of Pawpaw RiverAbove mouth
Belowmouth of Pawpaw River
T he dra inage basin lies in a completely glaciated region ,and is
overlain with diversified drift deposits. T he current of the riverfrom South Bend to itsmouth was formerly reversed
,and this valley
formed an outlet for “the waters of Lake Michigan ,
which turned tothe southwest
,through Kankakee River , at South Bend
,and thus
reached the M ississippi through Illinois River . Leverett states 1 thatthere is still a well-defined river channel connecting St . Joseph Riverwith the Kankakee
,the surface of which , where it leaves the St .
Joseph , is but 45 or 50 feet above the present low-water surface of
that stream. T he watershed of St . Joseph River in M ichigan con
ta ins relatively little marsh land not artificially drained and relatively little uncleared land . About a third of the lakes are
,however,
without outlets. T he proportion of undra ined lakes in Indiana is
smaller, and the swamp lands are much more extensive .
Elkhart River , one of the principal Indiana tributaries Of the St .
Joseph , drains an area of about 500 square miles which containslarge lakes and extended swamp areas, with the principal fall occurring in the passage of the stream frommarsh to marsh .
St . Joseph River was formerly navigable for boats as far asElkhart,
or perhaps above, and the Older dams were provided with locks, longS ince abandoned and closed . Prof , James Du Shane is of the opinionthat at the present time the low-water depth of the river over the rap
ids is from 14 to . 2 feet . A rise of 5 feet represents ordinary highwater, and a rise of 8 feet represents extreme high water . Within thelast twenty - two years two freshets have occurred which ra ised thewater in some portions of the river higher than here given . T he aver
age width from bank to bank is 400 feet , and the average slope fromElkhart to Be
'
rrien Springs is feet to the mile .
T he first water-
powermill in southwesternM ichigan was constructedby Eli Ford , in 1 827 , on Dowagiac Creek ,
near its confluence with St .
1 Water resources of Indiana and Ohio , by Frank Levere t t : Eighteenth Ann. Rept . U . S . Geol .
Survey , Pt . IV, 439.

MICHIGAN . 255
Joseph River , at Niles. This mill,known as the Volante mill , has
been in operation since 1 828 . Power development on St . Joseph Riverbegan at a somewhat later date . The dam at Niles was built about1 856 . At South Bend the power was developed by the South BendManufacturing Company ,
and was sold in the form of rights tothe flow through wheels of a certain number of square inches ventunder the available head . T he dam is 1 0 feet high ,
with lateralpower canals on each side . Under an order of the court the water isto be ma inta ined at a stage not lower than 6 inches below the crest ofthe dam.
'
Nineteen privileges have been gran ted , c alling for a flow
of cubic feet per second under a head of feet . Fourteenof these privileges are now in use ; T he minimum flow Of the streamis usually considered to be second - feet
,but it is stated to have
gone considerably lower during the months of July and August,1 895 .
At Elkhart there 1 8 a S imilar power development , the flow of the
stream being divided among elevenmills. T he power at Elkhart wasoriginally divided by priority , the amount being specified as SO manyruns Of stone, or sufficient for the purpose of the mill .”T he following table gives the principal facts regardingwater power
in the St . Joseph River Basin , so far as reported :
Develop ed wa ter p owers in S t. Joseph River Basin.
Effective head or fall .Number
S tream. Locat ion . of millsat dam.
Greatest . Least . Average
S t . Joseph RiverDo
DoPawpaw River
DODO
South Branch ofPawpaw RiverDO
Spr ing BrookDowagiac CreekDo
Pokagon CreekS outh Branch ofDowagiac Creek .
DoChrist iana CreekElkhar t River
Do
DOPortage RiverRocky RiverSwan CreekColdwater River
DO
DoNottawa Creek

256 OPERAT ION S AT RIVER STAT IONS , 1900.
— PART II I . [NO- 49
There are a number of undeveloped powers between the presentdams
,and projects are now formed to utilize them. T he power is to
be used largely for the generat ion of electricity'
for transmission toneighboring towns. A part Of it will supplement the power at existing dams. At Berrien Springs, Michigan ,
a concrete dam 30 feet inheight isproposed . Thiswill make ava ilable a fall of 20 feet . Eighteen water wheels of a rated capacity of horsepower are to be
installed . This power is in sec . 1 8,T . 1 7 W .
,R . 6 S .
,Michiganmerid
ian . At Bertrand , M ichigan ,a fall of 1 2 feet could be obtained by
the construction Of a suitable dam.
T wo available sites for dams exist between M ishawaka and Elk
hart,Indiana . T he former is in sec. 1 1
,T . 38 N .
,R . 2 E.
, secondprincipal meridian ,
where a 1 2- foot fall is avai lable . T he width of
the river is about 350 feet . T he latter site,called the Twin Branch
site, is in sec. 1 2,T . 37 N .
,R . 3 E.
,second principa l meridian . A
dam 422 feet long is proposed at this point , which would make available a fall of 21 feet .
At Bristol , Indiana ,a dam formerly existed
,but it waswashed out.
A site exists in sec . 31,T . 38 N .
,R . 5 E.
, second principal meridian ,
where a fall of 1 6 feet could be Obtained by the construction of a dam600 feet in length .
At Mottville , Michigan ,in see . 6
,T 8 S . R . 5W . Mich iganmeridian ,
a fall Of 94 feet could be obta ined by the construction of a dam 540
feet in length .
An undeveloped waterpower also existsnearThree Rivers,Michigan ,
in see . 1,T . 6 S .
,R . 1 1 W .
,where about 9 feet fa ll could be obtained
T he available power Of tributaries of S t . Joseph River is of littlevalue
,as is indicated by the existence of numerous abandoned S ites
where damshave been carried away by freshets. At L igonier, Indiana ,a dam formerly existed on Elkhart River
,but it was washed out .
There are three undeveloped p owers on Pawpaw River , in AntwerpTownship ,
Van Buren County ,Michigan ,
with falls of 9 feet , 1 4 feet ,and 9 feet , respectively .
Arrangements have been made with the Berrien Springs PowerCompany for the maintenance Of a record of flow Of St . Joseph Riv erat their plant when completed . T he record will include dischargeover the 500- foot concrete dam
,and the run of water wheels, which
will be 1 8 in number,arranged in sets of three pairs each . In the
meantime_a temporary gaging station has been established at the
dam Of the Berrien Springs Power Company at Buchanan ,Michigan ,
1 0 miles above Berrien Springs. T he dam is of timber, of the Beardsley gravity type, with a straight crest approximately 400 feet long .
It is feet high , and is built on an earth foundation .
In January ,1 891
,the following gaging Of St . Joseph River wasmade
by John F . Meighan at LeepersBridge , 1 mile belowthe dam at SouthBend

258 OPERAT IONS AT RIVER S TAT IONS,1900.
— PART III .
Develop ed wa ter p owers in Ka lamazooRiver Basin .
Effective head or fall .
NumberS tream. Locat ion . ofmills
at dam.
Greatest . Least . Average
Feet. Feet.
n n n n n n n n n n n n n n n n n n n n
- 0
m a
- fl - fl
a U ndershot water wheel .
It is stated that a dam could be built 1 mile above the mouth of
Swan Creek,which enters Kalamazoo River 8 miles below Allegan ,
and a head of 40 feet be Obtained .
During a portion of 1 900 a da ily record of the river stage was keptat Kalamazoo
,the results of which are given on the following page.
Earlier recordswill be found inWater -Supply Paper No . 30, page 36 .
Arrangements have beenmade for themaintenance of a gaging recorda t the electric-power dam at Trowbridge
,6 miles above Allegan . T he
plant includes four pa irs of 4 5 - inch Leffel-Sampson turbines on horizontal shafts. T he gate opening and discharge of two pairs are con
trolled by Lombard governors. T he excess Of flow not taken by theturbines'
is discharged over a spi llway having three Ta intor floodgates, each 20 feet long . T he spi llways have flat crests 20 feet inwidth
,wi th slopes of 1 to 1 on the upstream and downstream faces.
T he discharge on the downstream side is received on a floating apron
20 feet in wid th,which is anchored to the flood -
gate cribs by chains.

MICHIGAN . 259
Da i ly gage height, in feet, of Ka lamazoo River a t foot Of S heldon street, Ka la
mazoo , M ichigan , for 1 900 .
- Q
NOT E — On August 9 the gage height was feet .
Dai ly gageheight,-tu feet, of Kalamazoo River a t Gull street, Ka lamazoo ,Mi chigan ,
for 1 901 .
Mar .
NGT E — Gage height onApril 1 was feet , and on Apr il 12, feet .
Dai ly gage height, in feet, of Ka lamazoo River a t extension of Pa terson street ,
Ka lamazoo , M ichigan , for 1 900.
O O O O O O O O O O O O O O O O O O O O O
STREAMS OF NORTHERN PENINSU LA OF : MICH IGAN
T he streams of the northern peninsula of M ichigan are contrastedwith those of the southern portion of the S tate by their steep S lopes,rocky channels, and occasional waterfalls. They possess numerouswater powers, which are almost wholly undeveloped , and many of
which are in. close proximity to the mining centers of the iron and
copper region . Arrangements are being made for the establishment
of a gaging station on one Of the larger streams.
On Ontonagon River at Glenns Falls a head of -1 00 feet could be
obtained,which would y ield an estimated minimum of horse
power . This is in see . 31,T . 50 N .
,R . 31 W .
,about three-fourths of
a mile south of the V ictoria mine . Ontonagon River is the largestLake Superior tributary in Michigan . It extends entirely across thenorthern peninsula , and finds its headwaters ina region of numeroussmall lakes near theW isconsin-Michigan line . Its fa ll ismostly con
centrated in the Short stretch between the summit of the MichiganRange at Rockland and its entrance to Lake Superior at Ontonagon .

260 OPERAT IONS AT RIVER ST AT IONS , 1 900.
—PART II I . [No 49 .
Owing to the lack of a map on suitable sca le ,the dra inage area can
not at present be estimated .
Dead River , tribut ary to Lake . Superior at Marquette, possesses a
fall of 850 feet in a distance Of 1 0 miles.
Much of the southern slope of the upper peninsula dra ins intoMenominee River , a tributary of Green Bay . A report on that riverwas published in the Tenth Census Of the United States "O therstreams possessing good falls and opportunities for lake storage In theregion of their headwatersare the Escanaba
,Manist ique
,Michigamme ,
and T ahquemenon rivers.
MIS S IS S IPPI RIVER AT ST . PAU L,MINNESOTA.
Recordsof gage heightsarema intained by theUnited S tatesWeatherBureau at St . P aul
,and are furnished to the Geological Survey . T he
station is described in“Tater- S upply Paper No . 36, page 1 94 .
Da ily gage height, in feet , of JlI ississipp i River a t S t. Paul , JlI innesota , for 1 700.
Jan . Feb . Ap r . May . June . July . Oc t . Nov . Dec .
I a 3 . 2
a Approxima te ; r iver frozen . bRiver frozen .
WEST GALLAT IN RIVER NEAR SALESV ILLE,MONTANA .
This station,which was established in July ,
1 895,is located at the
highway bridge crossing the stream about 5 miles south of Salesville .
It is described in Water- Supply Paper No . 36, page 1 95 . Results Of
’
measurements for 1 899 will be found in the Twenty - first Annua l.
1 Vol . X VII , Wa ter Power, P t . II , pp . 71—81 .

262 OPERAT IONS AT RIVER STAT IONS , 1900.
— PART I I I . [No . 49.
Da i ly gage height, in feet, Of Middle Creek nea r Bozeman , Montana , for 1 900.
July . Aug . Sept . Oct . June . July . Aug . S ept . Oct .
NOT E — T his sta tion was d iscontinued in 1899, but was reopened on June 18, 1900. It was closed
for the winter on October 13.
GALLAT IN RIVER AT LOGAN ,MONTANA.
This station,which was established August 24
,1 893
, by F . H .
Newell , is located on the bridge of the Northern Pacific Ra ilroadcrossing the river at Logan
“. It is described in Water-Supply Paper
No . 36, pages 1 97 and 1 98
,where will a lso be found the results of
measurements for 1 899. During 1 900 the following measurements of
discharge weremade under the direction of Samuel Fortier :
Dischargemeasurements of Ga lla tin River a t Logan , Montana .
Gage Dis Gage DisDate .
heigh t . charge .
Da te .
height . charge .
Feet. S ec. f eet.
3 . 91 4 , 630 August 132 . 32 S ep tember1 . 51 October 15
744 October 16. 40 239

MONT ANA. 263
Da i ly gage height, in feet , of Ga lla tin River a t Logan ,Montana , for 1 900.
Apr . May . June . July . Aug. S ept . Oct . Nov . Dec .
a Frozen .
MADISON RIVER NEAR REDBLUFF,MONTANA
This station ,which was established May 2 , 1 897 , is located 4 miles
below the Redbluff iron county bridge over the river and 14 milesbelow the mouth of Cherry Creek . It is described in Water-SupplyPaper No . 37
, page 205 . Results of measurements for 1 899 will befound in the Twenty-first Annual Report , Part IV , page 1 86 . Dur
ing 1 900 the following measurements of d ischarge were made underthe direction of Samuel Fortier . Cherry Creek flows into MadisonRiver between the gage and the point where the river ismeasured , andi ts discharge Should
,therefore
,be added to that Of the ‘
river in orderto Obtain the total discharge at the gage .
Dischargemeasurements of Madison River nea r Redblufi , Montana .
Date . Date .
a Cherry Creek .

264'
OPERAT ION S AT RIVER STAT IONS , 1 900.
— PART I II .
“
[No . 49.
Da i ly gage height, in feet, of Madison River near Redblufi , Montana , for 1 900 .
May . June .
a Frozen .
JEFFERSON RIVER AT SAPP INGT ON,MONTANA.
This sta tion,which was established by Arthur P
“. Davis in 1 894
,is
located on the bridge of the Northern Pacific Ra ilroad crossing the
river at Sappington . It is described in Water-Supply Paper NO. 37
pages 206 and 207,where will also be found the results Of measure
ments for During 1 900 the followingmeasurementsof dischargewere made under the direction of Samuel Fortier :
Discha rgemeasurements Of J efferson River a t S app ington , Montana .
Date . Da te .
- O - fl - Q
- O p

266 OPERAT IONS AT RIVER ST AT IONS , 1 900.
— PART II I . [No . 49 .
Da i ly gage height, in feet , of M issouri River a t T ownsend ,Montana, for 1 900.
Jan. Feb . Mar . Apr . May . Aug . S ept . Oct . NOV .
a Approxima te ; no readings rece ived .
CROW CREEK,MONTANA.
Crow Creek,a tributary of Missouri River, is in Jefferson County ,
Montana . Its headwaters are at an elevat ion of between and
feet above sea level . It flows in a southeasterly d irection for
about 25 miles, and empties into Missouri River 33 milesbelow Toston ,
at an elevation of about 4,000
'
feet .
At the foot of the mountains the valley is approximately 1 2 milesSquare . About half Of it is owned by the residents
,and approximately
a third of the land owned is being irrigated , though perhaps scantilyat t imes. This l eaves without water about acres
,the greater
part of it the choice land of the valley and,according to the farmers
who have made efforts in that direct ion ,well adapted to the ra ising of
hay , grain ,and fruit crops. T he only apparent source of water sup
ply for this vast tract Of uncultivated land is small storage reservoirson Crow Creek ,
at points a long the canyon where the valley widenssuffi ciently to permit their construction . From the best informationobtainable from those familiar with the canyon ,
the largest of thesevalleys is from a fourth to a half mile wide and about 2 miles long.
On October 1 3,1 900
,the flow of Crow Creek at the mouth of the can
yon ,5 miles above Radersburg,
Montana,was
,by actua l measure
ment,1 6 second - feet . On the same date the discharge at the bridge
1 mile below the canyon was also 1 6 second - feet . T he high -waterflow lasts from four to six weeks
,with an occasional summer flood
,
and is confined in a channel having an average width Of '
from 25 to 30

H
MONTANA. 26 7
feet , with vertical banks of from 4 to 5 feet on either side,and a fa ll
of feet to the mile .
MILK RIVER AT HAVRE,MONTANA
This station ,which was established by C . C . Babb on May 1 5 , 1 898 ,
is described in Water- Supply Paper NO . 37, page 209 . Results of
measurements for 1 899 wi ll be found in the Twenty -first AnnualReport , Part IV , page 1 89 . During 1 900 the following measurementsOf d ischarge were made by C . W . L ing :
Discha rgemeasurements of M i lk River a t Havre, Montana .
Gage DisDate . Date .
heigh t . charge .
- 0
- 1
o o o o o o
Da i ly gage height in feet, of Mi lk River a t Havre, Montana , for 1 900 .
a Frozen .

268 OPERAT IONS AT RIVER STAT IONS , 1900.
— PART III . [No . 49.
YELLOW ST ONE RIVER NEAR L IV INGS T ON , MONTANA.
This station,which was established May 2 , 1 897 , is located at the
highway bridge over the Yellowstone,
5 miles south of LivIngston . It
is described inWater-Supply Paper No . 37 pages 210 and 21 1,where
w ill also be found the results ofmeasurements for 1 899. During 1 900the follow ingmeasurementswere made under the direction of SamuelFortier
Dischargemeasurements of Yellowstone River nea r L ivingston, Montana .
Date . Date .
July 14August 7S eptember 29October 17
Da i ly gage height, in feet, of Yellowstone River nea r L ivingston ,
.
Montana
1 900 .
Ap r . May . une . July . Aug . S ept . Oct . N ov . Dec.
—n
a Frozen.
MISCELLANEOU S DISCHARGE MEASUREMENT S IN MONTANA.
During the year the following miscellaneous measurements of
streams in Montana were made by Messrs. F . E. and G . H . Matthes '

270 OPERAT ION S -AT RIVER S T AT IONS,1900.
— PART 1 1 1 . [No . 49.
CLEAR CREEK NEAR BU FFALO,W YOMING .
This station was established by the S tate engineer of Wyoming . Ameasuring flume was erected in order that accurate measurements of
d ischarge might be obta ined . Owing to the stability of the station ithas not been necessary tomake d ischarge measurements at this place,the computa tions being made from the rating table established sev
eral years ago . T he station is described in Water -Supply Paper No .
37, page 21 2 . Results of measurements for 1 899 w ill be found in the
Twen ty -first Annual Report , Part IV , page 1 91 . Owing to the diversions of water which have taken place with in the basin ,
of late yearsthis station has not been considered as important as formerly ,
and itwas d iscontinued on March 1 1
,1 900
, no measurements of dischargebeing made during that year .
Da i ly gage height , in feet , of C lear Creek nea r Buffa lo ,Wyoming , for 1 900.
Ma r . Mar .
BIG S IOU X RIVER NEAR WAT ERT OWN,SOU T H DAKOT A.
Big S ioux River rises in Grant County ,South Dakota
,about 30
miles north of Watertown . Its principal headwaters dra in lands con
sti tut ing part of the S isseton and Wahpeton Indian Reservation . Its
genera l course is southeast,and it empties into M issouri River near
S ioux City ,Iowa . T he river is of interest on account of its water
powers, a number of which have been developed , principa lly at F landrean
,Dell Rapids, and S ioux Fa lls
,South Dakota
,and at Akron
,
Iowa . T he gaging station was established by O . V . P . S tout,the gage
being put in September 1 5,1 900
,by George W . Carpenter , county
surveyor for Cod ington County . It is located on the farm of L B .
Spicer , about 4 miles above Watertown . T he gage consists of an
inclined rod securely fastened on the right bank of the stream. T he
observer is L . E. Spicer . During 1 900 the follow ing d ischarge measurements were made by O . V . P . S tout and G . H . Matthes
July 1 7 Discharge ,5 second-feet.
July 18 : Discharge ,10 second-feet.
November 1 2 : Gage height, feet ; discharge , 7 second-feet .
T he measurement of July 1 8 was not made at the gaging station,
but in the town .

SOU TH DAKOTA. 27 1
Lake Poinsett , which lies almost wholly in Hamlin County ,South
Dakota ,has its outlet in B ig S ioux River near Dempster , a short d is
tance above Estelline . Immediately below the outlet of the lake a
damhas been constructed on the Big S ioux to ma inta in the level Ofthe lake within certain limits. A measurement Of the inlet to thelake was made July 1 9 , 1 900, by O . V . P . S tout , and a discharge Of
second—feet was found .
B ig S ioux River at the bridge west Of Estelline was also measuredby Mr . Stout on July 1 9
,1 900
,and a - discharge Of second - feet
was found .
Da i ly gage height, in feet , of B ig S ioux River nea r Wa tertown , S outh Dako ta ,
for 1 906
‘
Dec . Day . Oct . Nov . Day . S ept . Oct .
BIG S IOU X RIVER NEAR S IOU X FALLS,SOU TH DAKOTA .
This gaging station,which was established by O . V . P . Stout on
July 21 , 1 900, is 2 miles west Of S ioux Falls. T he gage consists Of an
inclined rod securely fastened to bevel blocks supported on wellbedded cross-ties. T he observer i s George Beggs. During 1 900 thefollowing discharge measurement wasmade by O . V . P . Stout
July 21 : Gage -height feet ; discharge , 78 second-feet .
Da i ly gage height, in feet, of B ig S ioux River nea r Sioux Fa lls, S outh Dakota
for 1 900.
Nov . Day . Aug . S ept . Oct . Nov . Day . Aug . Nov .
22
241 . 70 25
26
1 70 272829
3031
MISCELLANEOU S D ISCHARGE MEASU REMENT S OF CHEYENNE RIVER
AND IT S TRIBU TARIES.
During the year a number Of measurements Of C heyenne River and
its tributarieswere made by J . T . S tewart,as described in the table
on the next page .

272 OPERAT IONS AT RIVER ST AT IONS , 1 900 .
— PART I II . [No . 49.
M iscellaneous discha rgemeasurements of Cheyenne River and i ts tr ibuta r ies.
Da te . S tream. L oca lity . Hydrographer .
May 1 4 Cheyenne River Edgemont , S . DakMay 1 7 dMay 29
May 18 Above mouth of Cascade CreekJune 12May 19 Above mouth of Fall RiverJune 4 Mouth of Fall RiverMay 21 Below mouth of Beaver Creek , 7
miles southeast Of Buffalo Gap ,
S . Dak .June 5 Below mouth of Beaver CreekMay 15 Salt Creek East of Newcastle ,Wy o
May 31 doMay 1 5 Big Oil Creek B . and M . Railway bridgeMay 29
gdo do
May 17 L ittle Oil Creek Newcastle ,Wy oMay 29 do doMay 18 Cascade Creek At mouthJune 2 - u - doDO Ha t Creek
May 19 Fall River Below Hot Spprings, S . DakJune 4 Hot S prings, S . DakMay 19 At mouthJune 4 -do
May 26 Iron Creek Glendale , S . DakJune 7 do doMay 15 S tockade B e a v e r T WO miles above L . A. K . ranch ,
Creek ; Wy o .
May 31 do doMay 16 do At mouthMay 30 -do do
May 15 Beaver Creek Agove
kmouth of S tockade Beaver
ree
May 30 do doMay 21 do T hree miles northwest o f Buffalo
Gap , S . Dak .June 5 doMay 21 do At mouth , 7miles southeast of Buf
falo Gap .June 5 do Atmouth
May 21 Lame Johnny Creek S egen miles northeast Of Buffaloap .
DO - do East of Bufi alo Gap'
May 28 French Creek Custer , S ..DakMay 22 T enmiles above Fairburn , S . DakJune 6 do T en mi les northeast of Fairburn
S .Dak .
May 22 do Fairburn , S . DakJune 7 do -do _
May 22 S quaw Creek - Otis, S . DakJune 6 do doMay 26 Bat tle Creek Keystone , S . DakJune 7 doMay 25 - do Hermosa , S . DakJune 8 do
’
l}/Iay 2
3S pring
Creek North Of Rockerville , S . Dakune
May 23 F . E . and M . V . Ra ilway br idge , S .
Dak .June 9 -doMay 24 Rapid Creek Five and one-halfmilesabove Rapid
City , S . D .akJune 8 -doMay 25 doJune 8
NORT H PLAT T E RIVER .
This river has its source in the mounta ins Of North Park,in north
Upon entering Wyoming the stream passes through a
Short,narrow canyon ,
and then flows northerly through the upperP latte Valley ,
which extends from the State line down to Fort S teele .
On August 27 1 900,A. . J . Parshall made measurements of. the river
ern Colorado .

274 OPERAT IONS AT RIVER STAT IONS,1 900.
— PART II I . [No . 49.
Da i ly gage height, infeet, of La ramieRiver a t Woods, Wyoming, for 1 900.
LARAMIE RIVER NEAR U VA,NVYOMING .
This station was established in 1 894 by the S tate engineer of Wyoming . It is described in Water- Supply Paper NO . 37
, page 21 6 .
Results of measurements for 1 899 Will be found in the Twenty - first
Annual Report , Part IV , page 1 94 . T he station was discontinuedMarch 31 , 1 900, and no measurements Of discharge were made duringthe year
Da i ly gage height, in feet, of La ramie River nea r U’va ,Wyoming, for 1 900 .
Mar . Mar .
n ' o o c o
n n n n n n n n n n n
NORT H PLAT T E RIVER AT ORIN J U NCT ION,WYOMING .
This stat ion was'
established November 1,1 894
,by the S tate engi
neer of Wyoming. It is described in Water-Supply Paper NO . 37
page 21 7 . Results of measurements for 1 899 will be found in the
Twenty -first Annua l Report , Part IV , page T he station was
d iscontinued April 1 , 1 900, and no measurements Of discharge weremade during the year .

WYOMING . 275
1 900.
a Frozen .
NORTH PLAT T E RIVER NEAR GU ERNSEY ,WYOMING .
This station was established June 1 4 , 1 900, by A . J . Parshall . It
is located at the county bridge about a half mile northwest of Guernsey . T he bridge has eight piers, the sides are planked , and there isuniform flow undereach span . T he location is an excellent one for
accurate measurements. T he rod consists of a 4 - inch by 4 - inch by1 2- foot scantling firmly attached to one of the piers of the bridge .
AS the station was to be a temporary one,a metallic tape , d ivided
into feet and tenths,was securely fastened to the rod . T he bench
mark is a Spike driven in a sleeper of the bridge 1 foot from the rod
and at an elevation of feet above the zero . T he channel isstraight for a distance above and below the station . Both banksare high
.
and do not overflow at high stages. T he bed of the streamis sandy ,
but probably does not shift much . T he station was discontinued September 1 5 , 1 900. During 1 900 the following measurements were made by A . J . Parsha ll
June 14 : Gage height , feet ; discharge , second-feet.
June 26 : Gage height , feet ; discharge , second-feet .
July 10 : Gage height , foot ; discharge, second- feet.
July ’
1 3 : Gage height , foot ; discharge, second-feet .
August 2 : Gage height ,— 0.20 foot ; discharge ,
778 second-feet.
August 21 : Gage height , foot ; discharge, 430 second-feet .
Da i ly gage height, in feet, of N orth Pla tte River nea r Guernsey ,Wyoming, for
1 900 .
n n n n n n n n n n n n n n n n

276'
OPERAT IONS AT RIVER S TAT ION S , 1900 .
— PART 1 1 1 . (No w.
NORTH PLAT TE RIVER AT GERING,NEBRASKA.
This station,which was established May 29, 1 897 , is located at the
highway bridge at Gering . It is described in Water-Supply PaperNO . 37 page 21 8 . Results of measurements for 1 899will be found inthe Twenty -first Annual Report , Part IV , page 1 97 . During 1 900 thefollowing measurements of discharge were made by R . H . W illis :
D ischa rgemeasurements of North P la tte River a t Gering , Nebraska .
Date .
S ec.
-f t .
7 , 13810, 980
12 , 37113, 706
6 , 3212 , 8743,947
Date .
August 1August 10August 22August 30S eptember 1 1S eptember 20October 19October 20October 30 .
Da i ly gage height, in feet , of North Pla tte River a t Gering ,Nebraska , for 1 900.
June . NOV .
a Closed for w inter November 14 .
NORTH PLAT T E RIVER AT CAMP CLARKE,NEBRASKA.
This stat ion ,which was established June 27
,1 896
,consists of a
t imber fastened to cross-ties bedded in the bank Of the river. It is
described in Water- Supply Paper NO . 37, page 21 9. Results of

278 OPERAT IONS AT RIVER S T AT IONS , 1900.
— PART III . [No . 49.
Da ily gage heightfin feet , of North P la tte River a t North Pla tte, Nebraska , f or1 900.
Mar . Apr . May . June . Aug . S ept . Oct . N ov . Dec .
SOU TH PLAT T E RIVER .
T he South P latte rises in the h igh mounta in peaks surround ing thebasin known as South Park ,
near the center Of the S tate Of Colorado .
These mountains vary in altitude from feet,in the Park Range,
to feet , in South Park . From the point where the stream issuesfrom the mountains at P latte Canyon it flows in a northerly d irectionthrough Denver to its j unction w ith the Cache la Poudre near Gree
ley ,thence in a northeasterly direction until it leaves the S tate a short
distance to the northeast of Julesburg, and thence in an easterly d irection to its j unction with the North Platte near North Platte
,Nebraska .
T he tributariesmay be divided into two classes : ( 1 ) Those which ,l ike the headwaters of the South Platte ,
rise in the mountains,and
( 2 ) those which dra in the plains east of the mountains. T he principal tr ibutaries Of the first class
,in their order down the river
,are
Bea r Creek,Clear Creek
,S t . Vrain Creek
,Boulder and South Boulder
creeks,Big Thompson Creek ,
and Cache la Poudre River . Amongthose of the second class there may be named
,as especially worthy of
consideration ,Cherry Creek , Lone Tree Creek ,
Boxelder Creek,B ijou
Creek,Beaver Creek ,
and Pawnee Creek ; There are many others of
lesser note . T he streams of the first class—L those flowing from the
mountains — resemble the upper reaches Of the South P latte in thatthey furnish a perennial supply of water
,which varies, however, with
the season ,the discharge being great during the flood stages and low

COLORADO . 279
during the latter part of the summer and in the fall and winter . T he
streams from the pla ins, on the other hand,are intermittent in their
nature, usually furnishing water only during storms or the melting of
snows. In general itmay be sa id that the normal perennial d ischargeof all of the streamsof thisdivision is cla imed and used for irrigationbut great quantities of water go to waste during the flood stages and
in times Of storms. As there is a vast amount of land upon the pla insadjacent to the South P la tte that might be irrigated if there were a
sufficient supply of water,the question of storage becomes one of
great importance ,and the Geological Survey is now study ing this
problem,examin ing such reservoir sites as are considered capable of
storing considerable quantities Of water . It is hoped that reservoirswill be constructed to prevent the loss Of this great amount Of water,which
,if properly stored
,would become one of the greatest assets of
the arid region .
An interesting feature of the South P latte Basin is the fact that inall of itsvallevs there is a great return fromseepage , which is increasing from year to year , asmay be seen in the tables of seepage measurements of this river published by the S tate engineer Of Colorado .
T he underground water supply of the plains in this basin isa lso beingstudied
,and the results of the investigations will be of great interest
in determining the possibilities of procuring water from artesiansourcesfor stock purposesand possibly for the irrigation of small tractsOf land . T he surface flow of the intermittent streams of the plainsmay
”
be made ava ilable for irrigation purposes by the construction of
suitable reservoirs,
'
a few Of which are now being utilized by corporations and private part ies. T he most notable projects of this character which have been under way in the basin during the year are the
Lake Cheesman dam,which is being constructed by the Denver Un ion
Water Company , h
C . L . Harrison,chief engineer , and the B ijou Irri
gation Company’s reservoirs in the neighborhood Of Orchard . T he
Lake Cheesman reservoir is especially noteworthy on account of thegreat height of its dam (21 5 feet) and the amount of water to be stored .
T he damv
will be of solid masonry . T he reservoir S ites of the B ijouIrrigation Company are natural basins
,along the rims of which
embankments will be constructed,thus storing large quantities of
water , which will be conducted from the river through cana ls. Anygreat extension of the irrigated area of this d istrict must depend uponthe construction of add itional reservoirs and upon improvements in the
use and distribution of water . T he present system of distributionthroughout thissection ,
as in nearly all of the arid region ,isvery extrav
agant , in many cases there being several times the number of ditchlines that the most economical use would demand
,while much water
goes to waste in marshes and swamps which might be dra ined,and
an increased supply thus be made ava ilable .

280 OPERAT IONS AT RIVER S TAT IONS , 1 900.
— PART III . [No . 49.
SOU T H FORK OF S OU TH PLAT T E RIVER AT LAKE CHEESMAN,COLORADO.
During the year 1 900 the engineers in charge Of the construction Of
the dam at Lake Cheesman kept practically continuous records of the
gage heights and d ischarge of Goose Creek and South Platte Riverabove their j unction
,and also Of the combined discharge below the
j unction,the latter measurements being made below the dam. T he
accompany ing table of discharge measurements at the latter placewas Obtained through the courtesy Of Mr . C . L . Harrison
,at present
chief engineer of the Denver Un ion Water Company . T he dischargefor February is est imated
,but it may be considered approximately
correct . Discharges for the other months are from actual measurements
,which are usually made three times a
' day , but sometimesoftener . T he resultsmay be considered very nearly correct .
SOU TH PLAT T E RIVER NEAR PLAT T E CANYON,COLORADO .
This station was loca ted about 2 miles above the Colorado and
Southern Rai lroad station at P latte Canyon . It wasmaintained by theDenver Un ion lVater Company for some time previous to any cooperation on the part Of the Survey ,
which began April 1 , 1 899. T he gagerod was a 2- inch by 2- inch inclined timber on the right -hand side of theS tream
,the graduations being marked with brass na ils. Measure
ments Of discharge were made from the footbridge constructed by thewater company at the rod . Readings were taken until June 2
,1 900
,
inclusive,when extremely high water carried away the gage rod
,
which has not yet been replaced . Only two measurementsweremadein 1 900. T he channel at this point is rocky ,
but the high waterchanged it materially ,
so that it will be best for a new location to beselected . A station at this place is of great importance , and one
Should be mainta ined with care . A cable Should be stretched acrossthe river , with a traveling car
,at such a height as to preclude the
danger of its being washed away by floods. T he figures given i nthe table Show the actua l d ischarge of the river at P latte Canyonbefore any water is diverted for irrigation or other purpose , exceptthat taken out by the Denver Un ion Water Company a short distanceabove the sta tion
,for the supply of the c ity of Denver .
Readings were taken by James Proctor,Of L ittleton
,Colorado
,who
is in charge Of the pumping station of the Denver UnionWater Com
pany at that place . While the station was being ma inta ined gagereadings were furnished to the officers of the United S tatesWeatherBureau at Denver
,who had them published in the papers.
A description Of the station was published in Water- Supply PaperNO . 37 page 224 . T he results of measurements for 1 899 will be foundin the Twenty -fi rst Annual Report , Part IV , page 201 . During 1 900the following measurements were made by A . L . Fellows :
March 5 : Gage height , foot ; discharge , 87 second-feet.
Ap ril 1 8 : G age height , feet ; d ischarge ,467 second-feet .

282 OPERAT IONS AT RIVER STAT IONS , 1 900.
— PART II I . [No . 49.
Da ily gage height, in feet, of S outh P la tte River a t Denver , Colorado, for 1 900.
Jan . Feb . Mar . June . July Aug . Oc t . NOV . Dec .
a Estimated .
SOU TH PLAT TE RIVER AT ORCHARD . COLORADO .
This station is“on the lower part Of the South P latte
,below all Of
the mounta in drainage tributary to that stream. T he gage rod,which
is vertical , is fastened to a pi le at a wagon bridge about a quarter of
a mile southwest Of the Union Pacific Ra ilroad station at Orchard .
T he station was first established in November,1 895
,and has been
mainta ined during the greater part Of the t ime since . During the
last year the gage rod had to be moved twice,owing to changes in the
channel . T he left bank of the river is high , but the right bank islow and is likely to overflow . T he bed Of the stream is sandy and
shifting,but the cross Section did not change materially during 1 900 .
T he station has been of great value in demonstrating the fact thatlarge quantit ies of water go to waste during floods and during the
winter season, a great portion being seepage or return water . As a
result of the investigations at this place , a large irrigation enterprisehas been undertaken— namely ,
that of diverting water from‘ the river
near Hardin for the purpose Of"'
irrigating lands in the vicinity of Fort
Morgan ,the water to be stored in large reservoirs
,which are referred
to elsewhere (page 279, Bijou Irrigation Company’s reservoirs) ; T he
existence of a large flow hav ing been demonstrated , it is now thoughtbest that the station should be changed to a point farther upstream,
probably at Kersey ,where another large ditchmight possibly be taken
out . A description of the station was published in Water- SupplyPaper No . 37
, page 226 . T he results of measurements for 1 899will befound in the Twenty-first Annual Report, Part IV , page 203 . During

COLORADO. 283
1 900 the following measurements were made by A . L . FellowsR . W . Hawley :
March 7 : G age height , discharge ,668 second-feet .
April 21 : Gage height , 5 feet ; discharge , second- feet .
July 23 : Gage height , feet ; discharge , 1 56 second-feet .
October 27 : Gage height , feet ; discharge , 324 second-feet .
Da i ly gage height, in feet, of S outh Pla tte River a t Orcha rd , Colorado , for 1 900.
Jan . Feb . Mar . Apr . May . June . July . Aug . S ept . Oct . Nov . Dec .
SOU TH PLAT TE RIVER AT JU LESBU RG ,COLORADO .
Although no station has yet been established at this place , one isgreatly needed . A rod was attached to the wagon bridge about a
mile southeast of the Union Pacific Ra ilroad station at Julesburg,
but no one was found who would make the Observations,so that no
record has been kept . A station here would be of great value , as thebridge referred to is not far from the State line , and a knowledge of
the discharge passing from Colorado into Kansas could thus be
obtained . T he channel is very wide, as it is throughout the lowerport ion of the river
,and on this account the results obta ined would
necessarily be approximate ; but they would neverthelessbe va luable .
Within the last two years four measurements have been made at thisplace, as follows :
Dischargemeasurements of S outh Pla tte River a t J ulesburg , Colora do .
S ec -ft .
September 1 4 , 1899 2
November 12,1 899
March 8,1 900 2 , 291
November 2 , 1 900 76

284 OPERAT IONS AT RIVER STAT IONS , 1 900.
— PART III . [No . 49.
On December 20,1 900
,the South P latte was measured at North
P latte,Nebraska ,
by Adna Dobson ,and a d ischarge of 963 second
feet was found
BEAR CREEK NEAR MORRISON,COLORADO .
Bear Creek is one of the smaller tributariesof the South Platte,heading in the V icinity Of Mount Evans
,about 30 miles southwest of
Denver,and entering the main stream about 8 miles above that city .
Although usually of sma ll volume,the stream dra ins a considerable
portion of very mountainous country ,which is subj ect to more or less
V iolent cloudbursts,so that floods somet imes come down this creek
,
causing great destruction to property and even the loss of life . Allof the normal flow of the stream is used for irrigation ,
and it isonlyduring high -water stages that a large amount of water passes throughit . Records of its flow have been kept for a portion of each irrigationseason since April , 1 888 , with the except ion of the years 1 892
,1 893
,
and 1 894 . T he present station was establ ished April 1 6 , 1 899 . It is
located just above the little town of Morrison . T he gage rod,which
,
is a 2—inch by 4 - inch timber placed vert ically and marked in feet andtenths
,is fastened to the upper side of the dam which diverts water
into the mains of the Denver Union W'
ater Company . T he benchmark is the top of a granite bowlder about 1 00 feet above the rod on
the left -hand side of the stream,and it is feet above the gage
datum. As in previous years, the station was ma intained throughcooperation with the Denver Un ion lVater Company . Owing to theformation of a gravel bar in the summer Of 1 900
,the conditionswere
for some time radically changed from the normal,and during the
month of September no gagings were taken . T he observer is S .
Hebrew,an employee of the Denver Union XVater Company . Tables
of gage heights and - dischargemeasurements for 1 899 will be found inWater- Supply Paper NO . 37 pages 227 and 228 . T able of themonthlyflow for that year will be found in the Twenty -first Annual Report ,Part IV
, page 204 . During 1 900 the following measurements weremade by A . L . Fellows
March 9 : G age height , feet ; discharge , 17 second-feet .
April 1 4 : Gage height , feet ; discharge ,47 second-feet .
April 25 : Gage height , feet ; discharge , 367 second-feet .
August 7 : Gage height , feet ; discharge ,63 second-feet .
September 6 : No gage height taken ( conditions abnormal ) ; discharge ,
24 second-feet.

286 OPERAT ION S AT RIVER S T AT ION S , 1900.
— PART I II . [No. e .
structed at an acute angle . It is possible ,however
,to secure fairly
good results by means of measurementsmade at the two bridges abovethe forks
,thus securing data of the flow Of each branch as well as
the tota l flow . At low water the stream may be gaged by wad ing .
During the last two years the Observer has been C . N . Davis,ra ilway
station agent at Forkscreek . He has voluntarily made the readingsand sent daily reports to the local forecast Official in Denver , who hashad them published in the morning papers. A description Of the
station was published in Water-Supply Paper NO . 37 page 228 . T he
results of measurements for 1 899 will be found in the Twenty -first
Annua l Report , Part IV , page 205 . During 1 900 the following measurements were made by A . L . Fellows :
March 10 : Gage height , feet ; discharge , 55 second-feet .
Ap ril 13 : Gage height , feet ; discharge , 73 second-feet .
Apri l 24 : Gage height , feet ; discharge , 290 second- feet .
August 27 : Gage height , feet ; discharge , 1 30 second- feet .
Da i ly gage height , in feet , of C lea r Creek a t Forkscreek , Colorado f or 1 900 .
May . June . Nov .
SOU T H BOU L DER CREEK NEAR MARSHALL,COLORADO .
South Boulder Creek,a tributary of Boulder Creek IS the next
mountain stream Of importance north of Clear Creek . T he gagingstation
,which was established in April , 1 888 , and has been main
tained during a portion of each year since,except during 1 893 and
1 894,is located at the mouth of the canyon fromwhich the stream
issues about 3 miles west Of the Colorado and Southern Ra ilwaystation at Marshall . T he rod consists of an inclined timber on the

COLORADO. 287
north bank of the stream near the house of C . E. Barber . Above thestation two ditches divert water , namely ,
the South Boulder and CoalCreek d itch and the Community d itch , and their d ischargesmust beadded to the discharge at the station
,in order to obta in the total run
Ofi of the basin . T he channel of the stream,which is rocky and full of
bowlders,does not change materially . Gagings are usually made by
wad ing ,but at high water they are made from the footbridge just
above the rod . T he observer during 1 900 wasMiss Blanche Barber ,who lives near by . A description of the station was published in“l ater - Supply Pap er NO. 37 page 229. T he results of measurements
for 1 899 will be found in the T wenty-first Annual Report , Part IV ,
page 206 . During 1 900 the following measurements were made byA . L . Fellows :
July 28 : Gage height , feet ; discharge ,35 second-feet.
August 28 : G age height feet ; discharge ,10 second-feet .
Da i ly gage height, in feet, of S outh Boulder Creek nea r Marsha ll , Colorado for1 900 .
May . June . July . Aug . May . June. J u1y . Aug . S ept .
- . s
- 0 5 —v l - O - C
a Regular readings did not begin unt il June 1 .
BOU L DER CREEK NEAR BOU LDER,COLORADO
T he genera l character of Boulder Creek,one of the tributaries of
S t . Vrain Creek,is S imilar to that of the latter stream. T he gaging
station is located 1%miles above the town Of Boulder,where the stream
issues from the mounta ins. There are two small irrigation d itchesabove the station
,but the amount Of water diverted does not exceed
5 or 6 second - feet , and may ,therefore
, be disregarded . T he channelof the stream conta ins SO many large bowlders that accuratemeasurements are d ifficult to Obtain
,either here or at any other point . During
high water measurements are made from the bridge , but at low ~water
stages the stream can be gaged by wad ing. T he ent ire norma l flowis used for irrigation ,
but large quantities of water go to waste duringthe flood season . P lans are being considered for the construction of
large reservoirs to store the flood waters for the irrigation of landsnow arid . T he gage rod is an inclined timber Spiked to stakes driven

288 OPERAT ION S AT RIVER ST AT IONS , 1 900 .
— PART III . [No . 49.
into the bank. T he bench mark is the top of a large stone 22 feetwest of the gage and feet above the zero of the rod . Both banksare high and rocky ,
and are not subject to overflow . T he observerfor 1 900 was Mrs. Carrie Osgood ,
who lives near by . A descriptionof the station was published inWater- Supply Paper NO . 37 page 231 .
T he results Of measurements for 1 897 , 1 898 , and 1 899 wi ll be found inthe Twenty -first Annual Report , Part IV , page 207 . During 1 900 thefollowing measurements were made by A . L . Fellows :
-April 28 : Gage height , feet ; discharge ,483 second-feet .
July 27 : Gage height , feet ; discharge ,220 second-feet .
August 28 : Gage height , foot ; discharge, 49 second -feet .
Da i ly gage height, in feet , of Boulder Creek near Boulder , Colorado , for 1 900 .
May . June . July . Aug . S ept . Oct . May . June . July . S ept . Oct .
S T . VRAIN CREEK NEAR LYONS,COLORADO .
S t . Vra in Creek and its tributaries derive their supply of water
from the eastern slope of the Front Range , between Longs Peak and
James Peak,which are about 30 miles apart . T he genera l trend of
the dra inage is northeasterly ,the S t . V ra in flowing into South P latte
River about 6 miles below the town of P latteville . T he principaltributaries of the stream are the North and South forks and BoulderCreek . South Boulder Creek is a tributary of the latter stream. In
their upper portions these creeks flow through mountainous areas
where the water is used only for power purposes and for placer mining ,
but at the foothills each stream emerges into a broad,approxi
mately level valley ,devoted entirely to farming ,
water being furnishedbvmeansof irrigation cana ls lead ing fromthe streams. Three stationsare ma intained on the main stream and its tributaries, namely ,
at
Lyons, on the S t . V ra in,at Boulder , on the Boulder, and at Marshall ,
on the South Boulder . T he station at Lyons is about a half mi lesoutheast Of the town ,
and is below the intersection of the North and
South forks.
Records of the flow of the creek at or near Lyons have been keptS ince April , 1 888, except during the years 1 893 and 1 894 , but the sta
t ion was not put in itspresent condition until May 5 , 1 899, since when

290 OPERAT ION S AT RIVER ST AT ION S,1900.
— PART I II . [No . 49.
B IG T HOMPSON CREEK NEAR ARKINS, COL ORADO .
Th is streamd ra ins the country immed iately north of that dra inedby the headwaters of S t . Vra in Creek
,and is one of the largest tribu
taries of South P latte River,into which it empties about 4; miles
above the town Of Evans. L itt le Thompson“Creek is an important
tributary of Big Thompson Creek ,and the country dra ined by these
two streams makes up irrigation d istrict NO . 4 . T he junction of
these creeks is near the lower end of the d istrict,a short distance
above the po int where their combined waters enter the South P latte .
Records of the flow of this stream were begun in April , 1 888 , andhave been ma inta ined for a portion of each year since
,with the
exception of the years 1 893 and 1 894 . T he stationWas established atits present location on April 1 , 1 899 . T he only d iversi on above thegaging station is Handy ditch , a record of the gage heights of whichis kept by the water commissioner of that d istrict
,J . M . WOlaver
,
who has also kept the records of B ig Thompson C reek at this pointduring the year 1 900 . It is necessary to include the d ischarge of
Hand y d itch in Order to Obta in the tota l run -Off of the basin . T he rod
is a vertica l 2 inch by 4—inch timber fastened to the downstream sideof the right -hand end Of the wagon bridge on the ranch of JohnChasteen . T he bench mark is 25 feet south of the gage , and is a na ilin the root of a cottonwood stump ,
the head of the na il being feetabove the zero Of gage . T he channel of the stream is lined w ithbowlders and is very rough ,
but,not being likely to change , it fur
nishes a good point for Obta in ing accurate measurements. A per
manent station could be located here to advantage . L ike the othertributaries of the S outh P latte
,nearly all of the normal flow of Big
Thompson and L ittle Thompson creeks i s used for irrigation ,and
d uring the high-water stages the greater part of the volume is divertedinto large reservoirs
,from which. it is used to advantage later in the
season . A description of the station was published in Water - SupplyPaper No . 37
, page 233 . T he results of measurements for 1 899 w ill befound in the Twenty
-first Annual Report , Part IV , page 209 . Dur ing1 900 the follow ing measurements were made by A . L . Fellows :
April 26 : Gage height , feet ; discharge , 5 12 second - feet.
July 26 ; G age height , feet ; discharge , 322 second- feet .

COLORADO. 29 1
Da i ly gage height, in feet, of Big Thomp son Creek nea r Arkins,Colorado ,for 1 900 .
May . June . July . Aug . S ept . Apr . May . June . Aug . S ept .
i n n —v
- Q
n n n n n
Da i ly gage height, in feet, of H andy d i tch nea r Arkins, Colorado , for 1 900 .
July . Aug . S ept . Day . June . July . Aug . S ept . June . July . Aug . S ept .
12. 40 . 30 13. 40 . 30 14. 40 . 30 15
. 80 . 40 . 30 1 6
. 80 . 40 . 30 1 7
. 80 . 40 . 30 18
. 72 . 45 . 30 19
. 72 . 45 . 30 20
. 72 . 40 . 30 21
. 72 . 40 . 30 22
CACHE LA POU DRE RIVER NEAR FORT COLL INS,COLORADO .
This stream is the northernmost of the large tributaries of the
South P latte which issue from the east front of the Rocky Mountains. During the irrigating season its d ischarge is augmented bythe supply d iverted from the headwaters Of Laramie River
,which lie
immediately to the west of the headwaters of the Cache la Poudre,the diversion being made through Sky L ine canal . Measurementsof the discharge of the Cache la Poudre Basin
,therefore
,include
some of the Laramie waters. Practically the entire flow of the Cachela Poudre is used for irrigation purposes, even the greater part of
the flood waters being stored for use later in the S eason . It is a longthe valley Of the Cache la Poudre that the earliest and best irrigationof the State has been carried on .
T he gaging station,which was established in 1 884
,is about 1 5 miles
above Fort Collins. S ince its establishment it has been ma inta inedunder the direction of Prof . L . G . Carpenter, of the Colorado State
Agricultura l College . T he records are from the figures published byProfessor Carpenter in the da ily papers. T he figures of daily d ischarge for the years 1 895 to 1 899 , inclusive , will be found in VVater
Supply Paper NO . 37, pages 235 to 237 .
0. 72
72‘
72
. ‘d
. 72
. 72
. 72
. 72
. 72
. 72
. 72
. 32
. 32
. 32
. 32
. 32
. 32
. 32
. 32
. 32
3030
. 8030
303030
3030
30

292 OPERAT IONS AT RIVER STAT IONS , 1900.
— PART III . [No . 49.
Da i ly discha rge , in second -feet, Of Cache la Poudre River nea r Fort Collins, Colo
rado , for 1 900 .
Mean
[Cont inued in Water- Supply Paper NO . 50,where will be found
tables of computations of seepage on numerous streams in Colorado ]

1 . Pumping water for irrigation, byHerbert M.W ilson , 1896.'
2. Irrigation near Phoenix, Arizona, byArthur P. Davis, 1897.
3. Sewageirrigation, by GeorgeW Rafter, 1897.
”
4 . A reconnoissance in southeasternWashington, byIsrael C . Russell, 1897.5 . Irrigation practice on theGreat Plains, by E B. Cowgill , 1897.
”6. U ndergroundwaters of southwestern Kansas, by ErasmusHaworth , 1897.
7. Seepage waters of northern U tah , by Samuel Fortier, 1897 ;8. Windmills
_for irrigation ,
by E. C Murphy ,1897.
9. Irrigation near Greeley , Colorado , by David Boyd , 1897.
-10. Irrigation in Mesilla Valley , New Mexico , by F. C . Barker, 1898.
1 1 . River heights for 1896, by Arthur P . Davis, 1897
12 . U nderground waters of southeastern Nebraska ,by N .
‘
H. Darton,1898.
13. Irrigation systems in T exas, by W. F. Hutson, 1898.
1 4. New testsof pumpsand water liftsused in irrigation, by O . P .Hood, 1898.Operations at river stations, 1897 , Parts I , II , 1898.
17. IrrigationnearBakersfield , California , by C . E. Grunsky , 1898.
18. Irrigation near Fresno, California , by C . E. Grunsky , 1898.
19. Irrigation near Merced , California , by C. E. Grunsky , 1899.
20. ExperimentsWith windmills, by T homas0 . Perry , 1899.
21 . Wells of northern Indiana , byFrank Leverett , 1899.22. Sewage irrigation, Part II , by GeorgeW. Rafter , 1899.
23. Water-right problems of_Bighorn Mountains, by Elwood Mead, 1899.Water resourcesof the S tate ofNew York , PartsI , II , by G .W.Rafter, 1899.
26. Wells of southern Indiana ( continuation of No. by Frank Leverett , 1899.
Operations at river stations, 1898 , Parts I ,
29. Wells and windmills in Nebraska , by ErwinHinckley Barbour ,1899.
30. Water resourcesof theLowerPeninsula ofMichigan, byAlfredC .Lane, 1899.31 . Lower Michiganmineral waters, by Alfred C . Lane, 1899.
32. Water resources of Puerto Rico, by H. M.Wilson, 1900.
33 . S torage of water on G ila River, Arizona , by J . B. Lippincott , 1900.
34 . Geology and water resourcesof southeastern S . Dak. , by J. E. T odd, 1900.
35 39. Operations at river stations, 1899, Parts I- V , 1900.
40. T he Austin dam,by T homas U . T aylor, 1900.
T he windmill . its efficiency and use, Parts I , II, by E. C . Murphy, 1901 .43 . Conveyance of water
'
in irrigation canals, etc. , by Samuel Fortier , 1901 .44. Profiles of rivers, by Henry Gannett , 1901 .
45 . Water storage on Cache Creek , California , by Albert E. Chandler, 1901 .46 . Reconn. ofKern andYuba rivers, Cal , .by F H .OlmstedandM.Manson, 1901 .
47—52. Operationsat river stations, 1900, Parts I-VI , 1901 .
Other papersare in various stages of preparation. Provisionhasbeenmadeforprinting these by the following clause in the sundry civil actmaking appropriations for the year 1896
—97 :
Provided , T hat hereafter the reports of the Geological Survey in relation to thegaging of streams and to the methods of utilizing the water resourcesmay beprinted in octavo form, not to exceed 100 pages in length and 5 ,000 copies in number; 1 ,000copi es of which shall be for the
“official use of the G eological Survey ,
1 ,500 copies shall be delivered. to the Senate , and 2,500 copies shall begdelivered to
the House of Representatives, for distribution. (Approved, June‘
1 1 , 1896 ; Stat.L . , vol . 29, p.
T he endeavor ismade to send these pamphlets to personswho have rendered
assistance in their preparation through replies to schedulesorWho have furnisheddata . Reouestsmade for a certaip paper and stating a reason for asking for it are
granted Wheneverpracticable,but it'
isimpossible to complywith general demands,such as to have all of the seriessent
“
.
Application for these papersshould bemade either tomembers of Congress or to
_
49
THEDIRECTOR, UNITEDSTATES GEOLOGICAL SURVEY,WASHINGTON, D. 01 1 m