Department of Environment, Forest & Climate Change, Govt ...
139
Revised ACTION PLAN FOR RESTORATION & CONSERVATION OF POLLUTED RIVER STRETCHES IN BIHAR Department of Environment, Forest & Climate Change, Govt. of Bihar
-
Upload
khangminh22 -
Category
Documents
-
view
2 -
download
0
Transcript of Department of Environment, Forest & Climate Change, Govt ...
Revised
ACTION PLAN
FOR
RESTORATION & CONSERVATION
OF
POLLUTED RIVER STRETCHES
IN
BIHAR
Department of Environment, Forest & Climate Change,
Govt. of Bihar

CONTENTS
Sl. No.
Content
Page No.
Executive Summary 1-5 1. Background. 5-7 2. Bihar: An overview. 7-8 3. River Ganga & its Tributaries. 8-9 4. Initiatives for Conservation of River Ganga. 9-10 5. Water Quality Monitoring Network in Ganga Basin. 10-14 6. Polluted River Stretches in Bihar. 15-17 7. Sewage/Domestic Waste Water Management in ULBs located
in the Polluted River Stretches. 17-50
8. Industrial Pollution along the Polluted River Stretch. 50-53 9. Ground Water Status of Bihar. 53-54 10. Crop Diversification & Drip Irrigation. 54-55 11. Forestry & Plantation Activities along River Ganga and its
Tributaries in Bihar. 55-59
12. Action Plan for Open Defecation Free (ODF). 59-60 13. Status & Action Plan for Solid Waste, Plastic Waste, Bio-
Medical Waste, e-Waste and Hazardous Waste Management. 60-61
14. Action Plan for Restoration & Conservation of Polluted River Stretches in Bihar.
61-68
15. Annexure-1: Water Quality Status of River Ganga (2009-2018).
69
Annexure-2: Year Wise Water Monitoring Data of the Ganga.
70-83
Annexure-3: Year Wise Water Quality Monitoring Data of other Polluted River Stretches.
83-89
Annexure-4: Monitoring Reports of Individual Drains. 90-111 Annexure-5: Physical & Financial Target of Agriculture
Road Map 2017-18 to 2021-22. 112
Annexure-6: Constitution of RRC Bihar. 113-114
Annexure-7: Latest status of Ground Water in Bihar as reported CGWB
115-137

1
Executive summery and achievable goals with time lines
Out of 351 polluted river stretches those identified in the State of Bihar are river Sirisia at Raxaul (Priority-III), Parmar along Jogbani (Priority-V), Punpun at Fatuha (Priority-V), Ramrekha at Harinagar (Priority-V), Sikrahna at Narkatiaganj Priority-V) and Ganga (Priority-V). In compliance of the order of the Hon'ble NGT, dated-20.09.2018 River Rejuvenation Committee (RRC) has been constituted in the State of Bihar. The aforesaid River Rejuvenation Committee (RRC) has formulated action plan including the components as desired by the Hon'ble NGT for the aforesaid polluted river stretches in Bihar. The same has been submitted to CPCB & NMCG. The Harbaura and Ramrekha rivers join Sikrahna river near Lauriya in West Champaran district. These rivers are small rivers having low flow during lean season. Sirsia river originates in Nepal and enters Bihar at Raxaul, East Chamapran district. Similarly Parmar river also originates in Nepal and enters at Jogbani in Araria district. Sirsia river is already polluted by the time it enters Indian Territory. The Punpun River is a tributary of the Ganga. It originates in Palamu district of Jharkhand and flows through Aurangabad, Jahanabad and Patna districts of the Biharand joins the Ganga at Fatuha, 25km downstream of Patna. This river receives untreated sewage from Patna through Badshahi Nala and consequently observed polluted in downstream. The value of BOD in the Ganga river in Bihar stretch has normally been observed <3.0 mg/L except single observations of more than >3.0 mg/L at each of the 04 towns namely Patna, Barahiya, Munger and Bhagalpur during October, 2016 and at Simariya ghat, Mokama (Station code-1815) & Barahiya (Station code-3123) during January, 2017 and hence Ganga river from Buxar to Bhagalpur may not be treated as polluted river stretch with respect to BOD value. However, the quality does not conform with respect to FC. This is due to discharge of untreated sewage from the towns located on the banks of the river. Similarly value of BOD in Parmar river (Station code-1824, at Jogbani) was observed 3.6 mg/L during February, 2017. This was the only one value >3.0mg/L during 2010-11 to 2017-18 and hence Parmar river may not be treated as polluted river stretch with respect to BOD value. Bihar State Pollution Control Board has identified the drains, its flow and recipients generated from ULBs located in the basin of polluted river stretch as hereunder:-

2
Sl. No.
Name of ULBs Number of Drains Identified
Total Flow in MLD
Recipients/ Polluted River
Stretch 1. Raxaul Nagar
Parishad, Raxaul 3 14.89 (15) Sirsiya River
2. Narkatiaganj Nagar Parishad, Narkatiaganj
3 14.59 (15) Harbaura River
3. Ramnagar Nagar Panchyat, Ramnagar
5 27.88 (28) Ramrekha River
4. Fatuha Nagar Parishad, Patna
7 9.22 (09) Ganga River & Punpun
5. Jogbani Nagar Panchayat, Araria
4 2.74 (03) Low lying Area
Sewerage Network, STP & Action Plan for Sewage Management in Polluted River Stretch: Presently,there is no any sewerage network and Sewage Treatment Plant (STP) in the ULBs of polluted river stretch basin excluding Ganga.Bihar State Ganga River Conservation & Programme Management Society (BGCMS) has directed BUDCO for preparation of DPR for sewage management for the ULBs namely Raxaul, Narkatiaganj, Ramnagar-Harinagar and Jogbani located in the polluted river stretch basin. Fatuha (Punpun River): A scheme of I&D and STP of 07 MLD capacity has been approved for Rs. 35.49 Cr. for Fatuha. NIT has been floated for re-tender. The expected time of completion of the project is December, 2020. Ramnagar/Harinagar (Ramrekha River): DPR for I&D with STP is under preparation. It will be prepared by July, 2019 and will be sent to NMCG for sanction. After approval of DPR work will be completed by March, 2021. Narkatiaganj (Harbaura River): DPR for I&D with STP is under preparation. It will be prepared by July, 2019 and will be sent to NMCG for sanction. After approval of DPR work will be completed by March, 2021. Raxaul (Sirsia River): DPR for I&D with STP is under preparation. It will be prepared by July, 2019 and will be sent to NMCG for sanction. After approval of DPR work will be completed by March, 2021. Jogbani (Parmar River): DPR for I&D with STP is under preparation. It will be prepared by July, 2019 and will be sent to NMCG for sanction. After approval of DPR work will be completed by March, 2021. Ganga River: There are 23 towns situated on main steam of river Ganga. Out of 23 towns, sewerage projects in shape of STP & network and I & D with STP have been sanctioned for 17 towns& approval awaited for 06 towns.
3
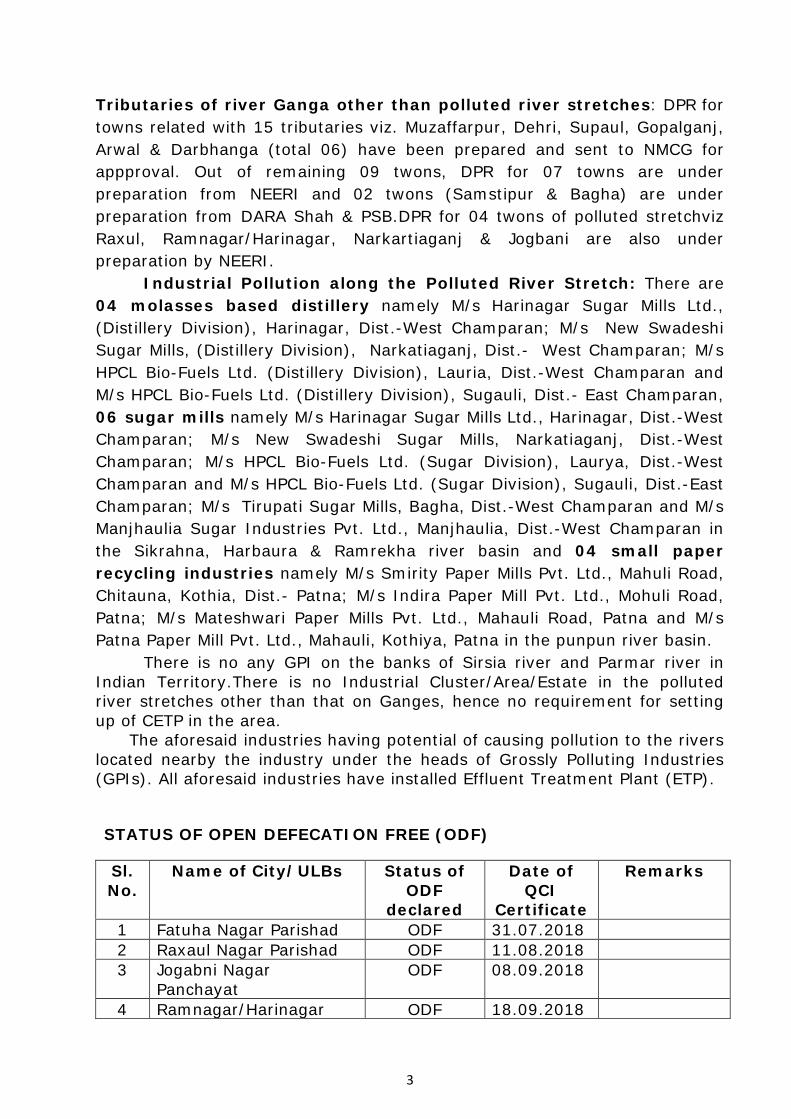
Tributaries of river Ganga other than polluted river stretches: DPR for towns related with 15 tributaries viz. Muzaffarpur, Dehri, Supaul, Gopalganj, Arwal & Darbhanga (total 06) have been prepared and sent to NMCG for appproval. Out of remaining 09 twons, DPR for 07 towns are under preparation from NEERI and 02 twons (Samstipur & Bagha) are under preparation from DARA Shah & PSB.DPR for 04 twons of polluted stretchviz Raxul, Ramnagar/Harinagar, Narkartiaganj & Jogbani are also under preparation by NEERI. Industrial Pollution along the Polluted River Stretch: There are 04 molasses based distillery namely M/s Harinagar Sugar Mills Ltd., (Distillery Division), Harinagar, Dist.-West Champaran; M/s New Swadeshi Sugar Mills, (Distillery Division), Narkatiaganj, Dist.- West Champaran; M/s HPCL Bio-Fuels Ltd. (Distillery Division), Lauria, Dist.-West Champaran and M/s HPCL Bio-Fuels Ltd. (Distillery Division), Sugauli, Dist.- East Champaran, 06 sugar mills namely M/s Harinagar Sugar Mills Ltd., Harinagar, Dist.-West Champaran; M/s New Swadeshi Sugar Mills, Narkatiaganj, Dist.-West Champaran; M/s HPCL Bio-Fuels Ltd. (Sugar Division), Laurya, Dist.-West Champaran and M/s HPCL Bio-Fuels Ltd. (Sugar Division), Sugauli, Dist.-East Champaran; M/s Tirupati Sugar Mills, Bagha, Dist.-West Champaran and M/s Manjhaulia Sugar Industries Pvt. Ltd., Manjhaulia, Dist.-West Champaran in the Sikrahna, Harbaura & Ramrekha river basin and 04 small paper recycling industries namely M/s Smirity Paper Mills Pvt. Ltd., Mahuli Road, Chitauna, Kothia, Dist.- Patna; M/s Indira Paper Mill Pvt. Ltd., Mohuli Road, Patna; M/s Mateshwari Paper Mills Pvt. Ltd., Mahauli Road, Patna and M/s Patna Paper Mill Pvt. Ltd., Mahauli, Kothiya, Patna in the punpun river basin. There is no any GPI on the banks of Sirsia river and Parmar river in Indian Territory.There is no Industrial Cluster/Area/Estate in the polluted river stretches other than that on Ganges, hence no requirement for setting up of CETP in the area. The aforesaid industries having potential of causing pollution to the rivers located nearby the industry under the heads of Grossly Polluting Industries (GPIs). All aforesaid industries have installed Effluent Treatment Plant (ETP).
STATUS OF OPEN DEFECATION FREE (ODF)
Sl. No.
Name of City/ULBs Status of ODF
declared
Date of QCI
Certificate
Remarks
1 Fatuha Nagar Parishad ODF 31.07.2018 2 Raxaul Nagar Parishad ODF 11.08.2018 3 Jogabni Nagar
Panchayat ODF 08.09.2018
4 Ramnagar/Harinagar ODF 18.09.2018
4
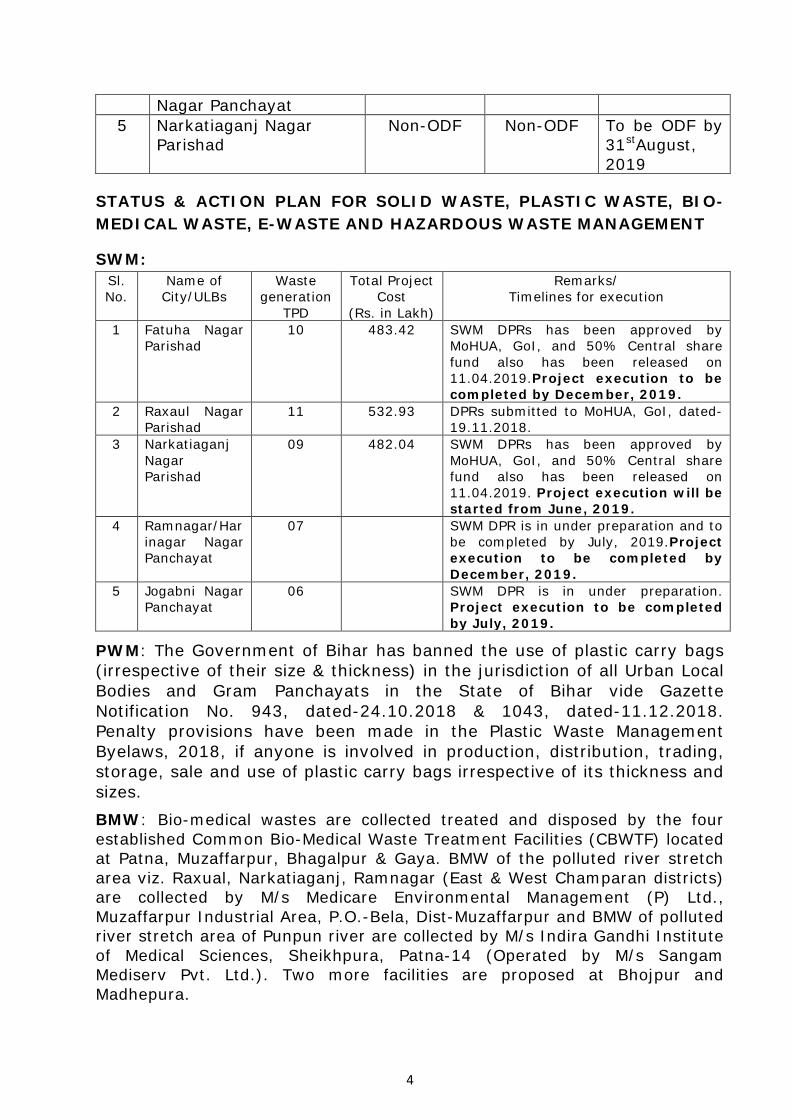
Nagar Panchayat 5 Narkatiaganj Nagar
Parishad Non-ODF Non-ODF To be ODF by
31stAugust, 2019
STATUS & ACTION PLAN FOR SOLID WASTE, PLASTIC WASTE, BIO-MEDICAL WASTE, E-WASTE AND HAZARDOUS WASTE MANAGEMENT
SWM: Sl. No.
Name of City/ULBs
Waste generation
TPD
Total Project Cost
(Rs. in Lakh)
Remarks/ Timelines for execution
1 Fatuha Nagar Parishad
10 483.42 SWM DPRs has been approved by MoHUA, GoI, and 50% Central share fund also has been released on 11.04.2019.Project execution to be completed by December, 2019.
2 Raxaul Nagar Parishad
11 532.93 DPRs submitted to MoHUA, GoI, dated-19.11.2018.
3 Narkatiaganj Nagar Parishad
09 482.04 SWM DPRs has been approved by MoHUA, GoI, and 50% Central share fund also has been released on 11.04.2019. Project execution will be started from June, 2019.
4 Ramnagar/Harinagar Nagar Panchayat
07 SWM DPR is in under preparation and to be completed by July, 2019.Project execution to be completed by December, 2019.
5 Jogabni Nagar Panchayat
06 SWM DPR is in under preparation. Project execution to be completed by July, 2019.
PWM: The Government of Bihar has banned the use of plastic carry bags (irrespective of their size & thickness) in the jurisdiction of all Urban Local Bodies and Gram Panchayats in the State of Bihar vide Gazette Notification No. 943, dated-24.10.2018 & 1043, dated-11.12.2018. Penalty provisions have been made in the Plastic Waste Management Byelaws, 2018, if anyone is involved in production, distribution, trading, storage, sale and use of plastic carry bags irrespective of its thickness and sizes.
BMW: Bio-medical wastes are collected treated and disposed by the four established Common Bio-Medical Waste Treatment Facilities (CBWTF) located at Patna, Muzaffarpur, Bhagalpur & Gaya. BMW of the polluted river stretch area viz. Raxual, Narkatiaganj, Ramnagar (East & West Champaran districts) are collected by M/s Medicare Environmental Management (P) Ltd., Muzaffarpur Industrial Area, P.O.-Bela, Dist-Muzaffarpur and BMW of polluted river stretch area of Punpun river are collected by M/s Indira Gandhi Institute of Medical Sciences, Sheikhpura, Patna-14 (Operated by M/s Sangam Mediserv Pvt. Ltd.). Two more facilities are proposed at Bhojpur and Madhepura.

5
e-Waste: There is no any manufacturer and e-Waste dismantlers, recyclers and re-furbishers in this State. Producers have been directed for collection& channilization of e-waste under EPR authorization by CPCB.
HW: There is no TSDF and significant HW generation in the State.
1.BACKGROUND
Water is one of the most essential requisites that nature has provided to sustain life on earth. Without water there would be no life. Population growth, rapid development and indiscriminate and excessive use of water have resulted in great depletion and deterioration of water resources. Water bodies are being polluted by discharge of sewages, industrial effluents and run-off water of the catchment area. Therefore, it is a clarion call to take necessary initiatives to maintain & restore the sanctity of water bodies. The Hon'ble NGT, Principal Bench, New Delhi registered application no. 673/2018 on the basis of news item dated-17.09.2018authored by Sri Jacob Koshy titled in "The Hindu" under the heading "More river stretches are now critically polluted: CPCB''.According to news itemCPCB identified a total of 302 polluted river stretches in the country during 2015 which have since increased to 351. The polluted river stretches have been divided into five priority categories i.e. I, II, III, IV & V.
Priority I BOD greater than or equal to 30 mg/L Priority II BOD between 20-30 mg/L Priority III BOD between 10-20 mg/L Priority IV BOD between 06-10 mg/L Priority V BOD between 03-06 mg/L
Out of 302 polluted river stretches those identified in the State of Bihar are river Sirisia at Raxaul (Priority-III), Parmar along Jogbani (Priority-V), Punpun at Fatuha (Priority-V), Ramrekha at Harinagar (Priority-V), Sikrahna at Narkatiaganj Priority-V) and Ganga (Priority-V). The Hon'ble NGT in its order dated-20.09.2018 directed all the States to prepare action plan within two months for making all the polluted river stretches fit at least for bathing purposes (i.e. BOD <3mg/L and FC <500 MPN/100ml) within six months from the date of finalization of the action plans. In compliance of the order, River Rejuvenation Committee (RRC) has been constituted by the Department of Environment, Forest & Climate Change, Govt. of Bihar vide notification no. 1412(E), dated-31.12.2018which includesDirector, Ecology & Environment, Department of Environment, Forest & Climate Change, Govt. of Bihar; Special Secretary, Urban Development & Housing Department, Govt. of Bihar; Director Industries, Department of
6
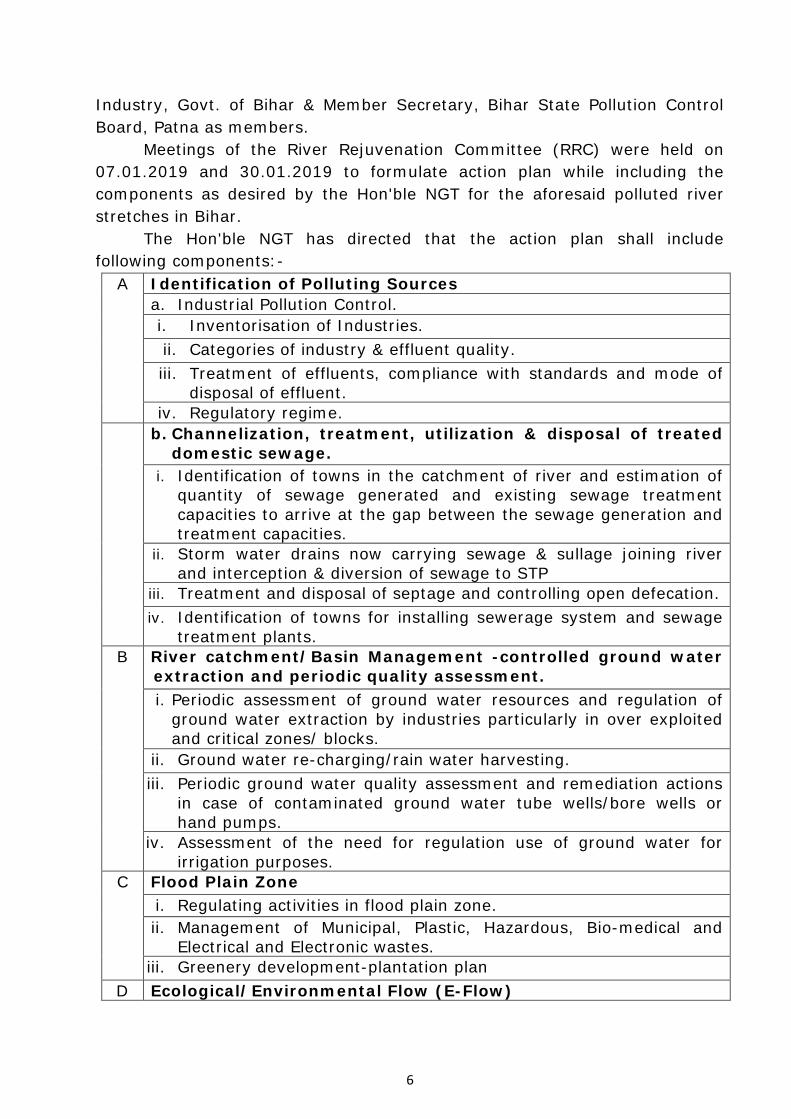
Industry, Govt. of Bihar & Member Secretary, Bihar State Pollution Control Board, Patna as members. Meetings of the River Rejuvenation Committee (RRC) were held on 07.01.2019 and 30.01.2019 to formulate action plan while including the components as desired by the Hon'ble NGT for the aforesaid polluted river stretches in Bihar. The Hon'ble NGT has directed that the action plan shall include following components:-
A Identification of Polluting Sources a. Industrial Pollution Control. i. Inventorisation of Industries. ii. Categories of industry & effluent quality. iii. Treatment of effluents, compliance with standards and mode of
disposal of effluent. iv. Regulatory regime.
b. Channelization, treatment, utilization & disposal of treated domestic sewage.
i. Identification of towns in the catchment of river and estimation of quantity of sewage generated and existing sewage treatment capacities to arrive at the gap between the sewage generation and treatment capacities.
ii. Storm water drains now carrying sewage & sullage joining river and interception & diversion of sewage to STP
iii. Treatment and disposal of septage and controlling open defecation. iv. Identification of towns for installing sewerage system and sewage
treatment plants. B River catchment/Basin Management -controlled ground water
extraction and periodic quality assessment. i. Periodic assessment of ground water resources and regulation of
ground water extraction by industries particularly in over exploited and critical zones/ blocks.
ii. Ground water re-charging/rain water harvesting. iii. Periodic ground water quality assessment and remediation actions
in case of contaminated ground water tube wells/bore wells or hand pumps.
iv. Assessment of the need for regulation use of ground water for irrigation purposes.
C Flood Plain Zone i. Regulating activities in flood plain zone. ii. Management of Municipal, Plastic, Hazardous, Bio-medical and
Electrical and Electronic wastes. iii. Greenery development-plantation plan
D Ecological/Environmental Flow (E-Flow)

7
i. Issues relating to E-Flow. ii. Irrigation practices.
E Such other issues which may be found relevant for restoring water quality to the prescribed standards.
2. BIHAR: AN OVERVIEW
Bihar is bounded by Nepal in north, Jharkhand in the south, West Bengal in the east and Uttar Pradesh in the west. The Bihar plain is divided into two unequal halves by Ganga which flows from west to east. It occupies a total geophysical area of 94,163km2 and has a population of 10.41Crores (10,40,99,452) as per census 2011. Out of total population of Bihar, 11.29% people live in urban areas and 88.71% in rural areas. The physical and administrative features of the State are presented as hereunder:- Features:
Particulars Census 2011 Census 2001 Approximate Population 10.41 Crores 8.3 Crores Actual Population 104,099452 82,998,509 Population Growth 25.42 % 28.43 % Percentage of totalpopulation of India
8.60% 8.07%
Rural Area (km2) 92,257.51 92,257.51 Urban Area(km2) 1095.49 1095.49 Total Area (km2) 94163 94163 Density/km2 1106 881 Rural Population 88.71% (92,341,436) 74,316,709 Urban Population 11.29% (11,758,016) 86,81,800
Administrative Units:
Divisions 9 Districts 38 Sub-divisions 101 CD blocks 534 Panchayats 8471 Number of Revenue Villages 45103 Number of Towns 130 Urban Local Bodies Municipal Corporation (12) Municipal Council (45) Municipal Nagar Panchayat (86)
143
There are no significant industrial establishments on the main stem of river Ganga. Water quality of Ganga in Bihar indicates the presence of higher value of bacteriological population (Total Coliform and Faecal coliform)

8
indicating the sewage/domestic waste water as the main source of its pollution. Restoration plan of water quality of Ganga includes laying of sewers, interception and diversion of sewage flowing through drain and setting up of sewage treatment plants (STPs), river front development, catchment area treatment (including plantation) construction and improvement of bathing ghats, setting of electric crematoria and low cost sanitation facilities. The desired results have not been achieved so far due to slow-implementation of sewer line and setting up of STPs in the towns located on the bank of River Ganga. The quality of Sikrahan/Budhi Gandak and its sub-tributaries (Ramrekha, Harbaura and Sirsia)and other tributaries of river Ganga also indicate presence of higher values of bacteriological population (Total Coliform and Faecal coliform) indicating sewage/domestic waste water as the main source of its pollution. The Harbaura and Ramrekha join Sikrahna river near Lauriya in West Champaran district. These rivers are small rivers having low flow during lean season. Sirsia river originates in Nepal and enters Bihar at Raxaul, East Chamapran district. Similarly Parmar river also originatesin Nepal and enters at Jogbani in Araria district. Sirsia river is already polluted by the time it enters Indian Territory. The Punpun River is a tributary of the Ganga. It originates in Palamu district of Jharkhand and flows through Aurangabad, Jahanabad and Patna districts of the Biharand joins the Ganga at Fatuha, 25km downstream of Patna. This river receives untreated sewage from Patna through Badshahi Nala and consequently observed polluted in downstream.
3.RIVER GANGA& ITS TRIBUTARIES
The River holy Ganga is the lifeline of northern India. Govt. of India has given the status of National River to the Ganga.In Bihar, Ganga traverses a distance of 425km from Chausa (Buxar) to downstream of Kahalgaon (Bhagalpur). The main tributaries of river Ganga are Gandak, Budhi Gandak, Ghaghra, Bagmati, Kamla-Balan, Koshi, Mahananda, Karmnasa, Son & Punpun. These tributaries contribute to the flow of Ganga in Bihar stretch and play significant role in maintaining wholesomeness (Nirmal Dhara and Aviral Dhara) of the holy river.
Budhi Gandak: The Budhi Gandak RiverSystem is a tributary of the Ganga. The Budhi Gandak originates from the hilly area of West chamapran district of Bihar in Indian Territory and enters in Chautarwa Chaur near Bisambharpur, West Champaran, Bihar. The river flows through West Champaran, East Champaran, Muzaffarpur, Samstipur, Begusarai and

9
Khagaria districts of Bihar. It outfalls in the Ganga river near Khagaria. It is also known as Sikrahana in its upper stretch of West Champaran and East Champaran districts. The total catchment area is 12021sq.km, out of which 9601 sq.Km lies in Bihar and rest in Nepal. The total length of the river is 320km. The Ramrekha, Harbaura, Sirsia and Bagmati (partially) are the tributaries of the Sikrahna/Budhi Gandak.
Ramrekha: The Ramrekha originates from hilly area and enters in the plains of West Champaran district at Ramangar (Harinagar) and joins Sikrahana just down-stream to Lauria. It is a very small river.
Harbaura: The Harbaura originates from hilly area and enters in the plains of West Champaran district of Bihar near Gaunaha-Manguraha. It passes though Narkataiganj town and joins with Balaur and finally outfalls in Sikrahana river just down-stream to Lauria at Matmariya-Beglochana mauza which is approx. 0.5 Km in western side of Lauriya-Narkatiaganj road bridge.
Sirsia: The Sirsia river originates in Nepal and enters East Champaran district of Bihar at Raxaul in Indian territory.It finally outfalls in Sikrahana river in East Champaran district. It is a tributary of Sikrahana.
Parmar: The Parmar river originates from hilly areas of Nepal and enter at Jogbani of Araria district. This river joints Mahananda at Jokihat of Araria district. Two small rivers namely Khadam and Kisley which also originates in Nepal join Parmar river at village Haziganj and Bhimsena. Both the villages are very near to Jogbani within 1Km from the ' No Man's land'.
Punpun: The Punpun River is a tributary of the Ganga. It originates in Palamu district of Jharkhand and flows through Aurangabad, Jahanabad and Patna districts of the Bihar. The Punpun originates on the Chota Nagpur Plateau, at an elevation of 300m. The river mostly flows in a north-east direction and joins the Ganga at Fatuha, 25km downstream of Patna. The 200km long river is mostly rain fed and carries little water in the dry season. However, during rains, the Punpun often causes heavy flood damages east of Patna city. The catchment area of the Punpun is 8,530sq.km.
4.INITIATIVES FOR CONSERVATION OF RIVER GANGA
Earlier, Many initiatives such as Ganga Action Plan (GAP), National Ganga River Basin Authority (NGRBA) Plan where initiated to ensure effective abatement of pollution and conservation of the River Ganga by adopting a river basin approach for comprehensive planning and management. Govt. of India has given the status of National River to the Ganga.A vision of Nirmal and Awiral Dhara under "Namami Gange" Mission is to be achievedby ensuring management of municipal sewage, rural sewage,

10
control of industrial discharges & other proposed plans for Ganga Rejuvenation including its all tributaries.Recently, an Integrated Ganga Conservation Mission called "Namami Gange" has been set up by the Ministry of Water Resources, River Development & Ganga Rejuvenation (MOWR, RD & GR), GoI. Ministry of Water Resources River Development and Ganga Rejuvenation, Govt. of India has constituted the National Ganga Council under The River Ganga (Rejuvenation, Protection & Management) Authorities Order, 2016.National Mission for Clean Ganga (NMCG) is the implementation wing of Namami Gange Programme. In compliance of the aforesaid order State Ganga Rejuvenation, Projection & Management Committee (State Ganga Committee) has been constituted by the State Govt. under chairmanship of Chief Secretary of Govt. of Bihar as a State Nodal Agency for the implementation of the provisions of the aforesaid order and for effective abatement of pollution and rejuvenation, protection and management of the River Ganga and its tributaries.
5. WATER QUALITY MONITORING NETWORK IN GANGABASIN
Bihar State Pollution Control Board is regularly monitoring the water quality of river Ganga at 33 different locations in addition with the its tributaries at 53 locations, ponds at 02 locations & lakes at 03locations and ground water at 70 locations in the State of Bihar.Water Quality monitoring is carried out under National Water Quality Monitoring Program (NWMP) sponsored by CPCB.There are total 161 water quality monitoring stations under NWMP.The details of the monitoring stations are shown at Table-1 to 4.The Water Quality criteria is shown at Table-5.
Table-1 Surface Water quality Monitoring
River/Lake/Ponds No. of Sampling Points Frequency of Sampling Present
Ganga 33 Monthly Tributaries 53 Monthly Ponds 02 Monthly Lakes 03 Monthly
11
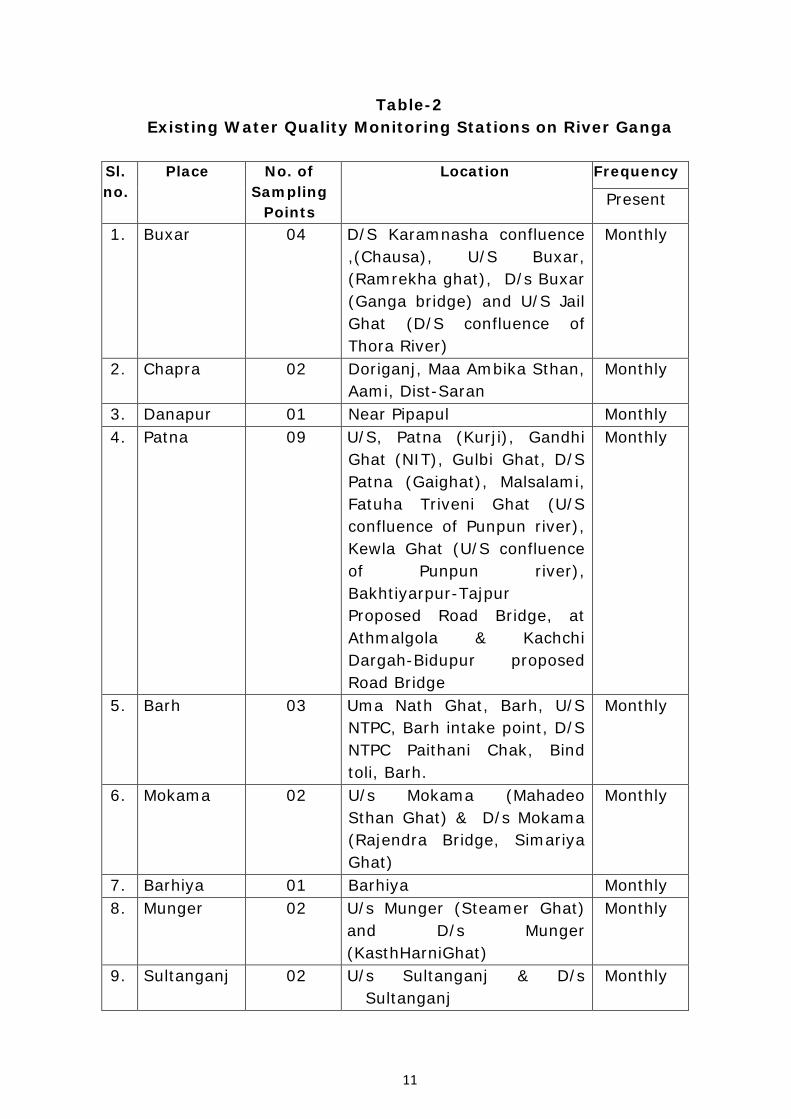
Table-2 Existing Water Quality Monitoring Stations on River Ganga
Sl. no.
Place No. of Sampling
Points
Location Frequency
Present
1. Buxar 04 D/S Karamnasha confluence ,(Chausa), U/S Buxar, (Ramrekha ghat), D/s Buxar (Ganga bridge) and U/S Jail Ghat (D/S confluence of Thora River)
Monthly
2. Chapra 02 Doriganj, Maa Ambika Sthan, Aami, Dist-Saran
Monthly
3. Danapur 01 Near Pipapul Monthly 4. Patna 09 U/S, Patna (Kurji), Gandhi
Ghat (NIT), Gulbi Ghat, D/S Patna (Gaighat), Malsalami, Fatuha Triveni Ghat (U/S confluence of Punpun river), Kewla Ghat (U/S confluence of Punpun river), Bakhtiyarpur-Tajpur Proposed Road Bridge, at Athmalgola & Kachchi Dargah-Bidupur proposed Road Bridge
Monthly
5. Barh 03 Uma Nath Ghat, Barh, U/S NTPC, Barh intake point, D/S NTPC Paithani Chak, Bind toli, Barh.
Monthly
6. Mokama 02 U/s Mokama (Mahadeo Sthan Ghat) & D/s Mokama (Rajendra Bridge, Simariya Ghat)
Monthly
7. Barhiya 01 Barhiya Monthly 8. Munger 02 U/s Munger (Steamer Ghat)
and D/s Munger (KasthHarniGhat)
Monthly
9. Sultanganj 02 U/s Sultanganj & D/s Sultanganj
Monthly

12
10.
Bhagalpur 03 U/s Bhagalpur (Barari Ghat), D/s Bhagalpur (Ganga Bridge) and Champa Nagar, Bhagalpur.
Monthly
11. Kahalgaon 02 Jahaj Ghat and Cremation Ghat
Monthly
12 Bhojpur 02 Aarah-Chapra Road Bridge & Water intake point Mauzampur, Barhara Block.
Total 33
Table-3 Water Quality Monitoring Stations of Tributaries of River Ganga. Sl. No.
River/ Ponds
No. of Sampling
Points
Sampling Locations Frequency
1. Sone 06 Banjari, Nasiriganj, Bahiara, Indrapuri Dam (Dehari-on- Sone), Koelwar and Dehri on sone Road Bridge
Monthly
2. Ghaghara 01 Revilganj Monthly 3. Gandak 05 Dumaria Ghat, Rewa
Ghat, Sonepur, U/S Hajipur (Road Bridge) and D/S Hajipur (Konhara Ghat)
Monthly
4. Punpun 03 Patna-Fatuha Road Bridge, Patna-Gaya Rail Bridge at Punpun, Kinzer Road Bridge
Monthly
5. Sikhrahna 04 Lauriya, Chanpatia, Lal Parsa & Lauriya-Narktiaganj Road Bridge.
Monthly
6. Daha 05 Siwan (Rajendra Bridge), U/s Sasamusa, D/s Sasamusa, Itwa bridge (Gopalganj-Mirganj Road), Mirganj.
Monthly
7. Sirsia 02 Raxaul-Birganj Check Monthly

13
Post, &KoiriaTola 8. Dhons 01 Saharghat (Madhubani-
Madhwapur Road Bridge)
Monthly
9. Parmar 01 Jogbani Monthly 10. Harbaura 02 Narkatiaganj U/s & D/s
Near Rail Bridge Monthly
11. Ramrekha 02 Harinagar U/s & D/s Monthly 12. Budhi-
Gandak 05 Samstipur Road Bridge,
U/s Muzaffarpur Road Bridge, Akhara Ghat (Muzaffarpur), Lalbagia & Khagaria Roard Bridge.
Monthly
13. Manusmar 02 Riga U/s & D/s Monthly 14. Koshi 03 Kurshailabridge
(Katihar), Medhepura&Birpur.
Monthly
15. Kamla 04 Benipatti (Madhubani), Goshalaghat (Darbhanga), Jaynagar, Jeevach Ghat, Darbhanga.
Monthly
16. Mahananda 01 Thakurganj-Kishanganj Road Bridge
Monthly
17. Bagmati 04 Muzaffarpur-Sitamarhi Road Bridge, Darbhanga-Samastpur Road Bridge, U/S Darbhanga and D/S Darbhanga (On second stream of Bagmati)
Monthly
18. Kohra 02 U/s Kohra Rajghat, Manjhaulia D/s Kohra Rajghat, Manjhaulia
Monthly
Total 53

14
Table-4 Water Quality Monitoring of Pond and Lakes
Sl. No.
Ponds No. of Sampling
Points
Sampling Locations
Frequency
1. Motijheel, Lake 01 Motihari Monthly 2. KanwarLake 01 Majhaul,
Begusarai Monthly
3. Sinkandarpur Lake
01 Muzaffarpur Monthly
4. DighiTalab, 01 Gaya Monthly 5. SurajKund 01 Gaya Monthly
Total 05 Table-5
Primary Water Quality Criteria for Various Uses Quality Class (Use Class)
Designated best use Parameter
pH Dissolved Oxygen (D.O.) mg/L Min.
Bio-Chemical Oxygen Demand (B.O.D.)
mg/L Max.
Total Coliform MPN/10
0ml Max.
A Drinking water source without conventional treatment but after
disinfections
6.5-8.5 6 2 50
B Outdoor bathing organized
6.5-8.5 5 3 500
C Drinking water source with conventional
(treatment followed by disinfections)
6.0-9.0 4 3 5000
D Propagation of Wild life, fisheries
6.5-8.5 4 - -
E Irrigation, Industrial Cooling, Controlled
Waste Disposal
6.5-8.5 - - -
Primary Water Quality Criteria for bathing
pH 6.5 to 8.5 Dissolved Oxygen (DO) 5 mg/L or more Biochemical Oxygen Demand (BOD) 3 mg/L or less Fecal Coliform 2500 MPN/100mL
15
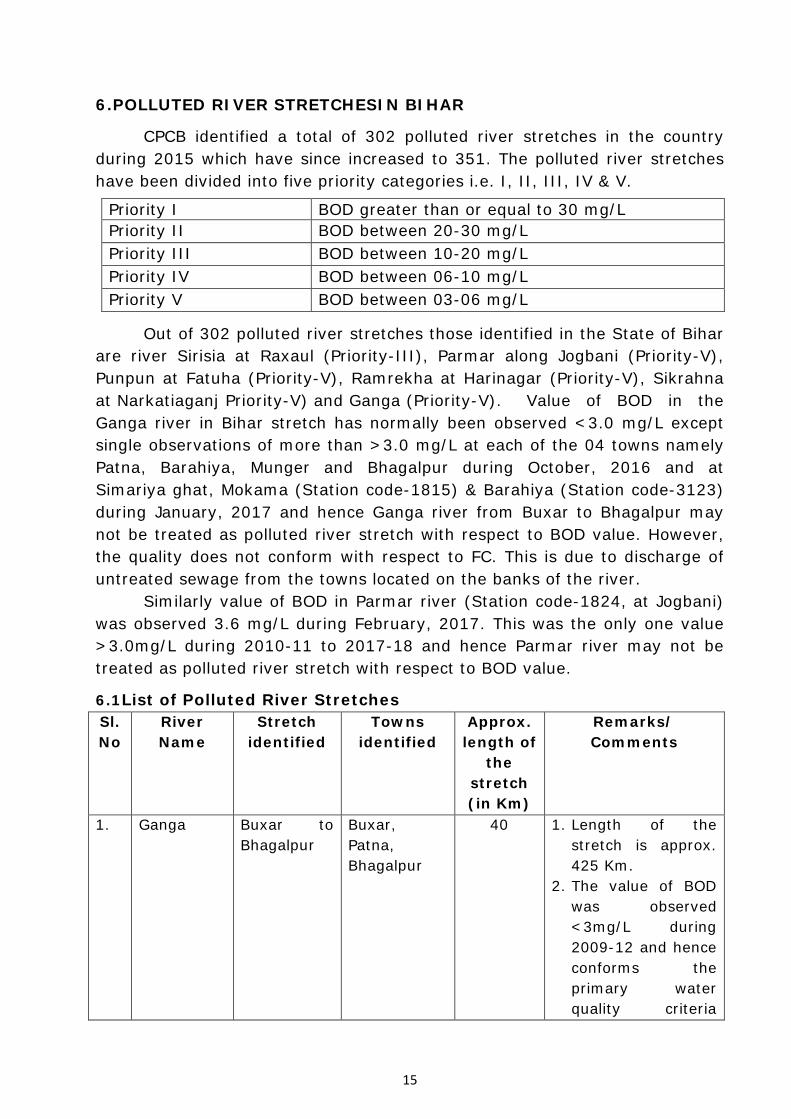
6.POLLUTED RIVER STRETCHESIN BIHAR
CPCB identified a total of 302 polluted river stretches in the country during 2015 which have since increased to 351. The polluted river stretches have been divided into five priority categories i.e. I, II, III, IV & V.
Priority I BOD greater than or equal to 30 mg/L Priority II BOD between 20-30 mg/L Priority III BOD between 10-20 mg/L Priority IV BOD between 06-10 mg/L Priority V BOD between 03-06 mg/L
Out of 302 polluted river stretches those identified in the State of Bihar are river Sirisia at Raxaul (Priority-III), Parmar along Jogbani (Priority-V), Punpun at Fatuha (Priority-V), Ramrekha at Harinagar (Priority-V), Sikrahna at Narkatiaganj Priority-V) and Ganga (Priority-V). Value of BOD in the Ganga river in Bihar stretch has normally been observed <3.0 mg/L except single observations of more than >3.0 mg/L at each of the 04 towns namely Patna, Barahiya, Munger and Bhagalpur during October, 2016 and at Simariya ghat, Mokama (Station code-1815) & Barahiya (Station code-3123) during January, 2017 and hence Ganga river from Buxar to Bhagalpur may not be treated as polluted river stretch with respect to BOD value. However, the quality does not conform with respect to FC. This is due to discharge of untreated sewage from the towns located on the banks of the river. Similarly value of BOD in Parmar river (Station code-1824, at Jogbani) was observed 3.6 mg/L during February, 2017. This was the only one value >3.0mg/L during 2010-11 to 2017-18 and hence Parmar river may not be treated as polluted river stretch with respect to BOD value.
6.1List of Polluted River Stretches Sl. No
River Name
Stretch identified
Towns identified
Approx. length of
the stretch (in Km)
Remarks/ Comments
1. Ganga Buxar to Bhagalpur
Buxar, Patna, Bhagalpur
40 1. Length of the stretch is approx. 425 Km.
2. The value of BOD was observed <3mg/L during 2009-12 and hence conforms the primary water quality criteria
16
(BOD Max. 3 mg/L) and hence no polluted stretch w.r.t. BOD.
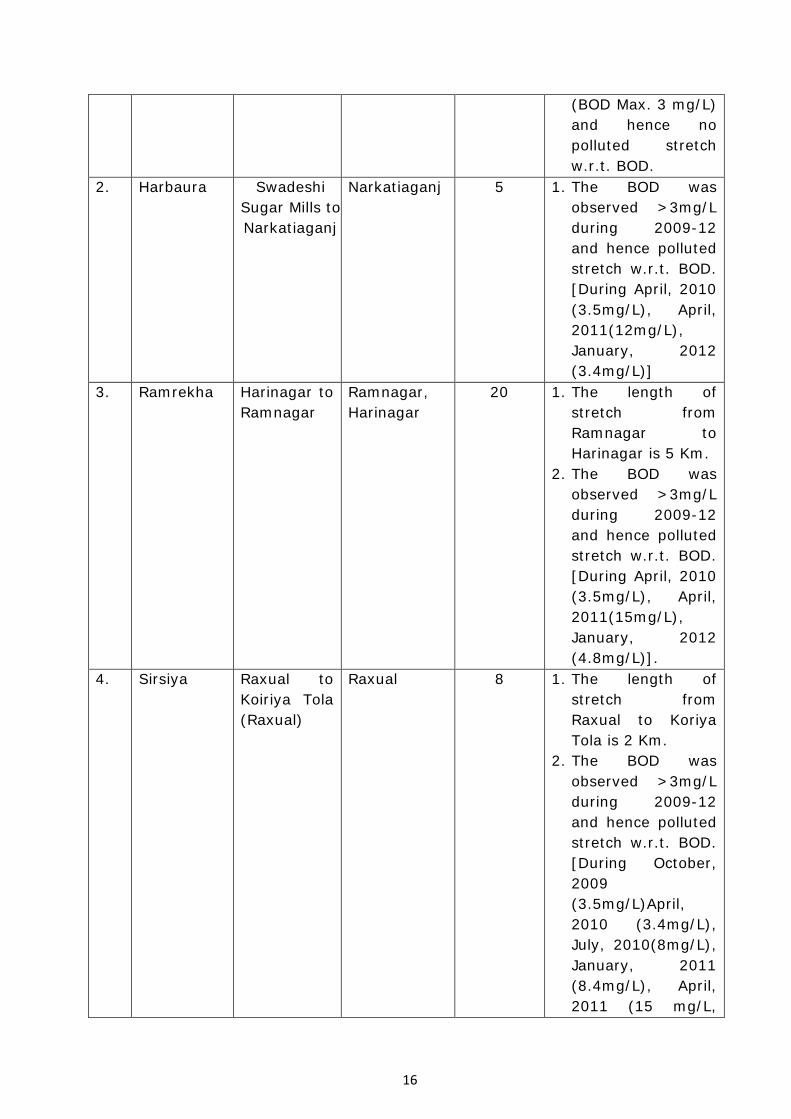
2. Harbaura Swadeshi Sugar Mills to Narkatiaganj
Narkatiaganj 5 1. The BOD was observed >3mg/L during 2009-12 and hence polluted stretch w.r.t. BOD. [During April, 2010 (3.5mg/L), April, 2011(12mg/L), January, 2012 (3.4mg/L)]
3. Ramrekha Harinagar to Ramnagar
Ramnagar, Harinagar
20 1. The length of stretch from Ramnagar to Harinagar is 5 Km.
2. The BOD was observed >3mg/L during 2009-12 and hence polluted stretch w.r.t. BOD. [During April, 2010 (3.5mg/L), April, 2011(15mg/L), January, 2012 (4.8mg/L)].
4. Sirsiya Raxual to Koiriya Tola (Raxual)
Raxual 8 1. The length of stretch from Raxual to Koriya Tola is 2 Km.
2. The BOD was observed >3mg/L during 2009-12 and hence polluted stretch w.r.t. BOD. [During October, 2009 (3.5mg/L)April, 2010 (3.4mg/L), July, 2010(8mg/L), January, 2011 (8.4mg/L), April, 2011 (15 mg/L,

17
October, 2011 (10 mg/L), January, February, March, 2012 (9,12,10mg/L respectively)].
5. Punpun Fatuha Fatuha & Patna
1 1. River gets polluted due to discharge of untreated sewage/waste water from Patna through Badshahi Nala.
2. The BOD was observed >3 mg/L(4 mg/Lduring March, 2018)
6. Parmar Jogbani Jogbani 2 1. BOD is observed <3 mg/L. There was only one observation >3 mg/L (3.6mg/L during February, 2017)
7. Sewage/domestic waste water management in ULBs located in the polluted river stretches 7.1 ULBs located on polluted rivers (other than Ganga)
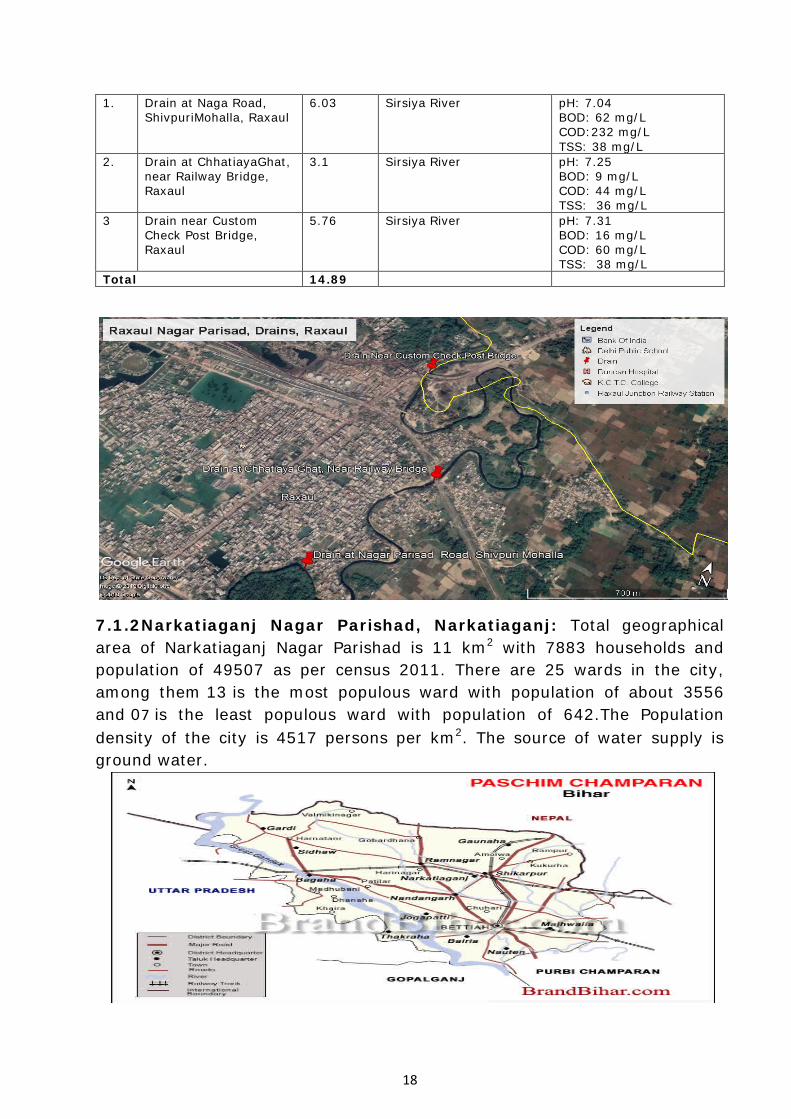
7.1.1 Raxaul Nagar Parisad: Total geographical area of Raxaul Nagar Parishadis 5.82 km2 with 8794 households and population of 55536 as per census 2011. Population density of the city is 9542 persons per km2. There are 25 wards in the city, among them ward no.04is the most populous ward with population of 3235 and ward no.06 is the least populous ward with population of 1286. The source of water supply is ground water. Drainage/Sewerage System& STP: There are three (3) drains namelyDrain at Naga Road, Drain at ChhatiayaGhat, Drain near Custom Check Post Bridge.The total sewage/waste water discharges through aforesaid drains have been assessed to 7.88 MLD. There is no sewerage network & STP for sewage management at Raxaul Nagar Parisad area. The details of the drains are hereunder:-
Sl. No.
Name of drain Average flow
(MLD)
Recipient Sewage/waste water Quality
18
1. Drain at Naga Road, ShivpuriMohalla, Raxaul
6.03 Sirsiya River pH: 7.04 BOD: 62 mg/L COD:232 mg/L TSS: 38 mg/L
2. Drain at ChhatiayaGhat, near Railway Bridge, Raxaul
3.1 Sirsiya River pH: 7.25 BOD: 9 mg/L COD: 44 mg/L TSS: 36 mg/L
3 Drain near Custom Check Post Bridge, Raxaul
5.76 Sirsiya River pH: 7.31 BOD: 16 mg/L COD: 60 mg/L TSS: 38 mg/L
Total 14.89
7.1.2Narkatiaganj Nagar Parishad, Narkatiaganj: Total geographical area of Narkatiaganj Nagar Parishad is 11 km2 with 7883 households and population of 49507 as per census 2011. There are 25 wards in the city, among them 13 is the most populous ward with population of about 3556 and 07 is the least populous ward with population of 642.The Population density of the city is 4517 persons per km2. The source of water supply is ground water.

19
Drainage/Sewerage System& STP: There are three (3) drains namely (i) Domestic Waste Water/Sewage drain, passing near power grid of Sugar Mill, (ii) Dhum Nagar Mandir drain & (iii) Nehar drain, Near Hardiya. The aforesaid Domestic Waste Water/Sewage drain, passing near power grid of Sugar Mill, &Dhum Nagar Mandir drainjoins Harbaurariver and Nehar drain, Near Hardiya, disperses in low lying area. The total sewage/waste water discharges through aforesaid drains have been assessed to 14.591 MLD. There is no sewerage network & STP for sewage management at Narkatiaganj Nagar Parishadarea. The details of the drains are hereunder:-
Sl. No.
Name of drain Average flow
(MLD)
Recipient Sewage/waste water Quality
1. Domestic Waste Water/Sewage drain, passing near power grid of Sugar Mill
6.736 Harbaura River pH: 6.59 BOD: 22 mg/L COD: 80 mg/L TSS: 53 mg/L
2. Dhum Nagar Mandir drain
4.215 Harbaura River pH: 6.59 BOD: 38 mg/L COD: 148 mg/L TSS: 78 mg/L
3. Nehar drain, Near Hardiya
3.640 Low Lying Area and Found Dry after 3.5 KM
pH: 6.62 BOD: 24 mg/L COD: 84 mg/L TSS: 26 mg/L
Total 14.591
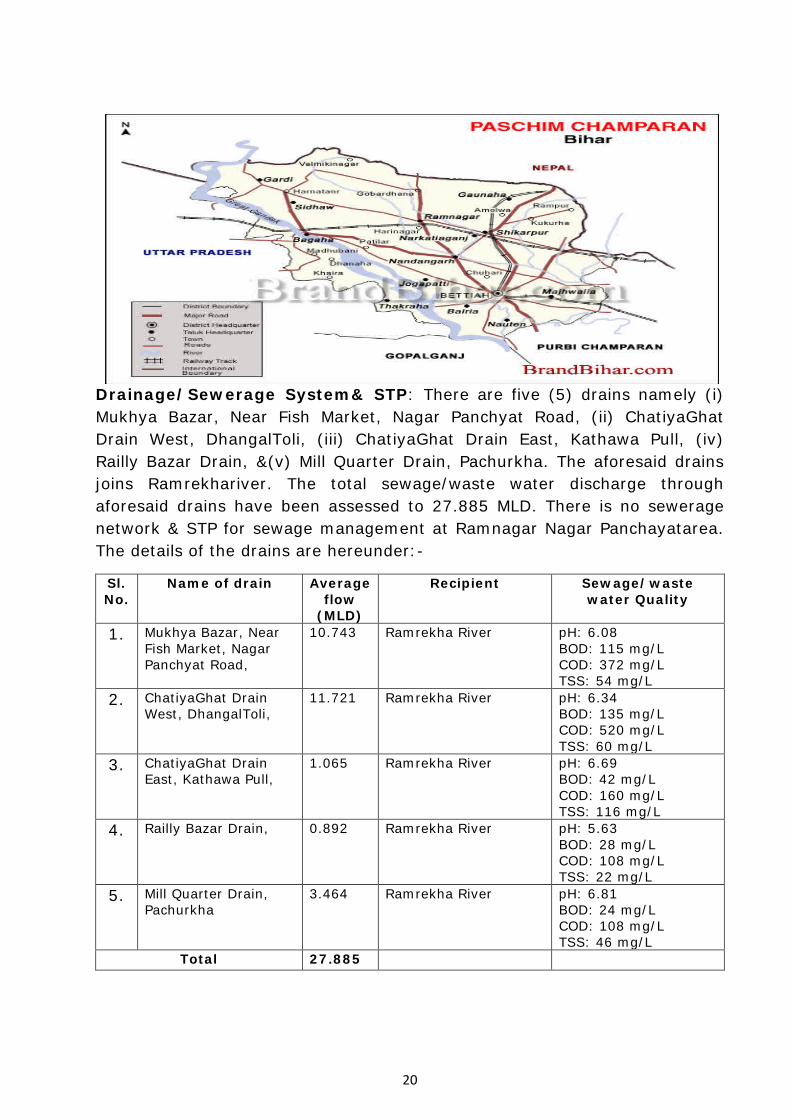
7.1.3 Ramnagar Nagar Panchayat: Total geographical area of Ramnagar Nagar Panchayatis 16.2km2 with 9123 households and population of 48411 as per census 2011. Population density of the city is 2988 persons per km2. There are 23 wards in the city, among them ward no. 20 is the most populous ward with population of 4220 and ward no.17 is the least populous ward with population of 925. The source of water supply is ground water.
20
Drainage/Sewerage System& STP: There are five (5) drains namely (i) Mukhya Bazar, Near Fish Market, Nagar Panchyat Road, (ii) ChatiyaGhat Drain West, DhangalToli, (iii) ChatiyaGhat Drain East, Kathawa Pull, (iv) Railly Bazar Drain, &(v) Mill Quarter Drain, Pachurkha. The aforesaid drains joins Ramrekhariver. The total sewage/waste water discharge through aforesaid drains have been assessed to 27.885 MLD. There is no sewerage network & STP for sewage management at Ramnagar Nagar Panchayatarea. The details of the drains are hereunder:-
Sl. No.
Name of drain Average flow
(MLD)
Recipient Sewage/waste water Quality
1. Mukhya Bazar, Near Fish Market, Nagar Panchyat Road,
10.743 Ramrekha River pH: 6.08 BOD: 115 mg/L COD: 372 mg/L TSS: 54 mg/L
2. ChatiyaGhat Drain West, DhangalToli,
11.721 Ramrekha River pH: 6.34 BOD: 135 mg/L COD: 520 mg/L TSS: 60 mg/L
3. ChatiyaGhat Drain East, Kathawa Pull,
1.065 Ramrekha River pH: 6.69 BOD: 42 mg/L COD: 160 mg/L TSS: 116 mg/L
4. Railly Bazar Drain, 0.892 Ramrekha River pH: 5.63 BOD: 28 mg/L COD: 108 mg/L TSS: 22 mg/L
5. Mill Quarter Drain, Pachurkha
3.464 Ramrekha River pH: 6.81 BOD: 24 mg/L COD: 108 mg/L TSS: 46 mg/L
Total 27.885

21
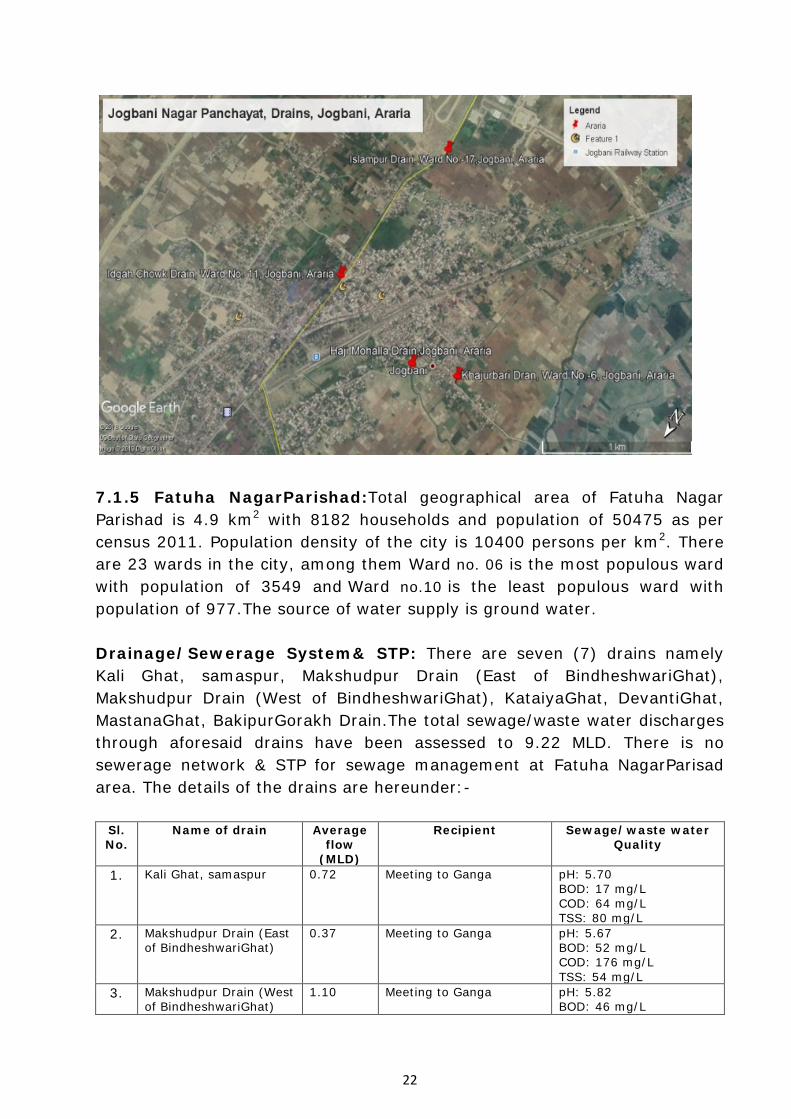
7.1.4 Jogbani Nagar Panchayat, Araria: Total geographical area of Jogbani Nagar Panchayatis 15.12km2 with 7616 households and population of 39281 as per census 2011. Population density of the city is 2598 persons per km2. There are 19 wards in the city, among them ward no.09 is the most populous ward with population of 2948 and ward no. 06 is the least populous ward with population of 1186. The source of water supply is ground water. Drainage/Sewerage System& STP: There are four (4) drains namely Khajurbari Drain, Ward No.6, Haji Mohalla Drain,IdgahChowk Drain, Isalmpur Drain, Ward No.17.The aforesaid drains disperse in low lying area. The total sewage/waste water discharge through aforesaid drains has been assessed to 5.559 MLD. There is no sewerage network & STP for sewage management at Jogbani Nagar Panchayatarea. The details of the drains are hereunder:-
Sl. No.
Name of drain Average flow
(MLD)
Recipient Sewage/waste water Quality
1. Khajurbari Drain, Ward No.6
2.96 Low lying area pH: 7.32 BOD: 85 mg/L COD: 272 mg/L TSS: mg/L
2. Haji Mohalla Drain 0.50 Low lying area pH: 7.20 BOD: mg/L COD: mg/L TSS: mg/L
3. IdgahChowk Drain 0.704 Low lying area pH: 7.42 BOD: mg/L COD: mg/L TSS: mg/L
4 Isalmpur Drain, Ward No.-17
1.395 Low lying area pH: 7.28 BOD: mg/L COD: mg/L TSS: mg/L
Total 5.559
22
7.1.5 Fatuha NagarParishad:Total geographical area of Fatuha Nagar Parishad is 4.9 km2 with 8182 households and population of 50475 as per census 2011. Population density of the city is 10400 persons per km2. There are 23 wards in the city, among them Ward no. 06 is the most populous ward with population of 3549 and Ward no.10 is the least populous ward with population of 977.The source of water supply is ground water. Drainage/Sewerage System& STP: There are seven (7) drains namely Kali Ghat, samaspur, Makshudpur Drain (East of BindheshwariGhat), Makshudpur Drain (West of BindheshwariGhat), KataiyaGhat, DevantiGhat, MastanaGhat, BakipurGorakh Drain.The total sewage/waste water discharges through aforesaid drains have been assessed to 9.22 MLD. There is no sewerage network & STP for sewage management at Fatuha NagarParisad area. The details of the drains are hereunder:-
Sl. No.
Name of drain Average flow
(MLD)
Recipient Sewage/waste water Quality
1. Kali Ghat, samaspur 0.72 Meeting to Ganga pH: 5.70 BOD: 17 mg/L COD: 64 mg/L TSS: 80 mg/L
2. Makshudpur Drain (East of BindheshwariGhat)
0.37 Meeting to Ganga pH: 5.67 BOD: 52 mg/L COD: 176 mg/L TSS: 54 mg/L
3. Makshudpur Drain (West of BindheshwariGhat)
1.10 Meeting to Ganga pH: 5.82 BOD: 46 mg/L

23
COD: 164 mg/L TSS: 88 mg/L
4. KataiyaGhat 0.64 Meeting to Ganga pH: 5.80 BOD: 50 mg/L COD: 168 mg/L TSS: 56 mg/L
5. DevantiGhat 2.30 Meeting to Ganga pH: 6.77 BOD: 19 mg/L COD: 68 mg/L TSS: 272 mg/L
6. MastanaGhat 1.14 Meeting to Ganga pH: 5.94 BOD: 42 mg/L COD: 160 mg/L TSS: 96 mg/L
7. BakipurGorakh Drain 2.95 Meeting to Punpun pH: 6.41 BOD: 85 mg/L COD: 268 mg/L TSS: 54 mg/L
Total 9.22
7.1.6ABSTRACT OF POLLUTED RIVER STRETCHES(EXCEPT GANGA)
Sl. No.
Name of ULBs Number of
Drains Identified
Total Flow in
MLD
Recipients/ Polluted River
Stretch
1. Raxaul Nagar Parishad, Raxaul
3 14.89
(15)
Sirsiya River
2. Narkatiaganj Nagar Parishad, Narkatiaganj
3 14.59
(15)
Harbaura River
3. Ramnagar Nagar Panchyat, Ramnagar
5 27.88
(28)
Ramrekha River

24
4. Fatuha Nagar Parishad, Patna
7 9.22
(09)
Ganga River & Punpun
5. Jogbani Nagar Panchayat, Araria
4 2.74
(03)
Low lying Area
Presently, identified drains carry storm water as well as sewage/domestic waste water generated from towns/ULBs.
7.1.7Status of Sewerage Network &STP and Action Plan for Sewage Management in Polluted RiverStretch(except Ganga)
There is no any sewerage network and Sewage Treatment Plant (STP) in the ULBs of polluted river stretch basin. Department of Urban Development & Housing, Govt. of Bihar (Bihar State Ganga River Conservation and Programme Management Society (BGCMC)is theexecutive agency for the installation and operation & maintenance of STPs for treatment of sewage/untreated domestic sewage generated from different cities in Bihar. In pursuance of BSPCB,BGCMC has directed BUDCO for preparation of DPR for sewage management for the ULBs namely Raxaul, Narkatiaganj, Ramnagar-Harinagar and Jogbani located in the polluted river stretch basin.DPR will be prepared by April, 2019 and will be sent to NMCG for sanction. After approval of DPR the work will completed by June, 2021. A scheme of I&D and STP of 07 MLD capacity has been approved for Rs. 35.49 Cr. for Fatuha. Tender floated. The expected time of completion of the project is December, 2020.
7.2 Sewage/Domestic Waste Water Discharge into the Ganga
Sl. No.
Name of ULBs Number of
Drains Identified
Total Flow in
MLD
Recipients/ Polluted River
Stretch
1. Buxar Nagar Parishad 07 31.55(32) Ganga
2. Patna Municipal Corporation 19 628 Ganga& Punpun
3. Bhagalpur Municipal Corporation
15 123.9 (124)
Ganga
4. Munger Municipal Corporation
01 21.5 (21) Ganga
5. Chapra Municipal Corporation
01 4.87(5) Ghaghara
6. Bakhtiyarpur Nagar 01 4.3 (4) Ganga

25
Parishad
7. Barh Nagar Parishad 07 9.13 (9) Ganga & low lying area
8. Danapur Nagar Parishad 01 8.16(8) Ganga
9. Fatuha Nagar Parishad 07 9.22(9) Ganga & Punpun
10. Mokama Nagar Parishad 04 7.17 (7) Ganga
11. Sultanganj Nagar Parishad 01 1.7 (2) Ganga
12. Barhiya Nagar Panchayat 03 5.66 (6) Low lying area
13. Dighwara Nagar Panchayat 02 1.57(2) Ganga
14. Maner Nagar Panchayat 03 13.3 (13) Sone river->Ganga river
7.2.1 Buxar Nagar Parisad, Buxar: Total geographical area of Buxar Nagar Parisad is 5.16km2 with 14010 households and population of 102861 as per census 2011. Population density of the city is 19934 persons per km2. There are 11 wards in the city, among them ward no. –16 is the most populous ward with population of 5021 and ward no. -23 is the least populous ward with population of 1626. The source of water supply is ground water.
Drainage/Sewerage System& STP: There are Seven (7) drains namely ChhotiSaripur Drain, Hospital Road Drain, Sati Ghat Drain, Bangla Ghat Drain, Tadka Drain, Nath Baba Mandir Drain, Sohnipatti Drain. The total

26
sewage/waste water discharges through aforesaid drains have been assessed to 31.55 MLD. There is no sewerage network & STP for sewage management at Buxar NagarParisad area. The details of the drains are hereunder:-
Sl. No.
Name of drain Average flow
(MLD)
Recipient Sewage/waste water Quality
1. ChhotiSaripur Drain 5.87 Ganga River pH: 6.08 BOD: 26 mg/L COD: 96 mg/L TSS: 68 mg/L
2. Hospital Road Drain 3.82 Ganga River pH: 6.42 BOD: 36 mg/L COD: 128 mg/L TSS: 64 mg/L
3. Sati Ghat Drain 6.29 Ganga River pH: 6.63 BOD: 72 mg/L COD: 224 mg/L TSS: 62 mg/L
4. Bangla Ghat Drain 1.80 Ganga River pH: 6.64 BOD: 70 mg/L COD: 212 mg/L TSS: 78 mg/L
5. Tadka Drain 8.23 Ganga River pH: 6.85 BOD: 74 mg/L COD: 224 mg/L TSS: 54 mg/L
6.
Nath BabaMandir Drain 4.23 Ganga River pH: 6.79 BOD: 15 mg/L COD: 68 mg/L TSS: 56 mg/L
7. Sohnipatti Drain 1.31 Ganga River pH: 6.79 BOD: 15 mg/L COD: 68 mg/L TSS: 56 mg/L
Total 31.55 7.2.2 Patna Muncipal Corporation, Patna:Total geographical area of Patna Municipal Corporation is approx. 110 km2 with 223088 households and population of 1684222 as per census 2011. The Patna Municipal Corporation is divided into 75 wards, which is managed through 5 circles namely New Capital (Total no. wards 16: ward no. 3,4,9-19, 21,28, 37, covering area Bailey Road area, Boring Road area, Khajpura area, Kurji area, Indrapuri Area, Rajiv Nagar area, Station area and Gandhi Maidan Marg); Kankarbagh(Total wards no. 11: 29-35, 44-46, 55, Covering area New By Pass road area, Kankarbagh road area, Chirayatard railways bridge area, Bhootnath Road area and Saidpur area); Bankipur circle (Total no. wards: 12: 36, 38-43, 47-51, covering area Ashok Rajpath area, Saidpur main drain area, Bakerganj area, Gandhi Ghat area and Bari path area); Patna city (Total no. wards: 20: 52-54, 56-72, Covering area Gaighat, Dundi Bazar area, Mahatma Gandhi Setu road area, New Bypass road area, Patna Ghat area and MaalGodam) and Patliputra (Total no. wards: 16: 1,2, 5-8, 20, 22, 22A, 22B, 22C, 23-27, covering area Patliputra

27
colony, Digha, Kurji and Mainpura). The source of domestic water supply is ground water. The city of Patna is one of the oldest continuously inhabited places in the world with the Patna Municipal Corporation (PMC) extending between the Latitude: 25°33'22''- 25°39'2'' North and Longitude: 85°31'12''- 85°15'5'' East. The elevation of the city is 519 meters above the mean sea level. It is a river borne town, located on the right bank (southern bank) of the Ganga. Punpun River joins Ganga it some 12 kms, east at Fatwa. Patna extends up to 21.3 kms in length (east to west) and 10.2 kms in breadth (north to south). Patna, being the capital of Bihar is a metropolis having some regional importance. It is the administrative focus of the entire state, besides being the District head quarter, Divisional and State administration. It is the head quarter of local administration, Judiciary and Legislature.
Drainage/Sewerage System & STP: The sewerage system has not been fully developed presently, The storm water drainages carry sewage and mostly flow from south to north and fall into river Ganga. There is a proposal to develop proper sewerage system in the city and then entire sewage will be diverted to STPs through respective network for treatment. Presently, city has four STPs of 109 MLD capacity (Beur-35MLD, Saidpur- 45MLD, Pahari- 25 MLD and Karmalichak- 04 MLD). These are under-utilized and treating all together only 61 MLD of sewage. It has been assessed that Patna city requires STPs of around 350 MLD capacity. (Beur-43 MLD, Saidpur-60 MLD, Pahari- 60MLD, Karmalichak- 37 MLD, Digha- 100 MLD &Kankarbagh- 50 MLD). The total proposed length of network is about 1000 Km. The proposed Patna Sewerage system has been divided into six different zones, such as Digha, Beur, Kankarbagh, Saidpur, Pahari &Karmalichak. After implementation of sewerage scheme of these zones will cater to the sewerage problems of entire 75 wards of Patna Municipal Corporation area. The sewerage scheme of Beur, Saidpur, Pahari and Karmalichak will be completed by 2020 where as Digha&Kankarbagh will be completed by 2021. Present status of the project is as follows:- There are 19 drains discharging sewage/domestic waste water to river Ganga. It is to be noted that significant drains of Patna namely Rajapurpul drain, Mandiri(Bans ghat drain) & Anta Ghat drain joins together to form a single common combined sewage/waste water channel and joins Ganga river near Kalighat, ahead TR BanarjeeGhat, Patna. The aforesaid drains discharge approx. 628 MLD (566 MLD sewage/waste water to river Gagna and 62 MLD to Punpun River). Out of 19 drains, 11 drains are having very low flow less than 1 MLD. The details of the drains are hereunder:-

28
Patna Municipal Corporation, Patna:
Sl. No.
Name of drain Average flow
(MLD)
Recipient Sewage/waste water Quality
1. DighaGhat Drain (Canal)
134 River Ganga pH:7.59 BOD:23 mg/L COD:88 mg/L TSS:92 mg/L
2. Kurji Drain 65 River Ganga pH:7.63 BOD:34 mg/L COD:120 mg/L TSS:42 mg/L
3. RajapurPul Drain 128 River Ganga pH: 7.88 BOD:16 mg/L COD:68 mg/L TSS:84 mg/L
4. Mandiri (Bans Ghat) Drain
148 River Ganga pH: 7.10 BOD:54 mg/L COD:184 mg/L TSS: 44 mg/L
5. Anta Ghat Drain 43 River Ganga pH: 7.40 BOD:75 mg/L COD:232 mg/L TSS: 44 mg/L
6. Krishna Ghat Drain (Pump House)
River Ganga pH: 7.33 BOD:80 mg/L COD:272 mg/L TSS: 10 mg/L
7. BarharwaGhat 0.042 River Ganga pH: 7.48 BOD: 60 mg/L COD:184 mg/L TSS: 14 mg/L
8. Rani Ghat Drain 0.072 River Ganga pH:7.42 BOD:44 mg/L COD:152 mg/L TSS: 36 mg/L
9. GhaghaGhat 0.032 River Ganga pH: 7.37 BOD: 60 mg/L COD:216 mg/L TSS:48 mg/L
10. Masjid Ghat Drain 0.05 River Ganga pH:7.22 BOD:90 mg/L COD:268 mg/L TSS: 52 mg/L
11. LoharwaGhat Drain 0.039 River Ganga pH: 7.34 BOD:75 mg/L COD:240 mg/L TSS: 58 mg/L
12. Goshaighat Drain 0.06 River Ganga pH:7.49 BOD:60 mg/L COD:184 mg/L TSS: 50 mg/L
13. BhadraGhat Drain 0.05 River Ganga pH:7.49 BOD:38 mg/L COD:136 mg/L

29
TSS: 42 mg/L 14. NauzarGhat Drain 0.02 River Ganga pH:7.46
BOD:65 mg/L COD:232 mg/L TSS:26 mg/L
15. MittanGhat Drain 48 River Ganga pH:7.43 BOD: 90 mg/L COD:352 mg/L TSS:34 mg/L
16. Badshahi Drain 62 Punpun at Fatuha-> River Ganga
pH: 7.67 BOD:38 mg/L COD:124 mg/L TSS:26 mg/L
17. GaiGhat Drain 0.06 River Ganga pH:7.53 BOD:44 mg/L COD:156 mg/L TSS:78 mg/L
18. MahavirGhat Drain 0.04 River Ganga pH: 7.61 BOD:24 mg/L COD:100 mg/L TSS: 16 mg/L
19. BaluGhat Drain 0.04 River Ganga pH:7.34 BOD:90 mg/L COD:284 mg/L TSS: 54 mg/L
Total 628.505 20. RajapurPul drain +
Mandiri drain+ Anta ghat drain combined sewage /waste water channel and joining Ganga river near Kalighat,
319 River Ganga
7.2.3Bhagalpur Municipal Corporation, Bhagalpur: Total geographical area of Bhagalpur Municipal Corporation is 30 km2 with 58361 households and population of 400146 as per census 2011.Population density of the city is 13263 persons per km2. There are 51 wards in the city, among them Bhagalpur Ward No 33 is the most populous ward with population of about 11 thousand and Bhagalpur Ward No 32 is the least populous ward with population of 4645.

30
Drainage/Sewerage System& STP: There are fifteen (15) drains namely Adampur Drain, Hathiya Drain near intake well, Surkhikal Drain, Sakhichand Drain, BarariGhat Drain, Neel Kothi Drain, PipaliDham drain-1&2, KuppaGhat Drain, Koyla Ghat, HathiyaNala, Near Tilkamnajhi University, STP Drain, SahebganjMiyabari Drain, ChampaNala -1, ChampaNala -2. The aforesaid drains discharge sewage/domestic waste water into Ganga River directly. The total sewage/waste water discharge through aforesaid drains has been assessed to 123.9 MLD.
Presently, there is no sewerage network and operational STP (earlier had a STP of 11 MLD capacity) for sewage management at Bhagalpur Municipal Corporation area. There is proposal of sewerage network and STP of 65 MLD capacity under NamamiGange Project. Cost of the project is 254.13 core. It is expected to be completed by December, 2020 as reported by HD&HD, Govt. of Bihar. The details of the drains are hereunder:-
Bhagalpur Municipal Corporation, Bhagalpur:
Sl. No.
Name of drain Average flow (MLD)
Recipient Sewage/waste water Quality
1. Adampur Drain 18.91 Ganga River pH:7.55 BOD:15mg/L COD:68mg/L TSS:62mg/L
2. Hathiya Drain near intake well
7.54 Ganga River pH: 7.76 BOD:09 mg/L COD:56 mg/L TSS:48 mg/L
3. Surkhikal Drain 13.10 Ganga River pH: 7.63 BOD:32mg/L COD:120mg/L TSS: 70mg/L
4. Sakhichand Drain 12.69 Ganga River pH:7.58 BOD:10mg/L COD: 56mg/L

31
TSS:62mg/L 5. BarariGhat Drain, near
Vikramshila Bridge, Bhagalpur
6.61 Ganga River pH:7.40 BOD:17mg/L COD:80mg/L TSS: 38mg/L
6. Neel KothiGhat Drain, Bhagalpur
1.91 Ganga River pH:7.45 BOD:20mg/L COD:92mg/L TSS: 68mg/L
7. pipalliDham Drain-I, Bhagalpur
0.7 Ganga River pH:7.86 BOD:14 mg/L COD:60 mg/L TSS: 56 mg/L
8. PipalliDham Drain-II, Bhagalpur
1.49 Ganga River pH:7.55 BOD:10 mg/L COD:56 mg/L TSS: 62 mg/L
9. KuppaGhat Drain 4.43 Ganga River pH:6.58 BOD:08 mg/L COD:40 mg/L TSS: 36 mg/L
10. Koyla Ghat 7.63 Ganga River pH: 7.72 BOD:125 mg/L COD:380mg/L TSS:192mg/L
11. HathiyaNala, Near Tilkamnajhi University
22.66 Ganga River pH: 7.69 BOD:145mg/L COD:468mg/L TSS:160 mg/L
12. STP Drain, Bhagalpur 1.77 Ganga River pH: 7.85 BOD:130mg/L COD:412mg/L TSS: 142mg/L
13. SahebganjMiyabari Drain
4.51 Ganga River pH: 7.94 BOD:32mg/L COD:108mg/L TSS:118mg/L
14. ChampaNala -1 11.57 Ganga River pH: 7.26 BOD:95mg/L COD:304mg/L TSS: 138mg/L
15. ChampaNala -2 8.38 Ganga River pH: 7.37 BOD:42mg/L COD:144mg/L TSS: 78mg/L
Total 123.9
7.2.4Munger Municipal Corporation:
Total geographical area of Munger Municipal Corporation is 17.5 km2 with 32891 households and population of 213303 as per census 2011. Population density of the city is 12189 persons per km2. There are 45 wards in the city, among them ward no.19 is the most populous ward with population of 7804 and ward no. 18 is the least populous ward with population of 2471. The source of water supply is ground water.

32
Drainage/Sewerage System& STP: There are one (1) drains namelyLal Drawaza Drain. The total sewage/waste water discharges through aforesaid drains have been assessed to 21.5 MLD. There is no sewerage network & STP for sewage management at Munger Municipal Corporation area. The details of the drains are hereunder:- Munger Nagar Nigam, Munger:
Sl. No.
Name of drain Average flow
(MLD)
Recipient Sewage/waste water Quality
1. Lal Drawaza Drain 21.5 Meeting to Ganga pH: 7.73 BOD: 14 mg/L COD: 60 mg/L TSS: 32 mg/L
Total 21.5
7.2.5Chhapra Municipal Corporation:
Total geographical area of Chhapra Municipal Corporation is 16.96km2 with 32585 households and population of 202,352as per census 2011. Population density of the city is 11931 persons per km2. There are 45 wards in the city, among them Chhapra Ward No 28 is the most populous ward with population of 7552 and Chhapra Ward No 22 is the least populous ward with population of 2285. The source of water supply is ground water.
33
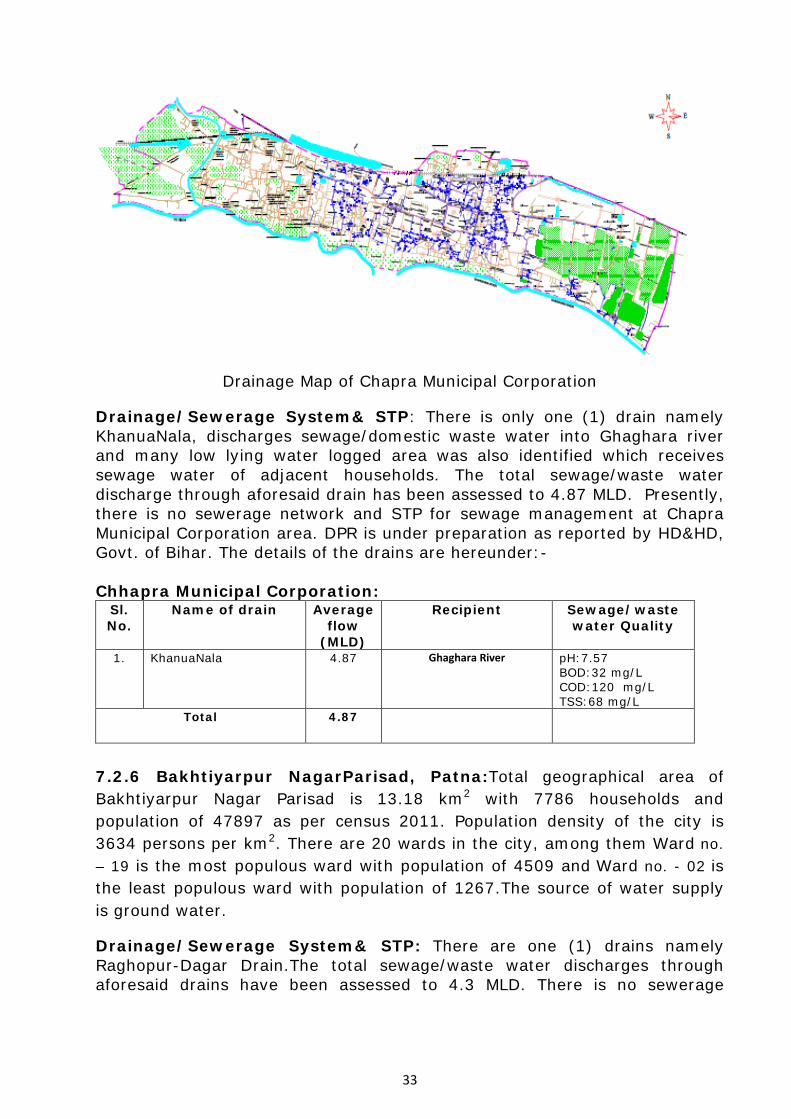
Drainage Map of Chapra Municipal Corporation
Drainage/Sewerage System& STP: There is only one (1) drain namely KhanuaNala, discharges sewage/domestic waste water into Ghaghara river and many low lying water logged area was also identified which receives sewage water of adjacent households. The total sewage/waste water discharge through aforesaid drain has been assessed to 4.87 MLD. Presently, there is no sewerage network and STP for sewage management at Chapra Municipal Corporation area. DPR is under preparation as reported by HD&HD, Govt. of Bihar. The details of the drains are hereunder:- Chhapra Municipal Corporation:
Sl. No.
Name of drain Average flow
(MLD)
Recipient Sewage/waste water Quality
1. KhanuaNala 4.87 Ghaghara River pH:7.57 BOD:32 mg/L COD:120 mg/L TSS:68 mg/L
Total 4.87
7.2.6 Bakhtiyarpur NagarParisad, Patna:Total geographical area of Bakhtiyarpur Nagar Parisad is 13.18 km2 with 7786 households and population of 47897 as per census 2011. Population density of the city is 3634 persons per km2. There are 20 wards in the city, among them Ward no. – 19 is the most populous ward with population of 4509 and Ward no. - 02 is the least populous ward with population of 1267.The source of water supply is ground water.
Drainage/Sewerage System& STP: There are one (1) drains namely Raghopur-Dagar Drain.The total sewage/waste water discharges through aforesaid drains have been assessed to 4.3 MLD. There is no sewerage

34
network & STP for sewage management at Bakhtiyarpur NagarParisad area. The details of the drains are hereunder:-
7.2.7Barh Nagar Parisad, Patna:
Total geographical area of Barh Nagar Parisad is 4.5 km2 with 9310 households and population of 61470 as per census 2011. Population density of the city is 13660 persons per km2. There are 27 wards in the city, among them Ward no. - 03is the most populous ward with population of 5306 and Ward no. - 21 is the least populous ward with population of 1093. The source of water supply is ground water.
Drainage/Sewerage System& STP: There are Seven(7) drains namely PipalGhat Drain, Salimpur Drain, MaliniaGhat Drain, Ward No. - 11, DhobiaGhat, Near Laxmi Flour Mill,Gauri Shankar Ghat, Talimpur Drain, DayachakDrain.The total sewage/waste water discharge through aforesaid drains have been assessed to 9.131 MLD. There is no sewerage network & STP for sewage management at Barh Nagar Parisad area. The details of the drains are hereunder:-
Sl. No.
Name of drain Average flow
(MLD)
Recipient Sewage/waste water Quality
1. PipalGhat Drain, Barh 0.476 Meeting to the Ganga pH: 8.0 BOD: 34 mg/L COD: 120 mg/L TSS: 36 mg/L
Sl. No.
Name of drain Average flow
(MLD)
Recipient Sewage/waste water Quality
1. Raghopur-Dagar Drain 4.3 Meeting to Ganga pH: 5.58 BOD: 36 mg/L COD: 132 mg/L TSS: 62 mg/L
Total 4.3

35
2. Salimpur Drain, Near Nagar Parishad, Barh
0.547 Meeting to the Ganga pH: 7.5 BOD: 26 mg/L COD: 92 mg/L TSS: 60 mg/L
3. MaliniaGhat Drain, Ward No. - 11, Salempur, Barh
0.842 Meeting to the Ganga pH: 7.5 BOD: 32 mg/L COD: 128 mg/L TSS: 64 mg/L
4. DhobiaGhat, Near Laxmi Flour Mill, Barh.
0.251 Meeting to the Ganga pH: 8.5 BOD: 70 mg/L COD: 232 mg/L TSS: 68 mg/L
5. Gauri Shankar Ghat, Barh
1.087 Meeting to the Ganga pH: 8.5 BOD: 42 mg/L COD: 142 mg/L TSS: 58 mg/L
6. Talimpur Drain, Barh 1.690 Low lying area pH: 8.5 BOD: 55 mg/L COD: 192 mg/L TSS: 70 mg/L
7. Dayachak Drain, Barh 4.238 Low lying area pH: 8.5 BOD: 28 mg/L COD: 100 mg/L TSS: 74 mg/L
Total 9.131
7.2.8 Danapur Nagar Parisad,Patna: Total geographical area of Danapur Nagar Parisad is 16.41 km2 with 27486 households and population of 182429 as per census 2011. Population density of the city is 11117 persons per km2. There are 40 wards in the city, among them ward no. –07 is the most populous ward with population of 10000 and ward no. - 09 is the least populous ward with population of 1559. The source of water supply is ground water.
Drainage/Sewerage System& STP: There are one (1) drains namelyDanapur Cant. Drain. The total sewage/waste water discharges through aforesaid drains have been assessed to 8.16 MLD. There is no sewerage network & STP for sewage management at Dananpur Nagar Parisad area. The details of the drains are hereunder:-
Sl. No.
Name of drain Average flow
(MLD)
Recipient Sewage/waste water Quality
1. Danapur Cant. Drain 8.16 Meeting to Ganga River pH: 7.66 BOD: 24 mg/L COD: 84 mg/L TSS: 62 mg/L
Total 8.16 7.2.9 Mokama Nagar Parisad, Patna:Total geographical area of Mokama Nagar Parisad is 14.18 km2 with 9384 households and population of 60678 as per census 2011. Population density of the city is 4279 persons per km2. There are 28 wards in the city, among them Ward no. - 28is the most

36
populous ward with population of 4979 and Ward no. - 03 is the least populous ward with population of 1260.The source of water supply is ground water.
Drainage/Sewerage System& STP: There are Four(4) drains namely TapashwaiGhat, Chaudhary Ghat Drain, KamleshwariAsthan Drain &SiddhnathMandir.The total sewage/waste water discharge through aforesaid drains have been assessed to 7.174 MLD. There is no sewerage network & STP for sewage management at Mokama Nagar Parisad area. The details of the drains are hereunder:-
Sl. No.
Name of drain Average flow
(MLD)
Recipient Sewage/waste water Quality
1. TapashwaiGhat, Mokama
6.024 Meeting to Ganga pH: 8.5 BOD: 20 mg/L COD: 72 mg/L TSS: 26 mg/L
2. Chaudhary Ghat, Pipal Tal, Mokama
0.171 Meeting to Ganga pH: 7.5 BOD: 42 mg/L COD: 148 mg/L TSS: 72 mg/L
3. KamleshwariAsthan Drain, Mokama
0.962 Meeting to Ganga pH: 7.5 BOD: 14 mg/L COD: 64 mg/L TSS: 48 mg/L
4. SiddhnathMandir, Mokama
0.017 Meeting to Ganga pH: 8.5 BOD: 18 mg/L COD: 64 mg/L TSS: 36 mg/L
Total 7.174
7.2.10 Sultanganj Nagar Parisad, Bhagalpur: Total geographical area of SultanganjNagarParisad is 12.29 km2 with 9410 households and population of 52892 as per census 2011. Population density of the city is 4304 persons per km2. There are 25 wards in the city, among them ward no.-16 is the most

37
populous ward with population of 3366 and ward no.-03 is the least populous ward with population of 1167. The source of water supply is ground water.
Drainage/Sewerage System& STP: There are one (1) drains namely Masjid ghat Drain. The total sewage/waste water discharges through aforesaid drains have been assessed to 1.7 MLD. There is no sewerage network & STP for sewage management at SultanganjNagarParisad area. The details of the drains are hereunder:-
Sl. No.
Name of drain Average flow
(MLD)
Recipient Sewage/waste water Quality
1. Masjid ghat Drain 1.7 Meeting to Ganga pH: 7.76 BOD: 14 mg/L COD: 64 mg/L TSS: 34 mg/L
Total 1.7
7.2.11 Barahiya Nagar Panchayat, Lakhisarai: Total geographical area of Behea Nagar Panchayat is 27 km2 with 7798 households and population of 43032 as per census 2011. There are 24 wards in the city, among them 19 is the most populous ward with population of about 2881 and 15 is the least populous ward with population of 799.The Population density of the city is 1621 persons per km2. The source of water supply is ground water.

38
Drainage/Sewerage System& STP: There are three(3) drains namely Gangtri drain, Railway Khanra drain and BodhnagarDobha Pull drain. The aforesaid drains disperses in low lying area. The total sewage/waste water discharge through aforesaid drains have been assessed to 5.668 MLD. There is no sewerage network & STP for sewage management at Barahiya Nagar Panchayatarea. The details of the drains are hereunder:-
Sl. No.
Name of drain Average flow
(MLD)
Recipient Sewage/waste water Quality
1. Gangtri drain 1.426 Drain disperses in low lying area
pH: 6.52 BOD: 70 mg/L COD: 232 mg/L TSS: 116mg/L
2. Railway Khanra drain 3.863 Drain disperses in low lying area
pH: 6.66 BOD: 48 mg/L COD: 168 mg/L TSS: 108 mg/L
3. BodhnagarDobha Pull drain
0.379 Drain disperses in low lying area
pH: 6.80 BOD: 32 mg/L COD: 100 mg/L TSS: 78 mg/L
Total 5.668
7.2.12 Dighwara Nagar Panchayat Saran: Total geographical area of Dighwara Nagar Panchayat is 13.27km2 with 6169 households and population of 32741 as per census 2011. Population density of the city is 2467 persons per km2. There are 18 wards in the city, among them ward no. –05 is the most populous ward with population of 3705 and ward no.10 is the least populous ward with population of 970. The source of water supply is ground water.
Drainage/Sewerage System& STP: There are two (2) drains namely BeerpurBhual NH-19 Drain and Shankarpur Road Nala.The aforesaidDrains disperse in Lowlying area.The total sewage/waste water discharges through

39
aforesaid drains have been assessed to 1.57 MLD. There is no sewerage network & STP for sewage management at Dighwara Nagar Panchayatarea. The details of the drains are hereunder:-
Sl. No.
Name of drain Average flow
(MLD)
Recipient Sewage/waste water Quality
1. BeerpurBhual NH-19 Drain, Dighwara
1.15 Ganga River pH: 6.75 BOD: 80 mg/L COD: 276 mg/L TSS: 132mg/L
2. Shankarpur Road Nala, Ward-15, Dighwara
0.42 Ganga River pH: 7.19 BOD:60 mg/L COD:196 mg/L TSS:102 mg/L
Total 1.57
7.2.13 Maner Nagar Panchayat, Patna:Total geographical area of Maner Nagar Panchayat is 12.00 km2 with 6562 households and population of 40068 as per census 2011. Population density of the city is 3339 persons per km2. There are 19 wards in the city, among them Ward no. – 13 is the most populous ward with population of 3351 and Ward no. - 06 is the least populous ward with population of 1286.The source of water supply is ground water.\
Drainage/Sewerage System& STP: There are Three(3) drains namely Maner Bazar Drain, Ram Nagina Singh College Drain, Ram GhatDrain.The total sewage/waste water discharge through aforesaid drains have been assessed to 13.5 MLD. There is no sewerage network & STP for sewage management at Maner Nagar Panchayatarea. The details of the drains are hereunder:-

40
Sl. No.
Name of drain Average flow
(MLD)
Recipient Sewage/waste water Quality
1. Maner Bazar Drain, Infront of Machhli Market, Maner, Patna
3.55 Ganga River pH: 7.26 BOD: 140 mg/L COD: 496 mg/L TSS: 52 mg/L
2. Ram Nagina Singh College Drain, Maner, Patna
7.59 Sone River Stream/Canal-> Ganga River
pH: 7.67 BOD: 46 mg/L COD: 160 mg/L TSS: 88 mg/L
3 Ram Ghat Drain, Maner, Patna
2.36 Sone River Stream/Canal-> Ganga River
pH: 7.89 BOD: 145 mg/L COD: 472 mg/L TSS: 68 mg/L
Total 13.5
7.2.14Status of Sewerage Network & STP and Action Plan for Sewage Management in Polluted River Stretch along the Ganga
Sl. No.
Name of the ULBs
Action Plan
1. Patna Municipal Corporation, Patna
PMC, Patna (Area: 100 Sq km, Population: 16,84,222- as per Census, 2011, No. of Wards: 75, Length:25 Km along the Ganga river, Water supply source: Ground water) is located on the south bank of river Ganga. The public water supply systems consist of tube wells, pumping water directly to distribution mains on an intermittent basis, across the entire town in addition with private tube wells. Drainage/Sewerage System & STP: The sewerage system has not been developed presently. The storm water drainages are carrier of sewage and mostly flow from south to north and fall into river Ganga. There is a proposal to develop proper sewerage system in the city and then entire sewage will be diverted to STPs through respective network for treatment. Presently, city has four STPs of 109 MLD capacity (Beur-35 MLD, Saidpur-45 MLD, Pahari-25 MLD and Karmalichak-04 MLD). These are under-utilized and treating all together only 64MLD of sewage. This is due to the lesser inflow of sewage from sewerage network due to improper repair and maintenance resulting in silting, dumping of garbage/ solid waste debris, damage pipes & main holes. It has been assessed that Patna city requires STPs of around 350 MLD (Beur-43 MLD, Saidpur-60 MLD, Pahari-60 MLD, Karmalichak-37 MLD, Digha-100 MLD & Kankarbagh-50 MLD)capacities. The proposed Patna sewerage system has been divided into six different Zones, such as Digha, Beur, Kankarbagh, Saidpur, Pahari and Karmalichak. After implementation of sewerage schemes of these zones entire 75 wards of PMC will be covered.The sewerage scheme of Beur, Saidpur, Pahari and Karmalichak will be completed by 2020 whrereas Digha

41
&Karmalichak will be completed by 2021. Present status of project is as follows:-
Proposed Sewerage System and STPs at Patna
Sl. no.
Location of STPs
Installed capacity (MLD)
Proposal for
expan-sion
Cost of Projec
t
Sewerage Network
(km)
Cost of Project
Status
a. Beur, Patna
35 MLD 43 MLD 68.16 180.00 225.77 1. STP & Sewerage Network: Work is in progress. Project will be completed by 2020. STP Physical porgress 98%. Sewerage network 59.86%.
b. Saidpur, Patna
45 MLD 60 MLD 184.93 177.45 268.63 1. STP & Sewerage Network: Work is in progress. Project will be completed by 2020.STP physical progress 81.5% and Sewerage network 24%.
c. Pahari, Patna
25MLD 60 MLD 191.62 88.00 184.86 1. STP & Sewerage Network: Agreement done on 09.05.2018. Work is in progress. Project will be completed by 2020. STP physical progress 13.37%, sewerage network zone-iv progress 46%, sewerage network zone-v progress 22.7%,
116.00 356.37
d. karmali-chak, Patna
04 MLD 37 MLD 77.04 96.54 277.42 1. STP: Work is in progress. Project will be completed by 2020.
2. SewerageNetwork:Agreement done on 11.05.2018. Work is in progress.Project will be completed by 2020. STP physical progress 92% and sewerage network progress 33%.
Total 109MLD 200MLD e.
Digha, Patna
- 100 MLD - 288.00 824.00 for both
work
1. STP & Sewerage Network: Tender received on 09.10.2018.Project will be completed by 2021.NOC form NMCG/World bank has been received for award of contract.
f. Kankar-bagh, Patna
- 50 MLD - 155.2 578.89 for both
work
STP & Sewerage Network: Tender received on 09.10.2018. Project will be completed by 2021.

42
3. Municipal Corpora-tion, Chapra
Municipal Corporation, Chapra (Area: 16.9 Sq KM, Population: 201597- as per Census, 2011, No. of Wards: 44, Length:10 Km along the Ganga river, Water supply source: Ground water) is located on the north bank of Ghaghara-Ganga junction.
Drainage/Sewerage System& STP: There are 7 drainage zones. Out of these 7 drainage basins, the runoff from the catchment area of 2 zone flows into the river Ghaghara. The runoff from 5 remaining zones flows into the river Ghaghara with channel gates and pumping arrangements of sullage to treatment work at Gheghta village. Some of the areas are not connected with drainage system. There is no proper sewage system. The sewage goes to low lying area and water bodies. A scheme comprising I&D of these nala with STP of 32 MLD capacity has been approved for Rs. 236.15 Cr. Bids are under evaluation. Work will be completed by June, 2021. The details of drains and their outfall points are hereunder:-
Drain
no.
U/S Points D/S points Length
(Km)
Direction of flow
DA-1 Gudri Mod Chaur 1.80 From Gudri Mod towards east along NH-19 till Jail and thereupon North from there vai Railway Culvert to Chaur
DA-2 South of Hanuman Madnir
DA-1 0.70 From South of Hanuman Mandir towards North, discharging to DA-1
DA-3 Town Post Office
DA-1 0.90 From town post officer towards north and discharging to DA-1
DA-4 Nehru Stadium
Chaur 0.67 Flowing East and then North towards Municipality Mod, via Railway Culvert to Chaur
DA-5 Kali Bari BalikaVidya
DA-4 0.95 Flowing South and connecting
Sl. No.
Name of the ULBs
Action Plan
2. Nagar Parishad, Buxar
Nagar Parishad, Buxar (Area: 8.7Sq KM, Population: 102861- as per Census, 2011, No. of Wards: 34, Length:12km along the Ganga river, Water supply source: Ground water) is located on the south bank of river Ganga. Drainage/Sewerage System& STP: There are 5 drains namely TadkaNala (Covering part areas of ward no.26, 27 &28), Sewak Nala (Covering part areas of ward no.27 & 28), Kawaldaha Nala (Covering part areas of ward no. 09, 10 & 11), Hosptial Nala (Covering part areas of ward no. 18, 19 & 23), Ambedkar Chauwk to DM Office Nala (Covering part areas of ward no. 11). Presently, sewage of towns flow to Ganga river. There is proposal ofsewerage network of 95.5 Km length and STP of 16 MLD capacity. The cost of the project is 74.95 Cr. Due to insignificant progress work order in process of termination.Revised estimate amounting Rs. 128.14 Cr. has been submitted to NMCG to apporval. The target of completion of the work is December, 2021.

43
laya to DA-4
DA-6 Salempur Ghagra 0.90 From Salempur towards south till canal (KhanuaNala)
DA-7 Salempur Low lying area near Rly. St.
0.95 From Salempur towards north up-to low lying water body (KhanuaNala)
DA-8 Gandhi Chowk
Low lying water body near Nanda LalTola
0.95 From Gandhi Chowk towards north east.
DA-9 Gandhi Chowk
Low lying area near BhikariChowk
1.70 East of Gandhi Chowk along NH-19
Length of major drains 9.52
4. Nagar Parishad, Danapur. Nizamat
Nagar Parishad, Danapur Nizamat (Area: 11.63Sq KM, Population: 18,22,41 as per Census 2011, No. of Wards: 40, Length: 6 Km along the Ganga river, Water supply source: Ground water) is located on the south bank of river Ganga.
Drainage/Sewerage System& STP: There are 4 drains namely Nahar (Patna Canal), Dev Nala (Court Drain), Shahpur Nala & Chitnava Nala. The Patna canal locks at Ganga river. Dev Nala is a major storm water drain passing through core area of the town and cantonment area and joins the Ganga river at cantonment area.
At present there is no sewerage network and STP. A scheme comprising I&D of these nala with STP of 10 MLD capacity has been approved from NMCG. NIT floated. Work will be completed by June, 2021.
5. Nagar Pancha-
yat, Sonepur
Nagar Panchayat, Sonepur (Area: 8.27Sq KM, Population: 37736 as per Census, 2011, No. of Wards: 21, Length: 9 Km along the Ganga river, Water supply source: Ground water) is located on the bank of river Gandak (East) and River Mahi (South).
Drainage/Sewerage System& STP: Total existing channel 11 of 9.22Km length. Discharge-193m3/hour (4.63 MLD). Presently, there is no sewerage system. All the discharge outlets go to low lying area and water bodies. The details of drains and their outfall points are hereunder:-
SN
.
Dra
inag
e C
han
nel
s
Len
gth
Km
Cat
chm
ent
(War
d)
Mea
sure
d
dis
char
ge/
flow
Ou
tfal
l p
oin
ts
DA-1 Rabindranath Tagore School
4.00 3 14.44-18.81
Mahi river
DA-2 Ward boundary 3-4 0.60 3 &4 20.00-22.11
-Do-

44
DA-3 Railway Colony ward-5 0.16 5 12.80-16.91
Agricultural Land
DA-4 Grave Yard, ward 0.70 18 2.23 Mahi river
DA-5 Meena Bazar 0.20 18 39.26-42.46
-Do-
DA-6 Rail Quarter 0.50 5 51.76-57.15
Low land
DA-7 Bihar Tourism 0.50 12 2.41-4.23 -Do-
DA-8 PrathamikVidyalaya 0.10 16 22.11-25.97
-Do-
DA-9 S.D. High School 0.30 14 5.57-7.37 Low land in ward 14
DA-10 NH Adjacent (Only alive in Maunsoon)
2.0 6,11 & 10
NA Canal
DA-11 Agricultural Land 0.16 2 7.54-10.25
Low agricultural land
Proposed STP & sewerage system:A scheme comprising I&D of these nala with STP of 3.5 MLD capacity has been approved with a view to treat the sewage following through the nalas. Tender floalted on 15.10.2018. Work will be completed by December, 2020.
6. Nagar Panchayat, Dighwara
Nagar Panchayat, Dighwara (Area: 13.27Sq KM, Population: 32739 as per Census, 2011, No. of Wards: 18, Length: 3.3 Km along the Ganga river, Water supply source: Ground water) is located on the bank of river Ganga(South).
Drainage/Sewerage System& STP: Presently, there is no sewerage system. All the discharge outlets go to low lying area and water bodies or Jheel in the southern fringe of the town and ultimately to river Ganga. The details of drains and their outfall points are hereunder:-
S.N
.
Dra
inag
e C
han
nel
s
Len
gth
Km
Cat
chm
ent
area
/war
d
Mea
sure
d
dis
char
ge/
flow
O
utf
all
poi
nts
DA-1 BagahingTola 0.40 1,2 5.75-11.85 Agriculture land
DA-2 Marchow Baba Mandir 0.35 3,4 8.83-15.07 -Do-
DA-3 Ucromit Madhya Vidylaya
0.65 10,11 & 15 12.78-20.50 -Do-
DA-4 Post office Road 1.50 14,16 9.34-20.13 Jheel
DA-5 Market Area 0.75 7,8 &9 9.12-15.56 low laying area
DA-6 Rajakia Primary School 0.75 8,9 8.98-14.43 Agriculture land
DA-7 Barbanna 0.42 18 8.86-15.31 Jheel

45
DA-8 Madhya Vidyalay, Basadpur
0.70 17 6.96-11.07 Low laying area
Proposed STP & sewerage system:A revised scheme comprising I&D of these nala with STP of 5.4 MLD capacity has been sent to NMCG with a view to treat the sewage following through the nalas. Work will be completed by December, 2021.
8. Mokama Municipal Council
Mokama Municipal Council (Area: 14.18Sq KM, Population: 60678 as per Census, 2011, No. of Wards: 28, Length: 7 Km along the Ganga river, Water supply source: Ground water) is located on the bank of river Ganga. Drainage/Sewerage System& STP: There are 3 out falls drains. At present, Mokama town has no sewerage system. All the sewages outlet into the drain or ultimately to the low lying area and water bodies. It is proposed to intercept the outfall and divert into STP site for further treatment using gravity and pumping station. The proposed STP & sewerage system: The proposed sewerage system & STP will be constructed near Tapeshwi Sthan, ward no.1 of 7.83 (8) MLD capacity on Sequential Batch Reactor Technology. The project (Rs.53.18crore) has been sanctioned by the NMCG. Tender under process. Work will completed by June, 2020.
9. Bakhtiyapur Nagar
Parishad
Bakhtiyapur Nagar Parishad (Area: 13.18Sq KM, Population: 47897 as per Census, 2011, No. of Wards: 27, Length: 3.5 Km along the Ganga river, Water supply source: Ground water) is located on the southern bank of river Ganga.
Drainage/Sewerage System& STP:There are 5 major drains which generate approx. 5.9(6) MLD. At present, Bakhtiyapur town has no sewerage system & STP. All the sewages outlet into the drain or ultimately to the low lying area and water bodies. It is proposed to intercept the outfall and divert into STP site for further treatment. The drains and their discharge points are hereunder :-
Sl. No. Name of the drains Discharge points
1 Station Road Nala Railway Land 2 Station Road to Gumti Par Nala Railway Land 3 ChouhanJi Road Nala Ganga River 4 RawaichDagarNala Railway Land 5 purana by-pass Nala Railway Land
The proposed STP & sewerage system:The proposed sewerage
7. Nagar Panchayat,
Maner
Nagar Panchayat, Maner (Area: 6.5Sq KM, Population: 40068 as per Census 2011, No. of Wards: 19, Water supply source: Ground water) is located at the distance of 7 Km from Ganga. Drainage/Sewerage System& STP: Presently, there is no sewerage system. All the discharge go to low lying area and water bodies. The proposed STP & sewerage system: A scheme comprising I&D of these nala with STP (for Rs. 41.36 Cr.) has been approved with a view to treat the sewage following through the nalas. NIT flolated.Bid under evaluation. Work will be completed by December, 2020.

46
system & STP of 4 MLD capacity will be constructed near Dhoba River in ward no.12 near Baldhan Colony. The project DPR for Rs. 38.88 Cr. for I&D and STP project has been obtained. Bids are under evaluation.Work will completed by December, 2020.
10. Barh Municipal Council
Barh Municipal Council (Area: 4.5Sq KM, Population: 61470 as per Census, 2011, No. of Wards: 27, Length: 4.5 Km along the Ganga river, Water supply source: Ground water) is located on the bank of river Ganga.
Drainage/Sewerage System& STP: At present, Barh town has no sewerage system. All the sewage outlet into the drain or ultimately to the low lying area and water bodies. It is proposed to intercept the outfall and divert into STP site for further treatment using gravity and pumping station.
The proposed STP & sewerage system: The proposed sewerage system & STP will be constructed near Gas Godown Road of 10.6 (11) MLD capacity on Sequential Batch Reactor Technology.Agreement done on 22.10.2018. Total cost of project is 53.9 Cr. has been approved for the aforesaid scheme Work will be completed by December, 2020.
11. Munger Municipal Council, Munger
Munger Municipal Council, Munger (Area: 17.5Sq KM, Population: 213301 as per Census, 2011, No. of Wards: 45, Length: 5 Km along the Ganga river, Water supply source: Ground water) is located on the southern bank of river Ganga.
Drainage/Sewerage System& STP: There are mainly 3 major drains falling into river Ganga directly out of which the ChandiSthan drain discharge the waste water generated by the households of approximately 20 wards out of 45 wards. Rest of 25 ward's waste water is discharged by the ChuaaBaag main drain and SojhiGhaat outfall drain. At present, there no STP in Munger.
The proposed STP & sewerage system:A revised estimate of the scheme amounting Rs. 294.02 Cr. has been approved for STP of 30 MLD capacity and sewerage network of 143 Km.Work will be completed by December, 2021.
12. Sultanganj Municipal Council,
Sultanganj
Sultanganj Municipal Council, Sultanganj (Area: 12.29Sq KM, Population: 52892 as per Census, 2011, No. of Wards: 25, Length: 4 Km along the Ganga river, Water supply source: Ground water) is located on the southern bank of river Ganga. Drainage/Sewerage System& STP: There are mainly 5 drains (6.40 MLD) namely Krishna GarhNala (1.19 MLD), DhwjaGaliNala (0.72 MLD), BisharisthanGopal Road Nala (0.84 MLD), Near Railway Station (1.30 MLD) and AjgaibnathNala (2.35 MLD). Presently, there is no sewerage system. All the sewages outlet into the drain or ultimately to the low lying area and water bodies. The proposed STP & sewerage system: There is proposal of construction of STP of 10 MLD capacity based on SBR Technology with sewerage network along with construction of sewerage pumping stations. The project (Rs. 63.51 crore) has been approved by NMCG.

47
Agreement done on 14.09.2018. Work will completed by December, 2020.
13. Bhagalpur Municipal
Corporation, Bhagalpur
Bhagalpur Municipal Corporation, Bhagalpur. (Area: 31.17Sq KM, Population: 400148 as per Census, 2011, No. of Wards: 51, Length: 23 Km along the Ganga river, Water supply source: Ganga & Ground water) is located on the southern bank of river Ganga.
Ganga River (17.27 MLD) and Ground water (11.08 MLD) from 51 nos. of tube wells are the source of water supply. Present, demand is 60 MLD. The water supply is managed by PHED, BRJP and BMC.
Drainage/Sewerage System& STP: There are mainly 15 outfall drains in Bhagalpur town which discharge waste water as well as storm water into the river Ganga from West to East. Presently, there is no sewerage system. All the sewages outlet into the drain or ultimately to the low lying area and water bodies.
The proposed STP & sewerage system:A scheme comprising I&D of these nala with STP of 65 MLD capacity has been prepared with a view to treat the sewage following through the nalas. Tender floated. Work will be completed by December, 2021.
14. Nagar Panchayat, Teghara, Begusarai
Nagar Panchayat, Teghara, Begusarai (Area: 26.88Sq KM, Population: 58477 as per Census, 2011, No. of Wards: 25, Length: 3.5 Km along the Ganga river, Water supply source:Ground water) is located on the northern bank of river Ganga.
Drainage/Sewerage System& STP: Presently, there is no sewerage system. Drain the along the station road is not connected to any river. The waste water is discharged to adjacent area of NH28.
The proposed STP & sewerage system:The project DPR for interception and diversion scheme with STP has been submitted to NMCG for approval on 01.08.2018. Works will be completed by December, 2021.
15. Nagar Panchayat,
Fatuha, Patna
Nagar Panchayat, Fatuha, Patna (Area: 7.9Sq KM, Population: 50961 as per Census, 2011, No. of Wards: 27, Length: 4 Km along the Ganga river, Water supply source:Ground water) is located on the bank of river Ganga.
Drainage/Sewerage System& STP: There are 5 drains namely ShamshanGhat to Punpun River covering Ward no. 01, 03, 04 (1.9 MLD); Maharani Ghat to Punpun River covering Ward no. 05, 06, 07, 08 (6.0 MLD); MahraniGhat to Maksudpur main road drain covering ward no. 12 & 13 to 25(1.7 MLD); Chauraha to station road covering ward no.13 & 26(1.55) and Shisamil drain covering ward no.27. Presently, there is no sewerage system and STP.
The proposed STP & sewerage system:A scheme for I&D and STP of 7 MLD capacity has been approved for Rs.35.49 Cr. NIT floated. Bids are unde evaluation.Work will completed by June, 2021.

48
16. Nagar Panchayat, Barahiya, Lakhisarai
Nagar Panchayat, Barahiya, Lakhisarai (Area: 10.0Sq KM, Population: 43032 as per Census, 2011, No. of Wards: 24, Length: 4 Km along the Ganga river, Water supply source:Ground water) is located on the bank of river Ganga.
Drainage/Sewerage System& STP: There are 5 drains. Presently, there is no sewerage system and STP. All the sewage outlet into the drain or ultimately to the low lying area and water bodies. The details of drains and their recipient are hereunder:-
Sl. No. Name of drain Flow (MLD) Recipient
1 Krishna ChowkNala 0.48 Ganga River 2 Baba DaniMohallaNala 0.52 Ganga River 3 Haha Bangla Tal Nala 1.68 Railway Land 4 Railway Station Nala 0.33 Railway Land 5 Baha Path Nala 2.46 Tal Area
The proposed STP & sewerage system: The project DPR for interception and diversion scheme with STP of 5.4 MLD has been submitted to NMCG for approval 18.10.2018. Work will be completed by December, 2021.
17. Nagar Panchayat, Kahalgaon, Bhagalpur
Nagar Panchayat, Kahalgaon, Bhagalpur (Area: 6.3Sq KM, Population: 33700 as per Census, 2011, No. of Wards: 17, Length: 3 Km along the Ganga river, Water supply source:Ground water) is located on the southern bank of river Ganga.
Drainage/Sewerage System & STP: Presently, there is no sewerage system. All the sewage outlet into the drain or ultimately to the low laying area and water bodies.
The proposed STP & sewerage system:A scheme comprising I&D of these nala with STP has been submitted to NMCG with a view to treat the sewage following through the nalas. Work will be completed by December, 2021.
18. Nagar Panchayat, Manihari
Nagar Panchayat, Manihari (Area: 9400.66Sqm, Population: 26629 as per Census, 2011, No. of Wards: 15, Length: 4 Km along the Ganga river, Water supply source:Ground water) is located on the bank of river Ganga.
Drainage/Sewerage System& STP: There are 5 drains (3 MLD) namely from Bus stand to Railway gumti, from railway gumti to nagar panchayat karyalay, from Rudal Paswan's house to middle school in ward no-2 and from ward no-14 to house of Pappu. Presently, there is no sewerage system and STP. All the sewage outlet into the drain ultimately to the low lying area and water bodies.
The proposed STP & sewerage system:A scheme comprising I&D of these nala with STP has been prepared with a view to treat the sewage following through the nalas. The DPR has been submitted to NMCG for approval. Work will be completed by December, 2021.
19. Nagar Parishad,
Nagar Parishad, Jamalpur (Area: 10.7Sq Km, Population: 105434 as per Census 2011, No. of Wards: 36, Town: 8 Km away from the Ganga

49
Jamalpur river, Water supply source:Ground water) is located on the bank of river Ganga.
Drainage/Sewerage System STP: The total drainage network in Jamalpur municipal area cover 114 Km (pucca- 84Km, Kutcha-30km) only on one side of roads. The natural drainage of the town is from east to west. Drains discharge storm water into nallahs located in the periphery of the town. The storm water drains carry waste water from households as well. The city is 8 km away from the main course of River Ganga. Therefore, no drains fall directly to the river. However, 5 drains of the town fall to the Dakranallah which eventually meets the River Ganga. Presently, there is no STP.
The proposed STP & sewerage system:A scheme comprising I&D of these nala with STP has been prepared with a view to treat the sewage following through the nalas. The DPR has been submitted for approval. Work will be completed by December, 2021.
20. Nagar Parishad, Khagaria
General: Nagar Parishad, Khagaria (Area: 6.5Sq Km, Population: 49373 as per Census, 2011, No. of Wards: 26, Town: 22km away from the Ganga river, Water supply source:Ground water) is located on the bank of river Ganga. Drainage/Sewerage System: All waste water from the town discharge to the Budhi Gandak River through the main drain along the Maal Godam Road. Presently, there is no STP. The proposed STP & sewerage system:A scheme (31.7 Cr.) comprising I&D of these nala with STP of 32 MLD capacity has been prepared with a view to treat the sewage following through the nalas. The DPR has been submitted for approval on 06.08.2018. NIT floated. Bids are under evaluation. Work will be completed by June, 2021.
21. Hajipur Municipal Council, Vaishali
Presenty, there no sewerage network & STP. A scheme (Rs. 305.19 Cr.) of STP of 22 MLD capacity and sewerage network 139 KM has been approved. Work will be completed by December, 2021.
22. Nauvgachhiya, Nagar Panchayat, Bhagalpur
Presenty, there no sewerage network & STP. A scheme (Rs. 6.8 Cr.) of STP of 09 MLD capacity has been approved. Work will be completed by December, 2020.
23. Phulwari-sharif, Municipal Council, Patna
Presenty, there no sewerage network & STP. A scheme of STP of 13 MLD capacity& I&D of the drains has been approved. NIT floated. Work will be completed byJune, 2021.
24. Khagaul Municipal Council, Patna
Presenty, there no sewerage network & STP. DPR of STP & I&D of the drainsis unde preparation. Work will be completed by December, 2021.
25. Begusarai Municipal Corporation
General: Begusarai Municipal Corporation (Area: 48 Sq Km, household: 50202, Population: 252008as per Census, 2011, No. of Wards: 45, Town: 08km away from the Ganga river, Water supply

50
source:Ground water). Drainage/Sewerage System: There is one drain namely Pokharia drain near Mohmadpur Jail, Begusarai. All waste water from the town discharge into the low-laying area near Begusarai Railway Stations. The proposed STP & sewerage system:Presenty, there no sewerage network & STP.Originally an AA&ES amounting Rs. 65.408 Cr. wa communcated by NMGC. The contract was terminated NMGC has communicated revised AA & ES amounting Rs. 230.06 Cr. The scheme has a STP having 17 MLD and network of 110 Km. Earlier, contract teminated (Tritech) due to non-performance of the contractor, revised AA & ES Rs. 230.06 Cr. vide NMCG Lt. No.-T-13/2013-14-0283, Dt.05.03.18. Status of previous work done (physical progress-14%, Financial progress-10.84Cr.). Bid received on 08.01.2019. Bid evaluation is in progress. Target of work completion is Spet., 2021.
8.Industrial Pollution along the Polluted River Stretch There are 04 molasses based distillery namely M/s Harinagar Sugar Mills Ltd., (Distillery Division), Harinagar, Dist.-West Champaran; M/s New Swadeshi Sugar Mills, (Distillery Division), Narkatiaganj, Dist.- West Champaran; M/s HPCL Bio-Fuels Ltd. (Distillery Division), Lauria, Dist.-West Champaran and M/s HPCL Bio-Fuels Ltd. (Distillery Division), Sugauli, Dist.- East Champaran, 06 sugar mills namely M/s Harinagar Sugar Mills Ltd., Harinagar, Dist.-West Champaran; M/s New Swadeshi Sugar Mills, Narkatiaganj, Dist.-West Champaran; M/s HPCL Bio-Fuels Ltd. (Sugar Division), Laurya, Dist.-West Champaran and M/s HPCL Bio-Fuels Ltd. (Sugar Division), Sugauli, Dist.-East Champaran; M/s Tirupati Sugar Mills, Bagha, Dist.-West Champaran and M/s Manjhaulia Sugar Industries Pvt. Ltd., Manjhaulia, Dist.-West Champaran in the Sikrahna, Harbaura & Ramrekha river basin and 04 small paper recycling industries namely M/s Smirity Paper Mills Pvt. Ltd., Mahuli Road, Chitauna, Kothia, Dist.- Patna; M/s Indira Paper Mill Pvt. Ltd., Mohuli Road, Patna; M/s Mateshwari Paper Mills Pvt. Ltd., Mahauli Road, Patna and M/s Patna Paper Mill Pvt. Ltd., Mahauli, Kothiya, Patna in the punpun river basin. There is no any GPI on the banks of Sirsia river and Parmar river in Indian Territory.There is no Industrial Cluster/Area/Estate in the polluted river stretches other than that on Ganges, hence no requirement for setting up of CETP in the area. The aforesaid industries having potential of causing pollution to the rivers located nearby the industry under the heads of Grossly Polluting Industries (GPIs). All aforesaid industries have installed Effluent Treatment Plant (ETP). Their details are hereunder:-

51
Status of Grossly Polluting Industries (GPIs)
Sl. No.
Name & Address of
the unit
Name of
Sector
Product and
Production
Capacity
Tentative Quantity
of effluent
generation in KLD (Potentia
l)
Details of Discharge Consent
Effluent Treatment
System
ZLD/ Discharge Recipient (River/ Land)
Remarks
Issued on
Valid up-to
1 M/s Harinagar Sugar Mills Ltd. (Distillery Division), Harinagar, Dist.- West Champaran.
Distillery
Ethanol 120 KLD
1000 13.12.2018
12.12.2023
Bio-methanation, Multi Effect Evaporation (MEE), followed by Bio-composting. The unit has developed facility for maintaining zero liquid discharge.
Zero Liquid Discharge system
Operational. This is located on banks of Ramrekha river, a tributary of Sikrahna River
2 M/s New Swadeshi Sugar Mills, (Distillery Division), Narkatiaganj, Dist.- West Champaran
Distillery
Ethanol, 60 KLD
600 24.12.2018
31.12.2023
Bio-methanation, MEE, RO, followed by Bio-composting. The unit has developed facility for maintaining zero liquid discharge.
Zero Liquid Discharge system
Operational. This is located on banks of Harbaura river, a tributary of Sikrahna River
3 M/s HPCL Bio-Fuels Ltd., Lauria, Dist.- West Champaran.
Distillery
Alcohol 60 KLD
600 29.11.2018
30.09.2023
Bio-methanation, MEE followed by Bio-composting for distillery.
Zero Liquid Discharge system
Operational. This is located nearby Sikrahna river
4 M/s HPCL Bio-Fuels Ltd., Sugauli, Dist.- East Champaran.
Distillery
Alcohol 60 KLD
600 23.11.2018
30.09.2023
Bio-methanation, MEE followed by Bio-composting for distillery.
Zero Liquid Discharge system
Operational. This is located approx. 6 km from Sikrahna river
5 M/s HPCL Bio-Fuels Ltd., Lauria, Dist.- West Champaran.
Sugar Sugar. Crushing Cap. 3500 TCD&
350 29.11.2018
30.09.2023
Activated Sludge Process (ASP) for sugar mill
Land for irrigation.
Operational. This is located nearby Sikrahna river
6 M/s HPCL Bio-Fuels Ltd., Sugauli, Dist.- East Champaran
Sugar Sugar. Crushing Cap. 3500 TCD&
350 23.11.2018
30.09.2023
Activated Sludge Process (ASP) for sugar mill
Land for irrigation.
Operational. This is located approx. 6 km from Sikrahna river
7 M/s Tirupati Sugar Mills, Bagha, Dist.- West
Sugar Sugar. Crushin
g Cap.5000 TCD
700 11.12.2018
31.12.2023
ETP based on Activated Sludge Process (ASP) up to
Land for irrigation.
Operational. This is located nearby Harha river, a tributary of Gandak river.
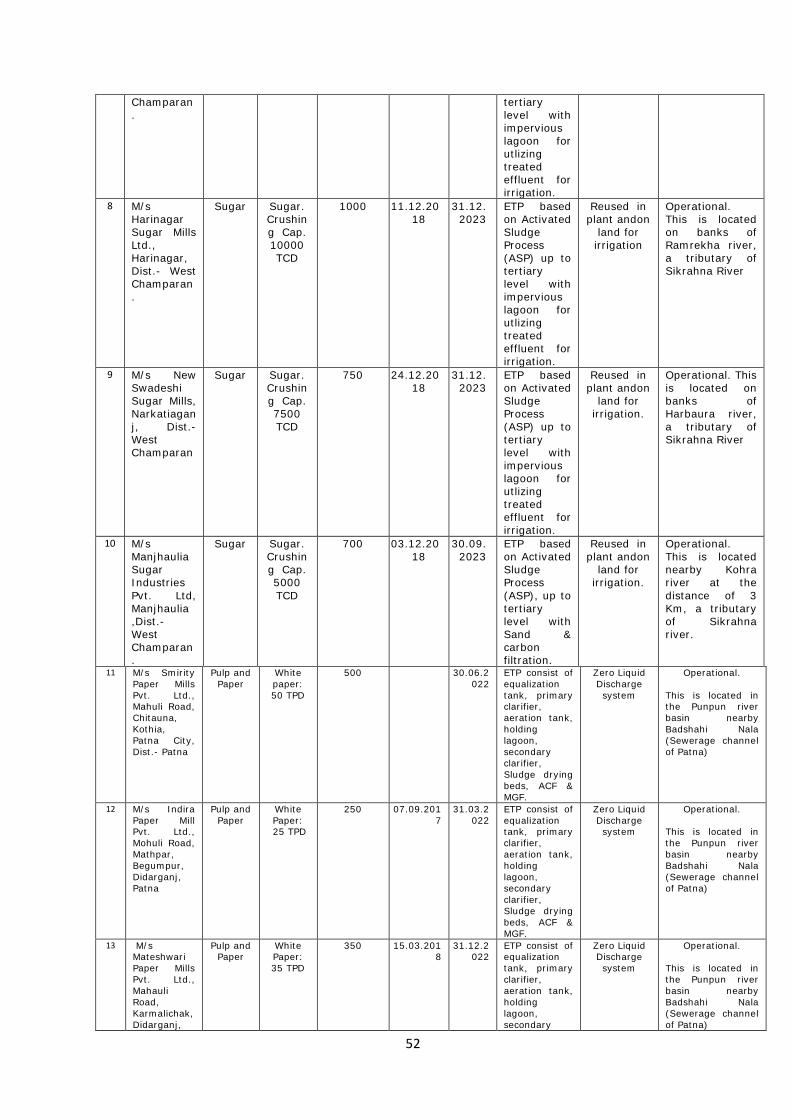
52
Champaran.
tertiary level with impervious lagoon for utlizing treated effluent for irrigation.
8 M/s Harinagar Sugar Mills Ltd., Harinagar, Dist.- West Champaran.
Sugar Sugar. Crushing Cap. 10000 TCD
1000 11.12.2018
31.12.2023
ETP based on Activated Sludge Process (ASP) up to tertiary level with impervious lagoon for utlizing treated effluent for irrigation.
Reused in plant andon
land for irrigation
Operational. This is located on banks of Ramrekha river, a tributary of Sikrahna River
9 M/s New Swadeshi Sugar Mills, Narkatiaganj, Dist.- West Champaran
Sugar Sugar. Crushing Cap. 7500 TCD
750 24.12.2018
31.12.2023
ETP based on Activated Sludge Process (ASP) up to tertiary level with impervious lagoon for utlizing treated effluent for irrigation.
Reused in plant andon
land for irrigation.
Operational. This is located on banks of Harbaura river, a tributary of Sikrahna River
10 M/s Manjhaulia Sugar Industries Pvt. Ltd, Manjhaulia ,Dist.- West Champaran.
Sugar Sugar. Crushing Cap. 5000 TCD
700 03.12.2018
30.09.2023
ETP based on Activated Sludge Process (ASP), up to tertiary level with Sand & carbon filtration.
Reused in plant andon
land for irrigation.
Operational. This is located nearby Kohra river at the distance of 3 Km, a tributary of Sikrahna river.
11 M/s Smirity Paper Mills Pvt. Ltd., Mahuli Road, Chitauna, Kothia, Patna City, Dist.- Patna
Pulp and Paper
White paper: 50 TPD
500 30.06.2022
ETP consist of equalization tank, primary clarifier, aeration tank, holding lagoon, secondary clarifier, Sludge drying beds, ACF & MGF.
Zero Liquid Discharge system
Operational.
This is located in the Punpun river basin nearby Badshahi Nala (Sewerage channel of Patna)
12 M/s Indira Paper Mill Pvt. Ltd., Mohuli Road, Mathpar, Begumpur, Didarganj, Patna
Pulp and Paper
White Paper: 25 TPD
250 07.09.2017
31.03.2022
ETP consist of equalization tank, primary clarifier, aeration tank, holding lagoon, secondary clarifier, Sludge drying beds, ACF & MGF.
Zero Liquid Discharge system
Operational.
This is located in the Punpun river basin nearby Badshahi Nala (Sewerage channel of Patna)
13 M/s Mateshwari Paper Mills Pvt. Ltd., Mahauli Road, Karmalichak, Didarganj,
Pulp and Paper
White Paper: 35 TPD
350 15.03.2018
31.12.2022
ETP consist of equalization tank, primary clarifier, aeration tank, holding lagoon, secondary
Zero Liquid Discharge system
Operational.
This is located in the Punpun river basin nearby Badshahi Nala (Sewerage channel of Patna)
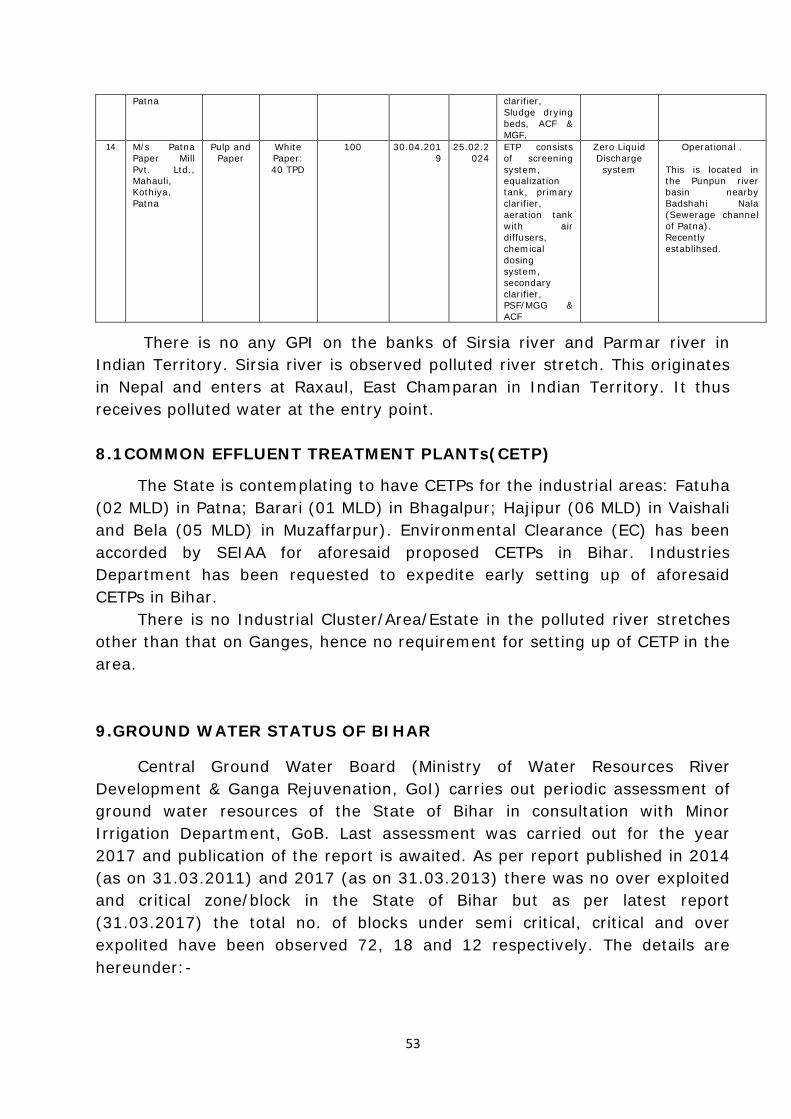
53
Patna clarifier, Sludge drying beds, ACF & MGF.
14 M/s Patna Paper Mill Pvt. Ltd., Mahauli, Kothiya, Patna
Pulp and Paper
White Paper: 40 TPD
100 30.04.2019
25.02.2024
ETP consists of screening system, equalization tank, primary clarifier, aeration tank with air diffusers, chemical dosing system, secondary clarifier, PSF/MGG & ACF
Zero Liquid Discharge system
Operational .
This is located in the Punpun river basin nearby Badshahi Nala (Sewerage channel of Patna). Recently establihsed.
There is no any GPI on the banks of Sirsia river and Parmar river in Indian Territory. Sirsia river is observed polluted river stretch. This originates in Nepal and enters at Raxaul, East Champaran in Indian Territory. It thus receives polluted water at the entry point. 8.1COMMON EFFLUENT TREATMENT PLANTs(CETP)
The State is contemplating to have CETPs for the industrial areas: Fatuha (02 MLD) in Patna; Barari (01 MLD) in Bhagalpur; Hajipur (06 MLD) in Vaishali and Bela (05 MLD) in Muzaffarpur). Environmental Clearance (EC) has been accorded by SEIAA for aforesaid proposed CETPs in Bihar. Industries Department has been requested to expedite early setting up of aforesaid CETPs in Bihar. There is no Industrial Cluster/Area/Estate in the polluted river stretches other than that on Ganges, hence no requirement for setting up of CETP in the area. 9.GROUND WATER STATUS OF BIHAR
Central Ground Water Board (Ministry of Water Resources River Development & Ganga Rejuvenation, GoI) carries out periodic assessment of ground water resources of the State of Bihar in consultation with Minor Irrigation Department, GoB. Last assessment was carried out for the year 2017 and publication of the report is awaited. As per report published in 2014 (as on 31.03.2011) and 2017 (as on 31.03.2013) there was no over exploited and critical zone/block in the State of Bihar but as per latest report (31.03.2017) the total no. of blocks under semi critical, critical and over expolited have been observed 72, 18 and 12 respectively. The details are hereunder:-

54
Particulars As on 31.03.2011
As on 31.03.2013
As on 31.03.2017
No. of assessment blocks/units
533 534 535
Category 1. Safe 522 519 433 2. Semi critical 11 08 72 3. Critical Nil Nil 18 4. Over exploited Nil Nil 12
All 18 assessment blocks/units of West Champaran district having 02 polluted river stretches andall 26 assessment blocks/units of East Champaran district having 01 polluted river stretch were observed in safe category except Madhuvan block under semi critical. CGWB scrutinizes the applications for permission for withdrawal of ground water to industries in Bihar as per norms and guidelines of CGWA and forwards to CGWA, New Delhi with recommendation for according NOC.There is no contaminated/affected ground water blocks in the West Champaran & East Champaran districts. CGWA has prepared artificial re-charge master plan for the State of Bihar. However, CGWA does not construct any structure.
10.CROPDIVERSIFICATION& DRIPIRRIGATION Cropdiversificationisoneofthemeansto minimizetheriskduetoclimatechange.It isalso adopted foravoidingorminimizingtheadverseeffectsofcurrentsystemofcrop specializationandmonocultureforbetteruseofresources,recyclingofnutrientsand regainingsoilfertility.It alsoprovidesbettereconomicvariabilitywithvalueadded productsandimprovementofecology.Changingclimaticconditionslikeerraticand scantyrainfall,depletionofwaterresources,declineinnetsownareaandexisting cropping patternarebecominglessproductive.Cultivatorsaremovingtowards crop intensificationthroughmixedcroppingandbyincludinghighvaluecrops. DepartmentofAgricultureBiharis promotingcultivationofpulsesandcoarsecereals underNationalFoodSecurityMissionandoilseedsunderNationalMissiononoil seedsandpalms,asthesecropsneedlesswater.Cropdiversificationprogramisalso beingimplementedinBihartodiversify thecroppingpatternfrom waterguzzling paddytopulses,oilseeds,maizeandagroforestrywiththeobjectiveoftacklingthe problemofdecliningsoilfertilityanddepletingwatertableinthe State.Toreduce utilization ofwaterinpaddy,waterconservationtechniquelikedirectseededrice,
55
systemofrice intensification,alternatewettinganddryingmethod, laserandlabeling, adoptionofshort duration anddrought tolerantverities,etc arepromoted through variouscropdevelopmentprograms. Inordertoenhancewateruseefficiencyinwaterintensivecrop,assistanceisgiven forpromotionofwatersavingtools/technologies likesprinkler anddripirrigation, creationoffarmponds, efficient deliveryanddistribution system andadoptionof agronomicpractices like alternate row/ furrow irrigation, mulching, etc. Pradhan MantriKrishiSinchaiYojanaalsofocusesoncreatingprotective irrigation byharnessing rain water at micro levelthrough'Jal Sanchay'and'JalSinchan'toinsure'PerDropMoreCrop'.Thestateisimplementing PradhanMantriKrishi Sinchai Yojana (PerDropMoreCrop)fordevelopmentof MicroIrrigationinBiharduringtheyear2018-19withthecostofRs133.00Croreby providing90%subsidytoallcategoriesofFarmersunderDripIrrigationand75% SubsidytoallcategoriesoffarmersunderSprinklerIrrigation.StateGovt.isalso implementing community Tube well Scheme for benefit of small and marginal farmerswith100%subsidytoprovidewatersourceforinstallationofDripIrrigation SystemundertheStatePlan.AsHorticulturalandCommercialcropslikeSugarcane requireheavywaterduringsummerseason,DripIrrigationishighlybeneficial becauseabout60%ofconventionalIrrigationwaterissavedunderthis system.Theproductivityofthecropsunderthis systemincreasesby about25-30%while costofproductiondecreases30-35%incomparisontoConventionalIrrigation System.
11.FORESTRY &PLANTATION ACTIVITIES ALONG RIVER GANGA AND ITS TRIBUTARIES IN BIHAR
The Department of Environment, Forest and Climate Change, Government of Bihar has been carrying out various plantation activities both inside the notified forest areas as well as in the agricultural fields outside the forest areas in the Ganga River Basin, with special emphasis on agroforestry. Increasing Tree Cover: The target for raising plantations both inside the forest area and as well as outside the forest areas in the agricultural fields is guided by the Bihar Krishi Road Map (Bihar Agriculture Road Map) Phase-II for the period 2017-18 to 2021-22. Phase-I of the Bihar Agriculture Road Map had a target of taking the total tree cover (both inside and outside the forest area) from 12.11% in 2012 to 15% by 2017. The Bihar state has successfully achieved the total tree cover target of 15% for the Phase-I of Bihar Agriculture Road Map. For the Phase-II of Bihar Agriculture Road Map for the period 2017-18 to 2021-22 a target of 17% total tree cover has to be achieved by 2022.
56
As part of this drive to achieve 17% of green cover in the state, the areas falling along the rivers like Ramrekha (Ramnagar, West Champaran), Sikrahna (Narkatiaganj, West Champaran), Sirisia (Raxaul, East Champaran), Parmar (Jogbani, Araria), Punpun (Fatuah, Patna) and entire stretch of Ganga in Bihar shall be given preference in taking up plantation activities; soil and moisture conservation efforts in the catchment areas (Forest areas) and plantations in the agricultural fields in the form of agro-forestry. The target for the Plantation activities under the Agricultural Road Map, Phase-II, 2017-18 to 2021-22 for the state of Bihar is given in the Annexure I. The forests of Valmiki Tiger Reserve in West Champaran district is the catchment for Ramrekha and forms part of the catchment for Shikrahna river. The Sirisia river in Raxaul in East Champaran district originates from Nepal. These rivers forms part of the Burhi Gandak river, which is a tributary of river Ganga. Parmar river in Jogbani (Araria), Punpun river in Fatuah (Patna) are also drain into the river Ganga. The Forest Depart has been playing an active role in the conservation of these rivers and river banks from soil erosion and degradation due to various factors by taking up soil and moisture conservation activities in the catchment area viz., forests of Valmiki Tiger Reserve along with plantation activities. In the agricultural fields outside the forest area agro-forestry is actively encouraged with financial incentives for growing trees through different plantation activities under various schemes including the Namame Gange – Forestry Intervention for Ganga scheme. Soil and Moisture Conservation works in Catchment Areas of Valmiki Tiger Reserve: Valmiki Tiger Reserve forms the eastern most limit of the Himalayan Terai forests in India. The landscape encompasses foothill ranges of Himalayan Siwaliks with mosaic of cliffs, ridges, gorges, hills, streams and valleys. Situated in Gangetic plains bio-geographic zone of the country, the forest has combination of bhabhar and terai tracks. Criss-crossing and meandering rivers, streams and rivulets feature on these lands. The streams while roaring in monsoon are mostly dry in summer. In order to reduce run-off and conserve moisture for the lean seasons, Forest Department came up with scheme of Soil and Moisture Conservation works on a large scale in 2012-13. Ever since, works have been carried out in 12,869 Ha of forest land with remarkable results downstream. Not only erstwhile dry nalas have water all year round, this has contributed to augmenting the flow in rivers for which these forests serve as Catchment areas.

57
Year Area taken up for SMC works (Ha)
No. of structures
2012-14 3347 632
2014-15 3034 537
2015-16 2992 549
2016-17 2360 396
2018-19 1136 150
Works have been carried out for treatment of existing gullies as also gullieswhich are in formation stage. Treatment of gully heads has been done using sand bags (geo-bags) and stones/boulders filled crates.
The results of the work done in last 6 years have been very encouraging.

58
Not only moisture regime has improved (resulting in water availability even during pinch season) but lot of silt has also been accumulated.
Kathaiya Nala (2016) Barbarhai Nala (2016)
Namami Gange Project:
Cleaning and maintaining the continuous flow of Ganga has been a mega effort undertaken by the Government of India under Namami Gange project. Role of forestry in this endeavour was amply realised and decided to plant trees and other herb/shrub along the Ganges and its tributaries. In this scheme, 5 km stretch on either side of Ganga and 2 Km in its tributaries viz., Kosi, Gandak, Ghaghra and Son is included where plantation is to be done under the project.
In the year 2016, the Forestry intervention for Ganga was launched in the state. In Bihar, various works such as block plantation, bamboo and iron gabion plantation along the road-side, river and canal side plantation, wetland management, soil and moisture conservation and development of eco-park are proposed in various models under the scheme.

59
As per detailed project report under Namami Gange – Forestry Intervention for Ganga, the total amount of Rs. 33367.993 lakhs will be spent in the state by 2021, under which 27,666.8 hectares of land is to be planted. At present, the scheme has been implemented in 18 districts till the financial year 2018-19. In future, the plan will be implemented in 20 districts of the state. This plan will prove to be effective in the micro climatic amelioration, conservation of soil moisture, soil erosion and help conserve biodiversity in the areas along the river Ganga and its tributaries which also include part of the catchment of the tributaries of river Ganga located in the State of Bihar.
Agricultural landscape-model Plantation activity has been started in the state in which plants are made available to the farmers. Mango, Litchi, guava and timber species plants have being distributed among the selected farmers, especially among the farmers whose agricultural fields are located within 2 Kms from the Tributaries of river Ganga and 5 Kms from the river banks of river Ganga. Under Agricultural landscape-model Plantation activity a total number of 230657 plants were planted on the farmer’s agricultural field along the river Ganga and along the tributaries of river Ganga within the State.Under ‘Ganga Gram’ activitiy under Namame Gange - Forestry Intervention For Ganga Scheme, plants are planted in a selected village along the river Ganga. This has been taken up as a awareness activity.
The Department of Environment, Forest and Climate Change, Government of Bihar has been striving to achieve the target for tree cover as given under the Bihar Agriculture Road Map: Phase –I: 2017-18 – 2021-22 with the available resources. There will emphasis to achieve the target of tree cover outside the forest areas through agroforestry on a massive scale. The catchments areas, agricultural lands falling on either side of the following rivers viz., Ram Rekha (Ramnagar, West Champaran), Sikrahna (Narkatiaganj, West Champaran), Sirisia (Raxaul, East Champaran), Parmar (Jogbani, Araria), Punpun (Fatuah, Patna) and Ganga will form part of this plantation drive by the department.
12.ACTION PLAN FOROPEN DEFECATION FREE (ODF)
Sl.
No.
Name of City/ULBs Status of ODF
declared
Date of QCI Certificate
Remarks
1 Fatuha Nagar Parishad ODF 31.07.2018
2 Raxaul Nagar Parishad ODF 11.08.2018
3 Jogabni Nagar Panchayat ODF 08.09.2018
4 Ramnagar/Harinagar Nagar ODF 18.09.2018

60
Panchayat
5 Narkatiaganj Nagar Parishad
Non-ODF Non-ODF To be ODF by 31stAugust, 2019
13.STATUS & ACTION PLAN FOR SOLID WASTE, PLASTIC WASTE,BIO- MEDICAL WASTE, E-WASTE AND HAZARDOUSWASTE MANAGEMENT
SWM:
Sl. No.
Name of City/ULBs
Waste generation
TPD
Total Project Cost
(Rs. in Lakh)
Remarks/ Timelines for execution
1 Fatuha Nagar Parishad
10 483.42 SWM DPRs has been approved by MoHUA, GoI, and 50% Central share fund also has been released on 11.04.2019.Project execution to be completed by December, 2019.
2 Raxaul Nagar Parishad
11 532.93 DPRs submitted to MoHUA, GoI, dated-19.11.2018.
3 Narkatiaganj Nagar Parishad
09 482.04 SWM DPRs has been approved by MoHUA, GoI, and 50% Central share fund also has been released on 11.04.2019. Project execution will be started from June, 2019.
4 Ramnagar/Harinagar Nagar Panchayat
07 SWM DPR is in under preparation and to be completed by July, 2019.Project execution to be completed by December, 2019.
5 Jogabni Nagar Panchayat
06 SWM DPR is in under preparation. Project execution to be completed by July, 2019.
PWM: The Government of Bihar has banned the use of plastic carry bags (irrespective of their size & thickness) in the jurisdiction of all Urban Local Bodies and Gram Panchayats in the State of Bihar vide Gazette Notification No. 943, dated-24.10.2018 & 1043, dated-11.12.2018. Penalty provisions have been made in the Plastic Waste Management Byelaws, 2018, if anyone is involved in production, distribution, trading, storage, sale and use of plastic carry bags irrespective of its thickness and sizes.
BMW: Bio-medical wastes are collected treated and disposed by the four established Common Bio-Medical Waste Treatment Facilities (CBWTF) located at Patna, Muzaffarpur, Bhagalpur & Gaya. BMW of the polluted river stretch area viz. Raxual, Narkatiaganj, Ramnagar (East & West Champaran districts) are collected by M/s Medicare Environmental Management (P) Ltd., Muzaffarpur Industrial Area, P.O.-Bela, Dist-Muzaffarpur and BMW of polluted river stretch area of Punpun river are collected by M/s Indira Gandhi Institute of Medical Sciences, Sheikhpura, Patna-14 (Operated by M/s Sangam Mediserv Pvt. Ltd.). Two more facilities are proposed at Bhojpur and Madhepura.

61
e-Waste: There is no any manufacturer and e-Waste dismantlers, recyclers and re-furbishers in this State. Producers have been directed for collection & channilization of e-waste under EPR authorization by CPCB. HW: There is no significant HW generation in the State. 14. Action Plan for Restoration& Conservation of Polluted River Stretches in Bihar with suggestive timelines.
Sl. No
Action Plan Im
ple
men
tin
g
Ag
ency
Imp
lem
enta
tio
n P
erio
d
(Sh
ort
/M
id/
Lon
g t
erm
)
Tim
e Ta
rget
fo
r im
ple
men
tio
n
StatusReport
A Identification of Polluting Sources
a. Industrial Pollution Control.
i. Inventorisation of Industries.
BSPCB
Short Immediate Complied There are 06 sugar mills, 04 molasses based distillery& 04 waste paper recycling unitin the basin of identified polluted river stretches falling under GPIs.
ii. Categories of industry & effluent quality.
BSPCB
Short Immediate Distillery, Sugar& waste paper recycling unit
These are Grossly Polluting Industries (GPIs)&having potential of causing pollution to the rivers located nearby the industry if there is discharge.
iii. Treatment of effluents, compliance with standards and mode of disposal of effluent.
BSPCB
Short Immediate All identified industries have installed Effluent Treatment Plant (ETP). Distillery units follow Bio-methanation, Multi-Effect-Evaporation (MEE) & Bio-composting mode for treatment and disposal of their effluent. They are maintaining Zero Liquid Discharge (ZLD). Sugar mills have ETP based on Activated Sludge Process (ASP) up to tertiary level with impervious lagoon for utilization of treated effluent for irrigation. Paper recycling unit have installed ETP for maintaining ZLD.
iv. Regulatory Regime
• Implementation of Zero Liquid Discharge in distillery&Paper
BSPCB
Short Immediate Being complied.

62
recycling unit
• Implementation of Discharge Standards notified by MoEF&CC, GoI vide notification GSR 35(E), dated-14.01.2016
BSPCB
Short Immediate Regular inspection & monitoring shall be carried out to ensure the notified discharge standards for sugar industry & implementation of ZLD in distillery & Paper recycling units.
• No industry shall be permitted to extract ground water for industrial and commercial purposes unless it has obtained permission from Central Ground Water Authority (CGWA).
Industrial Units and CGWA.
Short Immediate Being complied
• Flow Meters at the water source point and discharge point shall be installed at all Industrial Units prior to the grant of aforesaid permission for the assessment of water balance.
Industrial Units and CGWA.
Short Immediate Being complied
b. Channelization, treatment, utilization & disposal of treated domestic sewage.
i. Identification of towns in the catchment of river and estimation of quantity of sewage generated and existing sewage treatment capacities to arrive at the gap between the sewage generation and treatment capacities
BSPCB & UD&HD
Short Immediate
a. A total of 25 towns are located on Ganges while Raxaul, Narkatiaganj, Ramnagar/Harinagar, Fatuha and Jogbani have been identified as towns in the catchment of polluted river stretches apart from Ganges.
b. The quantity of sewage generated from the aforesaid identified towns/ ULBs and their recipient are hereunder:-
Towns /ULBs
No. of Drains Identif
ied
Total Flow in MLD
Recipients /Polluted River
Stretch
Raxaul 3 14.89 (15)
Sirsiya River
Narkatiaganj
3 14.59 (15)
Harbaura River

63
Ramnagar (Harinagar)
5 27.88 (28)
Ramrekha River
Bagha 4 7.88 (08)
Low lying area
Fatuha
7 9.22 (09)
Ganga River & Punpun
Jogbani
4 2.74 (03)
Low lying Area
c. There is no any sewerage
network and Sewage Treatment Plant (STP) in the ULBs of polluted river stretch basin. In pursuance of BSPCB, BGCMC (UD&HD, GoB) has directed BUDCO for preparation of DPR for I & D and setting up of STP through NEERI for sewage management for the ULBs namely Raxaul, Narkatiaganj, Ramnagar (Harinagar) and Jogbani located in the polluted river stretch basin.
d. Fatuha (Punpun River): A scheme of I&D and STP of 07 MLD capacity has been approved for Rs. 35.49 Cr. for Fatuha. NIT has been floated for re-tender. The expected time of completion of the project is June, 2021.
e. Ramnagar/Harinagar (Ramrekha River): DPR for I&D with STP is under preparation. It will be prepared by Sept., 2019 and will be sent to NMCG for sanction. After approval of DPR work will be completed by June, 2021.
f. Narkatiaganj (Harbaura River): DPR for I&D with STP is under preparation. It will be prepared by Sept., 2019 and will be sent to NMCG for sanction. After approval of DPR work will be completed by June, 2021.
g. Raxaul (Sirsia River): DPR for I&D with STP is under preparation. It will be prepared by Sept. 2019 and will be sent to NMCG for sanction. After approval of DPR work will be completed by June, 2021.
h. Jogbani (Parmar River): DPR for I&D with STP is under preparation. It will be prepared by Sept., 2019 and will be sent to NMCG for sanction. After approval of DPR work will be completed by June, 2021.
ii. Storm water drains now carrying sewage &
UD&HD Long 31.03.21 Presently, identified drains carry storm water as well as sewage/domestic waste water generated from towns/ULBs (Raxaul, Narkatiaganj, Ramnagar/Harinagar,
UD&HD Long 30.06.21
UD&HD
Long 30.06.21
UD&HD Long 30.06.21
UD&HD Long 30.06.21
30.06.21
Long UD&H

64
sullage joining river and interception & diversion of sewage to STP
Fatuha and Jogbani) under polluted river stretch/catchment area as well as from Ganga Front Towns. Presently, there is no sewerage network & STP in the aforesaid towns. UD&HD has prepared action plan for sewerage network and STP for the 25 Ganga Front Towns including Fatuha. DPR is under preparation for towns of polluted river stretches viz Raxaul, Ramnagar/ Harinagar, Narkatiaganj & Jogbani.
iii. Treatment and disposal of septage and controlling open defecation
UD&HD, GoB, PHED, GoB & District Adm.
Short 31.07.19 Fatuha Nagar Parishad, Raxaul Nagar Parishad, Ramnagar Nagar Parishad and Jogbani Nagar Panchayat have been declared ODF. Narkatiaganj Nagar Parishad shall be ODF by August, 2019.
iv. Identification of towns for installing sewerage system and sewage treatment plants.
UD&HD, GoB
Short Immediate Raxaul, Narkatiaganj, Ramnagar/Harinagar, Chanpatia, Fatuha and Jogbani. UD&HD has prepared action plan for sewerage network and STP for the 25 Ganga Front Towns including Fatuha. DPR is under preparation for towns of polluted river stretches.
B River catchment /Basin Management -controlled ground water extraction and periodic quality assessment.
i. Periodic assessment of ground water resources and regulation of ground water extraction by industries particularly in over exploited and critical zones/ blocks.
CGWB Short Immediate Complied 1. Central Ground Water Board
(Ministry of Water Resources River Development & Ganga Rejuvenation, GoI) carry out periodic assessment of ground water resource of the State of Bihar in consultation with Minor Irrigation Department, GoB. Last assessment has been carried out for the year 2017 and publication of the completed report is awaited. As per report published in 2014 (as on 31.03.2011) and 2017 (as on 31.03.2013) the status is as hereunder:-
Particulars As on 31.03.2011
As on 31.03. 2013
As on 31.03. 2017
No. of assessment blocks/ units
533 534 535
Category 1. Safe 522 519 433 2. Semi critical
11 08 72
3. Critical Nil Nil 18 4. Over exploited
Nil Nil 12
2. All 18 assessment blocks /units of
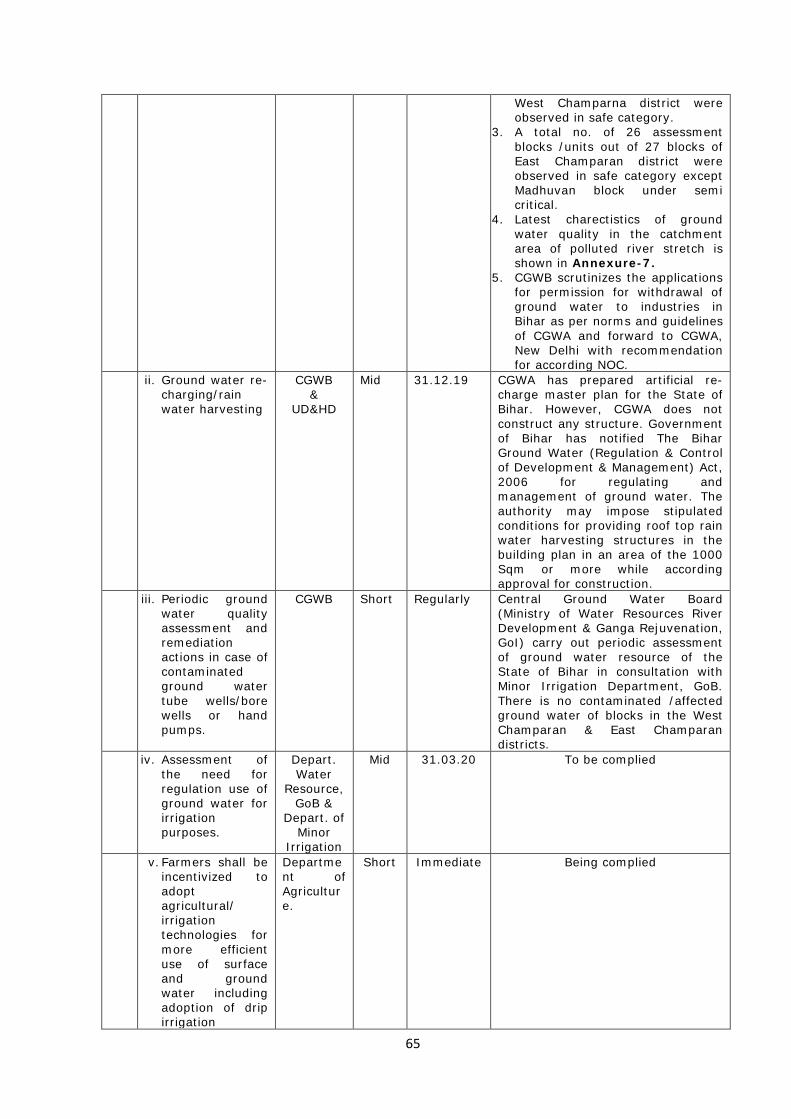
65
West Champarna district were observed in safe category.
3. A total no. of 26 assessment blocks /units out of 27 blocks of East Champaran district were observed in safe category except Madhuvan block under semi critical.
4. Latest charectistics of ground water quality in the catchment area of polluted river stretch is shown in Annexure-7.
5. CGWB scrutinizes the applications for permission for withdrawal of ground water to industries in Bihar as per norms and guidelines of CGWA and forward to CGWA, New Delhi with recommendation for according NOC.
ii. Ground water re-charging/rain water harvesting
CGWB &
UD&HD
Mid 31.12.19 CGWA has prepared artificial re-charge master plan for the State of Bihar. However, CGWA does not construct any structure. Government of Bihar has notified The Bihar Ground Water (Regulation & Control of Development & Management) Act, 2006 for regulating and management of ground water. The authority may impose stipulated conditions for providing roof top rain water harvesting structures in the building plan in an area of the 1000 Sqm or more while according approval for construction.
iii. Periodic ground water quality assessment and remediation actions in case of contaminated ground water tube wells/bore wells or hand pumps.
CGWB Short Regularly Central Ground Water Board (Ministry of Water Resources River Development & Ganga Rejuvenation, GoI) carry out periodic assessment of ground water resource of the State of Bihar in consultation with Minor Irrigation Department, GoB. There is no contaminated /affected ground water of blocks in the West Champaran & East Champaran districts.
iv. Assessment of the need for regulation use of ground water for irrigation purposes.
Depart. Water
Resource, GoB &
Depart. of Minor
Irrigation
Mid 31.03.20 To be complied
v. Farmers shall be incentivized to adopt agricultural/ irrigation technologies for more efficient use of surface and ground water including adoption of drip irrigation
Department of Agriculture.
Short Immediate Being complied

66
wherever feasible besides, promoting crops diversification to promote less water intensive crops in the Ganga river basin.
C Flood Plain Zone
i. Regulating activities in flood plain zone
WRD
a. The STPs shall not be constructed close to the river bed. Preferably there should be a distance of 500 meter or more from the edge of the river.
UD&HD& ULBs
Short Immediate To be complied
b. Management of Municipal, Plastic, Hazardous, Bio-medical and Electrical and Electronic wastes.
UD&HD, ULBs & BSPCB
Mid 31.12.19 Fatuha Nagar Parishad: SWM DPRs has been approved by MoHUA, GoI, and 50% Central share fund also has been released on 11.04.2019.Project execution to be completed by December, 2019. Raxaul Nagar Parishad:DPRs submitted to MoHUA, GoI, dated-19.11.2018. Narkatiaganj Nagar Parishad:SWM DPRs has been approved by MoHUA, GoI, and 50% Central share fund also has been released on 11.04.2019. Project execution will be started from June, 2019. Ramnagar/ Harinagar Nagar Panchayat:SWM DPR is in under preparation and to be completed by July, 2019.Project execution to be completed by December, 2019. Jogabni Nagar Panchayat:SWM DPR is in under preparation. Project execution to be completed by July, 2019. PWM: The Government of Bihar has banned the use of plastic carry bags (irrespective of their size & thickness) in the jurisdiction of all Urban Local

67
Bodies and Gram Panchayats in the State of Bihar vide Gazette Notification No. 943, dated-24.10.2018 & 1043, dated-11.12.2018. BMW: Bio-medical wastes are collected treated and disposed by the four established Common Bio-Medical Waste Treatment Facilities (CBWTF) located at Patna, Muzaffarpur, Bhagalpur & Gaya. BMW of the polluted river stretch area viz. Raxual, Narkatiaganj, Ramnagar (East & West Champaran districts) are collected by M/s Medicare Environmental Management (P) Ltd., Muzaffarpur Industrial Area, P.O.-Bela, Dist-Muzaffarpur and BMW of polluted river stretch area of Punpun river are collected by M/s Indira Gandhi Institute of Medical Sciences, Sheikhpura, Patna-14 (Operated by M/s Sangam Mediserv Pvt. Ltd.). Two more facilities are proposed at Bhojpur and Madhepura. e-Waste: There is no any manufacturer and e-Waste dismantlers, recyclers and re-furbishers in this State. Producers have been directed for collection channelization of e-waste uner EPR authorization by CPCB. HW: There is no significant HW generation in the State.
c. Restriction on disposal of solid waste on bank of rivers.
ULBs, District
Administration
Short Immediate Commited for compliance.
d. There shall be no dumping or landfill sites for any kind of waste irrespective of any technology for waste processing within 500 meter from the edge of river.
ULBs, UDD & BSPCB
Short Immediate Committed for compliance.
e. There shall be District Long 31.03.21 Committed for compliance.

68
no encroachment, unauthorized illegal construction on the banks/ flood plain of major drains, river Ganga and its tributaries. Preferably these area should be utilized for creation of green belt and bio-diversity park etc. (natural fringes of effluent and sewage)
Administration, Deptt. of Water Resources, Env.& Forest Deptt., Govt. of Bihar.
ii. Greenery development-plantation plan
Env.& Forest Deptt., Govt. of Bihar.
Mid 31.03.20 Plantation is being done under Namami Gange Scheme and Krishi Road Map wherein the polluted river stretches will be prioritized.
D Ecological/Environmental Flow (E-Flow)
i. Issues relating to E-Flow
Maintenance of 20% minimum environmental flow of the lean season flow of rivers.
Dept. of Water Resource, GoB
Long 31.03.21 Committed for compliance.
ii. Irrigation practices
Dept. of Minor
Irrigation &
Agriculture, GoB
Short Immediate Being complied
E Such other issues which may be found relevant for restoring water quality to the prescribed standards.
Water Resource Dapetment has prepared action plan for utilization of treated sewage of Patna which includes catchment area of Punpun river.
i. Water quality of polluted river stretches shall be displayed on the BSPCB website.
BSPCB Short Immediate Uploaded
ii. No illegal mining in polluted river stretches.
Mining Depart. & Dist. Adm.
Short Immediate Committed for compliance.

69
Annexure-1
Water Quality status of River Ganga (2009-2018)
Sl. No
Year No. of sampling location
DO mg/L
BOD mg/L
Remarks
1. 2009-10 13 7.4 to 9.2 <3 DO & BOD conforms 2. 2010-11 13 7.0 to 9.1 <3 DO & BOD conforms 3. 2011-12 21 6.2 to 9.3 <3 DO & BOD conforms 4. 2012-13 21 6.4 to 8.6 <3 DO & BOD conforms 5. 2013-14 21 5.8 to 9.7 <3 DO & BOD conforms 6. 2014-15 21 6.9 to 9.8 <3 DO & BOD conforms 7. 2015-16 21 6.9 to
10.2 <3 DO & BOD conforms
8. 2016-17 21 2.6* to 9.6
<3* The value of BOD was observed>3mg/L at 04 locations/towns viz. Patna, Barahiya, Munger and Bhagalpur during October, 2016 and at 02 locations Simariya ghat, Mokama (Station code-1815) 4.1 mg/L & Barahiya (Station code-3123) during January, 2017.
9. 2017-18 31 5.0 to 11.0
<3 DO & BOD conforms
10 2018-19 33 6.34 to 9.8
<3 DO & BOD conforms

70
Annexure-2
Year WiseWater Quality Monitoring Data of River Ganga
Water Quality Status of River Ganga during the Year (2010-2011)
Sl.No
Sampling Station
pH
D.O mg/L
B.O.D mg/L
T.C MPN/100mL
F.C MPN/100mL
1. Ganga at Chausa Buxar
Minimum 7.24 8.8 2.6 3000 1300 Maximum 8.58 9.1 2.9 16000 5000 Average 7.95 8.58 2.76 5750 2383
2. Ganga at Ramrekha ghat Buxar
Minimum 6.92 7.8 2.9 16000 3000 Maximum 8.52 9.0 3.0 24000 16000 Average 7.88 8.43 2.95 22000 8083
3. Ganga at Kurji (U/S Patna)
Minimum 8.11 7.7 2.6 2400 1300 Maximum 8.62 8.9 2.8 9000 5000 Average 8.31 8.57 2.74 4216 2075
4. Ganga at Darbhangaghat, Patna
Minimum 7.84 7.5 2.8 9000 3000 Maximum 8.34 9.1 3.0 24000 16000 Average 8.21 8.4 2.9 22083 8083
5. Ganga at Gaighat (D/S Patna)
Minimum 7.62 7.7 2.8 9000 2400 Maximum 8.28 8.8 3.0 24000 16000 Average 8.16 8.38 2.89 15583 5700
6. Ganga at Kewalaghat, Fatuha.
Minimum 7.51 7.6 2.6 2200 1100 Maximum 8.32 8.9 2.8 9000 5000 Average 8.16 8.48 2.73 4958 2250
7. Ganga at U/S Mokama
Minimum 7.14 7.8 2.7 2200 1100 Maximum 8.25 8.8 2.8 9000 5000 Average 7.95 8.3 2.75 4309 2136
8. Ganga at D/S Mokama
Minimum 7.60 7.0 2.9 9000 2200 Maximum 8.11 8.6 3.0 24000 16000 Average 7.91 8.04 2.92 16273 6473
9. Ganga at Munger
Minimum 7.81 8.0 2.6 2400 1300 Maximum 8.22 8.9 2.8 5000 2400 Average 7.98 8.32 2.76 3560 1540
10. Ganga at Sultanganj
Minimum 7.38 7.1 2.6 2200 1100 Maximum 8.20 8.9 2.8 9000 5000 Average 7.88 8.2 2.74 4690 2260
11. Ganga at Bhagalpur
Minimum 7.61 8.0 2.8 2800 1700 Maximum 8.56 8.9 2.9 16000 5000 Average 7.90 8.5 2.8 7466 2800
12. Ganga at Kahalgaon
Minimum 7.71 7.4 2.7 3000 1300 Maximum 8.67 8.9 2.9 16000 5000 Average 7.96 8.27 2.8 7500 3000
13. Ganga at Confluence of Sone River, Doriganj, Chapra.
Minimum 7.68 7.4 2.8 2400 1100 Maximum 8.75 8.9 2.8 5000 2200 Average 8.27 8.4 2.8 3533 1566
Water Quality Status of River Ganga during the Year (2011-2012)
Sl.No
Sampling Station
pH
D.O mg/L
B.O.D mg/L
T.C MPN/100mL
F.C MPN/100mL
1. Ganga at Chausa Buxar
Minimum 7.1 7.8 2.6 2800 1100 Maximum 8.52 9.2 2.8 16000 9000 Average 8.1 8.5 2.7 5900 2733
2. Ganga at Minimum 7.14 7.8 2.6 16000 5000
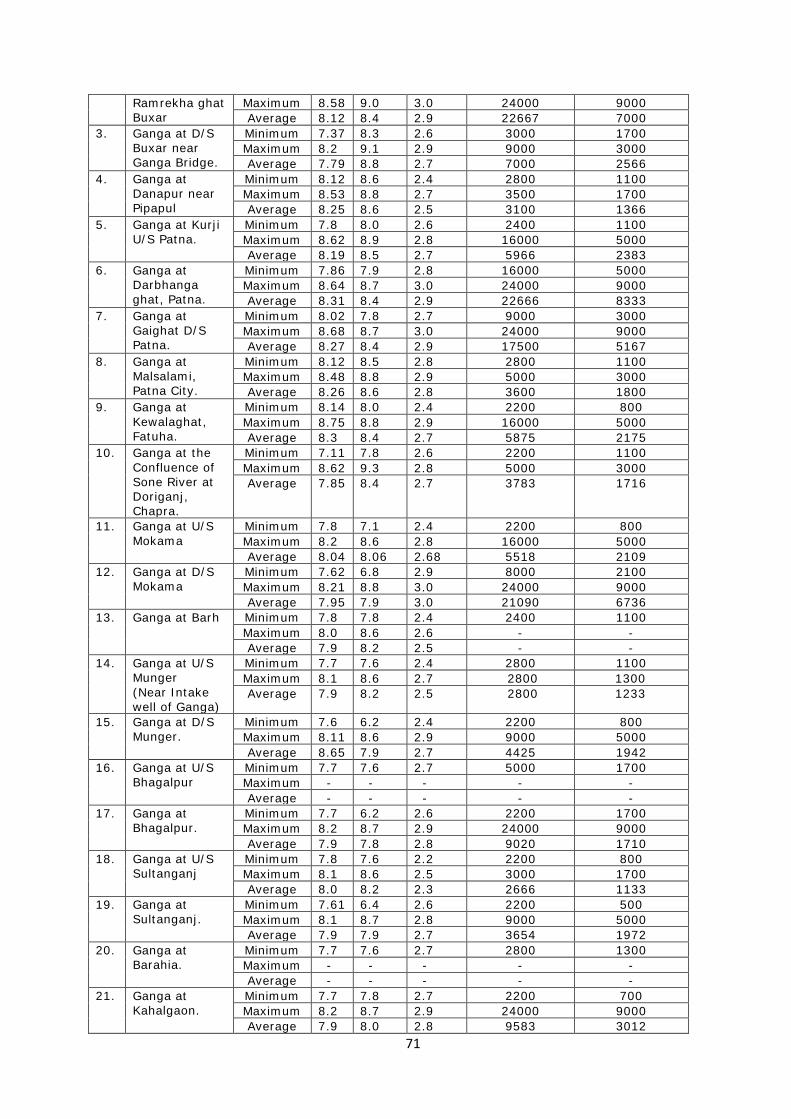
71
Ramrekha ghat Buxar
Maximum 8.58 9.0 3.0 24000 9000 Average 8.12 8.4 2.9 22667 7000
3. Ganga at D/S Buxar near Ganga Bridge.
Minimum 7.37 8.3 2.6 3000 1700 Maximum 8.2 9.1 2.9 9000 3000 Average 7.79 8.8 2.7 7000 2566
4. Ganga at Danapur near Pipapul
Minimum 8.12 8.6 2.4 2800 1100 Maximum 8.53 8.8 2.7 3500 1700 Average 8.25 8.6 2.5 3100 1366
5. Ganga at Kurji U/S Patna.
Minimum 7.8 8.0 2.6 2400 1100 Maximum 8.62 8.9 2.8 16000 5000 Average 8.19 8.5 2.7 5966 2383
6. Ganga at Darbhanga ghat, Patna.
Minimum 7.86 7.9 2.8 16000 5000 Maximum 8.64 8.7 3.0 24000 9000 Average 8.31 8.4 2.9 22666 8333
7. Ganga at Gaighat D/S Patna.
Minimum 8.02 7.8 2.7 9000 3000 Maximum 8.68 8.7 3.0 24000 9000 Average 8.27 8.4 2.9 17500 5167
8. Ganga at Malsalami, Patna City.
Minimum 8.12 8.5 2.8 2800 1100 Maximum 8.48 8.8 2.9 5000 3000 Average 8.26 8.6 2.8 3600 1800
9. Ganga at Kewalaghat, Fatuha.
Minimum 8.14 8.0 2.4 2200 800 Maximum 8.75 8.8 2.9 16000 5000 Average 8.3 8.4 2.7 5875 2175
10. Ganga at the Confluence of Sone River at Doriganj, Chapra.
Minimum 7.11 7.8 2.6 2200 1100 Maximum 8.62 9.3 2.8 5000 3000 Average 7.85 8.4 2.7 3783 1716
11. Ganga at U/S Mokama
Minimum 7.8 7.1 2.4 2200 800 Maximum 8.2 8.6 2.8 16000 5000 Average 8.04 8.06 2.68 5518 2109
12. Ganga at D/S Mokama
Minimum 7.62 6.8 2.9 8000 2100 Maximum 8.21 8.8 3.0 24000 9000 Average 7.95 7.9 3.0 21090 6736
13. Ganga at Barh Minimum 7.8 7.8 2.4 2400 1100 Maximum 8.0 8.6 2.6 - - Average 7.9 8.2 2.5 - -
14. Ganga at U/S Munger (Near Intake well of Ganga)
Minimum 7.7 7.6 2.4 2800 1100 Maximum 8.1 8.6 2.7 2800 1300 Average 7.9 8.2 2.5 2800 1233
15. Ganga at D/S Munger.
Minimum 7.6 6.2 2.4 2200 800 Maximum 8.11 8.6 2.9 9000 5000 Average 8.65 7.9 2.7 4425 1942
16. Ganga at U/S Bhagalpur
Minimum 7.7 7.6 2.7 5000 1700 Maximum - - - - - Average - - - - -
17. Ganga at Bhagalpur.
Minimum 7.7 6.2 2.6 2200 1700 Maximum 8.2 8.7 2.9 24000 9000 Average 7.9 7.8 2.8 9020 1710
18. Ganga at U/S Sultanganj
Minimum 7.8 7.6 2.2 2200 800 Maximum 8.1 8.6 2.5 3000 1700 Average 8.0 8.2 2.3 2666 1133
19. Ganga at Sultanganj.
Minimum 7.61 6.4 2.6 2200 500 Maximum 8.1 8.7 2.8 9000 5000 Average 7.9 7.9 2.7 3654 1972
20. Ganga at Barahia.
Minimum 7.7 7.6 2.7 2800 1300 Maximum - - - - - Average - - - - -
21. Ganga at Kahalgaon.
Minimum 7.7 7.8 2.7 2200 700 Maximum 8.2 8.7 2.9 24000 9000 Average 7.9 8.0 2.8 9583 3012
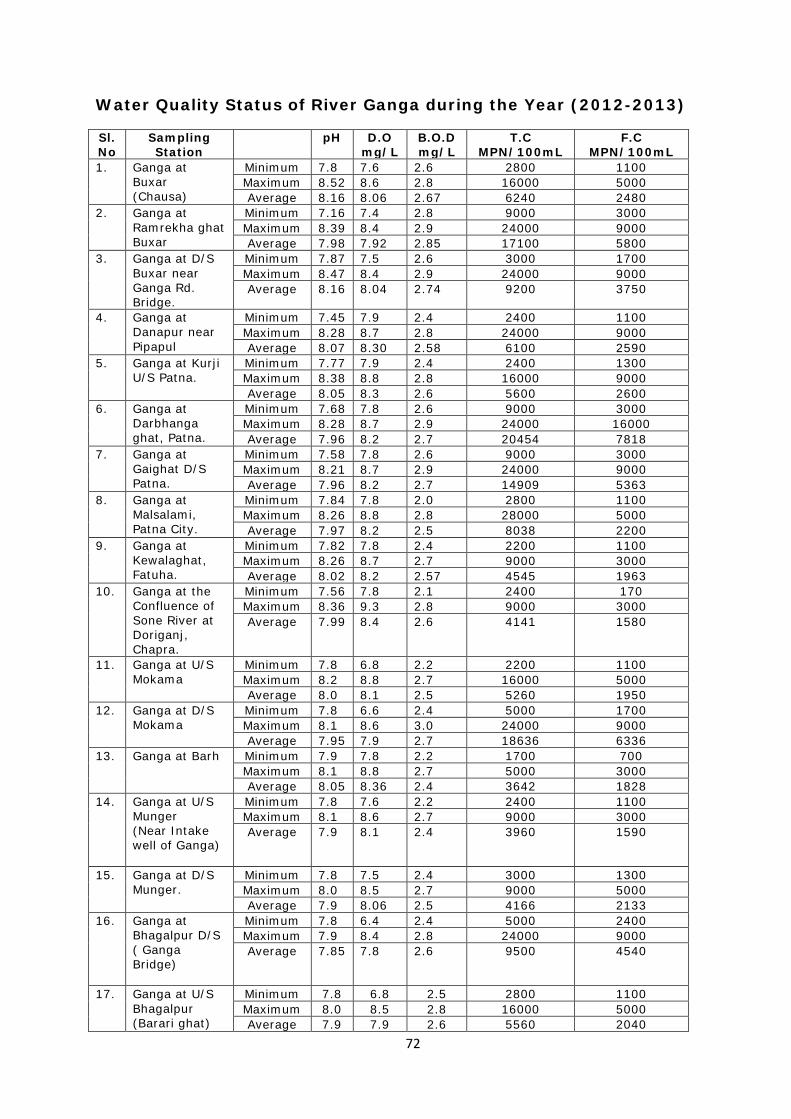
72
Water Quality Status of River Ganga during the Year (2012-2013)
Sl.No
Sampling Station
pH
D.O mg/L
B.O.D mg/L
T.C MPN/100mL
F.C MPN/100mL
1. Ganga at Buxar (Chausa)
Minimum 7.8 7.6 2.6 2800 1100 Maximum 8.52 8.6 2.8 16000 5000 Average 8.16 8.06 2.67 6240 2480
2. Ganga at Ramrekha ghat Buxar
Minimum 7.16 7.4 2.8 9000 3000 Maximum 8.39 8.4 2.9 24000 9000 Average 7.98 7.92 2.85 17100 5800
3. Ganga at D/S Buxar near Ganga Rd. Bridge.
Minimum 7.87 7.5 2.6 3000 1700 Maximum 8.47 8.4 2.9 24000 9000 Average 8.16 8.04 2.74 9200 3750
4. Ganga at Danapur near Pipapul
Minimum 7.45 7.9 2.4 2400 1100 Maximum 8.28 8.7 2.8 24000 9000 Average 8.07 8.30 2.58 6100 2590
5. Ganga at Kurji U/S Patna.
Minimum 7.77 7.9 2.4 2400 1300 Maximum 8.38 8.8 2.8 16000 9000 Average 8.05 8.3 2.6 5600 2600
6. Ganga at Darbhanga ghat, Patna.
Minimum 7.68 7.8 2.6 9000 3000 Maximum 8.28 8.7 2.9 24000 16000 Average 7.96 8.2 2.7 20454 7818
7. Ganga at Gaighat D/S Patna.
Minimum 7.58 7.8 2.6 9000 3000 Maximum 8.21 8.7 2.9 24000 9000 Average 7.96 8.2 2.7 14909 5363
8. Ganga at Malsalami, Patna City.
Minimum 7.84 7.8 2.0 2800 1100 Maximum 8.26 8.8 2.8 28000 5000 Average 7.97 8.2 2.5 8038 2200
9. Ganga at Kewalaghat, Fatuha.
Minimum 7.82 7.8 2.4 2200 1100 Maximum 8.26 8.7 2.7 9000 3000 Average 8.02 8.2 2.57 4545 1963
10. Ganga at the Confluence of Sone River at Doriganj, Chapra.
Minimum 7.56 7.8 2.1 2400 170 Maximum 8.36 9.3 2.8 9000 3000 Average 7.99 8.4 2.6 4141 1580
11. Ganga at U/S Mokama
Minimum 7.8 6.8 2.2 2200 1100 Maximum 8.2 8.8 2.7 16000 5000 Average 8.0 8.1 2.5 5260 1950
12. Ganga at D/S Mokama
Minimum 7.8 6.6 2.4 5000 1700 Maximum 8.1 8.6 3.0 24000 9000 Average 7.95 7.9 2.7 18636 6336
13. Ganga at Barh Minimum 7.9 7.8 2.2 1700 700 Maximum 8.1 8.8 2.7 5000 3000 Average 8.05 8.36 2.4 3642 1828
14. Ganga at U/S Munger (Near Intake well of Ganga)
Minimum 7.8 7.6 2.2 2400 1100 Maximum 8.1 8.6 2.7 9000 3000 Average 7.9 8.1 2.4 3960 1590
15. Ganga at D/S Munger.
Minimum 7.8 7.5 2.4 3000 1300 Maximum 8.0 8.5 2.7 9000 5000 Average 7.9 8.06 2.5 4166 2133
16. Ganga at Bhagalpur D/S ( Ganga Bridge)
Minimum 7.8 6.4 2.4 5000 2400 Maximum 7.9 8.4 2.8 24000 9000 Average 7.85 7.8 2.6 9500 4540
17. Ganga at U/S Bhagalpur (Barari ghat)
Minimum 7.8 6.8 2.5 2800 1100 Maximum 8.0 8.5 2.8 16000 5000 Average 7.9 7.9 2.6 5560 2040

73
18. Ganga at Sultanganj ( D/S )
Minimum 7.7 7.8 2.4 2400 800 Maximum 8.0 8.4 2.7 16000 2400 Average 7.9 8.0 2.5 4366 1622
19. Ganga at U/S Sultanganj.
Minimum 7.7 7.8 2.4 2200 900 Maximum 8.1 8.5 2.6 16000 9000 Average 7.9 8.1 2.5 5012 2400
20. Ganga at Barahia.
Minimum 7.9 7.4 2.2 2800 1100 Maximum 8.1 8.4 2.7 24000 5000 Average 8.02 8.0 2.4 8150 2125
21. Ganga at Kahalgaon.
Minimum 7.8 7.5 2.4 3000 1700 Maximum 8.0 8.6 2.9 24000 9000 Average 7.9 8.1 2.7 10909 4200
Water Quality Status of River Ganga during the Year (2013-2014)
Sl.No
Sampling Station
pH
D.O mg/L
B.O.D mg/L
T.C MPN/100 mL
F.C MPN/100 mL
1. Ganga at Buxar (Chausa)
Minimum 7.45 7.8 2.4 2800 1100 Maximum 8.28 8.8 2.6 9000 3000 Average 8.06 8.25 2.5 4978 1833
2. Ganga at Ramrekha ghat Buxar
Minimum 7.58 7.6 2.6 5000 2200 Maximum 8.25 8.7 2.8 24000 9000 Average 8.04 8.04 2.7 13444 4622
3. Ganga at D/S Buxar near Ganga Road Bridge.
Minimum 7.54 7.4 2.4 3000 1100 Maximum 8.27 8.8 2.7 16000 5000 Average 8.03 8.1 2.6 8777 2644
4. Ganga at Danapur near Pipapul
Minimum 7.46 7.3 2.4 3000 1100 Maximum 8.26 9.7 2.7 16000 2200 Average 8.01 8.16 2.56 5272 1645
5. Ganga at Kurji U/S Patna.
Minimum 7.8 7.5 2.3 2200 1100 Maximum 8.28 9.7 2.7 9000 5000 Average 8.08 8.2 2.5 4582 2082
6. Ganga at Darbhanga ghat, Patna.
Minimum 7.76 7.2 2.5 9000 2400 Maximum 8.18 9.2 2.9 24000 9000 Average 7.95 7.92 2.7 18454 6218
7. Ganga at Gaighat D/S Patna.
Minimum 7.71 7.0 2.6 5000 1400 Maximum 8.22 9.3 3.0 24000 9000 Average 7.98 8.0 2.75 14272 4436
8. Ganga at Malsalami, Patna City.
Minimum 7.73 7.5 2.1 2400 800 Maximum 8.34 9.4 2.7 9000 3000 Average 8.01 8.2 2.5 4200 1545
9. Ganga at Kewalaghat, Fatuha.
Minimum 7.63 7.5 2.0 2200 800 Maximum 8.34 9.6 2.7 9000 3000 Average 7.95 8.2 2.5 5140 1710
10. Ganga at the Confluence of Sone River at Doriganj, Chapra.
Minimum 7.8 7.4 2.4 2400 800 Maximum 8.34 9.0 2.6 5000 2400 Average 8.18 8.28 2.5 3400 1362
11. Ganga at U/S Mokama near B.M.P. Camp.
Minimum 7.8 6.1 2.3 2200 1100 Maximum 8.1 8.6 2.6 5000 1700 Average 7.92 7.71 2.46 3127 1390
12. Ganga at D/S Mokama near Rajendra Bridge.
Minimum 7.6 5.9 2.6 5000 1700 Maximum 8.0 8.4 2.9 24000 5000 Average 7.8 7.6 2.78 12545 3918
13. Ganga at Barh Minimum 7.6 5.9 2.2 1700 800 Maximum 8.1 8.6 2.5 3500 1400 Average 7.9 7.7 2.4 2633 1116
14. Ganga at U/S Minimum 7.8 6.1 2.2 1700 700

74
Munger (Near Steamer Ghat.
Maximum 8.1 8.5 2.6 5000 1700 Average 7.9 7.6 2.4 2675 1125
15. Ganga at D/S Munger near Kasth Harni Ghat.
Minimum 7.6 5.8 2.4 2200 1100 Maximum 8.0 7.8 2.7 5000 3000 Average 7.8 7.4 2.5 3745 1554
16. Ganga at Bhagalpur D/S ( Ganga Bridge)
Minimum 7.7 5.9 2.4 3000 1300 Maximum 8.0 8.5 2.8 9000 3000 Average 7.8 7.5 2.6 6500 2392
17. Ganga at U/S Bhagalpur (Barari ghat)
Minimum 7.7 6.0 2.4 2400 800 Maximum 8.0 8.5 2.7 5000 1700 Average 7.9 7.7 2.5 3066 1242
18. Ganga at Sultanganj ( D/S )
Minimum 7.7 5.9 2.4 2200 800 Maximum 8.0 8.5 2.7 5000 1700 Average 7.8 7.5 2.5 3100 1400
19. Ganga at U/S Sultanganj.
Minimum 7.6 6.0 2.3 2200 800 Maximum 8.0 8.6 2.6 3500 2200 Average 7.8 7.7 2.4 2642 1283
20. Ganga at Barahia.
Minimum 7.6 6.0 2.0 2200 800 Maximum 8.1 8.5 2.6 3000 1700 Average 7.88 7.4 2.4 2700 1150
21. Ganga at Kahalgaon near Jahaj ghat.
Minimum 7.8 6.0 2.5 5000 1400 Maximum 8.1 8.6 2.9 9000 3000 Average 7.94 7.7 2.7 7000 2642
Water Quality Status of River Ganga during the Year (2014-2015)
Sl.No
Sampling Station
pH
D.O mg/L
B.O.D mg/L
T.C MPN/100mL
F.C MPN/100mL
1. Ganga at Chausa (Mahdaba Ghat) Buxar
Minimum 7.80 7.8 2.3 2400 800 Maximum 9.27 9.8 2.8 4600 1500 Average 8.45 8.56 2.4 3066 1140
2. Ganga at Ramrekha ghat Buxar
Minimum 7.6 7.6 2.6 9000 500 Maximum 9.28 9.0 2.8 16000 5400 Average 8.40 8.18 2.7 10016 3216
3. Ganga at D/S Buxar near Ganga Bridge.
Minimum 7.6 7.8 2.4 2400 430 Maximum 9.25 9.6 2.7 9200 2400 Average 8.46 8.4 2.5 5016 1805
4. Ganga at Danapur near Pipapul
Minimum 7.78 7.2 2.0 1700 500 Maximum 9.21 9.4 2.6 3500 1700 Average 8.34 8.2 2.2 2545 1070
5. Ganga at U/S Patna, Kurji
Minimum 7.68 7.4 2.0 2200 700 Maximum 9.15 9.3 2.5 5400 2400 Average 8.27 8.1 2.3 3490 1609
6. Ganga at Darbhanga ghat, Patna.
Minimum 7.56 7.1 2.4 16000 5000 Maximum 9.08 8.8 2.9 24000 9200 Average 8.09 7.8 2.7 21090 7254
7. Ganga at D/S Patna, Gaighat
Minimum 7.64 7.0 2.5 9000 1400 Maximum 9.16 9.0 2.8 24000 9000 Average 8.19 7.9 2.6 12563 4200
8. Ganga at Malsalami, Patna City.
Minimum 7.55 7.2 2.2 2200 800 Maximum 9.17 9.3 2.6 16000 3500 Average 8.16 8.05 2.3 5000 1810
9. Ganga at the Confluence of
Minimum 7.80 7.6 2.0 2800 700 Maximum 8.31 8.4 2.7 9200 3500

75
Sone River at Doriganj, Chapra.
Average 8.09 8.04 2.4 4200 1580
10. Ganga at Kewalaghat, Fatuha.
Minimum 7.71 7.0 2.0 2200 800 Maximum 9.11 9.2 2.5 9000 3000 Average 8.18 8.1 2.2 4982 1836
11. Ganga at U/S Mokama near B.M.P. Camp.
Minimum 7.8 7.5 2.0 1700 790 Maximum 8.2 8.6 2.5 5000 2400 Average 8.0 7.9 2.2 2400 1141
12. Ganga at D/S Mokama near Rajendra Bridge.
Minimum 7.7 7.2 2.2 2800 920 Maximum 8.1 8.4 2.8 16000 5000 Average 7.8 7.8 2.5 9430 2742
13. Ganga at Barh Minimum 7.8 7.5 2.0 1400 900 Maximum 8.0 8.0 2.4 3000 1700 Average 7.9 7.7 2.1 2666 1173
14. Ganga at D/S Munger near Kastharani Ghat.
Minimum 7.7 7.4 2.1 2400 1100 Maximum 8.0 8.5 2.5 9000 3000 Average 7.9 7.8 2.3 4612 1712
15. Ganga at U/S Munger near Steamer Ghat
Minimum 7.8 7.6 2.0 1700 790 Maximum 8.0 8.5 2.5 3000 1300 Average 7.9 7.9 2.0 2342 940
16. Ganga at D/S Bhagalpur, near Ganga Bridge.
Minimum 7.6 7.5 2.1 3000 1400 Maximum 8.1 8.4 2.7 24000 9200 Average 7.8 7.8 2.5 9488 3333
17. Ganga at U/S Bhagalpur near Barari Ghat.
Minimum 7.8 7.6 2.0 1700 800 Maximum 8.1 8.5 2.6 5400 2200 Average 7.9 7.9 2.3 2850 1320
18. Ganga at D/S Sultanganj
Minimum 7.6 7.5 2.0 2200 940 Maximum 7.9 8.2 2.7 5400 2400 Average 7.8 7.8 2.4 4162 1655
19. Ganga at U/S Sultanganj.
Minimum 7.8 7.5 2.0 2400 790 Maximum 8.0 8.5 2.6 3500 1700 Average 7.9 7.9 2.2 2971 1197
20. Ganga at Barahiaya.
Minimum 7.7 6.9 2.0 1700 700 Maximum 8.1 8.6 2.6 3500 1400 Average 7.9 7.7 2.2 2712 1073
21. Ganga at Kahalgaon near Jahaj Ghat.
Minimum 7.8 7.6 2.4 5000 1300 Maximum 8.2 8.6 2.8 16000 5000 Average 7.9 7.9 2.6 8511 2522
Water Quality Status of River Ganga during the Year (2015-2016)
Sl.No
Sampling Station
pH
D.O mg/L
B.O.D mg/L
T.C MPN/100mL
F.C MPN/100mL
1. Ganga at Chausa (Mahdaba Ghat) Buxar
Minimum 7.76 7.9 2.2 3000 1100 Maximum 8.54 10.2 2.5 9000 1700 Average 8.24 8.7 2.38 4000 1625
2. Ganga at Ramrekha ghat Buxar
Minimum 8.0 7.7 2.7 9000 3000 Maximum 8.61 9.8 2.9 24000 9000 Average 8.24 8.5 2.8 14375 4750
3. Ganga at D/S Buxar near Ganga Bridge.
Minimum 7.99 7.8 2.5 5000 1300 Maximum 8.54 9.8 2.7 16000 5000 Average 8.20 8.47 2.6 8375 2375
4. Ganga at Danapur near
Minimum 7.52 7.6 2.0 1700 700 Maximum 9.15 8.8 2.5 5000 1700

76
Pipapul Average 8.49 8.24 2.24 2527 1072 5. Ganga at U/S
Patna, Kurji Minimum 7.86 7.4 2.0 2200 800 Maximum 9.06 8.6 2.6 9000 3000 Average 8.51 8.25 2.35 3500 1509
6. Ganga at Darbhanga ghat, Patna.
Minimum 7.61 7.4 2.7 9000 2800 Maximum 8.78 8.4 3.0 24000 16000 Average 8.28 7.8 2.8 22636 9709
7. Ganga at D/S Patna, Gaighat
Minimum 7.89 6.9 2.6 5000 1700 Maximum 8.86 8.6 2.8 24000 9000 Average 8.46 7.9 2.7 15545 4400
8. Ganga at Malsalami, Patna City.
Minimum 7.80 7.4 2.0 2400 800 Maximum 9.16 8.5 2.7 9000 3000 Average 8.36 7.9 2.4 4181 1618
9. Ganga at the Confluence of Sone River at Doriganj, Chapra.
Minimum 7.93 7.9 2.2 1100 500 Maximum 8.49 8.7 2.8 9000 3000 Average 8.30 8.32 2.5 3828 1357
10. Ganga at Kewalaghat, Fatuha.
Minimum 7.66 7.0 2.1 2400 800 Maximum 8.87 8.6 2.6 16000 5000 Average 8.49 7.9 2.4 4618 1754
11. Ganga at U/S Mokama near B.M.P. Camp.
Minimum 7.7 7.0 2.0 1700 800 Maximum 8.6 9.8 2.5 5000 1700 Average 8.0 7.9 2.25 2754 1136
12. Ganga at D/S Mokama near Rajendra Bridge.
Minimum 7.6 7.5 2.5 1700 800 Maximum 8.0 9.6 2.8 24000 9000 Average 7.8 7.9 2.7 9154 3190
13. Ganga at Barh Minimum 7.9 7.8 2.0 1300 700 Maximum 8.1 9.8 2.6 9000 1700 Average 8.03 8.07 2.3 3380 1160
14. Ganga at D/S Munger near Kastharani Ghat.
Minimum 7.6 7.5 2.2 1700 500 Maximum 8.0 9.7 2.7 16000 5000 Average 7.84 8.07 2.5 4590 1582
15. Ganga at U/S Munger near Steamer Ghat
Minimum 7.8 7.6 2.0 1300 500 Maximum 8.0 9.8 2.4 5000 1700 Average 7.9 8.17 2.15 2990 1010
16.
Ganga at D/S Bhagalpur, near Ganga Bridge.
Minimum 7.5 7.5 2.4 2400 800 Maximum 8.1 9.4 2.7 16000 5000 Average 7.85 8.05 2.57 8127 2518
17. Ganga at U/S Bhagalpur near Barari Ghat.
Minimum 7.8 7.6 2.0 1700 800 Maximum 8.1 9.6 2.5 9000 2400 Average 7.9 8.17 2.3 3518 1390
18. Ganga at D/S Sultanganj
Minimum 7.6 7.5 2.4 2200 900 Maximum 8.0 9.4 2.6 9000 3000 Average 7.8 8.08 2.5 4318 1481
19. Ganga at U/S Sultanganj.
Minimum 7.7 7.6 2.0 110 500 Maximum 8.1 9.6 2.6 5000 1400 Average 7.9 8.14 2.2 2309 863
20. Ganga at Barahiaya.
Minimum 7.8 7.7 1.8 1700 700 Maximum 8.0 8.2 2.5 3000 1700 Average 7.9 8.0 2.15 2600 1066
21. Ganga at Kahalgaon near Jahaj Ghat.
Minimum 7.9 7.6 2.0 3000 1300 Maximum 8.1 9.6 2.8 16000 5000 Average 8.01 8.2 2.5 6900 2260

77
Water Quality Status of River Ganga during the Year (2016-2017)
Sl.No
Sampling Station
pH
D.O mg/L
B.O.D mg/L
T.C MPN/100mL
F.C MPN/100mL
1. Ganga at Chausa (Mahdaba Ghat) Buxar
Minimum 7.46 6.0 1.3 2600 900 Maximum 8.33 9.2 2.9 5000 2600 Average 7.88 7.29 2.31 3550 1520
2. Ganga at Ramrekha ghat Buxar
Minimum 7.36 5.5 0.8 3000 1100 Maximum 8.30 9.1 2.7 5000 2600 Average 7.71 7.9 2.4 3850 1770
3. Ganga at D/S Buxar near Ganga Bridge.
Minimum 7.49 5.2 0.5 3000 400 Maximum 8.27 9.0 2.9 5000 2600 Average 7.78 8.05 2.35 3430 1420
4. Ganga at Danapur near Pipapul
Minimum 7.14 2.6 1.7 2200 700 Maximum 8.38 9.2 4.5 8000 2200 Average 7.78 7.38 2.7 3808 1600
5. Ganga at U/S Patna, Kurji
Minimum 7.24 3.5 1.8 3000 1300 Maximum 8.46 9.0 4.5 4800 2600 Average 7.8 7.52 2.7 3630 1723
6. Ganga at Darbhanga ghat, Patna.
Minimum 7.14 3.4 2.2 3000 900 Maximum 8.84 9.2 7.2 4800 2300 Average 7.75 7.4 3.0 3715 1761
7. Ganga at D/S Patna, Gaighat
Minimum 7.22 3.5 2.3 2200 800 Maximum 8.60 8.7 2.8 5000 2300 Average 7.73 7.4 2.7 3723 1800
8. Ganga at Malsalami, Patna City.
Minimum 7.29 3.5 2.2 3100 1200 Maximum 8.48 9.0 7.2 5000 3100 Average 7.74 7.5 2.9 4021 1764
9. Ganga at Kewalaghat, Fatuha.
Minimum 7.23 3.5 2.0 2800 900 Maximum 8.35 9.2 4.5 5000 2600 Average 7.76 7.32 2.7 3842 1700
10. Ganga at the Confluence of Sone River at Doriganj, Chapra.
Minimum 7.65 7.0 1.7 2100 1100 Maximum 8.4 9.6 2.8 4800 1800 Average 7.89 8.2 2.4 3183 1475
11. Ganga at U/S Mokama.
Minimum 7.9 7.6 1.0 2200 800 Maximum 8.1 9.2 2.8 5000 2200 Average 8.0 8.0 2.3 3100 1333
12. Ganga at D/S Mokama near Rajendra Bridge (Simaria Ghat)
Minimum 7.46 6.2 2.1 2400 900 Maximum 8.0 8.9 4.1 5000 2200 Average 7.84 7.76 2.6 3633 1508
13. Ganga at Barh Minimum 7.8 7.6 1.1 2600 1100 Maximum 8.1 9.3 2.9 5000 2700 Average 7.9 8.05 2.4 3891 1816
14. Ganga at D/S Munger near Kastharani Ghat.
Minimum 7.6 6.4 2.1 3000 1100 Maximum 7.9 9.0 7.4 8000 2600 Average 7.7 7.7 3.2 4535 1721
15. Ganga at U/S Munger near Steamer Ghat
Minimum 7.8 7.1 2.0 3000 700 Maximum 8.1 9.2 7.2 5000 2300 Average 7.9 7.9 3.2 3777 1677
16.
Ganga at D/S Bhagalpur, near Ganga Bridge.
Minimum 7.6 6.8 1.9 3800 800 Maximum 7.9 9.1 7.4 5000 2600 Average 7.8 7.7 2.9 4371 1900
17. Ganga at U/S Bhagalpur near
Minimum 7.8 7.1 1.8 2800 900 Maximum 8.0 9.2 7.2 8000 2300

78
Barari Ghat. Average 7.9 7.9 3.0 4228 1864 18. Ganga at D/S
Sultanganj Minimum 7.6 6.5 2.1 3000 1100 Maximum 8.0 9.1 2.8 9000 3000 Average 7.75 7.70 2.5 5125 2166
19. Ganga at U/S Sultanganj.
Minimum 7.7 7.1 1.6 2200 900 Maximum 8.1 9.2 2.9 5500 3000 Average 7.9 8.0 2.5 4291 1716
20. Ganga at Barahiaya.
Minimum 7.49 6.5 1.7 3000 1300 Maximum 8.1 9.2 4.2 5000 2200 Average 7.9 7.9 2.6 3966 1866
21. Ganga at Kahalgaon near Jahaj Ghat.
Minimum 7.8 7.2 1.8 3000 900 Maximum 8.1 9.3 2.8 4700 2700 Average 7.95 8.05 2.7 3658 1691
Water Quality Status of River Ganga during the Year(2017-2018) Excluding Rainy Season (August to October)
Sl.No
Sampling Station
pH
D.O mg/L
B.O.D mg/L
T.C MPN/100mL
F.C MPN/100mL
1. Ganga at Chausa D/S Karmnasa confluence canal Gate, Buxar
Minimum 7.81 7.6 1.5 5800 2600 Maximum 8.62 10.1 2.4 32000 21000 Average 8.19 8.74 1.87 14,244 8555
2. Ganga at Ramrekha ghat Buxar
Minimum 7.82 7.4 2.0 5800 2600 Maximum 8.34 9.6 2.4 32000 21000 Average 8.03 8.38 2.18 13744 7700
3. Ganga at D/S Buxar near Road Bridge Dist - Buxar.
Minimum 7.63 7.2 2.1 5800 2600 Maximum 8.27 9.3 2.6 24000 14000 Average 7.99 8.36 2.4 11077 5477
4. Ganga River at Jail Ghat, Buxar
Minimum 7.67 7.9 2.0 6300 2600 Maximum 8.31 10.0 2.7 40000 27000 Average 7.94 8.7 2.4 16720 9860
5. Ganga at Ara-Chhapra Road Bridge koelwar-Barhara Road, Dist.-Bhojpur.
Minimum 7.44 7.5 1.4 3100 1700 Maximum 8.42 9.8 2.2 4600 2300 Average 8.1 8.6 1.9 3577 1944
6. Ganga River at water intnke point Mauzampur Block, Barhara, Dist.-Bhojpur, Area
Minimum 7.42 8.3 1.4 2100 1700 Maximum 8.07 10.5 1.8 3900 1700 Average 7.76 9.4 1.5 3175 1700
7. Ganga at Danapur near Pipapul Dist.- Patna
Minimum 7.18 7.3 1.7 4100 1700 Maximum 8.55 14.1 2.6 11000 4000 Average 8.03 9.27 1.9 6544 2866
8. Ganga at U/S Patna, Kurji Dist.- Patna
Minimum 7.46 7.2 1.9 4700 2200 Maximum 8.43 13.2 2.6 22000 13000 Average 7.99 8.7 2.1 10077 5000
9. Ganga River at
Gulabi Ghat, Patna.
Minimum 7.1 7.4 2.5 11000 4000 Maximum 7.82 13.0 2.8 92000 26000 Average 7.6 9.1 2.6 34000 13020
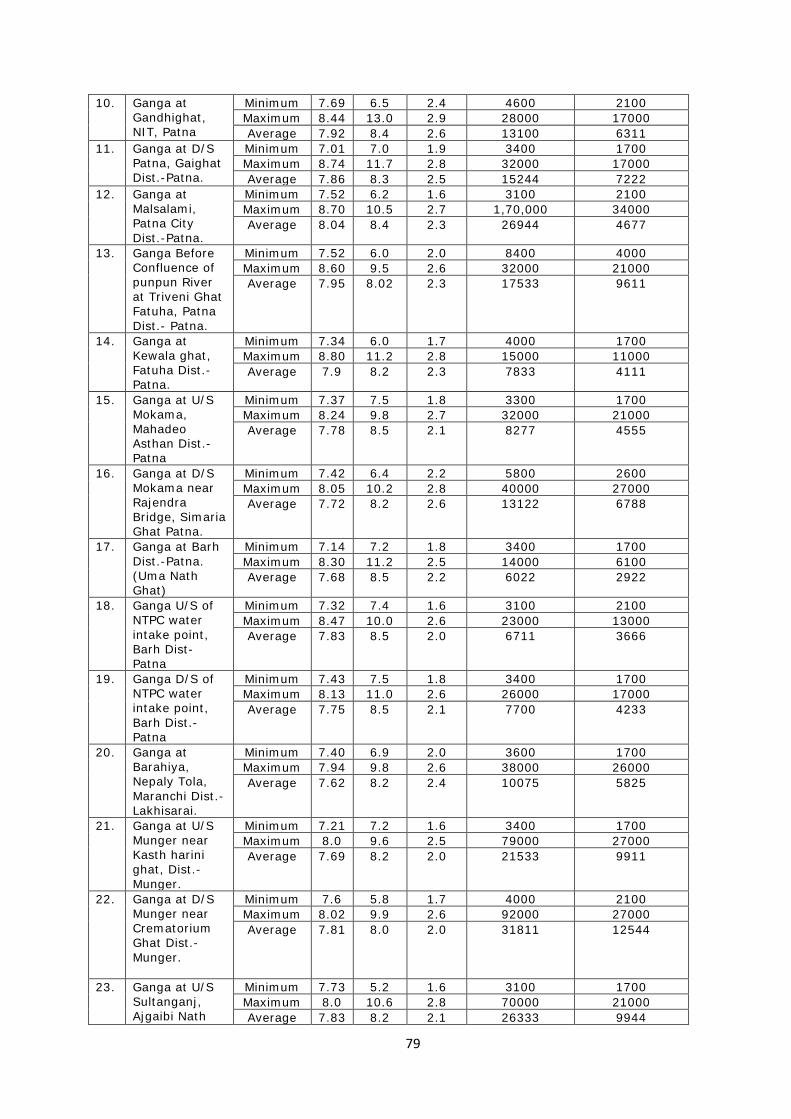
79
10. Ganga at Gandhighat, NIT, Patna
Minimum 7.69 6.5 2.4 4600 2100 Maximum 8.44 13.0 2.9 28000 17000 Average 7.92 8.4 2.6 13100 6311
11. Ganga at D/S Patna, Gaighat Dist.-Patna.
Minimum 7.01 7.0 1.9 3400 1700 Maximum 8.74 11.7 2.8 32000 17000 Average 7.86 8.3 2.5 15244 7222
12. Ganga at Malsalami, Patna City Dist.-Patna.
Minimum 7.52 6.2 1.6 3100 2100 Maximum 8.70 10.5 2.7 1,70,000 34000 Average 8.04 8.4 2.3 26944 4677
13. Ganga Before Confluence of punpun River at Triveni Ghat Fatuha, Patna Dist.- Patna.
Minimum 7.52 6.0 2.0 8400 4000 Maximum 8.60 9.5 2.6 32000 21000 Average 7.95 8.02 2.3 17533 9611
14. Ganga at Kewala ghat, Fatuha Dist.-Patna.
Minimum 7.34 6.0 1.7 4000 1700 Maximum 8.80 11.2 2.8 15000 11000 Average 7.9 8.2 2.3 7833 4111
15. Ganga at U/S Mokama, Mahadeo Asthan Dist.-Patna
Minimum 7.37 7.5 1.8 3300 1700 Maximum 8.24 9.8 2.7 32000 21000 Average 7.78 8.5 2.1 8277 4555
16.
Ganga at D/S Mokama near Rajendra Bridge, Simaria Ghat Patna.
Minimum 7.42 6.4 2.2 5800 2600 Maximum 8.05 10.2 2.8 40000 27000 Average 7.72 8.2 2.6 13122 6788
17. Ganga at Barh Dist.-Patna. (Uma Nath Ghat)
Minimum 7.14 7.2 1.8 3400 1700 Maximum 8.30 11.2 2.5 14000 6100 Average 7.68 8.5 2.2 6022 2922
18. Ganga U/S of NTPC water intake point, Barh Dist- Patna
Minimum 7.32 7.4 1.6 3100 2100 Maximum 8.47 10.0 2.6 23000 13000 Average 7.83 8.5 2.0 6711 3666
19. Ganga D/S of NTPC water intake point, Barh Dist.-Patna
Minimum 7.43 7.5 1.8 3400 1700 Maximum 8.13 11.0 2.6 26000 17000 Average 7.75 8.5 2.1 7700 4233
20. Ganga at Barahiya, Nepaly Tola, Maranchi Dist.- Lakhisarai.
Minimum 7.40 6.9 2.0 3600 1700 Maximum 7.94 9.8 2.6 38000 26000 Average 7.62 8.2 2.4 10075 5825
21. Ganga at U/S Munger near Kasth harini ghat, Dist.- Munger.
Minimum 7.21 7.2 1.6 3400 1700 Maximum 8.0 9.6 2.5 79000 27000 Average 7.69 8.2 2.0 21533 9911
22. Ganga at D/S Munger near Crematorium Ghat Dist.- Munger.
Minimum 7.6 5.8 1.7 4000 2100 Maximum 8.02 9.9 2.6 92000 27000 Average 7.81 8.0 2.0 31811 12544
23. Ganga at U/S Sultanganj, Ajgaibi Nath
Minimum 7.73 5.2 1.6 3100 1700 Maximum 8.0 10.6 2.8 70000 21000 Average 7.83 8.2 2.1 26333 9944

80
Dist.- Bhagalpur
24. Ganga at D/S Sultanganj at Cremation ghat Dist.-Bhagalpur.
Minimum 7.43 5.0 1.9 4000 1700 Maximum 8.32 9.9 2.9 92000 27000 Average 7.79 8.0 2.4 33000 13877
25. Ganga River at Champa Nagar Bhagalpur, Dist.- Bhagalpur.
Minimum 7.56 5.9 1.5 6300 2600 Maximum 8.13 11.1 2.8 170000 110000 Average 7.87 8.3 2.0 55900 28385
26. Ganga at U/S Bhagalpur near Bararighat Dist.- Bhagalpur
Minimum 7.15 6.0 2.2 3100 2100 Maximum 8.0 9.1 2.8 79000 27000 Average 7.54 7.4 2.5 25411 9600
27. D/S Ganga at Bhagalpur opposite-Kuppa ghat Dist.- Bhagalpur.
Minimum 7.43 6.6 1.5 4000 2100 Maximum 8.15 10.6 2.7 79000 27000 Average 7.79 8.4 2.3 25888 10222
28. Ganga at Kahalgaon near Jahajghat, Dist.- Bhagalpur
Minimum 7.57 6.6 1.8 3600 1700 Maximum 8.05 9.5 2.6 1,10,000 22000 Average 7.89 8.0 2.1 32,100 10111
29. Ganga at Kahalgaon near Cremation Ghat.
Minimum 7.53 6.1 2.1 3800 2200 Maximum 7.91 8.8 2.6 130000 79000 Average 7.75 7.3 2.3 46257 20171
30. Ganga at the Confluece of Sone River at Doriganj, Chapra Dist.- Saran
Minimum 7.01 7.7 1.5 3100 1700 Maximum 8.07 10.6 2.6 15000 7000 Average 7.73 8.6 1.9 5700 2833
31. Ganga River near Maa Ambika Sthan,Aami,Dist.-Saran
Minimum 6.97 7.9 1.6 14000 6100 Maximum 8.26 10.7 2.8 70000 27000 Average 7.61 9.2 2.4 30800 13620
Water Quality Status of River Ganga and its Tributaries during the
Year (2018-2019) Excluding Rainy Season(August to October)
Sl. No.
Sampling Point pH D.O. B.O.D. T.C. F.C.
mg/L mg/L MPN/100ml MPN/100ml
1 Ganga at Chausa karmnasa D/S Confluence , Buxar
Minimum 7.25 7.4 1.5 6300 2600
Maximum 8.23 9.8 2.3 29000 21000
Average 7.82 8.55 1.77 13787 8600
2 Ganga at Ramrekha ghat, Buxar. Dist. - Buxar
Minimum 7.47 7.2 1.7 7000 3300
Maximum 8.20 9.6 2.8 35000 17000
Average 7.85 8.16 2.28 16500 6925

81
3 Ganga at D/S Buxar near Road Bridge. Dist. - Buxar
Minimum 7.22 7.0 1.7 7000 3100
Maximum 8.21 9.6 2.6 15000 7900
Average 7.86 8.17 2.18 11700 6087
4 Ganga River at Jail Ghat, Buxar Minimum 7.18 7.2 1.7 7000 3100
Maximum 8.29 9.5 2.5 29000 21000
Average 7.79 8.3 2.06 14175 8312
5 Ganga at Ara - Chhapra Near Road Bridge Ara, Dist. Bhojpur.
Minimum 7.30 7.7 1.5 3800 1700
Maximum 7.94 9.1 2.0 4600 2100
Average 7.63 8.4 1.71 4228 1971
6 Ganga River at water intake point Mauzampur Block, Barhara, Dist-Bhojpur, Area
Minimum 7.35 7.8 1.4 3300 1700
Maximum 8.03 9.2 1.9 4700 2200
Average 7.72 8.55 1.58 4142 2014
7 Ganga at Danapur near Pipapul. Dist. - Patna
Minimum 7.44 7.5 1.3 5500 2600
Maximum 8.30 9.4 2.4 15000 7000
Average 7.74 8.35 1.8 8355 4077
8 Ganga at U/S Patna, Kurji.Dist. - Patna
Minimum 7.21 7.2 1.5 5800 2600
Maximum 8.20 9.5 2.5 14000 7900
Average 7.72 8.18 1.94 8922 4288
9 Ganga River at Gulabi Ghat, Patna
Minimum 7.31 6.7 2.2 6800 3100
Maximum 8.25 8.5 2.7 29000 21000
Average 7.80 7.8 2.51 15088 7955
10 Ganga at Gandhighat, NIT, Patna
Minimum 7.08 7.0 1.9 11000 4000
Maximum 8.21 8.8 2.6 35000 26000
Average 7.72 7.90 2.33 21222 10244
11 Ganga at D/S Patna, Gaighat Dist. Patna.
Minimum 7.42 6.6. 2.0 11000 4000
Maximum 8.20 8.8 2.8 29000 21000
Average
7.79 7.9 2.36 18666 11700
12 Ganga at Malsalami, Patna City Dist. - Patna
Minimum 6.9 7.2 1.5 5500 2600
Maximum 8.23 9.5 2.4 7000 3600
Average 7.64 8.28 1.53 6433 3044
13 Ganga Before Confluence of Punpun River at Trveni Ghat Fatuha, Patna Dist. - Patna.
Minimum 6.34 7.0 1.7 14000 6100
Maximum 8.16 9.5 2.5 35000 21000
Average 7.54 8.05 1.94 20222 10022
14 Ganga at Kewala ghat, Fatuha Dist.- Patna
Minimum 6.40 6.6 2.2 6100 2600
Maximum 8.13 8.5 2.7 7000 4500
Average 7.39 7.5 2.44 6588 3211
15 Ganga at Kachchi Dargah-Bidupur Road Bridge, Dist-Patna
Minimum 7.10 7.4 1.2 5500 2600
Maximum 8.21 9.6 2.2 7000 3600
Average 7.74 8.5 1.7 6222 3011
16 Ganga at Bakhtiyarpur-Tajpur Road Bridge near Athamalgola,
Minimum 6.35 7.3 1.3 5500 2600
Maximum 8.15 10.0 2.5 7000 4600

82
Dist-Patna Average 7.63 8.57 1.9 6557 3257
17 Ganga at U/S Mokama, Mahadeo Asthan Dist.- Patna.
Minimum 7.09 7.4 1.9 7000 3100
Maximum 8.36 9.4 2.4 15000 7000
Average 7.68 8.11 2.11 10575 5275
18 Ganga at D/S Mokama near Rajendra Bridge, Simaria Ghat Patna
Minimum 7.28 7.0 2.4 14000 6100
Maximum 8.40 8.0 2.6 32000 21000
Average 7.68 7.54 2.52 22571 13171
19 Ganga at Umanath Ghat Barh Dist.- Patna
Minimum 7.13 7.0 1.6 6300 3100
Maximum 8.40 9.8 2.4 13000 7900
Average 7.58 8.25 1.94 8900 3971
20 Ganga U/S of NTPC Water intake Point, Barh Dist.- Patna
Minimum 6.92 7.2 1.7 5500 2600
Maximum 8.28 9.6 2.5 11000 4500
Average 7.63 8.2 2.0 7228 3428
21 Ganga D/S of NTPC Water intake Point, Barh Dist.- Patna
Minimum 6.98 7.0 1.8 7000 3100
Maximum 8.37 9.3 2.5 13000 7900
Average 7.65 8.08 2.08 10714 4857
22 Ganga at Barahiya, Nepaly Tola, Maranchi Dist. - Lakhisarai
Minimum 7.29 7.2 1.4 11000 4000
Maximum 8.39 9.1 2.3 14000 12000
Average 7.83 8.1 1.9 11857 5871
23 Ganga at U/S Munger near Kasth harini ghat. Dist.- Munger
Minimum 6.76 7.0 1.5 6300 2600
Maximum 8.09 10.2 2.4 32000 21000
Average 7.75 8.55 2.06 16787 8900 24 Ganga at D/S Munger near
Crematorium Ghat Dist. - Munger
Minimum 6.87 7.4 1.7 7000 3800
Maximum 8.16 10.1 2.6 35000 21000
Average 7.81 8.46 2.32 19875 11375
25 Ganga at U/S Sultanganj, Ajgaibi Nath Dist.- Bhagalpur
Minimum 6.96 7.4 1.5 7000 3800
Maximum 8..18 10.0 2.3 29000 21000
Average 7.82 8.45 1.97 15950 9800
26 Ganga at D/S Sultanganj at Cremation ghat Dist.- Bhagalpur
Minimum 7.05 6.9 1.8 7000 3800
Maximum 8.20 9.8 2.8 32000 21000
Average 7.88 8.21 2.32 19000 10362
27 Ganga River at Champa Nagar, Bhagalpur. Dist.- Bhagalpur
Minimum 7.02 7.6 1.5 9300 4000
Maximum 8.13 9.7 2.3 22000 11000
Average 7.76 8.75 1.82 13228 6657
28 Ganga at D/S Bhagalpur near Bararighat. Dist.- Bhagalpur
Minimum 7.29 7.3 2.0 7000 3800
Maximum 8.17 8.5 2.7 29000 21000
Average 7.78 7.92 2.3 19000 11975
29 U/S Ganga at Bhagalpur kuppa ghat Dist.- Bhagalpur
Minimum 7.05 7.5 1.4 6300 2600
Maximum 8.08 9.0 2.4 32000 21000
Average 7.65 8.25 1.88 15112 8487
30 Ganga at Kahalgaon near Jahajghat. Dist.- Bhagalpur
Minimum 7.17 7.7 1.6 7000 3800
Maximum 8.05 9.5 2.2 22000 11000
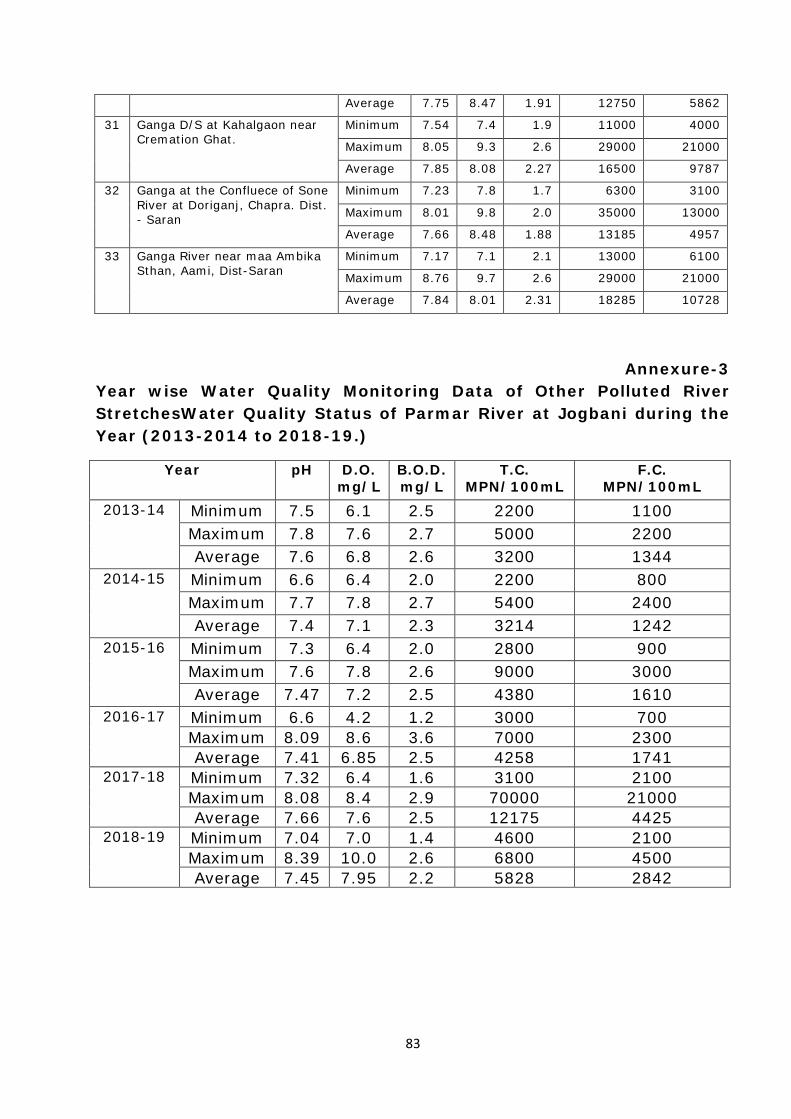
83
Average 7.75 8.47 1.91 12750 5862
31 Ganga D/S at Kahalgaon near Cremation Ghat.
Minimum 7.54 7.4 1.9 11000 4000
Maximum 8.05 9.3 2.6 29000 21000
Average 7.85 8.08 2.27 16500 9787
32 Ganga at the Confluece of Sone River at Doriganj, Chapra. Dist. - Saran
Minimum 7.23 7.8 1.7 6300 3100
Maximum 8.01 9.8 2.0 35000 13000
Average 7.66 8.48 1.88 13185 4957
33 Ganga River near maa Ambika Sthan, Aami, Dist-Saran
Minimum 7.17 7.1 2.1 13000 6100
Maximum 8.76 9.7 2.6 29000 21000
Average 7.84 8.01 2.31 18285 10728
Annexure-3 Year wise Water Quality Monitoring Data of Other Polluted River StretchesWater Quality Status of Parmar River at Jogbani during the Year (2013-2014 to 2018-19.)
Year
pH
D.O. mg/L
B.O.D. mg/L
T.C. MPN/100mL
F.C. MPN/100mL
2013-14 Minimum 7.5 6.1 2.5 2200 1100 Maximum 7.8 7.6 2.7 5000 2200 Average 7.6 6.8 2.6 3200 1344
2014-15 Minimum 6.6 6.4 2.0 2200 800 Maximum 7.7 7.8 2.7 5400 2400 Average 7.4 7.1 2.3 3214 1242
2015-16 Minimum 7.3 6.4 2.0 2800 900 Maximum 7.6 7.8 2.6 9000 3000 Average 7.47 7.2 2.5 4380 1610
2016-17 Minimum 6.6 4.2 1.2 3000 700 Maximum 8.09 8.6 3.6 7000 2300 Average 7.41 6.85 2.5 4258 1741
2017-18 Minimum 7.32 6.4 1.6 3100 2100 Maximum 8.08 8.4 2.9 70000 21000 Average 7.66 7.6 2.5 12175 4425
2018-19 Minimum 7.04 7.0 1.4 4600 2100 Maximum 8.39 10.0 2.6 6800 4500 Average 7.45 7.95 2.2 5828 2842

84
Water Quality Status of Sirsia River at Raxaul (Near Custom Office) during the Year (2013-2014 to 2018-19.)
Year
pH
D.O. mg/L
B.O.D. mg/L
T.C. MPN/100mL
F.C. MPN/100mL
2013-14 Minimum 7.68 0.0 2.9 16000 3000 Maximum 8.10 6.0 15 24000 9000 Average 7.69 4.2 7.0 17600 5400
2014-15 Minimum 6.88 0.0 3.0 16000 5000 Maximum 7.66 4.8 14.0 24000 5000 Average 7.33 4.1 10.0 18666 5000
2015-16 Minimum 7.16 0.0 1.8 9000 500 Maximum 8.24 8.2 18 24000 3000 Average 7.84 4.51 6.98 16285 1757
2016-17 Minimum 6.99 Nil 7.0 4100 2000 Maximum 7.79 2.5 12.0 9000 5000 Average 7.35 0.20 9.03 6425 3075
2017-18 Minimum 6.90 0.0 8.0 5600 2600 Maximum 8.01 2.1 15.0 15000 7000 Average 7.36 0.26 11.6 7912 3537
2018-19 Minimum 6.89 0.0 6.0 7000 3100 Maximum 7.47 0.0 14.0 29000 21000 Average 7.20 0.0 10.25 14875 8625
Water Quality Status of Sirsia River, Koriya Tola at Raxaul during the Year (2013-2014 to 2018-19.)
Year
pH
D.O. mg/L
B.O.D. mg/L
T.C. MPN/100mL
F.C. MPN/100mL
2013-14 Minimum 7.05 0.0 2.9 16000 2400 Maximum 8.10 6.2 16 24000 9000 Average 7.68 4.2 7.3 17600 4880
2014-15 Minimum 6.98 0.0 2.8 9000 2400 Maximum 7.56 5.0 16.0 16000 3000 Average 7.32 2.8 7.6 11400 2800
2015-16 Minimum 7.19 0.0 2.0 16000 5000 Maximum 8.86 7.6 20 24000 9000 Average 8.03 4.27 7.8 19428 7285
2016-17 Minimum 7.16 Nil 5.5 4000 1900 Maximum 7.73 2.8 12.0 9000 7000 Average 7.34 0.23 8.6 6041 3075
2017-18 Minimum 6.93 0.0 8.0 7000 3100 Maximum 7.87 3.8 11.0 22000 11000 Average 7.39 0.8 9.0 11375 5212
2018-19 Minimum 6.95 0.0 8.0 15000 6100 Maximum 7.57 0.0 12.0 32000 21000 Average 7.20 0.0 9.25 22750 13887
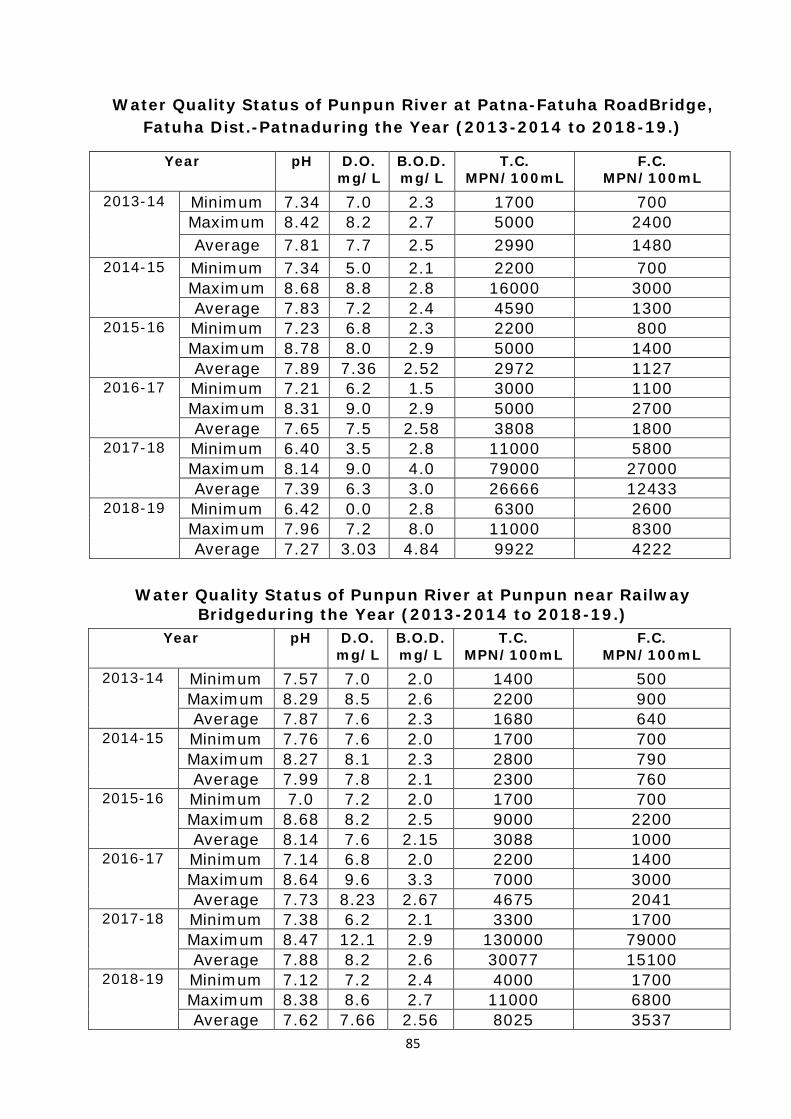
85
Water Quality Status of Punpun River at Patna-Fatuha RoadBridge, Fatuha Dist.-Patnaduring the Year (2013-2014 to 2018-19.)
Year
pH
D.O. mg/L
B.O.D. mg/L
T.C. MPN/100mL
F.C. MPN/100mL
2013-14 Minimum 7.34 7.0 2.3 1700 700 Maximum 8.42 8.2 2.7 5000 2400 Average 7.81 7.7 2.5 2990 1480
2014-15 Minimum 7.34 5.0 2.1 2200 700 Maximum 8.68 8.8 2.8 16000 3000 Average 7.83 7.2 2.4 4590 1300
2015-16 Minimum 7.23 6.8 2.3 2200 800 Maximum 8.78 8.0 2.9 5000 1400 Average 7.89 7.36 2.52 2972 1127
2016-17 Minimum 7.21 6.2 1.5 3000 1100 Maximum 8.31 9.0 2.9 5000 2700 Average 7.65 7.5 2.58 3808 1800
2017-18 Minimum 6.40 3.5 2.8 11000 5800 Maximum 8.14 9.0 4.0 79000 27000 Average 7.39 6.3 3.0 26666 12433
2018-19 Minimum 6.42 0.0 2.8 6300 2600 Maximum 7.96 7.2 8.0 11000 8300 Average 7.27 3.03 4.84 9922 4222
Water Quality Status of Punpun River at Punpun near Railway
Bridgeduring the Year (2013-2014 to 2018-19.) Year
pH
D.O. mg/L
B.O.D. mg/L
T.C. MPN/100mL
F.C. MPN/100mL
2013-14 Minimum 7.57 7.0 2.0 1400 500 Maximum 8.29 8.5 2.6 2200 900 Average 7.87 7.6 2.3 1680 640
2014-15 Minimum 7.76 7.6 2.0 1700 700 Maximum 8.27 8.1 2.3 2800 790 Average 7.99 7.8 2.1 2300 760
2015-16 Minimum 7.0 7.2 2.0 1700 700 Maximum 8.68 8.2 2.5 9000 2200 Average 8.14 7.6 2.15 3088 1000
2016-17 Minimum 7.14 6.8 2.0 2200 1400 Maximum 8.64 9.6 3.3 7000 3000 Average 7.73 8.23 2.67 4675 2041
2017-18 Minimum 7.38 6.2 2.1 3300 1700 Maximum 8.47 12.1 2.9 130000 79000 Average 7.88 8.2 2.6 30077 15100
2018-19 Minimum 7.12 7.2 2.4 4000 1700 Maximum 8.38 8.6 2.7 11000 6800 Average 7.62 7.66 2.56 8025 3537
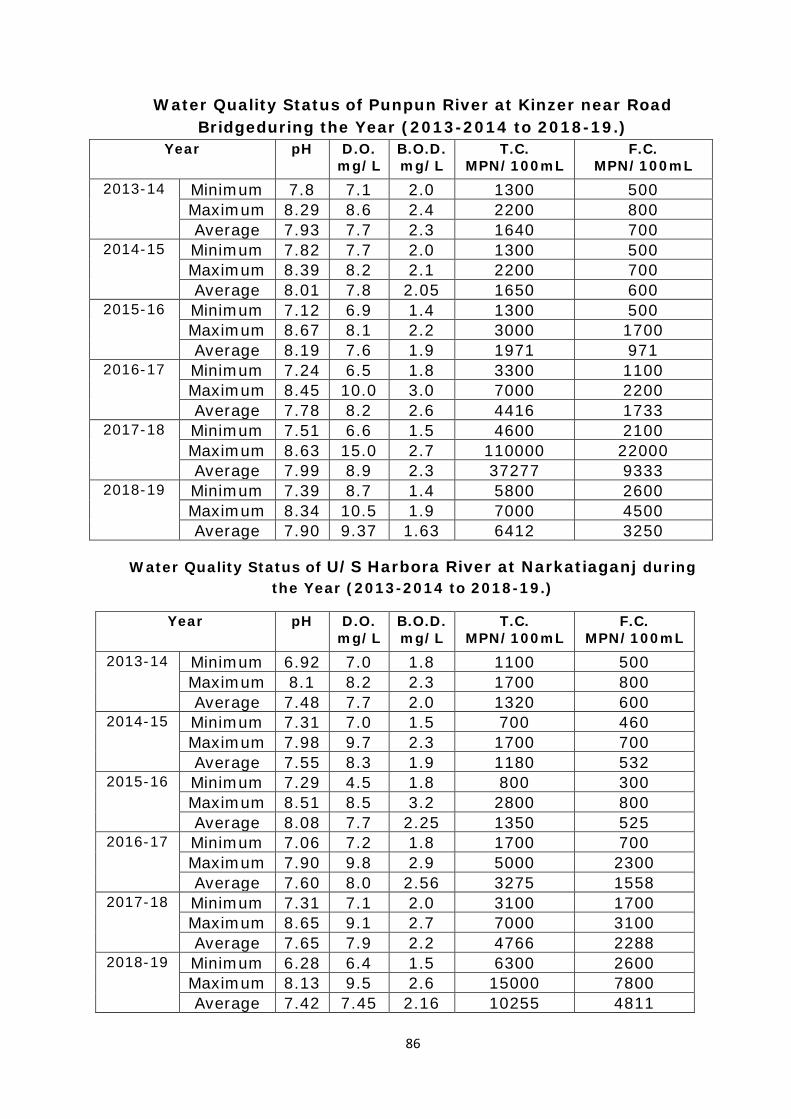
86
Water Quality Status of Punpun River at Kinzer near Road Bridgeduring the Year (2013-2014 to 2018-19.)
Year
pH
D.O. mg/L
B.O.D. mg/L
T.C. MPN/100mL
F.C. MPN/100mL
2013-14 Minimum 7.8 7.1 2.0 1300 500 Maximum 8.29 8.6 2.4 2200 800 Average 7.93 7.7 2.3 1640 700
2014-15 Minimum 7.82 7.7 2.0 1300 500 Maximum 8.39 8.2 2.1 2200 700 Average 8.01 7.8 2.05 1650 600
2015-16 Minimum 7.12 6.9 1.4 1300 500 Maximum 8.67 8.1 2.2 3000 1700 Average 8.19 7.6 1.9 1971 971
2016-17 Minimum 7.24 6.5 1.8 3300 1100 Maximum 8.45 10.0 3.0 7000 2200 Average 7.78 8.2 2.6 4416 1733
2017-18 Minimum 7.51 6.6 1.5 4600 2100 Maximum 8.63 15.0 2.7 110000 22000 Average 7.99 8.9 2.3 37277 9333
2018-19 Minimum 7.39 8.7 1.4 5800 2600 Maximum 8.34 10.5 1.9 7000 4500 Average 7.90 9.37 1.63 6412 3250
Water Quality Status of U/S Harbora River at Narkatiaganj during
the Year (2013-2014 to 2018-19.)
Year
pH
D.O. mg/L
B.O.D. mg/L
T.C. MPN/100mL
F.C. MPN/100mL
2013-14 Minimum 6.92 7.0 1.8 1100 500 Maximum 8.1 8.2 2.3 1700 800 Average 7.48 7.7 2.0 1320 600
2014-15 Minimum 7.31 7.0 1.5 700 460 Maximum 7.98 9.7 2.3 1700 700 Average 7.55 8.3 1.9 1180 532
2015-16 Minimum 7.29 4.5 1.8 800 300 Maximum 8.51 8.5 3.2 2800 800 Average 8.08 7.7 2.25 1350 525
2016-17 Minimum 7.06 7.2 1.8 1700 700 Maximum 7.90 9.8 2.9 5000 2300 Average 7.60 8.0 2.56 3275 1558
2017-18 Minimum 7.31 7.1 2.0 3100 1700 Maximum 8.65 9.1 2.7 7000 3100 Average 7.65 7.9 2.2 4766 2288
2018-19 Minimum 6.28 6.4 1.5 6300 2600 Maximum 8.13 9.5 2.6 15000 7800 Average 7.42 7.45 2.16 10255 4811
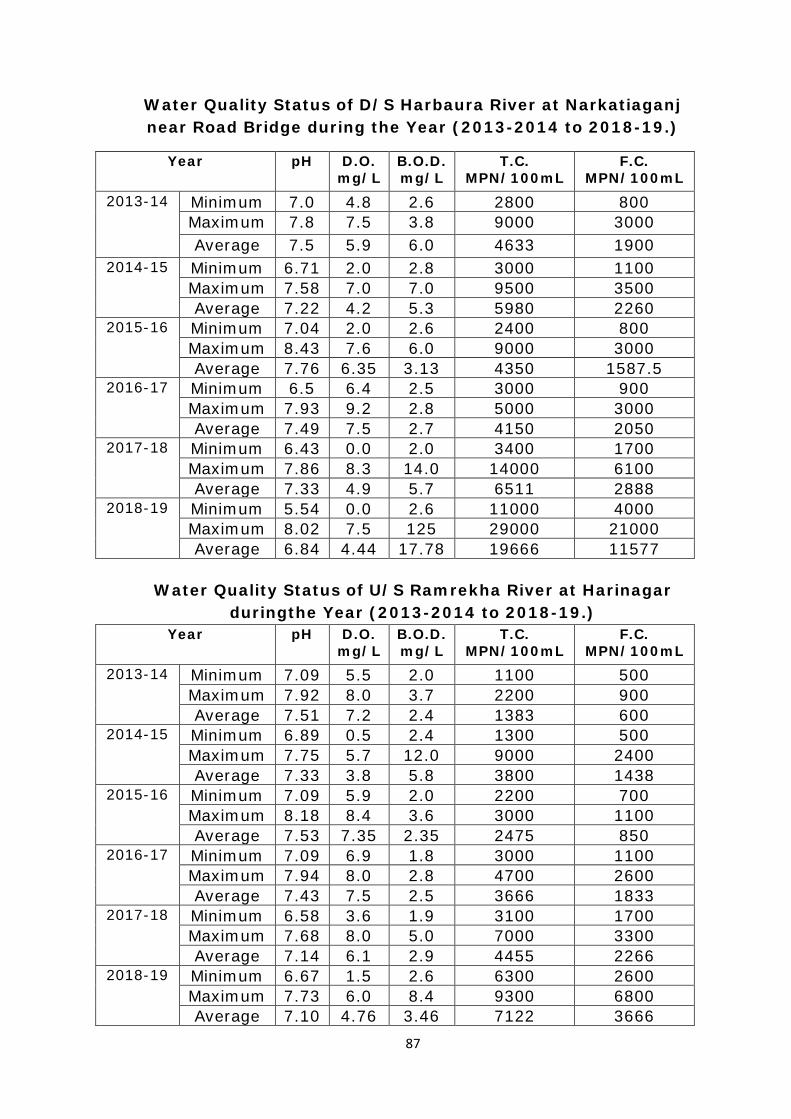
87
Water Quality Status of D/S Harbaura River at Narkatiaganj near Road Bridge during the Year (2013-2014 to 2018-19.)
Year
pH
D.O. mg/L
B.O.D. mg/L
T.C. MPN/100mL
F.C. MPN/100mL
2013-14 Minimum 7.0 4.8 2.6 2800 800 Maximum 7.8 7.5 3.8 9000 3000 Average 7.5 5.9 6.0 4633 1900
2014-15 Minimum 6.71 2.0 2.8 3000 1100 Maximum 7.58 7.0 7.0 9500 3500 Average 7.22 4.2 5.3 5980 2260
2015-16 Minimum 7.04 2.0 2.6 2400 800 Maximum 8.43 7.6 6.0 9000 3000 Average 7.76 6.35 3.13 4350 1587.5
2016-17 Minimum 6.5 6.4 2.5 3000 900 Maximum 7.93 9.2 2.8 5000 3000 Average 7.49 7.5 2.7 4150 2050
2017-18 Minimum 6.43 0.0 2.0 3400 1700 Maximum 7.86 8.3 14.0 14000 6100 Average 7.33 4.9 5.7 6511 2888
2018-19 Minimum 5.54 0.0 2.6 11000 4000 Maximum 8.02 7.5 125 29000 21000 Average 6.84 4.44 17.78 19666 11577
Water Quality Status of U/S Ramrekha River at Harinagar
duringthe Year (2013-2014 to 2018-19.) Year
pH
D.O. mg/L
B.O.D. mg/L
T.C. MPN/100mL
F.C. MPN/100mL
2013-14 Minimum 7.09 5.5 2.0 1100 500 Maximum 7.92 8.0 3.7 2200 900 Average 7.51 7.2 2.4 1383 600
2014-15 Minimum 6.89 0.5 2.4 1300 500 Maximum 7.75 5.7 12.0 9000 2400 Average 7.33 3.8 5.8 3800 1438
2015-16 Minimum 7.09 5.9 2.0 2200 700 Maximum 8.18 8.4 3.6 3000 1100 Average 7.53 7.35 2.35 2475 850
2016-17 Minimum 7.09 6.9 1.8 3000 1100 Maximum 7.94 8.0 2.8 4700 2600 Average 7.43 7.5 2.5 3666 1833
2017-18 Minimum 6.58 3.6 1.9 3100 1700 Maximum 7.68 8.0 5.0 7000 3300 Average 7.14 6.1 2.9 4455 2266
2018-19 Minimum 6.67 1.5 2.6 6300 2600 Maximum 7.73 6.0 8.4 9300 6800 Average 7.10 4.76 3.46 7122 3666

88
Water Quality Status of D/S Ramrekha River at Harinagar duringthe Year (2013-2014 to 2018-19.)
Year
pH
D.O. mg/L
B.O.D. mg/L
T.C. MPN/100mL
F.C. MPN/100mL
2013-14 Minimum 6.80 0.0 2.7 5000 1300 Maximum 8.12 7.3 12 24000 5000 Average 7.34 4.15 6.0 10666 3100
2014-15 Minimum 6.51 0.0 2.9 9200 3000 Maximum 7.46 6.7 10.0 24000 9000 Average 6.85 2.8 7.6 16240 5180
2015-16 Minimum 6.88 2.0 2.5 5000 1700 Maximum 8.43 7.5 6.4 16000 5000 Average 7.57 6.28 3.1 9250 3025
2016-17 Minimum 6.9 6.4 2.0 3000 900 Maximum 7.85 7.6 2.8 5000 2300 Average 7.40 7.05 2.6 4216 1866
2017-18 Minimum 6.59 3.0 2.7 3400 1700 Maximum 7.78 7.3 5.0 11000 4000 Average 7.08 5.6 3.3 5500 2522
2018-19 Minimum 6.09 0.0 2.9 7000 3100 Maximum 7.71 5.0 12.0 14000 12000 Average 6.85 3.63 4.26 10333 5677
Water Quality Status of Sikrahna River at Chanpatia Road
Bridgeduring the Year (2013-2014 to 2018-19.)
Year
pH
D.O. mg/L
B.O.D. mg/L
T.C. MPN/100mL
F.C. MPN/100mL
2013-14 Minimum 6.90 1.0 2.3 2400 800 Maximum 7.83 7.9 16 3000 1300 Average 7.42 6.0 3.68 2720 1120
2014-15 Minimum 7.06 1.8 2.5 5000 1100 Maximum 7.70 8.5 15.0 24000 9000 Average 7.40 4.4 6.9 11366 3866
2015-16 Minimum 7.56 2.7 2.4 3000 1100 Maximum 8.26 8.6 2.8 5000 1700 Average 7.99 6.95 2.56 3300 1325
2016-17 Minimum 7.25 3.5 2.0 3000 800 Maximum 7.98 8.6 4.5 5000 2600 Average 7.61 6.89 2.76 4058 1783
2017-18 Minimum 7.18 0.0 2.0 3100 1700 Maximum 8.14 8.4 10.0 14000 6100 Average 7.58 6.7 3.3 6437 2987
2018-19 Minimum 6.90 0.0 2.5 6300 1700 Maximum 7.69 8.1 95 14000 7900 Average 7.29 5.48 13.0 10066 4455

89
Water Quality Status of Sikrahna River at Lalparsa,Sugauli- Raxual Road Bridge during the Year (2013-2014 to 2018-19.)
Year
pH
D.O. mg/L
B.O.D. mg/L
T.C. MPN/100mL
F.C. MPN/100mL
201314 Minimum 7.6 6.8 2.3 2200 800 Maximum 7.86 8.0 2.6 2800 1100 Average 7.73 7.6 2.4 2480 980
2014-15 Minimum 7.36 2.7 2.3 2800 1100 Maximum 7.86 9.5 6.6 9500 3500 Average 7.56 6.4 3.4 5675 2025
2015-16 Minimum 7.68 6.2 2.1 2200 800 Maximum 8.44 8.5 2.7 28000 1400 Average 8.04 8.0 2.38 5962 1100
2016-17 Minimum 7.23 4.8 2.1 3200 1300 Maximum 8.46 8.6 2.8 8000 3300 Average 7.71 7.45 2.57 5125 2166
2017-18 Minimum 7.19 0.8 2.0 3100 2100 Maximum 8.21 8.1 6.0 14000 11000 Average 7.59 6.8 2.8 9437 4525
2018-19 Minimum 6.69 2.5 1.8 6300 2600 Maximum 8.16 9.0 4.0 15000 7000 Average 7.66 6.65 2.65 10733 4588
Water Quality Status of Sikrahna River at Lauriya-Harinagar Road Bridge during the Year (2013-2014 to 2018-19.)
Year
pH
D.O. mg/L
B.O.D. mg/L
T.C. MPN/100mL
F.C. MPN/100mL
2013-14 Minimum 6.63 0.0 2.4 2200 800 Maximum 7.80 8.0 110 16000 5000 Average 7.28 4.36 38 7366 2033
2014-15 Minimum 6.76 0.0 2.0 1700 800 Maximum 8.48 7.2 30.0 16000 5000 Average 7.38 5.1 9.8 6600 2088
2015-16 Minimum 6.89 6.0 2.0 2200 800 Maximum 8.33 8.6 2.7 5000 2400 Average 7.76 7.51 2.35 3587 1500
2016-17 Minimum 7.23 4.6 2.1 3000 800 Maximum 7.77 8.5 3.0 5000 2700 Average 7.57 7.56 2.7 4200 1841
2017-18 Minimum 5.81 0.0 2.0 4400 2100 Maximum 8.03 9.2 14.8 11000 4000 Average 7.48 6.8 3.8 6600 2888
2018-19 Minimum 5.62 0.0 1.8 7000 3800 Maximum 8.14 9.0 95 29000 21000 Average 7.33 6.15 13.68 13666 5444

90
Annexure-4
MONITORING REPORTS OF INDIVIDUAL DRAINS
DRAIN MONITORING FORMAT (Raxaul)
Date and Time of Sampling: 27/11/2018 Temp.: 22/210C Time: 5.30 PM
1 Name of the Drain Drain at Naga Road, Shivpuri Mohalla, Raxaul
2 Meeting Sirsiya River At right bank along the flow
3 Name of Regional Office of SPCB Muzaffarpur R.O.
4 Source of Pollution Load Domestic waste water
5 If Industrial / Mixed (Please indicate type of sector)
N.A.
6 Traceable length of drain (in Km) before meeting Ganga (through Google earth/Map)
0.5 Km approx.
7 Catchment Area Raxaul Main Road Market, Naga Road, Ward No. 11, 12, 20, 21, 22
8
Co-ordinate of the confluence Point (if not reachable indirect through google earth/map) (Decimal Units)
Latitude 26.978563
Longitude 84.854459
Distance of the sampling point from confluence point (may the find out over google earth / map), KM
0.03 Km approx.
9
Co-ordinate of the Sampling Point (Decimal Units)
Latitude 25.978734
Longitude 84.854484
10 Landmarks / Address of the Location Naga Road
11 Flow if in MLD, if zero indicate whether dry or stagnant
7.45 AM 2.00 PM 5.10 PM Average Flow 8.3 MLD 3.63 MLD 6.17 MLD 6.03 MLD
12 Observations
(General Parameters) SL. No.
Parameters Standards Results
1 pH 6.5-9.0 7.04
2 BOD (mg/l)
20 for Patna & 30 for other places
62
3 COD (mg/l) - 232
4 TSS (mg/l)
<50 for Patna &<100 for other places
38
5 TDS ((mg/l) - 410 6 TC (MPN/100 ml) - 14*105 7 FC (MPN/100 ml) <1000 79*104

91
DRAIN MONITORING FORMAT (Raxaul)
Date and Time of Sampling: 17.11.2018 Temp.: 22/200C Time: 4.50 PM
1 Name of the Drain Drain at ChhatiayaGhat, near Railway Bridge, Raxaul
2 Meeting Sirsiya River At right bank along the flow
3 Name of Regional Office of SPCB Muzaffarpur R.O.
4 Source of Pollution Load Domestic waste water
5 If Industrial / Mixed (Please indicate type of sector)
N.A.
6 Traceable length of drain (in Km) before meeting Ganga (through Google earth/Map)
0.5 Km approx.
7 Catchment Area Ward NO. 6, 9, 10, 11, 12, 13, 14, 15, Railway Colony
8
Co-ordinate of the confluence Point (if not reachable indirect through google earth/map) (Decimal Units)
Latitude 26.983423
Longitude 84.857462
Distance of the sampling point from confluence point (may the find out over google earth / map), KM
0.02 Km Apporx.
9
Co-ordinate of the Sampling Point (Decimal Units)
Latitude 26.983490
Longitude 84.857309
10 Landmarks / Address of the Location ChhathiyaGhat, near Railway Bridge
11 Flow if in MLD, if zero indicate whether dry or stagnant
8.15 AM 1.30 PM 4.40 PM Average Flow 3.43 MLD 2.6 MLD 3.27 MLD 3.1 MLD
12 Observations
(General Parameters) SL. No.
Parameters Standards Results
1 pH 6.5-9.0 7.25
2 BOD (mg/l)
20 for Patna & 30 for other places
9.0
3 COD (mg/l) - 44.0
4 TSS (mg/l)
<50 for Patna &<100 for other places
36
5 TDS ((mg/l) - 356 6 TC (MPN/100 ml) - 17*105 7 FC (MPN/100 ml) <1000 11*105
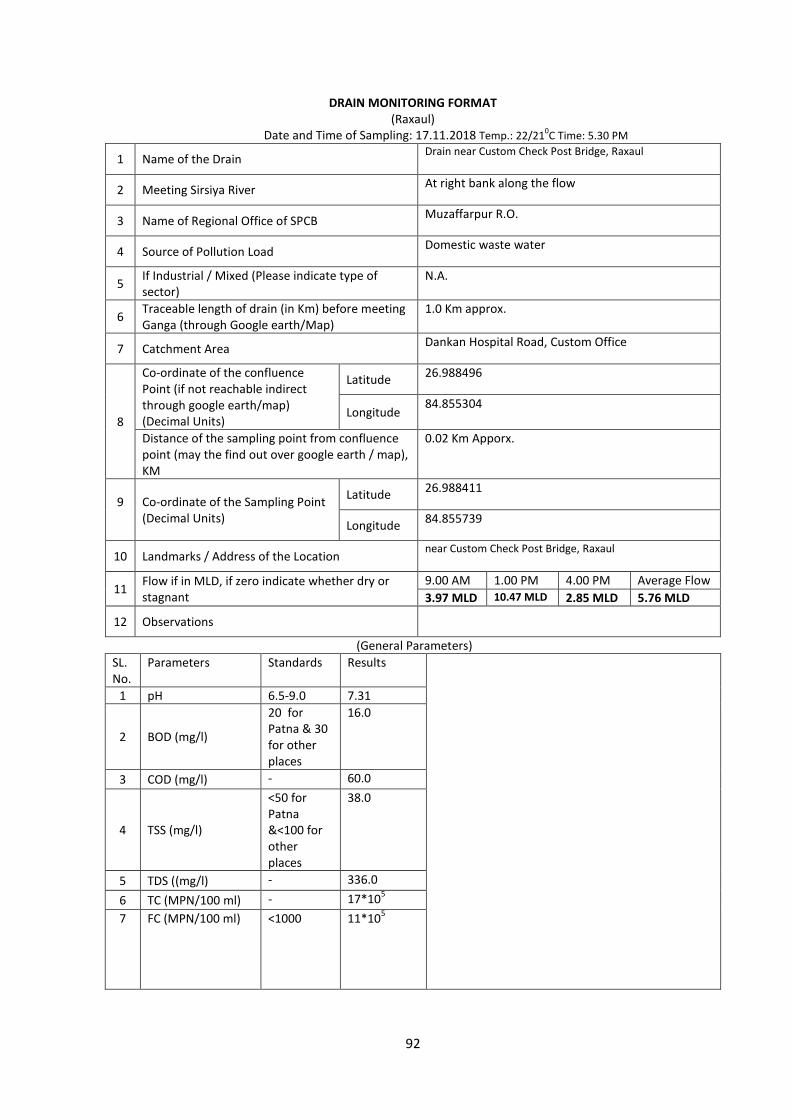
92
DRAIN MONITORING FORMAT (Raxaul)
Date and Time of Sampling: 17.11.2018 Temp.: 22/210C Time: 5.30 PM
1 Name of the Drain Drain near Custom Check Post Bridge, Raxaul
2 Meeting Sirsiya River At right bank along the flow
3 Name of Regional Office of SPCB Muzaffarpur R.O.
4 Source of Pollution Load Domestic waste water
5 If Industrial / Mixed (Please indicate type of sector)
N.A.
6 Traceable length of drain (in Km) before meeting Ganga (through Google earth/Map)
1.0 Km approx.
7 Catchment Area Dankan Hospital Road, Custom Office
8
Co-ordinate of the confluence Point (if not reachable indirect through google earth/map) (Decimal Units)
Latitude 26.988496
Longitude 84.855304
Distance of the sampling point from confluence point (may the find out over google earth / map), KM
0.02 Km Apporx.
9
Co-ordinate of the Sampling Point (Decimal Units)
Latitude 26.988411
Longitude 84.855739
10 Landmarks / Address of the Location near Custom Check Post Bridge, Raxaul
11 Flow if in MLD, if zero indicate whether dry or stagnant
9.00 AM 1.00 PM 4.00 PM Average Flow 3.97 MLD 10.47 MLD 2.85 MLD 5.76 MLD
12 Observations
(General Parameters) SL. No.
Parameters Standards Results
1 pH 6.5-9.0 7.31
2 BOD (mg/l)
20 for Patna & 30 for other places
16.0
3 COD (mg/l) - 60.0
4 TSS (mg/l)
<50 for Patna &<100 for other places
38.0
5 TDS ((mg/l) - 336.0 6 TC (MPN/100 ml) - 17*105 7 FC (MPN/100 ml) <1000 11*105

93
DRAIN MONITORING FORMAT (Narkatiyaganj)
Date ofSampling :27.11.2018, (Temp. in oC Air - 24/Waste Water - 20) Time 6.45 PM
1 Name of the Drain Domestic Waste Water/Sewage Drain, passing near power grid of Sugar Mill, Narkatiyaganj
2 Meeting River Ganga/Tributaries/Other Meeting to Harbaura River
3 Name of Regional Office of SPCB Muzaffarpur
4 Source of Pollution Load Domestic Sewage
5 If Industrial / Mixed (Please indicate type of sector)
N.A
6 Traceable length of drain (in Km) before meeting Ganga/Tributaries/Other (through Google earth/Map)
0.148 Km approx.
7 Catchment Area Shanti Nagar
8
Co-ordinate of the confluence Point (if not reachable indirect through google earth/map) (Decimal Units)
Latitude 27.1154261
Longitude 84.4598725
Distance of the sampling point from confluence point (may the find out over google earth / map), KM
0.073 Km approx.
9
Co-ordinate of the Sampling Point (Decimal Units)
Latitude 27.1552067
Longitude 84.4603519
10 Landmarks / Address of the Location Sugar Mill
11 Average flow if in MLD, if zero indicate whether dry or stagnant
7-9 AM 1-2 PM 4-6 PM
Average Flow
8.640 6.393 5.175 6.736
12 Observations Confluence in Harbaura River at Narkatiaganj
(General Parameters) SL. No.
Parameters Results
1 pH 6.59 2 BOD (mg/l) 22 3 COD (mg/l) 80 4 TSS (mg/l) 53 5 TDS ((mg/l) 831 6 TC (MPN/100 ml) 92X105
7 FC (MPN/100 ml) 54X105

94
DRAIN MONITORING FORMAT (Narkatiyaganj)
Date ofSampling :27.11.2018, (Temp. in oC Air - 24/Waste Water - 18) Time 7.00 PM
1 Name of the Drain Dhum Nagar Mandir Drain, Narkatiyaganj
2 Meeting River Ganga/Tributaries/Other Meeting to Harbaura River
3 Name of Regional Office of SPCB Muzaffarpur
4 Source of Pollution Load Domestic Sewage
5 If Industrial / Mixed (Please indicate type of sector)
NA
6 Traceable length of drain (in Km) before meeting Ganga/Tributaries/Other (through Google earth/Map)
0.617 Km approx.
7 Catchment Area Railway, Kusthashram
8
Co-ordinate of the confluence Point (if not reachable indirect through google earth/map) (Decimal Units)
Latitude 27.1062219
Longitude 84.4551662
Distance of the sampling point from confluence point (may the find out over google earth / map), KM
0.040 Km approx.
9
Co-ordinate of the Sampling Point (Decimal Units)
Latitude 27.1061822
Longitude 84.4555129
10 Landmarks / Address of the Location Railway line
11 Average flow if in MLD, if zero indicate whether dry or stagnant
7-9 AM 1-2 PM 4-6 PM
Average Flow
5.356 3.801 3.490 4.215
12 Observations Confluence in Harbaura River at Narkatiaganj
(General Parameters) SL. No.
Parameters Results
1 pH 6.59 2 BOD (mg/l) 38 3 COD (mg/l) 148 4 TSS (mg/l) 78 5 TDS ((mg/l) 1106 6 TC (MPN/100 ml) 17X105
7 FC (MPN/100 ml) 11X105

95
DRAIN MONITORING FORMAT (Narkatiyaganj)
Date ofSampling :27.11.2018, (Temp. in oC Air - 23/Waste Water - 17) Time 7.15 PM
1 Name of the Drain Nehar, Near Hardiya, Narkatiyaganj
2 Meeting River Ganga/Tributaries/Other No Meeting to any river
3 Name of Regional Office of SPCB Muzaffarpur
4 Source of Pollution Load Domestic Sewage
5 If Industrial / Mixed (Please indicate type of sector)
NA
6 Traceable length of drain (in Km) before meeting Ganga/Tributaries/Other (through Google earth/Map)
16 Km approx.
7 Catchment Area Prakash Nagar, Hardiya
8
Co-ordinate of the confluence Point (if not reachable indirect through google earth/map) (Decimal Units)
Latitude 27.1057850
Longitude 84.4571430
Distance of the sampling point from confluence point (may the find out over google earth / map), KM
0.565 Km approx.
9
Co-ordinate of the Sampling Point (Decimal Units)
Latitude 27.0968594
Longitude 84.4588666
10 Landmarks / Address of the Location ManavSevaSansthan
11 Average flow if in MLD, if zero indicate whether dry or stagnant
7-9 AM 1-2 PM 4-6 PM Average Flow
3.991 3.715 3.214 3.640
12 Observations Low Lying Area and Found Dry after 3.5 KM
(General Parameters) SL. No.
Parameters Results
1 pH 6.62 2 BOD (mg/l) 24 3 COD (mg/l) 84 4 TSS (mg/l) 26 5 TDS ((mg/l) 358 6 TC (MPN/100 ml) 14X105
7 FC (MPN/100 ml) 79X104

96
DRAIN MONITORING FORMAT (Ramnagar)
Date ofSampling :28.11.2018, (Temp. in oC Air - 22/Waste Water - 18) Time 6.00 PM
1 Name of the Drain Mukhya Bazar, Near Fish Market, Nagar Panchyat Road, Harinagar, Ramnagar
2 Meeting River Ganga/Tributaries/Other Meeting to Ramrekha River
3 Name of Regional Office of SPCB Muzaffarpur
4 Source of Pollution Load Domestic Sewage
5 If Industrial / Mixed (Please indicate type of sector)
NA
6 Traceable length of drain (in Km) before meeting Ganga/Tributaries/Other (through Google earth/Map)
0.235 Km approx.
7 Catchment Area Fish marker, Nagar Panchayat Road
8
Co-ordinate of the confluence Point (if not reachable indirect through google earth/map) (Decimal Units)
Latitude 27.1649890
Longitude 84.3265244
Distance of the sampling point from confluence point (may the find out over google earth / map), KM
0.144 Km approx.
9
Co-ordinate of the Sampling Point (Decimal Units)
Latitude 27.1651730
Longitude 84.3274743
10 Landmarks / Address of the Location Near Nagar Panchayat Office
11 Average flow if in MLD, if zero indicate whether dry or stagnant
7-9 AM 1-2 PM 4-6 PM Average Flow 12.441 11.923 7.862 10.743
12 Observations Confluence in Ramrekha River Hari Nagar
(General Parameters) SL. No.
Parameters Results
1 pH 6.08 2 BOD (mg/l) 115 3 COD (mg/l) 372 4 TSS (mg/l) 54 5 TDS ((mg/l) 672 6 TC (MPN/100 ml) 92X105
7 FC (MPN/100 ml) 54X105

97
DRAIN MONITORING FORMAT (Ramnagar)
Date ofSampling :28.11.2018, (Temp. in oC Air - 23/Waste Water - 18) Time 6.15 PM
1 Name of the Drain ChatiyaGhat Drain West, DhangalToli, Harinagar, Ramnagar
2 Meeting River Ganga/Tributaries/Other Meeting to Ramrekha River
3 Name of Regional Office of SPCB Muzaffarpur
4 Source of Pollution Load Domestic Sewage
5 If Industrial / Mixed (Please indicate type of sector)
NA
6 Traceable length of drain (in Km) before meeting Ganga/Tributaries/Other (through Google earth/Map)
0.310 Km approx.
7 Catchment Area Bazar, DhangalToli
8
Co-ordinate of the confluence Point (if not reachable indirect through google earth/map) (Decimal Units)
Latitude 27.1634385
Longitude 84.3289190
Distance of the sampling point from confluence point (may the find out over google earth / map), KM
0.028 Km approx.
9
Co-ordinate of the Sampling Point (Decimal Units)
Latitude 27.1634167
Longitude 84.3294229
10 Landmarks / Address of the Location Meghwal Ram Nagar Road
11 Average flow if in MLD, if zero indicate whether dry or stagnant
7-9 AM 1-2 PM 4-6 PM Average Flow 13.132 12.182 9.849 11.721
12 Observations Confluence in Ramrekha River Hari Nagar
(General Parameters) SL. No.
Parameters Results
1 pH 6.34 2 BOD (mg/l) 135 3 COD (mg/l) 520 4 TSS (mg/l) 60 5 TDS ((mg/l) 730 6 TC (MPN/100 ml) 17X105
7 FC (MPN/100 ml) 11X105
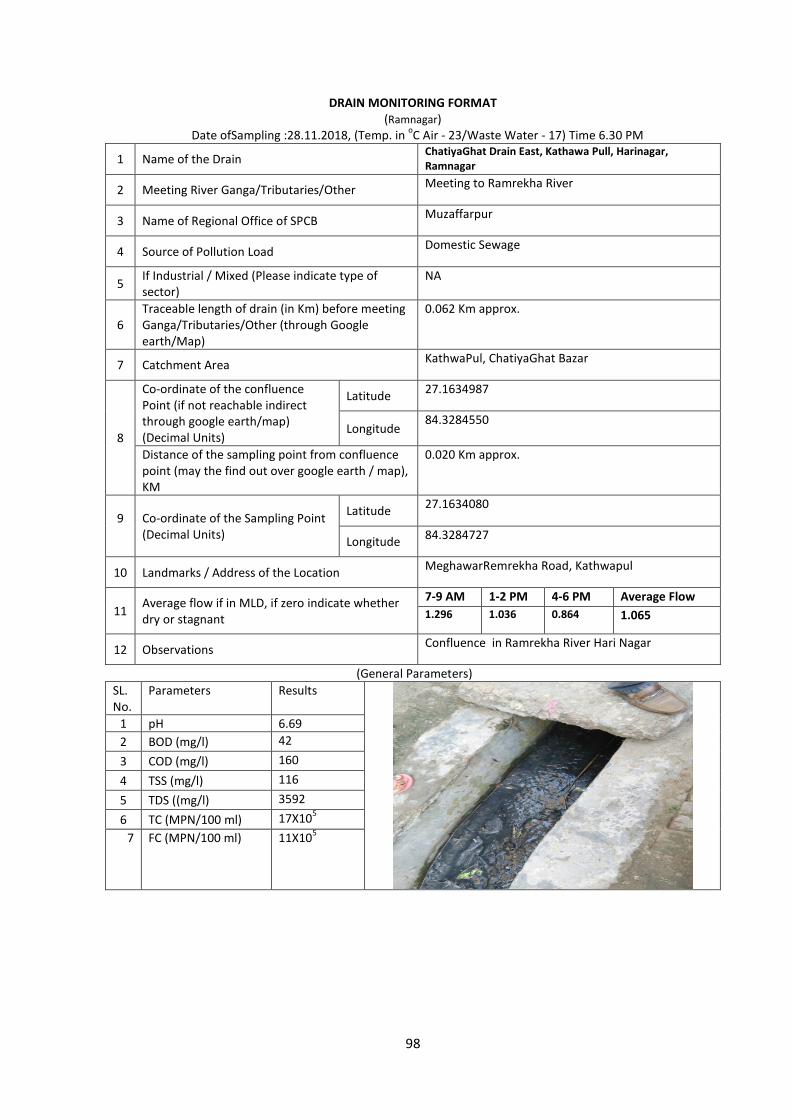
98
DRAIN MONITORING FORMAT (Ramnagar)
Date ofSampling :28.11.2018, (Temp. in oC Air - 23/Waste Water - 17) Time 6.30 PM
1 Name of the Drain ChatiyaGhat Drain East, Kathawa Pull, Harinagar, Ramnagar
2 Meeting River Ganga/Tributaries/Other Meeting to Ramrekha River
3 Name of Regional Office of SPCB Muzaffarpur
4 Source of Pollution Load Domestic Sewage
5 If Industrial / Mixed (Please indicate type of sector)
NA
6 Traceable length of drain (in Km) before meeting Ganga/Tributaries/Other (through Google earth/Map)
0.062 Km approx.
7 Catchment Area KathwaPul, ChatiyaGhat Bazar
8
Co-ordinate of the confluence Point (if not reachable indirect through google earth/map) (Decimal Units)
Latitude 27.1634987
Longitude 84.3284550
Distance of the sampling point from confluence point (may the find out over google earth / map), KM
0.020 Km approx.
9
Co-ordinate of the Sampling Point (Decimal Units)
Latitude 27.1634080
Longitude 84.3284727
10 Landmarks / Address of the Location MeghawarRemrekha Road, Kathwapul
11 Average flow if in MLD, if zero indicate whether dry or stagnant
7-9 AM 1-2 PM 4-6 PM Average Flow 1.296 1.036 0.864 1.065
12 Observations Confluence in Ramrekha River Hari Nagar
(General Parameters) SL. No.
Parameters Results
1 pH 6.69 2 BOD (mg/l) 42 3 COD (mg/l) 160 4 TSS (mg/l) 116 5 TDS ((mg/l) 3592 6 TC (MPN/100 ml) 17X105
7 FC (MPN/100 ml) 11X105
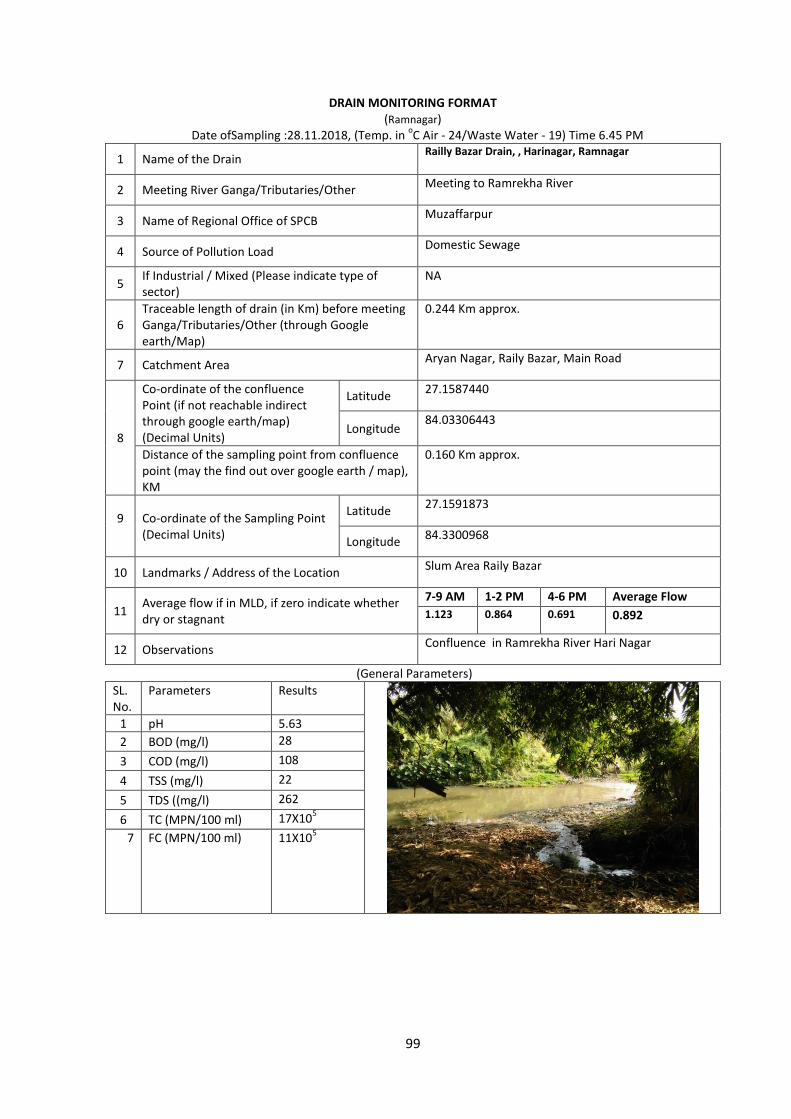
99
DRAIN MONITORING FORMAT (Ramnagar)
Date ofSampling :28.11.2018, (Temp. in oC Air - 24/Waste Water - 19) Time 6.45 PM
1 Name of the Drain Railly Bazar Drain, , Harinagar, Ramnagar
2 Meeting River Ganga/Tributaries/Other Meeting to Ramrekha River
3 Name of Regional Office of SPCB Muzaffarpur
4 Source of Pollution Load Domestic Sewage
5 If Industrial / Mixed (Please indicate type of sector)
NA
6 Traceable length of drain (in Km) before meeting Ganga/Tributaries/Other (through Google earth/Map)
0.244 Km approx.
7 Catchment Area Aryan Nagar, Raily Bazar, Main Road
8
Co-ordinate of the confluence Point (if not reachable indirect through google earth/map) (Decimal Units)
Latitude 27.1587440
Longitude 84.03306443
Distance of the sampling point from confluence point (may the find out over google earth / map), KM
0.160 Km approx.
9
Co-ordinate of the Sampling Point (Decimal Units)
Latitude 27.1591873
Longitude 84.3300968
10 Landmarks / Address of the Location Slum Area Raily Bazar
11 Average flow if in MLD, if zero indicate whether dry or stagnant
7-9 AM 1-2 PM 4-6 PM Average Flow 1.123 0.864 0.691 0.892
12 Observations Confluence in Ramrekha River Hari Nagar
(General Parameters) SL. No.
Parameters Results
1 pH 5.63 2 BOD (mg/l) 28 3 COD (mg/l) 108 4 TSS (mg/l) 22 5 TDS ((mg/l) 262 6 TC (MPN/100 ml) 17X105
7 FC (MPN/100 ml) 11X105
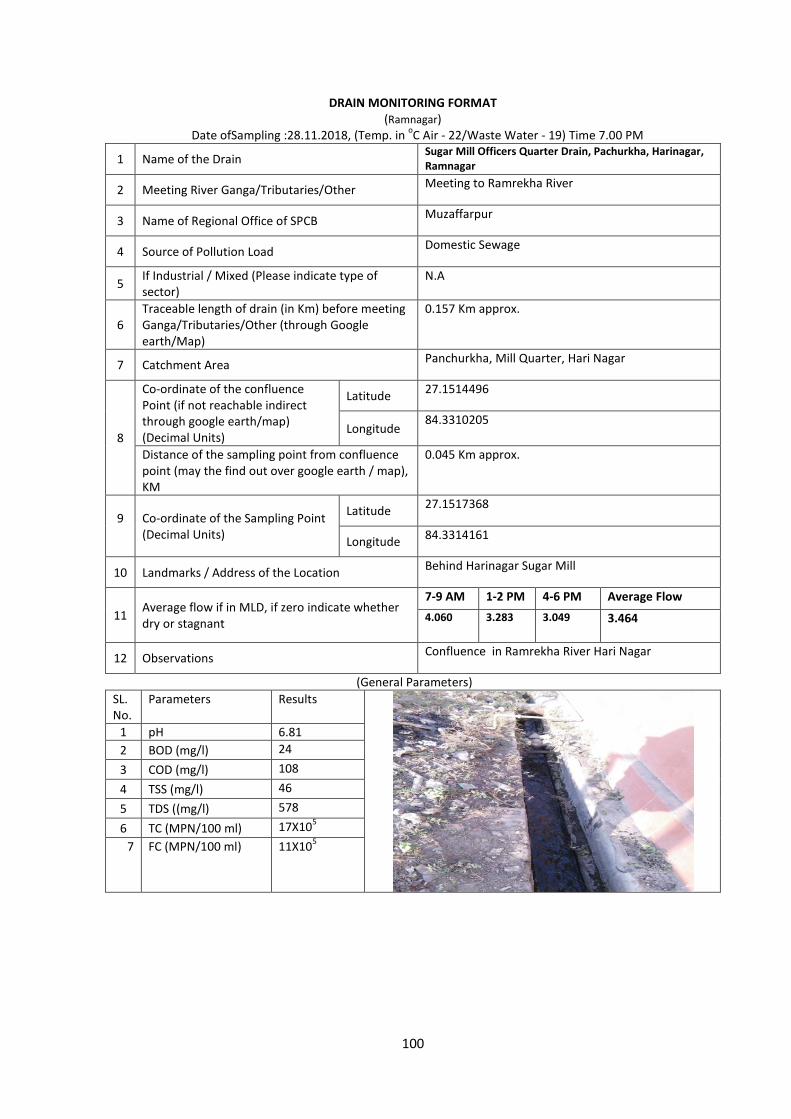
100
DRAIN MONITORING FORMAT (Ramnagar)
Date ofSampling :28.11.2018, (Temp. in oC Air - 22/Waste Water - 19) Time 7.00 PM
1 Name of the Drain Sugar Mill Officers Quarter Drain, Pachurkha, Harinagar, Ramnagar
2 Meeting River Ganga/Tributaries/Other Meeting to Ramrekha River
3 Name of Regional Office of SPCB Muzaffarpur
4 Source of Pollution Load Domestic Sewage
5 If Industrial / Mixed (Please indicate type of sector)
N.A
6 Traceable length of drain (in Km) before meeting Ganga/Tributaries/Other (through Google earth/Map)
0.157 Km approx.
7 Catchment Area Panchurkha, Mill Quarter, Hari Nagar
8
Co-ordinate of the confluence Point (if not reachable indirect through google earth/map) (Decimal Units)
Latitude 27.1514496
Longitude 84.3310205
Distance of the sampling point from confluence point (may the find out over google earth / map), KM
0.045 Km approx.
9
Co-ordinate of the Sampling Point (Decimal Units)
Latitude 27.1517368
Longitude 84.3314161
10 Landmarks / Address of the Location Behind Harinagar Sugar Mill
11 Average flow if in MLD, if zero indicate whether dry or stagnant
7-9 AM 1-2 PM 4-6 PM Average Flow 4.060 3.283 3.049 3.464
12 Observations Confluence in Ramrekha River Hari Nagar
(General Parameters) SL. No.
Parameters Results
1 pH 6.81 2 BOD (mg/l) 24 3 COD (mg/l) 108 4 TSS (mg/l) 46 5 TDS ((mg/l) 578 6 TC (MPN/100 ml) 17X105
7 FC (MPN/100 ml) 11X105
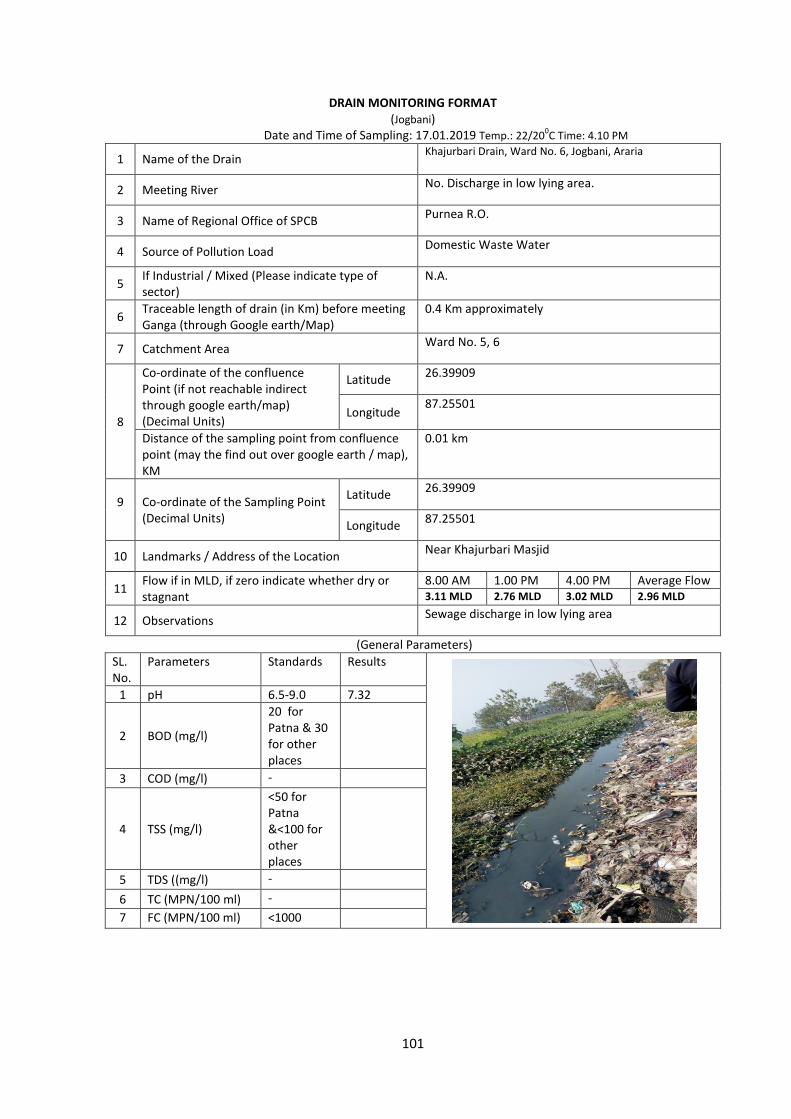
101
DRAIN MONITORING FORMAT (Jogbani)
Date and Time of Sampling: 17.01.2019 Temp.: 22/200C Time: 4.10 PM
1 Name of the Drain Khajurbari Drain, Ward No. 6, Jogbani, Araria
2 Meeting River No. Discharge in low lying area.
3 Name of Regional Office of SPCB Purnea R.O.
4 Source of Pollution Load Domestic Waste Water
5 If Industrial / Mixed (Please indicate type of sector)
N.A.
6 Traceable length of drain (in Km) before meeting Ganga (through Google earth/Map)
0.4 Km approximately
7 Catchment Area Ward No. 5, 6
8
Co-ordinate of the confluence Point (if not reachable indirect through google earth/map) (Decimal Units)
Latitude 26.39909
Longitude 87.25501
Distance of the sampling point from confluence point (may the find out over google earth / map), KM
0.01 km
9
Co-ordinate of the Sampling Point (Decimal Units)
Latitude 26.39909
Longitude 87.25501
10 Landmarks / Address of the Location Near Khajurbari Masjid
11 Flow if in MLD, if zero indicate whether dry or stagnant
8.00 AM 1.00 PM 4.00 PM Average Flow 3.11 MLD 2.76 MLD 3.02 MLD 2.96 MLD
12 Observations Sewage discharge in low lying area
(General Parameters) SL. No.
Parameters Standards Results
1 pH 6.5-9.0 7.32
2 BOD (mg/l)
20 for Patna & 30 for other places
3 COD (mg/l) -
4 TSS (mg/l)
<50 for Patna &<100 for other places
5 TDS ((mg/l) - 6 TC (MPN/100 ml) - 7 FC (MPN/100 ml) <1000
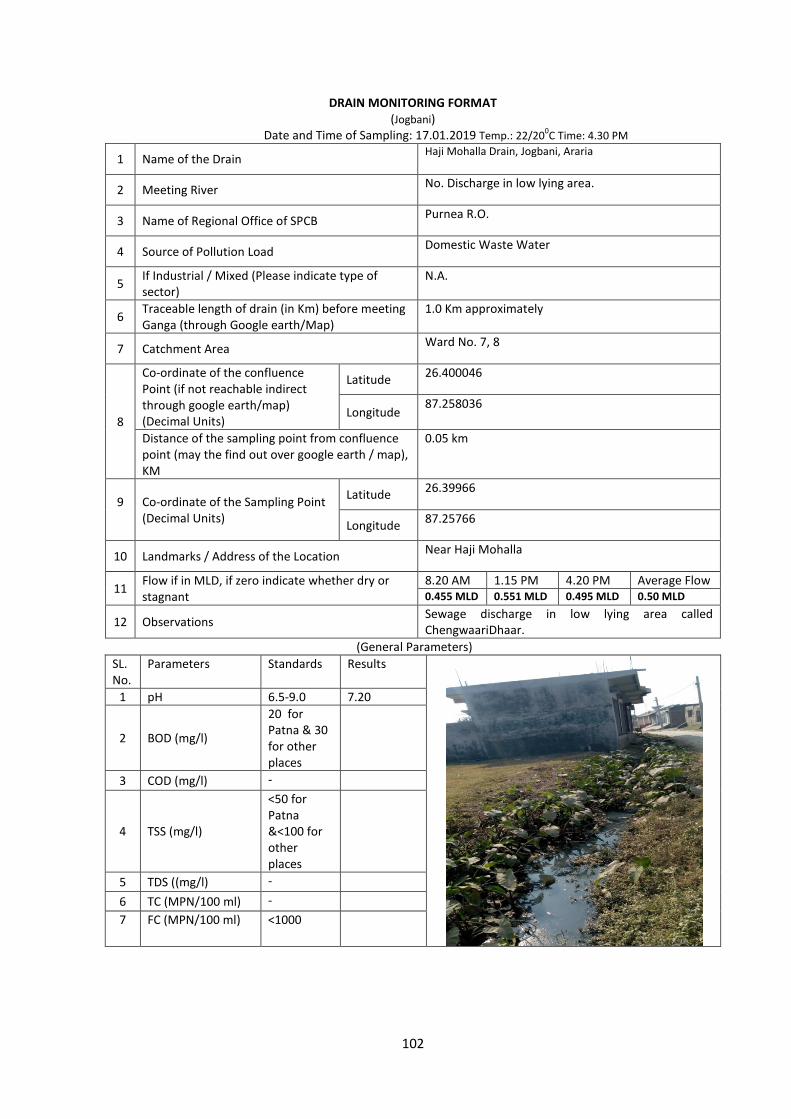
102
DRAIN MONITORING FORMAT (Jogbani)
Date and Time of Sampling: 17.01.2019 Temp.: 22/200C Time: 4.30 PM
1 Name of the Drain Haji Mohalla Drain, Jogbani, Araria
2 Meeting River No. Discharge in low lying area.
3 Name of Regional Office of SPCB Purnea R.O.
4 Source of Pollution Load Domestic Waste Water
5 If Industrial / Mixed (Please indicate type of sector)
N.A.
6 Traceable length of drain (in Km) before meeting Ganga (through Google earth/Map)
1.0 Km approximately
7 Catchment Area Ward No. 7, 8
8
Co-ordinate of the confluence Point (if not reachable indirect through google earth/map) (Decimal Units)
Latitude 26.400046
Longitude 87.258036
Distance of the sampling point from confluence point (may the find out over google earth / map), KM
0.05 km
9
Co-ordinate of the Sampling Point (Decimal Units)
Latitude 26.39966
Longitude 87.25766
10 Landmarks / Address of the Location Near Haji Mohalla
11 Flow if in MLD, if zero indicate whether dry or stagnant
8.20 AM 1.15 PM 4.20 PM Average Flow 0.455 MLD 0.551 MLD 0.495 MLD 0.50 MLD
12 Observations Sewage discharge in low lying area called ChengwaariDhaar.
(General Parameters) SL. No.
Parameters Standards Results
1 pH 6.5-9.0 7.20
2 BOD (mg/l)
20 for Patna & 30 for other places
3 COD (mg/l) -
4 TSS (mg/l)
<50 for Patna &<100 for other places
5 TDS ((mg/l) - 6 TC (MPN/100 ml) - 7 FC (MPN/100 ml) <1000
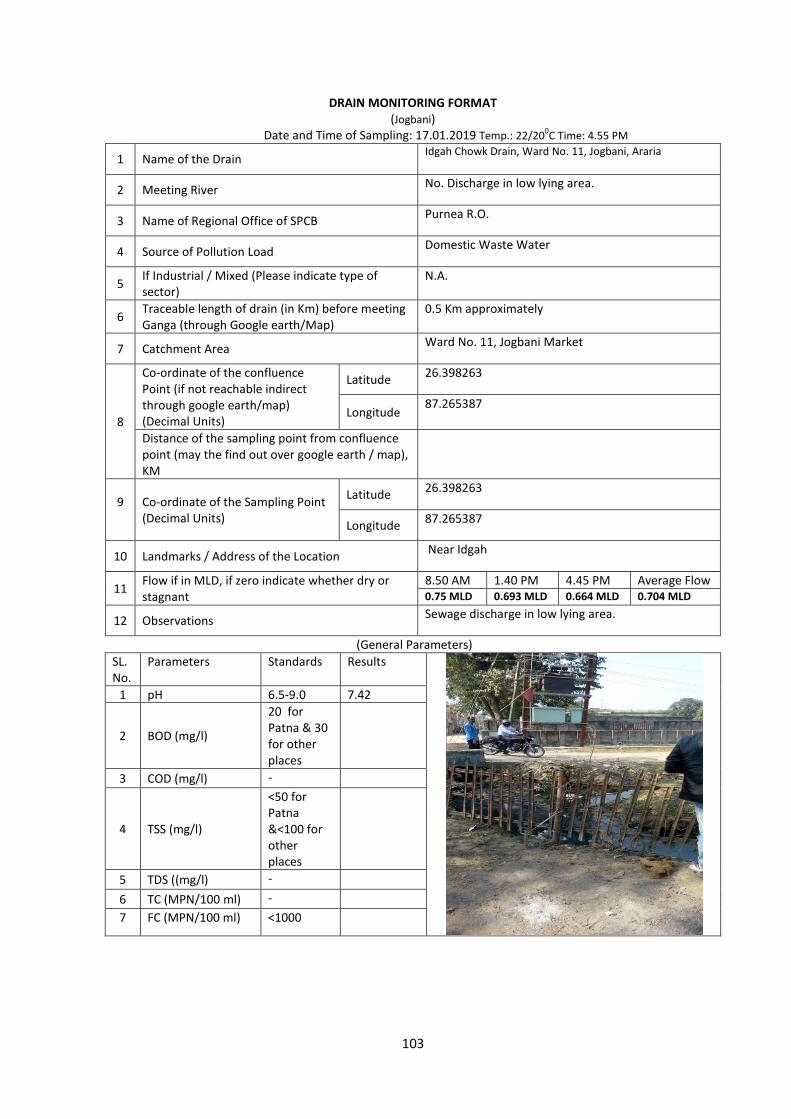
103
DRAIN MONITORING FORMAT (Jogbani)
Date and Time of Sampling: 17.01.2019 Temp.: 22/200C Time: 4.55 PM
1 Name of the Drain Idgah Chowk Drain, Ward No. 11, Jogbani, Araria
2 Meeting River No. Discharge in low lying area.
3 Name of Regional Office of SPCB Purnea R.O.
4 Source of Pollution Load Domestic Waste Water
5 If Industrial / Mixed (Please indicate type of sector)
N.A.
6 Traceable length of drain (in Km) before meeting Ganga (through Google earth/Map)
0.5 Km approximately
7 Catchment Area Ward No. 11, Jogbani Market
8
Co-ordinate of the confluence Point (if not reachable indirect through google earth/map) (Decimal Units)
Latitude 26.398263
Longitude 87.265387
Distance of the sampling point from confluence point (may the find out over google earth / map), KM
9
Co-ordinate of the Sampling Point (Decimal Units)
Latitude 26.398263
Longitude 87.265387
10 Landmarks / Address of the Location Near Idgah
11 Flow if in MLD, if zero indicate whether dry or stagnant
8.50 AM 1.40 PM 4.45 PM Average Flow 0.75 MLD 0.693 MLD 0.664 MLD 0.704 MLD
12 Observations Sewage discharge in low lying area.
(General Parameters) SL. No.
Parameters Standards Results
1 pH 6.5-9.0 7.42
2 BOD (mg/l)
20 for Patna & 30 for other places
3 COD (mg/l) -
4 TSS (mg/l)
<50 for Patna &<100 for other places
5 TDS ((mg/l) - 6 TC (MPN/100 ml) - 7 FC (MPN/100 ml) <1000
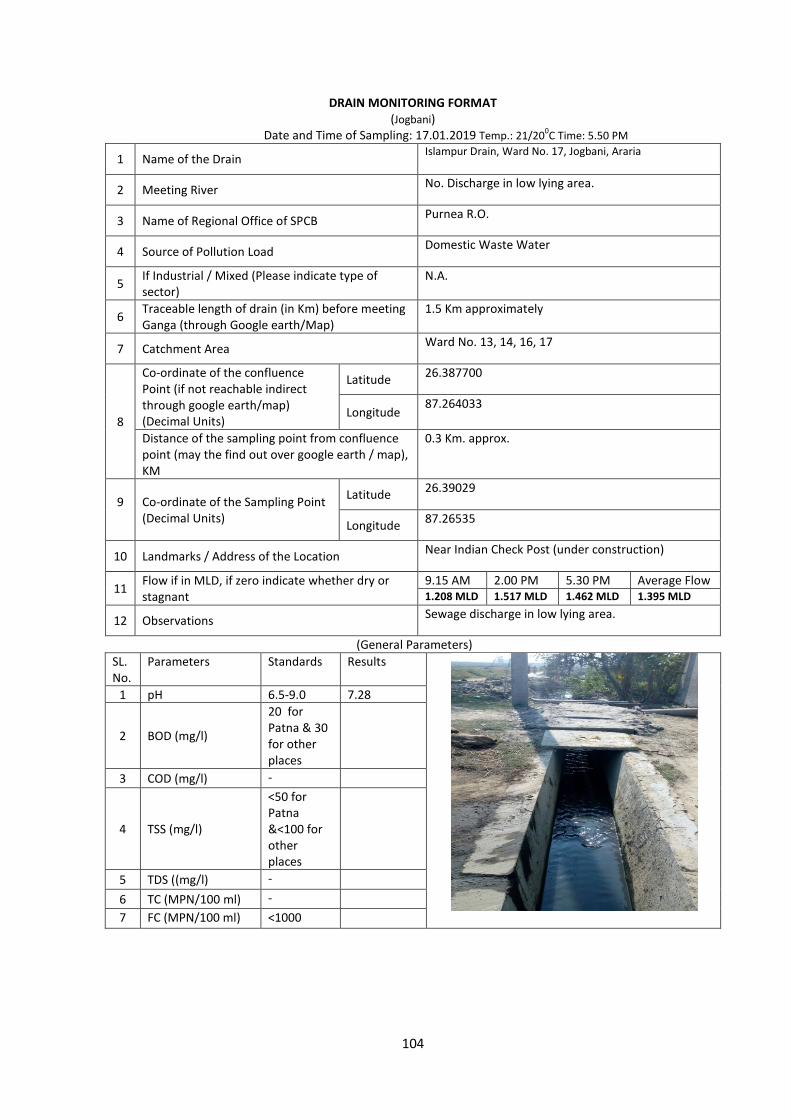
104
DRAIN MONITORING FORMAT (Jogbani)
Date and Time of Sampling: 17.01.2019 Temp.: 21/200C Time: 5.50 PM
1 Name of the Drain Islampur Drain, Ward No. 17, Jogbani, Araria
2 Meeting River No. Discharge in low lying area.
3 Name of Regional Office of SPCB Purnea R.O.
4 Source of Pollution Load Domestic Waste Water
5 If Industrial / Mixed (Please indicate type of sector)
N.A.
6 Traceable length of drain (in Km) before meeting Ganga (through Google earth/Map)
1.5 Km approximately
7 Catchment Area Ward No. 13, 14, 16, 17
8
Co-ordinate of the confluence Point (if not reachable indirect through google earth/map) (Decimal Units)
Latitude 26.387700
Longitude 87.264033
Distance of the sampling point from confluence point (may the find out over google earth / map), KM
0.3 Km. approx.
9
Co-ordinate of the Sampling Point (Decimal Units)
Latitude 26.39029
Longitude 87.26535
10 Landmarks / Address of the Location Near Indian Check Post (under construction)
11 Flow if in MLD, if zero indicate whether dry or stagnant
9.15 AM 2.00 PM 5.30 PM Average Flow 1.208 MLD 1.517 MLD 1.462 MLD 1.395 MLD
12 Observations Sewage discharge in low lying area.
(General Parameters) SL. No.
Parameters Standards Results
1 pH 6.5-9.0 7.28
2 BOD (mg/l)
20 for Patna & 30 for other places
3 COD (mg/l) -
4 TSS (mg/l)
<50 for Patna &<100 for other places
5 TDS ((mg/l) - 6 TC (MPN/100 ml) - 7 FC (MPN/100 ml) <1000

105
DRAIN MONITORING FORMAT (Fatuha)
Date of Sampling : 27.11.2018
1 Name of the Drain Kali GhatSamaspur, Fatuha, Patna
2 Meeting Ganga Meeting Ganga on right bank
3 Name of Regional Office of SPCB Regional office, Patna
4 Source of Pollution Load Domestic -sewage
5 If Industrial / Mixed (Please indicate type of sector)
Not Applicable (NA)
6 Traceable length of drain (in Km) before meeting Ganga (through Google earth/Map)
21 m
7 Catchment Area Samaspur
8
Co-ordinate of the confluence Point (if not reachable indirect through google earth/map) (Decimal Units)
Latitude 25.517221
Longitude 85.300431
Distance of the sampling point from confluence point (may the find out over google earth / map), KM
9
Co-ordinate of the Sampling Point (Decimal Units)
Latitude 25.517150
Longitude 85.300337
10 Landmarks / Address of the Location Millennium School
11 Average flow if in MLD, if zero indicate whether dry or stagnant
0.72 MLD
12 Observations
SN Time Flow rate (MLD) 1. 08:40am 0.84 2. 12:10pm 0.72 3. 02:40pm 0.46
(General Parameters) SL. No.
Parameters Results
1 pH 5.70 2 BOD (mg/l) 17 3 COD (mg/l) 64 4 TSS (mg/l) 80 5 TDS ((mg/l) 1326 6 TC (MPN/100 ml) 92x 105 7 FC (MPN/100 ml) 54x 105
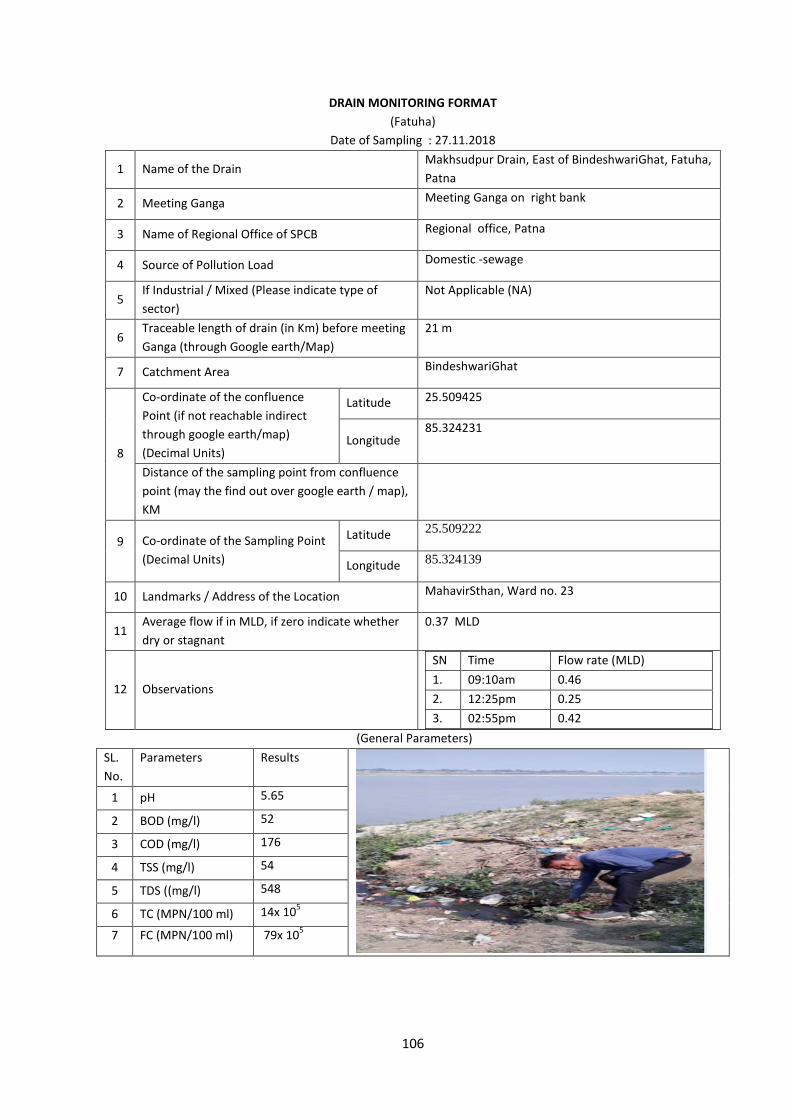
106
DRAIN MONITORING FORMAT (Fatuha)
Date of Sampling : 27.11.2018
1 Name of the Drain Makhsudpur Drain, East of BindeshwariGhat, Fatuha, Patna
2 Meeting Ganga Meeting Ganga on right bank
3 Name of Regional Office of SPCB Regional office, Patna
4 Source of Pollution Load Domestic -sewage
5 If Industrial / Mixed (Please indicate type of sector)
Not Applicable (NA)
6 Traceable length of drain (in Km) before meeting Ganga (through Google earth/Map)
21 m
7 Catchment Area BindeshwariGhat
8
Co-ordinate of the confluence Point (if not reachable indirect through google earth/map) (Decimal Units)
Latitude 25.509425
Longitude 85.324231
Distance of the sampling point from confluence point (may the find out over google earth / map), KM
9
Co-ordinate of the Sampling Point (Decimal Units)
Latitude 25.509222
Longitude 85.324139
10 Landmarks / Address of the Location MahavirSthan, Ward no. 23
11 Average flow if in MLD, if zero indicate whether dry or stagnant
0.37 MLD
12 Observations
SN Time Flow rate (MLD) 1. 09:10am 0.46 2. 12:25pm 0.25 3. 02:55pm 0.42
(General Parameters) SL. No.
Parameters Results
1 pH 5.65
2 BOD (mg/l) 52
3 COD (mg/l) 176
4 TSS (mg/l) 54
5 TDS ((mg/l) 548
6 TC (MPN/100 ml) 14x 105
7 FC (MPN/100 ml) 79x 105

107
DRAIN MONITORING FORMAT (Fatuha)
Date of Sampling : 27.11.2018
1 Name of the Drain Makhsudpur Drain, West of BindeshwariGhat, Fatuha, Patna
2 Meeting Ganga Meeting Ganga on right bank
3 Name of Regional Office of SPCB Regional office, Patna
4 Source of Pollution Load Domestic -sewage
5 If Industrial / Mixed (Please indicate type of sector)
Not Applicable (NA)
6 Traceable length of drain (in Km) before meeting Ganga (through Google earth/Map)
24 m
7 Catchment Area BindeshwariGhat
8
Co-ordinate of the confluence Point (if not reachable indirect through google earth/map) (Decimal Units)
Latitude 25.509439
Longitude 85.323937
Distance of the sampling point from confluence point (may the find out over google earth / map), KM
9
Co-ordinate of the Sampling Point (Decimal Units)
Latitude 25.509286
Longitude 85.323822
10 Landmarks / Address of the Location MahavirSthan, Ward no. 23
11 Average flow if in MLD, if zero indicate whether dry or stagnant
0.10 MLD
12 Observations
SN Time Flow rate (MLD) 1. 09:25am 1.28 2. 12:50pm 0.83 3. 03:10pm 1.21
(General Parameters) SL. No.
Parameters Results
1 pH 5.82 2 BOD (mg/l) 46 3 COD (mg/l) 164 4 TSS (mg/l) 88 5 TDS ((mg/l) 1180 6 TC (MPN/100 ml) 14x 105 7 FC (MPN/100 ml) 79x 105

108
DRAIN MONITORING FORMAT (Fatuha)
Date of Sampling : 27.11.2018
1 Name of the Drain KataiyaGhat Drain, Fatuha, Patna
2 Meeting Ganga Meeting Ganga on right bank
3 Name of Regional Office of SPCB Regional office, Patna
4 Source of Pollution Load Domestic -sewage
5 If Industrial / Mixed (Please indicate type of sector)
Not Applicable (NA)
6 Traceable length of drain (in Km) before meeting Ganga (through Google earth/Map)
14 m
7 Catchment Area Dariyapur, Fatuha
8
Co-ordinate of the confluence Point (if not reachable indirect through google earth/map) (Decimal Units)
Latitude 25.511272
Longitude 85.308228
Distance of the sampling point from confluence point (may the find out over google earth / map), KM
9
Co-ordinate of the Sampling Point (Decimal Units)
Latitude 25.511067
Longitude 85.308391
10 Landmarks / Address of the Location
11 Average flow if in MLD, if zero indicate whether dry or stagnant
0.64 MLD
12 Observations
SN Time Flow rate (MLD) 1. 09:50am 0.81 2. 01:15pm 0.35 3. 03:30pm 0.78
(General Parameters) SL. No.
Parameters Results
1 pH 5.80 2 BOD (mg/l) 50 3 COD (mg/l) 168 4 TSS (mg/l) 56 5 TDS ((mg/l) 666 6 TC (MPN/100 ml) 17x 105 7 FC (MPN/100 ml) 11x 105

109
DRAIN MONITORING FORMAT (Fatuha)
Date of Sampling : 27.11.2018
1 Name of the Drain DevantiGhat Drain, Fatuha, Patna
2 Meeting Ganga Meeting Ganga on right bank
3 Name of Regional Office of SPCB Regional office, Patna
4 Source of Pollution Load Domestic -sewage
5 If Industrial / Mixed (Please indicate type of sector)
Not Applicable (NA)
6 Traceable length of drain (in Km) before meeting Ganga (through Google earth/Map)
13 m
7 Catchment Area SonakothiMohallah
8
Co-ordinate of the confluence Point (if not reachable indirect through google earth/map) (Decimal Units)
Latitude 25.511723
Longitude 85.306409
Distance of the sampling point from confluence point (may the find out over google earth / map), KM
9
Co-ordinate of the Sampling Point (Decimal Units)
Latitude 25.511626
Longitude 85.306275
10 Landmarks / Address of the Location
11 Average flow if in MLD, if zero indicate whether dry or stagnant
2.30 MLD
12 Observations
SN Time Flow rate (MLD) 1. 10:20am 2.57 2. 01:30pm 1.82 3. 03:35pm 2.34
(General Parameters) SL. No.
Parameters Results
1 pH 6.77
2 BOD (mg/l) 19
3 COD (mg/l) 68
4 TSS (mg/l) 272
5 TDS ((mg/l) 4318
6 TC (MPN/100 ml) 17x 105
7 FC (MPN/100 ml) 11x 105
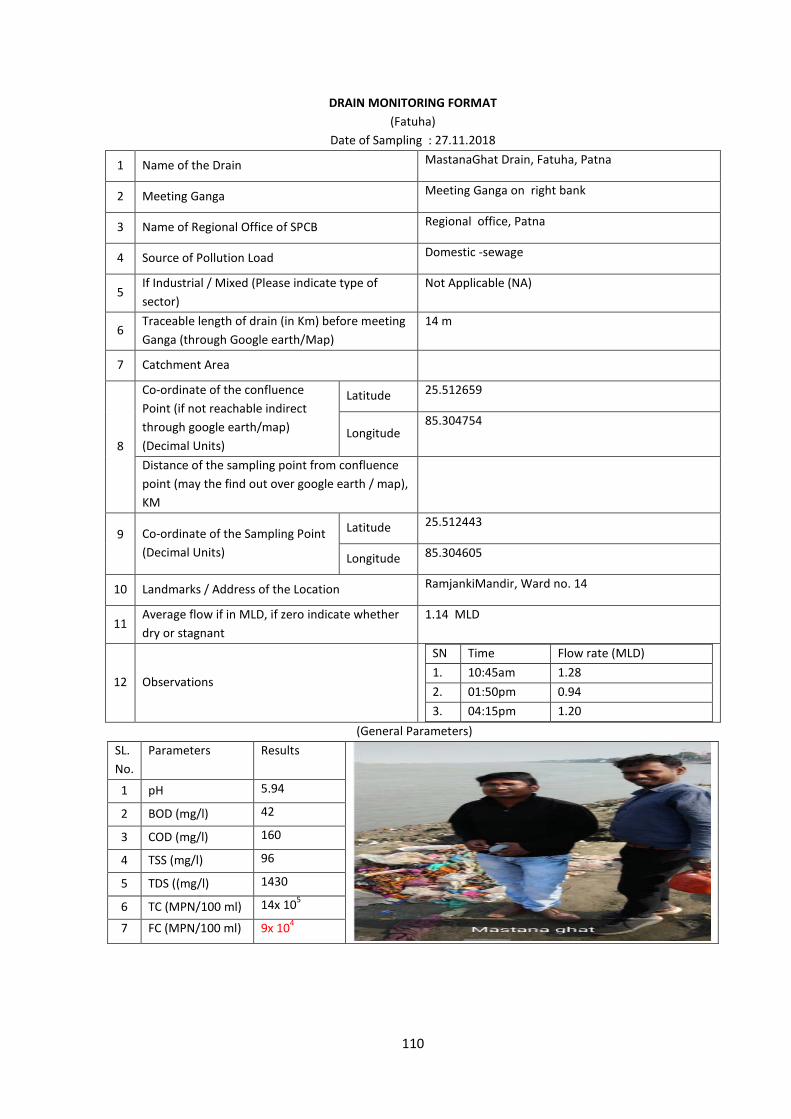
110
DRAIN MONITORING FORMAT (Fatuha)
Date of Sampling : 27.11.2018
1 Name of the Drain MastanaGhat Drain, Fatuha, Patna
2 Meeting Ganga Meeting Ganga on right bank
3 Name of Regional Office of SPCB Regional office, Patna
4 Source of Pollution Load Domestic -sewage
5 If Industrial / Mixed (Please indicate type of sector)
Not Applicable (NA)
6 Traceable length of drain (in Km) before meeting Ganga (through Google earth/Map)
14 m
7 Catchment Area
8
Co-ordinate of the confluence Point (if not reachable indirect through google earth/map) (Decimal Units)
Latitude 25.512659
Longitude 85.304754
Distance of the sampling point from confluence point (may the find out over google earth / map), KM
9
Co-ordinate of the Sampling Point (Decimal Units)
Latitude 25.512443
Longitude 85.304605
10 Landmarks / Address of the Location RamjankiMandir, Ward no. 14
11 Average flow if in MLD, if zero indicate whether dry or stagnant
1.14 MLD
12 Observations
SN Time Flow rate (MLD) 1. 10:45am 1.28 2. 01:50pm 0.94 3. 04:15pm 1.20
(General Parameters) SL. No.
Parameters Results
1 pH 5.94
2 BOD (mg/l) 42
3 COD (mg/l) 160
4 TSS (mg/l) 96
5 TDS ((mg/l) 1430
6 TC (MPN/100 ml) 14x 105
7 FC (MPN/100 ml) 9x 10⁴
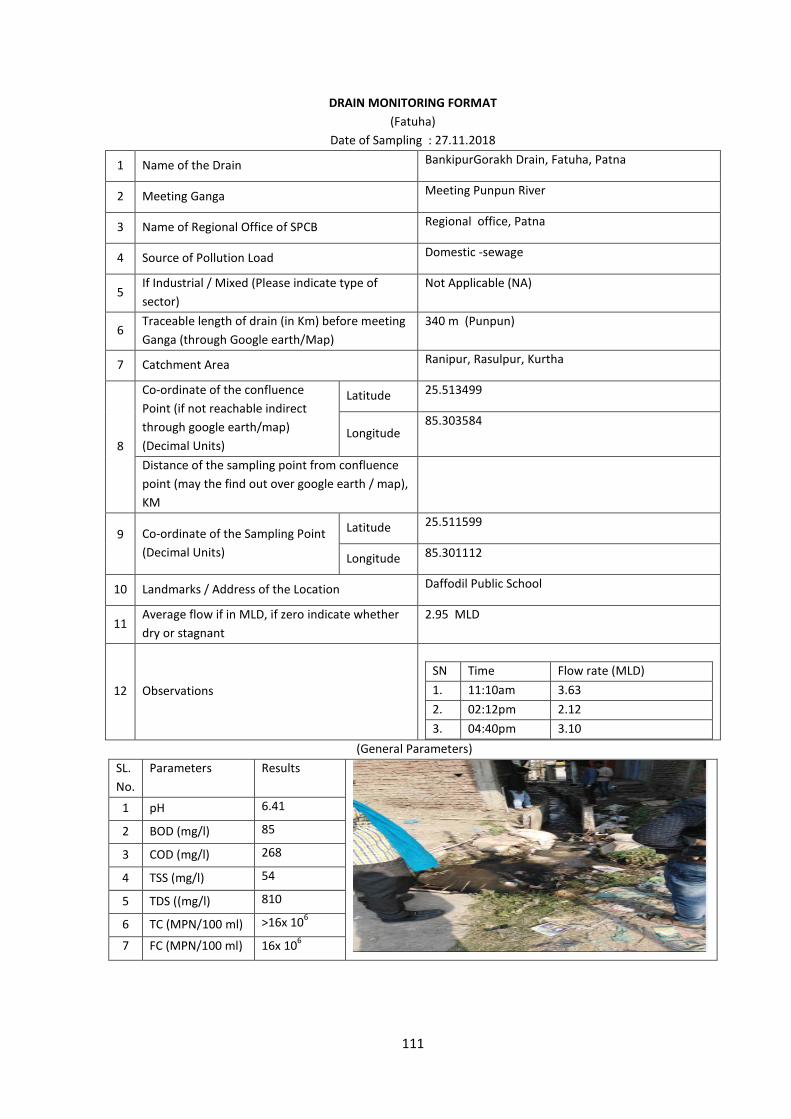
111
DRAIN MONITORING FORMAT (Fatuha)
Date of Sampling : 27.11.2018
1 Name of the Drain BankipurGorakh Drain, Fatuha, Patna
2 Meeting Ganga Meeting Punpun River
3 Name of Regional Office of SPCB Regional office, Patna
4 Source of Pollution Load Domestic -sewage
5 If Industrial / Mixed (Please indicate type of sector)
Not Applicable (NA)
6 Traceable length of drain (in Km) before meeting Ganga (through Google earth/Map)
340 m (Punpun)
7 Catchment Area Ranipur, Rasulpur, Kurtha
8
Co-ordinate of the confluence Point (if not reachable indirect through google earth/map) (Decimal Units)
Latitude 25.513499
Longitude 85.303584
Distance of the sampling point from confluence point (may the find out over google earth / map), KM
9
Co-ordinate of the Sampling Point (Decimal Units)
Latitude 25.511599
Longitude 85.301112
10 Landmarks / Address of the Location Daffodil Public School
11 Average flow if in MLD, if zero indicate whether dry or stagnant
2.95 MLD
12 Observations
SN Time Flow rate (MLD) 1. 11:10am 3.63 2. 02:12pm 2.12 3. 04:40pm 3.10
(General Parameters) SL. No.
Parameters Results
1 pH 6.41
2 BOD (mg/l) 85
3 COD (mg/l) 268
4 TSS (mg/l) 54
5 TDS ((mg/l) 810
6 TC (MPN/100 ml) >16x 106
7 FC (MPN/100 ml) 16x 106

112
Annexure-5 Department of Environment, Forest and Climate Change
Physical & Financial Target of Agriculture Road Map 2017-18 to 2021-22
S l.
Type of Land Item
Area Year 2017-18 Year 2018-19 Year 2019-20 Year 2020-21 Year 2021-22 Year 2017-22
ConsolidatedTarget
Unit Area
No. of Plants (in
Lakh)
Fin. Target (Rs. in Lakh)
Area
No. of Plants (in
Lakh)
Fin. Target (Rs. in Lakh)
Area
No. of Plants (in
Lakh)
Fin. Target (Rs. in Lakh)
Area
No. of Plants (in
Lakh)
Fin. Target (Rs. in Lakh)
Area
No. of Plants (in
Lakh)
Fin. Target (Rs. in Lakh)
Area
No. of Plants (in
Lakh)
Fin. Target (Rs. in Lakh)
1 Forest land
Rehabilitation of
Degraded Forest *
Ha 20000 186.4 24201 20000 186.4 24004 20000 163.9 21565 20000 163.9 21565 20000 146.4 19080 100000 847 110415
2
Plantation on govt. land
outside the
forest
River embankment K.M 350 3.5 2499 300 3 2142 300 3 2142 300 3 2142 250 2.5 1785 1500 15 10710
Canal embankment K.M 1300 13 10595 1300 13 10595 1200 12 9780 1200 12 9780 1000 10 8150 6000 60 48900
RCD roads K.M 1000 10 3950 1000 10 3950 800 8 3160 600 6 2370 400 4 1580 3800 38 15010
3
Degraded,
Wasteland & Urban Land
Urban & Institution Plantation
Ha 2050 4.1 1932.16 2050 4.1 1932.16 1975 3.95 1601.38 1975 3.95 1601.38 1950 3.9 1491.12 10000 20 8558.2
Park Development Park 43 & 3500 32 & 2500 22 & 2000 12 & 1500 11 & 1000 120 & 10500
4 Wet Land area
Wet Land conservation
& Dev.
Wet Land area Dev.
& & 1500 & & 1500 & 1000 & & 1000 & & 500 & & 5500
5 Farmers Land
Agro-forestry Ha 113000 169.5 4068 67000 100.5 2412 60000 90 2160 60000 90 2160 53333 80 1920 353333 530 12720
Total 386.5 52245.16 317 49035.16 280.85 43408.38 278.85 42118.38 246.8 35506.12 1510 222313.2 6 Development of Nursery & 234.5 4374.4 & 229.5 4250.8 & 229.5 4250.8 & 229.5 4250.8 & 219.5 4092.4 & 1142.5 21219.2
Gross Total 56619.56 53285.96 47659.18 46369.18 39598.52 243532.4
*Soil and Moisture conservation, Weeds control, development of grassland and Bamboo plantation
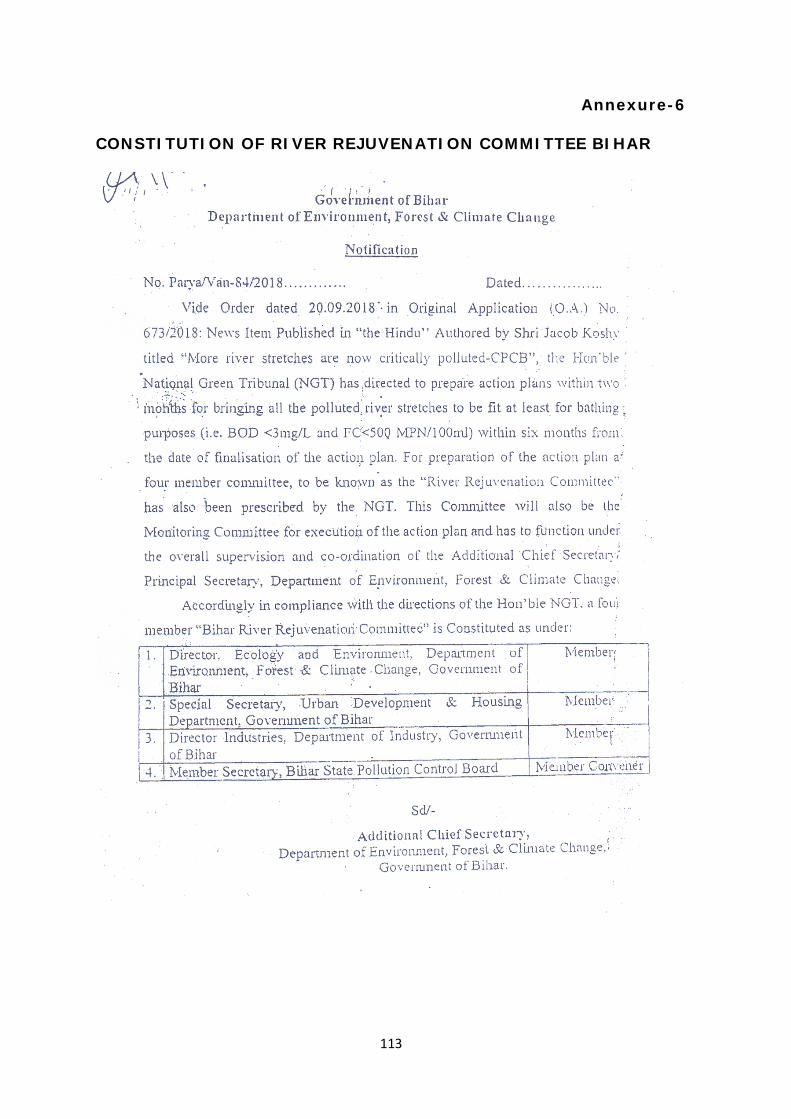
113
Annexure-6
CONSTITUTION OF RIVER REJUVENATION COMMITTEE BIHAR
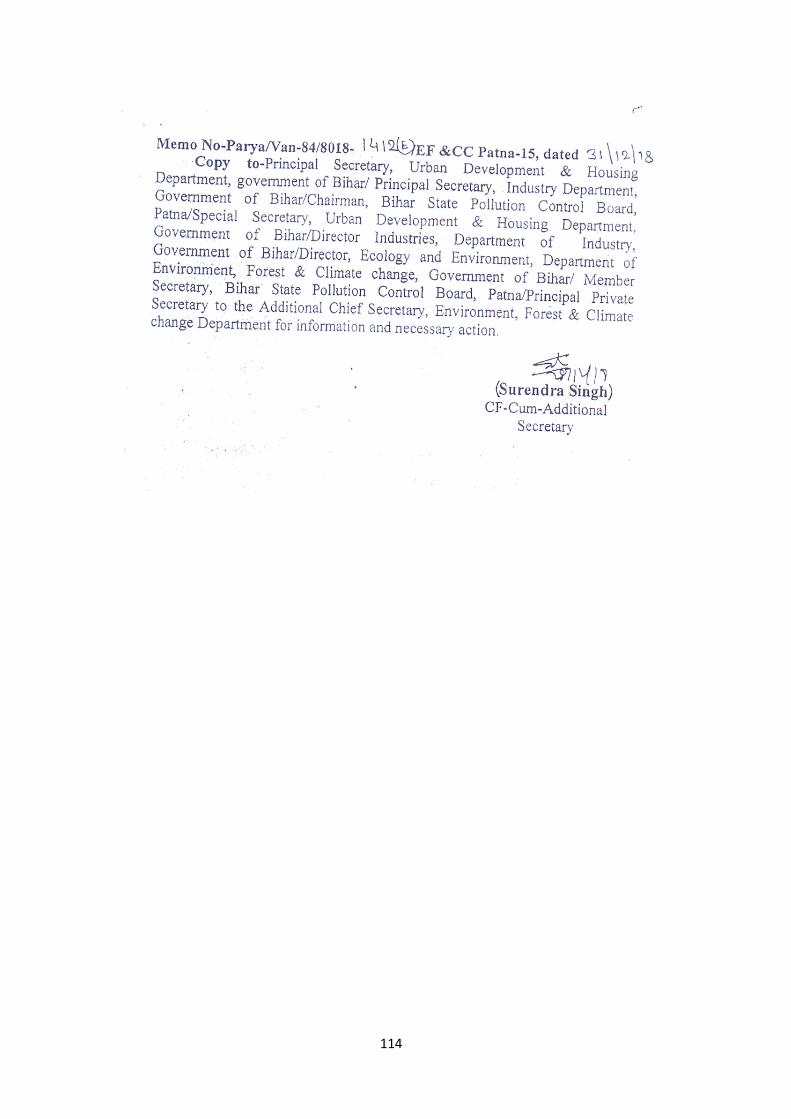
114

115
Annexure-7

116
Table5.5SummaryofAssessmentUnitsandSubunitsandCategorization
Sl
.No.
Nameofthe district
Noo
fass
essm
entB
lock
s\ U
nits
N
oofa
sses
smen
tuni
ts
Noof assessment Sub-units
NumberofAssessmentUnits
NonCommandareas
Tota
lNo.
ofAf
fect
edBl
ocks
To
talN
o.of
‘Sa
fe’B
lock
s\ U
nits
Al
luvi
um
Ha
rdRo
ck
O
verE
xplo
ited
Cr
itica
l
Se
mi-C
ritic
al
Sa
fe
To
tal(n
on-c
omm
anda
rea)
1 Araria 9 9 9 0 0 0 0 9 9 0 9 2 Arwal 5 5 5 0 0 0 0 5 5 0 5 3 Aurangabad 11 11 11 0 0 0 0 11 11 0 11 4 Banka 11 11 11 11 0 0 0 11 11 0 11 5 Begusarai 18 18 18 0 0 0 2 16 18 2 16 6 Bhabhua 11 11 10 4 0 0 0 11 11 0 11 7 Bhagalpur 16 16 16 0 0 0 0 16 16 0 16 8 Bhojpur 14 14 14 0 0 0 0 14 14 0 14 9 Buxar 11 11 11 0 0 0 0 11 11 0 11
10 Darbhanga 18 18 18 0 0 0 0 18 18 0 18 11 EastChamparan 27 27 27 0 0 0 0 27 27 0 27 12 Gaya 24 24 22 16 0 0 2 22 24 2 22 13 Gopalganj 14 14 14 0 0 0 0 14 14 0 14 14 Jamui 10 10 6 6 0 0 0 10 10 0 10 15 Jehanabad 7 7 7 0 0 0 1 6 7 1 6 16 Katihar 16 16 16 0 0 0 0 16 16 0 16 17 Khagaria 7 7 7 0 0 0 0 7 7 0 7 18 Kishanganj 7 7 7 0 0 0 0 7 7 0 7 19 Lakhisarai 7 6 6 4 0 0 0 6 6 0 6 20 Madhepura 13 13 13 0 0 0 0 13 13 0 13 21 Madhubani 21 21 21 0 0 0 0 21 21 0 21 22 Munger 9 9 9 7 0 0 0 9 9 0 9 23 Muzaffarpur 16 16 16 0 0 0 1 15 16 1 15 24 Nalanda 20 20 20 0 0 0 3 17 20 3 17 25 Nawada 14 14 13 7 0 0 1 13 14 1 13 26 Patna 23 23 23 0 0 0 2 21 23 2 21 27 Purnia 14 14 14 0 0 0 0 14 14 0 14 28 Rohtas 19 19 19 5 0 0 0 19 19 0 19 29 Saharsa 10 10 10 0 0 0 0 10 10 0 10 30 Samastipur 20 20 20 0 0 0 1 19 20 1 19 31 Saran 20 20 20 0 0 0 0 20 20 0 20

117
Sl
.No.
Nameofthe district
Noo
fass
essm
entB
lock
s\ U
nits
N
oofa
sses
smen
tuni
ts
Noof assessment Sub-units
NumberofAssessmentUnits
NonCommandareas
Tota
lNo.
ofAf
fect
edBl
ocks
To
talN
o.of
‘Saf
e’Bl
ocks
\ U
nits
Al
luvi
um
Ha
rdRo
ck
O
verE
xplo
ited
Cr
itica
l
Se
mi-C
ritic
al
Sa
fe
To
tal(n
on-c
omm
anda
rea)
32 Sheihkpura 6 6 6 1 0 0 0 6 6 0 6 33 Sheohar 5 5 5 0 0 0 0 5 5 0 5 34 Sitamarhi 17 17 17 0 0 0 0 17 17 0 17 35 Siwan 19 19 19 0 0 0 0 19 19 0 19 36 Supaul 11 11 11 0 0 0 0 11 11 0 11 37 Vaishali 16 16 16 0 0 0 1 15 16 1 15 38 WChamparan 18 18 18 0 0 0 0 18 18 0 18
STATETOTAL= 534 533 525 61 0 0 14 519 533 14 519 Note:InLakhisaridistrict,ChananblockhasbeenassessedaspartofLakhisariblock
Earlierestimation
(2011)categorized11blocksas‘SemiCritical’outof534assessedblocks.Incontrast
presentestimation categorized 14blocksas‘SemiCritical’ outof534assessed
administrativeunits.
Highstageofdevelopment isduetoagriculturalactivitiesinBiharstate.The
statusofcategorization forblocksotherthan‘Safe’intheStateasperpresent
estimationisgiveninTable5.6.

118
Table5.6Listofblockscategorisedotherthan‘Safe’inBiharStatebasedon DynamicGroundwaterResourceAssessment(ason31stmarch,2013)
Sl.
District
Block
SOD%
Category
Categoryaswasin 2011
1.
Begusarai Naokothi 98.71 Semi-Critical Semi-Critical
Bhagwanpur 91.32 Semi-Critical Safe 2.
Gaya GayaSadar 89.48 Semi-Critical Semi-Critical
Imamganj 96.93 Semi-Critical Safe
3. Jehanabad Kako 83.35 Semi-Critical Safe
4. Muzaffarpur Mushari 97.75 Semi-Critical Semi-Critical 5.
Nalanda
Nagarnausa 96.01 Semi-Critical Semi-Critical
Rajgir 78.24 Semi-Critical Semi-Critical
Silao 93.83 Semi-Critical Safe
6. Nawada Meskaur 95.67 Semi-Critical Semi-Critical 7.
Patna Sanpatchak 84.29 Semi-Critical Semi-Critical
PatnaSadar 95.39 Semi-Critical Safe
8. Samastipur Tajpur 77.58 Semi-Critical Semi-Critical
9. Vaishali Hazipur 96.45 Semi-Critical Safe
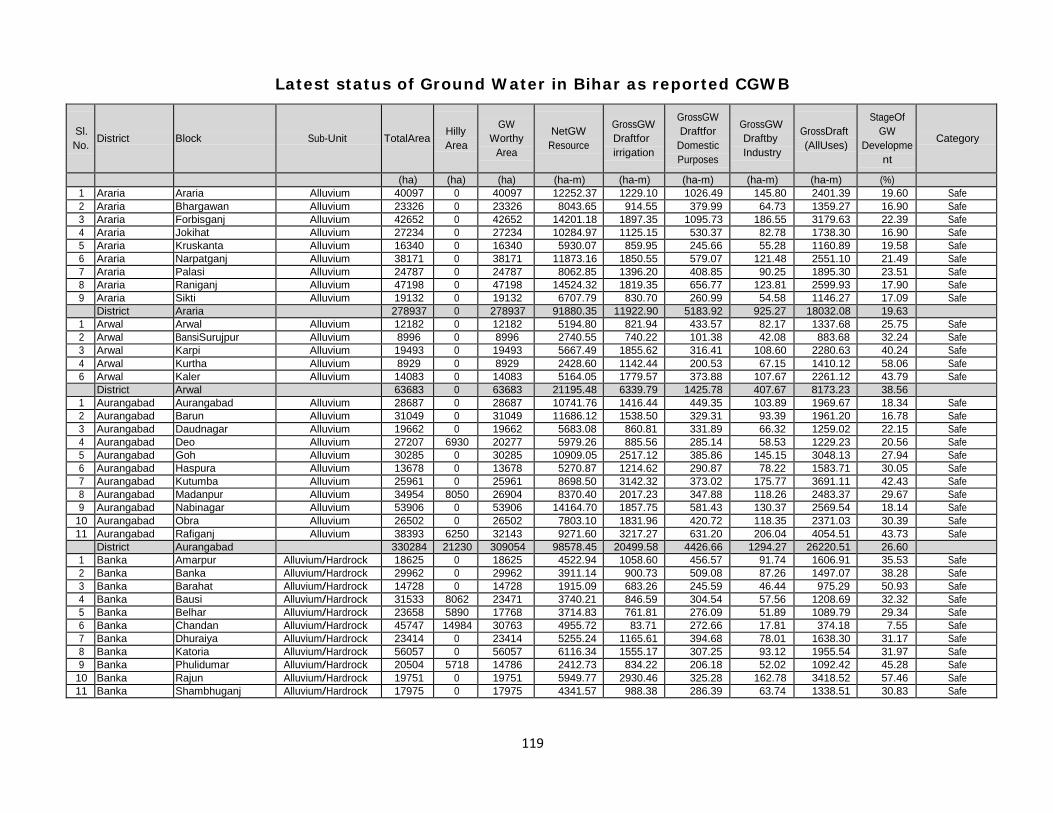
119
Latest status of Ground Water in Bihar as reported CGWB
Sl. No.
District
Block
Sub-Unit
TotalArea
Hilly Area
GW
Worthy Area
NetGW
Resource
GrossGW Draftfor irrigation
GrossGW Draftfor
Domestic Purposes
GrossGW Draftby Industry
GrossDraft (AllUses)
StageOf GW
Developme nt
Category
(ha) (ha) (ha) (ha-m) (ha-m) (ha-m) (ha-m) (ha-m) (%) 1 Araria Araria Alluvium 40097 0 40097 12252.37 1229.10 1026.49 145.80 2401.39 19.60 Safe 2 Araria Bhargawan Alluvium 23326 0 23326 8043.65 914.55 379.99 64.73 1359.27 16.90 Safe 3 Araria Forbisganj Alluvium 42652 0 42652 14201.18 1897.35 1095.73 186.55 3179.63 22.39 Safe 4 Araria Jokihat Alluvium 27234 0 27234 10284.97 1125.15 530.37 82.78 1738.30 16.90 Safe 5 Araria Kruskanta Alluvium 16340 0 16340 5930.07 859.95 245.66 55.28 1160.89 19.58 Safe 6 Araria Narpatganj Alluvium 38171 0 38171 11873.16 1850.55 579.07 121.48 2551.10 21.49 Safe 7 Araria Palasi Alluvium 24787 0 24787 8062.85 1396.20 408.85 90.25 1895.30 23.51 Safe 8 Araria Raniganj Alluvium 47198 0 47198 14524.32 1819.35 656.77 123.81 2599.93 17.90 Safe 9 Araria Sikti Alluvium 19132 0 19132 6707.79 830.70 260.99 54.58 1146.27 17.09 Safe
District Araria 278937 0 278937 91880.35 11922.90 5183.92 925.27 18032.08 19.63 1 Arwal Arwal Alluvium 12182 0 12182 5194.80 821.94 433.57 82.17 1337.68 25.75 Safe 2 Arwal BansiSurujpur Alluvium 8996 0 8996 2740.55 740.22 101.38 42.08 883.68 32.24 Safe 3 Arwal Karpi Alluvium 19493 0 19493 5667.49 1855.62 316.41 108.60 2280.63 40.24 Safe 4 Arwal Kurtha Alluvium 8929 0 8929 2428.60 1142.44 200.53 67.15 1410.12 58.06 Safe 6 Arwal Kaler Alluvium 14083 0 14083 5164.05 1779.57 373.88 107.67 2261.12 43.79 Safe
District Arwal 63683 0 63683 21195.48 6339.79 1425.78 407.67 8173.23 38.56 1 Aurangabad Aurangabad Alluvium 28687 0 28687 10741.76 1416.44 449.35 103.89 1969.67 18.34 Safe 2 Aurangabad Barun Alluvium 31049 0 31049 11686.12 1538.50 329.31 93.39 1961.20 16.78 Safe 3 Aurangabad Daudnagar Alluvium 19662 0 19662 5683.08 860.81 331.89 66.32 1259.02 22.15 Safe 4 Aurangabad Deo Alluvium 27207 6930 20277 5979.26 885.56 285.14 58.53 1229.23 20.56 Safe 5 Aurangabad Goh Alluvium 30285 0 30285 10909.05 2517.12 385.86 145.15 3048.13 27.94 Safe 6 Aurangabad Haspura Alluvium 13678 0 13678 5270.87 1214.62 290.87 78.22 1583.71 30.05 Safe 7 Aurangabad Kutumba Alluvium 25961 0 25961 8698.50 3142.32 373.02 175.77 3691.11 42.43 Safe 8 Aurangabad Madanpur Alluvium 34954 8050 26904 8370.40 2017.23 347.88 118.26 2483.37 29.67 Safe 9 Aurangabad Nabinagar Alluvium 53906 0 53906 14164.70 1857.75 581.43 130.37 2569.54 18.14 Safe
10 Aurangabad Obra Alluvium 26502 0 26502 7803.10 1831.96 420.72 118.35 2371.03 30.39 Safe 11 Aurangabad Rafiganj Alluvium 38393 6250 32143 9271.60 3217.27 631.20 206.04 4054.51 43.73 Safe
District Aurangabad 330284 21230 309054 98578.45 20499.58 4426.66 1294.27 26220.51 26.60 1 Banka Amarpur Alluvium/Hardrock 18625 0 18625 4522.94 1058.60 456.57 91.74 1606.91 35.53 Safe 2 Banka Banka Alluvium/Hardrock 29962 0 29962 3911.14 900.73 509.08 87.26 1497.07 38.28 Safe 3 Banka Barahat Alluvium/Hardrock 14728 0 14728 1915.09 683.26 245.59 46.44 975.29 50.93 Safe 4 Banka Bausi Alluvium/Hardrock 31533 8062 23471 3740.21 846.59 304.54 57.56 1208.69 32.32 Safe 5 Banka Belhar Alluvium/Hardrock 23658 5890 17768 3714.83 761.81 276.09 51.89 1089.79 29.34 Safe 6 Banka Chandan Alluvium/Hardrock 45747 14984 30763 4955.72 83.71 272.66 17.81 374.18 7.55 Safe 7 Banka Dhuraiya Alluvium/Hardrock 23414 0 23414 5255.24 1165.61 394.68 78.01 1638.30 31.17 Safe 8 Banka Katoria Alluvium/Hardrock 56057 0 56057 6116.34 1555.17 307.25 93.12 1955.54 31.97 Safe 9 Banka Phulidumar Alluvium/Hardrock 20504 5718 14786 2412.73 834.22 206.18 52.02 1092.42 45.28 Safe
10 Banka Rajun Alluvium/Hardrock 19751 0 19751 5949.77 2930.46 325.28 162.78 3418.52 57.46 Safe 11 Banka Shambhuganj Alluvium/Hardrock 17975 0 17975 4341.57 988.38 286.39 63.74 1338.51 30.83 Safe
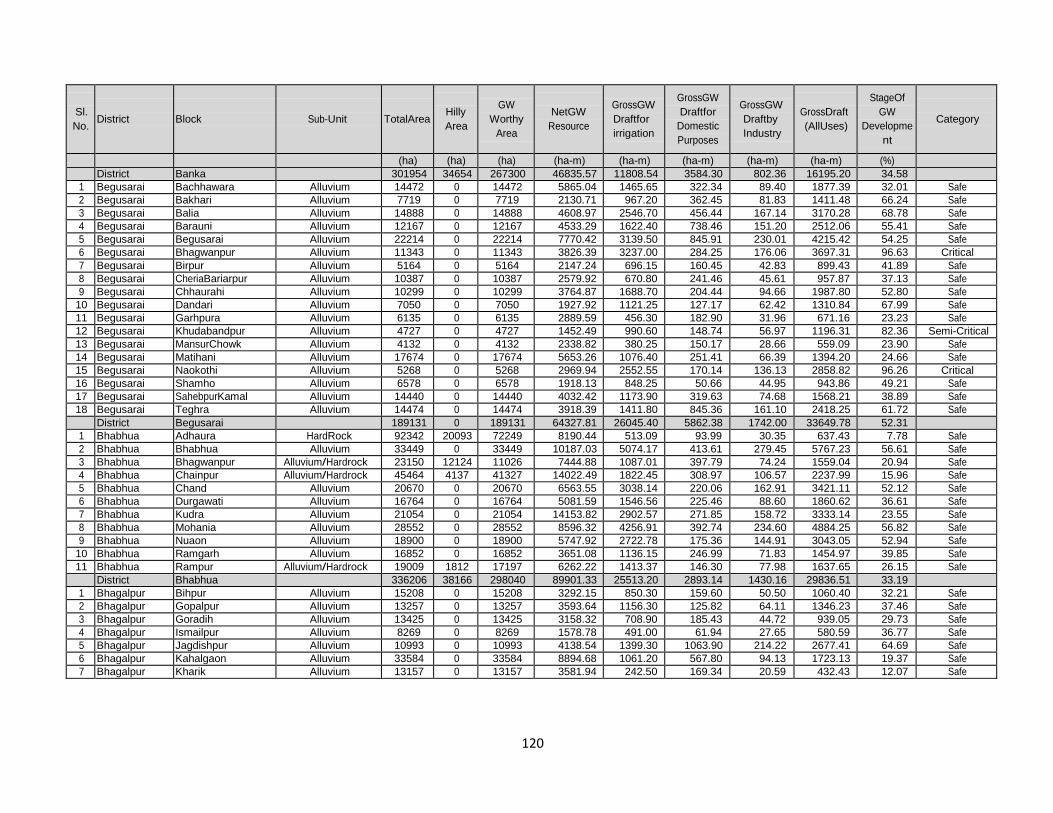
120
Sl. No.
District
Block
Sub-Unit
TotalArea
Hilly Area
GW
Worthy Area
NetGW
Resource
GrossGW Draftfor irrigation
GrossGW Draftfor
Domestic Purposes
GrossGW Draftby Industry
GrossDraft (AllUses)
StageOf GW
Developme nt
Category
(ha) (ha) (ha) (ha-m) (ha-m) (ha-m) (ha-m) (ha-m) (%) District Banka 301954 34654 267300 46835.57 11808.54 3584.30 802.36 16195.20 34.58
1 Begusarai Bachhawara Alluvium 14472 0 14472 5865.04 1465.65 322.34 89.40 1877.39 32.01 Safe 2 Begusarai Bakhari Alluvium 7719 0 7719 2130.71 967.20 362.45 81.83 1411.48 66.24 Safe 3 Begusarai Balia Alluvium 14888 0 14888 4608.97 2546.70 456.44 167.14 3170.28 68.78 Safe 4 Begusarai Barauni Alluvium 12167 0 12167 4533.29 1622.40 738.46 151.20 2512.06 55.41 Safe 5 Begusarai Begusarai Alluvium 22214 0 22214 7770.42 3139.50 845.91 230.01 4215.42 54.25 Safe 6 Begusarai Bhagwanpur Alluvium 11343 0 11343 3826.39 3237.00 284.25 176.06 3697.31 96.63 Critical 7 Begusarai Birpur Alluvium 5164 0 5164 2147.24 696.15 160.45 42.83 899.43 41.89 Safe 8 Begusarai CheriaBariarpur Alluvium 10387 0 10387 2579.92 670.80 241.46 45.61 957.87 37.13 Safe 9 Begusarai Chhaurahi Alluvium 10299 0 10299 3764.87 1688.70 204.44 94.66 1987.80 52.80 Safe
10 Begusarai Dandari Alluvium 7050 0 7050 1927.92 1121.25 127.17 62.42 1310.84 67.99 Safe 11 Begusarai Garhpura Alluvium 6135 0 6135 2889.59 456.30 182.90 31.96 671.16 23.23 Safe 12 Begusarai Khudabandpur Alluvium 4727 0 4727 1452.49 990.60 148.74 56.97 1196.31 82.36 Semi-Critical 13 Begusarai MansurChowk Alluvium 4132 0 4132 2338.82 380.25 150.17 28.66 559.09 23.90 Safe 14 Begusarai Matihani Alluvium 17674 0 17674 5653.26 1076.40 251.41 66.39 1394.20 24.66 Safe 15 Begusarai Naokothi Alluvium 5268 0 5268 2969.94 2552.55 170.14 136.13 2858.82 96.26 Critical 16 Begusarai Shamho Alluvium 6578 0 6578 1918.13 848.25 50.66 44.95 943.86 49.21 Safe 17 Begusarai SahebpurKamal Alluvium 14440 0 14440 4032.42 1173.90 319.63 74.68 1568.21 38.89 Safe 18 Begusarai Teghra Alluvium 14474 0 14474 3918.39 1411.80 845.36 161.10 2418.25 61.72 Safe
District Begusarai 189131 0 189131 64327.81 26045.40 5862.38 1742.00 33649.78 52.31 1 Bhabhua Adhaura HardRock 92342 20093 72249 8190.44 513.09 93.99 30.35 637.43 7.78 Safe 2 Bhabhua Bhabhua Alluvium 33449 0 33449 10187.03 5074.17 413.61 279.45 5767.23 56.61 Safe 3 Bhabhua Bhagwanpur Alluvium/Hardrock 23150 12124 11026 7444.88 1087.01 397.79 74.24 1559.04 20.94 Safe 4 Bhabhua Chainpur Alluvium/Hardrock 45464 4137 41327 14022.49 1822.45 308.97 106.57 2237.99 15.96 Safe 5 Bhabhua Chand Alluvium 20670 0 20670 6563.55 3038.14 220.06 162.91 3421.11 52.12 Safe 6 Bhabhua Durgawati Alluvium 16764 0 16764 5081.59 1546.56 225.46 88.60 1860.62 36.61 Safe 7 Bhabhua Kudra Alluvium 21054 0 21054 14153.82 2902.57 271.85 158.72 3333.14 23.55 Safe 8 Bhabhua Mohania Alluvium 28552 0 28552 8596.32 4256.91 392.74 234.60 4884.25 56.82 Safe 9 Bhabhua Nuaon Alluvium 18900 0 18900 5747.92 2722.78 175.36 144.91 3043.05 52.94 Safe
10 Bhabhua Ramgarh Alluvium 16852 0 16852 3651.08 1136.15 246.99 71.83 1454.97 39.85 Safe 11 Bhabhua Rampur Alluvium/Hardrock 19009 1812 17197 6262.22 1413.37 146.30 77.98 1637.65 26.15 Safe
District Bhabhua 336206 38166 298040 89901.33 25513.20 2893.14 1430.16 29836.51 33.19 1 Bhagalpur Bihpur Alluvium 15208 0 15208 3292.15 850.30 159.60 50.50 1060.40 32.21 Safe 2 Bhagalpur Gopalpur Alluvium 13257 0 13257 3593.64 1156.30 125.82 64.11 1346.23 37.46 Safe 3 Bhagalpur Goradih Alluvium 13425 0 13425 3158.32 708.90 185.43 44.72 939.05 29.73 Safe 4 Bhagalpur Ismailpur Alluvium 8269 0 8269 1578.78 491.00 61.94 27.65 580.59 36.77 Safe 5 Bhagalpur Jagdishpur Alluvium 10993 0 10993 4138.54 1399.30 1063.90 214.22 2677.41 64.69 Safe 6 Bhagalpur Kahalgaon Alluvium 33584 0 33584 8894.68 1061.20 567.80 94.13 1723.13 19.37 Safe 7 Bhagalpur Kharik Alluvium 13157 0 13157 3581.94 242.50 169.34 20.59 432.43 12.07 Safe

121
Sl. No.
District
Block
Sub-Unit
TotalArea
Hilly Area
GW
Worthy Area
NetGW
Resource
GrossGW Draftfor irrigation
GrossGW Draftfor
Domestic Purposes
GrossGW Draftby Industry
GrossDraft (AllUses)
StageOf GW
Developme nt
Category
(ha) (ha) (ha) (ha-m) (ha-m) (ha-m) (ha-m) (ha-m) (%) 8 Bhagalpur Narayanpur Alluvium 14427 0 14427 4051.83 842.50 134.90 48.87 1026.27 25.33 Safe 9 Bhagalpur Nathnagar Alluvium 12608 0 12608 3250.03 1108.90 200.72 66.06 1375.68 42.33 Safe
10 Bhagalpur Naugachia Alluvium 10670 0 10670 2880.20 829.10 328.12 76.56 1233.78 42.84 Safe 11 Bhagalpur Pirpainti Alluvium 35006 0 35006 9353.21 978.70 360.95 66.98 1406.63 15.04 Safe 12 Bhagalpur Rangrachowk Alluvium 11994 0 11994 3342.05 497.30 119.53 30.84 647.67 19.38 Safe 13 Bhagalpur Sabour Alluvium 11495 0 11495 3092.00 596.90 180.34 43.02 820.25 26.53 Safe 14 Bhagalpur Shahkund Alluvium 16818 0 16818 4937.85 1234.10 252.11 74.31 1560.52 31.60 Safe 15 Bhagalpur Sonhaula Alluvium 17420 0 17420 4666.15 1011.80 247.86 62.98 1322.64 28.35 Safe 16 Bhagalpur Sultanganj Alluvium 21924 0 21924 6680.52 829.20 322.13 63.82 1215.15 18.19 Safe
District Bhagalpur 260255 0 260255 70491.88 13838.00 4480.48 1049.35 19367.83 27.48 1 Bhojpur Agaiyon Alluvium 15599 0 15599 6896.87 721.06 244.24 48.27 1013.57 14.70 Safe 2 Bhojpur Arrah Alluvium 18491 0 18491 5978.88 4104.34 718.50 267.89 5090.74 85.15 Semi-Critical 3 Bhojpur Barhara Alluvium 20807 0 20807 5247.14 1848.42 396.12 112.23 2356.77 44.92 Safe 4 Bhojpur Behea Alluvium 14007 0 14007 4866.36 3952.83 381.65 225.50 4559.98 93.70 Critical 5 Bhojpur Charpokhari Alluvium 10931 0 10931 6850.40 813.11 166.86 49.00 1028.97 15.02 Safe 6 Bhojpur Garhani Alluvium 11201 0 11201 4249.75 1670.75 169.98 92.04 1932.77 45.48 Safe 7 Bhojpur Jagdishpur Alluvium 25778 0 25778 10575.19 7392.05 541.34 409.24 8342.63 78.89 Semi-Critical 8 Bhojpur Koilbar Alluvium 10846 0 10846 3542.24 2679.72 391.17 159.82 3230.71 91.21 Critical 9 Bhojpur Piro Alluvium 21839 0 21839 8566.80 6236.28 530.85 349.48 7116.61 83.07 Semi-Critical
10 Bhojpur Sahar Alluvium 12729 0 12729 4707.69 891.35 181.53 53.64 1126.52 23.93 Safe 11 Bhojpur Sandesh Alluvium 13009 0 13009 5211.34 2621.21 180.60 140.09 2941.90 56.45 Safe 12 Bhojpur Shahpur Alluvium 15143 0 15143 4111.04 2524.87 407.89 154.20 3086.96 75.09 Semi-Critical 13 Bhojpur Tarari Alluvium 20098 0 20098 7025.34 3469.24 300.64 188.49 3958.37 56.34 Safe 14 Bhojpur Udwantnagar Alluvium 17052 0 17052 6914.00 1301.25 259.78 78.05 1639.08 23.71 Safe
District Bhojpur 227530 0 227530 84743.03 40226.48 4871.15 2327.95 47425.58 55.96 1 Buxar Brahampur Alluvium 19029 0 19029 5518.73 2455.80 322.76 138.93 2917.49 52.87 Safe 2 Buxar Buxar Alluvium 17676 0 17676 7280.01 2909.70 461.09 180.13 3550.91 48.78 Safe 3 Buxar Chaungai Alluvium 5465 0 5465 2363.15 1673.10 80.24 87.67 1841.01 77.90 Semi-Critical 4 Buxar Chakki Alluvium 838 0 838 711.84 349.50 69.56 20.95 440.01 61.81 Safe 5 Buxar Chausa Alluvium 10804 0 10804 4619.70 2160.60 170.66 116.56 2447.82 52.99 Safe 6 Buxar Dumraon Alluvium 19799 0 19799 6900.97 2369.70 374.20 143.52 2887.42 41.84 Safe 7 Buxar Itarhi Alluvium 22893 0 22893 8298.49 4155.60 280.88 221.82 4658.30 56.13 Safe 8 Buxar Kesath Alluvium 3079 0 3079 1266.32 285.00 55.67 17.03 357.70 28.25 Safe 9 Buxar Nawanagar Alluvium 18450 0 18450 7393.40 1236.00 274.14 75.51 1585.65 21.45 Safe
10 Buxar Rajpur Alluvium 27434 0 27434 9938.82 5461.50 351.51 290.65 6103.66 61.41 Safe 11 Buxar Simari Alluvium 16915 0 16915 4957.88 3232.50 341.12 178.68 3752.30 75.68 Semi-Critical
District Buxar 162382 0 162382 59249.30 26289.00 2781.83 1471.45 30542.28 51.55 1 Darbhanga Alinagar Alluvium 9504 0 9504 2285.19 709.80 236.71 47.33 993.84 43.49 Safe 2 Darbhanga Bahadurpur Alluvium 16851 0 16851 4129.81 1503.45 445.48 98.98 2047.90 49.59 Safe

122
Sl. No.
District
Block
Sub-Unit
TotalArea
Hilly Area
GW
Worthy Area
NetGW
Resource
GrossGW Draftfor irrigation
GrossGW Draftfor
Domestic Purposes
GrossGW Draftby Industry
GrossDraft (AllUses)
StageOf GW
Developme nt
Category
(ha) (ha) (ha) (ha-m) (ha-m) (ha-m) (ha-m) (ha-m) (%) 3 Darbhanga Baheri Alluvium 21482 0 21482 6801.04 2381.55 498.20 143.99 3023.74 44.46 Safe 4 Darbhanga Benipur Alluvium 16259 0 16259 5606.96 1735.50 660.09 152.36 2547.95 45.44 Safe 5 Darbhanga Biraul Alluvium 18443 0 18443 6912.01 1703.55 470.98 108.73 2283.26 33.03 Safe 6 Darbhanga Darbhanga Alluvium 20612 0 20612 14066.93 575.85 1949.44 235.94 2761.24 19.63 Safe 7 Darbhanga Ghanashyampur Alluvium 10345 0 10345 2554.90 1234.95 219.28 72.71 1526.94 59.77 Safe 8 Darbhanga Goura-bouram Alluvium 11619 0 11619 3295.06 553.80 250.40 40.21 844.41 25.63 Safe 9 Darbhanga Hanumannagar Alluvium 13979 0 13979 4521.99 2013.00 254.55 113.38 2380.93 52.65 Safe
10 Darbhanga Hayaghat Alluvium 8601 0 8601 2864.25 1482.45 243.76 86.31 1812.52 63.28 Safe 11 Darbhanga Jale Alluvium 18679 0 18679 4110.71 694.80 434.99 56.49 1186.28 28.86 Safe 12 Darbhanga Keoti Alluvium 15008 0 15008 5857.61 599.25 445.65 52.24 1097.14 18.73 Safe 13 Darbhanga Kiratpur Alluvium 6236 0 6236 1309.46 323.70 134.03 22.89 480.62 36.70 Safe 14 Darbhanga KusheshwarAsthan Alluvium 11659 0 11659 4049.85 1439.10 268.11 85.36 1792.57 44.26 Safe 15 Darbhanga KusheshwarAsthan(E) Alluvium 12124 0 12124 5986.36 1170.00 212.05 69.10 1451.15 24.24 Safe 16 Darbhanga Manigacchi Alluvium 13620 0 13620 4124.42 864.45 376.34 62.04 1302.83 31.59 Safe 17 Darbhanga Singhwara Alluvium 17038 0 17038 5938.45 1443.45 440.51 94.20 1978.16 33.31 Safe 18 Darbhanga Tardih Alluvium 8370 0 8370 3567.08 325.65 202.97 26.43 555.05 15.56 Safe
District Darbhanga 250429 0 250429 87982.07 20754.30 7743.54 1568.69 30066.53 34.17 1 EastChamparan Adapur Alluvium 15318 0 15318 6715.76 1791.87 335.01 106.34 2233.22 33.25 Safe 2 EastChamparan Areraj Alluvium 18947 0 18947 6699.67 1596.97 355.49 108.39 2060.84 30.76 Safe 3 EastChamparan Bankatwa Alluvium 8846 0 8846 3763.37 1120.15 192.37 65.63 1378.15 36.62 Safe 4 EastChamparan Banjharia Alluvium 13935 0 13935 4326.46 770.99 267.80 51.94 1090.73 25.21 Safe 5 EastChamparan Chakia(Pipra) Alluvium 17335 0 17335 4714.40 2100.64 424.12 133.88 2658.64 56.39 Safe 6 EastChamparan Chhouradanu(Narkati Alluvium 13490 0 13490 4295.49 975.94 281.09 62.85 1319.88 30.73 Safe 7 EastChamparan Chiraiya Alluvium 20533 0 20533 6228.10 2651.75 455.67 155.37 3262.79 52.39 Safe 8 EastChamparan Dhaka Alluvium 16906 0 16906 7184.07 2592.04 662.19 178.27 3432.51 47.78 Safe 9 EastChamparan Ghorasahan Alluvium 11901 0 11901 4346.74 1112.26 287.85 70.01 1470.12 33.82 Safe
10 EastChamparan Harsidhi Alluvium 19010 0 19010 8596.31 5047.59 366.35 270.70 5684.64 66.13 Safe 11 EastChamparan Kalyanpur Alluvium 23811 0 23811 7608.50 2529.33 440.46 148.49 3118.28 40.98 Safe 12 EastChamparan Kesaria Alluvium 18825 0 18825 7127.25 1215.12 382.80 88.58 1686.50 23.66 Safe 13 EastChamparan Kotwa Alluvium 15203 0 15203 4771.62 1635.40 277.85 95.66 2008.91 42.10 Safe 14 EastChamparan Madhuban Alluvium 12150 0 12150 3408.13 2527.70 322.28 149.53 2999.51 88.01 Semi-Critical 15 EastChamparan Mehsi Alluvium 12168 0 12168 3829.26 1470.77 370.60 101.88 1943.24 50.75 Safe 16 EastChamparan Motihari Alluvium 25158 0 25158 6235.19 1652.39 578.39 125.24 2356.02 37.79 Safe 17 EastChamparan Paharpur Alluvium 15466 0 15466 5407.66 1663.20 301.27 98.22 2062.69 38.14 Safe 18 EastChamparan Pakaridayal Alluvium 11655 0 11655 2661.15 438.98 338.09 50.85 827.91 31.11 Safe 19 EastChamparan Patahi Alluvium 11849 0 11849 3975.77 1388.33 273.99 83.12 1745.44 43.90 Safe 20 EastChamparan Phenhara Alluvium 5459 0 5459 1347.34 678.42 132.23 40.53 851.18 63.18 Safe 21 EastChamparan Piprakothi Alluvium 4882 0 4882 1513.85 790.55 126.90 45.87 963.32 63.63 Safe 22 EastChamparan Ramgarhwa Alluvium 16766 0 16766 5963.78 1840.44 330.87 108.57 2279.88 38.23 Safe

123
Sl. No.
District
Block
Sub-Unit
TotalArea
Hilly Area
GW
Worthy Area
NetGW
Resource
GrossGW Draftfor irrigation
GrossGW Draftfor
Domestic Purposes
GrossGW Draftby Industry
GrossDraft (AllUses)
StageOf GW
Developme nt
Category
(ha) (ha) (ha) (ha-m) (ha-m) (ha-m) (ha-m) (ha-m) (%) 23 EastChamparan Raxaul Alluvium 13137 0 13137 4806.95 1032.30 372.81 76.24 1481.35 30.82 Safe 24 EastChamparan Sangrampur Alluvium 14766 0 14766 4686.47 935.36 237.16 58.63 1231.15 26.27 Safe 25 EastChamparan Sugouli Alluvium 16725 0 16725 5900.33 1500.20 507.73 116.18 2124.11 36.00 Safe 26 EastChamparan Tetaria Alluvium 8035 0 8035 2664.81 1207.40 169.24 68.83 1445.47 54.24 Safe 27 EastChamparan Turkaulia Alluvium 13611 0 13611 4930.60 1872.35 296.91 108.46 2277.72 46.20 Safe
District EastChamparan 395887 0 395887 133709.02 44138.44 9087.55 2768.24 55994.23 41.88 1 Gaya Amas Alluvium/Hardrock 10844 0 10844 2223.33 1161.70 172.89 66.73 1401.32 63.03 Safe 2 Gaya Atri Alluvium/Hardrock 13002 0 13002 1634.84 709.65 135.47 42.25 887.37 54.28 Safe 3 Gaya BankaBazar Alluvium/Hardrock 20718 0 20718 2645.52 880.20 213.38 54.68 1148.26 43.40 Safe 4 Gaya Barachatti Alluvium/Hardrock 29529 2749 26780 2812.42 1080.69 234.63 65.76 1381.08 49.11 Safe 5 Gaya Belaganj Alluvium 19795 0 19795 5567.09 3524.06 365.45 194.48 4083.99 73.36 Semi-Critical 6 Gaya Bodhgaya Alluvium/Hardrock 29484 0 29484 9368.46 6532.34 478.13 372.69 7383.16 78.81 Semi-Critical 7 Gaya Dobhi Alluvium/Hardrock 18313 1312 17001 3001.72 1167.68 255.83 71.17 1494.68 49.79 Safe 8 Gaya Dumaria HardRock 32098 1687 30411 3435.75 2780.52 211.86 149.62 3142.00 91.45 Critical 9 Gaya Fatehpur Alluvium/Hardrock 33594 680 32914 5826.63 2300.53 387.85 134.42 2822.80 48.45 Safe
10 Gaya GayaSadar Alluvium 18849 500 18349 4382.20 1178.72 1741.43 297.02 3217.17 73.41 Semi-Critical 11 Gaya Guraru Alluvium/Hardrock 16498 0 16498 4502.50 2240.82 220.90 124.97 2586.69 57.45 Safe 12 Gaya Gurua Alluvium 18941 0 18941 5269.34 2494.41 303.36 139.89 2937.66 55.75 Safe 13 Gaya Imamganj Alluvium/Hardrock 26418 0 26418 3313.80 3412.19 317.40 186.47 3916.06 118.17 OverExploited 14 Gaya Khizirsarai Alluvium 18456 0 18456 4333.08 3100.43 289.80 169.51 3559.74 82.15 Semi-Critical 15 Gaya Konch Alluvium 25559 0 25559 8217.33 5757.16 332.39 304.48 6394.03 77.81 Semi-Critical 16 Gaya Mouhra Alluvium 14764 0 14764 3938.32 1911.04 165.96 103.85 2180.85 55.38 Safe 17 Gaya Manpur Alluvium/Hardrock 12423 0 12423 2964.82 3312.50 244.32 177.84 3734.66 125.97 OverExploited 18 Gaya Mohanpur Alluvium/Hardrock 34309 680 33629 5689.22 1355.08 329.47 84.23 1768.78 31.09 Safe 19 Gaya NimchakBathani Alluvium 11848 0 11848 2787.16 1125.30 162.32 64.38 1352.00 48.51 Safe 20 Gaya Paraiya Alluvium 14190 0 14190 5243.56 2326.01 167.86 124.69 2618.56 49.94 Safe 21 Gaya Sherghati Alluvium/Hardrock 13879 0 13879 4250.03 1779.96 348.71 123.76 2252.43 53.00 Safe 22 Gaya Tankupa Alluvium/Hardrock 15015 0 15015 3267.29 1167.08 205.67 68.64 1441.39 44.12 Safe 23 Gaya Tekari Alluvium 23496 0 23496 7364.01 5558.80 480.73 309.21 6348.73 86.21 Semi-Critical 24 Gaya Wazirganj Alluvium/Hardrock 26564 0 26564 5802.49 2350.46 365.00 135.78 2851.24 49.14 Safe
District Gaya 498586 7608 490978 107840.86 59207.33 8130.81 3566.53 70904.67 65.75 1 Gopalganj Baikunthpur Alluvium 20408 0 20408 7285.64 4217.85 357.49 228.77 4804.11 65.94 Safe 2 Gopalganj Barauli Alluvium 18432 0 18432 6665.47 3956.70 572.25 240.07 4769.02 71.55 Semi-Critical 3 Gopalganj Bijaipur Alluvium 13041 0 13041 4759.05 4871.25 219.00 254.51 5344.76 112.31 OverExploited 4 Gopalganj Bhore Alluvium 14761 0 14761 5446.79 4161.15 293.34 222.72 4677.21 85.87 Semi-Critical 5 Gopalganj Gopalganj Alluvium 19548 0 19548 7183.62 2634.45 350.29 156.50 3141.24 43.73 Safe 6 Gopalganj Hathwa Alluvium 14660 0 14660 6215.63 4589.85 388.68 251.94 5230.47 84.15 Semi-Critical 7 Gopalganj Kateyan Alluvium 12614 0 12614 5359.95 3603.60 281.85 201.74 4087.19 76.25 Semi-Critical 8 Gopalganj Kuchaikot Alluvium 25136 0 25136 11087.42 5880.45 546.59 321.35 6748.39 60.87 Safe
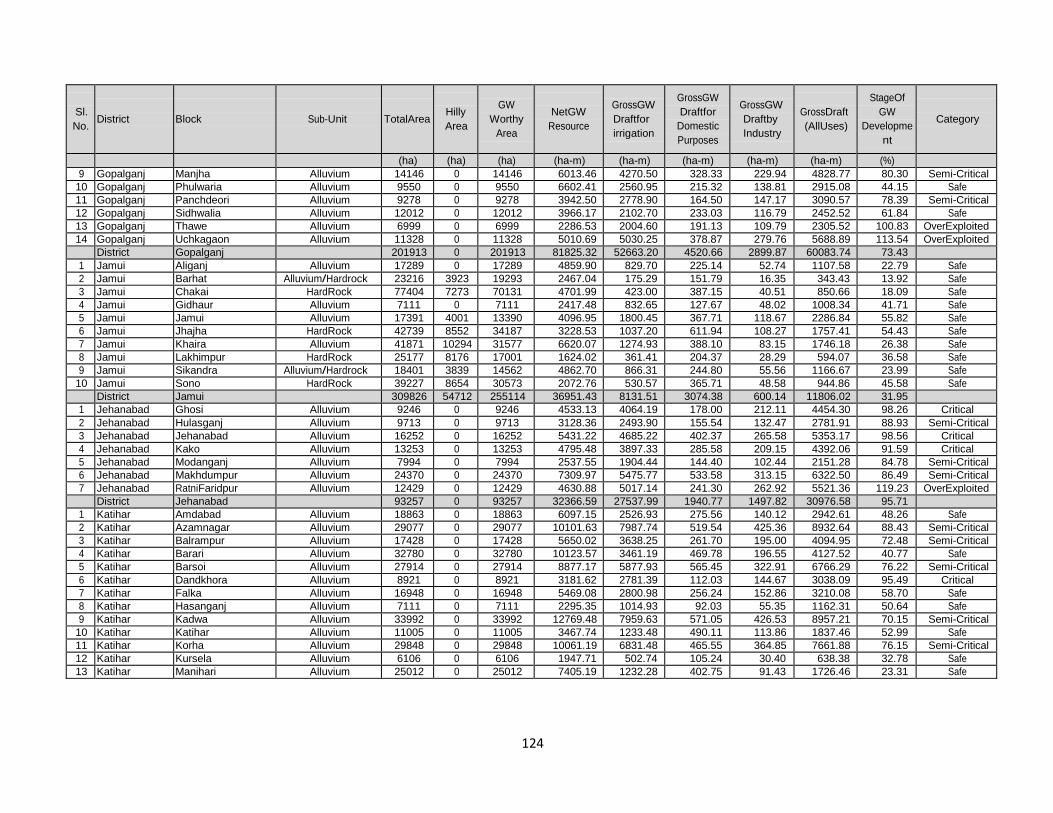
124
Sl. No.
District
Block
Sub-Unit
TotalArea
Hilly Area
GW
Worthy Area
NetGW
Resource
GrossGW Draftfor irrigation
GrossGW Draftfor
Domestic Purposes
GrossGW Draftby Industry
GrossDraft (AllUses)
StageOf GW
Developme nt
Category
(ha) (ha) (ha) (ha-m) (ha-m) (ha-m) (ha-m) (ha-m) (%) 9 Gopalganj Manjha Alluvium 14146 0 14146 6013.46 4270.50 328.33 229.94 4828.77 80.30 Semi-Critical
10 Gopalganj Phulwaria Alluvium 9550 0 9550 6602.41 2560.95 215.32 138.81 2915.08 44.15 Safe 11 Gopalganj Panchdeori Alluvium 9278 0 9278 3942.50 2778.90 164.50 147.17 3090.57 78.39 Semi-Critical 12 Gopalganj Sidhwalia Alluvium 12012 0 12012 3966.17 2102.70 233.03 116.79 2452.52 61.84 Safe 13 Gopalganj Thawe Alluvium 6999 0 6999 2286.53 2004.60 191.13 109.79 2305.52 100.83 OverExploited 14 Gopalganj Uchkagaon Alluvium 11328 0 11328 5010.69 5030.25 378.87 279.76 5688.89 113.54 OverExploited
District Gopalganj 201913 0 201913 81825.32 52663.20 4520.66 2899.87 60083.74 73.43 1 Jamui Aliganj Alluvium 17289 0 17289 4859.90 829.70 225.14 52.74 1107.58 22.79 Safe 2 Jamui Barhat Alluvium/Hardrock 23216 3923 19293 2467.04 175.29 151.79 16.35 343.43 13.92 Safe 3 Jamui Chakai HardRock 77404 7273 70131 4701.99 423.00 387.15 40.51 850.66 18.09 Safe 4 Jamui Gidhaur Alluvium 7111 0 7111 2417.48 832.65 127.67 48.02 1008.34 41.71 Safe 5 Jamui Jamui Alluvium 17391 4001 13390 4096.95 1800.45 367.71 118.67 2286.84 55.82 Safe 6 Jamui Jhajha HardRock 42739 8552 34187 3228.53 1037.20 611.94 108.27 1757.41 54.43 Safe 7 Jamui Khaira Alluvium 41871 10294 31577 6620.07 1274.93 388.10 83.15 1746.18 26.38 Safe 8 Jamui Lakhimpur HardRock 25177 8176 17001 1624.02 361.41 204.37 28.29 594.07 36.58 Safe 9 Jamui Sikandra Alluvium/Hardrock 18401 3839 14562 4862.70 866.31 244.80 55.56 1166.67 23.99 Safe
10 Jamui Sono HardRock 39227 8654 30573 2072.76 530.57 365.71 48.58 944.86 45.58 Safe District Jamui 309826 54712 255114 36951.43 8131.51 3074.38 600.14 11806.02 31.95
1 Jehanabad Ghosi Alluvium 9246 0 9246 4533.13 4064.19 178.00 212.11 4454.30 98.26 Critical 2 Jehanabad Hulasganj Alluvium 9713 0 9713 3128.36 2493.90 155.54 132.47 2781.91 88.93 Semi-Critical 3 Jehanabad Jehanabad Alluvium 16252 0 16252 5431.22 4685.22 402.37 265.58 5353.17 98.56 Critical 4 Jehanabad Kako Alluvium 13253 0 13253 4795.48 3897.33 285.58 209.15 4392.06 91.59 Critical 5 Jehanabad Modanganj Alluvium 7994 0 7994 2537.55 1904.44 144.40 102.44 2151.28 84.78 Semi-Critical 6 Jehanabad Makhdumpur Alluvium 24370 0 24370 7309.97 5475.77 533.58 313.15 6322.50 86.49 Semi-Critical 7 Jehanabad RatniFaridpur Alluvium 12429 0 12429 4630.88 5017.14 241.30 262.92 5521.36 119.23 OverExploited
District Jehanabad 93257 0 93257 32366.59 27537.99 1940.77 1497.82 30976.58 95.71 1 Katihar Amdabad Alluvium 18863 0 18863 6097.15 2526.93 275.56 140.12 2942.61 48.26 Safe 2 Katihar Azamnagar Alluvium 29077 0 29077 10101.63 7987.74 519.54 425.36 8932.64 88.43 Semi-Critical 3 Katihar Balrampur Alluvium 17428 0 17428 5650.02 3638.25 261.70 195.00 4094.95 72.48 Semi-Critical 4 Katihar Barari Alluvium 32780 0 32780 10123.57 3461.19 469.78 196.55 4127.52 40.77 Safe 5 Katihar Barsoi Alluvium 27914 0 27914 8877.17 5877.93 565.45 322.91 6766.29 76.22 Semi-Critical 6 Katihar Dandkhora Alluvium 8921 0 8921 3181.62 2781.39 112.03 144.67 3038.09 95.49 Critical 7 Katihar Falka Alluvium 16948 0 16948 5469.08 2800.98 256.24 152.86 3210.08 58.70 Safe 8 Katihar Hasanganj Alluvium 7111 0 7111 2295.35 1014.93 92.03 55.35 1162.31 50.64 Safe 9 Katihar Kadwa Alluvium 33992 0 33992 12769.48 7959.63 571.05 426.53 8957.21 70.15 Semi-Critical
10 Katihar Katihar Alluvium 11005 0 11005 3467.74 1233.48 490.11 113.86 1837.46 52.99 Safe 11 Katihar Korha Alluvium 29848 0 29848 10061.19 6831.48 465.55 364.85 7661.88 76.15 Semi-Critical 12 Katihar Kursela Alluvium 6106 0 6106 1947.71 502.74 105.24 30.40 638.38 32.78 Safe 13 Katihar Manihari Alluvium 25012 0 25012 7405.19 1232.28 402.75 91.43 1726.46 23.31 Safe

125
Sl. No.
District
Block
Sub-Unit
TotalArea
Hilly Area
GW
Worthy Area
NetGW
Resource
GrossGW Draftfor irrigation
GrossGW Draftfor
Domestic Purposes
GrossGW Draftby Industry
GrossDraft (AllUses)
StageOf GW
Developme nt
Category
(ha) (ha) (ha) (ha-m) (ha-m) (ha-m) (ha-m) (ha-m) (%) 14 Katihar Mansahi Alluvium 7814 0 7814 2850.49 2271.78 138.70 120.52 2531.00 88.79 Semi-Critical 15 Katihar Pranpur Alluvium 15306 0 15306 5912.47 4291.32 237.53 226.44 4755.29 80.43 Semi-Critical 16 Katihar Samili Alluvium 12866 0 12866 3943.82 1232.28 139.08 68.57 1439.93 36.51 Safe
District Katihar 300991 0 300991 100153.66 55644.33 5102.34 3075.42 63822.10 63.72 1 Khagaria Alauli Alluvium 27447 0 27447 19287.87 2288.00 464.42 137.62 2890.04 14.98 Safe 2 Khagaria Beldaur Alluvium 22356 0 22356 15906.14 3000.68 329.60 166.51 3496.79 21.98 Safe 3 Khagaria Chautham Alluvium 16397 0 16397 7052.96 1589.68 253.23 92.15 1935.06 27.44 Safe 4 Khagaria Gogari Alluvium 25031 0 25031 8834.48 4699.06 645.74 281.15 5625.95 63.68 Safe 5 Khagaria Khagaria Alluvium 26236 0 26236 7352.69 1314.20 619.64 101.94 2035.77 27.69 Safe 6 Khagaria Mansi Alluvium 7001 0 7001 2289.96 1196.38 145.70 67.10 1409.18 61.54 Safe 7 Khagaria Parbatta Alluvium 24104 0 24104 7903.81 4170.48 401.77 228.61 4800.86 60.74 Safe
District Khagaria 148572 0 148572 68627.92 18258.48 2860.10 1075.08 22193.66 32.34 1 Kishanganj Kishanganj Alluvium 18103 0 18103 6761.11 1365.60 379.53 100.39 1845.52 27.30 Safe 2 Kishanganj KochDhami Alluvium 28691 0 28691 10925.33 2036.85 480.88 125.89 2643.62 24.20 Safe 3 Kishanganj Bahadurganj Alluvium 24787 0 24787 9065.90 1018.50 539.22 95.08 1652.80 18.23 Safe 4 Kishanganj Teragachi Alluvium 19347 0 19347 7102.67 912.60 232.17 57.24 1202.01 16.92 Safe 5 Kishanganj Dighabank Alluvium 25532 0 25532 9296.69 863.85 342.98 60.34 1267.17 13.63 Safe 6 Kishanganj Thakurganj Alluvium 39238 0 39238 14381.01 1584.00 540.54 114.48 2239.02 15.57 Safe 7 Kishanganj Pothia Alluvium 35445 0 35445 13520.04 3867.30 432.10 214.97 4514.37 33.39 Safe
District Kishanganj 191143 0 191143 71052.76 11648.70 2947.43 768.39 15364.52 21.62 1 Lakhisarai Barahia Alluvium 24106 0 24106 6206.97 250.39 332.62 45.90 628.91 10.13 Safe 2 Lakhisarai Halsi Alluvium/Hardrock 15106 1687 13419 3603.29 1673.71 207.65 94.06 1975.42 54.82 Safe 3 Lakhisarai Lakhisarai Alluvium/Hardrock 17362 0 17362 5653.79 1690.47 290.54 106.49 2087.50 36.92 Safe 4 Lakhisarai Piparia Alluvium 5839 0 5839 2155.90 663.29 51.06 35.72 750.07 34.79 Safe 5 Lakhisarai RamgarhChowk Alluvium/Hardrock 10427 1172 9255 2264.84 389.93 292.22 34.11 716.26 31.63 Safe 6 Lakhisarai Surajgarha Alluvium/Hardrock 38966 5421 33545 7440.63 1089.12 369.26 72.92 1531.30 20.58 Safe 7 Lakhisarai Channan Alluvium/Hardrock 10968 0 10968 1630.06 721.57 185.76 50.12 957.45 58.74 Safe
District Lakhisarai 122774 8280 114494 28955.48 6478.48 1729.10 439.32 8646.91 29.86 1 Madhepura Alamnagar Alluvium 17120 0 17120 5233.84 2755.35 288.74 152.20 3196.29 61.07 Safe 2 Madhepura Bihariganj Alluvium 10568 0 10568 3492.28 2256.15 223.11 123.96 2603.22 74.54 Semi-Critical 3 Madhepura Chausa Alluvium 13665 0 13665 5078.04 2660.40 251.36 145.59 3057.35 60.21 Safe 4 Madhepura Ghailarh Alluvium 9177 0 9177 2919.28 1067.25 151.15 60.92 1279.32 43.82 Safe 5 Madhepura Gamharia Alluvium 7655 0 7655 1999.34 1277.25 135.84 70.65 1483.74 74.21 Semi-Critical 6 Madhepura Gwalpara Alluvium 11668 0 11668 3516.08 2673.15 207.45 144.03 3024.63 86.02 Semi-Critical 7 Madhepura Kumarkhand Alluvium 24709 0 24709 7749.79 3380.55 401.05 189.08 3970.68 51.24 Safe 8 Madhepura Madhepura Alluvium 18995 0 18995 4265.42 1051.05 584.04 104.10 1739.19 40.77 Safe 9 Madhepura Murliganj Alluvium 19745 0 19745 9550.47 2646.00 447.26 165.96 3259.22 34.13 Safe
10 Madhepura Puraini Alluvium 8698 0 8698 3815.80 1454.70 171.92 81.33 1707.95 44.76 Safe 11 Madhepura Sankarpur Alluvium 10858 0 10858 3346.87 2281.50 174.86 122.82 2579.18 77.06 Semi-Critical

126
Sl. No.
District
Block
Sub-Unit
TotalArea
Hilly Area
GW
Worthy Area
NetGW
Resource
GrossGW Draftfor irrigation
GrossGW Draftfor
Domestic Purposes
GrossGW Draftby Industry
GrossDraft (AllUses)
StageOf GW
Developme nt
Category
(ha) (ha) (ha) (ha-m) (ha-m) (ha-m) (ha-m) (ha-m) (%) 12 Madhepura Singheswar Alluvium 11113 0 11113 4253.06 2722.80 238.29 150.22 3111.31 73.15 Semi-Critical 13 Madhepura UdaKishanganj Alluvium 14869 0 14869 5252.05 3712.80 311.38 201.21 4225.39 80.45 Semi-Critical
District Madhepura 178840 0 178840 60472.30 29938.95 3586.43 1712.07 35237.45 58.27 1 Madhubani Andaratharhi Alluvium 14810 0 14810 5471.12 821.46 315.53 56.85 1193.84 21.82 Safe 2 Madhubani Babubarahi Alluvium 18914 0 18914 6884.96 1795.50 357.76 107.66 2260.92 32.84 Safe 3 Madhubani Basopatti Alluvium 13078 0 13078 5948.15 1274.46 285.61 78.00 1638.07 27.54 Safe 4 Madhubani Benipatti Alluvium 26238 0 26238 6451.27 1935.96 594.92 126.54 2657.42 41.19 Safe 5 Madhubani Bisfi Alluvium 18122 0 18122 4681.40 1556.67 527.93 104.23 2188.83 46.76 Safe 6 Madhubani Ghoghardiha Alluvium 16438 0 16438 6812.02 2274.00 377.96 144.09 2796.04 41.05 Safe 7 Madhubani Harlakhi Alluvium 14792 0 14792 7375.01 1012.95 323.06 66.80 1402.81 19.02 Safe 8 Madhubani Jainagar Alluvium 12922 0 12922 3755.67 858.39 390.57 71.73 1320.69 35.17 Safe 9 Madhubani Jhanjharpur Alluvium 14594 0 14594 6969.72 1103.76 439.03 89.61 1632.40 23.42 Safe
10 Madhubani Khajauli Alluvium 11415 0 11415 2744.21 1216.35 236.36 72.64 1525.35 55.58 Safe 11 Madhubani Kaluahi Alluvium 8895 0 8895 2137.86 926.01 193.06 55.95 1175.02 54.96 Safe 12 Madhubani Ladania Alluvium 18385 0 18385 4003.93 1668.51 289.00 97.88 2055.39 51.33 Safe 13 Madhubani Lakhnaur Alluvium 11748 0 11748 4694.07 1336.23 276.29 80.63 1693.15 36.07 Safe 14 Madhubani Laukaha Alluvium 21521 0 21521 4615.63 1557.36 349.19 95.33 2001.88 43.37 Safe 15 Madhubani Laukahi Alluvium 26634 0 26634 7250.66 1495.59 342.92 91.93 1930.44 26.62 Safe 16 Madhubani Madhepura Alluvium 23572 0 23572 5168.15 1121.37 221.74 67.16 1410.27 27.29 Safe 17 Madhubani Madhubani Alluvium 15473 0 15473 3478.41 1332.90 519.05 101.81 1953.76 56.17 Safe 18 Madhubani Madhwapur Alluvium 10833 0 10833 5125.10 1183.05 440.52 81.18 1704.75 33.26 Safe 19 Madhubani Pandaul Alluvium 16398 0 16398 3726.23 2027.88 445.52 123.67 2597.07 69.70 Safe 20 Madhubani Phulparas Alluvium 15971 0 15971 4760.91 1253.07 273.29 76.32 1602.68 33.66 Safe 21 Madhubani Rajnagar Alluvium 17892 0 17892 3863.40 1609.23 433.03 105.56 2147.82 55.59 Safe
District Madhubani 348645 0 348645 105917.86 29360.70 7632.32 1895.56 38888.58 36.72 1 Munger Asarganj Alluvium 5948 0 5948 2168.13 1062.70 143.27 62.84 1268.81 58.52 Safe 2 Munger Bariarpur Alluvium/Hardrock 16052 0 16052 4007.95 457.20 196.22 34.36 687.79 17.16 Safe 3 Munger Dharhara Alluvium/Hardrock 28285 2593 25692 6746.23 931.30 216.88 57.40 1205.58 17.87 Safe 4 Munger Jamalpur Alluvium/Hardrock 8545 0 8545 2179.33 695.90 325.59 61.96 1083.44 49.71 Safe 5 Munger Kharagpur Alluvium/Hardrock 30679 3815 26864 4428.27 1643.70 452.81 117.19 2213.70 49.99 Safe 6 Munger Munger Alluvium/Hardrock 24205 0 24205 4574.22 1076.30 536.74 103.86 1716.91 37.53 Safe 7 Munger Sangrampur Alluvium/Hardrock 8594 0 8594 3332.88 782.60 160.88 47.17 990.65 29.72 Safe 8 Munger Tarapur Alluvium 7104 0 7104 4082.34 829.20 243.15 60.64 1132.99 27.75 Safe 9 Munger TetiaBhamber Alluvium/Hardrock 10138 0 10138 2676.26 826.90 125.61 47.62 1000.13 37.37 Safe
District Munger 139550 6408 133142 34195.61 8305.80 2401.16 593.04 11300.00 33.05 1 Muzaffarpur Aurai Alluvium 19477 0 19477 6036.52 3201.32 478.28 183.98 3863.58 64.00 Safe 2 Muzaffarpur Bandra Alluvium 11049 0 11049 3736.80 2198.61 204.22 120.14 2522.97 67.52 Safe 3 Muzaffarpur Baruraj(Motipur) Alluvium 31356 0 31356 10699.70 5082.94 763.71 305.19 6151.84 57.50 Safe 4 Muzaffarpur Bochaha Alluvium 16136 0 16136 5613.38 3596.38 404.39 200.04 4200.81 74.84 Semi-Critical

127
Sl. No.
District
Block
Sub-Unit
TotalArea
Hilly Area
GW
Worthy Area
NetGW
Resource
GrossGW Draftfor irrigation
GrossGW Draftfor
Domestic Purposes
GrossGW Draftby Industry
GrossDraft (AllUses)
StageOf GW
Developme nt
Category
(ha) (ha) (ha) (ha-m) (ha-m) (ha-m) (ha-m) (ha-m) (%) 5 Muzaffarpur Gaighat Alluvium 21020 0 21020 5501.25 3064.40 427.53 174.60 3666.53 66.65 Safe 6 Muzaffarpur Kanti Alluvium 16816 0 16816 7795.69 2541.17 577.35 170.86 3289.38 42.19 Safe 7 Muzaffarpur Katra Alluvium 18915 0 18915 4385.24 2374.91 403.01 138.90 2916.82 66.51 Safe 8 Muzaffarpur Kurahni Alluvium 26025 0 26025 9265.57 6054.42 717.19 338.58 7110.19 76.74 Semi-Critical 9 Muzaffarpur Minapur Alluvium 23658 0 23658 7993.47 4878.76 561.21 272.00 5711.97 71.46 Semi-Critical
10 Muzaffarpur Moraul(Dholi) Alluvium 6263 0 6263 1532.26 984.52 148.96 56.67 1190.15 77.67 Semi-Critical 11 Muzaffarpur Marwan Alluvium 11514 0 11514 5767.98 2751.44 271.38 151.14 3173.96 55.03 Safe 12 Muzaffarpur Mushari Alluvium 11997 0 11997 4716.67 3481.68 1439.43 324.40 5245.51 111.21 OverExploited 13 Muzaffarpur Paru Alluvium 29152 0 29152 10476.74 5220.89 595.35 290.81 6107.05 58.29 Safe 14 Muzaffarpur Sakra Alluvium 17492 0 17492 7442.81 6707.45 505.09 360.63 7573.17 101.75 OverExploited 15 Muzaffarpur Saraia Alluvium 24684 0 24684 10845.75 5424.81 545.95 298.54 6269.30 57.80 Safe 16 Muzaffarpur Shahebganj Alluvium 18723 0 18723 8305.74 4652.01 473.90 265.52 5391.44 64.91 Safe
District Muzaffarpur 304277 0 304277 110115.58 62215.71 8516.95 3652.00 74384.67 67.55 1 Nalanda Asthawan Alluvium 14145 0 14145 4234.47 3496.34 269.87 188.31 3954.52 93.39 Critical 2 Nalanda Ben Alluvium 10083 0 10083 3124.70 2217.31 143.85 118.06 2479.22 79.34 Semi-Critical 3 Nalanda Biharsarif Alluvium 17645 150 17495 7053.60 2173.50 765.07 180.64 3119.21 44.22 Safe 4 Nalanda Bind Alluvium 7260 0 7260 2123.09 1777.81 102.04 93.99 1973.84 92.97 Critical 5 Nalanda Chandi Alluvium 13109 0 13109 7179.88 3276.12 250.47 176.33 3702.92 51.57 Safe 6 Nalanda Ekangasarai Alluvium 13443 0 13443 5534.43 2984.87 303.81 166.77 3455.46 62.44 Safe 7 Nalanda Giriak Alluvium 8093 0 8093 3206.15 3066.61 159.42 161.30 3387.33 105.65 OverExploited 8 Nalanda Harnaut Alluvium 18158 0 18158 5014.18 3642.10 289.95 196.60 4128.65 82.34 Semi-Critical 9 Nalanda Hilsa Alluvium 14424 0 14424 5694.34 1922.10 492.88 142.11 2557.08 44.91 Safe
10 Nalanda Islampur Alluvium 22211 0 22211 6134.93 4195.09 499.80 249.50 4944.39 80.59 Semi-Critical 11 Nalanda Karaiparsauni Alluvium 6476 0 6476 1892.87 1639.32 121.73 88.05 1849.10 97.69 Critical 12 Nalanda katrisarai Alluvium 4227 0 4227 1314.89 723.62 68.84 39.62 832.08 63.28 Safe 13 Nalanda Nagarnausa Alluvium 7530 0 7530 2024.62 1128.74 155.51 64.21 1348.46 66.60 Safe 14 Nalanda Noorsarai Alluvium 12485 0 12485 4291.34 2870.15 283.71 157.69 3311.55 77.17 Semi-Critical 15 Nalanda Parwalpur Alluvium 6301 0 6301 1940.25 1542.83 115.75 82.93 1741.51 89.76 Semi-Critical 16 Nalanda Rahui Alluvium 12168 0 12168 3741.12 2385.65 237.11 131.14 2753.90 73.61 Semi-Critical 17 Nalanda Rajgir Alluvium 16157 3200 12957 3704.07 2861.97 351.22 177.40 3390.58 91.54 Critical 18 Nalanda Sarmera Alluvium 12372 0 12372 3436.94 2067.15 159.81 111.35 2338.31 68.03 Safe 19 Nalanda Silao Alluvium 12435 0 12435 5659.29 1609.92 333.50 109.13 2052.55 36.27 Safe 20 Nalanda Tharthari Alluvium 6274 0 6274 2950.79 1721.44 112.58 91.70 1925.72 65.26 Safe
District Nalanda 234996 3350 231646 80255.93 47302.64 5216.93 2726.82 55246.39 68.84 1 Nawada Akbarpur Alluvium/Hardrock 19801 0 19801 5158.03 3000.60 305.01 165.29 3470.90 67.29 Safe 2 Nawada Govindpur Alluvium/Hardrock 15353 0 15353 4414.84 1029.00 127.83 57.84 1214.67 27.51 Safe 3 Nawada Hisua Alluvium 12270 0 12270 6515.29 1920.30 270.97 121.24 2312.51 35.49 Safe 4 Nawada Kasichak Alluvium 8202 0 8202 2034.50 465.60 107.77 28.67 602.04 29.59 Safe 5 Nawada Kawakol Alluvium/Hardrock 29909 1187 28722 4372.49 754.80 212.63 48.37 1015.80 23.23 Safe

128
Sl. No.
District
Block
Sub-Unit
TotalArea
Hilly Area
GW
Worthy Area
NetGW
Resource
GrossGW Draftfor irrigation
GrossGW Draftfor
Domestic Purposes
GrossGW Draftby Industry
GrossDraft (AllUses)
StageOf GW
Developme nt
Category
(ha) (ha) (ha) (ha-m) (ha-m) (ha-m) (ha-m) (ha-m) (%) 6 Nawada Meskaur HardRock 12183 0 12183 1573.01 1206.00 151.79 67.89 1425.68 90.63 Critical 7 Nawada Nardiganj Alluvium 10189 0 10189 3840.73 1400.40 159.36 77.99 1637.75 42.64 Safe 8 Nawada Narhat Alluvium/Hardrock 7639 0 7639 2504.05 1035.45 140.76 58.81 1235.02 49.32 Safe 9 Nawada Nawada Alluvium 17808 0 17808 4262.65 2562.00 410.24 161.37 3133.61 73.51 Semi-Critical
10 Nawada Pakribarwan Alluvium 20101 0 20101 4654.91 2259.90 245.12 125.25 2630.27 56.51 Safe 11 Nawada Rajauli Alluvium/Hardrock 38019 1812 36207 4277.99 2224.50 226.65 136.47 2587.62 60.49 Safe 12 Nawada Roh Alluvium 16402 0 16402 3822.66 2498.40 209.10 135.37 2842.87 74.37 Semi-Critical 13 Nawada Sirdala Alluvium/Hardrock 24685 0 24685 3306.55 1775.10 224.82 100.00 2099.92 63.51 Safe 14 Nawada Warsaliganj Alluvium 16096 0 16096 7370.10 3966.00 358.57 231.48 4556.05 61.82 Safe
District Nawada 248657 2999 245658 58107.82 26098.05 3150.63 1516.04 30764.72 52.94 1 Patna Athmalgola Alluvium 4025 0 4025 1199.20 1145.89 149.74 64.78 1360.41 113.44 OverExploited 2 Patna Bakhtiarpur Alluvium 19683 0 19683 6945.08 1340.46 532.00 111.18 1983.64 28.56 Safe 3 Patna Barh Alluvium 10959 0 10959 2951.97 1553.39 346.02 101.93 2001.34 67.80 Safe 4 Patna Belchi Alluvium 6867 0 6867 1918.40 1310.52 108.92 70.97 1490.41 77.69 Semi-Critical 5 Patna Bihta Alluvium 19392 0 19392 4495.44 2352.77 614.66 170.57 3138.01 69.80 Safe 6 Patna Bikram Alluvium 14815 0 14815 5413.13 2311.34 353.07 144.05 2808.46 51.88 Safe 7 Patna Danapur Alluvium 12446 0 12446 3178.69 1375.72 611.59 129.34 2116.64 66.59 Safe 8 Patna Daniawan Alluvium 6510 0 6510 1783.30 860.64 123.60 49.21 1033.45 57.95 Safe 9 Patna Dhanarua Alluvium 18555 0 18555 4777.84 2630.82 347.96 148.94 3127.72 65.46 Safe
10 Patna Dulhinbazar Alluvium 11068 0 11068 3465.07 1061.13 205.71 63.34 1330.18 38.39 Safe 11 Patna Fathua Alluvium 12636 0 12636 3244.14 1571.32 317.56 99.94 1988.82 61.30 Safe 12 Patna Ghoshwari Alluvium 13983 0 13983 3514.85 591.69 123.29 35.75 750.73 21.36 Safe 13 Patna Khusrupur Alluvium 6139 0 6139 1624.54 910.31 232.05 63.02 1205.38 74.20 Semi-Critical 14 Patna Maner Alluvium 17070 0 17070 3372.03 1375.72 574.73 112.19 2062.63 61.17 Safe 15 Patna Masuarhi Alluvium 20243 0 20243 5643.03 4027.73 593.97 254.93 4876.63 86.42 Semi-Critical 16 Patna Mokama Alluvium 19132 0 19132 4789.80 1309.49 548.94 117.27 1975.70 41.25 Safe 17 Patna Naubatpur Alluvium 16774 0 16774 6220.06 3542.59 417.49 207.74 4167.82 67.01 Safe 18 Patna Paliganj Alluvium 23775 0 23775 8613.76 2399.44 454.55 146.31 3000.30 34.83 Safe 19 Patna Pandarak Alluvium 20489 0 20489 5265.72 1101.88 254.52 67.82 1424.22 27.05 Safe 20 Patna PatnaSadar Alluvium 15666 0 15666 4075.88 1258.36 2220.95 346.86 3826.17 93.87 Critical 21 Patna Phulwarisarif Alluvium 10647 0 10647 4380.49 3368.18 806.17 247.74 4422.08 100.95 OverExploited 22 Patna Punpun Alluvium 12675 0 12675 4419.48 3749.00 227.40 198.82 4175.22 94.47 Critical 23 Patna Sampatchak Alluvium 6535 0 6535 1862.97 1424.33 175.92 80.01 1680.26 90.19 Critical
District Patna 320084 0 320084 93154.86 42572.72 10340.80 3032.70 55946.22 60.06 1 Purnia Amaur Alluvium 24505 0 24505 9535.74 7058.01 478.30 376.82 7913.13 82.98 Semi-Critical 2 Purnia Baisa Alluvium 20732 0 20732 7601.61 3368.82 317.92 184.34 3871.08 50.92 Safe 3 Purnia Baisi Alluvium 20463 0 20463 6622.20 4146.66 374.84 226.07 4747.57 71.69 Semi-Critical 4 Purnia Banmankhi Alluvium 36884 0 36884 10910.59 4404.81 678.36 265.61 5348.78 49.02 Safe 5 Purnia Baraharakothi Alluvium 22971 0 22971 8075.32 2457.70 344.04 140.09 2941.83 36.43 Safe

129
Sl. No.
District
Block
Sub-Unit
TotalArea
Hilly Area
GW
Worthy Area
NetGW
Resource
GrossGW Draftfor irrigation
GrossGW Draftfor
Domestic Purposes
GrossGW Draftby Industry
GrossDraft (AllUses)
StageOf GW
Developme nt
Category
(ha) (ha) (ha) (ha-m) (ha-m) (ha-m) (ha-m) (ha-m) (%) 6 Purnia Bhawanipur Alluvium 16064 0 16064 6237.69 2916.27 266.21 159.12 3341.60 53.57 Safe 7 Purnia Dagarua Alluvium 20995 0 20995 8788.01 6959.58 364.03 366.18 7689.79 87.50 Semi-Critical 8 Purnia Dhamdaha Alluvium 36254 0 36254 10536.66 3213.00 474.23 184.36 3871.59 36.74 Safe 9 Purnia Jalalgarh Alluvium 11320 0 11320 4004.50 2393.34 185.93 128.96 2708.23 67.63 Safe
10 Purnia K. Nagar Alluvium 28470 0 28470 10578.32 3692.37 379.44 203.59 4275.40 40.42 Safe 11 Purnia Kasba Alluvium 16797 0 16797 5305.73 2072.52 410.19 136.69 2619.40 49.37 Safe 12 Purnia Purnea(E) Alluvium 25727 0 25727 8994.07 4367.10 686.61 286.12 5339.83 59.37 Safe 13 Purnia Rupauli Alluvium 24836 0 24836 7955.51 3408.27 386.33 189.73 3984.33 50.08 Safe 14 Purnia Srinagar Alluvium 14221 0 14221 5564.89 2177.28 181.17 117.92 2476.37 44.50 Safe
District Purnia 320239 0 320239 110710.84 52635.73 5527.61 2965.61 61128.95 55.21 1 Rohtas Akhorigola Alluvium 10470 0 10470 5025.99 1529.01 197.78 86.34 1813.13 36.08 Safe 2 Rohtas Bikramganj Alluvium 13728 0 13728 5059.61 1262.52 428.81 102.62 1793.96 35.46 Safe 3 Rohtas Chenari Alluvium/Hardrock 24368 2125 22243 6461.58 1187.52 255.64 76.68 1519.84 23.52 Safe 4 Rohtas Dawath Alluvium 10638 0 10638 2896.28 333.00 240.72 36.53 610.25 21.07 Safe 5 Rohtas Dehari Alluvium 16210 0 16210 7837.88 1674.72 430.12 119.41 2224.26 28.38 Safe 6 Rohtas Dinara Alluvium 30907 0 30907 7537.00 1271.97 371.15 82.16 1725.28 22.89 Safe 7 Rohtas Karahgar Alluvium 33151 0 33151 8463.85 1084.86 370.52 72.77 1528.15 18.05 Safe 8 Rohtas Karakat Alluvium 20353 0 20353 5975.21 2978.97 344.51 166.17 3489.65 58.40 Safe 9 Rohtas Kochas Alluvium 21704 0 21704 5494.70 829.86 279.89 55.49 1165.24 21.21 Safe
10 Rohtas Nasariganj Alluvium 13159 0 13159 3599.28 703.08 307.13 58.33 1068.54 29.69 Safe 11 Rohtas Nauhatta Alluvium/Hardrock 39493 3250 36243 8099.70 363.81 154.84 25.93 544.58 6.72 Safe 12 Rohtas Nokha Alluvium 16910 0 16910 4636.48 886.56 375.21 72.86 1334.63 28.79 Safe 13 Rohtas Rajpur Alluvium 7041 0 7041 2427.55 372.33 123.81 24.81 520.95 21.46 Safe 14 Rohtas Rohtas Alluvium/Hardrock 32085 2665 29420 7548.26 753.75 156.48 47.59 957.82 12.69 Safe 15 Rohtas Sanjhauli Alluvium 6820 0 6820 1839.42 131.79 103.08 11.74 246.61 13.41 Safe 16 Rohtas Sasaram Alluvium/Hardrock 32416 743 31673 8018.22 1629.18 565.52 125.84 2320.54 28.94 Safe 17 Rohtas Sheosagar Alluvium 33130 0 33130 9998.45 851.16 289.85 57.05 1198.06 11.98 Safe 18 Rohtas Suryapura Alluvium 5703 0 5703 1600.34 584.34 94.70 33.95 712.99 44.55 Safe 19 Rohtas Tilawthu Alluvium/Hardrock 15640 0 15640 3068.44 624.96 207.03 44.67 876.67 28.57 Safe
District Rohtas 383926 8783 375143 105588.25 19053.39 5296.81 1300.95 25651.16 24.29 1 Saharsa Banmaitahari Alluvium 7520 0 7520 2131.33 544.05 149.71 34.69 728.45 34.18 Safe 2 Saharsa Kahara Alluvium 13445 0 13445 5287.04 1471.50 465.35 113.81 2050.66 38.79 Safe 3 Saharsa Mahishi Alluvium 22293 0 22293 5022.50 1983.00 340.38 116.17 2439.55 48.57 Safe 4 Saharsa Nauhatta Alluvium 16988 0 16988 3862.22 1752.30 266.32 100.93 2119.55 54.88 Safe 5 Saharsa Patarhgat Alluvium 11866 0 11866 2798.25 1049.10 211.24 63.02 1323.36 47.29 Safe 6 Saharsa Salakhua Alluvium 17661 0 17661 7746.15 1519.05 218.68 86.89 1824.62 23.56 Safe 7 Saharsa Satarkatya Alluvium 15074 0 15074 4209.66 1285.05 248.67 76.69 1610.41 38.26 Safe 8 Saharsa Saurbazar Alluvium 18849 0 18849 7411.83 3693.30 352.55 202.29 4248.14 57.32 Safe 9 Saharsa SimariBakhtiyarpur Alluvium 21385 0 21385 6861.34 1809.75 461.88 113.58 2385.21 34.76 Safe
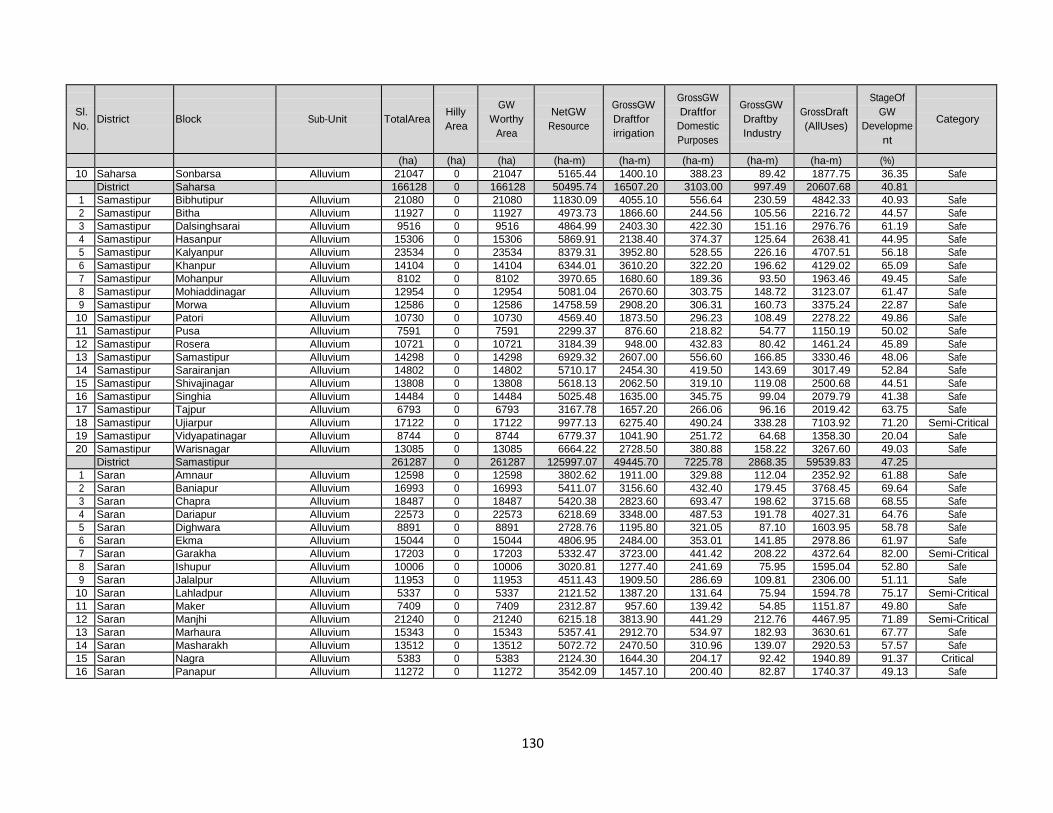
130
Sl. No.
District
Block
Sub-Unit
TotalArea
Hilly Area
GW
Worthy Area
NetGW
Resource
GrossGW Draftfor irrigation
GrossGW Draftfor
Domestic Purposes
GrossGW Draftby Industry
GrossDraft (AllUses)
StageOf GW
Developme nt
Category
(ha) (ha) (ha) (ha-m) (ha-m) (ha-m) (ha-m) (ha-m) (%) 10 Saharsa Sonbarsa Alluvium 21047 0 21047 5165.44 1400.10 388.23 89.42 1877.75 36.35 Safe
District Saharsa 166128 0 166128 50495.74 16507.20 3103.00 997.49 20607.68 40.81 1 Samastipur Bibhutipur Alluvium 21080 0 21080 11830.09 4055.10 556.64 230.59 4842.33 40.93 Safe 2 Samastipur Bitha Alluvium 11927 0 11927 4973.73 1866.60 244.56 105.56 2216.72 44.57 Safe 3 Samastipur Dalsinghsarai Alluvium 9516 0 9516 4864.99 2403.30 422.30 151.16 2976.76 61.19 Safe 4 Samastipur Hasanpur Alluvium 15306 0 15306 5869.91 2138.40 374.37 125.64 2638.41 44.95 Safe 5 Samastipur Kalyanpur Alluvium 23534 0 23534 8379.31 3952.80 528.55 226.16 4707.51 56.18 Safe 6 Samastipur Khanpur Alluvium 14104 0 14104 6344.01 3610.20 322.20 196.62 4129.02 65.09 Safe 7 Samastipur Mohanpur Alluvium 8102 0 8102 3970.65 1680.60 189.36 93.50 1963.46 49.45 Safe 8 Samastipur Mohiaddinagar Alluvium 12954 0 12954 5081.04 2670.60 303.75 148.72 3123.07 61.47 Safe 9 Samastipur Morwa Alluvium 12586 0 12586 14758.59 2908.20 306.31 160.73 3375.24 22.87 Safe
10 Samastipur Patori Alluvium 10730 0 10730 4569.40 1873.50 296.23 108.49 2278.22 49.86 Safe 11 Samastipur Pusa Alluvium 7591 0 7591 2299.37 876.60 218.82 54.77 1150.19 50.02 Safe 12 Samastipur Rosera Alluvium 10721 0 10721 3184.39 948.00 432.83 80.42 1461.24 45.89 Safe 13 Samastipur Samastipur Alluvium 14298 0 14298 6929.32 2607.00 556.60 166.85 3330.46 48.06 Safe 14 Samastipur Sarairanjan Alluvium 14802 0 14802 5710.17 2454.30 419.50 143.69 3017.49 52.84 Safe 15 Samastipur Shivajinagar Alluvium 13808 0 13808 5618.13 2062.50 319.10 119.08 2500.68 44.51 Safe 16 Samastipur Singhia Alluvium 14484 0 14484 5025.48 1635.00 345.75 99.04 2079.79 41.38 Safe 17 Samastipur Tajpur Alluvium 6793 0 6793 3167.78 1657.20 266.06 96.16 2019.42 63.75 Safe 18 Samastipur Ujiarpur Alluvium 17122 0 17122 9977.13 6275.40 490.24 338.28 7103.92 71.20 Semi-Critical 19 Samastipur Vidyapatinagar Alluvium 8744 0 8744 6779.37 1041.90 251.72 64.68 1358.30 20.04 Safe 20 Samastipur Warisnagar Alluvium 13085 0 13085 6664.22 2728.50 380.88 158.22 3267.60 49.03 Safe
District Samastipur 261287 0 261287 125997.07 49445.70 7225.78 2868.35 59539.83 47.25 1 Saran Amnaur Alluvium 12598 0 12598 3802.62 1911.00 329.88 112.04 2352.92 61.88 Safe 2 Saran Baniapur Alluvium 16993 0 16993 5411.07 3156.60 432.40 179.45 3768.45 69.64 Safe 3 Saran Chapra Alluvium 18487 0 18487 5420.38 2823.60 693.47 198.62 3715.68 68.55 Safe 4 Saran Dariapur Alluvium 22573 0 22573 6218.69 3348.00 487.53 191.78 4027.31 64.76 Safe 5 Saran Dighwara Alluvium 8891 0 8891 2728.76 1195.80 321.05 87.10 1603.95 58.78 Safe 6 Saran Ekma Alluvium 15044 0 15044 4806.95 2484.00 353.01 141.85 2978.86 61.97 Safe 7 Saran Garakha Alluvium 17203 0 17203 5332.47 3723.00 441.42 208.22 4372.64 82.00 Semi-Critical 8 Saran Ishupur Alluvium 10006 0 10006 3020.81 1277.40 241.69 75.95 1595.04 52.80 Safe 9 Saran Jalalpur Alluvium 11953 0 11953 4511.43 1909.50 286.69 109.81 2306.00 51.11 Safe
10 Saran Lahladpur Alluvium 5337 0 5337 2121.52 1387.20 131.64 75.94 1594.78 75.17 Semi-Critical 11 Saran Maker Alluvium 7409 0 7409 2312.87 957.60 139.42 54.85 1151.87 49.80 Safe 12 Saran Manjhi Alluvium 21240 0 21240 6215.18 3813.90 441.29 212.76 4467.95 71.89 Semi-Critical 13 Saran Marhaura Alluvium 15343 0 15343 5357.41 2912.70 534.97 182.93 3630.61 67.77 Safe 14 Saran Masharakh Alluvium 13512 0 13512 5072.72 2470.50 310.96 139.07 2920.53 57.57 Safe 15 Saran Nagra Alluvium 5383 0 5383 2124.30 1644.30 204.17 92.42 1940.89 91.37 Critical 16 Saran Panapur Alluvium 11272 0 11272 3542.09 1457.10 200.40 82.87 1740.37 49.13 Safe

131
Sl. No.
District
Block
Sub-Unit
TotalArea
Hilly Area
GW
Worthy Area
NetGW
Resource
GrossGW Draftfor irrigation
GrossGW Draftfor
Domestic Purposes
GrossGW Draftby Industry
GrossDraft (AllUses)
StageOf GW
Developme nt
Category
(ha) (ha) (ha) (ha-m) (ha-m) (ha-m) (ha-m) (ha-m) (%) 17 Saran Parasa Alluvium 10405 0 10405 2800.94 1522.50 256.53 88.95 1867.98 66.69 Safe 18 Saran Revelganj Alluvium 12351 0 12351 3135.32 930.00 325.50 75.22 1330.73 42.44 Safe 19 Saran Sonpur Alluvium 16790 0 16790 4569.97 2235.00 569.02 152.64 2956.66 64.70 Safe 20 Saran Tariya Alluvium 10167 0 10167 3450.31 1557.00 228.35 89.27 1874.62 54.33 Safe
District Saran 262957 0 262957 81955.80 42716.70 6929.39 2551.74 52197.83 63.69 1 Sheihkpura Ariari Alluvium 14665 0 14665 4766.17 2052.00 184.48 111.82 2348.30 49.27 Safe 2 Sheihkpura Barbihga Alluvium 9346 0 9346 2716.09 353.10 375.84 54.41 783.35 28.84 Safe 3 Sheihkpura Chebara Alluvium 11506 0 11506 3769.25 1629.30 120.61 87.50 1837.41 48.75 Safe 4 Sheihkpura Ghatkusumba Alluvium 9259 0 9259 2757.96 542.70 79.58 31.11 653.39 23.69 Safe 5 Sheihkpura Sheihkpura Alluvium/Hardrock 18518 2550 15968 3439.46 735.00 317.24 59.95 1112.19 32.34 Safe 6 Sheihkpura Shekhopursarai Alluvium 5515 0 5515 4269.89 1408.80 111.08 75.99 1595.87 37.38 Safe
District Sheihkpura 68809 2550 66259 21718.82 6720.90 1188.84 420.78 8330.52 38.36 1 Sheohar DumriKatsari Alluvium 6659 0 6659 1482.62 705.60 153.75 42.97 902.32 60.86 Safe 2 Sheohar Piprahi Alluvium 8268 0 8268 2013.69 922.50 194.16 55.83 1172.49 58.23 Safe 3 Sheohar Purnahia Alluvium 6410 0 6410 2054.39 855.30 151.36 50.33 1056.99 51.45 Safe 4 Sheohar Sheohar Alluvium 9282 0 9282 2891.51 875.10 348.14 72.02 1295.26 44.80 Safe 5 Sheohar Tariyani Alluvium 13680 0 13680 4660.00 2689.50 325.43 150.75 3165.68 67.93 Safe
District Sheohar 44299 0 44299 13102.20 6048.00 1172.84 371.90 7592.74 57.95 1 Sitamarhi Bairgania Alluvium 6706 0 6706 2098.09 387.66 358.77 55.81 802.24 38.24 Safe 2 Sitamarhi Bajpatti Alluvium 13932 0 13932 5384.05 3703.70 354.76 202.92 4261.38 79.15 Semi-Critical 3 Sitamarhi Bathnaha Alluvium 19995 0 19995 6486.83 2347.80 432.16 139.00 2918.96 45.00 Safe 4 Sitamarhi Belsand Alluvium 7688 0 7688 2124.04 626.08 266.74 52.79 945.61 44.52 Safe 5 Sitamarhi Bokhara Alluvium 8601 0 8601 3524.60 622.44 215.46 41.89 879.79 24.96 Safe 6 Sitamarhi Churaut Alluvium 7366 0 7366 1889.78 768.04 130.56 44.93 943.53 49.93 Safe 7 Sitamarhi Dumra Alluvium 19542 0 19542 7433.06 1972.88 702.98 146.86 2822.72 37.98 Safe 8 Sitamarhi Majorjong Alluvium 7554 0 7554 2223.05 707.98 169.20 43.86 921.04 41.43 Safe 9 Sitamarhi Nanpur Alluvium 10749 0 10749 2787.69 1064.70 300.30 68.25 1433.25 51.41 Safe
10 Sitamarhi Parihar Alluvium 21221 0 21221 5971.87 2254.98 556.76 140.59 2952.33 49.44 Safe 11 Sitamarhi Parsauni Alluvium 5914 0 5914 1781.48 704.94 141.60 42.33 888.87 49.89 Safe 12 Sitamarhi Pupri Alluvium 9309 0 9309 2817.85 832.10 332.29 64.08 1228.47 43.60 Safe 13 Sitamarhi Riga Alluvium 12914 0 12914 3041.82 1401.40 340.72 87.11 1829.23 60.14 Safe 14 Sitamarhi Runisaidpur Alluvium 26315 0 26315 6529.21 1492.68 613.32 105.30 2211.30 33.87 Safe 15 Sitamarhi Sonbarsa Alluvium 17633 0 17633 4519.91 1980.16 413.59 119.69 2513.44 55.61 Safe 16 Sitamarhi Suppi Alluvium 8575 0 8575 2594.18 700.70 201.22 45.10 947.02 36.51 Safe 17 Sitamarhi Sursand Alluvium 14506 0 14506 4215.66 1112.62 345.60 72.91 1531.13 36.32 Safe
District Sitamarhi 218520 0 218520 65423.17 22680.86 5876.02 1473.42 30030.30 45.90 1 Siwan Andar Alluvium 11826 0 11826 4943.40 1752.85 181.12 96.70 2030.67 41.08 Safe 2 Siwan Barharia Alluvium 17732 0 17732 7859.84 2083.91 528.89 130.64 2743.44 34.90 Safe 3 Siwan Basantpur Alluvium 6220 0 6220 2771.53 1733.89 173.22 95.36 2002.47 72.25 Semi-Critical

132
Sl. No.
District
Block
Sub-Unit
TotalArea
Hilly Area
GW
Worthy Area
NetGW
Resource
GrossGW Draftfor irrigation
GrossGW Draftfor
Domestic Purposes
GrossGW Draftby Industry
GrossDraft (AllUses)
StageOf GW
Developme nt
Category
(ha) (ha) (ha) (ha-m) (ha-m) (ha-m) (ha-m) (ha-m) (%) 4 Siwan Bhagwanpur Alluvium 14943 0 14943 4335.14 2461.30 363.22 141.23 2965.75 68.41 Safe 5 Siwan Darauli Alluvium 17278 0 17278 5385.03 2008.33 287.02 114.77 2410.12 44.76 Safe 6 Siwan Daraunda Alluvium 12431 0 12431 5284.42 4178.29 285.11 223.17 4686.57 88.69 Semi-Critical 7 Siwan Goryakothi Alluvium 13798 0 13798 4449.63 1237.17 368.26 80.27 1685.70 37.88 Safe 8 Siwan Guthani Alluvium 9171 0 9171 4145.05 2659.02 210.96 143.50 3013.48 72.70 Semi-Critical 9 Siwan Hussainganj Alluvium 8490 0 8490 3408.71 2073.36 300.91 118.71 2492.98 73.14 Semi-Critical
10 Siwan Hasanpura Alluvium 9699 0 9699 5964.20 2518.09 246.23 138.22 2902.54 48.67 Safe 11 Siwan Jeradei Alluvium 12703 0 12703 4043.86 2970.46 269.56 162.00 3402.02 84.13 Semi-Critical 12 Siwan LakriNabiganj Alluvium 9521 0 9521 2778.74 1163.39 212.19 68.78 1444.36 51.98 Safe 13 Siwan Maharajganj Alluvium 11542 0 11542 4369.97 2236.09 393.07 140.27 2769.43 63.37 Safe 14 Siwan Mairwa Alluvium 7977 0 7977 4252.13 1677.27 264.42 105.80 2047.49 48.15 Safe 15 Siwan Nautan Alluvium 6462 0 6462 5504.85 1720.42 149.33 93.49 1963.24 35.66 Safe 16 Siwan Pachrukhi Alluvium 12437 0 12437 3679.45 1590.02 332.13 96.11 2018.26 54.85 Safe 17 Siwan Raghunathpur Alluvium 15589 0 15589 5909.11 3039.95 259.59 164.98 3464.52 58.63 Safe 18 Siwan Siswan Alluvium 11579 0 11579 3676.99 2254.89 253.43 125.42 2633.74 71.63 Semi-Critical 19 Siwan Siwan Alluvium 12909 0 12909 5526.75 2758.56 539.07 179.42 3477.06 62.91 Safe
District Siwan 222307 0 222307 88288.80 42117.26 5617.72 2418.84 50153.82 56.81 1 Supaul Basantpur Alluvium 25153 0 25153 10600.73 3911.55 398.15 222.81 4532.51 42.76 Safe 2 Supaul Chattapur Alluvium 31275 0 31275 12841.13 5108.85 471.55 279.02 5859.42 45.63 Safe 3 Supaul Kishanpur Alluvium 19669 0 19669 7061.64 2231.40 276.01 125.37 2632.78 37.28 Safe 4 Supaul Marauna Alluvium 16657 0 16657 4431.74 764.40 238.91 50.17 1053.48 23.77 Safe 5 Supaul Nirmali Alluvium 12935 0 12935 4744.32 856.05 228.51 62.57 1147.12 24.18 Safe 6 Supaul Pipra Alluvium 19751 0 19751 7605.92 4351.95 331.53 234.17 4917.65 64.66 Safe 7 Supaul Pratapganj Alluvium 11080 0 11080 3500.74 1061.40 175.95 61.87 1299.22 37.11 Safe 8 Supaul Raghopur Alluvium 20809 0 20809 7474.37 2319.60 354.98 133.73 2808.31 37.57 Safe 9 Supaul Supaul Alluvium 30959 0 30959 9424.01 1920.75 582.17 132.69 2635.61 27.97 Safe
10 Supaul Triveniganj Alluvium 32097 0 32097 12094.31 1587.30 530.84 105.91 2224.05 18.39 Safe 11 Supaul SaraigarhBhaptiahi Alluvium 20641 0 20641 5913.63 893.70 202.10 54.79 1150.59 19.46 Safe
District Supaul 241026 0 241026 85692.53 25006.95 3790.70 1463.10 30260.74 35.31 1 Vaishali Bhagwanpur Alluvium 11828 0 11828 3764.05 2537.30 342.01 143.97 3023.28 80.32 Semi-Critical 2 Vaishali Biddupur Alluvium 11454 0 11454 7796.34 3528.67 442.56 198.56 4169.79 53.48 Safe 3 Vaishali Chehrakala Alluvium 6831 0 6831 2119.15 1352.72 215.65 78.42 1646.79 77.71 Semi-Critical 4 Vaishali Goroul Alluvium 4999 0 4999 3434.60 1965.35 144.21 105.48 2215.04 64.49 Safe 5 Vaishali Hazipur Alluvium 9888 0 9888 4083.73 2955.26 292.33 178.55 3426.14 83.90 Semi-Critical 6 Vaishali Jandaha Alluvium 15686 0 15686 4780.34 2820.58 1034.75 192.77 4048.10 84.68 Semi-Critical 7 Vaishali Lalganj Alluvium 15032 0 15032 5119.35 3100.51 454.69 191.24 3746.45 73.18 Semi-Critical 8 Vaishali Mahnar Alluvium 15143 0 15143 4243.08 1466.14 559.00 119.83 2144.97 50.55 Safe 9 Vaishali Mahua Alluvium 9989 0 9989 4077.02 1962.00 455.86 120.89 2538.75 62.27 Safe
10 Vaishali Patepur Alluvium 14003 0 14003 4919.22 4586.20 468.37 252.73 5307.30 107.89 OverExploited

133
Sl. No.
District
Block
Sub-Unit
TotalArea
Hilly Area
GW
Worthy Area
NetGW
Resource
GrossGW Draftfor irrigation
GrossGW Draftfor
Domestic Purposes
GrossGW Draftby Industry
GrossDraft (AllUses)
StageOf GW
Developme nt
Category
(ha) (ha) (ha) (ha-m) (ha-m) (ha-m) (ha-m) (ha-m) (%) 11 Vaishali PatehiBelsar Alluvium 25657 0 25657 6492.78 909.71 609.37 75.95 1595.03 24.57 Safe 12 Vaishali Premraj/Desri Alluvium 7416 0 7416 2274.38 1381.21 157.48 76.93 1615.62 71.04 Semi-Critical 13 Vaishali Raghopur Alluvium 22580 0 22580 6116.09 1514.61 383.40 94.90 1992.91 32.58 Safe 14 Vaishali Rajapakar Alluvium 7557 0 7557 2447.04 1795.31 260.30 102.78 2158.39 88.20 Semi-Critical 15 Vaishali SahdaiBizurg Alluvium 8774 0 8774 2658.22 1165.53 209.71 68.76 1444.00 54.32 Safe 16 Vaishali Vaishali Alluvium 12681 0 12681 5608.58 2058.08 308.63 118.34 2485.05 44.31 Safe
District Vaishali 199518 0 199518 69933.98 35099.18 6338.34 2120.11 43557.63 62.28 1 WChamparan Bagaha-1 Alluvium 39607 0 39607 18001.16 2611.86 636.62 175.85 3424.33 19.02 Safe 2 WChamparan Bairia Alluvium 23349 17500 5849 8338.43 1237.17 510.10 89.91 1837.18 22.03 Safe 3 WChamparan Bettiah Alluvium 6164 0 6164 3328.90 260.80 338.14 46.61 645.55 19.39 Safe 4 WChamparan Bhitaha Alluvium 14087 0 14087 5109.82 363.49 858.48 61.10 1283.07 25.11 Safe 5 WChamparan Chanpatiya Alluvium 25786 0 25786 7673.63 1543.78 108.98 93.75 1746.51 22.76 Safe 6 WChamparan Gaunaha Alluvium 31153 0 31153 12905.05 1983.71 579.34 128.15 2691.20 20.85 Safe 7 WChamparan Jogapatti Alluvium 21894 16500 5394 3977.83 1520.36 342.68 93.15 1956.19 49.18 Safe 8 WChamparan Lauria Alluvium 20354 0 20354 8817.66 2728.36 400.86 156.46 3285.68 37.26 Safe 9 WChamparan Madhubani Alluvium 14055 0 14055 5445.31 247.76 378.88 31.33 657.97 12.08 Safe
10 WChamparan Mainatanr Alluvium 23446 0 23446 6812.72 1549.10 147.51 84.83 1781.44 26.15 Safe 11 WChamparan Majhaulia Alluvium 28615 0 28615 11138.66 2072.33 313.99 119.32 2505.64 22.50 Safe 12 WChamparan Narkatiaganj Alluvium 34489 0 34489 14830.45 3352.99 542.15 200.03 4095.17 27.61 Safe 13 WChamparan Nautan Alluvium 18850 0 18850 9814.11 894.87 784.97 83.99 1763.83 17.97 Safe 14 WChamparan Piprasi Alluvium 16022 0 16022 7178.97 469.44 384.50 42.70 896.64 12.49 Safe 15 WChamparan Ramnagar Alluvium 35498 0 35498 13597.04 3367.49 63.53 191.39 3622.41 26.64 Safe 16 WChamparan Sidhaw Alluvium 47093 13257 33836 10893.29 1627.94 569.44 109.87 2307.25 21.18 Safe 17 WChamparan Sikta Alluvium 19580 0 19580 8904.14 949.26 311.94 63.06 1324.26 14.87 Safe 18 WChamparan Thakrahan Alluvium 14396 0 14396 4228.87 363.49 86.86 22.52 472.87 11.18 Safe
District WestChamparan 434438 47257 387181 160996.03 27144.20 7358.97 1794.02 36297.19 22.55

134
Latest status of Ground Water in Bihar as reported CGWB
Sl. No. District Blocks Safe Category Station
Semi Critical Critical Over Exploited
1 Araria 9 9/9 - - - 2 Arwal 6 6/6 - - - 3 Aurangabad 11 11/11 - - - 4 Banka 11 11/11 - - - 5 Begusarai 18 15/18 - - -
Bhagwanpur - - Critical - Khudawanpur - Semi Critical - -
Nawkothi - - Critical - 6 Bhabhua 11 11/11 - - - 7 Bhagalpur 16 16/16 - - - 8 Bhojpur 14 8/14 - - -
Arrah - Semi Critical - - Behea - - Critical -
Jagdishpur - Semi Critical - - Koilbar - - Critical -
Piro - Semi Critical - - Shahpur - Semi Critical - -
9 Buxar 11 9/11 - - - Chaungai - Semi Critical - -
Siamri - Semi Critical - - 10 Darbhanga 18 18/18 - - - 11 East Champaran 27 26/27 - - -
Madhuban - Semi Critical - - 12 Gaya 24 15/24 - - -
Belaganj - Semi Critical - - Bodhgaya - Semi Critical - - Dumaria - - Critical -
Gaya Sadar - Semi Critical - - Imamganj - - - Over Exploited Khizirsarai - Semi Critical - -
Donch - Semi Critical - - Manpur - - - Over Exploited Tekari - Semi Critical - -
13 Gopalganj 14 5/14 - - - Barauli - Semi Critical - - Bijaipur - - - Over Exploited Bhore - Semi Critical - -
Hathwa - Semi Critical - - Kateyan - Semi Critical - -

135
Manjha - Semi Critical - - Panchdeori - Semi Critical - -
Thawe - - - Over Exploited Uchkagaon - - - Over Exploited
14 Jamui 10 10/10 - - - 15 Jehanabad 7 0/7 - - -
Ghosi - - Critical - Hulasganj - Semi Critical - - Jehanabad - - Critical -
Kako - - Critical - Modanganj - Semi Critical - -
Makhdumpur - Semi Critical - - Ratni Faridpur - - - Over Exploited
16 Katihar 16 8/16 - - - Azamnagar - Semi Critical - - Balrampur - Semi Critical - -
Barsoi - Semi Critical - - Dandkhora - - Critical -
Dedwa - Semi Critical - - Kursela - Semi Critical - -
Mansahi - Semi Critical - - Samili - Semi Critical - -
17 Khagaria 7 7/7 - - - 18 Kishanganj 7 7/7 - - - 19 Lakhisarai 7 7/7 - - - 20 Madhepura 13 7/13 - - -
Bihariganj - Semi Critical - - Gamaharia - Semi Critical - - Gwalpara - Semi Critical - -
Shankarpur - Semi Critical - - Singheswar - Semi Critical - -
Uda Kishanganj - Semi Critical - -
21 Madhubani 21 21/21 - - - 22 Munger 9 9/9 - - - 23 Muzaffarpur 16 10/16 - - -
Bochaha - Semi Critical - - Kurhani - Semi Critical - - Minapur - Semi Critical - - Moraul (Dhoili) - Semi Critical - -
Mushari - - - Over Exploited Sakra - - - Over Exploited
24 Nalanda 20 9/20 - - -
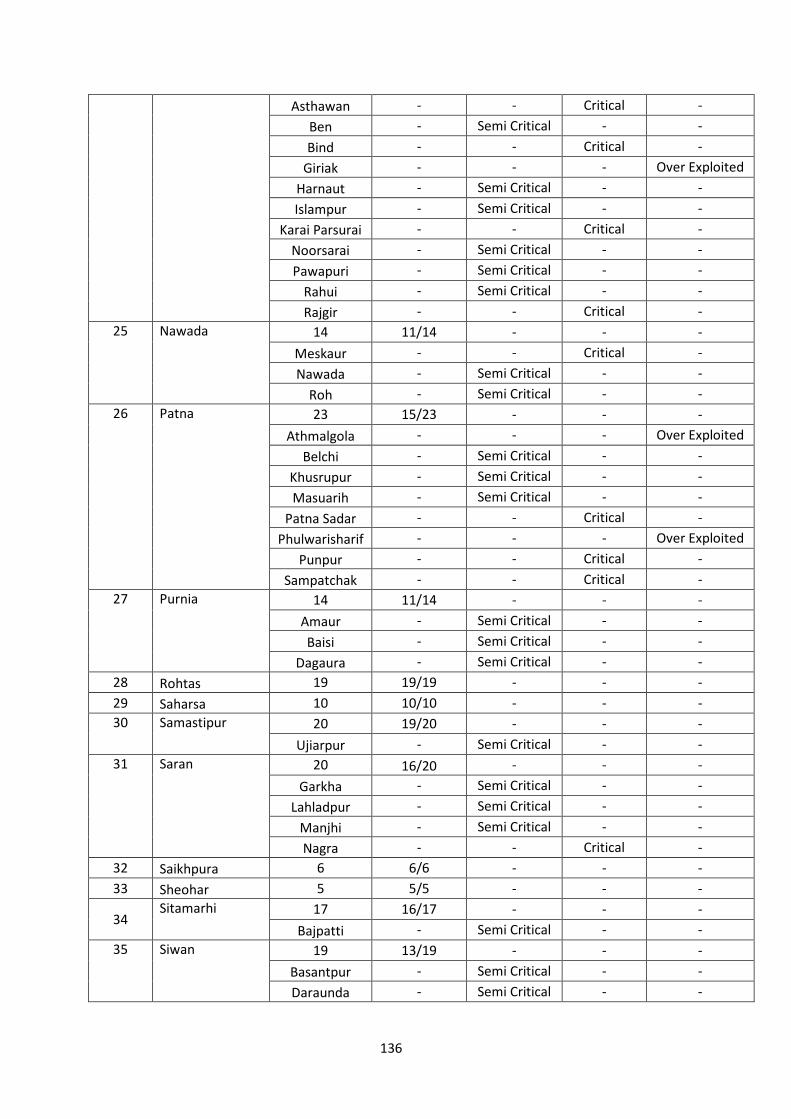
136
Asthawan - - Critical - Ben - Semi Critical - - Bind - - Critical -
Giriak - - - Over Exploited Harnaut - Semi Critical - - Islampur - Semi Critical - -
Karai Parsurai - - Critical - Noorsarai - Semi Critical - - Pawapuri - Semi Critical - -
Rahui - Semi Critical - - Rajgir - - Critical -
25 Nawada 14 11/14 - - - Meskaur - - Critical - Nawada - Semi Critical - -
Roh - Semi Critical - - 26 Patna 23 15/23 - - -
Athmalgola - - - Over Exploited Belchi - Semi Critical - -
Khusrupur - Semi Critical - - Masuarih - Semi Critical - -
Patna Sadar - - Critical - Phulwarisharif - - - Over Exploited
Punpur - - Critical - Sampatchak - - Critical -
27 Purnia 14 11/14 - - - Amaur - Semi Critical - - Baisi - Semi Critical - -
Dagaura - Semi Critical - - 28 Rohtas 19 19/19 - - - 29 Saharsa 10 10/10 - - - 30 Samastipur 20 19/20 - - -
Ujiarpur - Semi Critical - - 31 Saran 20 16/20 - - -
Garkha - Semi Critical - - Lahladpur - Semi Critical - -
Manjhi - Semi Critical - - Nagra - - Critical -
32 Saikhpura 6 6/6 - - - 33 Sheohar 5 5/5 - - -
34 Sitamarhi 17 16/17 - - -
Bajpatti - Semi Critical - - 35 Siwan 19 13/19 - - -
Basantpur - Semi Critical - - Daraunda - Semi Critical - -

137
Guthani - Semi Critical - - Sussainganj - Semi Critical - -
Jeradei - Semi Critical - - Siswan - Semi Critical - -
36 Supaul 11 11/11 - - - 37 Vaishali 16 8/16 - - -
Bhagwanpur - Semi Critical - - Chehra Kala - Semi Critical - -
Hazipur - Semi Critical - - Jandaha - Semi Critical - - Lalganj - Semi Critical - - Patepur - - - Over Exploited
Premraj/Desri - Semi Critical - - Rajapakar - Semi Critical - -
38 West Champaran 18 18/18 - - -
Total 535 433 72 18 12