Emergence of Economic Institutions: Analysing the Third Role of Universities in Turku, Finland
Upload
independentCategory
view
1download
0
Electronic copy available at: http://ssrn.com/abstract=1036841
No. 102
DEMOCRATIZATION, QUALITY OF INSTITUTIONS AND ECONOMIC GROWTH
Victor Polterovich, Vladimir Popov
Warsaw, July 2007

Electronic copy available at: http://ssrn.com/abstract=1036841
DEMOCRATIZATION, QUALITY OF INSTITUTIONS AND ECONOMIC GROWTH
Victor Polterovich, Vladimir Popov1
ABSTRACT
There are two innovations in the paper as compared to the previous literature on democracy and
growth. First, we consider not only the level of democracy, but also changes in this level in the
1970s-1990s as measured by increments of Freedom House political rights indices. Second, the
distinction is made between democracy and law and order (order based on legal rules); the latter
is measured by the rule of law, investors' risk and corruption indices. We discuss two
interconnected threshold hypotheses: (1) in countries where law and order is strong enough,
democratization stimulates economic growth, whereas in countries with poor law and order
democratization undermines growth; (2) if democratization occurs under the conditions of poor
law and order (so that illiberal democracy emerges), then shadow economy expands, quality of
governance worsens, and macroeconomic policy becomes less prudent.
We adduce a number of stylized facts to support our hypotheses. However our econometric
findings are mixed: we report results that support the hypotheses as well as regressions that
contradict them.
KEYWORDS: ECONOMIC GROWTH, DEMOCRACY, RULE OF LAW
1 New Economic School, Moscow, [email protected]
1

1. Introduction
Democracy is widely regarded as one of the goals of development and reforms. There are
disagreements, however, on how important this goal is in relation to the other goals, such as
higher income and more equitable income distribution, higher life expectancy and educational
levels. The Rawlsian theory puts a very high, if not an absolute, weight on democratic values:
civil liberties, including political rights, according to Rawls (1971), “are not subject to political
bargaining or to the calculus of social interests”. On the other hand, the proponents of Asian
values, often tracing the origins of their philosophical tradition back to Confucius, argue that the
interests of the society as a whole are superior to the interests of an individual; hence civil or
political rights can in principle be sacrificed for the benefit of greater good of the community,
such as, for instance, more rapid and equitable economic growth. As Amartya Sen puts it, “Lee
Kuan Yew, the former prime minister of Singapore and a great champion of the “Asian values”,
has defended authoritarian arrangements on the ground of their alleged effectiveness in
promoting economic success” (Sen, 1997).
This way or the other, nobody, even the defenders of Asian values, seriously disputes the
intrinsic values of democracy. The debate is rather about the price of these values, or, to be more
precise, about the relative weight (price) of democratic values as compared to other
developmental goals. This value of democratic (political) rights changed dramatically throughout
human history and there is yet to be a theory to explain the change. This paper focuses instead on
a more modest and more easily testable issue of the cost of democratization , i.e. on the existence
of trade-offs between democratization and growth. The conventional wisdom today appears to be
that these trade-offs do not exist, or that democracy is complementary to economic growth as
well as other goals of development. The issue of the price of democratization then becomes
largely irrelevant because democracy becomes both the mean and the end in itself. However, if
such trade-off exists, i.e. if democratization under particular conditions is really associated with
costs, the issue of the price of democratization becomes tangible and highly important.
Quite a number of scholars recently expressed their disappointment with performance of
the “third wave” democracies – countries that democratized since 1974 – both in terms of their
abilities to ensure political and other civil rights and in terms of their economic and social
progress. Carothers (2002)2 believes that of nearly 100 countries that are considered as 2 See also Diamond (2002) and the subsequent discussion in the Journal of Democracy, Vol. 13, No. 3, July 2002.
2

newcomers to the democratic world from authoritarianism, only 18 (10 countries of Eastern
Europe; Brazil, Chile, Mexico, Uruguay in Latin America; Taiwan, the Philippines and South
Korea in East Asia; Ghana in Africa) “are clearly en route to becoming successful well-
functioning democracies or at least have made some democratic progress and still enjoy a
positive dynamics of democratization”.
Zakaria (2003) looks at the rise of “illiberal democracies” - countries, where competitive
elections are introduced before the law and order is established. While European countries in the
XIX century and East Asian countries recently moved from first establishing the law and order to
gradually introducing democratic elections (Hong Kong before and after hand over to China in
1997 is the most obvious example of the law and order without democracy), in Latin America,
Africa, and now in many former Soviet Union republics democratic political systems were
introduced in societies without the firm law and order. Authoritarian regimes (including
communist), while gradually building property rights and institutions, were filling the vacuum in
the law and order via authoritarian means (lawless order). After democratization occurred and
illiberal democracies emerged, they found themselves deprived of old authoritarian instruments
to ensure order, but without the newly developed democratic mechanisms (law and order) needed
to guarantee property rights, contracts and order in general.
There is an extensive literature on the interrelationship between economic growth and
democracy (for a survey see: Przeworski and Limongi, 1993; Afontsev, 1999; Przeworski,
Alvarez, Cheibub, and Limongi, 2000; UNDP, 2002). Democracy is said to undermine
investment (because of populist pressure for increased consumption) and to block “good”
economic policies and reform because the governments in democratic societies are exposed to
pressures from particularistic interests. Autocratic regimes are believed to be better suited than
democratic to oppose pressures for the redistribution of income and resources coming from the
poor majority of the population (Alesina, Rodrik, 1994). It has been also noted that cases of
successful simultaneous economic and political reforms are relatively rare (Intriligator, 1998)
and that introducing voting in post-communist countries may be detrimental economically
(Cheung, 1998).
Taiwan, South Korea, Chile before late 1980s, and China until now are usually cited as
examples of autocracies that were successful in implementing liberalization and reform. On the
other hand, Olson (1991) argued that autocracies can be predatory, since there is no one to
3

control the autocrat. He also believed that the populist problem of democracies can be dealt with
by introducing constitutions that require supermajorities for certain government actions (2000).
Sen (1999) argued that comparative studies that are now available suggest that there is no
relation between economic growth and democracy in either direction and that all major famines
occurred under authoritarian, not under democratic regimes.3
A survey of 18 studies (Przeworski and Limongi, 1993) produced mixed results – the
only pattern that one can discover in these findings is that most studies published after 1987 find
a positive link between democracy and growth, whereas earlier studies, although not different in
samples or periods, generally found that authoritarian regimes grew faster. There are conflicting
studies of the impact of democracy on growth in transition economies – Fidrmuc (2002) reports a
moderate negative initial and direct effect, which is counterweighted by positive indirect effect
(democratization facilitates economic liberalization, which in turn is good for growth). On the
contrary, Popov (2000, 2006) finds a positive effect of ratio of the rule of law to democracy
index on economic performance and do not find any positive effect of liberalization on growth at
least in the first 10 years of transition.
A number of other papers differentiate between young and mature democratic regimes.
Clague et al (1996, p.1) show that "the age of a democratic system is strongly correlated with
property and contract rights." Akhmedov and Zhuravskaya (2004) demonstrate that political
cycles are deeper and therefore more costly under immature democratic regimes. Ross (2006)
shows that democracies spend more money on education and health care than non-democracies,
but these benefits seem to accrue to middle- and upper-income groups, so that democracy has
little or no effect on infant and child mortality rates.
Kaplan (2000) argues that democratic transitions are highly risky in low income setting with
poor institutions and ethnic divisions; they result in the upsurge of violence, crime, official
corruption, and anarchy. Chua (2002) blames the West for promoting a version of capitalism and
democracy that Westerners have never adopted themselves and that leads to accumulation of wealth
by "market dominant minorities" and the increase of political power by a disenfranchised majority.
3 Ellman (2000) challenges this point referring to the lack of famines in the authoritarian USSR after 1947 and to Sudan
famine that occurred under the democratic regime in 1985-89. Sen himself points out to another example – Irish famine
of the 1840s, but he claims that “the English rule over Ireland at that time was, for all practical purposes, a colonial rule”
(Sen, 1997).
4

Rodrik and Wacziarg (2005) argues with Chua, Kaplan and Zakaria – his results from panel data
regressions based on a POLITY IV measures of regime changes show that growth of GDP per capita
actually accelerates immediately after the democratic transition. But Rodrik and Wacziarg controls
for the State Failure dummy (which actually turns out to be most significant), so it is very probable
that this dummy is in fact endogenous to democratization and captures the negative effects of
democratization on institutions. Without this dummy the impact of democratization on growth turns
out to be insignificant.
Nelson and Singh (1998) use the Gastil’s democracy index to investigate the impact of
democracy on growth and find a positive correlation. But Gastil’s index includes components
that are not exactly the measures of democracy, such as the power of the citizenry to exercise the
right to own property, to make free economic resource-allocation decisions and enjoy the fruits
of such decisions (Gastil, 1989).
The recent Human Development Report (UNDP, 2002), entitled Deepening democracy in
a fragmented world, states that “political freedom and participation are part of the human
development, both as development goals in their own right and as means for advancing human
development” (p.52). It argues that there is no trade-off between democracy and growth and that
democracies in fact contribute to stability and equitable economic and social development.
Rodrik (1997) does not find much of the correlation between democracy and economic growth
for 1970-89 after initial income, education, and the quality of governmental institutions are
controlled for, but provides evidence that democracies have more predictable long-run growth
rates, produce greater stability in economic performance, handle adverse shocks much better than
autocracies, and pay higher wages. These findings are very much in line with Przeworski et al.
(2000): while there is no substantial difference in long term growth rates, democracies appear to
have smaller variance in the rates of growth than autocracies (fewer growth miracle stories, but
also fewer spectacular failures), higher share of labor in value added and lower share of
investment in GDP4.
It is concluded in Barro (1996) that «...the overall effect of democracy on growth is weakly
negative». In the same paper Barro considers a nonlinear regression and finds that «the middle
4 One of the most startling findings is about the population dynamics and life expectancy (Przeworski et al., 2000): in a
democracy birth rates and death rates are lower and life expectancy is higher than in an autocracy with the same income
per capita.
5

level of democracy is most favorable to growth, the lowest level comes second, and the highest
level comes third». In another paper Barro writes: " the idea that democracy- in terms of electoral
rights - is necessary for growth is just as false as the proposition that dictatorship is essential for
poor countries to escape poverty.…For a country that starts with weak institutions - weak
democracy and little rule of law - an increase in democracy is less important than an expansion
of the rule of law as a stimulus for economic growth and investment. In addition, democracy
does not seem to have a strong direct role in fostering the rule of law. Thus one can not argue
that democracy is critical for growth because democracy is a prerequisite for the rule of law."
(Barro, 2000, p.47). Barro also states that for given measures of the standard of living democracy
level is not connected with rule of law in either direction (Barro, 1999, p. 174). Similarly, Liew
(2001) attributes Chinese economic success of the 1980s and 19990s to the more effective
government, not to democracy.
In this paper, we make two innovations as compared to the previous literature on democracy
and growth. First, we study not the influence of the democracy level itself, but changes in this
level in the 1970s-1990s as measured by increments of political rights index. Second, we
elaborate on Zakaria's distinction between democracy and law and order (order based on legal
rules); the latter is measured by the rule of law, investors' risk and corruption indices. We try to
check two interconnected threshold hypotheses: (1) in countries where law and order is strong
enough, democratization stimulates economic growth, whereas in countries with poor law and
order, democratization undermines growth, (2) if democratization occurs under the conditions of
poor law and order (so that illiberal democracy arises) then shadow economy expands, quality of
governance worsens, and macroeconomic policy is less prudent.
We refer to a number of stylized facts that make our hypotheses plausible. However our
econometric findings are mixed: we report results that support the hypotheses as well as
regressions that contradict them.
Democracy certainly has its own value, no matter how it influences other developmental
goals, so the question is really how to carry out democratization. This is part of a larger problem
of institutional transplantation, and our study aims to facilitate its understanding.
The rest of the paper is organized as follows. In the next section we discuss main
channels through which democratization may influence economic growth. Sections 3 and 4 are
devoted to discussion of some facts from the history of developed and developing countries that
6

demonstrate how democratization can hamper economic growth. In Section 5 we try to check the
threshold hypothesis using the rule of law, corruption perception and investment climate indices
as indicators of law and order. In Section 6 we study the influence of democratization on
corruption, rule of law, investment climate, shadow economy, government size and
effectiveness, and inflation. Section 7 concludes.
2. Democratization, law and order and growth: channels of impact
In this paper we use the narrow definition of democracy, stating that democracy prevails in
a society if representatives chosen by a broad stratum of the society make main decisions and
control main officials. Democracy includes the rights to vote, to be elected, and to form political
parties as well as freedom of political competition5. Democracy is usually contrasted to
authoritarianism under which the right of basic decisions making and control belongs to a main
official or to a very narrow group. In many cases authoritarian governments are "grabbing hands"
(Frye, Shleifer, 1997); they are corrupted and selected officials by loyalty, not by merits.
Therefore, even if they like to promote growth they are not able to choose correct policy. But
there are many well known cases of relatively clean authoritarian regimes (Hong Kong, Taiwan,
South Korea, Singapore at different periods) that carry out good economic policies resulting in
quite successful economic performance.
In contrast, democracy, it is believed, facilitates formation and selection of growth-
oriented laws and policies, selection of professional policy makers, effective control and timely
change of high ranking officials. These beliefs, however, are mostly based on observations of the
experience in mature democracies. Many argue as well that democratization is the only way to
strengthen law and order, to improve institutional quality in general, and therefore promote
growth. Too often, however, quite different picture is observed for newly democratized countries
(see Section 4).
A certain level of wealth, education and civil society development are prerequisites for
effective democratization. Democracy is costly for both citizens and the state. It may be
considered as "a luxury good" a demand for which arises when a buyer is wealthy enough6.
There are other prerequisites as well, such as the strong law and order. Quick democratization
5 Even freedom of speech, not to speak about freedoms from ethnic, religious, gender and other forms of discrimination, can be guaranteed by liberal authoritarian regimes (Hong Kong, XIX century Europe). 7 Note that in a recent paper (Acemoglu et al., 2005) the authors do not find any causal effect of income on democracy.
7

creates a lot of rent seeking opportunities. Destructive redistribution activities pose a serious
danger of democracy degenerating into chaos that may be prevented only if the strong order
based on law is established in the society7.
If these prerequisites are absent, a hypothetical mechanism of the democracy degeneration may
be described as follows. Due to quick democratization a citizen receives a resource – her right to
vote – that has no intrinsic value for the citizen, but may have a price since it is demanded by
organized political groups. The temptation to sell votes is strong, and if law and order is weak
many votes could be bought and used for the purposes of redistribution in favor of particular
organized political group.
Under these circumstances, democracy becomes marketized and parliamentarians turn out to
be representatives of vested interests, not population because all positions and decisions are
bought and sold as commodities. Corruption flourishes: not only a thin stratum of officials, but
all people in the country are involved in corruption activities selling and buying votes, laws,
orders, permissions, and positions. An increase in corruption, decreasing the level of the rule of
law level and the quality of governance, contributes to slowing down of economic growth.
In what follows we concentrate on the law and order as the most important prerequisite for
successful democratization and try to understand through which channels democratization
influences economic growth. One may expect that democratization under poor law and order
leads to the decay of state institutional capacity because it undermines the effectiveness of the
government regulations, including tax regulations, leads to the expansion of the shadow
economy, and limits the growth of government revenues. Besides democratization under poor
law and order makes it difficult to carry out prudent macroeconomic policy (low budget deficits
and inflation) because the state becomes a hostage of industrial lobbies and populist groups.
The process of democratization is associated with little costs and many benefits, if carried out
in liberal autocracies (Zakaria, 2003), i.e. in countries that have already created a system of
protection of civil rights (except for political rights), or, to put it differently, established
mechanisms and traditions for the law and order. But when democratization occurs in illiberal
autocracies, i.e. in countries that maintain order, but not based on law, the result is the
8 A different question concerns the determinants of democracy independently on its efficiency. Barro (1999) finds that the propensity of democracy rises with per capita GDP, primary schooling, middle-class share of income, smaller reliance on natural resources. Przeworski et al. (2000) show that any country, even a poor one, can become democratic, but in order to stay democratic a certain level of income and other conditions need to be in place.
8

emergence of illiberal democracies, whose record in ensuring institutional capacities is the
worst, which predictably has a devastating impact on economic growth.
The scheme below shows potential channels of impact. Weak democracies produce weak
governments that are prone to the pressure of industrial lobbies and populist groups; civil service
in weak democracies is being corroded by corruption and crony relationships. Their governments
cannot ensure high tax compliance and cannot contain the expansion of the shadow economy.
They cannot collect enough revenues to finance their expenditure and have to resort to
inflationary financing. Very often the problem is exacerbated by the resource abundance that
gives rise to resource rent (and the fight for its redistribution) and income inequalities8. As a
result, growth rates in weak democracies are low; increases in life expectancy are held back by
the collapse of the preventive healthcare for low income groups (Ross, 2006), by growing
income and social inequalities, crime and murder rates (Przeworski et al., 2000). The
mechanisms at work in illiberal democracies that undermine growth are shown on a tentative
scheme below; thick arrows indicate most important links.
8 Fuel exporting countries are more likely to fall into the trap of unstable democratic regimes, i.e. to experience a periodic return to authoritarianism after democratization (Ross, 2001; Polterovich, Popov, Tonis, 2006).
9

SCHEME. ECONOMIC AND SOCIAL COSTS O DEMOCRACIES
ILLIBERAL DEMOCRACY = Demoratization + Poor rule of law (Poor protection of civil rights, including investors’ rights, such as contract and property rights)
Decline in the effectiveness of the government
Poor tax compliance Expansion of the shadow economy Difficulties in tax collectionSlow growth of government revenues and expenditure
POOR MACRO & INDUSTRIAL POLICY Lack of consensus Government budget deficit Inflation Debt accumulation Slow FOREX accumulation Overvalued exchange rate (Dutch disease) Price controls for resources (low domestic energy prices)
Lower investment Slower economic growth
ITUTIONS failure to ed public goods er, health care,
protection of investor’s rights, etc.)
Government failure to redistribute openly in favor of the poor social groups Inability to subsidize openly inefficient industries and enterprises
Higher income inequalities Higher crime rates Lower life expectancy
High income inequalities Differences in efficiency & between sectors of the economy
Resource abundance
10
F ILLIBERAL
WEAK INSTGovernment provide need(law and ord

3. Experience of developed countries
In countries which are currently called developed, the process of democratization was as a rule very
gradual. At the start voting rights were constrained by property, education, resident, age and gender
requirements, so that a very small minority of male property-owners had access to the ballot box.
For example, in France the proportion of voters amounted to only 0.25-0.3 per cent of the
population in 1815-30, and about 0.6 per cent – in 1830-48. Universal male suffrage was introduced
in 1848, however women were allowed to vote only in 1946. In England suffrage was extended by
Reform Act of 1832. Nevertheless, voting rights were received by 14-18 per cent of men only.
Universal male suffrage was introduced in 1928. In Germany, Italy, Belgium women were not
given voting rights until after the Second World War. Rich countries were generally late in
introduction of universal suffrage: it was granted in 1965 in the USA, in 1970 - in Canada, in 1971 -
in Switzerland. (Chang, 2002, pp.71-76).
There is a simple explanation of the slow democratization: the ruling classes tried to keep their
power9. This is just one of the causes however. Another cause is that quick democratization could
have been damaging for a society. The USA experience of XIX century is a clear demonstration of
this possibility. In 1815-40 the processes of quick democratization and formation of mass political
parties occurred. As a result corruption flourished and a catastrophic fall of the governance quality
occurred. Party political machines were developed to appoint people to bureaucratic positions and to
control the governments, police and the courts.
Elections were falsified. Party leaders hired "repeater gangs", individuals who voted many times in
the names of registered voters and intimidated potential opponents to prevent them from voting. 9 “The view that political democracy leads to greater economic equality was commonly held in the late eighteenth- and early nineteenth-century period, and economic consequences of democracy have been at the center of debates concerning the right to vote and to organize during the first half of the nineteenth century. One of the main arguments has been that democracy, specifically universal suffrage and the freedom to form unions, threatens private property: endowed with political power in the form of universal suffrage, those who suffer as a consequence of private property will attempt to use this power to expropriate the rich. The British electoral reforms, in particular reduction of the suffrage in the wake of the French revolution, are generally the best-known, and the most researched, case. But the same problems were present throughout Europe: only some 10% of adult male Italians, Dutch and Belgians had the right of vote as late as 1880 (Flora et al., 1983; Lindert, 1989); less than 2% of adult males were enfranchised in Hungary on the eve of World War I (Taylor, 1967; Polonsky, 1975, p. 46). The dilemma was eloquently summarized in 1871 by the Spanish statesman Canavas del Castillo in a rebuttal to those who complained about electoral fraud. He wrote: ‘to have to choose between the permanent falsification of universal suffrage and its abolition is not to have to choose between universal suffrage and preservation of property’. (Ubieto et al., 1972, p. 731)”. Mark Gradstein and B. Milanovic, Does Liberté=Egalité? A Survey of the Empirical Evidence on the Links Between Political Democracy and Income Inequality. Final version published in Journal of Economic Surveys, vol. 18 No. 4, pp. 515-537, September 2004.
11

"Since the police were primarily a political tool rather than a professional law enforcement
agency…the political loyalty was the only real qualification for appointment" (Walker, 1977; cited in
Knott, Miller, 1987, p.27). In many cities a policeman had to pay for a job to a party machine. In
the1890s patrolmen had to pay $300 for their jobs in New York City, sergeants - $1,600, captains -
$12,000. Syphilitics, criminals and illiterates could easily join the force. Symbiotic relationship with
criminals was quite usual for police offices (Knott, Miller, 1987, pp.27-28).
In the federal government, one of the most important bureaucrats was the collector of custom
duties in New York. Numerous complains about corruption in the Customs House were confirmed by
a citizens commission in 1877 and by a trial testimony in 1907. It was revealed that customs officials
had registered lower shipment weight of sugar for years, defrauding the government of millions of
dollars of duties on raw sugar (Knott, Miller, 1987, p.30).
It took about 70 years for the USA to start a serious fight against corruption and to get out of the
corruption trap.
4. Experience of developing countries
It looks like almost all successful catching up countries either delayed democratization or had the
same ruling party (one-and-a-half party system) during the major part of the catch up period. Taiwan,
South Korea, Singapore, Chile before late 1980s, and China until now belong to the first group
whereas Japan after the Second World War, as well as Germany and Italy are examples of the second
group of countries. Sen (1997) pointed out that “we cannot really take the high economic growth of
China or South Korea in Asia as "proof positive" that authoritarianism does better in promoting
economic growth – any more than we can draw the opposite conclusion on the basis of the fact that
Botswana, the fastest-growing African country (and one of the fastest growing countries in the
world), has been a oasis of democracy in that unhappy continent”. Indeed the Freedom House gives
Botswana very high scores when evaluating political rights. However, whether Botswana should be
classified as a democracy, is questioned by researchers (Przeworsky et al., 2000). Botswana belongs
to the second group of countries: the same party was ruling the country since it gained independence
in 1966, and we do not know for sure whether it would yield power, if faced with a defeat at the polls.
It is noteworthy that among the former communist countries with the weak law and order
better economic performance was exhibited by less democratic regimes (Belarus, China, Kazakhstan,
Turkmenistan, Uzbekistan, Vietnam), whereas poor-rule-of-law, but more democratic regimes (other
12

CIS countries, Balkan states, Mongolia) generally performed less successfully in terms of GDP
change (Popov, 2000, 2006), and also in terms of life expectancy and income inequalities.
Table 1 uses Freedom House classification of transition countries for 1998-200010, and
excludes China, Vietnam, Mongolia and countries that were engaged into long war conflicts during
the 1990 (Albania, Armenia, Azerbaijan, Georgia, Macedonia, Tajikistan)11.
In accordance to this classification there were ten transition countries with Free Political
Regime: Bulgaria, Czech Republic, Estonia, Hungary, Latvia, Lithuania, Poland, Romania, Slovakia,
Slovenia; five transition countries with Partly Free Political Regime: Croatia, Kyrgyzstan, Moldova,
Russia, Ukraine; four transition countries with Not Free Political Regimes: Belarus, Kazakhstan,
Turkmenistan, Uzbekistan. Table 1 demonstrates that Partly Free countries experienced deeper
recession and larger increase in inequality than Not Free countries. In fact, these indicators for the last
category were much closer to Free country indicators than to Partly Free ones.
Table 1. Economic growth and inequality in transition countries with different political regimes
Political regime in 1998-2000
Real GDP in 2000, 1989=100%
Average Gini index, 1987-1990
Average Gini index, 1996-1998
Free 91.9 0.21 0.32
Partly Free 56.8 0.29 0.44
Not Free 84.2 0.27* 0.35*
Source: Freedom House; Economic Survey of Europe, 2003, No. 1, p. 224; World Bank, 2002, p. 9.
*Calculated as average for Belarus, Kazakhstan, and Turkmenistan.
5. Rate of growth and democratization: econometric study
5.1. Notations and data sources
Below, we use the following notation and data sources.
y - average growth rate of PPP GDP per capita in 1975-99.
10 If a country belonged to different classes in 1998-2000 we used the majority rule. 11 We use definition of war-torn countries from WORLD BANK, 2002.
13

This and other economic indicators are taken from World Development Indicators database for 1970-
99 unless otherwise specified. It contains data on over 200 countries. Not all data for each country are
available, however.
Y- PPP GDP per capita in 1975,
Ytot – PPP GDP in 1999, a measure of a country size,
IMfuel – net fuel imports as a % of total imports in 1960-99.
RL - Rule of Law index for 2000/2001 (World Bank 2002; Kaufmann, Daniel, Kraay, Aart, and
Zoido-Lobatón Pablo, 1999); it is based on polls of experts and surveys of residents, and changes
from –2.5 to +2.5 (the higher, the stronger the rule of law).
D - Average level of democracy in 1972-75, equals to the Freedom House index of political rights,
ranging from 1 to 7 for every year; the absolute level shows the degree of authoritarianism, so, lower
values mean more democracy (http://www.freedomhouse.org/ratings/index.htm).
∆ - Democratization in 1973/75-1999/2002, equals to the change in democratization levels for the
whole period and calibrated so as to make the indicator always positive and showing the increase in
democratization, not in the authoritarianism: ∆ = 4 – (D99-02 – D73-75).
AUTlast_min – the ratio of the index of political rights in 2002 to it’s minimum value in the period
1972-2002; the closer it is to 1, the less pronounced was the retreat from the highest point of
democracy registered for the whole period.
DEMstab - the indicator of the stability of democracy that is computed as the R2 in the equation
describing the time trend of the index of political rights.
IC - average 1984-90 investment climate index from the International Country Risk Guide: it ranges
from 0 to 100%, higher values mean better climate (World Bank, 2001).
IC2000 - 2000 Investment Climate index from the International Country Risk Guide (World Bank,
2001).
n- average population growth rate in 1975-99.
PD – population density in 1999г., persons per 1 sq. km.
I - average investment/GDP ratio in 1975-99.
CPI - average Corruption Perception Index for 1980-85 (Transparency International, 54 countries).
CPI 2002 - average Corruption Perception Index for 2002-2003 (Transparency International).
GE - Index of government effectiveness in 2000, ranges from -2.5 to +2.5 (WDI, 2001; Kaufmann,
Daniel, Kraay, Aart, and Zoido-Lobatón Pablo, 1999).
14

S1 - average share of the shadow economy in GDP in the 1990s, 1st estimate (Hellman, Jones, and
Kaufmann, 2000).
S2 - average share of the shadow economy in GDP in the 1990s, 2nd estimate (Hellman, Jones, and
Kaufmann, 2000).
rev1999 - average share of central government revenues in GDP in 1995-99 as a % of 1971-75.
Rev - average share of central government revenues in GDP in 1971-75, %.
FI- average share of net fuel import in 1960-75 in total import.
Is - dummy, equal to 1 if a country belongs to The Organization of the Islamic Conference.
Inflation75-99 – annual average inflation (GDP deflator) in 1975-99.
The proxy for the law and order (civil rights/liberalism) is the investment climate index from the
International Country Risk Guide (World Bank, 2001), which is available for 1984-90 period, i.e. for
the middle of the period of economic growth (1975-99), not for the end of it. Investors care more
about guarantees and predictability of property and contract rights than about democratic/political
rights, so liberal authoritarian regimes like Hong Kong (before and after the handover to China) get
very high scores. Another measure is the rule of law index from the World Bank database. This latter
database contains separate indices for the transparency and accountability, political stability, rule of
law, control of corruption, government effectiveness and quality of regulations. And we also use
corruption perception indices (CPI) from Transparency International that are available since 1980-85.
Table 2 presents descriptive statistics for “new democracies” – transition and developing
countries separately – as compared to all other countries. The unconditional results – uncontrolled for
other factors, such as the level of development, etc. – are quite similar for new democracies in post-
communist and in developing countries. The growth of GDP per capita in 1975-99 is slower than in
other countries, the increase in government revenues is less pronounced, the index of government
effectiveness is lower, and the shadow economy is larger. In addition, new democracies seem to run
higher budget deficits (developing countries), have higher inflation, lower level of foreign exchange
reserves and slower rates of accumulation of these reserves (developing countries), lower level of
energy prices (developing countries). Only increases in life expectancy in new democracies among
developing countries in 1970-2000 are larger (7.6 years) than elsewhere (7.0 years), but in multiple
regressions (controlling for rule of law and for initial level of life expectancy in the early 1970s) both
the level of democracy and the increase in democratization in the last three decades negatively affect
life expectancy. The closer scrutiny follows.
15
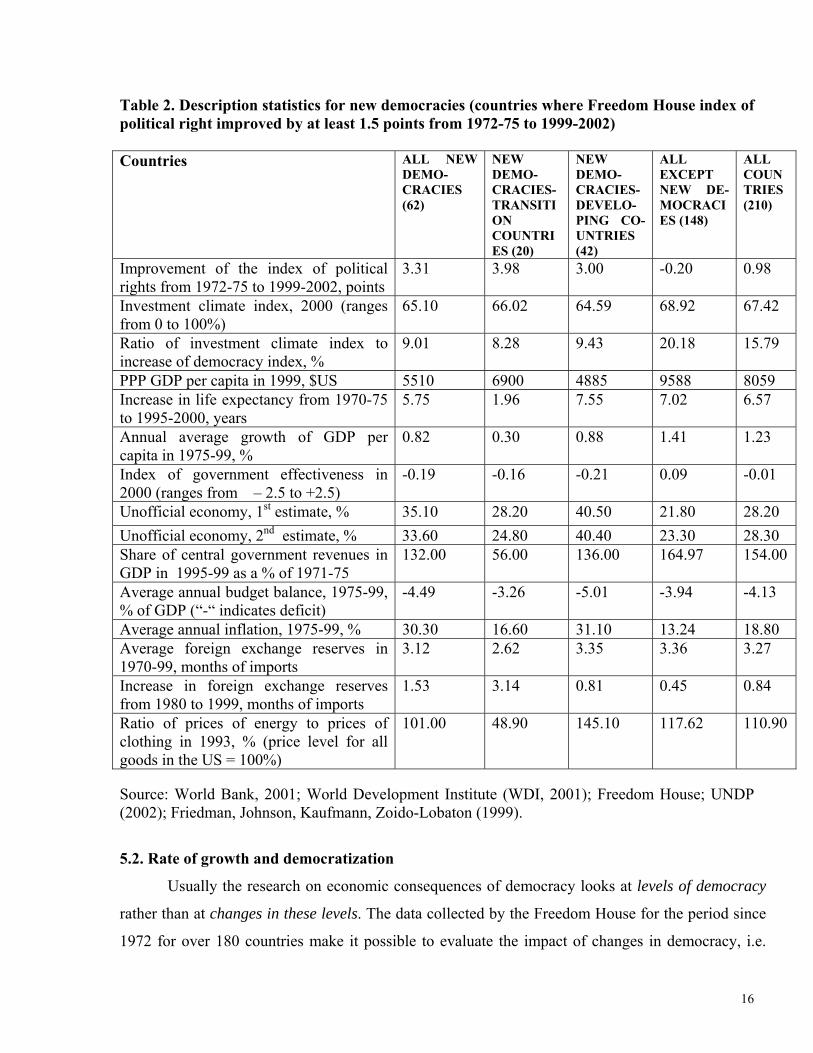
Table 2. Description statistics for new democracies (countries where Freedom House index of political right improved by at least 1.5 points from 1972-75 to 1999-2002) Countries ALL NEW
DEMO-CRACIES (62)
NEW DEMO-CRACIES- TRANSITION COUNTRIES (20)
NEW DEMO-CRACIES- DEVELO-PING CO-UNTRIES (42)
ALL EXCEPT NEW DE-MOCRACIES (148)
ALL COUNTRIES (210)
Improvement of the index of political rights from 1972-75 to 1999-2002, points
3.31 3.98 3.00 -0.20 0.98
Investment climate index, 2000 (ranges from 0 to 100%)
65.10 66.02 64.59 68.92 67.42
Ratio of investment climate index to increase of democracy index, %
9.01 8.28 9.43 20.18 15.79
PPP GDP per capita in 1999, $US 5510 6900 4885 9588 8059 Increase in life expectancy from 1970-75 to 1995-2000, years
5.75 1.96 7.55 7.02 6.57
Annual average growth of GDP per capita in 1975-99, %
0.82 0.30 0.88 1.41 1.23
Index of government effectiveness in 2000 (ranges from – 2.5 to +2.5)
-0.19 -0.16 -0.21 0.09 -0.01
Unofficial economy, 1st estimate, % 35.10 28.20 40.50 21.80 28.20 Unofficial economy, 2nd estimate, % 33.60 24.80 40.40 23.30 28.30 Share of central government revenues in GDP in 1995-99 as a % of 1971-75
132.00 56.00 136.00 164.97 154.00
Average annual budget balance, 1975-99, % of GDP (“-“ indicates deficit)
-4.49 -3.26 -5.01 -3.94 -4.13
Average annual inflation, 1975-99, % 30.30 16.60 31.10 13.24 18.80 Average foreign exchange reserves in 1970-99, months of imports
3.12 2.62 3.35 3.36 3.27
Increase in foreign exchange reserves from 1980 to 1999, months of imports
1.53 3.14 0.81 0.45 0.84
Ratio of prices of energy to prices of clothing in 1993, % (price level for all goods in the US = 100%)
101.00 48.90 145.10 117.62 110.90
Source: World Bank, 2001; World Development Institute (WDI, 2001); Freedom House; UNDP (2002); Friedman, Johnson, Kaufmann, Zoido-Lobaton (1999).
5.2. Rate of growth and democratization
Usually the research on economic consequences of democracy looks at levels of democracy
rather than at changes in these levels. The data collected by the Freedom House for the period since
1972 for over 180 countries make it possible to evaluate the impact of changes in democracy, i.e.
16

democratization per se, on economic and social development. It appears that the impact is different
for developed and developing countries, especially when the strength of the rule of law is taken into
account: for developing countries with poor rule of law greater democratization in 1975-99 was
associated with lower growth rates.
More accurate estimates – cross-country regression results – are presented in table 3:
average growth rates of GDP per capita in 1975-99 are explained by conventional factors
(investment, population growth, initial level of GDP per capita), democratization and the rule of law
indices.
It appears that the impact of democratization is different for developed and developing countries,
especially when the strength of the rule of law is taken into account: for developing countries with
poor rule of law greater democratization in 1975-99 was associated with lower growth rates. Table 3
reports the regression results with the interaction term of the rule of law and democratization; the
third equation is reorganized below, so as to make the threshold level12 of the rule of law explicit:
y = CONST. + CONTR.VAR. + 0.18∆(RL – 0.72), (1)
where ∆ – democratization (change in democracy index in 1970-2000), RL – rule of law index.
The critical level of the rule of law index is 0.72 (more than in Czech, Jordan, Malta, Uruguay;
but less than in Cyprus, Estonia, Hungary, Slovenia, Tunisia): if the index is higher, democratization
has a positive effect on growth, if it is lower, the impact is negative13. To put it differently,
regression (1) shows that only countries that managed to reach a certain level of the rule of law
benefited from democratization.
12 The idea of the threshold regressions is used extensively in our joint paper “Stages of Development and Economic Growth”, where we show that different policies (trade protectionism, accumulation of foreign exchange reserves, increase in government spending, liberalization of migration and of capital flows, etc.) are good for economic growth in countries with low level of GDP per capita and good quality of institutions, but bad for wealthier countries, especially if their institutions are weak. We try to determine the threshold level of GDP (and other indicators, such as the rule of law) in every case. The paper is available from the authors. See also: Polterovich, V., V. Popov. Appropriate Economic Policies at Different Stages of Development. NES, 2004 (http://www.nes.ru/english/research/pdf/2005/PopovPolterovich.doc). The updated version: http://www.wider.unu.edu/conference/conference-2005-3/conference-2005-3.htm. 13 Other policy variables, such as inflation, import taxes, increase in foreign exchange reserves and changes in the size of the government were included into the regression to see if the results still hold. They do, these regressions are not reported here to save space, but are available from the author.
17

Table 3. Factors explaining the average growth rate of GDP per capita in 1975-99 (democratization and the rule of law) – cross country OLS regression results (t-statistics – in brackets)
Dependent variable Average growth rate of GDP percapita in 1975-99
Number of observations 84 97 84 2000 investment climate index, ICRG (ranges from 0 to 100%, higher values –better climate)
0.1*** (4.18)
0.07*** (3.40)
Log PPP GDP per capita in 1975 -3.27*** (-6.22)
-2.43*** (-5.37)
-3.03*** (-6.44)
Average investment/GDP ratio in 1975-99, % 0.12*** (4.89)
0.12*** (4.44)
Average population growth rate in 1975-99, % -0.45** (-2.23)
-0.33* (-1.85)
-0.45*** (-2.51)
Increase in democracy index in 1970-2000 (positive values mean democratization)
-0.13* (-1.65)
-0.11 (-1.56)
-0.13* (-1.83)
Interaction term = Rule of law index *Democratization in 1975-2000
0.19*** (3.15)
0.31*** (6.85)
0.18*** (3.41)
Constant 6.52*** (3.09)
7.33*** (4.09)
4.71** (2.46)
Adjusted R2 53 56 63
*, **, *** - Significant at 10%, 5% and 1% level respectively. Robust estimates for T-statistics and standard errors to control for heteroscedasticity.
The shortcoming of rule of law indices is that they are available only for recent years, whereas
we are interested in the quality of institutions in the beginning (or at least in the middle) of the
period of economic growth. Note that using the rule of law indices for the end of the growth period
poses the endogeneity problem; we tried to find appropriate instrumental variables but did not
succeed. Hence later we use other measures of the law and order (investment climate and corruption
indices) that are available for the earlier period.
The Freedom House computes indices of civil liberties available from early 1970s, but they are
very correlated with political rights indices (and hence measure mostly political/democratic
liberties), whereas we are mostly concerned with non-political rights (security of life, contracts,
property, etc.). POLITY database has the same shortcomings. The case in point is Hong Kong,
where there was no democracy/political rights neither under the British rule, no after the hand over
to China in 1997, but where contracts and property rights were and are strictly enforced and where
there is stronger law and order than in most other countries. That is why to check the influence of
law and order we use corruption perception index (CPI) for 1980-85 – these estimates are available
18

from Transparency International for over 50 countries and make a lot of sense for our analysis. For
instance, they show that in 1980-85 corruption in the Soviet Union was in between developed and
developing countries, whereas today Russia is at the bottom of the list of developing countries. CPI
is measured on zero to ten points scale (the higher the index, the lower is corruption, so actually this
is the index of cleanness, not of corruption).
The results are presented in Table 4. The first equation in this table may be presented as follows:
y = CONST + CONTR. VAR. + 0.0729 ∆ (CPI – 6.65),
where CPI – is the average corruption perception index in 1980-1985.
If corruption index was higher than 6.65 (approximate level of corruption in Chile,
Malaysia, Spain in the early 1980s), democratization had positive impact on growth. If it was lower,
democratization had significant negative impact on growth. Adding investment to GDP ratio as one
of the control variables (equation 2), does not undermine the significance of democratization
variables. The threshold level of the corruption index increases (7.8, the level of Japan) and the
democratization coefficient is lower, suggesting that the impact of democratization on growth is
partly, but only partly, occurs through investment. Note that level of democracy in 1972-75, when
added to the control variables, turns out to be insignificant, though all other indicators retain their
significance (columns 4 and 5).
Inclusion of the corruption index, CPI, as a linear variable makes both the CPI and interaction
term (CPI∆) insignificant:
y = CONST + CONTR. VAR. + 0.11CPI + 0.036∆ CPI – 0.34∆ (0.48) (1.00) (-1.95)
(N=45, R2 = 73%, same control variables as in column 2 of table 4, T-statistics in brackets).
If corruption index is included as a linear variable only, i.e. excluding the interaction term
(CPI∆), we get inferior results – all coefficients become less statistically significant, whereas adjusted
R2 slightly falls:
y = CONST + CONTR. VAR. + 0.31CPI – 0.194∆,
(3.18) (-2.41)
(N=45, R2 = 72%, same control variables as in column 2 of table 4, T-statistics in brackets)
19

Results for developing countries only are even stronger.
Because we use CPIs for the initial part of the period in consideration, but not for the very
beginning of the period, there is a chance that CPI values as well as democratization depend on the
rate of economic growth. Therefore we tried to instrument democratization and interaction terms
using three instrumental variables: initial democracy, D, Islam dummy, Is, and average share of
fuel import for 1960-1975, FI. They are weakly correlated with rate of growth (correlation
coefficients are equal to -0.3, -0.16, and 0.2 respectively) but they explain a substantial part of
variation in democratization:
∆ = 3.16 + 0.487D - 1.23Is + 0.014IF, (11.06) (7.61) (−4.02) (2.75) Adj R-squared =0.34, Number of obs. = 137, Significance - 1%
Table 4. Factors explaining the average growth rate of GDP per capita in 1975-99 (democratization and corruption) – cross country OLS regression results (t-statistics – in brackets)
Dependent variable Average growth rate of GDP per capita in 1975-99 Number of observations 45 45 44 45 45 PPP GDP per capita in 1975 -.0008***
(-4.99) -.0006*** (-4.80)
-.0008*** (-7.04)
-.0007*** (-4.30)
-.0007*** (-4.18)
Average investment/GDP ratio in 1975-99, %
0.198*** (6.86)
0.139*** (3.47)
0.206*** (6.17)
Average population growth rate in 1975-99, %
-1.45*** (-4.27)
-1.18*** (-5.26)
-0.950*** (-3.90)
-1.14*** (-4.90)
-1.52*** (-4.48)
Increase in democracy index in 1970-2000 (positive values mean democratization)
-0.485*** (-4.12)
-0.416*** (-4.91)
-0.346*** (-3.84)
-0.356*** (-2.71)
-0.610*** (-3.03)
Interaction term = Corruption perception index in 1980-85*Democratization in 1970-2000
0.073*** (3.84)
0.053*** (3.50)
0.029* (1.91)
0.054*** (3.63)
.069*** (3.99)
2000 investment climate index, ICRG (ranges from 0 to 100%, higher values –better climate)
0.990*** (3.19)
Level of democracy in 1972-75 (lower values mean more democracy)
-0.119 (-0.62)
0.261 (1.06)
Constant 7.79*** (6.13)
2.10** (1.90)
3.43*** (3.40)
2.10* (1.98)
7.23*** (6.52)
Adjusted R2 46 73 79 73 48 *, **, *** - Significant at 10%, 5% and 1% level respectively. Robust estimates for T-statistics and standard errors to control for heteroscedasticity.
20

The results are presented in Table 5. The fourth column contains the following regression: y = 5.03 – 0.001Y+ 0.160I – 1.55n – 0.859∆ + 0.156∆CPI = 5.03 – 0.001Y + 0.160I – 1.55n + 0.156∆ ( CPI –5.51).
Thus the threshold level of CPI is equal to 5.51, which is close enough to the level found
earlier, whereas the significance of democratization variables is still reasonable.
Table 5. Factors explaining the average growth rate of GDP per capita in 1975-99 (democratization and corruption) – cross-country 2-SLS regression results, (t-statistics – in brackets)
Dependent variable Average growth rate of GDP per capita in 1975-99 Number of observations 44 44 44 44 PPP GDP per capita in 1975 -.001**
(2.40) -.001** (-2.67)
-.001** (-2.67)
-.001*** (-2.71)
Average investment/GDP ratio in 1975-99, %
0.157** (2.55)
0.160*** (2.80)
Average population growth rate in 1975-99, %
-1.54*** 3.33)
-1.54*** (-3.43)
-1.57*** (-3.80)
-1.55*** (-3.88)
Increase in democracy index in 1970-2000(positive values mean democratization)
-0.74* (-1.92)
-0.703* (-1.96)
-0.876** (-2.60)
-0.859** (-2.65)
Interaction term = Corruption perception index in 1980-85*Democratization in 1970-2000
0.151 (1.60)
0.153* (1.79)
0.165* (1.87)
0.156* (1.89)
PPP GDP in 1975 1.16*10-12* (1.77)
Constant 8.30*** (4.06)
8.10*** (4.04)
5.11** (2.07)
5.03** (2.12)
Instruments D, Is, FI D, FI D, FI D, Is, FI Adjusted R2 9 12 18 25
*, **, *** - Significant at 10%, 5% and 1% level respectively. Robust estimates for T-statistics and standard errors to control for heteroscedasticity. Instrumented: ∆, ∆CPI
Another indicator of the law and order is the Investment Climate Index. Table 6 presents
regressions, where investment climate index is used instead of CPI. The best regression is presented
in the third column of this table:
y = 0.883 – 0.0004 Y+ 0.122I – 0.559n – 0.981∆ + 0.016∆IC = (-4.07) (3.29) (-2.35) (-5.16) (4.66) 0.883 – 0.0004 Y+ 0.122I – 0.559n + 0.016∆ ( IC –61.31)
21

(N=90, R2= 51.62%, T-statistics in brackets). It reveals the investment climate index (IC) threshold, equal to 61.3%. Democratization affected
growth positively if and only if IC of a country exceeded this threshold level that corresponds to the
investment climate index of Albania, Colombia, India. Including the IC indicator as a linear variable
together with democratization and the interaction term makes all three coefficients insignificant.
Inclusion of the IC as a linear variable instead of the interaction term, IC∆, yields worse results -
statistical significance of the investment climate and democratization variables declines (and ∆ even
becomes insignificant) and R2 slightly decreases:
y = 0.883 – 0.0004 Y+ 0.122I – 0.559n + 0.08IC – 0.10∆ (-4.08) (3.26) (-2.78) (4.54) (-1.31) (N=90, R2 = 51.58%, T-statistics in brackets).
Again, the regression may suffer from the endogeneity problem. Unfortunately we were not
able to find proper instrumental variables to get a stable result. Using initial democracy, D, Islam
dummy, Is, and average share of fuel import for 1960-1975, FI, as instrumental variables, and
controlling for Y, we can support the threshold hypothesis with threshold level 57.7 (see column 4 of
the Table 6) which is close enough to the previous result. However, the hypothesis is not supported if
one controls for population growth or investment.
Table 6. Factors explaining the average growth rate of GDP per capita in 1975-99 (democratization and investment climate) – cross country OLS and 2-SLS (column 4) regression results, (t-statistics – in brackets)
Dependent variable Average growth rate of GDP per capita in 1975-99Number of observations 90 90 90 85 PPP GDP per capita in 1975 -.0004***
(-3.31) -.0005*** (-4.16)
-.0004*** (-4.07)
-.0009** (-2.52)
Average investment/GDP ratio in 1975-99, % 0.122*** (3.29)
Average population growth rate in 1975-99, % -0.614** (-2.56)
-0.559** (-2.35)
Increase in democracy index in 1970-2000 (positive values mean democratization)
-0.906** (-2.47)
-1.193*** (-5.65)
-0.981*** (-5.16)
-2.71*** (-3.03)
Interaction term = 1984-1990 investment climate index *Democratization in 1975-2000
0.016** (2.38)
0.020*** (5.08)
0.016*** (4.66)
0.047*** (2.99)
1984-1990 investment climate index 0.042 (1.09)
22

Constant -0.151 (-0.07)
4.003*** (4.25)
0.883 (0.69)
3.41*** (2.92)
Instruments D, Is, FI Adjusted R2 37 41 52 -
*, **, *** - Significant at 10%, 5% and 1% level respectively. Robust estimates for T-statistics and standard errors to control for heterocedasticity. Instrumented: ∆, ∆IC
6. Democratization and institutions: institutional decay in weak democracies?
The importance of institutional factors for economic growth was pointed out more than once
for various countries and regions (see Aaron (2000) and Acemoglu et al (2004) for surveys). Rodrik,
Subramanian, and Trebbi (2002) using instrumental variables for institutions and foreign trade
conclude that institutions are more important than either openness or geography for explaining
growth record of particular countries. Rodrik (1996b) found that nearly all variations in the rates of
growth in labor productivity in Southeast Asian countries in 1960-94 can be explained by per capita
income in 1960, average length of education and the index of the quality of institutions derived from
surveys conducted in the 1980s. Similarly, it was found that 70% of the variations in investment in 69
countries can be explained by only two factors – GDP per capita and institutional capacity index
(World Bank, 1997). Stiglitz (1998, 1999) wrote about emerging post-Washington consensus with the
greater emphasis on the role of institutions. Polterovich (1998) discusses mechanisms for the
institutional traps that stall growth
The collapse of institutions is often observable in the dramatic increase of the share of the
shadow economy; in the decline of government revenues as a proportion of GDP; in the inability of
the state to deliver basic public goods and appropriate regulatory framework; in poor enforcement of
property rights, bankruptcies, contracts and law and order in general (higher crime rates); in
macroeconomic instability – high rates of inflation; etc. Most of the mentioned phenomena may be
defined quantitatively with a remarkable result that some authoritarian regimes, like South Korea and
Taiwan before the 1990s, are closer to “old democracies” (Western countries) than to new
democracies of the “third wave”.
One possible general measure is the trust of businesses and individuals in various institutions.
In the global survey of firms in 69 countries on the credibility of the state institutions, CIS had the
lowest credibility, below that of Sub-Saharan Africa (World Bank, 1997, pp. 5, 35). Especially
striking was the gap between Eastern Europe (EE) and CIS countries: differences in credibility index
23

between South and Southeast Asia and EE were less pronounced than differences between Sub-
Sahara Africa and CIS. The government efficiency index (WDI, 2001; Kaufmann, Daniel, Kraay,
Aart, and Zoido-Lobatón Pablo, 1999) is another measure that is based on polls of experts and
surveys of residents.
Institutions are usually viewed as exogenous – at least in the short and medium term; there are
not so many studies offering clues to the patterns of the institutional rise or decay. In this paper we try
to prove that there is a price to pay for early democratization, i.e. introduction of competitive
elections under the conditions when major liberal rights (personal freedom and safety, property,
contracts, fair trial in court, etc.) are not well established. Below we try to check this proposition by
testing a number of hypotheses that democratization under the poor tradition of the law and order
leads to the deterioration of institutional quality: weakening law and order, increasing corruption14,
worsening investment climate, expanding shadow economy, decreasing government effectiveness.
These are potential channels through which early democratization may hamper economic growth. To
be sure, these consequences of democratization under the weak institutions are correlated between
themselves. For instance, the expansion of the shadow economy normally goes hand in hand with the
decline in the government effectiveness index (fig. 1).
Fig. 1. Index of government effectiveness in 2001 and the share of shadow economy in GDP in the 1990s
R2 = 0,3511
R2 = 0,1844
0
10
20
30
40
50
60
70
80
-1,5 -1 -0,5 0 0,5 1 1,5 2 2,5Index of government effectiveness (the higher, the more efficient)
Shar
e of
sha
dow
eco
nom
y in
G
DP
Shadow economy, 1st estimate
Shadow economy, 2nd estimate
14 We do not assert that institutions are better in autocracies than in weak democracies. We only show that in autocracies with weak institutions democratization worsens them even more. This may explain Triesman's (1999) finding that the current degree of democracy has no significant impact on the level on corruption; it is only the long exposure to democracy that limits corruption.
24

6.1. Shadow economy and democratization Using the corruption perception index as a proxy for rule of law in 1980-85, we get the following
equation for the unofficial economy:
S1 = 37.50 − 0.002Y − 22.70Tr + 3.74∆ −0.86CPI∆, (4.25) (−2.44) (−4.16) (4.83) (−6.59) Adj R-squared =0.78, Number of obs. = 33, Significance - 2%,
S1 = 37.50 − 0.002Y − 22.70Tr + 0.86∆(4.35 −CPI), (1)
where, as above, ∆ – democratization in 1970-2000, CPI – corruption perception index in 1980-85,
Y- PPP GDP per capita in 1975; Tr denotes a dummy variable for transition countries. Thus in
relatively “clean” countries democratization reduces the share of shadow economy, but in corrupt
countries democratization leads to the increase of unofficial economy. The threshold level of
corruption perception index in 1980-85 was 4.35 – in between Portugal and Greece.
For the second measure of the shadow economy one gets a similar result (2). Threshold level
though is higher and is equal to 5.64.
S2 = 35.31 − 0.022Y − 21.45Tr + 3.78∆ − 0.67CPI∆, (2) (3.23) (−2.09) (−3.39) (4.83) (−4.22) Adj R-squared = 0.78, Number of obs. = 33, Significance - 2%.
If we include CPI as a linear term in (1) or (2), it turns out to be most insignificant and does not
increase R-squared. Thus our threshold hypothesis is supported.
To test the robustness, we ran similar regressions with the investment climate index in 1984-90, IC,
as a proxy for institutional capacity:
S1 = 100.7 − 21.3logY + 0.12∆( 63 −IC ), (1a) (3.07) (−2.19) (3.45) (−3.13) Adj R-squared =0.71, Number of obs. = 47, Significance - 3%,
S2 = 35.31 − 22.8logY + 0.09∆ ( 60 − IC ) (2a)
25

(3.29) (−2.35) (2.39) (−2.25) Adj R-squared = 0.64, Number of obs. = 47, Significance - 2%.
The results are very similar (threshold investment climate index is 60-63%), the regression is quite
robust, and the parameters of the regressions deteriorate, once IC is included as a linear term.
6.2. Rule of law and democratization We regress the Rule of Law index for 2000 on democratization during previous 30 years and the
interaction term between democratization and corruption for 1980-1985. The result (1) seems to show
that democratization increases rule of law level only if the "initial" law and order (measured by
average CPI for 1980-85) is strong enough: the threshold level is equal to 3.04.
RL = − 0.28 − 0.17∆ + 0.056CPI∆ = − 0.28 + 0.056 ∆(CPI− 3.04) (3) (−0.09) (−2.81) (7.69) Adj R-squared =0.55, Number of obs. = 52, Significance - 1%
However, if we control for population density, PD, population density, corruption index in 1980-85,
CPI, and initial level of democracy, D, the sign of democratization variable changes:
RL = 0.003 + 0.0002PD - 0.27D + 0.22CPI + 0.24∆ (4) (5.51) (-4.68) (6.44) (5.83) Adj R-squared =0.84, Number of obs. = 51, Significance – 0.1%
This regression explains 84 percent of variation, and coefficients are extremely significant. Moreover,
if democratization variable is instrumented with fuel imports and Islam dummy variables, like we did
earlier, the parameters of regression virtually do not change. So it turns out that this second
hypothesis (no threshold, strictly positive linear impact of democratization on the rule of law) is
preferable: high population density, high initial level of democracy and cleanness, as well as fast
democratization – all contribute to higher rule of law at the end of the period.
6.3. Corruption and democratization Corruption could be another proxy for the law and order. Using this proxy we receive mixed results
as well. One gets a threshold by calculation a regression of average Corruption Perception index for
2002-2003 on democratization during previous 30 years and the interaction term between
26

democratization and corruption for 1980-1985 and controlling for initial GDP per capita, Y (equation
5). Recall that corruption perception index is higher for more clean countries.
CPI2002=2.84+0.00044Y − 0.31∆ + 0.10CPI∆ = − 0.28 + 0.00044Y + 0.10 ∆(CPI− 3.1) (5) (4.28) (4.00) (−2.51) (4.83) Adj R-squared =0.73, Number of obs. = 45, Significance - 2%
The threshold here is remarkably close to its value in (3) and 3(a). Initial democracy level, being
included, turns out to be insignificant and it does not change the significance of other variables too
much. All coefficients retain significance at a level of 10% or less and adjusted R-squared increases
up to 0.81 if one adds y and average PPP GDP per capita growth rate for 1975-1999 to the set of
explanatory variables.
One can get another form of threshold regression using a term of interaction between
democratization and initial PPP GDP per capita, Y:
CPI2002 = 4.62 + 0.26y + 0.31T− 0.41∆ + 0.00021 Y∆, (5.06) (2.11) (5.54) (4.83) Adj R-squared =0.47, Number of obs. = 73, Significance - 5%,
or
CPI2002 =4.62 + 0.26y + 0.31T + 0.00021 ∆(Y − 1952), (6 )
where T is the average ratio of the sum of export and import to GDP for 1980-1999. This parameter is
an indicator of economic openness. The threshold of GDP per capita in 1975 ($1952) is close to the
level of Algeria, Colombia, Peru, Turkey.
Nevertheless, if one controls for initial corruption level, CPI, all regressions described above fall
apart. The best regression we got to explain corruption in 2002-2003 does not contain
democratization at all:
CPI2002 = 0.51 + 0.32y + 0.01T + 0.00048 Y + 0.37CPI (7) (1.41) (3.25) (2.68) (4.67) (3.62) Adj R-squared =0.87, Number of obs. = 45, Significance - 2%.
This equation suggests that average GDP per capita growth rate, economic openness as well as initial
levels of GDP per capita and CPI all contributed positively to cleanness of a country.
Democratization does not help to explain final level of cleanness at all. Note, however, that the
difference in quality of regressions (5) and (7) is not very substantial and that growth itself depends
on democratization, as was shown earlier.
27

6.4. Investment climate and democratization If law and order is measured by the 2000 investment climate index one gets seemingly convincing
result (8).
IC 2000 = 63.45 + 0.0013Y −4.51∆ + 0.084IC∆ = 63.45+ 0.0013Y + 0.084 ∆(IC− 53.7) (8) (2.57) (4.34) (−5.03) (6.59) Adj R-squared = 0.59, Number of obs. = 86, Significance - 1%.
Democratization has positive influence only if average 1984-1990 Investment Climate index IC is
larger than a threshold level 53.7. This is a level of Ghana, Indonesia, and Pakistan.
However democratization turns out to be insignificant if we include a linear IC term. There is an
appropriate linear regression that does not contain democratization at all:
IC 2000 = 40.20 + 0.0011Y + 0.433 IC. (9) (11.93) (4.70) (7.65) Adj R-squared = 0.61, Number of obs. = 86, Significance - 1%.
Thus one has two different explanations of the IC dynamics. One interpretation may be that CPI
index and Investment Climate index are subjective measures that tend out to be highly correlated for
different periods in the same countries. Besides, like in the previous cases, there may be endogeneity
between investment climate index and democratization, but we did not succeed in finding
instrumental variables for democratization that are not correlated with investment climate index.
6.5. Government effectiveness and democratization
Table 7 summarizes regression results for government effectiveness index. Controlling for GDP
per capita and the rule of law indices, and even for all other measures of institutional capacity,
democratization that occurred in 1970-2000 had a clear negative impact on the efficiency of the
government. In the forth column in table 7 the corruption perception index is used as a proxy for the
law and order in the beginning of the growth period, so we get the following equation:
GE = -2.6 + 0.91logY +0.007 IMfuel + 0.025∆ (CPI – 3.7), (10)
(−2.64) (4.49) (1.76) (2.95) (−2.44)
28

Adj R-squared = 0.73, Number of obs. = 45, Significance - 2%.
where ∆ – democratization in 1970-2000, CPI – corruption perception index in 1980-85, IMfuel –
net fuel imports as a % of total imports in 1960-99.
.
Table 7. Factors explaining government effectiveness in 2000 – cross-country OLS regression results
Dependent variable Government effectiveness in 2000 Number of observations 155 131 154 45 45 Log PPP GDP per capita in 1975 0.65*** .91*** PPP GDP per capita in 1999 .00001* 2000 Rule of law index (WDI, 2001) .92*** .83*** .41*** 2000 Transparency and accountability index (WDI, 2001)
.09*
2000 Political stability index (WDI, 2001) .11** 2000Control of corruption index (WDI, 2001) .25*** 2000 Quality of regulations index (WDI, 2001) .18*** Net fuel imports in 1960-99, % of total imports 0.007** 0.007* Increase in democracy index in 1970-2000 (positive values mean democratization)
-.03** -.03* -.06*** -.09**
Corruption perception index in 1980-85 0.17*** Interaction term = democratization*corruption perception index in 1980-85
0.025 ***
Constant 0.13* .04 .28*** 2.5*** 2.65***Adjusted R2 86 87 90 77 73
*, **, *** - Significant at 10%, 5% and 1% level respectively. Robust estimates for T-statistics and standard errors to control for heteroscedasticity.
It means that democratization in relatively “clean” countries (with CPI over 3.7 – higher that
in Colombia, but lower than in India) raises the effectiveness of the government, whereas in corrupt
countries it undermines the effectiveness of the government.
True, as in the case with explaining corruption and investment climate index, it is possible to
find a better equation without the democratization variable at all:
GE = -2. 5 + 0.65logY+0.007IMPfuel + 0.17CPI (10a)
(−4.74) (3.40) (2.08 ) (4.93)
Adj R-squared = 0.77, Number of obs. = 45, Significance - 4%.
29

But it may well be that this is the result of the endogeneity between government effectiveness index
and CPI (even though CPI is for 1980-85 period, it may well be that government effectiveness index
in 1980-85 had an impact on CPI, and so does the government effectiveness index in 2000 because it
is correlated with the values for 1980-85). To test for such a possibility, we instrumented
democratization and interaction term with CPI in (10) and (10a) with the level of democratization in
1972-75, Islam dummy and net fuel imports in 1960-75 variables, but the results for the specification
without the threshold turned out to be slightly better anyway, i.e. we were not able to support firmly
the threshold hypothesis.
Similar results are obtained if the quality of institutions is proxied by the investment climate index for
1984-90, IC. Two equations with virtually the same goodness of fit (R-squared = 77%) – one with the
threshold and the other without it – can be obtained for a larger sample of countries (about 100) by
using the investment climate index instead of corruption perception index.
6.6. How democratization affects institutions – dealing with endogeneity
The results in sections 6.2-6.5 may seem dubious: for all indices that describe the quality of the
institutions (rule of law index, corruption perception index, index of government effectiveness, index
of investment climate) equations with the threshold work well, but it is possible to find a better
equation (with higher R2 and sometimes better T-statistics), where democratization affects the quality
of institutions positively or where democratization does not play any role at all. There may be several
explanations. First, given the previously established threshold relationship between shadow economy
and democratization, one may conclude that subjective indices estimated by experts are inferior
measures of the quality of institutions as compared to such objective measure as the share of shadow
economy.
The second interpretation is that the impact of democratization on the rule of law index is really
uncertain and that the threshold impact of democratization on economic growth is due mostly to its
impact on the size of the government and on macroeconomic policies (discussed below).
The third interpretation may be most plausible – it is based on accounting for the endogeneity
between institutions and democratization. Indeed, in another paper (Polterovich, Popov, Tonis, 2006)
we show that the stability of the newly born democracies depends on the initial level of democracy in
30

1972-75, D, and the quality of the institutions in the beginning of the period (index of investment
climate for 1984-90, IC, and Corruption perception index, CPI):
AUTlast_MIN = 2.5 - 0.005Y - 0.009IC - 0.1D - 0.006 IMfuel , (-1.79) (-1.73) (-2.21) (-2.20)
N = 89, Adjusted R2 = 0.17, Significance – 9%.
The dependent variable here, characterizing the instability of democratization, AUTlast_min, is
the ratio of the index of political rights in 2002 to it’s minimum value in the period 1972-2002. It
is a crude, but reasonable measure of the success of democratization: the closer it is to 1, the less
pronounced was the retreat from the highest point of democracy registered for the whole period15.
It turns out that, controlling for the initial level of democracy, the magnitude of the democratic
retreat that occurred in 1972-2002 was greater in countries with relatively weaker institutions and
larger resource exports. The equation also works, if the quality of institutions is measured by the
various indices for the end of the period in question, such as the rule of law index and government
effectiveness index (with various control variables). Besides, the regression works with the
increase in “cleanness” (as measured by the change in CPI – corruption perception index from
Transparency International) from 1980-85 to 2002-03.
It basically suggests that the success of the newly born democracies depends on the quality of
institutions in the beginning of the period. But the quality of institutions at the end of the period is
affected by the magnitude of democratization itself. It means that in countries with weak institutions
in the beginning of the period democratization attempts were very likely unsuccessful, so at the end
of the period they returned to authoritarianism, whereas the institutional quality was damaged by the
democratization attempts anyway. Thus, what we observe by the end of the period is poor institutions
with no change in the level of democracy. To put it differently, our previous indicator of the increase
15It should be noted that this variable, AUTlast_MIN, has a negative sign in growth regressions: the retreat from the highest level of democracy had a negative impact on growth: y = CONST + CONTR. VAR. - 0.48AUTlast_MIN (N=88, R2 = 39%, control variables – population density, PPP GDP per capita in 1975, level of democracy in 1972-75, significance – 10%).
31

in the level of democracy, ∆, may not be appropriate to capture correctly the impact of
democratization on institutions because it excludes by definition cases of democratization under poor
institutions that ended up in return to authoritarianism. The evidence is the following regression that
uses the AUTlast_MIN – the indicator that captures not only the direction of change in the political
regime, but also the persistence of this change:
CPI2002 = 2.14+ 0.55CPI+0.00034Y + 0.00037PD - 1.05*10-12Ytot- 0.73AUTlast_MIN (3.53) (4.74) (2.63) (3.71) (−2.62) (−2.08) Adj R-squared =0.85, Number of obs. = 44, Significance - 5%.
where (Ytot) is the total PPP GDP of a country in 1975, a measure of the country size.
The equation suggests that high cleanness in 2002 (lower corruption, higher CPI2002) controlling for
the initial level of corruption in 1980-85, CPI, was observed in countries which became democratic
and stayed democratic by the end of the period or returned to the achieved earlier level of democracy
by the end of the period. Two indicators, AUTlast_MIN and ∆, are correlated, but there is an
important difference between them. For instance, a country that started with democracy, moved to
authoritarianism, but then back to democracy would have ∆ = 0, but AUTlast_MIN = 1, i.e. this
would be considered as a case of successful democratization according to the second indicator, but
not according to the first one. On the contrary, a country that started with authoritarianism, moved to
democracy, but then to authoritarianism again, would also have ∆ = 0, but AUTlast_MIN >1.
It is noteworthy that the equation does not work, if we substitute AUTlast_MIN with ∆ (∆
becomes insignificant), but works perfectly well, if we instrument AUTlast_MIN with net fuel import
(which is not correlated with residuals, but is good predictor of AUTlast_MIN).
So, the conclusion is that democratization under weak institutions does indeed ruin them even
further, but we could not capture this effect in sections 6.2-6.5 because low ∆ countries include some
cases of successful democratization (from democracy to authoritarianism and back to democracy), as
well as some cases of unsuccessful democratization (from authoritarianism to democracy and then
back to authoritarianism). AUTlast_MIN allows to better account for what may be called successful
democratization (if a country was democratic at one point in the middle of the period, but ended up in
authoritarianism, AUTlast_MIN>1 and this case is not considered as success).
Similar results not reported here are obtained for other indices that characterize the quality of
institutions. Besides, these results hold when using a different measure of “successful
32

democratization” instead of AUTlast_MIN – the indicator of the stability of democracy that is
computed as the R2 in the equation describing the time trend of the index of political rights. One of
the equations is reported here as an example:
GE=-2.1+0.6logY-0.16D+0.0003PD+5.3*10-10Ytot-0.34Islam+0.2∆(IC-33)+0.005IC(DEMstab), (4.76) (-4.19) (8.17) (1.68) (2.36) (5.87) (-2.82) (1.94)
Adj R-squared =0.78, Number of obs. = 87, T-statistics in brackets.
where DEMstab - the indicator of the stability of democracy that is computed as the R2 in the
equation describing the time trend of the index of political rights, and Ytot – total PPPGDP, a
measure of a country size. According to this equation, government effectiveness, after controlling for
initial GDP per capita, population density and total initial GDP, Islam dummy variable and the initial
level of democracy, is influenced positively by democratization, if initial investment climate was
good, but negatively, if it was bad; on top of that the stability of the change in the index of political
right (in either direction) had a positive effect on government effectiveness.
Obviously more research is needed to properly account for the endogeneity between
democratization and institutions’ quality.
6.7. Democratization and the size of government
Institutional capacity of the state is determined by the efficiency of the government (provision of
public goods per $1 of government spending), as well as by the financial strength of the government
– the share of state revenues/expenditure in GDP. It appears that democratization in poor law and
order countries may have had an adverse effect on the size of the government. Perhaps nowhere else
in the world the process was more pronounced than in transition economies in the 1990s. In most of
them there occurred a dramatic reduction in the share of government spending in GDP and in the
efficiency of state institutions.
When real government expenditure fall by 50% and more - as it happened in most CIS and
South-East Europe states in the short period of time, just in several years, - there are practically no
chances to compensate the decrease in the volume of financing by the increased efficiency of
institutions. As a result, the ability of the state to enforce contracts and property rights, to fight
criminalization and to ensure order in general falls dramatically. The story of the successes and
33

failures of transition is not really the story of fast liberalizers in Central Europe and procrastinators in
the CIS. The major plot of the post-socialist transformation “novel” is the preservation of strong
institutions in some countries (very different in other respects – from Central Europe and Estonia to
China, Uzbekistan and Belarus) and the collapse of these institutions in the other countries. The crux
of this story is about the government failure (strength of state institutions), not about the market
failure (liberalization).
Whereas Central European countries and Estonia managed to arrest the fall of tax revenues as
a proportion of GDP, Russia and most other CIS countries (together with Lithuania, Latvia, and
several Southeast Europe states) experienced the greatest reduction. Exceptions within CIS prove the
rule: the decline in government revenues as percentage of GDP in Belarus and Uzbekistan was less
pronounced than elsewhere in CIS. Ukrainian example, on the other hand, proves that it is not the
speed of reforms per se that really matters, but the ability of the government to control redistribution
activities. Authoritarian regimes in Belarus and Uzbekistan could prevent disorganization and state
property stripping, whereas Ukrainian interest groups used weak democratic institutions and
weakness of the government in general to “grab the state”.
This is the alternative explanation of the Estonian success in economic transformation as
compared to most CIS states and even to neighboring Baltic states: the usual interpretation that
focuses on the progress in liberalization may overlook the impact of strong institutions. Not
surprisingly, Campos (1999) found evidence that government expenditures are positively, not
negatively correlated with economic growth in transition economies.
According to EBRD (1999), the quality of governance in the transition economies, as it is
evaluated by the companies themselves, is negatively correlated with the state capture index
(percentage of firms reporting significant impact from sales to private interests of parliamentary votes
and presidential decrees). The relationship seems to be natural – the less corrupt is the government,
the better the quality of governance. What is more interesting, both, the quality of governance
(positively) and the state capture index (negatively) are correlated with the change in share of state
expenditure in GDP. Belarus and Uzbekistan fall into the same group with Central European
countries and Estonia – relatively small reduction of state expenditure as percentage of GDP during
transition, comparatively good quality of governance, little bribery, not too large shadow economy
and state capture index (Hellman, Jones, and Kaufmann, 2000). Belarus, according to BEEPS survey,
was one of the two countries in the region (the other was Slovakia) that registered statistically
34

significant improvements in all 7 areas of governance in 2002-05 (judiciary, fighting crime, control
over corruption, customs and trade regulation, business licensing and permits, labor regulations, tax
administration) – (EBRD, 2005).
The post-communist transition story is by no means unique and has broader implications. The
following regression demonstrates once again that democratization under the poor law and order is
costly.
rev1999 = 73.02 + 0.075Y − 10.80Rev + 67.71D − 34.08∆. (12) (2.77) (-2.57) (2.41) (-2.15) Adj R-squared = 0.67, Number of obs. = 66, Significance – 5%.
Recall that rev1999 is average share of central government revenues in GDP in 1995-99 as a
percentage of the 1971-75 level, and D is a level of democracy in 1972-75 (lower values mean more
democracy). Thus the increase in the ratio of government revenues to GDP in 1975-99 depends
positively on initial levels of GDP per capita, Y, and negatively on both initial levels of the average
share of central government revenues in GDP in 1971-75, Rev, and democracy. It is the most
important that democratization, ∆ (positive values denote increases in democracy) slows down the
growth of central government revenues.
Democratization and other variables (except Rev) lose their significance if one adds CPI into the set
of control variables, but the goodness of fit falls down dramatically (to 25% and less).
6.8. Democratization, macroeconomic and industrial policy
The research on Latin American and other countries has proven that the “transitional
democracies” are less efficient than either authoritarian regimes or well established democratic
regimes in resisting macroeconomic populism (Kaufman and Stallings, 1991; Dornbush and Edwards,
1989; Sachs, 1989). Weak governments that cannot collect taxes have to resort to budget deficits
financed via inflation tax.
As fig. 2 suggests, there is a negative relationship between the ratio of rule of law index to
democratization and inflation. A closer scrutiny (table 8) reveals that democratization contributes to
inflation controlling for the law and order and other variables. If two countries had the same equal
levels of the investment climate index in 1984-90, average inflation was higher in the country that
had lower authoritarianism (higher initial democracy level) in 1972-75 and experienced deeper
35

democratization in the subsequent three decades. The equation shown in column 1 is presented
below:
Lg Inflation75-99 = 5.2 – 0.048IC − 0.20D + 0.18∆. (13) (9.36) (-7.29) (-4.02) (3.55)
Adj R-squared = 0.44, Number of obs. = 91, Significance – 0.1%.
Fig. 2. Inflation and the ratio of investment climate to increase in democracy index in 1975-99
R2 = 0,116
1
10
100
1000
5 10 15 20 25 30 35 40 45 50 55
Ratio of investment climate to increase in democracy index, %
Infla
tion,
%, l
og s
cale
Table 8. Factors explaining inflation– cross country OLS regression results, robust estimates Dependent variable Logarithm of average annual inflation in
1975-99, % (GDP deflator)
Number of observations 91 83 Log PPP GDP per capita in 1975 Annual average inflation, 1960-99, % .03*** Average investment climate index for 1984-90, ICRG -.05*** -.03*** Level of democracy in 1972-75 (lower values mean more democracy)
-.2*** -.10***
Increase in democracy index in 1970-2000 (positive values mean democratization)
.18*** .10***
Constant 5.9*** 3.85*** Adjusted R2 44 81
*, **, *** - Significant at 10%, 5% and 1% level respectively.
36

The second column shows that results do not change even when we control for the previous
inflationary experience (annual average inflation in 1960-99). Finally, we tried also to control for the
average government debt to GDP ratio in 1960-99 and external debt to GDP ratio in 1970-99, but
these indicators were not statistically significant.
We were not able to find any statistically significant threshold, however.
Similarly, it appears that democratic countries, other things being equal, tend not to impose import
duties as much as autocracies do. As table 9 suggests, import taxes are used mostly by poor
countries (with low GDP per capita) and countries with authoritarian political regimes: the higher
was the level of democracy in 1972-75 and the greater was democratization in the 1970-90s, the
lower were import duties16. Since there is evidence that protectionism sometimes boosts international
trade and economic growth in developing countries (Rodriguez, Rodrik, 1999; Polterovich, Popov,
2005), it follows that democratizing countries have less instruments to promote growth than
autocracies.
Table 9. Factors explaining the level of import and export duties – cross-country OLS regression results (T-statistics in brackets) Dependent variable/ Explanatory variables
Import duties as a % of import, average for 1975-99
Export duties as a % of export, average for 1975-99
Number of observations N = 104 N = 89 N = 89 N = 65 Log PPP GDP per capita in 1975, $
-.8. 6*** (-3.70)
-11.9*** (-7.69)
-2.88*** (-3.27)
-2.3 (-3.51)
Level of democracy in 1972-75 (lower values mean more democracy)
9.8* (1.64)
Increase in democracy index in 1970-2000 (positive values mean democratization)
-1.26** (-2.59)
Government revenues as a % of GDP in 1975
0.22 (033)
-0.07* (-1.82)
-0.06* (-1.90)
Ratio of government revenues to GDP in 1999 as a % of 1975
-0.012 (-1.42)
Constant 36.2*** (3.95)
49.0*** (10.84)
12.8*** (4.97)
11.7*** (5.28)
Adjusted R2 44 44 21 28 *, **, *** - Significant at 10%, 5% and 1% level respectively. Robust standard errors. 16 Export duties were generally much lower than import duties. They were used also mostly by poor countries, but with low level and low increase in government revenues, i.e. they were probably used mostly for fiscal purposes. On the contrary, the correlation between import duties and the level of government revenues was non significant (table 9).
37

7. Conclusions
There may be several reasons why extensive research on the link between democracy and growth
produces conflicting results. First, previous papers looked mostly at the level of democracy, but not at
changes in this level. Our regressions show that the influence of initial democracy level on growth is
positive or insignificant, but the influence of democratization (increase in the level of democracy) is
often negative.
Second, and probably most important, very often the distinction between the law and order
(civil rights) and democracy (political rights) is not rigorous. This paper controls for the law and
order, which is defined as the ability of the state to enforce rules and regulations based not on
arbitrary practices, but on well established legal rules (measured by the corruption, government
effectiveness, rule of law and investors’ climate indices), and examines the impact of democratization
on economic growth. We presented a number of evidences to support our first threshold hypothesis:
that democratization in countries with strong law and order stimulates economic growth, whereas in
countries with poor law and order democratization undermines growth. Thus, a certain threshold level
of the law and order is required to reap the benefits of democratization. Our findings make plausible
the second threshold hypothesis: in countries with poor tradition of the law and order, rapid
democratization undermines institutional capacity and the quality of macroeconomic policy with
predictable adverse effect on economic growth.
Not all presented econometric results support the second hypothesis. One possible explanation
may be that we considered a long period of 25 years and did not differentiate properly between
shock-wise and gradual democratization. One has to study shorter periods as well and include
maximum speed of democratization into considerations. Besides integral output losses for the period
should be taken into account as well.
In several cases we find (see Sections 6.2 – 6.5) that linear specifications results in conclusion
that democratization is not significant whereas nonlinear specifications detect a threshold levels.
Variations in results may be associated with the quality of subjective institutional indices: once
institutional capacity is proxied by the share of the shadow economy, the threshold hypothesis is
supported, but once subjective measures are used, it turns out that democratization either does not
have an impact on the quality of institutions, or has a positive influence. It is worth mentioning in this
respect that neither of the subjective indices that we used (corruption perception index, rule of law
38

index, government effectiveness index and investment climate index) does not help to explain the
share of shadow economy in GDP after controlling for the level of GDP per capita. This is very much
against intuition and raises serious concerns about the quality of these subjective indices. Another
interpretation is that there is an endogeneity between institutions and democratization that was
discussed in section 6.6. In any case, further efforts are needed to distinguish between these three
explanations.
Although our empirical results are not completely convincing we believe that there is a trade-
off between democratization in poor law and order countries and other developmental goals. Early
transition to electoral democracies in countries with weak law and order may be detrimental to
growth and inflicts high economic and social costs, because it undermines institutional capacity of the
state and it’s ability to carry out responsible economic policies.
The practical implication of this analysis is that introduction of the democracy overnight may
be not the best way to transform authoritarian regimes17. Democracy building, like market type
reforms, should be gradual, rather than shock therapy type, and should go hand in hand with the
strengthening of the law and order. Democracy, participation in decision making and civil society are
precious developmental goals by themselves and they should not be compromised by bad
implementation. This leads us to the basic question for future research: what is a sequence of interim
institutions that permits to reach stable democracy without deceleration of economic growth?
REFERENCES
Aaron, J. (2000). Growth and Institutions: A Review of the Evidence. The World Bank Research
Observer, v.15, No.1, 99-135.
Acemoglu, A., Johnson, S., and J.Robinson. (2004). Institutions as the fundamental cause of long-run
growth. NBER Working paper series, Working Paper 10481.
Acemoglu, A., Johnson, S., Robinson, J., and P. Yared (2005). Income and Democracy. MIT,
Working paper 05-05, February, 35 pp.
Afontsev, S. (1999). Economic Transformation in the Mirror of Political-Economic Analysis. –
Rossiya XXI, 1999, No. 3, pp. 49-83 (in Russian).
17 In his recent study of Arab political reform, Daniel Brumberg wrote: ” It is far from clear how to reform liberalized autocracies… Encouraging rapid change, such as completely free elections, might invite radical forces and even retreat to full autocracy.” (Brumberg, 2003).
39

Akhmedov, A., and E. Zhuravskaya (2004). Opportunistic Political Cycles: Test in a Young
Democracy Setting. - Quarterly Journal of Economics, November 2004, 1301- 1338.
Alesina, A. and Rodrik, D. (1994), Distributive Politics and Economic Growth. – Quarterly Journal
of Economics, 1994, May, Vol. 109, No.2, pp. 465-90.
Barro (1996). Democracy and Growth. Journal of Economic Growth, Vol.1, 3-27.
Barro (1999). Determinants of Democracy. Journal of Political Economy, 1999, Vol. 107, No.6, 158-
183.
Barro R. (2000). Rule of Law, Democracy, and Economic Performance. Index of Economic Freedom,
Ch.2, 31-49 (http://www.heritage.org/research/features/index/ChapterPDFs/2000_Chapter_2.pdf).
Brumberg, D. (2003). Liberalization Versus Democracy. Understanding Arab Political Reform.
Carnegie Endowment for International Peace, Working paper No. 37.
Campos, N. (1999). “Back to the Future: The Growth Prospects of Transition Economies
Reconsidered”. William Davidson Institute Working Paper No. 229, Ann Arbor, April 1999.
Carothers, Thomas (2002). The End of the Transition Paradigm. – Journal of Democracy, Jan. 2002,
pp.5-21.
Chang, H.-J. (2002). Kicking Away the Ladder. Cambridge University Press.
Cheung, S. (1998). The Curse of Democracy as an Instrument of Reform in Collapsed Communist
Societies”, Contemporary Economic Policy, Vol.16, No.2, April 1998 pp.247-249.
Dethier, Jean-Jacques, Ghanem, Hafez, Zoli, Edda. Does Democracy Facilitate the Economic
Transition? World Bank, 1999.
Chua, Amy (2002). World on Fire: How Exporting Free Market Democracy Breeds Ethnic Hatred
and Global Instability. New York : Doubleday, 2002.
Clague, Ch., Keefer, Ph., Knack, St., and M. Olson (1996). Property and Contract Rights in
Autocracies and Democracies. Journal of Economic Growth, Vol.1, (June), 243-276.
Diamond, Larry (1997a). Is the Third Wave of Democratization Over? An Empirical Assessment,
Helen Kellogg Institute for International Studies Working Paper no. 236 (University of Notre Dame,
March).
Diamond, Larry (1997b). Is the Third Wave of Democratization Over? The Imperative of
Consolidation. Working Paper #237 March 1997
Dornbush, Rudiger and Edwards, Sebastian (1989). The Economic Populism Paradigm. NBER
Working Paper 2986, Cambridge, Mass., 1989.
40

EBRD (1997). Transition Report 1997. EBRD, London, 1997.
EBRD (1998). Transition Report 1997. EBRD, London, 1998.
EBRD (1999). Transition Report 1999. EBRD, London, 1999.
(EBRD, 2005). Transition Report 1999. EBRD, London, 2005.
Ellman, Michael (2000). The 1947 Soviet Famine and the Entitlement Approach to Famines. –
Cambridge Journal of Economics, 2000, Vol. 24, pp. 603-30.
Fernandez, Raquel, and Rodrik, Dani (1991). Resistance to Reform: Status Quo Bias in the Presence
of Individual Specific Uncertainty. – American Economic Review, 1991, Vol. 81 (5), 1146-1155.
Fidrmuc, Jan (1998). Political Support for Reforms: Economics of Voting in Transition Countries. –
European Economic Review, 44 (8), 2000, pp. 1491-1513.
Fidrmuc, Jan (2002). Economic Reform, Democracy and Growth during Post-communist
Transition. CEPR Discussion Paper No. 2759, 2002.
Freedom House (http://www.freedomhouse.org/index.htm)
Friedman, Eric J., Johnson, Simon, Kaufmann, Daniel, Zoido-Lobaton, Pablo (1999). Dodging the
Grabbing Hand: The Determinants of Unofficial Activity in 69 Countries. – Fifth Nobel Symposium
in Economics. Stockholm, September 10-12, 1999
(http://web.mit.edu/sjohnson/www/attach/Dodging%20the%20Grabbing%20Hand%20August%2019
99.pdf).
Frye, T. & Shleifer, A. (May 1997). The Invisible Hand and The Grabbing Hand, American
Economic Review, pp. 354-358.
Gastil , R. D. ( 1989). Freedom in the World: political Rights and Civil liberties, 1988-89. New York,
Freedom House.
Gradstein, Mark and B. Milanovic (2004). Does Liberté=Egalité? A Survey of the Empirical
Evidence on the Links Between Political Democracy and Income Inequality. Final version
published in Journal of Economic Surveys, vol. 18 No. 4, pp. 515-537, September 2004.
Hellman, Joel, Jones, Geraint, and Kaufmann, Daniel (2000). How Profitable Is Buying the State
Officials in Transition Economies? - Transition. The Newsletter About Reforming Economies, April
2000, p.8-11.
Holmes, S. (1997). What Russia Teaches Us Now. - The American Prospect, July-August, 1997, p.
30-39.
41

Intriligator, M.D. (1998). Democracy in Reforming Collapsed Communist Economies: Blessing or
Curse? – Contemporary Economic Policy Vol.16, No.2, April 1998, pp.241-246.
Kaplan, Robert D. (2000). The Coming Anarchy: Shattering the Dreams of the Post Cold War.
New York : Random House, 2000.
Kaufmann, Daniel, Kraay, Aart, and Zoido-Lobatón Pablo (1999). Governance Matters. World bank
Policy Research Working Paper 2 196 (http://www.worldbank.org/wbi/governance/pdf/govmatrs.pdf).
Kaufman, Robert R. and Stallings, Barbara (1991). The Political Economy of Latin American
Populism. – In: Macroeconomics of Populism in Latin America. Ed. By R. Dornbush and S. Edwards.
Chicago and London, 1991.
Knott, J.H., G.J. Miller (1987). Reforming Bureaucracy. The Politics of Institutional Choice.
Prentice-Hall, Englewood Cliffs, New Jersey. 290 pp.
Liew, Leong. Marketization, Democracy and Economic Growth in China. – In: Beyond the Asian
Crisis: Pathways To Sustainable Growth. Ed. By A. Chowdhury, I. Islam. Northampton, MA,
Edward Elgar, 2001, pp. 300-23.
Naughton, Barry (1997). Economic Reform in China. Macroeconomic and Overall Performance. - In:
The System Transformation of the Transition Economies: Europe, Asia and North Korea. Ed. by D.
Lee. Yonsei University Press, Seoul, 1997.
Nelson, Michael A., Ram D. Singh (1998). Democracy, Economic Freedom, Fiscal Policy, and
Growth in LDCs: A Fresh Look. – Economic Development and Cultural Change, July 1998, Vol. 46,
No. 4, pp. 677-96.
Olson, Mancur (1991). Autocracy, Democracy and Prosperity. – In: Zeckhauser, Richard J. Strategy
and Choice, Cambridge, MIT Press, 1991, pp. 131-57.
Olson, Mancur (2000). Power and Prosperity: Outgrowing Communist and Capitalist Dictatorships.
Basic Books, 2000.
Polterovich, Victor (1998). Institutional Traps and Economic Reforms. Working Paper # 98/004.
New Economic School, Moscow, 1998.
Polterovich, Victor (2002). Political Culture and Transformational Recession. A Comment on the
article by A. Hillman “En Route to the Promised Land” – Economics and Mathematical Methods,
2002 (in Russian).
Polterovich, Victor, V. Popov (2002). Accumulation of Foreign Exchange Reserves and Long Term
Economic Growth. Paper presented at 10th NES Anniversary conference. Moscow, December 2002
42

(http://www.nes.ru/english/about/10th-Anniversary/papers-pdf/Popov-Polterovich.pdf and
http://www.nes.ru/english/about/10th-Anniversary/papers-pdf/Popov-charts.pdf).
Polterovich, Victor, V. Popov (2004). Appropriate Economic Policies at Different Stages of
Development. NES, 2004.
Polterovich, Victor, V. Popov, A. Tonis, (2006). Resource Abundance, Political Corruption and
Instability of Democracy. NES Working paper, 2006.
Popov, Vladimir (2000). Shock Therapy versus Gradualism: The End of the Debate (Explaining the
magnitude of the Transformational Recession). – Comparative Economic Studies, Vol. 42, No.1,
Spring 2000.
Popov, V. (2006). Shock Therapy versus Gradualism Reconsidered: Lessons from Transition Economies
after 15 Years of Reforms. TIGER Working paper No. 82, 2006
(http://www.tiger.edu.pl/publikacje/TWPNo82.pdf ).
Przeworski, Adam and Limongi, Fernando (1993). Political Regimes and Economic Growth. –
Journal of Economic Perspectives, Vol. 7, No. 3, Summer 1993, pp. 51-69.
Przeworski, Adam, Michael E. Alvarez, José Antonio Cheibub, and Fernando Limongi (2000).
Democracy and Development: Political Institutions and Well-Being in the World, 1950-1990.
Cambridge University Press, 2000.
Rawls, John (1971). A Theory of Justice. Cambridge, Massachusetts: Belknap Press of Harvard
University Press, 1971.
Rodriguez, Francisco and Dani Rodrik (1999). TRADE POLICY AND ECONOMIC GROWTH:
A Skeptic’s Guide to the Cross-National Evidence. CEPR Discussion Paper No. 2143
Rodrik, Dani (1995). Understanding Economic Policy Reform. – Journal of Economic Literature,
1995, Vol. 34, 9-41.
Rodrik, Dani (1996a). Why Do More Open Economies Have Bigger Governments? NBER working
paper 5537. April 1996 (http://www.nber.org/papers/w5537). .
Rodrik, Dani (1996b). Institutions and Economic Performance in East and South East Asia. In Round
Table Conference: The Institutional Foundations of Economic Development in East Asia. Tokyo,
December 1996, pp. 391-429.
Rodrik, Dani (1997). December 1997. Democracy and Economic Performance. A paper for a
conference in South Africa (http://ksghome.harvard.edu/~.drodrik.academic.ksg/demoecon.PDF).
43

Rodrik, Dani, Arvind Subramanian and Francesco Trebbi (2002). Institutions Rule: The Primacy of
Institutions over Geography and Integration in Economic Development. October 2002
(http://ksghome.harvard.edu/~.drodrik.academic.ksg/institutionsrule,%205.0.pdf).
Rodrik, Dani, Romain Wacziarg (2005). Do Democratic Transitions Produce Bad Economic
Outcomes? – American Economic Review, Papers and Proceedings, vol. 95, no. 2, May 2005, 50-
55.
Ross, Michael (2001). Does Oil Hinder Democracy? – World Politics 53 (April 2001), 325-61.
Ross, Michael (2006). Is Democracy Is Good for the Poor? –American Journal of Political Science,
Vol. 50, No. 4, October 2006, pp. 860-874.
Sachs, Jeffrey D. (1989). Social Conflict and Populist Policies in Latin America. NBER Working
Paper 2897. Cambridge, Mass., 1989.
Sen, Amartya (1997). Human Rights and Asian Values: What Lee Kuan Yew and Lee Peng Don’t
Understand About Asia. – The New Republic, July 14, 1997, Vol. 217, No. 2-3.
Sen, Amartya (1999). The Value of Democracy. – Development Outreach, Summer 1999, pp. 5-9.
Stiglitz, Josef (1998). More Instruments and Broader Goals: Moving Toward the Post-Washington
Consensus. WIDER Annual Lecture. WIDER/UNU, 1998.
Stiglitz, Josef (1999). Whither Reform? Ten Years of Transition. World Bank's Annual Bank
Conference on Development Economics, Wash., D. C., April 28-30, 1999.
Triesman, Daniel (1999). The Causes of Corruption: A Cross-National Study. - Fifth Nobel
Symposium in Economics. Stockholm, September 10-12, 1999.
UNDP (2002). Human Development Report 2002. Deepening democracy in a fragmented world.
UNDP, 2002.
World Bank (1996a). From Plan to Market. World Development Report, NY: Oxford University
Press, 1996.
World Bank, (1996b). The Chinese Economy. Fighting Inflation, Deepening Reforms. A World Bank
Country Study, Washington, DC: World Bank, 1996.
World Bank (1997). The State in A Changing World. World Development Report, NY: Oxford
University Press, 1997a.
World Bank (2001). World Development Indicators 2001.
World Bank (2002). Transition. The First Ten Years. 128 pp.
44

World Development Institute (WDI, 2001). Worldwide Governance Research Indicators Datasets,
2000/01 and 1997/98 (http://info.worldbank.org/governance/beeps/)
Zakaria, Fareed (2003). The Future of Freedom : Illiberal Democracy at Home and Abroad. New
York : W.W. Norton & Co, 2003.
45
Copyright © 2022 FDOKUMEN