What fundamentally drives growth? Revisiting the institutions and economic performance debate
29
What Fundamentally Drives Growth? Revisiting the Institutions and Economic Performance Debate Jessica Henson Decker & Jamus Jerome Lim * January 8, 2008 Abstract The recent empirical growth literature has proposed three underlying fun- damental determinants of economic growth, namely, physical geography, economic integration, and institutional quality. This paper unpacks the final determinant into both political-economic institutions as well as the primarily political institution of democratic development. Using both cross-sectional and panel datasets, we show that, properly instrumented, political-economic institutional quality matters, while there is no evidence that democracies grow faster or slower than non-democracies. This result is in contrast to much of the more recent literature, which tend to find a weakly positive relationship. Political economic institutions, however, remain positive and significant determinants of economic growth, which corroborates much of the empirical evidence in the existing literature. Keywords: Economic growth, institutions, democracy JEL Classification: O17, O47, P51 * Centre College and the World Bank, respectively. Emails: [email protected] and [email protected] (corresponding author). We are indebted to many helpful conversations and comments by Jonathon Adams-Kane, Joshua Aizenman, Kay Pommerenke, and an anony- mous referee (who suggested the System GMM approach). Thanks are also due to Dani Rodrik for kindly providing data. Financial support for this project was in part from funding from the Faculty Development Committee, Centre College (Decker and Lim), and the Graduate Division, University of California, Santa Cruz (Lim). The standard disclaimers apply. All errors and omissions remain firmly in our domain.
-
Upload
independent -
Category
Documents
-
view
3 -
download
0
Transcript of What fundamentally drives growth? Revisiting the institutions and economic performance debate

What Fundamentally Drives Growth? Revisiting
the Institutions and Economic Performance
Debate
Jessica Henson Decker & Jamus Jerome Lim ∗
January 8, 2008
Abstract
The recent empirical growth literature has proposed three underlying fun-damental determinants of economic growth, namely, physical geography,economic integration, and institutional quality. This paper unpacks thefinal determinant into both political-economic institutions as well as theprimarily political institution of democratic development. Using bothcross-sectional and panel datasets, we show that, properly instrumented,political-economic institutional quality matters, while there is no evidencethat democracies grow faster or slower than non-democracies. This resultis in contrast to much of the more recent literature, which tend to finda weakly positive relationship. Political economic institutions, however,remain positive and significant determinants of economic growth, whichcorroborates much of the empirical evidence in the existing literature.
Keywords: Economic growth, institutions, democracyJEL Classification: O17, O47, P51
∗Centre College and the World Bank, respectively. Emails: [email protected] [email protected] (corresponding author). We are indebted to many helpful conversationsand comments by Jonathon Adams-Kane, Joshua Aizenman, Kay Pommerenke, and an anony-mous referee (who suggested the System GMM approach). Thanks are also due to Dani Rodrikfor kindly providing data. Financial support for this project was in part from funding fromthe Faculty Development Committee, Centre College (Decker and Lim), and the GraduateDivision, University of California, Santa Cruz (Lim). The standard disclaimers apply. Allerrors and omissions remain firmly in our domain.

1 Introduction
The recent literature on the underlying “fundamental” determinants1 of eco-nomic growth has developed around three main strands: the influence of phys-ical geography, primarily through its impact on agriculture and health (Dia-mond 1997; Sachs 2001); the role of economic integration in driving convergence(Frankel & Romer 1999; Sachs & Warner 1995); and the power of institutionalquality in the determination of economic growth outcomes (Acemoglu, Johnson& Robinson 2001; Rodrik, Subramanian & Trebbi 2004). Each of these factors islikely to be important in its own right; nonetheless, the primacy of institutionsappears to have been overwhelmingly accepted by most researchers working inthe area. As Rodrik et al. (2004, pp. 135,141) claim triumphantly, “the qual-ity of institutions trumps everything else. . . [i]nstitutions trump geography andopenness.”2
Part of the problem of satisfactorily identifying the channels of transmissionis precisely the complexity of interactions between each of these constituentfactors. The issue, therefore, boils down to the choice of instruments used foreach deep determinant.3 The literature has introduced several instruments tothis effect. The distance from the equator and malarial risk are often used asinstruments for gauging the impact of physical geography. Economic integrationis instrumented with the predicted trade/GDP share, as determined by thegravity equation. Instruments for institutional quality include the mortalityrate of colonial settlers and the extent of (English and European) ethnolinguisticfractionalization within the population.
The success of empirical work in establishing the centrality of institutionsnonetheless raises another important question: What sorts of institutions matterfor growth? After all, the notion of institutions pursued in the literature is
1As opposed to “proximate” determinants found in extended Solow-style growth regressions(Mankiw, Romer & Weil 1992), such as the capital-labor ratio and human capital.
2This does not diminish the view of a small minority who continue to argue for the impor-tance of geographic factors. Sachs (2003, p. 10), for example, continues to argue that “[t]hereis good theoretical and empirical reason to believe that the development process reflects acomplex interaction of institutions, policies, and geography.”
3There is also reason to believe that data format—whether time series or cross-sectional—might influence the results as well. Time series and panel data are more likely to capture thedynamic determination of per capita income and growth, while cross-sectional data are moresuitable for estimating static levels of national income.
2

diverse. Acemoglu & Johnson (2005) draw a distinction between property rightsand contracting institutions, and find that the former dominates in terms ofits effect on long-run economic growth. Persson & Tabellini (2006) insteadconsider parliamentary versus presidential systems of representation, and findthat presidential systems tend to grow faster. Glaeser, La Porta, Lopez-deSilanes & Shleifer (2004) make the argument that the pertinent distinction isthat between institutional quality as opposed to constraints.
In contrast to these papers, we argue that the key difference is one be-tween political-economic and political institutions. More specifically, we regardthe political-economic institutions that govern economic norms and rules—legal frameworks, bureaucratic efficacy, curbs on corruption, and the regula-tory burden—as distinct from political institutions, which is primarily thatof democratic representation. While weak political-economic institutions arelikely to impose real costs on economic relationships in society, features of ademocratic political regime—such as checks and balances, electoral rules, andfederalism—seem to be of secondary importance to economic life. In addition,sound political-economic institutions could conceivably exist in predominantlynon-democratic settings; countries that appear to exhibit such qualities wouldinclude Singapore, Tunisia, and Jordan. Therefore, while the finer distinctionsmade by Acemoglu & Johnson (2005) and Persson & Tabellini (2006) are inter-esting in their own right, we regard our distinction as more fundamental.
This paper seeks to contribute to the debate on the different fundamentaldrivers of economic growth. In particular, our distinction between political-economic and political institutions allows us to determine if economies exhibit-ing either of the two—or both—are more likely to experience superior or in-ferior economic performance, while controlling for geographic endowment andeconomic integration. Using both cross-sectional as well as panel datasets, wefind that while institutions are significant predictors of economic performance,democracy is not. This result is robust to a range of specifications and measures,and is stable across both sets of data.
The debate on the complementarities between economic and political free-dom, which in turn spurs growth, goes back to Hayek (1944) and Friedman(1962). More recently, Barro (1996) has explored the manner in which democ-racy can serve as a fundamental determinant of economic growth, and the papersin the volume edited by Rivera-Batiz & Rivera-Batiz (2002) argue that politicalparticipation may evoke economic development in and of itself.
A priori, there is little reason to believe that democratic nations should nec-essarily grow faster or slower than their non-democratic counterparts. Indeed,a quick glance at the bilateral data alone (Figure 1) suggests that it is difficultto discern if there exists any clear relationship between GDP per capita and thelevel of democratic development. Theory, in and of itself, offers little help. Prze-worski & Limongi (1993) provide four main channels whereby democracy affectseconomic growth: First, it offers protection from a predatory autonomous au-thoritarian ruler (positive); second, it potentially unleashes pressures for imme-diate consumption, thus undermining investment and growth (negative); third,it removes the insulation of the state from particularistic pressures (ambiguous);
3

and fourth, it may have an influence on property rights, which in turn mighthave a role to play in fostering growth (ambiguous).
Formal models that seek to clarify these channels exist. Using a general equi-librium, endogenous growth model, Rivera-Batiz (2002) shows that democracyraises growth by constraining the actions of corrupt officials. This constraint,in turn, stimulates technological change and thus spurs economic growth. Inthe model of Persson & Tabellini (1994), redistributive (distortionary) taxa-tion in democracies leads to a deceleration of growth due to a depression ofafter-tax return to private investment. Alesina & Rodrik (1994) approach theproblem using a model where growth occurs through public and private sec-tor investment in physical capital. They obtain a similar prediction: Voting indemocracies lead to a choice of a tax rate on capital that is to the right of thegrowth-maximizing one. Thus, there is an inverse relationship between inequal-ity and growth, and—assuming a median-voter mechanism—this implies thatdemocracies should tend to grow slower. Moreover, special interest pressuresin democracies can lead to rent-seeking, which results in inefficient equilibriumoutcomes, undermining growth (Parente 2006).
These findings, however, are not definitive. A monotonically positive rela-tion between growth and inequality/democracy is possible if voting leads to ahigher expenditure on public education (financed by nondistortionary taxation),which then fuels growth (Verdier & Saint-Paul 1993). Acemoglu & Robinson(2000) model the aforementioned ambiguity of democracy on growth throughthe positive impact of majority voting on the expansion of education and hencea country’s stock of human capital, mitigated by the negative impact of growth-retarding systems of income redistribution.4 Finally, Gradstein (2007) modelsdemocracies as supportive for protection of private property rights, thus ensur-ing larger investment and higher growth.
The empirical literature on the relationship between democracy and growthis large. Most early studies are mixed: Some find that democratic regimes tendto grow faster (Knack & Keefer 1995), while others report a weakly signifi-cant negative relationship (Barro 1996).5 These earlier studies, are, however,racked with measurement, estimation, and endogeneity problems (Przeworski &Limongi 1993). More specifically, the measurement of democracy and economicgrowth is plagued by potential reverse causality problems. For example, greatereconomic integration and institutional quality may imply a superior environ-ment for the development of democracy; furthermore, economic developmentmay plant the seed of democratic reform. At the same time, democratic out-comes may well have an impact on the rate of economic growth, as discussedabove.
4Glaeser et al. (2004) have made the case that it is in fact human capital that leadsto institutional improvements, and not the other way round. Our view is that while humancapital may be a predictor of democratic development, it is far from clear that it is a convincingfundamental, as opposed to proximate, determinant of economic growth.
5In a review of the empirical literature on democracy and growth, Brunetti (1997) findsthat the evidence is very truly mixed: Of the seventeen papers considered, those that findeither positive or negative effects number four each, while the remainder find no effect.
4

United States
United KingdomAustriaBelgiumDenmark
FranceItalyNetherlandsNorwaySwedenSwitzerlandCanadaJapanFinland
Greece
Iceland
Ireland
PortugalSpain
Turkey
Australia
New Zealand
South Africa
Argentina
Bolivia
Brazil
Chile
Colombia Costa Rica
Dominican Republic Ecuador
El SalvadorGuatemala
Haiti
Honduras
Mexico
Nicaragua
PanamaParaguay
Peru
Uruguay
Venezuela, RB
Guyana
Jamaica
Trinidad and Tobago
Bahrain
Cyprus
Iran, Islamic Rep.
Israel
Jordan
Kuwait
Syrian Arab Republic Egypt, Arab Rep.
Bangladesh
Myanmar
Sri Lanka
India
Indonesia
Korea, Rep.
Malaysia
Nepal
Pakistan
Philippines
Singapore
Thailand
Algeria
Botswana
Cameroon
Central African Republic
Congo, Rep.
BeninGambia, TheGhanaKenya
Lesotho
Malawi
Mali
Mauritius
MozambiqueNiger
Zimbabwe
Rwanda
Senegal
Sierra Leone
Sudan
Swaziland
Togo
Tunisia
Uganda Zambia
Fiji
Papua New Guinea
Bulgaria
China
Hungary
Poland
Romania
67
89
1011
Log
of G
DP
per
cap
ita
0 .5 1 1.5 2 2.5Log of Democracy
Democracy and GDP Per Capita, 1995
(a) Cross-sectional for 97 countries, 1995
46
810
12Lo
g R
eal G
DP
per
Cap
ita
0 .5 1 1.5 2 2.5Log of Democracy
Democracy and GDP Per Capita
(b) Pooled panel for 159 countries, 1950–2003
Figure 1: Relationship between democracy and GDP per capita.
5

More recent research has taken these charges more seriously. Henisz (2000)employs three-stage least squares to examine how political constraints shapegrowth, while Vega-Gordillo & Alvarez Arce (2003) consider how economic andpolitical freedom (Granger) cause growth. Rodrik & Wacziarg (2005) examinethe growth effects of democratic transitions using fixed effects models, whilePersson & Tabellini (2007) exploit propensity matching to consider such regimechanges. Both find a positive effect of democratic transitions on growth out-comes. In a slightly different vein, Mobarak (2005) establishes a positive rela-tionship between democracy and growth volatility. The work that is probablymost closely associated with the approach of this study is that of Butkiewicz &Yanikkaya (2006). In particular, the authors consider decomposing institutionsinto measures associated with either rule of law or democracy. However, whiletheir paper considers institutions in significant detail, measures of integrationare given short shrift, and geography is not considered at all. This highlights amore general difference: While differing in estimation strategies, most of thesepapers introduce democracy into a vector of proximate covariates, as opposedto the fundamental determinants approach adopted here.
The main empirical contributions of this study are twofold. First, we accountfor endogeneity in the cross section by introducing several new instruments fordemocracy. We consider three potential instruments: government fractionaliza-tion, military spending as a fraction of government expenditures, and predicteddemocracy levels. Why? Democracies are likely to demonstrate greater lev-els of political participation than totalitarian regimes (Usher 1981). Similarly,healthy democracies tend to have a lower level of military spending as shareof government expenditures (Bueno de Mesquita, Morrow, Siverson & Smith1999). Finally, by utilizing predicted democracy levels from a regression basedon determinants of democracy, we are able to obtain a potentially strong instru-ment that is highly correlated with actual quantitative or qualitative measuresof democracy.
Second, we address endogeneity in the panel by using lagged values of the en-dogenous variables as instruments for the variables themselves. This is possiblein a panel setting, since lags of the regressors are orthogonal to the error termand can hence serve as valid instruments. By drawing instruments from withinthe dataset, we are able to extend the inferences concerning the fundamentaldeterminants to a much larger sample.
The rest of this paper is structured as follows. Section 2 will provide anoverview of the empirical model used in the present study. This is followed by adiscussion of the dataset, estimation technique, and the main results (Section 3).A final section concludes the paper with some reflections on the findings.
2 Empirical Model
The main empirical model is a variant of that in Rodrik et al. (2004), toaccommodate dynamic features. The core specification for the (fundamental
6

determinants-based) growth regression is:
log yit = αyi,t−1 + β0 + β1INSit + β2INTit + β3GEOi + β4DEMit + εit (1)
where |α| < 1, yit is the per capita income in country i at time t, INSit,INTit, GEOi, and DEMit are the deep determinants of (political-economic)institutional quality, economic integration, physical geography, and (political)democratic development, respectively, and εit is an error term given by
εit = µi + ηit, (2)
which comprises both fixed effects µi and idiosyncratic ηit components, andE (µi) = E (ηit) = E (µiηit) = 0, E (ηisηit) = 0 ∀s 6= t, and E (yi1ηit) = 0 ∀t =2, . . . , T .
When we constrain time to a single period, (1) simplifies to an extendedversion of the special case considered in Rodrik et al. (2004):6
log yi = β0 + β1INSi + β2INTi + β3GEOi + β4DEMi + εi.
Identification is achieved in this static model with first-stage regressions usingexogenous instruments given by
INSi = φ0 + φ1SMi + φ2CONSTi + φ3DEMDEVi + φ4GEOi + υi (3a)INTi = θ0 + θ1CONSTi + θ2SMi + θ3DEMDEVi + θ4GEOi + νi (3b)DEMi = λ0 + λ1DEMDEVi + λ2SMi + λ3CONSTi + λ4GEOi + ζi (3c)
where SMi is a measure of settler mortality utilized by Acemoglu, Johnson& Robinson (2001) as an instrument for institutional quality, CONSTi is thepredicted trade volume according to a gravity specification, used by Frankel& Romer (1999) as an instrument for economic integration, and DEMDEViis an instrument for the level of democratic development of a country, whichis one of the following: (a) Government fractionalization as proxied by theHerfindahl Index of government; (b) Military spending as a fraction of totalgovernment expenditures; and (c) Predicted level of democracy, estimated usingthe specification of Barro (1999), which for convenience is reproduced here:
DEMDEVit = ψ0 +ψ1DEMDEVi,t−T +ψ2DEMDEVi,t−2T +ψ3Xi,t−T + ξit,
where, for country i at time t, the current level of democratic development,DEMDEVit is determined by the previous levels of democratic development,lagged by T or 2T periods (where T is taken to be 5 years), and Zi,t−T is avector of previous-period variables that influence the extent of democracy, andξit is a random error term. The Xi,t−T vector used in this paper follows the
6Note that we have chosen to drop the lagged dependent variable from the right hand side of(1). This is both to remain consistent with Rodrik et al. (2004), as well as for practical reasons:Given the significant lags that are likely to operate with respect to these deep determinantsof growth, the inclusion of a lagged dependent variable in the static model is likely to swampthe subtle effects that would otherwise be picked up.
7

baseline specification of Barro (1999, p. S165), which includes the logarithm ofreal per capita GDP 5 years prior, measures of educational attainment 5 yearsprior (specifically, these are the years of primary schooling for persons aged 25and over, and the gap between the years of primary school attainment betweenmales and females aged 25 and over), a measure of the urbanization rate 5 yearsprior, a measure of country size given by the logarithm of the 5-year earlierpopulation level, and a dummy for oil-exporting countries.7
In order to identify the dynamic model, we exploit its temporal nature toretrieve an instrument set based on the lags of the endogenous variables:
Zi =[
0 00 Wi
], Wi = [diag (∆Wi,t+1 · · ·∆Wi,T )] , (4)
where Wit = [INSit INTit DEMit] are the time-varying deep determinants,and we supplement Zi (in levels) with the purely exogenous (time-invariant) in-strumentGEOi and (in some specifications) time dummies Ti = [t, t+ 1, . . . , T ].The instrument matrix Zi, together with the exogenous instruments GEOi andTi, correspond to a set of moment conditions that can be used in the estimationprocess using generalized method of moments (GMM).
As stressed by Rodrik et al. (2004), the core specification given by (1), (3),and (4) represent a natural framework for estimating the impact of the deep de-terminants of institutional quality, economic integration, geographic influences,and democratic development. The symmetry in this specification allows eachvariable an equal chance of exerting an influence on the economic developmentof any given country.
3 Estimation Findings
3.1 Datasets
We make use of two distinct datasets, corresponding to each of the two mainestimation procedures. The single-period cross-section is an augmented versionof that used in Rodrik et al. (2004), and so the finer details will not be repeatedhere. The data comprise up to 91 countries for the year 1995. For completeness,we will briefly discuss the key variables.
Institutional quality is measured by a composite indicator (ranging from -2.5 to 2.5, with higher values indicating stronger institutions) that captures,inter alia, property rights protection and rule of law, provided by Kaufmann,Kraay & Mastruzzi (2007); it is instrumented by the mortality rate of soldiers,bishops, and sailors in European colonies between the 17th and 19th centuries(Acemoglu et al. 2001) and the extent of ethnolinguistic fractionalization (Hall& Jones 1999). Economic integration is proxied by an openness measure of
7See Table 1 of Barro (1999), and the discussion from pp. S164–S166. Note that Barrouses two indices of democratic development as dependent variables: Electoral rights and civilliberties, obtained from Freedom House. In this paper we have instead used a compositedemocracy index provided by Marshall & Jaggers (2005).
8

the ratio of trade to GDP, measured in real PPP terms (Heston, Summers &Aten 2006), and is instrumented with predicted bilateral aggregate trade shares,as estimated by a variant of the gravity equation (Frankel & Romer 1999).Geography is itself a natural instrument, and in the benchmark cross-section,it is taken to be the latitudinal distance from the equator of the capital city, asprovided by the World Bank’s World Development Indicators (WDI).
Table 1: Determinants of democracy†
(D1 ) (D2 )
5-year lag 0.558 0.530of democracy (0.10)∗∗∗ (0.12)∗∗∗
10-year lag -0.013 0.003of democracy (0.07) (0.06)Log GDP -0.074 -0.095per capita (0.07) (0.06)Gap between male/female -0.021 -0.019primary schooling (0.01)∗∗ (0.01)∗
Years of primary 0.010schooling (0.06)Urbanization rate -0.037
(0.04)Log population -0.012
(0.04)Oil country dummy -0.105
(0.12)Constant 1.605 2.061
(0.56)∗∗∗ (0.82)∗∗
Adjusted R2 0.536 0.524N 93 93
†Notes: Huber-White (robust) standard errors reported in
parentheses. ∗ indicates significance at 10 percent level, ∗∗
indicates significance at 5 percent level, and ∗∗∗ indicates sig-
nificance at 1 percent level. A constant term was included in
the regressions, but not reported.
The actual level of democracy is taken from the Polity IV dataset (Marshall& Jaggers 2005). The instruments are: (a) the Herfindahl Index of government,which is the sum of squared seat shares of all parties in the government (highervalues suggest a more unified government and hence lower levels of democraticparticipation), and is provided by the World Bank database of political insti-tutions (Beck, Clarke, Groff, Keefer & Walsh 2001); (b) Military spending as ashare of total government expenditure from the WDI; and (c) predicted level of
9

democracy. The variables used for the vector of controls X are from Barro &Lee (1996) (educational attainment measures), the World Bank WDI, and theIMF International Financial Statistics (IFS). Lagged democracy levels utilizethe 1985 and 1990 levels of democracy from the Policy IV dataset.
The predicted level of democracy was regressed on a subset of the data forwhich observations for the independent variables were available. As a simplerobustness check, two specifications for the democracy regression were run: (D1 )A leaner model that includes just lagged democracy variables, income per capita,and a measure of educational attainment; and (D2 ) The baseline model of Barro(1999), as discussed above. The results are reproduced in Table 1.
In general, the regression provided a reasonable fit (adjusted R2 for thepreferred specification (D2 ) was 0.524). With the exception of the 10-yearlagged democracy level, log GDP per capita, and the oil country dummy, thecoefficients had the expected signs, similar to that of Barro (1999). Since thelatter two (GDP and oil dummy) coefficients were statistically insignificant, theexpected signs were not major issues. Moreover, the point estimate for the 10-year lag of democracy was relatively small, and only marginally significant, andits unexpected sign is unlikely to affect the value of the predicted democracy asan instrument.
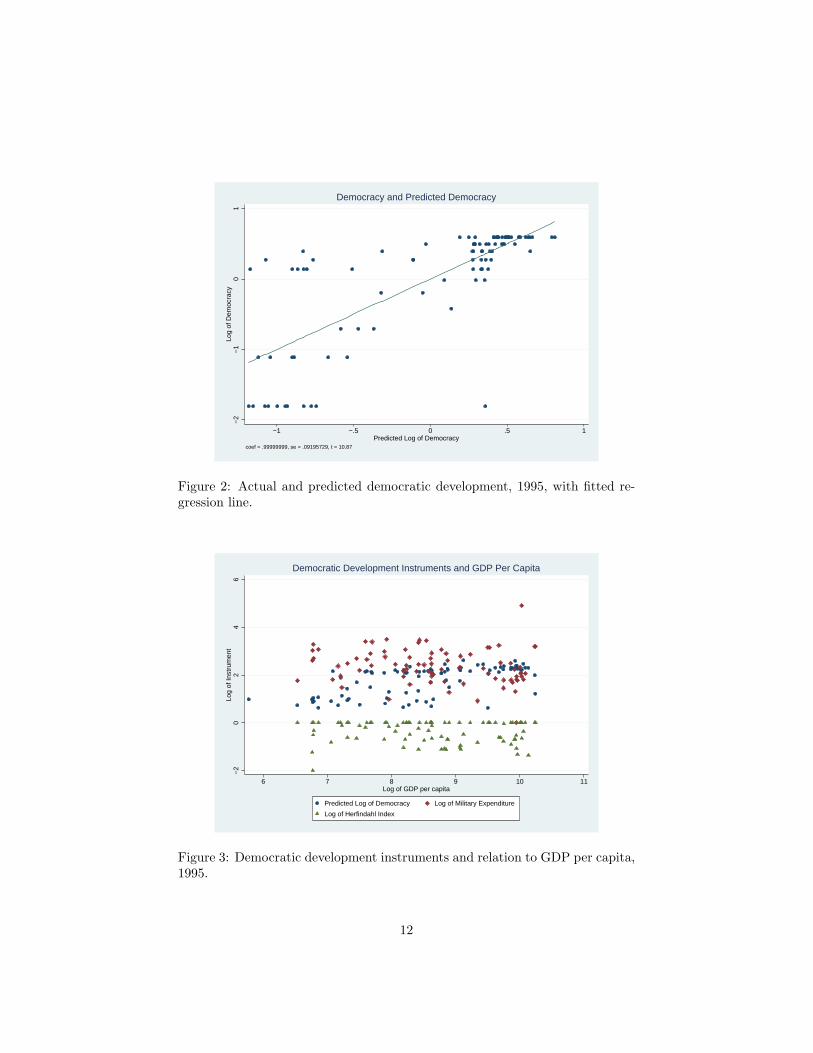
Table 2 summarizes the quality of the instruments used in a correlation ma-trix. As can be seen, the predicted democracy instrument is by far the superiorinstrument for actual democracy levels; as such, it will be the instrument ofchoice for the bulk of the cross-sectional estimations. This strong relationshipis also captured in Figure 2. Figure 3 provides a graphical depiction of therelationship between the various instruments and GDP per capita.
The multi-period panel comprises 128 countries between the years 1984–2002, for an unbalanced panel of up to 2,091 observations. The integration,geography, and democracy measures were obtained from the same sources (He-ston et al. (2006), the WDI, and Marshall & Jaggers (2005), respectively). Un-fortunately, the composite governance measure used for institutional quality inthe cross-section Kaufmann et al. (2007) is only available for seven discontin-uous years (1996, 1998, 2000, 2002–2006), and so, given the limited temporalvariability of some measures, is not as well suited for panel analysis. We substi-tute the institutional measure with an alternative measure compiled from theInternational Country Risk Guide (Political Risk Services 2003), which spans amuch longer period (1984–2002). This composite indicator (ranging from 0 to3.9, with higher values indicating stronger institutions) accounts for, inter alia,the quality of bureaucracy and rule of law.8
3.2 Estimation Methodology
To address the econometric issues raised in the introduction, the model in (1)is estimated with two estimation procedures that take into account endogeneity
8In any event, the correlation between these two measures is very strong: 0.88, significantat 1 percent.
10

Tab
le2:
Cro
ssco
rrel
atio
nsfo
rde
moc
rati
cde
velo
pmen
tin
stru
men
ts†
GD
P/c
apit
aA
ctua
lG
over
nmen
tM
ilita
ryP
redi
cted
dem
ocra
cyfr
acti
onal
izat
ion
expe
ndit
ure
dem
ocra
cy
GD
P/c
apit
a1.
000
Act
ual
dem
ocra
cy0.
420
1.00
0(0
.00)∗∗∗
Gov
ernm
ent
frac
tion
aliz
atio
n-0
.071
-0.1
341.
000
(0.5
2)(0
.20)
Mili
tary
expe
ndit
ure
-0.1
83-0
.375
0.03
01.
000
(0.1
0)∗
(0.0
0)∗∗∗
(0.8
0)P
redi
cted
dem
ocra
cy0.
631
0.75
2-0
.190
-0.2
691.
000
(0.0
0)∗∗∗
(0.0
0)∗∗∗
(0.0
8)∗
(0.0
2)∗∗
†N
ote
s:P
-valu
es
rep
ort
ed
inpare
nth
ese
s.∗
indic
ate
ssi
gnifi
cance
at
10
perc
ent
level,∗∗
indic
ate
ssi
gnifi
cance
at
5p
erc
ent
level,
and∗∗∗
indic
ate
ssi
gnifi
cance
at
1p
erc
ent
level.
11
−2
−1
01
Log
of D
emoc
racy
−1 −.5 0 .5 1Predicted Log of Democracy
coef = .99999999, se = .09195729, t = 10.87
Democracy and Predicted Democracy
Figure 2: Actual and predicted democratic development, 1995, with fitted re-gression line.
−2
02
46
Log
of In
stru
men
t
6 7 8 9 10 11Log of GDP per capita
Predicted Log of Democracy Log of Military Expenditure
Log of Herfindahl Index
Democratic Development Instruments and GDP Per Capita
Figure 3: Democratic development instruments and relation to GDP per capita,1995.
12

concerns: (a) Instrumental variables using two-stage least squares (2SLS); and(b) System General Method of Moments (System GMM) (Arellano & Bover1995; Blundell & Bond 1998).9 These approaches correspond, respectively, tothe static and dynamic versions of (1).
The predicted bilateral trade volume instrument was constructed by esti-mating the gravity model using standard panel regression techniques (Frankel& Romer 1999). The democratic development instrument was estimated withOLS.10 The cross-sectional growth regressions were estimated with both OLSand 2SLS with instrumental variables, while the panel growth regressions wereestimated with OLS, fixed effects, and System GMM.
Static regressions controlled for heteroskedasticity with Huber-White robuststandard errors, and panel estimates controlled for both heteroskedasticity andautocorrelation. Panel estimates also made finite sample corrections and appliedthe forward orthogonal deviations transform, which preserves sample size giventhe unbalanced nature of the panel.
3.3 Static Model Results
As discussed in the introduction, there is no clear reason why democracies neednecessarily exert a direct impact on economic performance. Table 3 divides thesample into democracies and non-democracies and provides summary statisticsfor the two groups for the key variables of interest, real GDP per capita. Thenumbers underscore the ambiguity of the data: While democracies as a groupappear to have a higher mean real GDP per capita, they also demonstrate awider range of performances. Furthermore, the lowest level of GDP per capitaamong democracies (corresponding to Uruguay) is lower than the lowest amongnon-democracies (corresponding to Rwanda).
Table 4 reports our benchmark results. These are: (C1 ) OLS regression ofGDP per capita on institutions, integration, geography, and democracy given bythe special case of (1); (C2 ) IV regression with settler mortality and governmentfractionalization as instruments for institutions and democracy, respectively;(C3 ) Specification (C2 ), but with democracy instrumented by military expen-diture; (C4 ) (C2 ), but with democracy instrumented by predicted democracy;(C5 ) (C2 ), with democracy instrumented by the all three democratic develop-ment instruments; (C6 )–(C8 ) Analogous regressions to (C2 )–(C4 ), but withethnolinguistic fractionalization as an instruments for institutions.
There are several points worth noting about the static model findings. First,the results for the prominence of institutions echo as in the findings of Rodriket al. (2004): In six of the eight specifications, institutional quality exerts a
9Due to the time invariance of the integration variable, and its importance in the core spec-ification (1), it is not possible to use the alternative—and more popular—difference estimator(Arellano & Bond 1991).
10Barro (1999) actually uses the seemingly unrelated regression (SUR) method, which al-lows for the error term in country i at time t to be correlated with the error terms of thesame country at a different time t′. Since the estimation only required predicted democraticdevelopment values for one year (1995), OLS was sufficient for our purposes.
13

Table 3: Descriptive statistics for GDP per capita forcross-section†
Democratic Nondemocratic
Mean 8.750 7.893Standard deviation 1.062 0.724Minimum 6.532 6.771Maximum 10.233 9.066
N 65 26
†Notes: Democracies were classified as those with democracy
level greater than 5, on a scale of 0–10, as given in the Polity
IV dataset (Marshall & Jaggers 2005).
positive and statistically significant influence on economic growth. The effect isalso economically significant: The average of the coefficient on all specificationsis 1.135, implying that a one-point increase in institutional quality increasesGDP per capita in the excess of a hundred percent. Moreover, Hansen J-testdiagnostics suggest that, with the exception of (C8 ) (and marginally for (C7 )),the use of additional instruments did not lead to overidentification, which lendscredibility to the estimates.
Second, while the quality of institutions is important, those associated withdemocracy are demonstrably less so. Point estimates for the democracy variableare statistically significant in only two of the eight specifications, (C5 ) and(C6 ); and for both they are only marginally significant (at 10 percent level).Democracy does nonetheless appear to be positively related to income, even afterinstrumentation: The coefficients for democratic development are either veryslightly negative or positive, and the positive values range from 0.199 to 0.939. Itis worth noting that the statistically significant coefficient on democracy in (C6 )comes at the expense of a significant coefficient on the institutions variable. Thisoutcome could be due to highly correlated measures of both in that particularsubsample.
Third, we find, in contrast to Rodrik et al. (2004), that geography and inte-gration are not always “trumped” by institutions. In three of the specifications,geography enters with a statistically significant coefficient. However, the valuesand direction of these estimates are not stable. In particular, the sign appearsto vary in accordance with the specific subsample considered, with the largersubsample tending to produce the positive coefficients consistent with a prioritheory. Similarly, integration does enter into one specification, (C5 ), with amarginally significant coefficient, although it is incorrectly signed. Since thesevariables are neither the focus of our study, nor do they show up in sufficientspecifications, we reserve judgment on these apparent inconsistencies. We donote, however, that such counterintuitive results were also found by Rodrik et al.
14

Tab
le4:
Ben
chm
ark
regr
essi
ons
ofG
DP
per
capi
tafo
rst
atic
mod
el†
(C1
)(C
2)
(C3
)(C
4)
(C5
)(C
6)
(C7
)(C
8)
Inst
itut
ions
Uni
nstr
umen
ted
0.83
6(0
.10)∗∗∗
Sett
ler
1.42
31.
817
1.83
21.
228
mor
talit
y(0
.62)∗∗
(6.6
0)(1
.57)∗∗∗
(0.1
9)∗∗∗
Eth
nolin
guis
tic
0.35
00.
683
0.91
0fr
acti
onal
izat
ion
(0.3
9)(0
.27)∗∗
(0.2
0)∗∗∗
Inte
grat
ion
0.01
4-0
.189
-0.3
29-0
.288
-0.2
950.
110
-0.0
71-0
.061
(0.1
1)(0
.36)
(1.5
4)(0
.24)
(0.1
6)∗
(0.2
7)(0
.15)
(0.1
4)G
eogr
aphy
0.01
4-0
.036
-0.0
13-0
.022
-0.0
160.
014
0.01
20.
005
(0.0
0)∗∗∗
(0.0
3)(0
.06)
(0.0
2)(0
.01)∗
(0.0
1)(0
.01)∗
(0.0
1)D
emoc
racy
Uni
nstr
umen
ted
-0.0
23(0
.09)
Gov
ernm
ent
1.00
70.
939
frac
tion
aliz
atio
n(1
.09)
(0.4
9)∗
Mili
tary
-0.3
600.
216
expe
ndit
ure
(6.7
8)(0
.29)
Pre
dict
ed-0
.006
0.24
3de
moc
racy
(0.3
5)(0
.20)
All
0.19
9(0
.11)∗
R2
0.72
9F
7.54∗∗∗
6.23∗∗∗
8.09∗∗∗
18.1
1∗∗∗
27.7
9∗∗∗
65.5
8∗∗∗
63.5
9∗∗∗
Han
sen
J-
--
0.89
10.
992
3.74
6∗5.
936∗∗
N97
4946
5140
8882
91
†N
ote
s:H
ub
er-
Whit
e(r
obust
)st
andard
err
ors
rep
ort
ed
inpare
nth
ese
s.A
const
ant
term
was
inclu
ded
inth
ere
gre
ssio
ns,
but
not
rep
ort
ed.
Hanse
nst
ati
stic
sfo
rexactl
yid
enti
fied
models
are
repla
ced
wit
ha
dash
.∗
indic
ate
ssi
gnifi
cance
at
10
perc
ent
level,∗∗
indic
ate
ssi
gnifi
cance
at
5p
erc
ent
level,
and∗∗∗
indic
ate
ssi
gnifi
cance
at
1p
erc
ent
level.
15

(2004).Fourth, only when we utilize the predicted level of democracy do we yield
Anderson LR test statistics (not reported) that reject the null of underidentifi-cation (χ2 = 2.982, p-value = 0.084). This result suggests that instrumentingwith predicted democracy provides a better fit, which validates our choice ofpredicted democracy as the instrument of choice for democratic development(see also Table 2 and Figure 3).
To test the robustness of these findings, Table 5 reports results from a rangeof robustness checks performed to ascertain the main finding that the politicalregime, once properly instrumented, does not affect economic performance. Theperturbations have been chosen to follow, in the main, those performed in Rodriket al. (2004). These can be classified into two broad categories: (a) Robustnessto other deep determinants of growth, such as the legal system (whether thishas origins from French civil law or English common law); and (b) Robustnessto alternative measures of the key deep determinants.
The specifications are, for other deep determinants as controls: (Ra1 ) Inclu-sion of regional dummies for Latin America, Sub-Saharan Africa, and East Asia;(Ra2 ) Inclusion of an indicator variable that takes on unity when the legal sys-tem has French legal origin; (Ra3 ) Inclusion of an indicator variable that takeson unity when the country was once a colony that was classified by Acemogluet al. (2001) as neo-European (the United States, Canada, Australia, and NewZealand); (Ra4 ) Inclusion of an indicator variable that takes on unity when thecountry was at war in 1995; (Ra5 ) Inclusion of an indicator variable that takeson unity when the country experienced a revolution or a coup in 1995; (Ra6 )Inclusion of an indicator variable that takes on unity when the country is an oilexporter, as classified by the IMF.
The specifications for alternative measures are: (Rb1 ) Inclusion of a variablemeasuring tropical land area; (Rb2 ) Inclusion of an indicator variable that takeson unity when the country is landlocked; (Rb3 ) Inclusion of an index measuringthe prevalence of malaria; (Rb4 ) Instrumenting integration with a measure ofreal openness, taken to be trade openness in PPP terms; (Rb5 ) Instrumentingintegration with the Sachs & Warner (1995) measure of trade policy openness;and (Rb6 ) Inclusion of two proxies for market size, land area and population.
Where possible, we have reported results for the larger sample using ethno-linguistic fractionalization as instruments for institutions. However, when theseinstruments failed the Hansen J-test for overidentification, we have reportedinstead the specification that instruments institutions with settler mortality(which is exactly identified). We also explored additional controls and alterna-tive specifications, such as frost days per year (additional geography control)and colonizer identity (additional deep determinant), but these did not producesubstantially different outcomes.
The general message that one obtains from the robustness checks is thatdemocracy does not exert a significant influence on economic performance acrossthe cross section of countries. The coefficient on democracy is not statisticallysignificant across all specifications, and the sign on these coefficients are alsonot stable.
16

Table 5: Robustness regressions of GDP per capita for static model†
(Ra1) (Ra2) (Ra3) (Ra4) (Ra5) (Ra6)
Institutions 1.999 1.053 1.569 1.859 1.879 1.618(0.99)∗∗ (0.23)∗∗∗ (0.62)∗∗ (0.60)∗∗∗ (0.64)∗∗∗ (0.47)∗∗∗
IntegrationOpenness -0.337 -0.051 -0.340 -0.326 -0.270 -0.112
(0.32) (0.13) (0.31) (0.27) (0.25) (0.22)Geography
Equatorial -0.027 0.003 -0.013 -0.021 -0.022 -0.016distance (0.03) (0.01) (0.02) (0.02) (0.02) (0.02)
Democracy -0.409 0.183 -0.058 -0.058 -0.028 0.121(0.70) (0.20) (0.35) (0.40) (0.37) (0.27)
RegionLatin 0.355America (0.40)Sub-Saharan -0.432Africa (0.47)East Asia -0.460
(1.03)Legal system 0.229
(0.13)∗
Neo-Europe -0.777(0.64)
War 0.301(0.34)
Revolution/coup 0.386(0.58)
Oil exporter 0.447(0.24)∗
F 5.30∗∗∗ 49.70∗∗∗ 43.30∗∗∗ 6.30∗∗∗ 6.33∗∗∗ 7.97∗∗∗
Hansen J - 1.338 2.073 - - -N 51 91 91 50 50 51
(Rb1) (Rb2) (Rb3) (Rb4) (Rb5) (Rb6)
Institutions 1.849 1.671 0.650 2.692 1.534 1.129(0.54)∗∗∗ (0.41)∗∗∗ (0.18)∗∗∗ (1.62)∗ (0.29)∗∗∗ (0.23)∗∗∗
IntegrationOpenness -0.375 -0.384 -0.039 -0.105
(0.28) (0.19)∗∗ (0.11) (0.44)Real openness -1.091
(1.04)Trade policy -1.110
(0.49)∗∗
GeographyEquatorial -0.031 -0.032 0.002 -0.062 -0.024 -0.001distance (0.02) (0.01)∗∗ (0.01) (0.06) (0.01) (0.01)Tropics 0.193
(0.51)Landlocked -0.556
(0.35)Malaria -0.983
(0.19)∗∗∗
Democracy 0.215 0.184 0.213 -0.348 0.048 0.104(0.26) (0.20) (0.15) (0.79) (0.25) (0.19)
Land area -0.000(0.00)
Population 0.028(0.11)
F 6.78∗∗∗ 10.35∗∗∗ 75.05∗∗∗ 4.56∗∗∗ 13.28∗∗∗ 15.18∗∗∗
Hansen J - - 0.097 - 1.016 0.033N 50 50 85 50 60 51
† Notes: Huber-White (robust) standard errors reported in parentheses. A constant term wasincluded in the regressions, but not reported. ∗ indicates significance at 10 percent level, ∗∗
indicates significance at 5 percent level, and ∗∗∗ indicates significance at 1 percent level.
17

The quality of institutions continues to be a positive, and significant, fun-damental determinant, a result consistent with Rodrik et al. (2004). However,physical geography does appear to be marginally significant for some specifica-tions, although these enter with the incorrect sign. However, the coefficient onthe malarial incidence index—the results for (Rb3 )—is negative and significant,a result that has been replicated by Sachs (2003) and Carstensen & Gundlach(2006). If disease ecology is the moderating variable by which underdevelop-ment occurs, then, geography cannot be ruled out as an important determinantto cross-country economic growth outcomes.
Depending on the specification, other determinants do seem to matter. Forexample, oil-exporting countries do appear to perform better, which suggeststhat there remains aspects of the African experience that are not captured bythe simple empirical model given by (1). Keeping in mind the negative (thoughinsignificant) coefficient on sub-Saharan Africa, this finding casts doubt on thenotion that the resource curse applies uniformly to all natural resources.
3.4 Dynamic Model Results
Table 6 presents the summary statistics for GDP per capita for the larger paneldata. The results for mean levels of GDP per capita for democracies versus non-democracies are remarkably similar to those reported in Table 3. The standarddeviations for per capita GDP for democracies is, however, much smaller; thisstatistic implies that, for the panel, democracies possess both higher averagelevels of GDP per capita together with lower variability.
Table 6: Descriptive statistics for GDP per capita forpanel†
Democratic Nondemocratic
Mean 8.966 8.007Standard deviation 0.955 1.108Minimum 6.589 5.806Maximum 10.445 10.507
N 1131 960
†Notes: Democracies were classified as those with democracy
level greater than 5, on a scale of 0–10, as given in the Polity
IV dataset (Marshall & Jaggers 2005).
The benchmark results for the panel are reported in Table 7. These corre-spond to: (P1 ) OLS regression of GDP per capita on lagged GDP per capitaand levels of institutions, integration, geography, and democracy given by (1);(P2 ) Fixed effects regression of specification (P1 ); (P3 ) System GMM estima-tion of (P1 ), with lagged GDP per capita, integration, institutions, and democ-racy instrumented by one-period lagged GMM-style instruments and geography
18

treated as an IV-style instrument; (P4 ) (P3 ), but with time dummies includedas IV-style instruments; (P5 )–(P6 ) (P4 ), with varying structures of the deepdeterminants, and instrumented by level through two-period GMM-style lags ofthe endogenous variables and both geography and time dummies as exogenousIV-style instruments; (P7 )–(P8 ) Analogous to (P5 )–(P6 ), but with a two andfour-period lag structure.11
The results for the dynamic model are notable for their strong corrobora-tion of the main findings in Section 3.3. As before, institutions appear to bean important fundamental determinant of GDP per capita. With the exceptionof specification (P7 ), the level coefficient for institutions enters with a positiveand statistically significant coefficient. In addition, the magnitudes are alsoeconomically significant, and comparable to that of the static model: The aver-age over all specifications is e0.065 = 1.067.12 For the specifications with laggedvariables—(P5 )–(P8 )—the coefficients tend to be negative (although not alwayssignificant), which suggests that the long-run impact of institutions is weakerthan its short-run impact. At first glance, this finding is somewhat surprising,since it is often assumed that the positive impact of strong institutions takestime to diffuse throughout the economy. However, to the extent that weak insti-tutions exert a real, immediate cost on growth, the muted latter-period effectsof institutions on income may be less surprising.
Second, democracy is, as before, largely irrelevant as a fundamental de-terminant of growth. The coefficients are mostly indistinguishable from zero,and in the two specifications where they are significant, the high z scores forthe Arellano-Bond test suggests that, with AR(2) autocorrelation still present,there is a possibility of misspecification in the GMM-style instruments. In ad-dition, the signs of the level coefficients for democracy are no longer stable. Aswas the case in (C6 ), the significance of democracy in (P7 ) could once againbe due to correlated measures of institutions and democracy in the particularsubsample.
Third, and in contrast to the static model, both geography and integrationappear to be positive determinants of GDP per capita. While these variables arenot always statistically or economically significant, their consistency with theirtheoretically-expected signs is reassuring. As before, our results are indicative ofthe fact that the primacy of institutions does not mean that other fundamentaldeterminants, especially geography, are no longer relevant. This finding alsoprovides some partial vindication of the view of Sachs (2001, 2003), which arguesthat geography remains an important fundamental determinant, independent ofthe intervening effects of institutional quality.
Fourth, the results in (P1 ) and (P2 ) underscore the importance of takinginto account endogeneity issues in estimates of (1). While it initially appears
11We have chosen not to run two-step GMM due to well-known finite-sample problemsassociated with the standard errors of two-step estimates. Indeed, two-step estimates of themodel (not reported) suggest significant downward bias in the standard errors, even aftereffecting the Windmeijer (2005) correction.
12As described in the Appendix, the natural log is taken for the alternative measure ofinstitutions used for the dynamic model.
19

Tab
le7:
Ben
chm
ark
regr
essi
ons
ofG
DP
per
capi
tafo
rdy
nam
icm
odel†
(P1
)(P
2)
(P3
)(P
4)
(P5
)(P
6)
(P7
)(P
8)
GD
Pp
er
capit
aO
ne-p
eri
od
0.9
92
0.8
57
0.9
96
0.9
97
0.9
92
0.9
86
lag
(0.0
0)∗∗∗
(0.0
3)∗∗∗
(0.0
0)∗∗∗
(0.0
0)∗∗∗
(0.0
0)∗∗∗
(0.0
0)∗∗∗
Tw
o-p
eri
od
0.9
84
0.9
89
lag
(0.0
2)∗∗∗
(0.0
1)∗∗∗
Geogra
phy
0.0
04
0.0
00
0.0
03
0.0
04
0.0
04
0.0
04
0.0
11
0.0
04
(0.0
0)∗∗
(0.0
0)
(0.0
0)
(0.0
0)∗
(0.0
0)∗
(0.0
0)∗
(0.0
1)∗
(0.0
0)
Inte
gra
tion
Level
0.0
06
0.0
23
0.0
01
0.0
90
0.0
32
0.0
05
0.0
34
0.0
06
(0.0
0)∗
(0.0
1)∗∗
(0.0
1)
(0.0
1)
(0.0
4)
(0.0
4)
(0.0
4)
(0.0
3)
One-p
eri
od
-0.0
15
0.0
09
lag
(0.0
4)
(0.0
5)
Tw
o-p
eri
od
-0.0
08
-0.0
06
0.0
46
lag
(0.0
2)
(0.0
4)
(0.0
4)
Four-
peri
od
-0.0
50
lag
(0.0
2)∗∗∗
Inst
ituti
ons
Level
0.0
30
0.0
31
0.0
34
0.0
30
0.0
90
0.1
14
0.0
68
0.1
20
(0.0
1)∗∗∗
(0.0
1)∗∗
(0.0
1)∗∗∗
(0.0
1)∗∗∗
(0.0
2)∗∗∗
(0.0
3)∗∗∗
(0.0
5)
(0.0
4)∗∗∗
One-p
eri
od
-0.0
57
-0.0
01
lag
(0.0
2)∗∗
(0.0
5)
Tw
o-p
eri
od
-0.0
69
-0.0
36
-0.0
97
lag
(0.0
4)∗
(0.0
6)
(0.0
4)∗∗
Four-
peri
od
0.0
29
lag
(0.0
2)
Dem
ocra
cy
Level
0.0
03
-0.0
03
-0.0
00
0.0
00
0.0
13
0.0
16
0.0
58
-0.0
06
(0.0
0)
(0.0
0)
(0.0
0)
(0.0
0)
(0.0
1)
(0.0
1)
(0.0
3)∗
(0.0
1)
One-p
eri
od
-0.0
13
-0.0
01
lag
(0.0
1)
(0.0
1)
Tw
o-p
eri
od
-0.0
09
-0.0
53
0.0
19
lag
(0.0
2)
(0.0
4)
(0.0
1)∗∗∗
Four-
peri
od
-0.0
06
lag
(0.0
1)
Adju
sted
R2
0.9
90.8
6Sarg
anχ
2107.5
0112.5
0112.3
4102.3
0116.1
0103.3
9A
R(2
)z
-0.9
8-0
.99
-0.8
9-1
.15
-2.5
4∗∗
-2.4
3∗∗
N2085
2085
1938
1938
1938
1794
1812
1544
†N
ote
s:H
ete
rosk
edast
icit
yand
auto
corr
ela
tion-r
obust
(asy
mpto
tic)
standard
err
ors
rep
ort
ed
inpare
nth
ese
s.E
stim
ate
sadju
sted
for
finit
esa
mple
and
ort
hogonal
devia
tions.
Aconst
ant
term
and
tim
edum
mie
sw
ere
inclu
ded
inth
ere
gre
ssio
ns,
but
not
rep
ort
ed.∗
indic
ate
ssi
gnifi
cance
at
10
perc
ent
level,∗∗
indic
ate
ssi
gnifi
cance
at
5p
erc
ent
level,
and∗∗∗
indic
ate
ssi
gnifi
cance
at
1p
erc
ent
level.
20

that most fundamental determinants (save democracy) are significant determi-nants of GDP per capita, controlling for possible endogeneity causes measuresof integration to completely fall out of the picture (except in the two-period lagof (P8 ), where it enters with a wrong sign), while also weakening the influenceof geography. We note, however, that coefficient estimates for specification (P1 )and (P2 ) are biased upward and downward, respectively, and hence for the the-oretical upper and lower bounds that can be used as a check on integrity of theestimates from the other specifications (Bond 2002).
Tests of the robustness of the dynamic model are reported in Tables 8a and8b. As far as possible, we have sought to introduce analogous perturbationsto those in Table 5. As in Table 5, these can be classified into the categories:(a) Robustness to other deep determinants; and (b) Robustness to alternativemeasures of deep determinants.13
For each robustness check, we ran the three specifications correspondingto (P4 )–(P6 ) (reported as sub-specifications 1–3 in Tables 8a and 8b). Thespecific perturbations are as follows: (Ta1 ) Inclusion of regional dummies forLatin America, Sub-Saharan Africa, and East Asia; (Ta2 ) (Ra2 ) Inclusion ofan indicator variable for a history of French colonization; (Ta3 ) Inclusion of anindicator variable for neo-Europe; (Ta4 ) Inclusion of an indicator variable foroil exporters. The specifications for alternative measures are: (Tb1 ) Inclusionof a variable measuring tropical area; (Tb2 ) Inclusion of an indicator variablefor landlocked countries; (Tb3 ) Substitution of the institutions variable withthe governance measure in Kaufmann et al. (2007); (Tb4 ) Substitution of thedemocracy variable with the freedom index in Freedom House (2007).
The robustness tests do not change the primary finding of this paper: Thepolitical regime, once properly instrumented, does not affect economic perfor-mance, insofar as compared to other fundamental determinants of growth. Thisis regardless of the specific measure that we have chosen, since the coefficienton democracy remains insignificant even with an alternative measure (as seenfrom the results in (Tb4 )). Several other findings, however, are of interest, andso will be discussed briefly.
Institutions continue to feature prominently as a significant, positive deter-minant of growth. As before, the positive effect of institutions diminishes overtime, although this effect is not consistently significant across all specifications.Importantly, this result is robust to the alternative measure of institutions thatwe employ: Institutions, as measured by governance, exerts a positive and sig-nificant effect in (Tb32 ) and (Tb33 ), although in this case the lagged effects arenot significant.
Likewise, physical geography does seem to exert an impact on growth out-comes, at least in some specifications. Equatorial distance is positive and signif-icant in (Ta3 ), and conversely, a larger tropical area reduces GDP per capita—see (Tb1 )—in a significant and negative fashion. However, integration does not
13In the interests of space, we have chosen to limit the number of reported robustness tests,as well as test diagnostics. The covariates included in Tables 8a and 8b were chosen basedon theoretical as well as statistical significance (consistent with Table 5), and all reportedspecifications passed the Arellano-Bond test for serial correlation.
21

Table 8a: Robustness regressions of GDP per capita to other deep de-terminants for dynamic model†
(Ta11) (Ta12) (Ta13) (Ta21) (Ta22) (Ta23)
GDP per capitaOne-period 0.986 0.986 0.977 0.995 0.990 0.984lag (0.01)∗∗∗ (0.00)∗∗∗ (0.01)∗∗∗ (0.00)∗∗∗ (0.00)∗∗∗ (0.01)∗∗∗
Geography -0.005 -0.002 -0.004 0.003 0.003 0.003(0.00) (0.00) (0.00) (0.00) (0.00)∗ (0.00)∗
IntegrationLevel -0.000 0.029 0.004 0.003 0.031 0.005
(0.01) (0.04) (0.04) (0.01) (0.04) (0.04)One-period -0.014 0.007 -0.012 0.007lag (0.04) (0.05) (0.04) (0.05)Two-period -0.006 -0.005lag (0.02) (0.02)
InstitutionsLevel 0.037 0.091 0.109 0.033 0.091 0.113
(0.01)∗∗∗ (0.02)∗∗∗ (0.03)∗∗∗ (0.01)∗∗∗ (0.02)∗∗∗ (0.03)∗∗∗One-period -0.060 0.001 -0.055 0.002lag (0.02)∗∗∗ (0.05) (0.02)∗∗ (0.05)Two-period -0.068 -0.068lag (0.04)∗ (0.03)∗
DemocracyLevel -0.001 0.015 0.016 -0.000 0.013 0.016
(0.00) (0.01) (0.01) (0.00) (0.01) (0.01)One-period -0.011 0.002 -0.013 -0.001lag (0.01) (0.01) (0.01) (0.01)Two-period -0.010 -0.010lag (0.02) (0.02)
Regional dummiesLatin -0.053 -0.035 -0.050America (0.02)∗∗∗ (0.01)∗∗∗ (0.01)∗∗∗Sub-Saharan -0.028 -0.027 -0.033Africa (0.01)∗ (0.01)∗∗∗ (0.01)∗∗∗East Asia -0.004 0.009 -0.001
(0.02) (0.01) (0.01)Colonizer
British -0.007 0.005 0.001(0.01) (0.01) (0.01)
French -0.023 -0.020 -0.022(0.01)∗∗ (0.01)∗∗ (0.01)∗∗
Sargan χ2 115.35 113.14 110.42 109.97 109.33 113.05N 1938 1938 1794 1938 1938 1794
(Ta31) (Ta32) (Ta33) (Ta41) (Ta42) (Ta43)
GDP per capitaOne-period 0.999 0.992 0.986 0.995 0.995 0.986lag (0.00)∗∗∗ (0.00)∗∗∗ (0.00)∗∗∗ (0.00)∗∗∗ (0.00)∗∗∗ (0.01)∗∗∗
Geography 0.005 0.005 0.004 0.003 0.004 0.004(0.00)∗ (0.00)∗∗ (0.00)∗ (0.00) (0.00) (0.00)∗
IntegrationLevel -0.003 0.030 0.005 0.002 0.031 0.005
(0.01) (0.04) (0.04) (0.01) (0.04) (0.04)One-period -0.014 0.009 -0.015 0.009lag (0.04) (0.05) (0.04) (0.05)Two-period -0.008 -0.008lag (0.02) (0.02)
InstitutionsLevel 0.038 0.089 0.114 0.032 0.090 0.114
(0.01)∗∗∗ (0.02)∗∗∗ (0.03)∗∗∗ (0.01)∗∗∗ (0.02)∗∗∗ (0.03)∗∗∗One-period -0.053 -0.001 -0.061 -0.001lag (0.02)∗∗ (0.05) (0.02)∗∗∗ (0.05)Two-period -0.069 -0.069lag (0.04)∗ (0.04)∗
DemocracyLevel 0.001 0.014 0.016 0.001 0.013 0.017
(0.00) (0.01) (0.01) (0.00) (0.01) (0.01)One-period -0.011 -0.000 -0.013 -0.001lag (0.01) (0.01) (0.01) (0.01)Two-period -0.009 -0.009lag (0.02) (0.02)
Neo-Europe -0.161 -0.058 -0.003(0.10)∗ (0.04) (0.02)
Oil exporter 0.013 -0.014 0.001(0.01) (0.01)∗ (0.01)
Sargan χ2 106.50 109.75 109.33 116.63 110.61 111.56N 1938 1938 1794 1938 1938 1794
† Notes: Heteroskedasticity and autocorrelation-robust (asymptotic) standard errors re-ported in parentheses. Estimates adjusted for finite sample and orthogonal deviations.A constant term and time dummies were included in the regressions, but not reported.∗ indicates significance at 10 percent level, ∗∗ indicates significance at 5 percent level,and ∗∗∗ indicates significance at 1 percent level.
22

Table 8b: Robustness regressions of GDP per capita to alternativemeasures for dynamic model‡
(Tb11) (Tb12) (Tb13) (Tb21) (Tb22) (Tb23)
GDP per capitaOne-period 0.994 0.986 0.979 0.995 0.991 0.985lag (0.00)∗∗∗ (0.00)∗∗∗ (0.01)∗∗∗ (0.00)∗∗∗ (0.00)∗∗∗ (0.01)∗∗∗
Geography -0.004 -0.007 -0.007 0.004 0.004 0.004(0.00) (0.00) (0.00)∗ (0.00) (0.00)∗ (0.00)∗
Tropics -0.026 -0.040 -0.043(0.02) (0.01)∗∗∗ (0.01)∗∗∗
Landlocked -0.015 -0.012 -0.013(0.01) (0.01) (0.01)
IntegrationLevel 0.003 0.030 0.005 0.003 0.031 0.004
(0.01) (0.04) (0.04) (0.01) (0.04) (0.04)One-period -0.010 0.006 -0.013 0.010lag (0.04) (0.05) (0.04) (0.05)Two-period -0.001 -0.007lag (0.02) (0.02)
InstitutionsLevel 0.026 0.086 0.111 0.031 0.090 0.113
(0.01)∗∗∗ (0.02)∗∗∗ (0.03)∗∗∗ (0.01)∗∗∗ (0.02)∗∗∗ (0.03)∗∗∗One-period -0.060 -0.002 -0.056 0.001lag (0.02)∗∗∗ (0.05) (0.02)∗∗ (0.05)Two-period -0.071 -0.069lag (0.03)∗∗ (0.03)∗
DemocracyLevel 0.001 0.015 0.017 0.000 0.015 0.017
(0.00) (0.01) (0.01) (0.00) (0.01) (0.01)One-period -0.010 0.001 -0.013 -0.000lag (0.01) (0.01) (0.01) (0.01)Two-period -0.008 -0.010lag (0.02) (0.02)
Sargan χ2 108.33 108.91 106.04 107.79 113.53 112.06N 1938 1938 1794 1938 1938 1794
(Tb31) (Tb32) (Tb33) (Tb41) (Tb42) (Tb43)
GDP per capitaOne-period 1.033 1.024 0.987 0.993 0.992 0.992lag (0.04)∗∗∗ (0.04)∗∗∗ (0.03)∗∗∗ (0.00)∗∗∗ (0.00)∗∗∗ (0.00)∗∗∗
Geography -0.011 -0.011 0.015 0.003 0.002 0.003(0.02) (0.02) (0.01) (0.00) (0.00) (0.00)
IntegrationLevel 0.058 0.041 0.023 0.001 0.012 0.010
(0.03)∗ (0.03) (0.05) (0.01) (0.02) (0.02)One-period 0.021 0.017 -0.006 -0.011lag (0.04) (0.06) (0.02) (0.02)Two-period 0.005 0.006lag (0.05) (0.01)
InstitutionsPolitical 0.041 0.084 0.075stability (0.02)∗∗ (0.04)∗ (0.04)∗
One-period -0.037 -0.034lag (0.03) (0.03)Two-period 0.002lag (0.01)
Governance -0.011 0.067 0.116(0.05) (0.04)∗ (0.04)∗∗∗
One-period -0.054 -0.098lag (0.04) (0.07)Two-period 0.016lag (0.04)
DemocracyPolity 0.032 -0.019 -0.028
(0.03) (0.03) (0.03)One-period 0.031 0.031lag (0.02) (0.02)∗Two-period -0.048lag (0.04)
Freedom 0.004 -0.000 0.009(0.01) (0.02) (0.02)
One-period 0.009 -0.022lag (0.02) (0.02)Two-period 0.018lag (0.02)
Sargan χ2 21.09 40.15 23.74 121.20 118.42 121.24N 558 558 410 2123 2123 1991
‡ Notes: Heteroskedasticity and autocorrelation-robust (asymptotic) standard errorsreported in parentheses. Estimates adjusted for finite sample and orthogonal devia-tions. A constant term and time dummies were included in the regressions, but notreported. ∗ indicates significance at 10 percent level, ∗∗ indicates significance at 5percent level, and ∗∗∗ indicates significance at 1 percent level.
23

appear to survive the robustness checks. It enters with a positive sign in onlyone specification, (Tb31 ), and only marginally so.
Finally, we note that other additional deep determinants, especially regionaldummies and colonial history, do seem to make a difference. The former resultis similar to the findings in Section 3.3, although in this case the dummy for sub-Saharan Africa is not just negative but also statistically significant. The negativecoefficient on the dummy for French legal origin is not entirely inconsistent withthose of other researchers (Acemoglu et al. 2001), who have argued that Britishcolonies tend to perform better in part because of Britain’s care in colonizinglocations where settlements were possible, which led to British colonies thatwere not merely extractive, but instead allowed for the development of betterinstitutions.
4 Conclusion
Critics of democracies often suggest that democratic pressures are inimical toeconomic growth, while its strongest proponents tend to overemphasize the roleof democracy.14 On the surface, the anecdotal evidence seems to support thecase of the former: China’s sustained rate of growth in GDP, averaging 8 percentor more over two decades, was achieved while the country was under the rule ofan authoritarian regime; while India, the world’s largest democracy, had a farmore modest record, with poverty rates today still about twice that of China.
The more nuanced view, however, is that democracy is neither necessarynor sufficient to ensure economic performance, nor does it need to be a “crueldilemma” (Bhagwati 2002). Indeed, it sees that any growth-enhancing effects ofdemocracy are conditional on a policy that includes a combination of market-orientated growth strategies—perhaps embodied in pro-growth institutions—and trade openness. (Bhagwati 2002, pp. 151–152) offers a candid explanation:
Democracy is not necessarily better for development. Only whencombined with markets and openness does democracy offer the bestprospect of achieving the efficient, dynamic society that allows de-velopment to thrive.
This paper has sought unpack the definition of “institutions,” in order toprovide empirical evidence behind the roles that political-economic institutionalquality and purely political democratic institutions play as fundamental driversof growth. Once we take into account the econometric problems arising fromendogeneity, and controlling for other deep determinants such as economic in-tegration and physical geography, our main finding is that (political-economic)
14Lee Kwan Yew, the architect of Singapore’s rapid rise from a riot-ridden, malaria-infestedtropical island to one of the world’s richest nations (in per capita terms), has even arguedthat “what a country needs to develop is discipline more than democracy. The exuberanceof democracy leads to indiscipline and disorderly conduct which are inimical to development”(Lee 2000, p. 304).
24

institutions exert a significant impact on the level of income, whereas the polit-ical institution of democracy is insignificant. Although similar to the findingsin Butkiewicz & Yanikkaya (2006), our result that democracy is insignificantis stable across both cross-sectional and panel data. In a crude sense, whileeconomic freedom appears to be crucial for successful economic performance,political freedom is not.
One explanation for this apparent paradox is to recognize the nonlinearityof the expansion of democratic rights. While extensions of political participa-tion may induce faster growth or retard economic development, in either case,this occurs only up to a certain point (Barro 1996). This nonlinearity can alsobe used to rationalize the potential tension—as highlighted in the theoreticalliterature—between a democratic regime as a positive force for economic devel-opment versus the negative effects of democracies. Minier (2007) has recentlystudied nonlinearities in the effects of institutions (generally defined) on growth.Future work would extend this to allow for nonlinear democratic developmentas well. Indeed, it may well be the case that, in a sufficiently diverse sample,these two contrary effects cancel each other out, resulting in a net zero impactfrom democracy. Although we are unable to draw strong conclusions regardingthe desirability of democracy or autocracy in fostering development, to assertthat the political regime does not matter seems, to us, an unwarranted, extremeconclusion. More generally, additional research is needed to understand the the-oretical drivers behind how political-economic and political institutions affectgrowth.
Nonetheless, as far as enhancing economic performance is concerned, devel-oping countries may be far better served by concentrating on improving thequality of political-economic institutions that exert a more direct, first-order in-fluence on the functioning of market processes—such as the rule of law (La Porta,Lopez-de Silanes, Shleifer & Vishny 1998) and the enforcement of property rights(Djankov, La Porta, Lopez-de Silanes & Shleifer 2002)—rather than expandingtheir energies on building participatory political institutions. While it is tempt-ing to claim the policy implication that promoting democratic development istherefore irrelevant, doing so would disregard the tremendous value afforded—interms of individual freedom and political representation—by democracy per se.It seems unwise to substitute such intangibles in favor of growth, at any cost.
ReferencesAcemoglu, K. Daron & Simon Johnson (2005). “Unbundling Institutions”. Journal of Political
Economy 113(5) (October): 949–995
Acemoglu, K. Daron, Simon Johnson & James A. Robinson (2001). “The Colonial Origins ofComparative Development: An Empirical Investigation”. The American Economic Review91(5) (December): 1369–1401
Acemoglu, K. Daron & James A. Robinson (2000). “Why Did the West Extend the Franchise?Democracy, Inequality, and Growth in Historical Perspective”. The Quarterly Journal ofEconomic 115(4) (November): 1167–1199
25

Alesina, Alberto & Dani Rodrik (1994). “Distributive Politics and Economic Growth”. Quar-terly Journal of Economics 109(2) (May): 2
Arellano, Manuel & Stephen R. Bond (1991). “Some Tests of Specification for Panel Data:Monte Carlo Evidence and an Application to Employment Equations”. Review of EconomicStudies 58(2) (April): 277–97
Arellano, Manuel & Olympia Bover (1995). “Another Look at the Instrumental VariableEstimation of Error-Components Models”. Journal of Econometrics 68(1) (July): 29–51
Barro, Robert J. (1996). “Democracy and Growth”. Journal of Economic Growth 1(1)(March): 1–27
Barro, Robert J. (1999). “Determinants of Democracy”. Journal of Political Economy 107(6/2(Supplement)) (December): S158–S183
Barro, Robert J. & Jong Wha Lee (1996). “International Measures of Schooling Years andSchooling Quality”. American Economic Review 86(2) (May): 218–223
Beck, Thorsten, George R. Clarke, Alberto Groff, Philip E. Keefer & Patrick Paul Walsh(2001). “New Tools in Comparative Political Economy: The Database of Political Institu-tions”. World Bank Economic Review 15(1) (January): 165–176
Bhagwati, Jagdish N. (2002). “Democracy and Development: Cruel Dilemma or SymbioticRelationship?” Review of Development Economics 6(2) (June): 151–162
Blundell, Richard & Stephen R. Bond (1998). “Initial Conditions and Moment Restrictionsin Dynamic Panel Data Models”. Journal of Econometrics 87(1) (August): 115–143
Bond, Stephen R. (2002). “Dynamic Panel Data Models: A Guide to Micro Data Methodsand Practice”. Portuguese Economic Journal 1(2) (August): 141–162
Brunetti, Aymo (1997). “Political Variables in Cross-Country Growth Analysis”. Journal ofEconomic Surveys 11(2) (June): 163–190
Bueno de Mesquita, Bruce, James D. Morrow, Randolph M. Siverson & Alastair Smith (1999).“An Institutional Explanation of the Democratic Peace”. American Political Science Re-view 93(4) (December): 791–807
Butkiewicz, James L. & Halit Yanikkaya (2006). “Institutional Quality and Economic Growth:Maintenance of the Rule of Law or Democratic Institutions, or Both?” Economic Modelling23(4) (July): 648–661
Carstensen, Kai & Erich Gundlach (2006). “The Primacy of Institutions Reconsidered: DirectIncome Effects of Malaria Prevalence”. World Bank Economic Review 20(3) (September):309–339
Diamond, Jared (1997). Guns, Germs and Steel: The Fates of Human Societies. New York,NY: W.W. Norton
Djankov, Simeon, Rafael La Porta, Florencio Lopez-de Silanes & Andrei Shleifer (2002). “TheRegulation of Entry”. Quarterly Journal of Economics 117(1) (February): 1–37
Frankel, Jeffrey A. & David Romer (1999). “Does Trade Cause Growth?” American EconomicReview 89(3) (June): 379–399
Freedom House (2007). Freedom in the World: The Annual Survey of Political Rights andCivil Liberties. Rowman & Littlefield, Lanham, MD
Friedman, Milton (1962). Capitalism and Freedom. Chicago, IL: University of Chicago Press
26

Glaeser, Edward L., Rafael La Porta, Florencio Lopez-de Silanes & Andrei Shleifer (2004).“Do Institutions Cause Growth?” Journal of Economic Growth 9(3) (September): 271–303
Gradstein, Mark (2007). “Inequality, Democracy and the Protection of Property Rights”.Economic Journal 117(516) (January): 252–269
Hall, Robert E. & Charles I. Jones (1999). “Why Do Some Countries Produce So Much MoreOutput Per Worker Than Others?” Quarterly Journal of Economics 114(1) (February):83–116
Hayek, Friedrich A. (1944). The Road to Serfdom. London, England: Routledge & KeganPaul
Henisz, Witold J. (2000). “The Institutional Environment for Economic Growth”. Economics& Politics 12(1) (March): 1–32
Heston, Alan, Robert Summers & Bettina Aten (2006). Penn World Table. Center forInternational Comparisons of Production, Income and Prices, Philadelphia, PA, 6.2 edition
Kaufmann, Daniel, Aart Kraay & Massimo Mastruzzi (2007). Governance Matters: Gover-nance Indicators for 1996–2006. The World Bank, Washington, DC, vi edition
Knack, Stephen & Philip Keefer (1995). “Institutions and Economic Performance: Cross-Country Tests Using Alternative Institutional Measures”. Economics & Politics 7(3)(November): 207–227
La Porta, Rafael, Florencio Lopez-de Silanes, Andrei Shleifer & Robert W. Vishny (1998).“Law and Finance”. Journal of Political Economy 106(6) (December): 1113–1155
Lee, Kwan Yew (2000). From Third World to First: The Singapore Story: 1965–2000.Singapore: Times Publishers
Mankiw, N. Gregory, David Romer & David N. Weil (1992). “A Contribution to the Empiricsof Economic Growth”. Quarterly Journal of Economics 107(2) (May): 407–437
Marshall, Monty G. & Keith Jaggers (2005). Polity IV Project: Political Regime Charac-teristics and Transitions, 1800–2004. Center for International Development and ConflictManagement, College Park, MD, iv edition
Minier, Jenny A. (2007). “Institutions and Parameter Heterogeneity”. Journal of Macroeco-nomics 29(3) (September): 3
Mobarak, Ahmed Mushfiq (2005). “Democracy, Volatility, and Economic Development”. Re-view of Economics and Statistics 87(2) (April): 348–361
Parente, Stephen L.and Zhao, Rui (2006). “Slow Development and Special Interests”. Inter-national Economics Review 47(3) (August): 991–1021
Persson, Torsten & Guido Tabellini (1994). “Is Inequality Harmful for Growth? Theory andEvidence”. American Economic Review 84(3) (June): 600–621
Persson, Torsten & Guido Tabellini (2006). “Democracy and Development: The Devil in theDetails”. American Economic Review 96(2) (May): 319–324
Persson, Torsten & Guido Tabellini (2007). “The Growth Effect of Democracy: Is It Het-erogenous and How Can It Be Estimated?” Working Paper 13150, NBER
Political Risk Services (2003). International Country Risk Guide. The PRS Group, EastSyracuse, NY
27

Przeworski, Adam & Fernando Limongi (1993). “Political Regimes and Economic Growth”.Journal of Economic Perspectives 7(3) (Summer): 51–69
Rivera-Batiz, Francisco L. (2002). “Democracy, Governance, and Economic Growth: Theoryand Evidence”. Review of Development Economics 6(2) (June): 225–247
Rivera-Batiz, Francisco L. & Luis A. Rivera-Batiz (2002). “Democracy, Participation, andEconomic Development: An Introduction”. Review of Development Economics 6(2) (June):135–150
Rodrik, Dani, Arvind Subramanian & Francesco Trebbi (2004). “Institutions Rule: The Pri-macy of Institutions over Geography and Integration in Economic Development”. Journalof Economic Growth 9(2) (June): 131–165
Rodrik, Dani & Romain Wacziarg (2005). “Do Democratic Transitions Produce Bad EconomicOutcomes?” American Economic Review 95(2) (May): 50–55
Sachs, Jeffrey D. (2001). “Tropical Underdevelopment”. Working Paper 8119, NBER
Sachs, Jeffrey D. (2003). “Institutions Don’t Rule: Direct Effects of Geography on Per CapitaIncome”. Working Paper 9490, NBER
Sachs, Jeffrey D. & Andrew M. Warner (1995). “Economic Reform and the Process of GlobalIntegration”. Brookings Papers on Economic Activity 1: 1–118
Usher, Daniel (1981). The Economic Prerequisite to Democracy. New York, NY: ColumbiaUniversity Press
Vega-Gordillo, Manuel & Jose L. Alvarez Arce (2003). “Economic Growth and Freedom: ACausality Study”. Cato Journal 23(2) (Fall): 199–215
Verdier, Thierry A. & Gilles Saint-Paul (1993). “Education, Democracy and Growth”. Journalof Development Economics 42(2) (December): 399–407
Windmeijer, Frank (2005). “A Finite Sample Correction for the Variance of Linear EfficientTwo-Step GMM Estimators”. Journal of Econometrics 126(1) (May): 25–51
Appendix
This appendix discusses in greater detail various variables employed in the re-gression analyses.
Ethnolinguistic fractionalization involved the use of two variables that cap-ture the fraction of the population speaking English, and the fraction of thepopulation speaking other European languages.
The measure of institutions using Kaufmann et al. (2007) included the fol-lowing variables: Voice and accountability, political stability, government effec-tiveness, regulatory quality, rule of law, and control of corruption. The esti-mates were assumed to be drawn from a normal distribution centered on zerowith support [−1, 1]. We dropped the first of these—which seems to be a betterproxy for democratic representation—and equally weight the remaining of these5 dimensions in the composite score:
INSi = 0.2 Stabi + 0.2 Govi + 0.2 Regi + 0.2 Lawi + 0.2 Corrupti.
28

The composite measure using Political Risk Services (2003) included very similarvariables: Bureaucracy quality, corruption, government stability, and rule oflaw. These were scored from 0–12 for government stability, 0–6 for corruptionand rule of law, and 0–4 for bureaucracy quality. The composite was thus thelog transform
INSit = ln (3×Bureauit + 2× Corruptit +Govit + 2× Lawit) .
The alternative democracy variable provided by Freedom House (2007) is acomposite of two main variables: Political rights, and civil liberties. The for-mer comprise electoral process, political pluralism, and government functioning,while the latter comprise freedom of expression, associational rights, rule of law,and personal autonomy. Each variable is scored from 1–7 and weighted equallyaccording to
DEMit = 0.5 Rightsit + 0.5 Libit.
29