DeepTrust: A Reliable Financial Knowledge Retrieval ... - arXiv
72
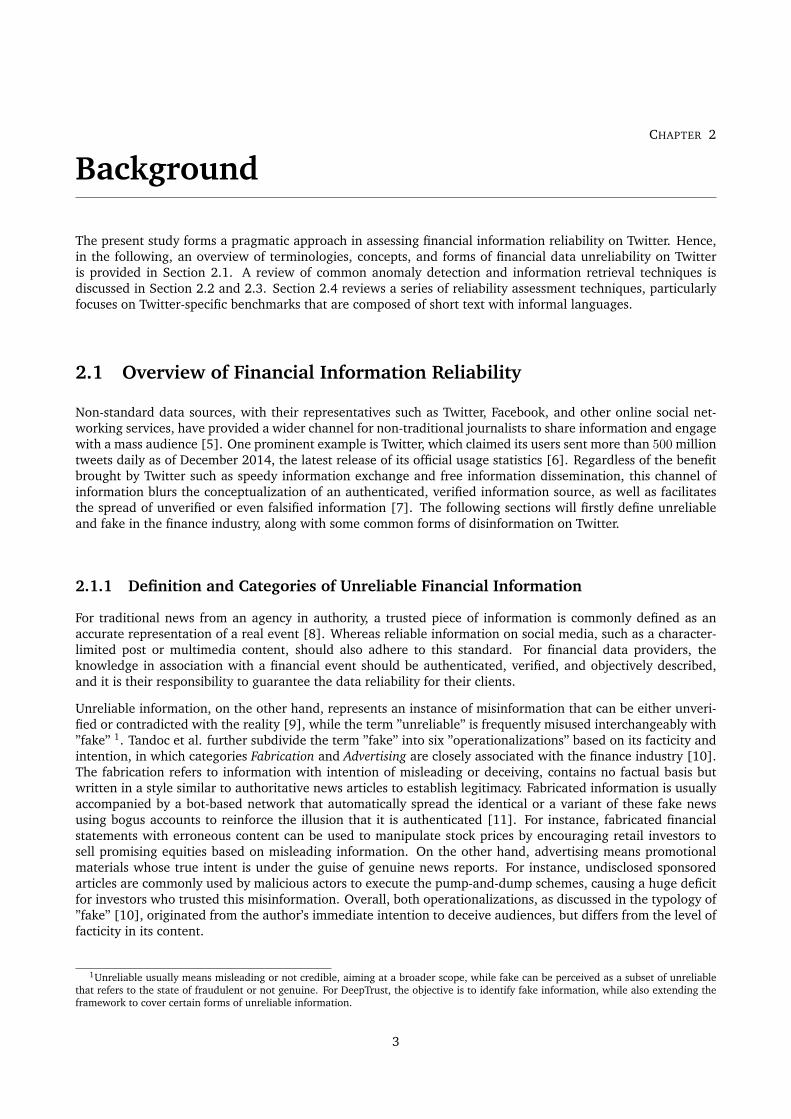
I MPERIAL C OLLEGE L ONDON DEPARTMENT OF COMPUTING DeepTrust: A Reliable Financial Knowledge Retrieval Framework For Explaining Extreme Pricing Anomalies Author: CHAN Pok Wah Supervisor: Dr. Ovidiu S , erban Second Marker: Prof. Francesca Toni Submitted in partial fulfillment of the requirements for the MSc degree in Computing (Management and Finance) of Imperial College London September 2021 arXiv:2203.08144v1 [q-fin.ST] 11 Mar 2022
-
Upload
khangminh22 -
Category
Documents
-
view
0 -
download
0
Transcript of DeepTrust: A Reliable Financial Knowledge Retrieval ... - arXiv
IMPERIAL COLLEGE LONDON
DEPARTMENT OF COMPUTING
DeepTrust: A Reliable Financial Knowledge RetrievalFramework For Explaining Extreme Pricing Anomalies
Author:CHAN Pok Wah
Supervisor:Dr. Ovidiu S, erban
Second Marker:Prof. Francesca Toni
Submitted in partial fulfillment of the requirements for the MSc degree inComputing (Management and Finance) of Imperial College London
September 2021
arX
iv:2
203.
0814
4v1
[q-
fin.
ST]
11
Mar
202
2

Abstract
Extreme pricing anomalies may occur unexpectedly without a trivial cause, and equity traders typically experi-
ence a meticulous process to source disparate information and analyze its reliability before integrating it into the
trusted knowledge base. Traditionally, for financial data providers, their primary data sources are authoritative
partnered news agencies with implicit trust, while there emerge needs to uncover insights from non-standard
data sources like Twitter for its responsiveness and enrichment. We introduce DeepTrust, a reliable financial
knowledge retrieval framework on Twitter to explain extreme price moves at speed, while ensuring data ve-
racity using state-of-the-art NLP techniques. Our proposed framework consists of three modules, specialized
for anomaly detection, information retrieval and reliability assessment. The workflow starts with identifying
anomalous asset price changes using machine learning models trained with historical pricing data, and retrieve
correlated unstructured data from Twitter using enhanced queries with dynamic search conditions. DeepTrust
extrapolates information reliability from tweet features, traces of generative language model, argumentation
structure, subjectivity and sentiment signals, and refine a concise collection of credible tweets for market in-
sights. The framework is evaluated on two self-annotated financial anomalies, i.e., Twitter and Facebook stock
price on 29 and 30 April 2021. The optimal setup outperforms the baseline classifier by 7.75% and 15.77%
on F0.5-scores, and 10.55% and 18.88% on precision, respectively, proving its capability in screening unreliable
information precisely. At the same time, information retrieval and reliability assessment modules are analyzed
individually on their effectiveness and causes of limitations, with identified subjective and objective factors that
influence the performance. As a collaborative project with Refinitiv, this framework paves a promising path
towards building a scalable commercial solution that assists traders to reach investment decisions on pricing
anomalies with authenticated knowledge from social media platforms in real-time.

Acknowledgments
I would first like to express my sincere gratitude to my thesis supervisor Dr. Ovidiu S, erban of the Data Science
Institute at Imperial College London. He is consistently being supportive of my project, and always welcomed
me to raise questions whenever I was facing obstacles in project designs or challenges in implementations. He
also generously offered me the flexibility in accomplishing this project in alignment with my research interest,
and kindly steered me in the right direction throughout the project. Finally, I am grateful for all the invaluable
insights and feedback he had provided for me to understand the field of natural language processing in greater
depth, and it is my honour to be in his guidance to accomplish this exciting project.
I would also like to thank the experts from the industry partner Refinitiv, who were continuously supporting
the project with curated historical news archives and other enriched unstructured data from industry-leading
solutions Refinitiv Eikon and PermID, and offer regular feedback from end-users ensuring DeepTrust align with
consensual objectives. The critical success factor behind project DeepTrust is the continuous collaboration
between academia and corporation that facilitate best practice for building a practical customer-centric solution,
which can truly enable institutional investors in discovering new insights from the market.
I would also like to acknowledge Prof. Francesca Toni of the Computing Department at Imperial College Lon-
don as the second reader of this thesis, and I am gratefully benefited from her comments and suggestions on
the project. Without her expertise and insightful input on the research area of argumentation, the proposed
framework could not have been accomplished the milestone as of now.
Finally, I must gratefully acknowledge the continuous encouragement and unfailing support from my parents,
my friends, and my partner Ziwi, through all the difficult times I have struggled during the project. The
accomplishment I have made with DeepTrust would not have been possible without them.
ii

Contents
1 Introduction 11.1 Motivations . . . . . . . . . . . . . . . . . . . . . . . . . . . . . . . . . . . . . . . . . . . . . . . . 11.2 Objectives and Contributions . . . . . . . . . . . . . . . . . . . . . . . . . . . . . . . . . . . . . . 2
2 Background 32.1 Overview of Financial Information Reliability . . . . . . . . . . . . . . . . . . . . . . . . . . . . . 3
2.1.1 Definition and Categories of Unreliable Financial Information . . . . . . . . . . . . . . . . 32.1.2 Forms of Unreliable Financial Information . . . . . . . . . . . . . . . . . . . . . . . . . . . 4
2.2 Anomaly Detection in Financial Market . . . . . . . . . . . . . . . . . . . . . . . . . . . . . . . . . 52.3 Correlated Events Detection . . . . . . . . . . . . . . . . . . . . . . . . . . . . . . . . . . . . . . . 6
2.3.1 Topic-Detection and Tracking (TDT) . . . . . . . . . . . . . . . . . . . . . . . . . . . . . . 62.3.2 Event-oriented Text Retrieval (ETR) . . . . . . . . . . . . . . . . . . . . . . . . . . . . . . 10
2.4 Reliability Assessment . . . . . . . . . . . . . . . . . . . . . . . . . . . . . . . . . . . . . . . . . . 142.4.1 Feature-based Credibility Assessment . . . . . . . . . . . . . . . . . . . . . . . . . . . . . . 142.4.2 Neural Fake News Verifier . . . . . . . . . . . . . . . . . . . . . . . . . . . . . . . . . . . . 152.4.3 Argument Mining (AM) . . . . . . . . . . . . . . . . . . . . . . . . . . . . . . . . . . . . . 172.4.4 Subjectivity Analysis (SA) . . . . . . . . . . . . . . . . . . . . . . . . . . . . . . . . . . . . 20
3 DeepTrust Framework 223.1 Overview of DeepTrust Framework . . . . . . . . . . . . . . . . . . . . . . . . . . . . . . . . . . . 223.2 Anomaly Detection module . . . . . . . . . . . . . . . . . . . . . . . . . . . . . . . . . . . . . . . 23
3.2.1 Anomaly Detection using Empirical Analysis and Benchmark Theory . . . . . . . . . . . . 233.2.2 Univariate Anomaly Detection using ARIMA model . . . . . . . . . . . . . . . . . . . . . . 243.2.3 Multivariate Anomaly Detection using Unsupervised Learning Algorithms . . . . . . . . . . 25
3.3 Information Retrieval Module . . . . . . . . . . . . . . . . . . . . . . . . . . . . . . . . . . . . . . 263.3.1 Twitter Search Query Modeling . . . . . . . . . . . . . . . . . . . . . . . . . . . . . . . . . 273.3.2 Tweets Retrieval and Ranking . . . . . . . . . . . . . . . . . . . . . . . . . . . . . . . . . . 31
3.4 Reliability Assessment Module . . . . . . . . . . . . . . . . . . . . . . . . . . . . . . . . . . . . . . 313.4.1 General Tweet Pre-Processing for Reliability Assessment . . . . . . . . . . . . . . . . . . . 313.4.2 Feature-based Screening using Heuristics and Threshold-based Classifiers . . . . . . . . . . 323.4.3 Synthetic Text Screening using Discriminative Model and Classifiers . . . . . . . . . . . . . 333.4.4 Argumentation Structure Screening using Sequence Labeling Model . . . . . . . . . . . . . 383.4.5 Subjectivity Screening using Classifiers and Subjectivity Lexicon . . . . . . . . . . . . . . . 393.4.6 Sentiment Signal Insights using Domain-Specific Language Model . . . . . . . . . . . . . . 42
4 Evaluation and Discussion 444.1 Dataset and Annotation . . . . . . . . . . . . . . . . . . . . . . . . . . . . . . . . . . . . . . . . . 44
4.1.1 Evaluation Dataset and Acknowledgement of Bias . . . . . . . . . . . . . . . . . . . . . . . 444.1.2 Data Annotation Guideline and Annotation Samples . . . . . . . . . . . . . . . . . . . . . 454.1.3 DeepTrust Evaluation Objective and Scope . . . . . . . . . . . . . . . . . . . . . . . . . . . 46
4.2 Experimental Results . . . . . . . . . . . . . . . . . . . . . . . . . . . . . . . . . . . . . . . . . . . 474.2.1 Summary of Experimental Results . . . . . . . . . . . . . . . . . . . . . . . . . . . . . . . . 474.2.2 Experiment Setup . . . . . . . . . . . . . . . . . . . . . . . . . . . . . . . . . . . . . . . . 484.2.3 Interpretation of Evaluation Metrics . . . . . . . . . . . . . . . . . . . . . . . . . . . . . . 484.2.4 Interpretation of Experimental Results . . . . . . . . . . . . . . . . . . . . . . . . . . . . . 49
4.3 Discussion and Implications . . . . . . . . . . . . . . . . . . . . . . . . . . . . . . . . . . . . . . . 494.3.1 Impact of Query Enhancement on Tweet Collection Quality . . . . . . . . . . . . . . . . . 494.3.2 Impact of Naming Ambiguity and Tag Abuse on Tweet Collection Quantity . . . . . . . . . 51
iii

CONTENTS Table of Contents
4.3.3 Impact of Delayed Evaluation on Feature-based Filter Performance . . . . . . . . . . . . . 534.3.4 Impact of Threshold Values on Feature-based Filter Performance . . . . . . . . . . . . . . . 544.3.5 Impact of Rule Aggressiveness on Synthetic Text Filter Performance . . . . . . . . . . . . . 544.3.6 Impact of Ever-Stronger Adversaries on Synthetic Text Filter Effectiveness . . . . . . . . . 554.3.7 Impact of Writing Style Difference on Argumentation Filter Performance . . . . . . . . . . 564.3.8 Implication of Subjectivity on Information Reliability . . . . . . . . . . . . . . . . . . . . . 574.3.9 Implication of Sentiment Signal Alignment on Reliability Assessment . . . . . . . . . . . . 57
5 Concluding Remarks 595.1 Conclusion . . . . . . . . . . . . . . . . . . . . . . . . . . . . . . . . . . . . . . . . . . . . . . . . 595.2 Legal, Social, Ethical and Professional Considerations . . . . . . . . . . . . . . . . . . . . . . . . . 595.3 Future Works . . . . . . . . . . . . . . . . . . . . . . . . . . . . . . . . . . . . . . . . . . . . . . . 60
5.3.1 Financial Information Retrieval from Multiple Social Media Platforms . . . . . . . . . . . . 605.3.2 Real-Time Reliable Financial Information Retrieval Framework . . . . . . . . . . . . . . . 615.3.3 Weighted Reliability Score using Author Reputation . . . . . . . . . . . . . . . . . . . . . . 61
iv

CHAPTER 1
Introduction
1.1 Motivations
Rationale of the DeepTrust initiative
Refinitiv, as a global financial data provider, is a data-driven company that develops knowledge bases of financialinformation from trusted data streams. To maintain its commitment to provide authenticated market data toclients, it primarily gathers real-time data from reputable global news sources with a high degree of implicittrust, specialty franchises from professional financial institutions, and multimedia content from expert partnerslike Reuters, IFR, CNBC, etc [1].Recently, non-standard data sources, such as Twitter, Facebook, and other social networking services have in-creasingly attracted more financial professionals and data providers to extract meaningful contents from theocean of big data. These data sources constitute an additional input of business information, which can beused to evaluate stock price expectations, monitor market sentiment [2]. The speedy transfer of knowledge onthese platforms can also be leveraged to explain anomalies in the pricing data, much faster than waiting foran analysis report from the traditional media. However, one intrinsic problem of non-standard data sources isdata veracity, in which financial data providers like Refinitiv cannot directly include information extracted fromthese sources as a part of its trusted knowledge base. Besides, disinformation in the financial industry maycause severe economic consequences by using deception and frauds to mislead consumers in reaching financialdecisions, thus requires prudent screening on information extracted from noisy social media data streams.
Challenges and Opportunities
Regardless of the effort made by linguistics and professional natural language processing (NLP) experts in iden-tifying fake news, the majority of detection mechanisms or frameworks such as SpotFake [3] and EANN [4] aimat identifying a particular form of fake news by training a discriminator using multimodal features (e.g., textualcontents and visuals), as information extracted from each modality can complement each other in evaluatinginformation authenticity. However, when the model is learning visual representations, this knowledge is usuallydomain-specific, and limits the flexibility of applying to a different domain using these non-transferable featurerepresentations. Besides, in the context of the financial industry, identifying unreliable financial information ismore challenging because a post can be deceiving by embellishing an event by quoting out of context, and isalso difficult to collect a sufficient amount of validated fake financial information from trusted data sources suchas Securities and Exchange Commission (SEC). In addition, fake news is only a subset of unreliable informa-tion as will be discussed in Section 2.1, whereas unconfirmed reported speech and subjective personal opinionsshould also be filtered out from the trusted knowledge base. Therefore, it is the responsibility of financial dataproviders to deploy additional validations, to ensure the extracted knowledge from Twitter is beyond ”Not Fake”,but is ”Reliable”.Different from existing works, the present project proposes a reliable information extraction framework namedDeepTrust. DeepTrust enables financial data providers to effectively source and analyze disparate financialinformation on Twitter that could explain a sudden price anomaly, and apply information processing and vali-dation techniques to preserve only reliable knowledge that contains a high degree of trust. The prime novelty ofDeepTrust is the integration of a series of state-of-the-art NLP techniques in retrieving information from a noisyTwitter data stream, and assessing information reliability from various aspects, including the argumentationstructure, engagement metrics, neural generated text traces, and text subjectivity. The DeepTrust is comprisedof three interconnected modules: (i) Anomaly Detection module, (ii) Information Retrieval module, (iii) Re-liability Assessment module. All modules function in sequential order within the DeepTrust framework, andjointly contribute to achieving an overall high level of precision in retrieving information from Twitter that con-stitutes a collection of trusted knowledge to explain financial anomalies. Solution effectiveness are evaluatedboth module-wise and framework-wise to empirically conclude the practicality of the DeepTrust framework infulfilling its objective.
1

1.2. OBJECTIVES AND CONTRIBUTIONS Chapter 1. Introduction
1.2 Objectives and Contributions
In this project, the author collaborated with Refinitiv in developing a financial information retrieval and assess-ment framework DeepTrust, to assist analysts and equity traders in understanding abnormal price movementsin the securities market using information retrieved from social media at speed. The primary objective of Deep-Trust is to establish a workflow that identifies unexpected price moves, explains the cause using unstructureddata from non-standard data sources such as social media posts from Twitter, and ensures the basis of theseinformation are reliable. In particular, DeepTrust has three essential purposes: (i) discover anomalous pricemovements using anomaly detection algorithms and machine learning models trained with historical data (ii)retrieve correlated information (e.g., industrial, company-specific, regional, etc.) from social media platformTwitter (iii) analyze and refine an implicitly trusted collection of tweets that are reliable for explaining thefinancial anomaly.
The project has three main contributions. Firstly, the prime novelty of DeepTrust is to incorporate numerousstate-of-the-art pre-trained language models of different specialties (e.g., few-shot learners, domain-specificlanguage models, sequence labeling models), and extrapolate information reliability using textual and metafeatures, traces of language model footprints, argumentation structure and subjectivity. DeepTrust explores thetopic of financial information credibility assessment on social media platforms, and goes beyond fighting againstbot-generated spam to more complex forms of unreliable knowledge such as opinion pieces and disinformation.
In addition, though there exists a large number of datasets for downstream NLP tasks like synthetic text detec-tion and argument mining, an annotated dataset on information reliability of tweets in the financial domain hasnever been published. Considering the peculiarities of Twitter-specific features and writing styles, the authorannotated two collections of tweets from different anomalous price movement events based on their perceivedcredibility, and evaluate the proposed DeepTrust framework accordingly. Although these datasets only containapproximately 1, 700 tweets due to limited resources available, the established definition of financial informa-tion reliability and annotation guideline paves the way for future researchers in designing their own enhancedreliable knowledge screening system, or benchmarking their framework on the task of tweet reliability analysis.
Lastly, as a collaborative project with Refinitiv, the proposed DeepTrust framework architecture and experimen-tal results contribute valuable input to Project Mosaic1, which is an ongoing prototype developed by RefinitivLabs that uncover insights into extreme asset price movements. Unlike DeepTrust, project Mosaic focuses ongenerating actionable knowledge on anomalous financial events instantly using data from multiple data sources,while DeepTrust goes beyond information retrieval and applies reliability assessment techniques using state-of-the-art language models, to guarantee only credible information is presented to users. DeepTrust is implementedin adherence to standard software engineering principles, including the adoption of modular programming andmicroservices architecture for code maintainability and testability. In addition, experimental results in Chap-ter 4 are insightful for Refinitiv Labs to further improve the existing framework following analytical results andproposed suggestions, and continue training classifiers and language models for better performance, with thelarge amount of proprietary financial datasets (e.g., machine readable news) at their disposal.
1Project Mosaic from Refinitiv Labs: https://www.refinitiv.com/en/labs/projects/mosaic.
2
CHAPTER 2
Background
The present study forms a pragmatic approach in assessing financial information reliability on Twitter. Hence,in the following, an overview of terminologies, concepts, and forms of financial data unreliability on Twitteris provided in Section 2.1. A review of common anomaly detection and information retrieval techniques isdiscussed in Section 2.2 and 2.3. Section 2.4 reviews a series of reliability assessment techniques, particularlyfocuses on Twitter-specific benchmarks that are composed of short text with informal languages.
2.1 Overview of Financial Information Reliability
Non-standard data sources, with their representatives such as Twitter, Facebook, and other online social net-working services, have provided a wider channel for non-traditional journalists to share information and engagewith a mass audience [5]. One prominent example is Twitter, which claimed its users sent more than 500 milliontweets daily as of December 2014, the latest release of its official usage statistics [6]. Regardless of the benefitbrought by Twitter such as speedy information exchange and free information dissemination, this channel ofinformation blurs the conceptualization of an authenticated, verified information source, as well as facilitatesthe spread of unverified or even falsified information [7]. The following sections will firstly define unreliableand fake in the finance industry, along with some common forms of disinformation on Twitter.
2.1.1 Definition and Categories of Unreliable Financial Information
For traditional news from an agency in authority, a trusted piece of information is commonly defined as anaccurate representation of a real event [8]. Whereas reliable information on social media, such as a character-limited post or multimedia content, should also adhere to this standard. For financial data providers, theknowledge in association with a financial event should be authenticated, verified, and objectively described,and it is their responsibility to guarantee the data reliability for their clients.
Unreliable information, on the other hand, represents an instance of misinformation that can be either unveri-fied or contradicted with the reality [9], while the term ”unreliable” is frequently misused interchangeably with”fake” 1. Tandoc et al. further subdivide the term ”fake” into six ”operationalizations” based on its facticity andintention, in which categories Fabrication and Advertising are closely associated with the finance industry [10].The fabrication refers to information with intention of misleading or deceiving, contains no factual basis butwritten in a style similar to authoritative news articles to establish legitimacy. Fabricated information is usuallyaccompanied by a bot-based network that automatically spread the identical or a variant of these fake newsusing bogus accounts to reinforce the illusion that it is authenticated [11]. For instance, fabricated financialstatements with erroneous content can be used to manipulate stock prices by encouraging retail investors tosell promising equities based on misleading information. On the other hand, advertising means promotionalmaterials whose true intent is under the guise of genuine news reports. For instance, undisclosed sponsoredarticles are commonly used by malicious actors to execute the pump-and-dump schemes, causing a huge deficitfor investors who trusted this misinformation. Overall, both operationalizations, as discussed in the typology of”fake” [10], originated from the author’s immediate intention to deceive audiences, but differs from the level offacticity in its content.
1Unreliable usually means misleading or not credible, aiming at a broader scope, while fake can be perceived as a subset of unreliablethat refers to the state of fraudulent or not genuine. For DeepTrust, the objective is to identify fake information, while also extending theframework to cover certain forms of unreliable information.
3

2.1. OVERVIEW OF FINANCIAL INFORMATION RELIABILITY Chapter 2. Background
2.1.2 Forms of Unreliable Financial Information
Neural Disinformation - Fabrication
Neural disinformation refers to fraudulent content created by a neural language model, which aims at gen-erating realistic-looking content using large-scale generative models such as GPT-2, GROVER and BERT. Theobjective is to mimics the style of an authenticated information from an authoritative party, whereas the con-tent itself is either viral or deceiving with a malicious intention.
For instance, in the Suez Canal traffic incident caused by cargo ship blockage starting from 21 March 2021,the crude oil price has surged 4.54% possibly due to fears of crude oil supply disruptions [12]. This financialanomaly was discussed by Bloomberg Economics on 23 March 2021, stating that ”A realignment of global crudeflows has seen westbound shipments from the Gulf tumble, making the Suez Canal far less important” 2. Neuralfake news can be simultaneously generated using solely this information, and result in another compelling storyregarding this anomalous event, such as ”Suez Canal also opening up the possibility that new oil-by-rail routes toCanada or the US ,”3. Without decent domain knowledge and rigorous fact-checking, it can be challenging evenfor a well-educated person to distinguish which one is the authenticated piece of information.
Intuitively speaking, neural fake news generally works better without length constraint, such as a news articleor an interview script, because more fabricated contextual information can be included in the passage to buildup a realistic-looking story. However, for Twitter, neural disinformation can be identified easily due to thecharacter-limit restriction, as most often neural fake tweets are not compelling enough to deceive a human.
Human-written Disinformation - Fabrication
Human-written disinformation refers to untruthful information written by human beings with malicious inten-tions, and is commonly used in the financial market to manipulate stock prices via misleading investors withfalsified company-specific information. This type of disinformation is by far the primary source of fake newsexisting on social media platforms [13].
Figure 2.1: Craig’s fabricated financial information on Twitter. He maliciously used the logo and style of the securitiesresearch firm Muddy Waters, and falsely accused Audience Inc. on 29 January 2013 (Source: [14])
For instance, SEC filed securities fraud charges against James Alan Craig in 2014 about publishing a series oftweets that falsely accusing Audience Inc. was under investigation, as shown in Figure 2.1. The direct conse-quence is the Audience Inc.’s stock price crashed and triggered a trading halt shortly after these tweets. Thistype of disinformation is hard to identify because it is nearly impossible to distinguish this with an authenticatedposts from the real Muddy Waters unless examining the account profile. In fact, the SEC also acknowledgedthat it is challenging to identify this perpetrator [14].
Therefore, for the consideration of feasibility, DeepTrust aims to primarily detect human-written disinformationthat is (i) from a personal account without disguise and (ii) written in his/her own linguistic style.
2Twitter post URL: https://twitter.com/economics/status/1375177958197956613.3Generated using GPT-2 XLarge model with 1.5B parameters, with 40-words diversity and 0.8 temperature. Selected content is the most
compelling piece out of 40 generated samples.
4

Chapter 2. Background 2.2. ANOMALY DETECTION IN FINANCIAL MARKET
Opinion Piece - Subjective Statement
An opinion piece is a subjective expression that represents an individual’s perspectives and judgements [15].Regardless it is riddled with logical fallacies or polarized subjective statements, an opinion piece alone does notrender itself fake information [16]. It is merely unreliable information that lacks an adequate chain of evidenceto reinforce its validity. In other words, if the opinion piece has clearly identified the author and its responsibilityto be held accountable for its statement, it should only be treated as knowledge that needs more scrutiny beforebeing deemed reliable.One example of misusing opinion pieces for malicious intention is the article ”Partisan, Moro pushes Brazil’sdemocracy in the abyss” [17]. This article was published by Mark Weisbrot in New York Times (NYT) in January2018, which is an opinion piece that does not reflect the newspaper’s political stance. However, left-wing mediaquickly leveraged this opinion piece by taking it out of context and used it as a representation of NYT’s editorialline, portraying a negative image of Judge Sergio Moro [18].Besides, it is worth noticing that subjectivity is not equivalent to opinionated, which refers to sentences explicitlyor implicitly express a sentiment, such as ”The earphone malfunctioned after two days” is an objective statementbut expressing negative sentiment [19]. Therefore, in this project, an opinion piece is treated as unreliableonly if (i) the claim directly contradicts evidence from trusted sources (e.g., news agencies) or (ii) primarilycomposed of subjective statements regardless of the sentiment.
2.2 Anomaly Detection in Financial Market
In an ideal world, the market should constantly operate under the efficient market hypothesis, implying that allsecurities (e.g., stocks, options, commodities) are priced perfectly based on their inherent investment properties,which are knowledge available to all participants. In other words, securities should always be traded at their fairvalue regardless of market timing or stock selection, and investors should never be able to create an arbitragesituation by reselling undervalued securities for higher prices without incurring additional risks.However, in reality, the market is rarely operating at its perfect efficiency, and the presence of anomalies canlead to distortions and inefficiency in the market. In [20], Yavrumyan defined three categories of financialanomalies in the securities market: (i) technical anomalies - anomalies that relate to abnormal trading behav-iors, that enable investors to leverage technical analysis of historical pricing data to predict the pattern of stockprice changes (ii) fundamental anomalies - anomalies in association with fundamental information of the listedcompany that allows investors to forecast the stock price using fundamental analysis (iii) calendar anomalies -systematic anomalies that caused by the seasonality of stock price movements that allow investors to identifythe price changing pattern. In addition, in the domain of data science, the anomaly can be classified into threecategories: (i) global anomaly - a single data point that significantly deviates from the rest of data points. (ii)collective anomaly - a subset of data points that exhibit peculiar behavior comparing to the whole dataset. (iii)contextual anomaly - individual or group of data points that deviates within a specific context (e.g., a timeperiod) [21]. In DeepTrust, the fundamental anomaly is the focus because the objective is to identify abnormalpricing changes that can be explained by information retrieved from non-standard data sources like Twitter.Besides, our model emphasizes identifying contextual anomaly, because generally, breaking news would lead toa sudden price change within a time period, and this anomaly is difficult to detect when searching for global orcollective anomalies.Anomaly detection refers to algorithms that identify abnormal data points from a given dataset. In the contextof this project, the anomaly can either be detected by financial experts or by anomaly detection algorithms.Anomaly detection algorithms can be classification-based, clustering-based, nearest neighbor-based, statistical-based and others [22]. In an overview of present anomaly detection algorithms in the stock market, the super-vised algorithms (e.g., Naive Bayes, K-Nearest Neighbour KNN, Support Vector Machine SVM and Class OutlierFactor COF) achieved a significantly better result comparing to unsupervised algorithms such as Local OutlierFactor (LOF) and other density-based or distance-based methods. Rajeswari et al. further evaluated these al-gorithms against different types of anomalies, and concluded that (i) all supervised algorithms can detect 80%anomalies, and KNN achieved the best F-measure comparing to others (ii) density-based and LOF algorithmsperformed identically well in the unsupervised category, but is only able to detect 58% anomalies correctly [23].In most recent literature, unsupervised anomaly detection algorithm becomes the mainstream due to its capa-bility in handling previously unseen anomalies, and does not need an annotated data set for training. These
5

2.3. CORRELATED EVENTS DETECTION Chapter 2. Background
algorithms are effective in identifying global and collective anomalies. In [24], a detailed evaluation of unsu-pervised anomaly detection algorithms is discussed, ranging from clustering-based nearest neighbor approacheslike k-Means and Local Density Cluster-based Outlier Factor (LDCOF) [25], to SVM-based approaches such asC-SVM and one-class SVM [26]. Among all these algorithms, Ahmed and Uddin evaluated their performanceon financial anomalies detection [27]. Algorithms were evaluated using precision, recall, F-measure and false-positive rates (FPR), then revealed that LOF and Clustering-based Multivariate Gaussian Outlier Score (CMGOS)achieved the highest F-measure comparing to all competitors. However, none of these unsupervised anomalydetection approaches outperform a random classifier, indicating the trade-off between robustness and accuracy.
Another variant of the anomaly detection algorithm is prediction-based Contextual Anomaly Detection (CAD)proposed by Golmohammadi and Koosha [28]. The system firstly extracts a subset of time series and calculatesthe centroid (i.e., average stock value over this time period), as the expected value of this subset of data. Thiscentroid is then used along with the correlation score between each time window to predict the expected valuesof the next time window. Comparing with supervised clustering algorithms, CAD improved the recall by 26%while maintaining the same level of precision.
In addition, the Early Aberration Reporting System (EARS) is a widely adopted enhanced surveillance system inthe infectious disease domain that can analyze syndrome monitoring data in public health to identify bioterror-ism in its early phase [29]. EARS aims to detect aberration, which in the context of public health, refers to thechange in the frequency distribution when comparing to historical data (i.e., ranging from 9-days to 3-years).EARS consists of algorithms targeting different scenarios, including long-term (i.e., an extended baseline for3–5 years, a limited baseline for 7 days to 5 years) and short-term(i.e., recent data for less than 30 days andshort-term for 1–6 days). The system also allows user-specified sensitivity and specificity estimates to configurethe system that is customized for each scenario. EARS is available in forms of its variants C1, C2, C3 and NB,which based on cumulative sum (CUSUM) algorithms that identify an anomaly if the observed count exceedsthe baseline count mean by a multiple of standard deviations.
2.3 Correlated Events Detection
Starting from a financial anomaly in the pricing data, the objective is to identify correlated posts on Twitter thatcan serve as supporting evidence of this anomalous event, or commonly known as specified event detection.Posts may be deemed correlated based on (i) textual-content analysis to identify relevant keywords (ii) socialnetwork analysis on the network topology with follower-followee patterns (iii) behavior analysis on individualsand the metadata of his/her posts. The present project focuses on the analysis of textual content and behaviordata to infer information correlation with the interested anomalous event.
Two main categories of event detection are namely: (i) Retrospective Event Detection (RED) by clusteringaccumulated set of documents into events, commonly known as offline event detection (ii) First Story Detection(FSD) by allocating documents from a live stream of data into the closest event, known as online event detection.In the context of the DeepTrust, both RED and FSD are applicable because the system can either start fromknown knowledge from a trusted knowledge base or starts from filtering a live data stream so only tweets thatare related to the event are recorded. The following sections review topic-detection and tracing mechanismsand event-oriented text retrieval techniques for gathering correlated knowledge of a given financial anomalyfrom the Twitter data stream.
2.3.1 Topic-Detection and Tracking (TDT)
Topic-Detection and Tracking (TDT) is the widely adopted framework to establish a timeline of textual contentsthat are centered around a single event, and to associate events with textual content by analyzing the temporalpattern of keywords. It involves three stages (i) segmentation by splitting texts into chunks (ii) detection byidentifying the first occurrence of a novel event (iii) tracking by constructing an evolution path of the detectedevent over the temporal dimension [30]. TDT algorithms can be classified broadly into document-pivot andfeature-pivot paradigms. The document-pivot approach refers to document-level clustering based on the pair-wise semantic distance among documents [31], and the feature-pivot approach detects events using word andtopic distributions per document, results in a cluster of features [32].
6

Chapter 2. Background 2.3. CORRELATED EVENTS DETECTION
Document-Pivot Paradigm (DPP)
DPP aims to cluster documents into separate events based on pairwise document similarity scores. For Deep-Trust, DPP can rapidly cluster documents into different events, and then locate the correlated cluster of events bycalculating the similarity score between the given financial anomaly and clusters. In early research, a single-passincremental algorithm with a document frequency threshold model is used to cluster broadcast news stories intodifferent events [33]. Brants et al. further improved the model by using incremental Term Frequency-InverseDocument Frequency (TF-IDF) and normalized similarity scores among documents, which results in greaterrecall and precision [34]. Zhang and Li applied cosine distance on Vector Space Model (VSM) topics represen-tation model, but improvement (i.e., 38.378% increase in topic detection rate) is only significant on large-scalecorpus [35]. All these approaches have achieved an overall good performance on traditional media.
Besides, extensive research efforts were made on improving DPP performance on social media such as Twitterwith multimodal analysis. Becker et al. proposed clustering documents using multiple types of unique Twitterfeatures such as time, location and other metadata, then assign specific similarity metrics (e.g., cosine similarityfor content and Haversine distance for metadata) on each feature [36]. In their later research, the performancewas improved by leveraging similarity metrics across multimodal documents as learnable parameters, and uselogistic regression to classify if a pair of documents belong to the same event or not [37]. In other words,the single-pass incremental algorithm is used in conjunction with the multimodal similarity metrics. Reuterand Cimiano simplified the TDT algorithm by reducing the number of comparisons needed when evaluatingpair-wise document similarity [38]. Originally, the number of comparisons grows exponentially with moremodalities used as a feature. Instead of computing a combined pair-wise similarity score, [38] proposed toretrieve a set of closest events with respect to each feature and compare them separately. A Support VectorMachine (SVM) classifier was also used to pre-classify incoming documents into (i) belongs to top bursty event(ii) belongs to another novel event. The scalability of DPP is further enhanced in Hossny et al., which amplifiedkeyword signals by mapping semantically correlated words with similar temporal patterns into a single wordvia Singular Value Decomposition with K-means (K-SVD), with an average 0.38 increase on the document-levelcorrelation scores [39].
Figure 2.2: Schematic diagram of the graph-based multimodal clustering technique using a Same-Cluster model(Source: [40]).
Other than incremental clustering, recent researches also utilized the graph-based multimodal clustering tech-nique, by representing documents as vertices and pairwise similarity score as weighted edges. Clustering isachieved by identifying an optimal partition scheme based on an objective function, which determines edges tobe removed. Additional modalities such as visual contents, uploader’s identity are included to aid the analysisof similarity among documents. For instance, in [40], as shown in Figure 2.2, candidates are firstly retrievedfrom the collection of documents represented as a multimodal item. The example clustering technique was usedto train an SVM classifier, known as the Same-Cluster (SC) model, in determining if sets of multimodal docu-ments belong to the same cluster, based on per modality distance. With the generated SC graph, two populargraph partitioning algorithms, batch-based algorithm Structural Clustering Algorithm for Networks (SCAN) andincremental-based algorithm Quick Community Adaption (QCA) were used to extract finalized clusters.
7

2.3. CORRELATED EVENTS DETECTION Chapter 2. Background
The latest DPP-based event detection framework was proposed by Hasan et al. as TwitterNews+, an onlineevent detection system consists of a Search component and EventCluster component [41]. The Search modulecombines Random Indexing based term vector model [42] and Locality Sensitive Hashing (LSH) scheme [43], toquickly hash similar tweets into the same buckets in a reduced dimension, then determine if an incoming tweetrelates to a known topic or not. The EventCluster module applies the classic TDT technique (i.e., single-passincremental clustering) to group tweets into events. A filter based on the user-specified topic is then appliedto retrieve relevant tweets. The TwitterNews+ application has achieved a significant improvement in terms ofprecision and recall after an exhaustive hyper-parameter tuning.
Feature-Pivot Paradigm (FPP)
FPP is another TDT technique based on the analysis of feature patterns, in which the feature can either be con-tent features or contextual features. For Twitter, the content features refer to words, sentiments and linguisticstyles in the 280 characters-long unstructured textual data. The contextual feature refers to the metadata of thetweet, including the uploader’s identity and network information, geographical and temporal information, etc.The conceptualization of FPP is that events are composed of prominent text features that exhibit abnormalitiesin temporal patterns, and the occurrence of features would increase when correlated events had happened.For example, the term ”interest rate” shall occur frequently when discussing the drastic tech stocks correctioncaused by a bond yield spike in March 2021.
Before extracting features, Tembhurnikar and Patil discussed the importance of appropriate text preprocessingin achieving a high-quality topic detection [44]. A combination of tokenization, slang word translation, normal-ization and temporal aggregation through merging correlated tweets were used, primarily focused on improvingfeature extraction performance on information short text on Twitter. These techniques were proved effective byalleviating ambiguity caused by the informal nature of the language used in tweets.
Figure 2.3: Feature-Pivot clustering process of an enduring event based on bursty feature identification (Source: [45]).
In [45], Fung et al. proposed a feature-pivot clustering algorithm to detect bursty features using time-seriesfeature distributions from a sequence of chronologically ordered text documents. The overview of the eventdetection pipeline is described in Figure 2.3. Bursty features are identified using a generative probabilisticmodel on a binomial distribution. In short, a feature is concluded bursty if the number of tweets containing itis greater than the expected value of the modeled distribution. Although this research focused on traditionalmedia TDT, it served as the foundation of bursty feature identification in later research.
Sakaki et al. was recognized as the pioneering research of FSD-based FPP on Twitter, by using statistical andcontextual features (e.g., length of the tweet, word choices, and neighboring words) to train an SVM classifierto determine if an incoming tweet belongs to natural disaster events or not [46]. However, this approach islimited in detecting solely earthquake-related tweets, heavily relies on common lexical features correlate tonatural disasters. Whereas, for financial anomalies, the scope of potential word choices is much larger, thusmaking this approach ineffective.
The framework proposed by Chen et al. is an insightful technique for DeepTrust. Once users specified keywordsthat might be related to an anomaly (e.g., oil price drop, interest rate, bond yield, etc.), these keywords are
8
Chapter 2. Background 2.3. CORRELATED EVENTS DETECTION
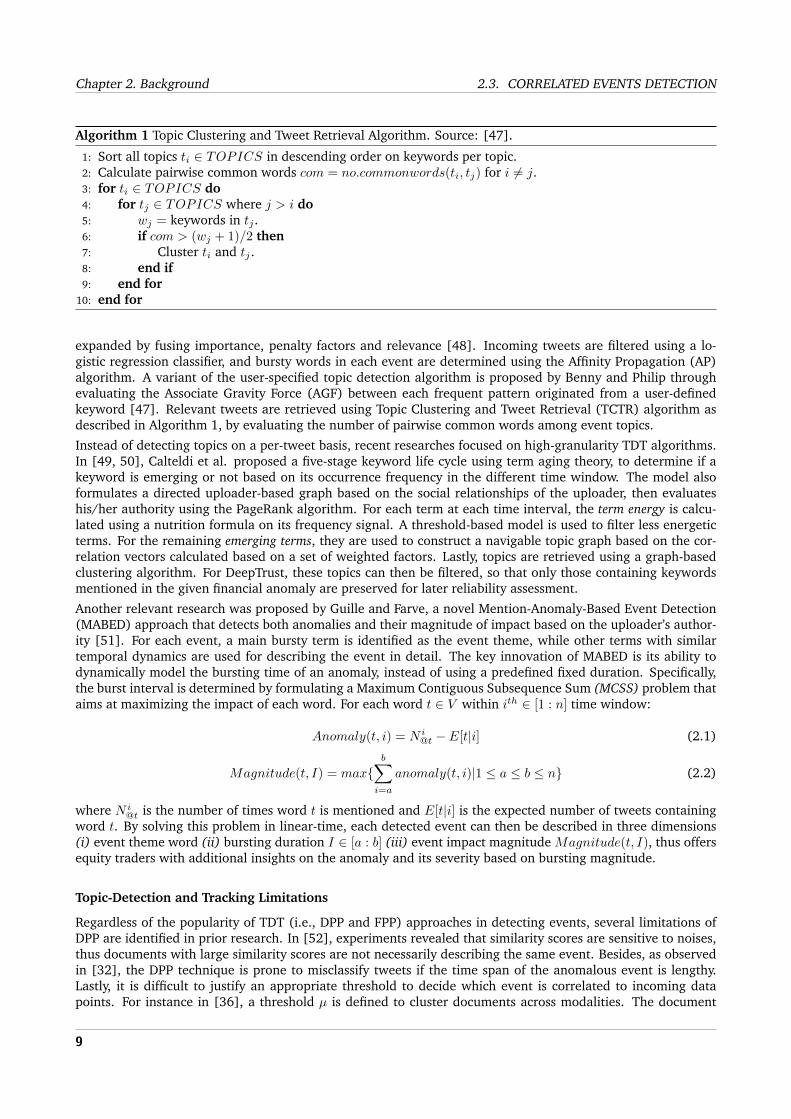
Algorithm 1 Topic Clustering and Tweet Retrieval Algorithm. Source: [47].
1: Sort all topics ti ∈ TOPICS in descending order on keywords per topic.2: Calculate pairwise common words com = no.commonwords(ti, tj) for i 6= j.3: for ti ∈ TOPICS do4: for tj ∈ TOPICS where j > i do5: wj = keywords in tj .6: if com > (wj + 1)/2 then7: Cluster ti and tj .8: end if9: end for
10: end for
expanded by fusing importance, penalty factors and relevance [48]. Incoming tweets are filtered using a lo-gistic regression classifier, and bursty words in each event are determined using the Affinity Propagation (AP)algorithm. A variant of the user-specified topic detection algorithm is proposed by Benny and Philip throughevaluating the Associate Gravity Force (AGF) between each frequent pattern originated from a user-definedkeyword [47]. Relevant tweets are retrieved using Topic Clustering and Tweet Retrieval (TCTR) algorithm asdescribed in Algorithm 1, by evaluating the number of pairwise common words among event topics.
Instead of detecting topics on a per-tweet basis, recent researches focused on high-granularity TDT algorithms.In [49, 50], Calteldi et al. proposed a five-stage keyword life cycle using term aging theory, to determine if akeyword is emerging or not based on its occurrence frequency in the different time window. The model alsoformulates a directed uploader-based graph based on the social relationships of the uploader, then evaluateshis/her authority using the PageRank algorithm. For each term at each time interval, the term energy is calcu-lated using a nutrition formula on its frequency signal. A threshold-based model is used to filter less energeticterms. For the remaining emerging terms, they are used to construct a navigable topic graph based on the cor-relation vectors calculated based on a set of weighted factors. Lastly, topics are retrieved using a graph-basedclustering algorithm. For DeepTrust, these topics can then be filtered, so that only those containing keywordsmentioned in the given financial anomaly are preserved for later reliability assessment.
Another relevant research was proposed by Guille and Farve, a novel Mention-Anomaly-Based Event Detection(MABED) approach that detects both anomalies and their magnitude of impact based on the uploader’s author-ity [51]. For each event, a main bursty term is identified as the event theme, while other terms with similartemporal dynamics are used for describing the event in detail. The key innovation of MABED is its ability todynamically model the bursting time of an anomaly, instead of using a predefined fixed duration. Specifically,the burst interval is determined by formulating a Maximum Contiguous Subsequence Sum (MCSS) problem thataims at maximizing the impact of each word. For each word t ∈ V within ith ∈ [1 : n] time window:
Anomaly(t, i) = N i@t − E[t|i] (2.1)
Magnitude(t, I) = max{b∑
i=a
anomaly(t, i)|1 ≤ a ≤ b ≤ n} (2.2)
where N i@t is the number of times word t is mentioned and E[t|i] is the expected number of tweets containing
word t. By solving this problem in linear-time, each detected event can then be described in three dimensions(i) event theme word (ii) bursting duration I ∈ [a : b] (iii) event impact magnitude Magnitude(t, I), thus offersequity traders with additional insights on the anomaly and its severity based on bursting magnitude.
Topic-Detection and Tracking Limitations
Regardless of the popularity of TDT (i.e., DPP and FPP) approaches in detecting events, several limitations ofDPP are identified in prior research. In [52], experiments revealed that similarity scores are sensitive to noises,thus documents with large similarity scores are not necessarily describing the same event. Besides, as observedin [32], the DPP technique is prone to misclassify tweets if the time span of the anomalous event is lengthy.Lastly, it is difficult to justify an appropriate threshold to decide which event is correlated to incoming datapoints. For instance in [36], a threshold µ is defined to cluster documents across modalities. The document
9

2.3. CORRELATED EVENTS DETECTION Chapter 2. Background
(a) Tweet from Financial Times (b) Tweet from Bloomberg
Figure 2.4: Strongly-related tweets about Suez Canal traffic jam incident posted by Financial Times and Bloomberg,with low similarity score using document-pivot clustering approach
is assigned to the closest matching cluster if the similarity score is greater than µ, or created a new clusterinstead. However, the defined threshold may not be robust enough for handling diverse linguistic styles ofindividuals when describing the same subject. One example is Figure 2.4, both tweets are discussing how theSuez Canal has impacted the world financially, thus can be reasonably concluded as correlated by a humanevaluator. Whereas with DPP, the n-gram similarity distance might be smaller than the defined threshold, thusbe clustered into different events under threshold-based models.
In addition, one critical issue with FPP is its capability in detecting less-trendy events. The FPP relies on burstyfeatures with abnormalities when a trending event is happening, whereas for less attentive events, FPP is likelyto perform poorly in identifying correlated documents. Besides, the fundamental prerequisite of FPP is toobtain knowledge of the frequency pattern of features over time, and for initial documents, there is no priorknowledge available. Therefore, for FPP approaches to support FSD-based TDT tasks, an incremental-basedmodel is necessary.
2.3.2 Event-oriented Text Retrieval (ETR)
Event-oriented Text Retrieval (ETR) is a supervised learning task, using a keyword-based model to locate rele-vant messages based on the user-supplied structured query, represented as a set of keywords. Formally speaking,given a list of n event-specific queries Q = {q1, q2, ..., qn} and m tweets T = {t1, t2, ..., tm}, the objective is toidentify a list of i correlated tweets D = {d1, d2, ..., di} ∈ T that are related to qj ∈ Q. Comparing to TDT,this approach can directly locate relevant tweets from a noisy data stream, but is also challenging to sanitizeuser-supplied input and match them with event representations. For the textual content in each tweet, theusage of abbreviations, typos, cyberspeak and nonstandard expressions create considerable obstacles to matchthe query with the tweet [53]. On the other hand, user-supplied keywords can also be either too general (i.e.,ambiguous) or too specific as a query string, making the event information retrieval process difficult [54].
In general, the ETR process contains three main components: (i) query modeling - using query expansiontechniques to enhance user-specified query (ii) event representation - formalizing and representing tweets bymachine-interpretable knowledge (iii) event retrieval - retrieving and ranking relevant documents [55]. Unlikethe TDT approach that clusters tweets into groups, the ETR process directly identifies correlated tweets of agiven anomalous event.
10
Chapter 2. Background 2.3. CORRELATED EVENTS DETECTION
Query Modeling
The simplest query modeling technique is by aggregating user-specified keywords and contextual information(e.g., geographical information, time period, event description), then retrieving relevant tweets using high-precision strategies [54]. A more dynamic solution is Pseudo Relevance Feedback (PRF) mechanism, which isan iterative query expansion technique that assumes the top γ ranked documents in the initial retrieval resultsare correlated and can be used to expand the original query [56]. The process typically starts with searchingdocuments using the user-specified query, and the system uses the retrieved documents to expand the queryset in order to produce a new query, so to achieve a greater recall. In each iteration, retrieved documents areranked based on the textual score φk, calculated as the cosine distance between the TF-IDF feature vector of thekeyword and each document. The entire PRF process requires no user interactions, commonly denoted as theblind relevance feedback mechanism.
Metzler et al. further incorporate the temporal dimension to the event retrieval process, based on the proposedtemporal query expansion technique [57]. The system firstly filters time intervals when the user-specifiedkeywords are intensely discussed. For each filtered time interval, the system calculates the bursty score for allterms other than the keyword, then identifies similarly trendy terms as correlated keywords, similar to the burstyfeature identification in FPP as proposed by [45]. An aggregated bursty score is also calculated by summarizingthe per-term bursty score over all time intervals. Lastly, the PRF mechanism is applied by expanding the user-specified keywords with the additional trendy terms identified, and reiterate the entire process. A timeline ofcorrelated tweets in response to the user-specified query is returned as the final output.
Tekeuchi et al. proposed a spatio-temporal query expansion technique STT-PRF, by including spatial, temporaland textual information in each iteration of the PRF process [58]. In addition to calculating the traditional text-based similarity score using cosine distance, a normal distribution is firstly used to approximate the spatial andtemporal information of a data point. Bhattacharyya Distance, commonly used to measure the distance betweentwo probability distributions, is then used to estimate the distance between two data points considering all threedimensions.
Event Representation
Event, defined as the objective representation of reality, usually consists of complex features that need struc-turalization and transformation into machine-readable knowledge for downstream applications such as ETR.The goal of event representation is to derive distributed representations of events using word embedding [59],then compare with the user-supplied query for correlation detection.
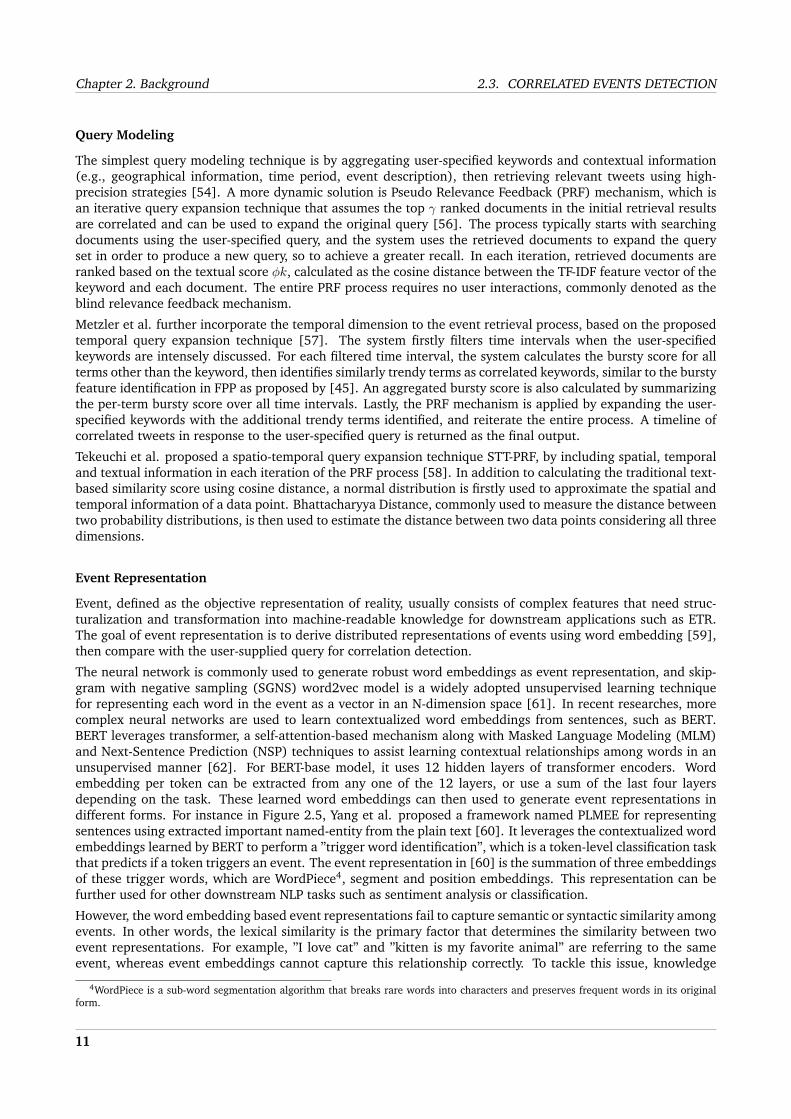
The neural network is commonly used to generate robust word embeddings as event representation, and skip-gram with negative sampling (SGNS) word2vec model is a widely adopted unsupervised learning techniquefor representing each word in the event as a vector in an N-dimension space [61]. In recent researches, morecomplex neural networks are used to learn contextualized word embeddings from sentences, such as BERT.BERT leverages transformer, a self-attention-based mechanism along with Masked Language Modeling (MLM)and Next-Sentence Prediction (NSP) techniques to assist learning contextual relationships among words in anunsupervised manner [62]. For BERT-base model, it uses 12 hidden layers of transformer encoders. Wordembedding per token can be extracted from any one of the 12 layers, or use a sum of the last four layersdepending on the task. These learned word embeddings can then used to generate event representations indifferent forms. For instance in Figure 2.5, Yang et al. proposed a framework named PLMEE for representingsentences using extracted important named-entity from the plain text [60]. It leverages the contextualized wordembeddings learned by BERT to perform a ”trigger word identification”, which is a token-level classification taskthat predicts if a token triggers an event. The event representation in [60] is the summation of three embeddingsof these trigger words, which are WordPiece4, segment and position embeddings. This representation can befurther used for other downstream NLP tasks such as sentiment analysis or classification.
However, the word embedding based event representations fail to capture semantic or syntactic similarity amongevents. In other words, the lexical similarity is the primary factor that determines the similarity between twoevent representations. For example, ”I love cat” and ”kitten is my favorite animal” are referring to the sameevent, whereas event embeddings cannot capture this relationship correctly. To tackle this issue, knowledge
4WordPiece is a sub-word segmentation algorithm that breaks rare words into characters and preserves frequent words in its originalform.
11

2.3. CORRELATED EVENTS DETECTION Chapter 2. Background
Figure 2.5: Pre-trained Language Model based Event Extractor (PLMEE) Architecture. This graph demonstrates trig-gering word identification (i.e., ”killed” and event category classification (Source: [60]).
graph embedding (KGE) was proposed as a low-dimensional representation of an event using directed hetero-geneous multigraph. KGE encodes knowledge and semantics in a graph in which entities (e.g., objects, persons,etc.) are connected via different relations. Based on KGE, Ding et al. proposed a joint embedding modelwhich, in addition to the traditional entity-centric event embeddings, simultaneously encode event participants’intention and emotions into event vectors based on ”why” and ”how” does the actor perform the event [59].This technique was evaluated using the stock market prediction task against baseline methods. The experi-ment results indicate that by adding emotion into the embedding vector, the performance was better than allcompetitive methods, including the previously best-performing knowledge-graph-based event representationapproach [63] by 2.4% in accuracy.
Figure 2.6: Event2Vec-2 Architecture that derives latent representation using multiple modalities from spatial andtemporal dimensions (Source: [64]).
In recent literature, models also incorporate multiple modalities for the rich semantic information in the spatialand temporal dimensions. For instance, Want and Tang proposed the Event2Vec model, which encodes eventsinto a lower dimension for learning the latent representations of event, time and locations simultaneously [64].The best-performing model is Event2Vec-2 as presented in Figure 2.6, which learns the embedding for bothevent and spatial-temporal pair while considering the interaction between spatial and temporal elements. The
12

Chapter 2. Background 2.3. CORRELATED EVENTS DETECTION
multimask self-supervised learning is used along with a feed-forward neural network (FFNN) to learn the em-bedding by naturally leveraging all available information in each document.
Event Retrieval and Ranking
The event retrieval component usually ranks retrieved documents based on their quality or other user-specifiedmetrics. For an ordered document collection, only the top γ documents are selected as the output. Tradition-ally, the ranking technique uses solely the relevancy of documents in determining the document quality. Mostrecent approaches leverage additional dimensions, such as recency, temporal profile and authority to assist inevaluating document relevancy from diverse aspects.To rank documents based on relevancy, Shokouhi proposed the central-rank based collection selection (CRCS)algorithm to rank and determine the top γ documents as the collection D [65]. The relevancy of ith rankeddocument di is R(di) = αexp(−β × i), in which α and β are user-specified constants and di ∈ D. The objectiveis to maximize the collective relevancy R(D) =
∑di∈D R(di) of the top γ retrieved documents’ collection D, by
assigning the optimal rank to each document. CRCS is widely used in later research as a foundation to rankdocuments by relevancy.Recent ranking models incorporate the temporal profile as a factor, which tackles the issue of retrieving irrele-vant documents from the past. For instance, for users interested in knowing why the crude oil prices rose sig-nificantly during March 2021, only information in association with the Suez Canel incident should be retrievedinstead of other possible causes that happened years ago. Campos et al. proposed a time re-ranking algorithmthat adds temporal similarity scores to measure both the topical and temporal relevancy of a document [66].The concept behind this algorithm is trivial, which is the greater the similarity between the document and key-words/dates in the query, the more correlation there is. The relevant dates of a query are identified using ageneric temporal similarity measure named GTE, and in the context of Twitter, the ease to access the temporalmetadata of each tweet makes calculating GTE even more convenient.
Figure 2.7: Event-oriented Neural Ranking Model for News Retrieval (ENRMNR) Architecture with a hierarchicalattention mechanism to evaluate the similarity between the query and event (Source: [67]).
Besides a ranking model, the neural network is an alternative to directly assign weights to retrieved documentsand return the top γ correlated documents. For instance in Figure 2.7, Zhao et al. proposed an event-oriented
13

2.4. RELIABILITY ASSESSMENT Chapter 2. Background
neural ranking model for news retrieval (ENRMNR) that uses a hierarchical attention mechanism to capturethe dynamics and coupling nature of events [67]. It uses three attention layers with different granularity: (i)word-level bidirectional attention layer to compute the similarity between each query keywords and words inthe document (i.e., query-to-passage) (ii) passage-level attention layer using query self-attention and passageinner-words self-attention techniques to grant more weights to important words in queries and documents (iii)document-level attention layer to assign greater weights to relevant documents as a whole. The combinedweights are then used to determine rankings of documents in the retrieval process. Lastly, documents areretrieved using a 3-layers FFNN as defined in the Output Layer, and the similarity score s between the queryrepresentation xq ∈ Q and the document representation yd ∈ D is calculated as follows:
s = wTp p+ bpwhere p = xq � yd (2.3)
Event-oriented Text Retrieval Performance Limitations
Regardless of the effectiveness of ETR in identifying correlated tweets comparing to clustering-based approaches,ETR has several limitations as well. Firstly, the retrieval performance is strongly associated with the popularityof the event category. Since ETR is a keyword-based model, and keywords are identified by the number ofmentions in the time span, event popularity can have a direct impact on ETR performance. As proved in [57],the correlation coefficient between event popularity and retrieval precision on Twitter corpus is 0.63 (p < 0.01)using sole keyword-based approach, and 0.61 (p < 0.01) even with the PRF mechanism deployed. Therefore,for less trendy events, ETR may not be able to retrieve events with high precision.
Secondly, modern variants of PRF mechanism such as STT-PRF demonstrate a significant improvement in termsof recall, whereas the precision also drops considerably compared to the traditional PRF mechanism [58]. Inother words, more related tweets are retrieved by incorporating more modalities, at the expense of a reducedquality on the document collection.
In addition, incorporating intention and semantic vectors into event representation can improve the perfor-mance, whereas a large-scale annotated dataset that covers the financial domain is required [59]. Most com-monsense knowledge dataset such as ATOMIC5 [68] only covers daily-life scenarios like ”drinking coffee” or”break a window”, but lacks coverage on events related to the financial domain. Therefore, if DeepTrust usesmulti-modal event representations, additional efforts are needed to annotate a special dataset consists of theintention and semantic elements of financial-related tweets.
2.4 Reliability Assessment
The goal of reliability assessment is to filter out fabricated or unvalidated information before integrating it intothe trusted knowledge base. Since DeepTrust focuses on evaluating reliability using only textual and behaviorfeatures, other language-independent detection techniques such as diffusion pattern, user-based features willnot be included in the scope. The below sections summarize relevant literature that assesses information relia-bility using various state-of-the-art techniques, with the aim to exclude known fake tweets, neural fake tweets,non-argumentative tweets, and subjective tweets.
2.4.1 Feature-based Credibility Assessment
Tweet features constitute a content representation of itself, which potentially is a useful indicator of credibil-ity. These features can be used as the input of a neural network for classification, as a supervised learningtask. For example, O’Donovan et al. identified textual features (e.g., URLs), behavior features (e.g., @men-tions, retweets) and statistical features (e.g., length of Tweet, number of question marks and emojis) are keyidentifiers that distinguish credible and non-credible posts [69]. Krishnan further refined the feature set intotwo categories, namely user features and content features [70]. For content features, it includes URLs, image,sentiment, length, word count, the usage of exclamation and question marks, and the number of upper caseletters and tags. User features are account-based metadata such as number of posts, retweets, likes, etc.
5ATOMIC covers 877k textual descriptions of everyday commonsense knowledge, aiming to generate an inferential knowledge repositorybased on if-then knowledge.
14

Chapter 2. Background 2.4. RELIABILITY ASSESSMENT
More recent approaches leverage the automatic feature extraction capability of neural network models. Forinstance, Ajao et al. used a hybrid Convolutional Neural Network (CNN) and Long-Short Term Memory (LSTM)system to learn the dependencies among words in fake posts without explicitly stating a list of pre-definedrules [71]. Singhal et al. used the BERT-base model to represent each token in the sequence of text as acontextual embedding (i.e., a feature vector of length 32), and this vector has already captured the underlyingcontextual and semantic association amongst tokens [3]. This embedding, along with visual feature embeddingcollected from VGG-16, is concatenated as the input of another fully connected neural network for classification.
One issue with feature-based reliability assessment is that it requires an expert-annotated dataset for supervisedlearning. For instance, Twitter Media Eval6 and FakeNewsNet7 are two widely adopted datasets used by previousresearches. However, most available datasets are related to politics or natural disaster, and there are limitedresources to create one associated to the financial domain from scratch. Therefore, existing feature-basedassessment techniques can only be used as a complementary reliability assessment tool (e.g., cross-validatingthe credibility of URL against known fake URLs), instead of a conclusive factor of information reliability.
2.4.2 Neural Fake News Verifier
With the success of Pre-trained Language Models (PLMs) in delivering promising results for downstream NLPtasks, these deep neural networks may potentially be leveraged to generate fake information that is indis-tinguishable from an authentic text. To a retail investor that does not possess in-depth financial knowledge,financial disinformation fabricated by the neural network can be abused for malicious intentions. The followingsections discuss forensic techniques for identifying machine-generated text that is fabricated by neural networkswithout a factual basis.
Language Model (LM)
Language modeling is the fundamental principle of natural language generation, and it is a statistical languagemodel that represents a sequence of text by the conditional probability of each word given the context (i.e., allprevious seen words) [72]. For a document D that begins with <start> and ends with <end> special tokens,the probability of generating such document is the product of generating each word xi given the full context:
p(D) =
N∏i=1
p(xi|x1:i−1) (2.4)
The document is terminated whenever the <end> is predicted as the N th word, and the natural languagegeneration process is completed. The objective function of the LM is to maximize the log-likelihood of theconditional probabilities over the sequence of words:
Θ∗ = argmaxΘ
N∑i=1
logP (xi|x1:i−1; Θ) (2.5)
where the parameter set Θ can be learned using different architectures such as LSTM or other RNN-based nerualnetworks.
Giant Language model Test Room (GLTR)
GLTR is a statistical forensic inspection tool that identifies machine-generated fake text by matching the re-viewed text and the text generated by a language model following a similar sampling assumption [73]. Inother words, GLTR tries to use the identical model (e.g., BERT, GPT-2) that is used to generate fake content asthe detector. For GLTR, three main factors are evaluated when concluding the authenticity of the text: For ith
word Xi in the input text and Yi in the GLTR-generated neural text (i) the probability of these two words areidentical given the full context p(Xi = Yi|X1:i−1) (ii) the ranked order of Xi in the predicted word distributionp(Xi|X1:i−1) (iii) the entropy of Yi distribution. For instance, for an input text that each word matches with
6Source: https://github.com/MKLab-ITI/image-verification-corpus/tree/master/mediaeval2016.7Source: https://github.com/KaiDMML/FakeNewsNet.
15

2.4. RELIABILITY ASSESSMENT Chapter 2. Background
the most confident predicted word from using a GPT-2 model, this input text is very likely generated by anotherGPT-2 or a model with similar architecture. GLTR is commonly used as a visualization aid for expert evaluators,and was proved to assist in improving 18% in neural fake text detection rate [73].
However, GLTR is limited by its core assumption that the adversarial model tends to sample words from the top γpredicted words in each iteration. Therefore, GLTR can be easily deceived by adjusting the sampling parameterswith a degree of randomness (e.g., sampling from top 20-50 instead of from top 10 predicted words). Besides,GLTR was proved to be effective in identifying fake text generated by BERT and GPT-2, but the performanceworsens when detecting against other language models. The reason is trivial as GLTR relies on known languagemodels to generate a similar fake text for detection. Therefore, in the context of this project, GLTR can beadopted as supplementary assistance in neural fake text detection, or as a reference to aid other models injudging the reliability.
Generating aRticles by Only Viewing mEtadata Records (GROVER)
GROVER model is an effective system for detecting neural fake news, which converts fake news detectioninto an adversarial game between two players, adversary and verifier [74]. The adversarial model strives tocreate convincing disinformation based on controllable parameters, whereas the verifier model aims to correctlydistinguish generated fake paragraphs from the adversarial model using unlimited authenticated informationfrom trusted sources. This creates an escalating competition between two participants, which eventually yielda pair of strong disinformation generator and verifier.
One novelty of GROVER is its capability of controlled text generation. Most transformer-based language modelssuch as GPT-2 and BERT are proved to generate realistic-looking fabricated content that can even deceive humanexperts [75], but the generated text cannot be restricted into a specified domain by using controllable param-eters [76]. Instead, GROVER models the neural fake news as a joint distribution of p(domain, date, authors,headline, body), and the adversarial player can specify either all five parameters or partially to guide the neuraltext generator conditionally producing fabricated content. Besides, the adversarial can easily adopt enhancingtechniques such as NeuralLogic Decoding [77] to generate fluent realistic-looking text while following complexlexical rules defined by linguistic experts. These techniques can expose the verifier model to more deceivingneural disinformation, thus improve its performance throughout iterations.
Generator SizeDetector 1.5B 335M 124M
GROVER-Base (124M) 71.3 79.4 90.0BERT-Base (110M) 67.2 75.0 82.0GPT-2 (124M) 67.7 73.2 81.8
Table 2.1: Comparison between detectors (BERT-base, GPT-2, and GROVER-Base) versus GROVER generators withunpaired settings across different architecture sizes. GROVER has achieved the best 90% accuracy in identifying neuralfake news from its paired adversarial model (Source: [74])
The performance of GROVER detector is evaluated against two competitors with similar architecture size, BERT-base, and GPT-2 124M. The experiment is conducted under an unpaired setting, in which the verifier modelneeds to distinguish human-written or machine-generated text independently without additional referencingmaterials. The experiment results are presented in Table 2.1, and is clear that GROVER-base outperforms othermodels significantly across all GROVER’s generations.
GROVER is not only effective in identifying fake text generated by its paired adversarial model, but also achievedan excellent performance against other models. This is because of the limitation of the predicted word samplingmechanism, which is also a common weakness for all natural language generation systems. Human speech is acombination of both anticipated and unexpected sequences of words, which introduces certain randomness thatcannot be modeled by a probability distribution. Whereas for language models, each word is predicted basedon the contextual information and probability distribution, which is a finite set of candidate words. Therefore,GROVER essentially leverages this weakness of text generation systems, and identity the unique pattern ofneural-generated text that is unlikely to be seen in a human-written text.
16
Chapter 2. Background 2.4. RELIABILITY ASSESSMENT
Generative Pre-trained Transformer (GPT)
Generative Pre-trained Transformer (GPT) is an autoregressive language model trained by OpenAI, and GPT-2is the second version in GPT generations that is pre-trained on a massive corpus of web-based English resourcesusing self-supervised learning [75]. The training process uses the MLM technique to predict masked words,similar to the mechanism discussed in Section 2.4.2. The WebText8 dataset is used to train the GPT-2, and themodel can learn the linguistic patterns of the English language represented by low-dimension vectors. GPT-2 isspecialized in generating compelling content from a given prompt, which usually is the topic sentence or theheadline that the user wants the model to emphasize.
Detector Amazon Yelp Overall
GLTR 40.9% 35.9% 38.5%GPT-2D 20.9% 25.8% 23.5%GROVER 43.6% 36.9% 40.7%
GLTR+GROVER 35.3% 34.6% 34.9%GPT-2D+GROVER 24.9% 22.2% 23.4%GLTR+GPT-2D 25.0% 19.6% 22.5%GROVER+GLTR+GPT-2D 25.0% 19.6% 22.5%
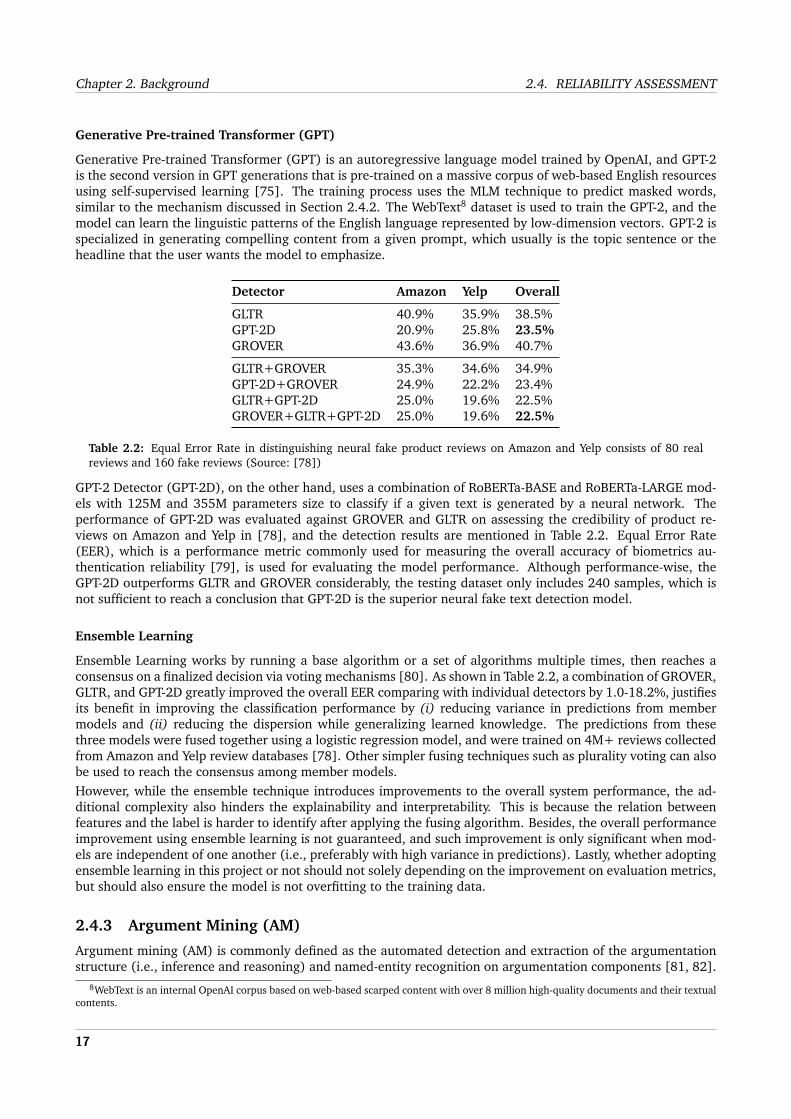
Table 2.2: Equal Error Rate in distinguishing neural fake product reviews on Amazon and Yelp consists of 80 realreviews and 160 fake reviews (Source: [78])
GPT-2 Detector (GPT-2D), on the other hand, uses a combination of RoBERTa-BASE and RoBERTa-LARGE mod-els with 125M and 355M parameters size to classify if a given text is generated by a neural network. Theperformance of GPT-2D was evaluated against GROVER and GLTR on assessing the credibility of product re-views on Amazon and Yelp in [78], and the detection results are mentioned in Table 2.2. Equal Error Rate(EER), which is a performance metric commonly used for measuring the overall accuracy of biometrics au-thentication reliability [79], is used for evaluating the model performance. Although performance-wise, theGPT-2D outperforms GLTR and GROVER considerably, the testing dataset only includes 240 samples, which isnot sufficient to reach a conclusion that GPT-2D is the superior neural fake text detection model.
Ensemble Learning
Ensemble Learning works by running a base algorithm or a set of algorithms multiple times, then reaches aconsensus on a finalized decision via voting mechanisms [80]. As shown in Table 2.2, a combination of GROVER,GLTR, and GPT-2D greatly improved the overall EER comparing with individual detectors by 1.0-18.2%, justifiesits benefit in improving the classification performance by (i) reducing variance in predictions from membermodels and (ii) reducing the dispersion while generalizing learned knowledge. The predictions from thesethree models were fused together using a logistic regression model, and were trained on 4M+ reviews collectedfrom Amazon and Yelp review databases [78]. Other simpler fusing techniques such as plurality voting can alsobe used to reach the consensus among member models.However, while the ensemble technique introduces improvements to the overall system performance, the ad-ditional complexity also hinders the explainability and interpretability. This is because the relation betweenfeatures and the label is harder to identify after applying the fusing algorithm. Besides, the overall performanceimprovement using ensemble learning is not guaranteed, and such improvement is only significant when mod-els are independent of one another (i.e., preferably with high variance in predictions). Lastly, whether adoptingensemble learning in this project or not should not solely depending on the improvement on evaluation metrics,but should also ensure the model is not overfitting to the training data.
2.4.3 Argument Mining (AM)
Argument mining (AM) is commonly defined as the automated detection and extraction of the argumentationstructure (i.e., inference and reasoning) and named-entity recognition on argumentation components [81, 82].
8WebText is an internal OpenAI corpus based on web-based scarped content with over 8 million high-quality documents and their textualcontents.
17

2.4. RELIABILITY ASSESSMENT Chapter 2. Background
Traditionally, an argumentation structure consists of six elements as proposed by Toulmin [83], namely claim,qualifier, grounds, rebuttal, warrant, and backing9. The following sections provide an overview of AM in thecontext of Twitter, and discuss some insights in incorporating AM to assess information reliability.
Overview of Twitter-specific Argumentation Structure
Twitter ID Tweet Content
Bloomberg@business #Bitcoin declined for the sixth time in seven days, extendinglosses after President Biden was said to propose almost doublingthe capital-gains tax for the wealthy
The Wolf Of All Streets@scottmelker #Bitcoin daily RSI has not hit oversold at 30 since March of 2020when the market crashed. It is currently about 32, the lowest it’sbeen since that day. Would love to hit oversold again and be donewith it.
Altcoin Daily@AltcoinDailyio #Bitcoin is doing great. 100k is inevitable. HODL!
Mira Christanto@asiahodl #Bitcoin is down -23% from the $65,000 peak. Let’s put that intocontext where the average dip was -35% in 2017 This is all part ofthe plan https://bitcoininsider.org/article/101910/...
Table 2.3: Various forms of Twitter-specific argumentation in relation to the trending topic #Bitcoin on 23 April, 2021,right after a drastic Bitcoin price correction over the weekend.
Twitter as a microblogging service provider, impose strict character-limit restriction on the tweet, which causescomplex argumentation structure cannot be formulated appropriately in the majority of tweets. Therefore,recent researches with a focus on simplifying AM formulation into two components: claim and evidence, wherethe evidence can be either supporting or contradicting [84]. Besides, the form of Twitter-specific argumentationcan varies drastically, as demonstrated in Table 2.310111213. The first tweet from Bloomberg consists of a clearclaim-evidence structure, with a verifiable factual basis ”doubling the capital-gains tax for the wealthy” to supportits assertion. A similar strategy is adopted by the second tweet, which is also an author in authority (i.e., witha large audience base and a certain degree of credibility). However, the vast majority of tweets published bycivilians are similar to the latter two examples. For instance, the third tweet is sarcastic, and yet still followsa claim-evidence structure14, makes AM even more challenging. The last tweet is a typical argumentationstructure in which the evidence is included as external links. The validity of these URLs is not trivial, andexamining them will significantly increase the complexity of AM. Therefore, it is essential to acknowledgethe peculiarities existing in Twitter-specific argumentation structure, and adjust the AM technique to handleinformation retrieved from user-generated data.
Argument Detection
The first step of argument detection is to define the source of arguments. In prior research, many differentdefinitions arose without a finalized standard. For instance, Bosc et al. stated that argumentation, or a claimtowards a certain topic, should primarily present in the format of independent tweets [85]. Other researchers,such as Schaefer and Stede, argued that replying tweets should also be evaluated alongside the main tweet forargument and relation detection [86]. However, using both independent and replying tweets in discourse asthe source of argumentation introduces significant complexity to the AM system, as the argument potentiallyconsists of rebuttal and elements other than a simplified claim-evidence structure. Therefore, as a compromise
9Claim is the key argument of a topic, or the assertion made by the author. Qualifier adds exceptions which the claim may not hold.Grounds is the factual basis of the claim, if available. Rebuttal refers to alternative views on the claim, which usually are disagreements.Warrant and Backing are additional hypotheses associated with the Grounds that might hinder the reliability of the original claim.
10Tweet from Bloomberg@business: https://twitter.com/business/status/1385375837055246336.11Tweet from The Wolf Of All Streets@scottmelker: https://twitter.com/scottmelker/status/1385416836683116544.12Tweet from Altcoin Daily@AltcoinDailyio: https://twitter.com/AltcoinDailyio/status/1385411871692365831.13Tweet from Mira Christanto@asiahodl: https://twitter.com/asiahodl/status/1385425967913472005.14The claim is ”100k is inevitable” and its supporting evidence is ”Bitcoin is doing great”, though the evidence is unverified.
18

Chapter 2. Background 2.4. RELIABILITY ASSESSMENT
to the complexity, the present project only focuses on using independent tweets as the sole source of argumen-tation.
With a defined source of information, the argument detection aims to classify tweets into argumentative or non-argumentative based on a list of criteria such as claim-evidence structure discussed in Section 2.4.3. Specifically,the most commonly adopted standard is defined in DART15. A tweet is argumentative if (i) contains explicitlyexpressed opinionated statements (ii) contains rhetorical questions or claims in the form of questions (iii)contains a claim-evidence pair regardless of the validity of the evidence. This standard was further clarifiedin [87], by dividing argumentative tweets into two categories, namely factual and opinion. In the context ofDeepTrust, only factual tweets are considered as reliable financial knowledge that can be incorporated into theRefinitiv knowledge base, while opinionated tweets are further evaluated using subjectivity analysis techniquesmentioned in Section 2.4.4.
Argument detection is usually defined as a binary classification task, to identify the presence of argumentationstructure. For instance, Addawood and Masooda trained an SVM model to classify tweets based on lexical (i.e.,n-grams), statistical (e.g., part-of-speech POS percentages) and Twitter-specific features (e.g., URLs, hashtags,emojis) [88]. Later, Dasmanu et al. further incorporated syntactic and semantic features to train a logisticregression model, which yielded the best score on the DART dataset with 0.89 F1 score [87]. An alternativeapproach was used in [86], which leveraged XGBoost16 model to classify tweets using the pre-trained BERTembeddings.
Although mainstream AM models use supervised learning to achieve a better performance, it requires an expertannotated dataset with identified argument structure and relation. In the absence of an annotated dataset forfinancial-related tweets, the unsupervised AM technique proposed by Persing and Ng [90] might be inspira-tional. The core idea is to automatically identify and weakly label argument components using both linguisticfeatures and heuristics, and use self-training to improve the performance with unlabelled data. However, thismethod relies on a well-defined document structure to heuristically identify major claims and argumentativecomponents, such as the premise of ”The major claim is assumed to appear only in the first and last paragraph,as these are typical places for a thesis statement” for an essay. These assumptions do not apply to tweets, thus theeffectiveness of this approach is questionable when applying to DeepTrust.
Evidence Detection and Validation
Evidence detection aims to identify associated evidence of a claim, while the evidence can either be validatedagainst a factual basis or invalidated. The source of evidence also varies, for instance, News, Blogs, Newspaper,Magazines as used in [87, 88]. To detect evidence, the simplest approach is to train a multi-class classifier suchas SVM using an annotated dataset on evidence types. However, a rule-based evidence detection system yieldssimilar performance without needing an annotated dataset. For example, a string matching system that detectsif known trusted Twitter users or news agencies (e.g., Bloomberg@business, CNN@cnn) exist in a tweet canbe used to infer tweet reliability, in which such tweet is likely to be a reported speech from authorized parties.Besides, named-entity recognition (NER), which identifies and classifies mentions of entities into predefinedcategories (e.g., news agencies, persons), can be used along with knowledge bases like DBpedia17 and RefinitivEikon to validate the evidence. Models such as Bidirectional LSTM (Bi-LSTM) were proved effective in TwitterNER tasks by training on both word-based embeddings and orthographic features18 [91], and DBpedia containsadequate structured information that covers the financial domain for evidence validation.
Nevertheless, the effectiveness of evidence validation relies on certain assumptions. Firstly, both reported speechfrom news agencies in authority and argumentative tweets with trusted named entities are assumed to bereliable, whereas this chain of trust is easily exploitable. For instance, a malicious player can add ”CNN stated:”in each fake tweet so to bypass the evidence validation system. To tackle this issue, one solution is to applythe ETR technique on the mentioned entity, such as CNN’s recent posts, then evaluate if the reported speech isauthenticated or not. However, drastic increase in time complexity is the trade-off for this enhanced validationscheme, and for DeepTrust, to hypothetically assume most Twitter users are decent by nature is a compromisemade to the efficiency.
15DART refers to Dataset of Arguments and their Relations on Twitter annotated by Bosc et al. [85].16eXtreme Gradient Boosting (XGBoost) is an ensemble learning algorithm based on a gradient boosting framework [89].17DBpedia is data catalog of extracted structured information from Wikipedia https://www.dbpedia.org/.18Orthographic features refer to norms of linguistic styles, such as ”1st Game has END!!” can be represented as ”ncc Cccc ccc CCCpp”.
19

2.4. RELIABILITY ASSESSMENT Chapter 2. Background
2.4.4 Subjectivity Analysis (SA)
Subjectivity analysis (SA) quantifies the degree of subjectivity, expressed in personal opinion or claims withoutfactual evidence. SA can be a binary classification task by distinguishing subjective and objective tweets, orcan also be a regression task, which assigns a per-tweet subjectivity score and uses a threshold-based model toevaluate the intensity of subjectivity and decide if the tweet is subjective. The following sections review variousSA techniques experimented in literature, and evaluates their suitability for Twitter.
Syntax-based Subjectivity Analysis
Syntax-based patterns can be an effective indicator of subjectivity, as subjective text often contains identifiablelinguistic features expressed in the way of using different combinations of phrases. For instance, Xuan et al.investigated and extracted 22 syntax-based patterns including adjectives, adverbs, verbs, and nouns. Thesepatterns were used as the input feature for classifying subjective movie reviews, achieved a 92.1% accuracyalong with a Maximum Entropy Model [15]. For each tweet, the Stanford Parser19 is used to extract linguisticfeatures from the raw textual content, such as (ROOT (S (NP (PRP)) (VP (VBP) (SBAR (S (NP (NNP)) (VP (VBZ)(NP (DT) (JJS)))))))) for the phrase ”I believe Bitcoin is the best”.
In the context of Twitter, the main challenge is the colloquial languages and Twitter-specific elements [91],making syntactic-based SA less effective comparing to lexicon-based and semantic-based approaches. For in-stance, users often make grammatical mistakes or include misspell words in the tweet, which can confuse thesyntax-based classifier in reaching an accurate decision on the text subjectivity. Besides, Twitter users often notfollowing proper grammatical rules due to the character-limit constraint, thus subjective syntax patterns learnedfrom other mediums such as newspapers or blogs cannot be directly reused for SA on Twitter.
Lexicon-based Subjectivity Analysis
Lexicon-based SA is an effective approach for evaluating subjectivity in tweets, as it not relying on a structuredsyntactic pattern. Instead, it leverages word-based or n-grams subjectivity, along with contextual information toestimate a score for each token. The sentence-level subjectivity score can then be calculated either using sum-mation or averaging techniques. One application is TextBlob20, which provides a subjectivity lexicon for Englishadjectives. Each adjective may contains multiple entries for each unique ”Sense” (Context) and ”POS tags”. Forexample, the word ”entire” can either means ”constituting the full quantity or extent” with 1.0 subjectivity scoreor ”(of leaves or petals) having a smooth edge” with a score of 0.0. Besides, the POS tag can be used to infer thesubjectivity tagging. One possible rule proposed by Riloff et al. is that objective sentences usually consist of in-terjections or adjectives, whereas verbs and pronouns are more common in subjective sentences [92]. Anothersubjectivity lexicon is MPQA21, which also consists of a database of pre-trained subjectivity score for tokens.When evaluating tweets, each document is assigned with a cumulative sum of subjectivity scores of tokens itcomprises, and each token has a weighted MPQA score adjusted for its polarity and intensity, similar to themechanism in TextBlob.
Besides pre-trained subjectivity score, statistical information on tokens can indicate the degree of subjectiv-ity. For instance, Hatzivassiloglou and Wiebe identified that the presence of dynamic adjectives, semantically-oriented adjectives, and gradable adjectives are statistically correlated with subjectivity [93], while Dey et al.improved such subjective indicators by incorporating the knowledge in Wordnet and SemEval 2016 stance de-tection dataset. The concept behind this improvement is that instead of focusing on the POS tag of tokens inthe document, all associated POS tags of a given token defined in Wordnet are examined to check if it has anentry as an adjective. This essentially transforms a pure lexicon-based SA to a combination of lexicon-basedand syntactic-based SA technique, and reduces the inconsistencies and lack of accuracy of lexicon-based SA asproved in [94].
However, lexicon-based SA suffers from various limitations. Firstly, the threshold on cumulative subjectivityscore should provide flexibility for different scenarios, especially for special subjective contents such as irony,which generates additional complexity to SA as evident in [95]. For example, a subjective sentence can be an
19Stanford Parser is probabilistic-based NLP tool to generate parse trees: http://nlp.stanford.edu:8080/parser/.20TextBlob is a Python library that provides NLP tools to process textual data: https://textblob.readthedocs.io/en/dev/.21Multi-Perspective Question Answering (MPQA) is a part of OpinionFinder that defines lexicon-based subjectivity clues: https://mpqa.
cs.pitt.edu/lexicons/subj_lexicon/.
20

Chapter 2. Background 2.4. RELIABILITY ASSESSMENT
objective statement with a rhetorical question at the end, like ”The CNN stated that the Suez Canal incident isover...is it?”, in which a lexicon-based SA model cannot capture the subjective nature of this statement if usinga simple threshold-based rule. Besides, traditional lexicon-based SA models are limited by the scope of theirknowledge source, as they only learn information via text representation models such as Bag-of-Words (BOW)or Word2Vec. Whereas Twitter metadata (e.g., Hashtags, Likes, Replies, Mentions), commonly denoted as struc-tured information, contains a considerable amount of additional resources that can be used as reinforcementto the SA model. For instance, Barbosa and Junlan used structured information and statistical information toassess subjectivity [96]. Five prominent features were exploited for subjectivity classification, namely the num-ber of verbs, URLs and upper-case, positive polarity, and prior subjectivity scores22. For instance, the sentence”@Tesla’s $1.5bn Bitcoin holding could influence other corporations seeking to diversify their investments. Couldthis be what makes enterprise #DLT a reality? https://buff.ly/...” is a typical objective tweet that contains theaforementioned features. The most recent research is from Sixto et al., which combined both lexical featuresand structured information to train a classifier for SA [98]. A stacked generalization ensemble model with fivedifferent classifiers yielded the best result on the TASS Spanish SA dataset with 89.80% accuracy, and eachclassifier is trained using both meta-information and Bag-of-Words (BOW) representations. These experimentsconcluded that combine multiple sources of knowledge, such as contextual information (e.g., tweet metadata)and statistical information (e.g., number of dynamic adjectives) can benefit lexicon-based SA models in classi-fying subjectivity in greater accuracy.
Pre-trained LM Subjectivity Analysis
Inspired by the capability of pre-trained models such as BERT and GPT-2, SA as a downstream NLP task canalso be solved using these models with some fine-tuning. For instance, Huo and Iwaihara experimented withpre-trained BERT in SA tasks, with a customized LSTM classifier, layer-wise discriminative learning rate, andmulti-task learning, which has proved its effectiveness in SA with 95.23% accuracy on SUBJ23 dataset [100].
However, as BERT was trained on general corpora like Wikipedia and BookCorpus, the performance is poorwhen re-applying the BERT-base model to a specific domain. Hence, BERT-based domain-specific models suchas BioBERT and SciBERT were proposed to counter this limitation. Domain-specific models can either be contin-ually pre-trained by initialized with BERT-base weights, or pre-trained from scratch using a specialized dataset.For Twitter, Nguyen et al. proposed BERTweet, a large-scale pre-trained language model trained using 850MEnglish Tweets [101]. BERTweets was originally designed to perform three downstream NLP tasks, namelyPOS tagging, NER, and sentiment classification, while its learned embedding can be leveraged for other taskssuch as subjectivity analysis. Another enhanced model TweetBERTv2 was proposed by Qudar and Mago, whichwas continually trained using 10.1B Twitter word tokens in addition to the general corpora [102]. Similarto BERTweets, this model was trained for various text analytics tasks, including sentiment analysis, questionanswering, NLP inferences, and paraphrase. However, to leverage BERTweets and TweetBERTv2 for SA work-loads, an annotated SA dataset on tweets is required to fine-tune the model for this additional task. Althoughavailable datasets such as SUBJ are great sources for training, these datasets contain general topics extractedfrom information platforms other than Twitter, thus might be ineffective when used for SA tasks on financialtweets from Twitter.
22Prior Subjectivity means the subjectivity score of the word preceding the target word, and a comprehensive collection of subjectivitylexicon can be found in [97].
23SUBJ contains 5,000 subjective and objective sentences extracted from IMDB movie reviews annotated by [99].
21

CHAPTER 3
DeepTrust Framework
3.1 Overview of DeepTrust Framework
Figure 3.1: The schematic diagram of the reliable financial knowledge retrieval framework DeepTrust.
DeepTrust is a framework for retrieving reliable financial information from the Twitter data stream, whichaims at discovering explanatory knowledge regarding an anomalous financial event faster than traditional newsagencies. The overview of DeepTrust and its components is shown in Figure 3.1. It consists of three modulesthat are executed in a sequential order to ensure information reliability.
The anomaly detection module defines the origin of an unusual event, typically represented by an anomalouspricing movement in the market. The cause of such a financial anomaly should not be trivial. For instance,a small fluctuation in price (e.g., ±5%) after releasing a quarterly financial statement is considered trivial,whereas a large-scale stock price correction that appeared without basis is the type of event DeepTrust aims toexplain using non-standard data sources. The financial anomaly can either be a spike (i.e., a sudden rise inprice followed by another large crash) or a change point (i.e., a persistent pricing movement trend). To identifya pricing anomaly, either a financial expert with solid domain knowledge or a time-series anomaly detectionalgorithm can fulfill the requirement. For DeepTrust, various AD algorithms are applied and compared for theireffectiveness in recognizing contextual anomalies, and more details are discussed in Section 3.2.
The information retrieval module defines the source of knowledge, which can be extremely noisy comparedto traditional implicitly trusted data sources like newspapers. The financial anomaly identified in the previousmodule is typically described in plain text, which mentions the targeted entity ”Twitter Inc. TWTR” and date”30 April 2021”. To construct the initial search query, various query modeling techniques are employed toinitialize a list of keywords and search parameters for information retrieval. Besides, information from relevantnews articles or other documents from the Refinitiv knowledge base is used to enhance the query. In particular,these trusted knowledge are analyzed using Refinitiv Intelligent Tagging API to identify relevant keywords thatexhibit a similar temporal pattern as the original keywords, and then integrated into the query for information
22

Chapter 3. DeepTrust Framework 3.2. ANOMALY DETECTION MODULE
retrieval. The pseudo-relevance feedback mechanism is used to iteratively improve the retrieval performanceby including dynamic keywords into the search query, and more details are discussed in Section 3.3.
The reliability assessment is the core module of DeepTrust, to screen unreliabile information from the Twitterdata stream and preserve only trusted knowledge related to the financial anomaly. Retrieved documents fromthe information retrieval module are analyzed and screened using various NLP techniques, including (i) feature-based filter that leverages textual, tweet-meta and author features to infer reliability (ii) neural fake text detectorthat identifies if a given text is fabricated content generated by a neural network (iii) argumentation filterthat removes non-argumentative tweets that lack a valid argumentation structure (iv) subjectivity filter thatanalyzes opinionated tweets on its reliability to be considered as trusted information. All these modules workcollaboratively to exclude unreliabile information from entering the trusted knowledge base. More details arediscussed in Section 3.4.
3.2 Anomaly Detection module
The AD module in DeepTrust focuses on detecting equity pricing anomalies, particularly on famous or trendingstocks that their management teams are proactively communicating with the public on social networking ser-vices such as Elon Musk from Tesla Inc. and Jack Dorsey from Twitter Inc. Section 3.2.1 outlines mainstreambenchmark theories for financial analysts to reference when detecting equity pricing anomalies using empiri-cal analysis, while Section 3.2.2 and Section 3.2.3 presents three AD algorithms implemented in DeepTrust toidentify anomalies using univariate or multivariate analysis.
3.2.1 Anomaly Detection using Empirical Analysis and Benchmark Theory
For empirical analysis, detecting equity pricing anomalies is equivalent to test the null hypothesis, which is theefficient market hypothesis discussed in Section 2.2. In other words, the equity market should (i) consistentlyoperate as an informationally efficient market and (ii) the fair value of equities is expressed by an equilibriummodel based on economic theories. If the null hypothesis is rejected, the cause can be either an abnormal pricemovement that is not predicted by cross-sectional analysis or time-series analysis using benchmark theories,or an incompatible equilibrium model is used to derive the fair value. Since 1972, Blume and Husic havestarted to establish a standard benchmark theory on modeling stock prices using previous rates of returns [103],while in later researches, hundreds of different return predictors are proposed using different return generatingfunctions such as payout yield or tail risk beta. Nevertheless, there is no standardized formulation on the returngenerating function, hence the equity pricing AD is inherently subjective by its choice of underlying benchmarktheory. For DeepTrust, one of the sources of curated anomaly list is domain experts. These specialists possesssolid understandings of both the company itself and different pricing models, which are key factors of AD usingempirical analysis. As introductory information, some most commonly acknowledged benchmark theories aredescribed in the following paragraphs as examples, and can be adopted by financial experts to empirically detectequity pricing anomalies.
The cross-sectional analysis is a comparison-based method to match a target company with its competitors orpeers with similar positioning. The representative benchmark theory in this category is Cross-Sectional ReturnPatterns (CSRP), which is based on the well-known Capital Asset Pricing Model (CAPM). In general, CSRPassumes the security return should conform to a linear relation with its non-diversifiable risk (i.e., beta β) andother security-specific characteristics. Formally, the expected return Ri of security i in the market portfolio thatconsists of all marketable securities is
Ri = a0 + a1βi +∑
ajcij + ei (3.1)
where a0 and a1 are constant coefficients, βi is systematic risks that measure covariance with the market, cijare all security-specific attributes such as accounting-based measures, and ei is the risk-free return. However,security-specific attributes cannot holistically represent a company, thus ineffective in cross-sectional analysis.For instance, market sentiment and intangible fundamental factors like the quality of management teams areexamples of intangible factors. These potential equity price driven forces are not captured by any attributethat can be quantified in the CAPM model. Besides, cross-sectional analysis is effective in identifying point
23

3.2. ANOMALY DETECTION MODULE Chapter 3. DeepTrust Framework
anomalies (e.g., an unusual operational cost on balance sheet comparing to the financial report of peers) insteadof contextual anomalies that DeepTrust is focused on.
Meanwhile, time-series analysis is another solution of equity price forecasting and AD by extracting meaningfulinformation from the time-series data. Typically, the expected return is governed by time-varying factors that areinfluenced by previous returns or seasonal milestones. For instance, the momentum of prior semiannual pricemovements can have explanatory power in the subsequent quarterly pricing trajectory, and evidence shownthat trading strategies that leverage the momentum power can yield greater profits than the baseline tradingstrategy [104]. However, though stocks may be seasonal with cyclical demands (e.g., sunscreen companiesmay face drastically different demands in different seasons), the majority of companies are time-independent,especially in the long run. Therefore, the equity price should still fairly represents the overall productivity of itscompany regardless of market timing, and time-series analysis that captures the momentum or trend of pricemovements may work effectively in the short-term, but less reliable for long-term equity pricing AD.
Overall, throughout observations, equity price movement is constantly changing in an unpredictable manner,and defying economic interpretations and benchmark theories. Hence, there is no consensus on a standard-ized paradigm to precisely model the expected returns in the future. Nevertheless, well-established pricingparadigms can still help predicting the expected return with greater probability than tossing a coin, allow de-tecting anomalous stock prices when it deviates from its normal expectation. The aforementioned models ormore complex benchmark theories can, therefore, be adopted by financial data providers as referencing tools ofAD, and generate a list of equity pricing anomalies accordingly.
3.2.2 Univariate Anomaly Detection using ARIMA model
For unsupervised AD on equity pricing data, one novel approach adopted in DeepTrust is via time-series fore-casting. Anomalies are detected by measuring the difference between the actual price and the predicted price.Detailed methodology and parameter tuning strategies are described in following paragraphs.
For time series forecasting in econometrics, the first step is to model the equity pricing data into a univariatetime series. Formally speaking, a univariate time series is a collection of observations recorded sequentiallywith a constant interval (e.g., stock prices with intervals of ticks, minutes, or longer periods), and analysis onunivariate time series involves only a single variable. For the equity pricing data, the sole independent variableinvolved is the timestamp, and the assumption made is that the equity price can be formulated as a functionof time. In DeepTrust, the AutoRegressive Integrated Moving Average (ARIMA) model is used to perform time-series forecasting on equity prices, and detect price anomalies by measuring the degree of deviation of the actualprice from the expected price. Mathematically, the ARIMA(p, d, q) models the expected value Yt at time t as
Yt = µ+ α1Yt−1 + α2Yt−2 + ...+ αpYt−p + εt + β1εt−1 + β2εt−2 + ...+ βqεt−q (3.2)
where µ is the average value, α and β are correlation coefficients and ε is an independent and identicallydistributed random variable from N (µ, σ2) functioned as an error term of the forecast. The ARIMA(p, d, q) isgoverned by three parameters, namely p and q for the order of autoregressive and moving average process,respectively, and d for the degree of differentiation. Specifically, p and q are equivalent to sliding windows thatdefine the number of past values that are influential to the current value, whereas parameter d is only neededfor non-stationary data with a varying mean, variance, and auto-correlation. To determine the stationarity oftime series data, the Augmented Dickey-Fuller (ADF) is used to test the null hypothesis of non-stationarity.Mathematically, a stationary time-series should have γ 6= 0 in
∆Yt = Yt − Yt−1 = α+ βt+ γYt−1 + δ1∆Yt−1 + δ2∆Yt−2 + ...δp∆Yt−p (3.3)
so to reject the null hypothesis, and the result should be statistically significant with p < 0.05. The benefitof stationary time series data is that its easier to model as its statistical characteristics are time-independent,and seasonality and trend do not affect the value at different observation times. In DeepTrust, each equity isevaluated individually using the ADF test for its stationarity, then decide if differencing (i.e., the parameterd 6= 0) is required.
In order to obtain the best parameter set of ARIMA(p, d, q) for each equity, an efficient stepwise grid searchstrategy proposed in [105] is applied. The objective is to minimize Akaike Information Criterion (AIC), which
24

Chapter 3. DeepTrust Framework 3.2. ANOMALY DETECTION MODULE
equals toAIC = −2log(L) + 2(p+ q + k + 1) (3.4)
where L is the log-likelihood estimate and k is a binary variable correlated to model coefficients. In DeepTrust,the fine-tuned ARIMA model with minimum AIC of each equity is serialized into a pickle object and saved as afile, in which the model is trained using all historical pricing data extracted from publically available stock dataAPIs like Yahoo Finance and Alpha Vantage.
To detect equity price anomalies, the find-tune ARIMA model is utilized to iteratively predict data within a user-specified time period using prior observations. When generating rolling statistics with a window size of n, theinitial n − 1 observations do not have any rolling statistics, as the first n observations are all used to calculatethe initial rolling statistics starts from the nth observation. Therefore, the user-specified time is automaticallyadjusted to include the previous n−1 stock prices for rolling statistics. In addition, as generating a rolling meanand standard deviation over the entire time period since Initial Public Offering is time-consuming, it is suggestedthat the user should specify a smaller time interval using domain knowledge. When comparing the actual valueagainst the predicted value, observations that defy the expected price movements concluded by the ARIMAmodel are recorded and quantified by its degree of deviation. At each time t, the predicted price Y
′
t and actualprice Yt are used to compute the error term, denoted as anomalous severity. A rolling standard deviation with auser-specific time window is used to quantify the degree of deviation in terms of σ2
t . Each error term is taggedwith a severity category in 6 levels, by the degree of 1.5, 1.75 and 2 standard deviations of errors in positive ornegative scale. For DeepTrust, a confidence interval of ±2σ2 with 95% certainty is used to establish a boundarybetween normal and abnormal prices, while anomalies and anomalous severity are assigned accordingly basedon its distance to the confidence interval.
3.2.3 Multivariate Anomaly Detection using Unsupervised Learning Algorithms
Since univariate AD algorithms do not capture interactions between different security-specific attributes suchas equity price and trade volume per timestamp, while the inter-relationship among different variables mightbrings additional insights in understanding the nature of price movements, DeepTrust incorporates multivariateAD algorithms as an alternative solution. Based on evaluations in Section 2.2, LOF and Isolation Forest areselected for their effectiveness in identifying contextual anomalies.
Firstly, LOF is a density-based unsupervised AD algorithm that can be applied on time series data, and it detectsanomalies by comparing Local Reachability Density (LRD) between the point and its k neighbors, as specifiedby users. Mathematically, For each point A that has K neighbors Xj in collection K(A), the LOF is calculatedas a ratio of the average LRD of k-neighbors to the LRD value of point A:
LRDk(A) =1∑
Xj∈K(A)max(K−d(A,Xj),d(A,Xj))
‖K(A)‖
(3.5)
LOFk(A) =
∑Xj∈K(A) LRDk(Xj)
‖K(A)‖× 1
LRDk(A)(3.6)
where the metric of distance function d(A,Xj) is selected based on empirical researches, such as the traditionalEuclidean distance or recently proposed Maximum shifting correlation distance (MSCD) in [106]. For eachpoint, three correlated variables are used to define the coordinate, namely timestamp, equity price and tradevolume. K nearest neighbors are automatically selected using either the Ball Tree, KD Tree, or brute forcealgorithms by partitioning points into different spatial clusters in the feature space.
To identify anomalies using LOF, expected data points are firstly defined using average LRD value, and anomaliesare identified as points that defy the expectation. The intuition in density-based AD algorithms is that theaverage density (i.e., LRD value for LOF algorithm) of the cluster consists of K neighbors should be similar tothe density of a given point. In other words, a normal equity price should have a LOF value closer to 1, vice versa.The LOF value can also rank the severity of anomalies, similar to the one in ARIMA approach as mentioned inSection 3.2.2. In addition, as LOF detects anomalies by evaluating points locally against its neighbors insteadof on a global scale, this approach is effective in identifying contextual anomalies by definition.
Unlike LOF that profiles normal behaviors, Isolation Forest identifies anomalies explicitly using a spatial partitionscheme. The intuition behind Isolation Forest is that anomalies tend to scatter sparsely across the feature space,
25
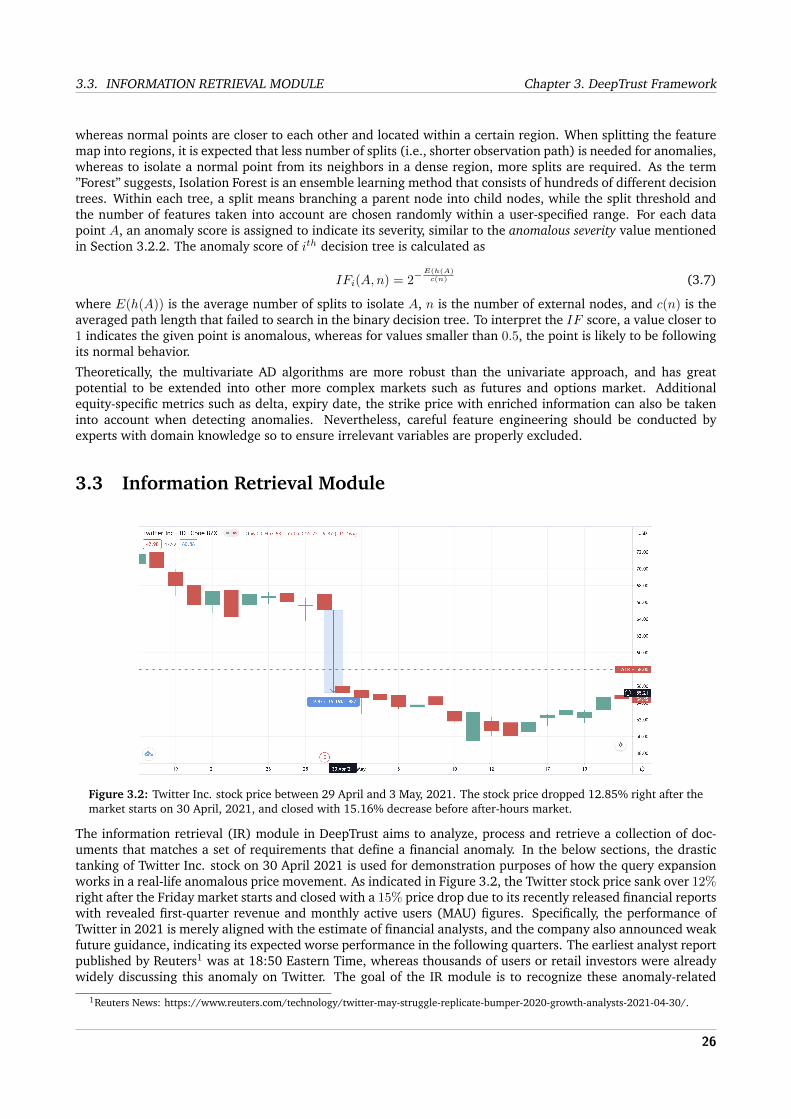
3.3. INFORMATION RETRIEVAL MODULE Chapter 3. DeepTrust Framework
whereas normal points are closer to each other and located within a certain region. When splitting the featuremap into regions, it is expected that less number of splits (i.e., shorter observation path) is needed for anomalies,whereas to isolate a normal point from its neighbors in a dense region, more splits are required. As the term”Forest” suggests, Isolation Forest is an ensemble learning method that consists of hundreds of different decisiontrees. Within each tree, a split means branching a parent node into child nodes, while the split threshold andthe number of features taken into account are chosen randomly within a user-specified range. For each datapoint A, an anomaly score is assigned to indicate its severity, similar to the anomalous severity value mentionedin Section 3.2.2. The anomaly score of ith decision tree is calculated as
IFi(A,n) = 2−E(h(A)c(n) (3.7)
where E(h(A)) is the average number of splits to isolate A, n is the number of external nodes, and c(n) is theaveraged path length that failed to search in the binary decision tree. To interpret the IF score, a value closer to1 indicates the given point is anomalous, whereas for values smaller than 0.5, the point is likely to be followingits normal behavior.
Theoretically, the multivariate AD algorithms are more robust than the univariate approach, and has greatpotential to be extended into other more complex markets such as futures and options market. Additionalequity-specific metrics such as delta, expiry date, the strike price with enriched information can also be takeninto account when detecting anomalies. Nevertheless, careful feature engineering should be conducted byexperts with domain knowledge so to ensure irrelevant variables are properly excluded.
3.3 Information Retrieval Module
Figure 3.2: Twitter Inc. stock price between 29 April and 3 May, 2021. The stock price dropped 12.85% right after themarket starts on 30 April, 2021, and closed with 15.16% decrease before after-hours market.
The information retrieval (IR) module in DeepTrust aims to analyze, process and retrieve a collection of doc-uments that matches a set of requirements that define a financial anomaly. In the below sections, the drastictanking of Twitter Inc. stock on 30 April 2021 is used for demonstration purposes of how the query expansionworks in a real-life anomalous price movement. As indicated in Figure 3.2, the Twitter stock price sank over 12%right after the Friday market starts and closed with a 15% price drop due to its recently released financial reportswith revealed first-quarter revenue and monthly active users (MAU) figures. Specifically, the performance ofTwitter in 2021 is merely aligned with the estimate of financial analysts, and the company also announced weakfuture guidance, indicating its expected worse performance in the following quarters. The earliest analyst reportpublished by Reuters1 was at 18:50 Eastern Time, whereas thousands of users or retail investors were alreadywidely discussing this anomaly on Twitter. The goal of the IR module is to recognize these anomaly-related
1Reuters News: https://www.reuters.com/technology/twitter-may-struggle-replicate-bumper-2020-growth-analysts-2021-04-30/.
26

Chapter 3. DeepTrust Framework 3.3. INFORMATION RETRIEVAL MODULE
tweets via learning unique features that distinguish irrelevant tweets from targeted ones. For DeepTrust, theIR module follows the ETR design mentioned in Section 2.3.2, and the below sections outline the design andimplementation details using this anomaly as an example.
3.3.1 Twitter Search Query Modeling
As mentioned in Section 2.3.2, the objective of query modeling is to formulate an event-specific query Q withn lexical features {w1, w2, ...wn} for retrieving correlated tweets from the Twitter data stream. Query modelingbegins from constructing the initial query using the output of the Anomaly Detection module, then applyingvarious query enhancing techniques such as NER and PRF to improve the query quality by enriching Q withstrongly correlated textual or behavior information. The following sections outline steps of query modeling.
Query Initialization with Lexical and Temporal Features
Ideally, the query for the first retrieval should contain a (i) temporal condition such as a date range to excludeoutdated events (ii) enriched lexical features that can precisely trace to the interested entity (iii) dynamic querycondition that is appropriately relaxed, so to avoid mistakenly exclude correlated tweets from the retrievalscope. Since the source of financial anomalies in this project has been restricted equity pricing data, it isreasonable to expect that the target equity is associated with a stock symbol or other standardized identifiersthat are uniquely identifiable in major knowledge bases. This stock symbol, along with its variants such ascompany names or stock symbols in different formats, are essential elements that define the correlation of atweet with the interested equity. In DeepTrust, the initial query is derived from the detected anomalies outputby the Anomaly Detection module by aggregating key pieces of information, namely the (i) anomaly date -the date when anomalous pricing movement occurred (ii) entity - the stock symbol (e.g., ticker or RIC code2)expressed as a unique sequence of characters. These two inputs collectively define the initial query with bothlexical and temporal conditions, and query enhancement techniques are employed to make every endeavourincluding all potentially correlated tweets (i.e., improve recall of IR).
Firstly, since financial data providers often use different formats of stock symbols to represent the same equity(e.g., exchange-level ticker in Yahoo Finance, RIC in Reuters, regional-level Committee on Uniform Securi-ties Identification Procedures (CUSIP) number, and global-level International Securities Identification Number(ISIN) in Bloomberg), it is necessary to detect and convert all symbols into the standardized RIC format forIR in the Refinitiv knowledge base. A rule-based detection algorithm is first applied to identify the format ofstock symbol, and public financial knowledge bases such as Yahoo Finance and Eikon Data API are used forsymbol conversion (i.e., symbology function in Eikon Data API and web scrapper in Yahoo Finance). Besides,equity fundamentals are retrieved from Eikon Data Item Browser, such as TR.CompanyName, TR.CommonName andTR.AssetName. These names are either official or frequently used terms on social media by the public to referto the entity, such as ”Twitter”, ”Twitter Inc.”, ”TWTR” for the company Twitter Inc.
For anomaly date, the range should be properly extended to cover the delay of information propagation on socialmedia platforms. For instance, the Bitcoin (BTC) price plunged 30% to 30, 000 USD/BTC on 19 May 2021, andthis anomalous price movement is a collective consequence of various negative announcements released earlierover the past two weeks. Firstly, Elon Musk, the Key Opinion Leader and the CEO of Tesla Inc., has suspendedBTC payment channels on Tesla cars due to environmental concerns of the crypto mining process on 12 May2021. In addition, multiple nations, including the United States and China, have tightened regulations over BTCtransactions to fight against potential financial crimes, and three state-backed Chinese financial organizationshave announced official warnings regarding the risk of BTC on 18 May 2021. In order to capture all thesefactors causing the sharp drop in BTC price, news from the past 7 days should all be included, whereas thenumber of days should be determined prudently to filter out outdated news from the retrieved collection ofdocuments. In DeepTrust, the anomaly date is expanded to a range of T − D days where the parameter Dcan be either user-specified or derived from information diffusion models. To determine D mathematically,a Twitter network can firstly be represented as a directed graph G = (V,E) with V represents users and Erepresents follower-followee relationships. Upon receiving an external influence (e.g., negative news on BTC),the external influence metric θ can be estimated using multi-source Breadth-first search (BFS) algorithms as
2Ticker is an abbreviation to uniquely identify traded equity of a company in the exchange market, whereas RIC refers to ReutersInstrument Code, a ticker-like index for Refinitiv knowledge base. For example, Twitter Inc. has ticker TWTR and RIC TWTR.K.
27
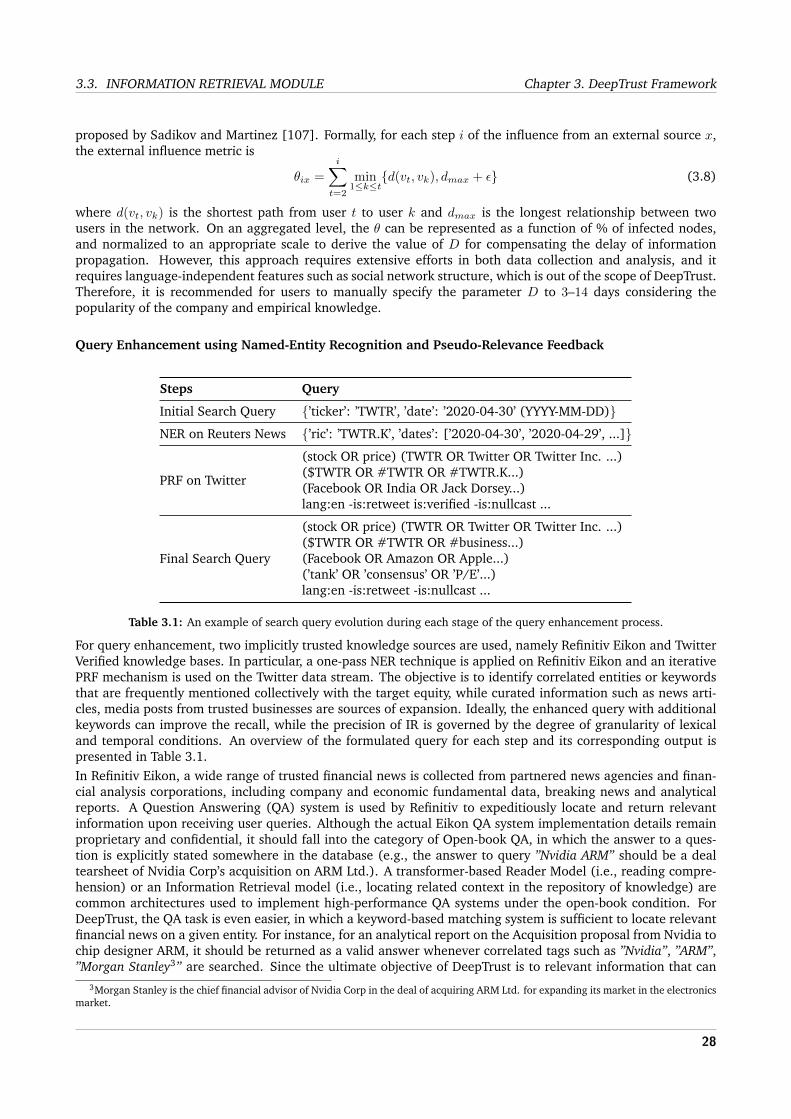
3.3. INFORMATION RETRIEVAL MODULE Chapter 3. DeepTrust Framework
proposed by Sadikov and Martinez [107]. Formally, for each step i of the influence from an external source x,the external influence metric is
θix =
i∑t=2
min1≤k≤t
{d(vt, vk), dmax + ε} (3.8)
where d(vt, vk) is the shortest path from user t to user k and dmax is the longest relationship between twousers in the network. On an aggregated level, the θ can be represented as a function of % of infected nodes,and normalized to an appropriate scale to derive the value of D for compensating the delay of informationpropagation. However, this approach requires extensive efforts in both data collection and analysis, and itrequires language-independent features such as social network structure, which is out of the scope of DeepTrust.Therefore, it is recommended for users to manually specify the parameter D to 3–14 days considering thepopularity of the company and empirical knowledge.
Query Enhancement using Named-Entity Recognition and Pseudo-Relevance Feedback
Steps Query
Initial Search Query {’ticker’: ’TWTR’, ’date’: ’2020-04-30’ (YYYY-MM-DD)}NER on Reuters News {’ric’: ’TWTR.K’, ’dates’: [’2020-04-30’, ’2020-04-29’, ...]}
PRF on Twitter
(stock OR price) (TWTR OR Twitter OR Twitter Inc. ...)($TWTR OR #TWTR OR #TWTR.K...)(Facebook OR India OR Jack Dorsey...)lang:en -is:retweet is:verified -is:nullcast ...
Final Search Query
(stock OR price) (TWTR OR Twitter OR Twitter Inc. ...)($TWTR OR #TWTR OR #business...)(Facebook OR Amazon OR Apple...)(’tank’ OR ’consensus’ OR ’P/E’...)lang:en -is:retweet -is:nullcast ...
Table 3.1: An example of search query evolution during each stage of the query enhancement process.
For query enhancement, two implicitly trusted knowledge sources are used, namely Refinitiv Eikon and TwitterVerified knowledge bases. In particular, a one-pass NER technique is applied on Refinitiv Eikon and an iterativePRF mechanism is used on the Twitter data stream. The objective is to identify correlated entities or keywordsthat are frequently mentioned collectively with the target equity, while curated information such as news arti-cles, media posts from trusted businesses are sources of expansion. Ideally, the enhanced query with additionalkeywords can improve the recall, while the precision of IR is governed by the degree of granularity of lexicaland temporal conditions. An overview of the formulated query for each step and its corresponding output ispresented in Table 3.1.In Refinitiv Eikon, a wide range of trusted financial news is collected from partnered news agencies and finan-cial analysis corporations, including company and economic fundamental data, breaking news and analyticalreports. A Question Answering (QA) system is used by Refinitiv to expeditiously locate and return relevantinformation upon receiving user queries. Although the actual Eikon QA system implementation details remainproprietary and confidential, it should fall into the category of Open-book QA, in which the answer to a ques-tion is explicitly stated somewhere in the database (e.g., the answer to query ”Nvidia ARM” should be a dealtearsheet of Nvidia Corp’s acquisition on ARM Ltd.). A transformer-based Reader Model (i.e., reading compre-hension) or an Information Retrieval model (i.e., locating related context in the repository of knowledge) arecommon architectures used to implement high-performance QA systems under the open-book condition. ForDeepTrust, the QA task is even easier, in which a keyword-based matching system is sufficient to locate relevantfinancial news on a given entity. For instance, for an analytical report on the Acquisition proposal from Nvidia tochip designer ARM, it should be returned as a valid answer whenever correlated tags such as ”Nvidia”, ”ARM”,”Morgan Stanley3” are searched. Since the ultimate objective of DeepTrust is to relevant information that can
3Morgan Stanley is the chief financial advisor of Nvidia Corp in the deal of acquiring ARM Ltd. for expanding its market in the electronicsmarket.
28

Chapter 3. DeepTrust Framework 3.3. INFORMATION RETRIEVAL MODULE
explain a financial anomaly in real-time, only historical news published before the anomaly date are referencedfor query enhancement.Once all relevant Reuters news is retrieved from Refinitiv Eikon, an enhanced NER algorithm named IntelligentTagging from OpenPermID API is applied to extract expansion words for the search query. In short, it analyzesunstructured data and extracts named entities and key phrases such as company names, geographical locationsand persons from it. A Permanent Identifier (PermID) is assigned to each entity for relationship and relevanceanalysis. These PermIDs are further mapped with Refinitiv proprietary PermID taxonomy database maintainedby experts in the financial domain, and generate entity resolution and relevance scores based on documents withsimilar context. Henceforth, for each identified entity, it can either be (i) included as a part of the Entity Markupthat is semantically identical to a known entity (ii) resolved into a standardized form that can unambiguously beindexed in the knowledge base, and DeepTrust uses the resolved entity for query expansion whenever feasible.In addition, user-specified thresholds (e.g., minimum relevance threshold > 0.5 and minimum importancethreshold > 0.8) are used to exclude irrelevant entities from contaminating the query, along with other commonfiltering rules (e.g., non-URL and non-numeric entities). Lastly, only the top N frequent entities are selected,whereas the parameter N is either specified by users or fine-tuned using an evaluation dataset. An example ofthe top 5 entities returned for query expansion in the Twitter case aforementioned is:
Reuters NER Keywords: [’Twitter’, ’India’, ’S&P 500 Index - CBOE’, ’Facebook’, ’United States’]
These keywords from diverse domains are included in the final search query as optional matching keywords,for the purpose of improving recall at the expense of a lower precision. Nevertheless, an optimal value ofparameter N should balance these two performance metrics. For DeepTrust, the N is tentatively set to 10 basedon empirical analysis, and the value is manually adjusted for different financial anomalies during evaluation.
Algorithm 2 Improved Twitter Pseudo-Relevance Feedback Mechanism with Tags and Entities.
1: Initial query Q = q1, q2, . . . , qk enters the PRF process.2: while True do3: Retrieve top γ documents d1, d2, . . . , dj from Twitter using query Q and store as collection D.4: Initialize a collection of tags and entities H for query expansion.5: for di ∈ D do6: Extracts tags and entities in the tweet content as collection Hi.7: For hj ∈ Hi increment the counter in H by 1.8: end for9: Sorts the collection H and appends Q using the top γ tags and entities.
10: if all top γ tags and entities already in Q then11: Query Expansion is completed, and Q has stabilized.12: end if13: end while
For Twitter, the unsupervised PRF method is used to expand the query iteratively until the set of keywords isstablized. The pseudocode of PRF is presented in Algorithm 2. Generally, in each iteration, topic-related wordsin the top γ retrieved tweets are assumed correlated with the entity, and are selected for relevance feedbackin the next iteration, while these words can be in the form of lexical features (e.g., individual words, phrases)or Twitter-specific features (e.g., hashtags, emojis). In DeepTrust, an enhanced PRF method with entity andcontext recognition and Twitter verification is utilized for query enhancement. Firstly, different from the NERalgorithm used in Refinitiv Eikon, the entity and context recognition algorithm is employed to extract bothlexical features and its underlying contextual meanings (e.g., domains such as trading, finance or money) thatcan be used to directly exclude tweets from an irrelevant domain. For instance, for a tweet that discussesthe stock performance of Twitter Inc., its contextual domain should not be primarily composed of words fromthe Sports domain, but should contain terminologies or common layman terms from the financial domain like”price” and ”money”. In addition, the search query is also refined with Twitter-specific filters (e.g., verified flags,hashtag flags, media duration, etc.) to extract information with high granularity. In particular, verified Twitteraccounts refer to individuals or organizations that are recognized as authentic, notable and active by Twitter,and are validated using a government-issued identification document or a company-registered domain, whichscreens the majority of bot and spam accounts that may corrupt the query with falsified content. The majority
29
3.3. INFORMATION RETRIEVAL MODULE Chapter 3. DeepTrust Framework
of those verified accounts are news agencies with an established reputation, in which their published tweets canbe implicitly trusted.
As an example, the below list consists of keywords and tags extracted from the top 10 tweets of the Twitterfinancial anomaly in its first retrieval:
Cashtags: [$TWTR, $FB, $twtr]
Annotations: [Microsoft, U.S., Google, Amazon, $TWTR, Refinitiv]
Hashtags: [#risks, #priceaction, #makingmoney, #stockmarket, #marketalert]
Based on the experimental results discussed in [108], the PRF method using top 2 frequently mentioned hash-tags as feedback yielded the greatest level of originality and retrieval efficiency comparing to non-expandedquery or keyword-based expansion. To take advantage of both Twitter verification and Twitter-specific features,the top 2 hashtags, cashtags, and annotations mentioned in tweets from Twitter verified accounts are selectedand used for query expansion iteratively, and the entire query enhancement process terminates when no newhashtags appear in the retrieval results.
Query Finalization and Composition Analysis
The finalized Twitter search query (e.g., the Final Search Query in Table 3.1) consists of multiple componentsthat collectively strive to cover as many relevant tweets as possible, and can be visualized as a combination of 6components:
Query = (domain, names or tags or related entities or descriptive keywords, parameters)
The domain refers to the category of the interested entity in the exchange market, typically as an investible andtradable asset. Common categories include stock, bond and commodity markets, and each asset within thesedomains has a market price, as the function of demand and supply dynamics.
The names are frequently mentioned titles of the interested entity or correlated key decision makers that areoften implicitly linked with the entity, which are the most popular approaches for users referring to an entity.For instance, a user may use a ticker with hashtag or cashtag (i.e., $TSLA or #TSLA.O), or the company nameTesla to refer to Tesla Inc. The collection of correlated names of the interested entity are retrieved duringboth the PRF process in Twitter and NER process in Reuters News. In addition, key decision makers that areaffiliated with the interested equity are also included, as users may address a financial anomaly using solely thename of the founder or CEO. For instance, Bill and Melinda Gates announced their divorce in May 2021, andthousands of tweets were discussing this news and its possible impact on the market. As a potential influentialfactor of MSFT stock price, conditionally restrict the search criteria to the entity name may mistakenly filterout relevant tweets that are discussing the divorce but not addressing the company by its name. Therefore,DeepTrust leverages both names of the company and key decision makers as matching criteria.
The tags are Twitter-specific features named Hashtag and Cashtag. The hashtag (i.e., words start with # symbol)is used to index topics on Twitter, and cashtag (i.e., ticker starts with $ symbol) is used to index ticker symbols.Both tags are frequently used by users on Twitter to promote their posts to a wider population who follow thesetags, and these features reduce the complexity of locating or filtering information from a specific theme.
The related entities are named entities that are deemed correlated as appearing in relevant financial articlesin Reuters News. These entities are usually mentioned alongside the interested entity, and are potentiallyrelevant to the cause of the financial anomaly. For instance, the company Facebook, as a competitor in the socialnetworking service market, is constantly mentioned in financial news of Twitter Inc. during 27–30 April 2021,in which the expected performance of Facebook is used by analysts to approximate the expectation of Twitterin later quarters, and partially cause the price crash after the weak future guidance.
The descriptive keywords describe the anomalous pricing movement and its cause using financial terminologies.For instance, to describe a decrease in stock price, professional traders usually use ”price tanking”, ”crash”or ”decline”. Similarly, fundamental indicators like ”P/E ratio” and ”cash flow” may frequently appear whendiscussing company performance. These keywords may help DeepTrust to capture related entities that areexhibiting similar pricing movements, which may constitute explanatory evidence of the financial anomaly.
30

Chapter 3. DeepTrust Framework 3.4. RELIABILITY ASSESSMENT MODULE
The parameters in the search query governs the search scope in Twitter using content-dependent flags andlanguage filters. For instance, using ”is:nullcast” can remove advertising tweets from the search result, and”is:retweet” to exclude retweets and only retrieve independent tweets from its author. Other parameters such aslanguage filters and data range filters are also used to restrict the search results within a narrowed range.
3.3.2 Tweets Retrieval and Ranking
Apart from the Query Modeling component, the remaining two ETR components, Event Representation andEvent Ranking and Retrieval are already implemented by Twitter on the server-side. Although Twitter has neverofficially released any information on how its social media algorithm (i.e., ”In case you missed it (ICYMI)” featurein Twitter) works on responding to user queries, the underlying principle is similar to the traditional rankingand retrieval model. Based on empirical evidence, the ranking of tweets when responding to a non-registereduser depends only on its content, including recency, relevancy, confidence, multi-media and other confidentialfactors. For instance, tweets with implicit trust (i.e., Twitter verified account) or with excellent public metrics(e.g., number of likes, retweets, etc.) are anticipated to be returned as top results, whereas tweets with fewerinteractions are often neglected from the first page. This ranking mechanism is particularly useful during thePRF process, because the objective of PRF is to retrieve correlated entities only in the top γ documents, and theTwitter ranking algorithm is able to rank tweets using its proprietary algorithm with high quality. Nevertheless,the ranking model from Twitter is only useful for queries with no date range is specified, whereas for the finalsearch with a specified date range, the ranking algorithm is implicitly disabled as all tweets that satisfy thesearch query condition are returned iteratively using search pagination.
In addition, it is noticed that the dynamics of the Twitter ranking algorithm lead to inconsistent results of iden-tical queries. In particular, if two identical queries are submitted simultaneously using two clients, the retrievalresults of the top 500 tweets might be different in terms of order and content. Although this inconsistency is notfrequently observed throughout the project, it may affect the PRF process as expansion entities and tags are onlyextracted from the top-ranked tweets. To mitigate this issue, DeepTrust implemented a buffering mechanismthat allows a stabilization period of 5 iterations once the expansion keywords list has converged to a fixed set.
Lastly, regardless of the benefit brought by using the Twitter verification system to improve the implicit trust ofthe expansion keywords list, the number of available tweets is significantly reduced depending on the popularityof the entity. This is primarily due to the privacy concern, as the Twitter verification system requires users tosubmit official government-issued documents for identity validation, and most users are unwilling to uploadtheir IDs to Twitter for the verified status. For less popular equities, the number of verified Twitter accountsthat are discussing the anomaly is drastically low, approximately only 5–10 verified users with less than 50tweets during a period of 7 days. Therefore, DeepTrust provides a parameter to specify if the verified flag isenabled or not depending on the judgment call of financial analysts on entity popularity, and allocating moreresponsibilities to the reliability assessment module to filter out irrelevant information.
3.4 Reliability Assessment Module
3.4.1 General Tweet Pre-Processing for Reliability Assessment
While analyzing tweets collected by the Information Retrieval module, it is observed that each tweet containsseveral noisy features that may obstruct the reliability assessment components in reaching a justified result. Forinstance, the following is a typical example of tweets retrieved by the IR module:
$TWTR Is Twitter a Buy or Sell After Its Post-Earnings Plunge? #technicalanalysis #investment :-)https://t.co/...
The first feature to be removed is the URL link (”https://t.co/...) appended by Twitter for identifying thedependencies associated with the tweet. The link is typically used by Twitter to track its associations, eitherlinked to its quoted content or the tweet itself if it is an original post. In practice, this link may confuse synthetictext verifier and argumentative detector as including the link may mislead the model to believe the text istrustworthy, whereas the link itself contains no useful information for any reliability assessment components.For instance, for a tweet containing only hashtags and emojis, the RoBERTa neural fake text detector predicts
31
3.4. RELIABILITY ASSESSMENT MODULE Chapter 3. DeepTrust Framework
its real probability only as 58% whereas with Twitter embedded link included, its estimated real probabilityimmediately increases to 86% while no substantial information is indeed added. Therefore, a regular expressionis used to remove these links from tweets before supplying them to any reliability assessment components.
In addition, emojis or emoticons are converted to interpretative words for better semantic interpretation andcontext understanding. For instance, an emoticon ”:-)” that transforms to ”:smiley-faces” can provide usefulinsights into the emotional context of the tweet, and a similar argument can be applied to emojis which insteadof converting to standard Unicode tokens, enriched information stored in interpretive words like ”blinking-stars”can be beneficial for contextual-related tasks. However, this pre-processing technique should only be appliedfor filters other than synthetic text filter, as these additional words may mislead the neural detector into falselybelieving the tweet is written coherently and was not generated by a language model. Therefore, in DeepTrust,emoji-word conversion is by default disabled, and is only applied when manually specified by users.
3.4.2 Feature-based Screening using Heuristics and Threshold-based Classifiers
The first phase of reliability assessment is conducting a preliminary feature-based microblog credibility assess-ment on the collection of retrieved tweets. The study from Krishnan and Chen is referenced for selectingprominent features that are correlated to tweet reliability. In DeepTrust, features are separated into threegroups, namely (i) textual features - statistical information on lexicon features (ii) tweet-meta features - tweetmetadata that captures interactions within the social network such as ”Likes”, ”Retweets” and ”Replies” (iii) userfeatures - attributes that describes the social networking profile of a Twitter user. Among all these types offeatures, the survey results from Morris et al. are used to rank feature importance by its impact on perceivedcredibility [109]. Specifically, the 3 most prominent features that affect the perceived reliability of a tweet areTwitter verified account / validated expertise in the topic, contained URLs from a trusted domain, published by anauthor with an active footprint in Twitter4, and other metrics such as the number of followers or the impression ofauthor bio have also received considerable attention from users when evaluating tweet credibility. However, dueto the absence of an annotated tweet dataset from the financial domain, the feature-based screening system inDeepTrust is not trained using supervised learning with classifiers such as SVM to determine reliability. Instead,it constitutes a complementary filter in reliability assessment as discussed in 2.4.1, with relaxed conditions thatsolely exclude trivially unreliable tweets from the collection. Therefore, instead of applying sophisticated fea-ture extraction or defining complex rules on feature-based reliability assessment, simple heuristics are used toperform a quick round of preliminary filtering, and this component is only used for screening the simplest formsof unreliable information.
Textual Features: [% Hashtags, % Cashtags, % Links, % @Mentions, Profanities]
Tweet-Meta Features: [# Retweets, # Replies, # Likes, # Quotes]
User Features: [# Followers, # Following, # Tweets, # Lists, Creation Date]
For textual features, DeepTrust focuses on the distribution of different categories of text elements within atweet, and review if it intends to artificially amplify or manipulate information on Twitter, which is defined asSpam by Twitter [110]. As one of the guidelines suggested by Twitter, the misuse of URLs, tags and mentionsare violating the Twitter policy by using Twitter service with abusive or disruptive behavior, and some typicalexamples are (i) including excessive unrelated hashtags, cashtags and @mentions of influencer accounts thatare different from the topic domain to drive traffic or expand influence (ii) adding misleading links that areirrelevant to the main topic of the tweet. In general, these spamming behavior can be detected easily viaanalyzing the textual composition, including the distribution of each feature (i.e., words, punctuation, tags,emojis, and links) and the correlation among features (e.g., the average semantic similarity between pairs ofhashtags). For DeepTrust, the system uses a threshold β to exclude tweets contain more than β% of tags,links and mentions, as the remained text can be reasonably assumed not sufficient for constructing a validargumentation structure. In addition, DeepTrust leverages a profanity filter to remove tweets composed ofoffensive or explicit languages that are certainly irrelevant to the financial anomaly. As discussed, the objectiveof DeepTrust is to identify tweets that are reliable by either having an argumentation structure with supporting
4DeepTrust only examines features that are user-account independent. Features that involve social network analysis are excluded inDeepTrust, such as authors that users are following.
32

Chapter 3. DeepTrust Framework 3.4. RELIABILITY ASSESSMENT MODULE
evidence or being an objective statement, and none of these two forms should contain profanities, which aresubjective representations of offensive words. Therefore, tweets are firstly vectorized using a BoW model, anda pre-trained linear SVM classifier calibrated with logistic regression is used to estimate the probability of thembeing offensive or explicit. For tweets that have a probability higher than a user-specified threshold, they aremarked as unreliable by the feature-based filter.
For tweet-meta features, metrics that capture tweet impression and engagement are used for assessing credibil-ity. In the design of DeepTrust, financial anomalies are not detected in real-time, which means at the time ofinformation retrieval, tweets with enriched information are likely to have certain numbers of interactions in theforms of tweet-meta features listed above. For tweets with zero engagement metrics, the ranking algorithm islikely to assign a lower score because it is likely to be spam information with unimportant words that are merelycorrelated with the financial anomaly. Thus, these tweets are often placed in lower positions of the Search En-gine Results Page (SERP), and most Twitter users are used to interact with tweets from the top hundreds oforganic positions. Among all metadata associated with the Tweet, the four most prominent features that col-lectively capture the most popular approaches users may interact with tweets are selected, namely number ofretweets, replies, likes and quotes5. In the Twitter sample discussed in Section 3.3, a typical feature-filteringalgorithm that removes tweets with zero public interactions (i.e., value 0 for all four features) can removeapproximately 52% tweets from the collection.
For user features, a similar logic is applied to filter unreliable authors. Four important attributes (i.e., number offollowers, following accounts, posted tweets, and listed accounts) of the social networking profiles are selectedbased on their correlation with the reach of influence and level of engagement, and used collectively to evaluateuser reliability. In addition to public metrics, the creation time of the account is also taken into account, whichis effective in filtering bot-generated accounts created recently for the sole purpose of spreading disinformationor other malicious intentions.
To further improve the re-usability of the DeepTrust framework for potential real-time reliability assessmenttasks, the core feature-based filter component is implemented as a module that can be configured by domainexperts with user-specified thresholds and customized evaluation logic. For each tweet in the collection, thereliability flag ’feature-filter’ is updated based on the output of feature-based filter, with true being reliable andfalse being unreliable. For all other filters mentioned later, each filter corresponds with a separate reliabilityflag, and only tweets have true for all reliability flags are deemed as reliable by the DeepTrust framework.
3.4.3 Synthetic Text Screening using Discriminative Model and Classifiers
To identify and filter out fabricated tweets generated by language models, three countermeasures (i.e., RoBERTa,GPT-2-XL and BERT-large-cased detectors) are employed along with Plurality voting in reaching a consensus ontextual content authenticity. In short, synthetic text detection is a sequence classification learning task, in whichthe objective is to determine a category based on a sequence of textual information as expressed in the tweet.Two mainstream approaches adopted in DeepTrust, which are fine-tuning based with discriminative model andsupervised-learning based with generative model and classifier, are discussed in the following sections.
Fine-tuning Based Detection using RoBERTa Discriminative Model
The first detection mechanism used by DeepTrust is via fine-tuning a language model, typically called a discrim-inative model that detects synthetic text generated by itself or another model with similar architecture. TheGPT-2D, which is a RoBERTa model trained on the output of WebText and GPT-2-XL generated output as dis-cussed in Section 2.4.2, is selected based on its high performance and flexibility in detecting a diverse range offake information accurately. GPT-2D uses sequence classifiers of RoBERTa-base6 and RoBERTa-large7 fine-tunedby OpenAI, which are the robustly optimized version of BERT by removing the NSP objective and focusing solelyon MLM objective, and training for larger mini-batches, learning rates, and iterations [111].
Instead of constructing and training a customized neural fake news detector from scratch, DeepTrust uses trans-fer learning to improve fake news detection performance by leveraging knowledge learned from previous rele-vant tasks which are transferable to other downstream NLP tasks. This technique is beneficial by both reducing
5Quotes refers to retweet with a comment, and considered as a standalone tweet by itself.6RoBERTa-base (125M): https://openaipublic.azureedge.net/gpt-2/detector-models/v1/detector-base.pt.7RoBERTa-large (356M): https://openaipublic.azureedge.net/gpt-2/detector-models/v1/detector-large.pt.
33

3.4. RELIABILITY ASSESSMENT MODULE Chapter 3. DeepTrust Framework
development time and avoiding the demand for intense computation resources throughout the training phase.DeepTrust uses model checkpoints released and published on HuggingFace, which are fine-tuned using generalcorpora and synthetic text generated by GPT-2-XL (1.5B) under a paired setting. The training data consists ofthree sources, namely (i) 250K samples selected from WebText8 labelled as ”Human” (ii) 250K samples gener-ated by GPT-2-XL with temperature 1.0 and no K truncation labelled as ”Machine” (iii) 250K samples generatedby GPT-2-XL with K = 40 truncation labelled as ”Machine”. The temperature is a hyperparameter that governsthe randomness of sampling in the Boltzmann distribution. The lower the temperature, the more conservativethe model is in incorporating randomness in the output. For instance, a temperature of 0.0 forces the modelto output deterministic completion for a given prompt, whereas a temperature of +∞ forces the model to uni-formly sample words regardless of the confidence of predictions. The K value is used to control predictiondiversity by sorting predictions by confidence and removing tailing predictions if their ranks are lower than K.This is usually to avoid models from sampling irrelevant words frequently under a high-temperature environ-ment, and improve text generation quality by reaching an optimal balance between random and deterministic.Overall, discriminative models like RoBERTa has proven to be more robust than generative models in detectingsynthetic text generated by itself as it focuses on learning detection while less relevant to the generation itself,with on average 96.4% accuracy9 when detecting GPT-2 neural fake text under three sampling conditions (i.e.,temperature, K-truncation and nucleus sampling) [112].
Regarding the design and configuration of the RoBERTa model, there are several adjustments made to furtherenhance its performance on shorter text with informal language styles and the usage of non-standard lexiconssuch as emoticons and hashtags. Firstly, byte-level Byte Pair Encoding (BPE) tokenizer is used for preparinginput for the model, and is well-known for handling vocabulary issues such as representing out-of-vocabularywords. This is particularly useful for tweets due to the presence of emojis and hashtags. For instance, sincehashtags prohibit adding spaces between words, the majority of them take the form of combined words withoutspaces in between them, such as ”#technicalanalysis”. Traditional BPE can easily tokenize these neologisms as acombination of separated known tokens of ”technical” and ”analysis”, whereas the byte-level BPE is an enhancedversion, in which the base vocabulary set contains all Unicode characters. In other words, the byte-level BPEcan tokenize every possible word, emoji or punctuation without needing the <unk> tokens. Lastly, a sequenceclassification top layer has been added to the model, which directly outputs the probability of a given inputtext being synthetic or human-written. The result is easily interpretable, and a decision can be made by using aminimum confidence threshold of 0.5.
Supervised Learning Based Detection using GLTR, GPT-2 Generator and SVM Classifier
The second detection mechanism is to distinguish synthetic text using a classifier trained on the languagemodel probability distribution of domain-specific tweets and neural tweets generated by a fine-tuned languagemodel. It consists of three components, namely a generator model for producing synthetic text for training, twolanguage models to reproduce the language modeling process based on GLTR, and a classifier that is trained onboth human-written tweets and synthetic tweets.
Phase 1: Generator Model Training Data Preparation
Since the task is supervised learning, the first phase is to annotate a collection of domain-specific human-writtentweets for training, one naive approach is to use all retrieved tweets from the Information Retrieval module withthe assumption that all of them are written by a human. Although the feature-based screening should effectivelyremove the majority of trivial bot-generated tweets, more deceptive synthetic text written by complex languagemodels such as BERT or XLM may be inaccurately labeled as ”Human”. To tackle this issue, a chain of trust isestablished in which the output from the RoBERTa discriminator is trusted as the root entity. In other words,with a confidence threshold of 0.5, only tweets with a real probability of p > 0.5 deemed by the RoBERTadiscriminator are used for fine-tuning the generator model. For the Twitter financial anomaly example discussedbefore, only 88, 936 out of 241, 714 tweets satisfy this threshold, in which all of them are implicitly trusted tobe written by a human after filtering by both interaction metrics (i.e., feature-based screening discussed inSection 3.4.2) and neural discriminative model (i.e., RoBERTa discriminative model).
Phase 2: Generator Models Evaluation and Fine-Tuning
8WebText is an internal OpenAI corpus consists of documents from 45 million web pages for a total around 40 GB in size.9Accuracy achieved by a RoBERTa-large model trained with synthetic text generated by GPT-2-XL using nucleus sampling.
34

Chapter 3. DeepTrust Framework 3.4. RELIABILITY ASSESSMENT MODULE
The second phase is to fine-tune a language model for generating synthetic text, in which the collection ofgenerated synthetic text is later used along with implicitly trusted tweets under a paired setting to train theclassifier. The objectives of the generator model are (i) able to generate domain-specific synthetic text (ii) ableto generate topic-related content (e.g., controlled text generation of GROVER) (iii) consists of Twitter-specificfeatures such as emoticons, net slang or cashtags outside of the general corpora used for training the pre-trainedmodel. The following is a list of candidate generator models for consideration:
• GROVER: GROVER is a fine-tuned GPT-2 that is trained over a news-only dataset. With its controllabilityand quality of text generation, the synthetic text generated by GROVER can be considerably deceptivefor even humans to distinguish. However, GROVER is powerful in generating lengthy paragraphs with aformal writing style from a third-person viewpoint, which is uncommon in Twitter except for posts fromnews agencies. In addition, the time needed to generate one piece of text is approximately 6 minutes10,significantly longer than using a standard GPT-2 language model. Lastly, there is no mature text truncationmechanism other than a simple character-based cut-off to force the generated text to satisfy the characterlimit required by Twitter, which can severely damage the coherence of the GROVER text.
• DeepTweets: DeepTweets11 is an experimental project by Lex Fridman to generate fake tweets that mimicthe writing style of individuals. It is based on GPT-2-medium (345M), and is fine-tuned using historicaltweets of the targeted individual. This approach is insightful for DeepTrust, and a similar approach isadopted to fine-tune a GPT-2 generator as discussed in the following section.
• GPT-2-medium Generator: As the state-of-the-art few-shot learner that is powerful in language modeling,GPT-2 is the ideal choice of synthetic text generator for generating artificial tweets. The reason why Deep-Trust only uses GPT-2-medium (345M) is two folds: (i) smaller model requires less computing resourcesand dedicated GPU memory to fine-tune, along with shorter training time (ii) comparing to the WebTextused for training the general GPT-2, for each financial anomaly there are only around 30–200K tweetsavailable. The lack of training samples may cause overfitting, especially if using a large model like GPT-2-XL that can simply memorize tweets instead of generalizing useful knowledge. Therefore, for optimalfine-tune performance, a smaller model like GPT-2-Medium is the ideal candidate.
With the above evaluations, GPT-2-medium is selected as the generator model for generating training data forthe DeepTrust neural text classifier. To fine-tune this generator model, instead of focusing on the MLM objectiveadopted by RoBERTa discriminator in Section 3.4.3, the causal language modeling (CLM) loss is used to enforceunidirectional language modeling behavior. Both MLM and CLM model the probability of the masked tokengiven context words, whereas MLM provides both words on the left and right to predict the masked token,and CLM provides only words that occurred to the left for prediction. In general, MLM is commonly used in ascenario in which a good representation of the document is required, while CLM is usually adopted for traininga model in generating coherent synthetic text. For the generator model, CLM is the better objective to focus on,and the cross-entropy loss is then calculated and backpropagated to update model weights.
Regarding the fine-tuning parameters, the learning rate is specified to 5e−5 as a smaller value can prevent themodel from updating its pre-trained weights drastically while losing its generalizability from its knowledge ofthe general corpora. The optimal number of epochs is decided to be 1, as it is proven sufficient for the model tostabilize at a constant range of CLM loss during evaluation for both training and testing data.
Phase 3: Synthetic Text Generation using GPT-2-medium
With a fine-tuned generator model, the next phase is to apply tokenizer and configure sampling parameters (e.g.,temperature, K, etc.) for synthetic text generation. The same byte-level BPE mentioned in Section 3.4.3 is usedfor tokenizing the input text. For each generation, a prompt or a hint of the main theme is provided to the modelas the start of the sentence. For instance, if the beginning of sequence symbol <BOS> is given as the prompt,the language model will generate a text randomly based on its predictions and sampling preference. Instead ofgenerating random synthetic sentences as training samples, DeepTrust leverages information from the implicitlytrusted tweets, and use the first n words (i.e., n is a random integer between 2 to the 1/3 of the length of thetweet) as the prompt to guide the language model during neural text generation. In other words, each synthetic
10Estimation based on experiments of generating one sample with controlled parameters using Google Colab standard GPU runtime.11DeepTweets is another fine-tuned version of GPT-2 language model specialized in generating account-specific fake tweets using historical
posts as training data. Available at https://lexfridman.com/deeptweets/.
35

3.4. RELIABILITY ASSESSMENT MODULE Chapter 3. DeepTrust Framework
text is generated under controlled settings similar to the mechanism adopted by GROVER. In addition, thetemperature is set to 1.0 for introducing a reasonable amount of randomness in language modeling, and Top-p(nucleus) sampling is adopted with p = 0.9. The nucleus sampling, unlike the K-truncation technique discussedin Section 3.4.3, only samples from the smallest set of predictions whose cumulative probability exceeds the pvalue, and the probability mass is redistributed among this collection of predicted words. In general, nucleussampling is more flexible than K-truncation by dynamically selecting the set of words, but may sometimes ignorelow-ranked keywords that may otherwise be included in a Top-K sampling scheme, thus a combination of bothsampling techniques is also common in practice. For DeepTrust, the parameter may be overridden by users inthe configuration file, but the default parameter is set to only use nucleus sampling with p = 0.9, as it yields thebest result for the Twitter financial anomaly as evaluated by the author.Phase 4: GLTR Evaluation with GPT-2-XL and BERT-Large-Cased ModelsFor both collections of tweets (i.e., implicitly trusted human-written tweets and synthetic tweets generated byGPT-2-medium), DeepTrust applies the forensic tool GLTR to gather statistical information about predictionsduring the process of language modeling. As discussed in Section 2.4.2, GLTR aims to detect synthetic text byusing an identical model or models with similar architecture to reproduce the language modeling process. Forsynthetic text, each word in the text should be more likely to match the most confident predicted word proposedby the language model used in GLTR, whereas for human-written text, words should be less predictable or notincluded in the subset of sampling due to the uncertainty in human writings. DeepTrust leverages two mostcommonly used models or referenced architecture for the task of language modeling: GPT-2 and BERT, andcustomized the GLTR tool so to support using the latest, most powerful GPT-2-XL and BERT-Large-Cased modelsfor evaluation.For each text, the fractional probability score frac(p) is calculated, which is the ratio between the probability ofthe most confident prediction by the GLTR model and the actual probability of the next word in the probabilitydistribution. Formally speaking, for ith word Xi in the input text with probability p(Xi|X1:i−1),
frac(pi) = p(Xi|X1:i−1)/p(Y1|X1:i−1) frac(pi) ∈ [0, 1] (3.9)
where p(Y1|X1:i−1) represents the probability of the top predicted word from the language model used byGLTR. For a synthetic text with i words generated using GPT-2-medium with K = 1 and temperature = 0.0 (i.e.,deterministic prediction by always select the top predicted word), the frac(pi) for every word should equal to1.0 when another GPT-2-medium model is used by GLTR to calculate the fractional probability score. In otherwords, in the distribution of frac(pi) for a given text, a synthetic text should have a mean value closer to 1.0compared with a human-written text, as the language model in GLTR is more confident of each prediction whenthe generator model is using a sampling strategy like K-truncation or nucleus.
Human-Written: ”Twitter’s stock price dropped following the social-media giant’s removal of PresidentDonald Trump’s account #Biz #BizNews #Business #Economy #Market #News #StockMarket #Stocks#Tech #Trending #Trump #Twitter”
Synthetic: ”Here are today’s Stock Market Leaders: 1. Twitter (TWTR) 2. Discord (DF) 3. Tesla (TSLA)4. Google (GOOGL) 5. Facebook (FB) 6. Amazon (AMZN) 7. StifelMcQuinn”12
In addition, the frac(p) distribution is further converted to a frequency domain and can be visualized as ahistogram. An example is provided in Figure 3.3. For each bar, instead of counting the absolute value of occur-rences, the percentage of words in each bin is used, equivalent to applying normalization with a normalizingconstant. Instead of using min-max normalization, a direct conversion to the percentage scale is selected be-cause min-max normalization requires a known min and max value (i.e., minimum and maximum amount ofwords may present in a tweet) are required, whereas converting to a percentage scale avoids fixing the scalingmagnitude while still normalizing the data to a standard scale with all essential information preserved. Forinstance, the above section presents two tweets that are (i) written by a human and validated by the author(ii) generated by GPT-2-medium generator model using the configuration specified in Phase 3. When applyingthe GPT-2-XL model with GLTR to calculate the frac(p) percentage distribution, the resulting histogram canbe visualized in Figure 3.3, and the two distributions are distinguishable. Specifically, both distributions are
12The synthetic tweet is generated using fine-tuned GPT-2-medium based on this retrieved tweet: ”Here are today’s Stock Market Lead-ers: 1. $TSLA 2. $AMZN 3. $AAPL 4. $MSFT 5. $MVIS 6. $AMD 7. $UPS 8. $NIO 9. $GOOGL 10. $FB See the full list athttps://t.co/wBMiVBND4t”
36

Chapter 3. DeepTrust Framework 3.4. RELIABILITY ASSESSMENT MODULE
Figure 3.3: The frac(p) percentage distribution histogram of a human-written tweet and synthetic tweet.
convex-shaped whereas synthetic tweet is more right-skewed than the human-written tweet, primarily due tothe difference of sampling strategy adopted by a generator model and a human. Therefore, the finalized inputfeature for the classifier is a matrix X ∈ IRn×10 where n is the number of tweets in the collection that has passedthe feature-based screening test mentioned in Section 3.4.2, and 10 is the number of bins in the histogram.
Phase 5: SVM Classifier Fine-Tuning and Detection
The last phase is to train and fine-tune a classifier to perform binary classification on synthetic and human-written text. A non-linear SVM classifier with a kennel, which applies dimension reduction technique or atransformer on the input features, is used to approximate a non-linear decision function for classification. InDeepTrust, two kernels, namely the polynomial (poly) and radial basis function (RBF), are selected as theyoutperform others in terms of accuracy and weighted average F1 score. For each kernel, three parameters arefine-tuned by grid search algorithms, namely C, gamma, and function degrees for the poly kernel. The C is aregularization parameter that defines the soft margin of classification (i.e., tolerance on misclassification), anda larger C value means a smaller margin accepted for incorrect predictions. The gamma γ governs the influenceof features on the decision boundary, in which a larger γ value means a greater influence. The degree parameteris only used for the polynomial kernel, which defines the degree of the polynomial function used to generatenew features by applying a polynomial combination on existing features for dimension reduction.
For optimizing the fine-tuning, fitting and predicting speed, Intel(R) Extension for Scikit-learn13 (sklearnex) isused to accelerate the workflow. It leverages the oneAPI Data Analytics Library that is natively built by Intel(R),and invokes customized functions to reduce execution time. The fine-tuning operation is completed by runningthe grid search algorithm on 80+ servers over different combinations of parameters in parallel. Once theoptimal parameters have been determined, instances of the SVM classifier are instantiated and calibrated so theclassifier can also generate the confidence level, as represented in probabilities, of its decision on observations.The calibration process leverages ensemble learning along with cross-validation, by fitting a copy of the baseclassifier in each split and evaluating against the testing dataset. The final estimator is an ensemble of calibratedSVM classifiers, and the output of each observation equals the mean predicted probabilities of all classifiers. Foreach tweet, the predicted probability of class 0 (i.e., Class 0 for ”Human” and Class 1 for ”Machine”) is updatedto the database.
Rule-based Consensus on Tweet Authenticity using Results from Detectors
To reach a consensus on whether a tweet is synthetically generated or human-written, the predicted probabilityfrom three detectors, namely the RoBERTa-based discriminative model and SVM classifiers (i.e., GPT-2-XL andBERT-Large-Cased), are referenced for making the decision.
The first option is via plurality voting with thresholds. For example, with a minimum threshold of 0.8 on thepredicted probability of class ”Human”, only tweets that have at least two out of three detectors satisfy thiscondition are concluded as human-written. However, this approach is problematic as the results from these
13sklearnex available at: https://github.com/intel/scikit-learn-intelex.
37

3.4. RELIABILITY ASSESSMENT MODULE Chapter 3. DeepTrust Framework
three detectors should not be interpreted in a parallel relationship. In other words, for a tweet that is generatedusing a BERT-base model, only the SVM classifier trained over GLTR-BERT frac(p) distribution can identify itas synthetic text with great confidence, whereas the other two classifiers that are trained over GPT-2-mediumsynthetic text and WebText may output arbitrary probability of it being true. Consequently, DeepTrust uses aweighted average score with a rule-based system to conclude text authenticity. For each tweet, the weightedprobability of it being human-written or synthetically generated is calculated, while the weight is determinedbased on the average accuracy of the detector on 10-fold cross-validation. For the Twitter financial anomalyexample, the average accuracy for RoBERTa (0.7 threshold), GLTR GPT-2-XL (0.5 threshold) and GLTR BERT(0.5 threshold) detectors are 0.92, 0.81 and 0.69, respectively, thus weights are distributed as 38%, 33% and 29%for these three detectors. DeepTrust also employes a rule-based system to exclude unreliable tweets. Tweet areconcluded as human-written only if (i) RoBERTa discriminative model reports it being real with preal > 0.7 and(ii) weighted fake probability from GLTR detectors pfake < 0.4; Tweets are concluded as synthetically generatedonly if (i) RoBERTa discriminative model reports it being fake with pfake > 0.7 or (ii) weighted fake probabilityfrom GLTR detectors pfake > 0.9. Thresholds are determined by the author using empirical evaluation14, andmay be overridden by end-users whenever suitable. The remaining tweets are left inconclusive, and are handleddifferently under the two detection modes DeepTrust supports.
DeepTrust supports two modes of synthetic text detection, namely ”Recall” and ”Precision”. For recall mode,the objective is to relax synthetic text filtering rules and include more uncertain tweets into the collection,whereas for the precision mode, strict filtering rules are applied to ensure only human-written tweets with highconfidence are included. The mode choice is depending on use cases, and is left to users for deciding. Forinstance, for large financial data providers like Refinitiv, a team of 100 experts may prefer the recall modeas they have the resources to manually review a large collection of tweets, whereas for individuals like retailinvestors, a refined collection with less than 100 tweets is usually preferred to quickly obtain insights into theanomaly cause. The decision of pursuing a recall-focused or precision-focused approach should not be decideduniversally for all use cases, and thus DeepTrust leaves the option to users. For both modes, tweets that areconcluded as human-written are presented to users, whereas tweets with inconclusive tags are only includedwhen recall mode is enabled. Tweets are deemed fake by detectors are ignored under either mode.
3.4.4 Argumentation Structure Screening using Sequence Labeling Model
The objective of AM component is to identify if a given tweet contains a valid Twitter-specific argumentationstructure, as defined in Section 2.4.3. Unfortunately, due to the anonymization requirement from Twitter,DART, the widely adopted annotated dataset for learning arguments and relations on Twitter, is not availablefor use currently, thus training a binary classifier to filter tweets into factual and opinionated categories isinfeasible. As an alternative, DeepTrust leverages another state-of-the-art generalized argument tagging toolTARGER15 with 7 pre-trained sequence taggers, as developed by Chernodub et al. [113]. To accommodatechanges in the training dataset, DeepTrust also proposes an alternative Twitter-specific argumentation structurethat distinguishes reliable and unreliable tweets.
Argumentative Units Detection using Sequence Tagger TARGER
The TARGER is an end-to-end sequence labeling system with models trained on large argument detectiondatasets, and is designed to identify different argumentative units (i.e., claim and premise) and entities (e.g.,person, location, organization, etc.) in text from diverse domains. To label a sequence, the tweet is firstly trans-formed to word embeddings with FastText n-gram representations, and processed by a pre-trained sequencetagging neural model on IBM Debator - Claim Evidence Search dataset16. The training dataset comprises 1.5Msentences retrieved from Wikipedia Snapshot in 2017, and is scattered across 150 different topics coveringpolitics, social media and other generic domains. During the training phase, the optimal training parameterdiscussed in [113] is used, in which the Adam optimizer, 0.5 dropout rate and 0.001 LR yields the optimal re-sults across all pre-trained models. Regarding the model specification, TARGER uses the state-of-the-art model
14The author first manually selects a subset of tweets (i.e., 200 tweets from the Twitter example) that are deemed correlated and agreedby three annotators, and is treated as the ground truth. Output from detectors are then reviewed and a threshold is determined that canmost accurately separate these tweets from the remaining ones.
15TARGER sequence labeling tool is available at: https://github.com/uhh-lt/targer.16IBM Debator - Claim Evidence dataset is available at https://www.research.ibm.com/haifa/dept/vst/debating_data.shtml.
38

Chapter 3. DeepTrust Framework 3.4. RELIABILITY ASSESSMENT MODULE
architecture to achieve optimal performance, which is a combination of CNN + Bi-LSTM + Conditional RandomField (CRF) as proposed in [114]. The following list discusses the details of the model:
1. CNN - Character-level Embedding: Instead of using pre-trained word or sequence embeddings, TARGERuses character-level CNN to encode lexical and morphological information of words into character-levelrepresentations, which may carry enriched information comparing to a less-granularity representation. Atypical construction of character-level CNN consists of (i) input layer (ii) convolution layer for learningcombinations of characters (iii) max-pooling layer for dimensionality reduction (iv) output layer withcharacter-level representations.
2. Bi-LSTM - Contextual Information: To obtain contextual information from a sequence of characters, eachsequence is presented both forward and backward to the Bi-LSTM model, and are captured with twohidden layers. The output is the concatenated vectors of both hidden states.
3. CRF - Sequential Data Modeling: Instead of modeling a sequence of words independently, CRF considersthe correlation among neighbors using a feature function, and output another sequence considering thecontextual information seen before. In other words, the sequence of text is decoded using contextualinformation instead of independently on a per-word basis.
Updated Definition of Tweet Argumentativeness and Consensus on Argumentation Structure
Although the definition of Twitter-specific argumentativeness proposed in DART [85] cannot be used due tothe absence of annotated training dataset, DeepTrust proposes an alternative argumentation structure based onthe Toulmin argument model, which is mentioned in Section 2.4.3. Initially, the argumentation filter deems atweet as argumentative if it contains a claim-evidence pair, in which the claim should be reasonably derived andsupported by the associated evidence. To formalize the terminology using components in the Toulmin argumentmodel, an argumentative tweet should at least contain a claim, expressed as a conclusion of the argument, anda grounds, which is the foundation of the claim. As an example, the following tweet is a typical argumentativetweet that contains two essential argumentative units claim and grounds.
We [should sell the Twitter stock now](claim). The [released figures are not looking good](grounds).17
in which the grounds is equivalent to the premise in TARGER. However, when applying this filter on evaluationdatasets, all tweets are labeled as unreliable because the sequence tagger cannot identify any claim from them.More analysis on factors that impact the performance of TARGER on Twitter are discussed in Section 4.3.7,but it is important to redefine the criteria of argumentativeness for this project, or this filter is equivalent to abaseline classifier.The finalized definition of argumentativeness of tweets is a relaxed version of the prior one. Instead of requiringboth claim and grounds to be presented in a tweet, tweets with only grounds are also treated as argumentative,thus labeled as reliable. The rationale behind this definition is two folds: (i) relaxing the definition can signifi-cantly improve the recall by treating more low-confidence tweets as reliable (ii) including exceptional cases inwhich an implicit argumentation structure is used (e.g., annotation sample 2 in Section 4.1.2). For instance,there may exists tweets that only mention the grounds (i.e., ”released figures are not looking good”) while usingTwitter-specific features like cashtag (e.g., ”$TWTR”) to replace the claim in above example. If enforcing thestricter definition, the diversity of argumentative units on social media platforms is not taking into considera-tion when evaluating tweet reliability. Therefore, DeepTrust decides to use the relaxed definition consideringits impact on recall and the variety of argumentation structures in Twitter.
3.4.5 Subjectivity Screening using Classifiers and Subjectivity Lexicon
In order to analyze text subjectivity, tweets are transformed into three different representations, namely context-independent lexical list, context-dependent word embeddings and context-dependent sentence embeddings.Classifiers (i.e., LSTM for Word Embedding and Single-Layer Perception for Sentence Embedding) or subjectivitylexicon (i.e., TextBlob) are then used to evaluate tweet subjectivity based on those representations. All classifiersare trained and evaluated using the SUBJ dataset. A consensus is reached via adopting a rule-based systemsimilar to the one in synthetic text filter.
17This tweet is written by the author for demonstration purposes, and is not retrieved from Twitter. Argumentative units are labeled byIBM FastText pre-trained model.
39
3.4. RELIABILITY ASSESSMENT MODULE Chapter 3. DeepTrust Framework
Additional Tweet Pre-Processing for Subjectivity Analysis
Due to the absence of an annotated subjectivity dataset composed of financial tweets, all classifiers for SA aretrained on the SUBJ dataset, which is introduced in Section 2.4.4. However, the movie reviews from the SUBJdataset are written in different linguistic styles, and missed most of the Twitter-specific features, such as tags andemoticons. Since it is infeasible to fine-tune classifiers using an annotated collection of tweets, it is necessary toapplying pre-processing techniques on the retrieved tweets to transform them into a similar format as the moviereviews in the SUBJ dataset. For DeepTrust SA, a series of pre-processing techniques are applied in addition tothe general text pre-processing steps in Section 3.4.1, namely as follows:
1. Contraction Replacement: Contractions are combination of words shortened by replacing with an apostro-phe (e.g., You are to You’re). DeepTrust uses a dictionary mapping, which consists of an aggregated listof most commonly used English contractions, to replace contractions in tweets. For contractions that areambiguous, they are ignored and replaced with an empty string (e.g., David’s to David).
2. Punctuation Removal: Functional punctuation with no concrete meanings are removed from tweets, suchas hyphen, semicolon and braces, which are proven effective in reducing noisy tokens during the tok-enization phase. In DeepTrust, only exclamation mark (!), question mark (?), comma (,) and period (.)are kept, as the presence of these punctuation may indicate subjectivity (e.g., sentence ends with multipleexclamation marks is more likely to be subjective than sentence ends with a period).
3. Spelling Corrections: As tweets often contain misspelled words, a collection of unigrams and bigramsTwitter word statistics annotated by EkPhrasis18 is used to perform spell correction. The spelling correctorworks by firstly identifying misspelled tokens in the tweet using a dictionary mapping, and replace themwith the most probable spelling corrections based on sequence similarity.
4. Tags and Emoji Unpacking: Twitter-specific features such as hashtags, cashtags and emojis are transformedto interpretable tokens that can be analyzed on their subjectivity. For instance, complex expressions, suchas tags with combined words (e.g., #technicalanalysis”), are properly split using a social tokenizer fine-tuned with the EkPhrasis Twitter dataset. This word segmentation step on tags is necessary to preservethe subjectivity within the combined words by converting them into known tokens of the vocab list usedby neural models.
5. Text Cleaning: Irrelevant tokens, including email, numbers, phone, date and time, url, user (@mentions) areall omitted in tweets as they are assumed not bringing subjectivity to the textual content. Excessive whitespace are also properly repaired using regular expression to avoid issues during the tokenization phase.
Context-Dependent Word Embedding based Analysis using BERT and LSTM Model
Distributed word representations, commonly known as word embedding, is a widely adopted technique inrepresenting a sequence of words in higher-dimensional space by dense vectors in lower-dimensional space,and captures semantics by representing words with similar meanings in vectors that are closer in distance.Recent advanced models, such as BERT as discussed in Section 2.3.2, capture both static semantic meaningsand contextualized meanings with innovative embedding schema when representing sentences (e.g., token,position, and segment embedding layers in BERT). DeepTrust references the leading model architecture withthe highest accuracy on the SUBJ benchmark, the BERT Embedding + LSTM approach proposed in [115], andfine-tuned on SUBJ dataset with 5-folds cross-validation before transfer learning to the Twitter domain.
Regarding implementation details, a batch of tweets is firstly pre-processed and tokenized using the BERT-basevocab list. All tweets are padded to a standard sequence length of 128 tokens with post-truncation mode,and [CLS] and [SEP] tokens are inserted accordingly. Tweets are represented by the last hidden layer h oftransformer encoders in the pre-trained BERT-base model, which are then used as the input of an LSTM modeltrained with categorical cross-entropy loss and Stochastic Gradient Descent (SGD) optimizer with 0.9 learningrate. Cyclical learning rate (CLR), proposed in [116] as an effective approach to identify optimal global learningrate and avoid stuck at local minima, is used to dynamically adjust the learning rate cyclically within a pre-defined range in each epoch. A dropout layer of rate 0.2 is adopted to prevent overfitting, and the optimalregularization parameter is determined by running the grid search algorithm. The last layer of the LSTM model
18EkPhrasis Twitter word statistics contains 330M English Twitter messages, available at https://github.com/cbaziotis/ekphrasis.
40

Chapter 3. DeepTrust Framework 3.4. RELIABILITY ASSESSMENT MODULE
uses the ReLU activation function, to introduce non-linearity and overcome the vanishing gradient problem, anda fully connected layer is concatenated to the output of the LSTM model, in which a sigmoid activation functionis used to classify tweets as subjective (i.e., Class 1) or objective (i.e., Class 0). Lastly, the entire model with theoptimal set of parameters is trained again using the whole SUBJ dataset, stored as a checkpoint for generatingpredictions on the pre-processed tweets.
Context-Dependent Sentence Embedding based Analysis using InferSent and Single-Layer Perception
Although the aforementioned approach with word embeddings has yielded the best performance on the SUBJdataset, there are several limitations of using word embeddings to represent a sentence. The first issue isthe sentence may be truncated to the maximum sequence length seen during the training phase, as the innercell dimension of the LSTM model is fixed during the training phase. In addition, aside from representingstatic semantic meanings, the effectiveness of word embeddings in capturing interactions and relationshipsamong words is still unknown in most researches. On the other hand, learning a universal representationof sentences, with either unsupervised or supervised learning approaches, can effectively capture enrichedinformation embedded in phrases and interaction among entities, then subsequently encode this knowledgeinto a single sentence embedding as opposed to a list of word embeddings.
In DeepTrust, the model architecture proposed by Facebook Research in [117], Bi-LSTM with Max-Pooling(InferSent), is referenced, and its second generation InferSent2 is used to encode sentences into a vector ofdimension 2048. Regarding the model specification, for each sequence of n words X = (x1, . . . , xn), the wordembedding value (i.e., the input of LSTM model) is firstly initialized with FastText n-gram representations,and the sentence embedding representation h is the concatenated output of forward and backward LSTM withmax-pooling sampling:
h = max(−→
LSTM(x1, . . . , xn)i,←−
LSTM(x1, . . . , xn)i) i ∈ 1 . . . n (3.10)
in which for each hidden unit hi ∈ h, its value is the maximum value between the forward and backwardLSTM output. The InferSent model is trained using a supervised learning task of Natural Language Inference(NLI) with the Stanford Natural Language Inference dataset. The objective of the SNI task is to analyze pairsof premise and hypothesis in English sentences, and classify if they are in the relationship of entailment, con-tradiction or neural. Texts are encoded in forms of sentence embedding with a sentence encoder (i.e., Bi-LSTMwith Max-Pooling), and the knowledge captured by the sentence encoder is transferred into another domain forother downstream NLP tasks like subjectivity classification.
To evaluate tweet subjectivity, a single-layer perceptron (SLP) model is used for the binary classification task.The model is implemented using PyTorch with one linear layer of dimension (2048, 2), in which 2048 representsthe dimension of sentence embedding and 2 represents the number of classes (i.e., Subjective as Class 1 andObjective as Class 0). The loss function is the categorical cross-entropy, and the optimizer is RMSprop, whichuses normalization on the gradient to prevent its value from vanishing or exploding. The sigmoid activationfunction is used to generate an output between [0, 1] for binary classification. Similar to the approach discussedin Section 3.4.5, the model is trained and fine-tuned with the SUBJ dataset of movie reviews, and the bestperforming model is stored for transfer learning into the Twitter domain. For each pre-processed tweet, thesentence is first encoded using the InferSent2 model and represented as a vector of dimension 2048, and theSLP classifier is then used to generate predictions on whether it is subjective or objective.
Context-Independent Lexicon based Analysis using TextBlob
Textblob, as discussed in Section 2.4.4, is a lexicon-based subjectivity analysis method that tags each tweet assubjective or objective using dictionary mapping. Tweets are firstly tokenized using the standard Punkt sentencetokenizer from NLTK, and then the POS tagging function from TextBlob is used to identify adjectives within thetweet. These adjectives are then matched against a curated subjectivity lexicon that contains around 2, 900adjectives and their subjectivity scores are represented as a float value between [0.0, 1.0]. A threshold-basedsystem is then employed to determine the degree of subjectivity of tweets, based on the average subjectivityscores of known adjectives. Subjective tweets are those with an average subjectivity score greater than a certainthreshold, and the optimal threshold value is determined as 0.5 by referencing the experiment results fromSahni et al. on another collection of 1.6M tweets in [118].
41
3.4. RELIABILITY ASSESSMENT MODULE Chapter 3. DeepTrust Framework
Rule-based Consensus on Tweet Subjectivity using Results from Classifiers
Similar to the rule-based system used for synthetic text filter, a list of pre-defined rules are used to reachconsensus on tweet subjectivity based on outputs from three different analytical tools aforementioned. Firstly,both context-dependent based approaches (i.e., with sentence embeddings or word embeddings) have yieldedan outstanding performance on the SUBJ dataset, and are assumed to be equally reliable when transferringknowledge from movie reviews to tweets in the forms of encoded representations. Secondly, TextBlob is lessreliable, primarily due to the insufficient coverage of adjectives or other words with different POS tags. Forexample, in the Twitter financial anomaly example, around 20.74% tweets have a subjectivity score of 0.0from TextBlob, and 71.23% of them are because there are no known adjectives in the tweet that matches withrecords in the TextBlob subjectivity lexicon. In other words, scores derived by TextBlob may carry multiplemeanings, as a score of 0.0 may either indicate the tweet being perfectly objective, or represent a subjectivesentence that does not contain any known adjectives from the TextBlob subjectivity lexicon. Therefore, thedecision on subjectivity is primarily based on outputs from context-dependent analysis, and the output fromcontext-independent approach TextBlob is only used as a moderator when there are disagreements. A tweet isclassified as subjective only if (i) both results from classifiers using sentence embeddings and word embeddingsare subjective and (i) in case of disagreement between the two results, the subjectivity score from TextBlob isgreater than the threshold value of 0.5, vice versa. The final results are updated to the database in the field of”subj-filter”, with ”subj-filter” equals to true means objective, vice versa.
3.4.6 Sentiment Signal Insights using Domain-Specific Language Model
Polarity analysis, which classifies text as positive, negative or neutral, may introduce insights to financial analystson the overall market sentiment towards the interested equity. Instead of relying on a sentiment classificationmodel trained on general corpora, DeepTrust utilizes a domain-specific language model to drive all potential ofdeep learning models in sentiment analysis. The following section introduces the FinBERT model architectureproposed in [119], and discusses some fine-tuning techniques DeepTrust has adopted to transfer this languagemodel into the Twitter domain.
Sentiment Analysis using Domain-Specific Language Model FinBERT
Although there exist a large number of high-performance deep learning models for sentiment analysis, they aremostly trained on general corpora such as IBDB Movie Reviews19 or the MR Movie Reviews20, and the knowl-edge may not be effectively transferred to the financial domain on Twitter. For instance, financial tweets may usespecialized language with domain-specific terminologies (e.g., EBIT (Earnings before Interest and Taxes), AH(After-Hours)) to convey information, and consist of complex expressions (e.g., rhetorical questions, sarcasm)that its sentiment cannot be identified trivially. Therefore, DeepTrust leverages FinBERT, a domain-specific lan-guage model that is pre-trained with massive financial corpora from Reuters, and fine-tuned for downstreamNLP tasks using task-specific datasets, to offer analysts an effective way to understand the sentiment indicatorfrom a large collection of unstructured data.
One novelty of FinBERT is the specially crafted list of pre-training tasks that allows the BERT model to contin-uously capture knowledge in different depths, in which comprised six unsupervised learning tasks21 that areinspired from the latest pre-training frameworks spanBERT [120] and ERNIE 2.0 [121]. The embedding layerhas also been extended for the pre-training tasks, with an additional task embedding that specifies that task ID(i.e., 0 to 5). The pre-training is firstly done with a large collection of financial information on social mediaplatforms (i.e., Reddit and Yahoo Finance) and financial forum (i.e., FinancialWeb), in addition to the generalcorpus of Wikipedia and BooksCorpus adopted in the original BERT paper. The language model is further fine-tuned with another subset of Reuters TRC222, to improve its knowledge on financial news using high-qualitycurated news collection from professional news agencies. For the sentiment analysis task, the FinBERT is further
19IBDM Movie Reviews dataset is a binary sentiment classification collection with 50,000 reviews annotated as positive or negative.20MR Movie Reviews dataset is a binary sentiment classification collection with 2,000 reviews annotated as positive or negative.21The six unsupervised pre-training tasks are namely (i) span replace prediction from spanBERT (ii) capital letters prediction from ERNIE2
(iii) token-from-passage prediction from ERNIE2 (iv) sentence order rearrangement from ERNIE2 (v) multi-class NSP (vi) self-supervisedquestion-answering relation from ERNIE.
22Reuters TRC2 contains 1, 800, 370 financial news between 2008–2009, available at https://trec.nist.gov/data/reuters/reuters.html.
42

Chapter 3. DeepTrust Framework 3.4. RELIABILITY ASSESSMENT MODULE
fine-tuned with Financial Phrasebank23 comprises annotated sentiment scores between [−1, 1] on 4.8K Englishfinancial news, and training parameters are learning rate 2e−5 and maximum sequence length 64. The lossfunction is defined as categorical cross-entropy loss, which is widely adopted for multi-class classification tasks.
Figure 3.4: Tokens per Tweet histogram using BERT-base-uncased vocab on Twitter and Facebook financial anomalies.
For DeepTrust, the model checkpoint trained by the ProsusAI team is used for its exceptional performance bothon Financial Phrasebank and our evaluation dataset. Firstly, the maximum sequence length is specified to be64 as the fine-tuning process conducted by the ProsusAI team is primarily focused on sentence-by-sentenceprediction, instead of per-document prediction. Consequently, DeepTrust can either use text truncation toensure a given tweet is complying with the sequence length restriction, or compute averaged sentiment scoreof all sentences within the tweet, in which the former option is adopted. The rationale behind this choice istwo-fold: (i) with 280 characters limit constraint from Twitter, the likelihood of a tweet contains more than64 words is negligible. As shown in Figure 3.4, 87.3% of tweets in the TWTR evaluation dataset and 93.2% oftweets in the FB evaluation dataset are within the maximum sequence length 64 after converting into a tokenlist with BERT-base-uncased vocab, which proves that the probability of tweet exceeding the sequence lengthrestriction is small (ii) unlike formal writing, the absence/misuse of punctuation (e.g., ”. . . ” and emoticons) iscommon in Twitter, thus it is challenging for a sentence tokenizer to properly split the tweet into sentences.Therefore, DeepTrust uses the mid-truncation technique as advised by the original paper, to randomly select asubstring between the first and third quartile (i.e., 25th and 75th percentile) section of the tweet, and removethe substring with minimal length to comply with the sequence length constraint.
In addition to text truncation, tweets are also preprocessed using the identical text pre-processing techniquesmentioned in Section 3.4.5. The rationale is similar, as the objective is to transform tweets into a similar formatas the training dataset of the language model. In the case of FinBERT, Twitter-specific features such as tagsand emoticons are less frequently appearing on forums and other social media platforms. These features arerequired to transform into interpretable formats that resemble the knowledge of FinBERT while preserving itsembedded meanings. Besides, a batch size of 5 is specified for faster predictions. The attention mask and tokentype IDs are configured accordingly based on the per-batch padding. The batch input is then passed to FinBERTfor evaluation. As the sentiment analysis task defined here is a multi-class classification task (i.e., positive,negative, and neutral), the softmax activation function is used to convert logits output from the last layer intoprobabilities, which is then converted to labels. Logits are also used for calculating a sentiment score, which isbased on the absolute difference between the probability of positive and negative.
23Financial Phrasebank is a polar sentiment dataset on financial news, available at https://huggingface.co/datasets/financial_phrasebank.
43

CHAPTER 4
Evaluation and Discussion
4.1 Dataset and Annotation
4.1.1 Evaluation Dataset and Acknowledgement of Bias
Two financial anomalies that are deemed representative by the author are used as the source of evaluationdataset, namely (i) Twitter Inc. stock price crashed on 30 April 2021, with 15.16% decrease when closed (ii)Facebook Inc. stock price surged on 29 April 2021, with 7.3% increase when closed. Both extreme price move-ments are caused by the difference between expectations from financial analysts and the disclosed quarterlyfinancial reports, affecting the post-earning stock price drastically. The below is a summary of the two financialanomalies:
Evaluation Dataset 1 (TWTR) Evaluation Dataset 2 (FB)
Stock Ticker / RIC TWTR / TWTR.K FB / FB.O
Anomaly Date 30 April 2021 29 April 2021
Price Movement Stock Price Plunged 15.16% Stock Price Surged 7.3%
Possible Causes1. Weak Future Guidance2. Slow User Growth3. Anticipated Quarterly Performance
1. 48% Revenues Growth over Q12. 10% MAU Growth during Pandemic3. 30% Price per Ad Increase
Original Dataset Size 241,714 (Tweet) / 115.690 (Author) 32,983 (Tweet) / 11,003 (Author)
Subset Search Query1. $TWTR2. Twitter && stock && price
1. $FB2. Facebook && stock && price
Annotated Dataset Size 659 (208 Reliable / 451 Unreliable) 1,052 (216 Reliable / 836 Unreliable)
Table 4.1: Evaluation Datasets (TWTR and FB Financial Anoamlies) for DeepTrust Framework.
The annotated dataset is a subset of the original collection of retrieved tweets output by the information retrievalmodule. For each evaluation dataset, the subset is selected using two search queries that the author deem aremost effective in identifying correlated tweets that can explain the cause of the financial anomaly, which areshown in Table 4.1. Firstly, the Cashtag, stock ticker symbol with a dollar sign prefix, is the most commonapproach for Twitter users to communicate financial information on Twitter, and it contains less noise comparedwith other keywords such as hashtag (i.e., #TWTR or #TSLA) or company names (i.e., Twitter Inc.). In the studyof [122] on Cashtag in 2014, the percentage of non-spam tweets of all tweets mentioning large corporationswith cahstags like $AAPL1 and $FB2 are approximately 81%, which is a relatively reliable approach to retrieve asubset of financial-related tweets that are associated with the target stock. In addition, a combination of case-insensitive stock-related keywords (i.e., company name + ”stock” + ”price”) is defined as the second searchquery. The rationale behind this query is that (i) it is inevitable to mention the company name either in formsof tags or text (e.g., Twitter or Facebook) when discussing its stock performance and (ii) an explanation ofanomalous stock price movement usually contains keywords of ”stock” and ”price”, regardless of describingthe price movement or explaining the cause. Although there are exceptional cases that address the stock pricemovement with a single keyword ”stock” or ”price” instead of both, relaxing the condition introduce significantlymore noise to the subset, from 108 to 3, 603 tweets in the TWTR evaluation dataset. Therefore, the second searchquery strictly requires the presence of both ”stock” and ”price” keywords.
Considering the available resources for data labeling, DeepTrust has made compromises to label bias when sam-pling and annotating subsets, and it is important to acknowledge these biases before interpreting the evaluation
1There are 81.2% (49, 602 out of 61, 068 tweets) non-spam tweets within all tweets that contain the cashtag of $AAPL in April 2013.2There are 80.7% (9, 817 out of 12, 169 tweets) non-spam tweets within all tweets that contain the cashtag of $FB in April 2013.
44
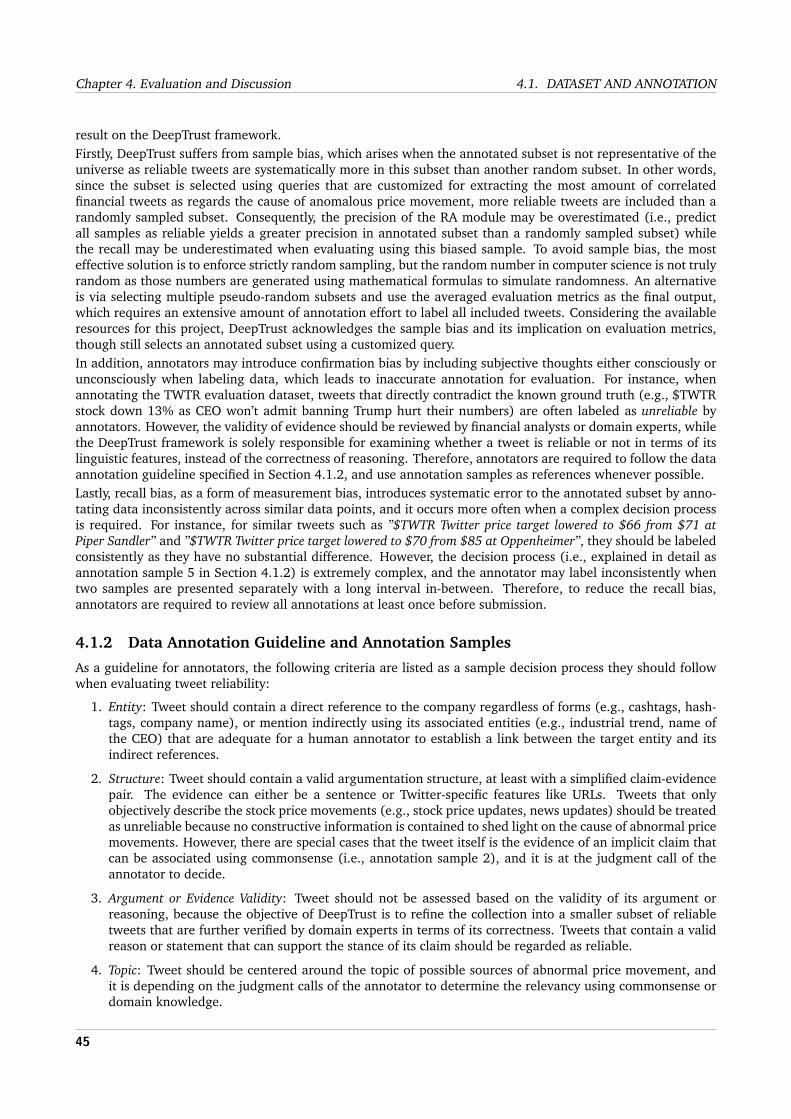
Chapter 4. Evaluation and Discussion 4.1. DATASET AND ANNOTATION
result on the DeepTrust framework.Firstly, DeepTrust suffers from sample bias, which arises when the annotated subset is not representative of theuniverse as reliable tweets are systematically more in this subset than another random subset. In other words,since the subset is selected using queries that are customized for extracting the most amount of correlatedfinancial tweets as regards the cause of anomalous price movement, more reliable tweets are included than arandomly sampled subset. Consequently, the precision of the RA module may be overestimated (i.e., predictall samples as reliable yields a greater precision in annotated subset than a randomly sampled subset) whilethe recall may be underestimated when evaluating using this biased sample. To avoid sample bias, the mosteffective solution is to enforce strictly random sampling, but the random number in computer science is not trulyrandom as those numbers are generated using mathematical formulas to simulate randomness. An alternativeis via selecting multiple pseudo-random subsets and use the averaged evaluation metrics as the final output,which requires an extensive amount of annotation effort to label all included tweets. Considering the availableresources for this project, DeepTrust acknowledges the sample bias and its implication on evaluation metrics,though still selects an annotated subset using a customized query.In addition, annotators may introduce confirmation bias by including subjective thoughts either consciously orunconsciously when labeling data, which leads to inaccurate annotation for evaluation. For instance, whenannotating the TWTR evaluation dataset, tweets that directly contradict the known ground truth (e.g., $TWTRstock down 13% as CEO won’t admit banning Trump hurt their numbers) are often labeled as unreliable byannotators. However, the validity of evidence should be reviewed by financial analysts or domain experts, whilethe DeepTrust framework is solely responsible for examining whether a tweet is reliable or not in terms of itslinguistic features, instead of the correctness of reasoning. Therefore, annotators are required to follow the dataannotation guideline specified in Section 4.1.2, and use annotation samples as references whenever possible.Lastly, recall bias, as a form of measurement bias, introduces systematic error to the annotated subset by anno-tating data inconsistently across similar data points, and it occurs more often when a complex decision processis required. For instance, for similar tweets such as ”$TWTR Twitter price target lowered to $66 from $71 atPiper Sandler” and ”$TWTR Twitter price target lowered to $70 from $85 at Oppenheimer”, they should be labeledconsistently as they have no substantial difference. However, the decision process (i.e., explained in detail asannotation sample 5 in Section 4.1.2) is extremely complex, and the annotator may label inconsistently whentwo samples are presented separately with a long interval in-between. Therefore, to reduce the recall bias,annotators are required to review all annotations at least once before submission.
4.1.2 Data Annotation Guideline and Annotation Samples
As a guideline for annotators, the following criteria are listed as a sample decision process they should followwhen evaluating tweet reliability:
1. Entity: Tweet should contain a direct reference to the company regardless of forms (e.g., cashtags, hash-tags, company name), or mention indirectly using its associated entities (e.g., industrial trend, name ofthe CEO) that are adequate for a human annotator to establish a link between the target entity and itsindirect references.
2. Structure: Tweet should contain a valid argumentation structure, at least with a simplified claim-evidencepair. The evidence can either be a sentence or Twitter-specific features like URLs. Tweets that onlyobjectively describe the stock price movements (e.g., stock price updates, news updates) should be treatedas unreliable because no constructive information is contained to shed light on the cause of abnormal pricemovements. However, there are special cases that the tweet itself is the evidence of an implicit claim thatcan be associated using commonsense (i.e., annotation sample 2), and it is at the judgment call of theannotator to decide.
3. Argument or Evidence Validity: Tweet should not be assessed based on the validity of its argument orreasoning, because the objective of DeepTrust is to refine the collection into a smaller subset of reliabletweets that are further verified by domain experts in terms of its correctness. Tweets that contain a validreason or statement that can support the stance of its claim should be regarded as reliable.
4. Topic: Tweet should be centered around the topic of possible sources of abnormal price movement, andit is depending on the judgment calls of the annotator to determine the relevancy using commonsense ordomain knowledge.
45

4.1. DATASET AND ANNOTATION Chapter 4. Evaluation and Discussion
The following list consists of some annotation samples extracted from the TWTR evaluation dataset for refer-ence:
1. Tweet: ”Twitter stock plunges on user miss and low guidance”
Explanation: Reliable. This is a typical example that explains the cause of a financial anomaly using anargumentation structure.
2. Tweet: ”$TWTR Twitter price target lowered to $66 from $71 at Piper Sandler”
Explanation: Reliable. This is a case in which an implicit argumentation structure is assumed. On thesurface, the tweet is objectively describing a fact that investment bank Piper Sandler has lowered Twitterstock price target, and does not address the stock price plunge. However, as an annotator with someunderstanding of trading and finance, the evidence mentioned in the tweet may be linked with the implicitclaim of ”Twitter stock price is plunging because...”, as a lower stock price target from a financial institutioncan negatively impact the confidence investors are having on the company, results in an increasing amountof sell transactions and a lower stock price. Therefore, this tweet should still be considered reliable withall conditions from the annotation guideline satisfied.
3. Tweet: ”$TSLA’s price moved below its 50-day Moving Average on April 29, 2021.”
Explanation: Unreliable. Firstly, the TSLA entity is not directly associated with TWTR in terms of itsbusiness nature or industry, and the author cannot relate this tweet to the Twitter stock price in anymeans. In addition, the tweet only objectively describes the behavior of TSLA stock price using technicalindicators, instead of making a claim based on this evidence.
4. Tweet: ”$TWTR Is Twitter a Buy or Sell After Its Post-Earnings Plunge?”
Explanation: Unreliable, due to the absence of a valid argumentation structure. It is merely raising aquestion on possible price movement instead of providing any constructive information.
5. Tweet: ”Price is signal, Twitter is noise”
Explanation: Unreliable, because the tweet is off-topic. Although it mentions Twitter Inc, with a claim-evidence structure by using the latter part as supporting evidence for the former claim, it is irrelevant tothe topic of stock price plunge.
6. Tweet: ”$TWTR I think earnings the selloff is overdone. And to everyone hating on this stock: Why are youstill on the platform if you dislike it so much?”
Explanation: Ambiguous. Although it is not following a standard argumentation structure as others,it still offers an opinion on the price movement (i.e., the selloff is overdone), which may indicate thatthe abnormal price movement is the consequence of mass irrational/emotional sell transactions frominvestors, and should be corrected by the market soon. However, the association aforementioned is madeby the author using trading knowledge that may differ among annotators, thus it is ultimately a judgmentcall from the annotator.
4.1.3 DeepTrust Evaluation Objective and Scope
The defined objectives for DeepTrust performance evaluation are (i) screening unreliable information and (ii)identifying reliable information that explains the anomalous price movement, while the emphasis is on theformer one. Nevertheless, it is important to firstly distinguish the recall metric for evaluation and the recallmode mentioned in Section 3.4.3. As stated, for large financial data providers like Refinitiv, recall mode ispreferred because they have sufficient resources to manually validate a large collection of tweets, and theywould want to maximize the recall in classifying reliable tweets. However, when evaluating the DeepTrustframework, the primary objective is to filter spamming or irrelevant information from the ocean of tweets, toassist analysts only focusing on a concise collection of high-quality tweets. In other words, since the RA moduleis less effective in examining the correctness of reasoning or validity of evidence, it is wiser to use the frameworkto exclude unreliable information instead of identifying reliable information. Formally speaking, with the nullhypothesis of ”Tweet is unreliable”, the evaluation objective is to minimize Type II error (i.e., accept the null
46

Chapter 4. Evaluation and Discussion 4.2. EXPERIMENTAL RESULTS
hypothesis while it is true/reliable - False Negative FN), but tolerate Type I error (i.e., reject the null hypothesiswhile it is false/unreliable - False Positive FP), and the precision of classifying unreliable tweets, calculated byFN / (FN + TN), is therefore determined as the primary objective for evaluation.
The performance of the DeepTrust framework can either be evaluated using a per-module approach, or with theframework as an entirety; While both approaches may be infeasible considering the resources available. Firstly,to evaluate the AD module, there must exist a standardized paradigm that defines financial anomaly, whichhas been discussed and proven infeasible in Section 3.2.1. Secondly, to evaluate the IR module, evaluationmetrics such as precision and its variant average precision may be adopted, which requires annotating the entirecollection of tweets for evaluation. However, due to limited time and annotators available, it is infeasible for theauthor to annotate both FB and TWTR dataset with 267K tweets in total. In addition, to evaluate the frameworkas an entirety, not only do the aforementioned two challenges need to be resolved first, but the author needs tomanually execute the entire pipeline of DeepTrust from Anomaly Detection to Reliability Assessment, which aresignificantly more challenging than the per-module evaluation approach. Considering the scale of this project,trade-offs are made to ensure the evaluation feasible for completion, and can be finished with high-quality usingthe available annotating resources.
The finalized evaluation scope is restricted to components within the RA module, which are feature-based filter,neural text filter, argumentation filter, and subjectivity filter. The evaluation is defined as a binary classificationtask that focuses on excluding unreliable tweets, with reliable as the positive class and unreliable as the negativeclass. Evaluation metrics associated with the unreliable class are used for evaluating the performance of Deep-Trust. Considering the stated challenges for AD and IR modules, empirical evaluation is conducted on the IRmodule to understand factors that may affect the quantity and quality of retrieved tweet collections, while theAD module is not evaluated in this project.
4.2 Experimental Results
4.2.1 Summary of Experimental Results
Notation Clarification
F: feature-based filter; N: neural text filter (default with P mode); A: argumentation filter; S: subjectivity filter;R Mode: recall mode for N filter; P Mode: precision mode for N filter.
Evaluation Metrics
TWTR Dataset FB Dataset
Precision Recall F1 F0.5 Precision Recall F1 F0.5
Baseline 68.44% 100.00% 81.27% 73.05% 79.46% 100.00% 88.56% 82.87%
F 75.06% 68.74% 71.76% 73.70% 83.94% 71.89% 77.45% 81.22%N (P) 76.39% 48.78% 59.54% 68.62% 90.51% 49.04% 63.62% 77.42%A 0.00% 0.00% 0.00% 0.00% 0.00% 0.00% 0.00% 0.00%S 65.12% 49.67% 56.35% 61.30% 76.53% 35.89% 48.86% 62.40%
F+N (R) 73.85% 71.40% 72.60% 73.35% 83.54% 73.44% 78.17% 81.30%F+N (P) 73.43% 83.37% 78.09% 75.23% 83.56% 82.66% 83.10% 83.37%F+A 75.06% 68.74% 71.76% 73.70% 83.94% 71.89% 77.45% 81.22%F+S 69.86% 85.81% 77.01% 72.55% 81.75% 86.24% 83.93% 82.61%
F+N+A 73.44% 83.37% 78.09% 75.23% 83.56% 82.66% 83.10% 83.37%F+N+S 70.03% 93.79% 80.19% 73.77% 81.62% 91.87% 86.44% 83.48%F+A+S 69.86% 85.81% 77.01% 72.55% 81.75% 86.24% 83.93% 82.61%
F+N+A+S 70.03% 93.79% 80.19% 73.77% 81.62% 91.87% 86.44% 83.48%
Table 4.2: Evaluation metrics of classifying unreliable tweets (i.e., negative class) with different combinations of filters.
47
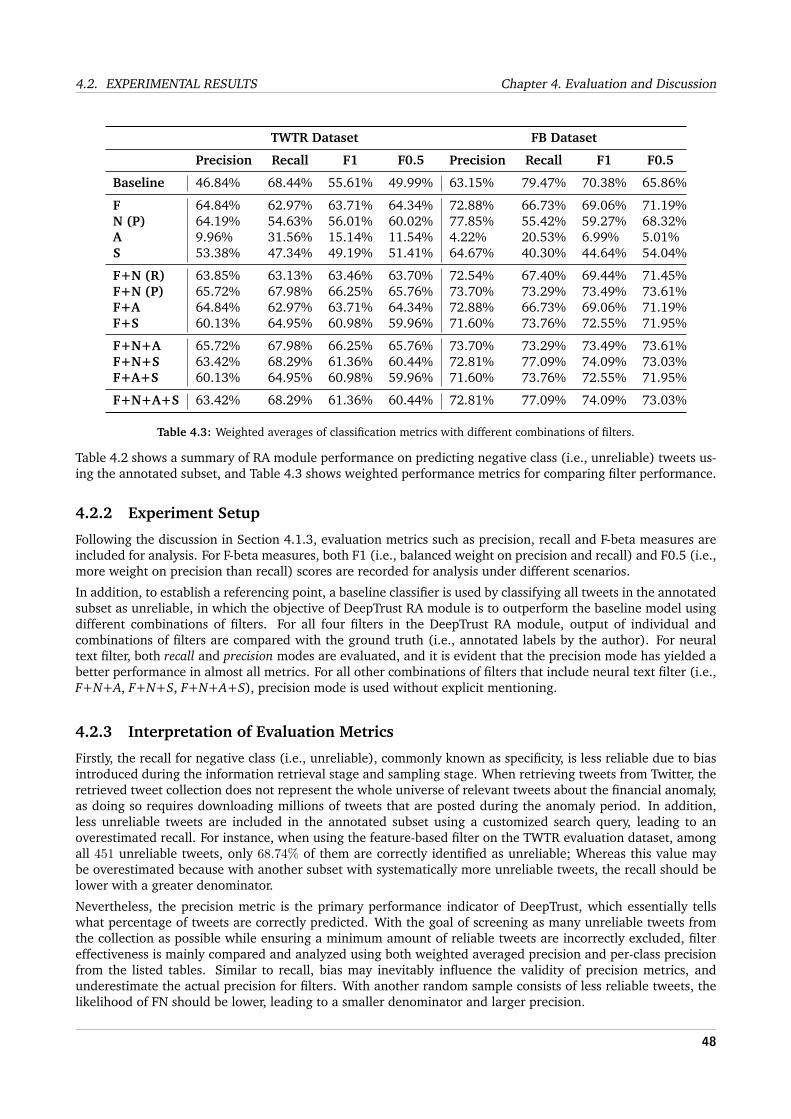
4.2. EXPERIMENTAL RESULTS Chapter 4. Evaluation and Discussion
TWTR Dataset FB Dataset
Precision Recall F1 F0.5 Precision Recall F1 F0.5
Baseline 46.84% 68.44% 55.61% 49.99% 63.15% 79.47% 70.38% 65.86%
F 64.84% 62.97% 63.71% 64.34% 72.88% 66.73% 69.06% 71.19%N (P) 64.19% 54.63% 56.01% 60.02% 77.85% 55.42% 59.27% 68.32%A 9.96% 31.56% 15.14% 11.54% 4.22% 20.53% 6.99% 5.01%S 53.38% 47.34% 49.19% 51.41% 64.67% 40.30% 44.64% 54.04%
F+N (R) 63.85% 63.13% 63.46% 63.70% 72.54% 67.40% 69.44% 71.45%F+N (P) 65.72% 67.98% 66.25% 65.76% 73.70% 73.29% 73.49% 73.61%F+A 64.84% 62.97% 63.71% 64.34% 72.88% 66.73% 69.06% 71.19%F+S 60.13% 64.95% 60.98% 59.96% 71.60% 73.76% 72.55% 71.95%
F+N+A 65.72% 67.98% 66.25% 65.76% 73.70% 73.29% 73.49% 73.61%F+N+S 63.42% 68.29% 61.36% 60.44% 72.81% 77.09% 74.09% 73.03%F+A+S 60.13% 64.95% 60.98% 59.96% 71.60% 73.76% 72.55% 71.95%
F+N+A+S 63.42% 68.29% 61.36% 60.44% 72.81% 77.09% 74.09% 73.03%
Table 4.3: Weighted averages of classification metrics with different combinations of filters.
Table 4.2 shows a summary of RA module performance on predicting negative class (i.e., unreliable) tweets us-ing the annotated subset, and Table 4.3 shows weighted performance metrics for comparing filter performance.
4.2.2 Experiment Setup
Following the discussion in Section 4.1.3, evaluation metrics such as precision, recall and F-beta measures areincluded for analysis. For F-beta measures, both F1 (i.e., balanced weight on precision and recall) and F0.5 (i.e.,more weight on precision than recall) scores are recorded for analysis under different scenarios.
In addition, to establish a referencing point, a baseline classifier is used by classifying all tweets in the annotatedsubset as unreliable, in which the objective of DeepTrust RA module is to outperform the baseline model usingdifferent combinations of filters. For all four filters in the DeepTrust RA module, output of individual andcombinations of filters are compared with the ground truth (i.e., annotated labels by the author). For neuraltext filter, both recall and precision modes are evaluated, and it is evident that the precision mode has yielded abetter performance in almost all metrics. For all other combinations of filters that include neural text filter (i.e.,F+N+A, F+N+S, F+N+A+S), precision mode is used without explicit mentioning.
4.2.3 Interpretation of Evaluation Metrics
Firstly, the recall for negative class (i.e., unreliable), commonly known as specificity, is less reliable due to biasintroduced during the information retrieval stage and sampling stage. When retrieving tweets from Twitter, theretrieved tweet collection does not represent the whole universe of relevant tweets about the financial anomaly,as doing so requires downloading millions of tweets that are posted during the anomaly period. In addition,less unreliable tweets are included in the annotated subset using a customized search query, leading to anoverestimated recall. For instance, when using the feature-based filter on the TWTR evaluation dataset, amongall 451 unreliable tweets, only 68.74% of them are correctly identified as unreliable; Whereas this value maybe overestimated because with another subset with systematically more unreliable tweets, the recall should belower with a greater denominator.
Nevertheless, the precision metric is the primary performance indicator of DeepTrust, which essentially tellswhat percentage of tweets are correctly predicted. With the goal of screening as many unreliable tweets fromthe collection as possible while ensuring a minimum amount of reliable tweets are incorrectly excluded, filtereffectiveness is mainly compared and analyzed using both weighted averaged precision and per-class precisionfrom the listed tables. Similar to recall, bias may inevitably influence the validity of precision metrics, andunderestimate the actual precision for filters. With another random sample consists of less reliable tweets, thelikelihood of FN should be lower, leading to a smaller denominator and larger precision.
48

Chapter 4. Evaluation and Discussion 4.3. DISCUSSION AND IMPLICATIONS
Accuracy is generally useful with (i) symmetric dataset with a similar number of samples in both classes (ii)identical costs for Type I and Type II errors, which does not fit the profile of TWTR and FB evaluation datasets.Instead, the F-measure score, as the harmonic mean of the precision and recall, is effective for unbalanced classdistribution by considering both FP and FN into accounts, and suitable for highly skewed classes like the FBevaluation dataset. For DeepTrust, the cost of FP is lower than FN because with FP, analysts can still manuallyfilter these unreliable information using domain knowledge, whereas with FN, mispredicted information isdisregarded by the RA module and cannot be retrieved back for further validation. Consequently, more emphasisshould be given to precision instead of recall. As presented in both Table 4.2 and Table 4.3, F0.5-scores thatallocate more weights on precision than recall are calculated and used for analysis in later sections.
Lastly, for unbalanced annotated subsets like TWTR and FB, it is essential to reference the weighted average ofevaluation metrics when comparing different filter setups. In other words, with per-class unweighted metrics,the performance of the baseline classifier on negative class (i.e., unreliable) is significantly better than onpositive class (i.e., reliable), which are 0.0% for all precision, recall, F1 scores on both TWTR and FB datasets.With weighted average metrics, issues caused by class imbalances are alleviated by the support of each label.Therefore, when comparing filter performance, metrics should be averaged using the support-weighted meanof each class, which are summarized in Table 4.3.
4.2.4 Interpretation of Experimental Results
Firstly, as presented in Table 4.3, all filters except the argumentation filter have outperformed the baselineclassifier in terms of precision and F0.5-scores. When used individually, the feature-based filter has achievedthe best overall performance in terms of weighted metrics, while the synthetic text filter is most powerful inexcluding unreliable tweets with high precision at the cost of a lower recall. The subjectivity filter is less reliable,results in a comparable performance with the baseline classifier. When filters are used in combinations, only thecombination of feature-based filter and synthetic text filter outperforms the best individual filter on all metrics.When using subjectivity together with other filters, both per-class and weighted metrics exhibit a similar pattern,resulting in a higher recall and a lower precision. In other words, the subjectivity filter tends to classify moretweets as unreliable, while a large proportion of them are false negatives, which are undesirable for this project.
In addition, for synthetic text filter, the precision mode is generally better than the recall mode as it enforcesa stricter rule-based consensus to classify low-confidence tweets as unreliable, at the cost of a slightly lowerprecision on the negative class. As shown in Table 4.2, when the synthetic text filter is used together with thefeature-based filter, using the precision mode allows more tweets to be classified as unreliable, resulting in ahigher recall for the negative class, while the precision is only affected by less than 0.5%. It is evident that thestricter version of the synthetic text filtering rule is more effective than the relaxed version, as observed in bothevaluation datasets.
Based on Table 4.3, the combination of the feature-based filter and synthetic text filter with precision settingyields the optimal precision and F0.5-score on both evaluation datasets, which are primary performance metricsused to evaluate the performance of the RA module. In addition, when using this combination on the wholedataset, there are 51, 121 tweets from TWTR and 3, 353 tweets from FB evaluation datasets concluded as reliable,with more than 79% unreliable tweets excluded from the collection. In practice, this amount of tweets areacceptable for large financial firms like Refinitiv to validate its authenticity manually, and are effective in savinga large number of full-time equivalent (FTE) for the corporation.
4.3 Discussion and Implications
4.3.1 Impact of Query Enhancement on Tweet Collection Quality
As discussed in Section 3.3.1, both named-entities identified in Reuters News and keywords collected by PRFare used to expand the final Twitter search query, with the objective to (i) include as many potentially relevanttweets as possible (i.e., improve recall) (ii) enhance query quality with dynamic keywords that are frequentlymentioned by the public. However, the effectiveness of these query enhancement techniques on improvingtweet collection quality is debatable, which are discussed in detail in the following sections.
49
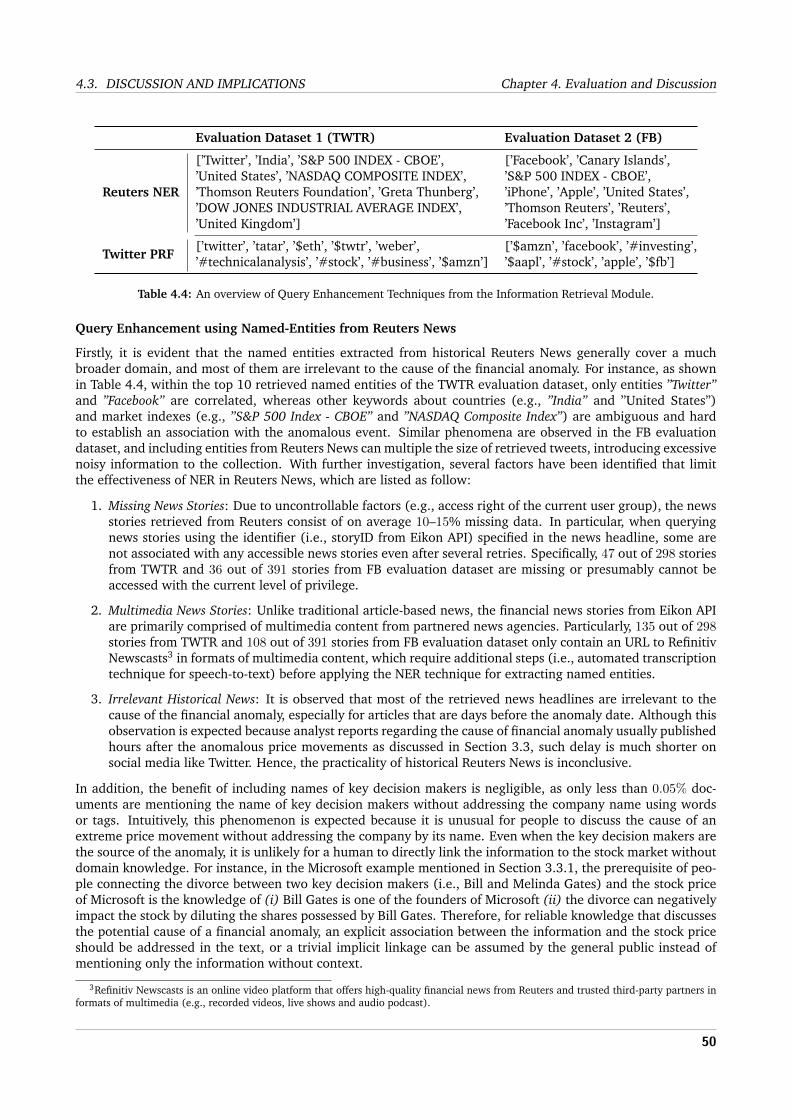
4.3. DISCUSSION AND IMPLICATIONS Chapter 4. Evaluation and Discussion
Evaluation Dataset 1 (TWTR) Evaluation Dataset 2 (FB)
Reuters NER
[’Twitter’, ’India’, ’S&P 500 INDEX - CBOE’,’United States’, ’NASDAQ COMPOSITE INDEX’,’Thomson Reuters Foundation’, ’Greta Thunberg’,’DOW JONES INDUSTRIAL AVERAGE INDEX’,’United Kingdom’]
[’Facebook’, ’Canary Islands’,’S&P 500 INDEX - CBOE’,’iPhone’, ’Apple’, ’United States’,’Thomson Reuters’, ’Reuters’,’Facebook Inc’, ’Instagram’]
Twitter PRF[’twitter’, ’tatar’, ’$eth’, ’$twtr’, ’weber’,’#technicalanalysis’, ’#stock’, ’#business’, ’$amzn’]
[’$amzn’, ’facebook’, ’#investing’,’$aapl’, ’#stock’, ’apple’, ’$fb’]
Table 4.4: An overview of Query Enhancement Techniques from the Information Retrieval Module.
Query Enhancement using Named-Entities from Reuters News
Firstly, it is evident that the named entities extracted from historical Reuters News generally cover a muchbroader domain, and most of them are irrelevant to the cause of the financial anomaly. For instance, as shownin Table 4.4, within the top 10 retrieved named entities of the TWTR evaluation dataset, only entities ”Twitter”and ”Facebook” are correlated, whereas other keywords about countries (e.g., ”India” and ”United States”)and market indexes (e.g., ”S&P 500 Index - CBOE” and ”NASDAQ Composite Index”) are ambiguous and hardto establish an association with the anomalous event. Similar phenomena are observed in the FB evaluationdataset, and including entities from Reuters News can multiple the size of retrieved tweets, introducing excessivenoisy information to the collection. With further investigation, several factors have been identified that limitthe effectiveness of NER in Reuters News, which are listed as follow:
1. Missing News Stories: Due to uncontrollable factors (e.g., access right of the current user group), the newsstories retrieved from Reuters consist of on average 10–15% missing data. In particular, when queryingnews stories using the identifier (i.e., storyID from Eikon API) specified in the news headline, some arenot associated with any accessible news stories even after several retries. Specifically, 47 out of 298 storiesfrom TWTR and 36 out of 391 stories from FB evaluation dataset are missing or presumably cannot beaccessed with the current level of privilege.
2. Multimedia News Stories: Unlike traditional article-based news, the financial news stories from Eikon APIare primarily comprised of multimedia content from partnered news agencies. Particularly, 135 out of 298stories from TWTR and 108 out of 391 stories from FB evaluation dataset only contain an URL to RefinitivNewscasts3 in formats of multimedia content, which require additional steps (i.e., automated transcriptiontechnique for speech-to-text) before applying the NER technique for extracting named entities.
3. Irrelevant Historical News: It is observed that most of the retrieved news headlines are irrelevant to thecause of the financial anomaly, especially for articles that are days before the anomaly date. Although thisobservation is expected because analyst reports regarding the cause of financial anomaly usually publishedhours after the anomalous price movements as discussed in Section 3.3, such delay is much shorter onsocial media like Twitter. Hence, the practicality of historical Reuters News is inconclusive.
In addition, the benefit of including names of key decision makers is negligible, as only less than 0.05% doc-uments are mentioning the name of key decision makers without addressing the company name using wordsor tags. Intuitively, this phenomenon is expected because it is unusual for people to discuss the cause of anextreme price movement without addressing the company by its name. Even when the key decision makers arethe source of the anomaly, it is unlikely for a human to directly link the information to the stock market withoutdomain knowledge. For instance, in the Microsoft example mentioned in Section 3.3.1, the prerequisite of peo-ple connecting the divorce between two key decision makers (i.e., Bill and Melinda Gates) and the stock priceof Microsoft is the knowledge of (i) Bill Gates is one of the founders of Microsoft (ii) the divorce can negativelyimpact the stock by diluting the shares possessed by Bill Gates. Therefore, for reliable knowledge that discussesthe potential cause of a financial anomaly, an explicit association between the information and the stock priceshould be addressed in the text, or a trivial implicit linkage can be assumed by the general public instead ofmentioning only the information without context.
3Refinitiv Newscasts is an online video platform that offers high-quality financial news from Reuters and trusted third-party partners informats of multimedia (e.g., recorded videos, live shows and audio podcast).
50
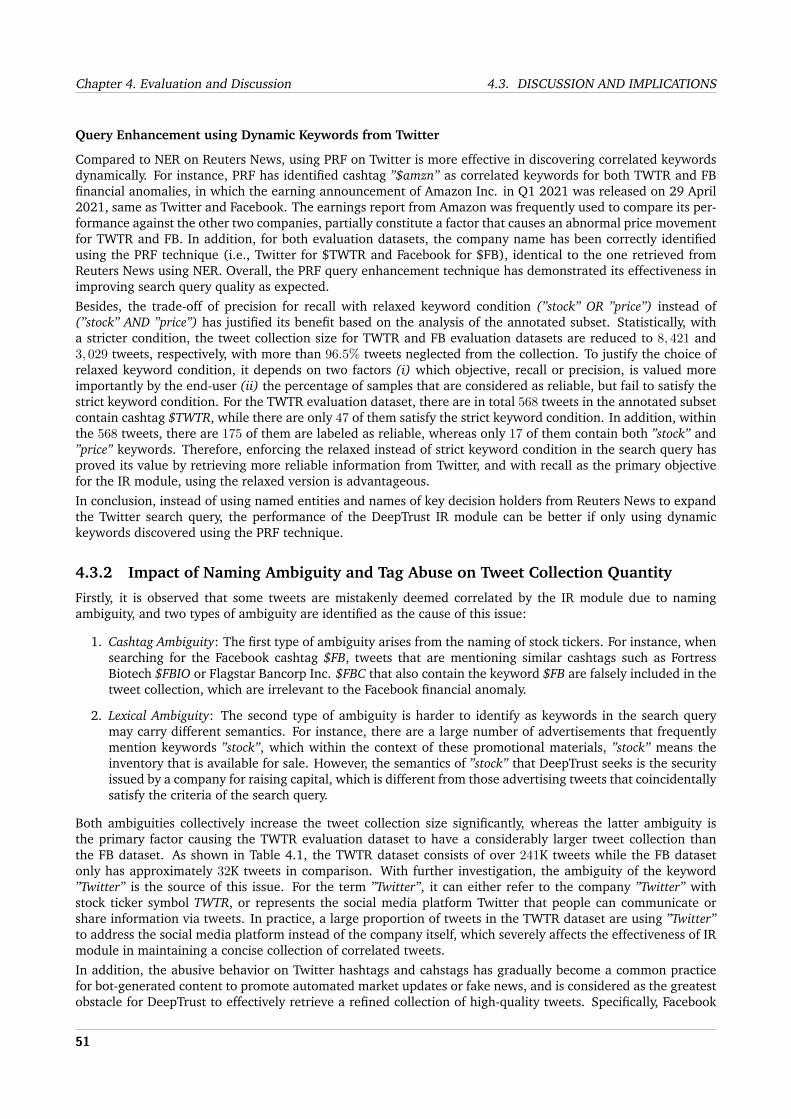
Chapter 4. Evaluation and Discussion 4.3. DISCUSSION AND IMPLICATIONS
Query Enhancement using Dynamic Keywords from Twitter
Compared to NER on Reuters News, using PRF on Twitter is more effective in discovering correlated keywordsdynamically. For instance, PRF has identified cashtag ”$amzn” as correlated keywords for both TWTR and FBfinancial anomalies, in which the earning announcement of Amazon Inc. in Q1 2021 was released on 29 April2021, same as Twitter and Facebook. The earnings report from Amazon was frequently used to compare its per-formance against the other two companies, partially constitute a factor that causes an abnormal price movementfor TWTR and FB. In addition, for both evaluation datasets, the company name has been correctly identifiedusing the PRF technique (i.e., Twitter for $TWTR and Facebook for $FB), identical to the one retrieved fromReuters News using NER. Overall, the PRF query enhancement technique has demonstrated its effectiveness inimproving search query quality as expected.Besides, the trade-off of precision for recall with relaxed keyword condition (”stock” OR ”price”) instead of(”stock” AND ”price”) has justified its benefit based on the analysis of the annotated subset. Statistically, witha stricter condition, the tweet collection size for TWTR and FB evaluation datasets are reduced to 8, 421 and3, 029 tweets, respectively, with more than 96.5% tweets neglected from the collection. To justify the choice ofrelaxed keyword condition, it depends on two factors (i) which objective, recall or precision, is valued moreimportantly by the end-user (ii) the percentage of samples that are considered as reliable, but fail to satisfy thestrict keyword condition. For the TWTR evaluation dataset, there are in total 568 tweets in the annotated subsetcontain cashtag $TWTR, while there are only 47 of them satisfy the strict keyword condition. In addition, withinthe 568 tweets, there are 175 of them are labeled as reliable, whereas only 17 of them contain both ”stock” and”price” keywords. Therefore, enforcing the relaxed instead of strict keyword condition in the search query hasproved its value by retrieving more reliable information from Twitter, and with recall as the primary objectivefor the IR module, using the relaxed version is advantageous.In conclusion, instead of using named entities and names of key decision holders from Reuters News to expandthe Twitter search query, the performance of the DeepTrust IR module can be better if only using dynamickeywords discovered using the PRF technique.
4.3.2 Impact of Naming Ambiguity and Tag Abuse on Tweet Collection Quantity
Firstly, it is observed that some tweets are mistakenly deemed correlated by the IR module due to namingambiguity, and two types of ambiguity are identified as the cause of this issue:
1. Cashtag Ambiguity: The first type of ambiguity arises from the naming of stock tickers. For instance, whensearching for the Facebook cashtag $FB, tweets that are mentioning similar cashtags such as FortressBiotech $FBIO or Flagstar Bancorp Inc. $FBC that also contain the keyword $FB are falsely included in thetweet collection, which are irrelevant to the Facebook financial anomaly.
2. Lexical Ambiguity: The second type of ambiguity is harder to identify as keywords in the search querymay carry different semantics. For instance, there are a large number of advertisements that frequentlymention keywords ”stock”, which within the context of these promotional materials, ”stock” means theinventory that is available for sale. However, the semantics of ”stock” that DeepTrust seeks is the securityissued by a company for raising capital, which is different from those advertising tweets that coincidentallysatisfy the criteria of the search query.
Both ambiguities collectively increase the tweet collection size significantly, whereas the latter ambiguity isthe primary factor causing the TWTR evaluation dataset to have a considerably larger tweet collection thanthe FB dataset. As shown in Table 4.1, the TWTR dataset consists of over 241K tweets while the FB datasetonly has approximately 32K tweets in comparison. With further investigation, the ambiguity of the keyword”Twitter” is the source of this issue. For the term ”Twitter”, it can either refer to the company ”Twitter” withstock ticker symbol TWTR, or represents the social media platform Twitter that people can communicate orshare information via tweets. In practice, a large proportion of tweets in the TWTR dataset are using ”Twitter”to address the social media platform instead of the company itself, which severely affects the effectiveness of IRmodule in maintaining a concise collection of correlated tweets.In addition, the abusive behavior on Twitter hashtags and cahstags has gradually become a common practicefor bot-generated content to promote automated market updates or fake news, and is considered as the greatestobstacle for DeepTrust to effectively retrieve a refined collection of high-quality tweets. Specifically, Facebook
51

4.3. DISCUSSION AND IMPLICATIONS Chapter 4. Evaluation and Discussion
Figure 4.1: An overview of Tags per Tweet histogram on Twitter, Facebook, Tesla and Apple tweet collections. Alltweets that contain more than 10 tags are counted for analysis.
and Apple Inc., as part of the FAANG4 companies, are generally more popular in terms of tags usage comparingto small and medium-sized enterprises (SMEs), while Twitter and Tesla Inc. have also attracted more attentionrecently due to the active engagement of their founders and CEOs on Twitter. Since these four companiesare popular choices of bot accounts to increase tweet exposure, they are selected as examples to illustratethe distribution of tags per tweet using their corresponding tweet collection retrieved from their anomalies5.Statistically, as presented in Figure 4.1, approximately 8–41%6 of them consists of more than 10 tags per tweet,which are commonly deemed as excessive and only appear in bot-generated tweets that wish to reach a widerpopulation with unnecessary trending tags for exposure.Besides, in the context of DeepTrust, cashtag abuse is more severe than hashtags due to its popularity in thefinancial domain. Since cashtag is widely adopted by users to communicate financial information on Twitter,bots that monitor the market and provide live stock market updates tend to include a large list of trendingcashtags to attract attention to its account. Figure 4.2 provides an overview on cashtag abuse. For all fourcompanies with excessive tags (i.e., more than 10 tags per tweet), the top 15 cashtags from each collection arepicked and counted based on their frequency of appearance. It is evident that regardless of which company isthe target entity, trending cahstags such as $TSLA, $AMZN, $AAPL, $SPY have always been mentioned frequentlyby these speculated bot-generated tweets. Therefore, the abusive behavior on tags, especially cashtags, severelyaffects the effectiveness of the IR module in retrieving tweets with high precision, as these bot-generated tweetshave continuously infiltrated into the tweet collection and dilute its overall quality.Nevertheless, bot-generated tweets exhibit specific patterns when using cashtags, which may be leveraged asa part of the feature-based filter to screen irrelevant stock market updates, whereas the effectiveness of thisapproach is questionable due to its aggressiveness. Firstly, it is observed that a large proportion of stock marketupdates tend to state the related cashtag at the beginning of the tweet, such as ”$FB Social media giant FacebookInc reported first-quarter revenue growth of 48% year-over-year.”, with approximately 10–20K7 tweets per datasetare using this writing style. To screen irrelevant stock market updates, a simple rule can be removing all tweetsthat start with an unknown cashtag that is not in the search query. However, such rule may be overly aggressiveas tweets may (i) contain multiple sentences, and each sentence starts with a different cashtag (ii) start witha seemly ”irrelevant” cashtag, but are correlated (e.g., the relationship between $AMZN and $FB). Therefore,
4FAANG is an abbreviation for the five prominent American companies in the information technology industry: Facebook, Amazon,Apple, Netflix and Google.
5In addition to the TWTR and FB financial anomalies, two additional anomalies, Tesla Inc. (i.e., extreme price movement on 22 Feb2021) and Apple Inc. (i.e., extreme price movement on 4 May 2021) are used to demonstrate the tag abuse behavior.
6Percentage of tweets that have more than 10 tags: Twitter 8.0%, Facebook 39.6%, Tesla 35.9% and Apple 40.6%.7There are 23, 535 tweets from the TWTR and 11, 202 tweets from the FB evaluation datasets that start with a cashtag.
52

Chapter 4. Evaluation and Discussion 4.3. DISCUSSION AND IMPLICATIONS
Figure 4.2: An overview of Cashtag Abuse barchart on Twitter, Facebook, Tesla and Apple tweet Collections. All tweetsthat contain more than 10 tags are collected first, and the top 15 cashtags from each collection are counted for analysis.
with recall as the primary objective for the IR module, these stock market updates are preserved and may befiltered based on their argumentation structure or subjectivity filter, instead of the position of cashtags.
4.3.3 Impact of Delayed Evaluation on Feature-based Filter Performance
From Table 4.3, it is evident that the feature-based filter alone is effective in filtering unreliable information, withapproximately 9–18% boost in precision and 5–14% increase in F0.5-scores when comparing with the baselineclassifier. In addition, when evaluating its performance using per-class metrics from Table 4.2, the feature-basedfilter individually has achieved the best precision metric among all candidates, with a slightly lower F0.5-scorecomparing with the combination of feature-based filter + synthetic text filter. In fact, among all three features(i.e., textual, tweet-meta and user) used for threshold-based classification, tweet-meta features that captureengagement metrics contribute the most in filtering unreliable tweets, causing approximately 50–71% tweetsfrom the TWTR and FB evaluation datasets8 excluded from the collection. A similar performance is observed inthe annotated subset, with approximately 75–84% unreliable tweets are correctly identified by the feature-basedfilter as presented in Table 4.2. Based on statistics, the feature-based filter is the most effective coarse-grainedscreening solution that identifies the most amount of trivially unreliable tweets.
However, the achieved effectiveness may not be replicated to another scenario with a shorter interval betweenanomaly date and evaluation period. For this project, evaluation datasets are collected between 10 June to 15July, 2021, more than five weeks after the anomaly occurred. One side effect of such delayed data collectionand evaluation is that future knowledge is used to assess tweet reliability, as tweet engagement metrics areclosely related to the popularity and perceived credibility of information on Twitter. With approximately onemonth buffer time, engagement metrics generally converge to a fixed number due to the tweet ranking systemsemployed by Twitter. As discussed in Section 3.3.2, recency, as one factor of the ranking and retrieval model,can influence the probability of tweets appearing in the top SERP. For tweets posted months in the past, it isreasonable to assume fewer users may interact with these old tweets unless using (i) explicit search querieswith specified time ranges or (ii) account-driven searches on tweets posted by a particular account, whichare less common in practice when browsing a topic on Twitter. Therefore, it is important to acknowledgethat regardless of the effectiveness of the tweet-meta feature alone in excluding unreliable tweets during thisexperiment, textual features and user features are equally important in distinguishing unreliable tweets and
8For TWTR evaluation dataset, 121, 669 out of 241, 714 tweets are excluded by feature-based filter based on tweet-meta features, and23, 269 out of 32, 983 tweets for FB evaluation dataset.
53

4.3. DISCUSSION AND IMPLICATIONS Chapter 4. Evaluation and Discussion
shed the light on information credible. If both datasets are collected minutes after the anomaly date, it isexpected tweet-meta features would be less useful as the majority of tweets may not be interacted by users yet,while traces hidden in the user and textual features may be the key indicator for information reliability.
4.3.4 Impact of Threshold Values on Feature-based Filter Performance
As stated in Section 3.4.2, DeepTrust uses a threshold-based feature filtering algorithm to exclude tweets withlimited public interactions (i.e., engagement metrics), while the minimum degree of engagement, expressed byfour prominent features of interaction, is configured to 0 for this project. However, in practice, the thresholdvalue should not be determined arbitrarily without supporting evidence, and one exceptional case is identifiedas a counterexample of using a threshold value of 0 for the feature-based filter.
In the second annotation sample included in Section 4.1.2, a typical stock price target update is deemed asreliable based on its implicit argumentation structure and its correlation with price movement. These tweetsare usually generated automatically by bot accounts that constantly monitor news feeds for price target updates,or can be generated by a neural model to confuse investors with falsified information. For both cases, financialdata providers like Refinitiv have sufficient tools and resources (e.g., robotics process automation solution thatcompares price target against curated stock fundamentals) to validate the price target using its knowledge baseconveniently, thus it is safe to assume all these types of tweets are reliable first by DeepTrust, and validateits correctness later. However, among all 443 tweets from the FB evaluation dataset that discuss stock pricetarget updates, 257 of them have no engagement metrics (i.e., 0 for all four tweet-meta features), and 1, 329out of 2, 683 tweets for TWTR evaluation dataset. In other words, with a threshold value of 0, approximately50–58% of tweets result in false negatives if assuming all updates are authentic, which can severely impact thefeature-based filter performance.
Nevertheless, for the feature-based filter, there is no simple solution that can preserve these stock market updatesin the collection while excluding irrelevant information in large-batch simultaneously. One naive approach canbe an expert-written list of exceptional cases, to ensure stock market updates or other forms of bot-generatedcontent (e.g., earnings calendar updates) that are meaningful are always deemed as reliable by the filter. How-ever, using a hard-coded list instead of relying on linguistic features affect the flexibility of DeepTrust, andpreparing such lists also requires extensive effort in both composing and maintaining it up to date. Therefore,instead of relying on DeepTrust to include all stock market updates into the trusted collection of tweets, it isadvised that analysts should reference price target updates from their proprietary data feeds such as RefinitivEikon, and ignore these updates from the Twitter data stream.
4.3.5 Impact of Rule Aggressiveness on Synthetic Text Filter Performance
For the synthetic text filter, there are several configurable parameters for users to adjust the filter aggressiveness,namely RoBERTa and SVM Classifier thresholds, GLTR-BERT and GLTR-GPT2 weights, and filter mode (i.e.,precision or recall mode). Among all these parameters, weights for GLTR-related variables are determined well-founded based on the average accuracy of the detector on 10-fold cross-validation, and the choice of filter modeis determined based on use cases. However, for the RoBERTa threshold, its value 0.7 is decided arbitrarily basedon empirical analysis. To investigate the impact of filtering rule aggressiveness on synthetic filter performance,a series of experiments are conducted to evaluate the sensitivity of performance metrics on changing RoBERTathreshold values.
Firstly, for binary classification on imbalanced classes, the default threshold of 0.5 may not represent an opti-mal decision boundary of the predicted probabilities, resulting in poorer performance. Although the synthetictext filter uses a rule-based system instead of a binary classifier, the rationale behind is comparable. Com-mon techniques adopted for identifying the optimal decision threshold include visualizing a receiver operatingcharacteristic (ROC) curve or precision-recall curve first, then select the best threshold that yields the lowestloss (e.g., categorical cross-entropy) or the greatest performance metric (e.g., F0.5-score for this project). Forthe synthetic text filter, instead of changing the decision threshold of the classifier, the RoBERTa threshold isselected based on its prominent impact on filter aggressiveness. As presented in Figure 4.3, the performanceof synthetic text filter (precision mode) is evaluated with different RoBERTa thresholds, from 0.0–1.0 with 0.01interval in-between. For each performance metric, per-class (i.e., negative class) and weighted metrics are cal-culated, including all key metrics defined in Section 4.2.2. For each subplot, the averaged RoBERTa threshold
54

Chapter 4. Evaluation and Discussion 4.3. DISCUSSION AND IMPLICATIONS
Figure 4.3: Sensitivity Analysis on how synthetic text filter performance is affected by changes in RoBERTa thresholdvalue that interpreted as filter aggressiveness. Classifier threshold is set to 0.9 and filter mode is precision.
that yields the greatest weighted metric on TWTR and FB annotated datasets are recorded and presented in thedashed green vertical line, and it is evident that a threshold greater than 0.5 is better for precision and F0.5-scores. In particular, for TWTR annotated subset, the optimal threshold for weighted F0.5-score is 0.9, and it is0.86 for FB annotated subset. However, when evaluating based on weighted precision, the optimal thresholdsfor TWTR and FB annotated are only 0.62 and 0.52, respectively, significantly lower than the optimal thresholdfor F0.5-scores. Nevertheless, both primary objectives require a threshold greater than 0.5, indicating that amore aggressive filter is preferred. Therefore, for Refinitiv that entirely focuses on the precision objective, aless aggressive filter (i.e., RoBERTa threshold 0.5–0.6) is more suitable, whereas for SMEs who seek a balancedsolution with more emphasis on precision, a more aggressive filter (i.e., RoBERTa threshold 0.8–0.9) is desirable.
In addition, as stated in [112], the 95% accuracy achieved by the pre-trained RoBERTa discriminative modelon its training data (i.e., WebText and synthetic texts generated by GPT-2-XL) is far from its full potential.During the training phase, both human-written and its corresponding synthetic text are presented to the modelunder paired settings, which is infeasible in practice. For standalone detection situations, this model mayunderperform due to the absence of reference texts, and result in lower performance metrics. To compensatefor its weakness under standalone scenarios, one suggestion proposed by OpenAI in [112] is to use this modelin conjunction with metadata-based filters, which is identical to the observation in our experiment. In termsof weighted metrics presented in Table 4.3, the combination of the feature-based filter and synthetic text filteryield the optimal performance among all candidates, and result in a 6–7% boost in F0.5-score compared withindividual synthetic text filter. Therefore, our experiment reinforces the conclusion made by the OpenAI team,and successfully enhances the overall performance of the RA module by leveraging the strength of multiplefilters, instead of relying on an excessively aggressive filter to improve performance metrics.
4.3.6 Impact of Ever-Stronger Adversaries on Synthetic Text Filter Effectiveness
It is evident that the synthetic text filter has achieved outstanding performance in filtering unreliable informa-tion, with the highest precision on both evaluation datasets. When used in conjunction with the feature-basedfilter, the F0.5-score has increased about 6% at the cost of a slight drop in precision as presented in Table 4.2.In fact, this combination has yielded the best F0.5-score and precision among all combinations when evaluatingusing weighted averages, and achieved the best metrics on the TWTR evaluation dataset when evaluating withper-class metrics, which has proved its effectiveness in filtering unreliable information. Both fine-tuning basedand supervised learning based approaches have collectively contributed to the effectiveness of this filter. How-ever, with the release of advanced few-shot learners such as GPT-3, whether this filter can maintain its sharpnessagainst the next frontier of generative writing is unknown, and it is essential to understand which agent, the
55

4.3. DISCUSSION AND IMPLICATIONS Chapter 4. Evaluation and Discussion
generator model or the discriminative model, in this adversarial game can win the race.
To understand the impact, the GPT-3 model proposed in [123], the latest version of few-shot learner in the GPTfamily with ten times more parameters (i.e., 175B parameters) than its predecessor GPT-2, is used to evaluatethe performance of the synthetic text filter. For instance, the following tweet is a neural text generated by theGPT-3 model9 based on the prompt ”stock”:
”I don’t care if you think $AAPL‘s stock is overpriced.
You’re wrong. Get over it and focus on true business metrics.”
in which even for a human, it is indistinguishable from a human-written tweet. In fact, when applying thesynthetic text filter, none of the detectors are able to identify it as a synthetic text based on its traces of languagemodeling. In particular, the RoBERTa detector claims this tweet being human-written with a probability of62.09%, while both SVM classifiers trained on TWTR financial anomaly predict this tweet as human-writtenwith 100.00% confidence. More interestingly, the GLTR frac(p) distribution for this tweet is nearly identical tothe histogram of the human-written tweet presented in Figure 3.3, with a balanced convex shape instead of aright-skewed distribution. Since the OpenAI team currently only invite selected researchers at institutions to jointheir private beta to explore the GPT-3, it is uncommon to see GPT-3 generated synthetic text on Twitter whenthis report is written, and the performance achieved by the synthetic text filter still reflects its true capability inscreening neural texts in present. Nevertheless, DeepTrust acknowledges that with more powerful adversariesreleased to the public, the performance can be overestimated by using evaluation datasets comprised of lessdeceptive neural texts generated by BERT or early versions of GPT models.
4.3.7 Impact of Writing Style Difference on Argumentation Filter Performance
For the argumentation filter, its performance is identical to an inversed baseline classifier, by predicting alltweets as reliable under the relaxed definition of argumentativeness. As presented in Table 4.2, metrics forthe argumentation filter are all 0.00% as no tweets are predicted as unreliable, and when used in conjunctionwith other filters, it has no impact on the overall performance as it always outputs true for all tweets in bothevaluation datasets. In addition, this filter has only two settings (i.e., depending on whether an argumentativetweet should contain only premise or both claim and premise), in which the relaxed setting will predict all tweetsas reliable and the strict setting will predict all tweets as unreliable. Therefore, this filter fails to derive tweetreliability based on its argumentation structure, and it is essential to understand the cause of ineffectiveness.
Unfortunately, though the author redefined the Twitter-specific argumentativeness and leveraged state-of-the-art sequence tagger TARGER to detect argumentative units in tweets, the absence of DART still severely impactsthe effectiveness of the argumentation filter. In particular, the training dataset for TARGER comprises snippetsfrom Wikipedia, written in a different style than posts on Twitter. For all English Wikipedia articles, a styleguideline named Manual of Style (MoS) proposed by Wikipedia is enforced to improve the readability of pages,including instructions on capitalization, punctuation, grammar and other grammatical features. For instance, inthe IBM Debator - Claim Evidence Search dataset, a typical financial sentence takes a formal writing style withproper usage of punctuation:
”The stock market liked the acquisition and the price of Ariba’s shares rose from $57 at the time ofthe announcement to $173 at closing on March 9, 2000, which also marked the peak of the InternetBubble.”
whereas tweets are mostly written in an informal tone, such as examples presented in Section 3.4.3. Althoughadditional preprocessing techniques are applied to transform tweets into a similar format, the difference is stilldrastic and the sequence tagger cannot properly identify claims from them. In addition, due to the characterlimit, it is common to use implicit claims, or replace them with abbreviations and Twitter-specific features likecashtags as discussed in Section 3.4.4. For humans, they can easily associate the tweet with its implicit claimusing domain knowledge, whereas for the sequence tagger, only explicit claims can be identified. Therefore,instead of using a sequence tagger trained on Wikipedia, a classifier trained on tweets with annotated argumen-tative units is believed to be more effective in filtering unreliable tweets based on its argumentation structure.
9Generated using the interface developed by Sushant Kumar, available at: https://thoughts.sushant-kumar.com.
56
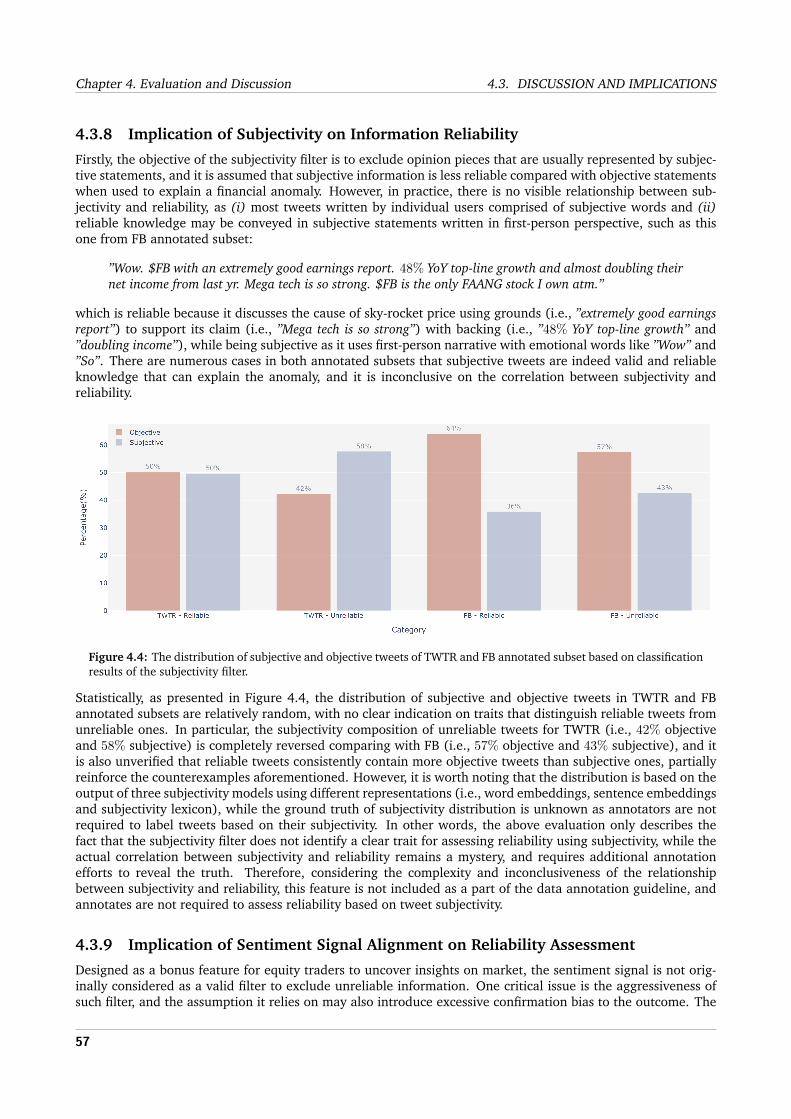
Chapter 4. Evaluation and Discussion 4.3. DISCUSSION AND IMPLICATIONS
4.3.8 Implication of Subjectivity on Information Reliability
Firstly, the objective of the subjectivity filter is to exclude opinion pieces that are usually represented by subjec-tive statements, and it is assumed that subjective information is less reliable compared with objective statementswhen used to explain a financial anomaly. However, in practice, there is no visible relationship between sub-jectivity and reliability, as (i) most tweets written by individual users comprised of subjective words and (ii)reliable knowledge may be conveyed in subjective statements written in first-person perspective, such as thisone from FB annotated subset:
”Wow. $FB with an extremely good earnings report. 48% YoY top-line growth and almost doubling theirnet income from last yr. Mega tech is so strong. $FB is the only FAANG stock I own atm.”
which is reliable because it discusses the cause of sky-rocket price using grounds (i.e., ”extremely good earningsreport”) to support its claim (i.e., ”Mega tech is so strong”) with backing (i.e., ”48% YoY top-line growth” and”doubling income”), while being subjective as it uses first-person narrative with emotional words like ”Wow” and”So”. There are numerous cases in both annotated subsets that subjective tweets are indeed valid and reliableknowledge that can explain the anomaly, and it is inconclusive on the correlation between subjectivity andreliability.
Figure 4.4: The distribution of subjective and objective tweets of TWTR and FB annotated subset based on classificationresults of the subjectivity filter.
Statistically, as presented in Figure 4.4, the distribution of subjective and objective tweets in TWTR and FBannotated subsets are relatively random, with no clear indication on traits that distinguish reliable tweets fromunreliable ones. In particular, the subjectivity composition of unreliable tweets for TWTR (i.e., 42% objectiveand 58% subjective) is completely reversed comparing with FB (i.e., 57% objective and 43% subjective), and itis also unverified that reliable tweets consistently contain more objective tweets than subjective ones, partiallyreinforce the counterexamples aforementioned. However, it is worth noting that the distribution is based on theoutput of three subjectivity models using different representations (i.e., word embeddings, sentence embeddingsand subjectivity lexicon), while the ground truth of subjectivity distribution is unknown as annotators are notrequired to label tweets based on their subjectivity. In other words, the above evaluation only describes thefact that the subjectivity filter does not identify a clear trait for assessing reliability using subjectivity, while theactual correlation between subjectivity and reliability remains a mystery, and requires additional annotationefforts to reveal the truth. Therefore, considering the complexity and inconclusiveness of the relationshipbetween subjectivity and reliability, this feature is not included as a part of the data annotation guideline, andannotates are not required to assess reliability based on tweet subjectivity.
4.3.9 Implication of Sentiment Signal Alignment on Reliability Assessment
Designed as a bonus feature for equity traders to uncover insights on market, the sentiment signal is not orig-inally considered as a valid filter to exclude unreliable information. One critical issue is the aggressiveness ofsuch filter, and the assumption it relies on may also introduce excessive confirmation bias to the outcome. The
57

4.3. DISCUSSION AND IMPLICATIONS Chapter 4. Evaluation and Discussion
following paragraphs use both statistics and reasoning to justify if leveraging a sentiment filter is effective ornot for DeepTrust, and some lessons learned from experimenting with this filter.
In general, a stock price surge indicates bullish market sentiment while a stock price crash indicates bearishmarket sentiment. Hence, a sentiment filter operates by assuming correlated tweets should contain an alignedsentiment with the price movement direction, either because (i) the tweet uses sentiment-aligned keywordswhen describing the price movement or (ii) anomalous price movement is caused by a sentiment-aligned issue,and the tweet is discussing it using sentiment-aligned keywords. For instance, when describing the TWTRfinancial anomaly, common descriptive keywords such as ”tanking”, ”crash” are all associated with negativesentiment. In addition, when describing the cause of anomaly like ”weak future guidance” and ”slow user growth”,the overall sentiment of these tweets is likely to be negative, aligned with the price movement. Statistically, forTWTR annotated subset, 60.10%10 tweets are aligned with the negative price movement, while 72.22%11 tweetsin FB annotated subset align with the positive sentiment brought by the stock price surge. It is evident thatthe majority of reliable tweets have a sentiment that is neutral or aligned with price movement direction, andvalidates the aforementioned assumption on sentiment signal alignment.
Nevertheless, there exist several counterexamples that contradict the above findings. Firstly, both TWTR and FBfinancial anomalies are not representative of the whole universe of equity markets, such as the bond market andderivatives market (e.g., options, futures). Considering a European put option that allows the holder to sell theassociated equity at expiry with the strike price, investors may only earn profits if the stock price is far belowthe strike price to cover the cost of option premium. Consequently, these investors largely rely on negative newsof the company to bring down the stock price before the expiry date, and earn profit in the opposite directionto traditional traders that open positions by buying stock shares. In addition, short selling is another scenarioin which the overall sentiment can be the opposite of the price movement direction. In the financial field, shortselling is a trading strategy that investors use to generate profit by speculating on the decline in equity price,and is legit in most countries including the United States and the United Kingdom. Unlike traditional stocktrading strategies that earn profit from higher stock price, shorting shares require investors to borrow sharesupfront and sell it to other investors, and earn profit by purchasing them back later with a lower stock price.Thus, experienced investors using this strategy would anticipate the stock price to decline, and express a positivesentiment when it occurred, which contradicts the assumption on sentiment signal alignment.
Overall, since using the sentiment signal from Twitter is less reliable and excessively aggressive, this filter isexcluded from the DeepTrust framework. However, the market sentiment is essential for short-term investorsto earn profit based on its impact on technical indicators. For instance, market sentiment may assist contrarianinvestors, who trade inversely to the prevailing consensus, to understand if equity is overvalued or undervalued.Instead of relying on Twitter sentiment signals, market sentiment indexes such as CBOEVolatility Index (VIX)are popular choices for analysts to understand investor confidence in the market. VIX, calculated based onoption premium, measures the expectation for volatility over the next month, and indicates whether investorsare optimistic or pessimistic about the market. Therefore, though the sentiment filter can only apply to a limitednumber of markets, market sentiment indexes are generally more reliable and flexible when applying to complexmarkets like the derivatives market.
10TWTR: Out of 208 reliable tweets, 125 tweets have negative sentiment, 50 tweets are neutral and 33 tweets have positive sentiment.11FB: Out of 216 reliable tweets, 45 tweets have negative sentiment, 15 tweets are neutral and 156 tweets have positive sentiment.
58

CHAPTER 5
Concluding Remarks
5.1 Conclusion
In this project we proposed DeepTrust, a practical knowledge retrieval and assessment framework for equitytraders to understand the cause of pricing anomalies with non-standard data sources. The framework consistsof three core modules, namely the (i) anomaly detection module - detect extreme price moves in the securitiesmarket (ii) information retrieval module - collect unstructured data from Twitter that are correlated to thefinancial anomaly (iii) reliability assessment module - refine a quality collection of reliable information thatexplains sudden price changes. The objective of DeepTrust is to source and organize disparate information thatuncovers insights of a sudden price surge or crash, using unstructured data from Twitter. Through extensiveanalysis, DeepTrust is capable of collecting a concise curated database of correlated financial information fromthe ocean of tweets, and distinguishing various forms of unreliable information precisely, including human-written disinformation, synthetic text and opinion pieces. In addition, as a collaborative project with Refinitiv, acustomer-centric prototype is developed for end-users to experiment DeepTrust on recent pricing anomalies ofTwitter Inc. and Facebook Inc, and evaluate its performance accordingly using an annotated dataset labeled bythe author following a well-defined annotation guideline based on the definition of financial reliability.
To the best of our knowledge, DeepTrust is the first domain-specific framework that detects, gathers and under-stands financial anomalies using NLP. Compared with other existing reliability assessment solutions like multi-modal framework SpotFake for fake news detection and heuristic-driven ensemble Framework for COVID-19disinformation detection, DeepTrust shows outstanding performance in screening unreliable information fromdifferent angles, including textual and tweet-meta features, traces of generative language model, argumen-tation structure and subjectivity. The proposed framework outperforms the baselines by a margin of 16.53%precision and 11.76% F0.5-score on weighted averages. Besides assessing reliability, DeepTrust can also sharplydetermine spikes in stock price caused by unexpected events like Mergers and Acquisitions (M&A) rumors, andgather event-related information from Twitter using enhanced structured queries constructed in an unsuper-vised manner. Evaluations on both datasets devised for this framework demonstrate prominent performance onall three tasks and achieves its objectives stated in Section 1.2. Although there are still room for improvementon more complex securities markets (e.g., derivatives market, bond market) and more deceptive disinformationgenerated by ever-stronger language models, DeepTrust offers a sophisticated yet flexible solution for financialdata providers to alleviate the burden on screening information from social media feeds manually, and shed thelight on pricing anomalies with a reliable yet concise collection of tweets.
5.2 Legal, Social, Ethical and Professional Considerations
Based on the ethics checklist1 from Imperial College London Department of Computing, this project involves (i)personal data collection and processing (ii) exclusive civilian application focus. All other stated ethical concernsare not applicable to this project, thus neglected in the following discussion.
Firstly, DeepTrust involves collecting and processing personal data publicized on Twitter. Based on the GeneralData Protection Regulation (GDPR)2 Article 4, personal data refers to ”information relating to an identified oridentifiable natural person” who can be ”identified, directly or indirectly, in particular by reference to an identifiersuch as a name...”. Tweets published on Twitter is, therefore, considered as personal data because it containsdirect identifiers (e.g., author name, profile picture) and indirect identifiers (e.g., geolocation) of a naturalperson, and all tweets collected and processed in this project are protected by GDPR legislation. Since processingpolitical opinions is prohibited in general based on GDPR Article 9 (i), DeepTrust intentionally neglects politicalpolling fields when collecting information from Twitter, and focuses only on contents exempted from the statedprohibited categories.
1Ethics checklist is available at: https://www.doc.ic.ac.uk/lab/msc-projects/ethics-checklist.xlsx.2General Data Protection Regulation is a new regulation on data protection applicable to European Union starting from 2018.
59

5.3. FUTURE WORKS Chapter 5. Concluding Remarks
In addition, based on the compliance requirement from Twitter, it is the obligation of developers and researchersto honor user intent on Twitter by respecting the changes users made to the availability of their posted content,such as modification and deletion. The rationale is that tweets are private data on public social media platformsbased on ongoing consent under a contract between the viewer and author, and the viewer only has the rightof data disposition instead of data ownership. To comply with this term, DeepTrust provides an update featurein the information retrieval module to assist users in updating the retained tweet collection and ensuring it issynchronized with the latest image on Twitter.
Besides, to ensure security for the curated database, DeepTrust originally intends to apply anonymization onpersonal data after the completion of this thesis. As stated in GDPR Recital 26, ”The principles of data protec-tion should therefore not apply to anonymous information”, in which the anonymous information means it isunrelated to a natural person using direct or indirect identifiers. To be fully qualified for anonymization, theretained database should be deleted as both the tweet content and its metadata can be used to identify a nat-ural person, which makes evaluation results presented in this thesis not reproducible. Nevertheless, DeepTrustapplies pseudonymization, which replaces identifiers (i.e., metadata and all other fields except for the tweet ID)with a private number, and this safeguarding measure complies with Article 89 for ”archiving purposes in thepublic interest, scientific or historical research purposes or statistical purposes”, and other researchers may use thispseudonymized dataset for further experiments.
From an environmental perspective, training and fine-tuning ever-larger language models introduce significantenvironmental and financial costs to the project. Following the benchmark conducted by Strubell et al., traininga BERT-base model on GPUs is equivalent to a domestic flight in terms of CO2 emission [124], while Deep-Trust leverages several complex models such as GPT-2 and FinBERT that are trained with a larger dataset withhyperparameter tuning. These increasing environmental and financial costs are mostly borne by marginalizedcommunities that are less benefited by the introduced framework and more harmed by the negative environ-mental consequences from the electricity and CO2 emissions, as advised by Bender et al. [125]. Fortunately,this project largely benefits from pre-trained models and applies transfer learning to migrate models into thefinancial domain on Twitter, instead of retraining them from scratch. Using training logs from the Weights& Bias training tracker 3 and Python logging facility, approximately 30 days of GPU computation is used fortraining classifiers and fine-tuning language models throughout this project, and all computations are done ona single NVidia GTX 1080 Ti graphics card. Using the Machine Learning Impact calculator, the estimated carbonemission is 77.76 kg CO2-equivalent4, and may bring 77.76 Global Warming Potential (GWP) to the Earth, whichquantifies the warming brought by energy emission over the next 100 years. Overall, DeepTrust is developedconscious of financial and environmental costs associated with model training, and utilizes computing resourcesefficiently to reduce carbon footprint whenever feasible.
5.3 Future Works
5.3.1 Financial Information Retrieval from Multiple Social Media Platforms
In addition to Twitter, the public may use other social media platforms to discuss or plan a mass collaborativestrike to the stock market, causing an abnormal price movement out of blue. The most prominent example in2021 is the story of GameStop5, in which a group of retail investors from Reddit purchase a massive amount ofshares of GameStop, as a revenge to Wallstreet elites and hedge funds who have heavily shorted the companyfor its poor performance over past years. Although it is unexpected to most investors, there are several cluesthat can be found on the social media days before the financial anomaly happened. Weeks before the pricerockets, well-informed individuals have started to widely post information on Reddit chatroom r/wallstreetbetsabout the Short Squeeze action, which may trigger an unexpected stock price raise to force short-sellers toclose their positions and iteratively driving up the stock price due to low-supply of tradable shares. The shortsqueeze action started on 22 January 2021, and drastically boosted the stock price from around $20 per shareto its peak at $469.2 per share on 28 January 2021. This example shows that retail investors may use socialmedia platforms other than Twitter to discuss financial information, or even plan a collective action that mayimpact the stock price severally with abnormal trading behavior. Therefore, the DeepTrust information retrieval
3Weights & Bias is a developer tool for experiment tracking, available at https://wandb.ai/site.4Estimations calculated by Machine Learning Impact Calculator [126], available at https://mlco2.github.io/impact#compute.5GameStop Corporation is a US chain gaming and trade-in retailers, traded on NYSE with stock symbol GME.
60

Chapter 5. Concluding Remarks 5.3. FUTURE WORKS
module may be extended to include information from other social media networks such as Reddit and Discord,so to capture more relevant information that may inform financial analysts on the cause of abnormal pricingmovements.
To upgrade DeepTrust and support processing information from multiple data sources, there are several majoradjustments needed. Firstly, the information retrieval module needs to include additional handlers to communi-cate and extract information from the Reddit and Discord API, and the Pseudo-Relevance Feedback mechanismshould also be customized for each portal. In addition, synthetic text filters should also be adjusted for differentwriting styles in each social media platform. For instance, it is uncommon to see hashtags and emojis on Redditcomparing to Twitter, and the writing styles may be different in each platform, so the SVM classifiers need tobe fine-tuned separately for each data source. Lastly, Reddit is a forum in which the discussions under eachstandalone post are equally important as the original post itself. Therefore, a knowledge graph may be adoptedto capture interlinked entities mentioned about a certain topic.
5.3.2 Real-Time Reliable Financial Information Retrieval Framework
Instead of understanding the cause of a financial anomaly in the past, the DeepTrust framework can be adjustedto support real-time market anomaly detection and explanation features, referencing the pioneering work donein Project Mosaic from Refinitiv Labs6. The key challenge would be completing the work of all three moduleswithin a limited time frame, which demands a more sophisticated solution.
To fully support real-time analytics, all three modules in the DeepTrust framework require a certain amount ofrework. Firstly, the AD module should include another mode of detection with machine learning models trainedon historical pricing data, and continuously evaluate if a price movement is anomalous or expected. Low-latencyprediction should be enforced so that whichever time interval (e.g., tick, 1 minute, 5 minutes, 1 hour) is usedfor the pricing data, abnormal events can be detected immediately for user actions. In addition, the IR moduleneeds to be slightly adjusted to use recent search instead of full-archive search on Twitter, and paginationshould also be properly configured to avoid including duplicate information into the tweet collection. Lastly,there are no adjustments needed for the RA module to support a low-latency assessment on tweet reliability asall components are implemented with a RESTful API, so pre-trained models are loaded using another spawnedsubprocess for generating predictions. Overall, the objective of this enhanced DeepTrust is to take a proactiveapproach to explain extreme price movements in real-time using reliable information extracted from Twitter.
5.3.3 Weighted Reliability Score using Author Reputation
In the present design, the feature-based filter primarily uses public metrics of tweets and their author to infersource credibility, while this design can be extended to a reputation-based credibility assessment engine thatuses author metadata to infer tweet reliability with greater precision. For instance, the credibility analysissystem proposed by Alrubaian et al. used hybrid-level feature extraction on both tweet and author informationto calculate averaged sentiment score and popularity score based on event engagement, public metrics andhistorical tweets [127]. Each feature is ranked based on its influence on perceived credibility, then used tocalculate an aggregated credibility score for training a supervised classifier. The system was evaluated using anannotated dataset on the topic of Houthis movement in Yemen with 1.4M tweets from 489K authors, and hasaround 85–95% accuracy over two testing datasets. A similar system TweetCred was proposed in Gupta et al.,in which a set of 45 features extracted from both tweet and author metadata are used to train an SVM classifieron classifying tweet credibility during the 6 famous chaotic events of 2013 [128].
Therefore, DeepTrust can leverage influential features with prominent impacts on perceived source credibility,and enhance the existing feature-based filter into a comprehensive reliability assessment engine that assigns aweighted score to each author. A tweet can therefore be filtered based on a combination of its textual contentand the weighted credibility score of its author, instead of relying on an absolute threshold on its public metrics.
6Project Mosaic is a real-time analytical tool that assists financial analysts to identify and understand anomalous price movements.
61

Bibliography[1] Refinitiv. Financial news coverage. URL https://www.refinitiv.com/en/financial-data/
financial-news-coverage. pages 1[2] Andrej Cwynar, Wiktor Cwynar, Robert Pater, and Kamil Filipek. Social media as an information source in finance:
Evidence from the community of financial market professionals in poland. International Journal of Digital AccountingResearch, 19, 2019. pages 1
[3] Shivangi Singhal, Rajiv Ratn Shah, Tanmoy Chakraborty, Ponnurangam Kumaraguru, and Shin’ichi Satoh. Spotfake:A multi-modal framework for fake news detection. In 2019 IEEE Fifth International Conference on Multimedia BigData (BigMM), pages 39–47. IEEE, 2019. pages 1, 15
[4] Yaqing Wang, Fenglong Ma, Zhiwei Jin, Ye Yuan, Guangxu Xun, Kishlay Jha, Lu Su, and Jing Gao. Eann: Eventadversarial neural networks for multi-modal fake news detection. In Proceedings of the 24th acm sigkdd internationalconference on knowledge discovery & data mining, pages 849–857, 2018. pages 1
[5] Melissa Wall. Citizen journalism: A retrospective on what we know, an agenda for what we don’t. Digital Journalism,3(6):797–813, 2015. pages 3
[6] The 2014 yearontwitter, . URL https://blog.twitter.com/official/en_us/a/2014/the-2014-yearontwitter.
html. pages 3[7] Kai Shu, Amy Sliva, Suhang Wang, Jiliang Tang, and Huan Liu. Fake news detection on social media: A data mining
perspective. ACM SIGKDD explorations newsletter, 19(1):22–36, 2017. pages 3[8] James W. Kershner. The elements of news writing. Pearson Allyn Bacon, 2012. pages 3[9] Claire Wardle. Fake news. it’s complicated., Dec 2018. URL https://medium.com/1st-draft/
fake-news-its-complicated-d0f773766c79. pages 3[10] Edson C Tandoc Jr, Zheng Wei Lim, and Richard Ling. Defining “fake news” a typology of scholarly definitions. Digital
journalism, 6(2):137–153, 2018. pages 3[11] Jonathan Albright. The election 2016 micro propaganda machine, Jan 2017. URL https://d1gi.medium.com/
the-election2016-micro-propaganda-machine-383449cc1fba. pages 3[12] Al Jazeera. Suez canal blockage sends oil prices rebounding after sell-off, Mar 2021. URL https://www.aljazeera.
com/economy/2021/3/24/bb-suez-canal-blockage-sends-oil-prices-rebounding-after-sell-off. pages 4[13] Chris J Vargo, Lei Guo, and Michelle A Amazeen. The agenda-setting power of fake news: A big data analysis of the
online media landscape from 2014 to 2016. New media & society, 20(5):2028–2049, 2018. pages 4[14] Sec charges: False tweets sent two stocks reeling in market manipulation, Nov 2015. URL https://www.sec.gov/
news/pressrelease/2015-254.html. pages 4[15] Huong Nguyen Thi Xuan, Anh Cuong Le, et al. Linguistic features for subjectivity classification. In 2012 International
Conference on Asian Language Processing, pages 17–20. IEEE, 2012. pages 5, 20[16] Sonnet Ireland. Fake news alerts: Teaching news literacy skills in a meme world. The Reference Librarian, 59:1–7, 04
2018. doi: 10.1080/02763877.2018.1463890. pages 5[17] Mark Weisbrot. Brazil’s democracy pushed into the abyss, Jan 2018. URL https://www.nytimes.com/2018/01/23/
opinion/brazil-lula-democracy-corruption.html. pages 5[18] Mariana Valente, Renata Avila Pinto, Anita Gurumurthy, Reem Al Masri, Ted Piccone, Jonathan Perri, Cass
Sunstein, Lucy Purdon, Raiane Assumpcao, Lucia Sestokas, and et al. Fake news: what it is and how todeal with it - sur - international journal on human rights, Nov 2018. URL https://sur.conectas.org/en/
fake-news-what-it-is-and-how-to-deal-with-it/. pages 5[19] Bing Liu. Sentiment analysis and opinion mining. Synthesis lectures on human language technologies, 5(1):1–167,
2012. pages 5[20] Evgenia Yavrumyan. Efficient market hypothesis and calendar effects: Evidence from the oslo stock exchange. Mas-
ter’s thesis, 2015. pages 5[21] Jiawei Han, Micheline Kamber, and Jian Pei. Data mining concepts and techniques third edition. The Morgan
Kaufmann Series in Data Management Systems, 5(4):83–124, 2011. pages 5[22] Seyed Koosha Golmohammadi. Time series contextual anomaly detection for detecting stock market manipulation.
2016. pages 5[23] AM Rajeswari, SK Yalini, R Janani, N Rajeswari, and C Deisy. A comparative evaluation of supervised and unsu-
62

BIBLIOGRAPHY BIBLIOGRAPHY
pervised methods for detecting outliers. In 2018 Second International Conference on Inventive Communication andComputational Technologies (ICICCT), pages 1068–1073. IEEE, 2018. pages 5
[24] Mohiuddin Ahmed, Abdun Naser Mahmood, and Jiankun Hu. Outlier detection. The state of the art in intrusionprevention and detection, pages 3–21, 2014. pages 6
[25] Mennatallah Amer and Markus Goldstein. Nearest-neighbor and clustering based anomaly detection algorithms forrapidminer. In Proc. of the 3rd RapidMiner Community Meeting and Conference (RCOMM 2012), pages 1–12, 2012.pages 6
[26] Chu-Hsing Lin, Jung-Chun Liu, and Chia-Han Ho. Anomaly detection using libsvm training tools. In 2008 interna-tional conference on information security and assurance (isa 2008), pages 166–171. IEEE, 2008. pages 6
[27] Mohiuddin Ahmed, Nazim Choudhury, and Shahadat Uddin. Anomaly detection on big data in financial markets.In 2017 IEEE/ACM International Conference on Advances in Social Networks Analysis and Mining (ASONAM), pages998–1001. IEEE, 2017. pages 6
[28] Koosha Golmohammadi and Osmar R Zaiane. Time series contextual anomaly detection for detecting market manip-ulation in stock market. In 2015 IEEE International Conference on Data Science and Advanced Analytics (DSAA), pages1–10. IEEE, 2015. pages 6
[29] Lori Hutwagner, William Thompson, G Matthew Seeman, and Tracee Treadwell. The bioterrorism preparedness andresponse early aberration reporting system (ears). Journal of Urban Health, 80(1):i89–i96, 2003. pages 6
[30] James Allan, Jaime G Carbonell, George Doddington, Jonathan Yamron, and Yiming Yang. Topic detection andtracking pilot study final report. 1998. pages 6
[31] Kristin P Bennett, Ayhan Demiriz, and Richard Maclin. Exploiting unlabeled data in ensemble methods. In Proceedingsof the eighth ACM SIGKDD international conference on Knowledge discovery and data mining, pages 289–296, 2002.pages 6
[32] Yiming Yang, Tom Pierce, and Jaime Carbonell. A study of retrospective and on-line event detection. In Proceedingsof the 21st annual international ACM SIGIR conference on Research and development in information retrieval, pages28–36, 1998. pages 6, 9
[33] James Allan, Ron Papka, and Victor Lavrenko. On-line new event detection and tracking. In Proceedings of the 21stannual international ACM SIGIR conference on Research and development in information retrieval, pages 37–45, 1998.pages 7
[34] Thorsten Brants, Francine Chen, and Ayman Farahat. A system for new event detection. In Proceedings of the 26thannual international ACM SIGIR conference on Research and development in informaion retrieval, pages 330–337, 2003.pages 7
[35] Dan Zhang and Shengdong Li. Topic detection based on k-means. In 2011 International Conference on Electronics,Communications and Control (ICECC), pages 2983–2985. IEEE, 2011. pages 7
[36] Hila Becker, Mor Naaman, and Luis Gravano. Event identification in social media. In WebDB, 2009. pages 7, 9[37] Hila Becker, Mor Naaman, and Luis Gravano. Learning similarity metrics for event identification in social media. In
Proceedings of the third ACM international conference on Web search and data mining, pages 291–300, 2010. pages 7[38] Timo Reuter and Philipp Cimiano. Event-based classification of social media streams. In Proceedings of the 2nd ACM
International Conference on Multimedia Retrieval, pages 1–8, 2012. pages 7[39] Ahmad Hany Hossny, Terry Moschuo, Grant Osborne, Lewis Mitchell, and Nick Lothian. Enhancing keyword corre-
lation for event detection in social networks using svd and k-means: Twitter case study. Social Network Analysis andMining, 8(1):1–10, 2018. pages 7
[40] Georgios Petkos, Manos Schinas, Symeon Papadopoulos, and Yiannis Kompatsiaris. Graph-based multimodal cluster-ing for social multimedia. Multimedia Tools and Applications, 76(6):7897–7919, 2017. pages 7
[41] Mahmud Hasan, Mehmet A Orgun, and Rolf Schwitter. Real-time event detection from the twitter data stream usingthe twitternews+ framework. Information Processing & Management, 56(3):1146–1165, 2019. pages 8
[42] Sasa Petrovic, Miles Osborne, and Victor Lavrenko. Streaming first story detection with application to twitter. InHuman language technologies: The 2010 annual conference of the north american chapter of the association for compu-tational linguistics, pages 181–189, 2010. pages 8
[43] Magnus Sahlgren. An introduction to random indexing. In Methods and applications of semantic indexing workshopat the 7th international conference on terminology and knowledge engineering, 2005. pages 8
[44] Suvarna D Tembhurnikar and Nitin N Patil. Topic detection using bngram method and sentiment analysis on twitterdataset. In 2015 4th International Conference on Reliability, Infocom Technologies and Optimization (ICRITO)(Trendsand Future Directions), pages 1–6. IEEE, 2015. pages 8
[45] Gabriel Pui Cheong Fung, Jeffrey Xu Yu, Philip S Yu, and Hongjun Lu. Parameter free bursty events detection in textstreams. In Proceedings of the 31st international conference on Very large data bases, pages 181–192. Citeseer, 2005.pages 8, 11
63

BIBLIOGRAPHY BIBLIOGRAPHY
[46] Takeshi Sakaki, Makoto Okazaki, and Yutaka Matsuo. Earthquake shakes twitter users: real-time event detection bysocial sensors. In Proceedings of the 19th international conference on World wide web, pages 851–860, 2010. pages 8
[47] Amrutha Benny and Mintu Philip. Keyword based tweet extraction and detection of related topics. Procedia ComputerScience, 46:364–371, 2015. pages 9
[48] Ying Chen, Bo Xu, Hongwei Hao, Shiyu Zhou, and Jie Cao. User-defined hot topic detection in microblogging. InProceedings of the Fifth International Conference on Internet Multimedia Computing and Service, pages 183–186, 2013.pages 9
[49] Mario Cataldi, Luigi Di Caro, and Claudio Schifanella. Emerging topic detection on twitter based on temporal andsocial terms evaluation. In Proceedings of the tenth international workshop on multimedia data mining, pages 1–10,2010. pages 9
[50] Mario Cataldi, Luigi Di Caro, and Claudio Schifanella. Personalized emerging topic detection based on a term agingmodel. ACM Transactions on Intelligent Systems and Technology (TIST), 5(1):1–27, 2014. pages 9
[51] Adrien Guille and Cecile Favre. Mention-anomaly-based event detection and tracking in twitter. In 2014 IEEE/ACMInternational Conference on Advances in Social Networks Analysis and Mining (ASONAM 2014), pages 375–382. IEEE,2014. pages 9
[52] Gabriel Pui Cheong Fung, Jeffrey Xu Yu, Hongjun Lu, and Philip S Yu. Text classification without negative examplesrevisit. IEEE transactions on Knowledge and Data Engineering, 18(1):6–20, 2005. pages 9
[53] Ahmad Hany Hossny and Lewis Mitchell. Event detection in twitter: A keyword volume approach. In 2018 IEEEInternational Conference on Data Mining Workshops (ICDMW), pages 1200–1208. IEEE, 2018. pages 10
[54] Hila Becker, Feiyang Chen, Dan Iter, Mor Naaman, and Luis Gravano. Automatic identification and presentation oftwitter content for planned events. In Proceedings of the International AAAI Conference on Web and Social Media,volume 5, 2011. pages 10, 11
[55] Lin Zhao, Minglei Li, Jinqiao Kou, Jian Zhang, and Yang Zhang. A framework for event-oriented text retrieval basedon temporal aspects: A recent review. In Proceedings of the 2020 12th International Conference on Machine Learningand Computing, pages 39–46, 2020. pages 10
[56] Efthimis N Efthimiadis. Query expansion. Annual review of information science and technology (ARIST), 31:121–87,1996. pages 11
[57] Donald Metzler, Congxing Cai, and Eduard Hovy. Structured event retrieval over microblog archives. In Proceedings ofthe 2012 Conference of the North American Chapter of the Association for Computational Linguistics: Human LanguageTechnologies, pages 646–655, 2012. pages 11, 14
[58] Shin’ichi Takeuchi, Komei Sugiura, Yuhei Akahoshi, and Koji Zettsu. Spatio-temporal pseudo relevance feedback forscientific data retrieval. IEEJ Transactions on Electrical and Electronic Engineering, 12(1):124–131, 2017. pages 11,14
[59] Xiao Ding, Kuo Liao, Ting Liu, Zhongyang Li, and Junwen Duan. Event representation learning enhanced withexternal commonsense knowledge. arXiv preprint arXiv:1909.05190, 2019. pages 11, 12, 14
[60] Sen Yang, Dawei Feng, Linbo Qiao, Zhigang Kan, and Dongsheng Li. Exploring pre-trained language models for eventextraction and generation. In Proceedings of the 57th Annual Meeting of the Association for Computational Linguistics,pages 5284–5294, 2019. pages 11, 12
[61] Tomas Mikolov, Ilya Sutskever, Kai Chen, Greg Corrado, and Jeffrey Dean. Distributed representations of words andphrases and their compositionality. arXiv preprint arXiv:1310.4546, 2013. pages 11
[62] Ashish Vaswani, Noam Shazeer, Niki Parmar, Jakob Uszkoreit, Llion Jones, Aidan N Gomez, Lukasz Kaiser, and IlliaPolosukhin. Attention is all you need. arXiv preprint arXiv:1706.03762, 2017. pages 11
[63] Xiao Ding, Yue Zhang, Ting Liu, and Junwen Duan. Knowledge-driven event embedding for stock prediction. InProceedings of coling 2016, the 26th international conference on computational linguistics: Technical papers, pages2133–2142, 2016. pages 12
[64] Yan Wang and Jie Tang. Event2vec: Learning event representations using spatial-temporal information for recom-mendation. In Pacific-Asia Conference on Knowledge Discovery and Data Mining, pages 314–326. Springer, 2019. pages12
[65] Milad Shokouhi. Central-rank-based collection selection in uncooperative distributed information retrieval. In Euro-pean Conference on Information Retrieval, pages 160–172. Springer, 2007. pages 13
[66] Ricardo Campos, Gael Dias, Alıpio Jorge, and Celia Nunes. Gte-rank: A time-aware search engine to answer time-sensitive queries. Information Processing & Management, 52(2):273–298, 2016. pages 13
[67] Lin Zhao, Wanhui Qian, Liangjun Zang, Fuqing Zhu, Yijun Lu, Ruixuan Li, Jizhong Han, and Songlin Hu. An event-oriented neural ranking model for news retrieval. In Proceedings of the 29th ACM International Conference on Infor-mation & Knowledge Management, pages 2325–2328, 2020. pages 13, 14
[68] Maarten Sap, Ronan Le Bras, Emily Allaway, Chandra Bhagavatula, Nicholas Lourie, Hannah Rashkin, Brendan Roof,
64

BIBLIOGRAPHY BIBLIOGRAPHY
Noah A Smith, and Yejin Choi. Atomic: An atlas of machine commonsense for if-then reasoning. In Proceedings of theAAAI Conference on Artificial Intelligence, volume 33, pages 3027–3035, 2019. pages 14
[69] John ODonovan, Byungkyu Kang, Greg Meyer, Tobias Hollerer, and Sibel Adalii. Credibility in context: An analysisof feature distributions in twitter. In 2012 International Conference on Privacy, Security, Risk and Trust and 2012International Confernece on Social Computing, pages 293–301. IEEE, 2012. pages 14
[70] Saranya Krishnan and Min Chen. Identifying tweets with fake news. In 2018 IEEE International Conference onInformation Reuse and Integration (IRI), pages 460–464. IEEE, 2018. pages 14
[71] Oluwaseun Ajao, Deepayan Bhowmik, and Shahrzad Zargari. Fake news identification on twitter with hybrid cnnand rnn models. In Proceedings of the 9th international conference on social media and society, pages 226–230, 2018.pages 15
[72] Yoshua Bengio, Rejean Ducharme, Pascal Vincent, and Christian Janvin. A neural probabilistic language model. Thejournal of machine learning research, 3:1137–1155, 2003. pages 15
[73] Sebastian Gehrmann, Hendrik Strobelt, and Alexander M Rush. Gltr: Statistical detection and visualization of gener-ated text. arXiv preprint arXiv:1906.04043, 2019. pages 15, 16
[74] Rowan Zellers, Ari Holtzman, Hannah Rashkin, Yonatan Bisk, Ali Farhadi, Franziska Roesner, and Yejin Choi. Defend-ing against neural fake news, 2020. pages 16
[75] A. Radford, Jeffrey Wu, R. Child, David Luan, Dario Amodei, and Ilya Sutskever. Language models are unsupervisedmultitask learners. 2019. pages 16, 17
[76] Zhiting Hu, Zichao Yang, Xiaodan Liang, Ruslan Salakhutdinov, and Eric P Xing. Toward controlled generation oftext. In International Conference on Machine Learning, pages 1587–1596. PMLR, 2017. pages 16
[77] Ximing Lu, Peter West, Rowan Zellers, Ronan Le Bras, Chandra Bhagavatula, and Yejin Choi. Neurologic decod-ing:(un) supervised neural text generation with predicate logic constraints. arXiv preprint arXiv:2010.12884, 2020.pages 16
[78] David Ifeoluwa Adelani, Haotian Mai, Fuming Fang, Huy H Nguyen, Junichi Yamagishi, and Isao Echizen. Generatingsentiment-preserving fake online reviews using neural language models and their human-and machine-based detec-tion. In International Conference on Advanced Information Networking and Applications, pages 1341–1354. Springer,2020. pages 17
[79] Pin Shen Teh, Ning Zhang, Andrew Beng Jin Teoh, and Ke Chen. A survey on touch dynamics authentication inmobile devices. Computers & Security, 59:210–235, 2016. pages 17
[80] Thomas G Dietterich et al. Ensemble learning. The handbook of brain theory and neural networks, 2:110–125, 2002.pages 17
[81] Marie-Francine Moens. Argumentation mining: How can a machine acquire common sense and world knowledge?Argument & Computation, 9(1):1–14, 2018. pages 17
[82] John Lawrence and Chris Reed. Argument mining: A survey. Computational Linguistics, 45(4):765–818, 2020. pages17
[83] Stephen E Toulmin. The uses of argument. Cambridge university press, 2003. pages 18[84] Ivan Habernal and Iryna Gurevych. Argumentation mining in user-generated web discourse. Computational Linguis-
tics, 43(1):125–179, 2017. pages 18[85] Tom Bosc, Elena Cabrio, and Serena Villata. Dart: A dataset of arguments and their relations on twitter. In Proceedings
of the Tenth International Conference on Language Resources and Evaluation (LREC’16), pages 1258–1263, 2016. pages18, 19, 39
[86] Robin Schaefer and Manfred Stede. Annotation and detection of arguments in tweets. In Proceedings of the 7thWorkshop on Argument Mining, pages 53–58, 2020. pages 18, 19
[87] Mihai Dusmanu, Elena Cabrio, and Serena Villata. Argument mining on twitter: Arguments, facts and sources. InProceedings of the 2017 Conference on Empirical Methods in Natural Language Processing, pages 2317–2322, 2017.pages 19
[88] Aseel Addawood and Masooda Bashir. “what is your evidence?” a study of controversial topics on social media. InProceedings of the Third Workshop on Argument Mining (ArgMining2016), pages 1–11, 2016. pages 19
[89] Tianqi Chen and Carlos Guestrin. Xgboost: A scalable tree boosting system. In Proceedings of the 22nd acm sigkddinternational conference on knowledge discovery and data mining, pages 785–794, 2016. pages 19
[90] Isaac Persing and Vincent Ng. Unsupervised argumentation mining in student essays. In Proceedings of The 12thLanguage Resources and Evaluation Conference, pages 6795–6803, 2020. pages 19
[91] Nut Limsopatham and Nigel Collier. Bidirectional lstm for named entity recognition in twitter messages. 2016. pages19, 20
[92] Ellen Riloff and Janyce Wiebe. Learning extraction patterns for subjective expressions. In Proceedings of the 2003conference on Empirical methods in natural language processing, pages 105–112, 2003. pages 20
65

BIBLIOGRAPHY BIBLIOGRAPHY
[93] Vasileios Hatzivassiloglou and Janyce Wiebe. Effects of adjective orientation and gradability on sentence subjectivity.In COLING 2000 Volume 1: The 18th International Conference on Computational Linguistics, 2000. pages 20
[94] Kuntal Dey, Ritvik Shrivastava, and Saroj Kaushik. Twitter stance detection—a subjectivity and sentiment polarityinspired two-phase approach. In 2017 IEEE international conference on data mining workshops (ICDMW), pages 365–372. IEEE, 2017. pages 20
[95] Cristina Bosco, Viviana Patti, and Andrea Bolioli. Developing corpora for sentiment analysis: The case of irony andsenti-tut. IEEE intelligent systems, 28(2):55–63, 2013. pages 20
[96] Luciano Barbosa and Junlan Feng. Robust sentiment detection on twitter from biased and noisy data. In Coling 2010:Posters, pages 36–44, 2010. pages 21
[97] Janyce Wiebe and Ellen Riloff. Creating subjective and objective sentence classifiers from unannotated texts. InInternational conference on intelligent text processing and computational linguistics, pages 486–497. Springer, 2005.pages 21
[98] Juan Sixto, Aitor Almeida, and Diego Lopez-de Ipina. Analysis of the structured information for subjectivity detectionin twitter. In Transactions on Computational Collective Intelligence XXIX, pages 163–181. Springer, 2018. pages 21
[99] Bo Pang and Lillian Lee. A sentimental education: Sentiment analysis using subjectivity summarization based onminimum cuts. arXiv preprint cs/0409058, 2004. pages 21
[100] Hairong Huo and Mizuho Iwaihara. Utilizing bert pretrained models with various fine-tune methods in subjectivitytasks. pages 21
[101] Dat Quoc Nguyen, Thanh Vu, and Anh Tuan Nguyen. Bertweet: A pre-trained language model for english tweets.arXiv preprint arXiv:2005.10200, 2020. pages 21
[102] Mohiuddin Md Abdul Qudar and Vijay Mago. Tweetbert: A pretrained language representation model for twitter textanalysis. arXiv preprint arXiv:2010.11091, 2020. pages 21
[103] Marshall E Blume and Frank Husic. Price, beta, and exchange listing. The Journal of Finance, 28(2):283–299, 1973.pages 23
[104] Narasimhan Jegadeesh and Sheridan Titman. Returns to buying winners and selling losers: Implications for stockmarket efficiency. The Journal of finance, 48(1):65–91, 1993. pages 24
[105] Rob J Hyndman, Yeasmin Khandakar, et al. Automatic time series forecasting: the forecast package for r. Journal ofstatistical software, 27(3):1–22, 2008. pages 24
[106] Gaoxia Jiang, Wenjian Wang, and Wenkai Zhang. A novel distance measure for time series: Maximum shiftingcorrelation distance. Pattern Recognition Letters, 117:58–65, 2019. pages 25
[107] Eldar Sadikov and Maria Montserrat Medina Martinez. Information propagation on twitter. CS322 project report,2009. pages 28
[108] Kanatbay Bektemirov. Tweetement: Pseudo-relevance feedback for twitter search. 2015. pages 30[109] Meredith Ringel Morris, Scott Counts, Asta Roseway, Aaron Hoff, and Julia Schwarz. Tweeting is believing? un-
derstanding microblog credibility perceptions. In Proceedings of the ACM 2012 conference on computer supportedcooperative work, pages 441–450, 2012. pages 32
[110] Twitter’s platform manipulation and spam policy — twitter help, . URL https://help.twitter.com/en/
rules-and-policies/platform-manipulation. pages 32[111] Yinhan Liu, Myle Ott, Naman Goyal, Jingfei Du, Mandar Joshi, Danqi Chen, Omer Levy, Mike Lewis, Luke Zettlemoyer,
and Veselin Stoyanov. Roberta: A robustly optimized bert pretraining approach. arXiv preprint arXiv:1907.11692,2019. pages 33
[112] Irene Solaiman, Miles Brundage, Jack Clark, Amanda Askell, Ariel Herbert-Voss, Jeff Wu, Alec Radford, GretchenKrueger, Jong Wook Kim, Sarah Kreps, et al. Release strategies and the social impacts of language models. arXivpreprint arXiv:1908.09203, 2019. pages 34, 55
[113] Artem Chernodub, Oleksiy Oliynyk, Philipp Heidenreich, Alexander Bondarenko, Matthias Hagen, Chris Biemann,and Alexander Panchenko. Targer: Neural argument mining at your fingertips. In Proceedings of the 57th AnnualMeeting of the Association for Computational Linguistics: System Demonstrations, pages 195–200, 2019. pages 38
[114] Xuezhe Ma and Eduard Hovy. End-to-end sequence labeling via bi-directional lstm-cnns-crf. arXiv preprintarXiv:1603.01354, 2016. pages 39
[115] Ritika Nandi, Geetha Maiya, Priya Kamath, and Shashank Shekhar. An empirical evaluation of word embeddingmodels for subjectivity analysis tasks. In 2021 International Conference on Advances in Electrical, Computing, Commu-nication and Sustainable Technologies (ICAECT), pages 1–5, 2021. doi: 10.1109/ICAECT49130.2021.9392437. pages40
[116] Leslie N Smith. Cyclical learning rates for training neural networks. In 2017 IEEE winter conference on applications ofcomputer vision (WACV), pages 464–472. IEEE, 2017. pages 40
[117] Alexis Conneau, Douwe Kiela, Holger Schwenk, Loic Barrault, and Antoine Bordes. Supervised learning of universal
66

BIBLIOGRAPHY BIBLIOGRAPHY
sentence representations from natural language inference data. arXiv preprint arXiv:1705.02364, 2017. pages 41[118] Tapan Sahni, Chinmay Chandak, Naveen Reddy Chedeti, and Manish Singh. Efficient twitter sentiment classification
using subjective distant supervision. In 2017 9th International Conference on Communication Systems and Networks(COMSNETS), pages 548–553. IEEE, 2017. pages 41
[119] Dogu Araci. Finbert: Financial sentiment analysis with pre-trained language models. arXiv preprintarXiv:1908.10063, 2019. pages 42
[120] Mandar Joshi, Danqi Chen, Yinhan Liu, Daniel S Weld, Luke Zettlemoyer, and Omer Levy. Spanbert: Improvingpre-training by representing and predicting spans. Transactions of the Association for Computational Linguistics, 8:64–77, 2020. pages 42
[121] Yu Sun, Shuohuan Wang, Yukun Li, Shikun Feng, Hao Tian, Hua Wu, and Haifeng Wang. Ernie 2.0: A continualpre-training framework for language understanding. In Proceedings of the AAAI Conference on Artificial Intelligence,volume 34, pages 8968–8975, 2020. pages 42
[122] Martin Hentschel and Omar Alonso. Follow the money: A study of cashtags on twitter. First Monday, 2014. pages 44[123] Tom B Brown, Benjamin Mann, Nick Ryder, Melanie Subbiah, Jared Kaplan, Prafulla Dhariwal, Arvind Neelakan-
tan, Pranav Shyam, Girish Sastry, Amanda Askell, et al. Language models are few-shot learners. arXiv preprintarXiv:2005.14165, 2020. pages 56
[124] Emma Strubell, Ananya Ganesh, and Andrew McCallum. Energy and policy considerations for deep learning in nlp.arXiv preprint arXiv:1906.02243, 2019. pages 60
[125] Emily M Bender, Timnit Gebru, Angelina McMillan-Major, and Shmargaret Shmitchell. On the dangers of stochasticparrots: Can language models be too big? In Proceedings of the 2021 ACM Conference on Fairness, Accountability, andTransparency, pages 610–623, 2021. pages 60
[126] Alexandre Lacoste, Alexandra Luccioni, Victor Schmidt, and Thomas Dandres. Quantifying the carbon emissions ofmachine learning. arXiv preprint arXiv:1910.09700, 2019. pages 60
[127] Majed Alrubaian, Muhammad Al-Qurishi, Mohammad Mehedi Hassan, and Atif Alamri. A credibility analysis systemfor assessing information on twitter. IEEE Transactions on Dependable and Secure Computing, 15(4):661–674, 2016.pages 61
[128] Aditi Gupta, Ponnurangam Kumaraguru, Carlos Castillo, and Patrick Meier. Tweetcred: Real-time credibility assess-ment of content on twitter. In International conference on social informatics, pages 228–243. Springer, 2014. pages61
67