Deep crustal structure of the conjugate margins of the SW South China Sea from wide-angle refraction...
17
Research paper Deep crustal structure of the conjugate margins of the SW South China Sea from wide-angle refraction seismic data T. Pichot a, * , M. Delescluse a , N. Chamot-Rooke a , M. Pubellier a,1 , Y. Qiu b , F. Meresse a, 2 , G. Sun b , D. Savva a , K.P. Wong a, 3 , L. Watremez c , J.-L. Auxiètre d a Laboratoire de Géologie, Ecole normale supérieure, CNRS/UMR 8538, 24 rue Lhomond, Paris 75005, France b Guangzhou Marine Geological Survey, Guangzhou 510760, China c Department of Oceanography, Dalhousie University, P.O. Box 15000, Halifax, NS, B3H 4R2, Canada d Total PN/BTF e Geosciences New business, 2 Place Jean Millier, La Défense Paris, France article info Article history: Received 3 July 2013 Received in revised form 10 September 2013 Accepted 16 October 2013 Available online xxx Keywords: South China sea basin Continental extension Crustal structure Wide-angle refraction seismic Seismic tomography Moho abstract The South China Sea is the largest marginal basin of SE Asia, yet its mechanism of formation is still debated. A 1000-km long wide-angle refraction seismic profile was recently acquired along the conjugate margins of the SW sub-basin of the South China Sea, over the longest extended continental crust. A joint reflection and refraction seismic travel time inversion is performed to derive a 2-D velocity model of the crustal structure and upper mantle. Based on this new tomographic model, northern and southern margins are genetically linked since they share common structural characteristics. Most of the continental crust deforms in a brittle manner. Two scales of deformation are imaged and correlate well with seismic reflection observations. Small-scale normal faults (grabens, horsts and rotated faults blocks) are often associated with a tilt of the velocity isocontours affecting the upper crust. The mid-crust shows high lateral velocity variation defining low velocity bodies bounded by large-scale normal faults recognized in seismic reflection profiles. Major sedimentary basins are located above low velocity bodies interpreted as hanging-wall blocks. Along the northern margin, spacing between these velocity bodies decreases from 90 to 45 km as the total crust thins toward the ContinenteOcean Transition. The ContinenteOcean Transitions are narrow and slightly asymmetric e 60 km on the northern side and no more than 30 km on the southern side e indicating little space for significant hyper-stretched crust. Although we have no direct indication for mantle exhumation, shallow high velocities are observed at the ContinenteOcean Transition. The Moho interface remains rather flat over the extended domain, and remains undisturbed by the large-scale normal faults. The main décollement is thus within the ductile lower crust. Ó 2013 Published by Elsevier Ltd. 1. Introduction The South China Sea (SCS) is one of the largest submerged continental provinces of SE Asia, covering a surface of nearly 1500 1000 km. Convergence of the Pacific plate toward Eurasia during the Mesozoic and the Cenozoic times has shaped the region, plate rollback leading to the progressive dislocation of the South China continent (known as South China Block) and the formation of a series of marginal basins at the edge of Sundaland. Whereas Sulu Sea and Celebes Sea opened as back-arc basins, the origin of the SCS involves the formation of a proto South China Sea probably floored with oceanic crust that has now been subducted (Pubellier et al., 2003). The V-shaped morphology of the SCS results from the mid-Neogene propagation toward the SW of a now extinct NE-SW spreading center (Taylor and Hayes, 1983; Briais et al., 1993; Huchon et al., 1998, 2001). Bathymetry and gravity data show complex longitudinal morphologic variations along the entire SCS province. While the eastern part of the SCS northern margin exhibits 400 km of extended crust, its western part shows nearly 800 km of extended continental crust (Fig. 1) which makes it one of the widest rifted margin in the world. This variability can be partly attributed to the heterogenous nature of the crust of the South China Block, in relation to a complex evolution of accreted terranes of Gondwana * Corresponding author. Present address: Institut de Physique du Globe de Paris, Sorbonne Paris Cité and CNRS/UMR 7154, 1 rue Jussieu, F-75238 Paris CEDEX 05, France. E-mail address: [email protected] (T. Pichot). 1 Present address: Faculty of Geosciences and Petroleum Engineering, Universiti Teknologi Petronas, 31750 Tronoh, Perak Darul Ridzuan, Malaysia. 2 Present address: Total SA, Structural Geology Group, CSTJF, avenue Larribau, 64000 Pau, France. 3 Present address: Department of Geosciences, University of Oslo, Norway. Contents lists available at ScienceDirect Marine and Petroleum Geology journal homepage: www.elsevier.com/locate/marpetgeo 0264-8172/$ e see front matter Ó 2013 Published by Elsevier Ltd. http://dx.doi.org/10.1016/j.marpetgeo.2013.10.008 Marine and Petroleum Geology xxx (2013) 1e17 Please cite this article in press as: Pichot, T., et al., Deep crustal structure of the conjugate margins of the SW South China Sea from wide-angle refraction seismic data, Marine and Petroleum Geology (2013), http://dx.doi.org/10.1016/j.marpetgeo.2013.10.008
Transcript of Deep crustal structure of the conjugate margins of the SW South China Sea from wide-angle refraction...
lable at ScienceDirect
Marine and Petroleum Geology xxx (2013) 1e17
Contents lists avai
Marine and Petroleum Geology
journal homepage: www.elsevier .com/locate/marpetgeo
Research paper
Deep crustal structure of the conjugate margins of the SW South ChinaSea from wide-angle refraction seismic data
T. Pichot a,*, M. Delescluse a, N. Chamot-Rooke a, M. Pubellier a,1, Y. Qiu b, F. Meresse a,2,G. Sun b, D. Savva a, K.P. Wong a,3, L. Watremez c, J.-L. Auxiètre d
a Laboratoire de Géologie, Ecole normale supérieure, CNRS/UMR 8538, 24 rue Lhomond, Paris 75005, FrancebGuangzhou Marine Geological Survey, Guangzhou 510760, ChinacDepartment of Oceanography, Dalhousie University, P.O. Box 15000, Halifax, NS, B3H 4R2, Canadad Total PN/BTF e Geosciences New business, 2 Place Jean Millier, La Défense Paris, France
a r t i c l e i n f o
Article history:Received 3 July 2013Received in revised form10 September 2013Accepted 16 October 2013Available online xxx
Keywords:South China sea basinContinental extensionCrustal structureWide-angle refraction seismicSeismic tomographyMoho
* Corresponding author. Present address: Institut dSorbonne Paris Cité and CNRS/UMR 7154, 1 rue JussiFrance.
E-mail address: [email protected] (T. Pich1 Present address: Faculty of Geosciences and Petro
Teknologi Petronas, 31750 Tronoh, Perak Darul Ridzu2 Present address: Total SA, Structural Geology Gr
64000 Pau, France.3 Present address: Department of Geosciences, Uni
0264-8172/$ e see front matter � 2013 Published byhttp://dx.doi.org/10.1016/j.marpetgeo.2013.10.008
Please cite this article in press as: Pichot, T.,refraction seismic data, Marine and Petroleu
a b s t r a c t
The South China Sea is the largestmarginal basin of SE Asia, yet its mechanism of formation is still debated.A 1000-km longwide-angle refraction seismic profilewas recently acquired along the conjugatemargins ofthe SWsub-basin of the South China Sea, over the longest extended continental crust. A joint reflection andrefraction seismic travel time inversion is performed to derive a 2-D velocity model of the crustal structureand upper mantle. Based on this new tomographic model, northern and southern margins are geneticallylinked since they share common structural characteristics.Most of the continental crust deforms in a brittlemanner. Two scales of deformation are imaged and correlate well with seismic reflection observations.Small-scale normal faults (grabens, horsts and rotated faults blocks) are often associated with a tilt of thevelocity isocontours affecting the upper crust. Themid-crust shows high lateral velocity variation defininglow velocity bodies bounded by large-scale normal faults recognized in seismic reflection profiles. Majorsedimentary basins are located above low velocity bodies interpreted as hanging-wall blocks. Along thenorthernmargin, spacing between these velocity bodies decreases from90 to 45 km as the total crust thinstoward the ContinenteOcean Transition. The ContinenteOcean Transitions are narrow and slightlyasymmetrice 60 km on the northern side and nomore than 30 km on the southern sidee indicating littlespace for significant hyper-stretched crust. Although we have no direct indication for mantle exhumation,shallow high velocities are observed at the ContinenteOcean Transition. The Moho interface remainsrather flat over the extended domain, and remains undisturbed by the large-scale normal faults. The maindécollement is thus within the ductile lower crust.
� 2013 Published by Elsevier Ltd.
1. Introduction
The South China Sea (SCS) is one of the largest submergedcontinental provinces of SE Asia, covering a surface of nearly1500 � 1000 km. Convergence of the Pacific plate toward Eurasiaduring the Mesozoic and the Cenozoic times has shaped the region,plate rollback leading to the progressive dislocation of the South
e Physique du Globe de Paris,eu, F-75238 Paris CEDEX 05,
ot).leum Engineering, Universitian, Malaysia.oup, CSTJF, avenue Larribau,
versity of Oslo, Norway.
Elsevier Ltd.
et al., Deep crustal structure om Geology (2013), http://dx
China continent (known as South China Block) and the formation ofa series of marginal basins at the edge of Sundaland. Whereas SuluSea and Celebes Sea opened as back-arc basins, the origin of the SCSinvolves the formation of a proto South China Sea probably flooredwith oceanic crust that has now been subducted (Pubellier et al.,2003). The V-shaped morphology of the SCS results from themid-Neogene propagation toward the SW of a now extinct NE-SWspreading center (Taylor and Hayes, 1983; Briais et al., 1993;Huchon et al., 1998, 2001).
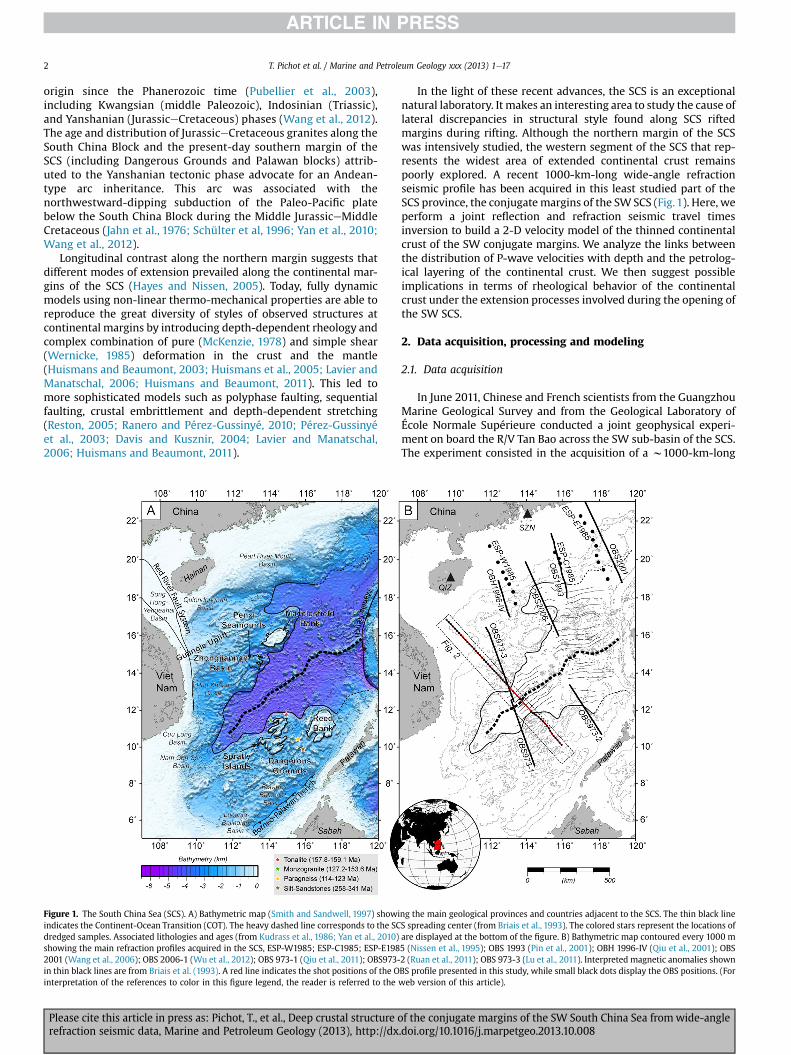
Bathymetry and gravity data show complex longitudinalmorphologic variations along the entire SCS province. While theeastern part of the SCS northern margin exhibits 400 km ofextended crust, its western part shows nearly 800 km of extendedcontinental crust (Fig. 1) which makes it one of the widest riftedmargin in the world. This variability can be partly attributed to theheterogenous nature of the crust of the South China Block, inrelation to a complex evolution of accreted terranes of Gondwana
f the conjugate margins of the SW South China Sea fromwide-angle.doi.org/10.1016/j.marpetgeo.2013.10.008
T. Pichot et al. / Marine and Petroleum Geology xxx (2013) 1e172
origin since the Phanerozoic time (Pubellier et al., 2003),including Kwangsian (middle Paleozoic), Indosinian (Triassic),and Yanshanian (JurassiceCretaceous) phases (Wang et al., 2012).The age and distribution of JurassiceCretaceous granites along theSouth China Block and the present-day southern margin of theSCS (including Dangerous Grounds and Palawan blocks) attrib-uted to the Yanshanian tectonic phase advocate for an Andean-type arc inheritance. This arc was associated with thenorthwestward-dipping subduction of the Paleo-Pacific platebelow the South China Block during the Middle JurassiceMiddleCretaceous (Jahn et al., 1976; Schülter et al, 1996; Yan et al., 2010;Wang et al., 2012).
Longitudinal contrast along the northern margin suggests thatdifferent modes of extension prevailed along the continental mar-gins of the SCS (Hayes and Nissen, 2005). Today, fully dynamicmodels using non-linear thermo-mechanical properties are able toreproduce the great diversity of styles of observed structures atcontinental margins by introducing depth-dependent rheology andcomplex combination of pure (McKenzie, 1978) and simple shear(Wernicke, 1985) deformation in the crust and the mantle(Huismans and Beaumont, 2003; Huismans et al., 2005; Lavier andManatschal, 2006; Huismans and Beaumont, 2011). This led tomore sophisticated models such as polyphase faulting, sequentialfaulting, crustal embrittlement and depth-dependent stretching(Reston, 2005; Ranero and Pérez-Gussinyé, 2010; Pérez-Gussinyéet al., 2003; Davis and Kusznir, 2004; Lavier and Manatschal,2006; Huismans and Beaumont, 2011).
Figure 1. The South China Sea (SCS). A) Bathymetric map (Smith and Sandwell, 1997) showiindicates the Continent-Ocean Transition (COT). The heavy dashed line corresponds to the SCdredged samples. Associated lithologies and ages (from Kudrass et al., 1986; Yan et al., 2010)showing the main refraction profiles acquired in the SCS, ESP-W1985; ESP-C1985; ESP-E1982001 (Wang et al., 2006); OBS 2006-1 (Wu et al., 2012); OBS 973-1 (Qiu et al., 2011); OBS973-in thin black lines are from Briais et al. (1993). A red line indicates the shot positions of the Ointerpretation of the references to color in this figure legend, the reader is referred to the
Please cite this article in press as: Pichot, T., et al., Deep crustal structure orefraction seismic data, Marine and Petroleum Geology (2013), http://dx
In the light of these recent advances, the SCS is an exceptionalnatural laboratory. It makes an interesting area to study the cause oflateral discrepancies in structural style found along SCS riftedmargins during rifting. Although the northern margin of the SCSwas intensively studied, the western segment of the SCS that rep-resents the widest area of extended continental crust remainspoorly explored. A recent 1000-km-long wide-angle refractionseismic profile has been acquired in this least studied part of theSCS province, the conjugatemargins of the SW SCS (Fig.1). Here, weperform a joint reflection and refraction seismic travel timesinversion to build a 2-D velocity model of the thinned continentalcrust of the SW conjugate margins. We analyze the links betweenthe distribution of P-wave velocities with depth and the petrolog-ical layering of the continental crust. We then suggest possibleimplications in terms of rheological behavior of the continentalcrust under the extension processes involved during the opening ofthe SW SCS.
2. Data acquisition, processing and modeling
2.1. Data acquisition
In June 2011, Chinese and French scientists from the GuangzhouMarine Geological Survey and from the Geological Laboratory ofÉcole Normale Supérieure conducted a joint geophysical experi-ment on board the R/V Tan Bao across the SW sub-basin of the SCS.The experiment consisted in the acquisition of a w1000-km-long
ng the main geological provinces and countries adjacent to the SCS. The thin black lineS spreading center (from Briais et al., 1993). The colored stars represent the locations ofare displayed at the bottom of the figure. B) Bathymetric map contoured every 1000 m5 (Nissen et al., 1995); OBS 1993 (Pin et al., 2001); OBH 1996-IV (Qiu et al., 2001); OBS2 (Ruan et al., 2011); OBS 973-3 (Lu et al., 2011). Interpreted magnetic anomalies shownBS profile presented in this study, while small black dots display the OBS positions. (Forweb version of this article).
f the conjugate margins of the SW South China Sea fromwide-angle.doi.org/10.1016/j.marpetgeo.2013.10.008
T. Pichot et al. / Marine and Petroleum Geology xxx (2013) 1e17 3
Ocean Bottom Seismometers (OBS) profile across the conjugatemargins and the oceanic basin. The section runs NW-SE perpen-dicular to the inactive spreading center axis and a total of 50 OBSswere deployed along the line (Fig. 1). Twenty-four Sercel Microbs�
OBSs were deployed over about half the profile, covering theSpratly Islands area (Dangerous Grounds province), the oceanicdomain and the distal portion of the northern conjugate margin(i.e. OBS-1 to OBS-24). The remaining OBSs were provided by theInstitute of Geology and Geophysics, Chinese Academy of Sciences,and cover the rest of the northern margin (i.e. OBS-25 to OBS-50).For technical reasons, the originally planned seismic reflectionline across the set of OBSs could not be shot, so that previousseismic lines around were further used to interpret the refractionresults, in particular the sub-surface structures.
The rationale of the experimentwas to focus asmuch as possibleon the conjugate continental domains and transition zones, using areasonable number of OBSs. The mean distance between OBSs wasthus kept close to 18 km in the continental parts (Fig. 2). A largerand variable spacing was used in the oceanic domain, which wasnot the primary goal of the study. Thus, oceanic crustal velocitieswere obtained with fewer details.
All OBSs were recovered successfully and only two did not re-cord any data (OBS-28 and OBS-50). The source was designed toinvestigate deep crustal structures and consisted of an array of Boltair guns with a total volume of w105 l. Shots were distance trig-gered every 150 m (leading to a 1 min trace length). A total of ca.7000 shots were recorded on each OBS. The sample interval usedwas 1, 4 or 8 ms, depending on the OBS type. All records wereresampled to 4 ms for the final processing. The OBS records are of agood overall quality (Fig. 3). For each instrument, the hydrophonesand the vertical component of the geophones were used for seismicphase identifications. Clock drifts were checked and correctionswere applied. A relocation procedurewas applied using water wave
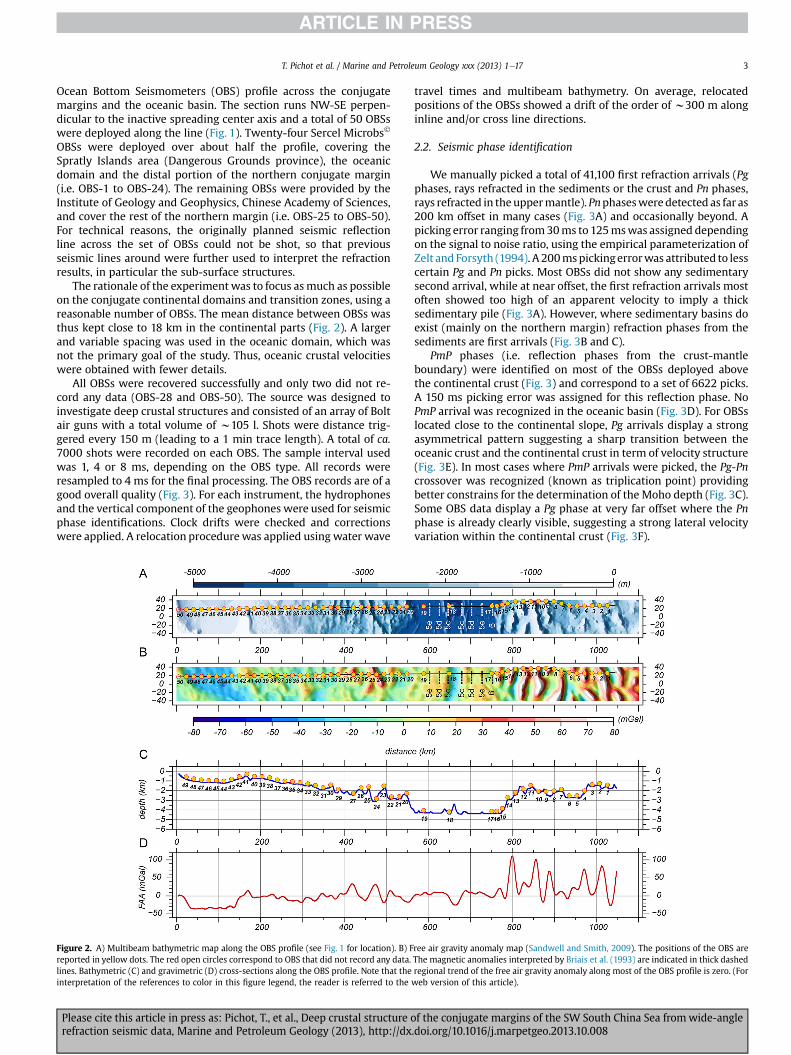
Figure 2. A) Multibeam bathymetric map along the OBS profile (see Fig. 1 for location). B) Freported in yellow dots. The red open circles correspond to OBS that did not record any data.lines. Bathymetric (C) and gravimetric (D) cross-sections along the OBS profile. Note that theinterpretation of the references to color in this figure legend, the reader is referred to the
Please cite this article in press as: Pichot, T., et al., Deep crustal structure orefraction seismic data, Marine and Petroleum Geology (2013), http://dx
travel times and multibeam bathymetry. On average, relocatedpositions of the OBSs showed a drift of the order of w300 m alonginline and/or cross line directions.
2.2. Seismic phase identification
We manually picked a total of 41,100 first refraction arrivals (Pgphases, rays refracted in the sediments or the crust and Pn phases,rays refracted in theuppermantle). Pnphasesweredetected as far as200 km offset in many cases (Fig. 3A) and occasionally beyond. Apicking error ranging from30ms to 125mswas assigned dependingon the signal to noise ratio, using the empirical parameterization ofZelt and Forsyth (1994). A 200mspickingerrorwas attributed to lesscertain Pg and Pn picks. Most OBSs did not show any sedimentarysecond arrival, while at near offset, the first refraction arrivals mostoften showed too high of an apparent velocity to imply a thicksedimentary pile (Fig. 3A). However, where sedimentary basins doexist (mainly on the northern margin) refraction phases from thesediments are first arrivals (Fig. 3B and C).
PmP phases (i.e. reflection phases from the crust-mantleboundary) were identified on most of the OBSs deployed abovethe continental crust (Fig. 3) and correspond to a set of 6622 picks.A 150 ms picking error was assigned for this reflection phase. NoPmP arrival was recognized in the oceanic basin (Fig. 3D). For OBSslocated close to the continental slope, Pg arrivals display a strongasymmetrical pattern suggesting a sharp transition between theoceanic crust and the continental crust in term of velocity structure(Fig. 3E). In most cases where PmP arrivals were picked, the Pg-Pncrossover was recognized (known as triplication point) providingbetter constrains for the determination of the Moho depth (Fig. 3C).Some OBS data display a Pg phase at very far offset where the Pnphase is already clearly visible, suggesting a strong lateral velocityvariation within the continental crust (Fig. 3F).
ree air gravity anomaly map (Sandwell and Smith, 2009). The positions of the OBS areThe magnetic anomalies interpreted by Briais et al. (1993) are indicated in thick dashedregional trend of the free air gravity anomaly along most of the OBS profile is zero. (Forweb version of this article).
f the conjugate margins of the SW South China Sea fromwide-angle.doi.org/10.1016/j.marpetgeo.2013.10.008
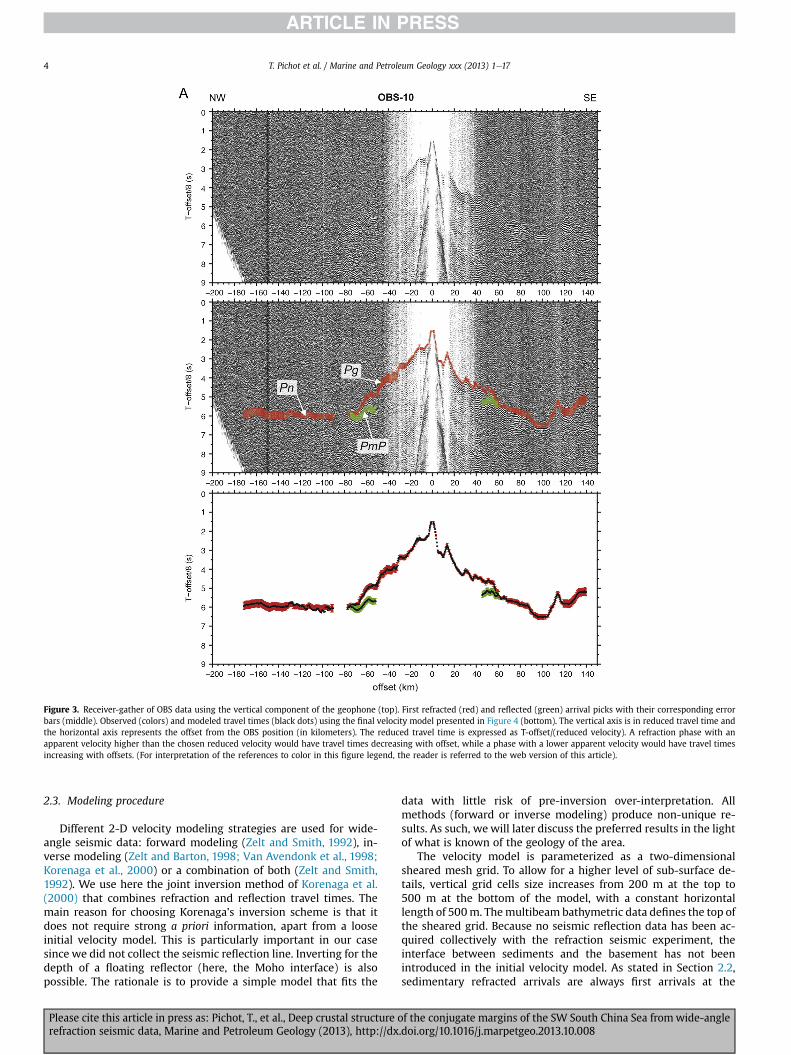
Figure 3. Receiver-gather of OBS data using the vertical component of the geophone (top). First refracted (red) and reflected (green) arrival picks with their corresponding errorbars (middle). Observed (colors) and modeled travel times (black dots) using the final velocity model presented in Figure 4 (bottom). The vertical axis is in reduced travel time andthe horizontal axis represents the offset from the OBS position (in kilometers). The reduced travel time is expressed as T-offset/(reduced velocity). A refraction phase with anapparent velocity higher than the chosen reduced velocity would have travel times decreasing with offset, while a phase with a lower apparent velocity would have travel timesincreasing with offsets. (For interpretation of the references to color in this figure legend, the reader is referred to the web version of this article).
T. Pichot et al. / Marine and Petroleum Geology xxx (2013) 1e174
2.3. Modeling procedure
Different 2-D velocity modeling strategies are used for wide-angle seismic data: forward modeling (Zelt and Smith, 1992), in-verse modeling (Zelt and Barton, 1998; Van Avendonk et al., 1998;Korenaga et al., 2000) or a combination of both (Zelt and Smith,1992). We use here the joint inversion method of Korenaga et al.(2000) that combines refraction and reflection travel times. Themain reason for choosing Korenaga’s inversion scheme is that itdoes not require strong a priori information, apart from a looseinitial velocity model. This is particularly important in our casesince we did not collect the seismic reflection line. Inverting for thedepth of a floating reflector (here, the Moho interface) is alsopossible. The rationale is to provide a simple model that fits the
Please cite this article in press as: Pichot, T., et al., Deep crustal structure orefraction seismic data, Marine and Petroleum Geology (2013), http://dx
data with little risk of pre-inversion over-interpretation. Allmethods (forward or inverse modeling) produce non-unique re-sults. As such, wewill later discuss the preferred results in the lightof what is known of the geology of the area.
The velocity model is parameterized as a two-dimensionalsheared mesh grid. To allow for a higher level of sub-surface de-tails, vertical grid cells size increases from 200 m at the top to500 m at the bottom of the model, with a constant horizontallength of 500m. Themultibeam bathymetric data defines the top ofthe sheared grid. Because no seismic reflection data has been ac-quired collectively with the refraction seismic experiment, theinterface between sediments and the basement has not beenintroduced in the initial velocity model. As stated in Section 2.2,sedimentary refracted arrivals are always first arrivals at the
f the conjugate margins of the SW South China Sea fromwide-angle.doi.org/10.1016/j.marpetgeo.2013.10.008

Figure 3. (continued).
T. Pichot et al. / Marine and Petroleum Geology xxx (2013) 1e17 5
continental domain water depths. As a result, the inversion shouldretrieve the large sedimentary basins without difficulty.
A Bouguer gravity inversion has been performed to define acrude Moho interface to be used as input in the initial velocitymodel. The inversion procedure is using Parker’s Fourier formula-tion for gravity (Parker, 1973) widely applied in sedimentary basins(details of our procedure can be found in Chamot-Rooke et al., 1997;see Braitenberg et al., 2006; Nguyen and Nguyen, 2013 for the latestapplications to the SCS). Since the aim was to obtain a smoothstarting velocity model, we did not try to introduce sophisticatedcorrections such as variable crustal densities due to the nature ofthe crust (continental versus oceanic) or variable mantle densitydue to the thermal anomaly related to the SCS opening. A standard2700 kg/m3 crustal density was used to first derive a Bougueranomaly based on the multibeam bathymetry. The resultinganomaly was then converted to a Moho geometry using a crust/mantle contrast of 450 kg/m3. The reference depth for the inversion
Please cite this article in press as: Pichot, T., et al., Deep crustal structure orefraction seismic data, Marine and Petroleum Geology (2013), http://dx
was set to 20 km, so that the gravity inverted oceanic crust thick-ness was kept close to 6 km, and the depth of the continental Mohointerface was in good agreement with previous seismic refractionstudies (Nissen et al., 1995; Pin et al., 2001; Qiu et al., 2011; Ruanet al., 2011; Lü et al., 2011). The initial velocity model iscomposed of a linear velocity gradient from 4 km/s below theseafloor interface to 7.5 km/s at the crust-mantle boundary (a ve-locity of 7.5 km/s is quite high but this avoids a strong velocitycontrast at the crust-mantle boundary in the initial velocitymodel).A velocity of 8 km/s is applied in the shallow uppermantle (Fig. 4A).
The inversion method used here requires a large set of param-eters (detailed in Table 1; see also Korenaga et al., 2000). The key-parameters are summarized hereafter. Both velocity and depthperturbations are controlled by predefined vertical and horizontalcorrelations lengths (Toomey et al., 1994). After exploring a large setof parameters, the preferred values for the correlation lengths are10e30 km horizontally and 0e24 km vertically, giving a value of
f the conjugate margins of the SW South China Sea fromwide-angle.doi.org/10.1016/j.marpetgeo.2013.10.008
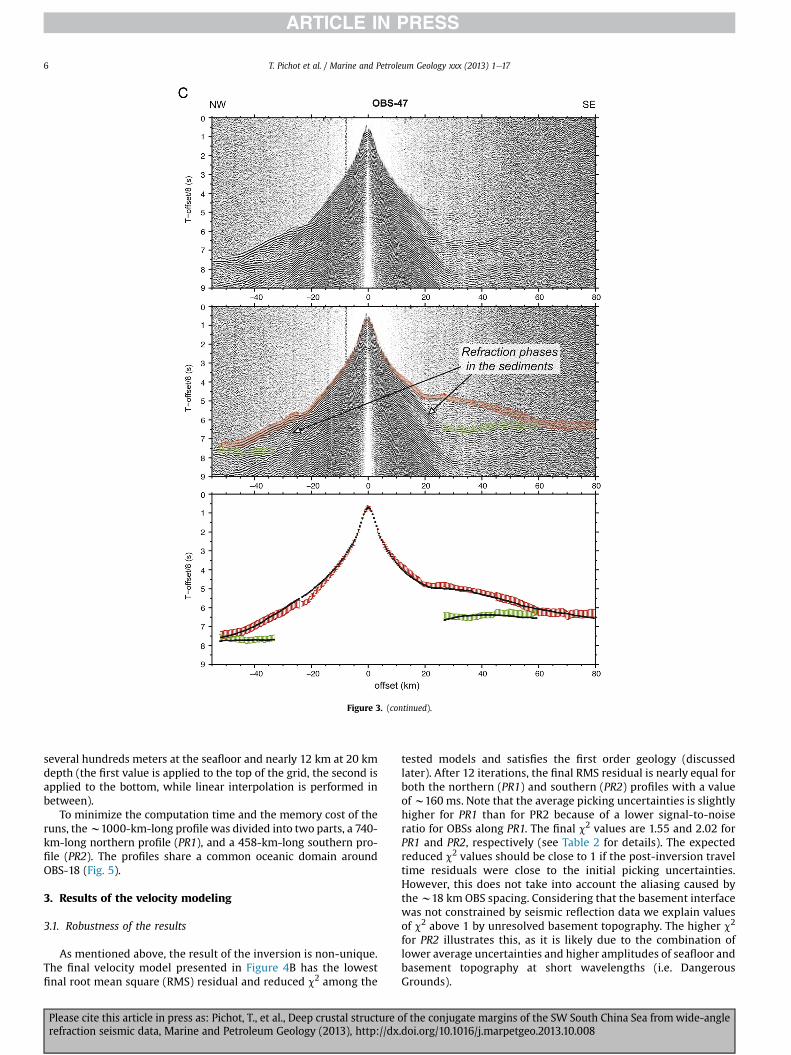
Figure 3. (continued).
T. Pichot et al. / Marine and Petroleum Geology xxx (2013) 1e176
several hundreds meters at the seafloor and nearly 12 km at 20 kmdepth (the first value is applied to the top of the grid, the second isapplied to the bottom, while linear interpolation is performed inbetween).
To minimize the computation time and the memory cost of theruns, thew1000-km-long profile was divided into two parts, a 740-km-long northern profile (PR1), and a 458-km-long southern pro-file (PR2). The profiles share a common oceanic domain aroundOBS-18 (Fig. 5).
3. Results of the velocity modeling
3.1. Robustness of the results
As mentioned above, the result of the inversion is non-unique.The final velocity model presented in Figure 4B has the lowestfinal root mean square (RMS) residual and reduced c2 among the
Please cite this article in press as: Pichot, T., et al., Deep crustal structure orefraction seismic data, Marine and Petroleum Geology (2013), http://dx
tested models and satisfies the first order geology (discussedlater). After 12 iterations, the final RMS residual is nearly equal forboth the northern (PR1) and southern (PR2) profiles with a valueofw160 ms. Note that the average picking uncertainties is slightlyhigher for PR1 than for PR2 because of a lower signal-to-noiseratio for OBSs along PR1. The final c2 values are 1.55 and 2.02 forPR1 and PR2, respectively (see Table 2 for details). The expectedreduced c2 values should be close to 1 if the post-inversion traveltime residuals were close to the initial picking uncertainties.However, this does not take into account the aliasing caused bythew18 km OBS spacing. Considering that the basement interfacewas not constrained by seismic reflection data we explain valuesof c2 above 1 by unresolved basement topography. The higher c2
for PR2 illustrates this, as it is likely due to the combination oflower average uncertainties and higher amplitudes of seafloor andbasement topography at short wavelengths (i.e. DangerousGrounds).
f the conjugate margins of the SW South China Sea fromwide-angle.doi.org/10.1016/j.marpetgeo.2013.10.008
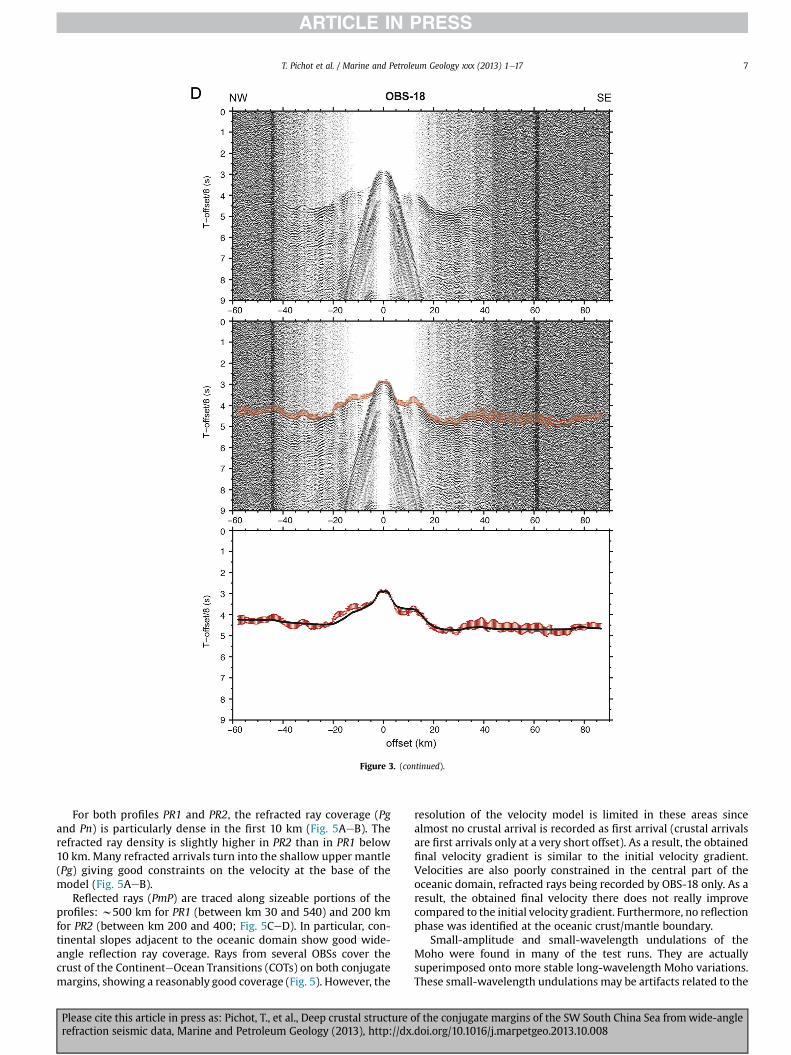
Figure 3. (continued).
T. Pichot et al. / Marine and Petroleum Geology xxx (2013) 1e17 7
For both profiles PR1 and PR2, the refracted ray coverage (Pgand Pn) is particularly dense in the first 10 km (Fig. 5AeB). Therefracted ray density is slightly higher in PR2 than in PR1 below10 km. Many refracted arrivals turn into the shallow upper mantle(Pg) giving good constraints on the velocity at the base of themodel (Fig. 5AeB).
Reflected rays (PmP) are traced along sizeable portions of theprofiles: w500 km for PR1 (between km 30 and 540) and 200 kmfor PR2 (between km 200 and 400; Fig. 5CeD). In particular, con-tinental slopes adjacent to the oceanic domain show good wide-angle reflection ray coverage. Rays from several OBSs cover thecrust of the ContinenteOcean Transitions (COTs) on both conjugatemargins, showing a reasonably good coverage (Fig. 5). However, the
Please cite this article in press as: Pichot, T., et al., Deep crustal structure orefraction seismic data, Marine and Petroleum Geology (2013), http://dx
resolution of the velocity model is limited in these areas sincealmost no crustal arrival is recorded as first arrival (crustal arrivalsare first arrivals only at a very short offset). As a result, the obtainedfinal velocity gradient is similar to the initial velocity gradient.Velocities are also poorly constrained in the central part of theoceanic domain, refracted rays being recorded by OBS-18 only. As aresult, the obtained final velocity there does not really improvecompared to the initial velocity gradient. Furthermore, no reflectionphase was identified at the oceanic crust/mantle boundary.
Small-amplitude and small-wavelength undulations of theMoho were found in many of the test runs. They are actuallysuperimposed onto more stable long-wavelength Moho variations.These small-wavelength undulations may be artifacts related to the
f the conjugate margins of the SW South China Sea fromwide-angle.doi.org/10.1016/j.marpetgeo.2013.10.008
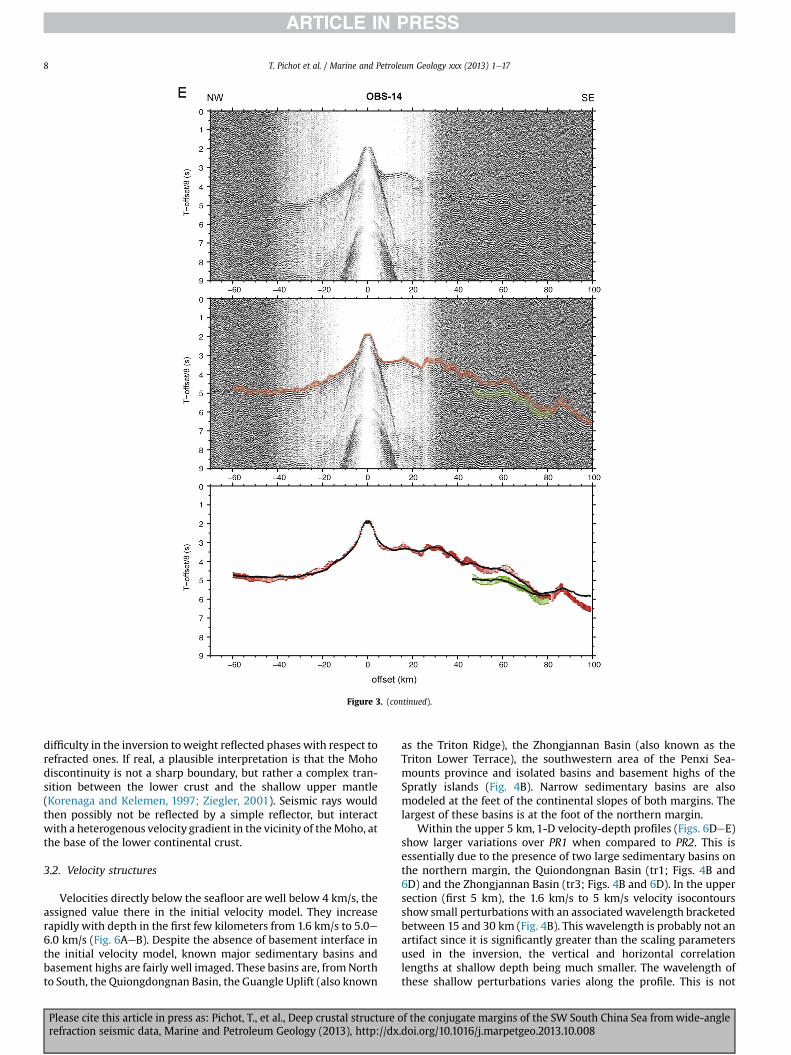
Figure 3. (continued).
T. Pichot et al. / Marine and Petroleum Geology xxx (2013) 1e178
difficulty in the inversion toweight reflected phases with respect torefracted ones. If real, a plausible interpretation is that the Mohodiscontinuity is not a sharp boundary, but rather a complex tran-sition between the lower crust and the shallow upper mantle(Korenaga and Kelemen, 1997; Ziegler, 2001). Seismic rays wouldthen possibly not be reflected by a simple reflector, but interactwith a heterogenous velocity gradient in the vicinity of theMoho, atthe base of the lower continental crust.
3.2. Velocity structures
Velocities directly below the seafloor are well below 4 km/s, theassigned value there in the initial velocity model. They increaserapidly with depth in the first few kilometers from 1.6 km/s to 5.0e6.0 km/s (Fig. 6AeB). Despite the absence of basement interface inthe initial velocity model, known major sedimentary basins andbasement highs are fairly well imaged. These basins are, fromNorthto South, the Quiongdongnan Basin, the Guangle Uplift (also known
Please cite this article in press as: Pichot, T., et al., Deep crustal structure orefraction seismic data, Marine and Petroleum Geology (2013), http://dx
as the Triton Ridge), the Zhongjannan Basin (also known as theTriton Lower Terrace), the southwestern area of the Penxi Sea-mounts province and isolated basins and basement highs of theSpratly islands (Fig. 4B). Narrow sedimentary basins are alsomodeled at the feet of the continental slopes of both margins. Thelargest of these basins is at the foot of the northern margin.
Within the upper 5 km, 1-D velocity-depth profiles (Figs. 6DeE)show larger variations over PR1 when compared to PR2. This isessentially due to the presence of two large sedimentary basins onthe northern margin, the Quiondongnan Basin (tr1; Figs. 4B and6D) and the Zhongjannan Basin (tr3; Figs. 4B and 6D). In the uppersection (first 5 km), the 1.6 km/s to 5 km/s velocity isocontoursshow small perturbations with an associated wavelength bracketedbetween 15 and 30 km (Fig. 4B). This wavelength is probably not anartifact since it is significantly greater than the scaling parametersused in the inversion, the vertical and horizontal correlationlengths at shallow depth being much smaller. The wavelength ofthese shallow perturbations varies along the profile. This is not
f the conjugate margins of the SW South China Sea fromwide-angle.doi.org/10.1016/j.marpetgeo.2013.10.008
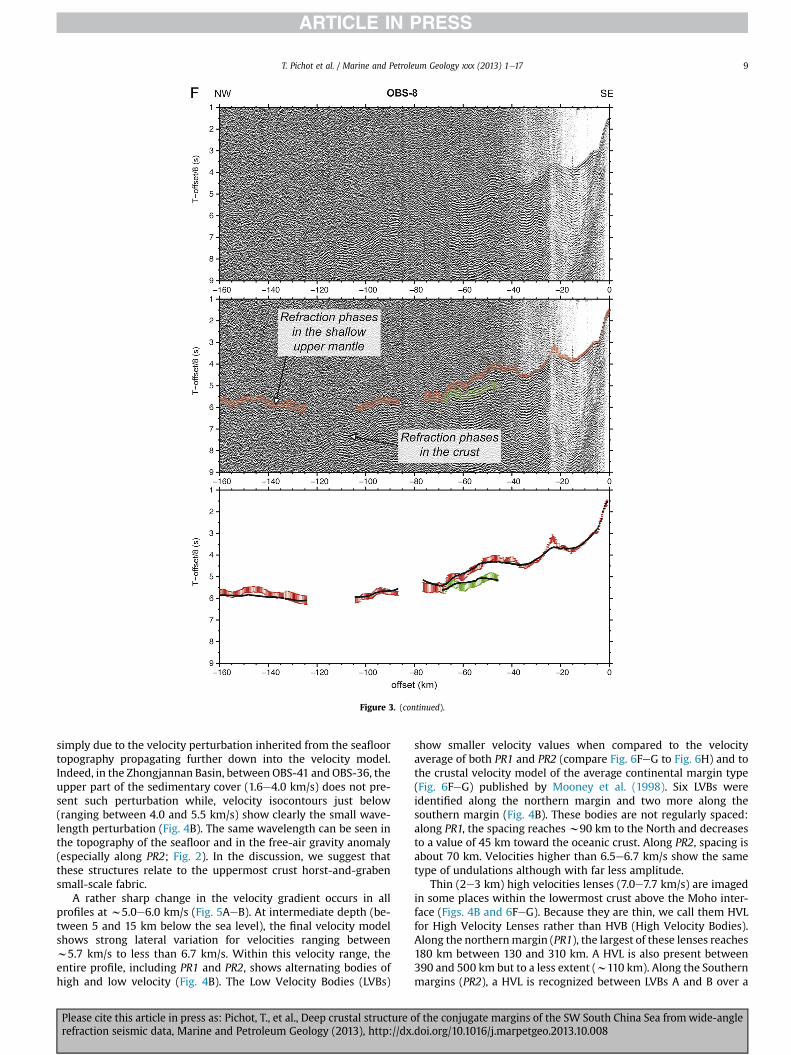
Figure 3. (continued).
T. Pichot et al. / Marine and Petroleum Geology xxx (2013) 1e17 9
simply due to the velocity perturbation inherited from the seafloortopography propagating further down into the velocity model.Indeed, in the Zhongjannan Basin, between OBS-41 and OBS-36, theupper part of the sedimentary cover (1.6e4.0 km/s) does not pre-sent such perturbation while, velocity isocontours just below(ranging between 4.0 and 5.5 km/s) show clearly the small wave-length perturbation (Fig. 4B). The same wavelength can be seen inthe topography of the seafloor and in the free-air gravity anomaly(especially along PR2; Fig. 2). In the discussion, we suggest thatthese structures relate to the uppermost crust horst-and-grabensmall-scale fabric.
A rather sharp change in the velocity gradient occurs in allprofiles at w5.0e6.0 km/s (Fig. 5AeB). At intermediate depth (be-tween 5 and 15 km below the sea level), the final velocity modelshows strong lateral variation for velocities ranging betweenw5.7 km/s to less than 6.7 km/s. Within this velocity range, theentire profile, including PR1 and PR2, shows alternating bodies ofhigh and low velocity (Fig. 4B). The Low Velocity Bodies (LVBs)
Please cite this article in press as: Pichot, T., et al., Deep crustal structure orefraction seismic data, Marine and Petroleum Geology (2013), http://dx
show smaller velocity values when compared to the velocityaverage of both PR1 and PR2 (compare Fig. 6FeG to Fig. 6H) and tothe crustal velocity model of the average continental margin type(Fig. 6FeG) published by Mooney et al. (1998). Six LVBs wereidentified along the northern margin and two more along thesouthern margin (Fig. 4B). These bodies are not regularly spaced:along PR1, the spacing reaches w90 km to the North and decreasesto a value of 45 km toward the oceanic crust. Along PR2, spacing isabout 70 km. Velocities higher than 6.5e6.7 km/s show the sametype of undulations although with far less amplitude.
Thin (2e3 km) high velocities lenses (7.0e7.7 km/s) are imagedin some places within the lowermost crust above the Moho inter-face (Figs. 4B and 6FeG). Because they are thin, we call them HVLfor High Velocity Lenses rather than HVB (High Velocity Bodies).Along the northernmargin (PR1), the largest of these lenses reaches180 km between 130 and 310 km. A HVL is also present between390 and 500 km but to a less extent (w110 km). Along the Southernmargins (PR2), a HVL is recognized between LVBs A and B over a
f the conjugate margins of the SW South China Sea fromwide-angle.doi.org/10.1016/j.marpetgeo.2013.10.008
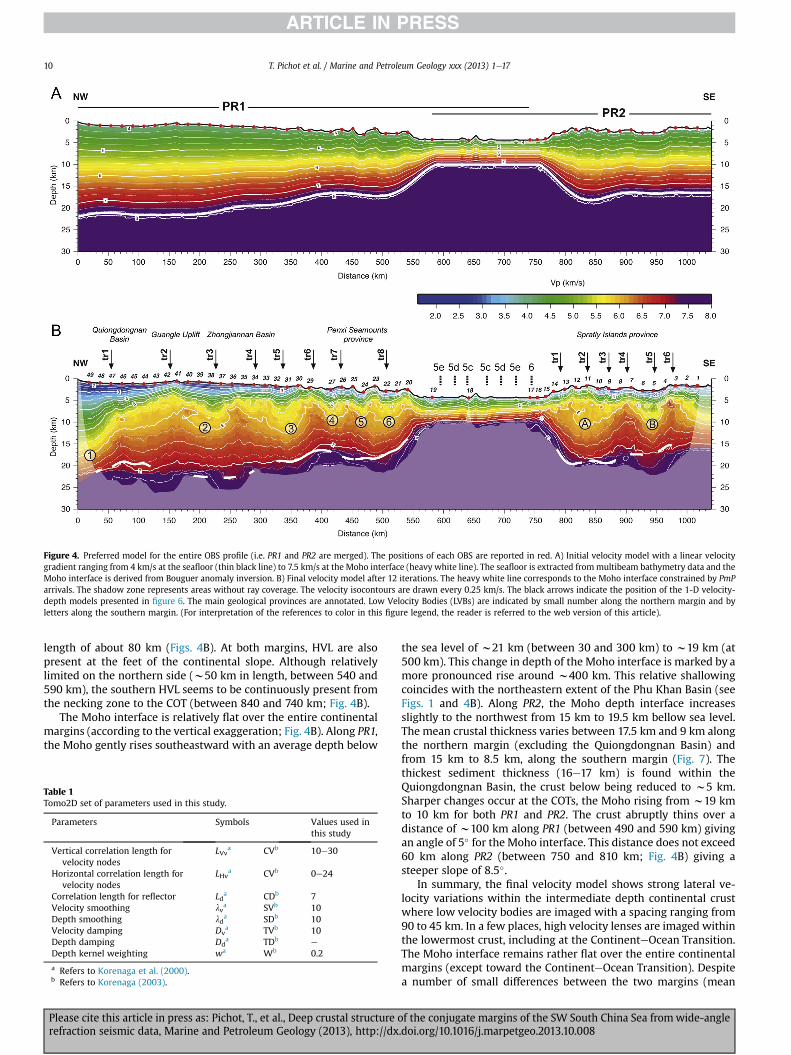
Figure 4. Preferred model for the entire OBS profile (i.e. PR1 and PR2 are merged). The positions of each OBS are reported in red. A) Initial velocity model with a linear velocitygradient ranging from 4 km/s at the seafloor (thin black line) to 7.5 km/s at the Moho interface (heavy white line). The seafloor is extracted frommultibeam bathymetry data and theMoho interface is derived from Bouguer anomaly inversion. B) Final velocity model after 12 iterations. The heavy white line corresponds to the Moho interface constrained by PmParrivals. The shadow zone represents areas without ray coverage. The velocity isocontours are drawn every 0.25 km/s. The black arrows indicate the position of the 1-D velocity-depth models presented in figure 6. The main geological provinces are annotated. Low Velocity Bodies (LVBs) are indicated by small number along the northern margin and byletters along the southern margin. (For interpretation of the references to color in this figure legend, the reader is referred to the web version of this article).
T. Pichot et al. / Marine and Petroleum Geology xxx (2013) 1e1710
length of about 80 km (Figs. 4B). At both margins, HVL are alsopresent at the feet of the continental slope. Although relativelylimited on the northern side (w50 km in length, between 540 and590 km), the southern HVL seems to be continuously present fromthe necking zone to the COT (between 840 and 740 km; Fig. 4B).
The Moho interface is relatively flat over the entire continentalmargins (according to the vertical exaggeration; Fig. 4B). Along PR1,the Moho gently rises southeastward with an average depth below
Table 1Tomo2D set of parameters used in this study.
Parameters Symbols Values used inthis study
Vertical correlation length forvelocity nodes
LVva CVb 10e30
Horizontal correlation length forvelocity nodes
LHva CVb 0e24
Correlation length for reflector Lda CDb 7
Velocity smoothing lva SVb 10
Depth smoothing lda SDb 10
Velocity damping Dva TVb 10
Depth damping Dda TDb e
Depth kernel weighting wa Wb 0.2
a Refers to Korenaga et al. (2000).b Refers to Korenaga (2003).
Please cite this article in press as: Pichot, T., et al., Deep crustal structure orefraction seismic data, Marine and Petroleum Geology (2013), http://dx
the sea level of w21 km (between 30 and 300 km) to w19 km (at500 km). This change in depth of the Moho interface is marked by amore pronounced rise around w400 km. This relative shallowingcoincides with the northeastern extent of the Phu Khan Basin (seeFigs. 1 and 4B). Along PR2, the Moho depth interface increasesslightly to the northwest from 15 km to 19.5 km bellow sea level.The mean crustal thickness varies between 17.5 km and 9 km alongthe northern margin (excluding the Quiongdongnan Basin) andfrom 15 km to 8.5 km, along the southern margin (Fig. 7). Thethickest sediment thickness (16e17 km) is found within theQuiongdongnan Basin, the crust below being reduced to w5 km.Sharper changes occur at the COTs, the Moho rising from w19 kmto 10 km for both PR1 and PR2. The crust abruptly thins over adistance of w100 km along PR1 (between 490 and 590 km) givingan angle of 5� for the Moho interface. This distance does not exceed60 km along PR2 (between 750 and 810 km; Fig. 4B) giving asteeper slope of 8.5�.
In summary, the final velocity model shows strong lateral ve-locity variations within the intermediate depth continental crustwhere low velocity bodies are imaged with a spacing ranging from90 to 45 km. In a few places, high velocity lenses are imaged withinthe lowermost crust, including at the ContinenteOcean Transition.The Moho interface remains rather flat over the entire continentalmargins (except toward the ContinenteOcean Transition). Despitea number of small differences between the two margins (mean
f the conjugate margins of the SW South China Sea fromwide-angle.doi.org/10.1016/j.marpetgeo.2013.10.008
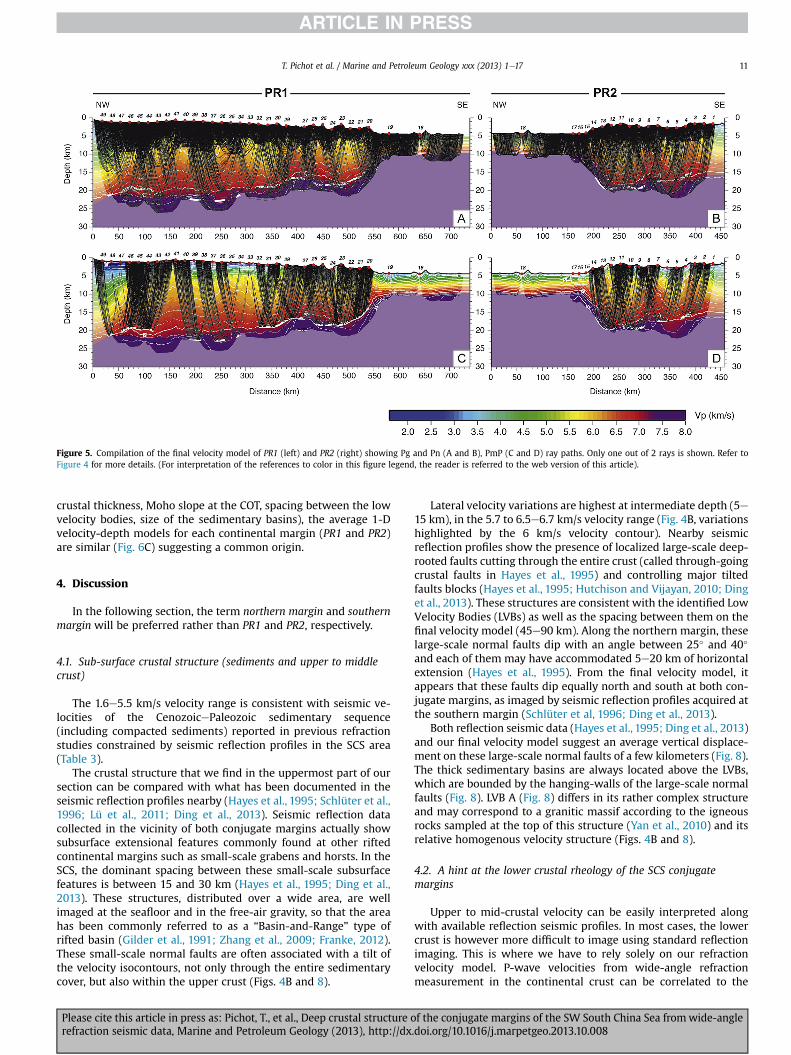
Figure 5. Compilation of the final velocity model of PR1 (left) and PR2 (right) showing Pg and Pn (A and B), PmP (C and D) ray paths. Only one out of 2 rays is shown. Refer toFigure 4 for more details. (For interpretation of the references to color in this figure legend, the reader is referred to the web version of this article).
T. Pichot et al. / Marine and Petroleum Geology xxx (2013) 1e17 11
crustal thickness, Moho slope at the COT, spacing between the lowvelocity bodies, size of the sedimentary basins), the average 1-Dvelocity-depth models for each continental margin (PR1 and PR2)are similar (Fig. 6C) suggesting a common origin.
4. Discussion
In the following section, the term northern margin and southernmargin will be preferred rather than PR1 and PR2, respectively.
4.1. Sub-surface crustal structure (sediments and upper to middlecrust)
The 1.6e5.5 km/s velocity range is consistent with seismic ve-locities of the CenozoicePaleozoic sedimentary sequence(including compacted sediments) reported in previous refractionstudies constrained by seismic reflection profiles in the SCS area(Table 3).
The crustal structure that we find in the uppermost part of oursection can be compared with what has been documented in theseismic reflection profiles nearby (Hayes et al., 1995; Schlüter et al.,1996; Lü et al., 2011; Ding et al., 2013). Seismic reflection datacollected in the vicinity of both conjugate margins actually showsubsurface extensional features commonly found at other riftedcontinental margins such as small-scale grabens and horsts. In theSCS, the dominant spacing between these small-scale subsurfacefeatures is between 15 and 30 km (Hayes et al., 1995; Ding et al.,2013). These structures, distributed over a wide area, are wellimaged at the seafloor and in the free-air gravity, so that the areahas been commonly referred to as a “Basin-and-Range” type ofrifted basin (Gilder et al., 1991; Zhang et al., 2009; Franke, 2012).These small-scale normal faults are often associated with a tilt ofthe velocity isocontours, not only through the entire sedimentarycover, but also within the upper crust (Figs. 4B and 8).
Please cite this article in press as: Pichot, T., et al., Deep crustal structure orefraction seismic data, Marine and Petroleum Geology (2013), http://dx
Lateral velocity variations are highest at intermediate depth (5e15 km), in the 5.7 to 6.5e6.7 km/s velocity range (Fig. 4B, variationshighlighted by the 6 km/s velocity contour). Nearby seismicreflection profiles show the presence of localized large-scale deep-rooted faults cutting through the entire crust (called through-goingcrustal faults in Hayes et al., 1995) and controlling major tiltedfaults blocks (Hayes et al., 1995; Hutchison and Vijayan, 2010; Dinget al., 2013). These structures are consistent with the identified LowVelocity Bodies (LVBs) as well as the spacing between them on thefinal velocity model (45e90 km). Along the northern margin, theselarge-scale normal faults dip with an angle between 25� and 40�
and each of them may have accommodated 5e20 km of horizontalextension (Hayes et al., 1995). From the final velocity model, itappears that these faults dip equally north and south at both con-jugate margins, as imaged by seismic reflection profiles acquired atthe southern margin (Schlüter et al, 1996; Ding et al., 2013).
Both reflection seismic data (Hayes et al., 1995; Ding et al., 2013)and our final velocity model suggest an average vertical displace-ment on these large-scale normal faults of a few kilometers (Fig. 8).The thick sedimentary basins are always located above the LVBs,which are bounded by the hanging-walls of the large-scale normalfaults (Fig. 8). LVB A (Fig. 8) differs in its rather complex structureand may correspond to a granitic massif according to the igneousrocks sampled at the top of this structure (Yan et al., 2010) and itsrelative homogenous velocity structure (Figs. 4B and 8).
4.2. A hint at the lower crustal rheology of the SCS conjugatemargins
Upper to mid-crustal velocity can be easily interpreted alongwith available reflection seismic profiles. In most cases, the lowercrust is however more difficult to image using standard reflectionimaging. This is where we have to rely solely on our refractionvelocity model. P-wave velocities from wide-angle refractionmeasurement in the continental crust can be correlated to the
f the conjugate margins of the SW South China Sea fromwide-angle.doi.org/10.1016/j.marpetgeo.2013.10.008
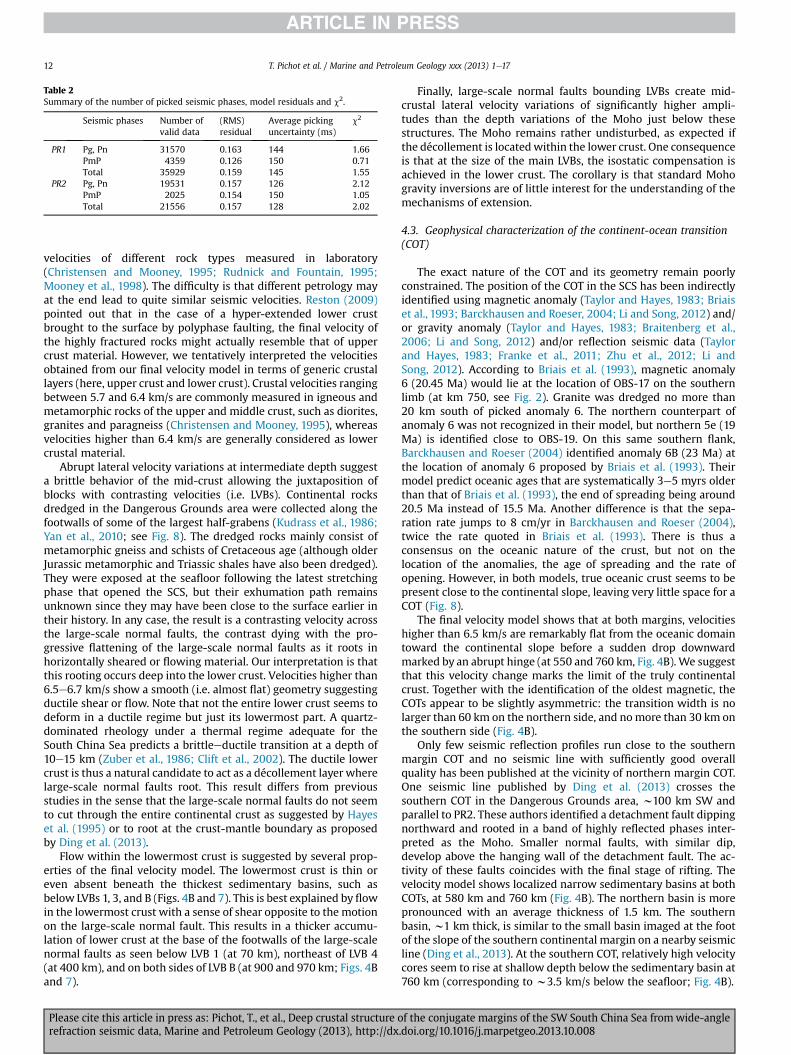
Table 2Summary of the number of picked seismic phases, model residuals and c2.
Seismic phases Number ofvalid data
(RMS)residual
Average pickinguncertainty (ms)
c2
PR1 Pg, Pn 31570 0.163 144 1.66PmP 4359 0.126 150 0.71Total 35929 0.159 145 1.55
PR2 Pg, Pn 19531 0.157 126 2.12PmP 2025 0.154 150 1.05Total 21556 0.157 128 2.02
T. Pichot et al. / Marine and Petroleum Geology xxx (2013) 1e1712
velocities of different rock types measured in laboratory(Christensen and Mooney, 1995; Rudnick and Fountain, 1995;Mooney et al., 1998). The difficulty is that different petrology mayat the end lead to quite similar seismic velocities. Reston (2009)pointed out that in the case of a hyper-extended lower crustbrought to the surface by polyphase faulting, the final velocity ofthe highly fractured rocks might actually resemble that of uppercrust material. However, we tentatively interpreted the velocitiesobtained from our final velocity model in terms of generic crustallayers (here, upper crust and lower crust). Crustal velocities rangingbetween 5.7 and 6.4 km/s are commonly measured in igneous andmetamorphic rocks of the upper and middle crust, such as diorites,granites and paragneiss (Christensen and Mooney, 1995), whereasvelocities higher than 6.4 km/s are generally considered as lowercrustal material.
Abrupt lateral velocity variations at intermediate depth suggesta brittle behavior of the mid-crust allowing the juxtaposition ofblocks with contrasting velocities (i.e. LVBs). Continental rocksdredged in the Dangerous Grounds area were collected along thefootwalls of some of the largest half-grabens (Kudrass et al., 1986;Yan et al., 2010; see Fig. 8). The dredged rocks mainly consist ofmetamorphic gneiss and schists of Cretaceous age (although olderJurassic metamorphic and Triassic shales have also been dredged).They were exposed at the seafloor following the latest stretchingphase that opened the SCS, but their exhumation path remainsunknown since they may have been close to the surface earlier intheir history. In any case, the result is a contrasting velocity acrossthe large-scale normal faults, the contrast dying with the pro-gressive flattening of the large-scale normal faults as it roots inhorizontally sheared or flowing material. Our interpretation is thatthis rooting occurs deep into the lower crust. Velocities higher than6.5e6.7 km/s show a smooth (i.e. almost flat) geometry suggestingductile shear or flow. Note that not the entire lower crust seems todeform in a ductile regime but just its lowermost part. A quartz-dominated rheology under a thermal regime adequate for theSouth China Sea predicts a brittleeductile transition at a depth of10e15 km (Zuber et al., 1986; Clift et al., 2002). The ductile lowercrust is thus a natural candidate to act as a décollement layer wherelarge-scale normal faults root. This result differs from previousstudies in the sense that the large-scale normal faults do not seemto cut through the entire continental crust as suggested by Hayeset al. (1995) or to root at the crust-mantle boundary as proposedby Ding et al. (2013).
Flow within the lowermost crust is suggested by several prop-erties of the final velocity model. The lowermost crust is thin oreven absent beneath the thickest sedimentary basins, such asbelow LVBs 1, 3, and B (Figs. 4B and 7). This is best explained by flowin the lowermost crust with a sense of shear opposite to the motionon the large-scale normal fault. This results in a thicker accumu-lation of lower crust at the base of the footwalls of the large-scalenormal faults as seen below LVB 1 (at 70 km), northeast of LVB 4(at 400 km), and on both sides of LVB B (at 900 and 970 km; Figs. 4Band 7).
Please cite this article in press as: Pichot, T., et al., Deep crustal structure orefraction seismic data, Marine and Petroleum Geology (2013), http://dx
Finally, large-scale normal faults bounding LVBs create mid-crustal lateral velocity variations of significantly higher ampli-tudes than the depth variations of the Moho just below thesestructures. The Moho remains rather undisturbed, as expected ifthe décollement is locatedwithin the lower crust. One consequenceis that at the size of the main LVBs, the isostatic compensation isachieved in the lower crust. The corollary is that standard Mohogravity inversions are of little interest for the understanding of themechanisms of extension.
4.3. Geophysical characterization of the continent-ocean transition(COT)
The exact nature of the COT and its geometry remain poorlyconstrained. The position of the COT in the SCS has been indirectlyidentified using magnetic anomaly (Taylor and Hayes, 1983; Briaiset al., 1993; Barckhausen and Roeser, 2004; Li and Song, 2012) and/or gravity anomaly (Taylor and Hayes, 1983; Braitenberg et al.,2006; Li and Song, 2012) and/or reflection seismic data (Taylorand Hayes, 1983; Franke et al., 2011; Zhu et al., 2012; Li andSong, 2012). According to Briais et al. (1993), magnetic anomaly6 (20.45 Ma) would lie at the location of OBS-17 on the southernlimb (at km 750, see Fig. 2). Granite was dredged no more than20 km south of picked anomaly 6. The northern counterpart ofanomaly 6 was not recognized in their model, but northern 5e (19Ma) is identified close to OBS-19. On this same southern flank,Barckhausen and Roeser (2004) identified anomaly 6B (23 Ma) atthe location of anomaly 6 proposed by Briais et al. (1993). Theirmodel predict oceanic ages that are systematically 3e5 myrs olderthan that of Briais et al. (1993), the end of spreading being around20.5 Ma instead of 15.5 Ma. Another difference is that the sepa-ration rate jumps to 8 cm/yr in Barckhausen and Roeser (2004),twice the rate quoted in Briais et al. (1993). There is thus aconsensus on the oceanic nature of the crust, but not on thelocation of the anomalies, the age of spreading and the rate ofopening. However, in both models, true oceanic crust seems to bepresent close to the continental slope, leaving very little space for aCOT (Fig. 8).
The final velocity model shows that at both margins, velocitieshigher than 6.5 km/s are remarkably flat from the oceanic domaintoward the continental slope before a sudden drop downwardmarked by an abrupt hinge (at 550 and 760 km, Fig. 4B). We suggestthat this velocity change marks the limit of the truly continentalcrust. Together with the identification of the oldest magnetic, theCOTs appear to be slightly asymmetric: the transition width is nolarger than 60 km on the northern side, and nomore than 30 km onthe southern side (Fig. 4B).
Only few seismic reflection profiles run close to the southernmargin COT and no seismic line with sufficiently good overallquality has been published at the vicinity of northern margin COT.One seismic line published by Ding et al. (2013) crosses thesouthern COT in the Dangerous Grounds area, w100 km SW andparallel to PR2. These authors identified a detachment fault dippingnorthward and rooted in a band of highly reflected phases inter-preted as the Moho. Smaller normal faults, with similar dip,develop above the hanging wall of the detachment fault. The ac-tivity of these faults coincides with the final stage of rifting. Thevelocity model shows localized narrow sedimentary basins at bothCOTs, at 580 km and 760 km (Fig. 4B). The northern basin is morepronounced with an average thickness of 1.5 km. The southernbasin, w1 km thick, is similar to the small basin imaged at the footof the slope of the southern continental margin on a nearby seismicline (Ding et al., 2013). At the southern COT, relatively high velocitycores seem to rise at shallow depth below the sedimentary basin at760 km (corresponding to w3.5 km/s below the seafloor; Fig. 4B).
f the conjugate margins of the SW South China Sea fromwide-angle.doi.org/10.1016/j.marpetgeo.2013.10.008
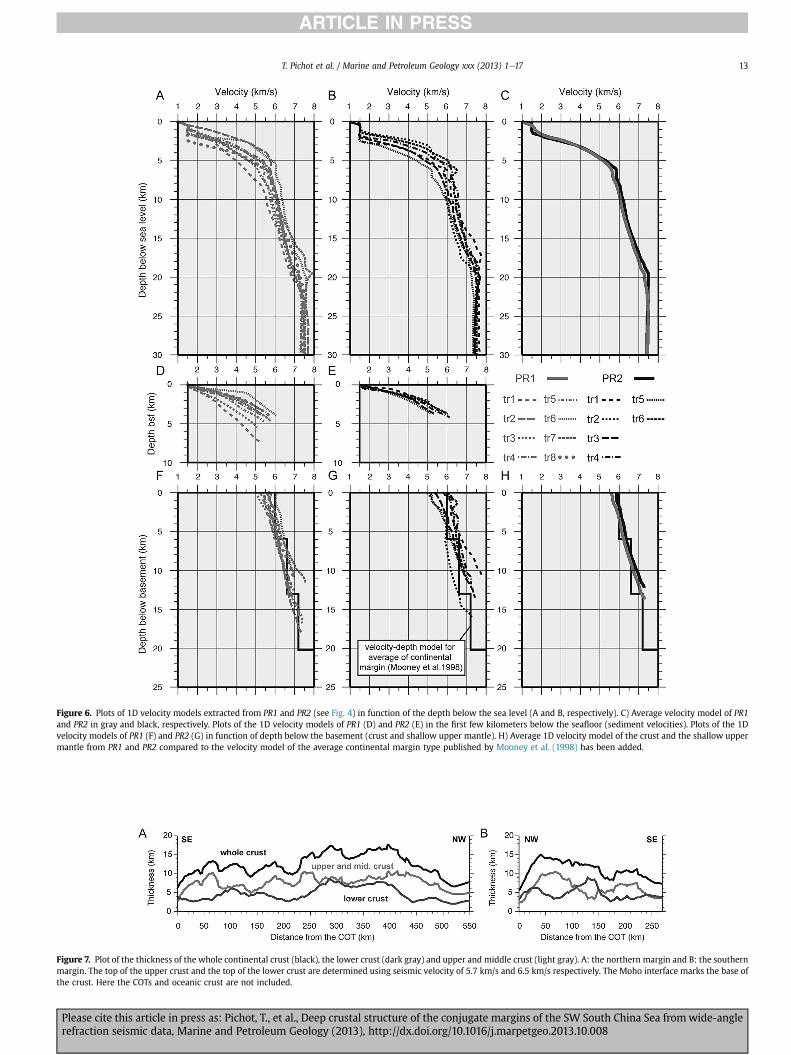
Figure 6. Plots of 1D velocity models extracted from PR1 and PR2 (see Fig. 4) in function of the depth below the sea level (A and B, respectively). C) Average velocity model of PR1and PR2 in gray and black, respectively. Plots of the 1D velocity models of PR1 (D) and PR2 (E) in the first few kilometers below the seafloor (sediment velocities). Plots of the 1Dvelocity models of PR1 (F) and PR2 (G) in function of depth below the basement (crust and shallow upper mantle). H) Average 1D velocity model of the crust and the shallow uppermantle from PR1 and PR2 compared to the velocity model of the average continental margin type published by Mooney et al. (1998) has been added.
Figure 7. Plot of the thickness of the whole continental crust (black), the lower crust (dark gray) and upper and middle crust (light gray). A: the northern margin and B: the southernmargin. The top of the upper crust and the top of the lower crust are determined using seismic velocity of 5.7 km/s and 6.5 km/s respectively. The Moho interface marks the base ofthe crust. Here the COTs and oceanic crust are not included.
T. Pichot et al. / Marine and Petroleum Geology xxx (2013) 1e17 13
Please cite this article in press as: Pichot, T., et al., Deep crustal structure of the conjugate margins of the SW South China Sea fromwide-anglerefraction seismic data, Marine and Petroleum Geology (2013), http://dx.doi.org/10.1016/j.marpetgeo.2013.10.008
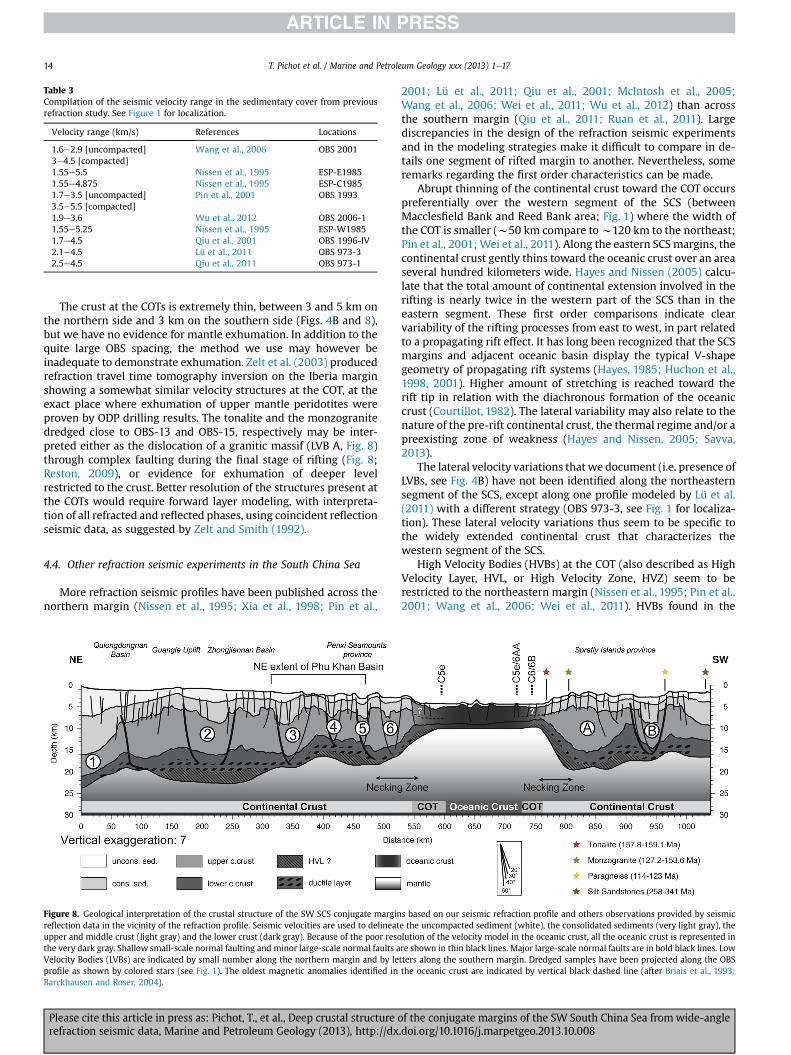
Table 3Compilation of the seismic velocity range in the sedimentary cover from previousrefraction study. See Figure 1 for localization.
Velocity range (km/s) References Locations
1.6e2.9 [uncompacted] Wang et al., 2006 OBS 20013e4.5 [compacted]1.55e5.5 Nissen et al., 1995 ESP-E19851.55e4.875 Nissen et al., 1995 ESP-C19851.7e3.5 [uncompacted] Pin et al., 2001 OBS 19933.5e5.5 [compacted]1.9e3.6 Wu et al., 2012 OBS 2006-11.55e5.25 Nissen et al., 1995 ESP-W19851.7e4.5 Qiu et al., 2001 OBS 1996-IV2.1e4.5 Lü et al., 2011 OBS 973-32.5e4.5 Qiu et al., 2011 OBS 973-1
T. Pichot et al. / Marine and Petroleum Geology xxx (2013) 1e1714
The crust at the COTs is extremely thin, between 3 and 5 km onthe northern side and 3 km on the southern side (Figs. 4B and 8),but we have no evidence for mantle exhumation. In addition to thequite large OBS spacing, the method we use may however beinadequate to demonstrate exhumation. Zelt et al. (2003) producedrefraction travel time tomography inversion on the Iberia marginshowing a somewhat similar velocity structures at the COT, at theexact place where exhumation of upper mantle peridotites wereproven by ODP drilling results. The tonalite and the monzogranitedredged close to OBS-13 and OBS-15, respectively may be inter-preted either as the dislocation of a granitic massif (LVB A, Fig. 8)through complex faulting during the final stage of rifting (Fig. 8;Reston, 2009), or evidence for exhumation of deeper levelrestricted to the crust. Better resolution of the structures present atthe COTs would require forward layer modeling, with interpreta-tion of all refracted and reflected phases, using coincident reflectionseismic data, as suggested by Zelt and Smith (1992).
4.4. Other refraction seismic experiments in the South China Sea
More refraction seismic profiles have been published across thenorthern margin (Nissen et al., 1995; Xia et al., 1998; Pin et al.,
Figure 8. Geological interpretation of the crustal structure of the SW SCS conjugate marginreflection data in the vicinity of the refraction profile. Seismic velocities are used to delineatupper and middle crust (light gray) and the lower crust (dark gray). Because of the poor resothe very dark gray. Shallow small-scale normal faulting and minor large-scale normal faults aVelocity Bodies (LVBs) are indicated by small number along the northern margin and by leprofile as shown by colored stars (see Fig. 1). The oldest magnetic anomalies identified inBarckhausen and Roser, 2004).
Please cite this article in press as: Pichot, T., et al., Deep crustal structure orefraction seismic data, Marine and Petroleum Geology (2013), http://dx
2001; Lü et al., 2011; Qiu et al., 2001; McIntosh et al., 2005;Wang et al., 2006; Wei et al., 2011; Wu et al., 2012) than acrossthe southern margin (Qiu et al., 2011; Ruan et al., 2011). Largediscrepancies in the design of the refraction seismic experimentsand in the modeling strategies make it difficult to compare in de-tails one segment of rifted margin to another. Nevertheless, someremarks regarding the first order characteristics can be made.
Abrupt thinning of the continental crust toward the COT occurspreferentially over the western segment of the SCS (betweenMacclesfield Bank and Reed Bank area; Fig. 1) where the width ofthe COT is smaller (w50 km compare tow120 km to the northeast;Pin et al., 2001;Wei et al., 2011). Along the eastern SCS margins, thecontinental crust gently thins toward the oceanic crust over an areaseveral hundred kilometers wide. Hayes and Nissen (2005) calcu-late that the total amount of continental extension involved in therifting is nearly twice in the western part of the SCS than in theeastern segment. These first order comparisons indicate clearvariability of the rifting processes from east to west, in part relatedto a propagating rift effect. It has long been recognized that the SCSmargins and adjacent oceanic basin display the typical V-shapegeometry of propagating rift systems (Hayes, 1985; Huchon et al.,1998, 2001). Higher amount of stretching is reached toward therift tip in relation with the diachronous formation of the oceaniccrust (Courtillot, 1982). The lateral variability may also relate to thenature of the pre-rift continental crust, the thermal regime and/or apreexisting zone of weakness (Hayes and Nissen, 2005; Savva,2013).
The lateral velocity variations that we document (i.e. presence ofLVBs, see Fig. 4B) have not been identified along the northeasternsegment of the SCS, except along one profile modeled by Lü et al.(2011) with a different strategy (OBS 973-3, see Fig. 1 for localiza-tion). These lateral velocity variations thus seem to be specific tothe widely extended continental crust that characterizes thewestern segment of the SCS.
High Velocity Bodies (HVBs) at the COT (also described as HighVelocity Layer, HVL, or High Velocity Zone, HVZ) seem to berestricted to the northeastern margin (Nissen et al., 1995; Pin et al.,2001; Wang et al., 2006; Wei et al., 2011). HVBs found in the
s based on our seismic refraction profile and others observations provided by seismice the uncompacted sediment (white), the consolidated sediments (very light gray), thelution of the velocity model in the oceanic crust, all the oceanic crust is represented inre shown in thin black lines. Major large-scale normal faults are in bold black lines. Lowtters along the southern margin. Dredged samples have been projected along the OBSthe oceanic crust are indicated by vertical black dashed line (after Briais et al., 1993;
f the conjugate margins of the SW South China Sea fromwide-angle.doi.org/10.1016/j.marpetgeo.2013.10.008
T. Pichot et al. / Marine and Petroleum Geology xxx (2013) 1e17 15
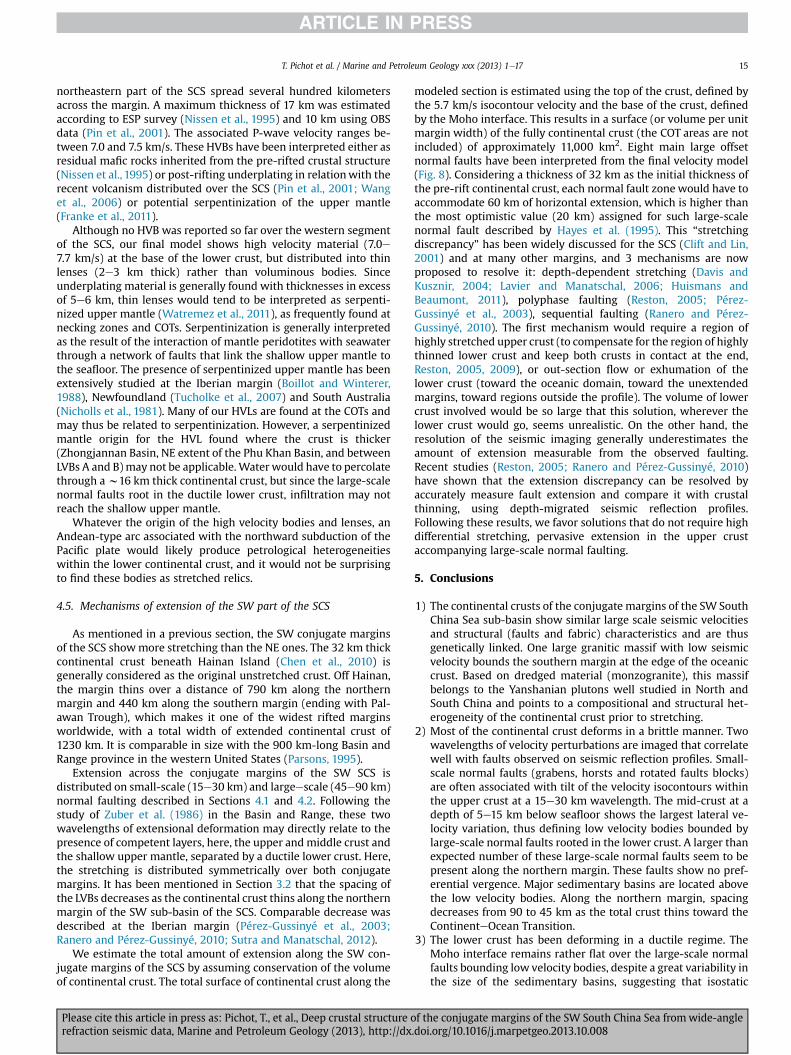
northeastern part of the SCS spread several hundred kilometersacross the margin. A maximum thickness of 17 km was estimatedaccording to ESP survey (Nissen et al., 1995) and 10 km using OBSdata (Pin et al., 2001). The associated P-wave velocity ranges be-tween 7.0 and 7.5 km/s. These HVBs have been interpreted either asresidual mafic rocks inherited from the pre-rifted crustal structure(Nissen et al., 1995) or post-rifting underplating in relationwith therecent volcanism distributed over the SCS (Pin et al., 2001; Wanget al., 2006) or potential serpentinization of the upper mantle(Franke et al., 2011).
Although no HVB was reported so far over the western segmentof the SCS, our final model shows high velocity material (7.0e7.7 km/s) at the base of the lower crust, but distributed into thinlenses (2e3 km thick) rather than voluminous bodies. Sinceunderplating material is generally found with thicknesses in excessof 5e6 km, thin lenses would tend to be interpreted as serpenti-nized upper mantle (Watremez et al., 2011), as frequently found atnecking zones and COTs. Serpentinization is generally interpretedas the result of the interaction of mantle peridotites with seawaterthrough a network of faults that link the shallow upper mantle tothe seafloor. The presence of serpentinized upper mantle has beenextensively studied at the Iberian margin (Boillot and Winterer,1988), Newfoundland (Tucholke et al., 2007) and South Australia(Nicholls et al., 1981). Many of our HVLs are found at the COTs andmay thus be related to serpentinization. However, a serpentinizedmantle origin for the HVL found where the crust is thicker(Zhongjannan Basin, NE extent of the Phu Khan Basin, and betweenLVBs A and B)may not be applicable.Water would have to percolatethrough aw16 km thick continental crust, but since the large-scalenormal faults root in the ductile lower crust, infiltration may notreach the shallow upper mantle.
Whatever the origin of the high velocity bodies and lenses, anAndean-type arc associated with the northward subduction of thePacific plate would likely produce petrological heterogeneitieswithin the lower continental crust, and it would not be surprisingto find these bodies as stretched relics.
4.5. Mechanisms of extension of the SW part of the SCS
As mentioned in a previous section, the SW conjugate marginsof the SCS showmore stretching than the NE ones. The 32 km thickcontinental crust beneath Hainan Island (Chen et al., 2010) isgenerally considered as the original unstretched crust. Off Hainan,the margin thins over a distance of 790 km along the northernmargin and 440 km along the southern margin (ending with Pal-awan Trough), which makes it one of the widest rifted marginsworldwide, with a total width of extended continental crust of1230 km. It is comparable in size with the 900 km-long Basin andRange province in the western United States (Parsons, 1995).
Extension across the conjugate margins of the SW SCS isdistributed on small-scale (15e30 km) and largeescale (45e90 km)normal faulting described in Sections 4.1 and 4.2. Following thestudy of Zuber et al. (1986) in the Basin and Range, these twowavelengths of extensional deformation may directly relate to thepresence of competent layers, here, the upper andmiddle crust andthe shallow upper mantle, separated by a ductile lower crust. Here,the stretching is distributed symmetrically over both conjugatemargins. It has been mentioned in Section 3.2 that the spacing ofthe LVBs decreases as the continental crust thins along the northernmargin of the SW sub-basin of the SCS. Comparable decrease wasdescribed at the Iberian margin (Pérez-Gussinyé et al., 2003;Ranero and Pérez-Gussinyé, 2010; Sutra and Manatschal, 2012).
We estimate the total amount of extension along the SW con-jugate margins of the SCS by assuming conservation of the volumeof continental crust. The total surface of continental crust along the
Please cite this article in press as: Pichot, T., et al., Deep crustal structure orefraction seismic data, Marine and Petroleum Geology (2013), http://dx
modeled section is estimated using the top of the crust, defined bythe 5.7 km/s isocontour velocity and the base of the crust, definedby the Moho interface. This results in a surface (or volume per unitmargin width) of the fully continental crust (the COT areas are notincluded) of approximately 11,000 km2. Eight main large offsetnormal faults have been interpreted from the final velocity model(Fig. 8). Considering a thickness of 32 km as the initial thickness ofthe pre-rift continental crust, each normal fault zone would have toaccommodate 60 km of horizontal extension, which is higher thanthe most optimistic value (20 km) assigned for such large-scalenormal fault described by Hayes et al. (1995). This “stretchingdiscrepancy” has been widely discussed for the SCS (Clift and Lin,2001) and at many other margins, and 3 mechanisms are nowproposed to resolve it: depth-dependent stretching (Davis andKusznir, 2004; Lavier and Manatschal, 2006; Huismans andBeaumont, 2011), polyphase faulting (Reston, 2005; Pérez-Gussinyé et al., 2003), sequential faulting (Ranero and Pérez-Gussinyé, 2010). The first mechanism would require a region ofhighly stretched upper crust (to compensate for the region of highlythinned lower crust and keep both crusts in contact at the end,Reston, 2005, 2009), or out-section flow or exhumation of thelower crust (toward the oceanic domain, toward the unextendedmargins, toward regions outside the profile). The volume of lowercrust involved would be so large that this solution, wherever thelower crust would go, seems unrealistic. On the other hand, theresolution of the seismic imaging generally underestimates theamount of extension measurable from the observed faulting.Recent studies (Reston, 2005; Ranero and Pérez-Gussinyé, 2010)have shown that the extension discrepancy can be resolved byaccurately measure fault extension and compare it with crustalthinning, using depth-migrated seismic reflection profiles.Following these results, we favor solutions that do not require highdifferential stretching, pervasive extension in the upper crustaccompanying large-scale normal faulting.
5. Conclusions
1) The continental crusts of the conjugate margins of the SW SouthChina Sea sub-basin show similar large scale seismic velocitiesand structural (faults and fabric) characteristics and are thusgenetically linked. One large granitic massif with low seismicvelocity bounds the southern margin at the edge of the oceaniccrust. Based on dredged material (monzogranite), this massifbelongs to the Yanshanian plutons well studied in North andSouth China and points to a compositional and structural het-erogeneity of the continental crust prior to stretching.
2) Most of the continental crust deforms in a brittle manner. Twowavelengths of velocity perturbations are imaged that correlatewell with faults observed on seismic reflection profiles. Small-scale normal faults (grabens, horsts and rotated faults blocks)are often associated with tilt of the velocity isocontours withinthe upper crust at a 15e30 km wavelength. The mid-crust at adepth of 5e15 km below seafloor shows the largest lateral ve-locity variation, thus defining low velocity bodies bounded bylarge-scale normal faults rooted in the lower crust. A larger thanexpected number of these large-scale normal faults seem to bepresent along the northern margin. These faults show no pref-erential vergence. Major sedimentary basins are located abovethe low velocity bodies. Along the northern margin, spacingdecreases from 90 to 45 km as the total crust thins toward theContinenteOcean Transition.
3) The lower crust has been deforming in a ductile regime. TheMoho interface remains rather flat over the large-scale normalfaults bounding low velocity bodies, despite a great variability inthe size of the sedimentary basins, suggesting that isostatic
f the conjugate margins of the SW South China Sea fromwide-angle.doi.org/10.1016/j.marpetgeo.2013.10.008
T. Pichot et al. / Marine and Petroleum Geology xxx (2013) 1e1716
compensation is achieved through the ductile lower crust. Themain large-scale normal faults root within this level.
4) The ContinenteOcean Transitions are narrow and slightlyasymmetric: 60 km on the northern side, and no more than30 km on the southern side. High velocity material is present atvery shallow level at these transitions (3 km below the sedi-mentary basin), but exhumation of upper mantle peridotites orserpentinites cannot be proven.
5) Large-scale extensional structures observed along the conjugatemargins of the SW South China Sea fail to explain the totalamount of horizontal extension estimated from thinning. Toexplain the discrepancy, pervasive faulting/deformation notdetected on seismic profiles is needed.
References
Barckhausen, U., Roeser, H.A., 2004. Seafloor spreading anomalies in the SouthChina Sea revisited. In: Clift, P., Kuhnt, W., Wang, P., Hayes, D.E. (Eds.), Conti-nent-ocean Interactions in the East Asian Marginal Seas. Geophys. MonographSeries. American Geophysical Union, pp. 121e125.
Boillot, G., Winterer, E., 1988. Drilling on the Galicia margin: retrospect and pros-pect. In: Proceedings Ocean Drilling Program. Scientific Results, vol. 103,pp. 809e828.
Braitenberg, C., Wienecke, S., Wang, Y., 2006. Basement structures from satellite-derived gravity field: south China Sea ridge. J. Geophys. Res. 111, 1e15. http://dx.doi.org/10.1029/2005JB003938.
Briais, A., Patriat, P., Tapponnier, P., 1993. Updated interpretation of magneticanomalies and sea floor spreading stages in the South China Sea: implicationsfor the Tertiary tectonics of Southeast Asia. J. Geophys. Res. 98, 6299e6328.
Chamot-Rooke, N., Gaulier, J.-M., Jestin, F., 1997. Constraints on Moho depth andcrustal thickness in the Liguro-Provençal basin from a 3D gravity inversion:geodynamic implications. Revue de l’Institut Français du Pétrole 52, 557e583.
Chen, Y., Niu, F., Liu, R., Huang, Z., Tkalcic, H., Sun, L., Chan, W., 2010. Crustalstructure beneath China from receiver function analysis. J. Geophys. Res. 115(B03307), 1e22. http://dx.doi.org/10.1029/2009JB006386.
Christensen, N., Mooney, W., 1995. Seismic velocity structure and composition ofthe continental crust: a global view. J. Geophys. Res. 100, 9761e9788.
Clift, P.D., Lin, J., 2001. Preferential mantle lithospheric extension under the SouthChina margin. Mar. Pet. Geology. 18, 929e945.
Clift, P.D., Lin, J., Barckhausen, U., 2002. Evidence of low flexural rigidity and lowviscosity lower continental crust during continental break-up in the SouthChina Sea. Mar. Pet. Geology. 19, 951e970.
Courtillot, V.,1982. Propagating rift and continental break up. Tectonics 1 (3), 239e250.Davis, M., Kusznir, N., 2004. Depth-Dependent lithospheric stretching at rifted
continental margins. In: Karner, G.D. (Ed.), Proceedings of NSF Rifted MarginsTheoretical Institute. Columbia University Press, pp. 92e136.
Ding, W., Franke, D., Li, J., Steuer, S., 2013. Seismic stratigraphy and tectonic struc-ture from a composite multi-channel seismic profile across the entiredangerous grounds, South China Sea. Tectonophysics 582, 162e176.
Franke, D., 2012. Rifting, lithosphere breakup and volcanism: comparison ofmagma-poor and volcanic rifted margins. Mar. Pet. Geol., 1e25. http://dx.doi.org/10.1016/j.marpetgeo.2012.11.003.
Franke, D., Barckhausen, U., Baristeas, N., Engels, M., Lutz, R., Montano, J., 2011. Thecontinent-ocean transition at the southeastern margin of the South China Sea.Mar. Pet. Geol. 28, 1187e1204.
Gilder, S.A., Keller, G.R., Luo, M., Goodell, P.C., 1991. Timing and spatial distributionof rifting in China. Tectonophysics 197, 225e243.
Hayes, D.E., 1985. Margins of the southwest sub-basin of the South China Sea-Afrontier exploration target? Energy 10 (3/4), 373e382.
Hayes, D.E., Nissen, S.S., 2005. The south China Sea margins: implication for riftingcontrast. Earth Planet. Sci. Lett. 237, 601e616.
Hayes, D.E., Nissen, S.S., Buhl, P., Diebold, J., Yao, B., Zeng, W., Chen, Y., 1995.Throughgoing crustal faults along the northern margin of the South China Seaand their role in crustal extension. J. Geophys. Res. 100, 22435e22446.
Huchon, P., Nguyen, T., Chamot-Rooke, N., 1998. Finite extension across the SouthVietnam basins from 3D gravimetric modelling: relation to South China Seakinematics. Mar. Pet. Geology. 15, 619e634.
Huchon, P., Nguyen, T., Chamot-Rooke, N., 2001. Propagation of continental breakupin the southwestern South China Sea. In: Wilson, R., Whitmarsh, R., Taylor, B.,Froitzheim, N. (Eds.), Geological Society of London, vol. 187, pp. 31e50.
Huismans, R., Beaumont, C., 2003. Symmetric and asymmetric lithospheric exten-sion: relative effects of frictional-plastic and viscous strain softening.J. Geophys. Res. 108 (B10), 2496. http://dx.doi.org/10.1029/2002JB002026.
Huismans, R., Beaumont, C., 2011. Depth-dependent extension, two-stage breakupand cratonic underplating at rifted margins. Nature 473, 74e79.
Huismans, R.S., Buiter, S.J.H., Beaumont, C., 2005. The effect of plastic-viscouslayering and strain-softening on mode selection during lithospheric exten-sion. J. Geophys. Res. 110 (B02406). http://dx.doi.org/10.1029/2004JB003114.
Please cite this article in press as: Pichot, T., et al., Deep crustal structure orefraction seismic data, Marine and Petroleum Geology (2013), http://dx
Hutchison, C.S., Vijayan, V.R., 2010. What are the Spratly islands? J. Asian Earth Sci.39 (5), 371e385.
Jahn, B.M., Chen, P.Y., Yen, T.P., 1976. Rb-Sr ages of granitic rocks in southeasternChina and their tectonic significance. Geol. Soc. America Bull. 87, 763e776.
Korenaga, J., 2003. Tomo2D: A Cþþ Package for 2-D Joint Refraction and ReflectionTravel-time Tomography. http://people.earth.yale.edu/profile/jk525/content/software.
Korenaga, J., Kelemen, P.B., 1997. Origin of gabbro sills in the Moho transition zoneof the Oman ophiolite: implications for magma transport in the oceanic lowercrust. J. Geophys. Res. 102, 27729e27749.
Korenaga, J., Holbrook, W.S., Kent, G.M., Kelemen, P.B., Detrick, R.S., Larsen, H.,Hopper, J.R., Carlo, M., 2000. Crustal structure of the southeast Greenlandmargin from joint refraction and reflection seismic tomography. J. Geophys. Res.105, 591e614.
Kudrass, H.W., Wiedicke, M., Cepek, P., Kreuzer, H., MQller, P., 1986. Mesozoic and
Cainozoic rocks dredged from the South China Sea (Reed Bank area) and SuluSea and their significance for plate-tectonic reconstructions. Mar. Pet. Geology.3, 19e30.
Lavier, L.L., Manatschal, G., 2006. A mechanism to thin the continental lithosphereat magma-poor margins. Nature 440, 324e328.
Li, C.F., Song, T.R., 2012. Magnetic recording of the Cenozoic oceanic crustal accre-tion and evolution of the South China Sea basin. Chin. Sci. Bull. 57 (24), 3165e3181. http://dx.doi.org/10.1007/s11434-012-5063-9.
Lü, C.C., Hao, T., Qiu, X.L., Zhao, M.H., You, Q.Y., 2011. A study on the deep structureof the northern part of southwest sub-basin from ocean bottom seismic data,South China Sea. Chin. J. Geophys. 54 (12), 3129e3138 (in Chinese).
McIntosh, K.D., Nakamura, Y., Wang, T.K., Shih, R.C., Chen, A.T., Liu, C.S., 2005.Crustal-scale seismic profiles across Taiwan and the western Philippine Sea.Tectonophysics 401, 23e54.
McKenzie, D., 1978. Some remarks on the development of sedimentary basins. EarthPlanet. Sci. Lett. 40, 25e42.
Mooney, W., Laske, G., Masters, T., 1998. CRUST 5.1: a global crustal model at 5N-5.J. Geophys. Res. 103, 727e747.
Nguyen, N.T., Nguyen, T.T.H., 2013. Topography of the Moho and Earth cruststructure beneath the east Vietnam sea from 3D inversion of gravity field data.Acta Geophys. 61 (2), 357e384. http://dx.doi.org/10.2478/s11600-012-0078-9.
Nicholls, I.A., Ferguson, J., Jones, H., Marks, G.P., Mutter, J.C., 1981. Ultramafic blocksfrom the seafloor southwest of Australia. Earth Planet. Sci. Lett. 56, 362e374.
Nissen, S.S., Hayes, D.E., Buhl, P., Diebold, J., Bochu, Y., Weijun, Z., Yongqin, C., 1995.Deep penetration seismic sounding across the nothern margin of the SouthChina Sea. J. Geophys. Res. 100, 22407e22433.
Parker, R.L., 1973. The rapid calculation of potential anomalies. Geophys. J. R. As-tronomical Soc. 31 (4), 447e455. http://dx.doi.org/10.1111/j.1365-246X.1973.tb06513.x.
Parsons, T., 1995. The basin and range province. In: Olsen, K. (Ed.), Continental Rifts:Evolution, Structure and Tectonics. Elsevier, Amsterdam, ISBN 044489-566-3,pp. 277e324.
Pérez-Gussinyé, M., Ranero, C.R., Reston, T.J., Sawyer, D., 2003. Structure andmechanisms of extension at the Galicia Interior Basin, west of Iberia. J. Geophys.Res. 108 (B5), 2245. http://dx.doi.org/10.1029/2001JB000901.
Pin, Y., Di, Z., Zhaoshu, L., 2001. A crustal structure across the northern continentalmargin of the South China Sea. Tectonophysics 338, 1e21.
Pubellier, M., Ego, F., Chamot-Rooke, N., Rangin, C., 2003. The building of pericra-tonic mountain ranges: structural and kinematic constraints applied to GIS-based reconstructions of SE Asia. Bull. de la Société géologique de France 174(6), 561e584.
Qiu, X.L., Ye, S., Wu, S., Shi, X., Zhou, D., Xia, K., Flueh, E.R., 2001. Crustal structureacross the Xisha trough, northwestern South China Sea. Tectonophysics 341,179e193.
Qiu, X.L., Zhao, M.H., Ao, W., Lü, C.C., Hao, T.Y., You, Q.Y., Ruan, A.G., Li, J.B., 2011. OBSsurvey and crustal structure of the SW sub-basin and Nansha block, SouthChina Sea. Chin. J. Geophys. 54 (12), 1009e1021.
Ranero, C.R., Pérez-Gussinyé, M., 2010. Sequential faulting explains the asymmetryand extension discrepancy of conjugate margins. Nature 468, 294e300. http://dx.doi.org/10.1038/nature09520.
Reston, T.J., 2005. Polyphase faulting during the development of the west Galiciarifted margin. Earth Planet. Sci. Lett. 237, 561e576.
Reston, T.J., 2009. The structure, evolution and symmetry of the magma-poorrifted margins of the North and Central Atlantic: a Synthesis. Tectonophysics468, 6e27.
Ruan, A. G., Niu, X. W., Qiu, X. L., Li, J. B., Wu, Z. L., Zhao, M. H., Wei, X. D., 2011. (inChinese) 54(12), 3139e3149.
Rudnick, R.L., Fountain, D.M., 1995. Nature and composition of the continentalcrust: a lower crustal perspective. Rev. Geophys. 33, 267e309.
Sandwell, D.T., Smith, W.H.F., 2009. Global marine gravity from retracked Geosatand ERS-1 altimetry: ridge segmentation versus spreading rate. J. Geophys. Res.114 (B01411), 1e18. http://dx.doi.org/10.1029/2008JB006008.
Savva, D., 2013. Variabilité des processus d’extension continentale en mer de chinedu Sud. Université Pierre et Marie Curie, Paris. Ph.D. Thesis.
Schluter, H.U., Hinz, K., Block, M., 1996. Tectono-stratigraphic terranes anddetachment faulting of the South China Sea and Sulu sea. Mar. Geology. 130,39e51.
Smith, W.H.F., Sandwell, D.T., 1997. Global seafloor topography from satellitealtimetry and ship depth soundings. Science 277, 1957e1962.
f the conjugate margins of the SW South China Sea fromwide-angle.doi.org/10.1016/j.marpetgeo.2013.10.008
T. Pichot et al. / Marine and Petroleum Geology xxx (2013) 1e17 17
Sutra, E., Manatschal, G., 2012. Hoes does the continental crust thin in a hyperextendedrifted margin? Insights from the Iberian margin. Geology 40 (2), 139e142.
Taylor, B., Hayes, D.E., 1983. Origin and history of the South China Sea basin. In:Hayes, D.E. (Ed.), The Tectonic and Geologic Evolution of Southeast Asian Seaand Islands. AGU, Washington, DC, pp. 23e56.
Toomey, D.R., Solomon, S.C., Purdy, G.M., 1994. Tomographic imaging of the shallowcrustal structure of the East Pacific Rise at 9N30’N. J. Geophys. Res. 99, 24135e24157.
Tucholke, B.E., Sawyer, D.S., Sibuet, J.-C., 2007. Breakup of the NewfoundlandeIberiarift. In: Geological Society of London, Special Publication, vol. 282, pp. 9e46.
VanAvendonk,H.J.A., Harding, A.J., Orcutt, J.A.,1998. A two-dimensional tomographicstudy of the Clipperton transform fault. J. Geophys. Res. 103, 17885e17899.
Wang, T.K., Chen, M.K., Lee, C.S., Xia, K., 2006. Seismic imaging of the transitionalcrust across the northeastern margin of the South China Sea. Tectonophysics412, 237e254.
Wang, Y., Fan, W., Zhang, G., Zhang, Y., 2012. Phanerozoic tectonics of the SouthChina Block: Key observations and controversies. Gondwana Res.. http://dx.doi.org/10.1016/j.gr.2012.02.019.
Watremez, L., Leroy, S., Rouzo, E., D’Acremont, E., Unternehr, P., Ebinger, C.,Lucazeau, F., Al-Lazki, A., 2011. The crustal structure of the north-eastern Gulf ofAden continental margin: insights from wide-angle seismic data. Geophys. J.Int. 184, 575e594. http://dx.doi.org/10.1111/j.1365-246X.2010.04881.x.
Wei, X.D., Ruan, A.G., Zhao, M.H., Qiu, X.L., Li, J.B., Zhu, J.J., Wu, Z.L., Ding, W.W., 2011.A wide-angle OBS profile across the Dongsha uplift and Chaoshan depression inthe mid-northern South China Sea. Chin. J. Geophys. 54 (12), 1149e1160.
Wernicke, B., 1985. Uniform-sense normal simple shear of the continental litho-sphere. Can. J. Earth Sci. 22, 108e125.
Wu, Z., Li, J., Ruan, A., Lou, H., Ding, W.W., Niu, X., Li, X.B., 2012. Crustal structure ofthe northwestern subbasin, South China Sea: Results from a wide-angle seismicexperiment. Earth Sci. Sci. China 55 (1), 159e172.
Please cite this article in press as: Pichot, T., et al., Deep crustal structure orefraction seismic data, Marine and Petroleum Geology (2013), http://dx
Xia, K., Xia, K., Zhou, D., Su, D., Flueh, E.R., Ye, S., He, H., Chen, W., Xie, Y.,Wang, G., Liu, S., Fu, G., Wang, J., Chen, J., 1998. The velocity structure of theYinggehai Basin and its hydrocarbon implication. Chin. Sci. Bull. 43, 2047e2054.
Yan, Q., Shi, X., Liu, J., Wang, K., Bu, W., 2010. Petrology and geochemistry ofMesozoic granitic rocks from the Nansha micro-block, the South China Sea:constraints on the basement nature. J. Asian Earth Sci. 37, 130e139.
Zelt, C.A., Barton, P.J., 1998. Three-dimensional seismic refraction tomography: acomparison of two methods applied to date from the Faeroe Basin. J. Geophys.Res. 103, 7187e7210.
Zelt, C.A., Forsyth, D., 1994. Modeling wide-angle seismic data for crustal structure:southeastern Grenville Province. J. Geophys. Res. 99 (B6), 11687e11704.
Zelt, C.A., Smith, R.B., 1992. Seismic traveltime inversion for 2-D crustal velocitystructure. Geophys. J. Int. 108, 16e34.
Zelt, C.A., Sain, K., Naumenko, J.V., Sawyer, D.S., 2003. Assessment of crustal velocitymodels using seismic refraction and reflection tomography. Geophys. J. Int. 153,609e626.
Zhang, Z.J., Liu, Y.F., Zhang, S.F., Zhang, G.C., Fan, W.M., 2009. Crustal P-wave velocitystructure and layering beneath ZhujiangkoueQiongdongnan basins in thenorthern continental margin of South China Sea. Chin. J. Geophys. 52 (5), 1012e1023.
Zhu, J., Qiu, X., Kopp, H., Xu, H., Sun, Z., Ruan, A., Sun, J., Wei, X., 2012. Shallowanatomy of a continenteocean transition zone in the northern South China Seafrom multichannel seismic data. Tectonophysics 554e557, 18e29.
Ziegler, P.A., 2001. Dynamic Processes Controlling Development of Rifted Basins.EUCOR-URGENT Publication 1, pp. 1e51.
Zuber, M.T., Parmentier, E.M., Fletcher, R.C., 1986. Extension of continental litho-sphere: a model for two scales of basin and range deformation. J. Geophys. Res.91, 4826e4838.
f the conjugate margins of the SW South China Sea fromwide-angle.doi.org/10.1016/j.marpetgeo.2013.10.008