Deconstruction as a Mechanism of Creativity and Its Reflections of Islamic Architecture
Upload
independentCategory
view
0download
0
Deconstruction of Nurse-Delivered Patient Self-ManagementInterventions for Symptom Management: Factors Related toDelivery Enactment and Response
Charles W. Given, Ph.D.,Department of Family Medicine, Michigan State University, East Lansing, MI, USA. B108 ClinicalCenter, East Lansing, MI 48824, USA
Barbara A. Given, Ph.D., R.N., F.A.A.N.,College of Nursing, Michigan State University, East Lansing, MI, USA
Alla Sikorskii, Ph.D.,Department of Statistics and Probability, Michigan State University, East Lansing, MI, USA
Mei You, M.S.,College of Nursing, Michigan State University, East Lansing, MI, USA
Sangchoon Jeon, Ph.D.,School of Nursing, Yale University, New Haven, CT, USA
Victoria Champion, D.N.S., andSchool of Nursing, Indiana University, Indianapolis, IN, USA
Ruth McCorkle, Ph.D., F.A.A.N.School of Nursing, Yale University, New Haven, CT, USACharles W. Given: [email protected]
AbstractThis research examines the processes by which patient self-management interventions are related tosymptom responses among cancer patients. A total of 333 patients from two randomized clinicaltrials were combined. Each patient received a six-contact 8-week patient self-managementintervention delivered by a nurse to address symptoms. Nurses’ decisions to deliver the strategies,patient enactment of strategies, and their success were investigated using patient- and symptom-levelcharacteristics. Generalized estimating equation modeling accounted for clustering of symptoms andstrategies delivered for each symptom within patient. Patient self-management intervention strategieswere classified into four classes. Strategies were delivered by nurses for symptoms with higherinterference and longer duration. Patient and symptom factors were related to enactment strategies.Symptom responses were related to number of strategies tried by patients. Delivery and enactmentof strategies were related to both patient and symptom characteristics.
KeywordsCancer; Symptom responses; Cognitive behavioral interventions
Correspondence to: Charles W. Given, [email protected].
NIH Public AccessAuthor ManuscriptAnn Behav Med. Author manuscript; available in PMC 2011 August 1.
Published in final edited form as:Ann Behav Med. 2010 August ; 40(1): 99–113. doi:10.1007/s12160-010-9191-7.
NIH
-PA Author Manuscript
NIH
-PA Author Manuscript
NIH
-PA Author Manuscript

IntroductionEngaging patients to participate in self-care activities to manage chronic conditionsincorporates behavior changes and life style adaptations associated with treatment regimensand their possible side effects [1–5]. Underpinning self-care management strategies is theassumption that effective care must build on collaboration between providers and patients [6,7]. Models for self-care management have been widely tested and proven effective amongpatients with such chronic conditions as asthma, diabetes, and hypertension [8,9]. In a recentpublication, the Institute of Medicine highlighted the importance of self-care for persons withcancer [10]. However, there is little information on which components of patient self-management interventions facilitate enactment of patients in self-care management strategies.
This research draws upon cognitive behavioral problem-solving models to examine theprocesses through which cancer patients engage in self-care management strategies to managetheir symptoms during chemotherapy. Patient self-management interventions engage patientsin self-care management by allowing them to prioritize problems, offering information, skillbuilding, support and counseling, and prescriptive behaviors that fit within and are tailored topatients’ daily routines [11]. Variations in the number and types of intervention strategiesdelivered and, in turn, enacted upon, may be associated with patients’ symptom responses.Moreover, patient characteristics, such as age, depressive affect, numbers of comorbidconditions, as well as total symptom burden, and symptom interference with daily activities,may temper how self-care approaches are enacted or are associated with symptom responses[12–15].
Over 325 studies have been published describing outcomes from cognitively based self-careinterventions. Several meta-analyses of these trials have been completed as well as a reviewof meta-analyses [16,17]. When contrasted with information and educational approaches, thesebehavioral models appear to be only marginally better [17–20].
Review of the LiteratureCognitive behavioral therapy was introduced by Beck as a set of strategies to address depression[21]. Dobson [22], Persons [23], and McGinn [24] have summarized the common underlyingassumptions on which cognitive behavioral approaches rest: (1) recognition that cognitionprecedes and directs behavior, (2) cognitive behavioral interventions are time limited, (3)clients need to assume control for solving the problems they face, (4) strategies involveisolating problems and teaching clients how to use strategies to solve and to adapt to theirsituations, and (5) these strategies need to be tailored to the needs of specific clients during thetherapeutic process.
Drawing on these precepts, we developed a patient self-management intervention that offeredpatients information and a series of related strategies focusing on self-care, communication ofneeds to providers and family, and counseling targeted toward each of the 15 symptomsaddressed in this research.
With respect to symptom management, the processes through which patient self-managementinterventions produce behavior change remain unclear, which strategies are delivered, howwell do patients enact those strategies, and do the strategies enacted to lower severity of onesymptom have implications for the management of other symptoms [25].
Research into the mechanisms through which patient self-management interventions produceoutcomes is evolving. Czaja and colleagues have argued that an intervention should specifythe processes leading to a particular outcome and prepare a measurement model that can assessthe contributions of each strategy to an outcome [26]. Leventhal and colleagues have argued
Given et al. Page 2
Ann Behav Med. Author manuscript; available in PMC 2011 August 1.
NIH
-PA Author Manuscript
NIH
-PA Author Manuscript
NIH
-PA Author Manuscript

for a detailed explication of the mechanisms through which these strategies produce the desiredoutcomes [27].
The following objectives guide this report: (1) to describe the intervention categories and thefrequency with which strategies from each category were delivered, the percent of thosedelivered that were enacted (tried), and the percent of those enacted that were consideredhelpful by the patients; (2) to identify which symptoms nurse interveners and their patientsselect for the delivery of strategies; (3) among those strategies delivered, what patient andsymptom factors are related to their enactment (trying); and (4) what patient and symptom-related factors, including enactment, produce symptom responses.
MethodsPrior Work Leading to this Analysis
Early findings indicated that when exposed to a patient self-management intervention, cancerpatients responded differentially depending upon whether they reported pain, fatigue, or bothsymptoms [28]. When examined in a randomized trial, a five-contact nurse-deliveredintervention proved to lower summed severity scores significantly when compared withconventional care alone. After five contacts over 10 weeks, the nurse arm produced a significantreduction in summed severity compared with the control group. Further, the interaction of trialarm and symptom severity at baseline was significantly favoring the nurse arm overconventional care [29]. Subsequent analyses summarized the moderating effects of depression,neutropenia, and treatment complications on the impact that patient self-managementinterventions produce with regard to summed symptom severity. In separate models,depression and neutropenia moderated the effects of the experimental arm on symptom severity[30,31]. While the patient self-management intervention improved symptom management overconventional care, we wanted to determine if the nurse-delivered patient self-managementintervention arms were superior to informational approaches in engaging patients in self-carestrategies and reducing symptom burden. In two recently completed trials, the nurse-administered arms were compared to active interventions where all patients received the samenumber of contacts, the same symptoms were assessed, and the only difference was referral ofpatients to a written symptom management guide for each symptom above threshold. In trial1, a nurse-delivered patient self-management intervention was compared to a non-nurse coachwho assessed symptoms and referred patients to a written symptom management guide. In trial2, the nurse arm was contrasted with an automated voice response system that queried patientsabout their symptoms and referred them to the symptom management guide. In both trials, allactive arms produced significant reductions in symptom severity over baseline as measured bya summed score of severities across 15 symptoms. In trial 1, the nurse arm reported baselinemean summed severity of 41 (standard deviation 21); the coach arm had a mean of 40 (standarddeviation 23). At 10 weeks, scores were 21 (standard deviation 17) and 21 (standard deviation16) for the nurse and coach arms, respectively. In trial 2 at baseline, the nurse arm reportedmean severity of 33 (standard deviation 21) and the automated voice response arm 35 (standarddeviation 22). Mean summed severity at 10 weeks was reduced to 20 (standard deviation 19)in the nurse arm and to 20 (standard deviation 18) in the automated voice response arm [20,32]. While all arms of the two trials produced significant reductions over baseline, nodifferences between arms of each trial were found. Indirectly, we were curious to learn whythese elaborate approaches may have been no better than the information/education arms.Given the significant effects of the nurse arm compared with care as usual, we wanted todeconstruct the nurse-directed patient self-management intervention in order to appreciate hownurses determined which symptoms should receive strategies, which strategies patients tried,and in turn which symptoms responded. Furthermore, results described above were based ona summed symptom severity index. Such a single summary symptom severity burden index
Given et al. Page 3
Ann Behav Med. Author manuscript; available in PMC 2011 August 1.
NIH
-PA Author Manuscript
NIH
-PA Author Manuscript
NIH
-PA Author Manuscript
has multiple drawbacks [33]. Therefore, a new response analysis methodology was developedand applied to the symptom data collected in the two trials. This analysis revealed whichspecific symptoms responded by accounting for the associations among multiple symptomswithin patient [32–34]. This methodology is applied to the investigation of the patient self-management intervention processes in the present paper.
The nurse arms of the two trials were selected for this process analysis because detailedinformation about the chosen symptoms and the specific strategies delivered and enacted bypatients were only available for the nurse arms. In addition, combining two nurse arms yieldsthe largest sample size for the process analyses. The rationale for combining two arms is thatthe same nurses were involved in the intervention delivery and both trials shared the samerecruitment procedures, both arms had the same nurse protocol for interventions, and bothnurse arms produced similar reduction in severity of symptom between intake and 10 weeks.
SampleThe accrual sites for both trials included two comprehensive cancer centers, two communitycancer oncology programs, and five hospital-affiliated community oncology centers. Theclinical trial offices of these sites assigned nurses, employed by the research study, toimplement the recruitment protocol. To be eligible, patients had to meet the followingrequirements: (1) should be 21 years of age or older; (2) have a diagnosis of a solid tumor ornon-Hodgkin lymphoma; (3) should be undergoing a course of chemotherapy at the time ofenrollment; (4) should be able to speak and read English, without hearing deficits; and (5) havea touchtone telephone. Both trials were completed between 2004 and 2006.
Patients (and caregivers) who signed human subject consent forms, approved by each site, hadtheir enrollment data entered into a secure website. Prior to trial entry, all patients were screenedfor severity of 15 symptoms via twice weekly calls for up to 6 weeks. To be eligible for trial1, patients had to score a severity of 2 or higher on both pain and fatigue on an 11-point scale(0–10) or a three or higher on either pain or fatigue and have a family caregiver who agreed toparticipate [28]. Patients and their caregivers completed the intake interview, received a copyof the Symptom Management Guide (a manual of strategies for the self-care management ofeach of the symptoms addressed in the two trials), and were randomized into a six-contact, 8-week trial where they received either the nurse-delivered patient self-management interventionor the coach-delivered information and self-care intervention. In both arms, patients’ symptomswere explained to their caregiver at the first, fourth, and sixth contact. Caregivers wereinformed to consult the symptom guide to assist their patient with symptom management.
Patients with no caregivers or whose caregivers did not agree to participate were eligible fortrial 2. Patients had to report a severity on any of the 15 symptoms of 2 or higher. Patientsmeeting the criteria, completed a baseline interview, received a Symptom Management Guide,and were then randomized into a six-contact, 8-week trial comparing a nurse-delivered patientself-management intervention with an information and self-care intervention that was deliveredvia automated voice response system. Only two recruited patients never reached a severityscore of 2 or higher on any symptom. They were sent a thank you letter and were not includedfurther. Randomization to arms in both trials was completed using a computer minimizationprogram that balanced arms in each trial with respect to accrual location and site of cancer.
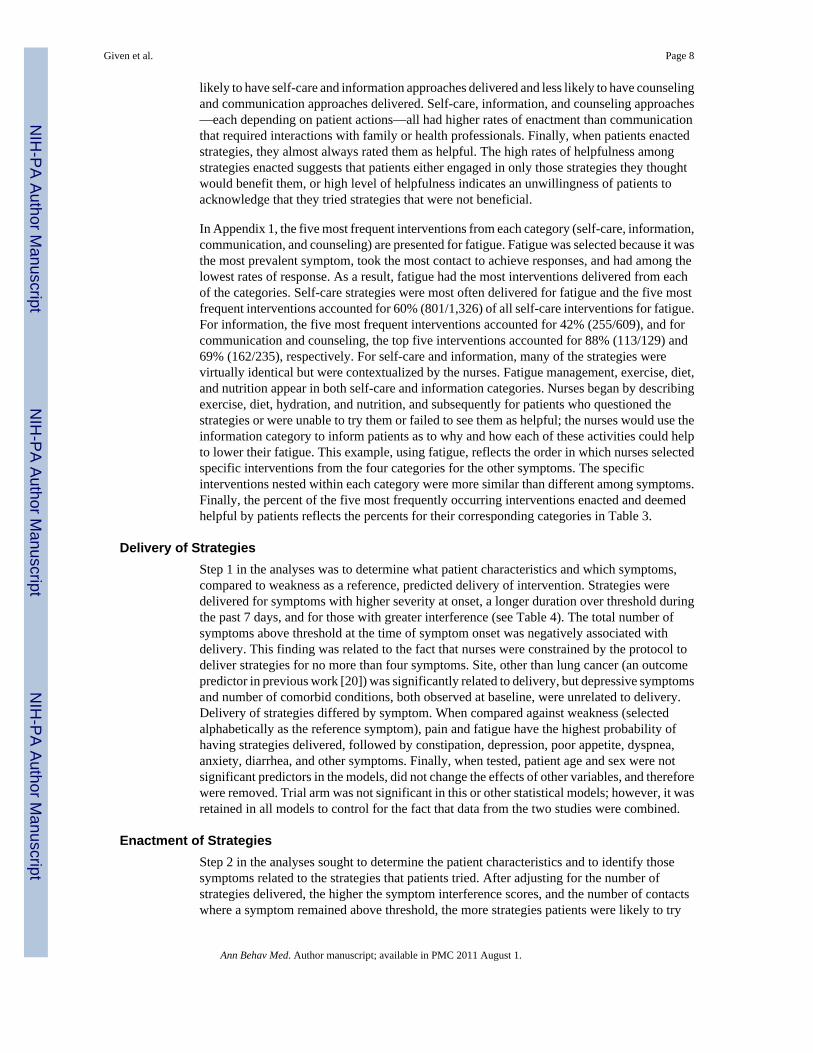
Fig. 1 summarizes the flow of patients from eligibility through randomization, baselineinterview, and completion of their intervention contacts. The numbers of patients who skippedthe intervention or were lost during the 8-week intervention period are specified by trial.
Given et al. Page 4
Ann Behav Med. Author manuscript; available in PMC 2011 August 1.
NIH
-PA Author Manuscript
NIH
-PA Author Manuscript
NIH
-PA Author Manuscript

MeasuresSymptom Measures
For these analyses, each of 16 frequently occurring symptoms associated with cancer treatment(anxiety, constipation, cough, depression, diarrhea, dry mouth, difficulty remembering,dyspnea, fatigue, insomnia, nausea and vomiting, pain, peripheral neuropathy, poor appetite,and weakness; alopecia was removed) were assessed at intake, each of the six interventioncontacts and at the 10-week endpoint. Three dimensions were identified for each symptom.The severity of each symptom was identified using the same 11-point scale from 0=not presentto 10=worst it can be. Patients reporting a severity of 1 or higher were then asked on how manyof the past 7 days they experienced the symptom, indicating its duration and using the same11-point scale. Patients were asked four additional questions regarding how the symptominterfered with their enjoyment of life, relationships with others, general daily activities, andemotions. These four interference items were summed to produce a score ranging from 0 to 40for each symptom and internal consistency reliability exceeding 0.80. Using a single summedsymptom interference score to reflect the reactive dimension of symptom experience has beenshown to be valid and reliable [35,36]. The interference scale is included as a covariate in themodels for symptom delivery and enactment, but combined with severity to create responsecategories.
The severity and interference dimensions of each symptom experience were combined in cut-points for mild, moderate, and severe categories for each symptom established in prior work[35]. Cut-points separating moderate severity from mild and severe from moderate severityscores were based on the largest increases in the interference scale scores between successiveincrements in symptom severity. Longitudinal analyses based on patients’ reports at each ofthe six intervention contacts were conducted and showed that these symptom-specific cut-points in severity based upon the magnitude of the interference scale scores consistentlydifferentiated the levels of symptom interference over time (six contacts of the intervention).These analyses are described elsewhere [35,36].
Based on National Cancer Care Network guidelines [37], symptoms rated at a 4 or higher inseverity (on a 0–10-point scale) were eligible to receive interventions under the cognitivebehavioral protocol. This pre-established threshold of 4 or higher corresponded to all symptomcut-points as moderate or severe, except for dry mouth, where the moderate category began at5. The onset for each symptom to receive interventions was defined as the contact numberwhen the symptom first reached a threshold of 4. At the time of onset, symptom severity [4–10], symptom duration (1–7 days) and symptom interference (0 to 40), and the total numberof symptoms above threshold were entered into the models to predict nurse delivery and thenpatient enactment of strategies.
Symptom responses to intervention strategies were defined for each symptom by comparingthe onset severity category (severe or moderate) against the severity category at the last contactcompleted by the patient. Responses were identified as symptom cases moving from severe tomoderate or mild and those moving from moderate to mild. Symptom cases remaining severeor moderate or those that transitioned from moderate to severe between onset and the lastcontact completed by the patient were considered non-responders. Since multiple symptomswere nested within a patient, a patient may be a responder, for example on pain, but a non-responder on fatigue. The symptom cases that remained mild (never reached threshold of 4 orabove) were not eligible to receive interventions and were not included in these analyses.Finally, all symptom cases reaching threshold on the last contact were not included in theanalysis since there was no opportunity to assess their response.
Given et al. Page 5
Ann Behav Med. Author manuscript; available in PMC 2011 August 1.
NIH
-PA Author Manuscript
NIH
-PA Author Manuscript
NIH
-PA Author Manuscript

Patient and Disease CharacteristicsSite and stage of cancer were obtained through an audit of patients’ medical records. Othersites of cancer, such as ovarian, uterine, gastrointestinal, head, and neck, were collapsed intoa single category because of the small number of cases accrued with these diseases. Patientcomorbidity was derived from patients’ reports as described by Katz and colleagues andsummarized as a less than three vs. three or more comorbid conditions [38]. The Center forEpidemiologic Studies—Depression (CES-D) scale was administered during the intakeinterview. Patient responses to 20 CES-D items using a 0–3 rating scale were summed to obtainthe total score ranging from 0 to 60 with a Cronbach’s alpha of 0.92 [39]. These variables aresummarized in Table 1.
Table 2 describes for each symptom the mean severity at onset, duration and interference scoresas well as the burden of other symptoms present at onset, and the number of patients with eachsymptom where no strategies were delivered, the mean number of contacts each symptom wasopen, and the number and percent of patients reporting each symptom who responded.
The InterventionThe nurse-administered self-management intervention was implemented as an arm in bothtrials 1 and 2. The same nurses used identical software to assess and rate symptoms, to selectand record intervention strategies delivered, and catalog patients’ reports of the strategies tried.The protocol restricted nurses from intervening on more than four symptoms per contact andfrom delivering more than four strategies per symptom. In collaboration with their patients,nurses prioritized which symptoms to address and selected from drop-down menus from theircomputer’s intervention approaches for engaging patients in the management of theirsymptoms. Strategies were classified according to four themes: self-care behaviors (adherenceto medications, diet, exercise), information and decision-making (cuing strategies, prioritizing,and limiting daily tasks), communication with family and providers (report problems, engagehelp, script out questions for providers), and counseling and support (coping strategies, re-framing) [40–43].
Once selected, the nurse reviewed each strategy with the patients and helped them to plan forimplementation. At subsequent contacts, nurses began the session by asking patients if theyhad tried (enacted) each strategy recommended at the previous contact and, if so, asked themto identify how helpful each strategy was for managing the symptom. Interventions, not triedor unsuccessful, could be replaced with new ones. Successful interventions could be continueduntil the symptom was managed. Table 3 summarizes the number of patients and symptomcases reporting each symptom over threshold, total number of strategies delivered, and meannumber of strategies delivered per patient per symptom. The final columns describe for eachapproach (self-care, information, communication, and counseling) the number of strategiesdelivered enacted and reported as helpful by patients.
Data AnalysisThe two nurse arms from the two trials were compared at baseline. The variables with respectto which of the two arms differed as well as the trial variable itself were adjusted for in theanalyses described below. The first set of analyses answered the question about nurses’ andpatients’ selections of which symptoms to intervene on and which symptoms to defer fromintervening on. Because strategies were symptom-specific, available data were at the symptom-case level. These symptom-case data were aggregated within patient using generalizedestimating equations (GEE) technique for the models where the outcome was binary [44] andusing mixed effects models where the outcome was treated as approximately continuous.Binary outcome variables were delivery of strategy for a symptom (yes/no any time during the
Given et al. Page 6
Ann Behav Med. Author manuscript; available in PMC 2011 August 1.
NIH
-PA Author Manuscript
NIH
-PA Author Manuscript
NIH
-PA Author Manuscript

contacts for symptoms that reached threshold of 4), and symptom response. Mixed modelingwas implemented for the number of enacted strategies, which were in an approximately normaldistribution. In both GEE and mixed models, symptom cases were considered nested withinpatients, and compound symmetry association structure among symptoms within patient wasspecified. Symptom-specific intercepts represented differences among symptoms and reflectedthe fact that all other factors being equal, a strategy may be more likely to be delivered orenacted, or response may be more likely to occur for one symptom, than another. In addition,our analytic strategy allowed for inclusion of both symptom-level variables and patient-levelvariables to explain variation in the delivery and enactment of strategies and symptom response.Thus, the explanatory variables were symptom severity, symptom duration, interference atonset, total number of symptoms above threshold at onset, the number of comorbid conditions,depressive symptomatology, age, sex, site, and stage of cancer. For the outcome of the numberof strategies tried, symptom-specific intervention delivery variable was added as a covariate,and only those symptom cases where strategies were delivered were included. In the responseanalysis, symptom interference at onset was removed from the list of covariates becausesymptom interference was implicitly included in the response outcome variable. Becauseresponses to different symptoms may be associated regardless of delivery of the intervention,the analysis of symptom response included symptom cases that received the interventions aswell as those that did not. In order to do that, the number of interventions tried for each symptomwas dichotomized at the median as 5 or more vs. less than 5, and one more level, “nointerventions delivered,” was added. Finally, in addition to formal statistical analysis ofresponse data, response rates were presented in graphic form according to the following: triedfewer than five strategies, tried five or more strategies, and no strategies delivered.
ResultsTable 1 summarizes patients’ socio-demographic characteristics including age, sex, sites ofcancer, stage, baseline CES-D depression scores, and comorbidity, for the cognitive behavioralarms in trials 1 and 2. Chi-square tests revealed that trial 1 had more female patients and, thus,different distribution of site of cancer compared to trial 2. No other differences between thenurse arms of two trials were found at baseline. At intake, all patients in both trials wereundergoing chemotherapy. We compared those patients whose chemotherapy ended prior tothe end of the intervention with patients whose treatment extended beyond. Two hundred andfive patients continued treatment beyond the end of the trials and 69 completed treatment beforethe end of the trials. Mean severity at 10 weeks adjusted for baseline severity indicated nosignificant difference between those still on chemotherapy and those who completedchemotherapy (data not shown).
Table 2 summarizes the symptom-level variables including onset severity; duration andinterference; the number of other symptoms that were over threshold at the time of onset ofeach symptom; and the mean number of contacts over threshold. The final column containsthe response rates for each symptom that ranged from 52% for peripheral neuropathy to 85%for diarrhea.
Table 3 describes the number of cases reporting each symptom above threshold, the totalnumber strategies delivered, and the average strategies delivered for each symptom, each timethat symptom was reported above threshold. The second part of Table 3 separates the totalnumber of strategies delivered, enacted (tried), and reported as helpful, according to the fourcategories from which strategies were delivered by nurses, enacted by patients, and patientsperceived helpfulness of that category of strategies for managing that symptom. Self-carebehavioral strategies accounted for slightly over half of all interventions delivered. Informationapproaches accounted for 25–30% with counseling followed by communication approachescompleting the frequency with which strategies were delivered by category. Patients were more
Given et al. Page 7
Ann Behav Med. Author manuscript; available in PMC 2011 August 1.
NIH
-PA Author Manuscript
NIH
-PA Author Manuscript
NIH
-PA Author Manuscript
likely to have self-care and information approaches delivered and less likely to have counselingand communication approaches delivered. Self-care, information, and counseling approaches—each depending on patient actions—all had higher rates of enactment than communicationthat required interactions with family or health professionals. Finally, when patients enactedstrategies, they almost always rated them as helpful. The high rates of helpfulness amongstrategies enacted suggests that patients either engaged in only those strategies they thoughtwould benefit them, or high level of helpfulness indicates an unwillingness of patients toacknowledge that they tried strategies that were not beneficial.
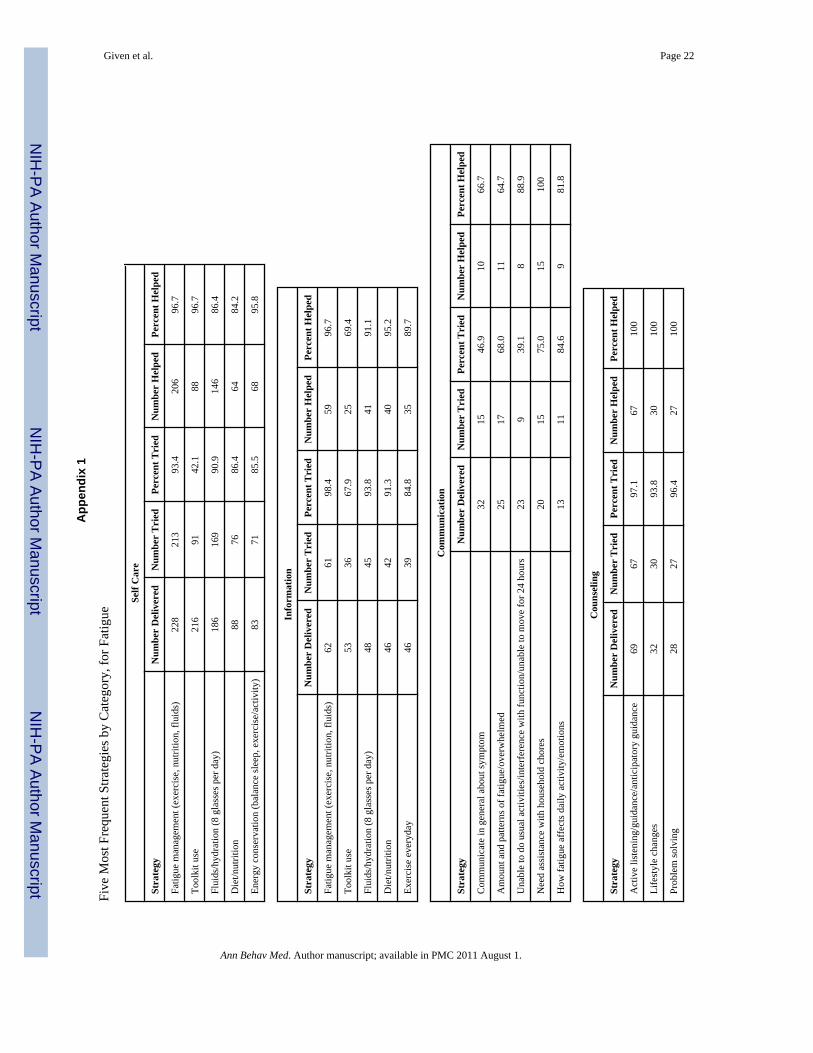
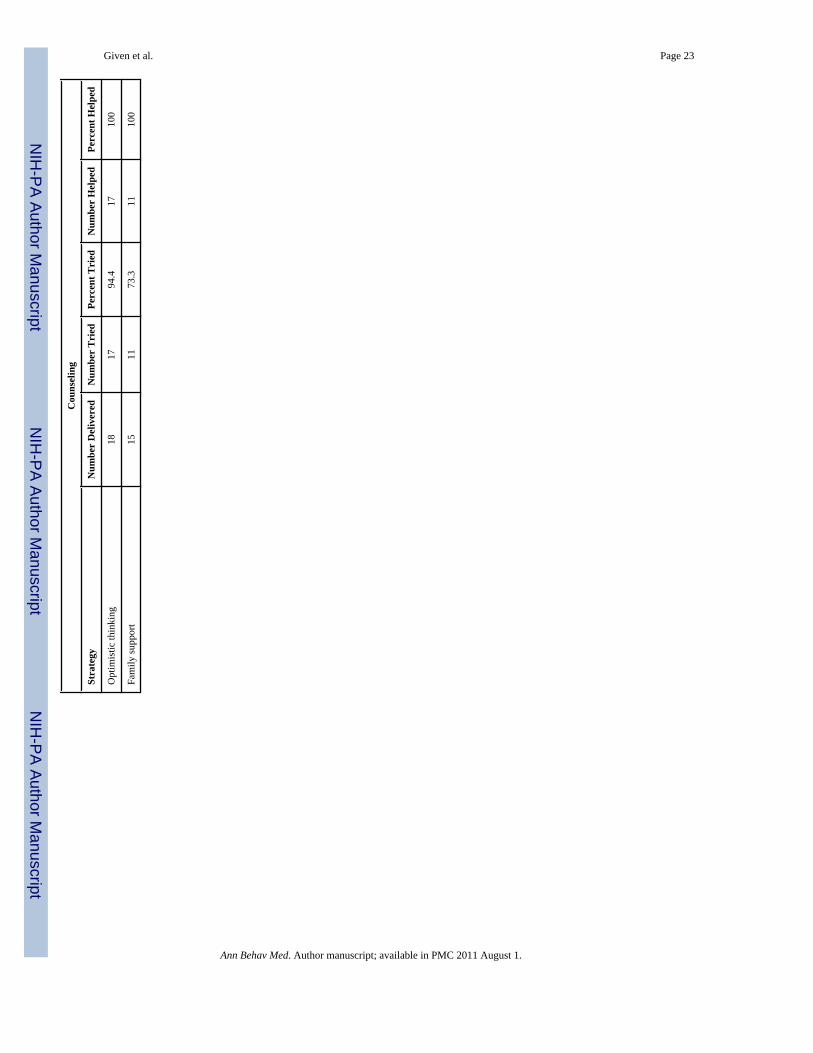
In Appendix 1, the five most frequent interventions from each category (self-care, information,communication, and counseling) are presented for fatigue. Fatigue was selected because it wasthe most prevalent symptom, took the most contact to achieve responses, and had among thelowest rates of response. As a result, fatigue had the most interventions delivered from eachof the categories. Self-care strategies were most often delivered for fatigue and the five mostfrequent interventions accounted for 60% (801/1,326) of all self-care interventions for fatigue.For information, the five most frequent interventions accounted for 42% (255/609), and forcommunication and counseling, the top five interventions accounted for 88% (113/129) and69% (162/235), respectively. For self-care and information, many of the strategies werevirtually identical but were contextualized by the nurses. Fatigue management, exercise, diet,and nutrition appear in both self-care and information categories. Nurses began by describingexercise, diet, hydration, and nutrition, and subsequently for patients who questioned thestrategies or were unable to try them or failed to see them as helpful; the nurses would use theinformation category to inform patients as to why and how each of these activities could helpto lower their fatigue. This example, using fatigue, reflects the order in which nurses selectedspecific interventions from the four categories for the other symptoms. The specificinterventions nested within each category were more similar than different among symptoms.Finally, the percent of the five most frequently occurring interventions enacted and deemedhelpful by patients reflects the percents for their corresponding categories in Table 3.
Delivery of StrategiesStep 1 in the analyses was to determine what patient characteristics and which symptoms,compared to weakness as a reference, predicted delivery of intervention. Strategies weredelivered for symptoms with higher severity at onset, a longer duration over threshold duringthe past 7 days, and for those with greater interference (see Table 4). The total number ofsymptoms above threshold at the time of symptom onset was negatively associated withdelivery. This finding was related to the fact that nurses were constrained by the protocol todeliver strategies for no more than four symptoms. Site, other than lung cancer (an outcomepredictor in previous work [20]) was significantly related to delivery, but depressive symptomsand number of comorbid conditions, both observed at baseline, were unrelated to delivery.Delivery of strategies differed by symptom. When compared against weakness (selectedalphabetically as the reference symptom), pain and fatigue have the highest probability ofhaving strategies delivered, followed by constipation, depression, poor appetite, dyspnea,anxiety, diarrhea, and other symptoms. Finally, when tested, patient age and sex were notsignificant predictors in the models, did not change the effects of other variables, and thereforewere removed. Trial arm was not significant in this or other statistical models; however, it wasretained in all models to control for the fact that data from the two studies were combined.
Enactment of StrategiesStep 2 in the analyses sought to determine the patient characteristics and to identify thosesymptoms related to the strategies that patients tried. After adjusting for the number ofstrategies delivered, the higher the symptom interference scores, and the number of contactswhere a symptom remained above threshold, the more strategies patients were likely to try
Given et al. Page 8
Ann Behav Med. Author manuscript; available in PMC 2011 August 1.
NIH
-PA Author Manuscript
NIH
-PA Author Manuscript
NIH
-PA Author Manuscript
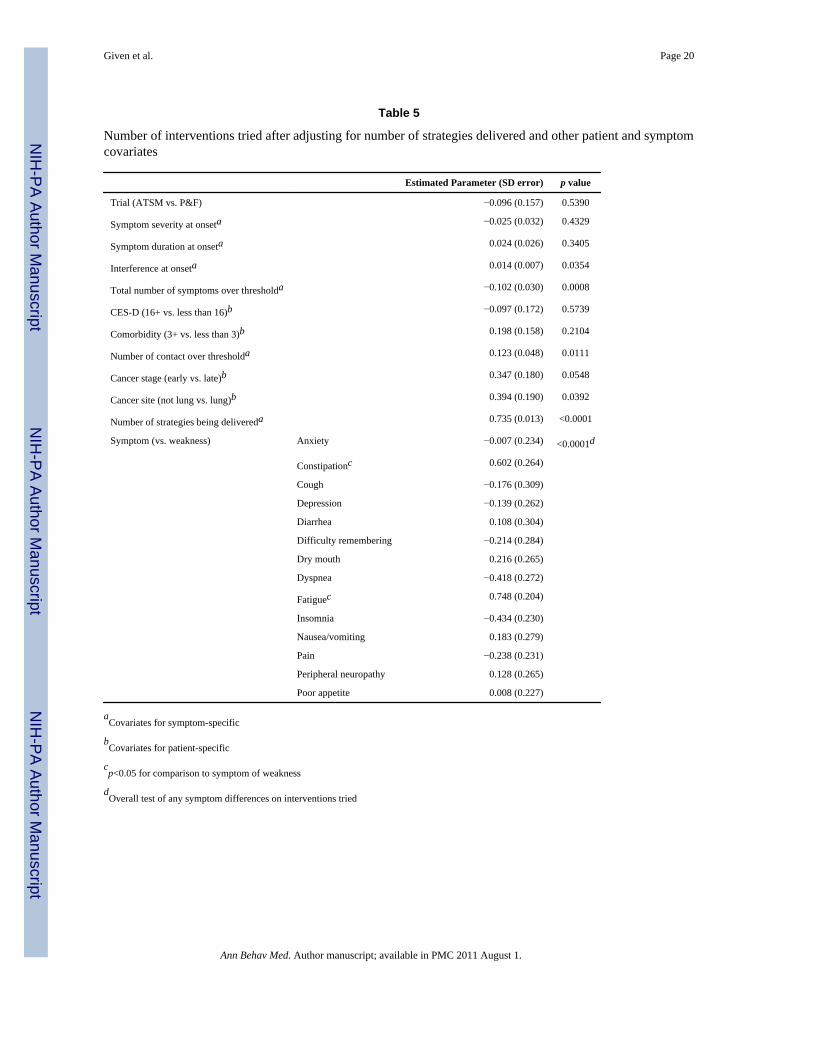
(Table 5). However, the number of symptoms over threshold was negatively associated withnumbers of strategies that patients tried. Finally, non-lung cancer patients tried more strategiesthan patients with lung cancer. Overall when compared against weakness, patients triedsignificantly more strategies for fatigue and constipation (with p value as <0.01 and 0.03 notlisted in the table) and marginally significantly fewer for insomnia (p value 0.06, not listed inthe table).
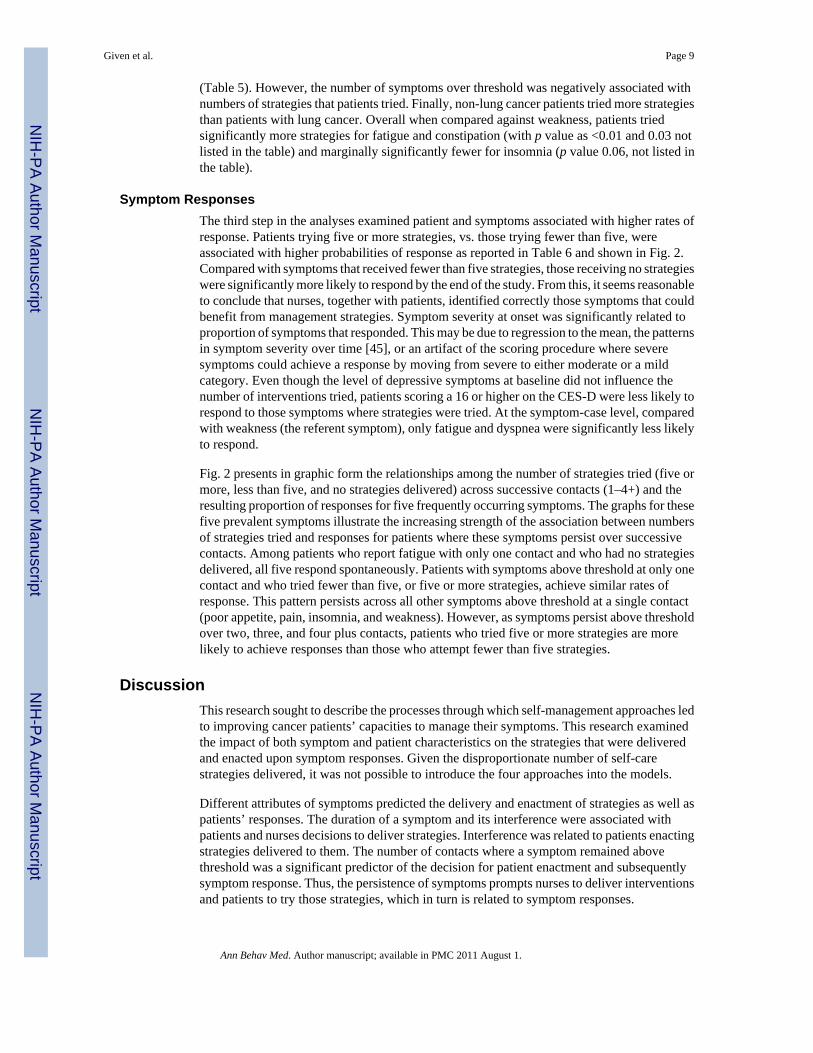
Symptom ResponsesThe third step in the analyses examined patient and symptoms associated with higher rates ofresponse. Patients trying five or more strategies, vs. those trying fewer than five, wereassociated with higher probabilities of response as reported in Table 6 and shown in Fig. 2.Compared with symptoms that received fewer than five strategies, those receiving no strategieswere significantly more likely to respond by the end of the study. From this, it seems reasonableto conclude that nurses, together with patients, identified correctly those symptoms that couldbenefit from management strategies. Symptom severity at onset was significantly related toproportion of symptoms that responded. This may be due to regression to the mean, the patternsin symptom severity over time [45], or an artifact of the scoring procedure where severesymptoms could achieve a response by moving from severe to either moderate or a mildcategory. Even though the level of depressive symptoms at baseline did not influence thenumber of interventions tried, patients scoring a 16 or higher on the CES-D were less likely torespond to those symptoms where strategies were tried. At the symptom-case level, comparedwith weakness (the referent symptom), only fatigue and dyspnea were significantly less likelyto respond.
Fig. 2 presents in graphic form the relationships among the number of strategies tried (five ormore, less than five, and no strategies delivered) across successive contacts (1–4+) and theresulting proportion of responses for five frequently occurring symptoms. The graphs for thesefive prevalent symptoms illustrate the increasing strength of the association between numbersof strategies tried and responses for patients where these symptoms persist over successivecontacts. Among patients who report fatigue with only one contact and who had no strategiesdelivered, all five respond spontaneously. Patients with symptoms above threshold at only onecontact and who tried fewer than five, or five or more strategies, achieve similar rates ofresponse. This pattern persists across all other symptoms above threshold at a single contact(poor appetite, pain, insomnia, and weakness). However, as symptoms persist above thresholdover two, three, and four plus contacts, patients who tried five or more strategies are morelikely to achieve responses than those who attempt fewer than five strategies.
DiscussionThis research sought to describe the processes through which self-management approaches ledto improving cancer patients’ capacities to manage their symptoms. This research examinedthe impact of both symptom and patient characteristics on the strategies that were deliveredand enacted upon symptom responses. Given the disproportionate number of self-carestrategies delivered, it was not possible to introduce the four approaches into the models.
Different attributes of symptoms predicted the delivery and enactment of strategies as well aspatients’ responses. The duration of a symptom and its interference were associated withpatients and nurses decisions to deliver strategies. Interference was related to patients enactingstrategies delivered to them. The number of contacts where a symptom remained abovethreshold was a significant predictor of the decision for patient enactment and subsequentlysymptom response. Thus, the persistence of symptoms prompts nurses to deliver interventionsand patients to try those strategies, which in turn is related to symptom responses.
Given et al. Page 9
Ann Behav Med. Author manuscript; available in PMC 2011 August 1.
NIH
-PA Author Manuscript
NIH
-PA Author Manuscript
NIH
-PA Author Manuscript

Even though a limit was set by protocol for the number of symptoms where strategies couldbe delivered, patients with higher numbers of symptoms were less likely to enact strategiesdelivered to them. This suggests that patient self-management interventions may be lesseffective as patients with higher symptom burden attempt to process and then allocate time andeffort to focus on multiple strategies requiring differing skills and supports.
At the patient level, those with more depressive symptoms at baseline were less likely torespond, even though they enacted strategies at rates comparable to those with fewer depressivesymptoms. Whether this is due to the possibility that more patients with depressive symptomshave greater interference or that the patient self-management intervention strategies wereperceived to be ineffective by patients remains an open question. In general, the findingsindicate that all patients who try more strategies do receive more responses, but the rate of theresponses varies by symptom.
Finally, among patients whose symptoms persist over successive contacts trying five or morestrategies result in significantly greater likelihood of achieving a response. Having nointerventions delivered results in spontaneous responses mainly for symptoms above thresholdat one contact, but as the number of contacts over threshold increases, the proportion ofresponses where no strategies were delivered declines. Among symptoms where patients triedfewer than five strategies, their pattern of responses approximates those where no strategieswere delivered. Patients trying five or more strategies for symptoms above threshold at onecontact above threshold do equally as well as those with fewer than five or who receive nostrategies to manage their symptom. However, as the number of contacts increase, then patientstrying five or more strategies for symptoms above threshold achieve a substantially greaterresponse than those who tried fewer than five strategies. This finding suggests that patient self-management intervention approaches to symptom management require some persistence onthe part of patients to achieve a response to their symptoms.
Considering the costs of implementing patient self-management interventions, it is critical tobetter understand the conditions and circumstances around which they produce symptomresponses. Finally, more work is needed to document factors affecting patient enactment ofthe strategies that are delivered.
Deconstructing the processes and mechanisms of multiple contact, patient self-managementinterventions on symptom management are complex but necessary to advance this science.First, with respect to symptoms, we demonstrated that attributes such as duration, interference,and persistence are related differently to delivery, enactment, and resulting responses. Second,patient characteristics were examined as well. Together, these patient and symptom-casevariables elaborated the processes by which patient self-management interventions caninfluence symptom outcomes. This effort built upon the work by Czaja [26], Leventhal [27],and Bellg [46]. These lines of investigation point to the complexity inherent in behavioral andself-management trials; further elaboration and replication will be necessary to linkintervention dose with patient enactment that leads to specific desired therapeutic outcomes.
LimitationsSeveral shortcomings of this work deserve consideration. First, we were unable to assess theunique impact of the patient self-management intervention categories. Second, while weobserved no differences between the nurse intervention arms, possible variations could beinvolved in the delivery, enactment, or responses. The number of strategies tried wassignificant; however, we do not know if there was a sentinel strategy that, when tried, produceda response. Alternative strategies, such as pharmaceutical interventions, could have explainedsome responses. We report on patients’ indication of the helpfulness of a strategy which mightmean it kept that symptom from getting worse and may not be related to a response. Further,
Given et al. Page 10
Ann Behav Med. Author manuscript; available in PMC 2011 August 1.
NIH
-PA Author Manuscript
NIH
-PA Author Manuscript
NIH
-PA Author Manuscript

we could not identify the “transference” of strategies delivered or enacted for one symptom,which patients may have applied to the management of other symptoms. Despite theselimitations, this work does suggest how, and under what conditions, delivery and the enactmentof strategies play in achieving responses.
ConclusionsThis research examined the processes through which patient self-management models addressthe management of disease- and treatment-related symptoms among cancer patientsundergoing chemotherapy. Symptom-specific variables were associated with nurses’ decisionsto deliver symptom management strategies for specific symptoms, and both symptom-specificand patient-specific variables were related with symptom responses. In general, nurses selectedsymptoms and delivered interventions based on their severity at each contact. This work pointsto the need for more research regarding the conditions under which symptoms that receiveinterventions either respond or fail to do so and to determine what factors contribute to theresponses of symptoms that do not receive interventions.
AcknowledgmentsAcknowledgement of Research Support National Cancer Institute Grant #RO1 CA30724
Automated Telephone Monitoring for Symptom Management, Charles Given, PI, Barbara Given, Co-PI
In Affiliation with the Walther Cancer Institute Indianapolis, IN
References1. Clark NM. Management of chronic disease by patients. Annu Rev Public Health 2003;24:289–313.
[PubMed: 12415147]2. Barlow J, Wright C, Sheasby J, Turner A, Hainsworth J. Self-management approaches for people with
chronic conditions: A review. Patient Educ Couns 2002;48:177–187. [PubMed: 12401421]3. Corbin JM, Strauss A. A nursing model for chronic illness management based upon the Trajectory
Framework. Sch Inq Nurs Pract 1991;5:155–174. [PubMed: 1763239]4. Lorig, K.; Holman, HR.; Sobel, D.; Laurent, D.; Gonzalez, V.; Minor, M. Living a Healthy Life with
Chronic Conditions. 2. Boulder: Bull Publishing; 2000.5. Glasgow RE, Osteen VL. Evaluating diabetes education. Are we measuring the most important
outcomes? Diabetes Care 1992;15:1423–1432. [PubMed: 1425111]6. Orem DE. The utility of self-care theory as a theoretical basis for self-neglect. J Adv Nurs 2001;34:552–
553. [PubMed: 11380723]7. Clark NM. Asthma self-management education. Research and implications for clinical practice. Chest
1989;95:1110–1113. [PubMed: 2651035]8. Chodosh J, Morton SC, Mojica W, et al. Meta-analysis: Chronic disease self-management programs
for older adults. Ann Intern Med 2005;143:427–438. [PubMed: 16172441]9. Newman S, Steed L, Mulligan K. Self-management interventions for chronic illness. Lancet
2004;364:1523–1537. [PubMed: 15500899]10. Adler, NE.; Page, AE., editors. Cancer Care for the Whole Patient. Washington: National Academic
Press; 2008.11. Butler AC, Chapman JE, Forman EM, Beck AT. The empirical status of cognitive behavioral therapy:
A review of meta-analysis. Clin Psychol Rev 2006;26:17–31. [PubMed: 16199119]12. Conn VS, Hafdahl AR, LeMaster JW, Ruppar TM, Cochran JE, Nielsen PJ. Meta-analysis of health
behavior change interventions in type 1 diabetes. Am J Health Behav 2008;32:315–329. [PubMed:18067471]
13. Bayliss EA, Ellis JL, Steiner JF. Barriers to self-management and quality-of-life outcomes in seniorswith multimorbidities. Ann Fam Med 2007;5:395–402. [PubMed: 17893380]
Given et al. Page 11
Ann Behav Med. Author manuscript; available in PMC 2011 August 1.
NIH
-PA Author Manuscript
NIH
-PA Author Manuscript
NIH
-PA Author Manuscript

14. Sevick MA, Trauth JM, Ling BS, et al. Patients with complex chronic diseases: Perspectives onsupporting self-management. J Gen Intern Med 2007;22:438–444. [PubMed: 18026814]
15. Barsevick AM, Sweeney C, Haney E, Chung E. A systematic qualitative analysis ofpsychoeducational interventions for depression in patients with cancer. Oncol Nurs Forum2002;29:73–84. [PubMed: 11817494]
16. Crepez N, Passin WF, Herbst JH, et al. Meta-analysis of cognitive behavioral interventions on HIV-positive persons’ mental health and immune functioning. Health Psychol 2008;27:4–14. [PubMed:18230008]
17. Newell SA, Sanson-Fisher RW, Savolainen NJ. Systematic review of psychological therapies forcancer patients: Overview and recommendations for future research. J Natl Cancer Inst 2002;94:558–584. [PubMed: 11959890]
18. Jacobsen PB, Meade CD, Stein KD, Chirikos TN, Small BJ, Ruckdeschel JC. Efficacy and costs oftwo forms of stress management training for cancer patients undergoing chemotherapy. J Clin Oncol2002;20:2851–2862. [PubMed: 12065562]
19. Yates P, Aranda S, Hargraves M, et al. Randomized controlled trial of an educational interventionfor managing fatigue in women receiving adjuvant chemotherapy for early-stage breast cancer. J ClinOncol 2005;23:6027–6036. [PubMed: 16135471]
20. Sikorskii A, Given CW, Given B, et al. Symptom management for cancer patients: A trial comparingtwo multimodal interventions. J Pain Symptom Manage 2007;34:253–264. [PubMed: 17618080]
21. Beck AT. Cognitive therapy and emotional disorders. Arch Gen Psychiatry 1976;41:113–114.22. Dobson, KS.; Dozois, DJA. Historical and philosophical bases of the cognitive-behavioral therapies.
In: Dobson, KS., editor. Handbook of Cognitive Behavioral Therapies. New York: The GuilfordPress; 2001. p. 3-39.
23. Persons, JB.; Davidson, J. Cognitive-behavioral case formulation. In: Dobson, KS., editor. Hand-book of Cognitive Behavioral Therapies. New York: The Guilford Press; 2001. p. 86-110.
24. McGinn LK, Sanderson WC. What allows cognitive behavioral therapy to be brief: Overview,efficacy, and crucial factors facilitating brief treatment. Clin Psychol Sci Pract 2001;8:23–37.
25. Hryniuk W, Ragaz J, Peters W. Dose density by any other name. J Clin Oncol 2004;22:750–751.[PubMed: 14966105]
26. Czaja SJ, Schulz R, Lee CC, Belle SH. A methodology for describing and decomposing complexpsychosocial and behavioral interventions. Psychol Aging 2003;18:385–395. [PubMed: 14518802]
27. Leventhal H, Friedman MA. Does establishing fidelity of treatment help in understanding treatmentefficacy? Comment on Bellg et al. Health Psychol 2004;23:452–456. [PubMed: 15367064]
28. Given B, Given CW, McCorkle R, et al. Pain and fatigue management: results of a nursing randomizedclinical trial. Oncol Nurs Forum 2002;29:949–956. [PubMed: 12096292]
29. Given CW, Given B, Rahbar M, et al. Effect of a cognitive behavioral intervention on reducingsymptom severity during chemotherapy. J Clin Oncol 2004;22:507–516. [PubMed: 14752074]
30. Given CW, Given B, Rahbar M, et al. Does a symptom management intervention affect depressionamong cancer patients: results from a clinical trial. Psychooncology 2004;13:818–830. [PubMed:15386790]
31. Sikorskii A, Given C, Given B, Jeon S, McCorkle R. Testing the effects of treatment complicationson a cognitive behavioral intervention for reducing symptom severity. J Pain Symptom Manage2006;32(2):129–39. [PubMed: 16877180]
32. Given B, Given CW, Sikorskii A, You M, McCorkle R, Champion V. Analyzing a symptommanagement trials: The value of both intention-to-treat and per protocol approaches. Oncol NursForum 2009;36:E293–302. [PubMed: 19887342]
33. Sikorskii A, Given C, You M, Jeon S, Given B. Response analysis for multiple symptoms revealeddifferences between arms of a symptom management trial. J Clin Epidemiol 2009;62:716–724.[PubMed: 19124223]
34. Given CW, Sikorskii A, Tamkus D, et al. Managing symptoms among patients with breast cancerduring chemotherapy: Results of a two-arm behavioral trial. J Clin Oncol 2008;26:5855–5862.[PubMed: 19029420]
Given et al. Page 12
Ann Behav Med. Author manuscript; available in PMC 2011 August 1.
NIH
-PA Author Manuscript
NIH
-PA Author Manuscript
NIH
-PA Author Manuscript

35. Given B, Given CW, Sikorskii A, et al. Establishing mild, moderate, and severe scores for cancer-related symptoms: How consistent and clinically meaningful are interference-based severity cut-points? J Pain and Symptom Manage 2008;35:126–135. [PubMed: 18158231]
36. Jeon S, Given CW, Sikorskii A, Given B. Do interference-based cut-points differentiate mild,moderate, and severe levels of 16 cancer-related symptoms over time? J Pain Symptom Manage2009;37:220–232. [PubMed: 18619769]
37. National Comprehensive Cancer Network. Clinical practice guidelines in oncology: cancer relatedfatigue version 1. [Access verified September 16, 2009]. Available athttp://www.nccn.org/professionals/physician_gls/PDF/fatigue.pdf
38. Katz JN, Chang LC, Sangha O, Fossel AH, Bates DW. Can comorbidity be measured by questionnairerather than medical record review? Med Care 1996;34:73–84. [PubMed: 8551813]
39. Radloff LS. The CES-D Scale: A self-report depression scale for research in the general population.Appl Psych Meas 1977;1:385–401.
40. Bandura, A. Self-Efficacy in Changing Societies. New York: Cambridge University Press; 1995.41. Bandura, A. Self-Efficacy. The Exercise of Control. New York: Freeman; 1997.42. D’Zurilla, T.; Nezu, A. Problem-solving strategies. In: Dobson, K., editor. Handbook of Cognitive-
Behavioral Therapies. New York: Guilford Press; 2001. p. 211-245.43. Nezu A, Nezu C, Houts P, et al. Relevance and problem solving therapy to psychosocial oncology.
J Psychosoc Oncol 1999;16:5–26.44. Zeger SL, Liang KY. Longitudinal data analysis for discrete and continuous outcomes. Biometrics
1986;42:121–130. [PubMed: 3719049]45. Wang XS, Fairclough DL, Liao Z, et al. Longitudinal study of the relationship between
chemoradiation therapy for non-small-cell lung cancer and patient symptoms. J Clin Oncol2006;24:4485–4491. [PubMed: 16983118]
46. Bellg AJ, Borrelli B, Resnick B, et al. Enhancing treatment fidelity in health behavior change studies:Best practices and recommendations from the NIH Behavior Change Consortium. Health Psychol2004;23:443–451. [PubMed: 15367063]
Given et al. Page 13
Ann Behav Med. Author manuscript; available in PMC 2011 August 1.
NIH
-PA Author Manuscript
NIH
-PA Author Manuscript
NIH
-PA Author Manuscript
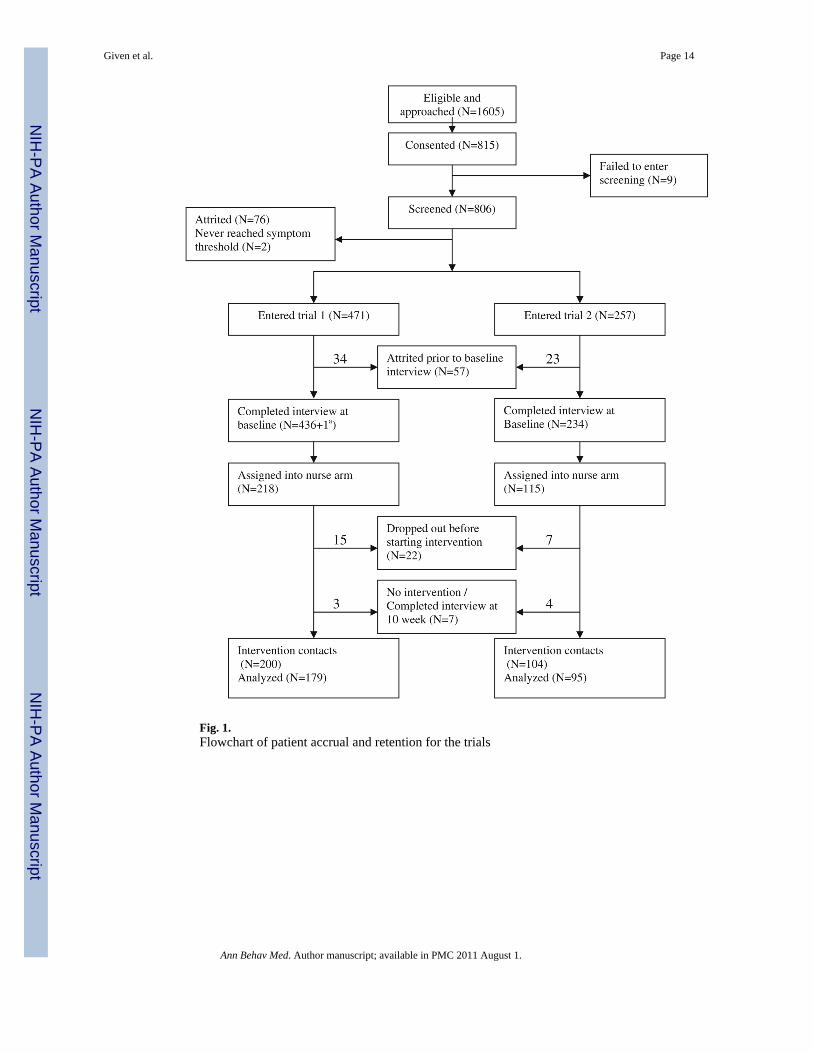
Fig. 1.Flowchart of patient accrual and retention for the trials
Given et al. Page 14
Ann Behav Med. Author manuscript; available in PMC 2011 August 1.
NIH
-PA Author Manuscript
NIH
-PA Author Manuscript
NIH
-PA Author Manuscript
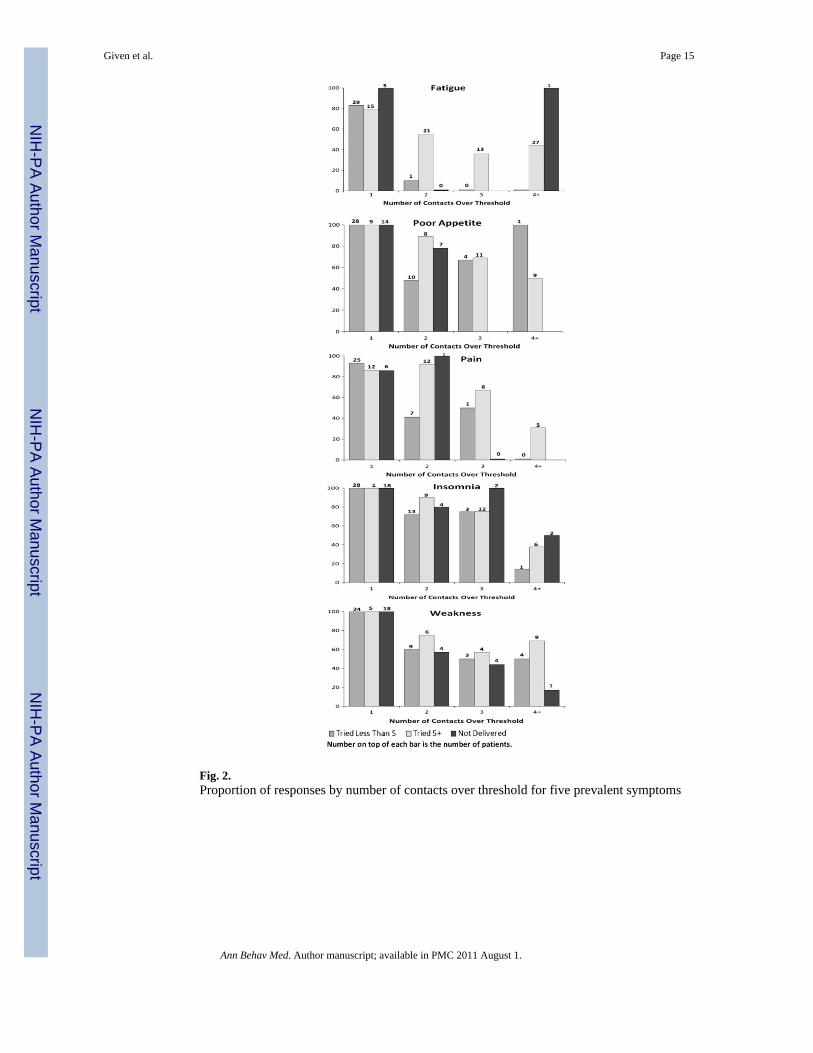
Fig. 2.Proportion of responses by number of contacts over threshold for five prevalent symptoms
Given et al. Page 15
Ann Behav Med. Author manuscript; available in PMC 2011 August 1.
NIH
-PA Author Manuscript
NIH
-PA Author Manuscript
NIH
-PA Author Manuscript

NIH
-PA Author Manuscript
NIH
-PA Author Manuscript
NIH
-PA Author Manuscript
Given et al. Page 16
Tabl
e 1
Soci
o-de
mog
raph
ic c
hara
cter
istic
s of p
atie
nts b
y tri
al
Tri
al 1
(N=1
79)b
Tri
al 2
(N=9
5)c
N%
N%
Patie
nt’s
sexa
Mal
e44
24.5
840
42.1
1
Fem
ale
135
75.4
255
57.8
9
Can
cer s
itea
Bre
ast
7240
.68
2526
.32
Lung
2916
.38
3031
.58
Col
on29
16.3
89
9.47
Oth
er47
26.5
531
32.6
3
Can
cer s
tage
Early
4625
.99
1515
.79
Late
131
74.0
180
84.2
1
CES
-DLe
ss th
an 1
612
368
.72
6770
.53
16+
5631
.28
2829
.47
Com
orbi
dity
Less
than
311
162
.01
6164
.21
3+68
37.9
934
35.7
9
a Chi
-squ
are;
p v
alue
sign
ifica
nt u
nder
the
crite
ria p
<0.0
5
b Patie
nt’s
age
in y
ears
(sta
ndar
d de
viat
ion
(SD
))=5
6.89
(11.
79)
c Patie
nt’s
age
in y
ears
(SD
)=57
.65
(10.
68)
Ann Behav Med. Author manuscript; available in PMC 2011 August 1.

NIH
-PA Author Manuscript
NIH
-PA Author Manuscript
NIH
-PA Author Manuscript
Given et al. Page 17
Tabl
e 2
Num
ber o
f pat
ient
s who
repo
rted
sym
ptom
ove
r thr
esho
ld, m
ean
of se
verit
y, d
urat
ion,
inte
rfer
ence
at o
nset
, tot
al n
umbe
r of s
ympt
oms a
bove
thre
shol
d at
onse
t, an
d re
spon
se ra
te fo
r eac
h sy
mpt
om
Sym
ptom
N o
f pat
ient
onse
tSe
veri
ty o
nset
,m
ean
(SD
)D
urat
ion
onse
t,m
ean
(SD
)In
terf
eren
ce o
nset
,m
ean
(SD
)
Num
ber
ofsy
mpt
oms o
ver
thre
shol
d at
onse
t, m
ean
(SD
)
Num
ber
of p
atie
nts w
ithno
inte
rven
tions
deliv
ered
, N (%
a )
Num
ber
ofco
ntac
t ove
rth
resh
old,
mea
n(S
D)
Res
pons
e, N
(%a )
Anx
iety
120
5.4
(1.4
)4.
3 (2
.2)
14.6
(8.9
)5.
0 (2
.7)
21 (1
7.5)
2.1
(1.2
)95
(79.
2)
Con
stip
atio
n72
5.9
(1.9
)3.
8 (1
.9)
8.7
(9.0
)4.
9 (2
.5)
10 (1
3.9)
2.0
(1.2
)56
(77.
8)
Cou
gh63
5.7
(1.7
)5.
5 (1
.9)
9.1
(8.6
)5.
9 (2
.6)
24 (3
8.1)
1.9
(1.4
)50
(79.
4)
Dep
ress
ion
825.
4 (1
.5)
4.5
(2.0
)17
.0 (9
.1)
6.1
(2.5
)18
(22.
0)1.
9 (1
.2)
60 (7
3.17
)
Dia
rrhe
a53
6.1
(2.1
)3.
1 (2
.2)
12.3
(11.
3)5.
3 (2
.8)
13 (2
4.5)
1.7
(1.1
)45
(84.
9)
Diff
icul
ty re
mem
berin
g81
5.2
(1.4
)6.
0 (1
.5)
8.1
(8.1
)5.
5 (2
.6)
35 (4
3.2)
2.0
(1.2
)53
(65.
4)
Dry
mou
th82
6.4
(1.5
)6.
0 (1
.8)
4.5
(6.3
)5.
0 (2
.3)
18 (2
2.0)
2.2
(1.3
)68
(82.
9)
Dys
pnea
735.
4 (1
.5)
5.1
(2.1
)13
.6 (1
0.0)
5.3
(2.9
)15
(20.
6)2.
2 (1
.3)
39 (5
3.4)
Fatig
ue21
35.
7 (1
.7)
5.3
(2.0
)13
.7 (9
.6)
4.4
(2.5
)7
(3.3
)2.
8 (1
.6)
112
(52.
6)
Inso
mni
a13
25.
9 (1
.6)
5.2
(2.1
)9.
3 (8
.6)
4.7
(2.7
)29
(22.
0)2.
3 (1
.4)
102
(77.
3)
Nau
sea/
vom
iting
695.
9 (1
.9)
3.7
(2.3
)14
.5 (1
0.8)
5.4
(2.6
)16
(23.
2)1.
8 (1
.2)
59 (8
5.5)
Pain
111
5.6
(1.8
)4.
9 (2
.0)
14.0
(11.
2)5.
0 (2
.5)
9 (8
.1)
2.2
(1.4
)76
(68.
5)
Perip
hera
l neu
ropa
thy
775.
6 (1
.7)
5.9
(1.8
)7.
0 (7
.6)
4.8
(2.8
)15
(19.
5)3.
0 (1
.6)
40 (5
2.0)
Poor
app
etite
133
5.7
(1.8
)5.
0 (2
.1)
8.6
(8.4
)4.
9 (2
.6)
23 (1
7.3)
2.1
(1.2
)10
3 (7
7.4)
Wea
knes
s12
95.
5 (1
.6)
5.8
(1.8
)11
.7 (9
.5)
5.1
(2.5
)40
(31.
0)2.
3 (1
.4)
93 (7
2.1)
a Perc
enta
ge b
ased
on
num
ber o
f pat
ient
s with
sym
ptom
seve
rity
over
thre
shol
d at
ons
et
Ann Behav Med. Author manuscript; available in PMC 2011 August 1.

NIH
-PA Author Manuscript
NIH
-PA Author Manuscript
NIH
-PA Author Manuscript
Given et al. Page 18
Tabl
e 3
Stra
tegi
es d
eliv
ered
for e
ach
sym
ptom
by
inte
rven
tion
cate
gory
Sym
ptom
N o
fca
sesa
Del
iver
edb
Ave
rage
deliv
ered
cSe
lf-ca
reIn
form
atio
nC
ouns
elin
gC
omm
unic
atio
n
Del
iver
ed,d
N (%
)E
nact
,eN
(%)
Hel
ped,
fN
(%)
Del
iver
ed,d
N (%
)E
nact
,eN
(%)
Hel
ped,
f N (%
)D
eliv
ered
,dN
(%)
Ena
ct,e
N (%
)H
elpe
d,f
N (%
)D
eliv
ered
,dN
(%)
Ena
ct,e
N (%
)H
elpe
d,f
N (%
)
Anx
iety
247
785
3.18
360
(46)
251
(70)
243
(97)
171
(22)
136
(80)
124
(91)
158
(20)
144
(91)
136(
94)
96 (1
2)47
(49)
43(9
1)
Con
stip
atio
n14
644
73.
0624
9 (5
6)20
2 (8
1)17
9 (8
9)13
6 (3
0)12
1 (8
9)10
4(86
)26
(6)
24 (9
2)23
(96)
36 (8
)18
(50)
17 (9
4)
Cou
gh12
226
12.
1413
4 (5
1)89
(66)
86 (9
7)75
(29)
55 (7
3)52
(95)
14 (5
)14
(100
)14
(100
)38
(15)
18 (4
7)18
(100
)
Dep
ress
ion
156
437
2.80
192
(44)
130
(68)
127
(98)
106
(24)
86 (8
1)76
(88)
73 (1
7)49
(67)
48 (9
8)66
(15)
40 (6
1)37
(93)
Dia
rrhe
a92
245
2.66
119
(49)
89 (7
5)80
(90)
86 (3
5)74
(86)
62 (8
4)15
(6)
14 (9
3)13
(93)
25 (1
0)12
(48)
11 (9
2)
Diff
icul
ty re
mem
berin
g16
225
91.
6017
1 (6
6)12
0 (7
0)11
0 (9
2)50
(19)
38 (7
6)34
(89)
26 (1
0)23
(88)
21 (9
1)12
(5)
6 (5
0)6
(100
)
Dry
mou
th17
842
52.
3924
6 (5
8)17
6 (7
2)17
4 (9
9)14
5 (3
4)11
9 (8
2)96
(81)
24 (6
)21
(88)
21 (1
00)
10 (2
)4
(40)
3 (7
5)
Dys
pnea
160
510
3.19
272
(53)
174
(64)
164
(94)
134
(26)
96 (7
2)75
(78)
39 (8
)34
(87)
34 (1
00)
65 (1
3)30
(46)
28 (9
3)
Fatig
ue58
822
993.
9113
26 (5
8)10
57(8
0)98
8 (9
3)60
9 (2
6)53
0(87
)47
8 (9
0)23
5 (1
0)22
1(94
)21
9 (9
9)12
9 (6
)75
(58)
61 (8
1)
Inso
mni
a30
579
02.
5940
1 (5
1)25
8 (6
4)22
8 (8
8)23
1 (2
9)18
1 (7
8)14
9 (8
2)77
(10)
74 (9
6)71
(96)
81 (1
0)41
(51)
34 (8
3)
Nau
sea/
vom
iting
121
339
2.80
166
(49)
124
(75)
108
(87)
117
(35)
98 (8
4)86
(88)
18 (5
)18
(100
)18
(100
)38
(11)
21 (5
5)18
(86)
Pain
241
854
3.54
375
(44)
234
(62)
223
(95)
283
(33)
229
(81)
186
(81)
60 (7
)53
(88)
51 (9
6)13
6 (1
6)79
(58)
72 (9
1)
Perip
hera
l neu
ropa
thy
228
507
2.22
272
(54)
200
(74)
182
(91)
148
(29)
123
(83)
107
(87)
45 (9
)45
(100
)43
(96)
42 (8
)23
(55)
21 (9
1)
Poor
app
etite
285
889
3.12
467
(53)
318
(68)
298
(94)
293
(33)
242
(83)
217
(90)
82 (9
)75
(91)
73 (9
7)47
(5)
23 (4
9)21
(91)
Wea
knes
s29
857
11.
9230
0 (5
3)20
6 (6
9)17
8 (8
6)18
2 (3
2)15
3 (8
4)13
4 (8
8)54
(9)
48 (8
9)46
(96)
35 (6
)21
(60)
21(1
00)
a Num
ber o
f cas
es w
ith se
verit
y ov
er 4
. For
exa
mpl
e, d
urin
g in
terv
entio
n, a
pat
ient
repo
rted
pain
thre
e tim
es o
ver t
hres
hold
; the
num
ber o
f cas
es w
ith se
verit
y ov
er 4
for p
ain
of th
is p
atie
nt w
ould
be
3
b Tota
l num
ber o
f stra
tegi
es b
eing
del
iver
ed d
urin
g in
terv
entio
n fo
r tha
t sym
ptom
c The
aver
age
deliv
ered
is th
e av
erag
e nu
mbe
r of s
trate
gies
bei
ng d
eliv
ered
for e
ach
sym
ptom
cas
e
d Num
ber o
f eac
h ty
pe o
f stra
tegy
bei
ng d
eliv
ered
dur
ing
inte
rven
tion.
The
per
cent
age
is fo
r eac
h ty
pe o
f stra
tegy
by
tota
l num
ber o
f stra
tegi
es b
eing
del
iver
ed
e Num
ber o
f eac
h ty
pe o
f stra
tegy
bei
ng e
nact
ed. T
he p
erce
ntag
e is
for e
ach
type
of s
trate
gy b
eing
ena
cted
by
num
ber o
f stra
tegi
es b
eing
del
iver
ed
f Num
ber o
f eac
h ty
pe o
f stra
tegy
repo
rted
by p
atie
nt a
s hel
ped.
The
per
cent
age
is fo
r eac
h ty
pe o
f stra
tegy
pat
ient
repo
rted
as h
elpe
d by
the
num
ber o
f stra
tegi
es p
atie
nt e
nact
ed
Ann Behav Med. Author manuscript; available in PMC 2011 August 1.

NIH
-PA Author Manuscript
NIH
-PA Author Manuscript
NIH
-PA Author Manuscript
Given et al. Page 19
Table 4
Adjusted odds ratios (OR) of nurses’ decision to deliver interventions derived from GEE aggregate symptommodel
Adjusted OR (95% CI) p value
Trial (ATSM vs. P&F) 1.15 (0.78, 1.70) 0.4820
Symptom severity at onseta 1.13 (1.02, 1.26) 0.0174
Symptom duration at onseta 1.10 (1.02, 1.18) 0.0171
Interference at onseta 1.03 (1.00, 1.05) 0.0306
Total number of symptoms over thresholda 0.64 (0.58, 0.72) <0.0001
CES-D (16+ vs. less than 16)b 0.88 (0.56, 1.37) 0.5642
Comorbidity (3+ vs. less than 3)b 0.85 (0.58, 1.24) 0.3883
Number of contact over thresholda 2.07 (1.75, 2.46) <0.0001
Cancer stage (early vs. late)b 1.65 (0.96, 2.84) 0.0684
Cancer site (not lung vs. lung)b 1.67 (1.09, 2.57) 0.0192
Symptom (vs. weakness) Anxietyc 3.29 (1.73, 6.24) <0.0001d
Constipationc 5.28 (2.24, 12.44)
Cough 1.58 (0.71, 3.51)
Depressionc 3.63 (1.67, 7.86)
Diarrheac 3.06 (1.28, 7.31)
Difficulty remembering 0.82 (0.42, 1.59)
Dry mouth 1.99 (0.99, 4.00)
Dyspneac 3.39 (1.43, 8.02)
Fatiguec 11.35 (5.08, 25.33)
Insomnia 1.80 (0.97, 3.33)
Nausea/vomitingc 2.94 (1.38, 6.24)
Painc 9.57 (3.65, 25.13)
Peripheral neuropathy 1.95 (0.78, 4.89)
Poor appetitec 3.49 (1.97, 6.18)
aCovariates for symptom-specific
bCovariates for patient-specific
cp<0.05 for comparison to symptom of weakness
dOverall test of any symptom differences on interventions delivered
Ann Behav Med. Author manuscript; available in PMC 2011 August 1.
NIH
-PA Author Manuscript
NIH
-PA Author Manuscript
NIH
-PA Author Manuscript
Given et al. Page 20
Table 5
Number of interventions tried after adjusting for number of strategies delivered and other patient and symptomcovariates
Estimated Parameter (SD error) p value
Trial (ATSM vs. P&F) −0.096 (0.157) 0.5390
Symptom severity at onseta −0.025 (0.032) 0.4329
Symptom duration at onseta 0.024 (0.026) 0.3405
Interference at onseta 0.014 (0.007) 0.0354
Total number of symptoms over thresholda −0.102 (0.030) 0.0008
CES-D (16+ vs. less than 16)b −0.097 (0.172) 0.5739
Comorbidity (3+ vs. less than 3)b 0.198 (0.158) 0.2104
Number of contact over thresholda 0.123 (0.048) 0.0111
Cancer stage (early vs. late)b 0.347 (0.180) 0.0548
Cancer site (not lung vs. lung)b 0.394 (0.190) 0.0392
Number of strategies being delivereda 0.735 (0.013) <0.0001
Symptom (vs. weakness) Anxiety −0.007 (0.234) <0.0001d
Constipationc 0.602 (0.264)
Cough −0.176 (0.309)
Depression −0.139 (0.262)
Diarrhea 0.108 (0.304)
Difficulty remembering −0.214 (0.284)
Dry mouth 0.216 (0.265)
Dyspnea −0.418 (0.272)
Fatiguec 0.748 (0.204)
Insomnia −0.434 (0.230)
Nausea/vomiting 0.183 (0.279)
Pain −0.238 (0.231)
Peripheral neuropathy 0.128 (0.265)
Poor appetite 0.008 (0.227)
aCovariates for symptom-specific
bCovariates for patient-specific
cp<0.05 for comparison to symptom of weakness
dOverall test of any symptom differences on interventions tried
Ann Behav Med. Author manuscript; available in PMC 2011 August 1.

NIH
-PA Author Manuscript
NIH
-PA Author Manuscript
NIH
-PA Author Manuscript
Given et al. Page 21
Table 6
Aggregate effect of GEE model on interventions tried on symptom responses after adjusting for patient andsymptom characteristics
Adjusted OR (95% CI) p value
Trial (ATSM vs. P&F) 0.79 (0.54, 1.16) 0.2222
Symptom severity at onseta 1.55 (1.38, 1.74) <0.0001
Symptom duration at onseta 0.98 (0.91, 1.05) 0.5139
Total number of symptoms over thresholda 1.00 (0.93, 1.08) 0.9936
CES-D (16+ vs. less than 16)b 0.65 (0.43, 0.98) 0.0379
Comorbidity (3+ vs. less than 3)b 0.87 (0.60, 1.27) 0.4792
Number of contacts over thresholda 0.40 (0.34, 0.46) <0.0001
Cancer stage (early vs. late)b 1.51 (0.94, 2.43) 0.0876
Cancer site (not lung vs. lung)b 1.12 (0.73, 1.70) 0.6069
Compliance (tried 5+ vs. less than 5)a 1.72 (1.20, 2.49) 0.0036
(Not delivered vs. less than 5) 1.56 (1.05, 2.31) 0.0265
Symptom (vs. weakness) Anxiety 1.20 (0.63, 2.29) <0.0001d
Constipation 0.92 (0.45, 1.89)
Cough 1.29 (0.52, 3.16)
Depression 0.76 (0.40, 1.41)
Diarrhea 1.12 (0.48, 2.62)
Difficulty remembering 0.56 (0.30, 1.04)
Dry mouth 1.94 (0.75, 4.98)
Dyspneac 0.34 (0.16, 0.71)
Fatiguec 0.39 (0.22, 0.67)
Insomnia 1.07 (0.56, 2.02)
Nausea/vomiting 1.30 (0.57, 2.96)
Pain 0.65 (0.36, 1.18)
Peripheral neuropathy 0.50 (0.25, 1.03)
Poor appetite 1.03 (0.57, 1.88)
aCovariates for symptom-specific
bCovariates for patient-specific
cp<0.05 for comparison to symptom of weakness
dOverall test of any symptom differences on symptom responses
Ann Behav Med. Author manuscript; available in PMC 2011 August 1.
NIH
-PA Author Manuscript
NIH
-PA Author Manuscript
NIH
-PA Author Manuscript
Given et al. Page 22
App
endi
x 1
Five
Mos
t Fre
quen
t Stra
tegi
es b
y C
ateg
ory,
for F
atig
ue
Self
Car
e
Stra
tegy
Num
ber
Del
iver
edN
umbe
r T
ried
Perc
ent T
ried
Num
ber
Hel
ped
Perc
ent H
elpe
d
Fatig
ue m
anag
emen
t (ex
erci
se, n
utrit
ion,
flui
ds)
228
213
93.4
206
96.7
Tool
kit u
se21
691
42.1
8896
.7
Flui
ds/h
ydra
tion
(8 g
lass
es p
er d
ay)
186
169
90.9
146
86.4
Die
t/nut
ritio
n88
7686
.464
84.2
Ener
gy c
onse
rvat
ion
(bal
ance
slee
p, e
xerc
ise/
activ
ity)
8371
85.5
6895
.8
Info
rmat
ion
Stra
tegy
Num
ber
Del
iver
edN
umbe
r T
ried
Perc
ent T
ried
Num
ber
Hel
ped
Perc
ent H
elpe
d
Fatig
ue m
anag
emen
t (ex
erci
se, n
utrit
ion,
flui
ds)
6261
98.4
5996
.7
Tool
kit u
se53
3667
.925
69.4
Flui
ds/h
ydra
tion
(8 g
lass
es p
er d
ay)
4845
93.8
4191
.1
Die
t/nut
ritio
n46
4291
.340
95.2
Exer
cise
eve
ryda
y46
3984
.835
89.7
Com
mun
icat
ion
Stra
tegy
Num
ber
Del
iver
edN
umbe
r T
ried
Perc
ent T
ried
Num
ber
Hel
ped
Perc
ent H
elpe
d
Com
mun
icat
e in
gen
eral
abo
ut sy
mpt
om32
1546
.910
66.7
Am
ount
and
pat
tern
s of f
atig
ue/o
verw
helm
ed25
1768
.011
64.7
Una
ble
to d
o us
ual a
ctiv
ities
/inte
rfer
ence
with
func
tion/
unab
le to
mov
e fo
r 24
hour
s23
939
.18
88.9
Nee
d as
sist
ance
with
hou
seho
ld c
hore
s20
1575
.015
100
How
fatig
ue a
ffec
ts d
aily
act
ivity
/em
otio
ns13
1184
.69
81.8
Cou
nsel
ing
Stra
tegy
Num
ber
Del
iver
edN
umbe
r T
ried
Perc
ent T
ried
Num
ber
Hel
ped
Perc
ent H
elpe
d
Act
ive
liste
ning
/gui
danc
e/an
ticip
ator
y gu
idan
ce69
6797
.167
100
Life
styl
e ch
ange
s32
3093
.830
100
Prob
lem
solv
ing
2827
96.4
2710
0
Ann Behav Med. Author manuscript; available in PMC 2011 August 1.
NIH
-PA Author Manuscript
NIH
-PA Author Manuscript
NIH
-PA Author Manuscript
Given et al. Page 23C
ouns
elin
g
Stra
tegy
Num
ber
Del
iver
edN
umbe
r T
ried
Perc
ent T
ried
Num
ber
Hel
ped
Perc
ent H
elpe
d
Opt
imis
tic th
inki
ng18
1794
.417
100
Fam
ily su
ppor
t15
1173
.311
100
Ann Behav Med. Author manuscript; available in PMC 2011 August 1.
Copyright © 2022 FDOKUMEN