Decoding Temporal Information Through Slow Lateral Excitation in the Olfactory System of Insects
11
Journal of Computational Neuroscience 15, 271–281, 2003 c 2003 Kluwer Academic Publishers. Manufactured in The Netherlands. Decoding Temporal Information Through Slow Lateral Excitation in the Olfactory System of Insects THOMAS NOWOTNY, MIKHAIL I. RABINOVICH AND RAM ´ ON HUERTA Institute for Nonlinear Science, University of California San Diego, La Jolla, CA 92093-0402, USA [email protected] HENRY D.I. ABARBANEL Institute for Nonlinear Science, University of California San Diego, La Jolla, CA 92093-0402, USA; Department of Physics and Marine Physical Laboratory (Scripps Institution of Oceanography), University of California San Diego, La Jolla, CA 93093-0402, USA Received April 23, 2003; Revised June 5, 2003; Accepted June 16, 2003 Action Editor: Christiane Linster Abstract. Sensory information is represented in a spatio-temporal code in the antennal lobe, the first processing stage of the olfactory system of insects. We propose a novel mechanism for decoding this information in the next processing stage, the mushroom body. The Kenyon cells in the mushroom body of insects exhibit lateral excitatory connections at their axons. We demonstrate that slow lateral excitation between Kenyon cells allows one to decode sequences of activity in the antennal lobe. We are thus able to clarify the role of the existing connections as well as to demonstrate a novel mechanism for decoding temporal information in neuronal systems. This mechanism complements the variety of existing temporal decoding schemes. It seems that neuronal systems not only have a rich variety of code types but also quite a diversity of algorithms for transforming different codes into each other. Keywords: olfaction, odor representation, temporal coding, sparse coding, mushroom body, Kenyon cells 1. Introduction In recent years a lot of experimental evidence for tem- poral coding of information has been collected in ol- factory (Laurent et al., 1998, 2001; Laurent, 1999), au- ditory (Jeffres, 1948; Leibold et al., 2002; Lu et al., 2001), visual (v. Rullen and Thorpe, 2001) and tactile systems (Ahissar et al., 1997, 2000), as well as in the hippocampus (Wallenstein et al., 1998; Fortin et al., 2002). The formation of spatio-temporal coding (some- times also referred to as identity-temporal or ensemble- temporal coding) in the hippocampus is related to be- havioral tasks following a temporal sequence (Fortin et al., 2002). In the example of the tactile system the sensory information from whiskers is encoded in the identity of active neurons for vertical localization but in a temporal code induced by whisker swiping for hor- izontal information (Ahissar et al., 1997, 2000). Exam- ples of temporal encoding in the visual system are nu- merous. We have, for example, temporal patterns found in lateral geniculate nucleus (Reinagel and Reid, 2000), temporal coding of contrast (Reich et al., 2001) and general temporal codes in visual cortex (Reich et al., 2001). Temporal information processing in the audi- tory system is mainly used for sound location in a three dimensional environment utilizing very precise spike timings (Jeffres, 1948; Leibold et al., 2002) but there is
Transcript of Decoding Temporal Information Through Slow Lateral Excitation in the Olfactory System of Insects

Journal of Computational Neuroscience 15, 271–281, 2003c© 2003 Kluwer Academic Publishers. Manufactured in The Netherlands.
Decoding Temporal Information Through Slow Lateral Excitationin the Olfactory System of Insects
THOMAS NOWOTNY, MIKHAIL I. RABINOVICH AND RAMON HUERTAInstitute for Nonlinear Science, University of California San Diego, La Jolla, CA 92093-0402, USA
HENRY D.I. ABARBANELInstitute for Nonlinear Science, University of California San Diego, La Jolla, CA 92093-0402, USA; Department
of Physics and Marine Physical Laboratory (Scripps Institution of Oceanography), University of CaliforniaSan Diego, La Jolla, CA 93093-0402, USA
Received April 23, 2003; Revised June 5, 2003; Accepted June 16, 2003
Action Editor: Christiane Linster
Abstract. Sensory information is represented in a spatio-temporal code in the antennal lobe, the first processingstage of the olfactory system of insects. We propose a novel mechanism for decoding this information in the nextprocessing stage, the mushroom body. The Kenyon cells in the mushroom body of insects exhibit lateral excitatoryconnections at their axons. We demonstrate that slow lateral excitation between Kenyon cells allows one to decodesequences of activity in the antennal lobe. We are thus able to clarify the role of the existing connections as wellas to demonstrate a novel mechanism for decoding temporal information in neuronal systems. This mechanismcomplements the variety of existing temporal decoding schemes. It seems that neuronal systems not only have arich variety of code types but also quite a diversity of algorithms for transforming different codes into each other.
Keywords: olfaction, odor representation, temporal coding, sparse coding, mushroom body, Kenyon cells
1. Introduction
In recent years a lot of experimental evidence for tem-poral coding of information has been collected in ol-factory (Laurent et al., 1998, 2001; Laurent, 1999), au-ditory (Jeffres, 1948; Leibold et al., 2002; Lu et al.,2001), visual (v. Rullen and Thorpe, 2001) and tactilesystems (Ahissar et al., 1997, 2000), as well as in thehippocampus (Wallenstein et al., 1998; Fortin et al.,2002).
The formation of spatio-temporal coding (some-times also referred to as identity-temporal or ensemble-temporal coding) in the hippocampus is related to be-havioral tasks following a temporal sequence (Fortin
et al., 2002). In the example of the tactile system thesensory information from whiskers is encoded in theidentity of active neurons for vertical localization butin a temporal code induced by whisker swiping for hor-izontal information (Ahissar et al., 1997, 2000). Exam-ples of temporal encoding in the visual system are nu-merous. We have, for example, temporal patterns foundin lateral geniculate nucleus (Reinagel and Reid, 2000),temporal coding of contrast (Reich et al., 2001) andgeneral temporal codes in visual cortex (Reich et al.,2001). Temporal information processing in the audi-tory system is mainly used for sound location in a threedimensional environment utilizing very precise spiketimings (Jeffres, 1948; Leibold et al., 2002) but there is
272 Nowotny et al.
also evidence for non-trivial processing of the temporalstructure of sound stimuli in general (Lu et al., 2001).
In the olfactory system temporally structured activityis generated even if the stimulus has no temporal struc-ture itself (Wehr and Laurent, 1999). It has been demon-strated that such temporal coding plays a role in enhanc-ing the discrimination of similar odors (Stopfer et al.,1997; Laurent et al., 1998; Teyke and Gelperin, 1999).
Several methods to decode temporal information inneuronal systems have been proposed. The oldest weare aware of (Jeffres, 1948) uses delay lines and coin-cidence detectors to explain the mechanisms of soundlocation. In more recent work Buonomano et al. showedthat a random network of neurons with excitatory andinhibitory synapses having realistic properties is able totransform temporally differing input into spatially dif-ferent activation patterns (Buonomano and Merzenich,1995; Buonomano et al., 1997). Even more recently,experimental observations of the encoding-decodingprocess in tactile systems indicate that temporal infor-mation in these systems is gated through the thalamus(Ahissar et al., 1997, 2000) to yield a spatial rate code.
In this paper, we analyze the role of local excita-tory connections for temporal decoding in the olfactorysystem of insects using the locust as our main modelsystem.
The first information processing stage of the ol-factory system of the locust, the antennal lobe (AL),has been subject to a thorough theoretical analysis(Rabinovich et al., 1998, 2001; Bazhenov et al., 2001a,2001b; Laurent et al., 2001). In the AL the dynami-cal interplay of excitatory and inhibitory connectionsbetween projection neurons (PNs) and local interneu-rons (LNs) produces sequences of activity that mapuniquely to the encountered odor (Stopfer et al., 2003).Odor identity as well as its concentration are encodedin these sequences of activity.
The present work focuses on the next stage of neu-ral processing in which the information, encoded inthe complex dynamics of the AL, is projected onto alarger screen, the mushroom body (MB). The Kenyoncells (KC) in the MB seem to be coincidence detectorsfor synchronized activity in the AL. It has been shownthat the resulting code in the MB is sparse (Perez-Oriveet al., 2002). In addition to the direct projection from theAL to the MB there is also a global feed-forward inhibi-tion mediated by lateral horn interneurons (LHIs) thatresets the activity of the KCs in the MB every 50 ms.This reset mechanism cuts the spatio-temporal code ofthe AL into snapshots of spatial activity patterns.
Our inquiry rests on a paradox. The KCs have lo-cal excitatory axo-axonal connections to their nearestneighbors but to date the function of these connectionsis unclear especially because the global inhibition stopsthe propagation of activity every 50 ms. Furthermore,if the connections were strong and fast enough to affectneighboring KCs within one 50 ms cycle of activity thiswould lead to a non-sparse code which is not observed.
Our main hypothesis is that if the lateral excitationbetween KCs is sufficiently slow it can be used to de-code temporal information across activity cycles. Weshow that lateral slow excitation can transform a givensequence of activity in the AL into a spatial represen-tation in the MB that is significantly different fromthe representation of any permutation of that sequence.This way the temporal information of the order of thesequence of activity snapshots in the MB is conserved.This might otherwise be lost during integration of MBactivity in downstream areas.
2. Biological Morphology
The olfactory circuits of the locust are known accu-rately (Perez-Orive et al., 2002). About 90000 olfac-tory receptor neurons in each antenna project throughglomeruli to the corresponding AL containing ≈830projection neurons (PN) and ≈300 LN. The PNs ofeach AL contact ≈600 of a total of ≈50000 KCs in theipsilateral MB through the calyx. In return each KCreceives input from ≈10–20 PNs. This pathway seemsto be the only olfactory input to the MB. There alsoseems to be no direct feedback from the MB to the AL.
The KC of the MB are subject to a periodic globalinhibition due to the activity of LHIs which are excitedby input from the PNs of the AL. The activity of theLHIs exhibits an approximate phase shift of ≈180◦
with respect to the average activity of the PNs or—more or less equivalently—to the observed local fieldpotential in the calyx.
The KCs project to the MB-lobes through axonswhich are densely packed in nerve fibers. It has beenknown for some time that the axons have chemical con-nections within these nerve fibers establishing a localhexagonal lattice structure within the otherwise seem-ingly unconnected KCs (Leitch and Laurent, 1996).The type of connection has not yet been determinedunambiguously but they are suspected to be excitatory.These connections are the essential ingredient for thedecoding mechanism suggested in this work.
Decoding Temporal Information in the Olfactory System of Insects 273
The output of the AL is the synchronous firing ofsmall groups of PNs. These groups of active PNs evolvein a slow switching pattern. Typically in the order of200 PNs respond in groups of ≈30 synchronously fir-ing neurons to each odor (Wehr and Laurent, 1996;Laurent et al., 1996). Recent experiments indicate evenlarger group sizes in this activity. This type of dynam-ical activity has been argued to result from neural cir-cuitry built on the principle of winnerless competition(Rabinovich et al., 2001).
3. Functional Principle
Our main hypothesis is that the KCs in the MB forma device that transforms the dense spatio-temporalcode generated by the AL into a sparse spatial code.The mechanism we suggest to perform this taskonly requires a sufficient size of the MB and a lo-cal structure of slow excitatory connections. No spe-cific connectivity between the AL and the MB isnecessary.
The basic mechanism for the transformation of thespatio-temporal code is illustrated in Fig. 1. The indi-vidual KCs act as coincidence detectors for the syn-chronous PN input with some given threshold. Thecoincidence detection responds to the spatial part ofthe spatio-temporal code. The threshold together withthe known connectivity statistics determines the av-erage initial activity of the KCs in response to anodor. If a given KC detects a coincidence of suffi-ciently many PN inputs, it will fire an isolated spike.This will excite the neighbors of this particular KCthrough the local excitatory connections. In the tem-porally next cycle of PN activity these neighbors willbe more receptive to input from the AL than in theirresting state, i.e., fewer coincident inputs than in theprevious cycle will suffice to trigger a spike in theseneurons. Depending on the input in the next cycleof PN activity it is therefore likely to have a spikein a KC in the neighborhood of the originally activeKC. This will in its turn activate its neighbors and soon. By this mechanism small clusters of active neu-rons are formed whose size and shape depend on theidentity and temporal order of the input. It obviouslyis essential for the functionality that the local excita-tory connections are effective longer than one activitycycle of the PN input. Equally important is an ade-quate connectivity statistics allowing the subsequentcoincidence detection in the activated neighborhoodKCs of active KCs.
4. Numerical Simulation
Because the statistical properties of the connectivitybetween AL and MB play a crucial role in the sug-gested function of the KCs the system was simu-lated in a realistically sized network. We used a set of158 × 316 ≈ 50,000 integrate and fire neurons to rep-resent the KCs in the MB. These very simple neuronsare adequate for the KCs as they only need to producea single spike on an infrequent basis. They are con-nected in a hexagonal lattice by excitatory Rall-typesynapses (see Appendix A). The input from the ALstems from 830 Hodgkin-Huxley type model neuronswhich are induced to spike synchronously in randomlychosen groups of 30 neurons. The active PN neuronsspike every 50 ms and the group of active PN neuronsis switched every 250 ms. The PNs have a fixed prob-ability p = 600/50000 to be connected to each KCleading to about 600 connections for each PN.
The feed-forward periodic global inhibition of theLHIs is implemented by one Hodgkin-Huxley typeneuron with slow calcium dynamics. It receives inputfrom all PNs and inhibits all neurons in the KC lattice.The morphology of the computer model is depicted inFig. 2. Details of the neuron and synapse models usedare given in Appendix A.
Up to this point the simulation is just a crude imageof the real system without any specifics about its bio-logical functionality. It is common understanding thatthe KCs in the MB work as coincidence detectors. Weadopted this view and chose the time scale of the PN-KC connections to be τsyn = 1 ms; namely, small. Thismakes the KCs very sensitive to the relative timing ofincoming input from the PNs and lets them functionas coincidence detectors. The synaptic strength of thePN-KC connections needs to be carefully adjusted toaccount for the observed initial KC activity in an odorresponse. It turns out that a constant synaptic strengthof these connections cannot account for the activitylevel observed. We, therefore, introduced an additiveGaussian jitter on the synaptic strengths, in particularfor a PN (i = 1, . . . , nPN) to KC ( j = 1, 2, . . . , nKC)connection, we use
gi j ={
g + δgi j with probability p
0 with probability 1 − p(1)
where g is the (fixed) average value and δgi j are inde-pendent identically distributed (iid) Gaussian randomvariables with mean 0 and standard deviation σ . For adetailed analysis see Appendix B.

274 Nowotny et al.
to PN group CAL activity switches
to PN group BAL activity switches
firingwhile PN group A isCoincidence detection
Activation of the local
Coincidence detection
in the activated neigh−
but strongly depends on
the current PN activity
Further activation
specific to the newcoincidence detection
neighborhood
borhood is likely
of the neighborhood
(random connectivity)
excitatory connections
slow local
excitatory connections
(830)
inhibitory connections
LH interneuron
(1)
excitatory connections
(49928)
(830)
lattice of KC
synτ = 1.0 ms
fast excitatory connections
synk µ= 0.8 S,
syn = 1 msτsynk = 0.16 +/ 0.02 Sµ
synτ = 40 ms, 30 ms
synk = 1.8 ... 2.7 Sµ
artificial input neurons
syn= 4.5 msτsynk µ= 1.0 S,
synτ = 3.0 ms
synk = 0.023 Sµ
HH type PN
Figure 2. Morphology of the computer model. Excitatory synapses are shown as red lines, inhibitory connections as black lines. Thicknessand texture of the lines hint to the strength of the connections.
Figure 1. Illustration of the transformation of temporal into spatialinformation. If a coincidence detection occurs the local excitatoryconnections activate the neighbors of the active neuron (yellow neu-rons in the second row). Coincidence detection of input is now moreprobable in these activated neighborhoods than in other KCs. Whichof the neighbors might fire a spike however depends on the activ-ity of the PNs in the next cycle. It might be a different neuron foran active group B of PNs (left side) than for active group C (rightside). In this way local sequences of active KC form which dependon the identity of active PNs (coincidence detection) as well as onthe temporal order of their activity (activated neighborhoods).
←
To implement the functional principle describedabove the local excitatory connections need to be suffi-ciently slow to still take effect in the next cycle of syn-chronized PN activity. We therefore tried connectionswith time scale τKC = 30 ms and 40 ms. The synapticstrength then again needs to be adjusted carefully tobe strong enough to allow the temporal decoding de-scribed above and to be not to strong to avoid excessiveKC activity in form of propagating waves. Appendix Bexplains the heuristics leading to the values used in thesimulation.
Decoding Temporal Information in the Olfactory System of Insects 275
5. Results
To test the transformation principle we randomly choseensembles A, B, C of 30 PN each and activated theseensembles in different temporal orders. The same en-sembles A, B, and C were used in all simulations. Ifthe mechanism was implemented successfully the ac-tivation of A → B → C should lead to a differentactivation pattern in the KC lattice than B → A → Cor A → C → B.
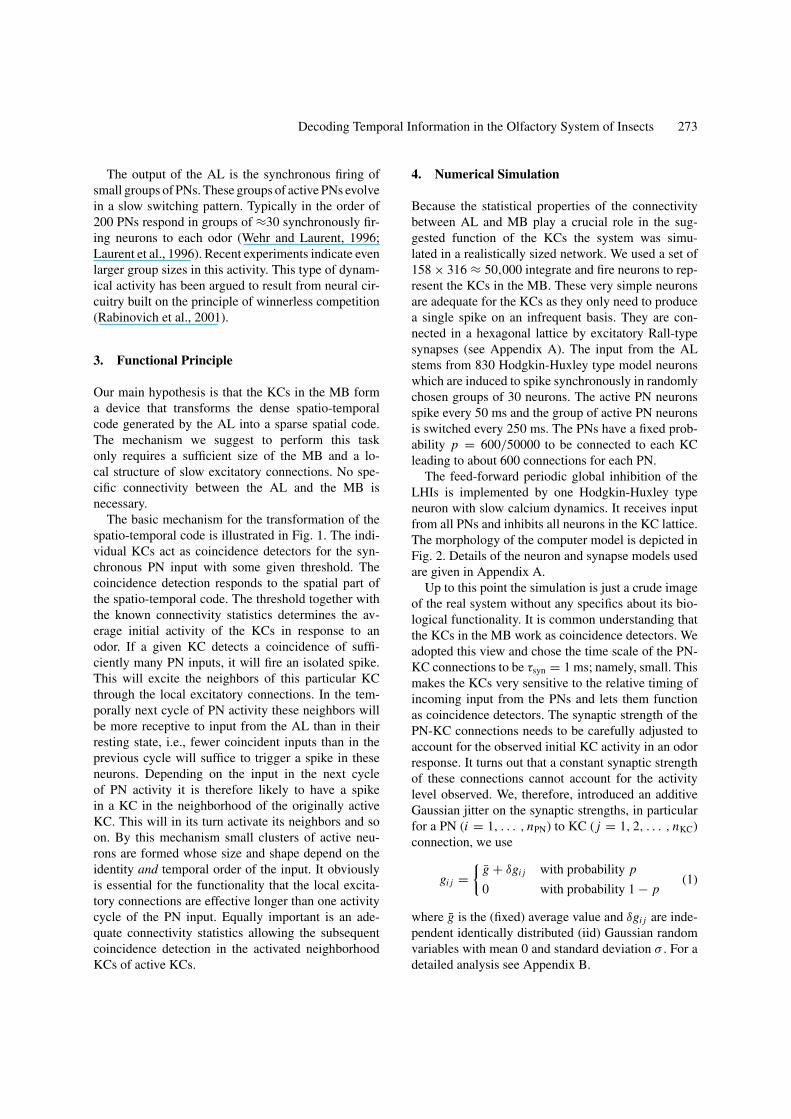
In Fig. 3 the differences in the average activity ofall the KCs for input A → B → C compared toinput A → C → B is shown for local synapses
-2 2
PN
Figure 3. Differences in the average activity of individual PN andKC for local synapses with time constant τsyn = 40 ms and synap-tic strength ksyn = 2.5 µS (see the equations for synaptic current inAppendix A). All PNs and KCs are represented as small dots. ThePNs are shown in a single column on the left side. The KCs arearranged on a 2d hexagonal lattice reflecting their axo-axonal neigh-borhood structure. The average activity of the cells is shown in agreyscale ranging from no activity (white) to maximal activity (total5 spikes, black). The PN which are much more active than the KCand therefore darker. Superimposed on this image is the differencein activity in a color code. Here the scale ranges from red (2 morespikes in A → C → B than in A → B → C) to green (2 morespikes in A → B → C than in A → C → B). Note that there is nodifference in the average activity of the PNs. The average activity inthe sequence A → B → C per KC and per ms is 0.13 ± 1.3 · 10−4.The average activity of the active neurons is 1.2 ± 0.4 · 10−3 spikesper ms corresponding to 1.2 spikes in the whole 1000 ms period.The number of active KC is 544. The average activity is similar forthe other sequences. The boxes at the bottom and right side highlightand magnify regions in the KC lattice that illustrate the results mostclearly.
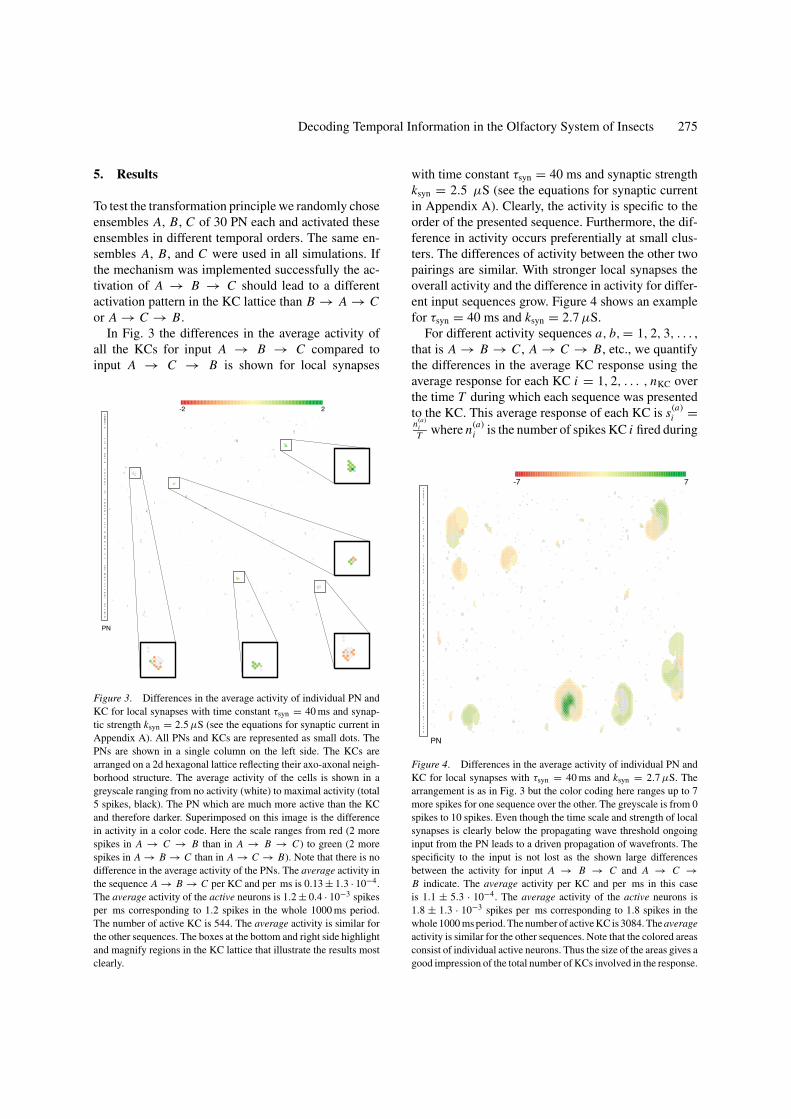
with time constant τsyn = 40 ms and synaptic strengthksyn = 2.5 µS (see the equations for synaptic currentin Appendix A). Clearly, the activity is specific to theorder of the presented sequence. Furthermore, the dif-ference in activity occurs preferentially at small clus-ters. The differences of activity between the other twopairings are similar. With stronger local synapses theoverall activity and the difference in activity for differ-ent input sequences grow. Figure 4 shows an examplefor τsyn = 40 ms and ksyn = 2.7 µS.
For different activity sequences a, b, = 1, 2, 3, . . . ,that is A → B → C , A → C → B, etc., we quantifythe differences in the average KC response using theaverage response for each KC i = 1, 2, . . . , nKC overthe time T during which each sequence was presentedto the KC. This average response of each KC is s(a)
i =n(a)
iT where n(a)
i is the number of spikes KC i fired during
-7 7
PN
Figure 4. Differences in the average activity of individual PN andKC for local synapses with τsyn = 40 ms and ksyn = 2.7 µS. Thearrangement is as in Fig. 3 but the color coding here ranges up to 7more spikes for one sequence over the other. The greyscale is from 0spikes to 10 spikes. Even though the time scale and strength of localsynapses is clearly below the propagating wave threshold ongoinginput from the PN leads to a driven propagation of wavefronts. Thespecificity to the input is not lost as the shown large differencesbetween the activity for input A → B → C and A → C →B indicate. The average activity per KC and per ms in this caseis 1.1 ± 5.3 · 10−4. The average activity of the active neurons is1.8 ± 1.3 · 10−3 spikes per ms corresponding to 1.8 spikes in thewhole 1000 ms period. The number of active KC is 3084. The averageactivity is similar for the other sequences. Note that the colored areasconsist of individual active neurons. Thus the size of the areas gives agood impression of the total number of KCs involved in the response.
276 Nowotny et al.
T . The average intensity of response over all KCs tothe presentation of sequence a is given as
A2a =
nKC∑i=1
(s(a)
i
)2. (2)
The difference in the KC response to two sequences aand b is indicated by
2ab =
nKC∑i=1
(s(a)
i − s(b)i
)2(3)
such that the relative difference per response intensityis
δ2ab = 2
ab
A2a + A2
b
. (4)
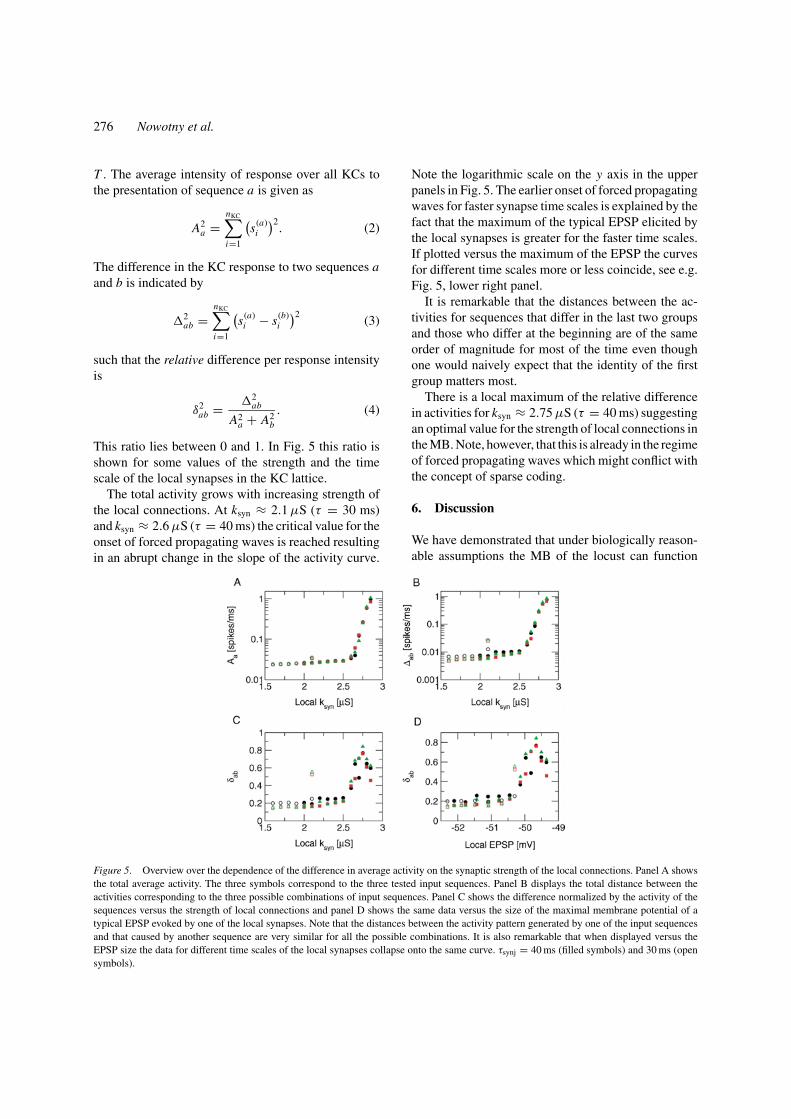
This ratio lies between 0 and 1. In Fig. 5 this ratio isshown for some values of the strength and the timescale of the local synapses in the KC lattice.
The total activity grows with increasing strength ofthe local connections. At ksyn ≈ 2.1 µS (τ = 30 ms)and ksyn ≈ 2.6 µS (τ = 40 ms) the critical value for theonset of forced propagating waves is reached resultingin an abrupt change in the slope of the activity curve.
Figure 5. Overview over the dependence of the difference in average activity on the synaptic strength of the local connections. Panel A showsthe total average activity. The three symbols correspond to the three tested input sequences. Panel B displays the total distance between theactivities corresponding to the three possible combinations of input sequences. Panel C shows the difference normalized by the activity of thesequences versus the strength of local connections and panel D shows the same data versus the size of the maximal membrane potential of atypical EPSP evoked by one of the local synapses. Note that the distances between the activity pattern generated by one of the input sequencesand that caused by another sequence are very similar for all the possible combinations. It is also remarkable that when displayed versus theEPSP size the data for different time scales of the local synapses collapse onto the same curve. τsynj = 40 ms (filled symbols) and 30 ms (opensymbols).
Note the logarithmic scale on the y axis in the upperpanels in Fig. 5. The earlier onset of forced propagatingwaves for faster synapse time scales is explained by thefact that the maximum of the typical EPSP elicited bythe local synapses is greater for the faster time scales.If plotted versus the maximum of the EPSP the curvesfor different time scales more or less coincide, see e.g.Fig. 5, lower right panel.
It is remarkable that the distances between the ac-tivities for sequences that differ in the last two groupsand those who differ at the beginning are of the sameorder of magnitude for most of the time even thoughone would naively expect that the identity of the firstgroup matters most.
There is a local maximum of the relative differencein activities for ksyn ≈ 2.75 µS (τ = 40 ms) suggestingan optimal value for the strength of local connections inthe MB. Note, however, that this is already in the regimeof forced propagating waves which might conflict withthe concept of sparse coding.
6. Discussion
We have demonstrated that under biologically reason-able assumptions the MB of the locust can function
Decoding Temporal Information in the Olfactory System of Insects 277
as a device to transform a dense spatio-temporal codeinto a sparse spatial code. In particular it has beenshown that slow local excitatory connections allowone to decode the temporal information in the input.Underlying this transformation is a mechanism to de-code spatio-temporal neural information that is basedon coincidence detection and slow excitation. It doesnot need any specific connectivity between PNs andKCs.
While using several known properties of the bio-logical system as an input this modeling study alsoprovides clear predictions about the necessary prop-erties of the local connections in the MB. An ex-perimental test for the mechanism suggested in thisstudy is to measure the EPSPs generated by the lo-cal axo-axonal connections among KCs. The EPSPsshould outlast the duration of a resetting cycle by theglobal inhibition of the LHIs. Furthermore, we predicta range for the strength (maximal conductivity) of theseconnections.
Our interpretation of the sparse spatial code gener-ated in the MB assumes integrators of the KC activityin downstream neural circuitry. The formation of lo-cal clusters suggests that it might be advantageous forthese integrators to receive input that is local with re-spect to the axo-axonal KC lattice structure. There areindications from staining experiments in cockroacheswhich might suggest such a connectivity (Strausfeldand Li, 1999; Strausfeld et al., 2000). It is, however,an open question on what time scale such downstreamintegrators might operate. The mechanism suggestedhere points to a long integration window because oth-erwise the decoded temporal part of the informationmight be lost.
One might hope that the formation of small clus-ters of activity in the KCs of the mushroom bodymight be detectable in optical or tetrode recordings.The clusters form with respect to the neighborhoodstructure defined by the axo-axonal connections, how-ever. This neighborhood structure does not correlatewell with the spatial arrangement of the KCs one cansee in experiments such that the clusters cannot be seendirectly.
There are several future directions for this re-search. One important question is how learning canbe included into the current scheme. There areclear indications that the MB is involved in learn-ing and memory of olfactory information (Heisenberg,2003; de Belle and Heisenberg, 1994; Hammer andMenzel, 1998; Dubnau et al., 2001). Another project
is to move to more and more realistic input fromthe AL including asynchronous input if no odor ispresent, noise and eventually input from a realistic ALmodel.
Appendix A: Model Components
All synapses in the system were represented by a modelfirst introduced by Rall (1967, 1989) and now is a stan-dard model for synapses (Destexhe et al., 1998). Thesynaptic current into a postsynaptic neuron with mem-brane potential Vpost(t) is given as
ISynapse(t) = −ksyn g(t) (Vpost(t) − Vsyn), (5)
where g(t) satisfies
d f (t)
dt= 1
τsyn((Vpre(t) − Vth) − f (t))
(6)dg(t)
dt= 1
τsyn( f (t) − g(t)),
Vth = −20 mV, and Vsyn = 0 mV for excitatory andVsyn = −92 mV for inhibitory synapses. Vpre(t) andVpost(t) are the pre- and post-synaptic membrane po-tentials and τsyn and ksyn are the time scale and thestrength of the synapse respectively. (u) = 0, u ≤ 0and (u) = 1, u > 0 is the usual Heaviside function.
The PNs of the AL were represented by Hodgkin-Huxley type model neurons previously developed forsimulations of the AL itself. The equations of theseconductance based model neurons are
CdV (t)
dt= −(INa(t) + IK(t) + ICa(t) + IKCa(t)
+ Il(t)) + ISynapse(t), (7)
where V (t) is the membrane voltage, C = 1.0 µF isthe membrane capacitance, and the ion currents aredetermined by
INa(t) = m(t)3h(t)gNa(V (t) − VNa)
IK(t) = n(t)4(V (t) − VK)(8)
ICa(t) = k(t)3l(t)gCaV (t)
1 − e2V (t)/kCa
IKCa(t) = gKCa(V (t) − VKCa)ω(t)4
k4KCa + ω(t)4
,

278 Nowotny et al.
and the leak current is
Il(t) = gl(V (t) − Vl). (9)
ISynapse is as given above. We used the following valuesfor the maximal conductances and reversal potentials:gl = 0.1 µS, gNa = 50 µS, gK = 10 µS, gCa = 0.2 µS,gKCa = 0.15 µS, Vl = −55 mV, VNa = 50 mV,VK = −95 mV, VKCa = −95 mV, and the constantsare kKCa = 0.15 and kCa = 24.42 mV.
Each of the activation and inactivation functionsm(t), h(t), n(t), k(t), and l(t) satisfy first order kineticsequations of the form
d X (t)
dt= AX (V (t)) − BX (V (t))X (t), (10)
where for X (t) = m(t), h(t), and n(t)
AX (V ) = αX (V )
BX (V ) = αX (V ) + βX (V )
αm(V ) = 0.116V + 42 mV
1 − exp(−(V + 42 mV)/4 mV)
βm(V ) = −0.093V + 15 mV
1 − exp((V + 15 mV)/5 mV)
αh(V ) = 0.0426 exp(−(V + 38 mV)/18 mV)
βh(V ) = 1.33
1 + exp(−(V + 15 mV)/5 mV)
αn(V ) = 0.01V + 30 mV
1 − exp(−(V + 30 mV)/5 mV)
βn(V ) = 0.166 exp(−(V + 35 mV)/40 mV).
(11)
For k(t) and l(t) we have
AX (V ) = αX (V )
βX (V )
BX (V ) = 1
βX (V )
αk(V ) = 1
1 + exp(−(V + 27.1 mV)/7.18 mV)
βk(V ) = 20 − 19.9
1 + exp((V − 40.1)/8 mV)
αl(V ) = 1
1 + exp((V + 27.0 mV)/3.5 mV)
βl(V ) = 30 + 100
1 + exp((V + 50.1 mV)/5 mV).
(12)
The Ca induced K current activation is governed byω(t) satisfying
dω(t)
dt= 0.001
(− ICa(t)
µA− c2
0 ω(t) + 0.04 c20
),
(13)
and c0 = 1.8.The PNs are induced to spike by input received from
artificial input neurons which fire rectangular spikesaccording to the chosen input pattern and are connectedto the PNs by Rall type synapses with τsyn = 1.0 msand ksyn = 0.8 µS.
Using such an elaborated neuron model for the PN,which are not the focus of interest in this study, mightseem like overkill but will allow to easily combineearlier studies of the AL with the present one in fu-ture work. Note that in investigations of the AL ap-propriate neuron models are important for reproducingthe complex spatio-temporal dynamics (Laurent et al.,2001; Rabinovich et al., 2001; Bazhenov et al., 2001a,2001b).
The KC were represented by leaky integrate and fireneurons (IF) described by
CdV (t)
dt= −Il(t) + ISynapse(t), (14)
where
Il(t) = gl(V (t) − Vl), (15)
ISynapse(t) is the synaptic input current given above,gl = 0.3 µS and Vl = −60 mV. If V (t) grows largerthan a given threshold Vthresh = −35 mV it is instan-taneously set to the firing voltage Vmax = 50 mV.This voltage is fixed for the duration of the firing timeτf = 1.5 ms and then released to develop accordingto (14). The observed refractoriness of real KC in theMB of the locust was implemented by self-inhibitionof these IFs through synapses with τsyn = 45.0 ms andksyn = 8 µS. Using a highly simplified neuron modelfor the KCs seems to be legitimate because of the simplesparse activity observed in experiments (Perez-Oriveet al., 2002). It allowed us to simulate the system in itsfull size because of computational simplicity.
The LHIs were represented by a single neuron withslow calcium dynamics only, in particular
dV (t)
dt= − 1
C(Il(t) + ICa(t) + IKCa(t) − ISynapse(t)),
(16)
Decoding Temporal Information in the Olfactory System of Insects 279
where
Il(t) = gl(V (t) + 65 mV)
ICa(t) = gCa k(t)3 l(t)V (t)
1 − exp(2V (t)/kCa)(17)
IKCa(t) = gKCaω(t)4
ω(t)4 + 0.54(V (t) + 70 mV),
and gl = 0.4 µS, gCa = 2.5 µS, gKCa = 2.0 µS, andagain kCa ≈ 24.42 mV. This neuron receives input fromall PN through excitatory synapses with τsyn = 3.0 msand ksyn = 0.023 µS and projects to all KC with in-hibitory synapses with τsyn = 4.5 ms and ksyn = 1.0 µS.We chose this type of neuron model because the ac-tion of the LHI neurons results in a with period 50 msrather slow periodic inhibition onto the KCs. The slowdynamics of our inhibitory neuron reflects this slowertime scale.
Appendix B: Connectivity Analysis
In order to build a realistic model, the parameters ofthe model neurons and synapses have to be adjustedto a meaningful regime. Calculating the probabilitiesand expectation values for the number of connectionsto active neurons as well as the size and form of typi-cal EPSPs in the system allows us to adjust the firingthreshold of the model KC and the synaptic strengthsof the PN-KC connections to yield a realistic activityin the KC lattice. As the numbers of PNs and KCs arefairly large the law of large numbers is in our favor andthe calculation of expectation values provides a verygood estimates for the degree of coincidence and theresulting activity in the KC network for a given input.
The EPSP of Rall type synapses onto IF neuronsgiven a square pulse input of duration t0 is
E(t)
=
[∫ t
0dt ′ 1
C gl El e1C (gl t ′+gsynu(t ′)) + El e
2C gsynτsyn
]
× e− 1C (gl t+gsynu(t)) t ≤ t0
[∫ t
t0
dt ′ 1C gl El e
1C (gl t ′+gsynv(t ′))
+E(t0) e1C (gl t0+gsynv(t0))
]
× e− 1C (gl t+gsynv(t)) t > t0
(18)
where
u(t) = t(1 + et/τsyn ) + 2τsyne−t/τsyn (19)
v(t) = −(r (t0)(τsyn + t − t0) + s(t0)τsyn)e(t−t0)/τsyn
(20)
r (t) = 1 − e−t/τsyn (21)
s(t) = 1 − (t/τsyn + 1)e−t/τsyn (22)
From this it is easy to obtain the maximal value ofthe EPSP. Solving for this maximum being equal tothe threshold Vthresh = −35 mV of the IF neurons,one obtains a threshold θ for the total synaptic inputstrength necessary to fire the neuron. Inserting the pa-rameter values C = 1 µF, gl = 0.3 µS, El = −60 mV,τsyn = 1 ms, t0 = 2.5 ms one obtains θ ≈ 0.49 µS.
The random connectivity between AL and KC im-plemented in the model allows us to calculate theprobability distribution for the total synaptic inputstrengths at the KCs. Let C = (ci j ), i = 1, . . . , nPN,j = 1, . . . , nKC denote the connectivity matrix be-tween the PNs and the KCs and let CA = (cA
i j ) denotethe connectivity matrix of active PNs to all KCs. Theprobability P(
∑i cA
i j = x) for a given KC to have xconnections to the n A active PNs is given by the bi-nomial distribution bn A,p where p is the probability ofeach individual PN to be connected to a given KC. Tohave more than θ connections the probability is the sumpθ = ∑n A
�θ� bn A,p. The number Nθ of KCs which havemore than θ thus is distributed with a binomial distribu-tion bnKC,pθ
. These considerations give the expectationvalues for Nθ shown in Fig. 6A.
Assuming identical synaptic strength for allsynapses, the number of excited KCs given a certaininput activity n A jumps discontinuously as a functionof the firing threshold θ . This does not allow a mean-ingful adjustment of θ to the experimentally observedactivity level in the KCs. If one assumes a small jitter inthe synaptic strength however, the picture changes dra-matically. Let the synaptic strength of the synapses begiven by (1). The sum of synaptic strengths of incom-ing PN input to any KC is then distributed accordingto
pθ = P
( n A∑i=1
cAi j > θ
)
=n A∑
k=0
bn A,p(k)(1 − �σ
√k(θ − kg)
)(23)

280 Nowotny et al.
0 1 2 3 4 5 6number of connections to active PN
1
10
1e2
1e3
1e4
1e5
number
ofKC
1
10
1e2
1e3
1e4
0 0.2 0.4 0.6 0.8 1total synaptic strength of input
1
10
1e2
1e3
1e4
1e5
numberof
KC
1
10
1e2
1e3
1e4
A
B
Figure 6. Expectation value for the number of KC with more than xinputs from active PNs (A) and a stronger total input than θ assumingsynaptic strengths of PN-KC synapses according to (1) with g = 0.16and σ = 0.02 (B).
where �σ√
k denotes the integrated Gaussian distribu-tion with mean 0 and standard deviation σ
√k. And
the number Nθ of KCs having stronger input than θ isagain a binomial distribution with nKC and pθ . Theexpectation value for Nθ is shown in Fig. 6B. Thesmooth variation of the expectation value of Nθ withvarying θ now allows us to adjust θ (or equivalently g)to a value consistent with the experimentally observedactivity levels in the MB.
Aiming for an initial activity of ≈100 spikes andchoosing the jitter of synaptic strengths to be σ =0.02 µS we can calculate the appropriate mean synapticstrength g by inverting above equation for the expecta-tion value of Nθ with the θ = 0.49 obtained from theabove consideration of the EPSPs. This yields g ≈ 0.16which has been used consistently in all simulations inthis work.
The reasoning for the time constants and strengthof the local axo-axonal connections in the KC latticeis along the following lines. The time scale needs tobe long enough and the connections need to be strongenough for a significant contribution of local connec-tions to the ongoing activity of the KC ensemble ac-cording to the mechanism described in Section 3. Onthe other hand they have to stay below the propagatingwave limit to avoid over-excitation of the system.
From the explicit solution for the EPSPs (18) onecan estimate the propagating wave threshold assum-ing a maximum of two simultaneously active neigh-bors. Choosing 40 ms and 30 ms as example time scalesthis allows synaptic strengths up to 4.7 µS and 3.5 µSrespectively. These values do not take into accountthe ongoing input from the AL however. Therefore,driven propagating waves already occur for consider-ably smaller values.
Acknowledgments
We are grateful to Gilles Laurent for many helpful dis-cussions. This work was partly supported by the U.S.Department of Energy, Office of Basic Energy Sci-ences, Division of Engineering and Geosciences, underGrants No. DE-FG03-90ER14138 and No. DE-FG03-96ER14592, by grants from the National Science Foun-dation, NSF PHY0097134 and NSF EIA0130708, bya grant from the Army Research Office, DAAD19-01-1-0026, by a grant from the Office of Naval Research,N00014-00-1-0181, and by a grant from the NationalInstitutes of Health, NIH R01 NS40110-01A2.
References
Ahissar E, Haidarliu S, Zacksenhouse M (1997) Decoding tempo-rally encoded sensory input by cortical oscillations and thalamicphase comparators. PNAS 94: 11633–11638.
Ahissar E, Sosnik R, Haidarliu S (2000) Transformation from tem-poral to rate coding in a somatosensory thalamocortical pathway.Nature 406: 302–306.
Bazhenov M, Stopfer M, Rabinovich MI, Abarbanel HDI, SejnowskiT, Laurent G (2001a) Model of cellular and network mechanismsfor odor-evoked temporal patterning in the locust antennal lobe.Neuron 30: 569–581.
Bazhenov M, Stopfer M, Rabinovich MI, Huerta R, Abarbanel HDI,Sejnowski T, Laurent G (2001b) Model of transient oscillatorysynchronization in the locust antennal lobe. Neuron 30: 553–567.
Buonomano DV, Hickmott PW, Merzenich MM (1997)Context-sensitive synaptic plasticity and temporal-to-spatialtransformations in hippocampal†slices. PNAS 94: 10403–10408.
Buonomano DV, Merzenich MM (1995) Temporal information trans-formed into a spatial code by a neural network with realistic prop-erties. Science 267: 1028–1030.
de Belle JS, Heisenberg M (1994) Associative odor learning inDrosophila abolished by chemical ablation of mushroom bodies.Science 263: 692–695.
Destexhe A, Mainen ZF, Sejnowski TJ (1998) Kinetic models ofsynaptic transmission. In: C Koch, I Segev, eds. Methods inNeuronal Modeling, 2nd ed., MIT Press, Cambridge, MA. pp. 1–26.
Decoding Temporal Information in the Olfactory System of Insects 281
Dubnau J, Grady L, Kitamoto T, Tully T (2001) Disruption of neu-rotransmission in Drosophila mushroom body blocks retrieval butnot acquisition of memory. Nature 411: 476–480.
Fortin NJ, Agster KL, Eichenbaum HB (2002) Critical role of thehippocampus in memory for sequence of events. Nature Neurosci.5: 458–462.
Hammer M, Menzel R (1998) Multiple sites of associative odor learn-ing as revealed by local brain microinjections of octopamine inhoneybees. Learn. Mem. 5: 146–156.
Heisenberg M (2003) Mushroom body memoir: From maps to mod-els. Nat. Rev. Neurosci. 4: 266–275.
Jeffres LA (1948) A place theory of sound localization. J. Comp.Physiol. Psychol. 41: 35–39.
Laurent G (1999) A systems perspective on early olfactory coding.Science 286: 723–728.
Laurent G, MacLeod K, Wehr M (1998) Spatiotemporal structureof olfactory inputs to the mushroom bodies. Learn. & Mem. 5:124–132.
Laurent G, Stopfer M, Friedrich RW, Rabinovich MI, Abarbanel HDI(2001) Odor encoding as an active, dynamical process: Experi-ments, computation, and theory. Annu. Rev. Neurosci. 24: 263–297.
Laurent G, Wehr M, Davidowitz H (1996) Temporal representationsof odors in an olfactory network. J. Neurosci. 16: 3837–3847.
Leibold C, Kempter R, van Hemmen JL (2002) How spiking neuronsgive rise to a temporal-feature map: From synaptic plasticity toaxonal selection. Phys. Rev. E 65: 051915.
Leitch B, Laurent G (1996) GABAergic synapses in the antennallobe and mushroom body of the locust olfactory system. J. Comp.Neurol. 372: 487–514.
Lu T, Liang L, Wang X (2001) Temporal and rate representationsof time-varying signals in the auditory cortex of awake primates.Nat. Neurosci. 4: 1131–1138.
Perez-Orive J, Mazor O, Turner GC, Cassenaer S, Wilson RI, LaurentG (2002) Oscillations and sparsening of odor representations inthe mushroom body. Science 297: 359–365.
Rabinovich M, Huerta R, Bazhenov M, Kozlov K, Abarbanel HDI(1998) Computer simulations of stimulus dependent state switch-ing in basic circuits of bursting neurons. Phys. Rev. E 58: 6418.
Rabinovich M, Volkovskii A, Lecanda P, Huerta R, Abarbanel HDI,Laurent G (2001) Dynamical encoding by networks of compet-
ing neuron groups: Winnerless competition. Phys. Rev. Lett. 87:068102.
Rall W (1967) Distinguishing theoretical synaptic potentials com-puted for different soma-dendritic distributions of synaptic inputs.J. Neurophys. 30: 1138–1168.
Rall W (1989) Cable theory for dendritic neurons. In: C Koch,I Segev, eds. Methods in Neuronal Modeling: From Synapses toNetworks, MIT Press, Cambridge. pp. 9–62.
Reich DS, Mechler F, Purpura KP, Victor JD (2000) Interspike inter-vals, receptive fields, and information encoding in primary visualcortex. J. Neurosci. 20: 1964–1974.
Reich DS, Mechler F, Victor JD (2001) Temporal coding of contrastin primary visual cortex: When, what, and why. J. Neurophysiol.85: 1039–1050.
Reinagel P, Reid RC (2000) Temporal coding of visual informationin the thalamus. J. Neurosci. 20: 5392–5400.
Stopfer M, Bhagavan S, Smith B, Laurent G (1997) Impaired odordiscrimination on desynchronization of odor-encoding neural as-semblies. Nature 390: 70–74.
Stopfer M, Jayaraman V, Laurent G (2003) Spatiotemporal code forodor identity and concentration. In preparation.
Strausfeld NJ, Homberg U, Kloppenburg P (2000) Parallel organiza-tion in honey bee mushroom bodies by peptidergic Kenyon cells.J. Comp. Neurol. 428: 760.
Strausfeld NJ, Li Y (1999) Representation of the calyces in the me-dial and vertical lobes of cockroach mushroom bodies. J. Comp.Neurol. 409: 626–646.
Teyke T, Gelperin A (1999) Olfactory oscillations augment odor dis-crimination not odor identification by Limax CNS. Neuro Report10: 1061–1068.
v. Rullen R, Thorpe SJ (2001) Rate coding versus temporal order cod-ing: What the retinal ganglion cells tell the visual cortex. NeuralComp. 13: 1255–1283.
Wallenstein GV, Eichenbaum H, Hasselmo ME (1998) The hip-pocampus as an associator of discontiguous events. TrendsNeurosci. 21: 317–323.
Wehr M, Laurent G (1996) Odor encoding by temporal sequences offiring in oscillating neural assemblies. Nature 384: 162–166.
Wehr M, Laurent G (1999) Relationship between afferent and centraltemporal patterns in the locust olfactory system. J. Neurosci. 19:381–390.