
Deciding with data How data-driven innovation is fuelling Australia's economic growth
68
Deciding with data How data-driven innovation is fuelling Australia’s economic growth www.digitalinnovation.pwc.com.au September 2014
-
Upload
independent -
Category
Documents
-
view
0 -
download
0
Transcript of Deciding with data How data-driven innovation is fuelling Australia's economic growth

Deciding with data How data-driven innovation is fuelling Australia’s economic growth
www.digitalinnovation.pwc.com.au
September 2014


Contents
Executive summary Value to be unlocked from data19
02 27
03 35
01
Data-driven innovation in practice
Preface Seizing the opportunity
The new economy is fuelling data creation
11 55 AppendicesEconomic value from working with data
This report has been prepared by PricewaterhouseCoopers Australia (PwC) at the request of Google Australia in our capacity as advisors in accordance with the Agreement dated 19 June 2014 between PwC and Google Australia. This report is not intended to be utilised or relied upon by any other persons other than Google Australia, nor to be used for any purpose other than that articulated above. Accordingly, PwC accepts no responsibility in any way whatsoever for the use of this report by any other persons or for any other purpose.
The information, statements, statistics and commentary (together the “Information”) contained in this report have been prepared by PwC from publicly available material and consultation with Google Australia. PwC has not sought any independent confirmation of the reliability, accuracy or completeness of this information. It should not be construed that PwC has carried out any form of audit of the information that has been relied upon. Accordingly, whilst the statements made in this report are given in good faith, PwC accepts no responsibility for any errors in the information provided by Google Australia or other parties nor the effect of any such error on our analysis, suggestions or report.
The Information must not be relied on by third parties, copied, reproduced, distributed, or used, in whole or in part, for any purpose other than detailed in our Agreement without the written permission of Google Australia and PwC. Liability is limited by a scheme approved under Professional Standards Legislation

1
Executive SummaryData-driven innovation is transforming Australia’s economy and society, and is emerging as an essential tool to improve our growth and prosperity.
Data is a collection of information which gives us the ability to make informed decisions where we may have previously relied on gut instinct alone. Data reduces the need for guesswork, increasing the chances of getting it right. Data-driven innovation is harnessing this increased ability to understand the world around us to solve problems, create efficiencies, and invent new products.
Data itself is not inherently valuable. Value is created by working with it to innovate, invent, change business processes, and enhance decision-making.
In 2013, data-driven innovation added an estimated $67 billion in new value to the Australian economy, or 4.4 percent of GDP, broadly equivalent to the retail sector’s contribution. Every sector in the economy is using data to grow – from predicting weather patterns and optimising harvesting in agriculture, to improving patient diagnosis and treatment in the health industry, to enhancing the management of remote infrastructure in mining.
However, Australia has substantial room to improve and left an estimated $48 billion on the table in potential value from data-driven innovation in 2013.
Seizing this opportunity will require concerted action. The sheer size of government, representing around one third of Australia’s economy across all levels, makes it a pivotal player. It has a significant opportunity to improve its own services, like education and training, and administration and support, which have substantial room for improvement in innovating with data. Government should prioritise the provision of open data as a key input for the Australian economy and provide senior political leadership to ‘get on with it’ in order to support wider innovation by other players.
The private sector in every industry must also make a determined effort to work intelligently with data. The opportunities are not exclusively for the big end of town. Small businesses can utilise ‘little data’; combining knowledge of their business and market trends to gain insights about customers and business processes.
The health industry offers the biggest opportunity for Australia to boost data-driven innovation, according to PwC’s new Data Innovation Index. The sector is growing in size, is globally competitive, and has the assets, such as data and talent, to win. Today, health is just a middle-of-the-pack performer in Australia. The MindSpot Clinic is an example of the potential – it is a free online mental health clinic that has proven clinical success in using data to diagnose and treat patients. This type of innovation puts Australia in a strong position to export what we invent.
As growth in export revenue from the resources boom slows, Australia will need to achieve higher productivity in sectors like health in order to maintain and improve living standards. Increasing the uptake of data-driven innovation by business and public sector organisations will enable them to do things better, boosting productivity.
This will require us to achieve a balance between using data for the benefit of society while ensuring that it is managed carefully and respectfully. We will need to give data-driven innovators a social licence to operate in order to maximise the economic and societal value of data.
We have the data – and it tells us we need to act.

Preface
Opinions about the collection and use of data range from caution to enthusiasm. What is increasingly undeniable is the profound impact of data on our understanding of how the world works. It is fair to say that the use of data has positively changed the life of every Australian; from improving the quality of the products we consume to the health care we receive.
The power of computing and the internet have given us unprecedented abilities to analyse data, enabling us to work smarter by better understanding the chance of success in everything we do. Data-driven innovation has shifted society from a twentieth century mindset thinking about ‘how’ things work based on assumptions, to a twenty-first century mindset thinking about ‘why’ things work based on actual observations. It enables businesses and governments to make informed, fact-based decisions about the complex world around us, create new products, reduce waste, and plan intelligently for the future.
We, as individuals, also apply data-driven innovation in our daily lives to make better decisions, such as what to buy based on performance reviews, when to leave the house for the train based on whether it is on time, or managing personal finances based on an analysis of spending habits.
Like all change, these trends warrant consideration. This report contributes to our understanding of the role of data in the Australian economy and society by examining the value that innovating with it creates, and how we can unlock further value.
Deciding with data 2

The new economy is fuelling data creation
3

Deciding with data 4
My data – Internal data about a particular organisation or individual, this type of data is typically held securely with strict rules regarding access; for example, a hospital holding an individual’s health records for their health care professionals, which would also allow them to diagnose the patient on the basis of other aggregate data on medical conditions.
Internal enterprise data – Data that is collected by an organisation about its own systems and processes. This data may not be digital, can consist of both quantitative and qualitative information, and can also be anonymised; for example, a bank using anonymised customer transaction records to predict and proactively refill its ATMs.
Open data – A key source of data from governments and private institutions. ‘Open’ relates to how accessible a data set is in terms of allowing others to use it without restriction. An example of this is Australian Bureau of Statistics data on the size of the economy and productivity, which can be used to support analysis such as this report.
Little data – Small businesses can also make use of data analytics across data that they have about their own business; similar to big data, but on a smaller scale.
All data – Covers all types of data. It also includes unstructured data from outside the immediate control of an organisation or individual, such as traffic data, or social data.
Data is a collection of information which gives us the ability to make informed decisions where we may have previously relied on gut instinct alone. The broad categories of data are:
All data
Big data
My data
Little data
Defining data
Data driven innovation... is the value from using any kind of data to innovate.
Big Data – Data sets that are voluminous, diverse, and sometimes real time. ‘Big’ relates to how complex and large a data set is in terms of its physical size and the different subjects it covers. For example, a mining company may generate gigabytes of data each day across its plants, machines and operations.
Internal enterprise
data
Source: Image adapted from McKinsey Global Institute (2013), Open data: unlocking innovation and performance with liquid information, October 2013
Open data
Open government
data

5 The new economy is fuelling data creation
The internet, and information and communications technology more broadly, are fundamental enablers of the modern economy.
The spin-off benefit of this digitisation is data. The connected nature of our economy is producing a vast amount of data that helps us better understand how it works.
During 2002, humans created five billion gigabytes of data – we now create that same amount every two days1. It’s estimated there are 4.4 zettabytes of data in existence, almost as many stars in the visible universe.2
Enterprises generate around one-third of this data internally, and are responsible for around 85 percent of the remaining two-thirds of data, generated via consumers interacting with their services. Every data point is potentially valuable, from the publicly available data on the internet’s 60 trillion individual pages such as consumer reviews, to internal data such as e-health records, smart cards and financial transactions.3
2005
15
12
9
6
3
Zet
tab
ytes
(ZB
)
13ZB(+40% Y/Y)
Growth
>4ZB(+50% Y/Y)
Growth
2006 2007 2008 2009 2010 2011 2012 2013 2014 2015 2016
2013 TOTAL
ZETTABYTES
4.4
GENERATED BY
ENTERPRISESTOUCHED BY ENTERPRISES
2.9
1.5
ZB
ZBSource:IDC.2014
2.3
0.6 ZB (15%)
ZB (85%)
GENERATED BY
C O N S U M E R S
NOT TOUCHED BY
ENTERPRISES
Accelerated rate of change: Data growth over the years
The Commonwealth Bank has used cloud computing to increase operating efficiencies – the cost of storage, app testing and development has fallen from 75% of IT spending to 26%.
A zettabyte (ZB) is one billion terabytes, as big as 90 billion high definition movies(Based on the average size of a high defi-nition movie being around 12 gigabytes)
Source: Kleiner Perkins Caufield Byers (2014), Internet trends 2014 presentation, 28 May 2014 and IDC (2014), The digital universe of opportunities: rich data and the increasing value of the Internet of Things, April 2014

Deciding with data 6
Every day 720,000 new websites are created and in Australia alone there are 15.4 million transactions.7
More than 50 billion devices have smart sensors, turning what were once chunks of metal and plastic into data-generating nodes. They allow manufacturers to accurately track the performance of their products and make repairs before anything breaks down.
These sensors are a huge part of the next generation of data – it is estimated that data from these devices will grow to represent 10 percent of all data by 2020, up from just two percent in 2013.8 The ‘internet of things’, objects connected to the internet via sensors, such as consumer products or city infrastructure like buildings or buses, will expand to over 100 billion objects by 2020.9
With investment in collection and storage comes an equivalent investment in security. Almost $50 billion has been invested globally in ensuring the security of data such as corporate financial information, user account information and health records.10
Advancements in computing are enabling the data age The sheer volume of data that exists in the new economy is enabled by exponential improvements in our ability to collect, store and analyse it. In the last half century, the cost of digital storage has halved every two years, while storage density has increased 50-million fold. Our ability to process data has doubled every 1.5 years.4 It only takes us one day to decode human DNA and costs $1,000 – five years ago it took one year and $100,000.5
Significant advances in technology have enabled us to draw new and meaningful insights.
Cloud computing has vastly increased access to top-tier computing resources by allowing people to use the internet as a platform to access facilities with large scale data storage and processing power. It has contributed to innovations such as personalised medical care, real-time coordinated disaster responses and personal financial reporting. Around 20 percent of the data in the digital universe is located in the cloud. That number will jump to 40 percent by 2020.6

7 The new economy is fuelling data creation
Data-driven goods and servicesData can be used to help businesses create new products and services that respond to customer needs faster than ever before. For instance, data has allowed the finance industry to invent new business models. Real-time location based services are a subset of data-driven products. These combine real-time GPS data with other information to reduce cost and waste.
SocietyOne uses data to more accurately price credit risk and offer loans to underserved markets.
Transport for NSW uses real time GPS location data to help commuters know whether a train or bus is running on time, accessed via mobile apps created by some of Australia’s most talented developers.
http://bit.ly/PwCApp
The challenge is working more intelligently with this data to create valueThis report is focused on using data to innovate, that is, to create new or significantly improved goods, services, processes, marketing methods, or organisational methods.11
There are four main types of data-driven innovation:

Deciding with data 8
Data-driven planningData can be used to make robust decisions on the basis of facts, trends and patterns rather than the more variable tools of management expertise or ‘gut feel’. This often involves extracting patterns from large, disparate and anonymised datasets. It allows organisations to uncover new lucrative opportunities, minimise risk, or unearth trends that would otherwise remain hidden.
Data-driven marketingData can be used by businesses to identify new customers, or increase satisfaction and spend. They can identify consumer segments who share common characteristics and may be underserved by the market or provide useful product recommendations to their existing customers based on their needs and interests.
Data-driven operationsBusinesses can radically improve cost efficiencies and market agility through the data they capture about their processes and products. The growth in the use of sensors will help businesses see inside their organisations with greater clarity, tracking everything from one end of the supply chain to the other.
Queensland Health uses clinical dashboards which show real-time data on hospital utilisation and comparisons with State benchmarks to improve coordination of care.
Amazon has built a recommendation engine from their own sales data to help customers quickly find new things which interest them. Amazon also allows customers to rate its recommendations – helping to improve the relevance and convenience of shopping for their customers over time. Woolworths and Coles draw on data from their respective loyalty cards to reward their customers with fuel discounts and special offers.12
Tip Top Bakeries uses data to spot issues and optimise delivery routes in real time to reduce supply chain costs.
Sense-T integrates real time data on crops, livestock, water, weather, farm equipment and more to help farmers optimise crop harvesting, governments improve water catchment management, and consumers track exactly where food has been sourced from.
Sydney Local Health District brings together large amounts of data across public hospitals and health care facilities in the Sydney metropolitan region to benchmark and optimise levels of care.

9 The new economy is fuelling data creation
Data-driven innovation could reinvigorate Australia’s productivity Australia has enjoyed strong economic growth over the past two decades. Propelled by productivity growth, the 1990s was an outstanding decade for the Australian economy.13 Productivity growth slowed during the 2000s but was compensated by favourable terms of trade from resource production and high commodity prices. But the resources boom will eventually run its course, and productivity improvements will be necessary to maintain our prosperity and living standards.
Data-driven innovation could contribute significantly to Australia’s national productivity challenge.
• Innovation almost doubles the likelihood of productivity growth in Australian businesses.14
• Companies in the top third of their industry in the use of data-driven decision making are, on average, five percent more productive and six percent more profitable than their competitors.15
Now, more so than ever before, businesses have the ability to harness data to make decisions based on real-world behaviour rather than random sampling. New data-driven goods or services and supply chain innovations can be a source of major competitive advantage.
For the public sector, which makes up one third of our economy, the innovative use of data can profoundly change how policy is formed and services are delivered. Data-driven innovation across both the public and private sectors could help to improve the efficiency and effectiveness of planning and delivery of public services – even changing how they are perceived and built.
The abundance and innovative use of data is delivering power to the people as well. Data-based innovation provides consumers with new and improved goods and services at lower prices – from the ability to scan barcodes to check for better deals, to checking the real-time location of a bus to save time, to being the beneficiary of improved government services and offerings from business.
Figure 1: Contribution to income growth – the importance of productivity
Other
Per
cent
age
poin
ts c
ontr
ibut
ion
to G
ross
Nat
iona
l In
com
e. A
nnua
l ave
rage
3
2
1
0
– 1
Source: Treasury calculations based on ABS catalogue Numbers 5204.0. 6202.0 and unpublished ABS data. Note: Other includes labour utilisation and foreign income flows.
1990s 2014+
Other
Productivity Other
Mining
(terms of trade)
Productivity
2000 – 2013
?

Little data: Data-driven innovation without breaking the bankThere is a great deal of focus around the potential of big data; data-driven innovation from analysing masses of interrelated data. However, more than 95 percent of businesses in Australia can be characterised as small businesses, contributing over one-third of economic output.16 Many of them work in relatively sparse data environments without access to the information and resources required for advanced data analytics.
‘Little data’ techniques can give small businesses insights into their customers and their business – driving innovation without expensive data acquisition, hardware, software, or technology infrastructure. For example, small businesses will have access to their own store transactions and can also tap into open data such as weather forecasts and traffic patterns, which are readily available on the internet. A local ice cream store may learn there is a cold front coming next week and adjust staffing accordingly, or even better, run a promotion during those cold days. They can access the necessary analytical resources by using simple cloud computing tools.
Large companies are also using ‘little data’ to drive innovation. Information collected by service technicians at the Chinese appliance giant Haier helped to identify that rural customers were using their washing machines to wash vegetables, leading to clogs. Haier used this information to develop a new type of washer, which the company says is “mainly for washing clothes, sweet potatoes, and peanuts”.17
Deciding with data 10

11
Economic value from working with data

Deciding with data 12
$146bn $122bn
$115bn $97bn$12bn
$67bn
$100bn
$69bn
$39bn
$38bn
$41bn
$32bn
$69bn
$26bn
MiningFinancial & Insurance Services
Construction
$104bnManufacturing
Professional, Scientific & Technical Services
Health Care & Social
Assistance
$79bnPublic
Administration & Safety
$73bnTransport, Postal &
Warehousing
Edu
catio
n &
Tr
aini
ng
Data-driven Innovation
$65bnWholesale
Trade
$45bnAdministrative &
Support Services
Media & TelecommunicationsRental & Real Estate
Electricity, Gas, Water & Waste
Agriculture
Other Services
Arts
Retail Trade
$35bnAccommodation & Food Services
Data-driven innovation was worth
$67billion to the Australian economy in 2013.

13 Economic value from working with data
Data is the new economic input of today’s organisations. Data-driven innovation added an estimated $67 billion in new value to the Australian economy, or 4.4 percent of GDP, broadly equivalent to the retail sector’s contribution.Every sector in the economy is using data to innovate and create value – from predicting weather patterns and optimising harvesting in agriculture, to improving patient diagnosis and treatment in the health industry, to enhancing the management of remote infrastructure in mining. Data-driven innovation adds significant new value to the Australian economy by increasing production with the same or fewer resources across numerous industries – meaning an increase in productivity.
The benefits of data-driven innovation are often difficult to measure. In some cases, it may transfer consumption from one good or service to another, or from one business to another,
thereby simply redistributing value rather than creating it.
In other cases, it can grow the size of the Australian economy by attracting new consumption and using existing assets more efficiently.
The question that must be answered is how much ‘new’ or ‘additional’ value does data-driven innovation create?
PwC estimates the net contribution of data-driven innovation to Australia’s economy was $67 billion in 2013 or 4.4 percent of GDP.18 That is, without any data-driven innovation, Australia’s GDP in 2013 would be reduced by $67 billion.
Modelling method This report applies PwC’s Geospatial Economic Model, which allows economic activity to be assessed at a granular level. The model divides all of Australia into 2,214 locations, each with a population of around 10,000 people.19 For each location, it then combines multiple data layers from 2001 to 2013, with forecasts to 2020.67 For each location, the data-driven innovation analysis applied:
1. The economic output, calculated in a way that is consistent and reconcilable with the income approach of measuring GDP and Gross State Product (GSP) by the Australian Bureau of Statistics (ABS).20
2. The number of employees and businesses in each industry and by business size, overlaid on economic output to identify labour productivity.21
3. The level of innovation activity, derived by overlaying results of the ABS survey of innovation on the number of businesses based on its industry and size.22
This layering approach allowed the efficient and holistic identification of the relationship between economic output, businesses, and the level of innovation at a granular level for each location. It gives a deeper level of insight than merely assessing economic activity at the industry or state level.
NOTE: This correlation does not necessarily imply direct causation and it is not expected that innovation activity will explain labour productivity growth in all regions – but innovation was a statistically significant factor in all calculations. At one percent statistical significance, meaning that if innovation was not related to productivity, the chances of achieving the same change in productivity growth as a result of a one percentage point change in innovation activity are one percent. There are many other factors, which are likely to influence productivity. A detailed discussion of the methodology is contained in the Appendix.

Deciding with data 14
The genesis of data-driven innovation
Relationship between innovation and
activity
The analysis assessed the relationship between growth in labour productivity (real economic output per worker) and innovation activity for 1,616 locations in urban Australia between 2012 and 2013. 598 non-urban areas were excluded from analysis due to the relatively small number of businesses in those locations. The urban locations generate more than 80 percent of Australia’s economic output from one percent of its land mass.
The analysis shows that if there were no innovating businesses in the last financial year, labour productivity growth on average would be lower by 6.3 percent. Furthermore, every one percentage point increase in the total proportion of businesses that innovate relates to a 0.17 percentage point increase in labour productivity growth.
+
= 36.6%
Australian businesses...
that introduced an innovation
in 2013
Major innovations, such as changes in operational processes, organisational and managerial processes, and marketing methods, are corroborated with data. Based on this assumption, a minimum of 20.2 percent of Australian businesses introduced data-driven innovations in 2013. The ratio of this figure (20.2 percent) to the proportion of all businesses that introduced innovations (36.6 percent) is applied to the $87 billion upper bound estimate to calculate the lower bound estimate of the value of data-driven innovation of $48 billion.
$67 billion
This report adopts a midpoint estimate of $67 billion, which is the average of the upper bound and lower bound estimates. In 2013, around 36.6 percent
of all Australian businesses introduced an innovation, that is, a new or significantly improved good or service; operational process; organisational and managerial processes; or marketing method. If all innovations are dreamt up, or at least corroborated, on the basis of data, the upper bound estimate of the value of data-driven innovation is $87 billion.
Not all goods and services are necessarily based on data. The assumption is that certain types of major innovations, such as changes in operational processes, organisational and managerial processes, and
marketing methods, are corroborated with data and not undertaken blindly without it.
$48 billion $87 billion
–
6.3%=
are data-driven
The assumption
operational processes
marketing methods
organisational and managerial
processes
Innovations in:
If Australian businesses...
did not innovate...
productivity growth
15 Economic value from working with data
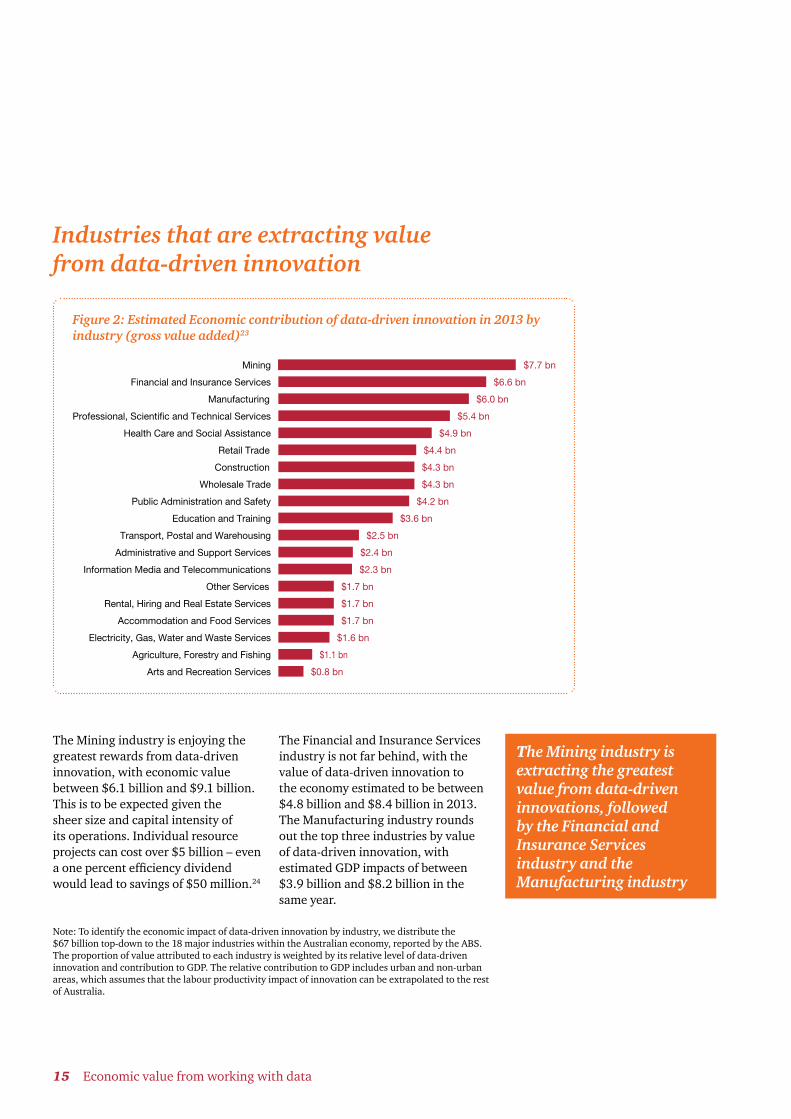
Figure 2: Estimated Economic contribution of data-driven innovation in 2013 by industry (gross value added)23
Mining $7.7 bn
Financial and Insurance Services $6.6 bn
Manufacturing $6.0 bn
Retail Trade $4.4 bn
Construction $4.3 bn
Wholesale Trade $4.3 bn
Public Administration and Safety $4.2 bn
Education and Training $3.6 bn
Transport, Postal and Warehousing $2.5 bn
Administrative and Support Services $2.4 bn
Information Media and Telecommunications $2.3 bn
Other Services $1.7 bn
Rental, Hiring and Real Estate Services $1.7 bn
Accommodation and Food Services $1.7 bn
Electricity, Gas, Water and Waste Services $1.6 bn
Agriculture, Forestry and Fishing $1.1 bn
Arts and Recreation Services $0.8 bn
Professional, Scientific and Technical Services $5.4 bn
Health Care and Social Assistance $4.9 bn
The Mining industry is enjoying the greatest rewards from data-driven innovation, with economic value between $6.1 billion and $9.1 billion. This is to be expected given the sheer size and capital intensity of its operations. Individual resource projects can cost over $5 billion – even a one percent efficiency dividend would lead to savings of $50 million.24
The Financial and Insurance Services industry is not far behind, with the value of data-driven innovation to the economy estimated to be between $4.8 billion and $8.4 billion in 2013. The Manufacturing industry rounds out the top three industries by value of data-driven innovation, with estimated GDP impacts of between $3.9 billion and $8.2 billion in the same year.
Note: To identify the economic impact of data-driven innovation by industry, we distribute the $67 billion top-down to the 18 major industries within the Australian economy, reported by the ABS. The proportion of value attributed to each industry is weighted by its relative level of data-driven innovation and contribution to GDP. The relative contribution to GDP includes urban and non-urban areas, which assumes that the labour productivity impact of innovation can be extrapolated to the rest of Australia.
The Mining industry is extracting the greatest value from data-driven innovations, followed by the Financial and Insurance Services industry and the Manufacturing industry
Industries that are extracting value from data-driven innovation

Deciding with data 16
Governments are innovating with data tooThe public sector is reaping the rewards of data-driven innovation as well, with a significant share of the $12.6 billion in combined value of data-driven innovation across the areas of Public Administration and Safety, Education and Training, and Health Care and Social Assistance.
7.0%
6.5%
6.0%
5.5%
5.0%
4.5%
4.0%
3.5%
3.0%0 1 2 3 4 5
Economic value of data-driven innovation ($ billions)
Size of bubble represents economic output in 2013
Val
ue o
f dat
a-d
riven
inno
vatio
n as
% o
f eco
nom
ic o
utp
ut in
ind
ustr
y
6 7 8 9
Other Services
Arts and Recreation Services
Wholesale Trade
Retail Trade
Agriculture, Forestry and Fishing
Transport, Postal and Warehousing
Electricity, Gas, Water and Waste Services
Rental, Hiring and Real Estate Services
Accommodation and Food Services
Administrative and Sup-port Services
Information Media and Tele-communications
Public Administration and Safety
Professional, Scientific and Technical Services
Health Care and Social Assistance
Education and Training
Manufacturing
Financial and Insurance Ser-vices
Mining
Construction
Figure 3: Economic contribution of industry to economic output vs economic value of data-driven innovation in each industry, 2013

17 Economic value from working with data
Value created by the application of data for governmentThere are significant opportunities to further improve government services with the use of data.
Industry
Data-driven innovation as a percentage of industry value add
Activities governments are doing, or could do better, with data
Health care and social assistance
5.0%
• Developing better health care by using data from millions of patients around the world to discover more efficient and appropriate treatments
• Matching patients to the most appropriate facility and clinician based on data from previous outcomes
• Reducing the costs of care by providing consumers with more information about total costs and helping health providers gain efficiencies in service provision.25
Public administration
and safety
5.3%
• Reducing costs of providing existing services (that is, doing the same at lower cost) by using data to find efficiencies or optimise current services
• Enabling new and improved services that is doing more at the same cost by using data to understand the community and service demand
• Indirectly contributing to improvements in public service delivery when data improves accountability and engenders trust in government.26
Education and training
5.3%
• Allocating Government funding for education more efficiently by being able to plan for future demand and improve utilisation
• Improving instruction by allowing teachers to design and tailor lessons suited to students’ individual skills and learning styles
• Matching students to the school or program most suited for them by analysing publicly available data on school performance and opportunities.27
Helping patients to move efficiently through hospitals and then back into the community is imperative for the health system, which is facing increasing demand.
Queensland Health embarked on a statewide Clinical Services Redesign Program using a data-driven approach to engage and empower their staff to improve services. An example initiative involved consolidating multiple data sources to: display the patient’s hospital journey on an Electronic Patient Journey Board; facilitate daily clinical decision-making by visualising performance against benchmarks on a Clinical Dashboard; and test new models of service in a hospital simulation.
Fire and Rescue NSW (FRNSW) are responsible for the emergency response and protection of the NSW population. In 2013, FRNSW responded to over 130,000 incidents – an average of one emergency incident every four minutes.
FRNSW is developing a world-first predictive system that uses environmental, geographic and operational data to gauge the risk of disasters, such as flood and fire, to every property in the state. This will enable FRNSW to deploy its resources more proactively before emergency situations to minimise life and property loss.

The NSW Department of Education and Communities has developed the Personalised Learning and Support Signposting Tool to tailor education to meet the unique needs of individuals with learning disabilities. Based on 25,000 student records created during the 2013 trial of the tool, the Department now has a detailed understanding of the common and uncommon patterns of educational needs present in the student population. Each teacher receives a report for each individual student, placing them on six different ‘spectrums’ of educational need, with a detailed discussion of the ways in which each student’s needs vary from similar students in the population.
Spillover benefits from data-driven innovationThe benefits of data-driven innovation are rarely fully appropriated by the innovator themselves.
The full social and economic benefits delivered by data-driven innovation are not reflected in economic output alone. Considerable value is realised by consumers through lower prices, higher quality goods and a better matching of products to their needs. Consumers will also enjoy higher earnings and lower health care costs respectively from improvements in education and health services.
Businesses benefit from increased revenues from data-driven innovation by catering to new and niche markets, or gaining a greater share of existing markets. They also enjoy cost efficiencies in marketing, operations, distribution and product development.
The public sector can use insights from data to decrease the costs of service design, planning and delivery. The US and UK, both use a service which publishes and benchmarks contract, procurement and expenditure data from public sector organisations to help governments identify opportunities for collaborative procurement and asset re-use. The Washington Department of Transport in the US saved $32 million over two years through cross agency collaboration enabled by this open data.28
The community as a whole benefits from knowledge spillovers (which occur as data-driven innovators exchange ideas), learn from other examples or build on other’s innovations, and innovations which address major social challenges. There are also environmental benefits, for example, data can be used to optimise freight networks and reduce the number of truck kilometres travelled.
Deciding with data 18

19
Value to be unlocked from data

Deciding with data 20
Australia could be missing out on $48 billion each year
$67bn Value today
$48bn More value tomorrow

Data itself is not inherently valuable. Value is created by working more intelligently with it to innovate, invent, change business processes, and enhance decision-making.
While the economic contribution of data-driven innovation is significant today, its potential extends beyond what has been accomplished so far.
In this respect, Australia has substantial room to improve - we left $48 billion on the table in potential value from data-driven innovation in 2013.
Australia still lags behind its OECD counterparts in indicators of data-driven innovation such as:
• The proportion of businesses with innovation activity (ranked 23rd out of 33 countries)
• Research and development expenditure in information industries (ranked 23rd out of 27 countries)
• Enterprises with broadband connections (ranked 7th out of 28 countries), and
• Internet connection speed (ranked 29th out of 34 countries).29
In 2013, around 36.6 percent of Australian businesses introduced a new innovation and 42.2 percent of businesses had innovative activity (‘innovation-active businesses’).30
If the proportion of ‘innovation-active businesses’ increased from 42.2 percent to 63.5 percent, the level experienced in Canada, and that innovation activity is driven by data, this could add a further $48 billion to the economy – bringing the impact of data-driven innovation on GDP to $115 billion each year.31
Canada serves as a good basis for comparison because of its similarity to Australia, including: geographic size, population, density, federal system, levels of GDP per capita in purchasing power parity terms, and its recent resources boom.
21 Value to be unlocked from data

Deciding with data 22
The health industry is poised for the greatest gains according to PwC’s Data Innovation IndexMining, Financial and Insurance Services, and Manufacturing industries are currently enjoying the greatest benefits of data-driven innovation. Even though these industries have already embraced data as a way of business, there is plenty more potential.
PwC’s Data Innovation Index provides a relative sense of the industries that are poised for great gains, and those which may face bigger barriers in capturing data-driven innovation opportunities.
The Index highlights the Health Care and Social Assistance industry as having the greatest potential to derive value from data-driven innovation. With greater adoption of electronic health records, data could further transform health care by:
Opportunities to transform health care
• Identifying patients that are most likely to benefit from interventions and the most appropriate care plan (half of a hospital’s resources are used to support only five percent of patients)
• Using predictive algorithms to foresee potential re-admissions and enable more precise interventions and care coordination after discharge
• Integrating triage algorithms into the clinical workflow to help manage rostering, patient transfers, and beds
• Evaluating multiple data streams from patient monitors to predict whether a patient’s condition is likely to worsen to prevent incidents
• Integrating data across clinical networks to help manage patients with chronic conditions that span more than one organ system.32
Note: These measures are indicative at an industry level only. Individual organisations within industries will differ in their performance against these criteria.
Size of bubble represents economic output in 2013
Figure 4. PwC’s Data Innovation Index
Manufacturing
Administrative and Support Services
Arts and Recreation Services
Public Administration
and Safety
Information Media and Telecommunications
Health Care and Social Assistance
Mining
Transport, Postal and Warehousing
Professional, Scientific and
Technical Services
Accommodation and Food Services
Electricity, Gas, Water and Waste Services
Wholesale Trade
Retail Trade
Financial and Insurance Services
Construction
Rental, Hiring and Real Estate Services
Education and Training
Agriculture, Forestry and Fishing
Other Services
Value Creation IndexLow HighLow
Hig
hV
alue
Cap
ture
Ind
ex
PwC’s Data Innovation Index was created by mapping the 18 major industries in Australia by their potential gains from innovating with data (Value Creation Index) and their ability to capture that potential (Value Capture Index).

The greatest value creation opportunities are in health, agriculture, and mining PwC’s Value Creation Index was created by assessing the potential gains from innovating with data for each of Australia’s major industries. It is based on three dimensions:
Expected growth path of the industry
This measure considers the forecast growth path of each industry to 2050.33 The expected growth path was assessed using a five point scale where one is minimal to no growth forecasted, three is growth forecast in line with the Australian economy and five is growth faster than the Australian economy.
Competitive advantage of the industry
This measure considers each industry’s competitive advantage compared to global economies. Digital disruption has enabled businesses to operate across geographic borders and increase potential addressable markets. Competitive advantage is based on research on the baseline competitiveness of Australian industry sectors from the Business Council of Australia report Building Australia’s Comparative Advantages.34
Relative size of the industry
This measure considers the relative size of the industry in terms of its contribution to Australia’s GDP. Even incremental innovations in large industries such as mining and construction could create billions of dollars in economic value.35
23 Value to be unlocked from data

Deciding with data 24
Table 2. PwC’s Value Creation Index of Australian industries
Industry
Industry growth forecast
Global Competitive-ness
Relative size of industry
Value Creation Index
Health Care and Social Assistance 5 4 4 13
Agriculture, Forestry and Fishing 5 5 1 11
Education and Training 3 5 3 11
Mining 1 4 5 10
Financial and Insurance Services 1 4 5 10
Public Administration and Safety 2 3 4 9
Information Media and Telecommunications 4 2 2 8
Rental, Hiring and Real Estate Services 5 1 2 8
Transport, Postal and Warehousing 2 2 4 8
Professional, Scientific and Technical Services 3 1 4 8
Manufacturing 1 2 5 8
Arts and Recreation Services 4 3 1 8
Wholesale Trade 2 2 3 7
Construction 1 1 5 7
Accommodation and Food Services 5 1 1 7
Administrative and Support Services 4 1 2 7
Electricity, Gas, Water and Waste Services 3 1 2 6
Retail Trade 1 2 3 6
Other Services 3 1 1 5
The Health Care and Social Assistance industry currently has low levels of data-driven innovation. Yet the Value Creation Index indicates that it is considerably ahead of other industries in its potential to create significant value for the Australian economy due to its high forecast growth, global competitiveness and sheer size. For example, Australia has an opportunity to lead the world in delivering virtual mental health services.
Australia is a leading exporter of resources and agricultural products, where it enjoys significant natural advantages.36 Pursuing data-driven innovation in these industries could lead to Australia realising substantial economic inflows from all parts of the world. While the economic contribution of agriculture to the Australian economy is small today, pressures on global food production and proximity to the rapidly growing economies of China and India mean this industry will be one of the fastest growing in Australia over the next few decades.37
Industries were rated on a five point scale in each dimension where one is the lowest and five is the highest. Industries were ranked by their Value Creation Index score.
The MindSpot Clinic is an innovative online mental health service that relies on data to assess and treat Australians with anxiety and depression. Since its launch in December 2012, MindSpot has helped almost 20,000 Australians, making it one of the largest mental health clinics in the world.
Innovations such as Sense–T, an agricultural sensor network that integrates real time data on crops, livestock, water, weather, farm equipment and more, help farmers improve their harvesting decisions and could underpin Australia’s ability to meet global food demand.

25 Value to be unlocked from data
Health, mining, and retail are best equipped to capture valuePwC’s Value Capture Index was created by assessing how easily each of Australia’s major industries could capture latent value from data-driven innovation. It is based on four dimensions:
Innovative and learning culture
Industries where the culture is more conducive to innovation and learning have a greater propensity to understand and capture the potential from data-driven insights. ABS survey results on the proportion of businesses in the industry involved in collaborative arrangements with other businesses or organisations are used as a proxy for innovative and learning culture.38 Some of the most innovative data-driven products are created through collaborations across the public and private sectors.
Technological adeptness
The ability to use technology is crucial to being able to analyse and make sense of data. ABS survey results on the industry’s access to knowledge or technology to enable development, introduction and implementation of innovation are used as a proxy for technological adeptness.39
Access to skilled persons
Human talent is needed to analyse and extract insights from data. ABS survey results on the industry’s access to engineering, scientific and research, and IT skills as a proxy of the capability to innovate with data.40
Volume of stored data
The growth of data has been observed in every industry, though some industries have greater volumes of data than others from which to derive value. While small businesses have potential to benefit from data-driven innovation, businesses and governments in industries with high data intensity have even greater potential in the near term. Storage volume for industries was derived by analysing data from the IDC, ABS and McKinsey Global Institute.
A large volume of data is generated as a patient experiences care through the health system. This data is generated across a number of different systems – some of which are now outdated.
Sydney Local Health District has pioneered the development of the Targeted Activity and Reporting System, a new performance reporting tool. With a focus on patient-centred care, the system has enabled greater flexibility in performance reporting, tailored to clinician’s needs. This user friendly, real-time active management tool has allowed for better financial, operational and clinical decision-making.

Deciding with data 26
Table 3: PwC’s Value Capture Index of Australian industries
Industry
Innovative and learning culture
Technolog-ical adeptness
Access to skilled persons
Volume of stored data
Value Capture Index
Health Care and Social Assistance 1 5 5 4 15
Mining 5 5 1 4 15
Retail Trade 4 1 5 5 15
Transport, Postal and Warehousing 1 4 4 5 14
Wholesale Trade 4 4 2 4 14
Arts and Recreation Services 5 2 3 1 13
Electricity, Gas, Water and Waste Services 2 5 1 3 13
Professional, Scientific and Technical Services 5 4 1 3 13
Information Media and Telecommunications 5 3 3 4 13
Public Administration and Safety 4 4 5 2 13
Accommodation and Food Services 1 5 2 1 12
Manufacturing 3 2 2 5 12
Administrative and Support Services 3 3 1 3 11
Financial and Insurance Services 4 1 1 5 11
Construction 1 3 4 2 10
Education and Training 3 2 2 2 9
Other Services 2 2 4 1 9
Rental, Hiring and Real Estate Services 3 1 3 1 8
Agriculture, Forestry and Fishing 2 1 3 2 8
It is clear that health is an area where data-driven value could be extracted due to the high levels of technological adeptness, access to skills required to drive insight from data, and volume of stored data in existence. Improvement in its innovation and learning culture could help the industry to better capture the potential of data.
Similarly, the mining industry has prime conditions for capturing value from data but its main challenge is access to skilled persons. The retail industry ranks third by its relative ease of value capture due to the large volume of stored data, innovation and learning culture and access to skilled persons.
Industries were rated on a five point scale in each dimension where one is the lowest and five is the highest. Industries were ranked by their Value Capture Index score.
For multinational mining organisations, managing the safety, health and wellbeing of workers, monitoring environmental performance and maintaining production efficiency of multiple sites around the globe are problems that must be monitored on an ongoing basis.
Rio Tinto’s real-time analysis of big data generated by plants, equipment and automated technologies at its Processing Excellence Centre in Brisbane generated $80 million in identified additional cash flow within the first six months of operations.
The Excellence Centre receives data on average 100 milliseconds after it is produced at the mine site amounting to gigabytes of data each day. The data is run through different analytical systems to spot anomalies and identify immediate process improvements.

27
Seizing the opportunity

Deciding with data 28
Data-driven innovation can be a sustainable source of economic growth in Australia – but capturing its full potential will require a concentrated effort from governments, businesses and individuals.
Accelerate the provision of ‘open data’ as an important economic input
Increase access to data by adopting a flexible digital architecture
Enhance Australia’s skill base with more people who can derive insights from data
Agree on a social licence to use data to maximise economic and societal value

29 Seizing the opportunity
‘Open data’ refers to government and private sector data that is accessible by all, machine readable, free and with minimal limitations on its use and reuse (see Figure 5). The case for open data has been well represented in discussions of citizens’ democratic rights to ensure accountability and transparency. But it is becoming increasingly clear that open data is a major source of innovation and economic growth, and should be considered separately through the lens of microeconomic reform.
Figure 5. Examining how data is open or closed
More accessible
Degree of access
Everyone has access Access to data is limited to a subset of individuals or organizations
Machine readability
Available in formats that can be easily retrieved and processed by computers
Data in formats not easily retrieved and processed by computers
Cost No cost to obtain Offered only at a significant fee
Rights Unlimited right to rescue and redistribute data
Re-use, republishing, or distribution of data is forbidden
Source: McKinsey Global Institute (2013), Open data: unlocking innovation and performance with liquid information, October 2013
Completely open
Completely closed
Accelerate the provision of ‘open data’ as an important economic input
Prioritise ‘open data’ as economic development
Government data has the potential to enable innovation in service delivery models across a number of industry sectors for example, data relating to spatial characteristics of Australia’s geography. This type of government-held data requires a different decision framework when considering whether it should be released. The potential economic value derived from this data should be a key element of this framework.
A 2013 McKinsey Global Institute report estimated open data could add over $3 trillion in total value to education, transportation, consumer products, consumer finance, oil and gas and healthcare, worldwide. A 2014 report found the potential value of open data to Australia in these verticals could be worth $16 billion in value add to the economy based on extrapolating McKinsey Global Institute’s methodology for Australia.41
1 2 Strong political leadership to ‘get on with it’
Australian open data policy settings are clear and explicit. But progress has been slow with a lower volume of open data when compared with the UK and US. In the US, President Obama appointed a ‘White House data evangelist’ whose role is to increase public access to open data. This strategy could be co-opted in Australia. A further step would be to introduce performance indicators, and encourage public access to make analysing and improving the quality of data more efficient.
Australia needs a strong leadership position from senior politicians to direct a change in this approach. Defaulting to open data is a significant change to business as usual for the public service and uptake is likely to continue to be difficult, particularly where the impact of releasing data is uncertain.
Opportunities to accelerate the release of open data

Deciding with data 30
Figure 6: Number of government open data sets in the US, UK and Australia
112,300
US UK Australia
19,100
3,700
Note: The total number of government data sets was not available to enable a comparison of the proportion of government data sets that are open. Source: data.gov.au, data.gov.uk, data.gov, accessed on 25 August 2014
Governments, directly and indirectly, can encourage economic growth and change by providing the right mix of incentives to innovate with data while balancing regulation and rules.
Governments possess rich and often real-time datasets such as weather information. The application of this data creates the possibility of new innovation. Even as early as the 1980s, the release of open global positioning data spurred the growth of a new industry of mobile mapping services, estimated to generate $150 – $270 billion in global revenue per year.42
Australia’s governments are already well along the path of using open data. Since the introduction of the Gov 2.0 taskforce in 2009 there has been steady progress towards releasing government-held data in machine-readable formats. For example, a data portal consolidating public datasets from 141 organisations with channels for the public to request access to datasets.
There are also awareness generating activities, such as Apps4NSW and GovHack, which draw together people from government, industry academia, startups and the general public to mash-up, reuse and remix the enormous amounts of data collected by governments to find new solutions to address existing problems.
Open data policy is clear and aligned with the best practice from around the globe. Australia joined 63 other countries in the Open Government Partnership in 2013, committed to making governments more open and responsive to citizens.
However, to generate the productivity benefits and realise the value of data-driven innovation, the provision of open data needs to accelerated. Compared with leading open data nations such as the United States and the United Kingdom, Australia is lagging in its efforts to release data sets to the public.
The public sector makes up almost one third of the economy, and has an influential role in fostering data-driven innovation for the remainder. At a minimum, the public sector’s use of data and provision of open data has ramifications for the rest of the country.
Pioneering open data through goverment

31 Seizing the opportunity
Agree on a social licence to use data to maximise economic and societal value
Unlocking the latent potential value of data-driven innovation will require a substantial uptake in the amount of businesses and organisations using data. In order to achieve the additional $48 billion dollars in value, the amount of business innovating must increase from 42.2 percent to 63.5 percent, equivalent to the level in Canada.
Because benefits of data-driven innovation are rarely fully appropriated by the innovator themselves, some of this value will be captured by consumers in the form of goods and services that may be lower price, higher in quality or completely new. Value will also be captured by the community as innovators address major societal challenges, such as improving health through medical breakthroughs or reducing pollution through more efficient transit systems.
However, to gain this additional value our society will need to understand and agree with the use of data. If negative perceptions dominate public opinion, it will reduce the uptake of data-driven innovation and ultimately diminish Australia’s chances of achieving higher living standards through productivity growth. We will need to give data-driven innovators a social licence to operate.
This will require us to achieve a balance between enabling data-driven innovation while ensuring that data is managed carefully and respectfully for the benefit of society as a whole. We need an informed debate about data that fully addresses the net impact of its use on the welfare of our society and acknowledges its value.43
Case study: Government as a user, provider, catalyst and champion of data-driven innovation
It is hard for organisations that rely on geospatial address information to plan and deliver services to their customers with the rapidly changing characteristics of addresses across the country. Developing a flexible and open platform for updating geospatial data could create substantial opportunities. As well as improving foundation data for traditional users such as utilities, telecommunications and insurance companies, it would create the ability to develop new solutions to meet public service and consumer needs.
To unlock the potential of government data and demonstrate the value potential of innovation to drive economic growth, in September 2014, Google sponsored a PwC event to bring together industry experts, startups and developers to solve this problem in an ‘Open Innovation Hub’. Over two days, students, businesses, governments and entrepreneurs gathered to look at new ways of tackling big ‘problems worth solving’ in the Western Sydney region and Australia more broadly. The objective was to develop a flexible and open platform for updating geospatial address data, using a sample of anonymised geocoded address data from NBN Co, AusPost, Department of Human Services, Australian Tax Office, Australian Electoral Commission, and Geelong local council. The challenge was to combine the data, design a way to update the dataset authoritatively in real time, including crowdsourcing, and serve it to users online.
Large corporations and government organisations want to innovate but do not often get the opportunity to engage with people in a meaningful way. The Open Innovation Hub offered a chance for innovators to get in front of the right people, learn about their problems and pitch an innovative solution. After the event, selected applicants were invited to participate in a 12-week incubation process to prototype and develop further proof of concept ideas with potential for direct commercial engagement.
Data and analytics have made deep inroads in improving innovation opportunities for businesses. Yet there remains a fundamental skepticism about the practical use of data to drive business decisions. The availability of data, new analytics techniques and business models are confounding the issue: Are we working with the right data? Are we thinking the right way about using it to compete or innovate? Solving these challenges matters. Big decisions have a big impact on future profitability, with nearly 1 in 3 executives valuing those decisions at a minimum of $1 billion. Breakthroughs are made by those who act on the opportunities that data provides.
Source: Big Decisions: PwC’s Global Data & Analytics survey 2014

Deciding with data 32
Increase access to data by adopting a flexible digital architecture
The challenge for all organisations is to be agile enough to identify, develop and absorb or realise the value of the products and services created by data-driven innovation, across the public and private sectors.
One of the key approaches to developing an agile organisation is to create a digital operating model that is flexible enough to enable innovation. Legacy ways do not scale well to the possibilities of data-driven innovation. To increase the speed of developing innovations, organisations need to adopt a new mantra: go open. This co-creation mandates a new open architecture, enabling what PwC calls the ‘permeable enterprise’.44
Application Programming Interfaces (APIs) enable these types of interactions. This architecture can uncover and realise the value of latent assets and capabilities within an organisation, for example by enabling different parts of the organisation or third parties to access the organisation’s data in a controlled manner, often in real-time, to create additional value.
Leading data-driven innovators are heavy providers and users of APIs, which allow them and others to quickly share and connect to many data sources and services. The uses are not restricted to large corporations. By using APIs for public sector datasets, governments become the ‘wholesalers’ of datasets and feeds. This allows them to co-create solutions with businesses, entrepreneurs, and the community to make the most effective use of latent data.
APIs also allow governments to reach more people. One application or solution, no matter how innovative, will not reach every person. APIs let developers access important information, such as weather alerts, traffic data and crime statistics, and present them in an infinite number of ways to suit different users.
Transport for NSW uses an API feed to deliver instantaneous bus and train information to approved app developers to bring real-time apps to life – a game changer in mass transit. Since its release in 2013, Transport for NSW has had over two million customers access real-time information through their smartphones, letting them know whether their bus or train is running on time.45
What is an API?
Enterprise data An API enables connection with other businesses and their data
Business ecosystem

33 Seizing the opportunity
Enhance Australia’s skill base with more people who can derive insights from data.
Data-driven innovation leans on the combined skills of statisticians, computer scientists and storytellers to extract insights from the mountains of data available. To lead the way in data-driven innovation, Australia must invest in human capital.
Clearly, the appetite is there – PwC’s 2014 Global Digital IQ survey results show that 44 percent of business owners globally intend to spend more on data collection and analysis, making data the biggest priority for strategic technology across almost every industry.46 Data experts will be a scarce and valuable commodity. According to Gartner, 4.4 million IT jobs globally will be created to support big data by 2015, but only one-third of those jobs will be filled.47 In Australia, the lack of skilled persons is cited as the number one barrier to innovation for all Australian businesses.48
The role of Science, Technology, Engineering and Mathematics (STEM) in propelling data-driven innovation cannot be ignored. However, STEM-related course completions in Australia have decreased over the past 10 years from 22 percent to 16 percent of all graduates.
The decline in the number of skilled and ready-for-work graduates is creating a bottleneck for data-driven innovation. AI Group reports that employers trying to recruit people with STEM skills are frustrated, with 25 percent finding a lack of applicants with relevant skills and 24 percent finding a lack of relevant work experience.52
In the short term, funding of applied education programs will reduce the shortfall in areas such as technical development skills.
The ability to understand, process, visualise and communicate data is developed early on through STEM education in Australia’s high schools.
In the medium to long term, growing our STEM skills base requires a focus on school curricula. Increasing the STEM and digital capabilities of educators will ensure that future generations will have the best chance of success.
“I keep saying the sexy job in the next ten years will be statisticians. People think I’m joking, but who would’ve guessed that computer engineers would’ve been the sexy job of the 1990s? “The ability to take data – to be able to understand it, to process it, to extract value from it, to visualize it, to communicate it – that’s going to be a hugely important skill in the next decades, not only at the professional level but even at the educational level for elementary school kids, for high school kids, for college kids.” Hal Varian, Chief Economist, Google49

Deciding with data 34
Figure 7: Barriers to innovation for all Australian businesses by type
Per
cent
age
of
resp
ond
ents
50
Any barriers to innovation Cost of development or introduction/implementation Lack of access to knowledge or technology Uncertain demands for new goods or services
Lack of access to additional funds Lack of skilled persons in any location Government regulations or compliance
2005 – 06 2006 – 07 2007 – 08 2008 – 09 2009 – 10 2010 – 110
5
10
15
20
25
30
35
40
4538.1
46.343.7 43.2 44.8 44.9
Shore up the skill base
Short term
Funding of applied education programs to fill the technical skills gap
Identify enterprise champions to bring commercial acumen and access to industry specific skills
Medium termGrowing our STEM skills base will require a more focussed school curriculum and equipped educators
Long term
S
T
E
M
Science
Technology Engineering
Maths
To remain globally competitive and increase the collective capability of Australia’s future workforce we need to shore up our skills base.
Source: Department of Industry, Innovation, Science, Research and Tertiary Education (2012), Australian Innovation System Report – 2012, September 2012

35
Data-driven innovation in practice

Deciding with data 36
Data-driven innovation can differ from industry to industry in terms of the rates of innovation and types of innovation. Some industries are characterised by step-change innovations and others by smaller, incremental improvements.
These case studies were chosen to provide a cross-sectional view of how different types of data-driven innovation can unleash significant consumer, business and community benefits across different industries.
In some cases, data-driven innovation creates wider social and economic benefits, which are difficult to quantify, such as environmental benefits from lower fuel consumption or social welfare gains from reduced inequality due to evidence-based policy decisions.
The information has been sourced from publicly available information and where possible, consultations with the relevant organisations.

37 Data-driven innovation in practice
MindSpot: A free and innovative online mental health serviceProblem
Mental health conditions such as stress, anxiety and depression are common among the Australian population and represent a significant cost to individuals, their families and carers.
Seeking assessment or treatment can be difficult if care is not locally accessible or the condition prevents a person from asking for help. More than three million Australians experience debilitating mental health symptoms each year but less than 20 percent visit a mental health professional. Further, the treatment system is bottlenecked by high-severity, low-frequency cases that take an enormous amount of time and resources, resulting in the majority of low-severity cases going untreated. This is not just a community issue; improving mental health conditions for employees could help businesses save at least $10.9 billion each year in productivity, participation, and compensation costs.50
Opportunity
MindSpot is one of the largest mental health practices in the world with one of the biggest sources of clinical data. MindSpot’s patients are a representative sample of Australians with mental health conditions by age and geography, and analysing this clinical data could drive major developments in mental health treatments.
20%Less than
$10.9bn
Since December 2012, MindSpot has helped...
MindSpot has helped patients overcome...
Clinical depression
Clinical anxiety
20,000 Australians
MindSpot facts and stats
Million3experience mental health symptoms
visit a mental health professional
Improving mental health conditions for employees could save businesses
Productivity
Participation
Compensation
in
75%
33%
79%
37%
Start of treatment
End of treatment
More than

Deciding with data 38
Benefits
Australia has an opportunity to lead the world in delivering virtual mental health services.
• More than 35,000 Australians will have used MindSpot by mid-2015, with at least 15,000 new patients per year from 2016 onwards. Patient outcomes are as good or better than face-to-face clinics.
– Patients benefit from reduced direct costs of accessing mental health services.
– Patients and their family and carers also experience lower indirect costs of treatment such as reduced time away from work or other responsibilities.
– Before MindSpot, over a third of patients had never spoken to a health professional about their symptoms, and over a third of patients live outside major cities and found it hard to access care.
• Clinical outcomes have been strong and robust: reducing patients with clinical depression from 75 percent at the start of treatment to 33 percent, and reducing patients with clinical anxiety from 79 percent to 37 percent.
• MindSpot is helping to free time for traditional (in person) mental health services to treat those with highly intensive mental health conditions.
• Therapists with MindSpot achieve double the productivity than they do in the face-to-face world.
Solution
MindSpot is an innovative online mental health service that provides free virtual assessment and treatment for Australians with anxiety and depression. Since its launch in December 2012, MindSpot has helped almost 20,000 Australians undertake step-by-step cognitive behaviour therapy online, or locate and access specialised health services. More than 40 new patients are joining each day, ranging from 13 to 94 years of age.MindSpot offers four online treatment courses for medium to low severity cases over low-cost, high-efficiency channels.
Developed at Macquarie University from the results of national clinical trials, a course is available following an initial questionnaire which comprises standardised measures of anxiety disorders and depression, allowing MindSpot to predict case parameters and severity.
Over the course of the treatment, a combination of data, protocols and algorithms help to ensure that patients are achieving sound progress and that therapists are providing quality and consistency of care. Patients receive at least 16 automated emails in one treatment, triggered by certain ‘events’ such as unread materials. Therapists can monitor their patients’ real-time progress and make decisions based on this data. Where face-to-face mental health treatments can differ depending on the health professional, MindSpot’s therapists follow clinically tested and proven guidelines to optimise and ensure consistent levels of treatment for all patients. Safety is a key priority at MindSpot – a progress dashboard alerts therapists if their patient’s treatment scores indicate elevated symptoms or major changes and activates feedback loops within the team.

39 Data-driven innovation in practice
Transport for NSW: All aboard for real-time train and bus apps
Problem
Delays are one of the most frustrating parts of the experience of using public transport. On any day across the Sydney train and bus network, commuters may face delays due to congestion, emergencies, or track work. Yet they could only rely on published train and bus timetables to plan their journeys.
Solution
Transport for NSW wanted to create a tool to provide commuters with real-time bus and train data so they could tell when the next one was coming. Transport for NSW used PwC’s App Hot House open innovation process to bring together some of Australia’s most talented app developers to design a solution using its real-time data feed – for buses in 2012, trains in 2013, and ferries in 2014.
These apps access a data stream from Transport for NSW based on GPS technology on buses and data point markers at train stations to receive live information on their location and immediately feed this back to customers via apps on their handheld devices.
There are currently six unique apps, designed by Australian startups, with data covering more than 8,000 stops, 1,900 buses and almost 1,200 routes across the Sydney Bus Network. Since launching in 2013, Transport for NSW has had over two million customers access real-time information through the six apps.51
This process saw Transport for NSW combine the use of data and a new style of working to accelerate and solve an immediate customer pain. It is an example of what other organisations could do to ignite and feed the spark of innovation. The result of experimentation and innovation using data may deliver something unexpected that sets businesses apart from their competitors, and help government to do more with fewer resources.
Benefits
This use of government data brought real-time apps to life – a game changer in mass transit.
• Customers can track the exact time of arrival of a bus or train in real-time, receiving the information they need to make journey decisions. If this saved each commuter 5 minutes a day, this would be worth more than $400 million to NSW each year.52
• Transport for NSW was able to provide an innovative and effective customer-centric solution at a total cost less than one tenth of the proposed budget for a scoping pilot using a traditional IT development method.
“We are keen to improve the customer experience on the rail network and we know that a real-time train app will give customers the information they need to make decisions about their journey, all in the palm of their hand.”
Transport Minister, Gladys Berejiklian

Deciding with data 40
Benefits
The innovative use of data has allowed SocietyOne to more accurately calculate risk and rates of return, resulting in more appropriate loans for borrowers and better rates of return for lenders.
• Individual borrowers, especially those of high credit quality, can receive lower rates than banks for a personal loan. As an example, a category AA borrower can borrow unsecured funds of $5,000 at an interest rate of 10.15 percent, compared to 16 percent to 18 percent for an unsecured loan from a bank.53
• Niche small businesses such as independent livestock agents have new and improved access to funds to grow.
• Investors typically receive more attractive rates of return on their investments than comparable fixed-income products. On average, SocietyOne is targeting returns to investors of approximately 10 percent, compared to average returns of 8.0 percent in residential investment property, 6.4 percent for Australian bonds and 6.1 percent for Australian shares in the ten years to 2011.54
Solution
Matt Symons saw the failure of traditional credit markets and cofounded SocietyOne with Greg Symons (no relation) in August 2012 as a peer-to-peer lender that could break down information asymmetries and address gaps in funding.
SocietyOne matches borrowers and investors through an internet-based platform and assesses borrowers’ creditworthiness using a combination of VedaScore and the analysis of three months’ transactional bank statements, in addition to other credit inputs.
SocietyOne places applicants into credit risk bands ranging from AA to D. SocietyOne’s innovative use of data combined with its algorithms allows it to offer personal loans at lower costs, competing directly with traditional banks for a share of the $100 billion unsecured lending market in Australia. Category AA borrowers can borrow unsecured funds at an interest rate of 10.15 percent, sliding up to 15.6 percent for category D borrowers.
Investors bid for these loans, within a predetermined interest rate band for each credit risk category. SocietyOne also provides investors with de-identified data on the factors they consider important for decision making, such as geographic information (for example the borrower’s suburb), financial information (for example summary of personal profit and loss account, financial ratios), and the borrower’s explanation of why they want the loan.
SocietyOne has also created new product offerings across a range of niche and underserved markets. For example, many small farming businesses find it hard to access capital, or face high costs of access, as the banks typically require loans to be secured against traditional assets like property. SocietyOne has a new product that solves this problem by allowing farmers to also use their stock, such as cattle, as security for loans. SocietyOne uses data from the national livestock identification system and records the transaction in Australia’s Personal Property Securities Register following a live auction.
SocietyOne: Better matching borrowers and lenders to improve credit markets Problem
An efficient financial system is critical for the productivity and growth of the Australian economy. By allowing funding to flow to where it is needed, the financial system helps businesses grow and creates more jobs.
Information asymmetries sometimes mean that lenders cannot accurately assess the risk of particular borrowers, meaning as a result, offering the borrower a set interest rate. For personal loans and small businesses, this increases the cost of borrowing as good borrowers subsidise risky borrowers. In some cases, lending is not available at all for good borrowers who do not have a credit history or secured assets.

41 Data-driven innovation in practice
QBE Insurance: Overcoming preconceived stereotypes of driving behaviour Benefits
• QBE gains efficiencies in underwriting at an individual risk level and speeding up the claims process
• Customers are incentivised to be better drivers, helping to avoid collisions, injuries and potentially fatal accidents. In the US and UK, it has been proven that this technology can reduce accidents by 30 percent.
• Customers save in insurance costs. One early adopter reduced their annual car insurance cost to $1000 from $1400.55
Problem
Auto insurance pricing is often not aligned with individual risk but rather with the average risk of a driver with their characteristics. For example, cautious young drivers may face the same insurance premium as risky young drivers. Inexperienced and younger drivers can sometimes take 10 years or more to be recognised as safe drivers in order to receive reductions in their insurance premium. Furthermore, traditional risk categories and incentives such as no-claim bonuses are limited in the capability to improve driver safety and reduce accidents.
SolutionQBE developed Insurance Box, an Australian first ‘black box’ for cars, which collects data on driving behaviour and sets risk-adjusted insurance premiums accordingly. Drivers can avoid steep premiums by showing safe driving behaviours. Since it is more likely that good drivers will plug in an Insurance Box, QBE can pass on lower costs as the good drivers are no longer subsidising bad ones.
The small, self-installed telematics device plugs into the car underneath the dashboard and transmits data collected real-time via satellite and mobile networks. Insurance Box combines information on date, time, speed, longitude, latitude, acceleration or deceleration (G-force), cornering, sudden braking, and then transmits that data back to base via a SIM card.
Customers are known only by a unique number, and trends are reported to customers in the form of a personal DriveScore on an online dashboard. Customers can see feedback on their driving behaviour and alerts about dangerous driving habits such as tailgating. Customers have financial incentives to modify their driving habits to actively reduce their risk premium and improve their DriveScore.
The real-time data feed can also speed up responses to accidents and assist with vehicle recovery if theft occurs.
1.4
3.5
2.7
5.0
Your ratingImproving
Your ratingGood
Your ratingOk
Your ratingBest
Speed
Acceleration Night driving
BrakingSpeed v time of day% time spent above limit
5.59am
12am 12pm5am 5pm 11pm8am
Time of day
Time peoplespeed the least
Time peoplespeed the most
5.16pm40
30
20
10
0
Source: Insurance Box
QBE’s DriveScore online dashboard

Deciding with data 42
Tip Top: Baking an optimal logistics plan
Benefits
By optimising supply chain routes:
• Tip Top has reduced freight travel distances by more than one million kilometres each year, which contributes to lowering greenhouse gas emissions and avoiding congestion
• Tip Top has improved gross profit after distribution by 7 percent, saved 9 percent in bakery to distribution centre costs and a further 12.5 percent in local-distribution costs.57
• Road transport costs could fall by around $800 million each year if the leading 20 fast-moving consumer goods companies in Australia adopted NICTA’s intelligent fleet logistics technology.58
Sources of Revenue
Optimised Service Routes
Problem
Tip Top Bakeries (Tip Top) faces the challenge of distributing over one million freshly baked products every day from 11 bakeries to 100 distribution centres and then more than 20,000 customer locations. ‘Last mile’ logistics, the final part of the supply chain where the product is delivered to customers, account for approximately 80 percent of Tip Top’s transport costs. Tip Top spends over $100 million on transport each year which contributes to 30-45 percent of the cost of goods sold.56
Solution
Tip Top, working with NICTA, used data on their transport networks and customer data to make smarter routing decisions and reduce freight distances. By applying the latest research in mathematics and artificial intelligence to data on costs, prices, distribution, customer sales and revenue, NICTA’s software solution finds the most efficient routes for Tip Top’s network of vehicles to deliver fresh bread to customers.

Rio Tinto: Improving mining operations to deliver big savings
Benefits
Over a proof-of-concept trial period before launching, the PEC generated $80 million in identified additional cash flow within the first six months of operations.
Analysing big data from copper plants can lead to various procedural enhancements such as the flotation process which increased the recovery of copper and gold.
The PEC also takes the pressure off employees at processing sites whose time and attention are often required for more urgent, daily and time-consuming work. By not getting drawn into day-to-day operational issues, the centre’s members can focus on short and medium-term horizons to reduce the variability of Rio Tinto’s processing plants.
Ultimately the PEC is a support function to Rio Tinto Operations; it identifies and advises process changes that will yield operating benefits while leaving the ultimate authority in the hands of the operations personnel.
Problem
For multinational mining organisations, managing the safety and health of workers, monitoring environmental performance, and maintaining production efficiency of multiple sites across the globe are core challenges. In the process, millions of gigabytes of data are created that need to be analysed and managed.
Solution
Rio Tinto has delivered innovative solutions to these problems with its ‘Mine of the Future™’ technology and innovation programme. One such innovation is the use of big data generated by plants, equipment and automated technologies at its Processing Excellence Centre (PEC) in Brisbane.
Officially launched in March 2014, the PEC is a world-first, state-of-the-art facility that examines real-time data to fine-tune operations at concentrator facilities located on seven mine sites across Australia, Mongolia and the United States. Containing the world’s biggest multi-platform touchscreen across one of its walls, the PEC monitors, analyses and suggest process interventions using the massive amounts of data generated across Rio Tinto’s concentrator plant operations.
The PEC receives data on average 100 milliseconds after it is produced at the mine site amounting to gigabytes of data each day. The data is run through different analytical systems to spot anomalies and identify immediate process improvements. To ensure the success of any optimisation solutions deployed by the PEC, ongoing results at the processing sites are monitored automatically and continuously by a suite of “data sentinels”. A “sentinel” is a system that raises an alert and allows for rapid intervention should processing plants drift from the optimum state.
The data and near real time analysis allows Rio Tinto’s expert mineral processing team located in the PEC to work in collaboration with operations based mineral processing experts in order to leverage best operating practice for concentrators located on mine sites spanning multiple product groups.
The PEC leverages data and collaborative work tools to help Rio Tinto operations maximise productivity and improve performance.
43 Data-driven innovation in practice
Cop
yrig
ht ©
200
9 R
io T
into

Deciding with data 44
Queensland Health: Using real-time data to improve patient flows and outcomes
Benefits
These initiatives help to ensure that patients receive the right care, in the right place, at the right time. A sample of outcomes achieved include:
• Hospitals experienced an 18 hour decrease in discharge delays, and 0.85 bed day reduction in the length of stay.
• Patients benefitted from a 52 percent increase in a discharge plan being communicated to them and a 30 percent increase in pharmacy scripts written 24 hours prior to discharge.
• Patients may also benefit from reduced time away from family or work, as well as reduced stress levels, which are difficult to quantify.
Problem
Helping patients to move efficiently through hospitals and then back into the community is imperative for the health system, which is facing increasing demand. Yet, this can be challenging due to the inability of different medical experts who may treat a patient during their recovery to communicate vital health information to each other. Health care staff are often forced to communicate using inefficient paper-based health records, whiteboards, and in-person meetings.
Solution
Queensland Health embarked on a statewide Clinical Services Redesign Program using a data-driven approach to engage and empower their staff to improve services.
An example initiative from this program involved consolidating multiple data sources to:
• Display the hospital patient journey on an Electronic Patient Journey Board. It shows the progress of key care activities at the ward level in real-time to provide a single source of data about a patient’s treatment. It uses a traffic light system to allow all multidisciplinary health care staff to quickly understand where the patient is on their journey towards discharge. This facilitated a more coordinated care approach and helped to improve patient recovery.
• Facilitate daily clinical decision-making visualised on a Clinical Dashboard. It displays how a ward is performing alongside relevant hospital and statewide metrics. The data is updated in real-time from the Journey Board and other Queensland Health data sources to allow clinicians to easily track performance according to defined models of care.
• Test new models of service in Simulation Scenarios. A simulation model of the complex healthcare system is used to test the outcomes of changes in process and resource allocation in a risk-reduced environment.
Patient flow simulation model

45 Data-driven innovation in practice
Fire and Rescue NSW: Using predictive analytics to save lives and properties
Benefits
Miinder is still under development but when it is deployed:
• FRNSW and taxpayers would benefit from more efficient resource allocation and hence cost savings.
• The community would benefit from improved fire and emergency responsiveness, savings lives and properties. FRNSW anticipates that Miinder will be able to actively prevent, prepare and respond to emergency situations, with the NSW community protected in the lowest possible state of risk.
Problem
Australia is a hot, dry continent, prone to drought and bushfires, with NSW experiencing extreme fire weather conditions in spring and summer. Fire and Rescue NSW (FRNSW) is responsible for the emergency response and protection of the NSW population, and in 2013, responded to over 130,000 incidents – an average of one every four minutes.
Managing emergencies has typically been a reactive service. Deploying firefighter crews proactively has typically been on the basis of historical knowledge and instinct, for example, there is greater likelihood of an accident on the M1 on the last day of school holidays. However, the location of emergencies is highly dependent on a range of factors, and incidents can occur where they have not historically. Without a comprehensive monitoring and predictive system, resources are not always efficiently allocated.
Solution
FRNSW is developing a world-first computer system dubbed Miinder (name subject to change). Miinder, currently in proof of concept stage, will be a sophisticated predictive system that uses environmental, geographic and operational data to gauge the risk of disasters, such as flood and fire, to every property in the State. This will enable FRNSW to better prepare its resources before emergency situations occur to minimise life and property loss.
By monitoring and analysing millions of pieces of real-time data on weather, elevations, and vegetation types, FRNSW will be able to pre-emptively deploy crews to specific locations during certain times of the day. Miinder contains machine learning algorithms and feeds from actual outcomes and incidents, which could be used to refine its risk assessments and improve recommendations for resource deployment in the future.
The first pilot of Miinder is the analysis of aerial photography to measure how close different types of vegetation are to houses to assess the risk of fire. Miinder could further help FRNSW with network planning and risk assessment, for example by integrating weather data into a heat map to replay past incidents and simulate future scenarios.

Deciding with data 46
NSW Department of Education & Communities: Personalising education for students with disabilitiesProblem
Access to specialist disability support in schools has, for many years, been based on eligibility that often requires a formal diagnosis of disability. Increasingly, evidence suggests that this approach has limitations. Students exist on a spectrum of needs for educational adjustments, and even within this spectrum each individual is unique. Thus a system based on diagnosis of disability can be inadequate for informing teachers and schools about a particular student’s learning needs. Associating a student with a diagnostic label can also affect the expectations placed on the student. In addition, some students who need additional support may not have a formal disability diagnosis.
Solution
In light of these limitations, education policy has moved increasingly towards personalised approaches to learning and support, and the idea that education should be tailored to meet the unique needs of individuals. To bring the power of data to bear on this approach, the NSW Department of Education & Communities developed the Personalised Learning and Support Signposting Tool. The Tool builds upon previous work by the Department to further identify, understand and profile differences in learning needs of students across NSW public schools.
Benefits
The Department’s Tool is a user-friendly online platform, which was developed iteratively in consultation with teachers from more than 550 schools. It contains:
• A set of questions – Developed by the Department and education experts to capture student educational needs, this questionnaire takes 15-20 minutes for a teacher to complete. In contrast to traditional psychometric questionnaires, this questionnaire is easy to understand and requires no specialist training to complete. This makes the Tool an easily accessible first step in identifying and addressing student educational needs.
• A psychometric model – From 25,000 student records created during the 2013 trial of the Tool, the Department has a detailed understanding of the common and uncommon patterns of educational need present in the student population. This underlying model allows the Department to convert the questionnaire answers into a detailed description of a particular student’s educational needs. Looking to the future, this anonymised dataset will empower population studies of educational need, allowing trends to inform teacher training and government policy.
• A report – Each teacher receives a report for each student, placing the student on six different “spectrums” of educational need, and providing a detailed discussion of the ways in which the particular student’s needs vary from similar students in the population. This is in stark contrast to traditional statistical reporting, which focusses on fitting the student within a standard mould and ignoring individual variations. This report provides a framework for discussing the student’s needs with other education practitioners and parents, informing best practice without forcing the teacher or student to conform to a generic pattern.
Bringing the tool to teachers in an intuitive and user friendly way
required an online platform
WebsiteThe complexity of
educational need required a sophisticated multi dimensional model
Statistical Model
Clear and concise visual communication of results is the final step necessary to impact daily practice
Student Report
The Question set was enhanced and extended
to maximise relevance to a range of student
contexts
Instrument
The PLASST
The PLASST

Sydney Water and NICTA: Predicting and preventing water pipe failures
Benefits
The use of enterprise data and environmental data by scientists has taken the guesswork out of water network maintenance.
• The community benefits from reduced inconvenience and expenses incurred by water pipe breakages.
• Sydney Water can optimise its water pipe network servicing.
• Savings of $700 million each year in reactive repairs and maintenance.
• Direct cost savings of an estimated $1.5 million over two years resulting from the correct detection of weak or at risk pipes.
• Indirect cost savings of an estimated $3 million from the discovery of pipes requiring renewal, which previously were not detected.
Problem
There are thousands of kilometres of buried water pipes and their decay can have considerable impacts on the surrounding community and the economy. Each year, only a fraction of Australia’s water pipe network can be renewed, yet Australia’s critical water mains break 7,000 times (on average). The renewal of underground water pipes costs up to $400 million annually. Previous inspection and prediction techniques have not been accurate in predicting likelihood of failure.
Solution
Sydney Water and National ICT Australia (NICTA) joined forces in February 2013 to predict potential breakages in the water system. NICTA analysed historical pipe failure data from Sydney Water to develop a system, using advanced machine learning techniques, to predict the decay of underground water pipes. The modelling also included extensive data on age, type, material, size, length, soil, pressure, location, weather and urbanisation.
Sydney Water used the information on the likelihood of pipe failure to prioritise pipe renewals, eliminating the guesswork from water pipe condition assessments.
47 Data-driven innovation in practice

Deciding with data 48
Sense-T: Innovation sprouts up in Tasmania through a world first resource management initiative
Benefits• Consumers will be able to
know exactly (down to the farm) where food has been sourced from (‘farm to fridge’).
• Farmers have access to the data they need to optimise harvesting decisions such as the use of irrigation and fertilisers, receive early warnings on weather conditions such as frost, and build the capacity to detect diseases in their crops.
• Government can use Sense-T to provide flood and fire alerts and improve water catchment management.
• The environment will benefit from a reduction in the over-extraction of limited water resources.
“Connecting sensor technology, real-time data and software solutions will help farmers make quicker and better decisions about how to interact with the environment to boost agricultural productivity.”
Jamie Briggs, Assistant Minister for Infrastructure and Regional Development.
Problem
Australian farmers are facing a range of challenges including the impact of drought, decline in the terms of trade for key commodities, and increased pressure on our scarce natural resources. The agricultural industry must make a step-change in the productivity and sustainability of its farming practices to meet increasing global demand for Australian food production in a sustainable way.
Solution
In a world-first initiative, the Tasmanian Government, University of Tasmania, CSIRO and IBM are developing a statewide agricultural sensor network, Sense-T.
Sense-T will be the world’s first intelligent sensor network that integrates real-time data on crops, livestock, water, weather, and farm equipment to help businesses, governments and communities make better decisions on harvesting and water catchment management. Thousands of sensors have been installed to date, covering a wide variety of agricultural businesses. Data from existing sensors across the economy will also be integrated into this single information system.
Real-time data and forecasts from Sense-T will be made publicly available through an easy-to-use, web-based map interface. Sense-T will also develop a platform to host web, smartphone and tablet apps, enabling the community to develop web-based tools which solve agriculture’s most pressing problems and deliver them back to farmers. Application programming interfaces (APIs) will be published to make it easy for entrepreneurs to develop applications using Sense-T’s core infrastructure.
Apps
(real-time data)Sensor Networks
(spatial, historical)Data Providers
Sense-T Data Cloud with real-time stream
computing
APls & Web Services
Data Analaysis & Research
ACTION
KNOWLEDGE
INFORMATION
DATA
DATA

49 Data-driven innovation in practice
United Energy: A smart approach to managing electricity consumption
Benefits• On average, customers
reduced their demand by around 40% during the event period on each event day of the trial when compared to a similar day prior to the trial
• By reshaping peak energy demand through minor changes to customer’s behaviours, United Energy may be able to delay or avoid costly network upgrades or new infrastructure, which saves customers money in the long run.
• By increasing awareness of peak demand and encouraging strategies in more efficient use of energy, there is the potential to contribute to reducing carbon emissions.
Problem
Australia’s rapidly growing use of appliances and air conditioners in the home means that on hot summer days there is a dramatic increase in demand for electricity. When temperatures exceed 35 degrees, an average customer’s electricity consumption can increase by more than 60 per cent compared to that of an average summer day of between 25-30 degrees.
While there is a trend of declining electricity demand overall, United Energy’s (UE’s) annual growth in peak demand is currently around 1.7% each year, largely driven by housing in-fill and lifestyle appliance choices. The result is that UE must invest in network reinforcement to increase network capacity and meet this growing peak demand. However, the top 20% of system capacity is used for a low number of hours per year.
Solution
UE is incorporating the use of smart meter data to trial voluntary demand side initiatives to reduce peak demand on areas of the network which are facing capacity constraints. The voluntary trial analyses customer responses to incentives and the potential to manage peak demand so as to postpone or avoid expensive network investment, which results in increased costs to customers.
UE commenced a Summer Energy Demand Trial in 2014 in the Bulleen / Lower Templestowe area of Melbourne, where demand was reaching infrastructure capacity limits. UE customers had the option of taking part in the trial on an entirely voluntarily basis - agreeing to reduce their demand for a period of up to three hours on days when demand was expected to be extraordinarily high. In return, customers were paid $25 for each event period where they reduced their load.
Participants in the trial were given tips on how to reduce their energy consumption to a level which did not compromise safety or comfort. They could opt out of the trial at any time if reducing demand on a day was inconvenient. UE analysed smart meter data to compare the customer’s energy consumption on the event day to a day of similar temperature earlier in the summer.
Participants were also encouraged to access their detailed energy consumption data on UE’s free Energy Easy portal and monitor for themselves the impact of the changes they had made.

Deciding with data 50
Mathletics: Innovative online learning resource helps you do the math
Benefits• Students are engaged and
motivated to learn, have 24 hour access at home or school, and can work through the curriculum at their own pace.
– In 2007, Mathletics analysed over 1.1 billion answers, and found there was a 21.1 percent improvement in mathematical ability after completing three Mathletics learning activities.60
– 96 percent of parents said Mathletics had improved their child’s understanding of mathematical concepts and 89 percent said their child was more engaged with mathematics.61
• Teachers benefit from a reduced workload as they can set homework tasks tailored for the student in seconds, track their progress in real-time, and automatically mark homework.
Problem
The Australian Government has recognised the critical role of education and research in ensuring the continued prosperity of Australia, and in particular Science, Technology, Engineering and Mathematics education.59 Yet the OECD’s Programme for International Student Assessment 2012 revealed that Australian students have slipped backwards in mathematical literacy levels, with average performance deteriorating in the past decade.
Solution
Founded in Australia, Mathletics is an innovative online learning resource developed by 3PL Learning which helps students enjoy mathematics and improve their results. Mathletics provides a range of mathematics activities at all levels from Kindergarten through to Year 12, often using mathematics games to enhance and encourage students’ learning experiences.
Teachers gain insight into students’ progress and help them to improve through the following resources:
• Real-time marking and results data can be used to create bespoke learning pathways, based on individual student results.
• Diagnostic results data is displayed on a dashboard to track individual student progress, classroom performance, and whole-school performance.
• Over 250 assessments are available – each one aligned to the specific requirements of state and national curricula. Teachers can use data on performance against each assessment to identify individual weaknesses and assign targeted activities accordingly.
40,000 students are using Mathletics each day, from schools all around the world in countries including Australia, New Zealand, UK, USA, South Africa and China.

51 Data-driven innovation in practice
Ergon Energy: Meeting electricity needs with small area peak demand forecasting
Benefits• Ergon saves costs from
deferring and optimising capital expenditure, which contribute to lower prices for Ergon’s customers
• Other Ergon models which rely on peak demand forecasts, for example modelling of customer demand response from price movements, benefit from improved peak demand modelling.
Problem
Queensland’s rapidly expanding population places extra strain on electricity supply and contributes to peak demand. At Ergon Energy (Ergon), millions of dollars are invested each year in the infrastructure required to support demand during peak times and to avoid power outages. The cost of investing in this infrastructure is one of the major causes of increasing electricity prices.
Total summer demand in Ergon’s network area is forecast to increase by 7.5 percent over the period to 2020 and network capacity augmentation is required to avoid system constraints. Network capacity augmentation needs differ by region yet peak demand forecasting across Australia generally uses whole of state inputs.
Solution
Ergon has moved to more granular energy and peak demand forecasting to match the differing levels of activity across Queensland. Ergon has developed customer-driven Peak Demand Forecast models for each of its six network regions using previously unavailable small area data on economic output, air conditioner use, historical summer and winter peak demand, and Bureau of Meteorology data.
To add a further level of granularity, tailored reference sheets were generated for more than 350 Ergon substations which showed information on population, land use, historical demand, temperatures and rainfall. These reference sheets supported Ergon’s Subject Matter Experts in a Delphi process which is used to supplement the mathematical demand forecasts with local knowledge.
This information feeds into Ergon’s network capital planning process to allow more accurate appraisal of when capital equipment is likely to need replacement. The greater granularity of the forecasts allows Ergon to delay some capital expenditure in lower growth regions and bring forward expenditure in higher growth regions. This leads to a network that can maintain the level of supply interruption risk at current levels but at a lower cost of capital investment.

Deciding with data 52
Department of Immigration and Border Protection: Allocating border security resources more effectively
Benefits• Better targeted referrals means
less inconvenience for genuine travellers
• Savings to government from:
– More efficient use of DIBP time and resources, by halving the number of passengers requiring additional checks at airport immigration points, from 2,500 to around 1,200-1,500 passengers per month.
– Detecting an increasing number of suspicious travellers, many of which were eventually refused entry to Australia, saving an average of $60,000 per refusal.
– Eliminating the manual and time-consuming handling of passenger information.
– The ability to handle increasing caseloads without extra resources.
Problem
Over 30 million passengers travel across Australia’s borders each year, with an average of 40,000 inbound travellers each day. This is forecast to increase to 50 million passenger movements by 2020 as airline travel becomes increasingly affordable and accessible. The rise in passenger movements at Australia’s airports makes border management and detection of increasingly sophisticated criminal or national threats more challenging.
Solution
The Department of Immigration and Border Protection (DIBP), previously the Department of Immigration and Citizenship and the Australian Customs and Border Protection Service, has developed the Border Risk Identification System (BRIS) to improve their ability to identify potential problem travellers in real-time among growing passenger movements.
BRIS integrates advanced analytics with passenger information collected from airlines and government agencies worldwide to scan all inbound travellers.62 Having this breadth of information accessible in real-time to assess passengers enables DIBP immigration officers to identify high-risk passengers quicker, and with more precision. This helps to streamline the processing of genuine travellers, while freeing up resources to manage more problematic cases.
BRIS was built and tested in-house over four months, using open source analytical software with about eight years of historical data. A successful prototype of the system was deployed in Sydney, Melbourne and Brisbane airports in early 2011.
BRIS complements existing border risk identification and mitigation tools such as immigration intelligence, primary line referrals and Movement Alert List matches.

53 Data-driven innovation in practice
Followmont Transport: Improving the freight mix with visual analytics
Benefits• Followmont can accurately
determine customer engagement and changes on-the-go, increasing fuel efficiency by changing the freight mix as changes emerge.
• Followmont can increase customer retention by identifying high-risk customers and potential customer issues, and engaging with them early on.
• Loyal customers are rewarded with better rates.
“There’s too much data; we carry two million consignments – how do you know which one is going to be losing you money?”
Paul Smith, CIO – Followmont Transport
Problem
Followmont Transport (Followmont) moves over 130,000 freight loads each month, spread across 600 trucks. Large amounts of customer and freight data were being generated but the data was not used to improve decision making.
Helping Followmont’s managers more effectively load trucks and optimise runs and staffing required the ability to turn its data into useful information. Followmont’s existing reporting system was cumbersome and reports could not be generated fast enough to match the speed of business. Revenue was lost as decision makers did not have access to relevant data on a timely basis.
Solution
In late 2013, Followmont began to analyse and visually report on the massive amounts of data they were generating.
The reporting included:
• Comprehensive information on the full costs per kilogram to deliver freight to a certain location.
• Benchmarking costs of delivery to certain areas.
• Historical customer data such as revenue, kilos and consignment notes, to understand when customers were reducing the amount of freight consignments with Followmont.
The reports are made available to staff across Followmont, tailored for specific uses, via desktop and tablet. This enables management to access updated information at all times and allows for better decision-making regarding freight movements, such as rotating fleet to spread usage.
Implementing this real-time visual analysis and reporting allows Followmont to identify high-risk customers and proactively engage with them before customers are lost. Followmont also uses the data to identify loyal customers and reward them with better rates.

Deciding with data 54
NSW Health – Sydney Local Health District: Solving the ‘data rich, information poor’ problem in health care
Opportunities
Support, use and availability of information provided by STARS has been overwhelmingly successful to date, but SLHD recognises that this is only the beginning of their journey with STARS. SLHD is continuously upgrading and developing its STARS applications, with over 60 in the pipeline.
Further, improvements in data access, education for end users and the incorporation of new measures (e.g. international health benchmarks) will empower SLHD to better understand the levers that affect health and societal outcomes.
BenefitsGreater insight into data has already allowed for the identification of more appropriate settings for patient treatments. For example:
• A reduction of length of stay of 1.05 days at the Royal Prince Alfred Hospital for a spinal disorder procedure, as data captured through STARS identified delays in access to a dedicated MRI slot
• Performance monitoring of activity data to support a clinical redesign project to improve emergency access to operating theatres at a hospital with a higher average length of stay than other hospitals in the District.
In addition, SLHD has realised benefits through providing a higher quality of care and more services for patients, with the same amount of funding. This includes: clinical redesign, finance and revenue outcomes, activity and performance improvements, and active safety and quality monitoring. Some examples of the benefits of the use of STARS are:
• Over a seven month period, improved revenue results by over $1 million
• Improved the start-to-end health journey for patients
• Empowered clinician and health executive decision making with the provision of highly accessible, user-friendly information.
Problem
A large volume of data is generated as a patient experiences care through the health system. This data is generated across a number of different IT systems – some of which are now dated. Health executives and clinicians are restricted in their ability to receive timely, accurate and appropriate insights from the current unstructured nature of health data.
Solution
Sydney Local Health District (SLHD) has pioneered the development of the SLHD Targeted Activity and Reporting System (STARS), a new performance reporting tool. With a focus on patient-centred care, STARS has enabled SLHD to provide flexibility in performance reporting, tailored to clinician’s needs. This user friendly, real-time active management tool has allowed for better financial, operational and clinical decision making.
STARS brings together the wealth of health data available in a comprehensive way. This health data comes from many perspectives, including by facility, clinical stream, speciality unit, diagnosis-related group and clinician. This captures a range of information, including patient profiles, average length of stay, emergency department data, episode and uncoded episode data and clinical variations.
To develop STARS, SLHD engaged and consulted with stakeholders (including clinicians and health care executives) across its network of public hospital and health care services in the central Sydney metropolitan area. By encouraging active communication and openness across the District, SLHD developed a number of applications using STARS to assist its stakeholders with decision making. In doing so, stakeholders have moved from an assumptions-based approach to a collaborative, evidence-based approach in making decisions about performance improvements and system sustainability.

55
Appendices

Working smarter with data 56
Methodology
Endnotes
Acknowledgements

57 Appendices
Methodology
This report uses PwC’s Geospatial Economic Model (GEM), which allows economic activity to be assessed at a granular level across multiple data layers:
• The economic output, calculated in a way that is consistent and reconcilable with the income approach of measuring GDP and Gross State Product (GSP) by the Australian Bureau of Statistics (ABS).
• The number of employees and businesses in each industry and by business size, overlaid on economic output to identify labour productivity.
• The level of innovation activity, derived by overlaying results of the ABS survey of innovation on the number of businesses based on industry and size.
This layering approach allows the efficient holistic identification of the relationship between economic output, businesses, and the level of innovation at a granular level for each location. It gives a deeper level of insight than merely assessing economic activity is at the industry or state level.
A PwC data-driven innovation: the Geospatial Economic Model - a new lens for understanding our evolving economy
Australian leaders are currently grappling with the question: what will drive growth in our economy after the end of the resource investment boom? PwC found that the current lenses through which the economy is generally viewed – such as an industry or state lens – provide only high-level perspectives. There was nothing that shows how the economy was working ‘on the ground’.
PwC’s GEM captures the macroeconomic trends that shape Australia while also providing a more granular analysis of how the trends play out in 2,214 ‘locations’ across Australia where business and government operate, covering 100 percent of the country. ‘Locations’ refer to socially and economically distinct areas that have, on average, a population of approximately 10,000 people.

Deciding with data 58
For each of these locations, PwC can identify the core economic output of the 20 industries which make up the Australian economy from 2001 to 2013, with forecasts out to 2020. PwC can also estimate effects of innovation activity, agglomeration and productivity metrics, the wages received by employees and company profitability. Economic performance can be tested and correlated to the other dimensions that are relevant. These include social and demographic factors, (for example age, income, education, housing density) access to transport and infrastructure, access to essential services, climatic conditions, customer preference, intention to purchase, crime statistics and more.
Understanding the spatial characteristics of the Australian economy allows a better understanding of the challenges it faces.
Labour productivity (real economic output per worker) in each location
Real economic output per worker for each location was derived from the economic layer of PwC’s GEM. Chain volume measures were used to allow real comparisons over time.
Data fusion
Your data
Our data
Social and demographics
factors
Data layers Data lenses
GDP (ABS)Gross Domestic Product
GSP (ABS)Gross State Product
Other industry data
ABS Census
data
ABS Econom-ic data
ABS Industry
data
GSAP (PwC)Gross Small Area Product
Retail and customer
Transport and infrastructure
Economic
Industry
Labour force
Climate
Figure 8: PwC’s Geospatial Economic Model

59 Appendices
Level of innovation activity in each location
Data on the number of business in each location by industry and employment size was sourced from ABS Cat. No. 8165.0 – Counts of Australian Businesses. This was imported as a data layer in GEM. PwC estimated the likelihood that each business engaged in innovation in the past year based on data from the ABS 2012-13 Business Characteristics Survey (BCS) published in ABS Cat. No. 8166.0 – Summary of IT Use and Innovation in Australian Business.
As innovation is often seen as a continuous process and aspects can be intangible, and therefore difficult to measure. The BCS adopts the international framework, ‘Oslo Manual, Guidelines for Collecting and Interpreting Innovation Data’, developed jointly by Eurostat and the Organisation for Economic Co-operation and Development (OECD) to measure the process of innovation. The BCS collects information about the broad types and status of innovation in Australian business for the 12 month reference period (2012-13).
Estimating the economic value of data-driven innovation
To identify the net economic contribution of data-driven innovation, PwC looked at the relationship between growth in productivity (real economic output per worker) for 1,616 locations in urban Australia from 2011-12 to 2012-13, and innovation activity in that location. These locations generate more than 80 percent of economic output from one percent of the Australian land mass.
PwC analysis shows that if there were no innovating businesses in 2012-13, labour, productivity growth on average would be lower by 6.3 percent, equating to $87 billion in economic value add (upper bound estimate). Furthermore, every one percentage point increase in the total proportion of businesses innovating relates to a 0.17 percentage point increase in labour productivity growth. The upper bound number assumes that all innovations in businesses are data-driven.
Note: This correlation does not necessarily imply direct causation and PwC does not expect innovation activity to explain labour productivity growth in all regions – but innovation was a statistically significant factor at a one percent level of statistical significance. There are many other factors, which are likely to influence productivity.
Estimating the upper bound, lower bound and midpoint
The upper bound estimate looked at the proportion of innovating businesses in Australia, that is, those that introduced any of the following four types of innovation during the 2012-13 reference period:
• Goods or services – Any good or service or combination of these which is new to a business (or significantly improved). Its characteristics or intended uses differ significantly from those previously produced/offered.
• Operational processes – New or significantly improved methods of producing or delivering goods or services of a business (including significant change in techniques, equipment and/or software).
• Organisational/managerial processes – New or significantly improved strategies, structures or routines of a business which aim to improve performance.
• Marketing methods – New or significantly improved design, packaging or sales methods aimed to increase the appeal of goods or services of a business or to enter new markets.
In 2013, around 36.6 percent of Australian businesses had introduced any of these four types of innovation.

Deciding with data 60
PwC assumed that major changes in operational processes, organisational /managerial processes and marketing methods are not undertaken blindly without the help of data. Around 20.0 percent of Australian businesses introduced an innovation in goods or services, 16.9 percent in operational processes, 20.2 percent in organisational / managerial processes and 18.8 percent in marketing methods in 2012-13.
Because businesses may be counted in more than one of these categories, the calculation takes the maximum of the proportion of businesses that are innovating in these three areas – 20.2 percent – to avoid double-counting. The ratio of this figure (20.2 percent) to the proportion of all businesses that had introduced innovations (36.6 percent) is applied to the upper bound estimate ($87 billion) to arrive at the lower bound estimate of $48 billion.
The midpoint estimate of $67 billion adopted in the report is the average of the upper bound and lower bound estimate.
Estimating the economic value of data-driven innovation by industry
The economic impact of data-driven innovation by industry was identified by distributing the $67 billion to the 19 major industries within the Australian economy, reported by the ABS. The proportion of value attributed to each industry is weighted by its relative level of data-driven innovation (Figure 9) and contribution to GDP. The relative contribution to GDP includes urban and nonurban areas, which assumes that the labour productivity impact of innovation can be extrapolated to the rest of Australia.
There is a disparity in the level of data-driven innovation across different industries. In the last financial year, the Wholesale Trade, Retail Trade and Manufacturing industries were the most innovative industries. These industries have collected significant volumes of data along the supply chain, from production through to customer transactions and even customer experiences, and from the growing number of sensors in products.
Figure 9: Proportion of businesses that introduced data-driven innovations in FY13
Mining
Financial and Insurance Services
Manufacturing
Retail Trade
Construction
Wholesale Trade
Public Administration and Safety
Education and Training
Transport, Postal and Warehousing
Administrative and Support Services
Information Media and Telecommunications
Other Services
Rental, Hiring and Real Estate Services
Accommodation and Food Services
Electricity, Gas, Water and Waste Services
Agriculture, Forestry and Fishing
Arts and Recreation Services
Professional, Scientific and Technical Services
Health Care and Social Assistance
48.1%
46.7%
43.9%
43.8%
43.7%
41.7%
40.3%
38.2%
36.8%
36.8%
36.8%
36.4%
35.2%
35.0%
32.1%
29.9%
27.0%
26.7%
24.3%
30%
28%
24%
33%
32%
24%
23%
25%
25%
25%
25%
22%
26%
21%
19%
20%
17%
12%
16%
Lower bound Upper boundMidpoint

61 Appendices
Endnotes
1 www.emc.com/collateral/analyst-reports/idc-digital-universe-are-you-ready.pdf. Accessed [30 July 2014].
www2.sims.berkeley.edu/research/projects/ how-much-info-2003/. Accessed [1 August 2014].
www-01.ibm.com/software/au/data/bigdata. Accessed [4 August 2014]2 A zettabyte is unit of measurement for digital information, equivalent
to 1 billion terabytes, 3 www.google.com.au/intl/en/insidesearch/howsearchworks/
thestory/. Accessed [18 August 2014]. 4 Moore’s law describes how processing power and storage capacity
roughly double every 18 months. The Hon. Malcolm Turnbull MP’s speech at the AAIA Navigating Analytics Summit, 20 March 2014
5 harvardmagazine.com/2014/03/why-big-data-is-a-big-deal. Accessed [30 July 2014].
6 www.emc.com/leadership/digital-universe/2014iview/ it-imperatives.htm. Accessed [30 July 2014].
7 PwC analysis of June 2014 data from Reserve Bank of Australia (2014), Payments data: C1 Credit and charge card statistics and C5 Debit card statistics available online at http://www.rba.gov.au/payments-system/resources/statistics/
8 www.emc.com/leadership/digital-universe/2014iview/ it-imperatives.htm. Accessed [30 July 2014].
9 www.digitalpulse.pwc.com.au/enterprise-it-internet-of-things/. Accessed [6 August 2014].
10 www.emc.com/leadership/digital-universe/2014iview/it-imperatives.htm. Accessed [30 July 2014]
11 The Oslo Manual is the foremost international source of guidelines for the collection and use of data on innovation activities in industry.
12 www.brw.com.au/p/tech-gadgets/coles_woolies_and_the_big_data_arms_4I2P2oieDKZGdev5aY778H. Accessed [13 August 2014].
13 This was driven by a surge in labour productivity. Widely acknowledged explanations for the growth in labour productivity include microeconomic reforms; education and skills in the workforce; and the rapid uptake and smart use of information and communications technologies.
14 Department Industry, Innovation, Science, Research and Tertiary Education (2012), Australian Innovation Systems Report 2012, September 2012
15 Harvard Business Review (2012), Big data: the management revolution, October 2012
16 Connolly, E. et al (2012), Small business, an economic overview, Small business finance roudtable, May 2012
17 Strategy& (2014), When big data isn’t an option, published in strategy + business, 19 May 2014.
18 Midpoint estimate with a lower bound of $48 billion and upper bound of $87 billion
19 Locations are Statistical Area Level 2 geographies as defined by the ABS. These loosely align with suburbs with a residential population of 10,000.
20 This methodology has been consistently applied since 2001 across all locations
21 Data sourced from PwC’s GEM22 Survey results are available in ABS Cat. No. 8166.0 – Summary of
IT Use and Innovation in Australian Business, 2012 – 13 Counts of businesses in each location are derived from ABS Cat. No. 8165.0 – Counts of Australian Businesses, including Entries and Exits, June 2009 to June 2013.
23 Conservative estimate of value within the band24 Indicative project costs sourced from Bureau of Resources and Energy
Economics (2014), Resources and energy major projects: April 2014 – Projects listing, available online at http://www.bree.gov.au/publications/resources-and-energy-major-projects
25 Adapted from McKinsey Global Institute (2013), Open data: unlocking innovation and performance with liquid information, October 2013, p18
26 Adapted from McKinsey Global Institute (2013), Open data: unlocking innovation and performance with liquid information, October 2013, p18
27 Adapted from Lateral Economics (2014), Open for business: how open data can help achieve the G20 growth target, commissioned by Omidyar Network, June 2014,
28 Lateral Economics (2014), Open for business: how open data can help achieve the G20 growth target, commissioned by Omidyar Network, June 2014
29 OECD (2013), OECD Science, Technology and Industry Scoreboard 2013: Innovation for growth, October 2013
30 An innovation is the introduction of a new or significantly improved good or service; operational process; organisational/managerial process; or marketing method. The ABS survey draws on the conceptual definitions and guidelines included in the OECD (2005), Oslo Manual: Guidelines for Collecting and Interpreting
Innovation Data, 3rd Edition, 10 June 2005. This manual provides a framework for the collection of innovation statistics and specifies the definitions of innovating businesses and innovation-active businesses.
31 Statistics Canada (2014), Survey of Innovation and Business Strategy, 2012, February 14, 2014. Estimated by applying the results of our regression analysis which shows that one percentage point increase in the total proportion of businesses innovating relates to a 0.17 percentage point increase in labour productivity growth.
32 Bates, D.W. et al (2014), Big data in health care: using analytics to identify and manage high – risk and high – cost patients, Health Affairs, 33, no.7 (2014):1123 – 1131
33 IBISWorld (2012), A snapshot of Australia’s digital future to 2050, 34 PwC subject matter expertise was applied for the six industries
where data was not available: Accommodation and Food Services, Administrative and Support Services, Public Administration and Safety, Education and Training, Health Care and Social Assistance and Arts and Recreation Services. The competitive advantage of each industry was assessed using a five point ‘likert’ scale, where one is little to no observable competitive advantage and five is very high competitive advantage.
35 Industries were ranked from largest to smallest where one indicates the 20th percentile and five indicates the 100th percentile.
36 Department of Foreign Affairs and Trade, Australia in brief – Australia and the world, available online at http://www.dfat.gov.au/aib/australia-and-the-world.html
37 Linehan, V. et al (2012), ‘Food demand to 2050: opportunities for Australian agriculture’, 42nd ABARES conference, Canberra.
38 ABS Cat. No. 8167.0 – Selected Characteristics of Australian Business, 2011 – 12, Business structure and arrangements. Data was not available for the Public Administration and Safety and Education and Training industries. Industries were ranked by quintiles. Two industries where survey data was not available were allocated to quintiles by PwC subject matter experts with in – depth experience and market knowledge in these fields.
39 ABS Cat. No. 8167.0 – Selected Characteristics of Australian Business, 2011 – 12, Barriers to innovation and general business activities or performance. Data was not available for the Public Administration and Safety and Education and Training industries. Industries were ranked by quintiles. Two industries where survey data was not available were allocated to quintiles by PwC subject matter experts with in – depth experience and market knowledge in these fields.
Deciding with data 62
40 ABS Cat. No. 8167.0 – Selected Characteristics of Australian Business, 2011 – 12, Skills. Data was not available for the Public Administration and Safety and Education and Training industries. Industries were ranked by quintiles. Two industries where survey data was not available were allocated to quintiles by PwC subject matter experts with in – depth experience and market knowledge in these fields.
41 Lateral Economics (2014), Open for business: how open data can help achieve the G20 growth target, commissioned by Omidyar Network, June 2014www.digitalinnovation.pwc.com.au/trends-driving-digital-innovation/. Accessed [5 August 2014].
42 Oxera (2013), What is the economic impact of Geo services, prepared for Google, January 2013
43 Lateral Economics (2014), Open for business: how open data can help achieve the G20 growth target, commissioned by Omidyar Network, June 2014
44 www.pwc.com/us/en/technology-forecast/2012/issue2/features/feature-cios-permeable-enterprose.jhtml. Accessed [20 August2014].
45 www.transport.nsw.gov.au/media-releases/new-real-time-transport-app-makes-waves-app-store. Accessed [18 August 2014].
46 PwC’s 6th Annual Digital IQ Survey, 2014 – www.digitalinnovation.pwc.com.au/australia-digital-iq-2014/. Accessed [30 July 2014].
47 www.gartner.com/newsroom/id/2207915. Accessed [19 August 2014].48 www.digitalinnovation.pwc.com.au/education/. Accessed [30 July 2014].49 www.mckinsey.com/insights/innovation/hal_varian_on_how_the_
web_challenges_managers. Accessed [8 August 2014].50 PwC (2014), Creating a mentally healthy workplace: return on
investment analysis, Final Report, March 201451 www.transport.nsw.gov.au/media-releases/new-real-time-transport-
app-makeswaves-app-store. Accessed [26 August 2014]52 Estimate assuming the opportunity cost of waiting for the two million
passengers is wages foregone. Wage information from 6302.0 – Average Weekly Earnings, Australia, May 2014
53 Comparison rates obtained from Rate City on 21 August 2014 54 www.asx.com.au/documents/products/ASX_Report_2012.pdf.
Accessed [26 August 2014].55 www.theaustralian.com.au/executive-living/motoring/the-insurance-
box-watchesyou-drive-and-could-cut-your-insurance-premium/story-fngmee2f-1226749928118. Accessed [26 August 2014].
56 www.business.nsw.gov.au/__data/assets/pdf_file/0019/26245/digital_economy_iap_final_20121213.pdf. Accessed [30 July 2014].
57 www.business.nsw.gov.au/__data/assets/pdf_file/0019/26245/digital_economy_iap_final_20121213.pdf
58 www.nicta.com.au/__data/assets/pdf_file/0004/38605/13_01_21_IFL_Cost_To_Serve_Poster_0_3.pdf. Accessed [20 August 2014].
59 www.chiefscientist.gov.au/wp-content/uploads/STEMstrategy290713FINALweb.pdf. Accessed [5 August 2014].
60 2007 Mathletics improvement analysis report61 Mathletics (2012), Usage and Improvement Survey 2011 and 201262 Passenger information is stored in line with the International Air
Transport Association privacy and security standards.
All years in this report refer to financial years ending 30 June.

63
Acknowledgements
This report was co-written by Duncan Stone and Rujia Wang – PwC on behalf of Google Australia.
The contact for this report at Google Australia is Matt Dawes.
We would like to thank all government agencies and companies who generously gave up their time to contribute to the case studies in this report:
• Ergon Energy
• NSW Department of Education and Communities
• NSW Health – Sydney Local Health District
• Queensland Health
• Rio Tinto
• SocietyOne
• The MindSpot Clinic
• United Energy
We would also like to thank our PwC colleagues who contributed their knowledge and assistance including Sammy Kumar (Managing Partner, Enterprise and Strategy & Transformation), Jeremy Thorpe (Partner, Economics & Policy), Trent Lund (Lead Partner, Innovation & Digital Ventures), Jason Juma-Ross (Lead Partner, Digital Intelligence), John Studley (Lead Partner, Analytics), Nirosha Methananda (Marketing Lead, Digital Change), Patrick Stafford (Digital Content Producer) and Ali Dalton (Graphic Designer).

© 2014 PricewaterhouseCoopers. All rights reserved.
PwC refers to the Australian member firm, and may sometimes refer to the PwC network. Each member firm is a separate legal entity. Please see www.pwc.com/structure for further details.
This content is for general information purposes only, and should not be used as a substitute for consultation with professional advisors.
Liability is limited by the Accountant’s Scheme under the Professional Standards Legislation.
PwC Australia helps organisations and individuals create the value they’re looking for. We’re a member of the PwC network of firms in 158 countries with close to 169,000 people. We’re committed to delivering quality in assurance, tax and advisory services. Tell us what matters to you and find out more by visiting us at www.pwc.com.auWL 127019431

Sammy KumarManaging Partner, Enterprise and Strategy & TransformationMelbourne+61 (3) 8603 [email protected]
Jeremy ThorpePartner, Economics & PolicyCanberra+61 (2) 6271 [email protected]
Trent LundLead Partner, Innovation & Digital VenturesSydney+61 (2) 8266 [email protected]
John StudleyLead Partner, AnalyticsMelbourne+61 (3) 8603 [email protected]
Contacts
www.digitalinnovation.pwc.com.au