The Futures of Russia: The picture of Russia through scenarios
Upload
moscowstateCategory
view
3download
0
POLICY RESEARCH WORKING PAPER WPS -21 00
Decentralization in Reglonal Considering the positiveimpact decentralization has
Fiscal Systems in Russia had on regional economic
performance and expenditure
Trends and Links structure, Russia's federal
government should:
to Economic Performance c Decisively protect local
self-govemance and budget
Lev Freinkman autonomy.
Plamen Yossifov Make intergovernmental
fiscal relations more
transparent.
- Develop universal models
of interactions between
regional and municipal
governments.
- Impose stricter limits on
total debt and budget deficits
of subnational governments.
The World BankEurope and Central Asia RegionPoverty Reduction and Economic Management Sector Unit
April 1999
Pub
lic D
iscl
osur
e A
utho
rized
Pub
lic D
iscl
osur
e A
utho
rized
Pub
lic D
iscl
osur
e A
utho
rized
Pub
lic D
iscl
osur
e A
utho
rized

POLICY RESEARCH WORKING PAPER 3000
Summary findings
To shed light on decentralization in Russia, Freinkman republics and okrugs but revenue arrangements differand Yossifov examine intergovernmental fiscal relations greatly. "True" decentralization has taken place inwithin regions. To analyze trends, they review channels oblasts and krais, where local authorities are providedof fiscal allocation within regions - tax sharing and with a bigger share of subnational tax revenues. Alocal transfer schemes. To evaluate the potential impact redistribution model applies in republics andof various fiscal decentralization patterns on regional autonomous okrugs, where greater local outlays haveeconomic performance (including growth and the budget been financed through larger transfers from regionaldeficit), they study data on the structure of 89 Russian governments.consolidated regional budgets for 1992-96. Regions near each other tend to have similar budget
They find that local governments' relative share of arrangements - the result of intensive interactionsRussia's consolidated budget, although substantive between neighbors and probably supported by the(roughly a quarter of the total budget), did not expand activities of regional associations. The size of a region'safter 1994. The federal government's relative role in territory does not influence decentralization outcomes.financing public goods and services declined as the Fiscal decentralization seems positively related to therelative role of local governments increased substantially. share of education spending in regional budgets. AndLocal governments collected more revenues in 1996 (6.4 regions with more decentralized finances tend topercent of GDP) and spent more than regional experience less economic decline.governments. They also substantially increased social But budget control is weaker in more decentralizedfinancing (including health, education, and social regions. Instability and lack of transparency inprotection). intergovernmental fiscal relations provide subnational
Russia made no progress toward a more transparent governments little incentive for responsible fiscal policy.system for tax assignments. Further decentralization with-out greater transparency
The average level of expenditure decentralization is could bring greater debt and deficits.similar for ethnically Russian regions and national
This paper-a product of the Poverty Reduction and Economic Management Sector Unit, Europe and Central Asia Region-is partof a larger effortin the unit to studyfiscal decentralization in transition economies. Copies of the paperare availablefree from the World Bank, 1818 H Street NW, Washington, DC 20433. Please contact Zakia Nekaien-Nowrouz, room 04-150, telephone 202-473-9057, fax 202-522-3607, Internet address znekaiennowrouzCaworldbank.org. Policy ResearchWorking Papers are also posted on the Web at http://wwxv.worldbank.org/html/dec/Publications/Workpapers/home.html.Lev Freinkman may be contacted at [email protected]. April 1999. (50 pages)
The Policy Research Working Paper Series disseminates the findings of work in progress to encourage the exchange of ideas aboutdevelopment issues. An objective of the series is to get the findings out quickly, even if the presentations are less than fully polished. 7'hepapers carry the names of the authors and should be cited accordingly. The findings, interpretations, and conclusions expressed in thispaper are entirely those of the authors. They do not necessarily represent the view of the World Bank, its Executive Directors, or thecountries they represent.
Produced by the Policy Research Dissemination Center

Decentralization in Regional Fiscal Systems in Russia: Trends
and Links to Economic Performance
Lev FreinkmanPlamen Yossifov'
The World Bank*
Ph.D. student in Economics at the University of Delaware. The work on this project was conductedduring a summer intemship at the World Bank (ECSPE) in the summer of 1998.
* The views in this paper are those of the authors and should not be attiibuted to the World BankWe are gratefiu to Daniel Treisman for fruitful discussions of various aspects of the analysis presentedhere and to Alexei MN Lavrov for sharing with us the database on Russian regional budgets. Commentsby Martha De Melo were also quite helpful.

Table of Contents
Section 1. Introduction I
Section 2. Data 1
Section 3. Analytical framework 3
Section 4. Main trends in fiscal decentralization, 1992-1996 6
Section 5. Decentralization at the regional level 16
Section 6. Measures of regional decentralization and subordination 21
Section 7. Decentralization and economic performance 29
Section 8. Conclusions 42
References 44
Appendixes 46

List of Tables
Table 1. Budget Revenues By Level Of Government, As Percent Of GDP 8
Table 2. Shares Of Different Government Levels In Consolidated Itemized Revenues, % 10
Table 3. Shares Of Itemized Revenues In Total Revenues At Different Levels Of TheGovermment, % 11
Table 4. Budget Expenditures by Level of Government, as Percent of GDP 13
Table 5. Shares Of Different Government Levels In Consolidated Itemized Expenditures, % 14
Table 6. Shares Of Itemized Expenditures In Total Expenditures At Different Levels Of TheGovermment, % 15
Table 7. Budget Balance By Level Of Government As Percent Of GDP, on a Cash Basis 16
Table 8. Budget Balance Before Transfers By Level Of Government As Percent Of GDP,On a Cash Basis 16
Table 9. Shares Of Local Governments In Total Consolidated Regional Revenues and inSelect Consolidated Regional Tax Revenues, % 17
Table 10. Shares Of Local Governments In Total Consolidated Regional Expenditures andIn Select Consolidated Regional Expenditures, % 19
Table 11. Average Shares Of Local Governments In "Social Protection" Outlays In The NorthernRegion And In The Russian Federation, % 20
Table 12. Measures Of Fiscal Decentralization, % 22
Table 13: Revenue Decentralization By Administrative Type Of Region, % 23
Table 14: Expenditure Decentralization By Administrative Type Of Region, % 24
Table 15. Measures Of Fiscal Subordination Of Subnational Governments In The Period1994- 1996,% 25
Table 16: Fiscal Subordination Of Local Governments By Administrative Type Of Region, % 26
Table 17: Fiscal Subordination Of Regional Governments By Administrative Type Of Region, % 27
Table 18: Coefficients Of Correlation Between Measures Of Fiscal Decentralization AndSubordination In Russian Regions 28
Table 19. Determinants Of Fiscal Decentralization 32
Table 20. Impact Of Decentralization On The Structure Of Budget Expenditures 35
Table 21. Impact Of Decentralization On Fiscal And Economic Performance 39
Appendix 1: Budget Revenues By Level Of Government, Mln. Current Rubles 46
Appendix 2: Budget Expenditures By Level Of Government, Mln. Current Rubles 48
Appendix 3: Budget Balance By Level Of Government, Mln. Current Rubles 50
Appendix 4: Budget Balance Before Transfers By Level Of Government, Mln. Current Rubles 50

1
1. Introduction
Fiscal decentralization in Russia has been an important dimension of reforms since 1992. Theissue has received a lot of attention recently in academic literature (Lavrov, 1995; Le Houerou, 1995;McLure at al, 1995; Treisman, 1998a; Wallich, 1994). As a rule these studies have been focused at threeaspects of evolving Russian federalism: delegation of specific revenue and expenditure assignments toregional governments, relationship between federal and regional budgets through various types of explicitand implicit transfers, and cross-regional budget equalization.
The main purpose of this paper is to look at one more aspect of the decentralization process,which relates to inter-government fiscal relations within the regions. The paper focuses on two elementsof such process. The first reflects overall trends in allocation of fiscal resources within regional fiscalsystems, primarily between regional and municipal levels of the government. We review both channels offiscal allocation within regions -- tax sharing and local transfer schemes. The second element relates topotential impact of various decentralization patterns on regional economic performance, such aseconomic growth and budget deficit. We use the data on the structure of 89 Russian consolidated regionalbudgets in 1992-96 to determine basic statistical characteristics of the decentralization process over theperiod and to provide correlation and regression analysis of links between decentralization, regionalindicators of social and industrial structure, and economic performance.
Section 2 provides a brief description of the data. Section 3 presents an analytical framework usedfor developing a statistical model. Section 4 reviews trends in the distribution of revenue and expenditureassignments between the federal, regional and municipal governments. Section 5 presents a more detailedanalysis of fiscal decentralization in Russian regions through the examination of trends in localgovernments' shares in main types of consolidated regional budget revenues and expenditures. In Section6, we suggest simple indicators of fiscal decentralization and subordination at the regional level andconduct their statistical analysis. Finally, in Section 7 we run a panel-data regression analysis of potentialdeterminants of the fiscal decentralization process. We also explore relationships between these indicatorsand regional economic performance. Section 8 brings main conclusions.
2. Data
This paper was inspired by the work of Lavrov (1 996a), for which a special database on thestructure of the Russian regional budgets for 1992-95 was collected'. Dr. Alexei Lavrov also shared withus the database, which derives from the standard reporting forms filed by regions with the federalMinistry of Finance. He also provided additional budget data for 1996. The database contains data onconsolidated budgets for each level of subnational governments (regions, cities of regional status, rayons,cities of rayon status, rural municipalities) for all 89 regions. In a sense we had access to quite a uniquedata set. Systematic analysis of local budgets in Russia and their relationships with higher level budgets isusually limited by lack of representative data. As a result, the research is based on small samples or casestudies (Freinkman and Titov, 1994; Mitcheneck, 1997a; World Bank, 1998; Zhuravskaya, 1997).
The data reflect actual outcomes of annual budget execution (i.e. it is not just agreed budgetallocation). According to Russian budget accounting standards, the data include both cash and non-cashcomponents of the actual budget flows, i.e. include budget revenues and expenditures occurred e.g.through barter or cancellation of mutual debts. Also, as is usual for Russian budget statistics, subnational
' Some results of this report were also presented in the paper by Kuznetsova, Lavrov and David (1997).

2
budgets are separated and do not include financial operations of municipal companies (other than budgetsubsidies to these companies).
We explored the database with a special focus on decentralization of consolidated regionalbudgets. The major differences in our approach compared to the one in Lavrov (1996a) include:
(a) We consolidated all types of local governments (i.e. governments below the regional level) and did nottry to look at any differences between them. While budget mechanisms in different types of municipalitiesare quite different (especially between major cities and rural rayons and municipalities), these differencesare less important from a decentralization perspective compared to a fundamental contrast betweenmunicipalities in general and regional administrations. At the same time, the size of the consolidatedbudget of all municipalities in each particular region is usually determined by the budgets of few largestcities that amount to 70-80% of the total. Thus, the share of all local budgets in the regional fiscal systemcould be considered as a proxy for the relative budget role of the largest urban municipalities. As it isshown below, the latter could be a potentially important variable related to the economic performance ofregions.
(b) We excluded all interbudgetary transfers within the regions from further consideration. Netting outinterbudgetary transfers is important, because the direct summation of total revenues/expenditures resultsin a substantial double counting and to overestimation of the real amount of fiscal resources beingcontrolled by local governments. Because of a multi-level structure of local governments in Russia, inter-government fiscal flows are quite intensive and could amount to 30% of gross (i.e. including transfers)total local budget revenues (see also Data Appendices).
(c) We excluded the cities of Moscow and St. Petersburg, which have a double status of "region-municipality" from the analysis. Given their weight in the total fiscal flows, such exclusion may changesubstantially statistical characteristics of the sample and influence conclusions of the analysis.
(d) Compared to the original work by Lavrov (1 996a), we tried to develop a more comprehensivestatistical analysis of the data, including cross-regional variation of main parameters and factor analysis ofdecentralization.
(e) Finally, we have used the data to explore the links between decentralization and regional economicperformance, which provides an opportunity to compare some conventional predictions of thedecentralization theory with actual numbers.
Also, we've had an opportunity to incorporate the 1996 budget outcomes into the database. Givenconsiderable stabilization efforts in Russia in 1995 such an extension may provide important additionalinformation. Data on 1996 reflect some initial post-stabilization fiscal realities, which could be differentfrom the trends observed during the inflationary phase of 1992-95.
All data on the federal budget is based on the reports from the Ministry of Finance with someadjustments done by the staff of the World Bank (Le Houerou, 1995; World Bank, 1998) to incorporatemajor types of off-budget operations of the central government. As usual in this kind of analysis, we donot consider here main extra-budgetary funds (such as the Pension fund) which operate outside of thetraditional government budget.
An important caveat relates to the quality of the data, that was affected by various incentives oflocal governments to underreport their budget revenues and hide them using all kinds of extrabudgetaryaccounts (World Bank, 1998). Still, we believe that the data quality is sufficient for adequate evaluationof prevailing trends in the subnational budget system.

3
3. Analytical framework
Political and fiscal decentralization has recently become a global trend that is widely consideredto be supportive of economic growth and more efficient provision of public services (Bahl and Linn,1992). These gains could derive from informational advantages of local governments, which are betterpositioned to reflect recipients' preferences in the process of service delivery as well as from competitionbetween local governments (Oates, 1972)2. Political dimension of the decentralization is also viewedquite positively because it facilitates establishing and strengthening of democratic institutions (Inman andRubinfeld, 1997).
By conventional measures fiscal decentralization in Russia has been evolving quite successfullyin 90-es. Consolidated regional budgets are now responsible for about a half of total budget spending,while their share amounted to about 15% in late 80-es (Freinkman and Haney, 1997). However, given therelatively large size of most Russian regions, it is not clear if devolution of functions from the center toregions is sufficient for enjoying all decentralization gains mentioned above. If most resources andfunctions are concentrated within regional governments and not delegated to the local level, there is a riskthat the single centralized state would be replaced by numerous centralized entities of smaller size thatcould neither exploit informational advantages nor be seriously influenced by competitive pressures. Inthe latter case, another stage of the decentralization process would be required to force regions to sharemore resources with local governments.
In reality, the Russian environment for decentralization is characterized by wide opportunities forthe regions to decide almost unilaterally on specific arrangements for power and budget sharing withmunicipalities. A legal framework for fiscal federalism at the regional level is quite weak and regionalauthorities have full discretion not just for determining a desirable degree of centralization andredistribution of fiscal flows but also for frequently changing the rules of the game (World Bank, 1998).Recent analysis of various aspects of economic policy conducted by Russian regional governmentssuggests high cross-regional variation in both chosen strategies and to-date outcomes of economicdevelopment (Lavrov, 1996b) as well as in regional governance regimes (Mitcheneck, 1997b). In such anenvironment, it seems quite likely to expect a substantial cross-regional variation in actualdecentralization patterns. Regions may experiment with more or less centralized schemes depending ontheir political preferences, specifics of economic structure, and social and geographical features. Givenmentioned above predictions of the theory of fiscal federalism, one may expect that the actual degree ofregional decentralization would matter: more decentralized regions, all other factors equal, woulddemonstrate stronger economic growth (less decline).
Thus recent Russian developments provide an interesting statistical material - a relatively largesample of similar government entities that have been pursuing different decentralization policies -- to betested against some conventional theoretical principles. Traditionally, impact of decentralization oneconomic performance is studied based on cross-country regressions, which have their own limitationsrelated to high heterogeneity of the sample by too many parameters. Decentralization is a complex multi-dimensional process, and its impact on economic performance is difficult to isolate from influences ofvarious cultural, political, and historical factors. In this respect, the sample of Russian regions is muchmore homogeneous because, notwithstanding existing cross-regional variation, all regions of Russia havestrong common roots in modern history of the Russian/Soviet state. This common cultural and politicalbackground may provide more chances for identification and accurate statistical measuring of links andcorrelations in the sample.
2 Zhang and Zou (1997) provide a general model for analyzing the impact of inter-government and inter-sectoralallocation of budget expenditures on economic growth.

4
There are some country-specific arguments in support of a possible positive link between regionaldecentralization and regional growth in Russia. Recent experience of the most advanced countries intransition demonstrated that economic recovery and growth is primarily concentrated in the largest cities(urban municipalities) which is associated with more favorable industrial structure, better access toinfrastructure and human capital in metropolitan areas. But in Russia, local governments in urban areas ofpotential economic growth, face economic disincentives that derive from excessive and discretionarycentralization of fiscal gains that such a growth may bring.
Under current fiscal arrangements, the rules of tax sharing between the local and regionalgovernments are negotiated annually-or sometimes several times a year. The shares tend to bedifferentiated sharply across municipalities, with a few largest industrial centers often contributing largeshares of main taxes, while rural rayons keep 100 percent and also receive most of regional budgettransfers. The sharing rates vary not just between urban and rural districts within the same oblasts, butalso between urban districts in different oblasts. In 1993, the city of Tver was permitted to keep 3 percentof profit tax revenues, 4.3 percent of VAT, and 5 percent of personal income tax collected in the city. Therest went to federal and regional budgets. The corresponding rates for the city of Yaroslavl, however,were 12, 10 and 80 percent. (Institute for Local Government, 1994)
Research suggests that urban municipalities are punished for better revenue performance byhaving their tax shares lowered. One study of the budgets of 35 large cities in 29 Russia's regions in1992-97 found that for every ruble that a local budget's own revenues increased in a given year, about 90kopecks were taxed away by reductions in the transfers and tax shares that the superior regionalgovernment allowed (Zhuravskaya, 1998). Thus, any increase in the effectiveness of tax collection orincrease in local revenues due to growth-promoting policies would be unlikely to make the localgovernments better off than before.
Analysis of the trends in tax sharing rates for rayon budgets in Yaroslavl oblast in 1994-98 alsosuggests that urban municipalities are the most affected by the existing system (World Bank, 1998). As inmost other Russian regions, all the 12 rural rayons are recipients of transfers within the regional budgetsystem and always have been getting maximum possible tax shares. In contrast, all urban rayons arefacing a gradual decline in their tax share. The rate of this decline is not monotonic, influenced bybargaining power of specific municipal leaders, and hardly could be predicted in advance by municipalauthorities.
Overall, these examples may suggest that large urban municipalities in Russia are the mainbeneficiaries from decentralization of regional budgets. Decentralization brings them more resources andmore incentives to use them more efficiently. While we believe that in Russia, as in other countries intransition, an average rate of return of budget spending is much higher in urban centers, thendecentralization may support growth through simple reallocation of resources from less to more efficientusers.3
For further justification of this argument, it is necessary to look at differences in the structure ofbudget spending at various government levels. Different combinations of investment, subsidies, andsocial spending have a different impact on economic growth. From this perspective, there is an evidencethat it is regional governments who are responsible for most enterprise subsidies remained in the Russianfiscal system (Freinkman and Haney, 1997). These subsidies are a serious barrier for restructuring ofrecipient enterprises, which are usually the largest local companies with a sufficient lobbying power to
3 By the same reason, decentralization, by reducing redistribution, may lead to an increase in fiscal inequality acrosslocal govermments, especially between urban and rural municipalities.

5
extract budget funds. It sounds plausible that less decentralized regional fiscal systems (i.e. with a highershare of regional governments) would tend to have more subsidies, less enterprise restructuring and lessgrowth.
Recent analysis of the relation between decentralization and growth in developing countriesfound, contrary to the theoretical predictions, a negative correlation between these two variables. Theseresults hold for three different cases: a cross-country model estimated for 46 developing countries(Davoodi and Zou, 1998), cross-country model for developed and developing countries (Fukasaku and DeMelo, 1997), and cross-provincial model for a specific country, China (Zhang and Zou, 1 998) 4 Severalfactors are named that could be responsible for this inconsistency between the theory and the outcome ofstatistical analysis. They include: (i) wrong composition of expenditure made by local governments,which may in part derive from the fact that local governments in many countries are not elected and thusnot responsive to local preferences; (ii) local government autonomy in expenditure decisions may belimited due to excessive interventions of the central government; in other words, simple measures offiscal decentralization based on a share of subnational governments in consolidated budget expendituresmay overestimate actual degree of decentralization; (iii) in some countries (e.g. China) programs of thecentral government could be more efficient due to nation-wide externalities associated with largeinfrastructure projects and similar types of spending.
While traditionally decentralization and growth were seen as positively correlated, impact ofdecentralization on fiscal performance was usually considered as potentially more problematic (Wildasin,1998). These worries that decentralization may contribute to fiscal imbalance and accumulation of publicdebt have become stronger recently (Tanzi, 1996) in part as a reflection of subnational debt crisis in LatinAmerica (Dillinger and Webb, 1998). However, available theoretical and empirical work does not providesufficient support for the validity of these concerns (Hunter and Shah, 1998; Fornasari at al., 1998). Inparticular, Wildasin (1997) argues that ultimate impact of the decentralization on fiscal performance ishighly dependent upon basic characteristics of the system of inter-governmental fiscal relations such astransparency, accountability, and predictability. He also suggests that the size of individual subnationalgovernments could be of critical importance: some subnational governments are just too large to fail andhave weak incentives for responsible fiscal policy. The latter leads to a higher probability of their defaultto be followed by bailout by the central government. Another recent paper (Fornasari at al., 1998), whichwas also based on the cross-country analysis, shows that the size of subnational government is positivelycorrelated with the size of the national budget deficit. However, the paper examines the effect of anabsolute size of subnational governments (as percent of GDP), not their relative size (as percent of theoverall government size), which would be a more appropriate measure of decentralization. Also, theseresults still do not address a more a general question - what is the impact of the decentralization on theoverall fiscal performance (consolidated budget deficit)?
From this perspective, it seems interesting to explore the impact of decentralization on fiscalperformance within the sample of Russian regions. Changes in a degree of decentralization lead tosubstantive modifications in institutional setting for the budget management. Peculiar features of budgetinstitutions are likely to bring about changes in fiscal performance (Alesina, 1996). Thus, it is easy toexpect some correlation between decentralization and e.g. size of budget deficit. But what may be a signof such correlation? On one side, following Wildasin's model, one may argue that, given all existing non-
4However, for India the same authors (Zhang and Zou, 1997) found that most measures of decentralization arepositively correlated with the state economic growth. In both cases, for China and India, they consider a two-levelgovernment model with the municipal level being excluded from analysis. Also, the recent study by Hunter andShah (1998) provides some but very indirect evidence of positive link between decentralization and growth. Theydevelop an index of good governance and show that the index is positively related to both decentralization andeconomic growth.

6
transparency and non-predictability in budget relations between regional and municipal governments,more decentralized regions would have less fiscal discipline and higher budget deficits. On the other side,in the Russian environment, individual local governments have less access to capital markets thanregional ones because municipalities have less control over their revenue flow and thus are considered bycreditors as more risky. So far, most of subnational debt and deficit in Russia was concentrated at theregional level, which to large extent reflects restricted opportunities of local governments to attract deficitfinancing (World Bank, 1998). Also, decentralization, by reducing the size of regional governments,effectively limits their opportunities to borrow relatively to the size of the consolidated regional budget.Thus, one may expect that more decentralized fiscal systems, in which local governments control arelatively larger portion of total budget, would carry less debt and deficit.
4. Main trends in fiscal decentralization, 1992-96
The legal framework for local decentralization is provided by several federal laws that in generalgive regional legislature almost unlimited power for sharing fiscal resources with municipalities (Lavrov,1996a; Yandiev, 1997). There are two primary channels for decentralization of budget funds: tax sharingand regional budget transfer program (World Bank, 1998). Under current arrangements, the shares ofshared taxes that each local budget receives are negotiated annually -- or sometimes several times a year -- between the local and regional governments. As mentioned above, the shares tend to be differentiatedsharply across municipalities.
A specific feature of fiscal decentralization in Russia relates to a very limited role of local taxesin subnational budgets. The lion's share, about 75%, of all subnational tax revenues derives from fourmajor federal taxes that are shared on a derivation basis and neither regional nor local governments haveleverage regarding tax rates and tax bases of these taxes. Conflicts related to intra-regional allocation ofsubnational shares of main tax between regional and municipal governments constitute a center part of thewhole budget preparation process. Local governments have very limited room for collecting morerevenues through additional taxation. In 1996-97, the single largest local tax - tax on upkeep of socialassets - amounted to 7-10% of total budget revenues in cities that have used it actively. However, the draftTax Code provides for elimination of this tax (together with other similar taxes levied on gross turnover).At the same time, insufficient discretion of local governments over their tax sources does generate lack ofaccountability: local leaders may always argue that higher levels of government deprive them from anyinstruments to increase revenues and thus improve service delivery. For local governments in areas ofpotential economic growth, the expectation of punitive extraction by the regional government createsincentives to keep their budget revenues hidden.
Anecdotal evidence suggests that the reported numbers on the size of municipal budgets mayexaggerate the actual degree of regional decentralization. This caveat is important for adequateinterpretation of the data that follow. Various expenditures could be nominally funded from local budgetswhile decisions on their allocation may be made at the regional level, with municipalities merelyexecuting regional government decisions. Some regions have recently recentralized some types ofexpenditures, such as infrastructure investments.
At least among regions, which are recipients of large amounts of federal transfers, regionalauthorities have much control over the revenue and expenditure patterns of municipal governments. Thewidespread use of non-cash schemes for budget execution further supports such a trend toward greaterregional control since schemes of mutual settlements enjoy significant economies of scale. However, thistrend is balanced to some extent with strengthening of practice of local elections and establishment ofstructures of local-self government, which feel sufficient popular support to stand regional pressures.

7
Between 1992 and 1996, the relative size of the enlarged Russian government, measured by thesize of its budget, has shrunk substantially. However, as seen from Tables 1-6, the observed downsizingof the Russian government was not similar across the different government levels.
The consolidated budget revenues5 of all levels of the government fell from 33.4% of GDP in1992 to 27.2% in 1996 (Table 1). During that period, federal government's total revenues shrunk from20.1% of GDP to 14.5% in 1996, while subnational governments saw little change in the size of theirrevenues relative to GDP. As a result, by 1996 subnational governments controlled 46.5% of consolidatedbudget revenues net of interbudgetary transfers, up from 39.8% in 1992 (Table 2). All thisdecentralization shift happened in 1992-94, while in 1995-96 the share of the federal governmentregained some ground.
The relative share of local governments in the Russian consolidated budget did not expand muchsince 1994 and they remain in control of about a quarter of total budget expenditures. However, at thesubnational level, the relative size of the local budgets increased at the expense of some compression inregional budgets. 1996 was the first year, when local governments collected more budget revenues (6.4%of GDP) than regional administrations.
As seen in Table 1, the overall decline in consolidated government revenues relative to GDP canbe largely attributed to weakening tax collection. Between 1992 and 1996, the consolidated tax revenuesof all tiers of the government dropped from 29.6% to 23.2% of GDP. This overall downward trend wasdriven by two especially sharp drops (each in excess of 4.5 percentage points) in total tax collections thatoccurred in 1993 and 1995. The systemic problems created by the transition to a market economysubstantially eroded the collection base of many taxes. At the same time, tax administration in Russia hasbeen traditionally weak.6
In 1996, overall budget revenues from the Profit Tax were only 4.6% of GDP, compared to 8.2%in 1992. The VAT receipts relative to GDP also dived from 10.5% to 7.5% in 1996. The reassertion ofproperty rights however, boosted the revenues from Property Taxes and their volume has been steadilyrising to reach 1.7% of GDP in 1996. Over this period, cumulative non-tax revenues - includingprivatization receipts - failed to increase relative to GDP. In 1996, they summed up to 4% of GDP - asmall improvement compared to their 1992 value of 3.7%.
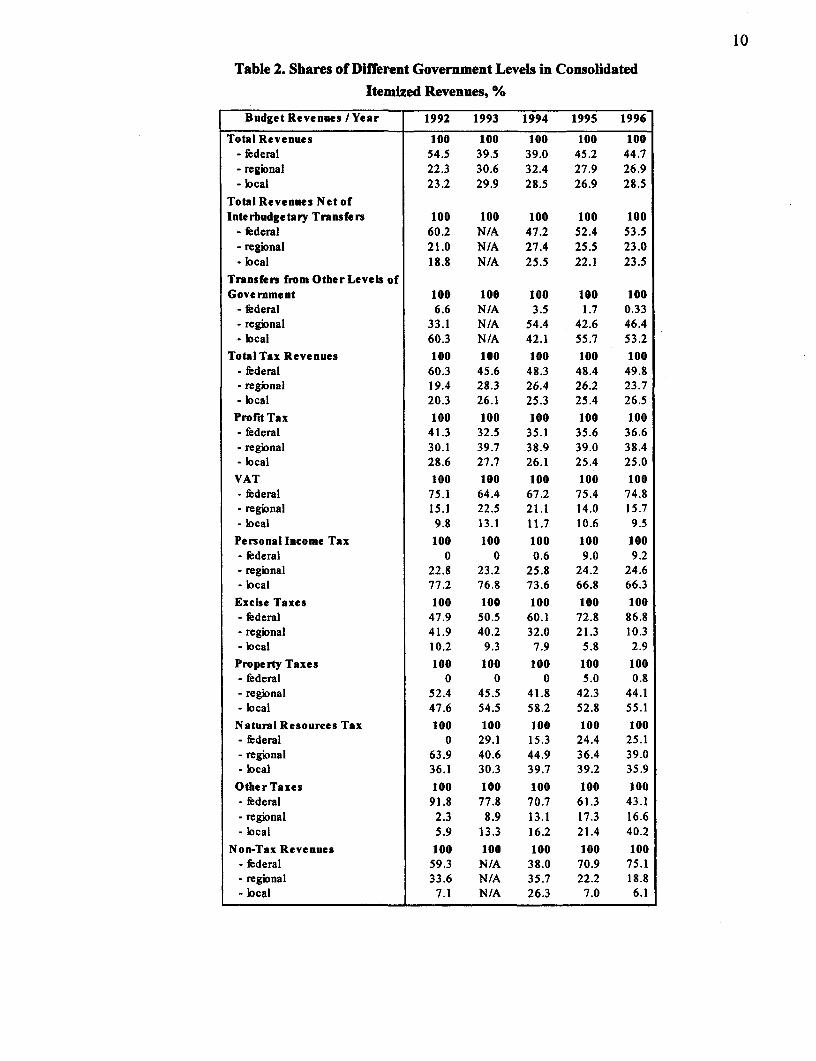
The trends of revenue sharing between the three tiers of government were quite different for thevarious types of main taxes (Table 2). Throughout the period, local governments' share in VAT has beenfairly stable (around 10%), while their allotments of the Profit Tax and the Personal Income Tax revenueshave fallen by 3.6 and 10.9 percentage points respectively. Between 1992 and 1996, regionalgovernments enhanced their share in Profit Tax revenues by '8.3 percentage points, while broadlypreserving their shares of the Personal Income Tax and the VAT - 24.6% and 15.7% in 1996 respectively.
5Calculated as the sum of total revenues of the three tiers of govermment net of all budgetary transfers from onegovernment level to another.
6 Treisman (1998b) provides detailed analysis of factors responsible for poor tax performance.

Table 1. Budget Revenues by Level of Government as Percent of GDP, %
BudgetRevenues IYear 1992 1993 1994 1995 1996
Total Revenues 37.30 36.71 36.96 31.52 32.58- federal 20.34 14.51 14.43 14.24 14.56- regional 8.32 11.23 11.98 8.80 8.75- local 8.64 10.97 10.55 8.48 9.27
Total Revenues Net ofInterbudgetary Transfers 33.38 N/A 30.08 27.03 27.18
- federal 20.08 14.49 14.19 14.16 14.54- regional 7.02 9.67 8.23 6.89 6.24- local 6.27 N/A 7.66 5.98 6.40
Transfers from Other Levels ofGovernment 3.93 N/A 6.89 4.49 5.40
- federal 0.26 0.02 0.24 0.08 0.02- regional 1.30 1.55 3.75 1.91 2.51- local 2.37 N/A 2.90 2.50 2.87
Total Tax Revenues 29.64 25.13 26.85 22.23 23.21- federal 17.87 11.46 12.97 10.76 11.56- regional 5.76 7.12 7.08 5.82 5.50- local 6.00 6.55 6.81 5.65 6.15
Profit Tax 8.23 9.81 8.02 7.16 4.58- federal 3.40 3.19 2.81 2.55 1.68- regional 2.48 3.90 3.12 2.79 1.76- local 2.35 2.72 2.09 1.82 1.14
VAT 10.52 6.57 6.83 5.84 7.46- federal 7.90 4.23 4.59 4.40 5.58- regional 1.59 1.48 1.44 0.82 1.17- local 1.03 0.86 0.80 0.62 0.71
Personal Income Tax 2.27 2.56 2.87 2.23 2.55- federal 0 0 0.02 0.20 0.23- regional 0.52 0.59 0.74 0.54 0.63- local 1.75 1.97 2.11 1.49 1.69
Excise Taxes 1.10 1.04 1.22 1.48 2.85- federal 0.53 0.52 0.73 1.08 2.47- regional 0.46 0.42 0.39 0.31 0.29- local 0.11 0.10 0.10 0.09 0.08
Property Taxes 0.28 0.32 0.79 1.03 1.67- federal 0 0 0 0.05 0.01- regional 0.15 0.15 0.33 0.43 0.74- local 0.14 0.17 0.46 0.54 0.92
Natural Resources Tax 0.64 0.50 0.40 0.75 1.02- federal 0 0.14 0.06 0.18 0.26- regional 0.41 0.20 0.18 0.27 0.40- local 0.23 0.15 0.16 0.30 0.37
OtherTaxes 6.59 4.34 6.72 3.75 3.09- federal 6.04 3.37 4.75 2.30 1.33- regional 0.15 0.39 0.88 0.65 0.51- local 0.39 0.58 1.09 0.80 1.24
Non-Tax Revenues 3.74 N/A 3.22 4.81 3.96- federal 2.21 3.03 1.22 3.41 2.98- regional 1.26 2.55 1.15 1.07 0.75- local 0.27 N/A 0.85 0.34 0.24

9
The single most important development throughout the period, was the federal government'sreclaim of sizable portions of the Excise Taxes and the Natural Resources Tax. While in 1992, the federalgovernment received 47.9% of the Excise Taxes and none of the Natural Resources Taxes, by 1996 thefederal shares in these taxes have risen to 86.8% and 25.1% respectively.
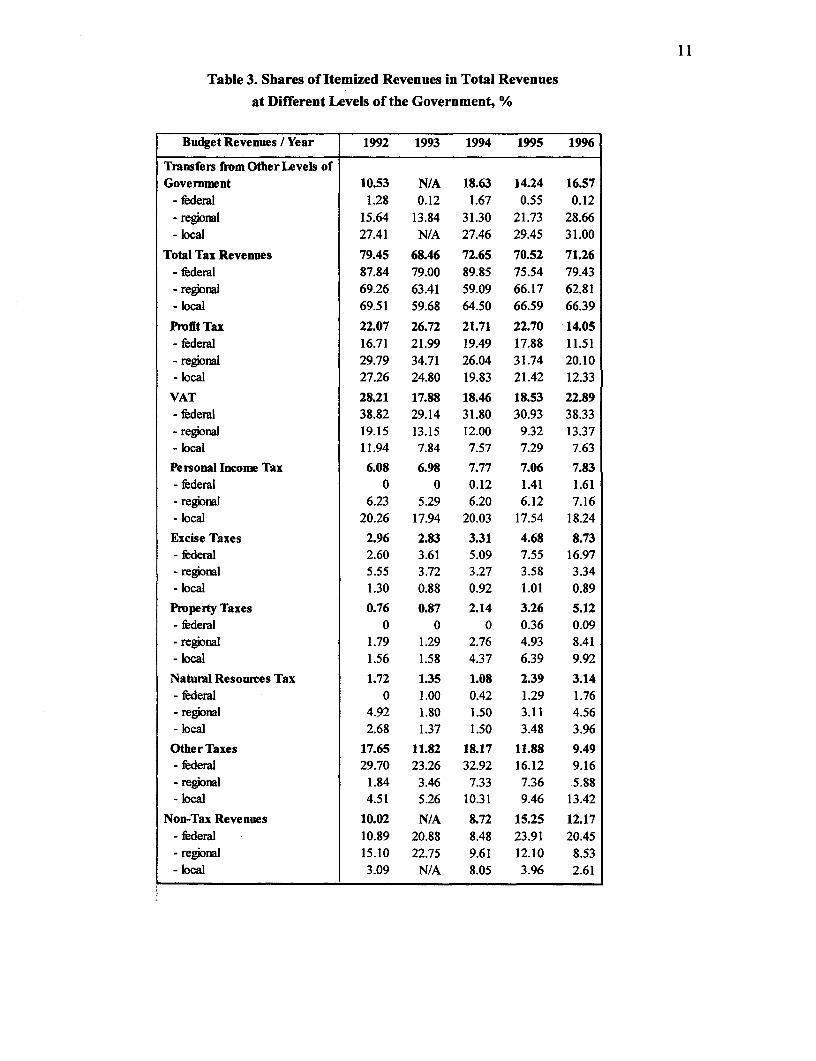
Table 3 shows the relative roles of various types of revenues in the financing of local, regionaland federal budgets. The data reveals a serious cross-government disparity between the portions of totalrevenues derived from the four main shared taxes7 and the other taxes. Between 1992 and 1996, thecombined share of the Profit Tax, VAT, Personal Income Tax and Excises in total revenues of local andregional governments declined by 21.7 and 16.8 percentage points respectively. In 1996, these four maintaxes accounted for 39.1% of local and 44% of regional total revenues. In contrast, at the federal level theportion of total revenues derived from the four main taxes increased from 58.1% in 1992 to 68.4% in1996. At the same time, the corresponding shares of Property Taxes grew more than four times (to 8.4%of the total) at regional and six times (to 9.9%) at the local government level. Share of other taxesdeclined at the federal level (where they mainly represent foreign trade taxes) but increased at thesubnational level (where they represent numerous small taxes and fees, which frequently are regionspecific).
One possible explanation of this phenomenon is that subnational governments have almost nocontrol over the rates and the tax base of shared tax revenues assigned to them and therefore they do nothave leverage to push for expansion in collection of these taxes. In addition, because of the shared natureof these taxes, subnational governments have limited incentives to strengthen tax administration for maintaxes. Consequently, one of the few ways in which subnational governments can independently raisemore revenues is through more active involvement in the collection of local taxes, first of all the Propertyand the Land Taxes. From the other hand, it is the federal government who controls the assignment ofshares from the shared taxes to the lower levels of government, but has few alternative sources of taxreceipts. As a result, in response to growing fiscal pressures, the federal government tends to makeregular changes in tax sharing and increase its share in four main shared taxes.
On the expenditure side, the consolidated expenditures8 of all levels of the government fell from51.6% of GDP in 1992 to 35.3% in 1996 (Table 4). It is worth mentioning that the magnitude of thisdecline in government spending was more than twice the size of the negative shocks experienced on therevenue side of government budgets. Thus, the shrinkage of the Russian government was driven not onlyby the government's sheer inability to generate tax revenues, but also by a considerable stabilizationeffort by the Russian government. In 1996, the enlarged government experienced a moderate expansion asthe share of consolidated budget expenditures in GDP increased by 4.1 percentage points.
The government expenditure items most adversely affected by this scaling down were those of"National Economy" and "Defense". The outlays on "National Economy" - including subsidies toenterprises and housing - decreased from 26.4% of GDP in 1992 to 8.6% in 1996, while the defenseexpenditures dropped by 1 percentage point. Throughout the period, overall budget expenditures on"Education", "Health and Sports" and "Culture and Mass Media" as percent of GDP remained fairlystable around their 1992 levels.
7The Profit Tax, the VAT, the Personal Income Tax and Excise Taxes that together provide about 75% of total taxrevenues of the consolidated budget.
Calculated as the sum of total expenditures of the three tiers of government net of all transfers from onegovernment level to another.
10
Table 2. Shares of Different Government Levels in ConsolidatedItemized Revenues, %
Budget Revenues /Year 1992 1993 1994 1995 1996
Total Revenues 100 100 100 100 100- federal 54.5 39.5 39.0 45.2 44.7- regional 22.3 30.6 32.4 27.9 26.9- local 23.2 29.9 28.5 26.9 28.5
Total Revenues Net ofInterbudgetary Transfers 100 100 100 100 100
- federal 60.2 N/A 47.2 52.4 53.5- regional 21.0 N/A 27.4 25.5 23.0- local 18.8 N/A 25.5 22.1 23.5
Transfers from OtherLevels ofGovernment 100 100 100 100 100
- federal 6.6 N/A 3.5 1.7 0.33- regional 33.1 N/A 54.4 42.6 46.4- local 60.3 N/A 42.1 55.7 53.2
Total Tax Revenues 100 100 100 100 100- federal 60.3 45.6 48.3 48.4 49.8- regional 19.4 28.3 26.4 26.2 23.7- local 20.3 26.1 25.3 25.4 26.5
Profit Tax 100 100 100 100 100- federal 41.3 32.5 35.1 35.6 36.6- regional 30.1 39.7 38.9 39.0 38.4- local 28.6 27.7 26.1 25.4 25.0
VAT 100 100 100 100 100- federal 75.1 64.4 67.2 75.4 74.8- regional 15.1 22.5 21.1 14.0 15.7- local 9.8 13.1 11.7 10.6 9.5
Personal Income Tax 100 100 100 100 100- federal 0 0 0.6 9.0 9.2- regional 22.8 23.2 25.8 24.2 24.6- local 77.2 76.8 73.6 66.8 66.3
Excise Taxes 100 100 100 100 100- federal 47.9 50.5 60.1 72.8 86.8- regional 41.9 40.2 32.0 21.3 10.3- local 10.2 9.3 7.9 5.8 2.9
Property Taxes 100 100 100 100 100- federal 0 0 0 5.0 0.8- regional 52.4 45.5 41.8 42.3 44.1- local 47.6 54.5 58.2 52.8 55.1Natural Resources Tax 100 100 100 100 100- federal 0 29.1 15.3 24.4 25.1- regional 63.9 40.6 44.9 36.4 39.0- local 36.1 30.3 39.7 39.2 35.9
OtherTaxes 100 100 100 100 100- federal 91.8 77.8 70.7 61.3 43.1- regional 2.3 8.9 13.1 17.3 16.6- local 5.9 13.3 16.2 21.4 40.2
Non-Tax Revenues 100 100 100 100 100- federal 59.3 N/A 38.0 70.9 75.1- regional 33.6 N/A 35.7 22.2 18.8- local 7.1 N/A 26.3 7.0 6.1
11
Table 3. Shares of Itemized Revenues in Total Revenues
at Different Levels of the Government, %
Budget Revenues / Year 1992 1993 1994 1995 1996
Transfers from OtherLevels ofGovemment 10.53 N/A 18.63 14.24 16.57
- federal 1.28 0.12 1.67 0.55 0.12- regional 15.64 13.84 31.30 21.73 28.66- local 27.41 N/A 27.46 29.45 31.00
Total Tax Revenues 79.45 68.46 72.65 70.52 71.26- fderal 87.84 79.00 89.85 75.54 79.43- regional 69.26 63.41 59.09 66.17 62.81- local 69.51 59.68 64.50 66.59 66.39
Profit Tax 22.07 26.72 21.71 22.70 14.05- federal 16.71 21.99 19.49 17.88 11.51- regional 29.79 34.71 26.04 31.74 20.10- local 27.26 24.80 19.83 21.42 12.33
VAT 28.21 17.88 18.46 18.53 22.89- fIderal 38.82 29.14 31.80 30.93 38.33- regional 19.15 13.15 12.00 9.32 13.37- local 11.94 7.84 7.57 7.29 7.63
Personal Income Tax 6.08 6.98 7.77 7.06 7.83- federal 0 0 0.12 1.41 1.61- regional 6.23 5.29 6.20 6.12 7.16- local 20.26 17.94 20.03 17.54 18.24
Excise Taxes 2.96 2.83 3.31 4.68 8.73- federal 2.60 3.61 5.09 7.55 16.97- regional 5.55 3.72 3.27 3.58 3.34- local 1.30 0.88 0.92 1.01 0.89
Property Taxes 0.76 0.87 2.14 3.26 5.12- federal 0 0 0 0.36 0.09- regional 1.79 1.29 2.76 4.93 8.41- local 1.56 1.58 4.37 6.39 9.92
Natural Resoumres Tax 1.72 1.35 1.08 2.39 3.14- federal 0 1.00 0.42 1.29 1.76- regional 4.92 1.80 1.50 3.11 4.56- local 2.68 1.37 1.50 3.48 3.96
OtherTaxes 17.65 11.82 18.17 11.88 9.49- federal 29.70 23.26 32.92 16.12 9.16- regional 1.84 3.46 7.33 7.36 5.88- local 4.51 5.26 10.31 9.46 13.42
Non-Tax Revenues 10.02 N/A 8.72 15.25 12.17- federal 10.89 20.88 8.48 23.91 20.45- regional 15.10 22.75 9.61 12.10 8.53- local 3.09 N/A 8.05 3.96 2.61

12
The observed downsizing of the government varied across the different levels of administration.While federal government expenditures shrunk from 39.2% of GDP in 1992 to 19.6% in 1996,expenditures of regional and municipal governments rose by 1.8 and 1.5 percentage points of GDPrespectively. As a result, by 1996 subnational governments accounted for 44.6% of consolidated publicexpenditures net of interbudgetary transfers (Table 5). Throughout the whole period, the overall size ofthe local government tier exceeded that of the regional one. Between 1992 and 1996, the share of localgovernments in consolidated budget expenditures net of interbudgetary transfers rose from 14.9% to26.2%, while the corresponding regional share increased from 9.1% to 18.4%.
While quite substantive, the relative size of local budgets in Russia did not expand since 1994.Local governments have been responsible for about a quarter of the consolidated budget expenditures (netof transfers) and for more than a half of total subnational budget expenditures. At the same time, therelative role of local governments has been substantially increasing in financing of social sectors,including education, health, and social protection. With a growing share of federal budget spent on debtservice, the role of the federal government in financing public goods and services increasingly becomesless important.
This process of fiscal decentralization brought a swift change in the proportions of itemizedexpenditures, financed by the different levels of government. Between 1992 and 1996, the federalgovernment's share in spending on "National Economy" fell from 80.8% to 27.5% (Table 5). At the sametime, since 1994 local governments have become the biggest spenders on this expenditure item and by1996 their share in total outlays on "National Economy" was in excess of 40%. As seen in Table 6,throughout the whole period local governments consistently allocated more than 35% of their budgets onsubsidies. This makes the category "National Economy" their number one spending priority, whichrelates to continuing pressures for subsidies in housing that is a sector under municipal responsibility.Regional governments have been spending on subsidies relatively less than municipalities but still thelargest part (about 30%) of their budgets. However, recipients of regional subsidies are quite differentfrom those who are subsidized by municipalities. Regional budgets subsidize primarily the largest localindustrial enterprises as well as traditional former state farms in agriculture. Therefore regional subsidiesare considered to be more distortive as they have a stronger negative impact on economic restructuringand growth (Freinkman and Haney, 1997).
"Social Protection" was one of the few spheres of public expenditures that modestly expanded as ashare of GDP over the years. The 0.7 percentage points increase was accompanied by a dramaticdownward shift of expenditure responsibilities. Over the period, local governments share in consolidatedbudget expenditures on "Social Protection" jumped from 7.8% in 1992 to 42% in 1996.
Regional and local governments further increased their involvement in spheres that they havetraditionally dominated. Between 1992 and 1996, local governments' share in consolidated budgetexpenditures on "Education" rose by more than 15 percentage points to reach 67.5% in 1996. Thisexpenditure item was the second largest in local budgets after outlays on "National Economy" andaccounted for more than one quarter of their spending (Table 6).

13
Table 4. Budget Expenditures by Level of Government as Percent of GDP, %
BudgetExpenditures/Year 1992 1993 1994 1995 1996
Total Expenditures 56.06 46.14 46.14 36.06 40.98- federal 40.91 25.10 24.24 18.45 22.17- regional 7.38 10.51 11.71 9.08 9.42- local 7.77 10.54 10.20 8.53 9.40
Total Expenditures Net ofInterbudgetary Transfers 51.63 NIA 38.64 31.19 35.30
- federal 39.24 22.53 20.39 16.31 19.57- regional 4.70 N/A 8.15 6.52 6.49- local 7.69 10.19 10.10 8.36 9.23
Transfers to OtherLevels ofGovernment 4.43 N/A 7.51 4.87 5.68
- federal 1.67 2.57 3.84 2.14 2.59- regional 2.68 N/A 3.56 2.56 2.92- local 0.08 0.35 0.10 0.17 0.16
NationalEconomy 26.42 13.45 10.60 8.34 8.56- federal 21.35 6.53 3.22 2.20 2.35- regional 2.31 3.31 3.68 2.96 2.77- local 2.76 3.61 3.70 3.19 3.43
Education 3.58 4.06 4.51 3.48 3.82- federal 1.21 0.79 0.90 0.55 0.56- regional 0.52 0.77 0.86 0.69 0.69- local 1.85 2.50 2.75 2.24 2.58
Health and Sport 2.47 3.11 3.25 2.37 2.61- federal 0.28 0.33 0.38 0.23 0.27- regional 0.70 0.94 1.08 0.79 0.86- local 1.49 1.85 1.78 1.35 1.48
Social Protection 1.08 0.74 0.78 1.28 1.76- federal 0.77 0.38 0.39 0.24 0.55- regional 0.22 0.26 0.27 0.40 0.47- local 0.08 0.10 0.12 0.64 0.74
Administration and Justice 1.84 2.32 2.96 2.40 2.78- federal 1.48 1.85 2.41 1.51 1.77- regional 0.10 0.14 0.18 N/A 0.53- local 0.26 0.33 0.37 N/A 0.48
Culture and Mass Media 0.61 0.57 0.73 0.55 0.59- federal 0.31 0.20 0.29 0.17 0.21- regional 0.13 0.17 0.21 0.17 0.17- local 0.17 0.20 0.23 0.21 0.21
Defence 4.50 4.20 4.67 3.04 3.47- federal 4.50 4.20 4.67 3.04 3.47- regional 0 0 0 0 0- local 0 0 0 0 0
Loans 5.04 N/A 2.72 0.99 0.91- federal 4.61 1.70 2.30 0.58 0.28- regional 0.20 N/A 0.34 0.34 N/A- local 0.23 N/A 0.08 0.06 N/A
OtherExpenditures 6.09 N/A 8.42 8.73 10.78- federal 4.72 6.55 5.83 7.77 10.12- regional 0.52 N/A 1.51 N/A N/A- local 0.85 N/A 1.08 N/A N/A

14
Table 5. Shares of Different Government Levels in ConsolidatedItemized Expenditures, %
Budget Expenditures / Year 1992 1993 1994 1995 1996
Total Expenditures 100 100 100 100 100- federal 73.0 54.4 52.5 51.1 54.1- regional 13.2 22.8 25.4 25.2 23.0- local 13.9 22.8 22.1 23.7 22.9
Total Expenditures Net ofInterbudgetary Transfers 100 100 100 100 100
- federal 76.0 N/A 52.8 52.3 55.4- regional 9.1 N/A 21.1 20.9 18.4- local 14.9 N/A 26.1 26.8 26.2
Transfers to OtherLevels ofGovernment 100 100 100 100 100
- federal 37.6 N/A 51.2 43.9 45.7- regional 60.5 N/A 47.5 52.6 51.5- local 1.8 N/A 1.3 3.5 2.9
National Economy 100 100 100 100 100- federal 80.8 48.6 30.4 26.3 27.5- regional 8.7 24.6 34.8 35.4 32.4- local 10.5 26.8 34.9 38.2 40.1
Education 100 100 100 100 100- federal 33.8 19.5 19.9 15.9 14.5- regional 14.5 18.9 19.1 19.7 18.0- local 51.8 61.6 61.0 64.4 67.5
Health and Sport 100 100 100 100 100- federal 11.3 10.5 11.8 9.9 10.2- regional 28.5 30.2 33.4 33.4 33.1- local 60.2 59.3 54.8 56.7 56.8
Social Protection 100 100 100 100 100- federal 71.8 52.0 50.3 18.5 31.2- regional 20.4 34.9 34.9 31.1 26.8- local 7.8 13.2 14.8 50.3 42.0
Administration And Justice 100 100 100 100 100- federal 80.5 79.6 81.4 63.1 63.7- regional 5.5 6.1 6.2 N/A 19.0- local 14.0 14.3 12.4 N/A 17.3
Culture and Mass Media 100 100 100 100 100- federal 51.2 34.8 39.6 31.6 34.7- regional 21.2 30.2 28.9 30.8 29.3- local 27.6 35.0 31.5 37.6 36.0
Defence 100 100 100 100 100- federal 100 100 100 100 100- regional 0 0 0 0 0- local 0 0 0 0 0
Loans 100 100 100 100 100- federal 91.5 N/A 84.6 58.9 30.3- regional 4.0 N/A 12.5 34.6 N/A- local 4.5 N/A 3.0 6.5 N/A
Other Expenditures 100 100 100 100 100- federal 77.5 N/A 69.2 89 94- regional 8.5 N/A 18.0 N/A N/A- local 14.0 N/A 12.8 N/A N/A

15
Table 6. Shares of Itemized Expenditures in Total Expenditures
at Different Levels of the Government, %
Budget Expenditures / Year 1992 1993 1994 1995 1996
Transfers to Other Levels ofGovernment 7.9 N/A 16.3 13.5 13.9
-federal 4.1 10.2 15.9 11.6 11.7- regional 36.3 N/A 30.4 28.2 31.1- local 1.0 3.3 1.0 2.0 1.7
National Economy 47.1 29.1 23.0 23.1 20.9- federal 52.2 26.0 13.3 11.9 10.6- regional 31.3 31.5 31.4 32.6 29.5- local 35.5 34.2 36.2 37.4 36.5
Education 6.4 8.8 9.8 9.6 9.3- federal 3.0 3.2 3.7 3.0 2.5- regional 7.0 7.3 7.3 7.5 7.3- local 23.8 23.8 27.0 26.2 27.4
Health and Sport 4.4 6.7 7.0 6.6 6.4- federal 0.7 1.3 1.6 1.3 1.2- regional 9.5 8.9 9.3 8.7 9.2- local 19.1 17.5 17.4 15.8 15.8
Social Protection 1.9 1.6 1.7 3.5 4.3- federal 1.9 1.5 1.6 1.3 2.5- regional 3.0 2.4 2.3 4.4 5.0- local 1.1 0.9 1.1 7.5 7.9
Administration And Justice 3.3 5.0 6.4 6.7 6.8- federal 3.6 7.4 9.9 8.2 8.0- regional 1.4 1.3 1.6 N/A 5.6- local 3.3 3.2 3.6 N/A 5.1
Culture and Mass Media 1.1 1.2 1.6 1.5 1.4- federal 0.8 0.8 1.2 0.9 0.9- regional 1.7 1.6 1.8 1.9 1.8- local 2.2 1.9 2.3 2.4 2.3
Defence 8.0 9.1 10.1 8.4 8.5- federal 11.0 16.8 19.3 16.5 15.7- regional 0 0 0 0 0-local 0 0 0 0 0
Loans 9.0 N/A 5.9 2.8 2.2- federal 11.3 6.8 9.5 3.2 1.2- regional 2.7 N/A 2.9 3.8 N/A- local 2.9 N/A 0.8 0.8 N/A
Other Expenditures 10.9 N/A 18.3 24.2 26.3-federal 11.5 26.1 24.1 42.1 45.7- regional 7.0 N/A 12.9 N/A N/A- local 11.0 N/A 10.6 N/A N/A

16
We next turn to Tables 7 and 8, which present data on the size of budget deficits/surpluses fordifferent government levels.
Table 7. Budget Balance by Level of Government as Percent of GDP, on a Cash Basis
Budget Balance / Year 1992 1993 1994 1995 1996
Consolidated Budget Balance -18.77 -9.43 -9.18 -4.54 -8.41- federal -20.56 -10.59 -9.80 -4.21 -7.61- consolidated regional 1.79 1.15 0.62 -0.34 -0.80- regional 0.93 0.72 0.27 -0.28 -0.67- local 0.86 0.43 0.35 -0.05 -0.13
Table 8. Budget Balance before Transfers by Level of Government as Percent of GDP,
on a Cash Basis
Budget Balance / Year 1992 1993 1994 1995 1996
Consolidated Budget Balance -18.77 -9.43 -9.18 -4.54 -8.41- federal -19.15 -8.04 -6.20 -2.15 -5.03- consolidated regional 0.39 -1.40 -2.98 -2.40 -3.37- regional 2.31 N/A 0.08 0.37 -0.25- local -1.42 N/A -2.44 -2.38 -2.84
Between 1992 and 1996, the federal budget deficit, measured on a cash basis, fell from 20.6% ofGDP in 1992 to 7.6% in 1996. At the same time, subnational governments have succeeded to maintaincash budget surpluses up to 1995, when both local and regional governments run into deficits. In 1996,local governments deficit as percent of GDP stood at 0.1 %, whereas the corresponding figure on regionallevel was 0.7%.
5. Decentralization at the regional level
This section is focused on the distribution of tax assignments and expenditure responsibilitiesbetween local and regional governments in Russian regions. In contrast to the previous section thatanalyses relative shares of three government levels, tables below describe a relative role of localgovernments in consolidated regional budgets, i.e. excluding the federal level.
Table 9 presents average values of local governments' shares in the four main shared taxes: theProfit Tax, the VAT, the PIT and Excises, together with selected summary statistics for the period 1992-96. Over this period the collective share of these four taxes in local governments' total tax revenues fellfrom 87.4% in 1992 to 58.9% in 1996.

17
Table 9. Shares of Local Governments in Total Consolidated Regional Revenues
and in Select Consolidated Regional Tax Revenues, %
Summary Statistics /Year 1992 1993 1994 1995 1996
1. Share in Total Consolidated Regional Revenues *1.1. Mean 66.59 N/A 62.37 67.83 70.25
(1.44) N/A (1.18) (1.27) (1.43)1.2. Standarddeviation 13.24 N/A 10.73 11.7 13.021.3. Coefflicient ofvariation 0.20 N/A 0.17 0.17 0.191.4. Minimum vakhe 15.73 N/A 26.81 22.76 11.961.5. Maximum value 98.02 N/A 85.35 97.76 96.691.6. Vafid Number of Observations 85 N/A 83 85 83
2. Share in Profit Tax revenues2.1. Mean 62.51 56.48 57.40 55.79 55.77
(2.13) (2.02) (2.16) (2.23) (2.25)2.2. Standard deviation 19.68 18.63 19.90 20.58 20.662.3. Coefficient ofvariation 0.31 0.33 0.35 0.37 0.372.4. Mininum value 22.82 21.08 21.59 19.70 7.282.5. Maximum value 99.99 100 100 100 1002.6. Vaid Number of Observations 85 85 85 85 84
3. Share in VAT revenues3.1. Mean 53.82 51.75 49.06 58.15 55.71
(3.32) (2.96) (2.85) (3.21) (2.82)
3.2. Standard deviation 30.46 27.13 26.00 27.40 26.003.3. Coefficient ofvariation 0.57 0.52 0.53 0.47 0.473.4. Minimum value 0 0 0 0 03.5. Maximumvalue 100 100 100 100 1003.6. Valid number ofobservations 84 84 83 73 85
4. Share in Personal Income Tax revenues4.1. Mean . 85.00 88.33 87.37 87.76 88.68
(1.9) (1.74) (1.8) (1.81) (1.74)
4.2. Standard deviation 17.20 15.99 16.63 16.42 15.934.3. Coefficientofvariation 0.20 0.18 0.19 0.19 0.184.4. Minimm vakle 40.75 46.61 40.10 40.70 42.204.5. Maximurnvahle 100 100 100 100 1004.6. Valid numnber of observations 82 84 85 82 84
5. Share in Excise Tax revenues5.1. Mean 32.95 36.25 41.78 45.5 46.19
(3.96) (3.83) (3.99) (3.95) (4.16)
5.2. Standard deviation 36.08 34.88 35.94 35.8 37.645.3. Coefticientofvariation 1.09 0.96 0.86 0.79 0.815.4. Minimum value 0 0 0 0 05.5. Maxinumvalue 100 100 100 100 1005.6. Valid number ofobservations 83 83 81 82 82
Standard error of the mean in parentheses.The cities of Moscow and St. Petersburg, Chechnya and Ingushetia excluded from the sample.* Calculated as a ratio of the sum of the total revenues of all tiers of local government minus the revenuesfrom transfers from one local government to another and the sum of the total revenues of local and regionalgovernments minus the transfers from regions to local governments and from local governments to regions.

18
The average share of local governments in Profit Tax proceeds decreased by 6.7 percentagepoints between 1992 and 1996. This was caused by an one-time, permanent fall in its value in 1993, afterwhich the average share of local governments in Profit Tax revenues stabilized at the new lower levelaround 56%.
Over the same period, the average share of local governments in VAT revenues was quitevolatile. Until 1995, it followed a downward trend dropping by more than 4.7 percentage points, only toregain grounds in 1995 and fall slightly in the next year. Overall, despite the nominal gain of 1.9percentage points, the 1992 and 1996 average shares of local governments in VAT are not statisticallydifferent at the 95% level of confidence. Meanwhile, the cross-regional disparities in the share of VATrevenues assigned to local governments diminished, as evidenced by 10 percentage point drop in thevalue of the respective coefficient of variation. Despite this tendency, the variation in VAT sharing ratesremained higher compared to those for the Profit Tax and the PIT, i.e. municipal VAT shares still fell intoa maximum band - from zero to one hundred percent.
The average share of local governments in Personal Income Tax revenues increased by 3.7percentage points in 1992-96. This was caused by one-time rise in its value in 1993, after which theaverage share of local governments in the PIT stabilized at around 88%. It is worth noting that the timingof this one-time jump in the local share of the PIT coincided with the fall in their share in the Profit Tax.Regional disparities in the allocation of the PIT were the smallest among the main taxes and therespective coefficient of variation remained stable over the period at 0.19, which suggests quite stablerules of sharing for this tax.
Compared to other main taxes, local governments experienced the largest expansion in their shareof excises (by more than 13 percentage points). However, cross-regional allocation of excises stillremained the most diversified. In a number of regions municipalities get nothing or a negligible portion ofexcises.
On the expenditure side, Table 10 presents data on the average local governments shares in fourof the most important expenditure items, which collectively accounted for more than 87% of totalmunicipal outlays in 1996.
The visual inspection of Table 10 reveals that with the exception of the "Health and Sports"9category, local governments' involvement in public expenditures has uniformly grown over time9.
Overall, cross regional variation in expenditure sharing is much lower that the one for taxes. It means thatpatterns in expenditure allocation are much more similar in various regions compared to revenueallocation, which seems much more unstable from tax to tax and from year to year.
Between 1992 and 1996, the average share of local governments in consolidated regionalexpenditures on "National Economy" has increased by 3.9 percentage points.
9 The differences in the means of the three variables in 1992 and 1996 are statistically significant at the 95% level ofconfidence in paired-samples t-tests of the equality of the respective means.

19
Table 10. Shares of Local Governments in Total Consolidated Regional Expenditures
and in Select Consolidated Regional Expenditures, %
Summary Statistics /Year 1992 1993 1994 1995 1996
1. Share in Total Consolidated Regional Expenditures *
1.1. Mean 63.93 N/A 63.51 67.32 68.97(1.31) N/A (1.08) (1.09) (1.17)
1.2. Standard deviation 12.12 N/A 9.86 10.03 10.831.3. Coefflicientofvariation 0.19 N/A 0.16 0.15 0.161.4. Minimunvalue 14.91 N/A 26.81 33.34 36.591.5. Maximm value 83.94 N/A 84.27 88.30 90.71
2. Share in expenditures on National Econony2.1. Mean 61.89 59.29 62.92 64.74 65.79
(1.71) (1.79) (1.73) (1.5) (1.69)2.2. Standard deviation 15.77 16.54 15.94 13.87 15.602.3. Coefficient ofvariation 0.25 0.28 0.25 0.21 0.242.4. Mifninmvalue 21.96 18.33 16.25 27.76 28.252.5. Maximum value 89.98 100 100 90.49 93.72
3. Share in expenditures on Education
3.1. Mean 85.56 85.14 87.26 86.06 87.59(0.77) (0.8) (0.76) (0.81) (0.71)
3.2. Standard deviation 7.11 7.36 6.98 7.45 6.543.3. Coefficient ofvariation 0.08 0.09 0.08 0.09 0.073.4. Minimumvalue 55.98 53.56 59.05 50.98 59.243.5. Maxinmunvalue 95.78 100 100 94.64 96.50
4. Share in expenditures on Health and Sports4.1. Mean 69.94 69.98 69.41 69.24 68.68
(1.41) (1.44) (1.53) (1.4) (1.47)4.2. Standard deviation 13.00 13.30 14.10 12.88 13.534.3. Coefflicientofvariation 0.19 0.19 0.20 0.19 0.204.4. Minirnunvalue 17.91 17.26 18.40 18.20 13.334.5. Maxun umvalue 88.16 100 100 90.54 92.18
5. Share in expenditures on Social Protection5.1. Mean 22.34 26.31 30.77 67.46 70.79
(2.17) (2.36) (2.2) (1.97) (2.13)5.2. Standard deviation 20.04 21.72 20.31 18.15 19.635.3. Coefficient ofvariation 0.90 0.83 0.66 0.27 0.285.4. Minirunvalue 0 2.06 2.41 1.18 0.345.5. Maximum value 100 100 100 96.30 99.59
Standard error of the mean in parentheses.The valid number of observations in all cases is 85, except for the local governments share in totalconsolidated regional expenditures in 1994 (83).The cities of Moscow and St. Petersburg, Chechnya and Ingushetia excluded from the sample.* Calculated as a ratio of the sum of the total expenditures of all tiers of local government minus theexpenditures on transfers from one local government to another and the sum of the total expenditures of localand regional governments minus the expenditures on transfers from regions to local governments and fromlocal governments to regions.

20
Despite its already high value (85.6% in 1992), by 1996 the average share of local governmentsin consolidated regional expenditures on "Education" gained additional 2 percentage points. Thisexpenditure category has been a firm prerogative of local governments in practically all regions -between 1992 and 1996 the values of the respective coefficient of variation remained exceptionally low ataround 0.09. Also, compared to other types of expenditures, the minimum value across regions of theaverage share of local governments in public spending on "Education" was remarkably high: 56% in 1992and 59.2% in 1996.
The single most notable expansion of local governments' expenditure responsibilities was in thesphere of "Social Protection". Between 1992 and 1996, the average share of local governments inconsolidated regional expenditures on "Social Protection" rose from 22.3% to 70.8%. As noted by Lavrov(1996a) however, this seemingly drastic change in policies may at least in part might reflect a 1994change in the budget classification, which moved the formerly separate category "Allowances forChildren and Other Social Transfers to the Population" in the expenditure item "Social Protection".Between 1992 and 1996, the regional disparities in local governments involvement in "SocialProtection" diminished substantially, as the respective coefficient of variation fell by nearly 70 percentagepoints right after the steep rise of the average share of local governments in consolidated regionalexpenditures on "Social Protection" in 1995.
A more detailed look at local governments' involvement in "Social Protection" by economicregion'0 however, shows that the Northern Region did not participate in the observed rapid decentralizationof this type of expenditures. As the data in Table 11 shows, up to 1994 the Northern Region was in linewith the rest of the country by degree of decentralization of the "Social Protection" expenditures. But in1994, it did not follow the countrywide rapid expansion of local governments' involvement in that sphere.And even though the average share of local governments in consolidated regional expenditures on "SocialProtection" in the North Region consequently doubled to 36.5% in 1996, it was still half of the nationalaverage.
Table 11. Average Shares of Local Governments in "Social Protection"Expenditures in the Northern Region and in the Russian Federation, %
Aierage Shares / Year 1992 1993 1994 1995 1996
1. Average Share of Local Govemrnents inConsolidated Regional Expenditures on SocialProtection in the Northern Region 18.38 15.19 17.45 34.84 36.52
(7.86) (3.61) (4.34) (12.3) (13.85)2. Average Share of Local Govemnrents in
Consolidated Regional Expenditures on SocialProtection in the Russian Federation 22.34 26.31 30.77 67.46 70.79
(2.17) (2.36) (2.2) (1.97) (2.13)
Standard error of the mean in parentheses.
'O The official statistics divide the constituents of the Russian Federation in 11 economic regions based on theirgeographic location. For example, the Northern Region includes Komi Republic, Karelia Republic, Arkhangel'skOblast, Nenets Autonomous Okrug, Vologda Oblast and Murmansk Oblast.

21
Section 6. Measures of regional decentralization and subordination.
To evaluate the level of fiscal decentralization within the Russian regions, we examine thedistribution of total expenditure responsibilities and revenue assignments between regional and localgovernments. We construct two simple measures of the level of fiscal decentralization, using the datarespectively from the revenue and expenditure side of consolidated regional budgets:
- The ratio between local governments total revenuesl and the consolidated regional budget revenues12
- The ratio between local governments total expenditures'3 net of transfers to regions and theconsolidated regional budget expenditures14
The measure of fiscal decentralization on the expenditure side of consolidated regional budgets isdefined in such a manner to provide information about the share of local governments in final budgetoutlays15 (purchases of goods and services from the rest of the economy).
Furthermore, we explore the degree of subordination of local to regional budgets using thefollowing measure -- the ratio between regional transfers to local governments and local governmentstotal expenditures16.
Thus, the two measures of fiscal decentralization within regions refer to the downward shift ofcontrol over budget revenues and expenditures from regional to local governments. The measure of fiscalsubordination is used to describe the dependence of local governments on transfers from regions.
The statistical analysis presented below is conducted with data on 85 of the 89 regions of theRussian Federation. The regions removed from the sample are Chechnya, Ingushetia, Moscow City andSt. Petersburg City. The first two are dropped because of the poor quality or lack of data on most of thevariables. As mentioned above, the special status of the last two as federal cities puts the issue of fiscaldecentralization out of context.
Table 12 presents the values of the two measures of fiscal decentralization together with selectedsummary statistics for the period 1994 - 1996.
Calculated as the sum of the total revenues of all tiers of local government minus the revenues from transfers fromone local government to another.
12 Calculated as the sum of the total revenues of local and regional govermments minus the revenues from transfersfrom regions to local governments and from local governments to regions.
13 Calculated as the sum of the total expenditures of all tiers of local government minus the expenditures on transfersfrom one local government to another.
14 Calculated as the sum of the total expenditures of local and regional governments minus the expenditures ontransfers from regions to local governments and from local governments to regions.
15 Our database does not provide data on regional transfers to the federal government and consequently this type ofinterbudgetary transfers is not netted out of the consolidated regional budget expenditures.
16 Calculated as the sum of the total expenditures of all tiers of local government minus the expenditures on transfersfrom one local government to another.

22
Table 12. Measures of Fiscal Decentralization, %
Summary Statistics / Year 1994 1995 1996
1. Ratio between local governments totalrevenues and the consolidated regionalbudget revenues1.1. Mean 62.37 67.83 70.25
(1.18) (1.27) (1.43)1.2. Standard deviation 10.73 11.7 13.021.3. Coefficient of variation 0.17 0.17 0.191.4. Minimum value 26.81 22.76 11.961.5. Maximum value 85.35 97.76 96.691.6. Valid number of observations 83 85 83
2. Ratio between local governments totalexpenditures before transfers and theconsolidated regional budget expenditures2.1. Mean 62.8 65.94 67.67
(1.08) (1.05) (1.15)2.2. Standard deviation 9.83 9.71 10.632.3. Coefficient of variation 0.16 0.15 0.162.4. Minimum value 26.81 33.34 36.592.5. Maximum value 84.27 83.8 86.582.6. Valid number of observations 83 85 85
Standard error of the mean in parentheses.
Throughout the sample period, there was a clear tendency toward greater fiscal decentralizationon both sides of consolidated regional budgets. Between 1994 and 1996, the average share of localgovernments in consolidated regional budget revenues has increased by 7.9 percentage points, while atthe same time the relative size of their outlays in consolidated regional public expenditures has risen by4.9 percentage points17. Before 1995, the average expenditure share of local governments was broadly inline with their share in budget revenues. This trend was reversed in 1995-96. In 1996 local governmentsreceived 70.3% of all revenues but financed only 67.7% of consolidated regional budget expenditures.This was related to noticeable expansion of regional budget deficits.
The breakdown of Russian regions by administrative type into republics, oblasts and krais48, andautonomous okrugs'9 unravels interesting patterns in the degrees of fiscal decentralization across groups.Tables 13 and 14 present data on the average ratio between local governments total revenues and theconsolidated regional budget revenues and local governments share in the consolidated regional finalexpenditures by administrative type of region.
17 These changes in the means for both variables are statistically significant at the 99% level in paired-samples t-tests of the equality of the respective means.
18 Oblasts and krais were pooled together because of the numerous similarities between them.19 Including one autonomous oblast -Yevreyskaya Autonomous Oblast.

23
Table 13: Revenue Decentralization by Administrative Type of Region, %
Measure of Fiscal Decentralization / Year 1994 1995 1996
1. Ratio between local governments totalrevenues and the consolidated regionalbudget revenues in:
1.1 Republics- Mean 53.78 61.27 68.12
(1.93) (3.32) (3.38)- Minimum 41.73 22.76 40.78- Maximum 66.60 97.76 96.69- Valid number of observations 19 19 19
1.2 Oblasts and Krais- Mean 66.41 71.40 73.89
(0.96) (0.97) (1.12)- Minimum 50.74 56.09 56.98- Maximum 79.79 88.12 91.82-Valid number of observations 55 55 54
1.3 Autonomous Okrugs-Mean 55.84 61.34 54.68
(6.17) (5.17) (5.96)-Minimum 26.81 33.51 11.96-Maximum 85.35 84.93 77.27- Valid number of observations 9 11 10
Standard error of the mean in parentheses

24
Table 14: Expenditure Decentralization by Administrative Type of Region, %
Measure of Fiscal Decentralization / Year 1994 1995 1996
1. Ratio between local governments totalexpenditures before transfers and theconsolidated regional budget expenditures in:
1.1 Republics- Mean 55.75 60.16 62.29
(1.82) (1.9) (2.38)- Minimum 42.33 42.12 42.78- Maximum 76.23 71.25 81.57- Valid number of observations 19 19 19
1.2 Oblasts and Krais- Mean 66.29 68.66 70.14
(0.91) (0.93) (1.16)- Minimum 46.07 46.21 46.15- Maximum 79.24 81.87 86.58- Valid number of observations 55 55 55
1.3 Autonomous Okrugs
- Mean 56.39 62.29 64.65(5.71) (5.14) (4.86)
- Minimum 26.81 33.34 36.59- Maximum 84.27 83.80 84.84- Valid number of observations 9 11 11
Standard error of the mean in parentheses
The data in Tables 13 and 14 unequivocally show the substantial and persistent gap between thedegrees of fiscal decentralization on both sides of consolidated regional budgets in oblasts and krais andthe other types of regions. In all years, oblasts and krais, i.e. ethnically Russian regions, boasted thehighest average ratios between local governments total revenues and expenditures before transfers and theconsolidated regional budget revenues and final expenditures respectively, with the pair wise differencesin the corresponding means being statistically significant at the 95% level of confidence0 in 1994 and1995. Oblasts and krais are also the most homogenous group in terms of the achieved degree of fiscaldecentralization - the standard error of the mean for this type of regions is more than 6 times smaller thanthat of autonomous okrugs and 3 times that of republics. The observed differences among the groupmeans were somewhat subdued in 1996, when the difference in the means of the degree of revenuedecentralization in oblasts and krais and republics seized to be statistically significant. The same was alsotrue for the difference in the means of the degree of expenditure decentralization in oblasts and krais andautonomous okrugs in 1996.
Table 15 presents the values of the two measures of fiscal subordination of regional and localgovernments together with selected summary statistics for the period 1994 - 1996.As Table 15 shows,interbudgetary transfers from higher levels of the government were a significant source of revenues for
20 Comparison of means conducted with One-way Analysis of Variance supplemented with Least-significantDifference Tests.

25
both regional and local goverrnents throughout the whole period. Between 1994 and 1996, the ratio ofregional transfers to total expenditures of local governments fluctuated in a narrow band of 35%. At thesame time, with the exception of 1995 the ratio of federal transfers to total regional expenditures stayedaround 42.5%. In 1995 federal transfers to regional governments were substantially reduced. The sevenpercentage points drop in the average value of the above ratio coincided with a drastic increase in regionaldisparities - in one year the coefficient of variation jumped by 43%. This apparent shock to the system offederal transfers quickly disseminated and by 1996 both the mean of the ratio of federal transfers to totalregional expenditures and its coefficient of variation returned to their pre-1995 values.
Table 15. Measures of Fiscal Subordination of SubnationalGovernments in the Period 1994 - 1996, %
Summary Statistics / Year 1994 1995 1996
1. Ratio between regional transfers to localgovernments and local governments totalexpenditures1.1. Mean 36.87 33.40 34.85
(1.71) (1.65) (1.78)
1.2. Standard deviation 15.48 15.18 16.391.3. Coefficient of variation 0.42 0.45 0.471.4. Minimum value 0 3.01 01.5. Maximum value 91.73 74.77 82.451.6. Valid number of observations 82 85 85
2. Ratio between federal transfers toregional governments and total regionalexpenditures2.1. Mean 42.35 35.36 42.58
(2.38) (2.8) (2.46)2.2. Standard deviation 21.41 25.51 22.242.3. Coefficient of variation 0.51 0.72 0.522.4. Minimum value 1.61 0 0.042.5. Maximum value 96.05 99.71 88.952.6. Valid number of observations 81 83 82
Standard error of the mean in parentheses

26
Table 16 presents data on the average degree of fiscal subordination of local to regionalgovernments by administrative type of region.
Table 16: Fiscal Subordination of Local Governments by
Administrative Type of Region, %
Measure of Fiscal Subordination / Year 1994 1995 1996
1. Ratio between regional transfers to localgovernments and local governments totalexpenditures in:1.1 Republics
- Mean 48.18 43.05 44.70(4.36) (4.22) (4.31)
- Minimum 18.81 7.08 0- Maximum 91.73 68.46 75.39- Valid number of observations 19 19 19
1.2 Oblasts and Krais- Mean 32.83 29.30 31.85
(1.2) (1.13) (1.26)- Minimum 16.80 14.98 11.85- Maximum 59.79 52.74 54.31- Valid number of observations 55 55 55
1.3 Autonomous Okrugs- Mean 37.74 37.23 32.81
(9.74) (7.75) (9.10)
- Minimum 0 3.01 0- Maximum 72.09 74.77 82.45- Valid number of observations 8 11 11
Standard error of the mean in parentheses
Between 1994 and 1996, there were substantial differences in the importance of regional transfersas sources of funds for local budgets in oblasts and krais and the other types of regions. Oblasts and kraishave maintained the lowest average ratio between regional transfers to local governments and localgovernments' total expenditures. The difference in the average values of this variable in republics andoblasts and krais is statistically significant at the 95% level of confidence in all years in One-wayAnalysis of Variance supplemented with Least-significant difference tests of the equality of thecorresponding means. Overall, regional transfers were most important for local governments in republics,followed by autonomous okrugs, and oblasts and krais.
This finding, combined with the results from the analysis of the measures of fiscaldecentralization by administrative type of regions, outlines two distinctive patterns in the downwardtransfer of fiscal responsibilities in the Russian Federation. In both cases, local governments end up withmore budget resources and a wider range of expenditure responsibilities. In the case of oblasts and kraishowever, this is achieved by entitling local authorities to a bigger share of the consolidated regionalbudget revenues, whereas in republics and autonomous okrugs (before 1996) the expansion of localoutlays has been financed by larger interbudgetary transfers from regional governments. Thus, we have

27
identified two different patterns of fiscal evolution in Russian regions: the former could be called "truedecentralization", the latter may be described as a "redistribution model".
Table 17 presents data on the average ratio between federal transfers to regional governments andtotal regional expenditures in different administrative types of regions.
Table 17: Fiscal Subordination of Regional Governments by
Administrative Type of Region, %
Measure of Fiscal Subordination / Year 1994 1995 1996
1. Ratio between federal transfers toregional governments and totalregional expenditures in:1.1 Republics
- Mean 51.19 44.77 47.55(7.49) (7.42) (6.18)
- Minimum 1.61 0 0.04- Maximum 96.06 98.62 88.95- Valid number of observations 17 18 19
1.2 Oblasts and Krais- Mean 37.30 27.95 40.70
(1.93) (2.25) (2.62)- Minimum 10.34 1.85 4.37- Maximum 75.13 69.72 82.19- Valid number of observations 55 55 53
1.3 Autonomous Okrugs- Mean 56.45 59.19 43.11
(9.05) (11.14) (9.13)- Minimum 8.86 3.18 4.44- Maximum 78.40 97.23 87.68- Valid number of observations 9 9 10
Standard error of the mean in parentheses
As seen from the table, in 1994 and 1995 oblasts and krais received much less federal assistancethan both republics and autonomous okrugs21. In 1995, the mean of the ratio of federal transfers to totalregional expenditures in autonomous okrugs was more than twice the average in oblasts and krais. In1996, the federal government finally adopted a more equitable allocation scheme of federal assistanceamong the different types of regions. A plausible explanation of the huge discrepancies between theamount of grants received by republics and autonomous okrugs, and oblasts and krais until 1996 is thatthe federal government tried to use the transfers as the "carrot" in its policy to discourage the attempts ofnon-Russian regions to become independent states (Treisman, 1996).
21 The differences in the average ratios between federal transfers to regions and total regional expenditures inrepublics and oblasts and krais, and in autonomous okrugs and oblasts and krais are statistically significant in bothyears at the 95% level of confidence.

28
Next, we turn to the coefficients of correlation between different measures of fiscaldecentralization and subordination (Table 18).
Table 18: Coefficients of Correlation between Measures of FiscalDecentralization and Subordination in Russian Regions
Covariates / Year 1994 1995 1996
Ratio between local governments total expendituresbefore transfers and the consolidated regional budget 0.89 0.80 0.76expenditures -Ratio between local governments total 089 080 0.76revenues and the consolidated regional budget revenues (83) (85) (83)
Ratio between local governments total expendituresbefore transfers and the consolidated regional budgetexpenditures -Ratio between regional transfers to local -0.33 -0.10* -0.09*governments and local governments total expenditures (82) (85) (85)
Ratio between federal transfers to regional governmentsand total regional expenditures - Ratio between local -0.48 -0.33 0.004*governments total revenues and the consolidated (81) (82) (80)regional budget revenuesRatio between federal transfers to regional governmentsand total regional expenditures - Ratio between regional 0.50 0.60 0.53transfers to local governments and local governments (80) (83) (82)total expenditures
Numbers in parenthesis represent the number of regions used in the correlation analysis.Unless otherwise indicated, all correlation coefficients are significant at the 99% level of confidence.* Statistically insignificant at the 95% level of confidence.
As seen from the first row of Table 18, there is a strong positive correlation between the share oflocal governments in consolidated regional final expenditures and the ratio of local governments totalrevenues to the consolidated regional budget revenues. However, the statistical link between the twomeasures of fiscal decentralization weakened over time, dropping from 0.89 in 1994 to 0.76 in 1996. Onepossible explanation of the above trend might derive from quickly expanding deficits of some but not allregional budgets: local governments' share in expenditures in such cases does not correspond to theirshare in revenues.
The second raw of Table 18 suggests that there is no link between the incidence of regionaltransfers and degree of fiscal decentralization. High dependence of local governments on regionaltransfers indicates neither high nor low decentralization level.
Another interesting finding of the correlation analysis is that in 1994-95 the size of federal grantsto regions relative to the consolidated regional expenditures was negatively correlated with the share oflocal governments in consolidated regional expenditures (third raw of Table 18). In 1996, this correlationcoefficient became statistically insignificant. At the same time, however, the sizes of the federal andregional transfers relative to the total regional and local governments total expenditures, respectively,remained strongly positively correlated (see the last row of Table 18).

29
Thus, the impact of federal transfers on fiscal decentralization at the regional level was mixed. Onone hand, federal aid was by no means concentrated in regions with the highest degree of fiscaldecentralization, but on the other, larger federal transfers to regions resulted in larger transfers fromregions to local governments, and thus indirectly promoted some decentralization. In the precedingsection, we identified two distinct patterns of fiscal decentralization prevalent in Russian regions ofdifferent administrative type. In oblasts and krais, the downward shift of expenditure responsibilities isgenerally financed through increases in the share of local governments in consolidated regional revenues- "true decentralization". In autonomous okrugs and republics, however, relatively more funds for localbudgets are provided by regional governments via interbudgetary transfers - "decentralization throughtransfers". Consequently, the results of the correlation analysis suggest that federal transfers to regionspromoted the process of fiscal decentralization in autonomous okrugs and republics and slowed down it inoblasts and krais.
Section 7. Decentralization and Economic Performance.
The panel-data regression analysis conducted in this section addresses the following specificissues related to the nature and impact of fiscal decentralization within Russian regions:
* What are the main social and economic determinants of the degree of fiscal decentralization withinRussian regions?
* Is there a link between regional fiscal decentralization and public expenditures policy (measuredthrough the structure of the consolidated budget expenditures)?
* Does the degree of fiscal decentralization have an influence over regional economic performance?
In the initial stages of our empirical investigation of these problems, we have considered thefollowing set of social and economic variables as potential determinants of the degree of fiscaldecentralization within Russian regions:
A. Geographic and administrative characteristics:
* Geographic location (regions divided in 11 zones, so called "economic regions", based on theirlocation)
* Territory of region as percent of the total territory of the Russian Federation (%)* Population density in 1994 (persons per square kilometer)* Administrative type (republic, oblast and krai, autonomous okrug)
B. Social variables:
* Share of the poor population (%) - 1994 and 1995 data only* Money income as percent of the subsistence minimum* Unemployment rate (%) - 1994 and 1995 data only* Share of rural population in 1994 (%)* Rate of infant mortality (number of babies per 1000 live births, who died before reaching the age of
one)* Infant mortality in 1990 - used as a reference variable that reflects specific social characteristics of
Russian regions prevalent before the transition to market economy* Life expectancy (years)

30
C. Economic variables:
* Real (1991 Rubles) per capita GDP - 1994 and 1995 data only* Annual real per capita income (1991 Rubles)* Annual rate of inflation (%)* Real industrial output growth (as % of previous year)* Growth of investment (as % of previous year)* Percent of arrears in enterprise payables (1995 and 1996 data only)
D. Fiscal variables:
* Federal transfers to regions as percent of total regional expenditures (%)* Regional transfers to local governments as percent of local governments' total expenditures (%)* Share of expenditures on National Economy in the consolidated regional budget expenditures (%)* Share of expenditures on Education in the consolidated regional budget expenditures (%)* Share of expenditures on Health and Sport in the consolidated regional budget expenditures (%)* Share of expenditures on Social Protection in the consolidated regional budget expenditures (%)* Real (1991 Rubles) per capita consolidated regional expenditures on National Economy• Real (1991 Rubles) per capita consolidated regional expenditures on Education* Budget arrears as percent of consolidated regional budget expenditures (%) - 1995 and 1996 data only* Tax arrears as percent of the consolidated regional tax revenues (%) - 1995 data only* Accumulated debt as percent of consolidated budget revenues net of transfers (%) - 1995 and 1996
data only* Local governments budget balance (negative sign indicates a deficit) as percent of local governments
total expenditures (%)* Regional budget balance (negative sign indicates a deficit) as percent of total regional expenditures
(%)* Consolidated regional budget balance (negative sign indicates a deficit) as percent of consolidated
regional budget expenditures (%)
The statistical analysis presented below is conducted with the data on 85 of the 89 regions of theRussian Federation. The regions removed from the sample are Chechnya, Ingushetia, the cities ofMoscow and St. Petersburg. The first two are dropped because of the poor quality or lack of data on mostof the variables. The special status of the last two as federal cities puts the issue of fiscal decentralizationout of context. We use the values of the above listed variables over the period 1994-1996 for each of theremaining 85 regions to construct the panel used in the subsequent regression analysis. If there is no dataon a particular variable for a given region in a given year, missing values are recorded in the data set. Inthe case of variables such as the rate of infant mortality in 1990 and the percent of rural population in1994, for which we are only interested in how their values in some base year (1990 and 1994respectively) affect the future outcomes of the dependent variable, we record the base values of thesevariables three times in the data set - once for every year in the sample. The summary regression resultstables presented in this section are constructed using the following convention. We first identify thepreferred regression model of the dependent variable using standard econometric techniques. We then testfor the presence of heteroskedasticity and correlation in regression residuals using the White test forgeneral heteroskedasticity/2 and the Durbin-Watson testf3 for first-order serial correlation. If the resulting
22 The test statistics are computed using auxiliary regressions, in which the squared residuals from the regressionspresented in Tables 19,20 and 21 are regressed on a constant, the explanatory variables from the originalregressions and all possible (nonredundant) cross products of the explanatory variables, with the exception ofthose involving dummy variables.

31
value of the White test statistic is significant at the 95% level of confidence, in the summary tables wereport the White heteroskedasticity-consistent standard errors of the OLS coefficients. Due to the shorttime-dimension of our panel and the somewhat arbitrary construction and hence obscure interpretation ofthe Durbin-Watson statistic in panel data models (see footnote 24), no attempts have been made to correctfor the possible existence of serial correlation in OLS residuals. Nevertheless, in all regression modelspresented below we show the estimated value of the Durbin-Watson statistic.
Table 19 presents the final results from our regression analysis of the determinants of fiscaldecentralization within Russian regions. The regression output in Table 19 identifies a common set offactors that influence the degree of fiscal decentralization on both the revenue and expenditure sides ofconsolidated regional budgets. The measures of revenue and expenditure decentralization are bothnegatively related to the rate of infant mortality in 1990 and the rate of inflation in regions. The firstvariable is an indicator of the social and economic development of Russian regions prior to thetransition24 . In our view, it reflects fundamental historical differences in regional wellbeing - such as realincomes, quality of and access to health care, development of infrastructure, ethnic and religious customs,etc.2' The second variable is an indicator of the degree of macroeconomic instability inflicted on regionaleconomies. For 1994-96 the inflation indicator also reflects regional peculiarities of price liberalization:usually during this period, inflation was higher in regions, where during the initial years of reforms(1992-93), regional administrations imposed stronger price control, thus delaying both liberalization andeconomic restructuring.
The OLS estimates of the influence of the rate of infant mortality in 1990 on the degrees ofrevenue and expenditure decentralization in regions are (-0.94) and (-0.87) respectively. Thus, if we taketwo regions with identical rates of inflation, geographic location and administrative status, where thevalues of the rate of infant mortality in 1990 differed by one basic point (one death per 1000 live births),the predicted shares of local governments in consolidated budget revenues and final expenditures in theregion with higher rate of infant mortality would be approximately 0.9 percentage points smaller thanthose in the other region. The OLS coefficients of the rate of inflation in the two regressions are (-0.03)and (-0.02) respectively, suggesting a much weaker influence of the degree of macroeconomic instabilityon the decentralization outcome. All reported coefficients are statistically significant at the 99% level ofconfidence.
When we tried to substitute the rate of infant mortality in 1990 with the values of the samevariable over the period of 1994-1996 as an explanatory variable, it provided the above regressions withmuch lower OLS coefficients2 6 (in the magnitude of (-0.4) and (-0.2) respectively) and also it worsenedthe overall fit of the two regressions. Thus, only the historical differences in regional standards of living,captured by the interregional disparities in the rate of infant mortality prior to the transition, help explainthe variation in fiscal decentralization in the subjects of the Russian Federation.
23 In panel data models, the estimation of the Durbin-Watson statistic requires prior transfortnations of the regressionoutput. First, the residuals for the different cross-sections are stacked on top of one another, separated byadditionally included "N/A" values. Then, the standard formula of the Durbin-Watson statistic is applied to thisaugmented set of residuals.
24 In the economic literature infant mortality is often used to construct of composite measures of poverty. Please,note a reliable indicator of pre-transition regional poverty in Russia is not available.
25 Tuva Republic, Evenk Autonomous Okrug and Altay Republic had the highest infant mortality rate in 1990 thatexceeded 30 deaths per 1000 newborns. North Osetia Republic, Smolensk Oblast, Chuvashia Republic andVoronezh Oblast had the lowest infant mortality rate, below 14.
26 Marginally statistically significant at the 95% level of confidence in the case of the measure of revenuedecentralization and insignificant in the second regression.

32
Table 19. Determinants of Fiscal Decentralization
Local govemments Local governmentsLocal governments total expenditures
totalreveues s beoretransfxentrs aRegressors / Dependent Variable percentuesas before transfers as
consolidated regional percent of theconsolidated regional
budget revenues budget expenditures
Constant 91.18 83.84(18.3) (21.32)
Infant mortality in 1990 -0.94 -0.87(-3.16) (-3.62)
Inflation -0.03 -0.02(-4.85) (-3.44)
Dummy Republic -8.71 -8.61(4.64) (-6.22)
Dummy Autonomous Okrug -10.55 -6.84(-3.55) (-3.05)
Dummy Northern Region -5.66 *(-2.15)
Dummy Ural Region 7.05(4.12)
Dummy Western Siberia Region 7.47(3.7)
Dummy Eastern Siberia Region 6.66 10.67(2.59) (4.97)
Sample 1994 1996 1994 1996Total Panel (Unbalanced) Observations 251 253Adjusted R-squared 0.31 0.32Durbin-Watson 0.97 0.64White's Heteroskedasticity Test 49.52 44.32
(0.00) ** (0.00) **Standard Error of Regression 10.18 8.45Root Mean Squared Residual 1994 8.76 7.57Root Mean Squared Residual 1995 9.72 7.97Root Mean Squared Residual 1996 11.45 9.31
Notes:Unless otherwise indicted, numbers in parenthesis are t-statistics calculated with the Whiteheteroskedasticity consistent standard errors of OLS coefficients.Unless otherwise indicated, OLS coefficients are statistically significant at the 99% levelof confidence.* Statistically significant at the 95% level of confidence** P-value

33
The available regional data on infant mortality for 1994-96 demonstrate unusually large andunstable (with almost chaotic fluctuations from year to year) changes in this variable after the beginningof transition.27 This may be explained by a scale and nature of impact of transition on social development,which was massive and quite uneven across regions and across different time periods. Also, the first yearsof transition were accompanied by major migration flows and deterioration in a quality of demographicstatistics.
Even after controlling for regional differences in the standard of living, economicmismanagement and geographic location, the administrative type of regions remains an importantpredictor of the degrees of fiscal decentralization. On the revenue side, the OLS coefficients of thedummy variables Autonomous Okrugs and Republics are (-10.6) and (-8.7), while on the expenditure sidethe corresponding OLS estimates are (-6.8) and (-8.6). These results imply that the predicted values fromthe two regressions of the shares of local governments in consolidated budget revenues and finalexpenditures are significantly lower in autonomous okrugs and republics than in oblasts and krais.
Finally, the regressions suggest that regional location is another significant variable to explainvariation in fiscal decentralization. Regions located in three geographic areas (Urals, Western and EasternSiberia) on average have much higher degree of decentralization when it is measured as a share of localgovernments' expenditures. There are two possible explanations of this phenomenon. First, regionslocated next to each other tend to have similar budget arrangements and fiscal policy. This similarityderives from horizontal inter-government interactions that are supported through activities of localassociations of regional governments. Second, on average regions in both Western and Eastern Siberia arethe regions with the largest territory. The size of region's territory might be in itself an importantdeterminant of decentralization: larger territory requires more delegation of authority to localgovernments and thus decentralization.
To test the latter hypothesis, we re-estimate the two decentralization regressions adding therelative size of region's territory, measured as percent of the total territory of the Russian Federation, tothe explanatory variables discussed above. On the revenue side of fiscal decentralization, using the fullsample of 85 regions we obtain positive and statistically significant at the 99% level of confidence OLScoefficient (1.25) of the relative size of region's territory. However, when we re-estimate this augmentedregression using all possible sub-samples of 84 regions as a check of the robustness of the OLScoefficients (see the discussion in the following paragraph), we discover that the explanatory power of therelative size of region's territory critically hinges upon one extreme realization of that variable. Inparticular, the territory of the Sakha Republic constitutes 18.2% of the total territory of the RussianFederation and it is also the region with one of the highest levels of revenue decentralization (in 1996 theshare of local governments in consolidated regional budget revenues was 93.5%). The removal of thisapparent outlier from the sample, renders the OLS coefficient of the relative size of region's territorystatistically insignificant even at the 95% level of confidence. Thus, after controlling for regionaldifferences in the standard of living, economic mismanagement, geographic location and administrativestatus, the size of region's territory is not an important determinant of the degree of revenuedecentralization. On the expenditure side of fiscal decentralization, using the full sample of 85 regions weobtain a much smaller and statistically insignificant at the 90% level of confidence OLS coefficient (0.13)of the relative size of region's territory. Finally, the population density - when used in place of the relativesize of region's territory - does not show up significantly in any of the two regressions. In summary, the
27 For instance, a correlation coefficient between mortality in 1994 and in 1995 amounts to 0.39 and between 1994and 1996 - to 0.46.

34
empirical evidence strongly rejects the hypothesis that the differences in the size of regions' territoriescan help explain the observed heterogeneity of fiscal decentralization outcomes.
It is worth noting that our results suggest that a positive correlation between decentralization andregional level of economic development exists only as a general trend that could be tracked down withsome lag. We did not find any correlation between decentralization and current indicators of regionalwealth such as local real per capita incomes, share of poor households, etc.
Next, we check the robustness of the OLS coefficients presented in Table 19 by evaluating theirdependence on the particular set of cross-sectional units used in the panel-data analysis. To achieve this,we re-estimate the regressions of the shares of local governments in consolidated regional budgetrevenues and final expenditures with all possible sub-samples of 84 out of 85 regions and plot theresulting OLS coefficients and their 95% confidence intervals?8. If the observed negative link betweenfiscal decentralization and the incidence of poverty and macroeconomic instability in regions hinges onany one extreme realization of these variables in a given region, then the elimination of this outlier fromthe sample should make the corresponding OLS coefficient statistically insignificant. Following thisconvention, we are able to show that the coefficients of the rate of infant mortality in 1990 and the rate ofinflation remain statistically significant regardless of which sample of 84 regions we use in the estimationof the two regressions, thus confirming the statistical robustness of the coefficients presented in Table 19.
The overall fit of the estimated regressions of the measures of revenue and expendituredecentralization is 0.31 and 0.32 respectively. The lower panel of Table 19 also contains information onthe values of the root mean squared residuals9 of the two regressions for each year covered by the panel.The root mean squared residual is a measure of the average misfit of the estimated panel-data regressionto the actual values of the dependent variable in that particular year. Thus, if the overall R-squared of thepanel-data regression hinges on the good fit of the data in only one year, then there should be substantialdifferences between the intertemporal values of the root mean squared residual. The values of the rootmean squared residuals of the two regressions presented in Table 19 are increasing with time - from 8.8and 7.6 percentage points in 1994 to 11.5 and 9.3 percentage points in 1996. This comes as no surprisegiven the fact that the degrees of fiscal decentralization were shown to depend predominantly onfundamental factors - such as administrative type of regions, geographic location and infant mortality atthe start of the transition - that do not change over time. Using constant base values of the explanatoryvariables to forecast the future behavior of the degrees of revenue and expenditure decentralization willinevitably worsen the fit of the regression over time as the statistical noise present in the relationshipcompounds. At the same time, we expect that the stabilization policy of the federal government in 1995could bring about modifications in regional budget arrangements in 1996 and cause some changes in thelink between regional decentralization and its major determinants.
Table 20 presents the results from the analysis of the hypothesized link between the structure ofconsolidated regional budget expenditures and the degree of fiscal decentralization in regions. As seenfrom the first column of Table 20, the share of expenditures on Education in the consolidated regionalbudget expenditures depends positively on the rate of infant mortality in 1990 and negatively on the realper capita income in regions. The OLS coefficient of the rate of infant mortality in 1990 is substantive in
28 In all robustness tests presented in this paper, if the full-sample regressions yield statistically significant value ofthe White test of general heteroscedasticity, the 95% confidence intervals of the sub-sample estimates of OLScoefficients are constructed using White heteroskedasticity consistent standard errors.
29The root mean squared residual for a particular year is calculated by first estimating the regression with the datafor all three years in the sample. We next sum the squared OLS residuals from this regression for each year anddivide the result by the number of cross-sectional units with valid data on all variables in that particular year.

35
Table 20. Impact of Decentralization on the Structure of Budget Expenditures
Share of expenditures Share of expenditures onRegressors / Dependent Variable on Education in the National Economy in the
consolidated regional consolidated regionalbudget expenditures budget expenditures
Constant 4.80 43.07(3.02) (40.24)
Infant mortality in 1990 0.38(4.43)
Percent of rural population in 1994 (6.22) (-.37)
Local governments total revenues as 0.12percent of the consolidated regional (5.96)budget revenues
Local governments budget deficit as -0.10 0.10*percent of local governments total (-3.62) (2.17)expenditures
Real per capita income -0.0003(-4.36)
Dummy North Region 4.05 -7.17(4.25) (-5.15)
Dummy North Caucasus Region -3.15(-3.02)
Dummy Volgo-Vyatka Region -4.97(-4.62)
Dummy Ural Region 1.59 -3.54(3.19) (-4.61)
Dummy Eastern Siberia Region -5.15(-2.75)
Sample 1994 1996 1994 1996Total Panel (Unbalanced) Observations 243 255Adjusted R-squared 0.46 0.36Durbin-Watson 0.89 0.90White's Heteroskedasticity Test 85.91 62.69
(0.0O) ** (0.00) **
Standard Error of Regression 2.88 5.73Root Mean Squared Residual 1994 2.14 4.88Root Mean Squared Residual 1995 3.51 5.87Root Mean Squared Residual 1996 2.65 6.07
Notes:Unless otherwise indicated, numbers in parenthesis are t-statistics calculated withthe White heteroskedasticity consistent standard errors of OLS coefficientsUnless otherwise indicated, OLS coefficients are statistically significant at the 99%level of confidence* Statistically significant at the 95% level of confidence** P-value

36
value (0.38) and statistically significant at the 99% level of confidence. The coefficient in front of the realper capita income implies that an one thousand 1991 Rubles difference in the annual per capita income intwo otherwise identical regions will result in a 0.3 percentage points smaller predicted share ofexpenditures on Education in the consolidated budget outlays of the wealthier region. Thus, regions withhigher incidence of poverty (both in terms of real incomes and overall standard of living) spend a biggerproportion of their consolidated budgets on Education.30 Less urbanized regions also tend to allocate alarger share of their budget expenditures to the sphere of Education, as seen from the positive coefficient(0.1 1) in front of the share of rural population in 1994.
Even after controlling for regional disparities in the incidence of poverty and for certain otherdemographic and geographic factors, the degree of revenue decentralization remains an importantdeterminant of the share of expenditures on Education in the consolidated regional budget expenditures.The OLS coefficient of the ratio between local governments total revenues and the consolidated regionalbudget revenues is positive (0.12) and highly statistically significant. This result seems to support thetheoretical proposition that lower levels of government tend to be more responsive to the social needs ofthe population and thus decentralization promotes a more efficient allocation of resources. Furthermore,our regression analysis indicates that in times of budget revenue shortfalls local governments cushion thenegative impact of the lack of funds on social expenditures by expanding budget deficits. The OLScoefficient in front of the ratio of local governments budget balance to local governments totalexpenditures is (-0.10) and is statistically significant at the 99% level of confidence. Thus, localgovernments with larger budget deficits, for which the value of the above ratio is negative (negativebudget balance represents a deficit) and high in absolute terms, tend to allocate a bigger share ofconsolidated budget expenditures on Education.
Next, we check the robustness of the OLS coefficients discussed above by evaluating theirdependence on the particular set of cross-sectional units used in the panel-data analysis. To achieve this,we re-estimate the regression of the share of expenditures on Education in the consolidated regionalbudget expenditures with all possible sub-samples of 84 out of 85 regions and plot the resulting OLScoefficients and their 95% confidence intervals. If the observed positive link between the dependentvariable and the degree of revenue decentralization hinges on any one extreme realization of the latter fora given region, then the elimination of this outlier from the sample should make the corresponding OLScoefficient statistically insignificant. As seen from Figure 1 however, the OLS coefficient of the share oflocal governments in the consolidated regional budget revenues remains statistically significant regardlessof which sample of 84 regions we use, thus confirming the statistical robustness of the corresponding full-sample OLS coefficient. The same is also true for the other explanatory variables.
The adjusted R-squared of the regression of the share of expenditures on Education inconsolidated regional budget expenditures is 0.46 and the values of the root mean squared residuals of theregression in different years are quite close to each other. Thus, the overall fit of the estimated model isgood and consistent over the time span of the panel. The conducted White's test of generalheteroskedasticity in regression residuals returns a highly significant value and consequently all reportedt-statistics are calculated with the White heteroskedasticity-consistent standard errors of OLS coefficients.
30 This is consistent with the results of other studies (Stewart, 1996; Freinkman and Haney, 1997) that main socialexpenditures in subnational budgets are relatively well protected against budget squeeze and vary much less thanexpected between poor and wealthy regions.

37
Figure 1: OLS Coefficients and 95% Confidence Intervals of LocalGovernments Share in Consolidated Regional Budget Revenues
Estimated with All Possible Sub-Samples of 84 Regions
Local Govemments Share in Consolidated Regional Revenues
0.18 -
0.14 -
0.12-
0.10
0 .0 8 -,. .,..,w,, -. ,\.-- -- .- ,:, ,l
0.06 ,......
10 20 30 40 50 60 70 80
OLS Coefficient----- 95 % Confidence Interval
The second column of Table 20 shows the results of the regression analysis of the share ofexpenditures on National Economy in the consolidated regional budget expenditures. In contrast to theshare of education expenditures, spending on enterprise and housing subsidies is not related to any of themeasures of population's wellbeing in regions. Besides being contingent on the geographic location ofregions, the share of expenditures on National Economy in the consolidated regional budget expenditurestends to be higher in more urbanized regions. The OLS coefficient in front of the share of rural populationin 1994 is (-0.17) and statistically significant at the 99% level of confidence. Our interpretation of thisresult is that it mainly reflects the dynamics of housing subsidies that are a dominating component inNational Economy spending item. In Russia, housing subsidies are disproportionally concentrated inurban areas and therefore local authorities in regions with higher share of urban population are forced toallocate a bigger share of their budgets on expenditure on National Economy.
A central result of this regression is the finding that the share of expenditures on NationalEconomy in consolidated regional budget expenditures is negatively related to the size of localgovernments budget deficit. The OLS coefficient in front of the ratio between local governments budgetbalance and local governments total expenditures is positive (0.10) and statistically significant at the 95%level of confidence. Local governments with larger budget deficits, for which the value of the above ratiois negative (negative budget balance represents a deficit) and high in absolute terms, tend to allocate asmaller share of consolidated budget expenditures on National Economy. Thus, local governments are notkeen on expanding subsidy provision at the expense of the expansion in deficit. hn other words, localgovernments' response to growing deficits would be likely to include cuts in subsidies but at the sametime they would keep educational spending relatively protected. This finding is also broadly consistentthe argument that local governments in Russia are less likely that regional administrations to spendtaxpayers money on large enterprise subsidies (Freinkman and Haney, 1997).

38
Next, we check the robustness of the above OLS coefficients by evaluating their dependence onthe particular set of cross-sectional units used in the panel-data analysis. Applying the same techniquesused in the construction of Figure 1, we are able to show that the OLS estimate of the coefficient of theshare of rural population in 1994 remains statistically significant regardless of which sample of 84 regionsis used in its estimation. This is not the case however for the coefficient of the ratio between localgovernments budget balance and local governments total expenditures. In all sub-samples the abovecoefficient is positive and close to its full-sample value (0.10), but seven of the sub-samples render itstatistically insignificant at the 95% level of confidence. Thus, while the positive relation between theshare of expenditures on National Economy in regional budget expenditures and the relative size of localgovernments' budget balance is a definitive characteristic of regional fiscal systems in the RussianFederation, the strength of this link in the panel is derived from the presence of a number of data outliers.Consequently, the full-sample estimate of the coefficient of the ratio between local governments budgetbalance and local governments total expenditures should be used with caution.
The adjusted R-squared of the regression of the share of expenditures on National Economy inconsolidated regional budget expenditures is 0.36. The rising values of the root mean squared residuals ofthe regression over the time span of the panel indicate that the fit of the regression was best in earlieryears. The conducted White's test of general heteroskedasticity in regression residuals returns a highlysignificant value and consequently all reported t-statistics are calculated with the Whiteheteroskedasticity-consistent standard errors of OLS coefficients.
Table 21 presents the results from the analysis of the link between fiscal decentralization andregional economic and fiscal performance. The second column of Table 21 suggests that, as one mayexpect, real industrial growth relates positively to the purchasing power of the population and isnegatively influenced by macroeconomic instability. The large value of the OLS coefficient in front of thereal per capita income implies that an one thousand 1991 Rubles difference in the annual per capitaincome in two otherwise identical regions will result in an 1 percentage point higher rate of real industrialgrowth in the wealthier region. The OLS estimate of the influence of the rate of inflation on real industrialoutput growth is (-0.03). The central finding in this regression is the positive link between the real growthof industrial output and the degree of revenue decentralization. The value of the OLS coefficient of theratio between local governments total revenues and consolidated regional budget revenues is (0.15) and isstatistically significant at the 95% level of confidence.

39
Table 21. Impact of Decentralization on Fiscal and Economic Performance
Consolidated regional Real industrial outputbudget balance as growth
Regressors / Dependent Variable percent of the (% to previous year)consolidated regionalbudget expenditures
Constant 74.93(15.11)
Percent of rural population in 1994 -0.17 *(-2.23)
Local governments total revenues as -0.15 0.15*percent of the consolidated regional (-5.44) (2.32)budget revenues
Regional transfers to local governments 0.22as percent of local governments total (2.62)expendituresInflation 0.04 -0.03
(9.05) (-6.14)
Real per capita income 0.001(3.1)
Sample 1994 1996 1994 1996Total Panel (Unbalanced) Observations 250 243Adjusted R-squared 0.34 0.19Durbin-Watson 1.64 2.25White's Heteroskedasticity Test 85.61 26.21
(0.00) ** (0.00) **Standard Error of Regression 8.80 10.79Root Mean Squared Residual 1994 7.90 10.43Root Mean Squared Residual 1995 7.13 13.05Root Mean Squared Residual 1996 10.75 7.59
Notes:Unless otherwise indicated, numbers in parenthesis are t-statistics calculated withthe White heteroskedasticity consistent standard errors of OLS coefficientsUnless otherwise indicated, OLS coefficients are statistically significant at the 99%level of confidence* Statistically significant at the 95% level of confidence** P-value
The OLS coefficients of real per capita income and the rate of inflation are statistically robust asthey remain statistically significant and close in value to the full-sample estimates, when re-estimatedwith all possible sub-samples of 84 out of 85 regions. Figure 2 presents the OLS coefficients and the 95%confidence intervals of the share of local governments in consolidated regional budget revenues. In allsub-samples the above coefficient is positive and close to its full-sample estimate, but on one occasion(when the Altay Republic is removed from the sample) it becomes marginally insignificant at the 95%level of confidence. Consequently, while the positive link between revenue decentralization and the real

40
industrial output growth is well documented by the data, caution should be used in interpreting themagnitude of this relation.
Figure 2: OLS Coefficients and 95% Confidence Intervals of LocalGovernments Share in Consolidated Regional Budget Revenues
Estimated with All Possible Sub-Samples of 84 Regions
Local Govemments Share in Consolidated Regional Revenues
0.1-
03 * --- "; -- ,s- ',- -- -- A,- … [2| -<\5
012-
0.0- ..-.- ....... :..\.\ .fi.,............,,,,\,, ...< t
10 20 30 40 50 60 70 80
-OLS Coefficient------ 95% Confidence Interval
The adjusted R-squared of the regression of real industrial output growth is 0.19 and there is notrend in the values of the root mean squared residuals of the regression over the time span of the panel.The conducted White's test of general heteroskedasticity in regression residuals returns a statisticallysignificant value at the 95% level of confidence and consequently all reported t-statistics are calculatedwith the White heteroskedasticity-consistent standard errors of OLS coefficients.
Table 21 also describes the link between the degree of revenue decentralization and the size andsign of the consolidated regional budget balance. The relative size of the consolidated regional budgetbalance is negatively related to the degree of regional decentralization. The value of the OLS coefficientof the measure of revenue decentralization is (-0.15) and is statistically significant at the 99% level ofconfidence. Thus, regions that assign a bigger share of total budget revenues to local governments have aless favorable budget balance position (if we take two regions with identical rates of inflation, share ofrural population and relative size of regional transfers to local governments total expenditures, the regionthat assigns a bigger share of budget revenues to local governments will have a smaller predicted budgetsurplus or a large deficit than the more centralized one).
However, regions that channel a bigger portion of funds to local governments throughinterbudgetary transfers tend to have a more favorable consolidated budget balance. The coefficient infront of the relative size of regional transfers to local governments total expenditures is positive (0.22)and highly statistically significant. Combination of these two coefficients may be interpreted in a way thatdecentralization overall weakens fiscal control in regional systems but all other factors being equal, a

41
higher role of transfers mitigates this impact of decentralization. Regional transfers tend to be a moreefficient instrument of budget control within decentralized budget systems compared to tax revenuesharing.
Finally, the relative size of regional budget balance is positively related with the rate of inflationand negatively with the share of rural population in regions. The respective OLS coefficients are (0.04)and (-0.17) and are both statistically significant at the 95% level of confidence.
Next, we check the robustness of the OLS coefficients discussed above by evaluating theirdependence on the particular set of cross-sectional units used in the panel-data analysis. Applying thesame techniques used in the construction of Figures 1 and 2, we are able to show that the OLS estimatesof the coefficients of the rate of inflation, the share of local governments in consolidated regional budgetrevenues and the relative size of regional transfers to local governments total expenditures remainstatistically significant, regardless of which sample of 84 regions is used in their estimation. This is notthe case however for the coefficient of the share of rural population in 1994. In all sub-samples the abovecoefficient is negative, but three of the sub-samples render it statistically insignificant at the 95% level ofconfidence. Consequently, the full-sample estimate of the coefficient of the share of rural population in1994 (-0.17) should be interpreted with due diligence. Figure 3 demonstrates the statistical robustness (interms of independence from data outliers) of the OLS estimate of the coefficient of the share of localgovernments in consolidated regional budget revenues.
Figure 3: OLS Coefficients and 95% Confidence Intervals of LocalGovernments Share in Consolidated Regional Budget Revenues
Estimated with All Possible Sub-Samples of 84 Regions
Share of Local Govemments in Consolidated Regional Revenues
-0.08 -
- 0 .1 0 --.J..R-.........., ,,.,,........,; .,-.
-0.12-
_0314 -
-0.16-
-0.18 -
-0.20-
-0.220 20 30 40 50 60 70 80
| OLS Coefficient----- 95% Confidence interval
The adjusted R-squared of the regression is 0.34 and the values of the root mean squaredresiduals of the regression indicate that the fit of the estimated model was particularly good in 1994 and1995, but worsened in the following year. The conducted White's test of general heteroskedasticity inregression residuals returns a statistically significant value at the 95% level of confidence and

42
consequently all reported t-statistics are calculated with the White heteroskedasticity-consistent standarderrors of OLS coefficients.
8. Conclusions.
The analysis of the data on the structure of regional budgets for 1992-96 suggests that, whilequite substantive, the relative share of local governments in the Russian consolidated budget did notexpand since 1994 and they remain in control of about a quarter of total budget expenditures. However, atthe subnational level, the relative size of the local budgets increased at the expense of some compressionin regional budgets. 1996 was the first year, when local governments collected more budget revenues(6.4% of GDP) and spent more than regional administrations. At the same time, the relative role of localgovernments has been substantially increasing in all sorts of social financing including education, health,and social protection. With a growing share of federal budget spent on debt service, the role of the federalgovernment in financing public goods and services increasingly becomes less important.
The cross-regional variation in degree of decentralization of subnational budgets is high and sofar does not show any decline. Variation in revenue sharing is much more serious than variation on theexpenditure side, where common and stable patterns in expenditure assignments are quite noticeable (e.g.in education and health). All major taxes remain to be shared between three government levels, and noprogress has made towards a more transparent system of tax assignments.
Main factors that could explain this variation in the degree of decentralization are the level ofpoverty and an administrative status of the region. Regions, which have been historically less wealthy,have a more centralized budget system. This seems to represent a global phenomena: urbanization,growth in education, and decentralization are closely inter-related, and all positively related to growth.
There is a major difference in budget arrangements between ethnically Russian regions andnational republics and okrugs. In both cases, the average level of expenditure decentralization is similarbut the contrasts on a revenue side are striking. In the case of oblasts and krais, decentralization has beenevolving through the provision of local authorities with a bigger share of subnational tax revenues,whereas in republics and autonomous okrugs (before 1996) the expansion of local outlays has beenfinanced through larger interbudgetary transfers from regional governments. We describe two variouspatterns of fiscal evolution: the former could be called "true decentralization", the latter may be describedas a "redistribution model".
There is also a significant correlation between decentralization and geographic location. Regionssituated in close proximity tend to have similar budget arrangements. Interactions between neighbors inthe area of budget settings seem to be quite intensive and probably are supported through activities oflocal regional associations. The size of region's territory does not influence the decentralization outcome.
The analysis provides quite robust and statistically significant estimates of the impact ofdecentralization on fiscal and economic performance. In particular, when we control for other socialvariables such as real per capita income, fiscal decentralization is positively related to the share ofeducation spending in regional consolidated budgets. Regions with more decentralized finances tend tohave a lower economic decline. These results seems to be fully consistent with conventional predictionsof the decentralization theory that underline potential positive growth impact of decentralization.
At the same time, negative correlation between decentralization and regional budget balancesuggests that overall budget control is weaker in more decentralized regions. Instability and non-

43
transparency of inter-governmental fiscal relations at the regional level in Russia does not provideindividual governments with sufficient incentives for responsible fiscal policy. Under existing fiscalarrangements, there is a risk that further decentralization could be accompanied by additional growth inpublic deficit and debt.
Given current positive impact of decentralization in Russia on growth and expenditure structure,the federal government should be more decisive in protecting local self-governance and budget autonomy.It should develop and enforce some universal models of interactions between regional and municipalgovernments that - within the limits of the Constitution - would provide for more stability andpredictability in formation of local budgets and expand minimum requirements on local shares in maintaxes. To address potential negative fiscal impacts of decentralization, the federal government has toimpose stricter limits on the size of subnational governments' current budget deficit as well as on theoverall stock of their debt.

44
REFERENCES
Alesina, Alberto, Ricardo Hausmann, Rudolf Hommes, and Ernesto Stein. 1996. Budget Institutions andFiscal Performance in Latin America. NBER WP 5586, May.
Bahl, Roy B. and Johannes J. Linn. 1992. Urban Public Finance in Developing Countries. NY. OxfordUniversity Press.
Bird, Richard M., Robert D. Ebel, and Christine I. Wallich. 1995. "Fiscal Decentralization: FromCommand to Market." In Bird, Ebel and Wallich, eds., Decentralization of the Socialist State:Intergovernmental Finance in Transition Economies. Washington, D.C.: World Bank.
Dillinger, William and Steven B. Webb. 1998. Fiscal Management in Federal Democracies: Argentinaand Brazil. June 25, World Bank, Mimeo.
Davoodi, Hamid and Heng-fu Zou. 1998. Fiscal Decentralization and Economic Growth. Journal ofUrban Economics, 43:244-257
Fornasari, Francesca, Steven B. Webb, and Heng-Fu Zou. Decentralized Spending and CentralGovernment Deficit: International Evidence. September 23, mimeo.
Freinkman, Lev and Michael Haney. 1997. What Affects the Propensity to Subsidize: Determinants ofBudget Subsidies and Transfers Financed by the Russian Regional Governments in 1992-1995.World Bank: Policy Research Working Paper 181 8,August.
Freinkman, Lev and Stepan Titov. 1994. Decentralization of the Russian Fiscal System: the Case ofYaroslavl. The World Bank. Discussion Series Paper.
Fukasaku, Kiichiro, and Luis R. de Melo Jr. 1997. Fiscal Decentralization and Macroeconomic Stability:The Experience of Large developing and Transition Economies. K. Fukasaku, R. Hausmann, Eds.Democracy, Decentralization and Deficit in Latin America. IDB-OECD.
Hunter, Jeff and Anwar Shah. 1998. Applying a Simple Measure of Good Governance to the Debate ofFiscal Decentralization. World Bank: Policy Research Working Paper 1894, March.
Inman, Robert P. and Daniel L. Rubinfeld. 1997. Rethinking Federalism. Journal of EconomicPerspective. 11: 4: 43-64.
Institute for Local Government and Public Service. 1994. Local Governments in the CEE and CIS.Budapest.
Kuznetsova O., Lavrov A., and Y. David. 1997. Interbudgetary Relations in Subjects of the RussianFederation. In Budgetnoye Ustroistvo v Rossiskoi Federatsii, Moscow: Moskovskii PbshetsvenyiNauchnyi Fond.
Lavrov, Aleksei (Ed). 1996a. Economic Policies of Subjects of the Russian Federation Report preparedfor World Bank, November.
Lavrov, Aleksei (Ed). 1996b. Budget System of Subjects of the Russian Federation. Report prepared forWorld Bank, November.
Lavrov, Aleksei. 1995. Problemy Stanovleniya i Razvitiya Byudzhetnogo Federalizma v Rossii. AnalyticalDepartment of the Presidential Administration. Moscow, September.
Le Houerou, Philippe. 1995. Fiscal Management in the Russian Federation. World Bank Report No.14862-RU.
McLure, Charles, Christine Wallich, and Jennie Litvack. 1995. Special Issues in Russian Federal Finance:Ethnic Separatism and natural Resources. In Bird, Ebel, Wallich.
Mitcheneck, Beth. 1997a. Restructuring Russian Urban Budgets: 1991-1995. Europe-Asia Studies, 49:989-1015.
Mitcheneck, Beth. 1997b. Regional Governance in Russia: The Role of Accumulated Alliances.University of Arizona. Departnent of Geography. Discussion paper 97-4, August.
Morozov, Alexander. 1998. Intergovernmental Transfers Reform in the Russian Federation. World Bank:fiscal policy note, June.
Oates, Wallace. 1972. Fiscalfederalism. NY: Harcourt Brace Jovanovich.Stewart, Kitty. 1996. The Impact of Fiscal Decentralization on Social Expenditures in the Regions of the
Russian Federation, The World Bank. Mimeo, January 31.

45
Tanzi, Vito. 1996. Fiscal Federalism and Decentralization: A Review of Some Efficiency andMacroeconomic Aspects. Annual World Bank Conference on Development Economics, 1995.Washington, D.C., World Bank.
Treisman, Daniel. 1998a. Deciphering Russia's Federal Finance: Transfers to the Regions in 1995-6.Europe-Asia Studies. July.
Treisman, Daniel. 1998b. Russia's Tax Crisis: Falling Revenues in a Transitional Economy. UCLA:manuscript.
Treisman, Daniel. 1996. The Politics of Intergovernmental Transfers in Post-Soviet Russia, BritishJournal of Political Science July: 299-33 5
Wallich, Christine. 1994. Russia and the Challenge of Fiscal Federalism. Washington, D.C.: World Bank.Wildasin, David E. 1997. Externalities and Bailouts: Hard and Soft Budget Constraints in
Intergovernmental Fiscal Relations. World Bank: Policy Research Working Paper 1843,November.
Wildasin, David E. 1998. Fiscal Aspects of Evolving Federations. World Bank: Policy Research WorkingPaper 1884, February.
World Bank. 1998. Subnational Budgeting in Russia: Preempting a Potential Debt Crisis. Draft Report,July.
Yandiev, Magomed. 1997. Regional 'nyue i Mestnyue Budgetnyue Sistemy. Moscow. TEIS.Zhang, Tao and Heng-fu Zou. 1997. The Growth Impact of Intersectoral and Intergovernmental
Allocation of Public Expenditures: With Applications to China and India. Mimeo, December.Zhang, Tao and Heng-fu Zou. 1998. Fiscal Decentralization and Economic Growth in China. Journal of
Public Economics. 67: 221-240Zhuravskaya, Ekatherina V. 1998. "Incentives to Provide Local Public Goods: Fiscal Federalism Russian
Style". Harvard University: manuscript.

46
APPENDIX 1: Budget Revenues by Level of Government
/ mln. current Rubles /BudgetRevenues /Year 1992 1993 1994 1995 1996
Total Revenues 7087890 62956115 225736973 513808943 716729480- federal 3865500 24883100 88132100 232117348 320307776- regional 1581210 19257679 73163015 143457475 192489685- local 1641180 18815336 64441858 138234120 203932019
Total Revenues Net ofInterbudgetary Transfers 6341454 N/A 183673998 440654824 597950853
- federal 3816100 24853300 86660854 230852255 319915976- regional 1333971 16592346 50264032 112282721 137326207- local 1191383 N/A 46749112 97519848 140708670
Transfers from Other Levels ofGovernment 746436 N/A 42062975 73154119 118778627
- federal 49400 29800 1471246 1265093 391800- regiDnal 247239 2665333 22898983 31174754 55163478- local 449797 N/A 17692746 40714272 63223349
Total Tax Revenues 5631258 43097151 163986662 362316500 510714154- federal 3395300 19656800 79187126 175345255 254419807- regional 1095213 12211898 43235455 94919773 120908773- local 1140745 11228453 41564081 92051472 135385574
Profit Tax 1564355 16822332 49007033 116646509 100690719- federal 645900 5471600 17177304 41504403 36855317-regional 471115 6684070 19050582 45527378 38681807- local 447340 4666662 12779147 29614728 25153595
VAT 1999443 11259243 41680491 95226882 164055392- federal 1500700 7251000 28025154 71787639 122776879- regional 302792 2532278 8780230 13363949 25727697- local 195951 1475965 4875107 10075294 15550816
Personal Income Tax 431025 4394486 17548546 36299400 56129966- federal 0 0 108164 3269453 5143127- regional 98458 1019594 4532897 8786503 13789278- local 332567 3374892 12907485 24243444 37197561
Excise Taxes 209697 1780439 7468805 24059709 62603074- federal 100500 898600 4485639 17527221 54364461- regional 87830 715513 2391839 5130624 6432197- local 21368 166326 591327 1401864 1806416
Property Taxes 53890 546696 4840812 16727397 36710926- federal 0 0 0 831425 298287-regional 28235 248826 2021871 7069226 16185905- local 25656 297870 2818941 8826746 20226734
Natural Resources Tax 121760 851973 2439097 12271205 22507838- federal 0 248000 373964 2996888 5642115- regional 77768 346024 1095885 4462422 8780583- local 43992 257949 969248 4811895 8085140
OtherTaxes 1251237 7441973 41026378 61064101 68016239- federal 1148200 5787600 29016901 37428226 29339621-regional 29017 665584 5363151 10558458 11311306- local 74020 988789 6646326 13077417 27365312
Non-Tax Revenues 710196 N/A 19687336 78338324 87236699- federal 420800 5196500 7473728 55507000 65496169- regional 238758 4380448 7028577 17362948 16417434- local 50638 N/A 5185031 5468376 5323096
GDP 19000000 171500000 610700000 1630100000 2200200000

47
Notes:
1. The 1992, 1993 and 1994 data on "Total Revenues" on federal level have been augmented with therevenues accrued in the following off-budget accounts: "Road and Ecological funds" and "ForeignEconomic Activity".
2. The category "Other Taxes" on federal level is obtained as the difference between "Total TaxRevenues" and the sum of all itemized tax revenues shown in the above table.
3. The category "Other Taxes" on regional and municipal level is obtained directly from regional budgetdata. In 1992 and 1994 this category includes inter alia the revenues from the Land tax andGosudarstvennaia poshlina.
4. The category "Non-Tax Revenues" is calculated as the difference between "Total Revenues" and thesum of "Total Tax Revenues" and "Interbudgetary Transfers, Received".
5. Regional and municipal data for 1996 do not include the revenues of a number of "closed cities", whichbudgets were not included in the official statistics for previous years.
6. The 1996 figure of Municipal Total Tax Revenues is an estimate, based on the municipal budget data

48
APPENDIX 2: Budget Expenditures by Level of Government
/ mln. current Rubles /Budget Expenditures /Year 1992 1993 1994 1995 1996
Total Expenditures 10652046 79136666 281797011 587851384 901666566- federal 7772300 43042900 148006980 300682605 487730641
- regional 1402813 18018044 71512993 148072692 207204439
-local 1476933 18075722 62277038 139096087 206731486
Total Expenditures Net ofInterbudgetary Transfers 9810435 N/A 235950128 508489455 776687684
- federal 7455500 38638200 124530211 265838751 430654280- regional g93412 N/A 49757657 106309492 142865748
-local 1461523 17478014 61662260 136341212 203167656
Transfers to OtherLevels ofGovernment 841611 N/A 45846883 79361929 124978882
- federal 316800 4404700 23476769 34843854 57076361- regional 509401 N/A 21755336 41763200 64338691- local 15410 597708 614778 2754875 3563830
National Economy 5020573 23061487 64706923 136006447 188338823-federal 4056900 11202100 19646313 35819955 51775100-regional 438676 5674635 22488737 48211021 61033324- local 524997 6184752 22571873 51975471 75530399
Education 679703 6968581 27528711 56700424 84097340-federal 229700 1356400 5487311 9023343 12231344-regional 98249 1317678 5250503 11177017 15122035- local 351753 4294503 16790897 36500064 56743961
Health and Sport 468953 5338754 19820376 38709964 57494614- federal 52800 563000 2340921 3828008 5843945- regional 133703 1611264 6620973 12935045 19014275- local 282449 3164490 10858482 21946911 32636394
Social Protection 204686 1265023 4775064 20850750 38791956- federal 147000 657600 2403178 3864953 12104451- regional 41819 441003 1666283 6487823 10377977
- local 15867 166420 705603 10497974 16309528
Administration and Justice 350326 3982490 18082220 39099609 61179795- federal 282000 3171300 14712791 24654896 38965289- regional 19264 241678 1121637 N/A 11649041- local 49062 569512 2247792 N/A 10565465
Culture and Mass Media 115970 978755 4463105 9004354 13071548- federal 59400 340300 1768418 2847969 4540463- regional 24541 295580 1289253 2769236 3825785
- local 32030 342875 1405434 3387149 4705300
Defence 855000 7210000 28499629 49565077 76356954- federal 855000 7210000 28499629 49565077 76356954- regional 0 0 0 0 0- local 0 0 0 0 0
Loans 957897 N/A 16629519 16169517 20113400- federal 876300 2909600 14062395 9524891 6087923
- regional 38333 N/A 2071447 5591244 N/A- local 43264 N/A 495677 1053382 N/A
OtherExpenditures 1157327 N/A 51444581 142383313 237243254- federal 896400 11227900 35609255 126709659 222748811
- regional 98826 N/A 9248824 N/A N/A- local 162101 N/A 6586502 N/A N/A
GDP 19000000 171500000 610700000 1630100000 2200200000

49
Notes:
1. The category "Administration and Justice" sums the data from "State administration" and "Lawenforcement" expenditure classifications.
2. The category "Other Expenditures" is formed as the difference between "Total Expenditures" and thesum of all itemized expenditures shown in the above table.
3. The 1993 figures of the category "Administration and Justice" do not include data on law enforcementexpenditures on regional and municipal level.
4. The 1993 figure of the "Health and Sport" category does not include data on sport expenditures.
5. The 1992, 1993 and 1994 data on "Total Expenditures" on federal level have been augmented with theexpenditures from the following off-budget accounts: "Foreign Economic Activity" and "Road andEcological funds".
6. Regional and municipal data for 1996 do not include the expenditures of a number of "closed cities",which budgets were not included in the official statistics for previous years.
7. "Total municipal Expenditures" is defined as the sum of total expenditures of municipalities net oftransfers among municipalities.
8. Due to the missing data, the 1993 figures on interbudgetary transfers were estimated based on therevenue side data other municipalities, adjusted for measurement errors.

50
APPENDIX 3: Budget Balance by Level of Government
/ mln. current Rubles
Budget Balance / Year 1992 1993 1994 1995 1996
Consolidated Budget Balance -3566233 -16180551 -56060038 -74042441 -184937086- federal -3906800 -18159800 -59874880 -68565257 -167422865- consolidated regional 340567 1979249 3814842 -5477184 -17514221- regional 176320 1239635 1650022 -4615217 -14714754- local 164246 739614 2164820 -861967 -2799467
GDP 19000000 171500000 610700000 1630100000 2200200000
APPENDIX 4: Budget Balance before Transfers by Level of Government
/ mln. current Rubles
Budget Balance / Year 1992 1993 1994 1995 1996
Consolidated Budget Balance -3566233 -16180551 -56060038 -74042441 -184937086- federal -3639400 -13784900 -37869357 -34986496 -110738304- consolidated regional 73167 -2395651 -18190681 -39055945 -74198782- regional 438482 N/A 506375 5973229 -5539541- local -270141 N/A -14913148 -38821364 -62458986
GDP 19000000 171500000 610700000 1630100000 2200200000

Policy Research Working Paper Series
ContactTitle Author Date for paper
WPS2085 Monitoring Banking Sector Fragility: Asli Demirg09-Kunt March 1999 K. LabrieA Multivariate Logit Approach with Enrica Detragiache 31001an Application to the 1996-97Banking Crises
WPS2086 Deregulating Technoiogy Transfer David Gisselquist March 1999 L. Tabadain Agriculture: Reform's Impact Carl Pray 36896on Turkey in the 1980s
WPS2087 Male-Female Differences in Labor Peter F. Orazem March 1999 S. FallonMarket Outcomes during the Early Milan vodopivec 38009Transition to Market: The Case ofEstonia and Slovenia
WPS2088 Expropriation of Minority Stijn Claessens March 1999 R. VoShareholders: Evidence from Simeon Djankov 33722East Asia Joseph P. H. Fan
Larry H. P. Lang
WPS2089 Corporate Diversification in East Asia: Stijn Claessens March 1999 R. VoThe Role of Ultimate Ownership and Simeon Djankov 33722Group Affilication Joseph P. H. Fan
Larry H. P. Lang
WPS2090 Risks, Lessons Learned, and Donald F. Larson March 1999 P. KokiJaSecondary Markets for Greenhouse Paul Parks 33716Gas Reductions
WPS2031 Beyond Unequal Development: Andr6s Solimano March 1999 A. SolimanoAn Overview 87671
WPS2092 What Does Aid to Africa Finance? Shantayanan Devarajan March 1999 C. BernardoAndrew Sunil Rajkumar 31148Vinaya Swaroop
WPS2093 Free Entry in Infrastructure David Ehrhardt March 1999 R. BartolomeRebecca Burdon 35703
WPS2094 What Triggers Market Jitters? Graciela L. Kaminsky April 1999 S. HoltA Chronicle of the Asian Crisis Sergio L. Schmukler 37859
WPS2095 Ten Years of Post-Socialist Lessons Grzegorz W. Kolodko April 1999 J. Prochnow-Walkerfor Policy Reform 37466
WPS2096 Reforming the Urban Transport Jorge M. Rebelo April 1999 A. TurnerSector in the Rio de Janeiro 30933Metropolitan Region: A Case StudyIn Concessions

Policy Research Working Paper Series
ContactTitle Author Date for paper
WPS2097 The Theory of Access Pricing: Tommaso M. Valletti April 1999 G. Chenet-SmithAn Overview for Infrastructure Antonio Estache 36370Regulators
WPS2098 Reconsidering the Evidence Madhur Gautam April 1999 M. Gautamon Retums to T&V Extension Jock R. Anderson 30442in Kenya
WPS2099 Mutual Funds and Institutional Estelle James April 1999 M. LeenaertsInvestments: What Is the Most Gary Ferrier 84264Efficient Way to Set Up Individual James SmalhoutAccounts in a Social Security Dimitri VittasSystem?
Copyright © 2022 FDOKUMEN