Decarbonisation options for Large Volume Organic Chemicals ...
66
DECARBONISATION OPTIONS FOR LARGE VOLUME ORGANIC CHEMICALS PRODUCTION, DOW CHEMICAL TERNEUZEN Hans Eerens, Dick van Dam 15 February 2022 Manufacturing Industry Decarbonisation Data Exchange Network
-
Upload
khangminh22 -
Category
Documents
-
view
1 -
download
0
Transcript of Decarbonisation options for Large Volume Organic Chemicals ...
DECARBONISATION OPTIONS FOR LARGE VOLUME ORGANIC CHEMICALS PRODUCTION, DOW CHEMICAL TERNEUZEN Hans Eerens, Dick van Dam 15 February 2022
Manufacturing Industry Decarbonisation Data Exchange Network
Colophon
Decarbonisation options for Large Volume Organic Chemicals production, DOW Terneuzen © PBL Netherlands Environmental Assessment Agency; © TNO The Hague, 2022 PBL publication number: 4883 TNO project no. 060.33956 / TNO2021 P11711
Authors H.C. Eerens, D. van Dam
Acknowledgements We thank Kees Biesheuvel (DOW) for valuable input in several interviews and for reviewing the report, and Carina Oliveira (TNO) and Ton van Dril (TNO) for discussions and feedback.
MIDDEN project coordination and responsibility The MIDDEN project (Manufacturing Industry Decarbonisation Data Exchange Network) was initiated and is also coordinated and funded by PBL and TNO. The project aims to support industry, policymakers, analysts, and the energy sector in their common efforts to achieve deep decarbonisation. Correspondence regarding the project may be addressed to: D. van Dam (PBL), [email protected], or S. Gamboa (TNO), [email protected]. This publication is a joint publication by PBL and TNO Energy Transition and can be downloaded from: www.pbl.nl/en. Parts of this publication may be reproduced, providing the source is stated, in the form: Eerens, H.C., Van Dam, D. (2022), Decarbonisation options for Large Volume Organic Chemicals Production, DOW Chemical Terneuzen. The Hague: PBL Netherlands Environmental Assessment Agency and TNO Energy Transition. PBL Netherlands Environmental Assessment Agency is the national institute for strategic policy analysis in the fields of the environment, nature and spatial planning. We contribute to improving the quality of political and administrative decision-making by conducting outlook studies, analyses and evaluations in which an integrated approach is considered paramount. Policy relevance is the prime concern in all of our studies. We conduct solicited and unsolicited research that is both independent and scientifically sound. TNO Energy Transition has a twofold mission: to accelerate the energy transition and to strengthen the competitive position of the Netherlands. TNO conducts independent and internationally leading research and we stand for an agenda-setting, initiating and supporting role for government, industry and NGOs. This report has been reviewed by Kees Biesheuvel (DOW). PBL and TNO are responsible for the content of the report. The decarbonisation options and parameters are explicitly not verified by the company.
Accessibility PBL and TNO attach great importance to the accessibility of their products. Should you encounter any access-related problems when reading them, please contact us at [email protected], stating the title of the publication and the issue you are experiencing..
PBL – TNO. A MIDDEN report | 3
Contents 1 Introduction 7 1.1 Scope 7 1.2 Reading guide 7
2 LVOC production at DOW Chemical Terneuzen 8
3 LVOC production processes 12 3.1 Steam cracking 12 3.1.1 Overview steam cracker process 13 3.1.2 Feedstock preparation, cracking and quenching/cooling 14 3.1.3 Primary fractionation and compression 15 3.1.4 Cryogenic cooling and product separation 15 3.1.5 De-coking 16 3.1.6 C4 hydrocarbons separation unit 17 3.1.7 Benzene extraction 17 3.1.8 Steam cracker mass and energy balance 19 3.2 Production of polyethylenes (LDPE and LLDPE) 20 3.3 Production of cumene (isopropylbenzene) 21 3.4 Production of ethylbenzene 22 3.5 Production of styrene 23 3.6 Production of SAN 25 3.7 Production of ABS 26 3.8 Production of latex 27 3.9 Production of ethylene oxide (oxirane) 28 3.10 Production of polyols (PEG/PPG) 30 3.10.1 Poly-ethylene-glycol 31 3.10.2 Poly-propylene-glycol 31 3.10.3 Mass and energy balance PEG/PPG 32 3.11 ELSTA CHP 32 3.12 Overview energy use at DOW site in Terneuzen 33 3.13 ETS Emissions 34
4 LVOC products and applications 36 4.1 Feedstocks 36 4.2 Products 38 4.2.1 Ethylene 38 4.2.2 Propylene 39 4.2.3 C4 hydrocarbons 40 4.2.4 Aromatics 41 4.2.5 Hydrogen 44 4.2.6 LDPE and LLDPE 44 4.2.7 Ethylbenzene 44 4.2.8 Cumene (isopropylbenzene) 45 4.2.9 Styrene 45 4.2.10 Acrylonitrile Butadiene Styrene (ABS) 45
PBL – TNO. A MIDDEN report | 4
4.2.11 Styrene Acrylonitrile (SAN) 45 4.2.12 Styrene Butadiene Rubber (SBR) and Styrene Butadiene Latex (SBL) 46 4.2.13 Ethylene oxide (EO) 46 4.2.14 Polyether glycols (polyols) 46
5 Options for decarbonisation 48 5.1 Energy efficiency 49 5.2 Carbon-capture storage (CCS) and/or utilisation (CCU) 49 5.3 Electrification 52 5.3.1 Electrification of furnaces 52 5.3.2 Electrification of steam generation 53 5.4 Hydrogen as fuel for furnaces 54 5.5 Feedstock substitution 55 5.5.1 Feedstock from waste 56 5.5.2 Bio-based feedstock 56 5.5.3 Synthetic feedstock 56 5.6 Methanol to olefin process 56
6 Discussion 58
References 60
PBL – TNO. A MIDDEN report | 5
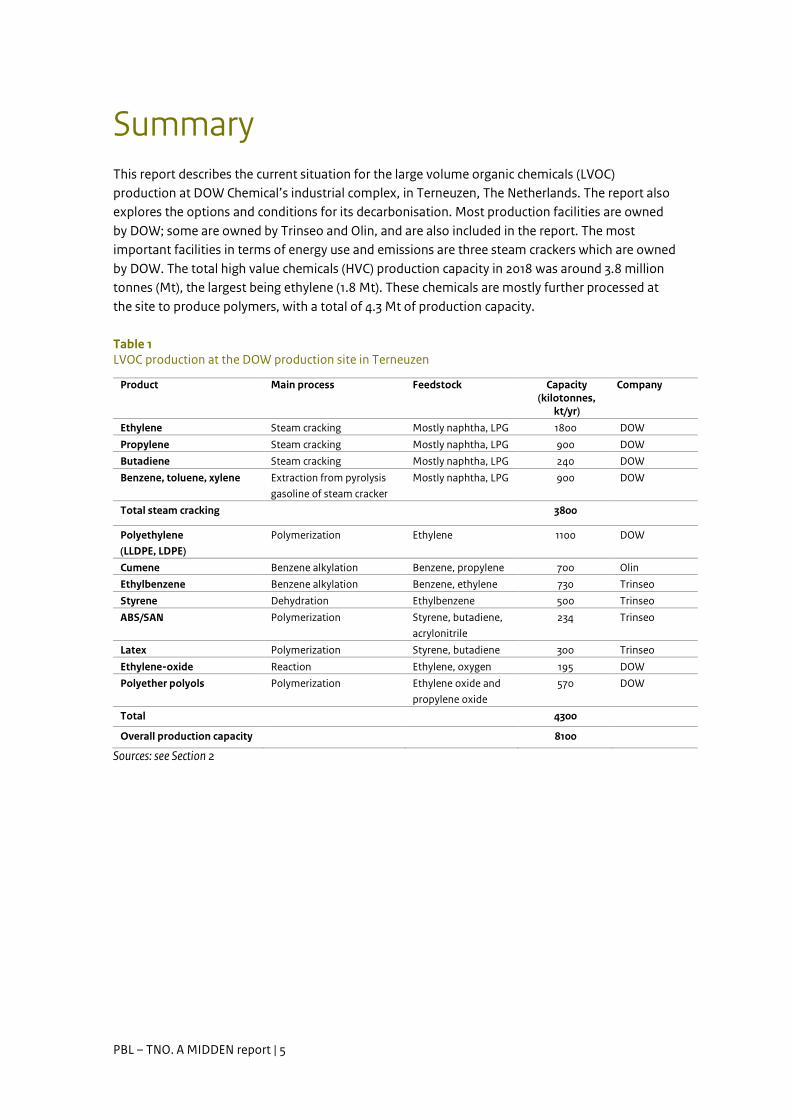
Summary This report describes the current situation for the large volume organic chemicals (LVOC) production at DOW Chemical’s industrial complex, in Terneuzen, The Netherlands. The report also explores the options and conditions for its decarbonisation. Most production facilities are owned by DOW; some are owned by Trinseo and Olin, and are also included in the report. The most important facilities in terms of energy use and emissions are three steam crackers which are owned by DOW. The total high value chemicals (HVC) production capacity in 2018 was around 3.8 million tonnes (Mt), the largest being ethylene (1.8 Mt). These chemicals are mostly further processed at the site to produce polymers, with a total of 4.3 Mt of production capacity.
Table 1 LVOC production at the DOW production site in Terneuzen
Product Main process Feedstock Capacity (kilotonnes,
kt/yr)
Company
Ethylene Steam cracking Mostly naphtha, LPG 1800 DOW
Propylene Steam cracking Mostly naphtha, LPG 900 DOW Butadiene Steam cracking Mostly naphtha, LPG 240 DOW Benzene, toluene, xylene Extraction from pyrolysis
gasoline of steam cracker Mostly naphtha, LPG 900 DOW
Total steam cracking 3800
Polyethylene (LLDPE, LDPE)
Polymerization Ethylene 1100 DOW
Cumene Benzene alkylation Benzene, propylene 700 Olin Ethylbenzene Benzene alkylation Benzene, ethylene 730 Trinseo Styrene Dehydration Ethylbenzene 500 Trinseo ABS/SAN Polymerization Styrene, butadiene,
acrylonitrile 234 Trinseo
Latex Polymerization Styrene, butadiene 300 Trinseo
Ethylene-oxide Reaction Ethylene, oxygen 195 DOW Polyether polyols Polymerization Ethylene oxide and
propylene oxide 570 DOW
Total 4300
Overall production capacity 8100
Sources: see Section 2
PBL – TNO. A MIDDEN report | 6
In 2018, the estimated final energy consumption of the DOW site was 65 PJ. Approximately 55 PJ of fuel gas and steam is supplied to the steam crackers whereof 10 PJ of steam is recovered. The combined heat and power (CHP) plant ELSTA used about 26 PJ in 2018 and provides steam and electricity for the DOW site, as well as electricity for the grid. In 2018, the CO2 emissions at the DOW complex amounted to 3.9 Mt/yr (NEa, 2021). The decarbonisation options studied include furnaces and steam generation electrification, hydrogen as fuel substitute, plastic waste oil, synthetic hydrocarbon and bio-based naphtha as co-processed feedstock and alternative olefins production via the methanol to olefins process. All the options present benefits and challenges related to their implementation, which are further explored in this report. The cracker furnaces could be electrified, which would avoid the largest part of the emissions. However, electrification requires reliable renewable electricity supply and finding a CO2 free utilization for the fuel gas from the crackers, which could be the production of either hydrogen or olefins. Regarding alternative feedstocks, the use of plastic waste and bio-based feedstocks are increasingly used, although yet in small amounts.
PBL – TNO. A MIDDEN report | 7
1 Introduction This report describes the current situation for Large Volume Organic Chemicals (LVOC) production in Terneuzen and the options and preconditions for its decarbonisation. The study is part of the MIDDEN project (Manufacturing Industry Decarbonisation Data Exchange Network). The MIDDEN project aims to support industry, policymakers, analysts, and the energy sector in their common efforts to achieve deep decarbonisation. The MIDDEN project will update and elaborate further on options in the future, in close connection with the industry.
1.1 Scope Although this report covers mainly the production of DOW Chemical in Terneuzen, also larger production processes owned by other parties present at the DOW Chemical industrial site are covered. These include Trinseo and Olin. DOW Chemical also owns smaller production sites in The Netherlands, in Dordrecht and Delfzijl, which are not part of the scope of this report. Production processes include naphtha steam cracking, styrene and cumene production and others. Products include: ethylene, propylene, benzene, styrene, cumene, latex. The polyolefins production (polymerisation) is covered in MIDDEN report ‘Decarbonisation options for the Dutch polyolefins industry’ (Negri and Ligthart, 2020). The main options for decarbonisation at DOW Terneuzen are electrification, hydrogen as fuel, carbon capture and utilisation or storage (CCUS) and feedstock substitution.
1.2 Reading guide Section 2 introduces the Large Volume Organic Chemicals production in Terneuzen. Section 3 describes the current situation for Large Volume Organic Chemicals production in Terneuzen, and Section 4 describes the relevant products of these processes, while options for decarbonisation are systematically quantified and evaluated in Section 5. The feasibility of and requirements for those decarbonisation options are discussed in Section 6.
PBL – TNO. A MIDDEN report | 8
2 LVOC production at DOW Chemical Terneuzen
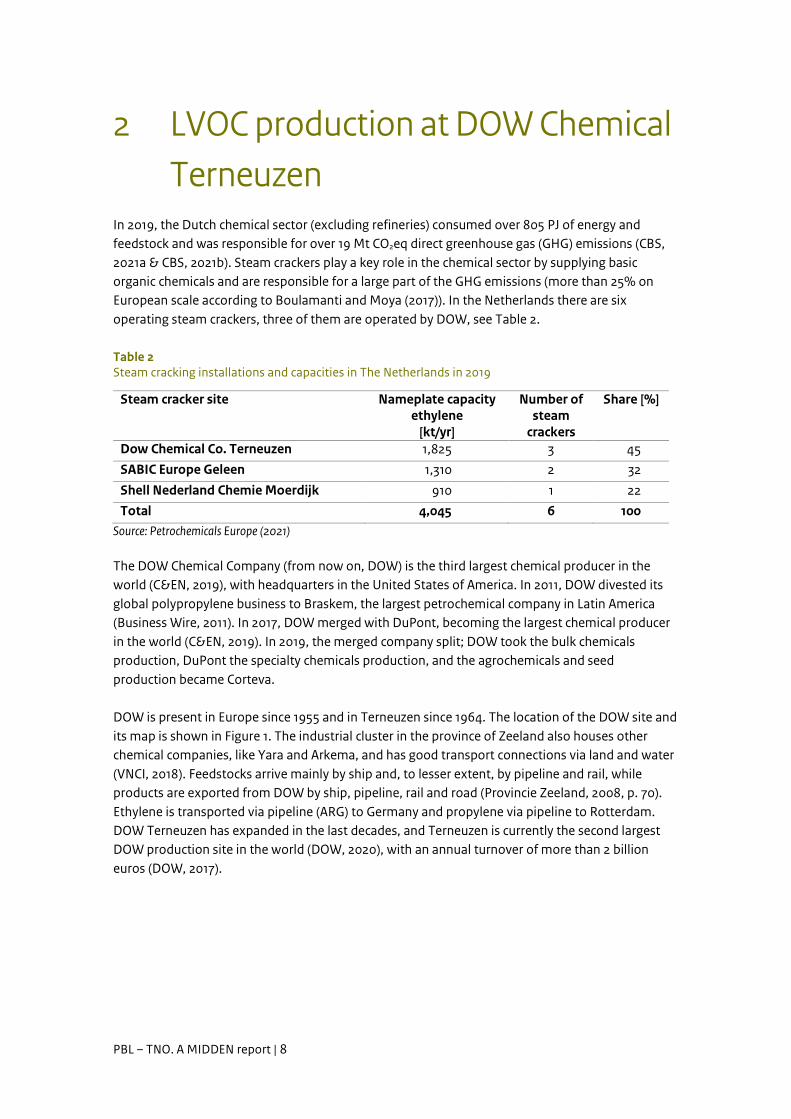
In 2019, the Dutch chemical sector (excluding refineries) consumed over 805 PJ of energy and feedstock and was responsible for over 19 Mt CO2eq direct greenhouse gas (GHG) emissions (CBS, 2021a & CBS, 2021b). Steam crackers play a key role in the chemical sector by supplying basic organic chemicals and are responsible for a large part of the GHG emissions (more than 25% on European scale according to Boulamanti and Moya (2017)). In the Netherlands there are six operating steam crackers, three of them are operated by DOW, see Table 2.
Table 2 Steam cracking installations and capacities in The Netherlands in 2019
Steam cracker site Nameplate capacity ethylene
[kt/yr]
Number of steam
crackers
Share [%]
Dow Chemical Co. Terneuzen 1,825 3 45 SABIC Europe Geleen 1,310 2 32 Shell Nederland Chemie Moerdijk 910 1 22 Total 4,045 6 100
Source: Petrochemicals Europe (2021) The DOW Chemical Company (from now on, DOW) is the third largest chemical producer in the world (C&EN, 2019), with headquarters in the United States of America. In 2011, DOW divested its global polypropylene business to Braskem, the largest petrochemical company in Latin America (Business Wire, 2011). In 2017, DOW merged with DuPont, becoming the largest chemical producer in the world (C&EN, 2019). In 2019, the merged company split; DOW took the bulk chemicals production, DuPont the specialty chemicals production, and the agrochemicals and seed production became Corteva. DOW is present in Europe since 1955 and in Terneuzen since 1964. The location of the DOW site and its map is shown in Figure 1. The industrial cluster in the province of Zeeland also houses other chemical companies, like Yara and Arkema, and has good transport connections via land and water (VNCI, 2018). Feedstocks arrive mainly by ship and, to lesser extent, by pipeline and rail, while products are exported from DOW by ship, pipeline, rail and road (Provincie Zeeland, 2008, p. 70). Ethylene is transported via pipeline (ARG) to Germany and propylene via pipeline to Rotterdam. DOW Terneuzen has expanded in the last decades, and Terneuzen is currently the second largest DOW production site in the world (DOW, 2020), with an annual turnover of more than 2 billion euros (DOW, 2017).
PBL – TNO. A MIDDEN report | 9
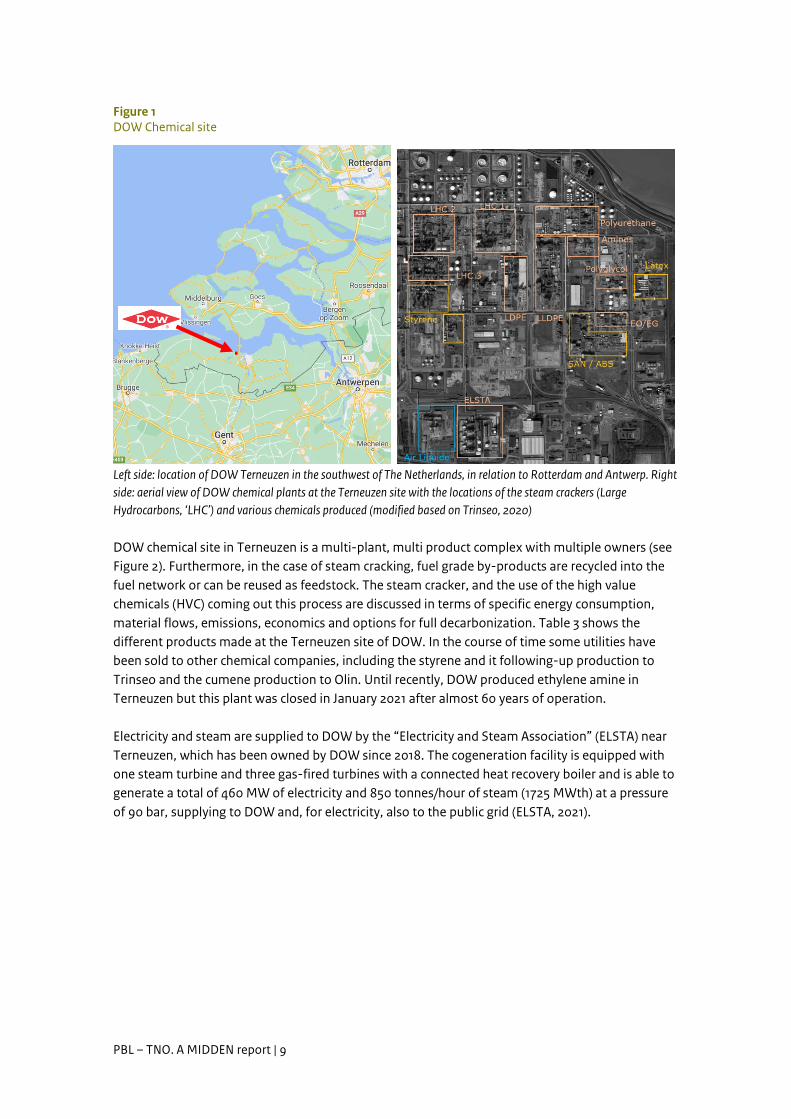
Figure 1 DOW Chemical site
Left side: location of DOW Terneuzen in the southwest of The Netherlands, in relation to Rotterdam and Antwerp. Right side: aerial view of DOW chemical plants at the Terneuzen site with the locations of the steam crackers (Large Hydrocarbons, ‘LHC’) and various chemicals produced (modified based on Trinseo, 2020) DOW chemical site in Terneuzen is a multi-plant, multi product complex with multiple owners (see Figure 2). Furthermore, in the case of steam cracking, fuel grade by-products are recycled into the fuel network or can be reused as feedstock. The steam cracker, and the use of the high value chemicals (HVC) coming out this process are discussed in terms of specific energy consumption, material flows, emissions, economics and options for full decarbonization. Table 3 shows the different products made at the Terneuzen site of DOW. In the course of time some utilities have been sold to other chemical companies, including the styrene and it following-up production to Trinseo and the cumene production to Olin. Until recently, DOW produced ethylene amine in Terneuzen but this plant was closed in January 2021 after almost 60 years of operation. Electricity and steam are supplied to DOW by the “Electricity and Steam Association” (ELSTA) near Terneuzen, which has been owned by DOW since 2018. The cogeneration facility is equipped with one steam turbine and three gas-fired turbines with a connected heat recovery boiler and is able to generate a total of 460 MW of electricity and 850 tonnes/hour of steam (1725 MWth) at a pressure of 90 bar, supplying to DOW and, for electricity, also to the public grid (ELSTA, 2021).
PBL – TNO. A MIDDEN report | 10
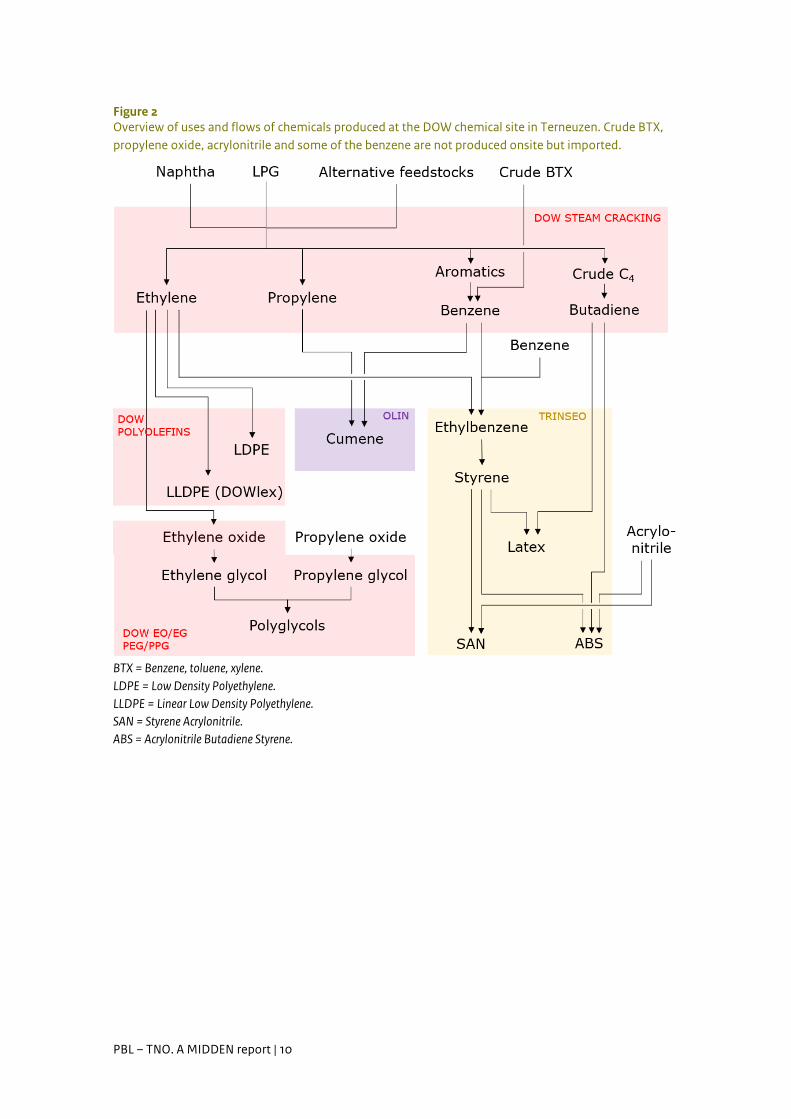
Figure 2 Overview of uses and flows of chemicals produced at the DOW chemical site in Terneuzen. Crude BTX, propylene oxide, acrylonitrile and some of the benzene are not produced onsite but imported.
BTX = Benzene, toluene, xylene. LDPE = Low Density Polyethylene. LLDPE = Linear Low Density Polyethylene. SAN = Styrene Acrylonitrile. ABS = Acrylonitrile Butadiene Styrene.
PBL – TNO. A MIDDEN report | 11
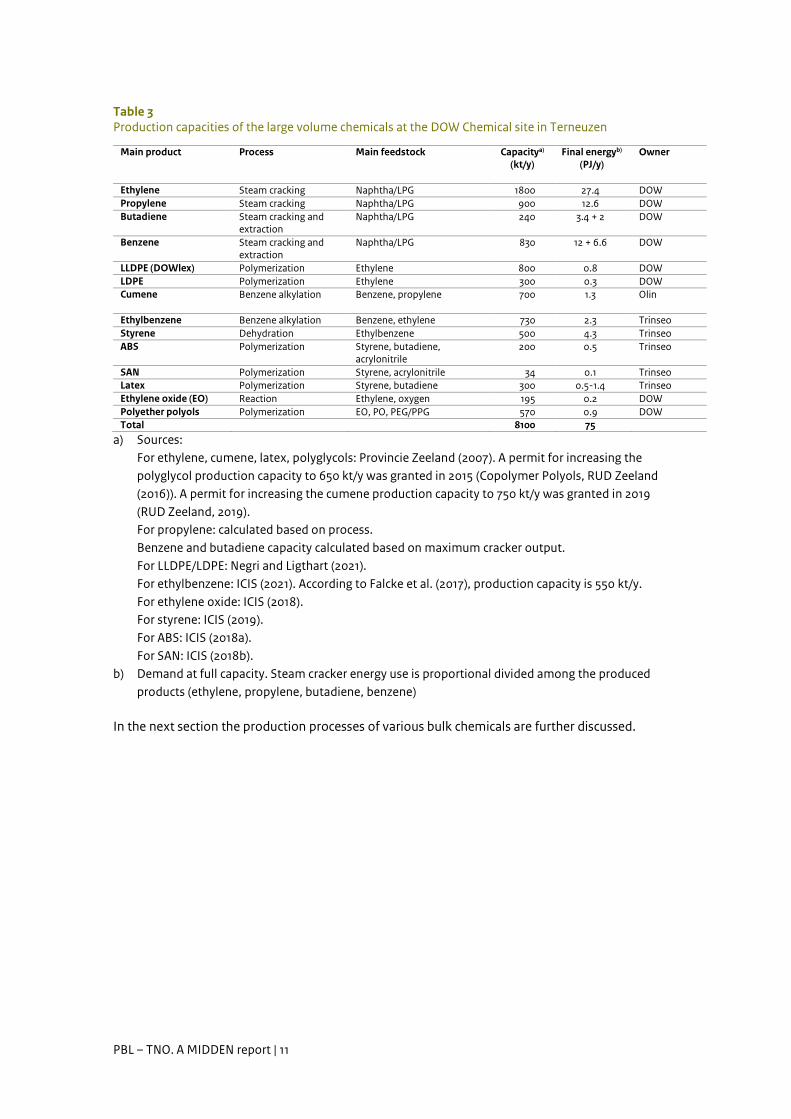
Table 3 Production capacities of the large volume chemicals at the DOW Chemical site in Terneuzen
Main product Process Main feedstock Capacitya) (kt/y)
Final energyb) (PJ/y)
Owner
Ethylene Steam cracking Naphtha/LPG 1800 27.4 DOW Propylene Steam cracking Naphtha/LPG 900 12.6 DOW Butadiene Steam cracking and
extraction Naphtha/LPG 240 3.4 + 2 DOW
Benzene Steam cracking and extraction
Naphtha/LPG 830 12 + 6.6 DOW
LLDPE (DOWlex) Polymerization Ethylene 800 0.8 DOW LDPE Polymerization Ethylene 300 0.3 DOW Cumene Benzene alkylation
Benzene, propylene 700 1.3 Olin
Ethylbenzene Benzene alkylation Benzene, ethylene 730 2.3 Trinseo Styrene Dehydration Ethylbenzene 500 4.3 Trinseo ABS Polymerization Styrene, butadiene,
acrylonitrile 200 0.5 Trinseo
SAN Polymerization Styrene, acrylonitrile 34 0.1 Trinseo Latex Polymerization Styrene, butadiene 300 0.5-1.4 Trinseo Ethylene oxide (EO) Reaction Ethylene, oxygen 195 0.2 DOW Polyether polyols Polymerization EO, PO, PEG/PPG 570 0.9 DOW Total 8100 75
a) Sources: For ethylene, cumene, latex, polyglycols: Provincie Zeeland (2007). A permit for increasing the polyglycol production capacity to 650 kt/y was granted in 2015 (Copolymer Polyols, RUD Zeeland (2016)). A permit for increasing the cumene production capacity to 750 kt/y was granted in 2019 (RUD Zeeland, 2019). For propylene: calculated based on process. Benzene and butadiene capacity calculated based on maximum cracker output. For LLDPE/LDPE: Negri and Ligthart (2021). For ethylbenzene: ICIS (2021). According to Falcke et al. (2017), production capacity is 550 kt/y. For ethylene oxide: ICIS (2018). For styrene: ICIS (2019). For ABS: ICIS (2018a). For SAN: ICIS (2018b).
b) Demand at full capacity. Steam cracker energy use is proportional divided among the produced products (ethylene, propylene, butadiene, benzene)
In the next section the production processes of various bulk chemicals are further discussed.
PBL – TNO. A MIDDEN report | 12
3 LVOC production processes In this section the main chemical processes, their energy use and associated CO2 emissions are described.
3.1 Steam cracking Steam cracking is the process of breaking long-chain hydrocarbons into short-chain ones, and it is the most important process worldwide to produce high value chemicals (HVCs) (Falcke, 2017). Steam cracking utilizes the thermal energy provided by furnaces (fed by hydrogen- and methane-rich gas from the steam cracker output) in the presence of steam (Sanfilippo et al., 2005). With an increasing temperature gradient, cracking reactions are initiated first (above 700 °C), followed by dehydrogenation (above 800-850 °C). The reaction is highly endothermic. Thermodynamics and kinetics of cracking put constraints in the design of industrial units:
• Supply substantial amount of heat at very high temperature • Operate at the lowest hydrocarbon partial pressure in the reactor • Use very short residence times, to limit the consecutive reactions • Quickly quench the reactor effluents to avoid composition change.
The ethylene and propylene yield of steam cracking vary between 24-81% and 1.5-25% respectively, depending mainly on the feedstock type and operating conditions (ACC, 2004). At DOW Chemical Terneuzen there are three steam cracker units operating on naphtha and LPG as a feedstock with an average ethylene and propylene yield of 35% and 17% respectively. Added to the steam crackers are two extraction/conversion units (for benzene and 1,4-butadiene). The steam cracking reaction results in more than one product which makes it difficult to standardize the energy use and emissions accurately for each product. Therefore, benchmarking studies from Solomon and Associates have defined the term High Value Chemicals (HVCs). High value chemicals include ethylene, propylene, benzene, 1,4-butadiene and hydrogen, according to Solomon Associates (IEA, 2009). Due to the variation in reaction conditions and multiple products formed, aggregation of these chemicals makes it easier to assess the overall performance of a site compared to others. In this study the energy use and emissions are standardized to this term for simplicity and consistency with literature. Table 4 reports typical distributions of products from the steam crackers using different types of feeds. Ethylene is the main product.
PBL – TNO. A MIDDEN report | 13
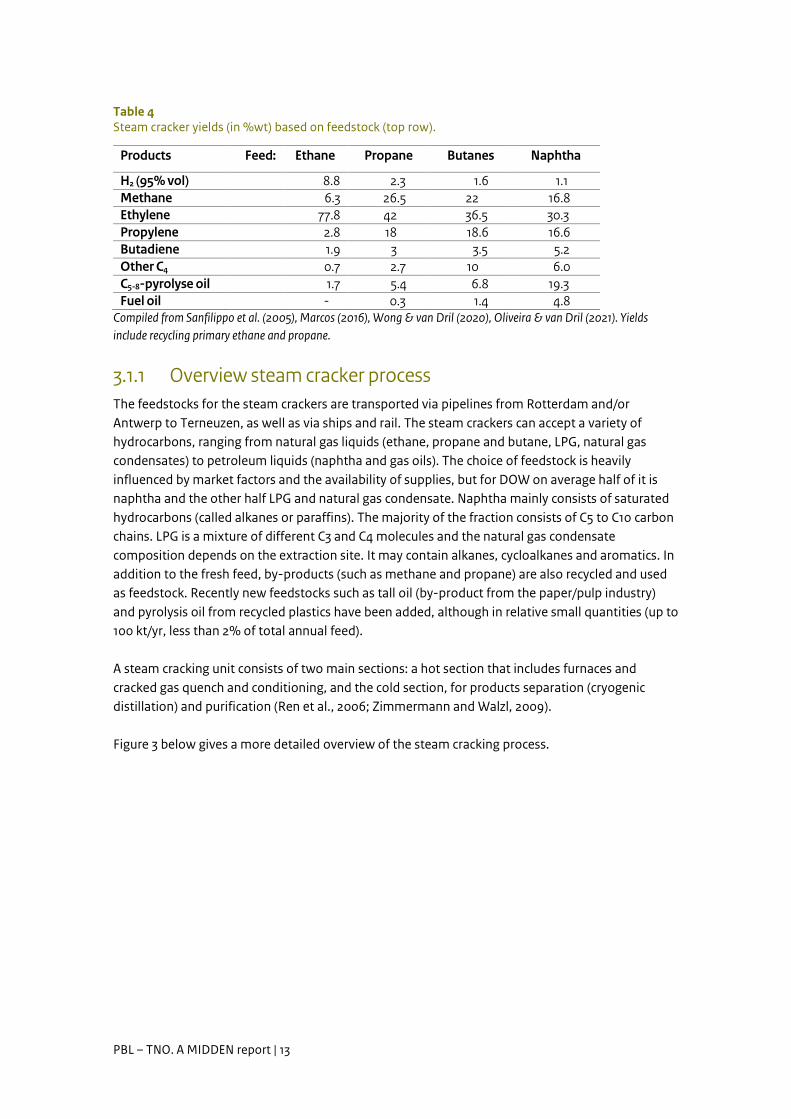
Table 4 Steam cracker yields (in %wt) based on feedstock (top row).
Products Feed: Ethane Propane Butanes Naphtha
H2 (95% vol) 8.8 2.3 1.6 1.1 Methane 6.3 26.5 22 16.8 Ethylene 77.8 42 36.5 30.3 Propylene 2.8 18 18.6 16.6 Butadiene 1.9 3 3.5 5.2 Other C4 0.7 2.7 10 6.0 C5-8-pyrolyse oil 1.7 5.4 6.8 19.3 Fuel oil - 0.3 1.4 4.8
Compiled from Sanfilippo et al. (2005), Marcos (2016), Wong & van Dril (2020), Oliveira & van Dril (2021). Yields include recycling primary ethane and propane.
3.1.1 Overview steam cracker process The feedstocks for the steam crackers are transported via pipelines from Rotterdam and/or Antwerp to Terneuzen, as well as via ships and rail. The steam crackers can accept a variety of hydrocarbons, ranging from natural gas liquids (ethane, propane and butane, LPG, natural gas condensates) to petroleum liquids (naphtha and gas oils). The choice of feedstock is heavily influenced by market factors and the availability of supplies, but for DOW on average half of it is naphtha and the other half LPG and natural gas condensate. Naphtha mainly consists of saturated hydrocarbons (called alkanes or paraffins). The majority of the fraction consists of C5 to C10 carbon chains. LPG is a mixture of different C3 and C4 molecules and the natural gas condensate composition depends on the extraction site. It may contain alkanes, cycloalkanes and aromatics. In addition to the fresh feed, by-products (such as methane and propane) are also recycled and used as feedstock. Recently new feedstocks such as tall oil (by-product from the paper/pulp industry) and pyrolysis oil from recycled plastics have been added, although in relative small quantities (up to 100 kt/yr, less than 2% of total annual feed). A steam cracking unit consists of two main sections: a hot section that includes furnaces and cracked gas quench and conditioning, and the cold section, for products separation (cryogenic distillation) and purification (Ren et al., 2006; Zimmermann and Walzl, 2009). Figure 3 below gives a more detailed overview of the steam cracking process.
PBL – TNO. A MIDDEN report | 14
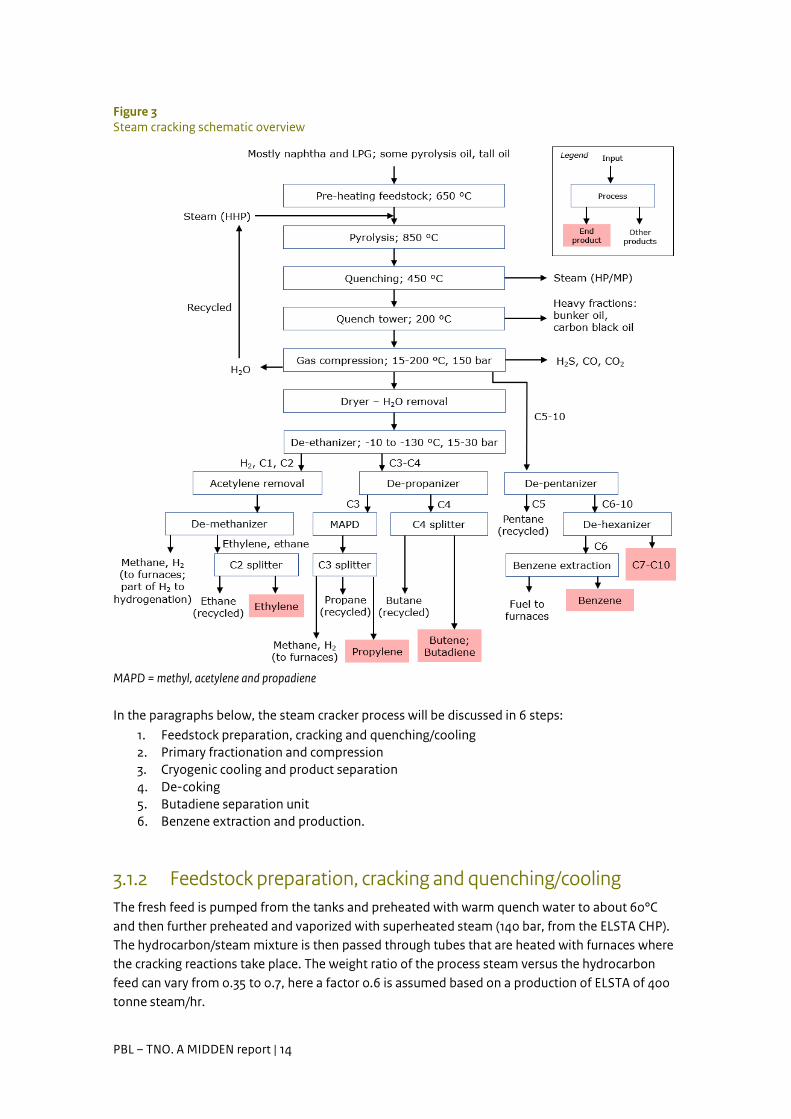
Figure 3 Steam cracking schematic overview
MAPD = methyl, acetylene and propadiene In the paragraphs below, the steam cracker process will be discussed in 6 steps:
1. Feedstock preparation, cracking and quenching/cooling 2. Primary fractionation and compression 3. Cryogenic cooling and product separation 4. De-coking 5. Butadiene separation unit 6. Benzene extraction and production.
3.1.2 Feedstock preparation, cracking and quenching/cooling The fresh feed is pumped from the tanks and preheated with warm quench water to about 60°C and then further preheated and vaporized with superheated steam (140 bar, from the ELSTA CHP). The hydrocarbon/steam mixture is then passed through tubes that are heated with furnaces where the cracking reactions take place. The weight ratio of the process steam versus the hydrocarbon feed can vary from 0.35 to 0.7, here a factor 0.6 is assumed based on a production of ELSTA of 400 tonne steam/hr.
PBL – TNO. A MIDDEN report | 15
The process is highly endothermic and requires high temperatures and therefore continuous external heating. This is provided by the recycled fuel gases coming out of the cracking process itself (Ren et al., 2006). To minimalize the forming of carbon in the furnaces, the residence time is short and the pressure in the tubes is low. The vaporization with steam inhibits carbonization and prevents mixing with air to form explosive mixtures, a danger in case of leak (CIEC, 2015). In addition, it lowers the hydrocarbon partial pressure, thus enhancing olefin yield (Zimmermann and Walzl, 2009). The ratio of ethylene to propylene is dependent on the residence time in the furnace section of the cracker, a short residence time of 0.5 s favors ethylene production (max 5% increase) and is called high severity, with longer residence time (1 s, low severity) propylene yield is favored. P/E ratio of <0.5 is called high severity and P/E ratio of 0.7 low severity. In Europe the average ratio is 0.52. The hot cracker gas flow that leaves the ovens must be cooled down quickly to prevent unwanted follow-up reactions. This is done in two steps. In the first step, the cracking gas is cooled down (to about 300-650 oC) in a heat exchanger while producing HHP steam (approx. 110 bar) from boiler feed water. The 110 bar steam is mainly used for driving compressors. The second cooling step takes place in a quench tower and reduces the cracked gas temperature to approximately 200 °C, being responsible for the partial condensation of the cracked gas. The cooling process happens via direct contact between the cracked gas and a quench oil.
3.1.3 Primary fractionation and compression After cooling, the cracked gas flow is sent to the "primary fractionation column". This column forms part of the so-called "warm separation" (200 °C). In the column, the heaviest fractions (the quench oil) are drained via the bottom. Most is pumped back to the quench tower, while a small part is pumped to the storage, and eventually sold (Ren et al., 2006). Most of the dilution steam is recovered and recycled (Ren et al., 2006). The cracked gas from the top of the quenching tower is transported via a suction tank to the "cracking gas compressor". Compression (4-5 stages) at 15-100 °C and high pressure (up to 140 bar) is necessary to remove the acid gases (such as H2S), CO2 and water, whereby the water is recycled back. The compressor is driven by a steam turbine that uses HHP steam (140 bar) from the ELSTA CHP. The resulting low pressure steam is used for dilution in the crackers. During the compressions steps the heavier hydrocarbons (C5+) are separated from the main stream. This allows for a more energy-efficient process, compared to separating the C5+ stream at the end of the separation process.
3.1.4 Cryogenic cooling and product separation The last residues of water vapor are removed in the dryers. This prevents hydrate/ice formation in the deep cooling section. The dried gas is led to the cryogenic separation section where, after each step, condensate is collected. The cooling can reach approximately minus 130 °C. At this temperature virtually all hydrocarbons (except methane) are condensed. In the first separation step ethane, ethylene, hydrogen and acetylene (top products) are separated in the de-ethaniser (120-180 traps, 15-30 bar and -10 to -150 °C), followed by the separation of
PBL – TNO. A MIDDEN report | 16
acetylene. Methane and ethylene are then separated in the de-methaniser (-114 °C). In this column, methane, CO and hydrogen are recovered as top products and ethylene/ethane as bottom products. Part of the hydrogen is recovered and used for downstream hydrogenation, hydrotreating of the heavier products or sold (Falcke et al., 2017). Because CO poisons the catalysts, its removal is necessary before the hydrogen can be used. This is done by adsorption. DOW employs an existing natural gas pipeline to ammonia producer Yara in Sluiskil for supplying a hydrogen-rich gas stream (4.5 kt/y). The remaining methane rich stream (including CO and some hydrogen) is used as fuel in the furnaces/boilers of the cracker, sent to the CHP unit (ELSTA) or just by other facilities on the area. The bottom product of ethylene and ethane is sent to the C2 splitter. In the C2 splitter, ethylene is separated from ethane by distillation. Ethylene is recovered as main product over the top and ethane is collected as bottom product and recycled to the gas furnace to be cracked. The ethylene gas can now be transported to the various plants at the DOW site to be used as a feedstock. In the second separation step (as in crackers LHC1 and LHC2, in cracker LHC3 the de-propaniser is done as a first step) the bottom products of de-ethaniser are sent to the de-propaniser destillation tower (80oC) with propylene, methylacethylene, propadiene and propane as top products. The bottom products are discharged to the de-butanizer / C4 splitter, while the top products are sent to the MAPD (methylacetylene and propadiene) hydrogenation reactor. In the MAPD methylacetylene and propadiene are converted into propylene. Following the MAPD hydrogenation, the C3 stream is sent to the C3 splitter. In this column, the last residues of methane and hydrogen go over the top and are returned to the cracking gas compressor. Also, 98-99.5% propylene is obtained as top product and about 90% propane as a bottom product. This pure "polymer grade" propylene is sent to storage and/or directly to buyers. The bottom product (propane rich) goes to the feed of the crackers (Zimmermann and Walzl, 2009). In the third separation step the C4 splitter is used to separate the crude C4 species (top) from the rest (bottom). The C4 stream (butenes, butanes and butadienes) are further processed in the butadiene production unit. The C5+ steam (already separated at the hot section in cracker LHC3) is fed to the de-pentanizer. The de-pentanizer distillation tower is used to separate pentane (top product) from the rest. The first step involves selective hydrogenation so that the diolefins are not polymerized. Olefins and the impurities, such as nitrogen and sulfur are then fully hydrogenated and removed. The recovered pentane is sent back to the feed of the crackers, the rest is sent to the de-hexanizer. Finally, the de-hexanizer distillation tower is used to separate benzene (top product) from the rest (bottom). The top products are sent to the benzene production unit, while the rest is sold (C7-C10). Depending on the market situation the C7 (toluene) and C8 (xylene) can also be further processed into benzene.
3.1.5 De-coking The wall and pipes of the reactor are slowly polluted with coke. A naphtha-cracking furnace typically will be out of operation for 20-40 h every 15-40 days. In this interval steam and air will be injected at 880-900 oC to remove the carbon from the reactor and pipes.
PBL – TNO. A MIDDEN report | 17
3.1.6 C4 hydrocarbons separation unit
Butadiene extraction and C4 hydrogenation The butadiene recovery happens via liquid extraction. Normally n-methyl pyrrolidone (NMP) is employed as solvent. First, direct contact between the solvent and the C4 rich stream takes place in a extraction column. After that, the solvent and butadiene are separated via distillation. The remaining C4 stream follows to the C4 hydrogenation unit, where butyne, any traces of butadiene and vinylacetylene are selectively hydrogenated to butene. The reactor vessel is filled with catalyst and fed with hydrogen. Due to the endothermic character of the reaction, the C4 liquid feed is pre-heated from about 40-80 °C to 90-110 °C. The reactor effluent is collected in a separating vessel in which the gas phase is separated from the liquid (rich in butene). The separated gas from the separator tank is passed through a cooling where C4 vapors condensate. The condensate flows back into the separator. The gas flow (hydrogen, methane and remaining butene vapor) is discharged to the cracking gas compressor to recover the components. The required steam and electricity for this step is 6.4 and 0.9 GJ/tonne of product respectively, based on Wong & van Dril (2020). The estimated mass and energy balance can be found in Table 5.
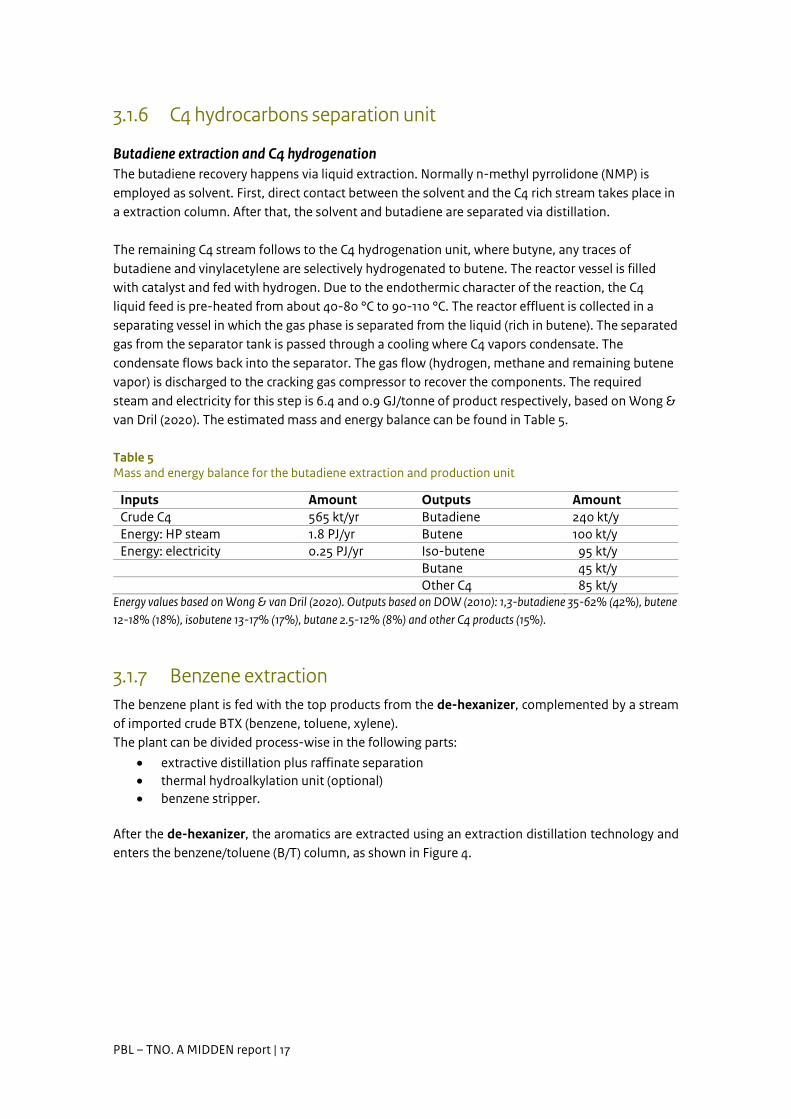
Table 5 Mass and energy balance for the butadiene extraction and production unit
Inputs Amount Outputs Amount Crude C4 565 kt/yr Butadiene 240 kt/y Energy: HP steam 1.8 PJ/yr Butene 100 kt/y Energy: electricity 0.25 PJ/yr Iso-butene 95 kt/y Butane 45 kt/y Other C4 85 kt/y
Energy values based on Wong & van Dril (2020). Outputs based on DOW (2010): 1,3-butadiene 35-62% (42%), butene 12-18% (18%), isobutene 13-17% (17%), butane 2.5-12% (8%) and other C4 products (15%).
3.1.7 Benzene extraction The benzene plant is fed with the top products from the de-hexanizer, complemented by a stream of imported crude BTX (benzene, toluene, xylene). The plant can be divided process-wise in the following parts:
• extractive distillation plus raffinate separation • thermal hydroalkylation unit (optional) • benzene stripper.
After the de-hexanizer, the aromatics are extracted using an extraction distillation technology and enters the benzene/toluene (B/T) column, as shown in Figure 4.
PBL – TNO. A MIDDEN report | 18
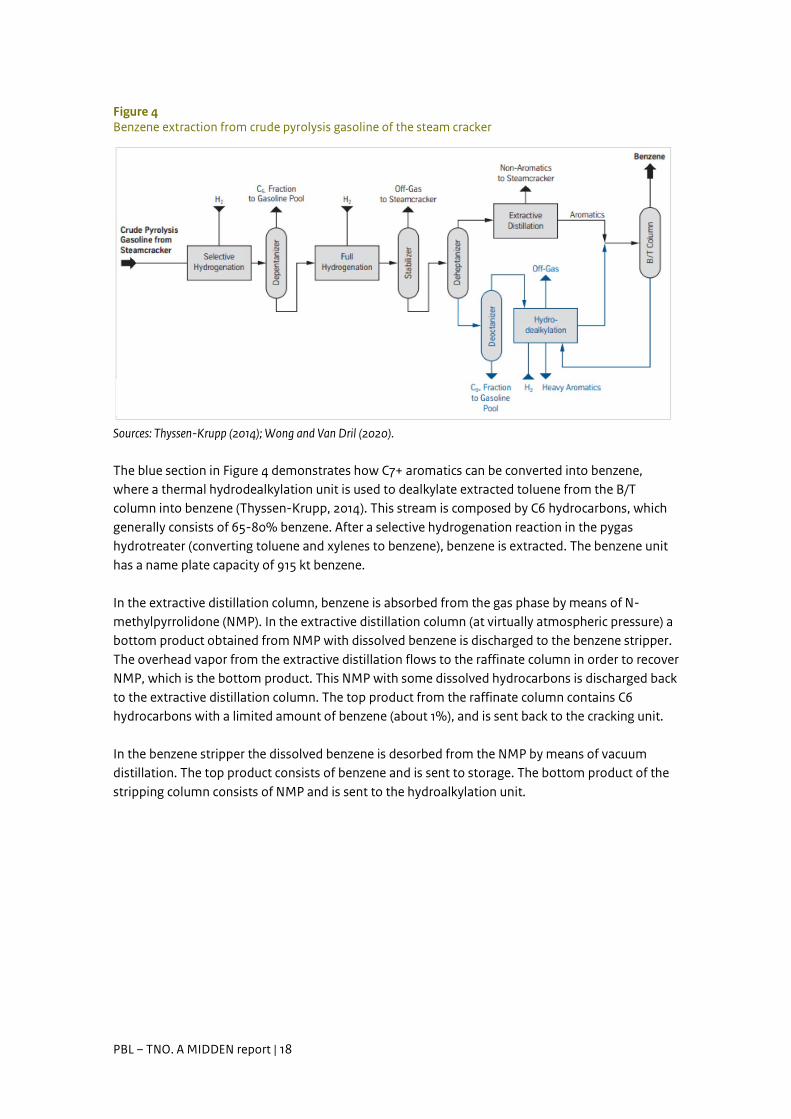
Figure 4 Benzene extraction from crude pyrolysis gasoline of the steam cracker
Sources: Thyssen-Krupp (2014); Wong and Van Dril (2020). The blue section in Figure 4 demonstrates how C7+ aromatics can be converted into benzene, where a thermal hydrodealkylation unit is used to dealkylate extracted toluene from the B/T column into benzene (Thyssen-Krupp, 2014). This stream is composed by C6 hydrocarbons, which generally consists of 65-80% benzene. After a selective hydrogenation reaction in the pygas hydrotreater (converting toluene and xylenes to benzene), benzene is extracted. The benzene unit has a name plate capacity of 915 kt benzene. In the extractive distillation column, benzene is absorbed from the gas phase by means of N-methylpyrrolidone (NMP). In the extractive distillation column (at virtually atmospheric pressure) a bottom product obtained from NMP with dissolved benzene is discharged to the benzene stripper. The overhead vapor from the extractive distillation flows to the raffinate column in order to recover NMP, which is the bottom product. This NMP with some dissolved hydrocarbons is discharged back to the extractive distillation column. The top product from the raffinate column contains C6 hydrocarbons with a limited amount of benzene (about 1%), and is sent back to the cracking unit. In the benzene stripper the dissolved benzene is desorbed from the NMP by means of vacuum distillation. The top product consists of benzene and is sent to storage. The bottom product of the stripping column consists of NMP and is sent to the hydroalkylation unit.
PBL – TNO. A MIDDEN report | 19
Table 6 shows an estimated mass and energy balance.
Table 6 Mass and energy balance for the benzene extraction and production unit
Inputs Amount Outputs Amount Pygasc) 720 kt/yr Benzene 830 kt/yr Imported crude BTX 260 kt/yr Energy: HP steam 5.8 PJ/yr C9-C10 150 kt/y Energy: electricity 0.8 PJ/yr
c) Pygas is pyrolysis gas from steam cracker. Energy values based on Wong & Van Dril (2020).
3.1.8 Steam cracker mass and energy balance This section summarizes the feedstocks and output products, as well as the energy flows. Table 7 and Table 8 shows the input feedstocks and energy content and Table 9 shows the outputs of the steam crackers as calculated using the input from Table 4. The calculated values differ slightly from the name plate capacities presented in Section 1.
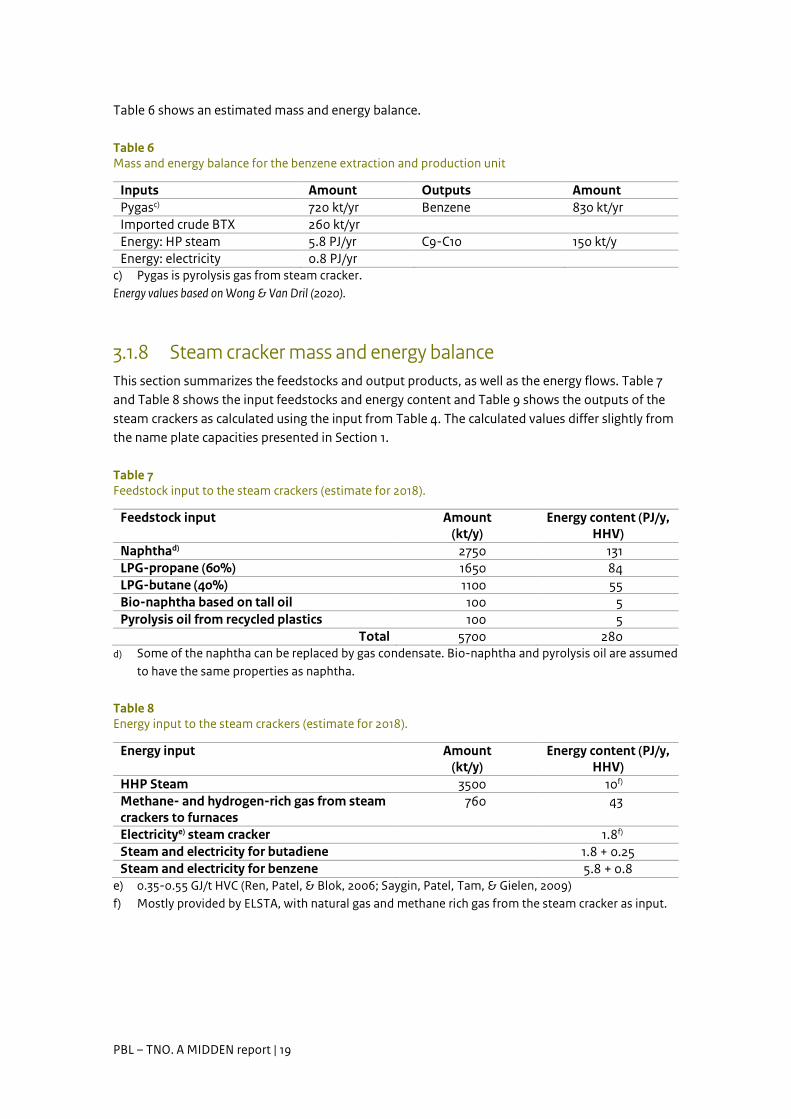
Table 7 Feedstock input to the steam crackers (estimate for 2018).
Feedstock input Amount (kt/y)
Energy content (PJ/y, HHV)
Naphthad) 2750 131 LPG-propane (60%) 1650 84 LPG-butane (40%) 1100 55 Bio-naphtha based on tall oil 100 5 Pyrolysis oil from recycled plastics 100 5
Total 5700 280 d) Some of the naphtha can be replaced by gas condensate. Bio-naphtha and pyrolysis oil are assumed
to have the same properties as naphtha.
Table 8 Energy input to the steam crackers (estimate for 2018).
Energy input Amount (kt/y)
Energy content (PJ/y, HHV)
HHP Steam 3500 10f) Methane- and hydrogen-rich gas from steam crackers to furnaces
760 43
Electricitye) steam cracker 1.8f)
Steam and electricity for butadiene 1.8 + 0.25 Steam and electricity for benzene 5.8 + 0.8
e) 0.35-0.55 GJ/t HVC (Ren, Patel, & Blok, 2006; Saygin, Patel, Tam, & Gielen, 2009) f) Mostly provided by ELSTA, with natural gas and methane rich gas from the steam cracker as input.
PBL – TNO. A MIDDEN report | 20
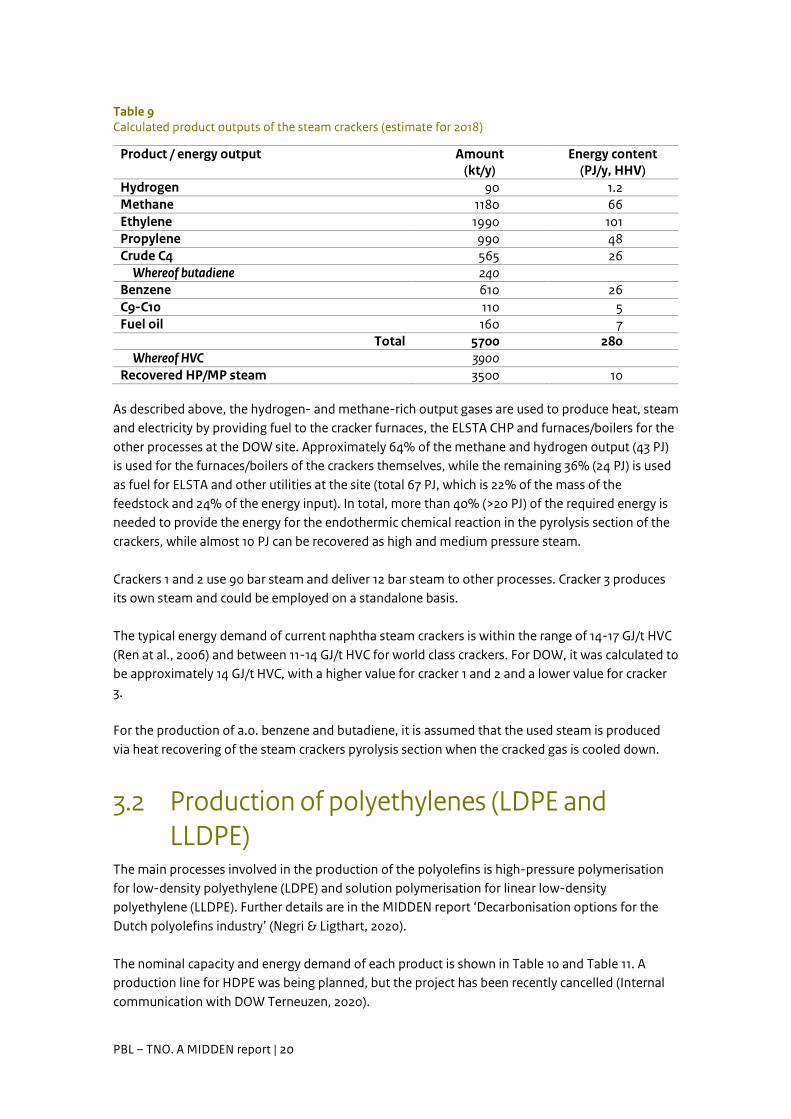
Table 9 Calculated product outputs of the steam crackers (estimate for 2018)
Product / energy output Amount (kt/y)
Energy content (PJ/y, HHV)
Hydrogen 90 1.2 Methane 1180 66 Ethylene 1990 101 Propylene 990 48 Crude C4 565 26 Whereof butadiene 240 Benzene 610 26 C9-C10 110 5 Fuel oil 160 7
Total 5700 280 Whereof HVC 3900 Recovered HP/MP steam 3500 10
As described above, the hydrogen- and methane-rich output gases are used to produce heat, steam and electricity by providing fuel to the cracker furnaces, the ELSTA CHP and furnaces/boilers for the other processes at the DOW site. Approximately 64% of the methane and hydrogen output (43 PJ) is used for the furnaces/boilers of the crackers themselves, while the remaining 36% (24 PJ) is used as fuel for ELSTA and other utilities at the site (total 67 PJ, which is 22% of the mass of the feedstock and 24% of the energy input). In total, more than 40% (>20 PJ) of the required energy is needed to provide the energy for the endothermic chemical reaction in the pyrolysis section of the crackers, while almost 10 PJ can be recovered as high and medium pressure steam. Crackers 1 and 2 use 90 bar steam and deliver 12 bar steam to other processes. Cracker 3 produces its own steam and could be employed on a standalone basis. The typical energy demand of current naphtha steam crackers is within the range of 14-17 GJ/t HVC (Ren at al., 2006) and between 11-14 GJ/t HVC for world class crackers. For DOW, it was calculated to be approximately 14 GJ/t HVC, with a higher value for cracker 1 and 2 and a lower value for cracker 3. For the production of a.o. benzene and butadiene, it is assumed that the used steam is produced via heat recovering of the steam crackers pyrolysis section when the cracked gas is cooled down.
3.2 Production of polyethylenes (LDPE and LLDPE)
The main processes involved in the production of the polyolefins is high-pressure polymerisation for low-density polyethylene (LDPE) and solution polymerisation for linear low-density polyethylene (LLDPE). Further details are in the MIDDEN report ‘Decarbonisation options for the Dutch polyolefins industry’ (Negri & Ligthart, 2020). The nominal capacity and energy demand of each product is shown in Table 10 and Table 11. A production line for HDPE was being planned, but the project has been recently cancelled (Internal communication with DOW Terneuzen, 2020).
PBL – TNO. A MIDDEN report | 21
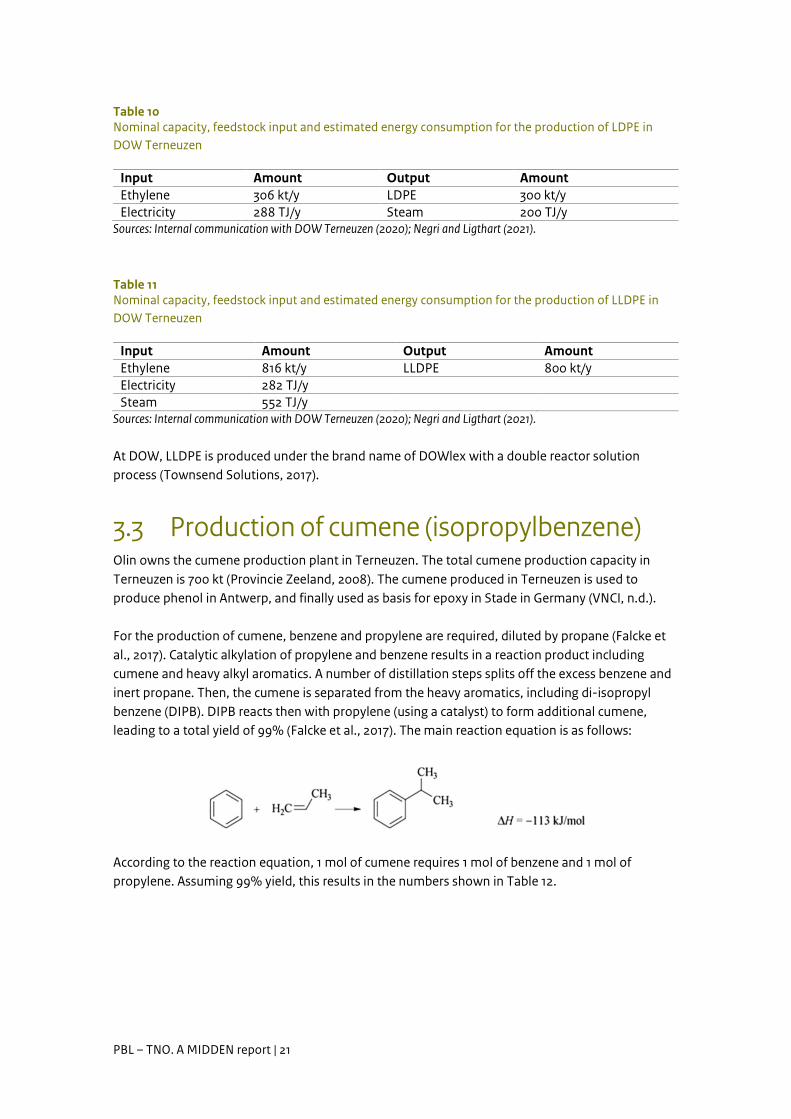
Table 10 Nominal capacity, feedstock input and estimated energy consumption for the production of LDPE in DOW Terneuzen
Sources: Internal communication with DOW Terneuzen (2020); Negri and Ligthart (2021).
Table 11 Nominal capacity, feedstock input and estimated energy consumption for the production of LLDPE in DOW Terneuzen
Sources: Internal communication with DOW Terneuzen (2020); Negri and Ligthart (2021). At DOW, LLDPE is produced under the brand name of DOWlex with a double reactor solution process (Townsend Solutions, 2017).
3.3 Production of cumene (isopropylbenzene) Olin owns the cumene production plant in Terneuzen. The total cumene production capacity in Terneuzen is 700 kt (Provincie Zeeland, 2008). The cumene produced in Terneuzen is used to produce phenol in Antwerp, and finally used as basis for epoxy in Stade in Germany (VNCI, n.d.). For the production of cumene, benzene and propylene are required, diluted by propane (Falcke et al., 2017). Catalytic alkylation of propylene and benzene results in a reaction product including cumene and heavy alkyl aromatics. A number of distillation steps splits off the excess benzene and inert propane. Then, the cumene is separated from the heavy aromatics, including di-isopropyl benzene (DIPB). DIPB reacts then with propylene (using a catalyst) to form additional cumene, leading to a total yield of 99% (Falcke et al., 2017). The main reaction equation is as follows:
According to the reaction equation, 1 mol of cumene requires 1 mol of benzene and 1 mol of propylene. Assuming 99% yield, this results in the numbers shown in Table 12.
Input Amount Output Amount Ethylene 306 kt/y LDPE 300 kt/y Electricity 288 TJ/y Steam 200 TJ/y
Input Amount Output Amount Ethylene 816 kt/y LLDPE 800 kt/y Electricity 282 TJ/y Steam 552 TJ/y
PBL – TNO. A MIDDEN report | 22
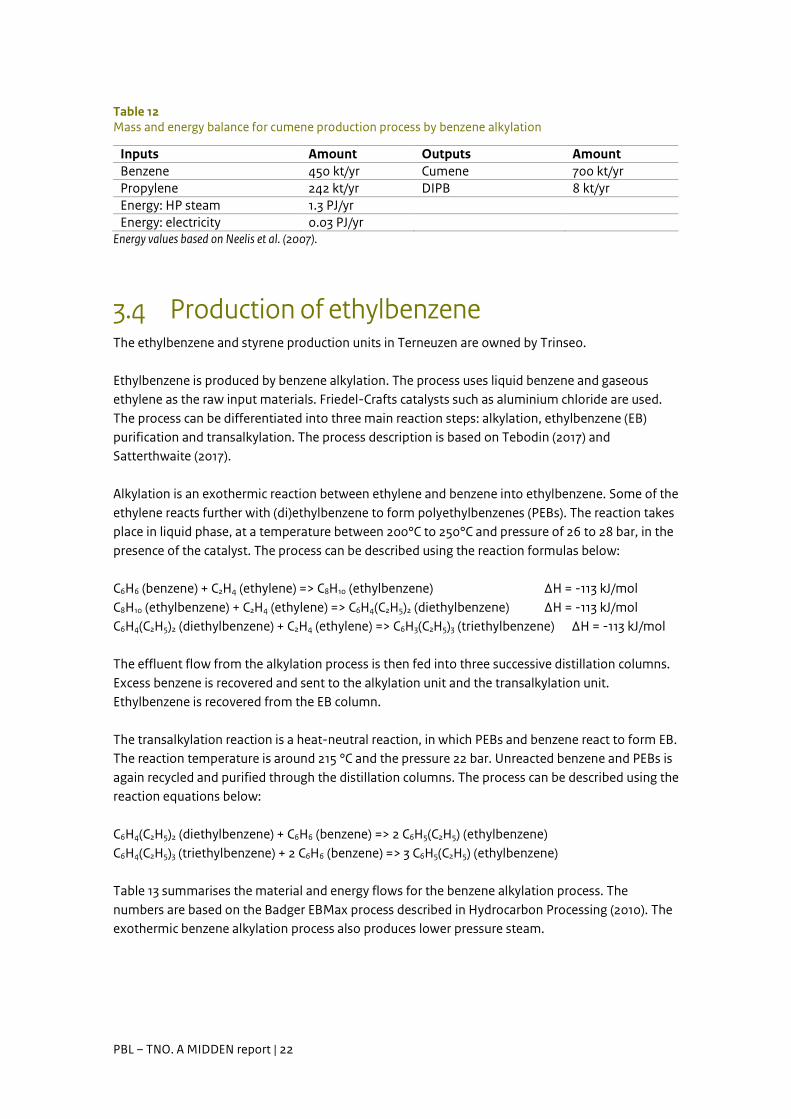
Table 12 Mass and energy balance for cumene production process by benzene alkylation
Inputs Amount Outputs Amount Benzene 450 kt/yr Cumene 700 kt/yr Propylene 242 kt/yr DIPB 8 kt/yr Energy: HP steam 1.3 PJ/yr Energy: electricity 0.03 PJ/yr
Energy values based on Neelis et al. (2007).
3.4 Production of ethylbenzene The ethylbenzene and styrene production units in Terneuzen are owned by Trinseo. Ethylbenzene is produced by benzene alkylation. The process uses liquid benzene and gaseous ethylene as the raw input materials. Friedel-Crafts catalysts such as aluminium chloride are used. The process can be differentiated into three main reaction steps: alkylation, ethylbenzene (EB) purification and transalkylation. The process description is based on Tebodin (2017) and Satterthwaite (2017). Alkylation is an exothermic reaction between ethylene and benzene into ethylbenzene. Some of the ethylene reacts further with (di)ethylbenzene to form polyethylbenzenes (PEBs). The reaction takes place in liquid phase, at a temperature between 200°C to 250°C and pressure of 26 to 28 bar, in the presence of the catalyst. The process can be described using the reaction formulas below: C6H6 (benzene) + C2H4 (ethylene) => C8H10 (ethylbenzene) ∆H = -113 kJ/mol C8H10 (ethylbenzene) + C2H4 (ethylene) => C6H4(C2H5)2 (diethylbenzene) ∆H = -113 kJ/mol C6H4(C2H5)2 (diethylbenzene) + C2H4 (ethylene) => C6H3(C2H5)3 (triethylbenzene) ∆H = -113 kJ/mol The effluent flow from the alkylation process is then fed into three successive distillation columns. Excess benzene is recovered and sent to the alkylation unit and the transalkylation unit. Ethylbenzene is recovered from the EB column. The transalkylation reaction is a heat-neutral reaction, in which PEBs and benzene react to form EB. The reaction temperature is around 215 °C and the pressure 22 bar. Unreacted benzene and PEBs is again recycled and purified through the distillation columns. The process can be described using the reaction equations below: C6H4(C2H5)2 (diethylbenzene) + C6H6 (benzene) => 2 C6H5(C2H5) (ethylbenzene) C6H4(C2H5)3 (triethylbenzene) + 2 C6H6 (benzene) => 3 C6H5(C2H5) (ethylbenzene) Table 13 summarises the material and energy flows for the benzene alkylation process. The numbers are based on the Badger EBMax process described in Hydrocarbon Processing (2010). The exothermic benzene alkylation process also produces lower pressure steam.
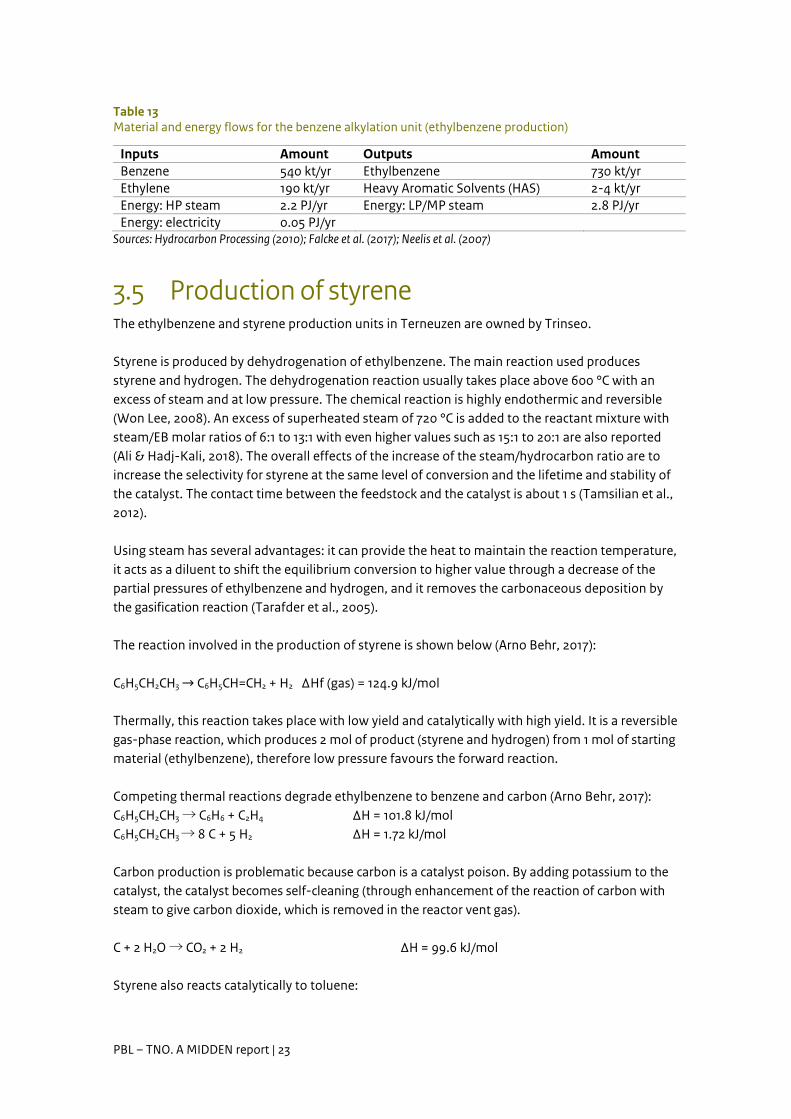
Table 13 Material and energy flows for the benzene alkylation unit (ethylbenzene production)
Inputs Amount Outputs Amount Benzene 540 kt/yr Ethylbenzene 730 kt/yr Ethylene 190 kt/yr Heavy Aromatic Solvents (HAS) 2-4 kt/yrEnergy: HP steam 2.2 PJ/yr Energy: LP/MP steam 2.8 PJ/yr Energy: electricity 0.05 PJ/yr
Sources: Hydrocarbon Processing (2010); Falcke et al. (2017); Neelis et al. (2007)
3.5 Production of styrene The ethylbenzene and styrene production units in Terneuzen are owned by Trinseo.
Styrene is produced by dehydrogenation of ethylbenzene. The main reaction used produces styrene and hydrogen. The dehydrogenation reaction usually takes place above 600 °C with an excess of steam and at low pressure. The chemical reaction is highly endothermic and reversible (Won Lee, 2008). An excess of superheated steam of 720 °C is added to the reactant mixture with steam/EB molar ratios of 6:1 to 13:1 with even higher values such as 15:1 to 20:1 are also reported (Ali & Hadj-Kali, 2018). The overall effects of the increase of the steam/hydrocarbon ratio are to increase the selectivity for styrene at the same level of conversion and the lifetime and stability of the catalyst. The contact time between the feedstock and the catalyst is about 1 s (Tamsilian et al., 2012).
Using steam has several advantages: it can provide the heat to maintain the reaction temperature, it acts as a diluent to shift the equilibrium conversion to higher value through a decrease of the partial pressures of ethylbenzene and hydrogen, and it removes the carbonaceous deposition by the gasification reaction (Tarafder et al., 2005).
The reaction involved in the production of styrene is shown below (Arno Behr, 2017):
C6H5CH2CH3 → C6H5CH=CH2 + H2 ∆Hf (gas) = 124.9 kJ/mol
Thermally, this reaction takes place with low yield and catalytically with high yield. It is a reversible gas-phase reaction, which produces 2 mol of product (styrene and hydrogen) from 1 mol of starting material (ethylbenzene), therefore low pressure favours the forward reaction.
Competing thermal reactions degrade ethylbenzene to benzene and carbon (Arno Behr, 2017): ∆H = 101.8 kJ/mol C6H5CH2CH3 → C6H6 + C2H4
C6H5CH2CH3 → 8 C + 5 H2 ∆H = 1.72 kJ/mol
Carbon production is problematic because carbon is a catalyst poison. By adding potassium to the catalyst, the catalyst becomes self-cleaning (through enhancement of the reaction of carbon with steam to give carbon dioxide, which is removed in the reactor vent gas).
∆H = 99.6 kJ/mol C + 2 H2O → CO2 + 2 H2
Styrene also reacts catalytically to toluene:
PBL – TNO. A MIDDEN report | 23
PBL – TNO. A MIDDEN report | 24
C6H5CH2CH3 + H2 → C6H5CH3 + CH4 ∆H = 64.5 kJ/mol
Typically catalysts contains 84.3% iron as Fe2O3, 2.4% chromium as Cr2O3, and 13.3% potassium as K2CO3 (Arno Behr, 2017).
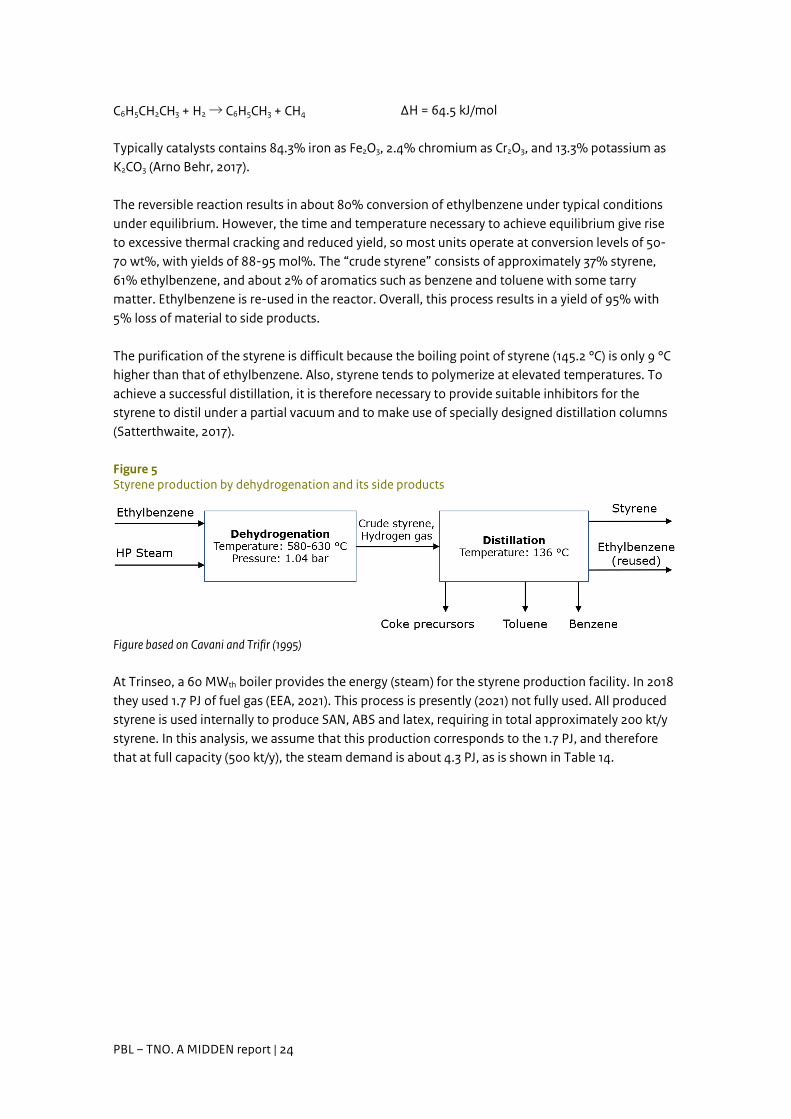
The reversible reaction results in about 80% conversion of ethylbenzene under typical conditions under equilibrium. However, the time and temperature necessary to achieve equilibrium give rise to excessive thermal cracking and reduced yield, so most units operate at conversion levels of 50-70 wt%, with yields of 88-95 mol%. The “crude styrene” consists of approximately 37% styrene, 61% ethylbenzene, and about 2% of aromatics such as benzene and toluene with some tarry matter. Ethylbenzene is re-used in the reactor. Overall, this process results in a yield of 95% with 5% loss of material to side products.
The purification of the styrene is difficult because the boiling point of styrene (145.2 °C) is only 9 °C higher than that of ethylbenzene. Also, styrene tends to polymerize at elevated temperatures. To achieve a successful distillation, it is therefore necessary to provide suitable inhibitors for the styrene to distil under a partial vacuum and to make use of specially designed distillation columns (Satterthwaite, 2017).
Figure 5 Styrene production by dehydrogenation and its side products
Figure based on Cavani and Trifir (1995)
At Trinseo, a 60 MWth boiler provides the energy (steam) for the styrene production facility. In 2018 they used 1.7 PJ of fuel gas (EEA, 2021). This process is presently (2021) not fully used. All produced styrene is used internally to produce SAN, ABS and latex, requiring in total approximately 200 kt/y styrene. In this analysis, we assume that this production corresponds to the 1.7 PJ, and therefore that at full capacity (500 kt/y), the steam demand is about 4.3 PJ, as is shown in Table 14.
PBL – TNO. A MIDDEN report | 25
Table 14 Material and energy flows for styrene production
Inputs Amount Outputs Amount Ethylbenzene 540 kt/y Styrene 500 kt/y Steam (HP) g) 920 kt/y Aromatics 30 kt/y Energy (in HP steam) 4.3 PJ/y Hydrogen 10 kt/y
g) For the mass balance calculation a molar ratio of steam to EB of 10 is used (1.7 in mass terms).
3.6 Production of SAN The SAN production facility at the DOW site is owned by Trinseo.
Styrene acrylonitrile resin (SAN) is a copolymer plastic consisting of styrene and acrylonitrile (CH2=CHCN) in a ratio of around 3:1 (Emblem, 2012). SAN is used in place of polystyrene, due to its greater thermal resistance. The molecular chains are typically between 70 and 80 w% styrene and 20 to 30 w% acrylonitrile (Ullmann, 2002). Larger acrylonitrile content improves mechanical properties and chemical resistance, but also makes the product somewhat yellow, instead of the usually transparent colour (Harper, 2000). The synthesis can be done by suspension, emulsion and continuous mass polymerization. The continuous mass process is the method used by Trinseo. The acrylonitrile is imported by train.
In both batch and continuous emulsion, acrylonitrile and styrene monomers are injected into a monomer makeup tank along with chemical additives and recovered acrylonitrile. The monomer mix is then injected into the polymerization reactor with initiator, emulsifier, deionized water and chain-transfer agent. After a specific time, the SAN copolymer melt is pumped to a steam stripper to recover unreacted monomers. The polymer is then subjected to filtration, then being washed and dried so that the solid SAN copolymer is formed.
Continuous mass polymerization is complicated. Complex machinery is required to handle mixing, heat transfer, melt transport, and devolatilization, because of the high viscosity of the mixture. In addition, considerable time is required to establish steady-state conditions in a stirred tank reactor and a linear flow reactor.
In the case SAN is used as a copolymer for poly-ether-glycol, SAN is produced in a batch process. Styrene, acrylonitrile, a catalyst and the stabilizer are the ingredients, and a polyol is used as solvent. The polymer is 'graved' on the stabilizer. The result can be diluted with extra polyol. The dilution process is quite critical, as a relatively high viscosity is required to improve the suspension stability but also should be low enough for processability (Block et.al., 2020).
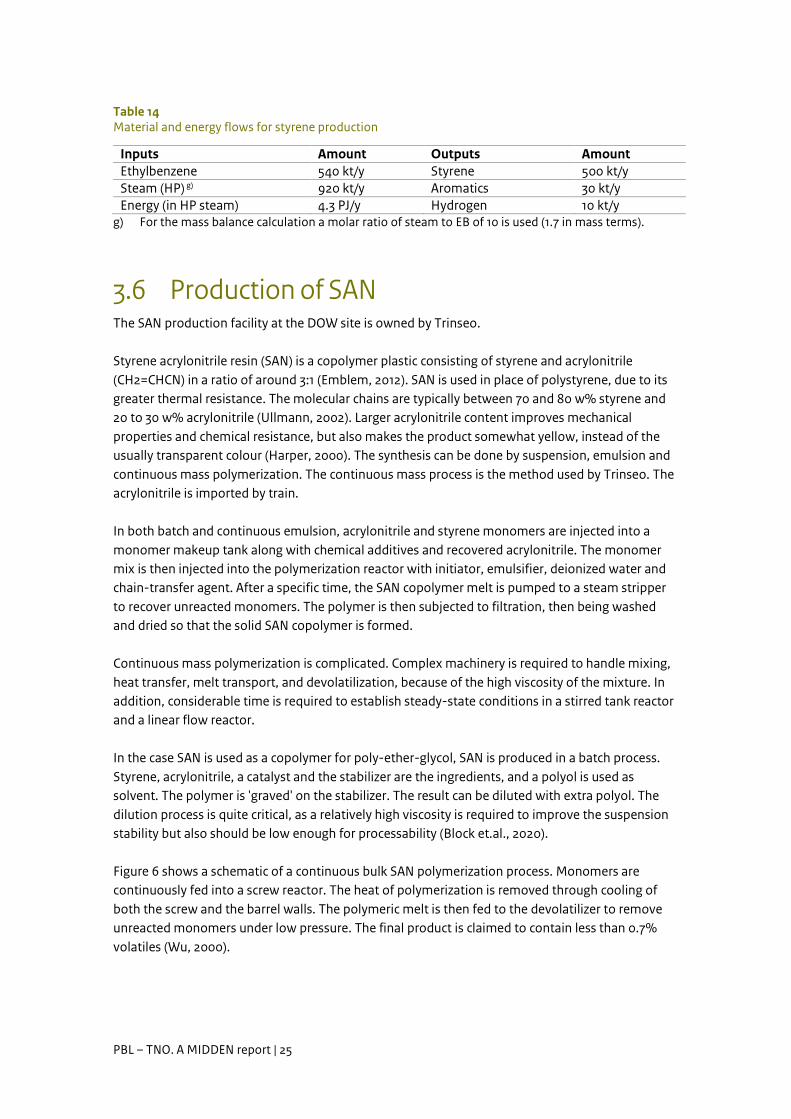
Figure 6 shows a schematic of a continuous bulk SAN polymerization process. Monomers are continuously fed into a screw reactor. The heat of polymerization is removed through cooling of both the screw and the barrel walls. The polymeric melt is then fed to the devolatilizer to remove unreacted monomers under low pressure. The final product is claimed to contain less than 0.7% volatiles (Wu, 2000).
PBL – TNO. A MIDDEN report | 26
Figure 6 SAN process flow
SAN polymer polyols manufacturing consumes more energy than the polyol manufacturing itself (Block et al., 2020). The unconverted styrene and acrylonitrile must be stripped off as they are toxic compounds. This stripping involves evaporation of the unconverted compounds, and subsequent incineration with roof combustors.
The total production capacity of SAN by Trinseo in Terneuzen is 34 kt/y (ICIS, 2018a). We assume 5% losses during production, a styrene content of 75% and a acrylonitrile content of 25%. The energy input values are taken from PlasticsEurope (2015). This results in the material and energy balance shown in Table 15.
Table 15 Material and energy balance for SAN production
Inputs Amount Outputs Amount Styrene 27 kt/y SAN 34 kt/y Acrylonitrile 9 kt/y Losses 2 kt/y Steam 0.05 PJ/y Electricity 0.03 PJ/y
Energy values from PlasticsEurope (2015).
3.7 Production of ABS The ABS production facility at the DOW site is owned by Trinseo.
Acrylonitrile-Butadiene-Styrene (ABS) is a copolymerisation of SAN with polybutadiene, resulting in a much tougher material than SAN. The rubber chains form separate phases which are 10-20 micrometers in diameter. When the product is stressed, crazing from the particles helps to increase the strength of the polymer.
The proportions of the ingredients typically range from 15% to 35% acrylonitrile, 5% to 30% butadiene, and 40% to 60% styrene. It can be found as a graft copolymer, in which SAN polymer is formed in a polymerization system in the presence of polybutadiene rubber; the final product is a complex mixture consisting of SAN copolymer, a graft polymer of SAN and polybutadiene and some unchanged polybutadiene rubber (McKeen, 2019).
The butadiene rubber is polymerized in a separate step. Blocks of polybutadiene rubber are crushed into small pieces and then dissolved in the styrene and acrylonitrile monomers which have been mixed together. This solution is then moved into a reactor where the styrene and acrylonitrile are
PBL – TNO. A MIDDEN report | 27
polymerized. The solution is mixed during polymerization.
During the reaction, the dissolved rubber is replaced by the styrene-acrylonitrile copolymer (SAN) and forms discrete rubber particles. Part of the SAN is grafted on the rubber particles, while another part is occluded in the particles. The reaction mixture contains several additives, e.g. initiator, chain-transfer agents, these are needed in the polymerization.
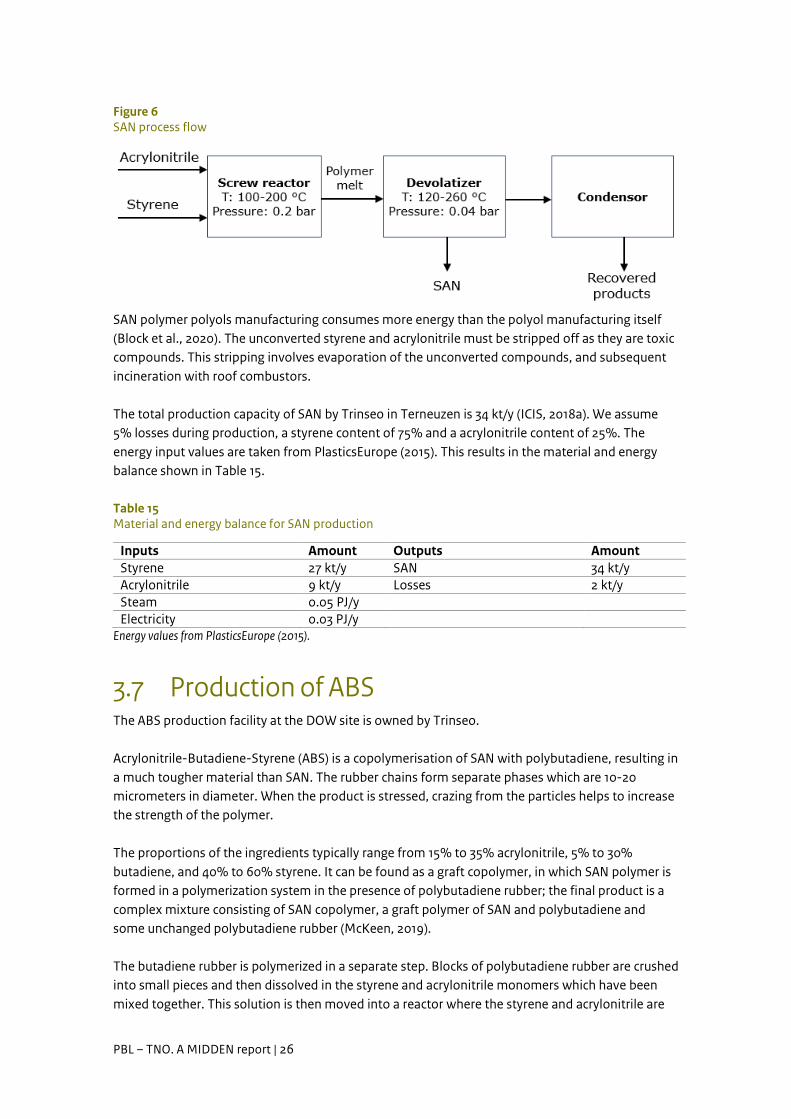
The sheer force created by this mixing reduces the size of the rubber particles. The mixing is with care so that the rubber particle size can be closely controlled as it has a lot of impact on the properties of the final product (The Weekly Pellet, 2016). In the end, the product is devolatilized to remove unreacted monomer, which is recycled to the reactor, and then pelletized (EEA, 2006).
Figure 7 ABS process flow
As mentioned in the previous section, the total production of ABS in Terneuzen is 200 kt/y (ICIS, 2018b). We assume 2% losses during the production of ABS. The share of polybutadiene varies between 5-30%; for the material balance 20% was assumed. This results in the material and energy balance shown in Table 16. The required energy is coming from the DOW site’s utility system.
Table 16 Material and energy flows for ABS production
Inputs Amount Outputs Amount Styrene 100 (80-120) kt/y ABS 200 kt/y Acrylonitrile 60 (30-70) kt/y Losses 4 kt/y Polybutadiene 40 (10-60) kt/y Heat 0.3 PJ/y Electricity 0.2 PJ/y
Energy values from PlasticsEurope (2015)
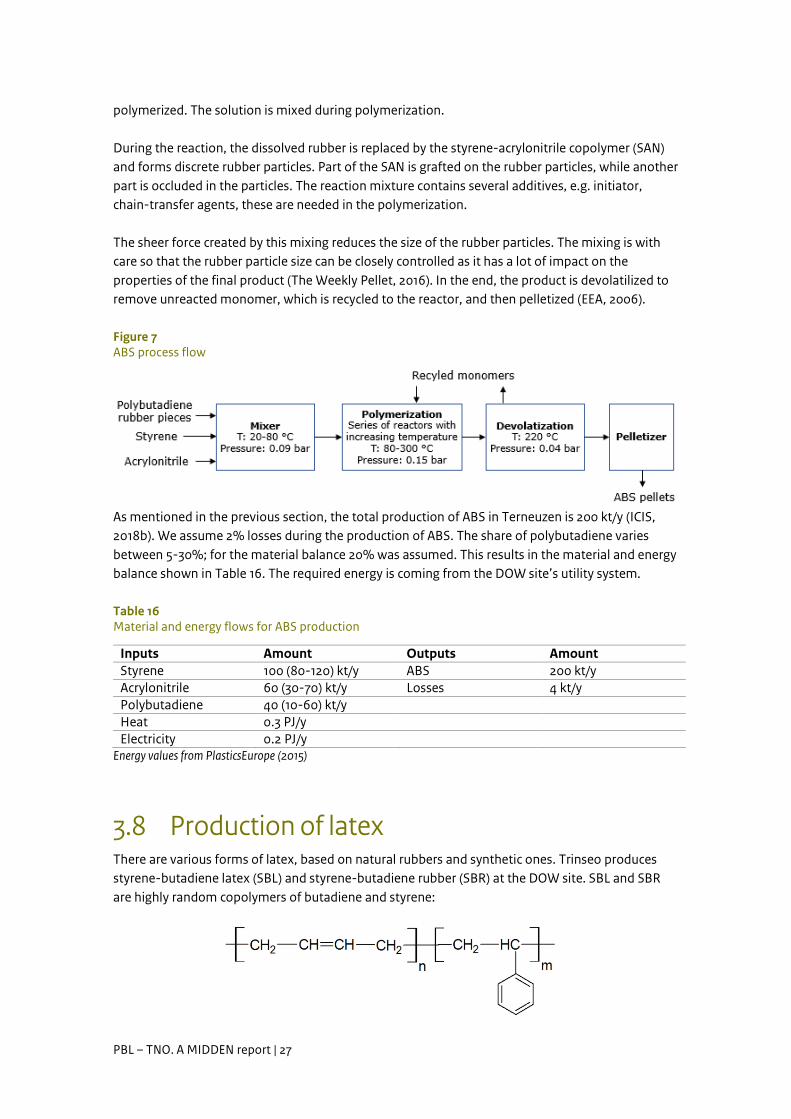
3.8 Production of latex There are various forms of latex, based on natural rubbers and synthetic ones. Trinseo produces styrene-butadiene latex (SBL) and styrene-butadiene rubber (SBR) at the DOW site. SBL and SBR are highly random copolymers of butadiene and styrene:
PBL – TNO. A MIDDEN report | 28
At DOW, three independent production trains are used. Production takes place in reactors, where in watery circumstances latex emulsion is formed by polymerisation of styrene, butadiene and soaps. Off-gases and excess monomers are incinerated in an installation which produces 12.5 bar steam (Provincie Zeeland, 2008).
Table 17 shows an estimated material and energy balance for latex production. 99% conversion is assumed (DOW, 2018). The products are primarily used in carpet, textile and paper industry (RUD Zeeland, 2018).
Table 17 Material and energy flows for latex production
Inputs Amount Outputs Amount Styrene 70 kt/y Latex (wet)h) 300 kt/y Butadiene 50 kt/y Losses 1.4 kt/y Additives 10 kt/y Water 172 kt/y Steam 0.4-1.1 PJ Electricity 0.1-0.3 PJ
h) Of which 45% solid content (135 kt/y) Energy values relate to emulsion SBR production. Sources: DOW (2018); European Commission (2007).
3.9 Production of ethylene oxide (oxirane) Ethylene oxide (EO) is an important chemical used in the production of ethylene glycols (EG, as described in this report), but also detergent ethoxylates, ethanol amines, glycol ethers and polyols. A small portion of the EO produced is employed directly as a sterilising agent and as a fumigation chemical. EO and EG can be produced separately, but nearly all European installations produce a mix of products in integrated plants (this is efficient because the reaction of EO and water to make glycols is exothermic, but the glycol plant is a net consumer due to the large heat demand of the evaporation and distillation stages) (Falcke et al., 2017).
EO/EG processes can be designed for the production of glycols only (without high-purity EO recovery); high-purity EO only with a minimum production of unavoidable glycols; or a product mix of high-purity EO and glycols in an integrated plant. In practice, the third configuration is most often used.
The capacity of ethylene oxide (EO) plant at DOW is 195 kt per year. Ethylene oxide is produced by the reaction of ethylene with oxygen:
2 H2C=CH2 + O2 → 2 CH2OCH2 (dHf =103.4 kJ/mol)
Ethylene oxide (EO) is formed by reacting ethylene and oxygen over a silver-containing catalyst. The exothermic reaction takes place at an elevated temperature (200–300 °C) and pressure (15–25 bar) with a residence time of a few seconds. Small amounts of acetaldehyde (from isomerisation of EO) and formaldehyde may also be produced. The selectivity at full conversion is relatively low (75-82%, theoretical maximum is 85.7%), due to two undesired competing reactions:
PBL – TNO. A MIDDEN report | 29
CH2CH2 +3 O2 → 2 CO2 + 2 H2O (dHc =1340 kJ/mol) 2
(CH2CH2)O + 5 O2 → 4 CO2 + 4 H2O
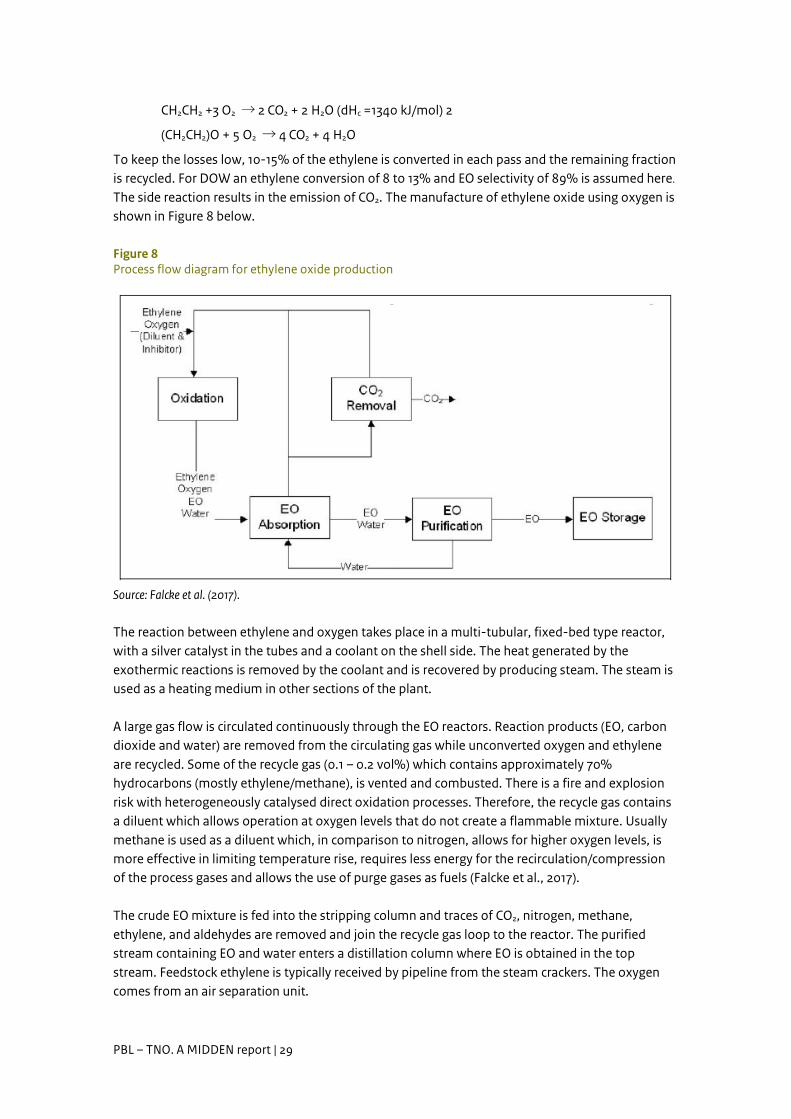
To keep the losses low, 10-15% of the ethylene is converted in each pass and the remaining fraction is recycled. For DOW an ethylene conversion of 8 to 13% and EO selectivity of 89% is assumed here. The side reaction results in the emission of CO2. The manufacture of ethylene oxide using oxygen is shown in Figure 8 below.
Figure 8 Process flow diagram for ethylene oxide production
Source: Falcke et al. (2017).
The reaction between ethylene and oxygen takes place in a multi-tubular, fixed-bed type reactor, with a silver catalyst in the tubes and a coolant on the shell side. The heat generated by the exothermic reactions is removed by the coolant and is recovered by producing steam. The steam is used as a heating medium in other sections of the plant.
A large gas flow is circulated continuously through the EO reactors. Reaction products (EO, carbon dioxide and water) are removed from the circulating gas while unconverted oxygen and ethylene are recycled. Some of the recycle gas (0.1 – 0.2 vol%) which contains approximately 70% hydrocarbons (mostly ethylene/methane), is vented and combusted. There is a fire and explosion risk with heterogeneously catalysed direct oxidation processes. Therefore, the recycle gas contains a diluent which allows operation at oxygen levels that do not create a flammable mixture. Usually methane is used as a diluent which, in comparison to nitrogen, allows for higher oxygen levels, is more effective in limiting temperature rise, requires less energy for the recirculation/compression of the process gases and allows the use of purge gases as fuels (Falcke et al., 2017).
The crude EO mixture is fed into the stripping column and traces of CO2, nitrogen, methane, ethylene, and aldehydes are removed and join the recycle gas loop to the reactor. The purified stream containing EO and water enters a distillation column where EO is obtained in the top stream. Feedstock ethylene is typically received by pipeline from the steam crackers. The oxygen comes from an air separation unit.
PBL – TNO. A MIDDEN report | 30
Carbon dioxide is the main by-product of the direct oxidation. A selectivity of 70–90 % would correspond to a maximal ratio of 0.86–0.22 tonnes of CO2 per tonne of EO produced in the reaction (for the mass balance we have assumes a ratio of 0.25). The vented ethylene/methane is incinerated and converted to CO2, with an average loss of 0.15% and 8.5 passes there will be an additional 7 kt CO2 emission. In 2017-2020 the unit approximately emitted an average of 44 kt CO2 according to the Dutch emission authority (DOW BKG 7) (NEa, 2021)). The stream is purified and either liquefied by a downstream unit for marketing or released to atmosphere. An estimated mass and energy balance is shown in Table 18.
Table 18 Mass and energy balance for the ethylene oxide production plant
i) After incineration converted into 7 kt/y CO2
Energy values from Neelis et al. (2007) and Wong & van Dril (2020).
The EO is preferably not stored but used directly (due to explosion risks). At DOW, the EO is used for polyol production. The polyol production is a batch process, but due to the large number of polyol reactors (13) in Terneuzen, the EO can be used rapidly and only a small amount of storage is needed.
3.10 Production of polyols (PEG/PPG) The term polyol is used for polyether polyols and polyester polyols. In Terneuzen polyether polyols are produced, particularly polyethylene glycol (PEG) and polypropylene glycol (PPG). Polyols can react with diisocyanates (such as MDI (methylene-difenyl-di-isocyanate) and TDI (2.4-toluene-di-isocyanate)) to produce polyurethanes. The higher molar weight of the polyol, the softer the polyurethane. Soft urethanes are characterized by PEG or PPG with a molecular weight in the range of 1000-6500 g/mol and rigid urethanes are characterized by PEG or PPG with a molecular weight in the range of 150-1000 g/mol. Usually there are different product lines for the manufacturing of different grades of polyols with specific applications based on their molecular weight. In this paragraph three production lines are discussed; one for poly-ethylene-glycol (molar mass 3000 g/mol), and two for poly-propylene glycol (molar mass 500 and 3000 g/mol).
Polyether polyols are manufactured through the catalytic polymerization of propylene oxide (PO, imported from Antwerp in Belgium and Stade in Germany) and/or ethylene oxide (EO) (produced in Terneuzen). The most common catalyst is potassium hydroxide.
The process needs an initiator having active hydrogens, and a starter such as glycerine, sucrose, water, amines or mono-propylene glycol (MPG).
The production takes place as a batch process. The unit has 13 different production lines allowing a semi-continuous production, reducing the need to store large quantities of the continuously produced ethylene-oxide.
Inputs Amount Outputs Amount Ethylene 140 kt/y Ethylene oxide 195 kt/y Oxygen 125 kt/y CO2 48 kt/y Methane 2.5 kt/y Methanei) 2.5 kt/y Energy: electricity 0.23 PJ/y Energy: MP steam 1.0 PJ/y
PBL – TNO. A MIDDEN report | 31
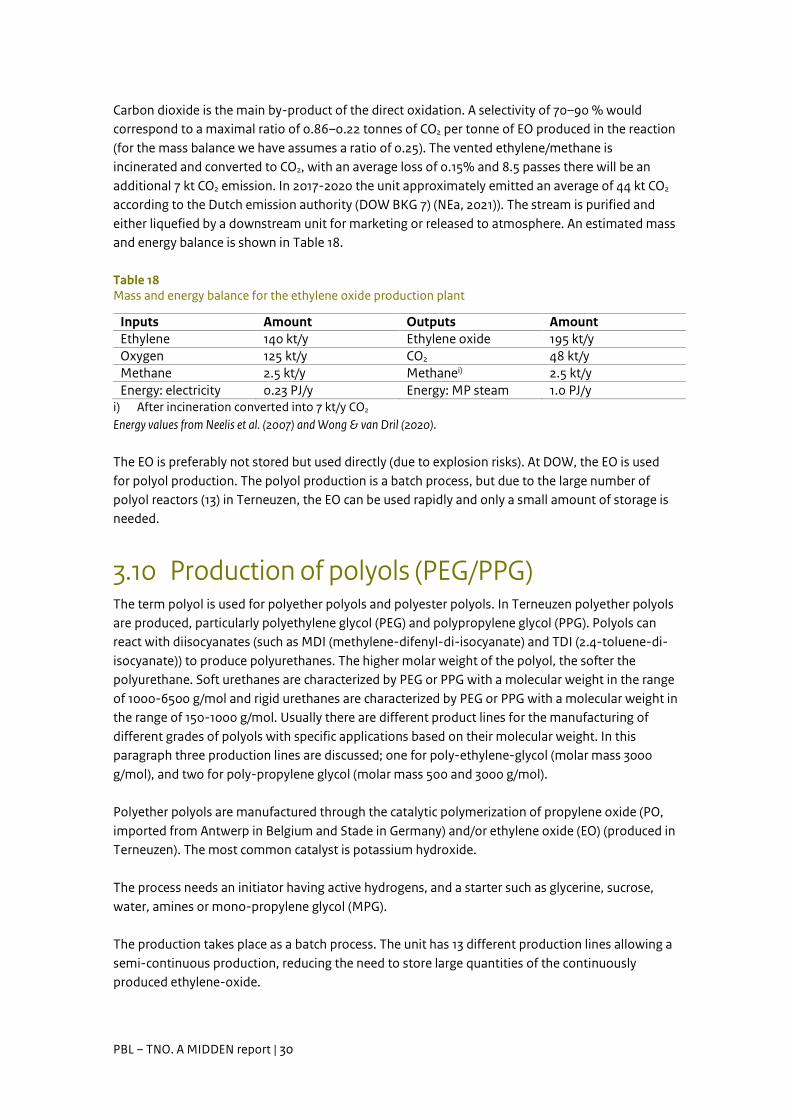
3.10.1 Poly-ethylene-glycol Production of poly-ethylene-glycol (PEG) takes place by the reaction of ethylene-oxide with water, mono-, di- and/or tri-ethylene glycol. The used catalysts often are potassium hydroxide or double metal cyanide (DMC) complexes, prepared by reacting ZnCl2 and K3[Co(CN)6]2 in the presence of complexing agents or multi-metal cyanide (MMC) catalyst prepared by reacting ZnCl2, K3[Co(CN)6]2 and K4Fe(CN)6) in the presence of complexing agents.
Ethylene-oxide reacts with ethylene-glycol to form a polyether-glycol: C2H4O + C2H6O2 → C2H5O-[C2H4O]n-OH
Figure 9 shows the process configuration (Fernández-Dacosta, Stojcheva, & Ramirez, 2018).
Figure 9 Conventional polyether polyol manufacturing process diagram
Source: Fernández-Dacosta, Stojcheva & Ramirez (2018).
The general formula for PEG is C2nH4n+2On+1 and typical mass density is 1110-1140 g/cm3, with a molar mass of (44n+18) g/mol. PEG with N<500 (molar mass below 35,000) are liquid at room temperature and are called ‘poly-ethyleneoxide-glycol’. They are used to produce polyurethane. PEG with N>500 (molar mass above 35,000) are solid at room temperature and are often called ‘poly-ethylene-oxide’ (the two OH ending groups effects become negligible with the large polyethylene group in the middle).
3.10.2 Poly-propylene-glycol The reaction of ethylene-glycol with propylene-oxide produces poly-propylene-glycol (PPG). The reaction takes place at 135 °C and 3 bar. Double metal cyanide (DMC) is used as catalyst and is recovered in a filter after the reaction. In a vacuum-stripping step (140 °C, 25 mbar) odours and other impurities are separated, and polyol is obtained as final product (40 °C, 1 bar). When producing high molecular weight PPG-polyols, the DMC catalyzed products are specified since they result in much lower contents of unsaturated chain-ends (i.e. mono-ols). The unsaturated end-functionality with KOH catalyzed PPG-polyols results from the base catalyzed isomerization of propylene oxide to allyl alcohol. The reaction equation is:
C3H7O + C2H6O2 → C2H5O-[C3H7O]n-OH
The molar mass can be calculated as (56n+18) g/mol.
PBL – TNO. A MIDDEN report | 32
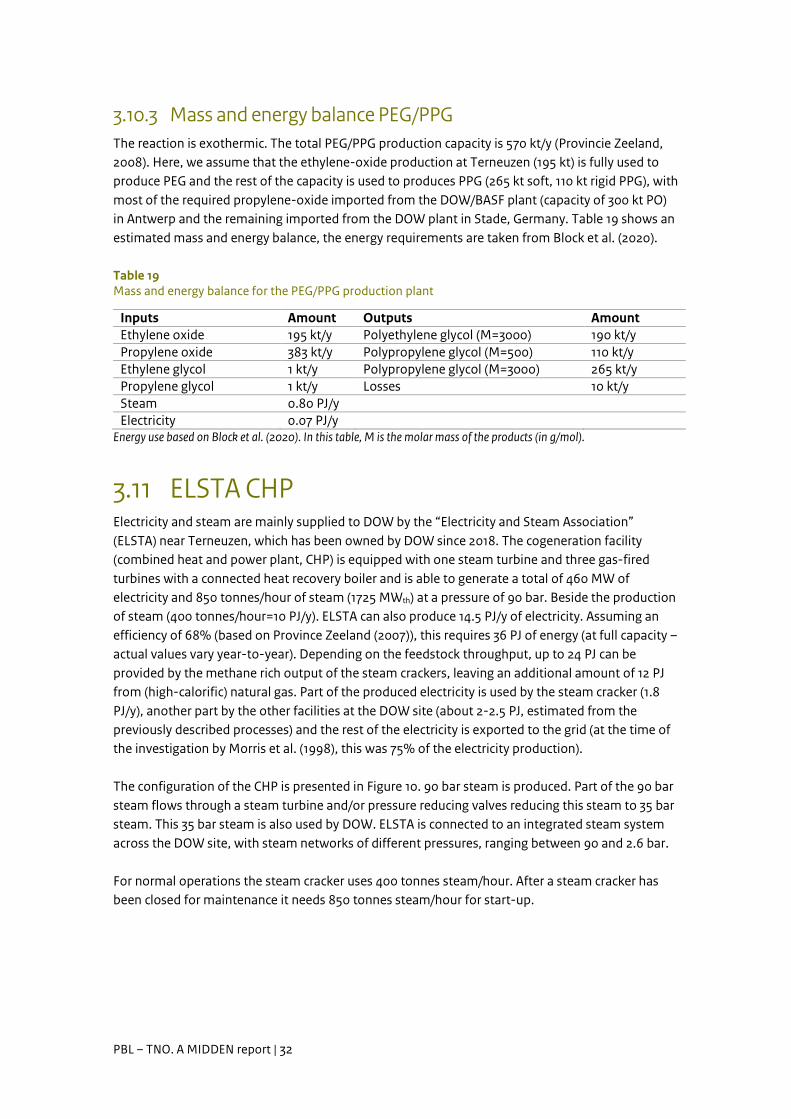
3.10.3 Mass and energy balance PEG/PPG The reaction is exothermic. The total PEG/PPG production capacity is 570 kt/y (Provincie Zeeland, 2008). Here, we assume that the ethylene-oxide production at Terneuzen (195 kt) is fully used to produce PEG and the rest of the capacity is used to produces PPG (265 kt soft, 110 kt rigid PPG), with most of the required propylene-oxide imported from the DOW/BASF plant (capacity of 300 kt PO) in Antwerp and the remaining imported from the DOW plant in Stade, Germany. Table 19 shows an estimated mass and energy balance, the energy requirements are taken from Block et al. (2020).
Table 19 Mass and energy balance for the PEG/PPG production plant
Inputs Amount Outputs Amount Ethylene oxide 195 kt/y Polyethylene glycol (M=3000) 190 kt/y Propylene oxide 383 kt/y Polypropylene glycol (M=500) 110 kt/y Ethylene glycol 1 kt/y Polypropylene glycol (M=3000) 265 kt/y Propylene glycol 1 kt/y Losses 10 kt/y Steam 0.80 PJ/y Electricity 0.07 PJ/y
Energy use based on Block et al. (2020). In this table, M is the molar mass of the products (in g/mol).
3.11 ELSTA CHP Electricity and steam are mainly supplied to DOW by the “Electricity and Steam Association” (ELSTA) near Terneuzen, which has been owned by DOW since 2018. The cogeneration facility (combined heat and power plant, CHP) is equipped with one steam turbine and three gas-fired turbines with a connected heat recovery boiler and is able to generate a total of 460 MW of electricity and 850 tonnes/hour of steam (1725 MWth) at a pressure of 90 bar. Beside the production of steam (400 tonnes/hour=10 PJ/y). ELSTA can also produce 14.5 PJ/y of electricity. Assuming an efficiency of 68% (based on Province Zeeland (2007)), this requires 36 PJ of energy (at full capacity – actual values vary year-to-year). Depending on the feedstock throughput, up to 24 PJ can be provided by the methane rich output of the steam crackers, leaving an additional amount of 12 PJ from (high-calorific) natural gas. Part of the produced electricity is used by the steam cracker (1.8 PJ/y), another part by the other facilities at the DOW site (about 2-2.5 PJ, estimated from the previously described processes) and the rest of the electricity is exported to the grid (at the time of the investigation by Morris et al. (1998), this was 75% of the electricity production).
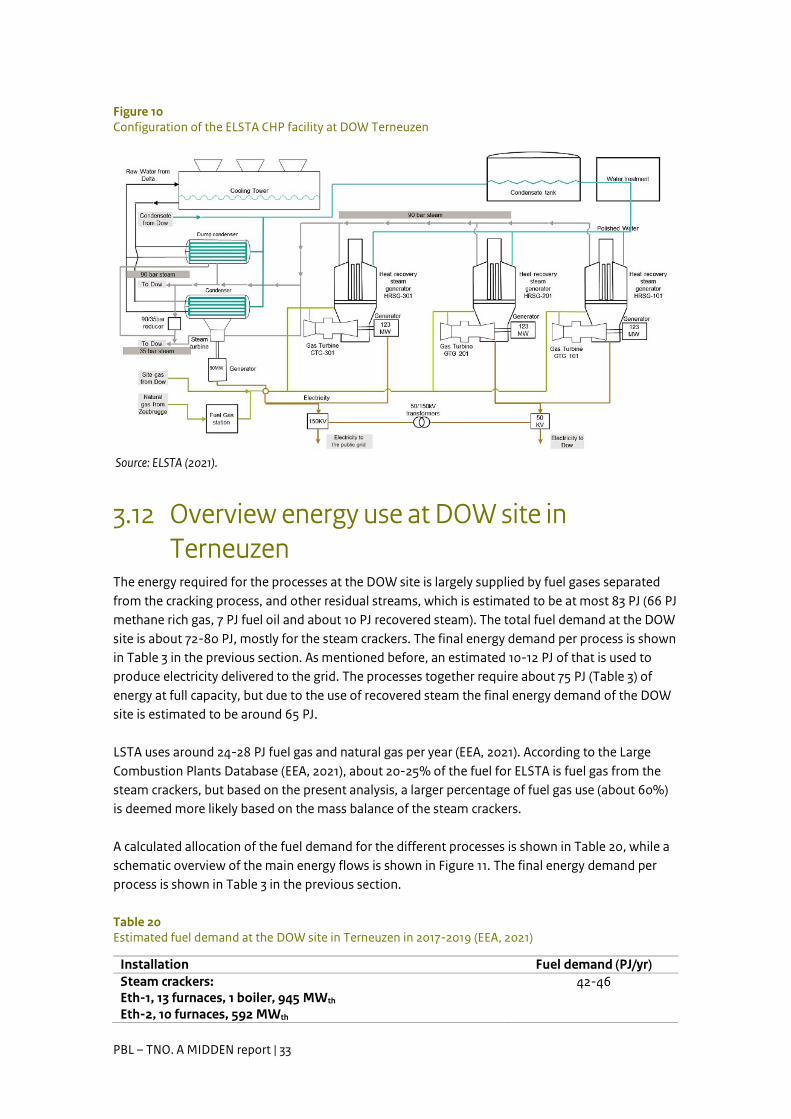
The configuration of the CHP is presented in Figure 10. 90 bar steam is produced. Part of the 90 bar steam flows through a steam turbine and/or pressure reducing valves reducing this steam to 35 bar steam. This 35 bar steam is also used by DOW. ELSTA is connected to an integrated steam system across the DOW site, with steam networks of different pressures, ranging between 90 and 2.6 bar.
For normal operations the steam cracker uses 400 tonnes steam/hour. After a steam cracker has been closed for maintenance it needs 850 tonnes steam/hour for start-up.
PBL – TNO. A MIDDEN report | 33
Figure 10 Configuration of the ELSTA CHP facility at DOW Terneuzen
Source: ELSTA (2021).
3.12 Overview energy use at DOW site in Terneuzen
The energy required for the processes at the DOW site is largely supplied by fuel gases separated from the cracking process, and other residual streams, which is estimated to be at most 83 PJ (66 PJ methane rich gas, 7 PJ fuel oil and about 10 PJ recovered steam). The total fuel demand at the DOW site is about 72-80 PJ, mostly for the steam crackers. The final energy demand per process is shown in Table 3 in the previous section. As mentioned before, an estimated 10-12 PJ of that is used to produce electricity delivered to the grid. The processes together require about 75 PJ (Table 3) of energy at full capacity, but due to the use of recovered steam the final energy demand of the DOW site is estimated to be around 65 PJ.
LSTA uses around 24-28 PJ fuel gas and natural gas per year (EEA, 2021). According to the Large Combustion Plants Database (EEA, 2021), about 20-25% of the fuel for ELSTA is fuel gas from the steam crackers, but based on the present analysis, a larger percentage of fuel gas use (about 60%) is deemed more likely based on the mass balance of the steam crackers.
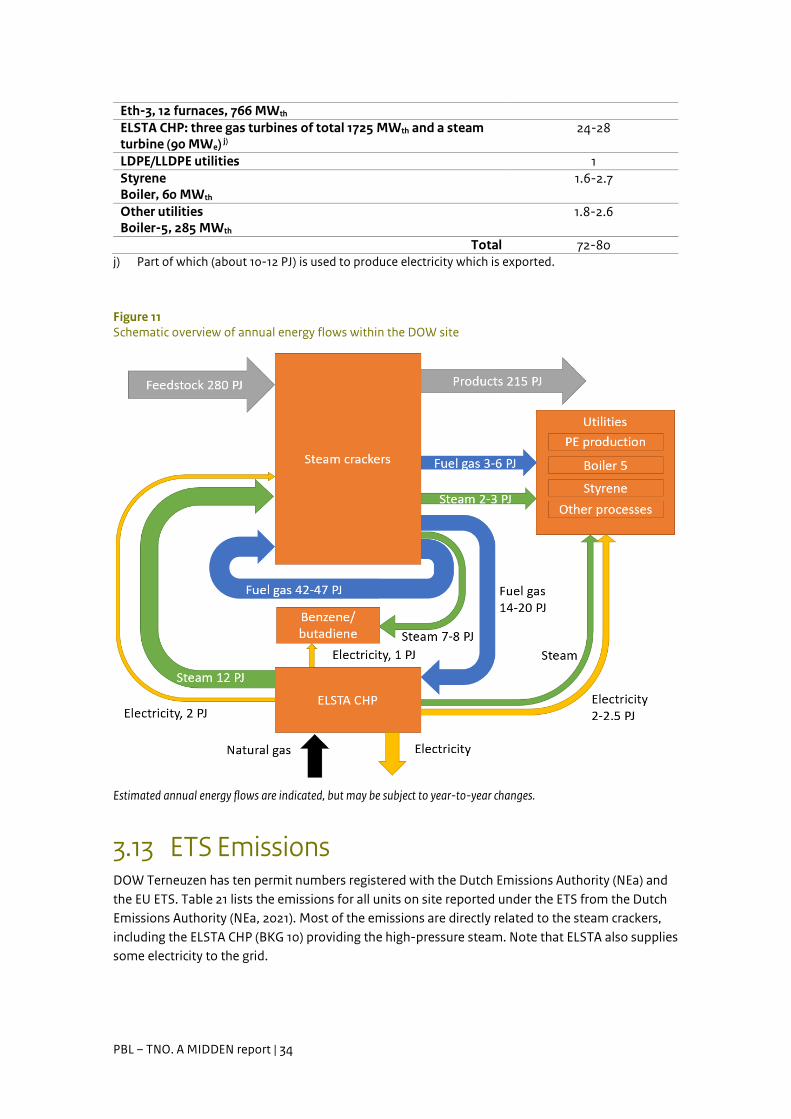
A calculated allocation of the fuel demand for the different processes is shown in Table 20, while a schematic overview of the main energy flows is shown in Figure 11. The final energy demand per process is shown in Table 3 in the previous section.
Table 20 Estimated fuel demand at the DOW site in Terneuzen in 2017-2019 (EEA, 2021)
Installation Fuel demand (PJ/yr) Steam crackers: Eth-1, 13 furnaces, 1 boiler, 945 MWth
Eth-2, 10 furnaces, 592 MWth
42-46
PBL – TNO. A MIDDEN report | 34
Eth-3, 12 furnaces, 766 MWth ELSTA CHP: three gas turbines of total 1725 MWth and a steam turbine (90 MWe) j)
24-28
LDPE/LLDPE utilities 1 Styrene Boiler, 60 MWth
1.6-2.7
Other utilities Boiler-5, 285 MWth
1.8-2.6
Total 72-80j) Part of which (about 10-12 PJ) is used to produce electricity which is exported.
Figure 11 Schematic overview of annual energy flows within the DOW site
Estimated annual energy flows are indicated, but may be subject to year-to-year changes.
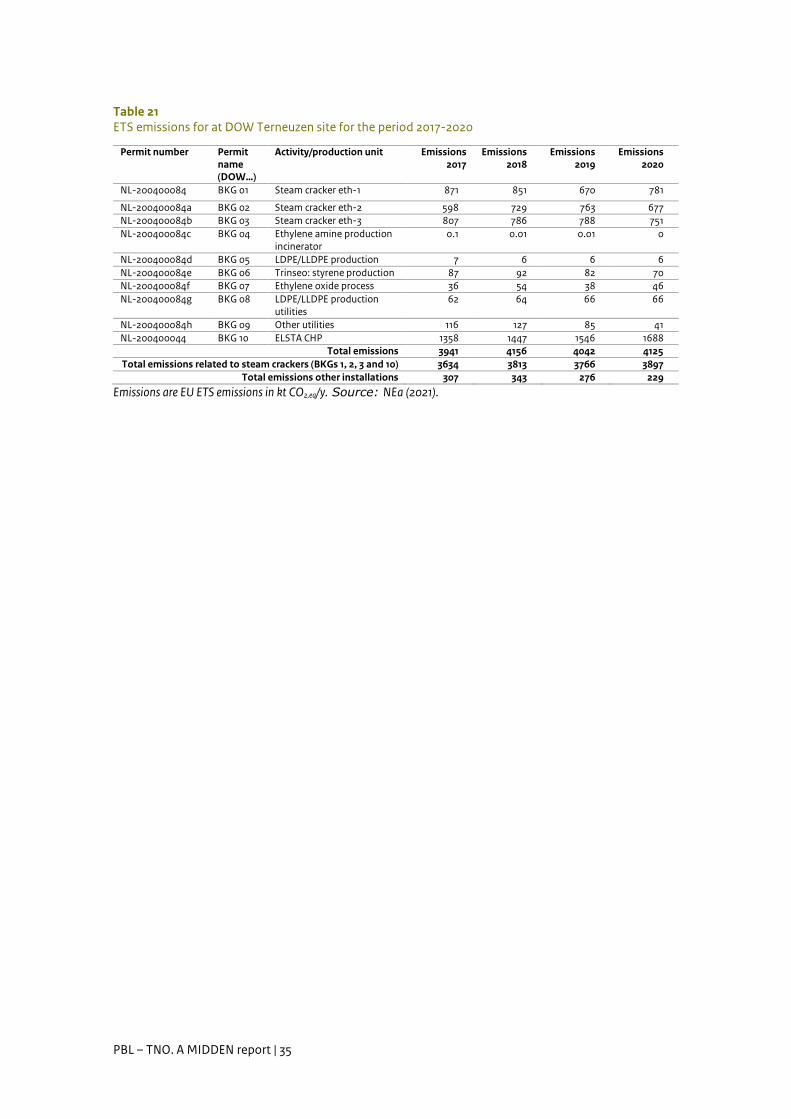
3.13 ETS Emissions DOW Terneuzen has ten permit numbers registered with the Dutch Emissions Authority (NEa) and the EU ETS. Table 21 lists the emissions for all units on site reported under the ETS from the Dutch Emissions Authority (NEa, 2021). Most of the emissions are directly related to the steam crackers, including the ELSTA CHP (BKG 10) providing the high-pressure steam. Note that ELSTA also supplies some electricity to the grid.
PBL – TNO. A MIDDEN report | 35
Table 21 ETS emissions for at DOW Terneuzen site for the period 2017-2020
Permit number Permit name (DOW…)
Activity/production unit Emissions 2017
Emissions 2018
Emissions 2019
Emissions 2020
NL-200400084 BKG 01 Steam cracker eth-1 871 851 670 781
NL-200400084a BKG 02 Steam cracker eth-2 598 729 763 677 NL-200400084b BKG 03 Steam cracker eth-3 807 786 788 751 NL-200400084c BKG 04 Ethylene amine production
incinerator 0.1 0.01 0.01 0
NL-200400084d BKG 05 LDPE/LLDPE production 7 6 6 6 NL-200400084e BKG 06 Trinseo: styrene production 87 92 82 70 NL-200400084f BKG 07 Ethylene oxide process 36 54 38 46 NL-200400084g BKG 08 LDPE/LLDPE production
utilities 62 64 66 66
NL-200400084h BKG 09 Other utilities 116 127 85 41 NL-200400044 BKG 10 ELSTA CHP 1358 1447 1546 1688
Total emissions 3941 4156 4042 4125 Total emissions related to steam crackers (BKGs 1, 2, 3 and 10) 3634 3813 3766 3897
Total emissions other installations 307 343 276 229
Emissions are EU ETS emissions in kt CO2,eq/y. Source: NEa (2021).
PBL – TNO. A MIDDEN report | 36
4 LVOC products and applications The LVOC production chain is briefly discussed in this section to contextualize its position in the global and Dutch chemical industry. Raw materials such as natural gas and crude oil are refined into chemical feedstocks such as naphtha, LPG and gas condensates transported by pipeline and ship to DOW Terneuzen which manufactures chemicals from short chain building blocks, such as ethylene and propylene, to more complex final products such as polymers. The following sections will describe in more detail the feedstocks and products handled at the DOW site, including production volume/markets, applications and their chemical and physical properties. The scope of this Section is limited to the products indicated in Table 1.
4.1 Feedstocks Naphtha is a refinery fraction composed of mostly C5–C11 aliphatic hydrocarbons and has a boiling point range between 35–190 °C. Depending on refinery conditions and source, it can vary in composition and is typically processed as light naphtha (boiling range 35–90 °C), heavy naphtha (90–180 °C), and full range naphtha (35–180 °C) (Zimmermann & Walzl, 2009).
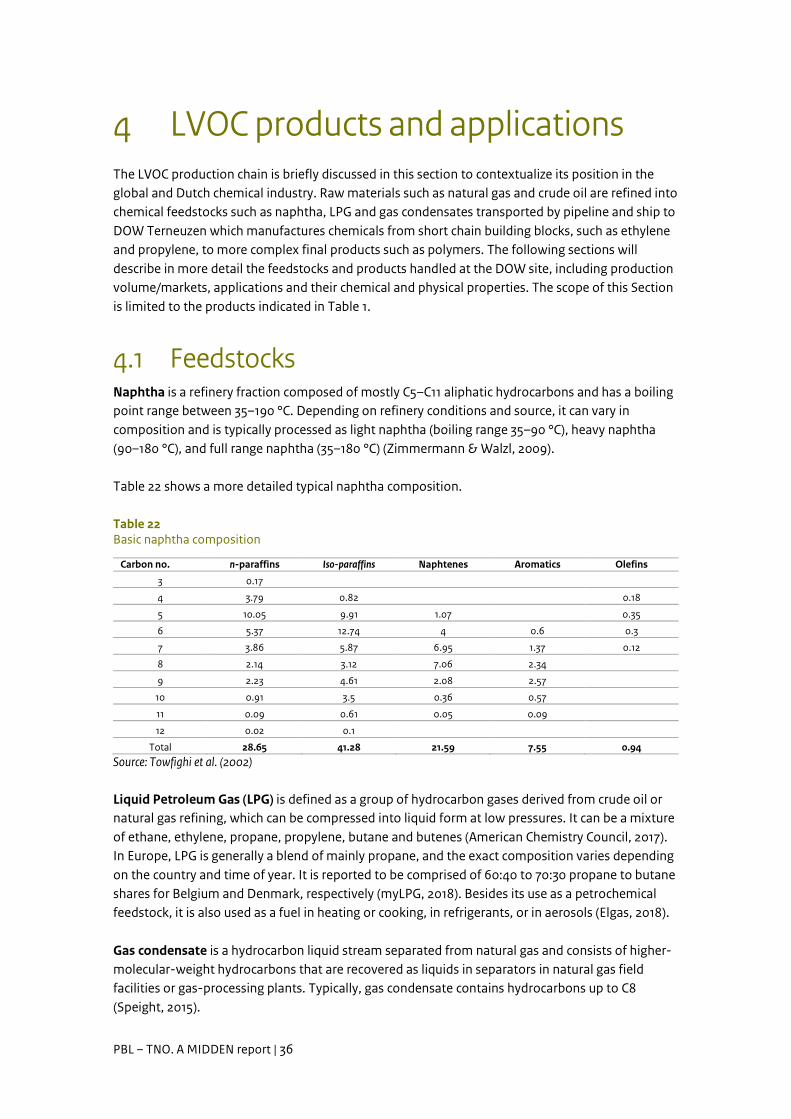
Table 22 shows a more detailed typical naphtha composition.
Table 22 Basic naphtha composition
Carbon no. n-paraffins Iso-paraffins Naphtenes Aromatics Olefins
3 0.17
4 3.79 0.82 0.18
5 10.05 9.91 1.07 0.35
6 5.37 12.74 4 0.6 0.3
7 3.86 5.87 6.95 1.37 0.12
8 2.14 3.12 7.06 2.34
9 2.23 4.61 2.08 2.57
10 0.91 3.5 0.36 0.57
11 0.09 0.61 0.05 0.09
12 0.02 0.1
Total 28.65 41.28 21.59 7.55 0.94 Source: Towfighi et al. (2002)
Liquid Petroleum Gas (LPG) is defined as a group of hydrocarbon gases derived from crude oil or natural gas refining, which can be compressed into liquid form at low pressures. It can be a mixture of ethane, ethylene, propane, propylene, butane and butenes (American Chemistry Council, 2017). In Europe, LPG is generally a blend of mainly propane, and the exact composition varies depending on the country and time of year. It is reported to be comprised of 60:40 to 70:30 propane to butane shares for Belgium and Denmark, respectively (myLPG, 2018). Besides its use as a petrochemical feedstock, it is also used as a fuel in heating or cooking, in refrigerants, or in aerosols (Elgas, 2018).
Gas condensate is a hydrocarbon liquid stream separated from natural gas and consists of higher-molecular-weight hydrocarbons that are recovered as liquids in separators in natural gas field facilities or gas-processing plants. Typically, gas condensate contains hydrocarbons up to C8 (Speight, 2015).
PBL – TNO. A MIDDEN report | 37
The feedstock used will depend on market conditions and the availability of supplies (EIPPCB, 2014; Zimmermann & Walzl, 2009). The main feedstocks in Europe are naphtha, natural gas condensate, liquid petroleum gas (LPG), and gas oil, with naphtha holding the largest share (CEFIC, 2013).
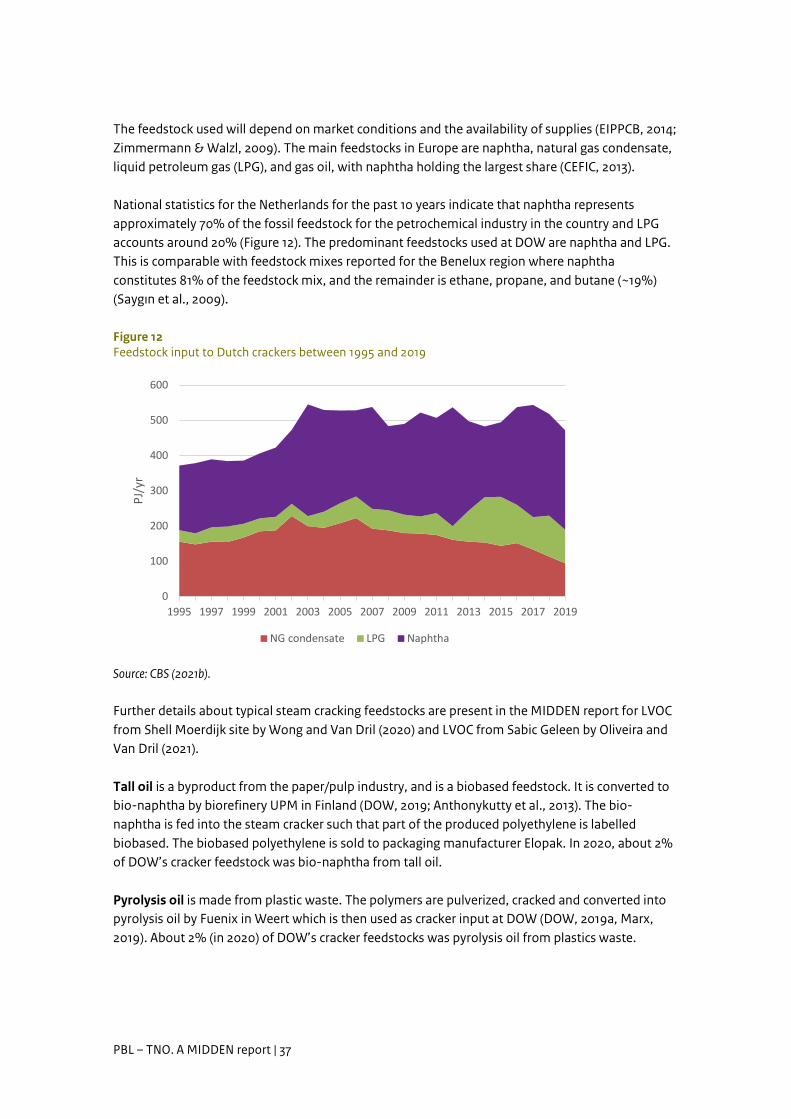
National statistics for the Netherlands for the past 10 years indicate that naphtha represents approximately 70% of the fossil feedstock for the petrochemical industry in the country and LPG accounts around 20% (Figure 12). The predominant feedstocks used at DOW are naphtha and LPG. This is comparable with feedstock mixes reported for the Benelux region where naphtha constitutes 81% of the feedstock mix, and the remainder is ethane, propane, and butane (~19%) (Saygın et al., 2009).
Figure 12 Feedstock input to Dutch crackers between 1995 and 2019
Source: CBS (2021b).
Further details about typical steam cracking feedstocks are present in the MIDDEN report for LVOC from Shell Moerdijk site by Wong and Van Dril (2020) and LVOC from Sabic Geleen by Oliveira and Van Dril (2021).
Tall oil is a byproduct from the paper/pulp industry, and is a biobased feedstock. It is converted to bio-naphtha by biorefinery UPM in Finland (DOW, 2019; Anthonykutty et al., 2013). The bio-naphtha is fed into the steam cracker such that part of the produced polyethylene is labelled biobased. The biobased polyethylene is sold to packaging manufacturer Elopak. In 2020, about 2% of DOW’s cracker feedstock was bio-naphtha from tall oil.
Pyrolysis oil is made from plastic waste. The polymers are pulverized, cracked and converted into pyrolysis oil by Fuenix in Weert which is then used as cracker input at DOW (DOW, 2019a, Marx, 2019). About 2% (in 2020) of DOW’s cracker feedstocks was pyrolysis oil from plastics waste.
0
100
200
300
400
500
600
1995 1997 1999 2001 2003 2005 2007 2009 2011 2013 2015 2017 2019
PJ/y
r
NG condensate LPG Naphtha
PBL – TNO. A MIDDEN report | 38
4.2 Products The chemicals produced at DOW can be classified as “Bulk Petrochemicals and Organic Intermediates”. They are derived from hydrocarbon feedstocks and, therefore, characteristically feature carbon molecules. The bulk petrochemicals produced at DOW include olefins (short chain hydrocarbons), benzene (molecule with an aromatic six-carbon ring structure), butadiene, ethylbenzene, styrene, cumene and polyurethanes. Favourable properties include their high reactivity and their numerous uses as chemical building blocks in downstream processes. It is estimated that over 85% of olefins produced globally are used in polymer production (Wesselink & Deng, 2009). Other co-products such as fuel gases and hydrogen are also valuable as they can be sold or internally used. Prices of most of the produced products ranged between 700 and 1700 euro per tonne product. Product prices depend strongly on oil prices, ethylene prices varies between July 2020 and July 2021 between 686 euro/t to 1120 euro/t (Penpet 2021). January 2021 prices for LDPE were approximately 1000-1100 euro/t, PP 1040-1090 euro/t, PS 1270-1360 euro/t and ABS 1600-1700 euro/t (MYbusinessmedia Holding B.V., 2021).
4.2.1 Ethylene Ethylene (C2H4 – CH2=CH2) — ethene according to IUPAC1 — is one of the largest-volume commodity chemicals produced worldwide. Ethylene is as a colourless gas with sweet odour and taste. It is used mainly as raw material in the manufacture of plastics, fibres and other organic chemicals, which are ultimately used in the packaging, transportation and construction industries (Zimmermann and Walzl, 2009). It is the basic chemical for about 30% of all petrochemicals (Ecofys, 2009). It was estimated that by the end of 2018, approximately 20 Mt of ethylene was produced in Western Europe. About 60% of ethylene in Western Europe is used for the production of polyethylene (PE) of different types, such as low density (LDPE), linear low density (LLDPE) and high density (HDPE). Ethylene dichloride (EDC) is the second main derivative of ethylene (15%), used itself for the production of polyvinylchloride (PVC) (Petrochemicals, 2016).
At DOW, 1420 kt ethylene (of the 1800 kt from the steam cracker) is used to produce: • 300 kt LDPE• 800 kt LLDPE• 730 kt ethyl benzene, using 180 kt ethylene• 195 kt ethylene oxide, using 140 kt ethylene.
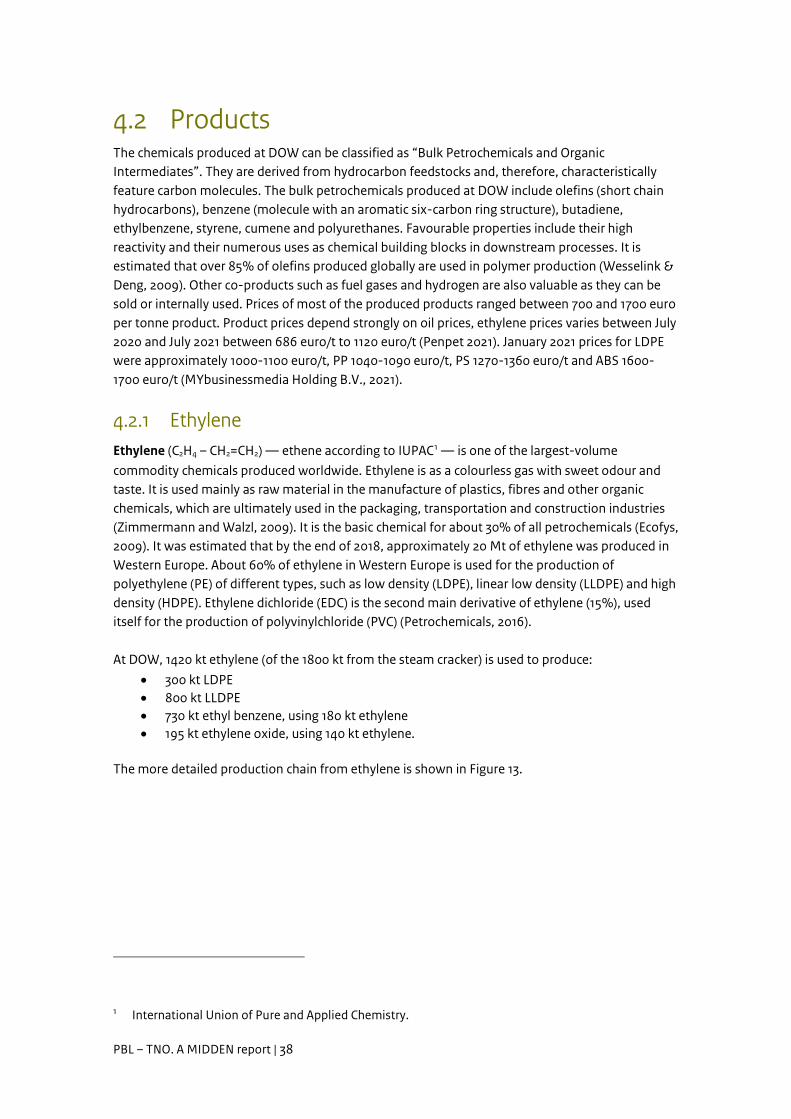
The more detailed production chain from ethylene is shown in Figure 13.
1 International Union of Pure and Applied Chemistry.
PBL – TNO. A MIDDEN report | 39
Figure 13 Production chain from ethylene
Coloured boxes are products produced at the DOW production site. Modified figure based on American Chemistry Council (2017).
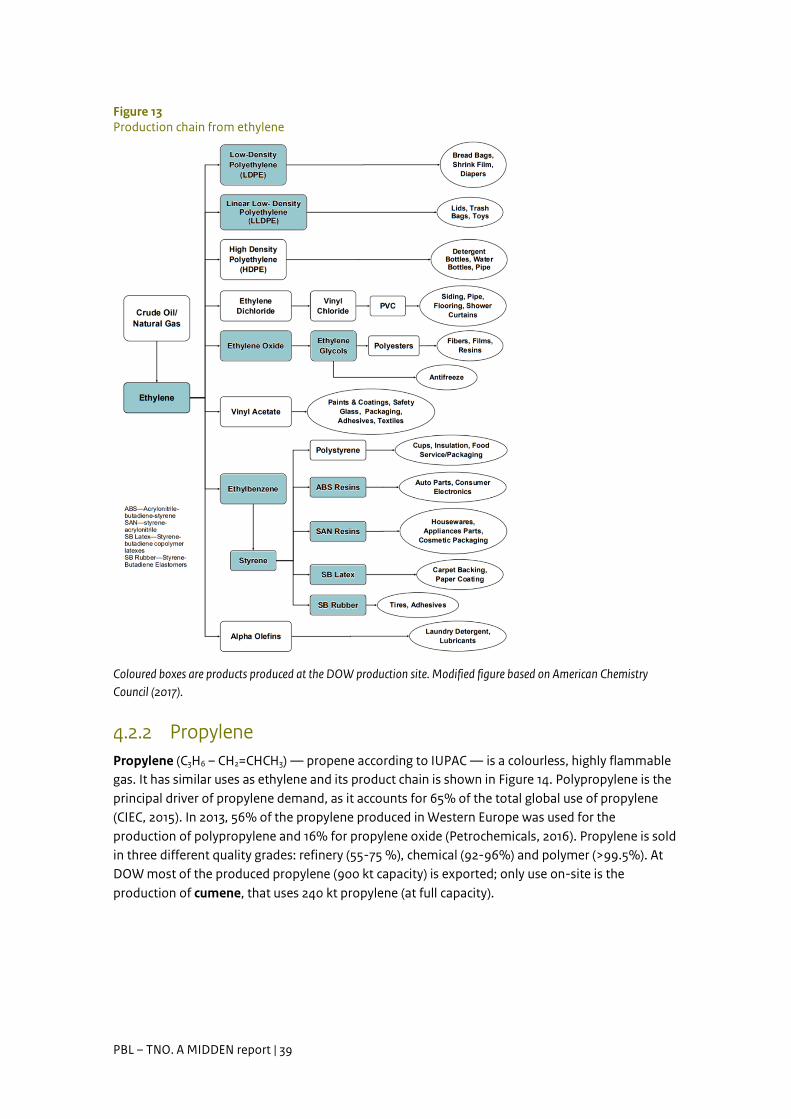
4.2.2 Propylene Propylene (C3H6 – CH2=CHCH3) — propene according to IUPAC — is a colourless, highly flammable gas. It has similar uses as ethylene and its product chain is shown in Figure 14. Polypropylene is the principal driver of propylene demand, as it accounts for 65% of the total global use of propylene (CIEC, 2015). In 2013, 56% of the propylene produced in Western Europe was used for the production of polypropylene and 16% for propylene oxide (Petrochemicals, 2016). Propylene is sold in three different quality grades: refinery (55-75 %), chemical (92-96%) and polymer (>99.5%). At DOW most of the produced propylene (900 kt capacity) is exported; only use on-site is the production of cumene, that uses 240 kt propylene (at full capacity).
PBL – TNO. A MIDDEN report | 40
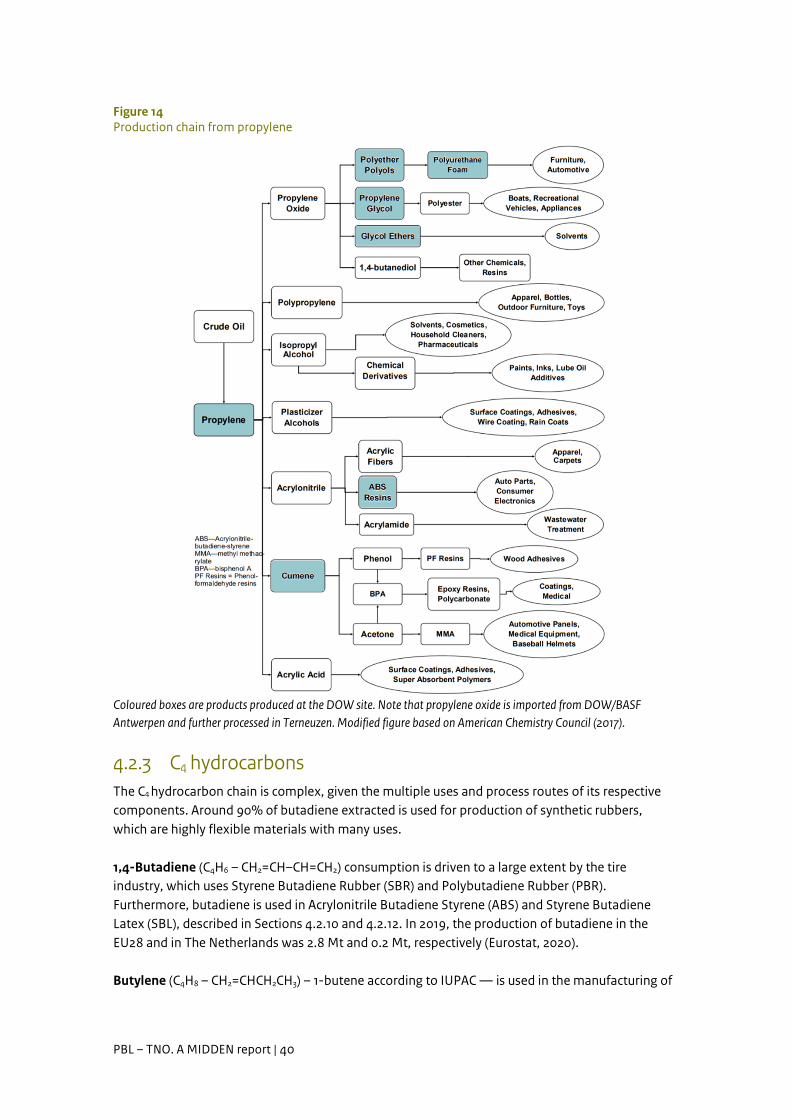
Figure 14 Production chain from propylene
Coloured boxes are products produced at the DOW site. Note that propylene oxide is imported from DOW/BASF Antwerpen and further processed in Terneuzen. Modified figure based on American Chemistry Council (2017).
4.2.3 C4 hydrocarbons The C4 hydrocarbon chain is complex, given the multiple uses and process routes of its respective components. Around 90% of butadiene extracted is used for production of synthetic rubbers, which are highly flexible materials with many uses.
1,4-Butadiene (C4H6 – CH2=CH–CH=CH2) consumption is driven to a large extent by the tire industry, which uses Styrene Butadiene Rubber (SBR) and Polybutadiene Rubber (PBR). Furthermore, butadiene is used in Acrylonitrile Butadiene Styrene (ABS) and Styrene Butadiene Latex (SBL), described in Sections 4.2.10 and 4.2.12. In 2019, the production of butadiene in the EU28 and in The Netherlands was 2.8 Mt and 0.2 Mt, respectively (Eurostat, 2020).
Butylene (C4H8 – CH2=CHCH2CH3) – 1-butene according to IUPAC — is used in the manufacturing of
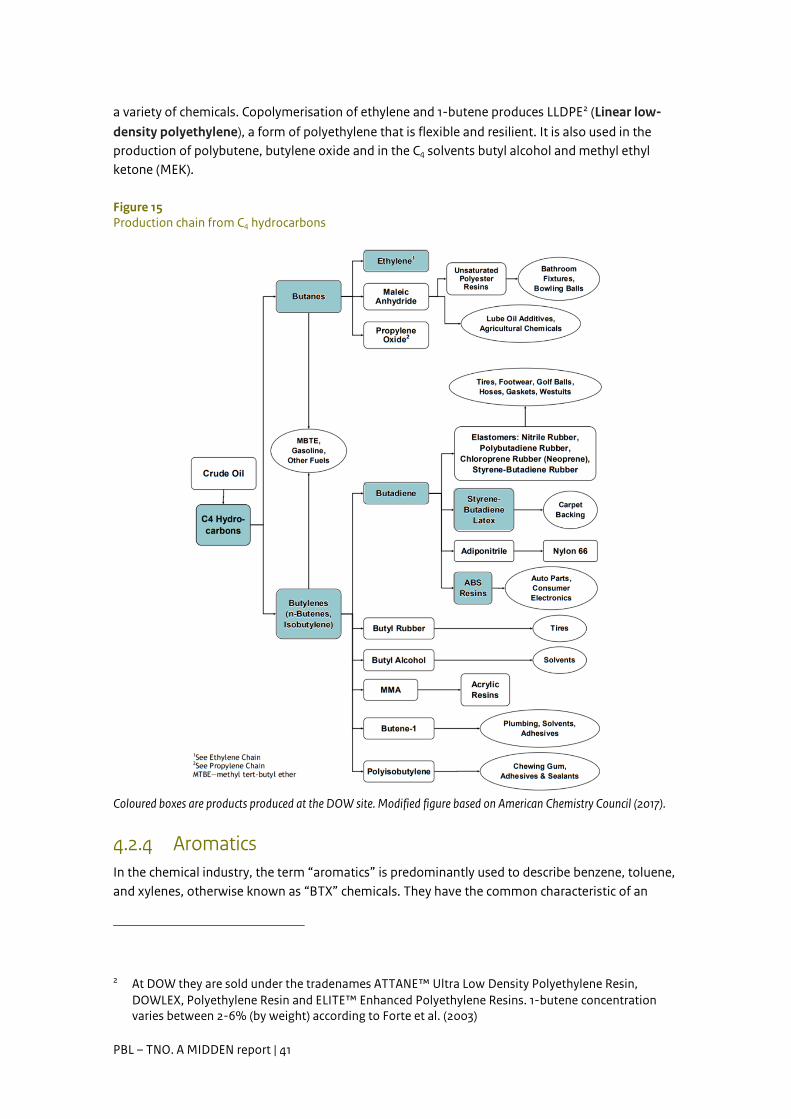
PBL – TNO. A MIDDEN report | 41
a variety of chemicals. Copolymerisation of ethylene and 1-butene produces LLDPE2 (Linear low-density polyethylene), a form of polyethylene that is flexible and resilient. It is also used in the production of polybutene, butylene oxide and in the C4 solvents butyl alcohol and methyl ethyl ketone (MEK).
Figure 15 Production chain from C4 hydrocarbons
Coloured boxes are products produced at the DOW site. Modified figure based on American Chemistry Council (2017).
4.2.4 Aromatics In the chemical industry, the term “aromatics” is predominantly used to describe benzene, toluene, and xylenes, otherwise known as “BTX” chemicals. They have the common characteristic of an
2 At DOW they are sold under the tradenames ATTANE™ Ultra Low Density Polyethylene Resin, DOWLEX, Polyethylene Resin and ELITE™ Enhanced Polyethylene Resins. 1-butene concentration varies between 2-6% (by weight) according to Forte et al. (2003)
PBL – TNO. A MIDDEN report | 42
aromatic six carbon ring, which gives them a specific odour. One of their main uses are in the production of polymers, and multiple consumer products including, solvents, paints and polishes. BTX chemicals are often obtained together from different fractions of oil distillation, therefore referred to as a group. In the Netherlands, the capacities for benzene, toluene, and xylene were 2.5 Mt, 0.3 Mt, and 1.1 Mt respectively in 2013 (Boulamanti & Moya, 2017). Benzene (C6H6) is an aromatic hydrocarbon. The compound exists as a clear, colourless liquid with a gasoline-like odour. It is highly flammable, with a flashpoint of -18°C, and has a density lower than water (National Center for Biotechnology Information, 2020). Benzene is used in the manufacturing of ethylbenzene (50% of total usage) and cumene (20% of total usage). Benzene is produced in the largest volumes out of the aromatic chemicals. In 2013, global production reached 42.7 million tonnes, with Western Europe, China, and the US responsible for about half the total world consumption (IHS-Markit, 2020). In 2019, the production of benzene in the EU28 was 5.7 Mt, of which 1.1 Mt in The Netherlands (Eurostat, 2020). Benzene is now mainly consumed as a chemical feedstock, where 70-75% of the produced benzene is applied in ethylbenzene and cumene production (IHS-Markit, 2020), and it is also an important feedstock for cyclohexane and aniline synthesis. At DOW the produced benzene (900 kt, including converted toluene and xylenes) is fully used to produce ethylbenzene (540 kt benzene at full capacity) and cumene (450 kt benzene at full capacity).
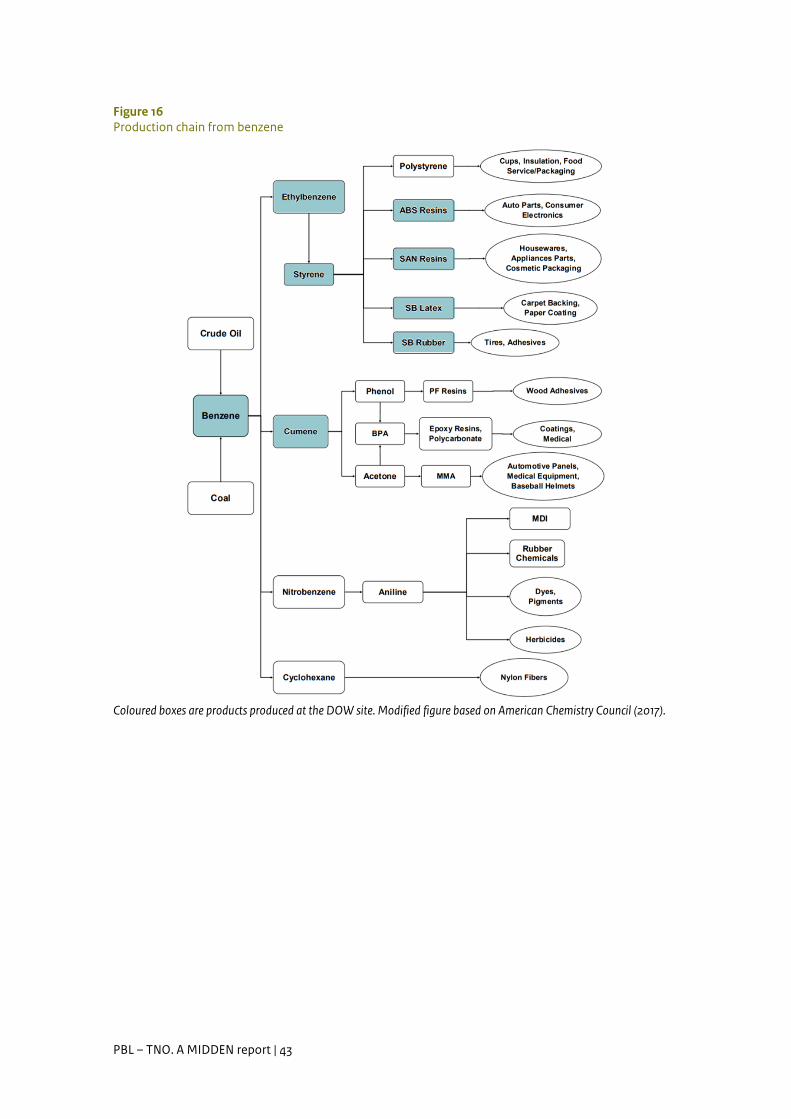
PBL – TNO. A MIDDEN report | 43
Figure 16 Production chain from benzene
Coloured boxes are products produced at the DOW site. Modified figure based on American Chemistry Council (2017).
PBL – TNO. A MIDDEN report | 44
4.2.5 Hydrogen Hydrogen is a colourless and odourless gas at normal conditions, it is non-toxic and it is considered environmentally neutral. The boiling point is low (-252.76 °C) at normal pressure (1.013 bar); this is close to the absolute zero temperature of –273.15 °C. The industrial sector is both the main producer and consumer of hydrogen, with more than 90% of market share amongst the EU28, and a total consumption of 7 Mt (Fraile, Lanoix, Maio, Rangel, & Torres, 2015). In 2018, 96% of all hydrogen was produced from fossil fuels, natural gas being the most commonly used feedstock (representing 49%), followed by liquid hydrocarbons at 29% and coal at 18%. Four percent of the total hydrogen production came from electrolysis and as a by-product from other production methods (IHS-Markit, 2019). In 2016, 55% of hydrogen was used for ammonia production and 10% for methanol production. About 25% of hydrogen was used for processing intermediate oil in refineries. The remaining 10% of global hydrogen production was used in the manufacturing of polymers and other applications (Hydrogen Europe, 2019). Expectations are that the hydrogen market will grow significantly in the future. On the short term, this is due to increased oil, ammonia and methanol consumption in developing countries (Hydrogen Europe, 2019; IHS-Markit, 2019). Furthermore, hydrogen is increasingly seen as a promising energy carrier. Hydrogen is a highly efficient, carbon-neutral fuel that can be used for transportation, heating, and power generation, particularly for applications which cannot be easily electrified.
4.2.6 LDPE and LLDPE Low-Density Polyethylene (LDPE) is an amorphous polymer with an average density of 0.91-0.94 g/cm3 and a melting point of 105-115°C. It is composed by 4,000-40,000 carbon atoms with many short and long branches (Omnexus, 2020). Linear low-Density Polyethylene (LLDPE, DOWLEX) is a flexible and translucent plastic with high impact strength resistance and good resistance to water and chemicals such as alcohols. Just like LDPE, LLDPE has light weight and low production cost. The most common manufacturing process is extrusion (e.g. for blow and cast films), but injection and roto-moulding can also be used (Omnexus, 2020). LLDPE sheets are physiologically harmless, making it the perfect material for food packaging and agricultural film. LDPE and LLDPE together form 17.5% of the plastics demand in Europe, for a total of almost 9 million tonnes. LDPE is used especially in the packaging sector (single use food films, reusable bags and containers), agriculture sector (single use agricultural films), building and construction sector, and it is marginally used in the electrical and automotive sectors (PlasticsEurope, 2014).
4.2.7 Ethylbenzene Ethylbenzene has the formula C6H5CH2CH3. It is a highly flammable, colourless liquid with an odour similar to that of gasoline. In 2012, more than 99% of ethylbenzene produced was consumed in the production of styrene (described in Section 4.2.9). Global demand for both EB and styrene are projected to increase at a rate of 2% per year up to 2022 (IHS-Markit, 2020).
PBL – TNO. A MIDDEN report | 45
4.2.8 Cumene (isopropylbenzene) Cumene is an organic liquid compound with the formula C6H5CH(CH3)2. Nearly all the cumene (98%) that is produced as a pure compound on an industrial scale is converted to cumene hydroperoxide, which is an intermediate in the synthesis of other industrially important chemicals, primarily phenol and acetone, which are not produced at the DOW site. Phenol is primarily used as a precursor to plastics, such as polycarbonates (via bisphenol A), epoxy resins and nylon. Acetone is mainly used as solvent and for the production of polycarbonate and plexiglass (via bisphenol A and methyl methacrylate (MMA)). Global production of cumene was about 15 Mt in 2019; for almost 75% in Asia and North and South America (IHS-Markit, 2021).
4.2.9 Styrene Styrene has the formula C6H5CH=CH2. It appears as a colourless to dark liquid and has a sweet odour (National Center for Biotechnology Information, 2020a). Globally, approximately 35 Mt of styrene were produced in 2018. About 56% of the styrene is used for polystyrene production, 22% for ABS/SAN, 6% for SBL and 12% for other uses (youknowstyrene, 2021). A few of the most predominant forms of styrene and their uses are (youknowstyrene, 2021):
• Solid polystyrene, which is used in packaging, rigid foodservice containers, medical and optical devices, electronics, toys, kitchen appliances, household items, and many other products.
• Polystyrene foam, which is used in lightweight protective packaging, foodservice containers, building components, insulation, and more.
• Composite products, also known as fiber-reinforced polymer composites (FRP): used in automobile components, military and commercial aircraft, boats, wind turbine parts, corrosion-resistant pipes and tanks, bathroom fixtures, sporting goods, and many other applications.
• Polystyrene film, which is used in a variety of food packaging, laminating, and printing applications.
Other styrene-based materials include Acrylonitrile Butadiene Styrene (ABS), Styrene Acrylonitrile (SAN), Styrene Butadiene Rubber (SBR) and Styrene Butadiene Latex (SBL). These are discussed in the next paragraphs.
4.2.10 Acrylonitrile Butadiene Styrene (ABS) Acrylonitrile Butadiene Styrene (ABS) is used in refrigerator liners, medical devices, auto parts, small household appliances, toys, and luggage. Global production is more than 10 Mt per year and is dominated by Asia (PlasticsInsight, n.d.)
4.2.11 Styrene Acrylonitrile (SAN) Styrene Acrylonitrile (SAN) polyols are used to produce polyurethane foam, automotive parts, battery cases, kitchenware, appliances, furniture and medical supplies. SAN polyols are also used for pharmaceutical and cosmetic packaging. Most major SAN producers are in the process of developing or have already developed natural oil–based polyols (NOPs). The main feedstocks for these products are renewable (vegetable) oils including rapeseed, soybean, castor, and corn oils.
PBL – TNO. A MIDDEN report | 46
4.2.12 Styrene Butadiene Rubber (SBR) and Styrene Butadiene Latex (SBL)
Styrene Butadiene Rubber (SBR) can substitute natural rubbers and provides improved performance in applications such as vehicle tires (leading to improved fuel efficiency), conveyor belts, gaskets, and seals. SBR is one of the cheaper synthetic general purpose elastomers. In 2012, more than 5.4 million tonnes of SBR were processed worldwide. The styrene/butadiene ratio influences the properties of the polymer: with high styrene content, the rubbers are harder and less rubbery (Market Study Synthetic Rubber, 2013; Obrecht et al., 2012). Styrene Butadiene Latex (SBL) has a lower butadiene content than SBR which makes it less elastic. It also has a larger crosslink density, giving it a higher toughness and strength compared to SBR (Mallard Creek Polymers, 2016). SBL is used in many paper coatings and in broadloom carpeting (90% of the broadloom carpeting made in the United States) to attach carpet fibres to a backing material. These materials have good abrasion resistance and good aging stability when protected by additives.
4.2.13 Ethylene oxide (EO) Ethylene oxide (EO) is one of the most important raw materials used in large-scale chemical production. As of 2016, there were 12 production sites for EO in the EU-28, with the two sites located in the Netherlands (DOW Chemical Terneuzen and Shell Moerdijk) equaling a total capacity of 470 kt/y (ICIS, 2013). It contains a strained epoxy group (C-C bond triangulated with oxygen) which is very reactive, and it is therefore commonly used as an intermediate in chemical production. It can be used as a disinfectant, sterilizing agent, or as a fumigant. However, most ethylene oxide is used for synthesis of mono-ethylene glycol (MEG), and its by-products; di-ethylene glycol (DEG) and tri-ethylene glycol (TEG), together accounting for up to 75% of global consumption.
4.2.14 Polyether glycols (polyols) A polyglycol or polyol contains more than one OH group in its molecule (methanol and ethanol have one OH group). With two OH groups it is called a diol (i.e. ethylene glycol), with three OH groups a triol. Other examples are sugars (i.e. sorbitol, lactitol, xylitol). They are manufactured in a wide range of molecular weights to meet the application and processing needs. The main use of polyols is in polyurethane (PU) foams, flexible or rigid. Smaller uses for polyether polyols include PEG1000 carbowax (produced by DOW), elastomers, adhesives and sealants, surface coatings and PU fibres. Polyols can also be used in non-urethane applications such as surfactants and oil demulsifiers (Shell, 2019). Another example of a polyol produced by DOW is VORALUX™ HL 430, a grafted polyether polyol containing copolymerized styrene and acrylonitrile. It is used in the manufacture of flexible slabstock polyurethane foams. VORALUX™ HL 430 is most commonly used in the full density range of high-load bearing flexible foams used in carpet underlay and packaging. It can be used as the sole polyol, or may be blended with conventional polyether slabstock polyols to produce high-load bearing (DOW, 2010). In The Netherlands, polyether polyols are produced by DOW Chemical in Terneuzen, Shell in Pernis (Rotterdam) and Huntsman in Botlek (Rotterdam). Globally, DOW, Covestro, Shell and BASF are the

PBL – TNO. A MIDDEN report | 47
largest players, owning about 47% of the global production capacity (9.4 Mt) in 2016 (Statista, 2021).
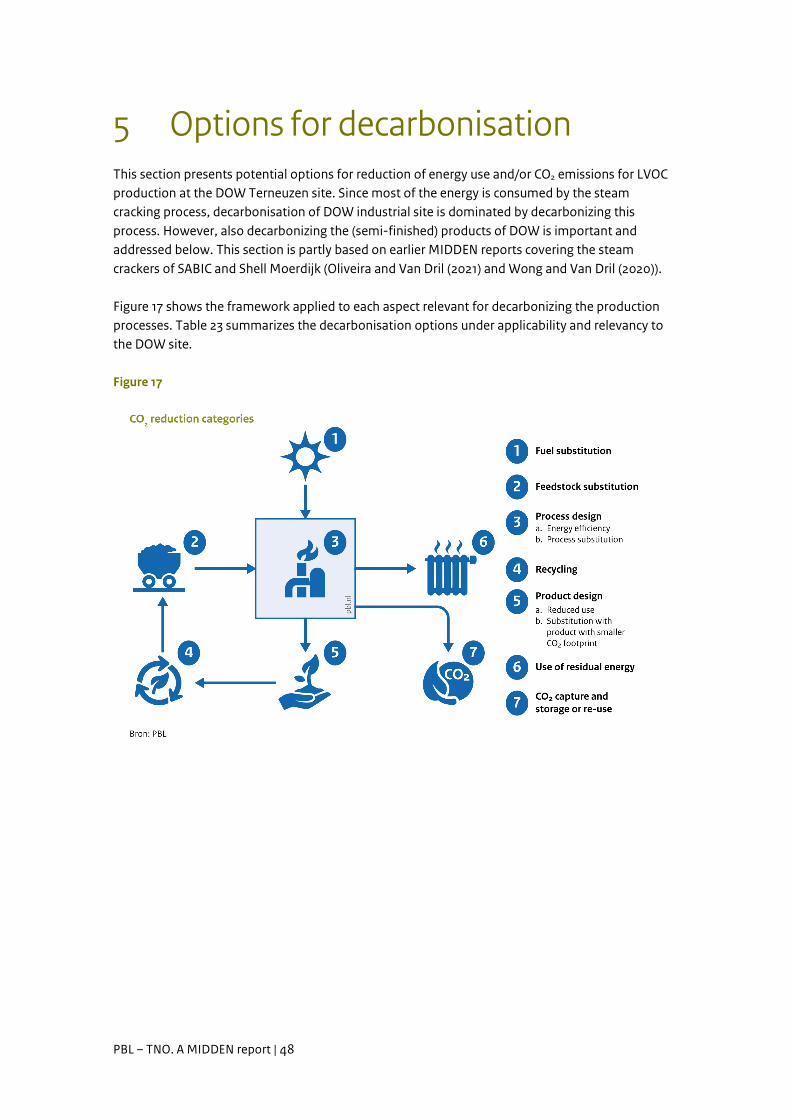
PBL – TNO. A MIDDEN report | 48
5 Options for decarbonisation This section presents potential options for reduction of energy use and/or CO2 emissions for LVOC production at the DOW Terneuzen site. Since most of the energy is consumed by the steam cracking process, decarbonisation of DOW industrial site is dominated by decarbonizing this process. However, also decarbonizing the (semi-finished) products of DOW is important and addressed below. This section is partly based on earlier MIDDEN reports covering the steam crackers of SABIC and Shell Moerdijk (Oliveira and Van Dril (2021) and Wong and Van Dril (2020)). Figure 17 shows the framework applied to each aspect relevant for decarbonizing the production processes. Table 23 summarizes the decarbonisation options under applicability and relevancy to the DOW site.
Figure 17
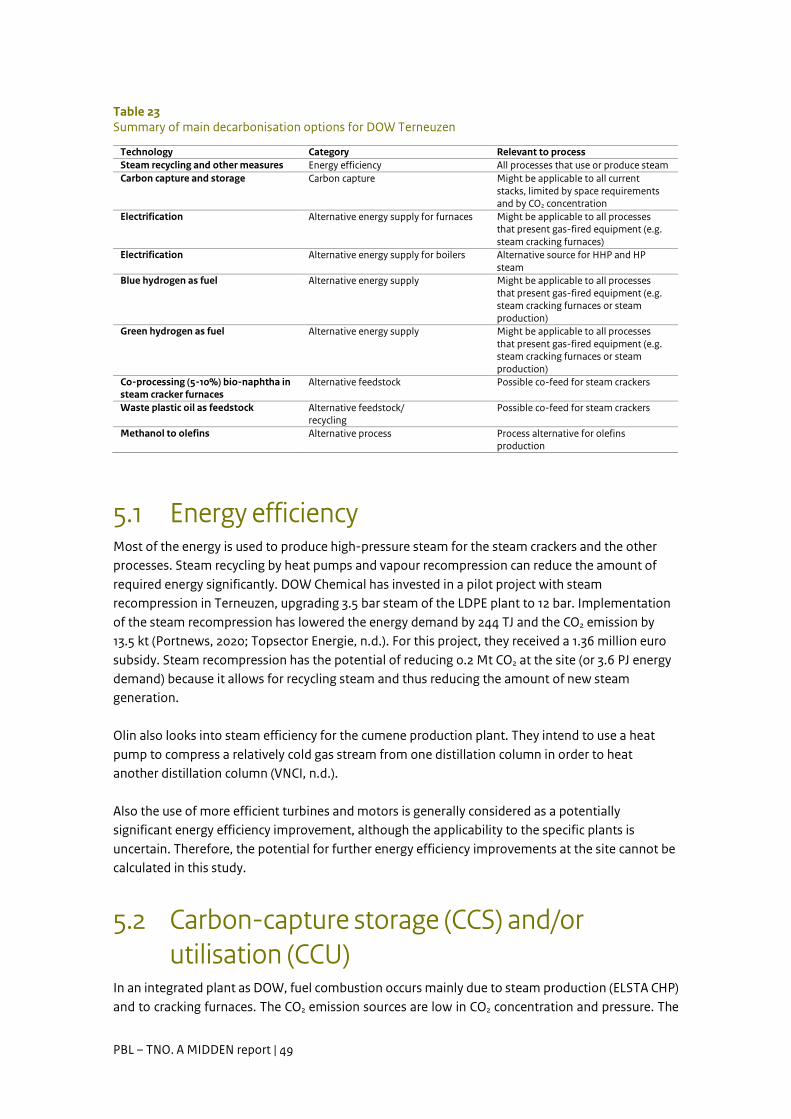
PBL – TNO. A MIDDEN report | 49
Table 23 Summary of main decarbonisation options for DOW Terneuzen
Technology Category Relevant to process Steam recycling and other measures Energy efficiency All processes that use or produce steam Carbon capture and storage Carbon capture Might be applicable to all current
stacks, limited by space requirements and by CO2 concentration
Electrification Alternative energy supply for furnaces Might be applicable to all processes that present gas-fired equipment (e.g. steam cracking furnaces)
Electrification Alternative energy supply for boilers Alternative source for HHP and HP steam
Blue hydrogen as fuel Alternative energy supply Might be applicable to all processes that present gas-fired equipment (e.g. steam cracking furnaces or steam production)
Green hydrogen as fuel Alternative energy supply Might be applicable to all processes that present gas-fired equipment (e.g. steam cracking furnaces or steam production)
Co-processing (5-10%) bio-naphtha in steam cracker furnaces
Alternative feedstock Possible co-feed for steam crackers
Waste plastic oil as feedstock Alternative feedstock/ recycling
Possible co-feed for steam crackers
Methanol to olefins Alternative process Process alternative for olefins production
5.1 Energy efficiency Most of the energy is used to produce high-pressure steam for the steam crackers and the other processes. Steam recycling by heat pumps and vapour recompression can reduce the amount of required energy significantly. DOW Chemical has invested in a pilot project with steam recompression in Terneuzen, upgrading 3.5 bar steam of the LDPE plant to 12 bar. Implementation of the steam recompression has lowered the energy demand by 244 TJ and the CO2 emission by 13.5 kt (Portnews, 2020; Topsector Energie, n.d.). For this project, they received a 1.36 million euro subsidy. Steam recompression has the potential of reducing 0.2 Mt CO2 at the site (or 3.6 PJ energy demand) because it allows for recycling steam and thus reducing the amount of new steam generation. Olin also looks into steam efficiency for the cumene production plant. They intend to use a heat pump to compress a relatively cold gas stream from one distillation column in order to heat another distillation column (VNCI, n.d.). Also the use of more efficient turbines and motors is generally considered as a potentially significant energy efficiency improvement, although the applicability to the specific plants is uncertain. Therefore, the potential for further energy efficiency improvements at the site cannot be calculated in this study.
5.2 Carbon-capture storage (CCS) and/or utilisation (CCU)
In an integrated plant as DOW, fuel combustion occurs mainly due to steam production (ELSTA CHP) and to cracking furnaces. The CO2 emission sources are low in CO2 concentration and pressure. The
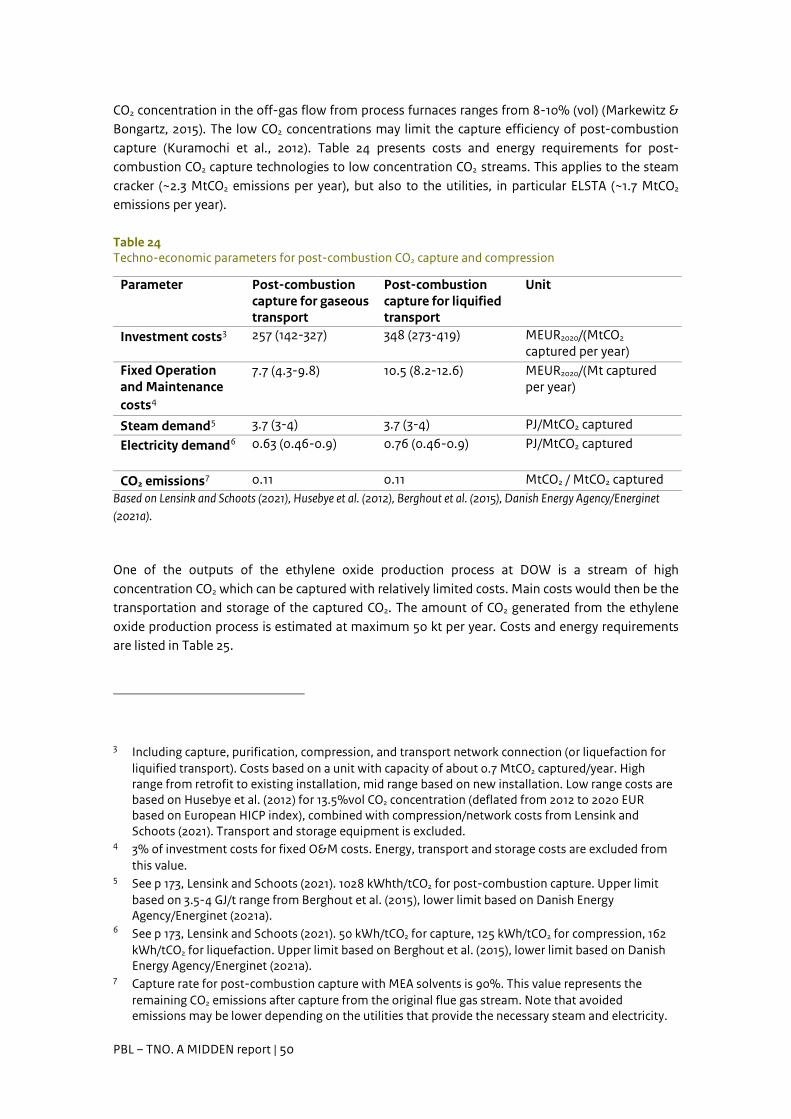
PBL – TNO. A MIDDEN report | 50
CO2 concentration in the off-gas flow from process furnaces ranges from 8-10% (vol) (Markewitz & Bongartz, 2015). The low CO2 concentrations may limit the capture efficiency of post-combustion capture (Kuramochi et al., 2012). Table 24 presents costs and energy requirements for post-combustion CO2 capture technologies to low concentration CO2 streams. This applies to the steam cracker (~2.3 MtCO2 emissions per year), but also to the utilities, in particular ELSTA (~1.7 MtCO2 emissions per year).
Table 24 Techno-economic parameters for post-combustion CO2 capture and compression
Parameter Post-combustion capture for gaseous transport
Post-combustion capture for liquified transport
Unit
Investment costs3 257 (142-327) 348 (273-419) MEUR2020/(MtCO2 captured per year)
Fixed Operation and Maintenance costs4
7.7 (4.3-9.8) 10.5 (8.2-12.6) MEUR2020/(Mt captured per year)
Steam demand5 3.7 (3-4) 3.7 (3-4) PJ/MtCO2 captured
Electricity demand6 0.63 (0.46-0.9) 0.76 (0.46-0.9) PJ/MtCO2 captured
CO2 emissions7 0.11 0.11 MtCO2 / MtCO2 captured Based on Lensink and Schoots (2021), Husebye et al. (2012), Berghout et al. (2015), Danish Energy Agency/Energinet (2021a). One of the outputs of the ethylene oxide production process at DOW is a stream of high concentration CO2 which can be captured with relatively limited costs. Main costs would then be the transportation and storage of the captured CO2. The amount of CO2 generated from the ethylene oxide production process is estimated at maximum 50 kt per year. Costs and energy requirements are listed in Table 25.
3 Including capture, purification, compression, and transport network connection (or liquefaction for
liquified transport). Costs based on a unit with capacity of about 0.7 MtCO2 captured/year. High range from retrofit to existing installation, mid range based on new installation. Low range costs are based on Husebye et al. (2012) for 13.5%vol CO2 concentration (deflated from 2012 to 2020 EUR based on European HICP index), combined with compression/network costs from Lensink and Schoots (2021). Transport and storage equipment is excluded.
4 3% of investment costs for fixed O&M costs. Energy, transport and storage costs are excluded from this value.
5 See p 173, Lensink and Schoots (2021). 1028 kWhth/tCO2 for post-combustion capture. Upper limit based on 3.5-4 GJ/t range from Berghout et al. (2015), lower limit based on Danish Energy Agency/Energinet (2021a).
6 See p 173, Lensink and Schoots (2021). 50 kWh/tCO2 for capture, 125 kWh/tCO2 for compression, 162 kWh/tCO2 for liquefaction. Upper limit based on Berghout et al. (2015), lower limit based on Danish Energy Agency/Energinet (2021a).
7 Capture rate for post-combustion capture with MEA solvents is 90%. This value represents the remaining CO2 emissions after capture from the original flue gas stream. Note that avoided emissions may be lower depending on the utilities that provide the necessary steam and electricity.
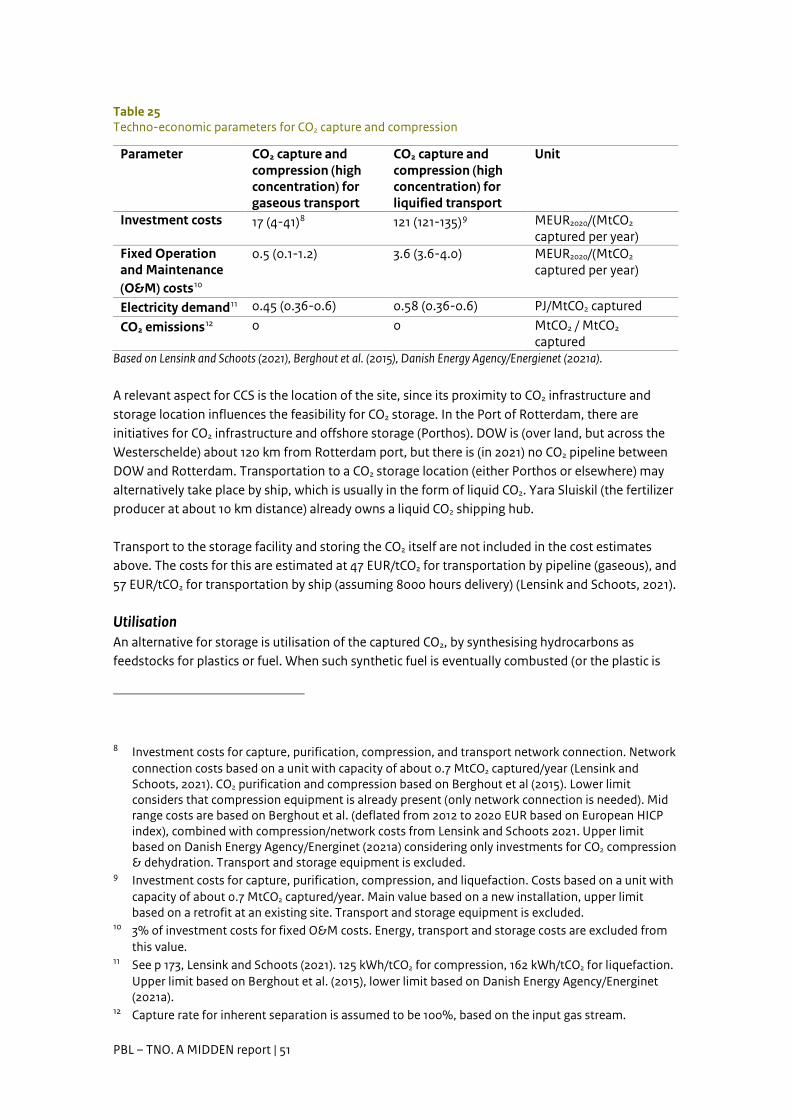
PBL – TNO. A MIDDEN report | 51
Table 25 Techno-economic parameters for CO2 capture and compression
Parameter CO2 capture and compression (high concentration) for gaseous transport
CO2 capture and compression (high concentration) for liquified transport
Unit
Investment costs 17 (4-41)8 121 (121-135)9 MEUR2020/(MtCO2 captured per year)
Fixed Operation and Maintenance (O&M) costs10
0.5 (0.1-1.2) 3.6 (3.6-4.0) MEUR2020/(MtCO2 captured per year)
Electricity demand11 0.45 (0.36-0.6) 0.58 (0.36-0.6) PJ/MtCO2 captured
CO2 emissions12 0 0 MtCO2 / MtCO2 captured
Based on Lensink and Schoots (2021), Berghout et al. (2015), Danish Energy Agency/Energienet (2021a). A relevant aspect for CCS is the location of the site, since its proximity to CO2 infrastructure and storage location influences the feasibility for CO2 storage. In the Port of Rotterdam, there are initiatives for CO2 infrastructure and offshore storage (Porthos). DOW is (over land, but across the Westerschelde) about 120 km from Rotterdam port, but there is (in 2021) no CO2 pipeline between DOW and Rotterdam. Transportation to a CO2 storage location (either Porthos or elsewhere) may alternatively take place by ship, which is usually in the form of liquid CO2. Yara Sluiskil (the fertilizer producer at about 10 km distance) already owns a liquid CO2 shipping hub. Transport to the storage facility and storing the CO2 itself are not included in the cost estimates above. The costs for this are estimated at 47 EUR/tCO2 for transportation by pipeline (gaseous), and 57 EUR/tCO2 for transportation by ship (assuming 8000 hours delivery) (Lensink and Schoots, 2021).
Utilisation An alternative for storage is utilisation of the captured CO2, by synthesising hydrocarbons as feedstocks for plastics or fuel. When such synthetic fuel is eventually combusted (or the plastic is
8 Investment costs for capture, purification, compression, and transport network connection. Network
connection costs based on a unit with capacity of about 0.7 MtCO2 captured/year (Lensink and Schoots, 2021). CO2 purification and compression based on Berghout et al (2015). Lower limit considers that compression equipment is already present (only network connection is needed). Mid range costs are based on Berghout et al. (deflated from 2012 to 2020 EUR based on European HICP index), combined with compression/network costs from Lensink and Schoots 2021. Upper limit based on Danish Energy Agency/Energinet (2021a) considering only investments for CO2 compression & dehydration. Transport and storage equipment is excluded.
9 Investment costs for capture, purification, compression, and liquefaction. Costs based on a unit with capacity of about 0.7 MtCO2 captured/year. Main value based on a new installation, upper limit based on a retrofit at an existing site. Transport and storage equipment is excluded.
10 3% of investment costs for fixed O&M costs. Energy, transport and storage costs are excluded from this value.
11 See p 173, Lensink and Schoots (2021). 125 kWh/tCO2 for compression, 162 kWh/tCO2 for liquefaction. Upper limit based on Berghout et al. (2015), lower limit based on Danish Energy Agency/Energinet (2021a).
12 Capture rate for inherent separation is assumed to be 100%, based on the input gas stream.
PBL – TNO. A MIDDEN report | 52
being incinerated) without capturing the CO2, the entire value chain of the product is not decarbonised. In a fully decarbonised system, such plastics should be recycled after use to avoid any emissions. DOW Chemical is involved in the Steel2Chemicals project, which utilises syngas from blast furnaces at ArcelorMittal in Ghent (Belgium) and TATA Steel in IJmuiden as a feedstock for chemicals. The syngas is presently incinerated, leading to CO2 emissions. Instead, it could be used to produce plastics at DOW Chemical thus reducing emissions at the steel manufacturing plants (Dow Circles, 2019; De Ingenieur, 2018; ISPT, 2019).
5.3 Electrification Electrification of furnaces and boilers has the potential of a large reduction in CO2 emissions, provided that the electricity is produced without fossil fuels. Other electrification measures include electrification of steam-driven turbines and motors, as well as heat pumps. These are not discussed in detail since their implementation requires specific information about the processes which is not available. Steam recompression is discussed in Section 5.1. For electrification of cracking furnaces, DOW requires large quantities of renewable electricity. Currently (2021), authorities are investigating reinforcing the grid connection in and to Zeeuws-Vlaanderen. In particular, routes are being explored for a 380 kV connection between Borssele/Vlissingen and Terneuzen, and realising a 380 kV station in Terneuzen is planned (Ministerie van Economische Zaken en Klimaat, 2021).
5.3.1 Electrification of furnaces Electric furnaces present significant potential to reduce energy related emissions (VNCI, 2018). Electric based processes can use electric currents (resistance heating) or electromagnetic fields (induction and dielectric) to heat materials. Most of the electrical heating methods can be subdivided into direct (inductive/dielectric) and indirect (resistance/arc/infrared) heating technologies. Direct technologies generate heat within the work piece without the need for a heat transfer medium whereas indirect heating takes place outside the heated substance and is conveyed with a heat transfer medium (Schuwer and Schneider, 2013). Electric heating is used in industry for many applications, however it has not been applied yet in large scale for the steam cracking processes. Together with Shell, TNO and Institute for Sustainable Process Technology (ISPT), DOW runs a research program into electric cracking, aiming at a multi-megawatt installation before 2025 (Energeia, 2021). Also, the consortium ‘Cracker of the Future’ (in which SABIC participates) investigates electric cracking (Brightlands, 2020). The Finnish company Coolbrook is presently building an electric cracker as pilot plant at Chemelot, with an estimated naphtha input capacity of 0.5 t/h. The so-called ‘Rotor Dynamic Reactor’ technology promises an ethylene yield of 20% more than a traditional cracker, while reducing 30% energy use (Duurzaam Ondernemen, 2021). The reduction of energy use implies less residual low or medium pressure steam. In order to bring the steam production and consumption at the site back in balance, mechanical vapour recompression or heat pumps can be used to produce the required LP/MP steam instead. Since the technology is still under development, little information on electrical furnaces for steam
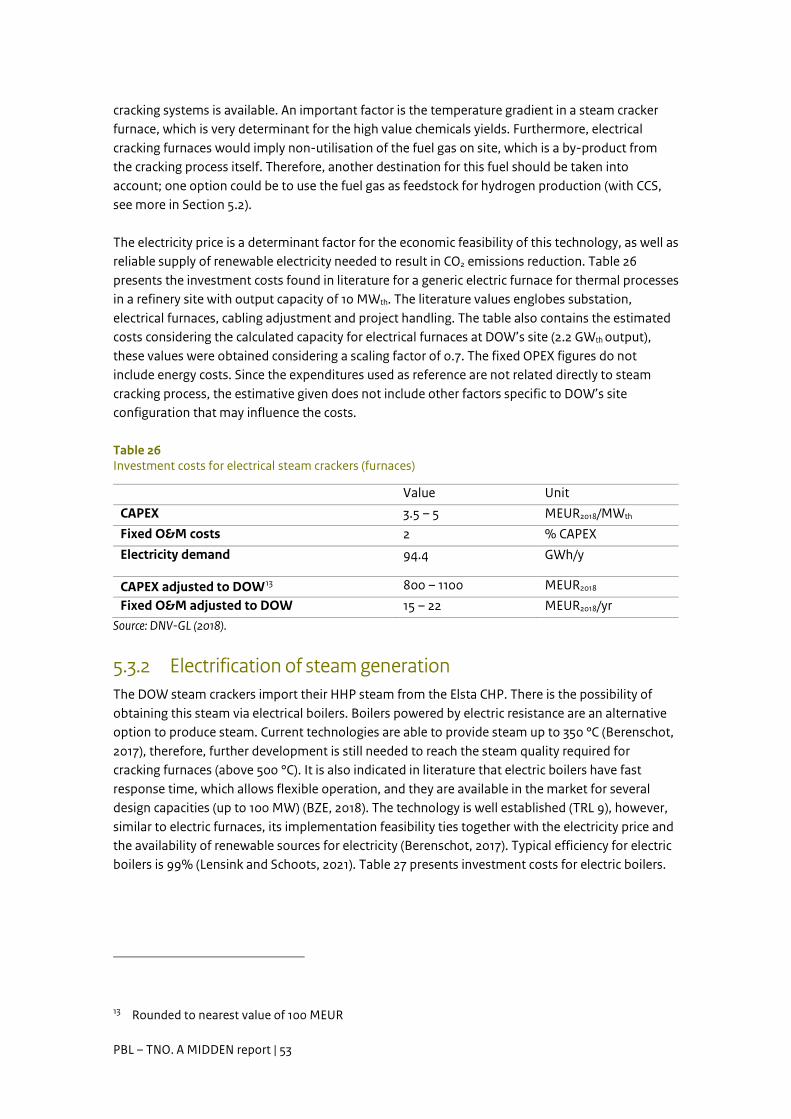
PBL – TNO. A MIDDEN report | 53
cracking systems is available. An important factor is the temperature gradient in a steam cracker furnace, which is very determinant for the high value chemicals yields. Furthermore, electrical cracking furnaces would imply non-utilisation of the fuel gas on site, which is a by-product from the cracking process itself. Therefore, another destination for this fuel should be taken into account; one option could be to use the fuel gas as feedstock for hydrogen production (with CCS, see more in Section 5.2). The electricity price is a determinant factor for the economic feasibility of this technology, as well as reliable supply of renewable electricity needed to result in CO2 emissions reduction. Table 26 presents the investment costs found in literature for a generic electric furnace for thermal processes in a refinery site with output capacity of 10 MWth. The literature values englobes substation, electrical furnaces, cabling adjustment and project handling. The table also contains the estimated costs considering the calculated capacity for electrical furnaces at DOW’s site (2.2 GWth output), these values were obtained considering a scaling factor of 0.7. The fixed OPEX figures do not include energy costs. Since the expenditures used as reference are not related directly to steam cracking process, the estimative given does not include other factors specific to DOW’s site configuration that may influence the costs.
Table 26 Investment costs for electrical steam crackers (furnaces)
Value Unit CAPEX 3.5 – 5 MEUR2018/MWth Fixed O&M costs 2 % CAPEX Electricity demand 94.4 GWh/y
CAPEX adjusted to DOW13 800 – 1100 MEUR2018 Fixed O&M adjusted to DOW 15 – 22 MEUR2018/yr
Source: DNV-GL (2018).
5.3.2 Electrification of steam generation The DOW steam crackers import their HHP steam from the Elsta CHP. There is the possibility of obtaining this steam via electrical boilers. Boilers powered by electric resistance are an alternative option to produce steam. Current technologies are able to provide steam up to 350 °C (Berenschot, 2017), therefore, further development is still needed to reach the steam quality required for cracking furnaces (above 500 °C). It is also indicated in literature that electric boilers have fast response time, which allows flexible operation, and they are available in the market for several design capacities (up to 100 MW) (BZE, 2018). The technology is well established (TRL 9), however, similar to electric furnaces, its implementation feasibility ties together with the electricity price and the availability of renewable sources for electricity (Berenschot, 2017). Typical efficiency for electric boilers is 99% (Lensink and Schoots, 2021). Table 27 presents investment costs for electric boilers.
13 Rounded to nearest value of 100 MEUR
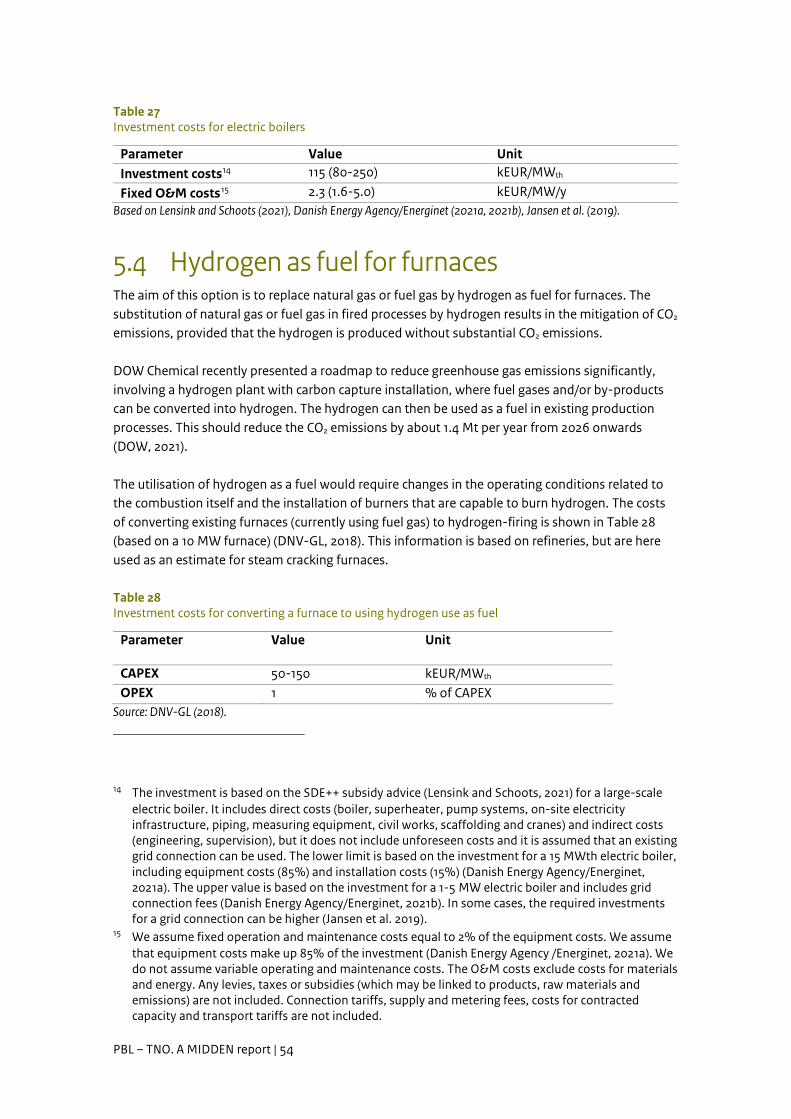
PBL – TNO. A MIDDEN report | 54
Table 27 Investment costs for electric boilers
Parameter Value Unit Investment costs14 115 (80-250) kEUR/MWth
Fixed O&M costs15 2.3 (1.6-5.0) kEUR/MW/y Based on Lensink and Schoots (2021), Danish Energy Agency/Energinet (2021a, 2021b), Jansen et al. (2019).
5.4 Hydrogen as fuel for furnaces The aim of this option is to replace natural gas or fuel gas by hydrogen as fuel for furnaces. The substitution of natural gas or fuel gas in fired processes by hydrogen results in the mitigation of CO2 emissions, provided that the hydrogen is produced without substantial CO2 emissions. DOW Chemical recently presented a roadmap to reduce greenhouse gas emissions significantly, involving a hydrogen plant with carbon capture installation, where fuel gases and/or by-products can be converted into hydrogen. The hydrogen can then be used as a fuel in existing production processes. This should reduce the CO2 emissions by about 1.4 Mt per year from 2026 onwards (DOW, 2021). The utilisation of hydrogen as a fuel would require changes in the operating conditions related to the combustion itself and the installation of burners that are capable to burn hydrogen. The costs of converting existing furnaces (currently using fuel gas) to hydrogen-firing is shown in Table 28 (based on a 10 MW furnace) (DNV-GL, 2018). This information is based on refineries, but are here used as an estimate for steam cracking furnaces.
Table 28 Investment costs for converting a furnace to using hydrogen use as fuel
Parameter Value Unit
CAPEX 50-150 kEUR/MWth
OPEX 1 % of CAPEX Source: DNV-GL (2018).
14 The investment is based on the SDE++ subsidy advice (Lensink and Schoots, 2021) for a large-scale
electric boiler. It includes direct costs (boiler, superheater, pump systems, on-site electricity infrastructure, piping, measuring equipment, civil works, scaffolding and cranes) and indirect costs (engineering, supervision), but it does not include unforeseen costs and it is assumed that an existing grid connection can be used. The lower limit is based on the investment for a 15 MWth electric boiler, including equipment costs (85%) and installation costs (15%) (Danish Energy Agency/Energinet, 2021a). The upper value is based on the investment for a 1-5 MW electric boiler and includes grid connection fees (Danish Energy Agency/Energinet, 2021b). In some cases, the required investments for a grid connection can be higher (Jansen et al. 2019).
15 We assume fixed operation and maintenance costs equal to 2% of the equipment costs. We assume that equipment costs make up 85% of the investment (Danish Energy Agency /Energinet, 2021a). We do not assume variable operating and maintenance costs. The O&M costs exclude costs for materials and energy. Any levies, taxes or subsidies (which may be linked to products, raw materials and emissions) are not included. Connection tariffs, supply and metering fees, costs for contracted capacity and transport tariffs are not included.
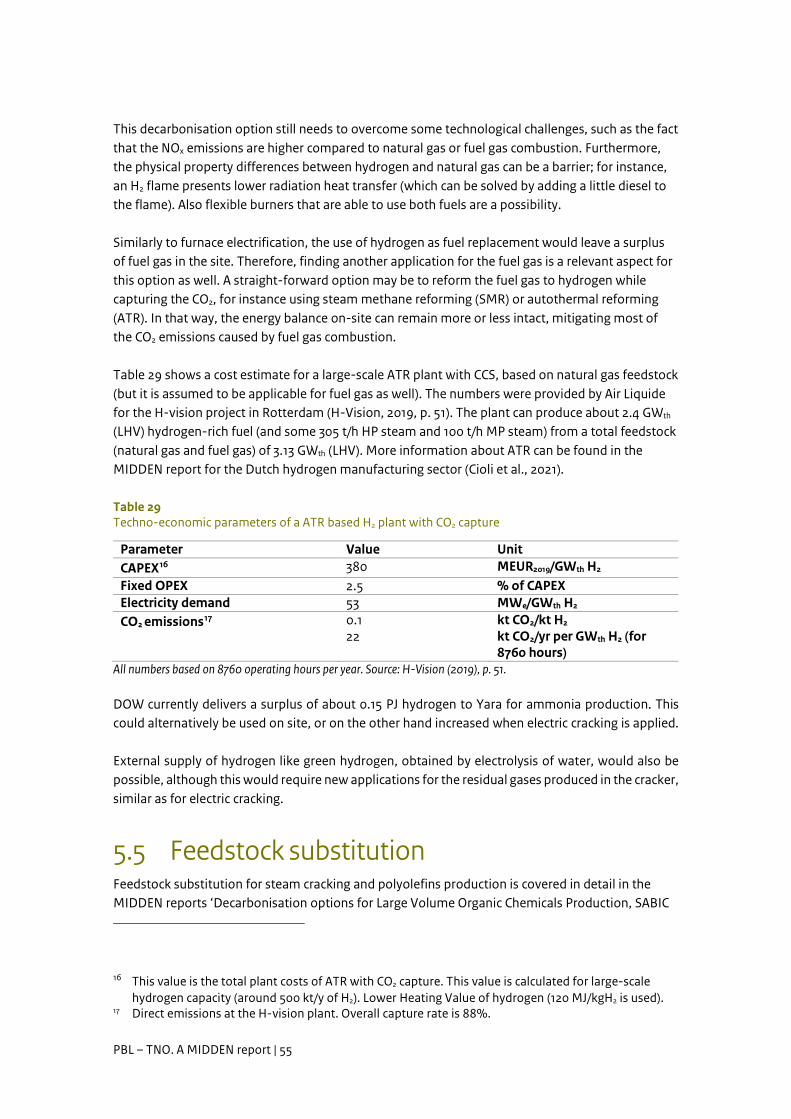
PBL – TNO. A MIDDEN report | 55
This decarbonisation option still needs to overcome some technological challenges, such as the fact that the NOx emissions are higher compared to natural gas or fuel gas combustion. Furthermore, the physical property differences between hydrogen and natural gas can be a barrier; for instance, an H2 flame presents lower radiation heat transfer (which can be solved by adding a little diesel to the flame). Also flexible burners that are able to use both fuels are a possibility. Similarly to furnace electrification, the use of hydrogen as fuel replacement would leave a surplus of fuel gas in the site. Therefore, finding another application for the fuel gas is a relevant aspect for this option as well. A straight-forward option may be to reform the fuel gas to hydrogen while capturing the CO2, for instance using steam methane reforming (SMR) or autothermal reforming (ATR). In that way, the energy balance on-site can remain more or less intact, mitigating most of the CO2 emissions caused by fuel gas combustion. Table 29 shows a cost estimate for a large-scale ATR plant with CCS, based on natural gas feedstock (but it is assumed to be applicable for fuel gas as well). The numbers were provided by Air Liquide for the H-vision project in Rotterdam (H-Vision, 2019, p. 51). The plant can produce about 2.4 GWth (LHV) hydrogen-rich fuel (and some 305 t/h HP steam and 100 t/h MP steam) from a total feedstock (natural gas and fuel gas) of 3.13 GWth (LHV). More information about ATR can be found in the MIDDEN report for the Dutch hydrogen manufacturing sector (Cioli et al., 2021).
Table 29 Techno-economic parameters of a ATR based H2 plant with CO2 capture
Parameter Value Unit CAPEX16 380 MEUR2019/GWth H2 Fixed OPEX 2.5 % of CAPEX Electricity demand 53 MWe/GWth H2
CO2 emissions17 0.1 22
kt CO2/kt H2
kt CO2/yr per GWth H2 (for 8760 hours)
All numbers based on 8760 operating hours per year. Source: H-Vision (2019), p. 51. DOW currently delivers a surplus of about 0.15 PJ hydrogen to Yara for ammonia production. This could alternatively be used on site, or on the other hand increased when electric cracking is applied. External supply of hydrogen like green hydrogen, obtained by electrolysis of water, would also be possible, although this would require new applications for the residual gases produced in the cracker, similar as for electric cracking.
5.5 Feedstock substitution Feedstock substitution for steam cracking and polyolefins production is covered in detail in the MIDDEN reports ‘Decarbonisation options for Large Volume Organic Chemicals Production, SABIC
16 This value is the total plant costs of ATR with CO2 capture. This value is calculated for large-scale
hydrogen capacity (around 500 kt/y of H2). Lower Heating Value of hydrogen (120 MJ/kgH2 is used). 17 Direct emissions at the H-vision plant. Overall capture rate is 88%.
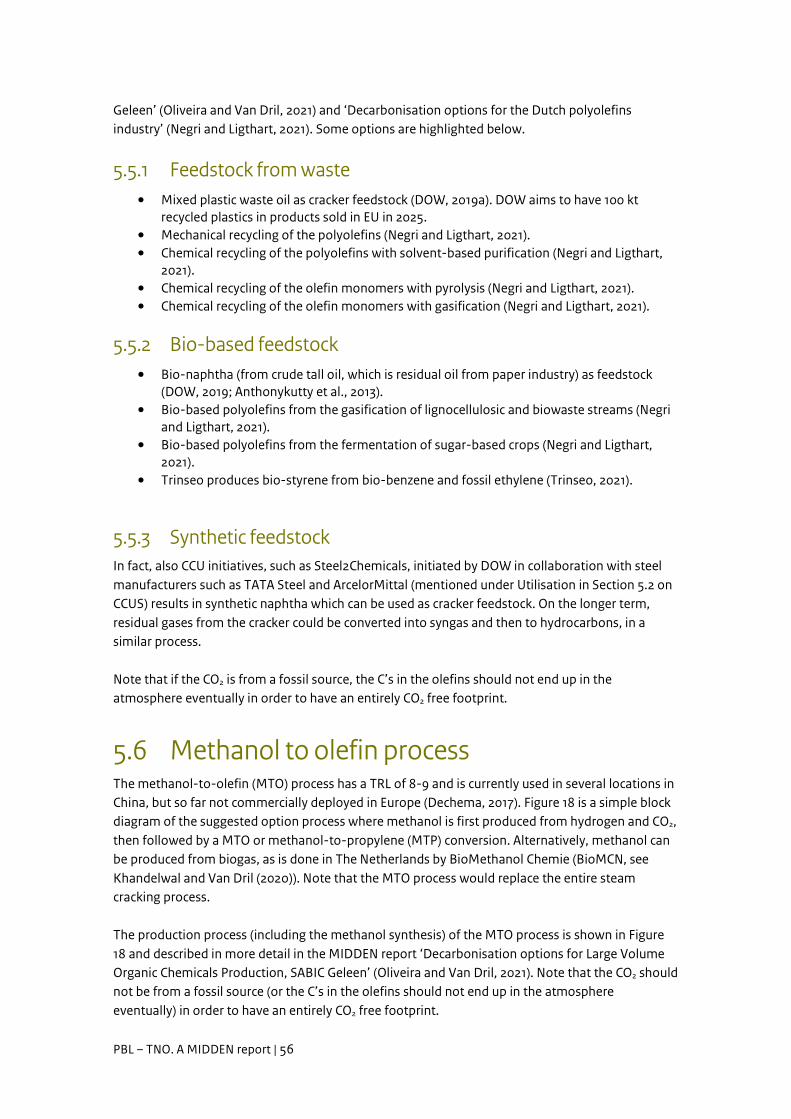
PBL – TNO. A MIDDEN report | 56
Geleen’ (Oliveira and Van Dril, 2021) and ‘Decarbonisation options for the Dutch polyolefins industry’ (Negri and Ligthart, 2021). Some options are highlighted below.
5.5.1 Feedstock from waste • Mixed plastic waste oil as cracker feedstock (DOW, 2019a). DOW aims to have 100 kt
recycled plastics in products sold in EU in 2025. • Mechanical recycling of the polyolefins (Negri and Ligthart, 2021). • Chemical recycling of the polyolefins with solvent-based purification (Negri and Ligthart,
2021). • Chemical recycling of the olefin monomers with pyrolysis (Negri and Ligthart, 2021). • Chemical recycling of the olefin monomers with gasification (Negri and Ligthart, 2021).
5.5.2 Bio-based feedstock • Bio-naphtha (from crude tall oil, which is residual oil from paper industry) as feedstock
(DOW, 2019; Anthonykutty et al., 2013). • Bio-based polyolefins from the gasification of lignocellulosic and biowaste streams (Negri
and Ligthart, 2021). • Bio-based polyolefins from the fermentation of sugar-based crops (Negri and Ligthart,
2021). • Trinseo produces bio-styrene from bio-benzene and fossil ethylene (Trinseo, 2021).
5.5.3 Synthetic feedstock In fact, also CCU initiatives, such as Steel2Chemicals, initiated by DOW in collaboration with steel manufacturers such as TATA Steel and ArcelorMittal (mentioned under Utilisation in Section 5.2 on CCUS) results in synthetic naphtha which can be used as cracker feedstock. On the longer term, residual gases from the cracker could be converted into syngas and then to hydrocarbons, in a similar process. Note that if the CO2 is from a fossil source, the C’s in the olefins should not end up in the atmosphere eventually in order to have an entirely CO2 free footprint.
5.6 Methanol to olefin process The methanol-to-olefin (MTO) process has a TRL of 8-9 and is currently used in several locations in China, but so far not commercially deployed in Europe (Dechema, 2017). Figure 18 is a simple block diagram of the suggested option process where methanol is first produced from hydrogen and CO2, then followed by a MTO or methanol-to-propylene (MTP) conversion. Alternatively, methanol can be produced from biogas, as is done in The Netherlands by BioMethanol Chemie (BioMCN, see Khandelwal and Van Dril (2020)). Note that the MTO process would replace the entire steam cracking process. The production process (including the methanol synthesis) of the MTO process is shown in Figure 18 and described in more detail in the MIDDEN report ‘Decarbonisation options for Large Volume Organic Chemicals Production, SABIC Geleen’ (Oliveira and Van Dril, 2021). Note that the CO2 should not be from a fossil source (or the C’s in the olefins should not end up in the atmosphere eventually) in order to have an entirely CO2 free footprint.
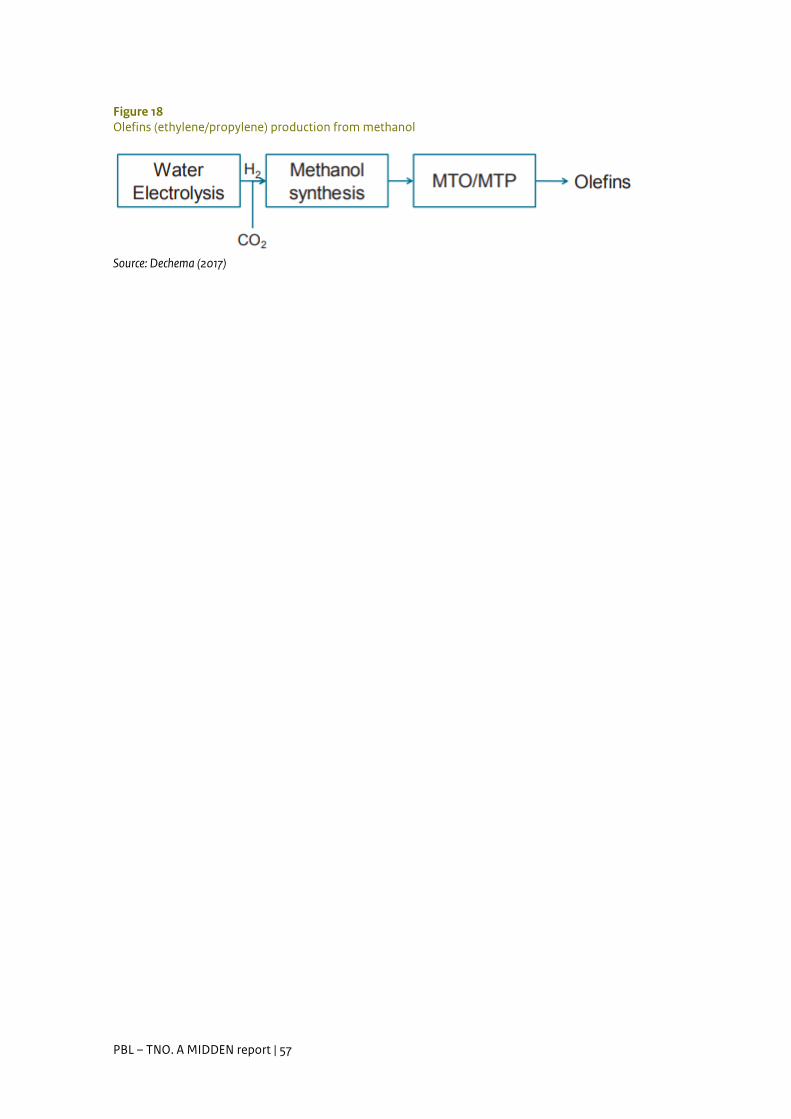
PBL – TNO. A MIDDEN report | 57
Figure 18 Olefins (ethylene/propylene) production from methanol
Source: Dechema (2017)
PBL – TNO. A MIDDEN report | 58
6 Discussion The importance of the products produced by DOW Chemical in Terneuzen is evident, which illustrates the need of decarbonising the site. The decarbonisation strategy is dependent on many factors, such as infrastructure, economics, policies and so on. Some specific observations for DOW Chemical Terneuzen are highlighted below. In terms of energy efficiency, improvements are possible at the site. Steam recompression has the potential of reducing 0.2 Mt CO2 at the site because it allows for recycling steam and thus reducing the amount of new steam generation. However, there will always be a need for producing new steam which is addressed further below.
Steam cracking About 90% of the CO2 emissions at DOW Terneuzen are allocated to the steam cracking, mainly by incinerating fuel gases generated from the cracking itself. As long as steam cracking takes place, the fuel gases should be utilised without emitting CO2. This could happen either by producing hydrogen from it (while capturing and storing (most of) the CO2) or by converting it into products. Since it is presently used as fuel, it is attractive from a site point of view to use the produced hydrogen as fuel instead. This can be done with mainly existing technology and would not require a complete overhaul of the processes. DOW Chemical plans to produce hydrogen from fuel gases and/or by-products while capturing the CO2 (Van Beek, 2021). The hydrogen will then be used as a fuel in existing production processes. At the moment, DOW Chemical does not have access to a (future) CO2 storage location for storing the captured CO2. Both a pipeline to Porthos Rotterdam or transport by ship to Porthos or another future CO2 storage facility (in The Netherlands or abroad) would be a possible solution, provided that the CO2 emission accounting such as EU ETS allow it. Together with Shell, TNO and Institute for Sustainable Process Technology (ISPT), DOW studies electric cracking, which could replace at least one of the gas-fired crackers eventually. In that case, energy from the fuel gases is not required for the cracker any more, such that it may be used as feedstock for hydrogen or other chemicals. Produced hydrogen could also be sold to other users, e.g. for ammonia production at Yara nearby. Electrification of crackers would likely also imply an energy efficiency increase of 30-35%. This means that less residual steam will be available from the crackers and the steam network on the DOW site should be rebalanced, for instance using mechanical vapour recompression applied to low pressure steam. Note that full-scale electric cracking (at present capacity) requires large amounts (several tens of petajoules per year) of base load renewable (or at least CO2-neutral) electricity in order to ensure decarbonised production. A reinforcement to the grid connection is therefore being proposed (Ministerie van Economische Zaken en Klimaat, 2021).
Other facilities Regarding the other facilities (other than steam cracking), decarbonisation options mainly relate to alternatives for steam production. Optimal use and re-use of residual steam of the steam cracking could reduce the need of new steam production. Electric or hydrogen-fired boilers could replace the CHP and gas-fired boilers, while the furnaces can eventually be replaced by electric or hydrogen-fired furnaces. Post-combustion carbon capture and storage of the ELSTA plant could also be a
PBL – TNO. A MIDDEN report | 59
possibility. The roadmap of DOW Terneuzen includes also CO2 capture at the ethylene oxide plant and replacing a number of gas turbines by electrical motor drives, together resulting in a reduction of 0.3 Mt CO2 by 2030 (DOW, 2021).
Feedstock In terms of feedstock, it is expected that mechanical and chemical recycling will get traction in the next decades. However, recycling technologies have limits and losses and some amount of virgin material will likely be needed. Non-fossil alternatives are biobased plastics (by using feedstock from biogenic origin such as tall oil from the pulp industry) and synthetic hydrocarbons (for instance methanol to olefins), based on captured CO2 and hydrogen produced by electrolysis. DOW Chemical is involved in CCU pilot projects such as Steel2Chemicals, utilising syngas from blast furnaces. Depending on the future of the blast furnaces (which may be replaced by other steel manufacturing methods), this presents a potential for use of CO2 which would otherwise be emitted. However, in order to be CO2-neutral in the entire value chain, these plastics should be recycled after use to avoid CO2 emissions.
PBL – TNO. A MIDDEN report | 60
References Antonykutty, J.M., Van Geem, K.M., De Bruycker, R., Linnekoski, J., Laitinen, A., Rasanen, J., Harlin,
A., and Lehtonen, J. (2013). Value Added Hydrocarbons from Distilled Tall Oil via Hydrotreating over a Commercial NiMo Catalyst. Ind. Eng. Chem. Res. 2013, 52, 30, 10114–10125.
Ali, M. & Hadj-Kali, M. (2018). Energy efficiency analysis of styrene production by adiabatic ethylbenzene, Polish Journal of Chemical Technology, 20, 1, 35-46, doi:10.2478/pjct-2018-0006.
American Chemistry Council (2004). Ethylene: Product Stewardship Guidance Manual.
American Chemistry Council (2017). Elements of the Business of Chemistry.
Arno Behr (2017). Styrene production from ethyl benzene, Retrieved July 13, 2017 from http://www.tc.bci.tu- dortmund.de/Downloads/Praktika/tc30_styrene_english.pdf
Beek, A. van (2021). Groene waterstof niet altijd de heilige graal voor verduurzaming. Energeia, 13 December 2021. https://energeia.nl/energeia-artikel/40100023/groene-waterstof-niet-altijd-de-heilige-graal-voor-verduurzaming
Berenschot (2017). Electrification in the Dutch process industry. In-depth study of promising transition pathways and innovation opportunities for electrification in the Dutch process industry.
Berghout, N. et al. (2015). Techno-economic performance and spatial footprint of infrastructure configurations for large scale CO2 capture in industrial zones: A case study for the Rotterdam Botlek area. International Journal of Greenhouse Gas Control 39: 256-284.
Block, T. Gamboa Palacios, S., Van Dril, T. (2020). Decarbonisation options for large volume organic chemical production, Shell Pernis. PBL Netherlands Environmental Assessment Agency and TNO EnergieTransitie.
Boulamanti A., & Moya J.A. (2017). Energy efficiency and GHG emissions: Prospective scenarios for the Chemical and Petrochemical Industry. https://doi.org/10.2760/630308
Brandt et al. (2012). "Rubber, 5. Solution Rubbers" in Ullmann's Encyclopedia of Industrial Chemistry, 2012, Wiley-VCH, Weinheim.
Brightlands (2020). Petrochemical companies form Cracker of the Future Consortium and sign R&D agreement. Accessed via https://www.brightlands.com/brightlands-chemelot-campus/nieuws/petrochemical-companies-form-cracker-future-consortium-and-sign
Business Wire (2011), DOW Announces Sale of Global Polypropylene Business to Braskem for $340 Million | Business Wire.
BZE (2018), Zero Carbon Industry Plan: Electrifying Industry should be attributed to Beyond Zero Emissions.
Cavani, F. and Trifir, F. (1995). Alternative processes for the production of styrene, Elsevier, Applied catalysis A: General 133 (1995) 219-239.
CBS (2021a). Energy balance sheet; supply and consumption, sector. 2021https://opendata.cbs.nl/statline/#/CBS/en/dataset/83989ENG/table?ts=1582715085299
CBS (2021b). Emissions to air on Dutch territory; totals. https://opendata.cbs.nl/statline/#/CBS/en/dataset/37221eng/table
CEFIC (2013). Competitiveness of the EU Chemical Industry, a Key sector in the Refining Value Chain Profile of the European Chemical Industry. Manufacturing Platform Europe.
PBL – TNO. A MIDDEN report | 61
CIEC (2015). CIEC Promoting Science, The Essential Chemical Industry – online, University of York, York, UK, available at https://www.essentialchemicalindustry.org/processes/cracking-isomerisation-and-reforming.html#steam_cracking
Cioli, M., Schure, K.M., Van Dam, D. (2021). Decarbonisation options for the Dutch industrial gases production. PBL Netherlands Environmental Assessment Agency and TNO.
C&EN. (2019). C&EN’s Global Top 50 Chemical Companies. C&EN Global Enterprise, 97(30), 30–35. https://doi.org/10.1021/cen-09730-coverCIE (2015)
Danish Energy Agency/Energinet (2021a). Technology Catalogue: Industrial Process Heat and Carbon Capture.
Danish Energy Agency/Energinet (2021b). Technology Catalogue: Generation of Electricity and District Heating.
Dechema (2017). Low carbon energy and feedstock for the European chemical industry.
De Ingenieur (2018). TATA Steel and DOW to invest in green chemicals. Accessed via https://www.deingenieur.nl/artikel/tata-steel-and-dow-to-invest-in-green-chemicals
DNV-GL (2018). CO2 Reductie Roadmap van de Nederlandse raffinaderijen (for VNPI).
DOW (2010), Product Safety Assessment: Crude Butadiene, accessed 17-8-2021.
DOW (2017). Sustainability report 2017 DOW Terneuzen.
DOW (2018). DOW Industrial Solutions: Solutions for Emulsion Polymerizations. https://www.dow.com/content/dam/dcc/documents/en-us/catalog-selguide/119/119-02458-01-solutions-for-emulsion-polymerizations-selection-guide.pdf?iframe=true
DOW (2019). DOW and UPM partner to produce plastics made with renewable feedstock. https://corporate.dow.com/en-us/news/press-releases/dow-and-upm-partner-to-produce-plastics-made-with-renewable-feedstock.html
DOW (2019a). DOW and Fuenix enter into a partnership for the production of 100% circular plastic. https://corporate.dow.com/en-us/news/press-releases/dow-and-fuenix-enter-into-a-partnership-for-the-production-of-10.html
DOW (2020). Terneuzen - DOW Benelux.
DOW (2021). Dow Benelux outlines roadmap to support Dutch Climate Agreement, achieve CO2 emissions neutrality. Accessed 17 December 2021 via: https://corporate.dow.com/en-us/news/press-releases/dow-benelux-outlines-roadmap-to-support-dutch-climate-agreement-.html
Dow Circles (2019). Steel2Chemical - de aanleiding. https://dowcircles.nl/duurzaamheid/steel-2-chemical/steel2chemical-de-aanleiding
Duurzaam Ondernemen (2021). Coolbrook verduurzaamt de Nederlandse petrochemische industrie met innovatieve pilot. Accessed via https://www.duurzaam-ondernemen.nl/coolbrook-verduurzaamt-de-nederlandse-petrochemische-industrie-met-innovatieve-pilot/
Ecofys (2009). Methodology for the free allocation of emission allowances in the EU ETS post 2012 Sector report for the chemical industry, EU contract Study Contract: 07.0307/2008/515770/ETU/C2. Ecofys project Number: PECSNL082164
EEA (2006). Emission Inventory Guidebook. Processes in Organic Chemical Industries (Bulk Production). https://www.eea.europa.eu/publications/EMEPCORINAIR4/B4515vs1.1.pdf/view
EEA (2021). Industrial Reporting under the Industrial Emissions Directive 2010/75/EU and European Pollutant Release and Transfer Register Regulation (EC) No 166/2006
PBL – TNO. A MIDDEN report | 62
https://www.eea.europa.eu/data-and-maps/data/industrial-reporting-under-the-industrial-3/user-friendly-tables-in-excel-1/industrial-reporting-db-excel-extracts-2/at_download/file
EIPPCB. (2014). Large Volume Organic Chemical Industry - Draft 1 (2014).
ELSTA (2020). ELSTA Cogeneration Power plant Hoek | AES.
Elgas. (2018). Properties of LPG. Retrieved September 6, 2018, from https://www.elgas.com.au/blog/453-the-science-a-properties-of-lpg
Emblem, A. (2012). Plastics properties for packaging materials. In Packaging Technology (pp. 287-309). Woodhead Publishing.
Energeia (2021). Shell en Dow mikken op elektrische kraker in 2025, https://energeia.nl/energeia-artikel/40093814/shell-en-dow-mikken-op-elektrische-kraker-in-2025.
European Commission (2007). Reference Document on Best Available Techniques in the Production of Polymers. https://eippcb.jrc.ec.europa.eu/sites/default/files/2019-11/pol_bref_0807.pdf
Eurostat (2020). Statistics on the production of manufacturing goods. https://ec.europa.eu/eurostat/web/prodcom/data/database
Falcke, H., Holbrook, S., Clenahan, I., Lopez Carretero, A., Sanalan, T., Brinkmann, T., … Delgado Sancho, L. (2017). Best Available Techniques (BAT) Reference Document for the Production of Large Volume Organic Chemicals - Industrial Emissions Directive 2010/75/EU (Integrated Pollution Prevention and Control). https://doi.org/10.2760/77304
Fernández-Dacosta, C., Stojcheva, V., & Ramirez, A. (2018). Closing carbon cycles: Evaluating the performance of multi-product CO2 utilisation and storage configurations in a refinery. Journal of CO2 Utilization, 23, 128-142. https://doi.org/10.1016/j.jcou.2017.11.008
Forte, Maria Madalena de Camargo, da Cunhaa, Fernanda Oliveira Vieira Santos, Joa ˜o Henrique Zimnoch dos, Zaccac, Jorge Jardim (2003). Ethylene and 1-butene copolymerization catalyzed by a Ziegler–Natta/Metallocene hybrid catalyst through a 23 factorial experimental design, Polymer 44, 1377–1384
Fraile, D., Lanoix, J., Maio, P., Rangel, A., & Torres, A. (2015). Overview of the market segmentation for hydrogen across potential customer groups, based on key application areas. Brussels: European Comission / CertifHy project.
Gogoi, R., Utpal Kumar Niyogi, M. Sarwar Alam and Dayal Singh Mehra (2013). Study of Effect of NCO/OH Molar Ratio and Molecular Weight of Polyol on the Physico-Mechanical Properties of Polyurethane Plaster Cast, World Applied Sciences Journal 21 (2): 276-283, 2013, ISSN 1818-4952
Harper, C. (ed.) (2000). Modern Plastics Handbook, ISBN 0-07-026714-6, 2000.
Husebye, J. et al. (2012). Techno economic evaluation of amine-based CO2 capture: Impact of CO2 concentration and steam supply. Energy Procedia 23: 381-390.
Hydrogen Europe. (2019). Hydrogen in Industry. Retrieved from: https://hydrogeneurope.eu/hydrogen-industry
H-Vision (2019). Blue hydrogen as accelerator and pioneer for energy transition in the industry.
ICIS. (2013). Chemical Profile Europe: ethylene oxide. Retrieved from: https://www.icis.com/explore/resources/news/2013/04/13/9658385/chemicalprofile-europe-ethylene-oxide/
ICIS (2018). Plant Status: DOW Chemical to shutdown Terneuzen EO plant Oct-Nov. https://www.icis.com/explore/resources/news/2018/03/15/10202644/plant-status-dow-chemical-to-shutdown-terneuzen-eo-plant-oct-nov/
PBL – TNO. A MIDDEN report | 63
ICIS (2018a) Plant status: Trinseo's Netherlands SAN turnaround begins, expected to end early June. https://www.icis.com/explore/resources/news/2018/05/25/10225052/plant-status-trinseo-s-netherlands-san-turnaround-begins-expected-to-end-early-june
ICIS (2018b). Plant status: Trinseo planning shutdown for Netherlands ABS plant in late May. https://www.icis.com/explore/resources/news/2018/05/14/10221390/plant-status-trinseo-planning-shutdown-for-netherlands-abs-plant-in-late-may
ICIS (2019). Plant status: Trinseo confirms Dutch styrene unit down for 3-4 weeks. https://www.icis.com/explore/resources/news/2019/08/30/10411617/plant-status-trinseo-confirms-dutch-styrene-unit-down-for-3-4-weeks
IEA (2009), Chemical and Petrochemical Sector Potential of best practice technology and other measures for improving energy efficiency. https://iea.blob.core.windows.net/assets/c2d071e4-4142-44f1-8a41-88ece29be439/ChemicalandPetrochemicalSector.pdf
IHS-Markit (2019). Chemical Economics Handbook. Retrieved from https://ihsmarkit.com/products/hydrogen-chemical-economics-handbook.html
IHS-Markit (2020). Benzene: Chemical Economics Handbook. Retrieved from https://ihsmarkit.com/products/benzene-chemical-economics-handbook.html
IHS-Markit (2021). Cumene: Chemical Economics Handbook. Retrieved from https://ihsmarkit.com/products/cumene-chemical-economics-handbook.html
IISRP (2011). International Institute of Synthetic rubber Producers, Inc. (IISRP) article on S-SBR (retrieved 2011-12-02)
ISPT (2019). ArcelorMittal en DOW samen op weg om koolstofkringloop te sluiten. Accessed via https://ispt.eu/media/Article-NPT-Magazine-september-2019-Steel2Chemicals.pdf
Jansen, N., de Smidt, R.P., Hermelink, M. (2019). Eindverslag Haalbaarheidsstudie Elektrificatie bestaande gasketels, TNO.
Khandelwal, M. and Van Dril, T. (2020). Decarbonisation options for the Dutch biofuels industry. PBL Netherlands Environmental Assessment Agency and TNO.
Kuramochi, T., Ramirez, A., Turkenburg, W., & Faaij, A. (2012). Comparative assessment of CO2 capture technologies for carbon-intensive industrial processes. Progress in Energy and Combustion Science, 38(1), 87-112.
Lensink, S. and Schoots, K. (2021), Eindadvies basisbedragen SDE++ 2021. PBL Netherlands Environmental Assessment Agency, The Hague.
Mallard Creek Polymers (2016). The Difference between Styrene-Butadiene Rubber and Styrene-Butadiene Latex. https://www.mcpolymers.com/library/the-difference-between-styrene-butadiene-rubber-and-styrene-butadiene-latex
Marcos, J.M.M. (2016), Modelling of naphtha cracking for olefins production, Tecnico Liboa, Lisbon, thesis department chemical engineering.
Markewitz, P., Bongartz, R. (2015). Carbon Capture Technologies. In W. Kuckshinrichs, & J. Hake, Carbon Capture, Storage and Use. Springer
Market Study Synthetic Rubber, (2013). Market Study Synthetic Rubber, published by Ceresana, June 2013
Marx, P. (2019). Elke koolstofbron een kans. Sciencelink C2W Mensen en Moleculen. https://www.sciencelink.net/nieuws-and-verdieping/elke-koolstofbron-een-kans/1020.article
PBL – TNO. A MIDDEN report | 64
McKeen, L.W. (2019). The Effect of UV Light and Weather on Plastics and Elastomers (4th ed.). Elsevier Inc.
Ministerie van Economische Zaken en Klimaat (2021). MIEK Overzicht 2021 - Meerjarenprogramma Infrastructuur Energie en Klimaat. https://www.tweedekamer.nl/kamerstukken/detail?id=2021D46472&did=2021D46472
Morris, J.D., Symonds, R.A., Ballard, F.L., Banti, A. (1998). Combustion Aspects of Application of Hydrogen and Natural Gas Fuel Mixtures to MS9001E DLN-1 Gas Turbines at Elsta Plant, Terneuzen, The Netherlands. ASME Proceedings Series 98-GT-3569, V003T05A033. https://manufacturingscience.asmedigitalcollection.asme.org/GT/proceedings/GT1998/78644/V003T05A033/246968
myLPG. (2018). Propane/butane mixture in countries around Europe. Retrieved August 5, 2018, from https://www.mylpg.eu/useful/lpg-mixture
MYbusinessmedia Holding B.V., (2021), https://www.kunststofenrubber.nl/nieuws/id6250-richtprijzen-kunststoffen-week-1.html
National Center for Biotechnology Information (2020). PubChem Compound Summary for CID 1030, Propylene glycol. Retrieved from https://pubchem.ncbi.nlm.nih.gov/compound/Benzene
National Center for Biotechnology Information (2020a). PubChem Compound Summary for CID 1030, Propylene glycol. Retrieved from https://pubchem.ncbi.nlm.nih.gov/compound/Styrene
NEa (2021). Emissiecijfers 2013-2020. Dutch Emission Authority.
Neelis, M., Patel, M., Blok, K., Haije, W., & Bach, P. (2007). Approximation of theoretical energy-saving potentials for the petrochemical industry using energy balances for 68 key processes. Energy. https://doi.org/10.1016/j.energy.2006.08.005
Negri, A. & Ligthart, T. (2020), Decarbonisation options for the Dutch polyolefins industry. PBL Netherlands Environmental Assessment Agency and TNO EnergieTransitie, The Hague.
Obrecht, W., Jean-Pierre Lambert, Michael Happ, Christiane Oppenheimer-Stix, John Dunn, Ralf Krüger (2012). "Rubber, 4. Emulsion Rubber". Ullmann's Encyclopedia of Industrial Chemistry. Weinheim: Wiley-VCH. doi:10.1002/14356007.o23_o01.]
Oliveira, C. and Schure, K.M. (2020). Decarbonisation options for the Dutch refinery sector. PBL Netherlands Environmental Assessment Agency and TNO Energy Transition, The Hague
Oliveira, C. and Van Dril, T. (2021). Decarbonisation options for LVOC production at SABIC Geleen. Netherlands Environmental Assessment Agency and TNO Energy Transition, The Hague
Omnexus (2020). Polyethylene (PE) Plastic: Properties, Uses & Application. https://omnexus.specialchem.com/selection-guide/polyethylene-plastic
Penpet (2021). News Ethylene July 2021. Accessed 11-08-2021, https://www.penpet.com/news/news-ethylene-july-2021.html
PlasticsEurope (2014). Ecoprofiles and Environmental Product Declarations of the European Plastics Manufacturers (HDPE, LDPE, LLDPE). Accessed via https://www.plasticseurope.org/en/resources/eco-profiles
PlasticsEurope (2015). Eco-profiles and Environmental Product Declarations of the European Plastics Manufacturers Styrene Acrylonitrile (SAN) and Acrylonitrile Butadiene Styrene (ABS). Accessed via https://www.plasticseurope.org/en/resources/eco-profiles
PlasticsInsight (n.d.). ABS Plastic (ABS): Production, Market, Price and its Properties. https://www.plasticsinsight.com/resin-intelligence/resin-prices/abs-plastic/
PBL – TNO. A MIDDEN report | 65
PlasticsInsight (n.d.-a). Polyurethane Production, Pricing and Market Demand https://www.plasticsinsight.com/resin-intelligence/resin-prices/polyurethane/
Portnews (2020). Breakthrough in steam recycling. https://issuu.com/marcogeels/docs/portnews_april_2020_lr/s/10477299
Provincie Zeeland (2007). Beschikking van de Gedeputeerde Staten van Zeeland. Accessed 23 December 2021 via: https://www.zeeland.nl/sites/default/files/digitaalarchief/RMW0710341.pdf
Provincie Zeeland (2008). Beschikking van de Gedeputeerde Staten van Zeeland. Accessed 18 June 2021 via: https://www.zeeland.nl/digitaalarchief/08015816
PZC (2020), Dow schrapt 170 banen in Terneuzen: complete fabriek op park sluit de deuren. Accessed 17 June 2021 via: https://www.pzc.nl/zeeuws-vlaanderen/dow-schrapt-170-banen-in-terneuzen-complete-fabriek-op-park-sluit-de-deuren~a6df0976/
Ren, T., Patel, M., & Blok, K. (2006). Olefins from conventional and heavy feedstocks: Energy use in steam cracking and alternative processes. Energy. https://doi.org/10.1016/j.energy.2005.04.001
RUD Zeeland (2016). Omgevingsvergunning van Gedeputeerde Staten van Zeeland Kenmerk: W-AOV150360/00107941. http://www.rud-zeeland.nl/Producten_en_diensten/Verleende_vergunningen/Verleende_vergunningen_en_meldingen/D/Dow_Benelux_B_V/Vergunningen_en_meldingen/Veranderingsvergunning_uitgebreid_22_april_2016.pdf
RUD Zeeland (2018). Omgevingsvergunning van Gedeputeerde Staten van Zeeland Kenmerk: W-AOV170656/00180885. http://www.rud-zeeland.nl/Producten_en_diensten/Verleende_vergunningen/Verleende_vergunningen_en_meldingen/D/Dow_Benelux_B_V/Vergunningen_en_meldingen/Veranderingsvergunning_6_juli_2018.pdf
RUD Zeeland (2019). Omgevingsvergunning van Gedeputeerde Staten van Zeeland. Kenmerk: W-AOV180273/00194200. https://www.rud-zeeland.nl/Producten_en_diensten/Verleende_vergunningen/Verleende_vergunningen_en_meldingen/D/Dow_Benelux_B_V/Vergunningen_en_meldingen/Veranderingsvergunning_30_april_2019.pdf
Sanfilippo et.al., (2005), Domenico Sanfilippo, Ivano Miracca, Marco Di Girolamo, engineering alkanes to olefins and higher value chemicals; The technological world of olefins, building blocks of the current Industrial Chemistry, Springer in E.G. Derouane et al. (eds.), Sustainable Strategies for the Upgrading of Natural Gas: Fundamentals, Challenges, and Opportunities, pp 217–247
Satterthwaite, K. (2017). Plastics Based on Styrene. In Brydson's Plastics Materials (pp. 311-328). Butterworth-Heinemann.
Saygın, D., Patel, M. K., Tam, C., & Gıelen, D. J. (2009). Chemical and Petrochemical Sector: Potential of best practice technology and other measures for improving energy efficiency, IEA Information Paper.
Shell (2019). Shell.com. Retrieved from: https://www.shell.com/businesscustomers/chemicals/our-products/polyols.html
Speight, J. (2015). Chapther 1 - Occurence of Crude Oil and Natural Gas. Subsea and Deepwater Oil and Gas Science and Technology, p. 1-43.
PBL – TNO. A MIDDEN report | 66
Statista (2021). Leading polyether polyol producers worldwide in 2016, by production capacity. https://www.statista.com/statistics/747099/production-capacity-of-the-leading-polyether-polyol-producers/
Tarafder, A., G.P. Rangaiah, A. K. Ray (2005). Multiobjective optimization of an industrial styrene monomer manufacturing process, Chemical Engineering Science, 60 (2005) 347 – 363
Tamsilian, Y., A. N. Ebrahimi, Ramazani S.A. H. Abdollahzadeh (2012). Modeling and sensitivity analysis of styrene monomer production process and investigation of catalyst behavior, Computers and Chemical Engineering, 40 (2012) 1-11
Tebodin (2017). Veiligheidsrapport – Gesterde delen Lyondell Chemie Nederland B.V. locatie
Maasvlakte Deel 0 en 1.
The Weekly Pellet (2016). All about ABS. https://weeklypellet.com/2016/11/07/all-about-abs/
Thyssen-Krupp. (2014). World Market Leader in Aromatics Extraction
Towfighi, J., Heinz Zimmermann, Ramin Karimzadeh, and Mohammad M. Akbarnejad (2002). Steam Cracking of Naphtha in Packed Bed Reactors, Ind. Eng. Chem. Res. 2002, 41, 1419-1424
Topsector Energie (n.d.). Stoomrecompressie voor de reductie van energiekosten en co2-uitstoot in de Nederlandse procesindustrie. Accessed via https://projecten.topsectorenergie.nl/projecten/stoomrecompressie-voor-reductie-van-energiekosten-en-co2-uitstoot-in-de-nederlandse-procesindustrie-27406
Townsend Solutions. (2017). Polyethylene Catalyst and Process Technology Tutorial.
Trinseo (2020). TA 2020 EBSM. https://cdcsupport.nl/wp-content/uploads/2020/01/Engels-TA-Instructie-Trinseo-2020.01.29.pdf
Trinseo (2021). Trinseo receives mass balance certifications for its styrene. https://www.trinseo.com/News-And-Events/Trinseo-News/2021/January/Trinseo-Receives-Mass-Balance-Certification-for-its-Styrene
Ullmann, F. (2002). ULLMANN’S Encyclopedia of Industrial Chemistry (6th ed.). Wiley‐VCH Verlag GmbH & Co. KGaA.
VNCI (n.d.). Cumeenfabriek Olin in Terneuzen onmisbaar in epoxyketen. Retrieved via https://www.vnci.nl/chemie-magazine/actueel/artikel?newsitemid=5282267136&title=cumeenfabriek-olin-in-terneuzen-onmisbaar-in-epoxyketen.
VNCI (2018), Chemistry for Climate: Acting on the need for speed. Roadmap for the Dutch Chemical Industry towards 2050.
Wesseling, B., & Deng, Y. (2009). Sectoral Emission Reduction Potentials and Economic
Costs for Climate Change (SERPEC-CC).
Wong, L., and Van Dril, A.W.N. (2020), Decarbonisation options for large volume organic chemicals production, Shell Moerdijk. PBL Netherlands Environmental Assessment Agency and TNO EnergieTransitie, The Hague.
Wu, M. M. (2000). Acrylonitrile Polymers, Survey and Styrene‐Acrylonitrile (SAN). Kirk‐Othmer Encyclopedia of Chemical Technology.
Youknowstyrene (2021). https://youknowstyrene.org/what-are-the-uses-and-benefits-of-styrene/. Accessed 16-7-2021
Zimmermann, H., & Walzl, R. (2009). Ethylene. In Ullmann’s Encyclopedia of Industrial Chemistry. https://doi.org/10.1002/14356007.a10_045.pub3