Debitage Analysis of Carlin Malouf's CO collection
18
DEBITAGE ANALYSIS University of Montana Anty 455 Artifact Analysis Final Project
Transcript of Debitage Analysis of Carlin Malouf's CO collection

DEBITAGE ANALYSIS
University of Montana
Anty 455 Artifact Analysis Final Project
Elizabeth Rush 5/9/14
DEBITAGE ANALYSIS
INTRODUCTION
Debitage analysis is an important way to gain a better
understanding of the lithic processing and use of different
areas in an archaeological site. The measurements of
different attributes on lithic debitage can provide
information on the type of stone tool manufacturing that
took place and provide insight into what the site was used
for. The goal of this debitage analysis was to answer the
question of whether or not similar lithic processing was
going on at two separate areas of site 13 that Carlin Malouf
discovered during a pipeline survey in Colorado in the
1950’s. The area Malouf surveyed was labeled as site 13,
and was near the remains of a pit house.
2
This debitage analysis was modeled after Sullivan and
Rozen’s “interpretation free” technique, meaning the
measurements would be taken without noting which specific
method of production was used, or where in the reduction
process each flake was created. Their “interpretation
free” method of debitage analysis is usually done by
creating a hierarchical key using different, specific
attributes to understand the types of flakes present in an
assemblage with the goal of creating a scientifically
replicable study (Sullivan and Rozen 1985). This debitage
analysis, however, used the attributes Sullivan and Rozen
suggested as means of comparing the two groups from site 13.
The Sullivan and Rozen attributes were used in the hopes of
analyzing if the two groups from site 13 had the same type
of flakes. Other appropriate attributes were also used to
examine similarities or differences between the two groups.
This debitage analysis also used analytical techniques
described by William Andrefsky, in regards to where on the
3

flake measurements of particular attributes were taken, and
in doing an aggregate analysis of each piece of debitage’s
size.
The attributes that were selected and measured for each
group were flake size, flake weight, type of raw material,
whether or not the interior of the flake was discernible,
platform thickness and platform width, bulb of percussion
thickness, the presence of ripple marks on the flakes, and
the type of termination present on each flake.
Once all the attributes had been measured for both
groups out of site 13, the averages of the different
attributes were compared between the two groups, as well as
other non-numerical attributes. In comparing the two
groups, it appeared that there was similar stone tool
production happening at the two separate areas of site 13.
MATERIALS &
METHODS
4

The first materials used for the analysis were Malouf’s
own records. The location of site 13 and site 14, which
were noted as being very similar sites, were drawn showing
their positions in the field. Site 13 is shown to be on
either side of the pipeline being surveyed. In Malouf’s
notes he said site 13 and 14 are very similar, that he
found similar flakes and the sites are geographically
close. The main materials used for the analysis were the
two groups of debitage found at separate areas of site 13.
The first group, group A, had a total of 11 pieces of
debitage. The second group, group B had a total of 46
pieces of debitage.
5

Figure 1. Malouf’s Map of Site 13
The two groups of debitage were arranged on two
separate trays. The flakes were arranged by size and
appearance of raw material. Each lithic flake was
examined, and each attribute, if present was measured. The
flakes were measured for size using methods similar to an
aggregate analysis. Each flake was placed on a sheet of
paper with boxes of different sizes to recreate nested
screens, with the size in millimeters of each square. Each
6
flake was also weighed individually on a digital scale in
grams. The platform of each flake was measured by
thickness and width due to the advice from Andrefsky’s
Lithics: Macroscopic Approaches to Analysis. In his publication,
Andrefsky stated it was difficult to recreate a measurement
for the platform due to different analysts measuring
different sides, so the platform was measured by the width
and the thickness, to make the measurements as accurate as
possible. The bulb of percussion was measured on each
flake at the maximum thickness of the bulb of percussion
(Andrefsky 1998). The lithics were examined closely to see
if the interior surface was visible. The interior surface
is indicated by marks that represent an applied force, such
as ripple marks (Sullivan and Rozen 1985). The lithics
were examined using a magnifying glass to identify the type
of raw material each flake was sourced from. The
magnifying glass made the crystalline structure of the
quartzite material more obvious, and aided in defining the
7
type of raw material each flake was made of. The two
groups were examined to identify the types of terminations
present, and if the margins were intact or indicate they’ve
been broken. A margin is considered intact of it has a
feather or hinge termination present (Crabtree 1982).
Once all the flakes had been examined and attributes
(if present) recorded for each group, the numbers were
analyzed and compared. The averages for each numerical
attribute were taken for each group for the numerical
comparison. The attributes that were analyzed
categorically were recorded for each group and compared.
For example, the presence of ripple marks was recorded on a
yes or no basis. The numbers of yes occurrences and
numbers of no occurrences were recorded for each categorical
attribute. A pivot table was created in excel to show the
average flake size and weight for each group to aid in
comparison. A T Test was done in excel to the attribute of
8
flake weight to statistically analyze the difference between
the groups.
The purpose of recording the similarities or
differences between the averages of each attribute for each
group was to better understand the tangible similarities
between the lithic processing that took place at the two
locations in site 13. If the averages of the numerical
attributes were similar for both assemblages, then most
likely there was similar processing happening at both
locations.
RESULTS
The results of the attribute comparison were
interesting. The pivot tables of the flake’s size and
weight attributes show that group A had two lithics that
were much larger and heavier that skewed the data. The
large and heavy lithics were determined to be a partial core
and a possible tool. The possible partial core was made of
9
quartzite and had many different negatives of where larger
flakes had been taken off from many different sides. The
possible tool was made of quartzite and had hinge
terminations, which could indicate the lithic wasn’t hit in
the correct area with the right amount of force in the
knapping process, but appeared to have been reworked on one
of the edges, as to still make use of the large quartzite
material (Crabtree 1982).
The pivot table also showed that, although group A had
some larger and heavier pieces, the average size for the
majority of the flakes was similar to that of group B.
Flake weight however, seemed to be more varied. Group B
had much smaller weights than Group A. This could speak to
the nature of the reduction happening at group B. More
smaller, thinner flakes with no platform could indicate
bifacial thinning was happening more with Group B (Andrefsky
2001).
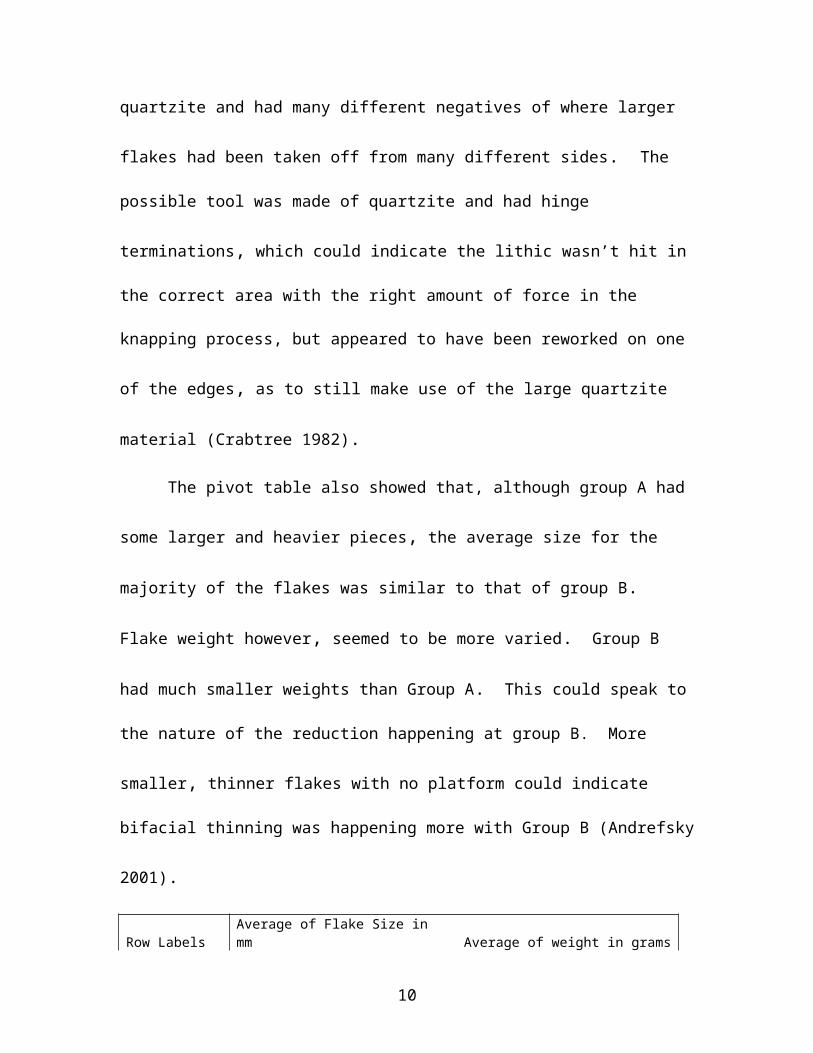
Row LabelsAverage of Flake Size in mm Average of weight in grams
10

Group13A1 70 166.3Group13A10 45 22.2Group13A11 35 6.8Group13A2 60 31.8Group13A3 60 90.8Group13A4 25 2.9Group13A5 40 15.8Group13A6 40 11.5Group13A7 40 5.6Group13A8 30 4.8Group13A9 30 2.3Grand Total 43.18181818 32.8Figure 2. Pivot Table of Group A
Row LabelsAverage of Flake Size in mm Average of weight in grams
Group13B1 50 25Group13B10 30 3.1Group13B11 25 2.8Group13B12 30 2.5Group13B13 30 2.2Group13B14 30 2.7Group13B15 45 7.6Group13B16 35 5.1Group13B17 35 6.7Group13B18 40 6.2Group13B19 30 3.9Group13B2 45 13.4Group13B20 25 2.2Group13B21 25 1.8Group13B22 25 1.6Group13B23 25 2.4Group13B24 30 4.9Group13B25 25 1.9Group13B26 30 2.6Group13B27 20 0.7Group13B28 25 2.4Group13B29 30 2.9Group13B3 35 7.1Group13B30 35 6.9Group13B31 20 0.6Group13B32 30 2.6Group13B33 25 1.8Group13B34 25 1.1Group13B35 20 2.1Group13B36 30 2.2
11
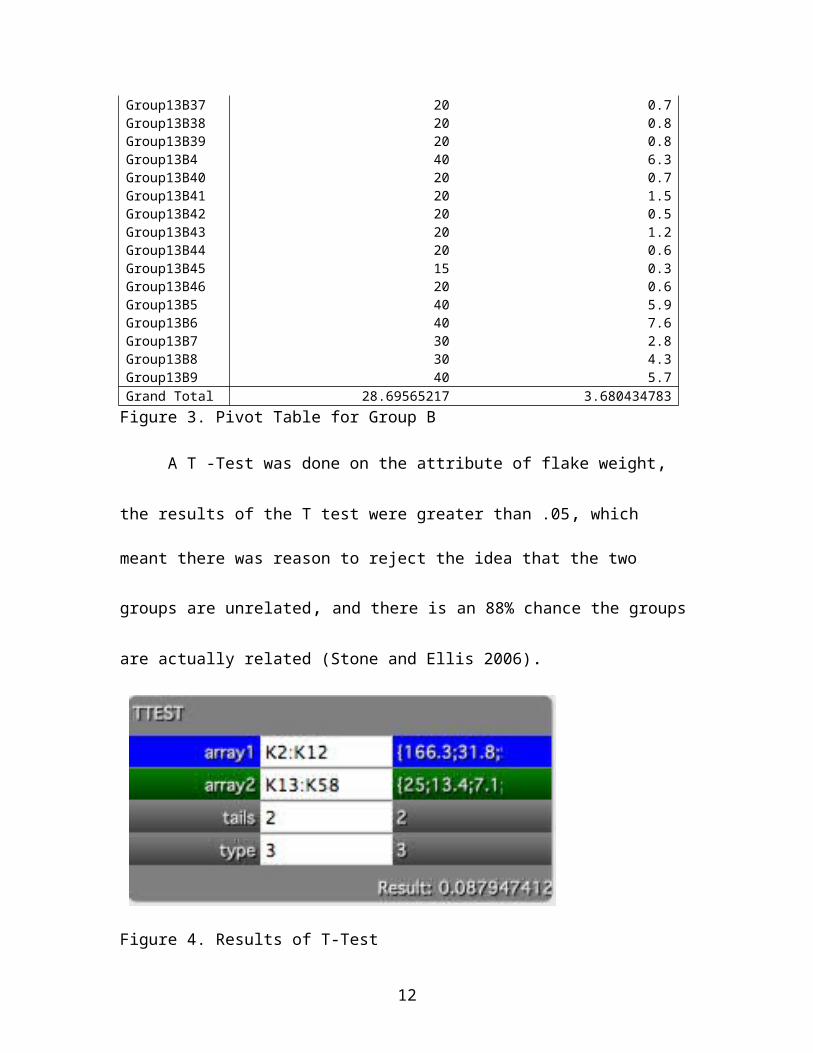
Group13B37 20 0.7Group13B38 20 0.8Group13B39 20 0.8Group13B4 40 6.3Group13B40 20 0.7Group13B41 20 1.5Group13B42 20 0.5Group13B43 20 1.2Group13B44 20 0.6Group13B45 15 0.3Group13B46 20 0.6Group13B5 40 5.9Group13B6 40 7.6Group13B7 30 2.8Group13B8 30 4.3Group13B9 40 5.7Grand Total 28.69565217 3.680434783Figure 3. Pivot Table for Group B
A T -Test was done on the attribute of flake weight,
the results of the T test were greater than .05, which
meant there was reason to reject the idea that the two
groups are unrelated, and there is an 88% chance the groups
are actually related (Stone and Ellis 2006).
Figure 4. Results of T-Test
12

Categorical attributes were also compared between the
two groups. The categorical data was skewed because of the
difference in size between the two groups. When analyzing
if the interior was discernible the results showed that for
both groups the interior was discernible more often than
not. Similar results occurred in the attribute of the
presence of ripple marks. There were no ripple marks
present for the majority of artifacts in both assemblages
than were present.
Interior Discernible NO YESGroup A 4 7Group B 9 37Figure 5. Interior Discernible
Presence of Ripple Marks
NO YES
Group A 7 4Group B 39 7Figure 6. Presence of Ripple Marks
The results of the analysis of the type of terminations
present showed that for both groups there were mostly
feathered and what could be considered broken margins.
13
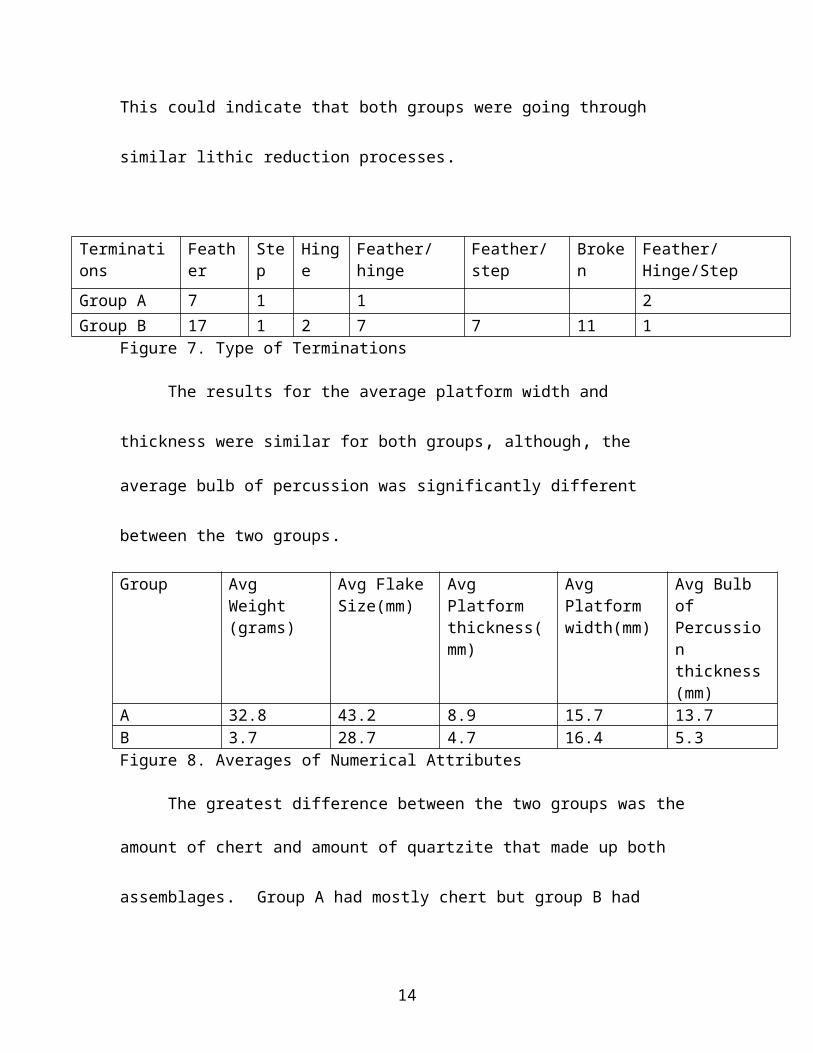
This could indicate that both groups were going through
similar lithic reduction processes.
Terminations
Feather
Step
Hinge
Feather/hinge
Feather/step
Broken
Feather/Hinge/Step
Group A 7 1 1 2Group B 17 1 2 7 7 11 1
Figure 7. Type of Terminations
The results for the average platform width and
thickness were similar for both groups, although, the
average bulb of percussion was significantly different
between the two groups.
Group Avg Weight (grams)
Avg FlakeSize(mm)
Avg Platform thickness(mm)
Avg Platform width(mm)
Avg Bulb of Percussion thickness(mm)
A 32.8 43.2 8.9 15.7 13.7B 3.7 28.7 4.7 16.4 5.3Figure 8. Averages of Numerical Attributes
The greatest difference between the two groups was the
amount of chert and amount of quartzite that made up both
assemblages. Group A had mostly chert but group B had
14
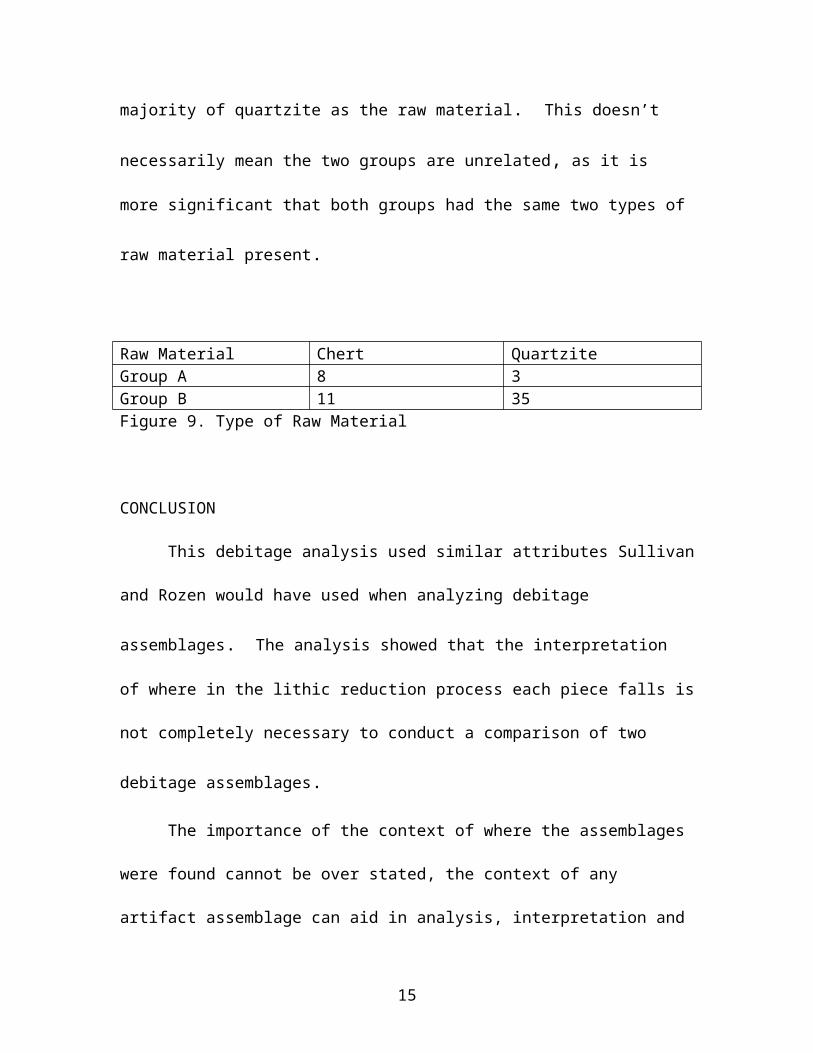
majority of quartzite as the raw material. This doesn’t
necessarily mean the two groups are unrelated, as it is
more significant that both groups had the same two types of
raw material present.
Raw Material Chert QuartziteGroup A 8 3Group B 11 35Figure 9. Type of Raw Material
CONCLUSION
This debitage analysis used similar attributes Sullivan
and Rozen would have used when analyzing debitage
assemblages. The analysis showed that the interpretation
of where in the lithic reduction process each piece falls is
not completely necessary to conduct a comparison of two
debitage assemblages.
The importance of the context of where the assemblages
were found cannot be over stated, the context of any
artifact assemblage can aid in analysis, interpretation and
15
understanding of the site. Malouf’s records of the site
proved very useful in better understanding the possible
relationship between the two groups. The use of
statistical analysis on groups of debitage is a helpful and
appropriate way to scientifically understand the
similarities between two assemblages. Most importantly,
this analysis did not rely on human interpretation, making
it easier to replicate and the results scientifically and
mathematically justified. The results of this analysis
showed there are significant similarities between the
assemblages, and that the two groups of debitage were
probably created using similar processing techniques by the
same or related groups of people.
REFERENCES
Andrefsky, William, Jr.1998 Lithics: Macroscopic Approaches to Analysis. Cambridge Manuals in Archaeology, Cambridge.
16

Andrefsky, William, Jr.2001, Lithic Debitage: Context, Form, Meaning. University of Utah Press, Salt Lake City.
Crabtree, Don1982 An Introduction to Flintworking. Occasional Papers of the Idaho Museum of Natural History No. 28.
Stone, David, and Jon Ellis. "Evaluation of Means for small samples - The t-test.". http://www.chem.utoronto.ca/coursenotes/analsci/StatsTutorial/ttest.html (accessed April 30, 2014).
Sullivan, Alan P. III, and Kenneth C. Rozen 1985 Debitage Analysis and Archaeological Interpretation. American Antiquity 50(4): 755-779
17

18