Death and decay at the dawn of the city
234
Death and decay Death and decay at the dawn of the city at the dawn of the city Interpretation of human bone deposits at Tell Majnuna Areas MTW, EM and EMS Arkadiusz Sołtysiak Arkadiusz Sołtysiak Department of Bioarchaeology Institute of Archaeology University of Warsaw with Preface by Augusta McMahon Augusta McMahon Tell Brak Field Director Institute of Archaeology University of Warsaw 2010
-
Upload
khangminh22 -
Category
Documents
-
view
1 -
download
0
Transcript of Death and decay at the dawn of the city

Death and decayDeath and decayat the dawn of the cityat the dawn of the city
Interpretation of human bone depositsat Tell Majnuna
Areas MTW, EM and EMS
Arkadiusz SołtysiakArkadiusz SołtysiakDepartment of Bioarchaeology
Institute of ArchaeologyUniversity of Warsaw
with Preface byAugusta McMahonAugusta McMahon
Tell Brak Field Director
Institute of ArchaeologyUniversity of Warsaw
2010

Published by the Institute of Archaeology, University of Warsawul. Krakowskie Przedmiescie 26/28, 00-921 Warszawa, Polandhttp://www.archeo.uw.edu.pl/
Cover design: Barbara Sołtysiak
Layout: Barbara Sołtysiak
© Arkadiusz Sołtysiak 2010
ISBN 978-83-61376-40-8
Printed in Poland
´

ContentsPreface (by Augusta McMahon) ............................................................................................v
Introduction ...................................................................................................................... 1
Part One: Analysis ............................................................................................................. 51. Excavations ................................................................................................................... 7
1.1. Rescue operation (2006) ........................................................................................ 81.2. Area MTW (2007, 2008) .................................................................................... 131.3. Area EM (2007, 2008) ........................................................................................ 151.4. Area EMS (2007) ................................................................................................ 171.5. Summary of data ................................................................................................. 19
2. Diagenesis ................................................................................................................... 202.1. Physical and chemical factors ............................................................................... 202.2. Plants and animals ............................................................................................... 242.3. Human factors ..................................................................................................... 26
3. Biostratinomy and deposition ...................................................................................... 293.1. Tooth and beak marks .......................................................................................... 303.2. Preservation pattern ............................................................................................. 353.3. Articulations ........................................................................................................ 393.4. Cut marks, percussion marks, spiral fractures ....................................................... 433.5. Human bone tools ............................................................................................... 43
4. Event ........................................................................................................................... 474.1. Male : female ratio ............................................................................................... 474.2. Age-at-death pattern ............................................................................................ 50
5. Palaeoecology .............................................................................................................. 555.1. Diet and food toughness ...................................................................................... 555.2. Nutrition and stress markers ................................................................................ 585.3. Injuries ................................................................................................................ 625.4. Degenerative joint disease .................................................................................... 655.5. Physical activity ................................................................................................... 66
Part Two: Synthesis .......................................................................................................... 736. Interpretation of the deposits ....................................................................................... 75
6.1. One or many events? ........................................................................................... 766.2. Cannibalism: not at Tell Majnuna ........................................................................ 796.3. Interpretation vector ............................................................................................ 806.4. Who and where? .................................................................................................. 83
7. Beyond bones .............................................................................................................. 877.1. Early urbanisation at Tell Brak ............................................................................. 877.2. Population growth and decline ............................................................................ 897.3. Ecology of marginal farming zone ........................................................................ 92
Conclusion ...................................................................................................................... 95
Tables .............................................................................................................................. 99Figures .......................................................................................................................... 145Bibliography .................................................................................................................. 199


Preface
Tell Brak is one of the most important and largest ancient settlements in northern Mesopotamia (northeast Syria), with occupation from the 7th through 2nd millennia BC and a maximum extent of ~130 hectares. Its key location at the southern edge of the past rainfall agriculture zone and at a node on several cross-regional trade routes between Assyria and the Mediterranean in part explains its extraordinary length of occupation and significant urban scale. This location was also politically strategic, since it is central to the upper Khabur drainage system and adjacent to both settled farming and nomadic pastoral populations. Targeted excavations under Sir Max Mallowan in the late 1930s revealed the famous “Eye Temple” of the 4th millennium BC and Naram-Sin Palace of the late 3rd millennium BC Akkadian state (Mallowan 1947). Renewed excavations directed by David and Joan Oates since 1976 have exposed key artifactual sequences from the late 5th through 4th millennia BC, massive administrative and religious complexes of the Akkadian Period and a monumental palace and temple complex of the late 2nd millennium BC Mitanni Period (Oates, Oates & McDonald 1997, 2001). The site first reached urban size and density in the 4th millennium BC, remained a significant urban centre through most of the 3rd millennium BC, and gradually declined in size during the 2nd millennium BC, although the palace and temple indicate it retained administrative and religious importance.
This settlement history created a core main mound reaching 40 meters above the surrounding plain and having a maximum horizontal extent of ~60 hectares. Beyond this core mound in all directions lies an Outer Town, which also varied in density of occupation and physical extent over time. Its edge is defined by a discontinuous ring of small low mounds located some 300-400 meters from the core mound. Soundings in this Outer Town in the late 1990s (Skuldbøl 2010) and an intensive surface survey during 2004-6 (Ur et al. 2007) have allowed reconstruction of the Outer Town’s biography, as it intersects with that of the core main mound. The small outlier mounds were in some cases first occupied in the late 5th-early 4th millennium BC (Late Chalcolithic 2 Period), and that occupation intensified, and the area between them and the main mound was filled in, during the mid- to later 4th millennium (Late Chalcolithic 3 Period). It is during the Late Chalcolithic 3 Period that the mound of Tell Majnuna, at the northern edge of the Outer Town, was established and grew rapidly to ~2-3 hectares. The most important features of this mound were several mass graves, each followed by deliberate massive deposits of rubbish designed to create a visible monument. Dr Arek Sołtysiak’s intensive study of the human remains from these graves supports the indicators from the archaeological contexts that these mass deaths resulted from a violent catastrophic event or events. The graves are temporally associated with Brak’s expansion to urban size and with internal socio-economic developments such as expansion of monumental religious and secular structures and increasing social divisions indicated by changes in craft production. These changes can be logically linked to the possibility of both internal and external social stress and the potential for interpersonal violence. While the cause of the violence is an ongoing research question, the discovery and excavation of mass graves at Tell Brak already delivers a challenge to traditional reconstructions of the region’s “peaceful prehistory”. Dr Sołtysiak’s excellent detailed report presents the rich data from the most important of the Majnuna graves, together with some possibilities for the reconstruction of the social circumstances in which these graves were created.
Financial support for the excavations at Tell Brak during 2006-2008 was generously provided by the British Institute for the Study of Iraq (formerly British School of Archaeology

vi
in Iraq), National Geographic Committee for Research and Exploration, Society of Antiquaries of London, McDonald Institute for Archaeological Research, Cambridge, the University of Cambridge, and Newnham College, Cambridge. We are most grateful for the research permissions and support of the Directorate-General of Antiquities and Museums in Syria, especially Dr Bassam Jamous, the Director General; Dr Michel al-Maqdissi, Director of Excavations; and Dr Abdul-massih Baghdo, Director of Antiquities in Hasseke.
Augusta McMahon
Tell Brak Field DirectorMcDonald Institute for
Archaeological Research,University of Cambridge

Introduction
This story begins in the spring of 2006 when frequent rains in north-eastern Syria made the crops abundant and local grain storage bin in the village of Tell Brak were quickly overflown. The local government decided to set a temporary storage area in vicinity of TellMajnuna, a small satellite mound located some 600 metres north-east to the slopes of Tell Brak (36°40'27''N 41°03'13''E). A roughly rectangular area, 300x200m, was delimited north and east of Tell Majnuna and filled with bags of grain. During the summer a foundation trench, 2m broad and up to 2m deep, for a fence had been excavated around the storage areaby a mechanical digger. Further, during the spring, the south-eastern 1/3 of Tell Majnuna has been completely removed by a bulldozer, in an effort to straighten a road. This damage attracted the attention of the Tell Brak regional survey team, during their autumn seasonin September 2006, and quickly it became apparent that the damage at Tell Majnuna it-self and in the adjacent areas to the NW and SE of the site had exposed dense deposits of human and animal bones, ash and pottery dated to the Late Chalcolithic 3 period (LC3, ~3800–3600 BCE).
The first archaeological excavations at Tell Majnuna were conducted in 1937 by Sir Max Mallowan, but only a short note about this activity has been published (Mallowan 1947). In 2004 and 2005 the site was surveyed by Jason Ur and Philip Karsgaard who found some LC2 and many LC3 sherds on the surface of Tell Majnuna (as well as in some other satellite mounds around Tell Brak) and concluded that large LC3 urban center of Tell Brak covering ~130ha had originated in scattered villages which expanded and eventually joined together (Ur et al. 2007). However, more recent research at Tell Majnuna has weakened this conclu-sion, because no domestic remains have been discovered.
In September 2006 a two-week salvage operation was carried out in the grain storage tren-ches. The straight trench along the road to the SW of Tell Majnuna was called Area MTW and a more irregular trench, NE to Tell Majnuna, was called Area MTE. Section cleaning and other activities allowed evidence to be gathered which was sufficient to preliminarilyinterpret Area MTE as a midden with a regular cemetery on the top, and Area MTW as a lar-ge deposit of partially articulated human bones covered by layers of trash (Karsgaard & Sołtysiak 2007; Sołtysiak 2008).
Regular excavations were undertaken during the spring seasons of 2007 and 2008 when research at Tell Majnuna became the primary objective of the Tell Brak archaeological proj-ect. Four trenches adjacent to the previous machine-cut trench were explored in the AreaMTW, one trench in the Area MTE, and ten trenches on the tell itself: four in Area EM, in south-eastern part, one in the Area EMS, in southern part, and five in the Area EME in central part of Tell Majnuna (see Figure 1). During theses two years a massive amount of trash including sherds, clay sealings, human and animal bones has been excavated and it has become obvious that Tell Majnuna is a large midden disturbed by a somewhat later cemetery in its northern part (EME and MTE). Some lower strata in the midden contained dense de-posits of human bones, observed chiefly in the Areas MTW, EM and EMS, but perhaps also in the deeper EME trenches. In total, several thousand bones and bone fragments were found and studied by the present authors during the spring excavation seasons of 2007 and 2008, and during the autumn excavation season of 2008 in the Polish dig house at Tell Arbid. The research was finally concluded before the end of the spring study season 2009 at Tell Brak.

2
Apart from quite detailed description of salvage operation activities, so far only a short pre-liminary report about 2007 regular excavations has been produced (Sołtysiak 2007).
Each human bone, bone fragment or skeletal unit retrieved from all explored strata in the Areas MTW, EM and EMS was described separately and included in a database which finally reached 2873 entries. In addition, more than 3500 pictures were taken with a digital camera. The database contains both osteological and taphonomical data, including scores for sex and age assessment, metric measurements and non-metric traits, tooth measurements, scores for dental caries, enamel hypoplasia and some other stress markers, bone preserva-tion pattern, articulation pattern and scores for taphonomic agents (especially toothmarks).A basic osteological questionnaire was partially based on Standards of Data Collection from Human Skeletal Remains (Buikstra & Ubelaker 1994), and all scoring methods which are not described below in detail may be found in this handbook. The database has been designed in Statistica 8.0 and most statistical tests were performed with use of this software or simple on-line calculators for t-test or chi-square (www.graphpad.com, www.quantpsy.org). Also used, were some functions written by the present author in Pascal.
This book differs from usual reports on human bones in many respects. It has been writ-ten in a short time after the finish of excavations at Tell Majnuna and, because no final results of studies on artifacts, faunal and plant remains are available yet, it presents the interpreta-tion of a large human bone deposit from the perspective of the bones themselves. Actually it is intended not to be any kind of final presentation of research on a given bone sample, but rather an invitation to a discussion on the formation of an unusual deposit of human bones within a broader anthropological framework. For that reason only pieces of research important for the understanding of the event which underlies this deposit are presented here in detail, others may be only outlined. This book is issued in a small number of copies which will be distributed among the members of Tell Brak archaeological team as well as colleagues interested in Mesopotamian bioarchaeology. It is possible that forthcoming feedback and discussions with people looking at the Tell Majnuna deposit from other perspectives will change the ideas presented here, and the final report on the excavations at the site will contain a completely different text on human bones. However, it is also possible that the present view will be accepted as likely interpretation of the event. I am looking forward to this discussion and hope that it will contribute to an advance in taphonomic applications to archaeology.
There are two main parts of this book, one is relatively long and presents the results of re-search on the human bones from selected areas at Tell Majnuna. The second section is shorter, but perhaps more important, containing the background and synthesis of these results. The analytical part has been divided into five chapters, each of them devoted to one stage in the history of bones found at Tell Majnuna, but in reverse chronological order (roughly based on Lawrence 1968). The first chapter contains rather detailed description of the excavation of human bone deposits at Tell Majnuna, the second presents the factors which may have altered the bones between deposition and excavation, the third concerns the deposition itself and biostratinomy. The fourth covers the death of all these people, and the fifth deals with some details about the life of individuals who were eventually buried at Tell Majnuna.
Below are some terms used in a slightly more precise sense than in common usage and they need further explanation. Following R.L. Lyman (1994:3), I will use the terms “taphonomic agent” and “taphonomic effect” for a factor and a trace left by that factor on bones once or continuously between the death of an individual and the excavation of its remains. A set of fragments of one bone is called here “element”, and “skeletal unit” stands for articulated bones and/or elements belonging to one individual (for the adopted definition of “articulation” see

3
Chapter 3.3 below). A limited deposit of bones is called “cluster” and large clusters may be divided into layers which are defined here in purely mechanical and arbitrary way.
The osteological works reported in this book are a small part of the archaeological re-search at Tell Brak and its satellite mounds which was initiated by David and Joan Oates in 1976, and continued for more than 30 years by an expedition based chiefly in theMcDonald Institute of Archaeological Research, Cambridge University, and supported by the British School of Archaeology in Iraq. I would like to express my gratitude to Joan Oates and Augusta McMahon, the present field director of the expedition, for their hospitalityand interest in my studies on human bones, as well as to Henry Wright, the field director of Tell Brak regional survey project (autumn 2006). Thanks are also due to Philip Karsgaard, Tim Skuldbøl, Adam Stone, Matthew Williams and Ahmed Slivi, trench supervisors at Tell Majnuna, as well as to Mette Marie Hald, Lamia Khalidi, Jill Weber, all other members of Tell Brak archaeological team and local camp staff. In the spring excavations season of 2008 I was assisted by Agata Chilińska, a graduate student from the University of Warsaw. Some animal taphonomic agents were discussed with Jill Weber, Alicja Lasota-Moskalewska and Anna Gręzak, I have also profited from discussions on human bones from Tell Majnuna with Theya Molleson and Elżbieta Jaskulska. The experiment with the vulture (Chapter 3.1) would not have been possible without the help of Maria Jaromirska, Rafał Fetner and the staff of the Polish Fauna Garden in Bydgoszcz. Maria Sterzyńska identified the larva found at Tell Majnuna as wireworm or (rather) false wireworm. I am grateful also to the Syrian General Directorate of Antiquities and Museums in Damascus for permission to export samples of human bones and teeth for further laboratory analyses.
A draft version of this report was read and commented on by (in alphabetical order): Mette Marie Hald, Maciej Henneberg, Theya Molleson, Alicja Lasota-Moskalewska, Holger Schut-kowski. Many thanks are due to Adam Stone who kindly corrected the language of the text.
The present research was partially financed by the Institute of Archaeology, University of Warsaw. Last but not least, I would like to thank Basia for her constant support and Olek who slept silently throughout all these nights when I wrote this book.


Part One: Analysis


1. Excavations
After the initial rescue operation in 2006, large scale archaeological works at TellMajnuna were undertaken during two spring excavation seasons in 2007 and 2008. In total, 15 trenches of various size were explored in a wide zone along the cuts of modern destruc-tion from SW to NE. Large human bone deposits were found in the Areas MTW and EM, and a smaller cluster was discovered in the Area EMS, the latter in much higher absolute elevation than the former. It is likely that the irregular deposits witnessed in the Area MTW extended at least to Area EME in the central part of the tell (see Figure 1), where two small deep sondage trenches also revealed some clusters of bones. However, the analysis of human remains from the Area EME will be reported elsewhere. Locus numbers for MTW, EM or EMS contexts containing any human bone are given in the Table 1.
Each skeletal element retrieved from Tell Majnuna has been numbered and in the case of large clusters, layers or sectors were also defined (this was especially important in EM loc. 6=53, which included more than 50% of all elements from Majnuna). Pictures of all layers were taken and each elements were specified with their numbers during excavation, then some pictures were transformed into drawings. Such technique allowed the reconstruction of the pattern of articulations, by comparing picture with bones, even if nobody trained in osteology was present in the field during excavation. In the case of small clusters the numbers were given after excavation, and were only for the purpose of database registration.
Most elements were packed into plastic bags, densely perforated in order to allow the evaporation of water from the bone. Occasionally pieces of newspapers were used to pack well preserved bones. The most complete crania were placed in rubber buckets filled partially with earth. Almost all deposits were transported to the dig house at Tell Brak by local vehicle which sometimes contributed to further fragmentation of the bones. In the storage house the elements were stored in crates. Due to their generally poor condition, human remains were not washed, but cleaned with the use of soft brushes and wooden sticks. Only a few elements, which had been initially classified as animal remains, were washed and cleaned with hard brushes, a process which obliterated most taphonomic effects.
The degree of recovery was variable and depended chiefly on two factors: temperature changes during excavations and the excavation schedule. The first factor especially affected elements from the Area EM where the main deposit of human bones was covered by several metres of later strata. The exploration of this deposit throughout several weeks in 2007 and again in 2008 rapidly altered the previously stable and humid environment and some bones started to crack in a more or less regular way during exploration, especially when exposed to the sun in the trench after a rainy day. Sometimes cracks imitated artifcial cut marks obliter-ated by fine sand-paper (Figure 2). Bones from MTW were found closer to the surface, so this effect was not as widespread. The second factor was also more prominent in the Area EM, especially in the locus 6=53 which appeared to contain so many human bones that some sectors must have been explored very quickly by local workers just before the end of the fieldwork season. In result some elements have been fragmented and in a few cases missing or not recognised in the dig house. Several human bones from small deposits were recovered by a pick together with animal remains and usually their degree of recovery was low.
Possibly some minor rodent and insect activity between discovery and exploration of bone clusters slightly altered some elements. Occasionally some mice entered the trenches during their exploration, their presence related to the proximity of grain storage area (Figure 3). Ro-dent activity was also observed (or rather heard) in the storage rooms at Tell Brak. It is then

8
possible that some observed rodent tooth marks were recent and arose during excavation or the months of storage which lapsed between the excavation and study of some of the bones. However, in most cases tooth marks were observed immediately after bone excavation (as in the trench EMS) or smudged by soil, so a few unclear cases should not substantially alter the actual distribution of ancient rodent tooth marks.
1.1. Rescue operation (2006)
Due to short time and the small labour force, the first archeological activity at Tell Maj-nuna after the accidental discovery of the machine-cut trench was necessarily limited to the documentation of the damage, cleaning of the trench sections and the retrieval of bone and pottery samples from the spoil dumps. During the last week of September and the first week of October 2006 some 25m of the trench, SW of Tell Majnuna, was surveyed (Area MT), and small bone collections were also gathered from an NE space of the damaged area at the mound itself as well as in the northern and eastern machine-cut trench. The objective ofthese works was to propose an initial explanation for the dense human bone deposit which was especially evident in the northern section of the SW trench (see Sołtysiak 2008). After cleaning of this section, thirteen visible human bone clusters (A to M) were explored in or-der to assess the presence of articulations, bone preservation pattern, as well as sex and agepattern. Additionally, several hundred elements were gathered from the dump and one ~0.5x1m section trench was properly excavated in approximately the middle of the visible human bone stratum (cluster H).
The most complete evidence was collected in the trench section (cluster H). Human remains were found in three strata, labelled 6, 7 and 10. The uppermost layer (loc. 6, Fig-ure 4) included three human skulls in a row located in the south-eastern part of the trench extension. The first of them (skull #3) was heavily destroyed by the earthworks. Originally it was laying on its left side, facing west. Only the maxilla and mandible were relatively well preserved, together with a great number of very small fragments of sphenoid and temporal bones as well as some internal facial bones (as vomer). Also, the first three somewhat broken cervical vertebrae were present in articulation. Westwards, and farther into the section, skull #2 was found, also broken by the earthworks (and easily visible in the section), laying on its left side and facing east. Most of the right part of the cranium was preserved (including fron-tal, parietal, temporal and occipital bones), the mandible was completely missing. The most complete skull in the row was labelled as #1; it was not visible in the section and again lacked the mandible and cervical vertebrae. The cranium was laying on its left side, facing west. Al-though almost complete, the cranium was strongly deformed and somewhat cracked.
Westwards, close to skull #3, there was an animal cranium (perhaps bovine, judging from its size) and west-north of this cranium, there was another human skull deposited about 15 cm deeper than the previous ones, laying on its top, facing south (skull #4). Although not exposed in the section, this cranium was also heavily broken, and among the preserved parts there were the almost complete frontal bone, left maxilla and zygomatic bone, right broken maxilla and zygomatic bone, both nasal bones, right temporal bone. Some teeth were also present and it was possible to assess the dental age of 10/11 years. North of the row of human skulls, among animal bones and sherds, there was also a right femur with exposed proximal half and distal half continuing into northern section of the trench. The small diameter ofthe femoral head suggests the female sex of this individual. There was also another proximal half of a femur, with even smaller head diameter.

9
Still in the locus 6, but below the skulls, there were parallel bones: single humerus and leg bones in anatomical articulation (femur with proximal half in the eastern section, patella, and complete couple tibia + fibula) but without tarsals and metatarsals. The humerus was heavily cracked, leg bones relatively well preserved. Close to the eastern section there was part of a human spine laying perpendicularly on the femur, dorsal side up. It consisted of broken atlas and C3–C7, more or less complete T1–T4 and more fragmentary T5–T8. The thoracic vertebrae were accompanied by nine fragments of ribs, only vertebral ends preserved. Two clavicles of perhaps the same individual, parallel to the femur, were found below. The left one remained in the section, the right one was very gracile, but quite long. These remains were in such position that they could have been related to the skull #3, with which, however, three upper cervical vertebrae were already found.
Below the clavicles a left femur was found, this time parallel to the eastern section, with proximal end (in the south) destroyed by the earthworks and distal end articulated with pa-tella but without tibia and fibula. Moderate to strong osteoarthritis could have been observed in femoral epiphysis and both articulation surfaces of patella. Other bones found in the lower part of the locus 6 around and below the skulls are a fragment of a robust tibia shaft, a part of a very robust femoral shaft without distal end which had been bitten off by a carnivore, the somewhat broken first three cervical vertebrae likely in articulation, and two permanent upper teeth. In the western part of the extension trench there was a broken proximal end ofa tibia with half of the shaft and an analogical part of a fibula without proximal diaphysis. Both quite robust bones were located on a sherd.
Below all these human remains, locus 6 gradually passed into the locus 7. Although well separated in the trench section, they seem to be a continuation of the same deposit of human remains, in spite of some differences in the fill (locus 7 more ashy and with infrequent animal bones and sherds). In the transition between the strata, close to the middle of the northern section, there was a mandible with broken condyles. Sex cannot be determined, but the bone belonged to an early-middle-aged individual, if we can trust the degree of dental wear.
In the bottom of the locus 7 (Figure 5), there were at least one partially articulated skel-eton, one relatively well preserved cranium, and five femora scattered in the area, as well asa few animal bones. In the south-western part of the trench extension, there were two parallel femora belonging most likely to one individual (they appeared to be symmetrical) and with posterior side up. The right one (A) was articulated with patella, tibia and fibula; the lasttwo bones were only partially exposed. The left femur (B) was articulated only with the patella, the lower bones were completely missing. All bones of this individual were large but gracile. Perhaps fragments of arm bones found in the eastern part of the trench, heav-ily destroyed by the earthworks, also belonged to the same individual. There was the distal end of a left humerus (H) in articulation with proximal parts of ulna and radius, broken in an irregular way before the excavation. The position of these bones and their robusticity are conformable with the legs in the western part of the trench; other parts of this skeleton mayhave been missing in the destruction trench. Close to the eastern section, there was a fifthskull laying on right side, facing south-east (cranium I). The mandible was missing, and the right side of the cranium was heavily destroyed. In the eastern part of the extension trench, between the cranium and the parallel legs, there were five scattered femora, all with ends more or less gnawed by carnivores.
In the locus 7 a few other small fragments of human bones were found: the distal end of a left humerus and the heavily damaged distal end of a left tibia with furrows both in
10
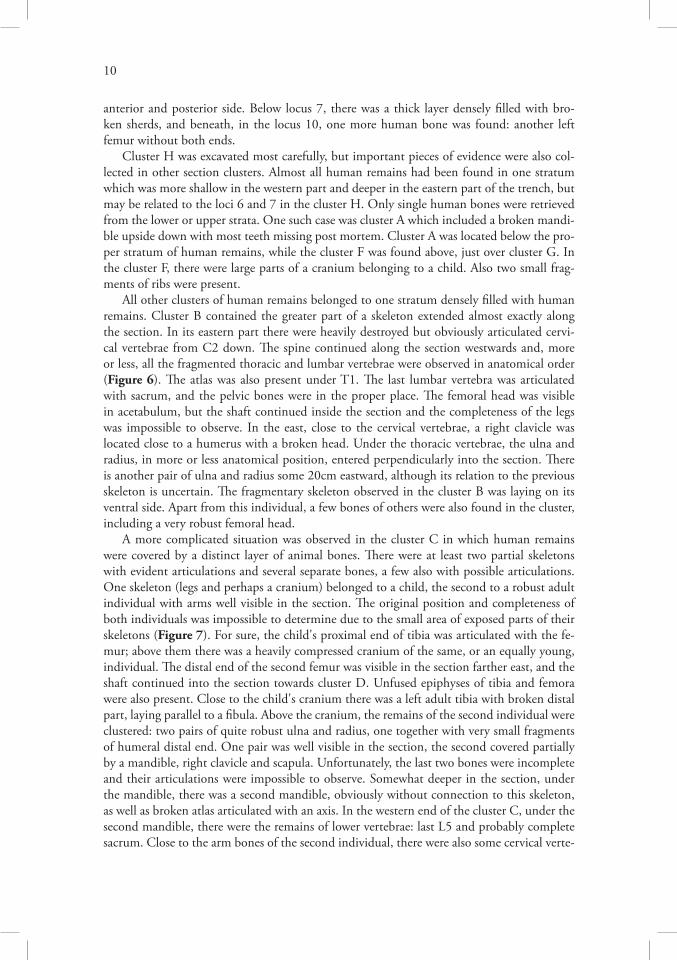
anterior and posterior side. Below locus 7, there was a thick layer densely filled with bro-ken sherds, and beneath, in the locus 10, one more human bone was found: another left femur without both ends.
Cluster H was excavated most carefully, but important pieces of evidence were also col-lected in other section clusters. Almost all human remains had been found in one stratum which was more shallow in the western part and deeper in the eastern part of the trench, but may be related to the loci 6 and 7 in the cluster H. Only single human bones were retrieved from the lower or upper strata. One such case was cluster A which included a broken mandi-ble upside down with most teeth missing post mortem. Cluster A was located below the pro-per stratum of human remains, while the cluster F was found above, just over cluster G. In the cluster F, there were large parts of a cranium belonging to a child. Also two small frag-ments of ribs were present.
All other clusters of human remains belonged to one stratum densely filled with human remains. Cluster B contained the greater part of a skeleton extended almost exactly along the section. In its eastern part there were heavily destroyed but obviously articulated cervi-cal vertebrae from C2 down. The spine continued along the section westwards and, more or less, all the fragmented thoracic and lumbar vertebrae were observed in anatomical order (Figure 6). The atlas was also present under T1. The last lumbar vertebra was articulated with sacrum, and the pelvic bones were in the proper place. The femoral head was visible in acetabulum, but the shaft continued inside the section and the completeness of the legswas impossible to observe. In the east, close to the cervical vertebrae, a right clavicle was located close to a humerus with a broken head. Under the thoracic vertebrae, the ulna and radius, in more or less anatomical position, entered perpendicularly into the section. There is another pair of ulna and radius some 20cm eastward, although its relation to the previous skeleton is uncertain. The fragmentary skeleton observed in the cluster B was laying on its ventral side. Apart from this individual, a few bones of others were also found in the cluster, including a very robust femoral head.
A more complicated situation was observed in the cluster C in which human remains were covered by a distinct layer of animal bones. There were at least two partial skeletons with evident articulations and several separate bones, a few also with possible articulations. One skeleton (legs and perhaps a cranium) belonged to a child, the second to a robust adult individual with arms well visible in the section. The original position and completeness of both individuals was impossible to determine due to the small area of exposed parts of their skeletons (Figure 7). For sure, the child's proximal end of tibia was articulated with the fe-mur; above them there was a heavily compressed cranium of the same, or an equally young, individual. The distal end of the second femur was visible in the section farther east, and the shaft continued into the section towards cluster D. Unfused epiphyses of tibia and femora were also present. Close to the child's cranium there was a left adult tibia with broken distal part, laying parallel to a fibula. Above the cranium, the remains of the second individual were clustered: two pairs of quite robust ulna and radius, one together with very small fragments of humeral distal end. One pair was well visible in the section, the second covered partially by a mandible, right clavicle and scapula. Unfortunately, the last two bones were incomplete and their articulations were impossible to observe. Somewhat deeper in the section, under the mandible, there was a second mandible, obviously without connection to this skeleton, as well as broken atlas articulated with an axis. In the western end of the cluster C, under the second mandible, there were the remains of lower vertebrae: last L5 and probably complete sacrum. Close to the arm bones of the second individual, there were also some cervical verte-

11
brae in articulation as well as a separate occipital bone of an adult, obviously without the rest of neurocranium, which was broken along completely open suturae.
The cluster D contained at least four thoracic vertebrae in a row together with rib frag-ments, all belonging to a child, perhaps the same as the one found in the cluster C. In the western part of the cluster there was a broken robust cranium laying on its top, without man-dible or vertebrae, as well as proximal end of a femur, articulated with acetabulum and conti-nuing into the section. The position of the bones in the cluster E was again quite complicated and there were remains of at least three skeletons. The first was represented by leg bones, chief-ly the almost complete right femur with its head still in acetabulum, parallel to the section and laying on its anterior side, also articulated with tibia, which was only partially exposed in the section. Also, the knee area of the left leg was visible above the lower part of the right femur's shaft; the left femur was fully articulated with patella and tibia making a very acute angle with the femur and continuing above it deep into the section. Thus, there was the lower part of a body laying on its ventral side, with a straight right leg and a left one strongly flexed, spread over the right one. Above the left knee, there were some bones of a child, including articulated left tibia and femur (epiphyses present), part of the right humerus and some skull fragments. These bones may have belonged to one or two individuals of approximately the same age. Above them there were at least four lumbar vertebrae articulated with sacrum (only broken S1 present) and cluster E also contained many bones which cannot be directly associ-ated with the three recognised individuals (Figure 8). Above cluster E, in another layer, there was a poorly preserved cranium of a child, laying on its back, accompanied only by animal bones and small sherds.
Two crania with some other bones were found in cluster G. The upper one, almost en-tirely destroyed by the earthworks, belonged to an adult and was articulated with atlas, axis and C3. Part of a spine perhaps of this individual, including four cervical and one thoracic vertebrae, was found somewhat deeper, together with a fragmented left humerus, scapula and some ribs. The lower cranium of a child was strongly compressed and only articulated with the atlas. There was also part of an adult human femur just above the skull, with its distal end broken by carnivores.
East of cluster H, a concentration of human skulls in the section was evident. Cluster I contained a negative of neurocranium completely removed during the earthworks and some parts of left temporal, zygomatic bone and maxilla. Also in cluster J a negative of one cra-nium may have been documented together with some parts of another cranium and broken mandible of a child. This skull was deposited over a disarticulated adult left femur with its proximal end missing. Again a concentration of postcranial bones was observed in cluster K, where the disarticulated cranium of a young adult was located under a heap of animal bones also including part of a human left femur. In the lower part of this cluster there wasa distal part of an old child's left tibia with epiphysis not fused, clearly articulated with tarsals. Perhaps, the parts of a pelvis in articulation with femur, found above, belonged to the same individual. Above this group of bones, in an upper stratum, there was a quite well preserved gracile neurocranium of a young adult. It is likely that its face had been destroyed by the earthworks, and there were no other human bones in the neighbourhood.
Westwards, in cluster L, only two crania have been found. The left one was represented by large parts of the face, the right one laid on its right side, facing south. It was strongly compressed (Figure 9) and articulated with the first three cervical vertebrae; these are the only pieces of postcranial skeleton found in this cluster, apart from a very small rib fragment. Also, cluster M contained two crania. The first one was almost complete and laid on its base.

12
Deeper in the section, there was another cranium articulated with atlas but without other ver-tebrae, belonging to an old adult, and the reversed, broken and robust mandible of a young adult. In this cluster there were also some not well preserved bones of a juvenile: some frag-ments of lower vertebrae, and very small fragments of pelvis and right tibia.
In general, the content of the explored section clusters shows non-uniform distribution. First, a distinct layer of human remains may have been observed, although some separate bones were found also below and above it. Second, there were many partially articulated postcranial skeletons in the western part of the section, on the slope of the original pit, with fewer skulls in the east, where chiefly complete skulls or crania were found. Perhaps they just rolled down from the west. It is interesting that child skulls do not imitate this pattern and their remains were found in both halves of the section; perhaps this difference was due to their greater susceptibility to compression which had prevented their mobility. Third, most recognised skeletons were only partially articulated, although in some cases full articulation cannot be excluded. Moreover, there were also many completely disarticulated bones. Only in a few cases could the position of a skeleton be recognised, but it seems likely that they were just thrown into the pit without any care.
During the spring season of 2007 several other bones were retrieved from the MT sec-tions which had been strongly eroded since the previous autumn. The salvage operation in 2006 focused on northern section, while the next year a small cluster of bones was also explored in the southern section, ~240cm west of the original beginning of the machine-cut trench, ~130cm below the ground level. The cluster contained at least five thoracic vertebrae in articulation all together with rib fragments. East of this skeletal unit a cranium was found, resting on its base, facing westwards (Figure 10). This area belonged to the Area MTW4 excavated in the spring of 2008.
More than 700 elements have been collected from the trench’s spoil dump, both from the surface and from careful sieving of two dump intervals. Distribution of human remains on the dump surface was not uniform; the intervals between 0 and 10 metres (from NE to SW) were very abundant, between 10 and 20 metres the bones were few, above 20 metres they vir-tually disappear (Figure 11). Such pattern may be explained by the shape of the pit: the layer of human remains slopes down from west to east, and reaches the bottom of the trench at around the 10th metre. Thus, the abundance of human remains on the dump surface reflects the fact that between 0 and 10 metres the last digs of the machine contained the fill of layer most abundant in human bones and did not cover them with the fill of deeper layers, as in another parts of the trench. It is clear when comparing this pattern of distribution with dump sieving: in this case interval 14–16 contains many more bones than interval 0–2, which is consistent with distribution of bones in the section. All explored clusters were located be-tween the 10th and 20th metre, again because the layer of human remains in the eastern part of the section was just on or even below the bottom of the trench.
Exploration of the NE trench (Area MTE) and of the section at Tell Majnuna itself was not so detailed as in the western trench; section clusters were described without careful clean-ing and collection of bone fragments from the dump was not so methodical. In contrast with Majnuna West, human remains to the east of the tell did not form any distinct layer, but separate skeletons were observed in both eastern and western sections of the trench, as well as in the eastern part of the section at the tell. Although a clear burial pit was visible only in one case (skeleton G), it is obvious that there was a regular cemetery in Majnuna East. In the case of each skeleton only a few bones were taken out from the section, while more fragments were collected in the neighbouring parts of the spoil dumps.

13
The sample of the skeletal remains from Majnuna East was too small to propose any definite conclusion but nothing suggested any abnormality in this cemetery. There is no sex bias (five males, five females). The very clear age bias (only 3/16 infants or children) may be explained as the common effect of three factors: 1) child skeletons are much smaller than adult skeletons and for that reason less likely to be exposed in a random section, 2) child skeletons are more subject to erosion when exposed, 3) excavations on the main site of Tell Brak revealed many child inhumations in the Chalcolithic and Early Bronze Age strata which contrasted with few adult remains, so it may be assumed that children, and especially infants, were buried chiefly inside the town. The few child remains found in MTE suggest however, that it was not a very strict rule. Excavations at the regular cemetery (Areas MTE and EME) continued in 2007 and 2008, but the results of the research on these skeletons will be re-ported elsewhere.
1.2. Area MTW (2007, 2008)
Regular excavations in the Area MTW, adjacent to the SE machine-cut trench (MT), were undertaken in 2007 and 2008. Work during the first of these two seasons was focused on the exploration of a trench MTW1, the northern extension of the previous small cluster H section trench (see Figure 1). The objective of the research was to discover the northern limit of human bone deposit visible in the MT section. Over the whole length of MTW1 there were many strata of waste deposits of various colour. The top of the human bone deposit (lo-cus 59.2) has been found in only a small area ~1.5x2.5m close to the former cluster H section trench. Farther north two large pits disturbed the stratigraphy, but the stratum containing loosely scattered human bones (here designated as locus 65) continued for several metres to the northern limit of the trench MTW1.
The locus 59.2, corresponding to locus 6 from cluster H section trench, included many sherds, numerous disarticulated animal bones and a few human elements, often without articulations, although there was one femoral head articulated with os coxae and at least three thoracic vertebrae in a row. All human bones, including three crania, five fragments of femora, two fragments of pelvis and three vertebral elements, seem to be just a loose scatter mixed with other waste (Figure 12). All bones were significantly eroded, also due to abun-dant rains in time of excavation.
The northern continuation of locus 59.2 was excavated in the last days of the excavation season, so the bones were retrieved very quickly and the presence or absence of articula-tions in the locus 65 was not noted. However, it may be safely assumed that the pattern of articulations was similar to that in locus 59.2 to the south. Crania, mandibles and pelvic frag-ments were most abundant in this part of the deposit, and were mixed with large quantities of animal remains and sherds.
Below the locus 59.2 there was very thin stratum of white ash and then the proper de-posit of partially articulated human bones (locus 66, corresponding to the locus 7 from the cluster H section trench). White ash was found also under the locus 65, but several box sondages in the northern part of the trench MTW1 revealed no dense deposits of human bones. It is probable then that locus 66 continued only some 1m north from the machine-cuttrench section, unlike the locus 59.2 which was correlated with locus 65 in the northern part of the trench MTW1.
Locus 66 contained both human and animal bones. In the higher stratum animal remains prevailed, but here the ratio was close to 1:1 (61 human elements per 118 registered num-
14
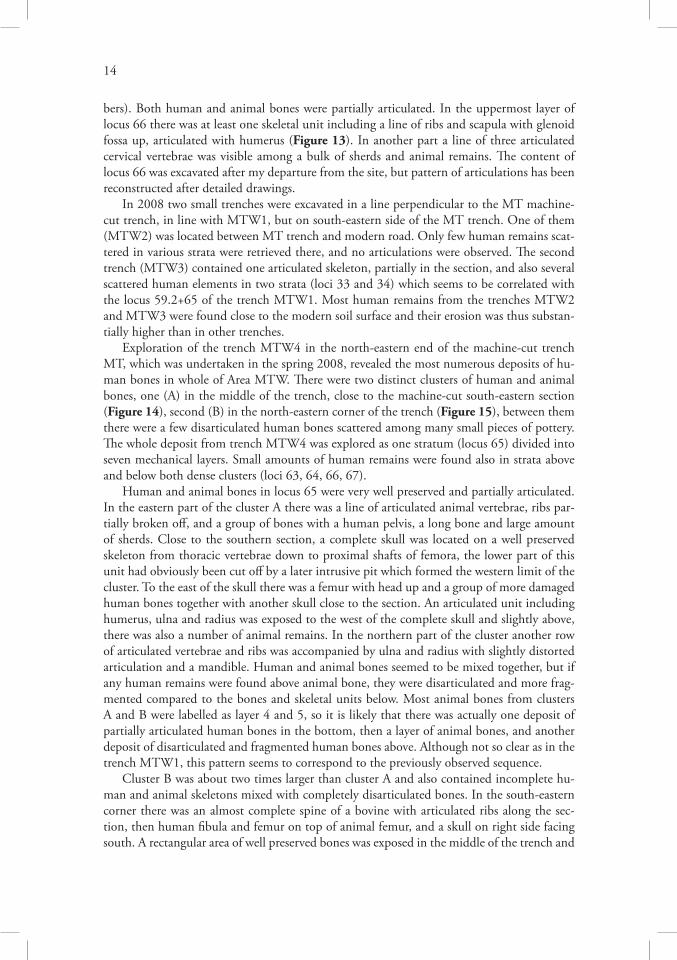
bers). Both human and animal bones were partially articulated. In the uppermost layer of locus 66 there was at least one skeletal unit including a line of ribs and scapula with glenoid fossa up, articulated with humerus (Figure 13). In another part a line of three articulated cervical vertebrae was visible among a bulk of sherds and animal remains. The content of locus 66 was excavated after my departure from the site, but pattern of articulations has been reconstructed after detailed drawings.
In 2008 two small trenches were excavated in a line perpendicular to the MT machine-cut trench, in line with MTW1, but on south-eastern side of the MT trench. One of them (MTW2) was located between MT trench and modern road. Only few human remains scat-tered in various strata were retrieved there, and no articulations were observed. The second trench (MTW3) contained one articulated skeleton, partially in the section, and also several scattered human elements in two strata (loci 33 and 34) which seems to be correlated with the locus 59.2+65 of the trench MTW1. Most human remains from the trenches MTW2 and MTW3 were found close to the modern soil surface and their erosion was thus substan-tially higher than in other trenches.
Exploration of the trench MTW4 in the north-eastern end of the machine-cut trench MT, which was undertaken in the spring 2008, revealed the most numerous deposits of hu-man bones in whole of Area MTW. There were two distinct clusters of human and animal bones, one (A) in the middle of the trench, close to the machine-cut south-eastern section (Figure 14), second (B) in the north-eastern corner of the trench (Figure 15), between them there were a few disarticulated human bones scattered among many small pieces of pottery. The whole deposit from trench MTW4 was explored as one stratum (locus 65) divided into seven mechanical layers. Small amounts of human remains were found also in strata above and below both dense clusters (loci 63, 64, 66, 67).
Human and animal bones in locus 65 were very well preserved and partially articulated. In the eastern part of the cluster A there was a line of articulated animal vertebrae, ribs par-tially broken off, and a group of bones with a human pelvis, a long bone and large amount of sherds. Close to the southern section, a complete skull was located on a well preserved skeleton from thoracic vertebrae down to proximal shafts of femora, the lower part of this unit had obviously been cut off by a later intrusive pit which formed the western limit of the cluster. To the east of the skull there was a femur with head up and a group of more damaged human bones together with another skull close to the section. An articulated unit including humerus, ulna and radius was exposed to the west of the complete skull and slightly above, there was also a number of animal remains. In the northern part of the cluster another row of articulated vertebrae and ribs was accompanied by ulna and radius with slightly distorted articulation and a mandible. Human and animal bones seemed to be mixed together, but if any human remains were found above animal bone, they were disarticulated and more frag-mented compared to the bones and skeletal units below. Most animal bones from clusters A and B were labelled as layer 4 and 5, so it is likely that there was actually one deposit of partially articulated human bones in the bottom, then a layer of animal bones, and another deposit of disarticulated and fragmented human bones above. Although not so clear as in the trench MTW1, this pattern seems to correspond to the previously observed sequence.
Cluster B was about two times larger than cluster A and also contained incomplete hu-man and animal skeletons mixed with completely disarticulated bones. In the south-eastern corner there was an almost complete spine of a bovine with articulated ribs along the sec-tion, then human fibula and femur on top of animal femur, and a skull on right side facing south. A rectangular area of well preserved bones was exposed in the middle of the trench and

15
between it and the souther section there was a zone of more fragmented and scarce human bones with much more animal remains and sherds. To the north-west of the bovine spine was a human pelvis, articulated with sacrum, and accompanied by a femur without a head, which might have been originally articulated with acetabulum. Along the femoral shaft several tho-racic vertebrae ran parallel to a radius and ulna articulated with several hand bones lying above a cranium. In the same spot two other skulls were located in various positions close to a large animal bone. All this complex was limited in the north by another line of thoracic vertebrae articulated with ribs. The southern skull was embraced by several ribs which be-longed perhaps to one skeletal unit with thoracic vertebrae below the skull, lumbar vertebrae west to the skull and pelvis articulated with right femur. To the west, there was a group of animal bones and, more to the north, three long bones from the upper extremity of an older child in articulation and again several animal skeletal assemblages with human adult hume-rus above. Below the distal end of this bone there was a human tibia articulated with talusand then a row of animal vertebrae covering other tarsals. The proximal humeral end cov-ered an articulated pair of tibia and fibula and in the northern limit of the cluster there was another human tibia, femur and another humerus close to an animal mandible. In the west cluster B was limited by a group of disarticulated bones including human ulna.
Excavations in Area MTW revealed at least three dense clusters of partially articulated human bones which seem not to follow any special spatial pattern. It looked like irregular scattered deposits, although the original distribution was obviously disturbed by later pits which were common over the whole area. Human bones were mixed with animal remains, although it is quite clear that the latter were more frequent in upper parts of the clusters. Above these clusters, there was a much broader stratum with disarticulated and usually frag-mented human bones mixed with large amounts of sherds, animal bones and other kinds of waste. Single human bones or bone fragments were found in virtually all trenches exposed in the Area MTW.
1.3. Area EM (2007, 2008)
Work in Area EM on the south-western slope of Tell Majnuna started simultaneously with the excavation of trench MTW1 and lasted for two fieldwork seasons. Virtually no architectural remains were found and at least in this area Tell Majnuna was just a dump of waste, several meters high and containing many strata dated to a relatively short period of 100-200 years, based on pottery, all belonging to the Late Chalcolithic 3. Most strata in trench EM slope down from south to north and it is clear that the formation of the mound was begun in the south and gradually the waste was disposed more and more in northern direction. However, no excavations were undertaken in north-western part of Tell Majnuna, so the end of this process is still not recognised.
Single and usually fragmented human bones were found in many strata in trench EM, but large deposits comparable to these from MTW1 locus 66 or MTW4 locus 65 have been exposed only in EM locus 6 (in 2008 re-numbered as locus 53) and locus 29, a separate clus-ter correlated with locus 6 and found in the western extension of the trench EM in 2008. In addition, locus 25 contained a medium sized concentration of skulls and a few postcranial elements, all of which was located above locus 29 and separated from the latter context by several strata, but not very distant in time. Locus 51 in the upper strata of Area EM contained a partial skeleton of a child, perhaps belonging to later regular cemetery, which was excavated chiefly in the Area EME.

16
The most important evidence has been collected in the locus 6=53 which was found some4m below the original soil surface on Tell Majnuna. This locus contained a very dense deposit of human bones with small amounts of animal remains and pottery, and was in the shape of a spindle ~11m long and up to 1m wide (Figure 16). It crossed the trench from east to west, along the contemporary slope of the mound, in higher elevation than the deposits in the trenches MTW1 and MTW4. The eastern end of this deposit reached the NE section of the trench and could not be explored, the western end had been found during 2008 season in trench EM extension. Two much smaller deposits of less regular form (loci 25 and 29) were also explored in this extension. The depth of the locus 6=53 was variable, up to ~0.7m in the middle, less than ~0.2m towards the ends.
As many as 1458 elements or skeletal units were retrieved from the locus 6=53, more than a half of all entries registered in the database of human remains from Tell Majnuna. Due to time constraints, various parts of this large deposits were excavated in different way, although in all cases bones were numbered and photographs of all layers and sectors taken. In the 2007 season, when only a part of locus 6 was uncovered, just two weeks before the end of fieldwork, the upper two mechanical layers of bones were explored by the present author with the assistance of Jill Weber. All articulations were described in situ and I did several sketches showing the position of bones. Lower layers were covered until the next year.
In 2008, before the exploration of remaining elements, the western extension of thetrench was deepened to the level of the locus 6 and the shape of the whole deposit could then be observed. The locus 6=53 was divided into six sectors which were explored byAgata Chilińska and Ahmed Slivi in 2–6 mechanical layers depending on the depth of the deposit. Pictures of all layers were taken and bone numbers indicated on these photographs. Articulations could then be reconstructed after this documentation. The same method has been adopted during excavations of loci 25 and 29 which were each explored in two me-chanical layers. Although the whole sample of bones from the locus 6=53 could have beenfinally divided into 20 units (number of layers in all sectors), for further analyses only 8 sub-samples were defined (Table 2).
All three contexts found in the trench EM contained much less articulated skeletal units than the locus 66 in MTW1 or the locus 65 in MTW4. However, in the surface of the locus 6=53 at least two groups of parallel mixed long bones could be observed, and they resembled armfuls of sticks thrown to the ground (Figure 17). The first such group contained six fem-ora, two humeri, one fibula and rib, the second, which was much more eroded, consisted of at least two femora and two tibiae. Also in second layer there were several groups of parallel bones, although not so clearly organised as the previously described examples. Towards the eastern end of locus 6=53 the frequency of animal bones was somewhat higher.
Skulls and skull fragments found in two upper layers were completely smashed and com-pressed, the deeper the better state of preservation. Bones were sometimes broken or frag-mented in situ, some cracked during exploration due to rapid desiccation. Also, tooth enamel and dentine appeared to be extremely fragile in most maxillae and mandibles retrieved from the locus EM. The deepest layers were excavated under time pressure during last days of the fieldwork season and some bones show clear traces of archaeological tools or damage from the nails used for elevation recording.
The difference in weather conditions between the springs of 2007 and 2008 may have also had some impact on the preservation pattern of human elements. In the former season rains were abundant and wind made excavation very difficult on some days. Further, differencesin temperature between rainy and sunny days made the bones more subject to cracking due

17
to changing humidity. The latter year was very dry and thus excavated bones were less en-dangered by erosion.
Only a few disarticulated and fragmented human bones were found in the trench EM2and no bones came from the trenches EM3 and EM4. All these trenches, however, wereonly excavated for a short time in 2008 and the strata roughly contemporary to EM locus 6 were not reached.
1.4. Area EMS (2007)
Again, a different pattern has been revealed in Area EMS located in the south corner ofthe surviving part of Tell Majnuna. As in Area EM, the trench EMS exposed many ashy strata, sherds and other kinds of waste. It is likely that at the time of the deposition of human bones in EM locus 6=53 the top of the midden was located near this place which exhib-ited more horizontal stratigraphy than the trench EM. About 1.5 metres from the surface, there was a stratum (locus 3.3) containing one small but dense cluster of fragmented humanand animal bones (locus 6), the articulated bones of a leg (locus 6) and a virtually com-plete skeleton of a child (locus 7). To the SE of all these human remains, there was a myste-rious circular construction with thin mudbrick walls, several metres in diameter. Its strati-graphical position, however, remains unknown. Most human elements from the Area EMS were explored and documented by the present author, only a part of the second layer of the dense cluster was excavated by local workers.
The lens-like cluster in locus 6 contained 26 human bones and bone fragments together with more or less equal quantity of animal remains. They were completely disarticulated and fragmented before the deposition and the pre-depositional histories of various fragments were different, some were weathered, others shown traces of plant roots or rodent toothmarks,a few fragments were only slightly eroded. The cluster was very clear, horizontally round in shape and to some extent also in vertical plane, ~1.2m in diameter (Figure 18). Below locus 6 there was a line of three very large mudbricks running from east to west. The cluster of bones was located on and to the north of the eastern brick, although this stratigraphical sequence does not seem to have been intentional.
Human bones in the top of locus 6 were grouped in the eastern part, there were several parallel long bones (the femur on top, femur and fibula some 20cm deeper) and four crania facing north and east in the NE corner. The distribution of human remains in the bottom was more uniform, but bones from the second mechanical layer were also more fragmented. Unfortunately, human elements from locus 6 were crushed by two containers of pottery dur-ing transportation, so the actual difference in the degree of fragmentation between two layers cannot be ascertained.
To the west of the lens-like cluster of bones and ~20cm deeper, but still in the locus 6, there were several animal bones and bone fragments (some with preserved articulations) found in irregular loose clusters, as well as one human skeletal unit including the right femur, patella, tibia and fibula of an adolescent individual (Figure 19). The bones were articulated but no tarsals nor pelvic bones of this individual were found in whole excavated area.
Farther west, close to the NW section of the trench, approximately on the same elevation, almost complete skeleton of a child lay in a disturbed position (Figure 20). The skull was missing, but a small fragment of parietal bone remained to the east of the thoracic vertebrae, so it is very likely that the body was complete at the time of deposition and the skull was later removed. Leg bones were partially within the NW section, but they too were explored.

18
A sandstorm disrupted exploration of the locus 7 and for that reason no good picture of the complete skeleton was taken.
Originally the body was laid on its right side with flexed legs and arms, but several bones were displaced after soft tissue decomposition. Upper limb bones were found close to the sec-tion: the left humerus along the section with distal end slightly broken, the radius and ulna below, with proximal metaphyses to the south of the distal end of the humerus and distal metaphyses below the proximal part of the humeral shaft. All epiphyses were present, but not directly linked to the metaphyses. Only the lesser multangular and navicular were present, the remaining carpals and metacarpals were missing or rather displaced, probably remaining somewhere in the section. The right humerus was missing, the ulna and radius lay parallel to the left pair, but this time no epiphyses nor hand bones were found. Only the left scapula (with unfused coracoid) and clavicle were present above the right forearm midshafts. The scapula was broken PM, south of this bone there was a row of at least five rib fragments, also broken PM. It is likely that the right scapula, clavicle and humerus were originally located in proximity to the skull and they were removed together. The spine was incomplete: no cervical vertebrae survived, 10 sometimes fragmented thoracic, all lumbar and sacral vertebrae were present. They were distributed in an S-shape line, thoracic vertebrae with spinous processes up, lumbar vertebrae dislocated with their upper intervertebral surfaces down and spinous processes north. Most ribs were present and articulated to the vertebrae, although most of them were broken PM, some dislocated.
All the pelvic bones were present, the ilia and sacrum in slightly disturbed anatomical position (right ilium in the bottom), the left ischium and pelvis in the proper position, the right ischium articulated with the ilium, and the pelvis had moved some 10cm to the north. Both legs were hyperflexed, but in proper position to each other, left in west, right in east. However, proximal metaphyses were some 20cm to the north of the pelvis and unfused heads were found in-between. Tibiae and fibulae were located below the femora, the distal ends more towards west with an angle of ~15°. The distal epiphysis of the right fibula was rotated by 180° in the horizontal plane, the right proximal epiphysis of the tibia was moved some 4cm to the north in relation to the metaphysis. No patellae nor distal femoral epiphyses were found, possibly they were located much deeper in the section. The left fibula was broken PM in the proximal one third of the diaphysis, with the distal part directed more westwards with an angle of ~30°, the distal metaphysis was missing. Also, the left tibia was partially crushed in the proximal one third of the diaphysis. Many tarsals and metatarsals from both sides were present, all in a disturbed anatomical position. The right, more complete foot, was found between proximal femoral metaphyses, the left one (calcaneus, talus, navicular) between left femoral metaphysis and left pelvis, somewhat moved westwards.
All observed deviations from the anatomical position suggest that the body was deposed near the top of the contemporary mound, but not buried, rather covered only by thin layer of earth or ashes. The limb bones gradually sloped down after decomposition of the ligaments (both arms and legs were found at an elevation some 10cm lower than the axial skeleton) and the eastern part of the skeleton along with skull was intentionally removed or sloped down more than limbs to the present-day northern section of the trench. Damage to some bones (left tibia and fibula, ribs) may be related to continued human and/or animal activity in the midden. Several snail shells were found close to the bones, there were also many rodent toothmarks and possible single traces of carnivore gnawing.

19
1.5. Summary of data
In total, three incomplete skeletons, at least three irregular clusters of partially articulated bones, at least four large clusters of disarticulated bones, and a number of small clusters or loose bone fragments were excavated in the Areas MTW, EM and EMS. A number of elements retrieved from these contexts varied, most entries in the database come from the Area EM (1733), second in rank was the MT trench explored during the salvage operation (575), but in this case many more fragmented bones were recovered, especially from the spoil dump. Two middle-size concentrations of human remains were found in trenches MTW1 and MTW4, both in the area of previous salvage operation, from which came respectively 187 and 266 elements and skeletal units. A small but important amount of data was col-lected in Area EMS (38 entries). In other trenches only a few human bones were found, 44 in MTW3, 17 in MTW2, only six in EM2.
It is impossible to estimate, even roughly, the number of individuals buried at Tell Maj-nuna and to the west of the mound. Excavated trenches covered only small part of whole area, but in almost all of them some clusters of human remains were found. It is more than likely, therefore, that some deposits of bones remain unexplored. Moreover, the observed pattern is so irregular, that every attempt to speculate about the actual size of human bone deposition area would be ungrounded.
Further, estimation of the minimum number of individuals (MNI) based on excavated bones is not an easy task due to the fact that the recovery pattern was completely different in various contexts, from well preserved and complete bones (as in MTW4 locus 65) down to small eroded fragments retrieved with use of a sieve (as in the MT spoil dump). After the salvage operation, MNI was counted as 24 following the number of crania, excluding frag-ments found in the spoil dump, but including several cranial negatives observed in the section (Sołtysiak 2008). For an MNI estimation from the whole sample of human bones retrieved from the Areas EM, EMS and MTW, a slightly more complicated algorithm has been ad-opted. Usually the MNI is based upon the most frequent single bone in the whole sample. However, in the case of heavily fragmented deposits, first the minimum number of elements (MNE) must be counted and the MNI is equal to the highest MNE score. In studies on ani-mal bone deposits the MNE may be measured as the percentage of the complete circumfer-ence represented by a long-bone shaft fragment, then those percentages are totalled for each portion of a skeletal element (Marean & Spencer 1991). There are also more sophisticated methods based on counts of overlapping sections (Lyman 1994:103-104). In this research each bone was divided into several sections (e.g. 10 sections for a femur: head, neck, greater trochanter, lesser trochanter, proximal, middle and distal shaft, distal metaphysis, medial and lateral condyle). The completeness of each section was scored on a 4-grade scale (0–absent, 1–fragments only, 2–broken, 3–complete). For each section MNE can be counted as the sum of elements with scores 2 and 3, assuming that small fragments (score 1) might came from broken bones (score 2) and thus should not be counted again. For cranium two different ap-proaches have been adopted, the first based on the above described method, the second slight-ly more complicated. The cranium has been divided into three regions (vault, face, base) and the MNE was counted as sum of all elements in which at least two of the three regions were represented by any fragment. Fragment size and state of preservation were here ignored.
The most numerous elements in whole sample were crania, femoral and humeralshafts. Table 3 presents MNE scores for these elements in 19 defined sub-samples. Cra-nial MNE has been counted in both ways: the first is the number of elements with two or

20
three regions present and—to compare—the number of elements in which only one region was retrieved, then follows the MNE based on the two most numerous cranial sections, max-illary alveolus and temporal pars petrosa. Some small clusters and bone scatters were pooled (e.g. all elements excavated during the salvage operation or the elements from the trenches MTW1 and MTW2, all small deposits from a single trench were pooled as a rule), EM locus 6 has been divided into eight arbitrary parts (cf. Table 2). The last column gives the MNI for each sub-sample. Assuming that each sub-sample was deposed separately, the total MNI would be 160, if skeletal assemblages from various clusters were mixed without any restric-tion, the figure of 143 individuals would be more appropriate. However, it is more likely that the bones of individuals deposed in different clusters were mixed only to small extent and only all sub-samples of EM locus 6 should be pooled, which reduces the MNI by 5. If eight negatives observed in the MT trench are added (which is justifiable, because cranial elements from the dump, where they had been moved by a machine cutting the trench, were too frag-mented to be counted), the final MNI figure is 163. Of course, this is only rough estimation of actual number of individuals excavated during three seasons of fieldwork at south-eastern part of Tell Majnuna.
In a deposit of well preserved human bones, in which pair matching may be possible,a much better estimate would be the Most Likely Number of Individuals (MLNI) counted as the product of the number of right and left bones divided by the number of pairs. For sucha figure, standard error and confidence intervals may be approximated (Adams & Konigs-berg 2004). Unfortunately, due to the high fragmentation rate of human remains from Tell Majnuna, pair matching was possible only in exceptional cases, usually when two bones were found close to each other or they bore unusual symmetrical characteristics, like the advanced osteoarthritis in two femora from EM locus 6.

2. Diagenesis
The almost five thousand years which lapsed between the deposition and excavation of human remains at Tell Majnuna were the longest and most stable period in the history of the studied deposits. However, two phases of diagenesis should be defined here: one relatively short when the formation of the site was still in progress which made the environmental con-ditions variable and the second after the abandonment of Tell Majnuna before the end of the Late Chalcolithic period. It may be assumed that during this long second phase of diagenesis, finally disrupted by the activity of Syrian local authorities in 2006, only minor alterations of human remains took place. Since some factors (such as humans or rodents) which affected the human remains directly after their deposition, during first phase of diagenesis, were po-tentially responsible also for biostratinomic alterations, sometimes it is difficult to distinguish between taphonomic effects which took place before and after deposition. Moreover, the borderline between biostratinomy and diagenesis is rather blurred because deposition might have taken place several times in the history of a given cluster of bones. For sake of clarity,I will assume in this report that diagenesis began from the moment of the deposition of a bone in the limits of a later archaeological locus. In such a definition, transportation of bones from one place to another within the limits of the site or outside the site is assumed to be a biost-ratinomic effect, but movements of any kind inside a single cluster of bones (defined as a sin-gle archaeological locus) are treated as diagenetic effects. Taphonomic effects which cannot be precisely credited to biostratinomic or diagenetic period will be discussed in this or the next chapter, according to their relations to better defined effects.
Two major questions concerning early phase of diagenesis will be addressed in this chap-ter. The first one concerns the period of time which lapsed between the deposition of hu-man remains and their complete burial under succeeding strata. Second is how the deposits could have been disturbed by various taphonomic factors before abandonment of the site. Of course, it is not possible to propose a detailed and completely reliable scenario, rather various hypotheses may be discussed with reference to modern forensic cases or experiments (Nawrocki 2009). The review of diagenetic factors will start with chemical and physical al-terations and move to biological agents.
2.1. Physical and chemical factors
In a regular burial context, bone diagenesis is related chiefly to bacterial/fungal activity and water erosion (cf. Mann et al. 1990; Marean 1991; Douglas Price et al. 1992). Bacteria decompose collagen, reorganise the mineral fraction of bone and change the content of ele-ments; fungi and cyanobacteria dissolve the bone matrix (Child 1995, Jackes et al. 2001, Carpenter 2007, Jans 2008, Pitre et al. 2009), and this activity is evident during first 500 years after burial (Hedges et al. 1995). Most important factor in bone diagenesis is the soil chemistry (Child 1995a), but in north-eastern Syria corrosive soils are not common (Ilaiwi 2001). There is some ambiguity whether microbial activity may be accelerated or delayed in disarticulated bones: on one side, microorganisms are more abundant in the soft tissue of intact corpses and may penetrate bones faster (Nielsen-Marsh et al. 2007), but on the other side, the rate of erosion in processed bones is higher which allows easier access for the microbes (Nicholson 1996).
The environment of the secondary human remain deposits at Tell Majnuna was much less predictable than in a typical regular burial, and moreover, many factors other than mi-

22
crobes and soil solutions may have altered physical and chemical characteristics of bone. Apart from the biological factors discussed in the following sections, natural breakage, bone weathering, changes of colour, surface crystalline deposits and element contents in a small sample of teeth were recorded.
Natural cracks and fractures of bone due to rapid changes in humidity have been ob-served during excavations (see Chapter 1), but obviously had also occured in the past, as in the EM locus 6=53 where several bone fragments and teeth were found with regular cut-like or chopped-like surfaces but without adjacent parts (see Figure 21). Such a phenomenon does not occur in fresh bones with well preserved collagene, so it may be concluded that at least some bones from this locus were rapidly exposed for a relatively long time after their original deposition. Although thermal stability in Syrian archaeological sites occurs in strata deeper than 6m, a rapid change in temperature which may cause breakage is not likely below the surface and only the extraction of bone from the soil can cause a vehement increase of temperature and subsequent desiccation (cf. Bollongino & Vigne 2008).
Extensive sun bleaching was rare at Tell Majnuna, only occasional bones were found with weathering stage 1 (cracking) or 2 (flaking) in Behrensmeyer's scale (1978). The only exception is the sample of bones gathered in the dump during the 2006 salvage operation, where even more advanced weathering was common, but this was obviously of recent origin. Although stage 1/2 may last for several years until it moves to the stage 3 (Gifford 1984), the rate of weathering is highly accelerated in direct sunlight (Lyman 1994:360) and bones exposed on the dump during the summer are expected to be strongly eroded. The frequency of bone fragments with observed weathering is presented in Table 4. In most contexts no, or only single, cases of weathering were noted, and only in the dense deposit in trench MTW4, in cluster EM locus 29, and in bones scattered over the whole of trench EM was the fre-quency slightly higher. The sole deposit with significant weathering was MTW3 locus 33 where the incomplete skeleton and some scattered bones were found with a more advanced stage of erosion. However, here the weathering was not caused by exposure to sun but rather by repeated desiccation of remains covered only by thin layer of soil.
Human bones retrieved from the Areas MTW and EMS were light brown in colour, whichis common in north-eastern Syria. A patchwork of light and dark areas has been observed many times and such discolouration, which may had been caused by many different ta-phonomic agents (Nawrocki 2009:288), was not scored. All bones in EM locus 6=53 were brown, dark brown or even black both on the surface and inside (Figure 22). It was not related however to burning of any kind, but to the fact that whole deposit was covered bystrata rich in dark ash. Apart from this context, a black colour was noted only in one fragment from a “black deposit” in MTW3 locus 34, and on one of the many elements in MTW3 locus 33 and in EM locus 4.4. This last fragment was a femoral head with neck, the only example of slightly cremated bone in whole sample from Tell Majnuna. However, it was found in a trash stratum without any dense cluster of human remains and it is likely that this fragment was burnt accidentally.
Occasionally small crystalline deposits were observed on bone surfaces (Table 4). Most of them were light violet transparent crystals, most likely apatite washed out from the bone(cf. Sillen 1989:221), although also newberyite and haematite were observed in archaeo-logical contexts (Edwards et al. 2007). Similar mineral deposits have been quite frequent-ly observed on human remains from north-eastern Syrian sites, especially in deeper stratapenetrated by ground waters (Sołtysiak in print a, b). In one case (EM loc. 6a, layer 2, element 9) the crystalline deposits were distributed along irregular lines resembling root

23
etching which suggests that decomposing products of plant roots may have catalysed the mineral growth (Figure 23).
Apart from large transparent crystals, less frequently observed white microcrystalline de-posits may be found on archaeological bones, especially inside neurocrania. There was one example of such feature in EM loc. 6.1, layer 3, element 15. Although no chemical analysis was performed, this kind of mineral resembles calcium sulphate which may be the com-bined product of soft tissue decomposition and bone demineralisation (cf. Ubelaker 1996:84), or the result of interaction between calcium dissolved in water and organic sulphide-rich deposits (Holden et al. 2006:75). Anyway, the presence of crystalline deposits of any kind indicates that at least occasionally some bones at Tell Majnuna were surrounded by flowing or stagnant water.
Diagenetic changes in chemical components of archaeological bone reflect many factors, some are related to soft tissue decomposition (Forbes 2008), others to interactions between the bone itself and the surrounding soil (Trueman et al. 2004). Nitrogen (usually in am-monium) and sulphur are common fertilizers released to the soil from the cadaver (Forbes 2008) and the intake of ammonium can decrease local soil acidity (Hopkins 2008). After complete skeletonization, calcium, phosphorus and trace elements are exchanged with soil solutions, although the rate of this exchange depends on many factors such as bacterial ac-tivity, soil chemistry and humidity (Lindsay 1979, Kyle 1986, Gill-King 1996, Sanford & Weaver 2000:334-336). Calcium concentration in bone may be increased by the presence of gypsum in the soil (Zapata et al. 2006). The content of calcium and some other metals in bone and in soil may be comparable: the animal bone standard for Zn is 84–95 µg/g, while the concentration of this element in soils amounts 0–900 µg/g, averagely 50–100 µg/g, forBa these figures are 67–92 and 10–1500 respectively. The range for Sr in animal bone is 88–105 µg/g and 50–1000 µg/g in soils, although in Turkmenian saline alkali soils it may be as high as 700–3000 µg/g (standard H5 IAEA, Aubert & Pinta 1978:85-101). The only exception is phosphorus, abundant in bone (100-200 mg/g) and much less common in soils (200 µg/g on average, exceptionally up to 40 mg/g), decreasing with higher weathering in-tensity (Ryan 1983, Ceccanti et al. 2007). Thus, although in the case of metal ions both extrinsic and intrinsic forces can take place, phosphorus is more likely to be removed from, than introduced into the bone. Soil particle size may be an important factor in phosphorus removal, because in a silt-clay fraction this process is highly accelerated in comparison to pure clay or clay-silt-fine sand fractions. A biological standard for Ca/P ratio in human bone is 2.15 (White & Hannus 1983) and any substantial deviation from this figure is generally interpreted as the result of diagenesis.
Content of Ca, P, Zn, Sr, and Ba was analysed in a small sample of human and animal teeth from MT salvage operation and trenches MTW1 and EM as well as in three soil sam-ples from Areas EM and MTW. Analysis was performed by Krzysztof Szostek (Jagiellonian University) with the use of Perkin Elmer ICP AES “Plasma 40” spectrophotometer (for prep-aration and measurement method see Szostek & Sołtysiak in print). The results are presented in Table 5 together with comparative data from Tell Brak Area TW which represent element contents in human deciduous teeth and tooth germs as well as in animal teeth excavated in Late Chalcolithic 2 and 3 strata (Szostek & Sołtysiak in print), and so roughly contemporary to the sample from Tell Majnuna.
Diagenetic alterations in teeth from Tell Majnuna are very high, which may be expected in secondary deposits covered by subsequent strata of waste of various origin. All analysed teeth were demineralised and the Ca/P ratio strongly deviated from the biological standard.
24
The phosphorus content in soil samples, taken from Tell Majnuna, was variable and it is likely that higher amount of this element in soil from EM locus 6 may be related to denser deposit of bones in this context than elsewhere.
Both zinc and strontium were more abundant in teeth than in soil, but in most cases were also above the upper limit of lifetime variability both in humans and in animals. Diagenetic impact on their content is clear not only after comparison to Tell Brak samples, but also by the reversed amount of Sr in a carnivorous and a herbivorous animal (Sr is less and less abundant when moving up in the trophic pyramid) and in the lack of correlation between Ba and Sr. Since soils at Tell Majnuna contained less Sr and Zn than analysed teeth, most likely these metals were concentrated in teeth due to microbial activity. It is possible that barium was subject to different diagenetic processes than other analysed elements. There was a significant difference between Areas EM and MTW in the amount of this metal, witha higher concentration in EM locus 6 (Mann-Whitney U test, Z=2.30, p<0.05). There is also more barium in the soil from this stratum, so more likely this element was introduced into the teeth from the ashy deposit covering the human remains than concentrated by bacteria. In one tooth from the MT cluster H the amount of zinc was exceptionally high (1982 µg/g), but this outlier seems to be purely accidental.
2.2. Plants and animals
Plant root etching is a common taphonomic effect in buried human remains. Sometimesroot remains are present inside marrow cavities or in trabecular bone, but usually only thin sinuous shallow lines remain on the bone surface. They are left by acids secreted by plantroots (Nawrocki 2009:288) or by fungi which decompose roots (Lyman 1994:375). Al-though root etching is responsible for only small-scale demineralisation of bone surface, it may increase erosion and other taphonomic factors (Fisher 1995:43). Penetration of bones by plant roots is observed in advanced stages of body decay, usually after complete skeletoniza-tion (Bass 1996). The intensity of root etching may be a potential indicator of relative burial depth in archaeological bones and the high frequency of this effect in deep deposits, caves or indoor burials means that for a period of time bones were covered by thinner strata or a de-posit was moved from a shallow burial to a secondary place.
The frequency of root etching at Tell Majnuna was moderate (Table 4) and some surplus may have been observed in relatively shallow deposits in MTW4 and EM locus 25 as well as in EMS locus 6 (Figure 24) where one fragment with abundant root traces was mixed to-gether with elements without root etching, some of them bearing instead rodent toothmarks, some with moderate weathering, others with no clear signs of diagenetic effects. It is then very likely that this secondary deposit contained both human and animal bones collected in various places. Surprisingly, in EM locus 6=53 elements with root etching seemed to be more abundant in deeper layers. Since it was also a secondary deposit of disarticulated bones, it is possible that bones which were buried deeper in the primary context, landed on the top after removal to the secondary context.
Occasionally human elements buried at Tell Majnuna were altered by invertebrates. There is large literature about the role of insects in the decomposition of soft tissues (for review see Dadour & Harvey 2008), but only few inconclusive notes were published about their activity as diagenetic factors after complete skeletonization (Fisher 1995:42, Lyman 1994:393-394). The most clear diagenetic effect due to invertebrate activity is tunneling through archaeologi-cal bone (cf. Jodry & Stanford 1992). In a small sample of bones from Assur (northern Iraq)

25
such tunneling was common and some regular holes in crania imitated an initial stage of unsuccessful trephination (Sołtysiak in print c). Insect tunneling may be easily distinguished from perforations by nails or points used during archeological excavations, because the edges are always smooth, without cracks and are smudged with soil.
There are several taxa of insects which may have been responsible for such effects. Scarab and dung beetles may dig tunnels through the soil to reach a corpse (Dadour & Harvey 2008:118-119), but it is not likely that they also drill the bones. West and Hasiotis (2007) at-tributed tunneling to a larva of an unknown beetle. During excavations in trench EM at Tell Majnuna, one yellow larva 3-4cm long was found in the soil (Figure 25) and then identified as possibly a false wireworm. Both wireworms (Elateridae larvae) and false wireworms (some Tenebrionidae larvae) live for many years in soil and some species can drill through compact substances as demineralised bone or mudbrick (Capinera 2008:4234; Thomas 1940; Maria Sterzyńska, pers. comm.).
Earthworms may be excluded because, although e.g. Lumbricus terrestris may dig burrows even 1m deep (Canti 2003), they are not able to drill through the bone. Before further stud-ies it may be assumed that the most likely makers of the tunnels in the bones are wireworms, false wireworms or several species of solitary wasps nesting in hard soils and also able to drill through mudbrick or demineralised bone (e.g. Spilomena subterranea). The length and shape of a wasp tunnel depends on the species, some of them may dig down to 75cm, although most do not exceed 40cm (O'Neill 2001:156-162). There are several species of solitary wasps living in the Near East. In Egypt one Bembix oculata dug a shallow oblique tunnel 22cm long and ~0.5cm broad over a period of 20 minutes (El-Banna et al. 1999), so one wasp may be responsible for many tunnels in an archaeological deposit. Since solitary wasps do not pen-etrate the soil very deeply, the presence of their tunnels may be another potential indicator of temporarily low burial depth.
In human bone deposits at Tell Majnuna a total number of 11 tunnels was observed, most of them in EM locus 6 (see Table 4). As opposed to Assur, here no holes were observed in crania nor in compact bone. In all cases only trabecular bone was affected: thrice in vertebral bodies (Figure 26), twice in various tarsals and in the proximal end of a femur, once in an ilium, in the distal end of a humerus, in the distal end of a femur and in the distal metaphysis of a subadult tibia. Perhaps two different taxa were involved, because in four cases the diam-eter of the tunnel was 5.5–6.0mm, in three other cases ~8mm. Similar to the distribution of root etching, tunneling in EM locus 6 was also most frequent in lower layers, although it is possible that some of tunnels appeared during the time of the excavations. Unlike root etch-ing which develops very slowly, solitary wasps may operate in hours.
Rodents are the next important diagenetic factor. Both in the steppe environment and in human settlements of north-earstern Syria many species of rodents are present (cf. Qum-siyeh 1996) and most of them were likely also present in the Chalcolithic period. The most common rodents are mice, rats (although black rats are thought to be relatively recent immi-grants from India, see McCormick 2003), gerbils (including jirds), voles, hamsters, and perhaps also porcupines. Basing this discussion on owl pellets, the most numerous small rodents in northern Syria and south-eastern Turkey are the social vole (Microtus socialis) and Günther's vole (M. guentheri), as well as the house mouse (Mus musculus). The presence of the subterranean mole rat (Spalax leucodon) should also be noted (Shehab & Al Charabi 2006, Seçkin & Coşkun 2006). Many rodent species nest in burrows, which could damage any archaeological deposit.

26
Occasionally rodents use human remains for nesting purposes (Haglund 1997a), and fre-quently move or remove smaller bones from the deposit (Galloway 1996:146), but the most evident effects of their activity are tooth marks. Rodents gnaw on human bone to acquire minerals (calcium phosphate) and to wear incisors which grow continuously in this taxon (Nawrocki 2009:290). For that reason they prefer prominent crests which are easy to handle and have thick cortical bone (Milner et al. 2000, Klippel & Synstelien 2007:770). However, at least some omnivorous rodents as the brown rat not only use bones as source of minerals but also scavenge on fresh bones and gnaw trabecular bone in epiphyseal areas to acquire marrow (Klippel & Synstelien 2007). In this respect rodent tooth marks may be mistaken with the tooth marks of scavenging carnivores, although rats also feed on small bones as metacarpals or metatarsals which are rarely gnawed by carnivores.
Typical rodent tooth marks are very easy to recognise, they usually have the identifiable form of clusters of double furrows (Figure 27). Carnivore incisors may leave similar traces, but they are less regular and often rounded. Furrows are made by lower incisors and their breadth points to the general size range of gnawing rodent, from 1mm in voles/mice to 5mm in beaver/porcupine (Haglund 1997a). In general, herbivorous rodents avoid bodies in early stages of decomposition and start gnawing no earlier than 12 months after death. In the Uni-versity of Tennessee's William M. Bass Forensic Skeletal Collection, rodent tooth marks were visible in 19% individuals and in virtually all cases PMI (Post Mortem Interval) was over 30 months, and only in one case the PMI was 16 months. Canid tooth marks, however, were observed in all PMI classes (Klippel & Synstelien 2007:771). Thanks to this preference, the frequency or rodent tooth marks may be used as an indicator of exposure or shallow burial in the diagenetic history of given human remains (but one should keep in mind the possibility of rodents gnawing on bones exposed during excavations or in the storage room).
In the sample studied in this report as many as 30 cases of rodent gnawing were observed and their distribution is more or less uniform (Table 4), although there is a small increase in Areas MTW and EMS in comparison to the Area EM. In comparison to root etching and tunneling, this diagenetic effect was observed in upper layers of EM locus 6 which suggests that the surface of this bone cluster was exposed for some period of time after deposition.
As expected, most rodent tooth marks in Tell Majnuna were noted on long bone shafts, especially close to interosseous crests or femoral linea aspera (21/30 cases), four other in-stances were found on sharp edges of cranial bones or mandible, two on ribs and two on the pelvis. Only once were tooth marks found in area rich in trabecular bone and without prominent crest––in this case on the posterior side of a calcaneus (Figure 28). However, here no clear furrows can be seen and it is possible that these tooth marks were made by carnivore incisors. In most evident cases the gnawing was not very intense and only occasionally were larger areas involved. The most interesting case is the skeleton from EMS locus 7 which has rodent tooth marks on the left humeral midshaft and on the right ulna where gnawing in-duced regular bone loss resembling chopping (Figure 29).
2.3. Human factors
After the deposition of the bone clusters, human activity in the neighbourhood of Tell Majnuna continued, as witnessed by thick subsequent strata of waste deposits which accu-mulated within a period of less than 100 years, according to pottery chronology. It is obvious, therefore, that human and occasionally animal trampling may be an important diagenetic factor, especially in those clusters of human remains which were not buried immediately

27
after deposition. There are three main results of trampling: fragmentation of bones, vertical movement and horizontal movement (Gifford-Gonzales et al. 1985). Modern experiment has shown that bones can be more subject to vertical and horizontal movement than lithics or sherds, but are never fragmented (Nielsen 1991). However, there is an obvious differ-ence between fresh and old demineralised bones; the latter being much less resistant than the former, which were used during the experiment. Trampling also produces scratch marks on bones which can sometimes be mistaken for cut marks, but the distribution of such is random and not limited to epiphyseal areas of long bones (Behrensmeyer et al. 1986; Olsen & Shipman 1988; Fiorillo 1989). There were several such scratch marks observed in the Tell Majnuna sample, but they will be discussed together with tooth marks and the (absent) cut marks in the Chapter 3.
Apart from scratch marks, which are not necessarily linked to trampling, but may have arisen during transportation or other manipulations, several more evident results of trampling were observed at Tell Majnuna. On the top of EM locus 6=53 all crania and some other bones were heavily fragmented and crushed (see Figure 17). In deeper layers the state of preserva-tion was considerably better, although some elements were still incomplete or broken. Several elements clearly affected by trampling were also found in other contexts, although never in such a frequency as on the top of EM locus 6=53. There are some examples of crushing (e.g. several elements in MTW3 locus 33, and MTW4 locus 65 element 89, Figure 30) or dislo-cation (e.g. child skeleton in EMS locus 7), occasionally some small human or animal bones were moved into neurocrania (EM locus 6 element 208, MTW1 locus 59.2 element 5).
Other taphonomic modification due to human or occasionally animal activity are shallow punctures, different to cut marks, tooth marks, percussion marks or percussion notches (cf. Capaldo & Blumenschine 1994). Usually they are wide and shallow, irregular and sometimes hardly visible due to erosion, although clearer examples have been noted (Figure 31). Most of these are most likely related to trampling, bone-to-bone strokes during deposition or to damage caused by pottery thrown into human remain deposits, although some such damage may have originated in the biostratinomic phase.
The frequency of shallow punctures is presented in the Table 4. These were most abun-dant in MTW1 locus 66 and in MTW4 locus 65, and therefore in the two clusters of par-tially articulated skeletons. No spatial pattern was noted in MTW4 locus 65 which had been divided into 7 mechanical layers and shallow punctures were present throughout. In comparison, in EM locus 6=53 the punctures seem to be more abundant in deeper layers. Shallow punctures were observed only in larger long bones (femur, humerus and tibia) and in neurocrania, never in smaller bones, with exception of one clavicle and one radius (Figure 32). Such a pattern suggests that large long bones and crania were more exposed to various strokes before the complete burial of the deposits.


3. Biostratinomy and deposition
All human remains retrieved from Areas MTW, EM and EMS with only two possible but not likely exceptions (MTW3 locus 33 and EMS locus 7) were found in secondary de-posits. Moreover, there are many pieces of evidence that various factors strongly affected bo-dies buried at Tell Majnuna between death and final deposition. These factors are discussed in the present chapter.
There is a very distinctive difference between biostratinomic histories of bodies buried ina regular manner a few hours or few days after death and bodies exposed for a certain time on the surface. The former are subject to very small if any macroscopic changes in bone tissue (although decomposition of collagen, lipids, etc. begins already at this stage), the latter may be strongly modified by invertebrates, carnivores, humans and many other factors. Many examples of biostratinomic effects were observed in the sample of human bones and teeth retrieved from Tell Majnuna.
Research on factors which modify bones between death and burial is supported by mod-ern case studies and experiments based on actualistic approach. The most abundant bulk of literature concerns biostratinomic factors which affected fossil animal assemblages related to hominids (cf. Egeland 2007), but there are also several papers about human forensic cases (cf. Haglund 1997). However, biostratinomic models and scenarios developed in these two areas of research are rarely used in the interpretation of archaeological secondary deposits of human remains. Only recently have methods of analysis of mixed and fragmented bone assemblages, developed in archaeozoology, began to be used in research on human remains (Outram et al. 2005, Kansa et al. 2009).
In forensic literature, there are many attempts to establish a scale for postmortem inter-val (PMI) degree of changes in soft and hard tissue (Galloway 1996, Bass 1996), although the differences in rate of decomposition even in one location makes this estimation ratherimprecise (Ubelaker 1996:80). Moreover, this rate may differ between outer and inner bodies if they are exposed in a cluster (Lyman 1994:146). It was observed that in arid and semi-arid areas bloat and post-bloat occurs in the first 10 weeks following death, skeletonizationbetween second and ninth month (Galloway 1996, scale based on 468 forensic cases from the Sonora desert).
Decomposition of soft tissue and modifiation of hard tissue (bones and teeth) in exposedbodies/carcasses may be related to various microorganisms, fungi and insects (Lyman 1994:140), but most important biostratinomic factors are carnivorous animals (chiefly ca-nids, felids and vultures) as well as humans. All of them leave some more or less distinguish-able marks on bones: human cut marks are most evident, scratches left by vultures may be most easily mistaken with diagenetic effects.
For each element retrieved from Tell Majnuna biostriatinomic effects were described and occasionally measured. No comparative sample for damage pattern induced by fauna of north-eastern Syria was available, only anecdotal evidence from Tell Marwaniye (Sołtysiak 2008), so each modification was also photographed for further comparisons and verifica-tion. Modern experiments with both experienced analysts and beginners have proven that repeatability of assessments is high or very high (Blumenschine et al. 1996), although in fossil assemblages it may be substantially lower than in fresh bones due to erosion and diagenetic effects (cf. Egeland 2007:45-46). Apart from cut marks and tooth marks, also fragmenta-tion, preservation pattern, presence of articulations and spatial distribution were scored ina consequent way. In EM locus 6=53 a number of human bone tools was found and they will

30
be discussed in a separate section. Except this evident anthropic modification and obviously human effort in transportation and deposition of all remains in the midden, the majority of biostratinomic effects at Tell Majnuna is of animal origin.
3.1. Tooth and beak marks
The presence of carnivore tooth marks on bones is an unquestionable indicator that the human body was exposed for a certain period of time between death and deposition. Scav-enging vertebrates feed on a fresh or skeletonised corpse, between there is a bloat phase with increased activity of invertebrates and suspended vertebrate activity (Morton & Lord 2006). Early phase of scavenging is related to muscle and other soft tissues consumption, and this may produce punctures or scratches on bone. During the late phase the animals try to reach red marrow in cancellous bone (chiefly long bone epiphyses) or yellow marrow inside med-ullary cavity. As a result, epiphyses may be completely gnawed with distinct furrows left on surviving parts and shafts fragmented, usually with more or less clear spiral fractures (Haynes 1980, 1983). Apart from bone modifications, scavengers may be responsible also for scatter-ing of remains and disarticulation (Haglund 1997).
There are few potential scavengers inhabiting north-eastern Syria, chiefly from the Cani-dae family, as dog (Canis familiaris), jackal (Canis aureus), wolf (Canis lupus) and four species of foxes (Vulpes sp.), also striped hyena (Hyaena hyaena) (Bueler 1973; Qumsiyeh 1996). Felidae, including caracal and wild cat, are less likely to feed on human bodies. In the past lions (Panthera leo persica) lived in the area too, but rather far from human settlements. Also the Syrian brown bear (Ursus arctos syriacus) may be included as a potential but not probable scavenger. On the other hand, carnivorous birds may have been active in human body scav-enging, among them the black vulture (Aegypius monachus), griffon vulture (Gyps fulvus) and Egyptian vulture (Neophron percnopteros). Eagles are also present in north-eastern Syria and may be included among occasional scavengers.
Although no study of scavenging has been undertaken in north-eastern Syria, some re-sults of research on African and North American species may be helpful in an interpretation of biostratinomic effects in the sample of human remains from Tell Majnuna (cf. Haynes 1980a; Brain 1981; Haglund et al. 1988; Milner & Smith 1989). It is virtually impossible to assign any kind of modification to a unique species, but at the very least it may be possible to distinguish between small (felids, canids), medium (canids) and large (hyena, large felids) scavengers. In general, felids make less damage to bones than canids, and damage by hyenas, which crush shafts, is greatest of all (Haynes 1983:171; Lam 1992; Marean et al. 1992). Foxes may dig out bodies and scatter bones or bone elements, but no identifiable tooth marks of these animals were observed on human bones (Svoboda 2008:30).
Tooth marks of carnivorous mammals may be divided into four categories: (1) punctures, perforations of flat bones by canines or carnassial teeth, (2) pits, shallower and smaller marks left by tips of teeth, (3) scoring, linear and usually parallel scratches transverse to the longaxis of the bone, (4) furrows left by cusps of cheek teeth, usually found on the ends of long bones (Haynes 1980a), in case of advanced gnawing the furrows are replaced by crenulated edges in diaphyses (Pickering & Wallis 1997:1118, Egeland 2007:47). Both scores and fur-rows are U-shaped in cross section and differ in this respect from V-shaped cut marks (Po-biner 2007:167). Intensive gnawing of shafts may produce spiral or green fractures, although these are not diagnostic marks of scavenging. Spiral fractures can be also of human origin

31
(Ubelaker 1996:78) or induced by trampling, especially in more advanced stages of decom-position (Haynes 1983a).
The sequence of human body alteration due to canid scavenging appears to be quite pre-dictable, at least in forensic cases in the modern USA. William Haglund (1997; Haglund et al. 1989) has proposed the following five grade scale: (0) no scavenging, (1) destruction of the ventral thorax, 1–2.5 months, (2) lower extremities fully or partially removed, 2–4.5 months, (3) all elements disarticulated except for segments of the vertebral column, 2–11 months, (4) total disarticulation, after 5 months. However, the assessment of the postmortem interval by the sequence of scavenging is not precise due to many factors which may accelerate or delay the process (Haglund 1997:379).
Advanced scavenging may be characterised by the scattering of elements (Haynes 1982:276). Especially in cases of high competition between scavengers some parts of a body are transported by animals away from their original location. In most forensic cases the bones have been found at a distance less than 100m (Haglund 1997:372, 377), but such may be related rather to scene examination restraints than to actual transportation abilities of scav-enging animals. Hands and feet are most easy to separate and scatter (but are also easiest to miss during bone retrieval), whole upper limbs may be also removed as a unit and for that reason they are represented less frequently than lower limbs. Crania have the highest survival rate which may be an artifact of discovery and recognition (Haglund 1997:375), but it is also true that this part of the body is less interesting for carnivores.
Also in modern forensic cases a negative correlation between human settlement density and the presence of animal scavenging has been observed (Haglund 1997:378), but it is not necessarily a general rule, because domestic dogs may also act as scavengers. Some wild animals (such as coyotes in the US, but perhaps also jackals in the Near East) avoid human smell and their scavenging activity may occur only in advanced stages of decay (Galloway 1996:146), but again this is not the case for domestic dogs and larger carnivores as lions or hyenas.
Scavenging animals damage cancellous rather than compact bone and especially epiphy-seal regions of long bones are partially or completely gnawed with furrows on the destruc-tion margin and punctures or pits close to the margin (Haglund 1997:375). In general, the intensity of tooth marks and other symptoms of scavenging of bones is related to two factors: surrounding tissues and the nutritional value of a body part. For example, patellae are ex-posed and easy to remove in early stage of scavenging, while femoral heads are protected by acetabula and for that reason their gnawing is possible only in advanced stage of scavenging (Haglund 1997:372). On animal carcasses tooth marks are often more frequent on upper limb bones (humerus, femur), less frequent in intermediate bones (radius, ulna, tibia) and least frequent in metapodials, which is consistent with the distribution of meat and marrow (Blumenschine 1986, 1986a; Pobiner 2007:200; for different pattern see Janjua & Rogers 2008). By analogy, it may be expected that human lower limbs with more massive muscles should be more affected by scavenging than upper limbs.
In modern forensic cases human crania are only occasionally damaged by carnivorous animals, but are often disarticulated from the mandible, while the atlas and axis are usually intact. The gnawing of scapula extends from medial to lateral side and on the humerus the head and greater tuberosity go first, then trochlea together with ulnar oleocranon process. The acetabular rim resists more frequently than the remaining parts of the pelvis, while gnaw-ing of the femur begins with the greater trochanter, then extends to the neck and head on the proximal end and both condyles in the distal end. Spiral fractures are frequently observed in smaller long bones, such as the ulna, radius and fibula (Haglund 1997:374).

32
The pattern of damage caused by various species of carnivorous animals may differ and several specific scavenging behaviours were recorded by observers of modern animal carcasses. Canids rarely fracture shafts trying to reach the yellow marrow, usually they gnaw out only epiphyses, leaving the shaft as a complete cylinder with furrows on both margins and some-times polished edges (Haynes 1980:349, 1983:167). If food is easily accessible in time of consumption, the carcass may be utilised only to small degree (Haynes 1982). In vertebrae, chiefly spinous processes are damaged, transverse processes may be broken, but without clear tooth marks (Haynes 1980:344). Usually only the proximal end of tibia is gnawed, while the distal end remains intact, sometimes even with some meat present (Haynes 1980:347). The femoral head and one of femoral condyles may also survive (Haynes 1983:167). Dogs and wolves damage bones to greater degree than coyotes or jackals.
The most important difference between canids and hyaenids is that the latter feed on yellow marrow and leave many more tooth marks on compact bone. In the first phase they produce impact depressions by their cheek teeth, then they crush shafts into small pieces and chew some of them (Haynes 1983:166; Binford et al. 1988). The common result of such behaviour are spiral fractures which together with a lack of the facial part of crania and the enlarged foramina magna were interpreted as scavenging of hominids from Zhoukoudian by cave hyenas (Boaz et al. 2000). Both canids and hyenas can produce much more intensive furrowing in epiphyses than lions (Domínguez-Rodrigo & Piqueras 2003:1389). The latter leave few but relatively deep grooves on bones and do not gnaw diaphyses but occasionally scratch them. Lions also damage the femoral head more frequently than other carnivores and scrape off trochlear rims with their carnassial teeth (Haynes 1983:169).
The pattern of damage depends not only on the scavenger species involved, but also on the level of competition. In the analysis of animal bone assemblages, three parameters are considered: (1) the frequency of fragments with any tooth marks, (2) the distribution of tooth marks, (3) the ratio of limb bone ends to shafts (Blumenschine & Marean 1993; Lupo 1995; Faith et al. 2007). In assemblages with no animal scavenging, there are no tooth marks and a high end-to-shaft ratio. A low level of competition is indicated by a low end-to-shaft ratio and a high number of tooth marks, because the carcass is consumed without scattering. In the case of high level of competition, the scavengers transport limb ends for consumption elsewhere, and low end-to-shaft ratio is then accompanied by small number of tooth marks (Blumenschine 1988; Blumenschine & Marean 1993; Lupo 1995, cf. also discussion in Lupo & O'Connell 2002; Domínguez-Rodrigo 2003; O'Connell & Lupo 2003).
Several authors have tried to find a method of distinguishing between scavenging species on the basis of either the pattern of damage or tooth mark measurements (Haynes 1983; Sel-vaggio & Wilder 2001; Domínguez-Rodrigo & Piqueras 2003; Faith 2007; Pobiner 2007). Most attempts have been focused on East African fauna and aimed at the reconstruction of interactions between fossil hominids and carnivores (cf. Pobiner & Blumenschine 2003). However, at least some observations may be transposed to the scavenging taxa of the Near East. In general, lions and hyenas produce tooth marks chiefly on diaphyses, small canids and felids (as jackal and cheetah) only on epiphyses, leopards equally on diaphyses and epiphyses (Pobiner 2007:188, Faith 2007). Lions and hyenas use their premolars for bone cracking and hyenas may crush diaphyses into pieces, dogs destroy only epiphyses and occasionally leave tooth marks on diaphyses (Pobiner 2007:170).
The upper canines of all carnivores are oval in section; lower canines are more variable: triangular in canids, rectangular in bears, triangular or oval in felids (Murmann et al. 2006). However, these differences of shape are not clear enough on bones to be of any practical

33
use. On the other hand, the dimensions of tooth pits may be helpful to distinguish betweensmall (cheetahs, jackals), medium (dogs, wolves) and large (hyenas, lions) carnivores (Selvag-gio & Wilder 2001; Domínguez-Rodrigo & Piqueras 2003). Bone density must be taken into account in an interpretation of tooth pit size, because differences between marks in com-pact and cancellous bones produced by one species may be greater than differences between tooth marks by small and large animals in equally dense bone. However, this problem is quite easy to control in actual research.
Small tooth marks (under 4mm) are made by all carnivores except lions, but are most common in bone samples gnawed by small canids (jackals) and middle-size felids (cheetahs, leopards). Bears, dogs and baboons are responsible for most marks between 4 and 6mm and larger marks are attributed chiefly to hyenas and lions (Domínguez-Rodrigo & Piqueras 2003). These differences are statistically significant (Pobiner 2007:205). On the other hand, tooth score lengths and widths are not variable enough to be useful in carnivore taxa identi-fication (Pobiner 2007:202).
In the studied sample of human bones from Tell Majnuna tooth pit maximum diam-eter has been measured with 0.5mm accuracy in 30 cases while both length and breadth ina further 17 cases. Only tooth marks in cancellous bone (chiefly epiphyses of long bones and pelvis) were measured. The sample of measurements fits well with normal distribution (Fig-ure 33), but there are three outliers above 7mm. Small differences between tooth mark size in EM (N=27, mean 4.81, s.d. 1.46) and MTW (N=20, mean 4.98, s.d. 1.79) is statistically insignificant (t=0.36, p=0.72).
The size of tooth marks in cancellous bone at Tell Majnuna was compared to measure-ments of pits attributed to known taxa (Table 6). The mean maximum diameter of 4.88mm is almost identical with mean diameter for large dogs, although mean tooth mark size of bears is also similar. On the other hand, mean diameters of tooth marks by hyenas, jackals and lions are statistically different. Breadth to length ratio is not variable enough to distinguish between known taxa, and ratios measured in Tell Majnuna are not statistically different from any taxon. However, tooth pits measured at Majnuna appear to be slightly more circular than these attributed to all taxa and perhaps this difference was due to erosion which affected archaeological bone and not the modern carcass. The average size of pits suggests that dogs were the main scavenging animals in the Tell Majnuna sample, but the contribution of other taxa cannot be excluded only on the basis of tooth mark measurements. Although observed outliers point to larger carnivores as striped hyenas, lack of diaphyseal fragmentation makes unlikely their substantial participation in scavenging at Majnuna.
All four categories of tooth marks were present in the sample. Scoring (Figure 34) was not common, perhaps due to subsequent erosion which obliterated tiny lines, pits (Figure 35), punctures (Figure 36) were averagely frequent, while furrows were most abundant (Fig-ure 37). The presence or absence of any tooth mark in a given bone unit was scored in ac-cordance to the following scale: (0) no damage, (1) modern or unknown damage, (2) ancient damage, no tooth marks, (3) ancient damage, possible tooth marks, (4) clear tooth marks. The frequency of last two grades has been counted for six contexts (EM locus 6, EM other loci, MT rescue operation, MTW1, MTW4, other areas) and detailed figures for all defined units of bones with at least one tooth mark are presented in Table 7.
The observed carnivore gnawing intensity is quite variable at Tell Majnuna (Figure 38). There are no clear and few possible tooth marks in bones excavated in MTW2 and MTW3. Also in the sample retrieved during the 2006 rescue operation very few bone units were clearly scavenged. In the latter case modern damage obviously obliterated most tooth marks,

34
especially in the spoil dump collection. Obversely, in MTW1 nearly 13% of all bone units had more or less clear scavenging marks. In the largest bone deposits (EM locus 6, EM other loci, MTW4) the frequency of tooth marks was less variable and near to the general mean 6.87% (520 per 7571 bone units). The difference in frequency between the three most im-portant clusters of human bones (EM locus 6, MTW1 and MTW4) appears to be statistically significant (χ2=17.05, p<0.0002) but only due to high number of tooth marks in MTW1, for the two largest clusters (EM locus 6 and MTW4) χ2=0.51, p=0.476.
Scavenging distribution is not uniform. The most affected parts of the skeleton were thepelvis together with the proximal femur and knee area, to a lesser extent also the tarsus, elbow and shoulder (Figure 39). Such distribution of tooth marks is consistent with the volumeof muscles available for consumption. Some differences between the major clusters havebeen observed: in MTW4 hip bones (os coxae and proximal femur) were more affectedthan the knee area (distal femur, patella, proximal tibia and fibula), in EM locus 6 sucha situation was inversed, in MTW1 both parts of the body were equally scavenged (Fig-ure 40). For both body parts the differences are statistically significant (hip area: χ2=11.21, p<0.005; knee area: χ2=7.76, p<0.05), although the small number of knee bones from MTW1 must be kept in mind.
In spite of these differences, the scavenging pattern in EM (locus 6) and MTW (MTW1 and MTW4 pooled together) is very similar. The correlation for all 80 bone units is not veryhigh (rs=0.46, p<0.00005), but for 56 units with both n>10 Spearman's rs=0.64 and for 26 units with both n>20 this figure is as high as 0.83. This rapid increase of Spearman's rank correlation coefficient when scarcely represented units are rejected points to general unifor-mity of scavenging pattern in both compared areas and the random character of differences in small unit samples.
More detailed analysis of the scavenging pattern is possible in femora which were com-mon in the sample from Tell Majnuna and frequently gnawed by carnivores. Gary Haynes noted that in all animals the degree of damage to this bone may be used as reliable indicator of the consumption progress: in light utilization only the greater trochanter is gnawed, in medium utilization grooving of the trochlear rims also appears, in heavy utilization the femo-ral head may be removed and the trochlear area completely gouged out (Haynes 1980:346). Apart from the general documentation of tooth marks, a specified 5-point scale for proximal (Table 8) and 4-point scale for distal femur gnawing (Table 9) has also been used in analysis of the Tell Majnuna sample.
Both in Areas EM and MTW more than 80% of proximal femoral ends were gnawed by animals, but more advanced damage can be observed in EM (Figure 41a). However, this difference is not statistically significant (with pooled grades 1+2 and 3+4 χ2=4.33, p=0.228, with pooled grades 0+1+2 and 3+4+5 χ2=3.28, p=0.070). Further, gnawing on distal fe-moral ends was more intensive in EM, although here the difference concerns less advanced cases of scavenging and in the most advanced stage there is even a small dominance of MTW femora (Figure 41b). This pattern is statistically significant (with pooled grades 0+1+2 χ2=10.46, p<0.01) and may reflect slightly more heavy utilization of bodies in the Area EM. However, this pattern is not completely clear. Surprisingly in Area MTW almost no transi-tional grades were observed in distal femoral ends: bones were either intact or heavily con-sumed. A completely different pattern appeared on the proximal ends where transitional grades were most frequent. In Area EM distribution is clearly more uniform. This peculiarity may be in some way related to the difference in scavenging pattern between the hip and knee area in EM locus 6 and MTW4. Thus, although the utilization of bodies (reflected by overall

35
frequency of tooth marks) in both contexts was similar, the sequence of scavenging may have been slightly different. It is possible that this reflected dissimilarity in competition level or in scavenging period, but no conclusive answer can be offered at the present stage of research.
Long bone diaphyses were usually intact, sometimes broken due to natural processes or during excavations. There were very few spiral fractures or tooth marks observed in midshafts, and it is unlikely, therefore, that hyenas contributed significantly to the scavenging of human bodies eventually buried at Tell Majnuna. The pattern of gnawing and tooth mark size point quite clearly to larger canids (e.g. dogs or wolves) as the most important animals involved in consumption. The high frequency of tooth marks and the low end-to-shaft ratio also suggest a low level of competition between animals.
Bone modifications by vultures are much less prominent and much more difficult to recognise than mammal tooth marks. In an experiment with pigs and goat exposed for scav-enging by North American vultures (Coragyps adratus and Cathartes aura) the birds came to the carrion after ~24h and in 3–27h brought to complete skeletonisation. The disarticula-tion sequence was different to that in mammal scavenging: it always started with mandible, then the cranium, scapulae, and front limbs. Two kinds of marks were left on bone surface by beaks: (1) shallow linear scratches up to 4 cm in length, most frequent on the crania and mandibles, (2) longer lines of color change on the surface of the bone, resembling root etch-ing but more regular (Reeves 2009).
A much more limited experiment was undertaken in February, 2008 in the Garden of Polish Fauna, Bydgoszcz, Poland. We exposed a fresh cattle head for scavenging by a griffon vulture (Gyps fulvus) and after two weeks bones were retrieved, cleaned and inspected. Only a few shallow scratch marks up to 2cm in length were found (Figure 42), and they closely resembled results obtained in the North American experiment.
Beak marks are very easy to obliterate by diagenetic processes and shallow scratches may result in trampling, so the presence of vulture scavenging in archaeological bone assemblages is very difficult to prove. Only in cases of known traditions of body exposure to vulture scav-enging (as in Zoroastrianism) is it possible to interpret cautiously shallow scratch marks as traces of bird beaks. One example is a Sasanian ossuary excavated in Bushehr, Iran (Molleson & Simpson in print).
In human bone deposits at Tell Majnuna short shallow linear scratches were observed in about 40 elements, but in most cases they were accompanied by pits and furrows and should, therefore, perhaps be recognised as mammal carnivore scores. Moreover, they were present chiefly on long bones or on os coxae and rarely on the crania and mandibles. It must be noted here that eroded linear scratches may imitate vascular grooves, which were very frequent in femoral and tibial medial midshafts as well as in frontal bones at Tell Majnuna. After sorting out tooth scoring and unclear shallow lines in areas where vascular grooves are expected, there remains only one frontal bone (MTW4 locus 65, layer 1, element 90) with several short pos-sible beak linear scratches (Figure 43, note also vascular groove).
3.2. Preservation pattern
Apart from direct evidence (tooth marks), carnivore activity may be also deduced from bone preservation pattern. In a sample of modern forensic cases collected in the US Pacific Northwest, skulls were preserved in all cases (although such may be due to the lesser likelihood of the recognition of a decayed decapitated body as human by an accidental finder), upper extremities less frequently than lower extremities, hands and feet were often missing, either
36
due to transportation for consumption elsewhere or because these are easier to overlook at the scene (Haglund 1997). Also in scavenged animal bone assemblages in the Amboseli Park, Kenya crania are the most frequent among surviving elements, followed by mandibles and the two upper cervical vertebrae. Long bones are usually represented more frequently than the axial skeleton. The more intensive the carnivore activity, the lower the axial skeleton to cra-nium ratio and the more evident fragmentation (with hyenas involved) and the lesser propor-tion of distal radius and tibia (Faith & Behrensmeyer 2006). In secondary deposits the size of retrieved elements may also affect their frequency: it is much easier to overlook or lose during transportation a small toe segment than the much larger femur or cranium. Another factor of differential preservation is bone density: units with a high proportion of cancellous bone (such as long bone epiphyses or sternum) are more vulnerable to destruction (Mays 1992).
The state of preservation of the sample of human bones from Tell Majnuna has beenscored for each bone unit on a four grade scale: (0) absent, (1) fragments only, (2) broken, (3) complete. Sums of these scores for the defined bone units in 20 contexts are presented in Table 10. The minimum number of individuals represented by a given unit may be obtained by dividing by 3. This data has been extracted to obtain percentage frequencies for the 26 basic parts of a skeleton (after Haglund 1997) in the following manner: sums of scores for all units of a given bone or skeletal portion have been divided by the product of highest score (3) and three variables: the number of bones in a portion (e.g. 12 in thoracic vertebrae, 2 in femora), the number of defined units (e.g. 2 in thoracic vertebrae, 10 in femora) and the minimum number of individuals in a context. The preservation pattern of bones wasthen analysed together with three comparative samples: 18 modern forensic cases of hu-man bodies scavenged by animals in the US Pacific Northwest (Haglund 1997:Table 3), 25 skeletons from a regular cemetery excavated in the Area EME on the top of Tell Majnuna (see Figure 1) and dated probably to the Late Chalcolithic 3, and 11 skeletons from another regular cemetery excavated at Tell Barri ~8km to the north of Tell Brak and dated to the Early Bronze Age (Sołtysiak in print a). Bone preservation frequencies in the comparative samples are presented in Table 11.
Preservation scores in almost all 20 contexts from Tell Majnuna are positively correlated to each other, the only exception is the couple of EM loc. 6(3) and the scattered bones from all EM loci except 6, 25 and 29 (referred to as EM others) where rs=-0.04. Most positive correlation coefficients are statistically significant. Only three contexts clearly differ from others: scattered bones from trench EM, scattered bones from trench MTW1 and EM loc. 25. In two former cases dissimilarity in preservation patterns is related to the small number of bones and the heterogenous character of these sets which include single elements from many various loci. EM loc. 25 contained chiefly crania and cranial fragments, while the relative number of other bones was much lesser than elsewhere.
There is also a positive correlation in the preservation pattern between all 20 Tell Majnuna contexts and the set of modern US scavenged human remains. Only in two instances (scat-tered bones from trench EM and scattered bones from trench MTW1) is this correlation insignificant. Conversely, in all but one case there is no significant correlation between the Tell Majnuna contexts and the EME top cemetery and the only exception is the negative cor-relation between the EME cemetery and EM loc. 6(4). The preservation patterns in the EME cemetery and in the set of modern forensic cases are negatively correlated (rs=-0.45, p<0.05), and there is a clear positive correlation between two regular cemeteries (rs=0.51, p<0.05). There is also no correlation between the cemetery at Tell Barri and most Tell Majnuna con-texts, and the two exceptions are the set of scattered bones from trench EM (rs=0.44, p<0.05)

37
and the topmost layer in the EM loc. 6 (rs=0.44, p<0.05) which contained more damaged elements than deeper layers and was similar in this respect to the cemetery at Tell Barri which contained distinctly more damaged skeletons than the EME cemetery. The small negative correlation between the Tell Barri cemetery and modern forensic cases is not significant.
This clear difference between human bone clusters from Tell Majnuna together with the modern forensic sample and the two regular cemeteries has been corroborated by principal component analysis (PCA). For the set of 20 Tell Majnuna contexts and 3 comparative sam-ples, four factors had eigenvalues greater than 1, but the first factor explained more than 50% of variance. Factor scores for bone preservation frequencies are presented in Table 11. The first factor was negatively related to the frequency of crania, femora, mandibles and lumbar vertebrae, which were most abundant in Tell Majnuna clusters (see Figure 44) and positively related to the frequency of carpals, tarsals, hand and foot bones, sterna and patellae, which were scarce in Tell Majnuna clusters. All but one Tell Majnuna context and modern forensic sample had high negative loadings of this factor, again only the set of scattered bones from trench EM appeared to be somewhat different (Table 12). The second factor was related to the high frequency of mandibles, humeri, femora and tali and to low frequency of crania, atlases, lumbar vertebrae, innominates, sacra and sterna. Such a pattern may be characteristic of cemeteries with poorly preserved skeletons where cancellous bone is more likely to be damaged than compact bone. This factor explains the covariance of Tell Barri and the set of scattered bones from trench EM. The two other factors explain only a small fraction of vari-ance and seem to have a random character. Bone frequencies in the EME cemetery are not clearly related to any factor.
In the diagram showing the first and second factor loadings (Figure 45) the clusters of human bones from Tell Majnuna are grouped together with the sample of modern forensic cases and are distant from both regular cemeteries. This complete discrimination is due to the first factor. The transitional position of the heterogenous set of bones from trench EM, between other Tell Majnuna contexts and the Tell Barri cemetery, possibly suggests that this small subsample contained not only scavenged remains but perhaps also bones from a regular cemetery removed accidentally to the midden (EM loc. 51).
Interestingly, the coefficient of variation is higher in the Tell Majnuna contexts than in comparative samples (Table 12). This peculiarity may be partially related to a smaller sample size, but even in the largest clusters of bones this coefficient was quite high. Obviously, the preservation pattern was far from uniform, farther even than in the modern forensic sample, and most likely not only scavenging but also successive selective bone retrieval and transpor-tation as well as erosion increased the relative frequency of large bones, and decreased the frequency of small bones.
Apart from the preservation pattern, the completeness of excavated elements has also been analysed as an average percentage of the preserved units per whole bone in a given con-text. Completeness was measured only for the four most frequent elements: crania, femora, humeri and ossa coxae (Table 13). The most complete were elements retrieved from MTW1 loc. 66 and MTW4 loc. 65, that is, from clusters of partially articulated skeletons. In addi-tion, elements in Area EMS were quite complete, although here two skeletal units were found together with a cluster of completely disarticulated and damaged bones. The most fragmen-tary elements were those collected from the spoil dump during the 2006 re-scue operation, especially crania, while the shafts of the long bones were usually found in much better condi-tion. The completeness of crania and innominate bones was more variable than the complete-ness of long bones, a situation most likely due to differential resistance of compact and can-
38
cellous bone. Except for MTW1 loc. 66 and MTW4 loc. 65 the distribution of completeness estimations was more or less uniform across the whole sample. The only noteworthy pattern may have been observed in EM locus 6 where, in the topmost layers, crania were much less complete than in the deeper strata. It is likely that this cluster of bones had been not deeply buried, or had been exposed for some time after deposition and surface bones were damaged by trampling and/or by the pressure of successive waste deposits.
The proportion of crania or cranial fragments in defined contexts has been counted as the number of elements (irrespective of completeness) and not as a sum of preservation scores in defined bone units. The only clear tendency is the very high number of crania in EM locus 25, almost half of all retrieved elements. It is also evident that less crania than elsewhere were found in MTW1 locus 66 and in MTW4 locus 65 which is related to the fact that virtually all crania in these contexts were complete or nearly complete and in other contexts there were chiefly cranial fragments.
In some contexts side differences in preservation scores have been observed (Table 13), but it must be kept in mind that in small clusters even one well preserved limb may skewa count which is based on preservation scores in many defined bone units. Only in two cases (EM loc. 6(7) and MTW4 loc. 65) does predominance of left side seems to be significant,but no valid interpretation of this deviation may be offered. For sure this was not likely an effect of animal scavenging.
Some forensic anthropologists explored the possibility of the use of postmortem tooth loss (PMTL) as a PMI indicator (McKeown & Bennett 1995; Duric et al. 2004; Forbes 2008a). So far this is only preliminary research and it is not very likely that this effort will ever end in establishing any precise method, but obviously teeth may be lost after soft tis-sue decomposition, especially if human remains are moved to another place or manipulated in another way (teeth are sometimes lost also during archaeological excavations). Thus, the frequency of PMTL may be used as a potential indicator of movement intensity during the advanced decomposition phase before burial. Of course, this movement may have been due to both animal and human activity. Additionally, frequency of postmortem enamel/dentine damage should be also related to impact of biostratinomic factors.
Both PMTL scores and enamel/dentine fractures have been recorded for human remains found at Tell Majnuna. Usually it was possible to distinguish macroscopically between ante-mortem (small and smooth) and postmortem (large and sharp) enamel fractures, but com-pletely reliable differentiation in many cases could not be performed without SEM photo-graphs. Apart from which tooth was involved, the position of a fracture was also noted. In total, 1654 permanent teeth were retrieved from all studied contexts (both still present in alveoli and loose teeth) and a further 921 teeth were missing from preserved alveoli. Ante-mortem tooth loss was omitted. Maxillary teeth were usually about two times more frequent than mandibular teeth (e.g., 440 vs 214 in EM loc. 6, 158 vs 77 in MTW4).
Table 14 shows the number of complete teeth, broken teeth and PMTL scores in eight Tell Majnuna dental samples. The observed differences in frequencies are very clear (χ2=172.4, p<0.000001, all tooth categories pooled) and four levels of movement intensity may be speci-fied (Figure 46). Obviously, the cluster of partially articulated skeletons in trench MTW4 was the least manipulated or scattered, followed by EMS and “EM others” (which includes here small clusters EM loc. 25 and EM loc. 29). The third level consists of MTW1 and the MT section which actually was a part of MTW1, and last, there are three contexts with the highest number of missing or broken teeth, including skeletal elements with the most com-plicated history: MT dump, EM loc. 6 and MTW2 together with MTW3.

39
Obviously the risk of postmortem tooth loss depends not only on movement intensity but also on tooth category: incisors with relatively short single root are much more likely to be lost than multi-rooted molars (cf. Roksandic 2002). The frequency of PMTL in all tooth categories was checked in the two largest samples representing two different levels of move-ment intensity: EM loc. 6 and MTW4. As expected, PMTL values were higher in anterior single-rooted teeth than in posterior multi-rooted teeth (Figure 47). It is also evident in the more numerous sample from EM loc. 6 that first molars are more resistant than second and third molars. This may be related to root morphology which tends to be wide in first molars, less divergent in second and often fused in third molars. Relative differences between two samples are highest in incisors and lowest in molars and it suggests that loss rate in molars (es-pecially in first molars) is less predictable and that the PMTL rate in incisors may give a much better discrimination between samples of various degree of movement intensity that general PMTL rates. Indeed, in MTW4 (first level of movement intensity) the loss rate in incisors is 29.7%; in three samples representing fourth level of movement intensity (MT dump, EM loc. 6 and MTW2 together with MTW3) the rate was between 58.8% and 68.2%; in four intermediary subsamples it ranged from 39.1% to 45.5%. A rough scale for archaeological context may be then proposed: secondary deposits of still not completely decomposed bodies should have less than 35% of incisors lost, ternary deposits (including loose bone scatters) moved from place to place are expected to have more than 50% of incisors lost, secondary de-posits of completely decomposed bodies (as EM loc. 29) or mixed contexts (as EMS) should reveal an intermediary figure between 35% and 50%.
The frequency of tooth damage also seems to be related to tooth category, although toa much smaller degree than the PMTL risk. This time no clear pattern may be observed, es-pecially in mandibular teeth, which has been surely related to small sample size (Figure 48). However, damage in maxillary teeth seems again to affect anterior teeth to a greater extent, but also first molars in the MTW4 subsample. Since inter-tooth differences are evidently smaller than in PMTL rates, the use of general frequencies instead of frequencies for specified tooth categories (as in Figure 46) may be justified, especially taking into account the com-mon problem of small sample size. The proportion of damaged teeth shows a similar pattern to the PMTL scores, but this characteristic is much less variable between the contexts, so it may be recommended that one should use only PMTL scores or PMTL scores together with frequencies of damaged teeth as indicators of movement intensity and not the latter alone.
3.3. Articulations
The preservation of anatomical relations between human bones in archaeological contexts may depend on many various factors: biostratinomic activity of animals, burial customs or other kinds of body treatment (including architecture of a grave), soil movements due to physical processes or induced by animals. However, the most important factor is the soft tis-sue decomposition stage during the final deposition event. Bodies buried in an early stage of decomposition, with complete ligaments, are expected to preserve most skeletal anatomical connections, while remains which were reburied or buried after advanced decomposition should maintain much less (if anything) of antemortem bone order.
Properly defined, disarticulation should be considered as the complete decomposition of soft tissues, especially ligaments, which hold bones together (Roksandic 2002), but in papers about taphonomic factors this term refers to a lack of correct anatomical relations between bones irrespective of the presence or absence of any soft tissue (Hill 1979; Lyman 1994:143-

40
153), and this latter definition is adopted in the present report, as opposed to articulation as the presence of such anatomical relations.
Several studies of the disarticulation process in animals based on an actualistic approach have been published in the last 30 years (cf. Hill 1979, 1979a; Hill & Behrensmeyer 1984, 1985; Lyman 1994), but these were based rather on analyses of differences in proportions of articulated bone pairs in a sample of carcasses than on longitudinal observations of the disar-ticulation process itself. Such an approach was aimed at distinguishing between the natural pattern of disarticulation and the practice of butchery (Hill 1979). Results of research on disarticulation pattern in modern scavenged human forensic cases (Haglund et al. 1989) or in archaeological primary and secondary burials (Roksandic 2002; Duday 2005; Smith 2006) have also been published.
The disarticulation sequence in human remains cannot be precisely defined and seems to be quite variable (Roksandic 2002). In three general joint categories (cf. Gardner 1963, Moore & Dalley 1999), synovial joints are least resistant, cartilagious joints may be preserved fora much longer time, especially these with stronger ligaments (as intervertebral joints), fibrous joints are most resistant, although these may also be disconnected by scavenging animals (such as the interosseous membrane between the ulna and radius). The strength and position of ligaments is also an important factor (Roksandic 2002), although again scavenging animals quickly disarticulate joints with strong ligaments if they are located in body areas abundant in the most nutritious tissues (Blumenschine 1986; Lyman 1994:147). For that reason the disarticulation process may substantially differ between exposed and buried bodies.
The articulation frequency may be calculated by different methods. For studies on faunal remains, Andrew Hill (1979) proposed corrected joint frequency (CJF) as 100*n/NR where N is the total number of all intact or articulated joints in a bone assemblage, n is the total number of a particular skeletal joint in a bone assemblage and R is the number of timesa particular joint occurs in a single skeleton. Such a figure may be calculated only if both joints are preserved. A different approach is represented by the percentage of potential articu-lations (PPA) as the number of specified articulated joints divided by the number of the least frequent articular surface which belongs to this joint. If the number of individuals is known, percentage of surviving articulations (PSA) may be counted as the frequency of articulations recorded for each joint observed, divided by the frequency at which each joint occurs ina complete skeleton (Lyman 1994:153). In human bone deposits from Tell Majnuna the number of preserved particular joints was usually too small to use any of these methods.
In the present research, articulations were scored separately for each articular surface, using the following scale: (0) articular surface missing, (1) no articulation, (2) disturbed articulation, distance up to 15cm between compatible articular surfaces, (3) full articula-tion, (4) probable articulation (bones with one label fit together) but no picture nor drawing available. Scores 2 and 4 appeared to be very rare, so they were pooled together with ‘full articulation’ score.
Frequencies of articulated (+) and disarticulated (–) articular surfaces in twenty Tell Maj-nuna contexts are presented in Table 15. In the case of more than one joint linking two bones (as between vertebrae or between cranium and mandible), only one was counted. Moreover, fibrous joints between cranial bones were not taken into account. In total, 4853 complete or damaged articular surfaces were observed in the whole sample, among them 1640 (33.8%) were still articulated which makes 820 preserved correct anatomical relations. The number of preserved articular surfaces per joint was usually very small, so the overall pattern of articula-tions has been presented in the Figure 49 for all skeletal elements from a given context. Such

41
a comparison may be slightly biased due to the differential preservation of elements in vari-ous contexts (see above) interferring with differential preservation of articulations in various kinds of joints, but it makes possible a general insight into pattern of articulation in whole sample of human remains from Tell Majnuna.
The diagram shows three quite distinct groups of contexts. In EM loc. 25, MTW1 loc. 66, MTW4 loc. 65, MT section and EMS the proportion of articulations is higher than 50%, also MTW1 loc. 65 and the collection of elements from various EM loci almost reach this level. Distinctly less articulations (20–40%) were preserved in the three subsamples of EM loc. 6, the collection of elements from various MTW1 loci and joint subsample from MTW2 and MTW3, which included one incomplete but fully articulated skeleton and many scattered fragments. Very few articulations (less than 20%) were observed in five sub-samples of EM loc. 6, in EM loc. 29, MTW4 loc. 64 (but here sample size was extremely small) and in the MT spoil dump collection. However, also in the MT spoil dump collection, which was obviously strongly affected by modern earthworks, as many as 11.7% articula-tions were preserved and this shows that complete disarticulation is unlikely even in heavily fragmented secondary deposits. The difference between the two most numerous deposits with low and high proportion of articulations (EM loc. 6 and MTW4 locus 65) is very sig-nificant (χ2=334.9, p=0.00), but even for eight EM loc. 6 subsamples χ2 is as high as 172.6 (p=0.00) which suggests that one cluster may have contained remains in various stages of disarticulation. In EM loc. 6 more articulations were observed in deeper layers (represented by subsamples 4, 7 and 8).
Table 16 shows percentage frequencies of articulations in ten body parts: skull (with two first cervical vertebrae), axial skeleton (vertebrae from C3 down to L5, ribs and sternum), shoulder (clavicle + scapula), arm (humerus), forearm (ulna + radius), hand (carpals, meta-carpals and finger segments), pelvis (os coxae + sacrum), thigh (femur + patella), leg (tibia + fibula) and foot (tarsals, metatarsals and toe segments). Frequency ranges in the table have been highlighted with relevant greyscale background for better readability. In spite of the small sample size, in all but one body part differences in frequencies between high and low articulation contexts were statistically significant (Mann-Whitney U test with Z between 2.11 and 3.32, p<0.05) and the only exception was the foot, which was represented, however, by really very few elements in Tell Majnuna sample.
Relations between contexts in respect of articulation proportions in defined body parts has been shown in a dendrogram (Figure 50). There are four quite clear clusters and the largest one may be divided into three further groups (see Table 17). The first cluster contains 12 contexts with the fewest articulations and the differences between objects are smallest due to the generally low proportion of articulations. However, apart from contexts with overall advanced disarticulation, there are also some contexts with relatively more articulations in axial skeleton, skull and pelvis or foot. The third cluster includes all contexts from Area MTW in which heaps of skeletal units were found and here articulations in all body parts were relatively frequent. In the second cluster there are three heterogenous contexts: MTW2 with MTW3 which included one primary burial and several scattered elements, EM loc. 25 with a high proportion of crania, some of them with mandibles or first cervical vertebrae, anda collection of elements from various EM loci which included also EM loc. 51 with a partially preserved child skeleton. EMS appears to be separate and clustered together with compara-tive skeleton with 100% of articulations (labelled as 100). However, it also represents a heter-ogenous sample with one almost complete skeleton, one partially articulated lower extremity and a number of completely disarticulated elements.

42
More detailed insight into the relation of articulation frequencies between contexts and body parts has been provided by Correspondence Analysis (CA), a method which was previ-ously successfully used in studies of animal bone assemblages (Moreno-García et al. 1996). The distribution of contexts and body parts in the first two CA dimensions (representing more than half of the total inertia) is shown in Figure 51. The first dimension easily discrimi-nates between high (left to the dotted line) and low (right to the line) frequency contexts. All contexts belonging to the third cluster and EMS are located near the centroid (marked by x, which also corresponds to a completely articulated skeleton), so their pattern of articulations is most regular. Heterogenous contexts are close to those body parts which have been repre-sented by partial skeletons included in these samples: upper limb in MTW3 and EM loc. 51, skulls in EM loc. 25. Most interesting is the position of contexts with few articulations: all of them are far away from the centroid, but two distinct groups may be observed: one most related to the foot, the second to the group including pelvis, skull and axial skeleton. It may be concluded then that articulations in secondary contexts may be relatively abundant in these four body parts and only the lack of articulations between upper and lower extremity long bones may be assumed to be typical for secondary deposits. The preservation of some anatomical relations between vertebrae or between damaged femoral neck and acetabulum even in the spoil dump collection is obviously not related to ligament preservation, but to the fact that small bones may be permanently glued together by soil or surface crystalline depos-its, and sometimes by plant roots. In large and heavy long bones moved to another place such consolidation is unrealistic, even in sticky clay environment.
An actualistic study of the disarticulation pattern in small animals revealed that in ter-restrial conditions disarticulation time increased with carcass size (Brandt et al. 2003). In the case of human remains, it would mean faster disarticulation in subadult individuals. To check this possibility, articulation frequencies in adults and subadults were compared for four relatively abundant articular surfaces (femur to acetabulum, femur to pelvis, thoracic and lumbar vertebrae). Differences appeared to be small and not statistically significant (Table 18), so it cannot be proven that the tendency observed in animals is also applicable to human remains of different size.
Human remains buried in MTW1 loc. 66 and in MTW4 loc. 65 were partially articulat-ed when disposed at the midden and were obviously transported from elsewhere after initial decomposition which may had lasted for weeks or months. The evidence from MT cluster H and MTW1 loc. 66 may be used for a reconstruction of the sequence of bone collection from the scene: originally on the bottom there were many scavenged femora, most easy to collect and manipulate, then there was a layer of partially decayed bodies and on the top many disar-ticulated heads (often without mandibles), which were more difficult to transport. For distant analogy it may be recalled the case of Roman Emperor Galba's head. Fractures of teeth and bones and the variable position of the skeletons suggest that the remains were transported without any care. The spatial distribution of the remains with postcranial skeletons prevailing on the slope of the pit and crania gathered chiefly on its bottom, and also the distribution of crania in the cluster H, all this may be interpreted as the effect of temporal exposure of the skeletons after their deposition: crania more likely moved down the slope than other bones. Possibly animal activity did not cease after the disposal of the bodies, although only the traces left by a rodent may be closely associated with this phase.

43
3.4. Cut marks, percussion marks, spiral fractures
Tooth and beak marks are effects of animal activity, disarticulation and differential pres-ervation pattern may be related both to animal and human activity, but there are also several biostratinomic effects which are attributed exclusively or chiefly to humans. Most apparent are cut marks which, differently from carnivore tooth scoring or vascular grooves, have V-shaped section and usually are present as a bundle of parallel lines (cf. Eickhoff & Herrmann 1985). If found on human bones, they are sometimes interpreted as effects of cannibalistic behaviour or surgical intervention (cf. Duday 2005:191), but usually it is impossible to dis-tinguish between perimortem and postmortem cut marks and occasionally they may have been even modern artifacts, as in the case of West Tump, a Neolithic site excavated in late 19th century (Smith & Brickley 2004). Frequently, especially in older literature, vascular grooves have been erroneously interpreted as cut marks (Fisher 1995:43; D'Errico & Villa 1997). In the sample of human bones retrieved from Tell Majnuna many vascular grooves, tooth scores and some broad U-shaped lines due to trampling have been observed, but no cut marks.
Another category of biostratinomic effects due to human activity are percussion or anvil marks, which could be produced during the breakage of marrow bones (Blumenschine & Selvaggio 1988, 1991; Pickering & Egeland 2006). No biostratinomic effect of this kind has been found at Tell Majnuna too. In older literature the presence of spiral (or green) fractures was interpreted as another indicator of bone processing by humans (Miller 1975). However, it appears that spiral fractures are common in natural animal bone assemblages and trampling is the more likely cause of this effect than human activity (Myers et al. 1980; Johnson 1985; Villa & Mahieu 1991; Lyman 1994:324; Ubelaker 1996:78). In spite of the probably inten-sive trampling on the deposit EM locus 6, no clear spiral fracture was found at Tell Majnuna and most fractures were classified as typical regular or irregular damage of eroded archaeo-logical bone. Human tooth marks on bones may be observable too, but they are usually very tiny and irregular (Landt 2004, 2007), so it is highly improbable to find any in even a well preserved and carefully excavated archaeological assemblage.
Apart from a number of human bone tools and polished crania found in EM loc. 6 and discussed in the following section, there are only single examples of possible bone modifica-tions by humans. One of them is a portion of tibial midshaft with quite regular chop marks on one breakage margin (Figure 52, EM loc. 6(4), layer 5, element X.43). However, chop marks on midshaft fragments may be also imitated by scavenging animals (e.g. hyena) or trampling (Myers et al. 1980), so it is impossible to offer any reliable interpretation of this exceptional specimen.
In three elements (sacrum, MTW1 loc. 66, 40; proximal tibia, EM loc. 6(4) layer 4, 25a; left frontal bone, MTW1 loc. 59.2, 5) small rectangular impressions have been observed, with size varying from 7x6mm to 10x9mm. The most clear example was found on a sacrum and consisted of two short and broad parallel lines with slightly pressed bone between them (Figure 53). Careful inspection of the picks used during excavation ruled these out as a cause of these effects, and again many different factors such as animal teeth, human tools or tram-pling may be taken into account.
3.5. Human bone tools
In spite of the complete lack of cut marks and the ambiguity of other possible anthropic effects on human bones from Tell Majnuna, there is direct proof that human activity at Tell

44
Majnuna in the period of deposition of the human bone cluster was not limited to bone transportation and trampling. In EM loci 6 and 29 a number of human bone tools has been found, among them 19 complete or fragmented specimens in various stages of production and 23 fragments (not only from EM) with at least one of four characteristics (pointed end, working, chipped back, polished handle). Among the latter, not only broken tools or tools discarded at an early stage of production, but also pseudotools may be included, producedby weathering, trampling or herbivorous animal chewing (cf. Singer 1956; Sutcliffe 1973; Myers et al. 1980; Lyman 1984).
A detailed description of all tools, possible tools and pseudotools is presented in Table 19. The typical tool was 11–21cm long (range based on six complete specimens) with a polished handle, pointed end worked in U-, D- or V-shape and a chipped back end (Figure 54). There is no clear dominance of any type of pointed end. Long bone midshafts were used for tool making, especially the femur, less frequently the tibia. There is a clear majority of massive long bones (femora and tibiae), but to some extent this reflects a higher proportion of femora in the whole sample. When compared to the bone unit frequencies in whole of EM locus 6, this majority is still present, but is not statistically significant (χ2=2.93, p=0.23), although this result is obviously affected by the small sample size.
Most tools maintain the entire bone circumference, although specimens with only half-circumference were also produced. No evident side, sex or size (adults versus subadults) pref-erence has been observed. The presence of animal tooth marks (and some diagenetic effects which preceded tool making) as well as use of fragments with natural fractures due to changes in humidity indicate that bones with a long taphonomic history were worked and at least sev-eral years elapsed between the death of these individuals and use of their bones as raw material. However, the episode of human tool production was contemporary to or preceded the deposi-tion of EM loc. 6, because all obvious tools were found in deeper layers of this large cluster (except one found in EM loc. 29, a small cluster which was actually an outlier of EM loc. 6).
Apart from the more obvious tools, there were also some fragments with a pointed end only (but no trace of working), which might represent the earliest stage of tool preparation, and many bone fragments were preserved only with a polished surface. If nothing but slight polish is observed, animal activity or trampling may be most likely responsible for such an effect. Two specimens with slight polish and T-shape ends on the distal metaphysis of the hu-merus (no. 11 and 17) were pseudotools produced by animal chewing (cf. Myers et al. 1980) and an unusual strongly damaged fragment of a tibia from EM loc. 50 with two V-shaped ends (no. 39) seems to have been formed rather by water erosion (Figure 55).
In spite of the number of pseudotools, the evidence from EM loc. 6 is clear enough to conclude that this place at Tell Majnuna served occasionally as a workshop for the production of human bone tools. No analogies have been found in any occupational layers at Tell Brak nor in other contexts of the midden at Tell Majnuna. Many tools were never finished, at least one was discarded because of damage during tool production, witness the two compatible fragments of one specimen (no. 4) found in two different locations. Together with the fact that EM loc. 6 was an abundant source of raw material, it strongly suggests that tools were worked at this place and not brought from elsewhere for disposal.
Apart from human bone tools, EM loc. 6 and loc. 29 also contained cranial fragments with more or less evident polishing and/or scratches (Table 20). In most cases a slight polish effect was likely caused by non-human taphonomic factors and most scratches were distrib-uted in a random way and were probably produced by trampling. However, at least in one case (EM loc. 6(5) layer 3, 15) the pattern of scratches and heavy polish could not have been

45
accidental. This cranium was far from complete, chiefly cranial vault and small parts of base were preserved together with portions of maxillary alveoli. On the right frontal bone, above the supraorbital arch, there is an oval area of scratches and heavy polish, another was located on occipital bone, ~3cm above the nuchal crest (Figure 56). Similar scratches and polish are visible also on two other small fragments of cranial vault. Only scratches, this time organised in parallel lines and obviously affected on already eroded bone, were observed on frontal bone found in EM loc. 29 layer 1 (Figure 57). It is likely that at least these two crania were used for tool polishing, and their location in the same context as human bone tools makes it possible (but not certain) that these tools were prepared with the use of human crania.
Many human bone tools (Talavera et al. 2001, 2002; Meza Peñaloza 2007) or grooved human femora which may have been used as musical instruments (McVicker 2005; Pereira 2005) have been found in various Pre-Columbian sites in Mexico, Belize and Guatemala including such sites as Teotihuacán and Tikal. Peoples inhabiting the East Sepik province of Papua produced ornamented daggers made from human femora, belonging to ancestors or killed enemies (Newton 1989). However, in the Near East such treatment of human remains is virtually absent. There are two spindles produced from human fibulae and found at Tell Nebi Mend, Syria (Molleson 2002) but it is likely that these bones were simply not recognised as human by the makers. At Tell Majnuna tools were a part of large deposit which included also more or less complete crania, which can be easily recognised as human by everybody, so it is almost certain that tool maker(s) was/were aware about the origin of their raw material. In this respect, the set of human bone tools from Tell Majnuna is unique.
In spite of the quite high number of human bone tools in one context, it is not very likely that they were widely used by a local population. Most specimens were not finished and some were found broken. In general, human bone seems to have worse mechanical proper-ties than animal, especially bovine bone. Fresh human bone has a significantly higher value of fracture toughness, but this property is related to greater proportion of collagen (Wang et al. 1998) which quickly decreases after deposition (cf. Collins et al. 1995). Human bone isa lamellar type which is equally resistant to compressive forces in many directions, while bovine bone is organised in parallel fibres which make it optimised in one direction (Cuijpers 2006; Weiner & Wagner 1998:18). Further, human osteons are substantially larger than ani-mal ones (Chen et al. 2009), especially in Holocene populations (Pfeiffer 1998). Since force in most bone tools is mainly unidirectional, fibrous bovine bone with small osteons organised in parallel lines offers better resistance. Moreover, collagen degradation may considerably af-fect mechanical properties of old human bone.
Human bones from Tell Majnuna have no direct analogies and their purpose is not clear. They resemble bevel-ended animal bone tools from Middle Chalcolithic Hungary (Choyke & Schibler 2007:58) or even bone splinters from Swartkrans and Sterkfontein, dated to 1.8–1.1 my BP which were probably used for tuber digging or termite extraction (Backwell & d'Errico 2001; Shipman 2001). Modified bones from Tell Majnuna are also similar to some U-shape and D-shape tools used likely for pottery smoothing and ornamenting, included in the sample of 114 various human bone artifacts found at the Pre-Columbian site Cantona, Mexico (Talavera et al. 2001). In Pratt's classification, tools from Tell Majnuna fit two types: Non-Facetted Points with Central Cavity and Bone Chisels with Unilaterally Tapered Ends which are interpreted as specialised wedges, antler crafting implements or bark priers (Pratt 2008). It is not likely that barking was important in the steppe areas of northern Mesopota-mia, but human bone tools may have been designed for seeding or just for rummaging in the

46
midden or elsewhere. More or less evident surface polish shows that they were used as hand tools (Figure 58) and were not attached to any handle.

47
4. Event
It is very difficult to recognise the type of event underlying the formation of such a hu-man bone deposit as this unearthed at Tell Majnuna. The most important kind of evidence is a possible sex and age bias, with, for example, adolescent or adult male individuals theoreti-cally prevailing in the battlefield or unusual age profiles in epidemic ‘death pits’. However, sex and age bias may also appear due to selective burial practices or non-anthropic biostrati-nomic factors, e.g. the complete removal of small infant bodies by scavenging animals, and sometimes also due to diagenetic factors such as differential preservation of more (adult) or less (infant) mineralised bones. For that reason any conclusion based on analysis of sex and age profile should be cautious.
Another kind of evidence may be the presence of perimortem trauma, but this is even more problematic, especially in a collective burial dated to a period when only primitive weaponry such as maces or spears were used and in which some biostratinomic factors may have produced early postmortem fractures which cannot be distinguished from perimortem blunt force trauma. There are no clear traces of perimortem trauma in the whole sample of human remains from Tell Majnuna, and the several instances of healed antemortem trauma are discussed in the Chapter 5.
4.1. Male : female ratio
Sex determination is probably the most important task in an osteological analysis. The most reliable results may be obtained from pelvic morphology which is determined by ob-stetric success in females (Mays & Cox 2000). In skeletal collections with known sex, some features of pelvis give 96% accuracy rate (Meindl et al. 1985; Sutherland & Suchey 1991) and they are recommended as the most reliable sex indicator. Some inter-population differ-ences in pelvic morphology must be taken into account (MacLauglin & Bruce 1986), but the most frequently used methods based on the observation of the pubic symphyseal region (ventral arc, subpubic concavity, ridge on medial border of the inferior pubic ramus; Phenice 1969) and the greater sciatic notch are reproducible both in European and in North Ameri-can populations, their measurement error is also low (Listi & Bassett 2006). If the pelvis is missing, the shape of the proximal femoral end, which to some extent reproduces pelvic geometry, may be also used as quite reliable sex indicator (Albanese et al. 2008).
Male skulls are, on average, larger and more robust than female ones and their muscle attachment areas are clearer, which is related to a longer period of growth in puberty (Mays & Cox 2000). However, the accuracy rate of sex determination based on the skull is substan-tially lower, only 92% (Meindl et al. 1985), and interpopulation differences in cranial and mandibular sexual dimorphism may be much greater than for the pelvis. This concerns the measurement error as well. In the European population the best sex determination accuracy has been noted for mastoid size, supraorbital ridge size, general size and architecture, rugosity of the zygomatic extension, size and shape of the nasal aperture, and gonial angle (Williams & Rogers 2006). Another frequently used feature, the sharpness of the supraorbital margin, offered only a 70% accuracy rate in modern medical cases in recent studies in Germany (Graw et al. 1999). The joint use of several sex determination methods based on pelvic and skull morphology may yield 97-98% accuracy rate, as for a modern North American sample and in the 18th-19th Spitalfields cemetery in London (Meindl et al. 1985; Molleson & Cox 1993) but, on the other hand, in the North American Indian cemetery at Averbuch the repli-

48
cability of sex determination based on pelvis and on skull was as low as 81-83%, which may have been related to the incompleteness of skulls in the archaeological record (Konigsberg & Hens 1998). In addition, in a medieval sample from the Netherlands more than 50% of mandibles classified as male belonged to individuals scored as females after observation of pelvic morphology (Maat et al. 1997).
If both pelvis and skull are missing or badly damaged, sex may be also diagnosed by the use of selected long bone measurements. Humeral and femoral epiphyseal measurements, es-pecially, are widely used as sex indicators and in some populations may be as reliable as pelvic morphology. For example in the French population epicondylar breadth in femur gives ~95% accuracy rate (Alunni-Perret et al. 2008). In modern Japan there are several measurements with an accuracy rate above 90%: the width of the articular surface of the distal humerus, the sagittal head diameter of the radius, the diaphyseal cross-section area and the articular breadth of the ulna, the bicondylar width and the transverse diameter of the lateral condyle of the femur, and the proximal epiphyseal breadth of the tibia. Epiphyseal measurements are much more useful in sex determination than total long bone lengths which give only 70-83% accuracy rate (Sakaue 2004). Averagely reliable are methods based on measurements of long bone circumferences (80-90%). In a Late Roman cemetery in Spain, upper extremity circumferences appeared to be a more accurate method of discrimination than measurements of lower long bones and this has been interpreted as the result of greater mechanical stress in males (Safont et al. 2000). Scales of sexual dimorphism for various small bones have been proposed for forensic applications and there are recently published papers on the hyoid bone (Kim et al. 2006), carpals (Cameriere et al. 2008), metacarpals (Barrio et al. 2006) and even phalanges (Case & Ross 2007). Measurements of the talus and calcaneus appear to be reliable sex indicators in Italian population (Gualdi-Russo 2007).
There are many papers about sex determination in juveniles, but so far no method has been widely accepted (Mays & Cox 2000). In older children it is possible to use crown di-mensions of the permanent canine which is the only tooth revealing some sexual dimorphism (Molleson 1992; Cardoso 2008), but there are considerable inter-population differences and possible mortality bias in dental dimensions (Molleson et al. 1998). Other teeth are not suitable for sex determination, although in a small sample of modern Nepalese subjects, mediodistal tooth diameters appeared to give average accuracy rate of ~80%, considerably higher than 62-64% of buccolingual diameters (Acharya & Mainali 2008). Some attempts to find a reliable subadult sex assessment method based on pelvic morphology were promising, but have been usually tested only on small samples and with high inter- and intra-observer error (Schutkowski 1993; Wilson et al. 2008; Cardoso & Saunders 2008). In contrast, the morphology of the mandible appears to be completely useless in subadult sex determination (Franklin et al. 2007; Suazo Galdames et al. 2009).
Several standard methods were used for sex determination of human remains from Tell Majnuna: the three features of pubic symphyseal region (Phenice 1969), the greater sciatic notch shape and the presence of preauricular sulcus (Buikstra & Ubelaker 1994), and the five features of the skull: nuchal crest, mastoid process, supra-orbital margin, glabella, mental eminence (Acsadi & Nemeskeri 1970). The recovery rate of the pubic bone was very low, buta possible prevalence of males in the MTW clusters may be indicated by the low frequency of the subpubic concavity and the ischiopubic ramus ridge (Table 21). Also, in the case of the greater sciatic notch, male : female ratio seems to be biased in the MTW clusters in favour of males, although this tendency is not statistically significant due to small sample size (χ2=2.58, p=0.11). Cranial and mandibular features calibrated for European populations seem to be

49
inadequate here, with a clear skew towards females in the nuchal crest and supraorbital ridge and more uniform distribution in the glabella, mastoid process and mental eminence. It was not possible to cross-check results for the skull and pelvis, but a clear pattern of differences in the whole sample was revealed by the analysis of the correspondence between methods and sex scores (Figure 59). If the greater sciatic notch has priority, all skull features must be refuted as more or less biased towards female sex.
Since all sex determining methods based on pelvic or skull morphology have very lim-ited value due to the low preservation rate of the diagnostic regions or are not applicable to the population buried at Tell Majnuna, the remaining possibility for the determination of sex is the analysis of the size and robusticity of the postcranial bones. The list of metric measurements taken of human bones from Tell Majnuna include more than 80 diameters and circumferences but only 24 could have been taken frequently enough to be useful in searching for possible sex bias (see Table 22). No scales of sexual dimorphism for metric bone measurements in North Mesopotamian early populations are so far published, so, for the present research, such scales have been constructed with use of the available data from 113 skeletons with well preserved os coxae, and sex determined acording to at least two standard pelvic morphological features. These skeletons were excavated at four sites located in the Khabour basin: Tell Arbid (n=17; Sołtysiak 2006a), Tell Barri (n=24; Sołtysiak 2008a), Tell Brak (n=10; Sołtysiak in print d), Tell Hamoukar (n=1), as well as two sites from the middle Euphrates valley: Tell Ashara (n=21; Sołtysiak & Tomczyk 2008) and Tell Masaikh (n=40; Sołtysiak & Tomczyk 2008a). They represent many periods from Late Chalcolithic to the 20th century CE, but most numerous are individuals dated to the Early and Middle Bronze Age and to the Early Islamic period. All measurements were taken by the present author with use of a vernier caliper, with accuracy to 0.5mm.
Basic statistics for both sexes, Student's t-test and Wilks' λ values as well as percentage frequencies of correct assignations in the discriminant function for the selected 24 measure-ments are presented in the Table 22. Best results have been obtained for talar articular surface length and for femoral epicondylar breadth, but almost all measurements of long bones, patella and talus appeared to be differentiated by sex to acceptable degree. In contrast, all measurements of mandible and axis had accuracy rate below 70% and were excluded from further analysis. For six measurements of femur (except midshaft circumference) it was pos-sible to check the difference between Mesopotamian sample and skeletons from medieval Croatia (Šlaus 1997). In males two measurements were significantly different (maximum head diameter greater in Croatia, anterior-posterior midshaft diameter greater in Mesopota-mia), in females two diameters also differed (anterior-posterior midshaft diameter and ante-rior-posterior subtrochanteric diameter, both greater in Mesopotamia). Such differences may be related not only to general inter-population body size variability but also to different levels of mechanical stress inducing modifications of bone geometry.
Selected mean measurements in three sub-samples from Tell Majnuna (EM locus 6, MTW1 and MTW4 together, other contexts, see Table 23) have been compared to means for males and females from the North Mesopotamian reference sample. Assuming that the reference sample is relevant to the Chalcolithic population buried at Tell Majnuna, it may be expected that a sample with 1:1 sex ratio should have mean measurements equally distant to both reference means, while any sex bias may be observed as systematic shift towards whether male or female reference mean.
Human remains from Tell Majnuna have been divided into three subsamples: EM loc. 6, all clusters excavated at MTW1 and MTW4, and all other contexts pooled together. The

50
last subsample appeared to be much smaller than the former two (Table 23). As expected, femoral measurements were most frequent, with the exception of the epicondylar breadth. Bones from both sides were included. Mean measurements were compared to the male and female reference means with the use of Student's t-test if at least three bones were complete enough to allow a given measurement.
The results of comparison are presented in the Table 24. No bias has been observed in the smallest heterogenous subsample where four mean measurements were skewed towardsfemale and also four mean measurements were skewed towards male reference means. In vir-tually all cases, the subsample means were located between reference means and the only ex-ception was the femoral anterior-posterior midshaft diameter which, however, may have been influenced by an unusual development of linea aspera due to physical activity (cf. Molleson 2007:28) or due to rickets (cf. Ortner 2003:402). Moreover, in bones from MTW1 and MTW4 all mean measurements are located between male and female reference means, but this time a small bias towards males may be observed: in six cases subsample means were skewed towards the male reference means and only in two cases the skew was towards fe-males. A small possible deviation from 1:1 sex ratio may be postulated for this subsample, because the greater sciatic notch scores also show some dominance towards males. Otherwise, in the case of EM loc. 6 the sex bias is very clear. In all measurements of long bones the sub-sample means are closer to the female reference means and in as many as eight cases they are even lower than the reference means. It may be then safely concluded that the subsample of human remains from EM locus 6 exhibited a clear and strong dominance towards females. Surprisingly, a different tendency may be observed for the talus, where both mean measure-ments are close to the male reference means. It is not possible to explain this obvious discrep-ancy and there is rather a small possibility that any kind of habitual activity or pathology may have produced such effect.
4.2. Age-at-death pattern
There are many methods of age-at-death estimation, some of them valid only for sub-adult individuals, others designed for adults. For subadults with preserved dentition, the sequence of tooth formation and eruption gives an age assessment with an accuracy between 3 months in infants and 2 years in older children (Ubelaker 1989; AlQahtani et al. in print). Alternatively, measurements of diaphyses may be used to estimate the age-at-death of an subadult individual (Anderson et al. 1964; Ha et al. 2003), although accuracy of this method is substantially lower. In older children and adolescents, the union of epiphyses or the fusion between primary ossification centers (as in the pelvis) is another age-related process (Ubelaker 1989a). The timing of the union sequence differs between sexes and there is considerable inter-individual variability, but in such a fragmentary deposit as in Tell Majnuna it may be useful at least to differentiate between adolescents (~14–20 years old, some epiphyses still not fused) and adults (complete ossification). Reliable identification of bones belonging to one individual in commingled remains based on the analysis of epiphyseal union (cf. Schaefer & Black 2007) appeared to be completely impossible in the Tell Majnuna deposits.
The estimation of age-at-death in adult individuals is perhaps most difficult task in hu-man osteology. Among morphological methods, widely used are those based on observation of changes in the pubic symphysis (Todd 1921; Brooks & Suchey 1990) and in the auricular surface (Meindl & Lovejoy 1989). However, they were tested on recent West European or North American populations and may give biased results when applied for individuals distant

51
in time and space. For example it appeared that both methods are not suitable for modern Thai population (Schmitt 2004), and application of the Suchey-Brooks method to the 18th-19th Spitalfields cemetery gave biased results (Hoppa 2000). Even in modern forensic cases in the Balkans, the observed sequence of changes in the pubic symphysis was different than in the reference sample (Berg 2008; Konigsberg et al. 2008). Apart from inter-population vari-ability, considerable inter-observer error for both methods decreases their efficiency, even if age assessment is performed by an experienced osteologist (Kimmerle et al. 2008). Recently, some authors explored the possibility of estimating age-at-death with use of the acetabulum (Rissech et al. 2006) or sacrum (Passalacqua 2009).
Apart from the pubic symphysis and the auricular surface, it is also possible to estimate age-at-death with the use of methods based on the observation of some features of the skull,e.g. cranial suture closure or dental wear degree. The first method gives very poor resultsdue to high inter-individual variability (Masset 1989), but the number of individuals with completely open sutures gradually decreases with age (Hershkovitz et al. 1997) and thus suture closure may be used to distinguish between cranial samples with a clear prevalenceof young or old adults.
On the other hand, dental wear degree is considered to be the best single morphological method of age-at-death assessment (Lovejoy et al. 1985). There are many scales of dental wear (e.g. Murphy 1959; Scott 1979; Brothwell 1981; Smith 1984; Millard & Gowland 2002) and for the sample from Tell Majnuna two of them have been adopted. In the original Scott's system for molars each quadrant of a molar is scored separately (Scott 1979, modified), here only most and least worn quadrants were taken into account and the wear degree was ex-pressed as the mean of these two figures. Wear of premolars and anterior teeth was scored on the 8-grade scale (Smith 1984). Mandibular teeth provide more reliable age assessment than maxillary teeth (Mays 2002), but in the deposits from Tell Majnuna upper dentition pre-vailed almost in all contexts. The presence of dental caries (which is very rare in all prehistoric populations from north-eastern Syria, cf. Sołtysiak 2006) or loss of a neighbouring tooth does not affect the rate of dental wear (Mays 2002). However, the presence of hard particles in food may strongly accelerate dental attrition, so this method of age assessment should be calibrated for diet toughness (cf. Smith 1972; Smith 1984). This calibration may be based on differences in average wear between three molars which erupt in ~6-year intervals (see discus-sion in the section 5.1 below).
A much less precise age-at-death assessment is based on the rate of antemortem toothloss (AMTL) which is strongly related to advanced stages of dental wear (cf. Mays 1998:62). In a 19th century cemetery at Zwolle (the Netherlands) AMTL rate was very low in individu-als who died under 40th years of age, but rapidly increased after 45th year of life and its vari-ability became very high in all older adults (Mays 2002). Again, as for cranial suture closure, the number of lost teeth may be used to distinguish between samples with a clear prevalence of young or old adults.
Along with observations of macroscopic features, histological methods are also used to diagnose age-at-death, among them tooth cementum annulations (Meinl et al. 2008) and pulp/tooth ratio in canines (Cameriere et al. 2007). These provide better results than mor-phological methods especially in older individuals, although the risk of diagenetic modifica-tions makes them more suitable for forensic applications than for research on archaeological bones (cf. Lucy et al. 1995).
Age-at-death profiles at archaeological cemeteries are used chiefly for palaeodemogra-phical research, especially for an estimation of fertility and mortality in past populations

52
(cf. Bocquet-Appel & Masset 1996). However, there are so many sources of possible bias in this data that reliable results are problematic (cf. Jackes in print). First, subadult bones are usually more poorly preserved than adult bones (Bello et al. 2006; Crubézy 2007; Séguy et al. 2008), although in the Near East this tendency may be reversed (Tomczyk & Sołtysiak 2007). Moreover, the likelihood of recovering smaller subadult skeletons is lower even in case of well preserved and complete human remains (Chamberlain 2000). Another potential fac-tor contributing to the under-representation of the youngest age classes is related to different burial practices of children and adults (cf. Duday 2005:182). In many ancient Near Eastern societies infants and some older children were buried in the areas of settlement, beneath the floors or in the walls, while outer cemeteries were destined for adults (cf. Sołtysiak in print d). In addition, age determination techniques are not precise, especially in the case of adult individuals. Many authors have observed that many commonly used methods overestimate the age of young adults and underestimate the age of older individuals (Meindl & Russell 1998; Miles 2001; Martrille et al. 2007; Hens et al. 2008), so calibration is often needed (Aykroyd et al. 1997). In a traditional approach, the life tables based on age-at-death profiles at cemeteries were compared to the model life tables for bias estimation (Chamberlain 2000), but better results are obtained with the use of methods based on the Bayesian theorem (Ko-nigsberg & Frankenberg 1992; Prince & Konigsberg 2008).
Human bone deposits at Tell Majnuna obviously cannot be treated as a representative sample of a local population, so no reliable estimation of demographic parameters is possible. Instead, potential factors of age bias related to the event and eventual selective body collec-tion may be detected. The most important question concerns the catastrophic or attritional character of the deposits: the attritional age-at-death profile, which is attested at regular cem-eteries, reveals more infants and older adults than in a living population due to highest riskof death in these age categories. In comparison, the catastrophic mortality profile corresponds to the actual frequency of age classes in a living population (Paine 2000, Margerison & Knü-sel 2002). Although very high population growth may imitate a catastrophic mortality pro-file in regular attritional contexts (Lyman 1994:121), usually the presence of a catastrophic profile is interpreted as the result of high short-term mortality, for example due to plague epidemics (Blanchard 2007).
Two types of age-at-death profiles may be distinguished with two indices frequently used by palaeodemographers to estimate demographic parameters: the Juvenility Index (JI) and the P-ratio (Bocquet-Appel & Masset 1996; Bocquet-Appel 2002). The first index may be counted as a ratio of older children (conventionally 5-14 years old) to adults (20 and more years old), the P-ratio is the ratio of older children and adolescents (5-19 years old) to all age classes except infants and younger children (5 and more years old). The Juvenility Index shows particular contrast between catastrophic and attritional samples of human skeletons (0.3396 and 0.0997 respectively for Model West, see Coale et al. 1983, for this model life table is assumed to be the most suitable for pre-industrial human populations). The Juvenil-ity Index for regular cemeteries is variable, but usually not higher than 0.2 (cf. Chamberlain 2006:86; Séguy et al. 2008).
In the whole collection of bone fragments retrieved from various contexts at Tell Maj-nuna, only occasionally was any morphological age assessment method possible. However, in 2352 per 2873 elements (more than 80%), at least a general distinction was noted between infants and younger children (0–6 years), older children (7–14 years), adolescents (15–20 years) and adults. These categories are not fully consistent with age classes used by palaeode-mographers, but nevertheless they may be used for a rough estimation of the Juvenility Index
53
and P-ratio. Further, the frequency of age classes for single bone elements instead of complete skeletons may be a potential source of bias, but even if this makes difficult any comparison with reference samples from regular cemeteries, at least the differences between various con-texts at Tell Majnuna may be revealed.
The frequencies of elements assigned to four rough age categories are shown in Table 25 which also contains estimates of the Juvenility Index and P-ratio in 20 defined contexts. There is a striking difference between EM locus 6 which clearly represents a catastrophic age-at-death profile (average JI=0.333) and bones from MTW1 and MTW4 where the number of subadult bones was much lower and thus more concordant with the attritional profile (av-erage JI=0.072). However, everywhere the number of infants and small children was strongly under-represented both as for attritional and catastrophic profile. The minimum number of individuals who died at an age earlier than 7 years was 13 (based on number of cranial frag-ments and dentition), among them a small group of five children, 1–3 years old, found in EM loc. 6(3) and 6(4) and the remaining eight, all 3 or more years old, in all other contexts. The numbers of subadult individuals with assessed dental age has been presented in Figure 60, separately for EM loc. 6 and MTW1+4.
Differences between the two main contexts (MTW and EM) are evident in the Cor-respondence Analysis biplot (Figure 61). All parts of EM locus 6 (including locus 29) were clustered together with EMS (where incomplete skeletons of a child and of an adolescent were counted as single elements) and corresponded to relatively higher frequencies of older children and adolescents. Other contexts corresponded to a greater proportion of adults and small children remained as distant outlier, only weakly related to EM loc. 6(3) and 6(4).
A similar pattern may be observed in the frequency of epiphyses fused to metaphyses (Table 26). In virtually all bone units which were represented more than 40 times in the two main contexts (MTW and EM) differences appeared to be statistically significant, withmany more unfused or partially fused epiphyses in EM locus 6 than in MTW1 and MTW4. In the proximal tibia the difference is evident but not significant due to the small samplesize. Another exception is the distal humerus, but these epiphyses fuse earlier than others, usually before the age of 14 years. This suggests that the difference between the two contexts is greater in adolescents and children who died in age close to 14 years than in children who belonged to younger part of the 7-14 class.
This observation has been confirmed by the proportions of not fully developed teeth in permanent dentition which appears to differ significantly between EM loc. 6 and MTW1+4 only in second and third molars (Table 27). Since formation of other teeth ends at an age of between 10 and 12, this again points to the age class 12-15 as much more frequently repre-sented in EM loc. 6 than in MTW contexts. Tooth formation was scored on a 14-grade scale (Moorrees et al. 1963), but only numbers of still developing (stages 4 to 13) and complete teeth (stage 14) were compared.
Some clear differences in average age-at-death were also observed among adults whose bodies had been buried in the Area MTW and in EM loc. 6. Only in 14 ossa coxae it was possible to observe the pubic symphysis and this sample was far too small to draw any conclu-sion (Figure 62, scoring system after Todd 1921). However, 68 auricular surfaces were pre-served well enough to allow age determination (following the method of Meindl & Lovejoy 1989). In this case after pooling of the right and left side, the sample size was large enough to reveal statistically significant difference between two main contexts, EM loc. 6 containingmore younger adults than MTW1+4 (Mann-Whitney U-test, Z=2.11, p<0.05). Surprisingly, a surplus of adults belonging to the 30-35 age class (more than 1/3 of all adults) was noted in

54
the MTW1+4 sample, while individuals representing age class 45+ were rare in both contexts (Figure 63). Again it shows that the age distribution at Tell Majnuna does not represent a re-gular attritional cemetery where more individuals of a greater age would be expected.
Cranial suture obliteration stages provide very poor age assessment. However, this feature was also scored with the use of 4-stage scale (Meindl & Lovejoy 1985) for 17 points defined by Buikstra and Ubelaker (1994). Most crania were highly fragmented, so no composite scores were counted, but the differences between subsamples were assessed for each suture separately (Table 28). Most sutures were open or only slightly obliterated which again points to the relatively young age of adults buried at Tell Majnuna. The only clear difference between EM loc. 6 and MTW1+4 was noted for sagittal suture (both midsagittal and obelion), and, again, more individuals with advanced stage of obliteration (thus more likely older ones) were found in the MTW contexts.
Table 29 contains medians and quartiles of dental wear in three subsamples from Tell Majnuna as well as in pooled teeth from Area G at Tell Barri, the latter representing regular burials dated to wide chronological range from the Early Bronze Age to the Neo-Assyrian pe-riod (Sołtysiak in print a). Differences between pairs of subsamples were checked by using the Mann-Whitney U-test (Table 30). Dental wear in EM locus 6 was systematically lower than in other Tell Majnuna contexts and in comparison to Tell Barri. In a few teeth these differ-ences were statistically significant in spite of small sample size. In contrast, teeth from MTW exhibited a more or less similar degree of wear to the attritional sample from Tell Barri. Again, it may be concluded that adults buried in EM locus 6 were relatively younger than those from MTW and other contexts. In all contexts, however, heavily worn teeth were not as frequent as at Tell Barri which suggests that this difference was more related to selective deposition, than to a contrast between catastrophic and attritional mortality profiles.
Another average age-at-death indicator is the frequency of antemortem tooth loss (AMTL) which progresses with age, especially in older adults. Again, there is a significant difference between EM loc. 6 and MTW (χ2=14.1, p<0.0002, see Table 31) which points to a lower frequency of younger adults in the MTW contexts. However, in all alveoli found at Tell Ma-jnuna the rate of AMTL was low and again all this may be interpreted as the consequence of a high proportion of young adults in EM loc. 6, a high proportion of middle-age adults in MTW and a low proportion of older adults in both contexts. This pattern is consequently revealed irrespective of the aging methods used.
The observed differences in age distribution are obviously related to human behaviour and not to any natural mortality pattern. The deposit in EM loc. 6 contained remains of older children, adolescents and younger adults while clusters excavated in Area MTW were abundant in remains of slightly more mature adults. The small number of older adults seems to be related not to any selective character of either context but to the catastrophic nature of these burials. Most striking is the complete lack of infants and the extremely small number of younger children, with the exception of a small concentration in EM locus 6. This feature should not be interpreted as a result of differential preservation, because infant remains in the Near East are usually in good condition (Tomczyk & Sołtysiak 2007).

55
5. Palaeoecology
Human remains excavated at archaeological sites are studied not only in order to recon-struct the burial rites and postmortem body treatment in general. An even more important area of research focuses on an interpretation of some processes which occurred during the lives of the individuals represented by archaeological bones and teeth. The toolkit of bioarchaeol-ogy includes many methods enabling more or less reliable insights into various aspects of life in past human populations, both those directly observed, such as diet composition, nutrition level, some diseases and injuries, and activity-related skeletal modifications, and those indi-rectly witnessed, such as subsistence strategies, social stratification, climatic changes and many others (cf. Larsen 1997). In general, the basic purpose of bioarchaeology is the construction ofa more or less detailed model of human palaeoecology in a given time and space.
This chapter does not contain a full report on all the aspects of life of the human popu-lation buried at Tell Majnuna, which could potentially be reconstructed with use of bioar-cheological methods, but only the data which is necessary for an interpretation of the events which preceded the deposition of human remains at the site, especially those concerning diet, nutrition level, skeletal modifications related to physical activity, and injuries.
5.1. Diet and food toughness
General diet composition has been one of the most frequently studied topics in bioar-chaeology over the last 20 years. Since early 1980, selected trace element contents has been used to distinguish between animal, plant and marine resources as the main components of human diet, using the observation that the proportion of zinc is positively correlated, and the proportion of strontium negatively correlated with position in the trophic pyramid. In addition barium follows strontium but is moreover less abundant in marine than in ter-restrial resources (Sanford & Weaver 2000). Somewhat later, another biochemical method became more popular, based on the measurement of stable isotope proportions in preserved collagene, especially 13C to 12C and 15N to 14N. Such analysis of carbon isotopes allows one to distinguish between plants using different photosynthetic pathways, and between marine and terrestrial food, while a proportion of a heavier nitrogen isotope is positively correlated with position in the trophic pyramid (Katzenberg 2000; Al-Shorman 2004; Thompson et al. 2005; Richards et al. 2006; Hedges & Reynard 2007). The same effect occurs in heavier hydrogen isotopes (Reynard & Hedges 2008). Analysis of isotopes and of trace element pro-portions may be also used in weaning time studies (Wright & Schwarcz 1998; Dupras et al. 2001; Mays 2003). Apart from paleodietary research, differences in stable isotope propor-tions of oxygene, strontium and sulfur between enamel and bone are possible indicators of migrations and mobility in general (Schweissing & Grupe 2003; Buzon et al. 2007; Haver-kort et al. 2008). However, no such kind of analysis appeared to be possible for Tell Majnuna due to considerable diagenetic alterations (see Chapter 2 above).
Another parameter of diet is food toughness and the presence or absence of highly abra-sive substances such as stone grinder particles. Studies on dental microwear patterns show that it is possible to distinguish at least between soft and hard food (cf. Hillson 1996:244-251; Schmidt 2001), although occasionally more detailed analysis allows the recognition of peculiar wear factors, such as calcium oxalate phytoliths from desert succulents which caused dental microwear and were also present in coprolites from prehistoric Texas (Danielson & Reinhard 1998; Reinhard & Danielson 2005). Additionally, an attempt to define microwear

56
patterns induced by various cereals has been published (Gügel et al. 2001). Most literature about dental microwear pattern concerns modern and fossil primates and the objective is to recognise the diet of the latter, by using data gathered for the former (cf. Ungar et al. 2006). However, there are also some papers about dental microwear in archaeological samples of human teeth. For example in the southern Levant temporal differences between the Upper Palaeolithic and Chalcolithic were observed, with some periods abundant in narrow scratches without many pits (Upper Palaeolithic, PPNA, Chalcolithic) and some with more pits (Natu-fian, PPNB) which suggests greater compressive force in the latter (Mahoney 2006, 2007).
Teeth found at Tell Majnuna were too eroded for the analysis of dental microwear pat-tern and a contemporary dental sample from Tell Brak includes almost exclusively deciduous teeth and permanent germs. For that reason it was possible to observe microwear for only one individual, TW 809 from Tell Brak, 10 years old, and dated to the same period as the deposits at Tell Majnuna. Since the second molar was not fully erupted, the first molar was selected (for differences between molars cf. Mahoney 2006a). After removal of dust with acetone, the cast was made with use of the silicon MM AD 25 and the polyurethane resin Rencast FC52. Pictures of the protoconid phase II wear facet 10n (cf. Maier & Schneck 1982) were taken with a scanning electron microscope LEO 1430VP in the Faculty of Biology, University of Warsaw. 300x magnification allowed the observation of a moderately eroded surface with sev-eral diversely oriented strong linear scratches and some irregular pits (Figure 64). Although this is nothing more than anecdotal evidence, such a pattern for this one individual may be interpreted as the result of quite abrasive diet, as would be expected for an early agricultural Mesopotamian population (cf. Molleson et al. 1993 for dental microwear pattern analysis in a Late Neolithic tooth sample from Abu Hureyra on middle Euphrates).
Strong or very strong dental wear was previously observed in Neolithic and Chalcolithic samples of human remains from Abu Hureyra (Molleson 2000), Eridu (Otten 1948) and ‘Ubaid (Keith 1927). However, the degree of wear is strongly related to age and different proportions of younger and older adults in compared samples may obviously bias the analy-sis of the food induced abrasion rate. This problem may be resolved by using wear gradients instead of wear scores (Smith 1972; Scott 1979a). The second molar erupts ~6 years after the first molar and the greater relative difference in wear between these two teeth, the faster the dental wear. Assuming that food induced abrasion is most important factor of dental wear, this difference may be interpreted in terms of food toughness.
Dental wear gradients between the upper first and second molar were analysed in a sample of 120 adult individuals from Tell Majnuna and two other sites: nearby Tell Barri (Sołtysiak in print a) and Gohar Tepe located close to the southern shore of the Caspian Sea, Iran (cf. Sołtysiak 2008b). The last sample was included as a reference from a completely different ecological zone. Dental wear was scored on the right side, and left side if any of two compared teeth was missing on the right side. The scoring method was described in the Chapter 4 above. The sample from Tell Majnuna was divided into five contextual subsamples and for Tell Barri four chronological subsamples were defined (Bronze Age, Neo-Assyrian, Achaemenian, Mod-ern). The cemetery at Gohar Tepe was used for several hundred years, primarily during the Late Bronze Age and the Early Iron Age. In the whole sample, the linear correlation between dental wear degree in M1 and M2 appeared to be high (r=0.86), so the differences in the degree of dental wear between samples were explored with linear regression analysis (Figure 65), tak-ing wear scores of M2 as the independent variable.
Regression residuals appeared to differ significantly between samples. One-way variance analysis gave positive results both for the whole dataset (F=2.60, p=0.01) and for Tell Maj-

57
nuna contexts only (F=2.90, p=0.03). Differences are shown in the box&whiskers plot (Fig-ure 66) and in the matrix of LSD posthoc test results (Table 32). The most striking feature isa very low gradient of dental wear in the two latest subsamples from Tell Barri (indicated by negative residuals), occasionally there was no difference in wear stage between M1 and M2 and this suggests that much less abrasive food was consumed in these later periods. Possibly this dramatic change was related to the wider introduction of rotary quern instead of saddle quern, which could have taken place in the Neo-Assyrian period. In addition, food prepara-tion was moved from private households to manufactures, as evidenced by the “houses of the mill” mentioned by Neo-Babylonian texts (Forbes 1971:138, 142).
Variability among earlier subsamples is lower, but none the less two groups may be de-fined: one with the heaviest dental abrasion (most positive residuals) includes Bronze Age and Neo-Assyrian subsamples from Tell Barri together with individuals buried at the EME cem-etery and minor Tell Majnuna deposits. The group of subsamples with the moderate dental wear gradient is composed of two Tell Majnuna deposits (MTW1+4 and EM locus 25) and the sample from Gohar Tepe. The subsample from EM locus 6 appears to be located between groups of moderate and high dental wear gradient. The intra-group variability is highest in the Bronze Age subsample from Tell Barri and at Gohar Tepe, but these are the most heterogenous and represent several hundred years of history. It is interesting that in more homogenous subsamples from Area MTW and from the EME top cemetery the variance is also quite high which may suggest some variability in the toughness of food consumed by the individuals buried in these places. In general, the gradient of dental wear at Tell Majnuna is comparable to gradients in Bronze Age and Early Iron Age populations of the Near East, and the largest deposits at Tell Majnuna even show a somewhat smaller abrasion rate than the later EME cemetery and the two early Tell Barri subsamples.
It is impossible to reconstruct the actual composition of the diets of past populations and the only exception is the amount of consumed fermentable carbohydrates (such as glucose, fructose or sucrose) which can be processed by oral bacterial flora (esp. Streptococcus sp. and other acidophile species). These microbes in turn produce some organic acids which cause local demineralisation of tooth tissues and, eventually, may lead to the formation of a cariotic cavity. There are many factors positively correlated with the prevalence of dental caries (e.g. oral hygiene, dietary habits, food density), but most important of all is the abundance of sugar in the diet (cf. Gustafsson et al. 1954; Lingström et al. 1993; Hillson 1996:282). For that reason the frequency of dental caries may be interpreted as proxy indicator of ferment-able carbohydrate intake in the diets of past populations.
There are very few potential sources of sugars in the Khabour basin. Some grape remains were found in the Late Chalcolithic strata at Tell Brak and Tell Majnuna (Hald & Charles 2007), occasionally figs may had been planted in the river valley, but it is not likely that they provided the local population with a considerable amount of fermentable carbohydrates. The most important sources of sugar in the Near East are dates and the honey of wild bees, but date palms do not ripe so far north (Potts 1997) and honey must have been imported from Anatolia or the Zagros (Dalley 2002; Limet 1987). For that reason it may be safely assumed that the frequency of dental caries should be low in populations of the Khabour basin feeding only on local resources and a higher proportion of cariotic teeth was the result of increased mobility of goods or people (Sołtysiak 2006).
Actually, the low frequency of dental caries in Tell Majnuna fits this model (see Table 33). For a comparison with other sites, the weighted mean frequency (WMF) was counted (Sołtysiak 2006) and the distribution of WMFs in three contextual subsamples from Tell Ma-

58
jnuna and chronological subsamples from Tell Brak, Tell Barri and Tell Arbid (cf. Sołtysiak 2003) has been presented in the diagram, Figure 67. In almost all periods, the frequency of dental caries was as low as in Late Chalcolithic Tell Majnuna and only in three cases (Tell Barri in the Early Bronze Age and Achaemenian period, and Tell Arbid in the Islamic period) did it reach much higher values which could have been related to an increase in mobility (cf. Sołtysiak 2006). Thus, the low frequency of caries at Tell Majnuna may be interpreted as an indicator of diet based on local non-cariogenic resources. The difference between EM loc. 6 and two other contextual subsamples was most likely an effect of different age-at-death pat-terns. Dental caries is a chronic disease and more lesions may be expected in adults than in adolescents even if the carbohydrate intake is similar.
5.2. Nutrition and stress markers
In studies on differences in the quality of life between past human populations, stress, defined as any disturbance of organism's homeostasis, is the term of primary importance (cf. Selye 1956; Goodman & Armelagos 1988). Bioarchaeologists have developed various meth-ods of measuring both nonspecific stress and specific disturbances such as diseases, general undernutrition or specific deficiencies, for example of vitamin D (rickets), vitamin C (scurvy) or vitamin B12 (megaloblastic anemia). Among many defined dental and skeletal stress mark-ers, enamel defects and cranial porosities have been most frequently scored in archaeological samples, chiefly because they can be observed without any special equipment (cf. Larsen 1997), although more detailed studies are possible only with the use of a microscope (Hillson & Bond 1997; Schultz 2001).
Enamel defects––especially linear enamel hypoplasia (LEH) in permanent teeth––are thought to be a reliable indicator of nonspecific systemic stress related to episodes of un-dernutrition or disease in the period of enamel formation, i.e. chiefly 2-7 years in cases of permanent dentition. In rare instances, they may be related to hereditary factors or localised traumas (Crawford et al. 2007), but it is possible to distinguish between stress related LEH and hereditary or traumatic malformation of enamel (Goodman & Rose 1991). Undernutri-tion as an important cause of linear enamel hypoplasia has been proven in the contemporary Chinese population. In the cohort of people whose enamel was formed in the period of severe famine (1959-1961), the frequency of enamel hypoplasia was considerably higher than in previous and succeeding cohorts (Zhou & Corruccini 1998). A dramatic increase in enamel defect frequency was also observed in the central Australian tribes after the 1940s when they were forced to move to a sedentary life, and live in unhygienic conditions. Children were, therefore, more exposed to various kinds of infections (Littleton & Townsend 2005).
Most bioarchaeological studies of enamel defects concern the transition from foragingto agriculture and the time of weaning, although the latter topic may be problematic(Larsen 1997:50-56; Hillson 1996:176-177). Occasionally, the impact of known historical events on human populations has also been studied, such as the collapse of the Maya civili-sation (Wright 1997), agrarian crisis in Mesopotamia after the collapse of the Akkadian state (Dawson 1999) or the wars between Romans and Persians in the middle Euphrates valley (Tomczyk et al. 2006).
The formation of enamel is a gradual process with considerable inter-tooth differences and different susceptibilities (highest in canines and lowest in first molars). It is possible, therefore, to construct a scale which enables an estimation of age when a hypoplastic line is formed and to some extent also the extent of stress or its intensity. The process of enamel for-

59
mation is not linear, it slows down from the tip to cemento-enamel junction, but it is possible to calibrate the age scale with use of histological methods (Reid & Dean 2000; Ritzman et al. 2008). After complete formation of enamel, the defects remain present until the crown wear reaches their level or the tooth is lost, so the markers of the episodes of stress in the childhood may be observed also in adult individuals (cf. Figure 68).
Several studies revealed different mortality patterns between individuals with andwithout enamel defects: average age-at-death of the former is often lower (Duray 1996; Pa-lubeckaite et al. 2002). This tendency has been interpreted as the result of biological damageto the immune system during prenatal or postnatal development (Duray 1996), although social stratification and its consequences may perhaps be a more relevant factor. For example such a differential mortality was observed in Early Modern Lithuanian town populations, but not in the sample of skeletons of the contemporary aristocracy (Palubeckaite et al. 2002). It may be assumed therefore that people belonging to lower classes are expected to be more exposed to stress both in childhood (elevated risk of enamel defects) and in adulthood (lower life time expectancy).
Enamel defects in the Tell Majnuna dental sample were scored both in permanent and deciduous teeth. For permanent dentition a 4-grade scale was adopted where 0 – no hypo-plasia, 1 – small lines or irregularities, impossible to palpate, 2 – one distinct line, possibleto palpate, 3 – more than one distinct line (after Schultz 1988). Enamel hypocalcificationwas not scored because of the much greater risk of diagenetic or traumatic alteration. Because of the variable susceptibility, the average degree of enamel hypoplasia (DEH) was counted as a mean of mean scores for each tooth divided by 3, according to the equation [1] (raw data are presented in the Table 34). Mean scores for right and left side were taken into account, or scores for any present tooth if the opposite was missing. Upper and lower teeth were counted separately, but M3, I1 and I2 were excluded because of small recovery rate in many Tell Maj-nuna contexts. In result, a generalised value expressing the degree of enamel hypoplasia in the range between 0 and 1 has been counted for five Tell Majnuna contexts, EME top cemetery as well as three chronological subsamples from Tell Brak and six chronological subsamples from Tell Barri. Distribution of these scores is presented in the Figure 69.
m – number of tooth categories (max. 16),nm – number of individuals with present teeth from a given category,h – enamel hypoplasia score in 4-grade scale.
There is a group of subsamples with the lowest degree of enamel hypoplasia (DEH between 0.17 and 0.20), which includes the Early Bronze Age, Middle Bronze Age and Achaemenian subsamples from Tell Barri. The degree of enamel hypoplasia appeared to be higher (DEH between 0.23 and 0.28) in the two periods of agricultural crisis witnessed by archaeological and textual evidence and sometimes related to possible climatic changes. The first of them (between Early and Middle Bronze Age, ca. 2200–2000 BCE) was related to the fall of the Akkadian state (Abate 1994; Hole 1997; Cullen et al. 2000, cf. Lovell & Whyte 1999 for similar pattern of enamel hypoplasia in Egypt). The second crisis (between the Late Bronze Age and the Early Iron Age, ca. 1200–900 BCE) occurred over the entire Near East, except for some marginal areas (as probably Southern Levant), and during this period pastoralists
, [1]

60
took power over agriculture-based states (Neumann & Parpola 1987, cf. Griffin & Donlon 2007 for different pattern of hypoplasia in Pella, Jordan).
The degree of enamel hypoplasia at Tell Majnuna was very high in comparison to later samples. Only in the extremely small sample from Tell Brak Level E, including two individu-als from Area TW, which belonged to subadult individuals buried one or two hundred years before the event, did the DEH exceed 0.50. In all contexts from Tell Majnuna, including the later EME top cemetery, the degree of enamel hypoplasia was at least equal, but sometimes almost two times higher than in the subsamples dated to periods of the agricultural crisis known from historical sources. Such a dramatic difference may be at least partially related to different contexts: dental subsamples from Tell Majnuna came from mass deposits which wit-nessed short-term events while later subsamples were gathered at regular burial places; they are obviously heterogenous and represent broader chronological ranges. However, even after this warning, the degree of enamel hypoplasia at Tell Majnuna is high enough to conclude that people buried at this site were subject to strong environmental stress.
Interestingly, the frequencies of enamel hypoplasia were relatively lower in MTW1 and MTW4 than in EM locus 6. This difference was tested for upper canines and secondpremolars, for both teeth it appears to be statistically significant (χ2=20.58, p<0.0002, df=3 for canines and χ2=7.82, p<0.05, df=3 for premolars). It is not clear, however, wheth-er this tendency should be related to differences in sex ratio, average age-at-death, socialstatus, or chronology.
In a deposit of human remains which presumably reflected one short-term event it may be possible to roughly reconstruct the recent history of stress intensity in a local population by analysis of enamel hypoplasia degree in various dental wear categories assuming that the stronger the wear the older individual. Enamel defects observed in unworn teeth or germs reflect recent stress episodes, while teeth with more advanced wear allow insight into last 20–30 years before the death of people represented by the dental sample—the more advanced the wear, the less precise the relative chronology. Of course, such a method never gives such results comparable to those obtained from the analysis of real cohorts, but at least strong fluctuations in environmental stress may be detected.
The frequencies of enamel hypoplasia in seven dental wear categories were checked for two teeth: upper canine (Figure 70) and second premolar (Figure 71), and separately for the two most numerous dental samples: from EM loc. 6 and MTW1+4. Dental wear was measured on an 8-stage scale (Smith 1984), but the last two stages have been rejected. No clear pattern was found in P2 except for the low frequency of enamel hypoplasia in older in-dividuals. In canines a decrease in the frequency of enamel hypoplasia was observed in teeth with dental wear stage 3, especially in the MTW context. Due to the small sample size it was impossible to test this pattern in a reliable way (χ2=10.5, p<0.006, but more than 20% of cells with expected frequencies less than 5). For the two subsamples pooled (assuming that they were contemporary), dental wear stages 0/1, 2/3, 4/6 and hypoplasia stages 0/1 and 2/3 the differences are close to the conventional significance level (χ2=5.85, p=0.054). This is nota very strong conclusion, but it is possible that directly before the event which caused death of people buried in the MTW deposit there was a period of elevated stress lasting for several years, some 10 years before a period of relaxation, and again a time of elevated stress in the more distant past. Taking into account the fact that only a small area of Tell Majnuna has been excavated, there is still hope that it will be possible to check this pattern in the future, on a more numerous dental sample.

61
The major human remain deposits in the Areas MTW and EM were found in different stratigraphical contexts and the latter has been dated to a slightly later period (Augusta Mc-Mahon, pers. comm.). However, EM loc. 6 contained a secondary deposit of bone fragments which were already eroded at the time of deposition (see Chapters 2 and 3), so originally they could have been contemporary. Again, this is only a premise and not a very strong argument, but the patterns of enamel hypoplasia frequencies in dental wear categories are quite similar, especially in canines (Figure 72). In the case of two compared teeth there are moderate posi-tive correlations between LEH scores in both contexts (r=0.40 for canines and r=0.45 for second premolars, both figures are statistically insignificant).
Apart from LEH in permanent dentition, it is also possible to score localised hypoplasia in deciduous canines as a marker reflecting perinatal or neonatal stress. Such kinds of enamel defect have been observed quite frequently in ancient south Asian populations, also at Kish (26.8%), but unfortunately, the sample from this Mesopotamian site is very broadly dated, from EBA to the Neo-Babylonian period (Lukacs & Walimbe 1998; Lukacs et al. 2001). At Tell Majnuna there was one individual who was 3 years old (MTW4 loc. 65, layer 2, element 70) with both upper canines showing clear localised hypoplasia, but the sample of deciduous teeth was extremely small: only 5 complete upper canines from left side and 4 teeth from right side, so no statistical analysis is possible.
By analogy to the linear enamel hypoplasia, stress episodes may also produce lines in de-veloping bones. These stress markers, called Harris lines, are observed on X-ray photographs. However, they are not permanent and their interpretation is very difficult (Lewis & Roberts 1997), e.g. clinical studies shown that even ethanol consumption by children may induce them (González-Reimers et al. 1993). Taking into account all methodological problems and poor state of preservation of subadult metaphyses at Tell Majnuna, the analysis of Harrislines was not undertaken.
Cranial porosities (cribra orbitalia, CO in the orbital roof and porotic hyperostosis, PH on the cranial vault) have, since more than 40 years ago, been interpreted as symptoms of iron-deficiency anemias (Angel 1966). Only recently has this causative factor been replaced by hemolytic and megaloblastic anemias related to vitamin B12 deficiency. Moreover, it ap-pears that the etiology of cribra orbitalia is more complicated and this term denotes not only anemia-induced marrow hypertrophy (as porotic hyperostosis), but also subperiosteal orbital roof hematomas produced by scurvy or rickets (Walker et al. 2009). For that reason, and without histological analysis, the frequency of cribra orbitalia and porotic hyperostosis cannot be interpreted as a direct indicator of anemia prevalence in ancient populations, but rather as another measure of nonspecific systemic stress.
Due to fragmentation and erosion, the observation of both kinds of cranial porosities was possible only in a relatively few cases, in spite of great number of cranial fragments in most Tell Majnuna contexts. The orbital roof was often damaged or incomplete, so the degree of cribra orbitalia was not scored, only the absence, the presence of active porosity or the presence of an obliterated feature was scored (cf. Brothwell 1981:165). In all relatively well preserved orbital roofs the degree of cribra orbitalia was small or moderate (Figure 73), but it must be kept in mind that more advanced CO could have made this area more susceptible to damage. Also porotic hyperostosis was rare and never observed at an advanced stage, and often there were only small areas of very sparse porosity (Figure 74).
Cranial porosities are more common in subadult individuals, so their frequencies were scored separately for subadults and adults (Table 35). Cribra orbitalia appeared more fre-quently in EM loc. 6 than in MTW (~65% vs ~40% in subadults, ~65% vs 30% in adults).

62
The subadult sample size is too small, but in adults this difference is statistically significant af-ter pooling active and obliterated instances together (χ2=10.45, p=0.0013). Porotic hyperosto-sis is very rare, there were only single cases on frontal or occipital bones. It is more frequent in the parietal bone, but never at an advanced or even moderate stage. However, there are many instances of locally thickened bones of the cranial vault, which may be traces of well healed infections or traumas, but also, perhaps, a relic of completely obliterated advanced porotic hyperostosis. Such areas of bone thickening (8–12mm) were observed chiefly in parietal bone near lambda, less frequently in occipital bone near lambda or in parietal bone near bregma. In broken fragments, expanded diploë at an advanced stage of obliteration in the outer and inner table could have been noted. Most such cases (17) were found in EM loc. 6, only three in MTW1+4, one in EM loc. 25 and one in MTW2. Even if some of them had a different background, such a great frequency of local bone thickening areas in EM loc. 6 suggests that many individuals from this context once suffered from more advanced porotic hyperostosis.
In subadult individuals some areas of porosity or exposed trabecular bone may be ob-served near the metaphyses of the long bones, especially on the anterior-inferior side of the femoral neck. There are some attempts to interpret this condition called femoral cribra as analogical to cribra orbitalia (Djuric et al. 2008), but such a feature is just an area of rapidly growing and remodeling bone, typical for subadult individuals (Mann & Hunt 2005:170-171). Sometimes a depression and exposed trabeculae can be present in adult individuals as so-called Allen's fossa (Finnegan 1978). In the whole sample from all the Tell Majnuna contexts, there was porosity on the femoral neck in 27/30 subadult and in 12/42 adult indi-viduals, so the frequency of Allen's fossa was nearly 30% (Figure 75).
There are no good skeletal or dental indicators of starvation. Occasionally prolongated severe undernutrition may cause osteoporosis with some overlay of osteomalacia (Ortner 2003:405), but it is very difficult to diagnose osteoporosis in usually eroded archaeological samples, even with histological methods. The advanced thinning of cortical bone which may be a reliable symptom of osteoporosis was observed in two individuals. The first fragment (femoral midshaft, MTW3 loc. 33.5 element 2) most likely belonged to a female (midshaft circumference 78), the second fragment (midshaft of fibula, MTW4 loc. 65, element F7) was also gracile and thus more likely female than male. It has not been possible to determine age, so in both instances there is a greater probability of osteoporosis affecting women at a post-menopausal age than as a sign of starvation.
5.3. Injuries
Although injuries of various kind are the most common sign of interaction between peo-ple and their environment, only some of them leave traces on the human skeleton. Analysis of these traces may be useful in the reconstruction of physical activity of past human popula-tions related for example to subsistence patterns, social stratification or gender roles. Injuries are usually the result of accidents, less frequently of interpersonal violence, fatigue or disease (as osteoporosis), although sometimes these factors are interrelated in many ways (cf. Lovell 1997; Ortner 2003:119).
The most spectacular category of injuries are the signs of interpersonal violence, among them traumas to the skull, projectile points embedded in bone, sword wounds in bone, parry fractures of the forearm, traces of scalping (Ortner 2003:137, 166). Sometimes these are difficult to distinguish from injuries resulting from accidents (parry fractures) or postmor-tem modifications (scalping), but occasionally atypical burial context may be also helpful

63
in diagnosis (Wakely 1997; Ortner 2003:137). Even if single cranial fractures or embedded projectiles may be the result of an accident, the higher frequency of specific injuries in one skeletal sample is a good indicator of interpersonal violence (Milner 1999; Walker 2001; cf. Liston & Baker 1996).
The reliable diagnosis of injuries is relatively easy in case of healed antemortem trauma, but may be risky if no traces of healing are observed. Even if damage to fresh bone leaves sharp edges with smooth surface and acute angles, and fractures of dry bones are rough withright edges (Moraitis & Spilipoulou 2006; Wheatley 2008), it may be impossible to distin-guish between recent antemortem trauma which was not the cause of death but occurred within one or two weeks before, actual perimortem trauma which might be the cause of death, and early postmortem mutilations related to the rough treatment of the corpse (Walker 2001). For that reason it is reasonable to understand the term ‘perimortem trau-ma’ in a wider sense, that is as all bone modifications due to external factors in the periodbetween one/two weeks before, and several weeks after death. Moreover, some diagenetic fac-tors may imitate injuries or obliterate signs of real trauma (cf. Calce & Rogers 2007).
The complicated history of human bone deposits at Tell Majnuna makes the diagnosis of perimortem trauma, even in its wider sense, completely impossible. However, many instances of healed antemortem trauma were noted, among them cranial fractures, compression frac-tures in vertebral bodies, a few dislocations and subperiosteal new bone formations.
Cranial injuries are thought to be good indicator of interpersonal violence. In the prehis-toric populations of the Channel Islands, southern California, the frequency of healed cranial injuries was as high as 19%, considerably more than in inland populations. This tendency was explained as the result of increased competition over resources in a closed island environ-ment. Most injuries were circular or ellipsoidal, some irregular, 1-1.5cm in diameter. The prevalence of trauma in adult males was evident (Walker 1989; Lambert & Walker 1991). Closer in time and space to Tell Majnuna, three clear circumscribed oval depressed fractures were found in one adolescent individual buried at the Chalcolithic site Shiqmim (northern Negev). The lack of signs of healing or infection suggests that these blows may have been the direct cause of death (Dawson et al. 2003).
In the sample of human remains from Tell Majnuna, there were as many as 11 cases of healed cranial injuries which makes ~17% of individuals, counted as the sum of preserved areas of the cranial vault. This figure is unexpectedly high, because cranial injuries were ex-tremely rare across Mesopotamia. There were four cases in the Neolithic site of Zawi Chemi (Agelarakis 1993), previously interpreted as trephinations (Ferembach 1970), two cases of alleged trephinations in a sample of skeletons of warriors killed during the siege of Tuttul (Middle Bronze Age; Wolska 1994), one of which seems to be a well healed compression fracture and the second looks like an attempt at the medical treatment of a wound. Two pos-sible perimortem fractures were observed in the Neo-Assyrian skeletons from Assur (Sołtysiak 2002; Sołtysiak in print c) and one healed compression fracture was found in a young male at the Roman cemetery in Tell Seh Hamad (Witzel et al. 2000). Altogether, this is a modest number, much lower than the number of cranial injuries in prehistoric Iranian populations (Rathbun 1984). It is striking that at Tell Majnuna there are more cranial injuries recorded than for all previously studied Mesopotamian archaeological sites.
Cranial injuries observed at Tell Majnuna are quite variable (Table 36). There is no preva-lence of right or left side nor any specific location. Although sex diagnosis was not possible in most cases, two skulls with such injuries were very gracile and two were very robust which suggests that both sexes had been affected. Also, the size and shape of the healed depressions

64
are very variable, from small point injuries (Figure 76), through more regular oval depres-sions resembling those from California (Figure 77), to long regular lines (Figure 78). Most instances were completely healed and only once could a small bone reaction around the injury be observed (Figure 77). The cranial injuries were clearly more common in the Area MTW contexts, and in EM loc. 6 only one was observed. Although skulls in EM loc. 6 were usually more fragmented than in most MTW contexts, many were complete or almost com-plete, so this difference was not an artifact of recovery.
The variability of shapes must have been related to the variability of weapons. Reconstruc-tion of the weaponry in so early a society as the Late Chalcolithic urban centre at Tell Brak is not an easy task and only the potential tools of interpersonal violence may be enumer-ated. Among them are clubs or maces with wooden handles and stone heads, stone axes or adzes, spears or arrows with flint arrowheads, and obsidian knives. All tools of that sort have been attested at prehistoric sites across Mesopotamia (Moorey 1994:61-73), some in the Late Chalcolithic strata at Tell Brak, and Tell Majnuna itself. Obviously more specialised weap-onry, such as swords were not used in this early period, but there is a controversial hypothesis that small clay spheres or balls, which were found in great number in Late Chalcolithic strata at Tell Hamoukar, could have been used as projectiles (Lawler 2006). In general, blunt tools (such as maces or stone adzes) are much more likely weapons in Late Chalcolithic Mesopo-tamia than any sharp tools. However, the presence of two linear fractures in MTW4 deposits suggests that the latter could have been used.
The most common category of injuries are fractures of postcranial bones, some caused by accidents, others by fatigue (especially compression fractures of vertebral bodies) or by meta-bolic diseases (such as scurvy or osteoporosis). In general, fractures were relatively infrequent in ancient Mesopotamia (Sołtysiak in print e), and in the whole sample from Tell Majnuna there was not a single case of an antemortem fracture of a long bone, but as many as eight compression fractures of vertebral bodies (Table 37). Here, a domination of EM or MTW contexts is not revealed, although the pattern of fractures in the small MTW subsample superficially seems to be more variable. All subjects were adults or young adults (remains of the billowing still visible in two cases) and most fractures did not coincide with spondylosis (Figure 79). The number of injuries of that kind, related to fatigue and usually occurring in more advanced age (cf. Lovell 1997), seems quite high when one remembers the low average age-at-death, especially in EM loc. 6. Again, in this respect the sample of human remains from Tell Majnuna more resembles the Proto-Neolithic sample from Zawi Chemi (Agelarakis 1993) than skeletons from historical cemeteries (Sołtysiak in print e).
Another type of injury are dislocations, which prevail in subadults and younger adults, while in older individuals fractures would be a more likely response to similar factors (Lovell 1997). Sometimes dislocations may have been related to a definite kind of physical activity (cf. Molleson 2007, Oates et al. 2008), but usually their cause is unclear. In Tell Majnuna there were three cases of that sort: first in the upper articular surface of the atlas (Figure 80), second in the auricular surface of the ilium, third probably in the sternal end of a clavicle.
Occasionally very strong strokes may lead to the formation of subperiosteal new bone due to the calcification of blood (Walker 2001). Although there are several different kinds of periostitis and some of them originate in skin ulcers or other infections (Resnick 2002), traumatic periostitis with new bone formation may be expected in bone areas near the skin (such as the medial and anterior midshaft of the tibia) which are thus more exposed to direct trauma (Ortner 2003:209) or in areas of major muscular attachments, which may be exposed to indirect trauma (cf. Wilder & Sethi 2004). Traumatic periostitis due to trauma in the ad-

65
ductor muscle (‘thigh splints’ or adductor insertion avulsion syndrome) has been observed on the medial and anterior side of the femoral diaphysis in modern patients, who exercise heavily or in soldiers (Charkes et al. 1987; Anderson et al. 2001). In addition, in professional runners and soldiers periosteal reaction develops on posteromedial tibial border and is known as ‘shin splints’ or tibial stress syndrome (Clement 1974; Nielsen et al. 1991; Batt 1995). This symp-tom may reflect trauma in the tibialis posterior or soleus muscle (Michael & Holder 1985).
Periostitis of all kinds occurred at Tell Majnuna in 12 bones of at most 10 individuals (Table 38). It is possible, however, that all femora and tibiae from MTW4 loc. 64 with the most evident cases of subperiosteal new bone formation (which may be most likely related to trauma) belonged to two adult male individuals: one represented by two femora (layer 3, ele-ments 47 and 48.1), the second represented by two femora and two tibiae (layer 5, elements 49 together with elements E+G10 and G13). In all these elements the pathologically modi-fied area was large, although the calcified layer of new bone had been partially removed post-mortem (Figure 81). The prevalence of the medial side (both femur and tibia) and anterior side (tibia) agrees with those areas most exposed for direct and indirect trauma, although sure diagnosis of adductor insertion avulsion syndrome or tibial stress syndrome is not possible. All other instances of periostitis were more likely caused by local inflammation: there was porosity and mild bone reaction in a small area, but without new bone formation.
Among all the injuries, cranial fractures and traumatic periostitis seem to be morefrequent in Area MTW, while compression fractures of the vertebral bodies are distributed in a more uniform way. The sample size is, however, too small for any statistical testing of these differences.
5.4. Degenerative joint disease
Degenerative joint disease (DJD) is the most common pathological condition observed inarchaeological samples. Although it progresses with age, the process of joint degeneration may be accelerated by mechanical stress or hereditary factors. It was also noted that theexpression of joint disease is more common in women (Ortner 2003:545-558). Again, as for the case of periostitis, there are many categories of the degenerative joint disease, andthe most common is nonspecific osteoarthritis (or osteoarthrosis) in synovial joints (Weiss& Jurmain 2007) and spondylosis (called also vertebral osteophytosis) between vertebral bodies (Jurmain & Kilgore 1995).
Both osteoarthritis and spondylosis were quite rare in the human remains from Tell Ma-jnuna, a factor obviously related to the small proportion of older adults in all contexts. The occurrence of degenerative joint disease was scored on a 3-stage scale (0 – no osteoarthritis/spondylosis, 1 – small osteophyte formation and mild irregularities of the articular surface, 2 – large osteophytes, porosity and/or eburnation of the articular surface, Figure 82). Scores for four subsamples and all joints observed are presented in the Tables 39 (osteoarthritis) and 40 (spondylosis). Hand and foot bones were omitted due to the small recovery rate and the general lack of pathological changes in joints.
The general frequency of degenerative joint disease is much higher in EM locus 6 and MTW1 than in MTW4. This difference was tested with use of Friedman ANOVA (three sub-samples, 12 regions of the body) and the value χ2=13.9 appeared to be statistically significant (p=0.00095). However, the overall pattern is quite similar in all subsamples, the Kendall Co-efficient of Concordance R=0.58, which means that the relative proportions of DJD in body regions are recurrent. In general, DJD occurred most frequently in the pelvis (acetabulum

66
and sacrum), but almost all of these cases were very mild, just small marginal osteophytes. More interesting is the relatively high prevalence of osteoarthritis in the shoulder, ribs and skull (Figure 83), evident especially in EM loc. 6. This gradient of a decreasing proportion of DJD from upper to lower body regions is clearly visible in the frequencies of osteoarthritis in the vertebral arches (Figure 84), although spondylosis does not follow this pattern and domi-nates in the lumbar vertebrae, with the curious exception of the subsample MTW1 where the spondylosis in cervical spine is also frequent. Moreover, only in the MTW1 context were two examples of ankylosing spondylitis were observed, one between two cervical vertebrae (Figure 85), another between L5 and S1. Also in MTW1 sclerosis of trabeculae was present in one talus, such a condition may be also related to the osteoarthritis (Figure 86), although another factors as infection (osteomyelitis) or metabolic disorders are also possible.
The observed difference in the frequency of the degenerative joint disease between the three subsamples does not reflect age pattern and seems not to be related to sex differences, although EM locus 6, with more young individuals and more females, exhibited only slightly lower rate of DJD than MTW1, which had more males and a higher average age-at-death. However, the very low frequency of osteoarthritis (but not spondylosis) in MTW4 compared to MTW1 could be explained in terms of differences in the level of the physical activity. The prevalence of degenerative joint disease in the cervical vertebrae, evident in MTW1 but quite clear also in EM locus 6, and the general relatively high rate of this pathological condition in the area of shoulder and in occipital condyles (chiefly in EM locus 6) was most likely the effect of heavy loads transported on the head or back with a supportive band or rope on head (cf. Kennedy 1989; Lovell 1994; Molleson 2000; Molleson & Hodgson 2000). In Bronze Age Harappa the elevated rate of DJD in cervical vertebrae was common in females, which suggests that the carrying of resources on the head was a sex-specific activity (Lovell 1994). The incidence of DJD chiefly in lumbar and lower thoracic vertebrae could be interpreted as a generalised stress marker (Kennedy 1989) and in this respect the mechanical stress in the MTW4 subsample may be estimated as lower than in the three other contexts.
Some differences between MTW1 (more DJD in vertebrae) and EM loc. 6 (more DJD in the shoulder, arm and skull) may be seen on the Correspondence Analysis biplot (Figure 87); here, the distant position of MTW4 is evident with the elevated rate of DJD only in thoracic and lumbar bodies. This peculiarity of the subsample of human remains buried at MTW4 may be cautiously interpreted as a reflection of social stratification. In the Parthian/Roman cemetery at Tell Seh Hamad rich people buried in constructed graves less suffered from DJD than poor people buried in simple pit graves and this difference was especially sharp in the rate of spinal pathologies (Witzel et al. 2000).
In spite of small number of published skeletal samples from Mesopotamia, a general de-crease in the frequency of osteoarthritis and spondylosis may be observed between Neo-lithic and historical periods. In the Early Neolithic sites as Zawi Chemi (Agelarakis 1993) or Hajji Firuz Tepe (Turnquist 1983) this pathology was very common, later it kept a high rate only in the more elderly population (Sołtysiak in print e). Unfortunately, no comparative data from Chalcolithic sites is available, except one anecdotal instance of spondylosis at TellRubeidheh (Downs 1988).
5.5. Physical activity
People in the past were much more physically active than modern representatives of our species, perhaps with exception of sportsmen and special forces soldiers. Bioarchaeological

67
studies on physical activity include estimations of the general level of physical activity and the reconstruction of social differences or labour divisions between sexes. Apart from direct im-pact, the high rate of mechanical stress in females may also have demographical consequences as such decreases fecundity (Ellison 1994), although actual studies on this effect on ancient populations are impossible. Occasionally some particular kinds of activity may be diagnosed with a certain likelihood, like grinding of cereals on a saddle quern (Molleson 1994), har-pooning (Molnar 2006) or hunting with the use of atlatl (Peterson 1998). Activity related traits which may be observed in a skeleton include bone remodelling, some injuries (see above), musculoskeletal stress markers, laterality in size or shape, the distribution of the de-generative joint disease (see above), non-pathologial joint modifications, and unusual dental wear (cf. Molleson 2007). Among all these traits, only laterality could not have been observed in the secondary deposits of human remains at Tell Majnuna. Although the reliable diagnosis of specific activity patterns is disputable as this is frequently based only on anecdotal evidence (Kennedy 1998) and individual responses to similar mechanical stress substantially differ (cf. Larsen 1997:185; Molleson 2007), at least a general estimation of the mechanical stress on a population may be possible with the use of several methods. Moreover, high or low inter-group variability in various activity related traits points to a lack or presence of a division of labour and thus to social stratification (Robb 1998). In addition, the subsistence strategy matters as is indicated by the general decrease in skeletal robusticity during the transition from foraging to agriculture (Larsen 1995).
The broad category of markers for occupational stress (MOS) includes musculoskeletal stress markers (MSM) and non-pathological joint modifications (as squatting facets or Po-irier's facet). Most of these traits develop before the bone ossification process is complete, and so reflect occupational stress which was initiated in subadult individuals (Pearson & Lieberman 2004). Initially, entheses are hardly visible on bones or may be present as grooves or depressions, in adult individuals they frequently form more or less distinct bony ridges (Molleson 2006), although they occasionally retain the form of a groove, such as the popliteal line in platycnemic tibiae (see below).
Interpretation of the musculoskeletal stress markers is often very difficult. They may be scored in several ways and most authors distinguish between robusticity (ruggedness) markers reflecting normal loading and stress lesions due to the overuse of a given muscle (Hawkey & Merbs 1995). Sometimes ossification is also scored as the third MSM feature (Weiss 2003). In general, the degree of MSMs is significantly correlated with many factors, such as sex (males more robust), age of an individual (older individuals will have more developed attach-ment areas) or the general size of bone (Weiss 2003, 2004). Any inter-group comparisons may be seriously biased if these correlations are ignored. Moreover, MSMs reflect rather load-ing intensity than loading frequency or duration (Churchill & Morris 1998), so only some aspects of physical activity may be measured with the use of these traits. In spite of all these difficulties, research on patterns of physical activity in past populations is quite popular and differences between foragers and first agriculturalists are especially searched for, as between Natufian and PPNA people in the Levant (Peterson 1997, 1998; Eshed et al. 2004).
Several activity related traits were scored in a systematic way in the sample of adult human remains from Tell Majnuna, others were noted only occasionally, when markedly developed. In most cases a 3-grade scoring system was adopted (0 – feature not present or very small, 1 – medium development, 2 – prominent or very prominent trait). The frequencies of six lower limb traits in three subsamples are presented in the Table 41. The differences between EM locus 6 and the MTW subsamples could not be tested in most cases, but in general there

68
was a modest prevalence of well developed traits in EM locus 6, which in the distribution of the third trochanter appeared to be almost significant at the conventional level (χ2=3.75, p=0.053). However, the presence of the third trochanter may not be necessarily related to physical activity. In general, other traits were often very well developed in all Tell Majnuna subsamples. In almost 60% there was a distinct tubercle on the intertrochanteric line, the attachment place of the iliofemoral ligament. More than 75% of individuals exhibited hypo-trochanteric fossa in the place where the gluteus maximus attaches to the femur. This trait was also frequently observed for the Proto-Neolithic population from Nemrik 9 and interpreted as a sign of intensive running and jumping (Molleson 2006).
Poirier's facet, or the extension of the articular surface of the head, was also frequently present at Tell Majnuna, although usually only moderately developed. This trait may be pro-duced by the flexion of the knee and extension of the hip joint (Kennedy 1989). Also the frequency of Allen's fossa was equally high, almost 30% (see above), again possibly the result of the hyperflexion of hip and knees with hyperdorsiflexion of ankle and subtalar joints. It may have been related to the squatting position or (less likely) a rapid descent of a steep slope (Kennedy 1989). Squatting may produce also squatting facets at the anterior surface of the distal end of tibia (Kennedy 1989; Boule 2001) or vastus notch on the patella, although the latter is also related to the sartorial position (Molleson 2006). Both traits were quite common at Tell Majnuna, although their presence was expected, as squatting was a common position ofrest in ancient populations.
The development and ruggedness of some attachment areas was also scored (Table 42). Again, the sample size was too small for any testing, but the slightly greater ruggedness for the EM loc. 6 upper limbs and for the MTW lower limbs may be cautiously suggested. These differences between the two contexts are close to the conventional statistical significance level, in the case of the clavicular conoid tubercle (χ2=3.05, p=0.08, Yates correction) and in the case of the linea aspera of the femur (χ2=5.42, p=0.067). In the latter case, only ruggedness was measured and not the general size or shape of this feature. The development of the attach-ment sites of the deltoid and the ruggedness of radial tuberosity might be due to the carrying of loads, especially when doing so with flexed elbows (Dutour 1986).
Differences in the breadth of the radial head articular surface on the medial and lateral sides are interpreted as the effect of pronation (Kapandji 1982:112). This trait was measured in the metric scale and the mean lateral to medial proportion was 0.50 (N=11, s.d.=0.13) in the whole sample of human remains from Tell Majnuna. The sample size was too small to check for differences between EM loc. 6 and MTW, but in general this feature seems to be more prominent than in later periods.
In addition, the development of the supinator crest of the ulna has been measured as the ratio of AP and ML diaphyseal diameters in the area of greater crest prominence. Hypertro-phy of this attachment in Indian Mesolithic foragers was explained as related to the use of missile weapons (Kennedy 1983), but the habitual pronation and supination of the forearm with humeroulnar extension may also produce such an effect (Kennedy 1989). There were no differences in the development of the supinator crest between MTW1 and MTW4. In the whole MTW subsample the crest was moderately developed (mean 117.7, N=11, s.d.=9.38), this is less than in EM loc. 6 (mean 127.4, N=12, s.d.=11.53) and in other contexts (mean 131.4, N=4, s.d.=15.38), although in the last case the sample size is very small and variance considerably higher. The difference between EM loc. 6 and MTW appears to be statistically significant (t=2.21, p=0.038). It was not possible to check the differences between sexes, but bearing in mind the dominance of females in EM loc. 6, the higher degree of supinator
69
crest development in this context is surprising, because this feature is usually more promi-nent in males (cf. Kennedy 1983). The degree of development of the lateral supracondylar ridge in the humerus (the attachment place of the extensor carpi radialis longus and bra-chioradialis muscles, cf. Molleson 2006) was not systematically scored, but among eight ob-served cases of its unusual development, as many as seven were found in EM loc. 6, and only one in MTW4 loc. 65. Sometimes it was noted that the bone was small and gracile and only this feature very prominent. No side domination occurred, as this trait was observed in four right and four left humeri.
Also, the development of the interosseous crest of the radius differed between EM loc.6 and MTW. This feature was measured only in a few adult individuals, but the mean ofML to AP diaphyseal index at greater development of the crest was 148.6 in EM loc.6 (N=13, SD=14.7) and only 116.2 in MTW (N=3, SD=16.7). This difference appeared to be significant in spite of the small sample size (t=3.37, p=0.005; Mann-Whitney U-test Z=2.35, p=0.02).
In the Neolithic site Tell Abu Hureyra, metatarsal-phalangeal alterations due to prolonged hyperdorsiflexion of the toes related to kneeling were observed in females and interpreted as the result of habitual grain grinding on a saddle quern (Molleson 1994). Only very few metatarsals were retrieved from Tell Majnuna, but strong modification of the distal articular surface was observed in one first metatarsal (Figure 88). This bone belonged to a female individual, sex diagnosed from the length of the talar articular surface. However, in compari-son to Abu Hureyra, here the extension occurred in the plantar side, and may be rather the consequence of a mild traumatic dislocation (cf. Garcia Mata et al. 1995; Sarban et al. 2004) than the effect of habitual activity.
Apart from the markers of occupational stress, some aspects of physical activity in past populations may be deduced from bone geometry. Research of this kind is focused on cross-sectional geometry of long bone diaphyses (especially femur) analysed with use of CT scans, but metric diaphyseal measurements and indices may also be used (Larsen 1997:195-203). In general, the greater the physical activity since childhood, the more flattened the diaphyses due to muscular pressure (Lovejoy et al. 1976; Ruff 1987; Larsen 1995; Feik et al. 2000). This flattening is called platybrachia (humerus), platymeria (proximal femur) or platycnemia (tibia). In addition, the development of the linea aspera in the femoral midshaft may be measured by the pilasteric index.
In general, long bones tend to be less and less flattened with time (Buxton 1938; Holt 2003) and the pilasteric index was higher in earlier, more mechanically stressed populations, with sexual dimorphism in this feature more pronounced (Ruff 1987). Although the differ-ences between sexes in the platymeric index may be related to the differences in the position of femora (Ruff 2002; Brown 2006) and some authors have observed some kind of relation between femoral and tibial indices and climate (Pearson 2000; Ruff et al. 2006), mechanical load is generally thought to be the major factor involved in bone flattening.
Significant differences in the platymeric index were observed between American Indians and modern forensic cases. The flattening occurred at an age of 5 years or before, prior to gait maturation, and then remained until the adulthood (Wescott 2005, 2006a). Flattening of the tibia (platycnemia) is interpreted as the result of flexion in the squatting position or stress from soleus and deep plantar-flexors of the feet due to running in rough terrain (Kennedy 1989). The lower cnemic index in males in the middle Euphrates valley was linked with the habitual squatting of male herders and the more differentiated positions adopted by women while engaged in household activities (Tomczyk & Sołtysiak 2009). In addition, in the Neo-
70
lithic period, Çatalhöyük males habitually squatted and the position of females was more variable (Molleson 2007a). Pilasterism was sometimes related just to upright position (Ken-nedy 1989), but the sexual dimorphism in the pilasteric index appeared to be strongly cor-related with mobility, the more mobile population, the greater difference (Wescott 2006).
Due to the secondary nature of the deposits explored at Tell Majnuna, it was not pos-sible to determine the sex of most long bones, as the most reliable methods are based on pelvic morphology. However, both platymeric and pilasteric indices in Tell Majnuna appear to be positively correlated with bone size (r=0.33 and 0.37 respectively) and it could have been the effect of sexual dimorphism. For that reason the sex of femora was conventio-nally determined by an examination of the bone size (male individuals with femoral mid-shaft circumference 88mm or more, ML subtrochanteric diameter 32.5 or more). Sexual dimorphism and differences between contexts in femoral indices were tested with the facto-rial ANOVA. No significant pattern was found in case of the platymeric index (see Table 43), but the pilasteric index was differentiated by both factors (F=2.90, p=0.039 for con-text; F=10.06, p=0.002 for sex). However, one-way ANOVA for both sexes separately pro-duced no significant differences between contexts (F=2.76, p=0.051 for females, F=0.66, p=0.582 for males) and there was a clear domination of females in EM locus 6, so evidently only sex matters in this case.
When compared to the samples from Chagar Bazar (Middle Bronze Age; Sołtysiak in print b), Tell Ashara and Tell Masaikh (middle Euphrates valley, chiefly Late Roman and Islamic period; Tomczyk & Sołtysiak 2009), the sexual dimorphism in shaft indices at Tell Majnuna was much greater than in later periods, which may be interpreted as the result of greater activity in the Late Chalcolithic. The linea aspera was very pronounced in many cases (Figure 89) and frequently skewed to the medial side, both in EM locus 6 and in MTW. The pilasteric index was not significantly different between Tell Majnuna and the middle Euphra-tes valley (see Table 43), although in males the difference is greater than in females and close to the conventional significance level. Otherwise, the flattening of the subtrochanteric area in both sexes was distinctly more pronounced in Tell Majnuna than in the later population of the middle Euphrates valley.
The lack of correlation between the cnemic index and the size of tibia (measured as the circumference at the nutrient foramen, r=-0.09) points to the lack of sexual dimorphism in the flattening of tibia at Tell Majnuna. There are also no differences between EM loc. 6 and MTW (Table 43), and bones excavated in MTW4 seem to be only slightly more platycne-mic than tibiae from MTW1 (t=1.40, p=0.18). Again, this lack of variability among Tell Majnuna contexts is accompanied by significant differences between Tell Majnuna and the middle Euphates valley, both in males and females, the earlier tibiae much more flattened especially in females. Significant platycnemia in Tell Majnuna was frequently accompanied by the prominence of the popliteal line which occasionally retained the form of a deep groove even in adult individuals (Figure 90). Further, the fibula was, in at least eight cases, signifi-cantly flattened in the distal diaphysis, sometimes with 2:1 ratio.
Only occasionally was the humerus complete enough to allow midshaft measurements. Among the nine adult individuals for whom minimum and maximum diameters were taken, in EM loc. 6 the mean platybrachic index was 66.7 (N=2, s.d.=1.12) and in MTW it was 82.3 (N=7, s.d.=2.14). In spite of extremely small sample size, this difference is statistically significant (t=9.60, p=0.00003; Mann-Whitney U test Z=2.05, p=0.04; Wald-Wolfowitz runs test Z=2.33, p=0.02). No reliable analysis of the sexual dimorphism was possible in the case of the humerus.

71
In general, the midshaft geometry for Late Chalcolithic Tell Majnuna and for the later populations of the middle Euphrates valley significantly differ from each other and only in the pilasteric index was there no difference between females and only slight difference be-tween males. The sample from Tell Majnuna itself was quite homogenous in the diaphyseal indices of the lower extremity, although the sexual dimorphic difference appeared to be sig-nificant in the pilasteric index. In contrast, the flattening of the humerus was much stronger in EM loc. 6 than in MTW.
As many as eight crania found at Tell Majnuna displayed a broad transverse sulcus behind the coronal suture on the parietal (Figure 91). Such were not regular saddle-shaped variants of the parietal, but an activity related feature, because the bone had been thinned in this area by 1-2mm. Similar sulcus was observed in two skulls from the Proto-Neolithic site Nemrik 9 and interpreted as the effect of loads carried with use of a ‘tump-line’ over the head (Molleson 2006). In Tell Majnuna, this feature occurred in one skull from EM loc. 16, three skulls from MTW1 loc. 59.2 and four skulls from MTW4. No case was found in EM loc. 6, but this negative evidence may be related to the much higher fragmentation rate in this context. One cranium with transverse sulcus belonged to a child 10/11 years old, others to adult individu-als. As discussed above, reliable sex diagnosis using of methods based on skull morphology is problematic at Tell Majnuna, but in four cases the crania with sulcus were very gracile and thus likely belonged to females. In three other individuals gracility was not so evident, but these crania were more likely female than male. The average degree of the sexual dimorphism expressed in the scale from -2 (female) to +2 (male) was -1.0 in the sample of six crania for which at least four sex related traits could have been scored.
In the Near East cranial deformations were widespread in the Neolithic and Chalcolithic periods. Initially they were present in both sexes, later more common in females (Meiklejohn et al. 1992; Zias 1993), although in the Chalcolithic sample from Tell Arpachiyah no differ-ence between sexes was observed (Molleson & Campbell 1995). Artificial cranial deforma-tion also occurred in at least one skull from Tell Majnuna (Figure 92). Usually frontal bones were flattened and whole cranium elongated (Meiklejohn et al. 1992) and such deformation may be related to the carrying of loads with supporting broad band over the cranium. This method could be exercised as an alternative to placing a rope over parietal which presumably induced the transverse sulcus.
The relatively high frequency or intensity of the markers of occupational stress in the upper limbs in EM loc. 6, in spite of the domination of women and younger adults in this context, together with the higher rate of degenerative joint disease in cervical vertebrae, sug-gests that carrying of heavy loads was probably very important task at least for females buried at Tell Majnuna. This assumption is corroborated by the presence of the transverse sulcus on the parietal. Mechanical stress in male individuals seemed to be heavier for the lower limbs, although it is impossible to recognise the actual kind of activity which could produce sucha pattern. For sure, the people from Tell Majnuna were much more physically active than later inhabitants of the middle Euphrates valley.


Part Two: Synthesis


6. Interpretation of the depositsDeposits of commingled human remains are quite frequently found at archaeological
sites and in some regions and some periods (as Late Neolithic in France; cf. Masset 2007)they were even more numerous than regular cemeteries. Multiple burials or human bone deposits may have been the result of many different social or natural processes, some of them perhaps unimaginable to a modern researcher. The most common and simplest case is (1) reg-ular secondary burial, when the remains of the dead are moved to another place or mixed to-gether in an ossuary. However, there are many more possibilities: (2) multiple burial at a bat-tlefield, (3) the deposit of massacred unburied bodies, (4) multiple burial during the outbreakof an epidemic disease, (5) multiple burial due to starvation, (6) an instance of cannibalism, (7) deposit generated through ritual activity, e.g. the cult of ancestors. Some of these catego-ries are overlapping (e.g. starvation and cannibalism or battlefield common burial moved from primary to secondary place), but they may be defined as a set of distinct theoretical possibilities which implicate presence or absence of certain pieces of evidence (a basic list is proposed in the Table 44).
Multiple burials or commingled deposits of human remains have rather rarely been found at the archaeological sites of Mesopotamia. Common intentional or accidental burials of city defenders have been excavated in the Middle Bronze Age levels at Tuttul (Strommenger & Kohlmeyer 1998) and in the Halzi Gate of Neo-Assyrian Nineveh (Stronach & Lums-den 1992). Strongly eroded and fragmented skeletons of possible victims of the successful siege by Median troops were also found at Assur (Sołtysiak 2002). Regular secondary burials were quite common throughout Neolithic and Chalcolithic (Voigt & Meadow 1983:75) and there are also examples from the Bronze Age, such as Gre Virike (Ökse 2006) and Tell Arbid (Sołtysiak 2003). A peculiar pit containing mixed fragments of selected bones of at least 32 individuals was found also in the Area TC at Tell Brak, in the stratum dated to the later Early Bronze Age (Sołtysiak in print f ).
Occasionally the interpretation of a multiple burial is quite easy. For example if it contains skeletons of adult males with some weapons, perimortem fractures are abundant and some missiles are embedded in bones, even the most sceptical observer should agree that such isa battlefield common burial. In reality, however, such clear and unequivocal cases are rather the exception than a rule, and usually it is possible only to suggest a most likely interpreta-tion. Moreover, the background of any multiple deposit may be rather multi- than unifac-toral and the interplay of various natural and social processes must be taken into account even if some or most of them remain unknown to the modern observer or their material correlates cannot be defined in a reliable way.
In spite of all the difficulties, the gathered evidence allows at least a tentative and cautious interpretation of the deposits of human remains found at Tell Majnuna. Obviously these were neither primary nor regular secondary burials, because the high number of carnivore tooth marks could have only been produced if the bodies were exposed for a quite substantial period of time before deposition. The rejection or acceptance of other possibilities is, how-ever, much more difficult and a careful review of the evidence is necessary. Moreover, there is also the crucial question whether all contexts at Tell Majnuna represent one category of multiple burial or if they reflect several events of various kinds.

76
6.1. One or many events?
After two seasons of regular excavations at Tell Majnuna, it has been quite clear that this site was a midden accumulated in a relatively short period of time between ~3800 and 3600 BCE. In a place of this sort, the occassional presence of fragmented human remains may be expected. Even in the occupational quarter at Tell Brak itself, in the Area TW, more than 50 complete or fragmented human bones were found in pit fills or mudbrick walls, in addition to the regular burials of infants and children (Sołtysiak in print d). However, the number of bones and their distinct clustering at Tell Majnuna exceeded any expectations and the un-usual character of these deposits was undisputable. Apart from a few fragments scattered in the mass of ash, pottery and other kinds of waste, there were two large and four small dense clusters of human remains excavated in the Areas EM, EMS and MTW. Most spectacular was the collection of partially articulated skeletons gathered in the area west of contemporary Tell Majnuna and exposed during earthworks in 2006. This was a cluster irregular in shape and in some parts disturbed by succeeding strata, with one concentration of bones explored during the 2006 rescue operation and then excavated in a regular way as MTW1 loci 65 and 66, and two other concentrations labelled as MTW4 locus 65. Above this cluster, there was a less dense scatter of disarticulated bones (MTW1 loc. 59, MTW4 loc. 63 and 64) which most likely contained elements removed from the original place during subsequent activity at the midden. In total, remains of at least 50 individuals were excavated so far in this place.
More dense and more clearly delimited was the cluster of human remains excavated as EM locus 6=53, with a small western outlier labelled as locus 29. It contained generally dis-articulated and more fragmented elements belonging to at least 89 individuals. Above, there was another small cluster with chiefly the skulls of at least 8 individuals and again more pre-served articulations (locus 25). The most variable evidence was recorded in the upper strata of Area EMS, with one dense cluster of mixed fragments of completely disarticulated human and animal bones accompanied by an almost complete skeleton and an incomplete lower limb in articulation. However, the minimum number of individuals buried in EMS was only five, much less than in MTW or EM loc. 6.
Two other small clusters of partially articulated skeletons were found in two deep trenches in Area EME close to the center of Tell Majnuna, but their analysis is still in progress and will be reported elsewhere. One of them resembled the large cluster from Area MTW, the second contained 11 skulls and a few postcranial elements, similar to EM loc. 25. Their exact stratigraphical position is still uncertain, but they seem to be roughly contemporary with the deposit labelled as MTW1 loc. 65+66 and MTW4 loc. 65. On the top of Tell Majnuna, there was a regular cemetery, which could have been one or two centuries later than the deposits of commingled human remains.
In total, two major clusters (MTW1+4 with likely outliers in MTW2+3, and EM loc. 6+29) and three minor clusters (EM loc. 25, EMS loc. 6, EMS loc. 7) were found in the south-western part of Tell Majnuna. Three of them (MTW, EM loc. 25, EMS loc. 7) con-tained skeletal units with many preserved articulations, so their primary character is clear (primary if one neglects the quite complicated biostratinomic history of all of them). EM loc. 6 and EMS loc. 6 were secondary deposits, although their content substantially differs and it is clear that they were secondary to two different primary locations with different diagenetic histories. It is important, however, that all clusters contained clearly scavenged elements.
There were at least two (MTW and EM loc. 25 + EMS loc. 7 assuming their correlation), if not five (if EM loc. 25 and EMS loc. 7 were not correlated and if EM loc. 6 and EMS

77
loc. 6 were secondary not to the irregular large MTW deposit, but to two different primary locations) independent primary deposits of human remains in the excavated parts of Areas MTW, EM, and EMS. However, all but two contexts contained the remains of a relatively small number of individuals and may be interpreted as evidence of usual human activityat the midden which could occasionally serve as the place of disposal of dead bodies. EMS loc. 7 contained articulated skeletal units which may have been the remains of two corpses exposed on the surface of the ancient trash dump or buried in very shallow pits, and then scavenged and spread out by animals. In comparison, EMS loc. 6 which had mixed human and animal fragments of disarticulated and eroded bones looked like a collection of elements removed from the large MTW cluster some decades or even centuries after its primary depo-sition. The most unexpected small deposit was EM loc. 25 which had many skulls and a few postcranial fragments with frequently preserved articulations. All of them belonged to adult or adolescent individuals and these might be a collection of independent scavenged remains which were exposed at the dump at roughly the same time or an outcome of a small-scale catastrophic episode.
The most important question concerns the relationship between the large irregular depos-it in the Area MTW and dense secondary cluster at EM loc. 6 (and 29). So large a collection of human elements cannot be interpreted as the result of regular quotidian human activity and at least the MTW deposit must have been generated during a single event which lasted for days or weeks, but not years. Moreover, EM loc. 6 with its peculiar age and sex profile and many tooth marks cannot be interpreted as a regular secondary common burial or evan a random collection of remains of corpses which had been exposed at the midden and then thrown into a common pit after complete skeletonisation. It is also likely that this deposit includes the remains of individuals who died during a single event. The question is whether those two events were independent and distant in time, or whether both contexts contain the remains of individuals who died at the same time, but some of whom were secondarily moved to another place. The two possible scenarios are shown in the diagrams where arrows with two heads denote the correlation of strata, one-headed arrows stand for a relation be-tween primary and secondary context, lines without arrowheads show stratigraphical but not contextual relations (Figure 93).
By stratigraphical position, EM loc. 6 was later than the MTW deposit, but the almost complete lack of articulations between long bones suggests that all soft tissues (and ligaments) were missing at the time of deposition of this cluster. Moreover, the frequency of diagenetic effects is higher in the deeper mechanical layers, which is a premise for reversed stratigraphy and another argument in favour of the quite substantial time (enough for the evident progress of diagenesis) which lapsed between the primary deposition and the secondary deposition in EM loc. 6. Moreover, the presence of human bone tools made of bone fragments which were previously fractured in a quite regular way by rapid changes in humidity points to a relatively strong erosion of bone tissue at the time of deposition. Taking all this evidence into account, it may be safely stated that decades or even centuries separated primary and secondary deposi-tion. Thus, the different stratigraphical position is not an argument against a direct relation between the two largest deposits of human remains found at Tell Majnuna.
Both deposits are similar in some respects, but dissimilar in others (see Table 45). The general pattern of carnivore scavenging was more or less the same in MTW and EM, al-though some differences between three contexts (EM loc. 6, MTW1 and MTW4) were ob-served. The most important difference was the general tooth mark frequency: elements from MTW1 were more gnawed than human remains from MTW4 and EM loc. 6. Although

78
some tooth marks may have been obliterated during removal of the secondary deposit EM loc. 6, the difference between the two primary MTW concentrations suggests that even in a deposit which reflected one event the pattern of scavenging may have been variable. The preservation pattern of elements from different units of the skeleton is quite consistent in the subsamples from MTW and EM loc. 6 and corresponds to the pattern observed in modern forensic cases. All this suggests that individuals whose remains were buried in both contexts had been scavenged by carnivores over a similar period of time and in similar circumstances, in spite of some variability in scavenging pattern.
In MTW1 and MTW4 human and animal remains were mixed and it is not likely that the deposit at EM loc. 6 which had a much smaller frequency of animal remains may had been a random sample from excavated parts of the MTW deposit. If EM loc. 6 was second-ary to MTW, it must be assumed that other parts of the latter were not abundant in animal remains or human elements were consciously selected during removal, which would imply knowledge of human anatomy. This difference is a quite convincing premise against the cor-relation of MTW and the primary forerunner to EM loc. 6.
Another important dissimilarity was observed in the sex and age-at-death patterns. In both contexts no remains of infants and very few of small children were found, but in EM loc. 6 older children and adolescents were more frequent than in MTW, making the pat-tern similar to a catastrophic mortality profile. Moreover, the sex ratio was strongly biased towards females in EM loc. 6, and perhaps slightly biased towards males in MTW. The lack of infants is not expected in any natural mortality profile, and differential preservation due to diagenetic factors is also unlikely. There is a small possibility that scavenging animals com-pletely removed the smallest bodies from the scene, but it is most likely that the bias in the age profile was due to selective body retrieval from the scene, rather than selective mortality. In contemporary levels at Tell Brak younger subadults were buried almost exclusively in the settlement areas, so the mortality profile at Tell Majnuna may have been biased by this cul-tural differentiation between age categories of the dead. However, this does not explain the prevalence of females in EM loc. 6. In general, the age and sex distributions were not uniform even in one context, with a small concentration of younger children in one square of EM loc. 6 and with different frequencies of subadult and adult crania in the MT section. None the less, variability inside one cluster was clearly lower than the differences between clusters.
Most observed diseases, stress markers and activity related traits varied in frequency or degree between EM loc. 6 and MTW, although some major differences occured also between MTW1 and MTW4. The only similarity was the average correlation between contexts in the degree of enamel hypoplasia in various categories of the dental wear. Since dental wear is strongly correlated with age-at-death, it may be interpreted as a similarity in the recent his-tory of stress in populations represented by the human remains from two compared contexts and a weak premise for their contemporarity.
In total, the evidence is not completely clear, but there are more dissimilarities than simi-larities between EM loc. 6 and MTW. Thus, it is more likely that these clusters witnessed two separate events of rapidly increased mortality, perhaps caused by similar factors. However, the difference in time between them can not be ascertained because of the secondary char-acter of the deposit at EM loc. 6. If two compared contexts contained the remains of people who died during one event (which is less likely), the deliberate selection of bodies buried in the Area MTW and in primary forerunner to EM loc. 6 must be assumed, including such characteristics as sex, age, occupation and perhaps also social status. Some kind of selection may be observed in the MTW clusters, but differences between whole MTW sample and

79
EM loc. 6 are substantially greater. The most likely scenario includes therefore the occu-rrence of two major events of rapidly increased mortality and several small episodes of the disposal of human bodies (as EMS loc. 6) or secondary burials (as EMS loc. 7) in the midden. The hypothesis of two events may be falsified during further archaeological excavations ifan extension of the primary MTW deposit would be found, sharing major characteristics of its content with secondary EM loc. 6, or at least differing as far as EM loc. 6 from MTW1 and MTW4 clusters.
6.2. Cannibalism: not at Tell Majnuna
Any commingled and fragmented human remains found in a midden together with ani-mal bones were in the past readily interpreted as the evidence of cannibalism (Barton 1930; Harrison 1959; cf. Gibbons 1997). However, after the publication of The Man-Eating Myth by William Arens (1979), bioarcheologists became much more cautious and many older re-ports on archaeological evidence of cannibalism such as that concerning the skull from Monte Circeo (White & Toth 1991) have been criticised and re-interpreted. Cannibalism in native cultures has also become a topic in the discussion about political correctness (Dongoske et al. 2000). In consequence, more sophisticated standards of identification were developed with several well defined criteria as cut marks near long bone metaphyses, evidence of burning of some of the bones, a dissimilarity between the human remains in the midden and regular burials, percussion or anvil marks, perimortem fracturing, a similarity between human bone and faunal bone collections, pot polish, and many missing vertebrae (White 1992; Turner & Turner 1992; Turner 1993; Degusta 1999; Pietrusewsky et al. 2007).
The most convincing evidence of cannibalism in a prehistoric human population was gathered in several Anasazi sites in the American Southwest (White 1992; Turner 1993; Turner & Turner 1995; Kuckelman et al. 2002). Mass deposits of human bone fragments with evidence of burning, cut marks, percussion marks and pot polishing were found at more than 30 sites (Hurlbut 2000) and osteological evidence has been corroborated by the finding of human myoglobin in human coprolites (Marlar et al. 2000). It is likely that cannibalism in the Anasazi culture was the result of a prolonged shortfall of corn yields during two periods of drought, ~1150–1175 and ~1280 CE (Billman et al. 2000; Lambert et al. 2000; Kuckelman et al. 2002). Along with the evidence of perimortem bone processing, signs of interpersonal violence were also common and deposits of processed human remains more abundant in fragments belonging to male individuals (Grayson 1990) which may suggest that not only hunger, but also attempts to terrorize, intimidate or eliminate neighbouring villages may have been a motive of cannibalism (Billman et al. 2000).
Possibly the mass burial of 30 individuals from a Hopi village which had been abducted, killed, dismembered and perhaps also cannibalised ~1580 CE, was also found and compared with ethnographical records (Turner & Morris 1970). One historical example of hunger can-nibalism in the USA was the case of Alferd Packer who killed and ate his five mates during the winter of 1874 in Colorado. The remains of these victims were excavated in 1989 and they revealed signs of cannibalism different from these observed in Anasazi sites (Rautman & Fenton 2005). Convincing evidence of cannibalism was gathered also at one midden on Fiji (Degusta 1999, 2000). Cannibalism was also suggested for many archaeological sites in Europe, but only occasionally is the record well grounded (cf. Villa et al. 1986; Hughes 1991:18-24; Cole 2006; Caceres et al. 2007).
80
In the Near East, the reliable evidence of cannibalism is very scarce. Only recently ina Halafian site Domuztepe, Turkey, dated to ~5550 BCE, a pit was excavated with com-mingled human and animal remains (Kansa & Campbell 2003). Among at least 40 indi-viduals, younger adults were most frequent, and no clear sex bias was observed. Evidence of putative cannibalism included cut marks with a pattern typical for disarticulation, eviscera-tion and defleshing, hammerstone impact damage, low temperature thermal exposure, potpolish, small non-carnivore tooth pits which might indicate human chewing, as well as the poor survival of vertebrae and ribs. In addition, high frequency of blows to the head occurred in the sample (Kansa et al. 2009).
Among the nine criteria of cannibalism, only a dissimilarity between the deposit and reg-ular burial was obviously observed at Tell Majnuna, but this evidence alone is not sufficient even to suggest a presence of cannibalism (Table 46). There was also some degree of similarity between treatment of human and animal remains in Area MTW where partially articulated bodies and animal carcasses were thrown to the midden. However, no cut marks are noted, the level of fragmentation was too low for cannibalism and marrow cavities were not open with use of tools. Also an absence of thermal exposure (except for a few cases of weathering), percussion marks, pot polishing and the relatively high survival of vertebrae witness against the interpretation of the deposits of human remains at Tell Majnuna as result of cannibalistic behaviour of any sort.
6.3. Interpretation vector
Evidence gathered in Areas EM, EMS and MTW of Tell Majnuna and presented in detail in the first part of this book is not sufficient to offer a completely certain identifica-tion of factor(s) which caused the rapidly increased mortality rate in the population whose dead members were finally buried at Tell Majnuna. It is only possible to distinguish between more likely and less likely explanations. A list of eight causative categories of multiple buri-als together with 12 pieces of evidence which may be useful in their identification has been presented in the Table 44. From among them the hypothesis of cannibalism has already been rejected, and, moreover, primary or secondary regular burials should not be taken into account as the interpretation of human bone deposits at Tell Majnuna if so many carnivore tooth marks were present. The remaining five possibilities may be divided into natural (epi-demic or starvation) and social (battle, massacre, ritual) causes.
The risk of epidemic diseases was dramatically increased after the transition to agriculture due to the increase of the population size, the direct contact with domesticated animals and the decrease in mobility which made higher the exposure to pollution by human feces. Some epidemic diseases such as smallpox, measles, cholera or plague were not present or rarely present in foragers and early farmers, but became a serious cause of death in more developed agricultural societies. In addition, parasitic infections were common in large and relatively im-mobile populations (Cockburn 1971). Usually epidemic diseases increase mortality to some extent, but only occasionally so rapidly and vehemently that regular burial rites are aban-doned and dead bodies must be buried in collective graves. Even in such dramatic cases (as plague pandemic in Late Middle Ages) local populations were able to bury their dead at least in simple collective graves in the few days after they deceased (Benedictow 2004). Although ‘plague pits’ may contain hundreds of skeletons, the rate of soft tissue decomposition during burial is small, most articulations and no, or very few, carnivore tooth marks are expected.

81
In most kinds of epidemic diseases the mortality in age classes is variable, with higher risk of death in less immune individuals like infants and elders; one of the few exceptions is the plague which due to its extremely high mortality produced a catastrophic mortality profile (Paine 2000), although there is at least one example of a ‘plague pit’ with the age-at-death pattern resembling an attritional profile (Waldron 2001). In any case it is extremely difficult to recognise the epidemic in an archaeological context only on the basis of the demographical profile and, taking into account the short time between infection and death in most epidem-ics, an observation of stress markers is also not conclusive, although a rise in their frequency may be related to a general greater exposure to infections.
Large scale starvation in a stable agricultural population is not a very likely event, al-though in the history of Mesopotamia at least two possible episodes of starvation are docu-mented. The first happened after Samsuiluna's 10/11th year of reign (1739 BCE) when the Euphrates changed its bed and moved west in the alluvial plain of southern Mesopotamia. In consequence, previously irrigated land was transformed into desert and most of the large cities of Sumer were abandoned and covered by dunes (Stone 1977, 1987; Gibson 1992). It is possible that the account of starvation in Atrahasis II i 9-10 reflected this event (Carter 1977; Gibson 1980; Chase 1987), which was also witnessed by dramatic letters from hungry naditum-priestesses to the king (Janssen 1991). The second period of occasional starvation due to drought extended from 11th to 9th century BCE and even an incident of cannibalism was noted in an Assyrian chronicle (Neumann & Parpola 1987). No mass burial due to starvation has been identified so far in Mesopotamia, but a high frequency of stress markers may be expected if the episode of starvation followed a prolonged period of famine. In ad-dition, evidence of cannibalism and some disarticulation and scavenging activity due to the prolonged time between death and burial may be exploited in the identification of starvation as a cause of rise in mortality.
Two events caused by social factors, battle and massacre, should be characterised by the presence of perimortem fractures and injuries, occasionally also projectiles embedded in bones. They may be distinguished from each other chiefly by age and sex pattern: in the case ofa common grave of warriors who fell during battle, a strong prevalence of young or middle-aged males should be expected, while a massacred group might include also women, children and more elderly members of the population (cf. Blanchard 2007). Few examples of battle-field deposits of skeletons are known from Mesopotamian archaeological sites (Strommenger & Kohlmeyer 1998; Stronach & Lumsden 1992).
The last discussed cause of multiple burial is ritual activity, for example the cult of the dead or human sacrifice. In archaeological interpretation, various abnormalities are some-times explained as ritual related features. For example the cemetery in Kfar HaHoresh, Israel, with its unusual mortality profile was labelled as a regional funerary and ritual centre (Eshed et al. 2008). Further, the deposit of commingled human and animal bones at Domuztepe has been recognised as the result of a ritual concerning the dead (Kansa & Campbell 2003). However, it is extremely difficult to make the term ‘ritual’ operational, because it may denote many completely different things (Bradley 2005; Barrowclough & Malone 2007; Fogelin 2007; Groot 2009:54-55). For that reason it seems impossible to state whether the deposits of human remains at Tell Majnuna were in any way related to ritual activity of any sort and this possibility will not be considered here.
For sake of clarity, further discussion about evidential support for the four remaining hypotheses will be more formalised. Each observation (e.g. the presence of articulations or sex bias) may be expressed in a scale from -2 to +2, where -2 stands for a piece of evidence

82
which allows the complete rejection of a given hypothesis and +2 denotes a piece of evi-dence strongly supporting this hypothesis. Accordingly, -1 means that a given observationis rather not consistent with the hypothesis, 0 stands for observation which is not relevant, and +1 means that the hypothesis is weakly supported. The average of all negative and posi-tive scores, called the interpretation vector, may be used to estimate of the validity of an of-fered interpretation. If at least one score -2 occurs, the hypothesis should be rejected, but any score +2 does not mean that the hypothesis is proven. Of course, the scores are not objective and may be subject to discussion, but such way of data presentation makes the whole process of interpretation clearer and more verifiable.
Interpretation vectors for the two main contexts (MTW1+4 and EM loc. 6) are pre-sented in the Tables 47 and 48 respectively. For better clarity, numerical scores have been substituted by signs and irrelevant observations omitted. The relevance rate (the percentage of positive or negative scores in the whole data matrix) is 78% in MTW1+4 and 70% in EM loc. 6, the latter slightly lower figure is chiefly related to the secondary character of the latter deposit. Along with four considered factors, the hypotheses of primary and secondary burials were also taken into account for the reference. Some scores are evident (e.g. the high number of tooth marks is highly improbable in a regular primary burial), but some need explanation. In both areas human remains were commingled in separate clusters and the greater part of the midden volume contained no or only a few bone fragments. No architecture nor deliber-ate pits were found in the context of the human remains. However, such careless treatment is expected in all four kinds of events and only regular primary burial may be rejected. The differential preservation of bones from various body units, the presence of tooth marks and the pattern of articulation in MTW1+4 (but not in secondary EM loc. 6) assert that the dead bodies were exposed for weeks or months before final burial. Again all these features are highly improbable in regular primary burials. The lack of less stable articulations in EM loc. 6 is concordant with a regular secondary burial, but the remaining two features permit a rejection of this possibility. The exposure of bodies for a longer time was not observed dur-ing historical epidemics, rather living people exerted themselves to bury dead bodies as soon as possible and ‘plague pits’ contain commingled but articulated skeletons (cf. Benedictow 2004). The carnivore tooth marks and the inferior preservation of distal parts of limbs would not be expected if the bodies have been buried relatively quickly. It is not possible to distin-guish between the three other possibilities, but longer exposure time may be expected in the case of starvation and massacre, when nobody or too small a number of people, able to bury the bodies, survives.
The sex bias towards females, detected in EM loc. 6, was enough to reject the hypothesis of battle as the cause of the rise in mortality. Furthermore, an epidemic is not a likely expla-nation, because known epidemic diseases affect both sexes. In the case of starvation sex does not matter, although cultural settings may produce a bias in both directions. No clear sex bias was revealed in Area MTW, and again this suggests that battle was not a causative agent here. The age-at-death distribution was distorted in both contexts, with no infants and very few small children, catastrophic distribution in the remaining age classes in EM loc. 6 and the distribution in Area MTW which most resembled the regular attritional pattern, but witha smaller number of older individuals than expected. The lack of infants cannot be explained in a reliable way, but unusual age patterns suggest a social rather than natural factor as the causative agent of both events. Moreover, the age distribution in MTW could to some extent reflect mortality due to a battle, but this is obviously not the case of EM loc. 6. Both starva-tion and an epidemic should produce a more clear catastrophic distribution than observed in

83
both contexts excavated at Tell Majnuna, but again some selection due to cultural customs might bias the catastrophic age pattern, especially in the youngest cohorts.
The presence of cranial injuries is relevant only to the social explanations, rather to battle, although high rate of such types of trauma suggests an elevated level of interpersonal violence in general which may have been expressed in many different ways. However, all kinds of healed injuries are always more common in warriors than in the general population.
The absence of any evidence of cannibalism seems to be only a weak argument against starvation, and is not relevant to both battle and massacre. Otherwise, the high degree of enamel hypoplasia in all contexts supports the hypothesis of starvation as the consequence of a long period of undernutrition. Stress markers may reflect also an increased rate of infec-tions, but they should not be interpreted as the direct indicator of epidemic diseases.
With all the evidence considered, the hypothesis of an epidemic is least likely in both contexts, although it cannot be completely rejected. Battle is improbable as the event un-derlying the cluster of human remains in EM loc. 6, and in the scores of this hypothesis the difference between EM loc. 6 and MTW1+4 is highest of all. In both cases the massacre re-ceived the most positive scores and starvation is only slightly inferior. It is extremely difficult to discriminate between these two possibilities; in the case of starvation a higher frequency of stress markers would be expected, and massacre should produce a selective age pattern, but both a massacre in a stressed population and rapid starvation without the clear develop-ment of stress markers may be imagined. Moreover, both explanations are not contradictory to each other and a massacre related to higher competition for resources in a period of food shortage may be the best unified interpretation which explains the evidence of inter-personal violence and the high frequency of enamel hypoplasia and is at least not ruled out (if not supported) by the other discussed pieces of evidence. The two compared contexts seem to be differentiated chiefly by the evidence of interpersonal violence which was more abundant in MTW1+4 than in EM loc. 6. However, in both events the competition for resources due to food shortage was most likely the cause of rapidly increased mortality and of the accumula-tion of human bodies.
6.4. Who and where?
The most detailed insight into the circumstances of the event which caused the depo-sition of human remains at Tell Majnuna is virtually impossible. Theoretically, it mightbe possible to check out potential affinities of people buried in the midden and at least to ask the question whether they belonged to local population inhabiting Tell Brak or wereimmigrants from another place.
In mainstream physical anthropology from 19th century to 1960s such a kind of inquiry was based on the analyses of craniofacial measurements. Later, it appeared, however, that the genetic variance in skull shape and proportions is not enough to obtain reliable results and observed differences between populations are likely due to the environmental contribution to the total phenotypic variation (Sjøvold 1984; Martínez-Abadías et al. 2009). The use of multivariate techniques for selected worldwide samples allow one to discriminate between them (Howells 1989; Owsley & Jantz 1996), but obtained discriminant functions proved to be unsuitable for cranial samples not included in the test database (Williams et al. 2005). In result, the research on craniofacial diversity approaches its end in the history of physical an-thropology (cf. Armelagos & Van Gerven 2003). Recently, ancient DNA is used in research on affinities of ancient human populations, but soil and climatic conditions in the Near East

84
are very unfavourable for DNA preservation and reliable comparative data is not available (Baca & Molak 2008), nor is there hope that ancient DNA can be successfully extracted from the human elements excavated at Tell Majnuna.
Another possibility is the research on non-metric skeletal or dental traits (Irish 2010). Skeletal traits have usually low or very low heritability (Hauser & DeStefano 1989; Carson 2006), but some dental traits exhibit the prevalence of genetic variance and the small en-vironmental contribution (Townsend et al. 2006). Analysis of dental non-metric traits in various samples from Egypt has permitted scholars to observe population continuity from the Pre-Dynastic period to Late Antiquity (Irish 2006). However, although some dental non-metric traits were scored during the fieldwork at Tell Majnuna, the lack of comparative samples (cf. Sołtysiak 2004) makes any research on dental affinities impossible. In addition, the small sample of human remains from Late Chalcolithic Tell Brak is not suitable for com-parison, because it includes almost exclusively children with only their deciduous teeth fully developed, and in contrast they are scarce and usually heavily worn at Tell Majnuna.
Migrations may be traced also by isotopic studies. Especially the differences in propor-tions of the stable isotopes of strontium and oxygen between enamel and bone may be good indicators of individual migration (Budd et al. 2004), but only in regions in which the iso-topic signatures are variable and well recognised, as for example the Andes (Knudson et al. 2004; Andrushko et al. 2009). Again, this is not the case of the Northern Mesopotamia.
There is no possibility of answering the question whether the people buried at TellMajnuna were local or had migrated from abroad, but taking into account the great num-ber of individuals it seems more likely that they were local, although not necessarily in-habitants of Tell Brak.
Late Chalcolithic levels have been excavated at Tell Brak itself, so it may be possible to check out if the alleged massacre or death due to starvation took place on the site or outside. In the former case, some loose bone fragments which were overlooked during the removal of decaying bodies might remain in the stratum generated during the time of the event.The presence of a level abundant in such findings and concordant with some peculiar char-acteristics of deposits at Tell Majnuna would be strong evidence in favour of the on-site character of the event.
In Area TW at Tell Brak, human remains were found in 77 loci, including 27 primary burials and 52 features including a few fragmented bones (Sołtysiak in print d). Only two burials contained the skeletons of adult individuals, the remaining 25 were subadults, es-pecially infants. Some temporal trends in the proportion of loci with loose bones may be observed, in the levels 19-21 as many as 54% loci are regular burials, in the levels 16-18 this rate decreases down to 41% and to 21% in higher levels (Figure 94). The sample size is too small to prove this tendency significant (χ2=3.06, p=0.22). However, very significant is the difference in proportion of adult and adolescent individuals between regular burials and loose fragments, 2/27 and 36/52 accordingly (χ2=27.2, p=0.0000002). This means that bone fragments did not come from damaged local burials. In the levels 16-18 adult and children remains are in balance (11+11), but in later levels adults clearly dominate (9+2). Among the adult and adolescent remains, foot and hand bones were most frequent (11/35), followed by fragments of long bones (9/35), vertebrae (4), skulls (4), single teeth (3) and patellae (3). Such a pattern seems to be reversed to that observed at Tell Majnuna, with many skulls and very few foot and hand bones. The evidence is not clear, but there is possibility that at least some fragments retrieved from the Area TW might be the remains of skeletons which had been removed to the midden. Moreover, the lack of gnawing by hyenas or lions in Tell Maj-

85
nuna contexts suggests that a location within the urban center is more likely than an off-site venue. However, both premises are weak and they should be understood rather as a direction for future research than a solid explanation.

7. Beyond bones
The deposits of human bones at Tell Majnuna are contemporary to unprecedented urban growth at Tell Brak. It is tempting to relate the events of rapidly increased mortality to the process of urbanisation, although the temporal coincidence only is far too weak an argument in favour of any real causative relationship. The review of the available archaeological and environmental background data may be helpful, however, at least in search for the most likely explanation of the events. Apart from the archaeological evidence from Tell Majnuna and Tell Brak, there are also available some results of excavations and surveys at other contemporary sites, chiefly Tell Hamoukar.
7.1. Early urbanisation at Tell Brak
Tell Brak with average yearly rainfall of 278mm (Ceccarelli et al. 2007) is located close to the southern limit of the dry farming zone in the Khabur basin. Although inter-annual fluc-tuations in precipitation make agriculture risky, the site may have profited from the control of trade routes which as early as the 5th millennium BCE linked Anatolia, the source of obsidian, with the Middle Euphrates and Middle Tigris regions (Lawler 2006; Ur in print).
As early as in the ‘Ubaid period, ~4800–4200 BCE, the average settlement size in the Khabur basin started to grow significantly in comparison to previous periods, and some signs of increased centralisation became visible (Ur in print). In addition, the clear cultural unifica-tion of southern and northern Mesopotamia suggests the importance of trade and inter-re-gional communication in this period (Oates 1993). The process of urban growth accelerated in the Late Chalcolithic (LC) 2 period, ~4200–3900 BCE, when two proto-urban centres emerged, Tell Hamoukar in the north-eastern corner of the Khabur basin and Tell Brak in the south. The history of these early cities, reconstructed with use of surface pottery distribution data, was not, however, completely parallel (Ur in print).
At Tell Hamoukar the initial phase of urbanisation in the LC 2 period was characterised by the rapid growth of the settled area in the Khirbet al-Fakhar area, to the south of the proper site. The sherd scatter was extended over at least 280ha, this was not, however, a dense settlement, but rather an area of seasonal occupation or small clusters of houses separated by empty space, something similar to the contemporary village at Tell Hamoukar where only ~750 inhabitants occupy ~40ha. In the succeeding LC 3/4 period, ~3900–3400 BCE, the settled area shrunk to the ~15ha of the high mound, but this much smaller area was densely populated (Ur 2002).
The settled area at Tell Brak in the LC 2 period was much smaller than at Tell Hamoukar and covered ~55ha on the main mound and six satellite clusters around. Then in the LC 3/4 period these clusters were joined together and the total area of quite dense occupation reached at least ~130ha. Such a pattern of urbanisation was interpreted as the result of a unification of autonomous groups (Ur et al. 2007), but this scenario was weakened by the excavations at Tell Majnuna, which had been previously considered as a site inhabited by one of such groups but which has now been seen to have no remains of houses dated neither to LC 2 nor to LC 3/4 periods. Irrespective the methods of social unification, in the LC 3/4 period Tell Brak was very large city with monumental public buildings (including the famous Eye Temple), specialised workshops and institutionalised religion (Ur in print).
More than ten seasons of archaeological excavations in the Area TW at Tell Brak together with small-scale works in other parts of the site (Skuldbøl 2009) offer some insight into so-

88
cial complexity in the period of rapid urbanisation. The most unexpected discovery in this northern part of the site, possibly located close to the gate of the city, was the monumental “Basalt Threshold Building”, perhaps the earliest secular monumental building found in the Near East, dated to the end of 5th millennium BCE (Level 20). Its walls were 1.85m thick and only a part of two rooms could have been unearthed under 11m of later strata (Oates et al. 2007; McMahon & Oates 2007). In the neighbourhood, an industrial area was excavated with many ovens and a variety of raw materials. This area of craft was in use as early as theLC 2 period and in the LC 3 it was replaced by less monumental public buildings, such as the “Red Building” (Level 19) and the “Feasting Hall” (Levels 18–14). All could have been used for communal activities such as feasting or food distribution, but some prestigious objects were also found there, such as an obsidian and marble chalice (Oates et al. 2007; McMahon & Oates 2007). Many sealings suggest the existence of a complex hierarchy of authority, but there is a very significant difference between these levels and Level 21, in which there were many impressions of the same seal, while later levels had a great variety of sealings (McMahon & Oates 2007). More than 1000 sealings were also found in the midden at Tell Majnuna (McMahon 2008). The midden itself could not have been the result of accumulation of household waste disposal, which in the Near East took and takes place everywhere around the house. Obviously, such extremely large quantities of rubbish were deliberately collected in one place and again this can be interpreted as another sign of presence of central authority. It may be speculated that such a kind of artificial mound could have been designed deliberately as a marker at the settlement edge (McMahon & Oates 2007).
In the same period when Tell Brak reached its maximum size, the number of sites in the region was also higher than before. The survey in the 15km radius area around Tell Brak re-vealed a gradual increase from Palaeolithic to the LC 2 period, with 32 Halafian, 63 ‘Ubaid and 82 Early Northern Uruk (=LC 2) sites. The number of the Middle Northern Uruk (=LC 3) sites was as high as 92 but dramatically decreased in the Southern Late Uruk (=LC 4/5) to only 14 small sites (Wright et al. 2007; cf. Eidem & Warburton 1996). This dramatic de-cline may be partially related to problems with the chronological distinctions of the pottery, because chaff-tempered forms characteristic to the local LC 3 ceramic production could have been still in use together with southern grit-tempered forms introduced in the LC 4 period (Ur in print). However, a general decrease of settlement size in the period of southern influ-ence after ~3600 BCE is very likely.
The most characteristic feature of the settlement pattern around Tell Brak in the period of urban growth is the complete lack of intermediate urban centers: there was only one very large center and this surrounded by small sites of up to ~5ha around. In this respect the early urbanisation at Tell Brak completely differed from the later process of city growth in south-ern Mesopotamia (Algaze 2008). Moreover, in the mid-fourth millennium there was empty area in radius of 3km from Tell Brak, and small sites clustered in a rough ring 3 to 8km from the urban center, but most of them on the opposite banks of the wadis Jaghjagh and Radd (Wright et al. 2007; Eidem & Warburton 1996).
Other contemporary urban centres located in the Khabur drainage basin to the north of Tell Brak were much smaller, up to 15ha as Tell Hamoukar, and not so clearly distinguished from their surrounding settlement (Ur in print). In this respect, the LC 3/4 urban center at Tell Brak seems to be the exceptional product of local population growth and the local evolution of social complexity, factors limited only to this one site in whole northern Mesopotamia.
89
7.2. Population growth and decline
The transition from hunting and gathering to agriculture was universally followed by con-siderable population growth in all parts of the world (Hassan 1981; Jackes et al. 1997) and a direct relationship between fertility and mode of subsistence has been postulated (Sellen & Mace 1997). Indeed, this change in the subsistence strategy meant that a much smaller area was necessary to feed an average person, but the proper mechanism of population growth is still being discussed and many different factors influencing fertility or mortality may be taken into consideration (Bentley et al. 2001; Kaplan & Lancaster 2003). Due to the many sources of bias in palaeodemographical data (cf. Paine & Harpending 1996, 1998), verification of the various models is usually impossible or very difficult.
One possibility is the increase of fertility due to the prolongation of the reproductive pe-riod in females or the reduction of spacing between births. Stature reduction in the Neolithic population and the change in the distribution of female age-at-death has been interpreted as the result of an earlier age of menarche (Piontek & Vancata 2002; Hershkovitz & Gopher 2008). The change of spacing between births is usually considered as the most likely factor of population growth (Bocquet-Appel 2002), although there is still controversy concerning its causative factor. Some authors think that sendentary life in farming communities substan-tially decreased female mobility and more than one small child without full walking ability may have now been simultaneously raised by one mother (Sussman 1972; Lee 1980; cf. Schutkowski 2006:213). Another explanation is that easier access to cooked cereal food (such as porridge) could have substituted for mother's milk and enabled earlier weaning (Hassan 1981), especially after the invention of pottery. Widespread cooking of cereals is suggested by various data from Near Eastern Neolithic sites, such as Çatalhöyük (Atalay & Hastorf 2006) and Abu Hureyra (Molleson 2000). However, earlier weaning in agricultural populations may be not an universal feature, e.g. isotopic studies on foragers and early farmers in the Lower Ohio Valley show no difference in weaning time (Schurr & Powell 2005).
The second possibility is the reduction of child mortality. Mortality in males increased in agricultural populations due to warfare (Keeley 1996), and higher work effort in females could decrease overall fertility (Kaplan & Lancaster 2003; cf. Lancaster et al., 2000), buta substantial reduction in child mortality may be responsible for a high net reproduction rate (Pennington 1996; Bentley et al. 2001). There were two potential factors contributing to such a tendency: a reduction of infanticide, which was high among foragers and usually con-cerned female infants (Chapman 1980; Hrdy 1994), and more widespread wet nursing (Suss-man 1982; Roth 2004:139-141). Obviously it was much more probable to find a lactating woman in a larger agricultural society than in a small group of foragers and several historical accounts suggest that wet nursing was widespread in Southern Mesopotamia at least through the Middle Bronze Age (Gruber 1989).
Some estimates of population dynamics may be obtained with the use of the archaeologi-cal data. Assuming that an increase in size and number of sites in a given period reflects popu-lation growth, the survey results may give at least a rough insight into the general trends, even if any absolute figures are disputable (cf. Sumner 1989). No large-scale survey in northern Mesopotamia comparable to Robert Adams' projects in the southern alluvium (1965, 1981) have been undertaken, but data from many regional surveys are available. In most regions the number and total area of sites gradually increased from the Pre-Pottery Neolithic to the Early Bronze Age III and then remained stable, as in the eastern Khabur drainage (Meijer 1986), the neighbourhood of Tell el-Hawa (Wilkinson 1990a) and the area of Tell Ashara on middle

90
Euphrates (Simpson 1984), or temporarily declined as in the area of Mashnaqa (Moncham-bert 1984), the Biqa‘ region and north-eastern Khabur drainage (McClellan 1992). Some-times growth continued into the Middle Bronze Age, such as in the Upper Euphrates region (Copeland 1985). The only exception is the southern Khabur drainage, where settlement size declined in the Chalcolithic period and then again in the Early Bronze Age IV (Hole 1998). The clear decrease in the site numbers between LC 3 and LC 4 has been observed in the area of Tell Brak (see above), and also in the neighbourhood of Tell Beydar (Ur & Wilkinson 2008). Average population growth in northern Mesopotamia cannot be reliably estimated, but a rough estimation for the agricultural population of Egypt in the pharaonic period is 0.5‰ and for the Diyalah region in central Mesopotamia the estimate is as high as 0.7‰ (Hassan 1981:234). All available data suggest that for several thousand years after the introduction of agriculture, population growth was not limited by resource availability and the limits had been touched not before the Early Bronze Age, at least in the dry farming zone of northern Mesopotamia.
In this broader context, the decline in the settlement density between LC 3 and LC 4 at least in two areas of the Khabur drainage seems to be an anomaly. It was unlikely that people emigrated from a land which was suitable for agriculture and not overcrowded, or that mortality was increased due to epidemic diseases or warfare only in the neighbourhood ofTell Brak and not elsewhere, so the most likely explanation of the negative trend in the population dynamics of the Tell Brak area is substantial and prolonged decline in the local carrying capacity limits.
The idea of the carrying capacity is derived from the Malthusian model of population growth. If resources are unlimited, the growth may be exponential, but if there is any limit, the curve turns logistic (cf. Schutkowski 2006:190). The carrying capacity of an ecosystem cannot be precisely counted and in human populations it may be shifted due to techno-logical innovations (Seidl & Tisdell 1998). The introduction of natural and lift irrigation to Egyptian agriculture supposedly changed the carrying capacity limits and enabled population growth until a new limit was reached (Butzer 1976). However, the actual population size does not usually touch nor exceed the maximum carrying capacity limits, but remains on a lower level due to social factors. It may be useful then to distinguish between biophysical carrying capacity and social carrying capacity (Seidl & Tisdell 1999). The difference between them is the zone of increasing social discomfort which decreases fecundity and subsequently slows down growth over the social carrying capacity limits. However, the point of equilibrium depends not on the size of the human population, but on the environment and its ecological resilience. In an unstable ecosystem with high susceptibility to fluctuations in the biophysical carrying capacity, even if an equilibrium between people and available resources was reached, the size of the population may rapidly exceed the declining carrying capacity limits and then collapse, if buffering mechanisms (as e.g. migration) are not suitable (Seidl & Tisdell 1999).
One of most discussed buffering mechanisms is the introduction of technological inven-tions which could allow an increase in available resources and, in consequence, enable further growth or at least prevent collapse. In the classical Malthusian model, such inventions are independent and determine the limits of further growth. However, in a model developed by Ester Boserup (1965), population growth is an independent factor and the technological innovations are introduced as the consequence of population pressure. In the shortest defi-nition, the Boserupian model assumes that, “population growth increases resource scarcity and increased scarcity brings about consequent socioculture structure and change” (Kappel 1974:159). In the 1970s and early 1980s many authors adopted the Boserupian model in
91
their explanations of observed events in Mesopotamian history. The most influential expla-nation of the origins of agriculture based on the theory of population pressure has been presented by Lewis Binford (1968) and Kent Flannery (1973), but also analogical models for the origins of irrigation and urbanisation were proposed.
General explanation of changes in Mesopotamian agriculture, based on the Boserupian model, has been presented by P.E.L. Smith and T. Cuyler Young jr. in 1972 (Smith & Young 1972; Smith 1972, 1972a; Young 1972; cf. Gibson 1976:53). They assumed that population pressure forced people to search for a more effective subsistence strategy, but also––reverse-ly––the reduction of the population size enabled a return to more extensive, but less costly forms of agriculture (Smith 1972:12-13). Technological innovations have been considered as not the only solution of the overpopulation problem, but also cultural methods of ba-lancing the population size have been considered, e.g. the use of contraception, or themigration of some individuals to other regions (Young 1972:829). This last possibility has been used as an explanation for much more intensive plant cultivation in southern Mesopo-tamia than in the north: the inhabitants of dry-farming Jasirah could have much more easily migrated to the western steppes, thus discharging pressure without need of searching for new subsistence strategies (Smith 1972a:420).
In Smith's opinion the increase of population size first induced the intensification of agri-culture with the use of available techniques, and only in the later phase are innovations in-troduced. Examples of more intensive cultivation includes: fallowing of smaller part of fields,or even complete fallow failure, cropping twice a year, and more intensive labour (Smith 1972a:412). Another result of the population pressure may be a change of social structure and this could have been the direct causative agent of urban life in Mesopotamia (Smith 1972a:412; Young 1972:827).
One important point in Young's reconstruction of the history of the Mesopotamian po-pulation is the population growth during the Uruk period in the southern alluvial plain and in the Diyalah basin. In the latter region, overpopulation may have been discharged by the increase of the area under cultivation. On the contrary, the shortage of land in the neighbo-urhood of Uruk caused competition and pressure towards more intensive agriculture. Since land was more valuable, inter-personal violence flourished and eventually forced people to build walled cities and to establish a strong central administration. Such evolution did not oc-cur in the Diyalah region, because the local farmers could more easily find new fields suitable for cultivation. In the final stage of this sequence of events, the growing dependance of urban communities upon imported resources made trade important (Young 1972).
The hypothesis of the population pressure has been strongly criticised in the early 1980s, and many authors have noticed that real human populations use various methods ofbirth control and that population size is kept well below the maximum limits set by food supply (Oates 1980:311; Masset 1980:336; Hassan 1981:164-167). Some Mesopotamian cuneiform texts directly refer to the problem of over-population and explicitly mention me-thods of birth control, as well as some natural factors stabilising the population size, e.g. the famous Old Babylonian story about Atrahasis and the flood (Lichty 1971).
The most detailed critical examination of the concept of population pressure has been published by Fekhri Hassan (1981:162-175). First, he has observed that technological inno-vations are not an obvious answer to over-population, and that other cultural and biological responses must be also taken into account. Second, the concept of population pressure itself is quite obscure, even if it may be, at glance, clearly defined as the ratio of actual population size to the carrying capacity limit. Small fluctuations of the carrying capacity do not affect the

92
population at all, but there is always a certain probability of rapid and unexpected decline. In such a case the regulatory mechanisms are often imposed, for example infanticide, migra-tion, exploitation of secondary resources or technical innovations postulated by the followers of the Boserupian model––but they are neither the most important, nor the most obvious. And finally, population pressure is not the primary cause in such a model, but rather, it is the instability of the environment.
7.3. Ecology of marginal farming zone
Dry farming is possible in the zone of average annual rainfall above ~250 mm, so TellBrak was located in the southern margin of the agricultural area. Actually only ~200 mm should suffice for barley cropping, but another important factor is the reliability of theprecipitation. In the case of considerable inter-annual fluctuations the minimum needed average annual rainfall increases to ~300 mm or even more per year (Oates & Oates 1976; Weiss 1986; cf. Wilkinson 1997). Fortunately for farmers, the seasonal distribution ofthe rain in Mesopotamia is very favourable with the maximum precipitation occurring du-ring the winter and early spring, precisely the time when the cereals germinate and grow (Oates & Oates 1976).
The most important and widespread plants were barley, glume wheat and lentil, in vario-us proportions (Hald & Charles 2007). A reduction in the variability of plant resources was evident in the southern Khabur drainage between 5th and 3rd millennia BCE, with relatively more glume wheat and legumes in the earlier periods and the domination of barley in the later period (McCorriston & Weisberg 2002).
The soils around Tell Brak are fertile calcic xerosols which need only the applications of nitrogen and phosphorus that may be secured by the action of leguminous lentils and the application of manure (Wilkinson 1990). Although the average crop in the Jasirah was less than in the irrigated fields of southern Mesopotamia, taking into account the factthat almost the whole area could be cultivated, the total yield may have been comparable or even greater (Weiss 1983, 1986; Wilkinson 1994). Until the social carrying capacity limits were approached, the most important factor which restricted land use was the labour neces-sary for plant cultivation. Throughout the Neolithic, farmers used hoes which were not very efficient in large scale farming. The earliest direct evidence of use of a beam-ard comes from Uruk IV pictograms, dated to ~3200 BCE, although purported plough marks were foundat Tepe Sharafabad, Khuzestan, in a layer dated to 5th millennium BCE (Sherratt 1983; Mo-orey 1994). In addition, an increase in settlement density in the Samarra and ‘Ubaid periods in central and southern Mesopotamia are sometimes thought to have been induced by ard introduction (Potts 1997).
Modern barley crops in the northern Jazira average between 700 and 900 kg/ha, from this 60 kg/ha must be subtracted for sowing and further 5% for wastage. Assuming biennial fallowing, one average consumer needs ~1ha (350kg) for annual subsistence and one worker may harvest 3-4ha during one harvest season (Wilkinson 1994; cf. Jalil Jawad 1965:99). Taking into account these figures and the relatively high number of unproductive or less productive children, virtually all people in a population must have been engaged in at least the most labour consuming agricultural tasks. The surpluses acquired in abundant years may have been invested in animals, which could be consumed in the case of insufficient crops (Flannery 1969). The maintenance of sheep and goats costs no more than 30-50kg of barley

93
per animal, and only in the summer season, when the plant vegetation is restricted by the heat and insufficient humidity (Charles 1990).
During the Bronze Age, no site in the Khabur drainage exceeded ~100ha and according to Tony Wilkinson, this was the upper limit forced by the constraint of labour and the fric-tional effect of distance. The most intensive land use was possible in the radius of 5km, which permitted the feeding of ~7000 people with biennial fallowing or up to ~15000 if fallowing was neglected (Wilkinson 1990). Taking into account the minor contribution of crops from fields located outside this central zone of cultivation, the available agricultural production was sufficient for a population of no more than ~10.000 people for a site covering less than 100ha (Wilkinson 1994). Further growth of an urban area would be enabled only by more intensive crop production or an extension of arable land. The first option could lead to a fast loss of soil fertility and population collapse. The second option was possible in the alluvium of southern Mesopotamia with its network of channels and the easy transportation of crops by water (Algaze 2001). However, in the Khabur drainage the rivers were hardly navigable and transportation on human or animal back was indispensable.
The most important pack-animals in the Near East, i.e. donkeys, horses and camels, were not available in the LC 3 period. The donkey was most likely domesticated first, in early 4th millennium in Egypt, and introduced to Mesopotamia not before the time of Uruk expansion, i.e. the middle 4th millennium BCE (Vila 2006; Rossel et al. 2008). Thus, in the period of events witnessed by the Tell Majnuna deposits, the transportation force was limited to human porters. Moreover, not only must cereals have been transported to Tell Brak, but also water, because the site is located ~3km away from Wadi Jaghjagh and wells could not have provided a large local population with enough water. The transportation issue was then an important limiting factor of population growth at Tell Brak and osteological evidence (see above) suggests that the carrying of heavy loads was a common occupation, at least for females buried in the Area EM of Tell Majnuna.
In the marginal dry farming area, there is always the risk of a dry year with, more or less, reduced crops. If such dry years are few, food storage and investment in animals should suffi-ce to cope with this difficulty. However, if the drought is prolonged, a food shortage may turn into famine. In modern Syria two dry years (2008 and 2009) induced a serious economical crisis with occasional small scale riots in provincial towns, and it is very likely that such epi-sodes of drought occurred in the prehistory (Wilkinson 1994). In small groups such issues may have been compensated for by an extension of arable land, migration or transition to nomadic pastoralism (Wilkinson et al. 2007). However, urban growth and the intensification of land use make it more difficult to cope with dry years. Alternative resources are too limi-ted for larger populations, violation of the fallow regime makes the soil more vulnerable for desiccation, the plow animals may die because of the drought (Wilkinson 1994; Wilkinson et al. 2007). For all these reasons, a large urban population becomes less resistant to drought episodes than scattered village-based populations of farmers.
The reconstruction of climatic conditions in the first half of 4th millennium BCE in theKhabur drainage is virtually impossible due to the scarcity of direct evidence (Riehl et al. 2009). However, several kinds of proxy data are available from other regions of the Near East and other parts of the world. Most important is the palaeobotanical evidence from Tell Brak itself where a higher proportion of lentils was observed in the Levels 20/21 than in later strata (Hald & Charles 2007). The lentil is less resistant to drought than barley or wheat (Brink & Belay 2006:93; Riehl 2009) and its smaller average water-use efficiency makes the crops of this plant highly correlated with water supply (Zhang et al. 2000; Hamdi et al. 1992).
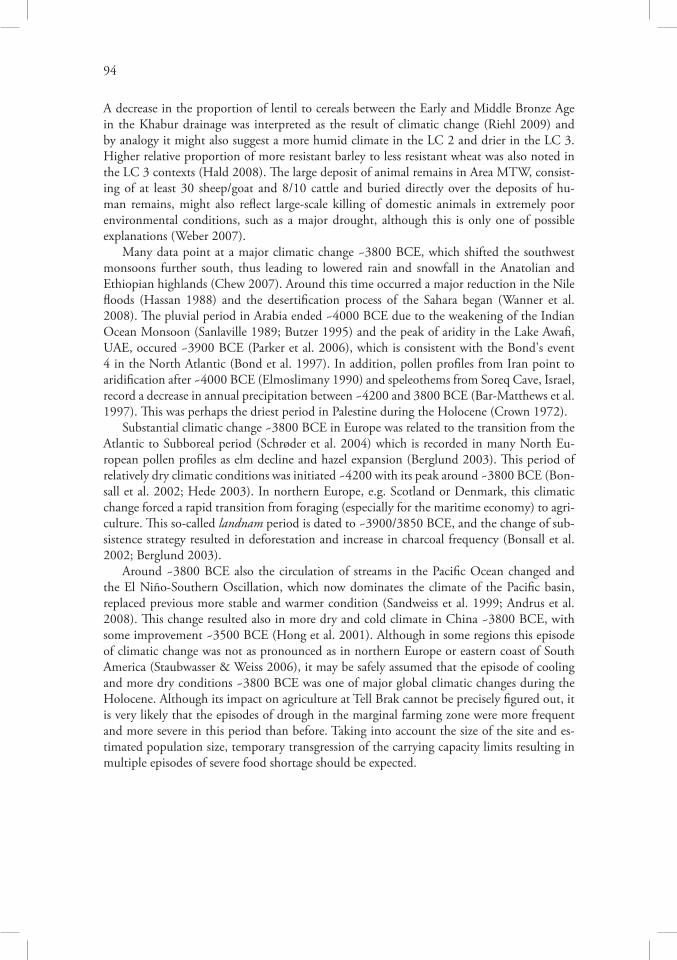
94
A decrease in the proportion of lentil to cereals between the Early and Middle Bronze Age in the Khabur drainage was interpreted as the result of climatic change (Riehl 2009) and by analogy it might also suggest a more humid climate in the LC 2 and drier in the LC 3.Higher relative proportion of more resistant barley to less resistant wheat was also noted in the LC 3 contexts (Hald 2008). The large deposit of animal remains in Area MTW, consist-ing of at least 30 sheep/goat and 8/10 cattle and buried directly over the deposits of hu-man remains, might also reflect large-scale killing of domestic animals in extremely poor environmental conditions, such as a major drought, although this is only one of possible explanations (Weber 2007).
Many data point at a major climatic change ~3800 BCE, which shifted the southwest monsoons further south, thus leading to lowered rain and snowfall in the Anatolian and Ethiopian highlands (Chew 2007). Around this time occurred a major reduction in the Nile floods (Hassan 1988) and the desertification process of the Sahara began (Wanner et al. 2008). The pluvial period in Arabia ended ~4000 BCE due to the weakening of the Indian Ocean Monsoon (Sanlaville 1989; Butzer 1995) and the peak of aridity in the Lake Awafi, UAE, occured ~3900 BCE (Parker et al. 2006), which is consistent with the Bond's event 4 in the North Atlantic (Bond et al. 1997). In addition, pollen profiles from Iran point to aridification after ~4000 BCE (Elmoslimany 1990) and speleothems from Soreq Cave, Israel, record a decrease in annual precipitation between ~4200 and 3800 BCE (Bar-Matthews et al. 1997). This was perhaps the driest period in Palestine during the Holocene (Crown 1972).
Substantial climatic change ~3800 BCE in Europe was related to the transition from theAtlantic to Subboreal period (Schrøder et al. 2004) which is recorded in many North Eu-ropean pollen profiles as elm decline and hazel expansion (Berglund 2003). This period of relatively dry climatic conditions was initiated ~4200 with its peak around ~3800 BCE (Bon-sall et al. 2002; Hede 2003). In northern Europe, e.g. Scotland or Denmark, this climatic change forced a rapid transition from foraging (especially for the maritime economy) to agri-culture. This so-called landnam period is dated to ~3900/3850 BCE, and the change of sub-sistence strategy resulted in deforestation and increase in charcoal frequency (Bonsall et al. 2002; Berglund 2003).
Around ~3800 BCE also the circulation of streams in the Pacific Ocean changed and the El Niño-Southern Oscillation, which now dominates the climate of the Pacific basin, replaced previous more stable and warmer condition (Sandweiss et al. 1999; Andrus et al. 2008). This change resulted also in more dry and cold climate in China ~3800 BCE, with some improvement ~3500 BCE (Hong et al. 2001). Although in some regions this episode of climatic change was not as pronounced as in northern Europe or eastern coast of South America (Staubwasser & Weiss 2006), it may be safely assumed that the episode of cooling and more dry conditions ~3800 BCE was one of major global climatic changes during the Holocene. Although its impact on agriculture at Tell Brak cannot be precisely figured out, it is very likely that the episodes of drough in the marginal farming zone were more frequent and more severe in this period than before. Taking into account the size of the site and es-timated population size, temporary transgression of the carrying capacity limits resulting in multiple episodes of severe food shortage should be expected.

Conclusion
Archaeology is frequently regarded as the art of telling stories about past people and their deeds. Spectacular finds, such as the deposits of commingled human remains, always stimu-late the imagination, and many different sensational, thrilling, intriguing, or simply didactic stories may be based on the discoveries at Tell Majnuna. However, archaeology may also be defined as the art of distinguishing between evidence and imagination. The evidence, which has been presented in this book, cannot directly support any easy and ultimate answer to the question: why the remains of so many people were buried in the midden. The only reli-able possibility is to present a coherent interpretation, with its strong and weak points, andwait for further pieces of evidence which may support it or allow rejection and the suggestion of a different hypothesis as a more likely explanation.
In the time of formation of the midden at Tell Majnuna, the Khabur drainage was in-habited by a relatively dense and still growing population of farmers, but the results of vari-ous surveys suggest that the carrying capacity limits (both in social and biophysical sense) had still not been attained. For several centuries Tell Brak was a proto-urban and eventuallyurban center, with high social complexity, the presence of central authority and developing craft specialisation. In the late 5th millennium BCE the climatic conditions were favour-able and even the marginal dry farming area around Tell Brak may have supported growing population of 10.000 people or more. However, during the Late Chalcolithic 3, the climate became drier and the risk of crop failure increased, especially for the intensively exploited land around a highly populated city.
The mass deposits of human remains at Tell Majnuna probably reflect at least two events of increased mortality, but their background seems to be similar and such may be associated with climatic change and its economical and social consequences. Obviously, food short-age causes social instability and there were at least three postulated outbreaks of drought contemporary with rise of warfare and population collapse, first ~6200 BCE in southern Anatolia (Clare et al. 2008), second ~2200-2100 BCE in Mesopotamia and Egypt (Cullen et al. 2000), third ~1200-900 BCE across the whole Near East (Neumann & Parpola 1987). The climatic deterioration ~3800 BCE, suggested by the clear record in proxy data from vari-ous parts of the world, may have had at least a comparable impact to human populations, especially in such a semi-arid zone as the neighbourhood of Tell Brak.
No direct evidence supports such an interpretation, but there are several relatively strong premises. Most important is the very high rate of linear enamel hypoplasia, much higher than in any later sample of human teeth from the Khabur drainage. Moreover, the pattern of hypoplasia in teeth belonging to individuals who died at various age gives the impression of periods of severe undernutrition lasting for several years, divided by periods of relaxation. During such difficult periods, competition for resources obviously raised the level of inter-personal violence, which resulted in the high frequency of cranial injuries observed at Tell Majnuna. Some people might die of starvation, but riots, massacres and other instances of violence may be assumed to be important factors of increased mortality.
However, the picture is more complicated by the fact that no population collapse nor social disruption is suggested by archaeological sources. Conversely, Tell Brak in this period of postulated climatic deterioration obviously flourished, with its size at least 130ha and many monumental buildings both preceding and anteceding the deposits at Tell Majnuna. It is also likely that this city was the only such large urban center in that period and that people in the northern part of the Khabur drainage, a region more humid and thus less

96
exposed to crop failure, kept living in villages and small towns. Even the process of urbanconsolidation at Tell Hamoukar was reversed and during the LC 3 period this site shrankto an area about ten times smaller than Tell Brak.
In handbooks of Mesopotamian archaeology we may find the common opinion that urbanisation is profitable in the southern alluvial plane, where channel irrigation needed the coordination of works, fields were too valued for use as a diffuse settlement place and efficient water transportation enabled the concentration of people in one place. Conversely, in the dry farming zone in northern Mesopotamia, scattered small-scale settlements without large cen-ters has been considered to be more natural and neither central administration was needed for effective farming, nor wadis and small rivers enabled efficient transportation of cereals from distant fields. Moreover, small communities may cope with dry years, being more bal-anced between plant cultivation and pastoralism (cf. Wilkinson et al. 2007). Taking all this into account, rapid and large scale urbanisation at Tell Brak seems to be a strange anomaly, breaking all known rules of social and economical development.
It may be only speculated why the city of Tell Brak still developed in such unfavourable conditions. Obviously, it was a growing center with an already established authority and administration when the postulated climatic deterioration started to affect the marginal dry farming area in the central and southern Khabur drainage. The most effective social response in such circumstances would be the abandonment of the urban center and the scattering of the population across the land, with growing investment in pastoralism. However, such an option would induce the collapse of the central authority and troubles to all people depended on the redistribution of resources. An alternative response, less effective for the whole local population, but much more profitable for the authority, was a continuing centralisation and more strict control over people and resources. If the climatic deterioration was gradual and the outbreaks of drought not too long, it might work, although extended periods abovesocial carrying capacity limits and occasionally even above biophysical carrying capacity lim-its may have occurred.
There is osteological evidence of hard labour, and especially of heavy load carrying at Tell Majnuna. Such suggests that resources were transported from relatively distant places and the feeding of people crowded in the city could only have been secured with great effort. It is pos-sible, however, that inhabitants of Tell Brak also profited from the size of their population and could gather resources by force from more distant places, beyond the area under the direct control of the city. Moreover, it was easier to organise effective distribution and the storage of food in one large city than across a less densely populated area. All this is only speculation, but it seems plausible that in the marginal dry farming area during the period of recurring drought and without efficient transportation, the concentration of people in one place and strict central control over resources and labour may have been a suitable adaptation to an unpredictable food income and strongly fluctuating carrying capacity level.
However, more prolongated outbreaks of drought must have resulted in extremely severe food shortages and the disruption of local economy. The deposits of human remains at Tell Majnuna most likely witness such events. There is no possibility of reconstructing in detail their circumstances, these events might have been the result of both episodes of general social instability and starvation when people killed each other for food, and also conscious acts of homicide ordered by the central authority. This second possibility is suggested by the biased character of the deposit found in EM loc. 6, where the prevalence of females is evident. Also some differences between MTW1 and MTW4 suggest that people whose bodies were buried

97
in these two contexts may have belonged to different social classes and such a selective treat-ment was hardly accidental.
People buried at Tell Majnuna died most likely in the neighbourhood of Tell Brak. It is difficult to imagine many corpses decaying in streets continuously used by the people whohad survived, but if the massacres were limited to selected places or quarters, it is possible that the bodies could be exposed for several weeks or months. Such a possibility is suggested by the pattern of scattered human remains found in many features in the Area TW. The bod-ies were scavenged, most likely by dogs, and eventually their remains were removed to themidden, then gradually covered by succeeding layers of waste, but still exposed for consider-able period of time. This complete lack of care is striking and underlined by attempts to make tools from some human bones.
The story presented above is to some extent based on hard evidence, but some elements are speculative. Well grounded pieces of this scenario are the unprecedented and exceptional growth of Tell Brak in the LC 3 period, climatic change at the same time, episodes of in-creased selective mortality leading to the formation of large deposits of human remains at Tell Majnuna, and episodes of undernutrition witnessed by the very high frequency of linear enamel hypoplasia. The hypothesis explaining the formation of the Tell Majnuna deposits as a result of massacres or starvation in a primitive but already centralised society suffering from climatic instability is perhaps only one of many possibilities. However, in my opinion it makes a good starting point for further discussion about the causes and effects of early urbanisation in northern Mesopotamia.


Tables


101
Table 1. Locus numbers for human bone deposits in Areas MTW, EM and EMS.
Trench Large deposits Small deposits or single bones
MTW1 59, 65, 66 4, 13, 30, 36, 38, 39, 64, 70
MTW2 3, 4, 6, 7
MTW3 33 34
MTW4 65 63, 64, 66, 67
EM 6=53, 25, 29 2.3, 2.6, 4.1, 4.2, 4.4, 13, 16, 17, 21, 22, 23, 24, 26, 27, 28, 30, 31, 50, 51
EM2 13
EMS 6 3, 7
Table 2. Sub-samples distinguished in EM locus 6=53.
Number Year Description
1 2007 First layer in the whole locus 6 as exposed in 2007.
2 2007 Second layer in the whole locus 6 as exposed in 2007.
3 2008 Sector between nails CC812, CC851, CC814, CC852, layers 1–3.
4 2008 Sector between nails CC813, CC812, CC815, CC814, layers 1–4.
5 2008 Sector between nails CC851, CC852, CC853, CC854, layers 3–7.
6 2008 Sector labelled as locus 6*, layers 1–2.
7 2008 Sector labelled as locus 6a, layers 1–2.
8 2008 Sector labelled as locus 6b, layers 1–2.
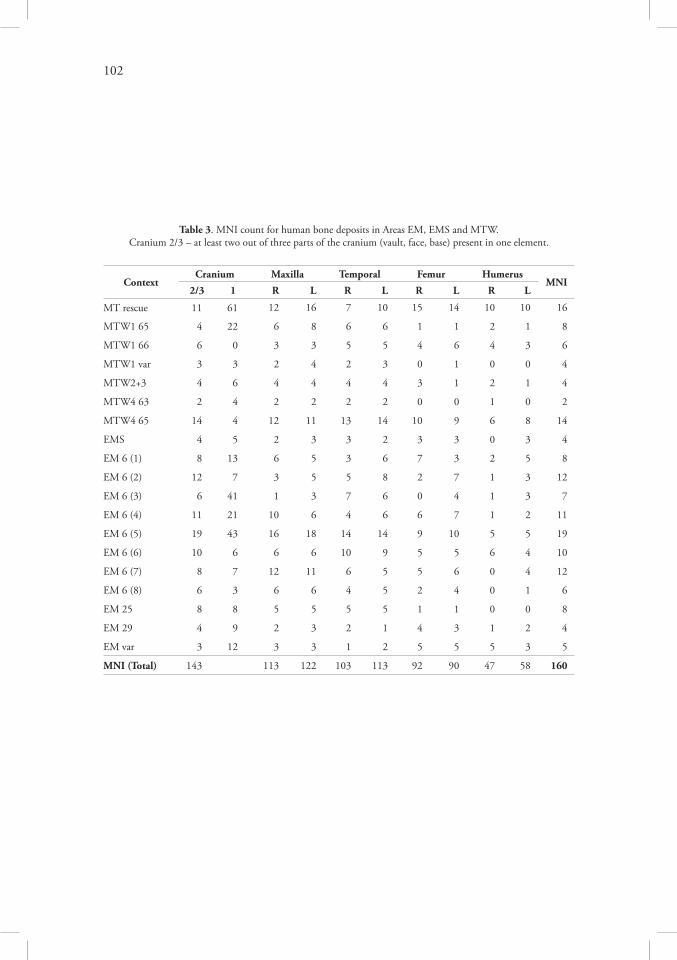
102
Table 3. MNI count for human bone deposits in Areas EM, EMS and MTW.Cranium 2/3 – at least two out of three parts of the cranium (vault, face, base) present in one element.
ContextCranium Maxilla Temporal Femur Humerus
MNI2/3 1 R L R L R L R L
MT rescue 11 61 12 16 7 10 15 14 10 10 16
MTW1 65 4 22 6 8 6 6 1 1 2 1 8
MTW1 66 6 0 3 3 5 5 4 6 4 3 6
MTW1 var 3 3 2 4 2 3 0 1 0 0 4
MTW2+3 4 6 4 4 4 4 3 1 2 1 4
MTW4 63 2 4 2 2 2 2 0 0 1 0 2
MTW4 65 14 4 12 11 13 14 10 9 6 8 14
EMS 4 5 2 3 3 2 3 3 0 3 4
EM 6 (1) 8 13 6 5 3 6 7 3 2 5 8
EM 6 (2) 12 7 3 5 5 8 2 7 1 3 12
EM 6 (3) 6 41 1 3 7 6 0 4 1 3 7
EM 6 (4) 11 21 10 6 4 6 6 7 1 2 11
EM 6 (5) 19 43 16 18 14 14 9 10 5 5 19
EM 6 (6) 10 6 6 6 10 9 5 5 6 4 10
EM 6 (7) 8 7 12 11 6 5 5 6 0 4 12
EM 6 (8) 6 3 6 6 4 5 2 4 0 1 6
EM 25 8 8 5 5 5 5 1 1 0 0 8
EM 29 4 9 2 3 2 1 4 3 1 2 4
EM var 3 12 3 3 1 2 5 5 5 3 5
MNI (Total) 143 113 122 103 113 92 90 47 58 160

103
Table 4. Frequency of diagenetic effects.
Context N Weathe-ring
Black or browncolour
Surface minerali-
sation
Shallow punctures
Root etching
Insect tunne-
ling
Rodent tooth marks
n % n % n % n % n % n % n %
MT rescue 576 n.a. n.a. 5 0.9 4 0.7 1 0.2 2 0.3
MTW1 65 83 1 1.2
MTW1 66 65 5 7.7 1 1.5 1 1.5
MTW1 var 41 1 2.4
MTW 2+3 62 5 8.1 2 4.8 1 1.6
MTW4 63 28 1 3.6 3 10.7 1 3.6
MTW4 65 239 7 2.9 20 8.4 12 5.0 1 0.4 5 2.1
EMS 39 1 2.6 2 5.1 2 5.1 2 5.1
EM 6 (1) 150 1 0.7 common 3 2.0 1 0.7 5 3.3
EM 6 (2) 200 common 1 0.5 3 1.5
EM 6 (3) 186 common 1 0.5
EM 6 (4) 161 2 1.2 common 6 3.7 3 1.9
EM 6 (5) 444 8 1.8 common 10 2.3 9 2.0 2 0.5 3 0.7
EM 6 (6) 156 1 0.6 common 2 1.3 4 2.6 3 1.9 3 1.9
EM 6 (7) 117 common 1 0.8 2 1.7 2 1.7 1 0.8
EM 6 (8) 46 common 3 6.5 2 4.3
EM 25 37 1 2.7 1 2.7 2 5.4 4 10.8
EM 29 82 3 3.7 2 2.4 1 1.2
EM var 161 6 3.7 1 0.6 1 0.6 1 0.6 4 2.5 2 1.2
Total 35 1.5 12 0.4 58 2.0 48 1.7 11 0.4 30 1.0
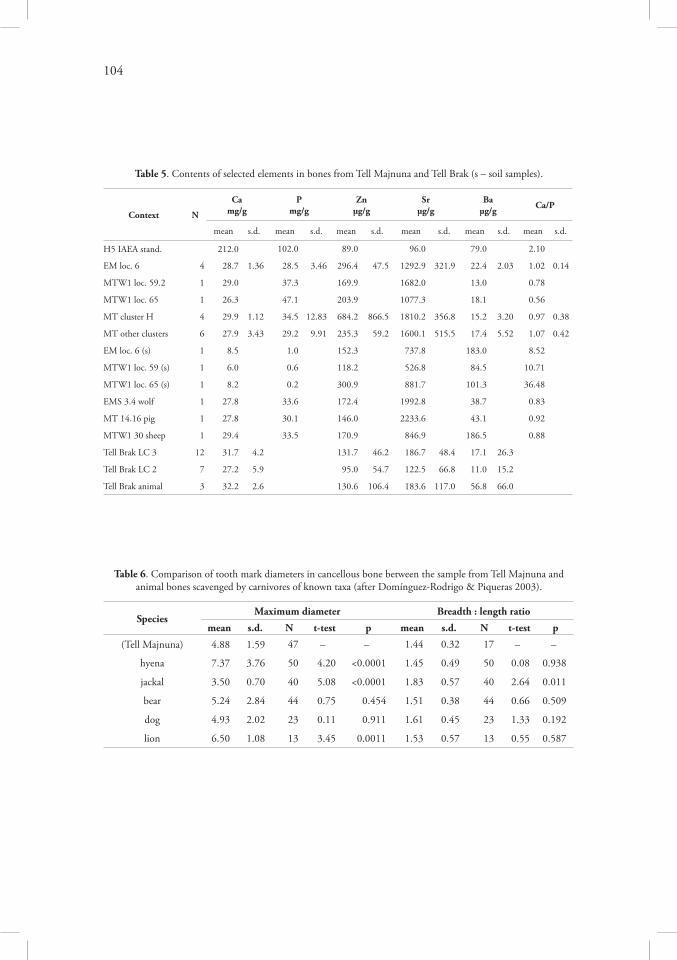
104
Table 5. Contents of selected elements in bones from Tell Majnuna and Tell Brak (s – soil samples).
Context N
Camg/g
Pmg/g
Znµg/g
Srµg/g
Baµg/g Ca/P
mean s.d. mean s.d. mean s.d. mean s.d. mean s.d. mean s.d.
H5 IAEA stand. 212.0 102.0 89.0 96.0 79.0 2.10
EM loc. 6 4 28.7 1.36 28.5 3.46 296.4 47.5 1292.9 321.9 22.4 2.03 1.02 0.14
MTW1 loc. 59.2 1 29.0 37.3 169.9 1682.0 13.0 0.78
MTW1 loc. 65 1 26.3 47.1 203.9 1077.3 18.1 0.56
MT cluster H 4 29.9 1.12 34.5 12.83 684.2 866.5 1810.2 356.8 15.2 3.20 0.97 0.38
MT other clusters 6 27.9 3.43 29.2 9.91 235.3 59.2 1600.1 515.5 17.4 5.52 1.07 0.42
EM loc. 6 (s) 1 8.5 1.0 152.3 737.8 183.0 8.52
MTW1 loc. 59 (s) 1 6.0 0.6 118.2 526.8 84.5 10.71
MTW1 loc. 65 (s) 1 8.2 0.2 300.9 881.7 101.3 36.48
EMS 3.4 wolf 1 27.8 33.6 172.4 1992.8 38.7 0.83
MT 14.16 pig 1 27.8 30.1 146.0 2233.6 43.1 0.92
MTW1 30 sheep 1 29.4 33.5 170.9 846.9 186.5 0.88
Tell Brak LC 3 12 31.7 4.2 131.7 46.2 186.7 48.4 17.1 26.3
Tell Brak LC 2 7 27.2 5.9 95.0 54.7 122.5 66.8 11.0 15.2
Tell Brak animal 3 32.2 2.6 130.6 106.4 183.6 117.0 56.8 66.0
Table 6. Comparison of tooth mark diameters in cancellous bone between the sample from Tell Majnuna and animal bones scavenged by carnivores of known taxa (after Domínguez-Rodrigo & Piqueras 2003).
SpeciesMaximum diameter Breadth : length ratio
mean s.d. N t-test p mean s.d. N t-test p
(Tell Majnuna) 4.88 1.59 47 – – 1.44 0.32 17 – –
hyena 7.37 3.76 50 4.20 <0.0001 1.45 0.49 50 0.08 0.938
jackal 3.50 0.70 40 5.08 <0.0001 1.83 0.57 40 2.64 0.011
bear 5.24 2.84 44 0.75 0.454 1.51 0.38 44 0.66 0.509
dog 4.93 2.02 23 0.11 0.911 1.61 0.45 23 1.33 0.192
lion 6.50 1.08 13 3.45 0.0011 1.53 0.57 13 0.55 0.587

105
Table 7. Frequency of tooth marks in Tell Majnuna (T – number of elements with tooth marks).
Bone unitEM loc. 6 EM others MT MTW1 MTW4 others
T N T N T N T N T N T N
Cranium: occipital 1 86 – 18 – 20 – 15 – 32 – 20
Cranium: temporal – 112 1 16 – 17 1 22 1 31 – 19
Cranium: zygomatic 1 77 – 17 – 12 – 15 – 22 – 18
Mandible: condylar process 1 35 – 11 – 13 3 10 – 10 – 3
Mandible: coronoid process – 28 – 13 – 13 – 11 – 10 – 3
Mandible: ramus – 38 – 18 – 15 1 13 – 12 – 5
Mandible: gonion 2 37 – 15 – 18 – 12 1 10 2 6
Mandible: body 1 60 – 21 – 27 – 20 – 13 1 10
Mandible: symphysis – 50 – 22 – 22 – 19 – 12 – 6
Vertebrae: C3–C7 1 59 – 16 – 34 – 9 – 17 – 9
Vertebrae: T1–T12 3 333 – 20 – 96 10 38 1 108 1 32
Vertebrae: L1–L5 7 237 – 9 – 68 2 22 1 46 – 17
Vertebrae: S1–S5 2 26 – 2 – 5 – 1 – 6 – 2
Ribs 14 478 – 39 – 89 4 42 3 174 4 79
Clavicle: sternal end 1 19 – 4 – 5 – 6 – 5 – 1
Clavicle: diaphysis 2 27 – 7 – 12 – 7 – 7 – 2
Clavicle: acromial end 1 22 – 4 – 7 1 6 – 5 – 1
Scapula: glenoid 5 35 – 2 – – – 5 – 8 – 1
Scapula: acromion 13 53 – 2 – 6 1 6 2 8 1 2
Scapula: coracoid 1 20 – 1 – 3 – 3 2 5 – 1
Scapula: medial body 1 22 – 2 – 1 – 4 – 5 1 2
Scapula: lateral body 1 34 – 3 – 3 1 6 – 11 1 2
Humerus: head 1 16 2 4 – 10 – 5 1 9 – –
Humerus: tubercles – 14 – 1 – 6 – 4 1 8 – –
Humerus: proximal diaphysis 4 47 – 10 – 18 – 12 1 21 – 3
Humerus: middle diaphysis – 60 – 13 – 23 – 11 – 19 – 4
Humerus: distal diaphysis 16 59 3 14 – 35 4 11 3 18 2 7
Humerus: medial (epi)condyle 4 21 2 6 1 15 – 5 3 8 – 1
Humerus: lateral (epi)condyle 4 23 1 5 – 15 – 3 – 9 – 2
Ulna: proximal epiphysis 3 14 – 1 – 4 – 1 3 5 – 3
Ulna: proximal diaphysis 4 28 – 7 – 13 1 2 1 11 2 8
Ulna: middle diaphysis – 27 – 9 – 6 – 2 – 11 – 4
Ulna: distal diaphysis – 19 – 4 – 5 – 1 1 8 – 6
Radius: proximal epiphysis 1 17 – 2 – 5 – 2 – 5 – 1
Radius: middle diaphysis – 30 1 7 – 7 – 3 – 10 – 3
Radius: distal diaphysis – 19 – 5 – 4 – 5 2 6 – 3
Acetabulum 8 67 2 8 – 21 1 16 1 19 – 8
Pubis – 20 2 5 – 6 – 2 – 8 – 2
Ischium: lesser sciatic notch 3 22 – 3 – 12 4 11 3 14 – 7
Ischium: tuberosity 8 21 2 3 – 6 4 8 8 15 – 7
Ischium: inferior ramus – 9 – – – 4 – 4 – 4 – 4
Ilium: greater sciatic notch 2 41 1 4 – 19 1 10 1 13 – 6
Ilium: auricular surface 4 48 – 4 – 17 2 8 1 12 – 6
Ilium: posterior superior spine 2 32 – 2 – 11 – 4 4 12 1 6

106
Table 7 (continued). Frequency of tooth marks in Tell Majnuna.
Bone unitEM loc. 6 EM others MT MTW1 MTW4 others
T N T N T N T N T N T N
Ilium: crest 7 29 – 2 – 9 2 3 2 10 1 5
Ilium: anterior superior spine 1 18 – – – 2 1 2 4 6 – 4
Ilium: anterior inferior spine 5 24 1 1 – 7 3 9 2 11 – 5
Femur: head 9 47 1 9 4 31 – 3 3 18 1 5
Femur: trochanters 22 52 6 9 7 20 3 4 12 19 2 6
Femur: proximal diaphysis 13 106 4 20 2 61 4 16 7 28 1 12
Femur: middle diaphysis 4 105 – 23 – 60 2 17 3 25 – 13
Femur: distal diaphysis 17 80 2 17 3 39 2 12 3 22 1 8
Femur: medial condyle 11 38 1 6 – 16 – 3 1 10 – 3
Femur: lateral condyle 13 37 1 5 – 12 – 3 2 13 – 2
Patella: medial side 2 4 – 1 – 6 – – – 8 – 1
Patella: lateral side 2 4 – 1 – 6 – – 1 8 – 1
Tibia: medial condyle 3 26 – 4 – 10 1 2 – 10 – 4
Tibia: lateral condyle 4 24 – 4 – 10 1 2 – 10 – 4
Tibia: proximal diaphysis 9 52 1 15 – 21 4 8 5 24 1 6
Tibia: middle diaphysis 4 56 – 11 – 19 – 9 1 16 – 9
Tibia: distal diaphysis 5 38 – 7 – 11 3 7 2 13 – 4
Tibia: medial malleolus – 17 – 5 – 4 – 2 – 6 – 3
Tibia: lateral epiphysis – 17 – 4 – 4 2 2 1 7 – 3
Fibula: proximal epiphysis 1 4 – – – 2 – – 1 6 – –
Fibula: proximal diaphysis – 15 – 2 – 9 – 1 – 10 – 7
Fibula: middle diaphysis – 31 – 7 – 9 1 3 – 12 – 6
Fibula: distal diaphysis – 22 – 3 – 5 – 2 – 10 – 7
Fibula: distal epiphysis 2 10 – 1 – 1 – – – 5 – 2
Talus: posterior side 3 18 – 6 – 4 1 4 – 5 – 4
Calcaneus: posterior side 5 12 1 2 – 3 2 2 1 4 – 3
Calcaneus: anterior side – 15 – 2 – 3 – 4 – 3 – 3
Calcaneus: superior side – 18 – 4 – 3 – 2 – 4 – 3
Metatarsals: proximal end – 17 – 3 – 7 – 2 – 12 – 7
Metatarsals: diaphysis – 14 – 5 – 9 – 2 1 14 – 7
Metatarsals: distal end 2 9 – 5 – 5 – 4 1 8 – 7

107
Table 8. Scale for gnawing of proximal femoral end; frequencies in Areas EM and MTW.
Grade Description EM MTW
0 no traces 9 5
1 toothmarks only on greater trochanter 8 3
2 greater trochanter damaged, traces on lesser trochanter 6 12
3 both trochanters damaged, traces on femoral head 4 1
4 head damaged, neck still partially preserved 11 4
5 damage complete on and above lesser trochanter 8 3
Table 9. Scale for gnawing of distal femoral end; frequencies in Areas EM and MTW.
Grade Description EM MTW
0 no traces 6 10
1 toothmarks on condyle(s) 11 0
2 one condyle damaged, toothmarks on other 2 0
3 both condyles damaged 1 1
4 epicondyles damaged 8 5

108
Table 10. Relative frequency of bone units in Tell Majnuna (EM locus 6). R– right, L – left, U – undetermined.
Bone unitEM loc. 6(1) EM loc. 6(2) EM loc. 6(3) EM loc. 6(4) EM loc. 6(5)
R U L R U L R U L R U L R U L
Supraorbital area 5 5 10 9 6 6 9 7 19 21
Glabella 1 6 3 19 26
Frontal bone 8 5 8 14 10 14 5 7 3 6 8 5 13 15 14
Parietal bone 14 8 14 15 5 15 5 14 8 9 4 9 5 23 7
Occipital base 4 7 2 – 10
Occipital arc 2 4 12 12 9 9 5 3 16 24
Occipital bone 10 6 9 14 3 14 4 9 9 9 5 9 13 14 14
Temporal: anterior 4 6 4 11 3 4 7 8 13 14
Temporal: petrosa 7 2 13 8 3 20 17 3 12 11 2 15 29 – 34
Temporal: mastoid 4 7 7 12 12 9 8 11 22 29
Temporal: posterior – 1 2 1 – 3 4 – 4 2 – – 5 1 4
Sphenoid: base – 4 1 1 4
Sphenoid: lesser wing – 1 2 1 2 – 1 1 7 10
Sphenoid: greater wing – 4 – 6 – 10 4 2 3 4 4 5 10 5 15
Zygomatic bone 5 8 11 10 6 5 10 13 24 21
Maxilla: facial part 2 1 3 3 – – – – 5 9
Maxilla: alveolus 8 7 7 12 3 6 17 11 26 31
Maxilla: palate 3 3 7 8 3 2 9 5 16 14
Nasal bone – – – – – – 3 3 1 1
Mandible: condylar 4 8 12 9 3 – 5 – 10 21
Mandible: coronoid – 8 4 9 3 – – – 10 12
Mandible: ramus – 4 12 10 3 – 2 1 8 14
Mandible: gonion – – 12 15 3 – 4 3 6 11
Mandible: body 4 4 17 18 1 – 4 4 10 14
Mandible: chin 2 2 17 16 – – 2 3 14 12
Atlas: lateral – – 3 6 6 7 3 3 4 6
Atlas: anterior – 2 6 3 2
Atlas: posterior – – 5 2 –
Axis: lateral 2 4 – 2 – – – – 4 2
Axis: anterior 6 – 2 3 4
Axis: posterior 3 – – – 1
Cervical body 3 22 13 9 27
Cervical arc 3 13 5 9 6
Thoracic body 31 55 29 58 87
Thoracic arc 15 45 29 36 61
Lumbar body 3 20 22 50 61
Lumbar arc 4 19 11 51 65
Sacrum: S1 – – – 5 7 7 1 5 1 2 9 2 7 15 5
Sacrum: S2 1 2 1 – 5
Sacrum: S3 1 1 1 – 3
Sacrum: S4 1 2 1 – 1
Sacrum: S5 – – – 1 1
Coccyx – – – – –
Ribs 3 24 9 12 78 2 11 47 7 10 33 4 17 78 11
Sternum: manubrium – 1 – – –
Sternum: body – – 1 4 2

109
Table 10 (continued). Relative frequency of bone units in Tell Majnuna (EM locus 6 and others).
Bone unitEM loc. 6(6) EM loc. 6(7) EM loc. 6(8) EM loc. 25 EM loc. 29
R U L R U L R U L R U L R U L
Supraorbital area 12 4 19 16 5 5 7 9 5 2
Glabella 13 23 9 5 5
Frontal bone 13 1 10 14 2 14 3 2 3 8 1 9 3 2 2
Parietal bone 15 2 16 10 5 10 3 2 3 8 6 8 2 5 2
Occipital base 7 7 4 2 6
Occipital arc 10 13 8 7 7 7 7 4 2 1
Occipital bone 13 2 13 10 6 10 4 3 4 6 2 9 3 2 3
Temporal: anterior 10 10 8 6 8 7 9 7 4 3
Temporal: petrosa 20 – 20 12 – 11 8 – 10 13 2 9 5 – 2
Temporal: mastoid 20 17 6 8 9 8 18 8 2 3
Temporal: posterior 5 – 5 5 1 2 3 – 3 6 – 4 – – 2
Sphenoid: base 7 2 2 – 2
Sphenoid: lesser wing 7 7 4 5 2 1 – – 1 1
Sphenoid: greater wing 8 1 7 5 2 5 4 – 3 3 1 3 2 3 –
Zygomatic bone 20 13 7 13 11 9 15 11 2 4
Maxilla: facial part 1 2 10 8 1 1 2 7 – –
Maxilla: alveolus 11 9 29 22 7 9 9 13 4 5
Maxilla: palate 6 5 23 17 2 3 2 6 2 2
Nasal bone – – 2 2 – – – – – –
Mandible: condylar 12 7 4 2 1 3 3 8 6 9
Mandible: coronoid 11 6 8 2 3 3 4 2 3 14
Mandible: ramus 13 10 5 6 3 3 3 6 6 11
Mandible: gonion 13 9 5 7 3 3 3 8 6 11
Mandible: body 14 15 8 8 3 3 2 5 8 11
Mandible: chin 14 17 11 10 3 3 5 5 9 9
Atlas: lateral 2 2 – – 2 2 6 2 – –
Atlas: anterior 4 – – 1 –
Atlas: posterior – – – 2 –
Axis: lateral – 2 3 3 2 2 2 2 – –
Axis: anterior – 3 3 5 –
Axis: posterior – 3 1 5 –
Cervical body 18 15 – 3 7
Cervical arc 8 1 – 3 –
Thoracic body 24 42 48 – 16
Thoracic arc 23 44 33 – 3
Lumbar body 8 47 28 9 1
Lumbar arc 5 48 9 6 3
Sacrum: S1 – 1 1 4 8 3 – 4 2 1 3 1 – – –
Sacrum: S2 1 3 2 1 –
Sacrum: S3 1 2 2 – –
Sacrum: S4 – – 3 – –
Sacrum: S5 – – 3 – –
Coccyx – – – – –
Ribs 16 34 6 7 20 28 2 – 1 – – 1 – 10 2
Sternum: manubrium – 2 – – –
Sternum: body – – – – –

110
Table 10 (continued). Relative frequency of bone units in Tell Majnuna (MTW1 and MTW4).
Bone unitMTW1 l. 65 MTW1 l. 66 MTW1 others MTW4 l. 64 MTW4 l. 65
R U L R U L R U L R U L R U L
Supraorbital area 10 8 11 12 7 9 6 6 34 31
Glabella 7 13 9 6 33
Frontal bone 8 – 6 8 – 11 7 – 9 6 – 6 35 2 36
Parietal bone 5 5 3 7 1 9 6 2 6 5 – 5 33 1 35
Occipital base 2 10 3 5 21
Ocipital arc 4 2 13 11 4 4 3 4 27 23
Occipital bone 6 5 4 9 – 7 7 – 7 5 – 5 32 – 32
Temporal: anterior 7 8 6 5 5 6 5 3 23 24
Temporal: petrosa 16 – 14 12 – 14 6 – 6 6 – 5 35 – 41
Temporal: mastoid 13 15 15 11 6 7 4 4 27 35
Temporal: posterior 7 – 7 6 – 6 5 – 5 4 – 3 23 – 24
Sphenoid: base 2 5 4 2 23
Sphenoid: lesser wing 2 2 7 7 1 4 1 1 20 22
Sphenoid: greater wing 4 1 3 6 1 7 3 – 4 3 – 4 25 – 24
Zygomatic bone 6 9 8 14 4 9 4 3 36 21
Maxilla: facial part 7 7 6 5 3 8 6 3 21 19
Maxilla: alveolus 12 16 8 8 3 10 6 5 28 31
Maxilla: palate 11 14 7 6 3 8 6 4 25 31
Nasal bone 6 6 3 3 3 3 3 3 19 19
Mandible: condylar – 1 12 11 – – – – 18 12
Mandible: coronoid 3 3 15 12 – – – – 15 14
Mandible: ramus 2 5 15 13 – – – – 17 13
Mandible: gonion 4 7 14 15 – – – – 15 14
Mandible: body 9 12 13 15 – – – – 18 17
Mandible: chin 12 15 17 17 – – – – 18 16
Atlas: lateral 2 4 – 3 – – – – 15 12
Atlas: anterior 2 3 – – 16
Atlas: posterior 4 – – – 14
Axis: lateral 4 4 3 5 – – – – 13 16
Axis: anterior 6 6 – – 20
Axis: posterior 5 5 – – 9
Cervical body 21 27 – 3 41
Cervical arc 21 8 – 3 29
Thoracic body 36 18 21 – 225
Thoracic arc 24 20 14 – 145
Lumbar body 5 9 16 8 89
Lumbar arc 3 13 13 1 75
Sacrum: S1 – – 1 2 3 2 – – – 2 2 2 8 13 5
Sacrum: S2 1 – – 1 8
Sacrum: S3 – – – – 5
Sacrum: S4 – – – – 3
Sacrum: S5 – – – – –
Coccyx – – – – 3
Ribs – – – 11 21 9 – – – – – – 50 94 52
Sternum: manubrium – – – – 2
Sternum: body – – – – 2
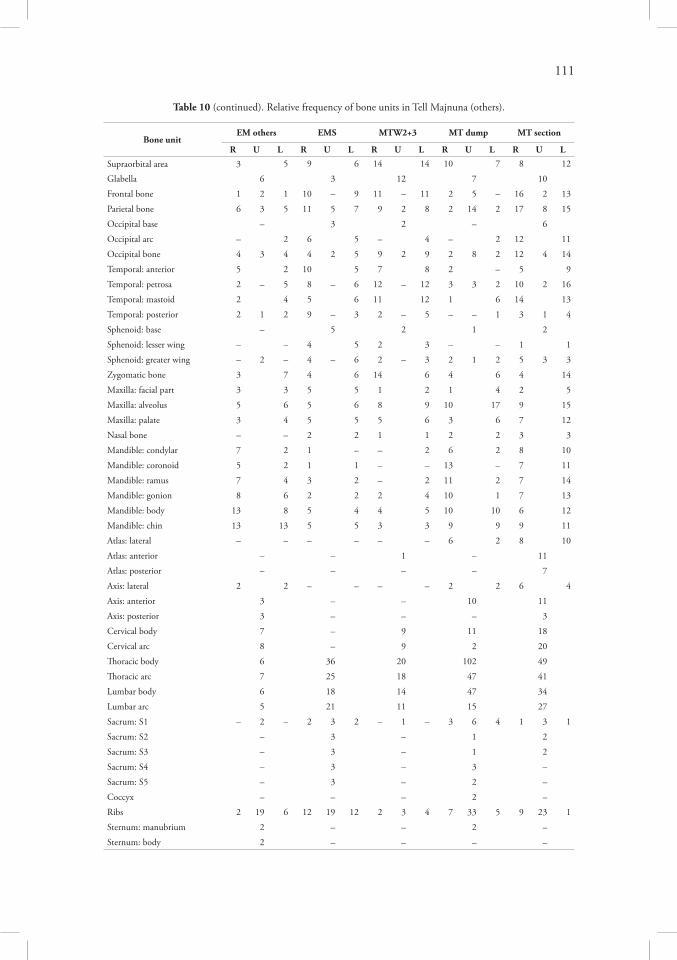
111
Table 10 (continued). Relative frequency of bone units in Tell Majnuna (others).
Bone unitEM others EMS MTW2+3 MT dump MT section
R U L R U L R U L R U L R U L
Supraorbital area 3 5 9 6 14 14 10 7 8 12
Glabella 6 3 12 7 10
Frontal bone 1 2 1 10 – 9 11 – 11 2 5 – 16 2 13
Parietal bone 6 3 5 11 5 7 9 2 8 2 14 2 17 8 15
Occipital base – 3 2 – 6
Occipital arc – 2 6 5 – 4 – 2 12 11
Occipital bone 4 3 4 4 2 5 9 2 9 2 8 2 12 4 14
Temporal: anterior 5 2 10 5 7 8 2 – 5 9
Temporal: petrosa 2 – 5 8 – 6 12 – 12 3 3 2 10 2 16
Temporal: mastoid 2 4 5 6 11 12 1 6 14 13
Temporal: posterior 2 1 2 9 – 3 2 – 5 – – 1 3 1 4
Sphenoid: base – 5 2 1 2
Sphenoid: lesser wing – – 4 5 2 3 – – 1 1
Sphenoid: greater wing – 2 – 4 – 6 2 – 3 2 1 2 5 3 3
Zygomatic bone 3 7 4 6 14 6 4 6 4 14
Maxilla: facial part 3 3 5 5 1 2 1 4 2 5
Maxilla: alveolus 5 6 5 6 8 9 10 17 9 15
Maxilla: palate 3 4 5 5 5 6 3 6 7 12
Nasal bone – – 2 2 1 1 2 2 3 3
Mandible: condylar 7 2 1 – – 2 6 2 8 10
Mandible: coronoid 5 2 1 1 – – 13 – 7 11
Mandible: ramus 7 4 3 2 – 2 11 2 7 14
Mandible: gonion 8 6 2 2 2 4 10 1 7 13
Mandible: body 13 8 5 4 4 5 10 10 6 12
Mandible: chin 13 13 5 5 3 3 9 9 9 11
Atlas: lateral – – – – – – 6 2 8 10
Atlas: anterior – – 1 – 11
Atlas: posterior – – – – 7
Axis: lateral 2 2 – – – – 2 2 6 4
Axis: anterior 3 – – 10 11
Axis: posterior 3 – – – 3
Cervical body 7 – 9 11 18
Cervical arc 8 – 9 2 20
Thoracic body 6 36 20 102 49
Thoracic arc 7 25 18 47 41
Lumbar body 6 18 14 47 34
Lumbar arc 5 21 11 15 27
Sacrum: S1 – 2 – 2 3 2 – 1 – 3 6 4 1 3 1
Sacrum: S2 – 3 – 1 2
Sacrum: S3 – 3 – 1 2
Sacrum: S4 – 3 – 3 –
Sacrum: S5 – 3 – 2 –
Coccyx – – – 2 –
Ribs 2 19 6 12 19 12 2 3 4 7 33 5 9 23 1
Sternum: manubrium 2 – – 2 –
Sternum: body 2 – – – –

112
Table 10 (continued). Relative frequency of bone units in Tell Majnuna (EM locus 6).
Bone unitEM loc. 6(1) EM loc. 6(2) EM loc. 6(3) EM loc. 6(4) EM loc. 6(5)
R U L R U L R U L R U L R U L
Clavicle: medial epiphysis – – 6 – – – – 3 – 2 3 – 3 – –
Clavicle: medial diaphysis – 2 6 – – 4 – 3 – 3 1 2 5 5 6
Clavicle: middle diaphysis – 1 3 2 – 5 3 2 – 5 – 6 9 1 10
Clavicle: lateral diaphysis – 3 2 – – 3 3 – – 5 – 7 7 – 9
Clavicle: lateral epiphysis – 3 2 – – – 2 – – 5 – 2 – – 3
Scapula: glenoid – 3 – 12 – 8 5 – – 6 2 4 5 – 7
Scapula: acromion 1 – 2 10 1 7 5 – 4 7 – 8 5 – 10
Scapula: coracoid – 3 – 8 – – – – – 2 – 3 – 2 6
Scapula: medial body – – – 1 – – – – 1 2 1 3 1 2 3
Scapula: lateral body – 1 – 1 1 3 1 1 – – 1 2 3 6 4
Humerus: head 5 – 5 7 – – – – – – – – 8 2 –
Humerus: greater tubercle 2 – 5 6 – – – – – – – – 4 – –
Humerus: lesser tubercle 2 – 6 7 – – – – – – – – 4 – –
Humerus: neck + groove 2 1 8 6 – – 2 2 – – – – – – 1
Humerus: prox. diaphysis 3 1 12 5 – – 3 – 2 4 1 3 6 – 12
Humerus: mid. diaphysis 8 – 11 6 2 – 3 – 4 1 2 6 11 – 15
Humerus: dist. diaphysis 5 1 14 3 – 6 3 1 9 3 3 5 11 2 16
Humerus: distal fossae 5 – 8 3 1 7 2 – 8 2 2 3 8 1 10
Humerus: med. epicond. 5 2 3 2 – 5 – – 3 – – 3 3 1 7
Humerus: lat. epicond. 5 1 3 2 2 6 – – 3 – – 3 3 1 7
Ulna: prox. epiphysis 2 – 9 – – – – – – – – 3 8 – 3
Ulna: prox. metaphysis 3 – 9 – – – 2 – – 2 – 3 11 – 11
Ulna: prox. diaphysis 1 – 7 4 – 2 3 – – 3 – 3 10 – 10
Ulna: middle diaphysis – – 6 3 – 2 5 – – 3 2 3 6 5 9
Ulna: dist. diaphysis – – 6 – – – 5 – – 1 1 3 12 1 4
Ulna: dist. metaphysis – – 6 – – – 6 – – – – – 4 3 –
Ulna: dist. epiphysis – – 5 – – – 4 – – – – – 3 – –
Radius: prox. epiphysis – – – 6 – – 2 3 – – – – 12 6 2
Radius: prox. metaphysis – 2 – 6 – – 3 1 – 3 – – 11 3 5
Radius: prox. diaphysis 1 2 – 5 3 – 3 – – 6 1 – 12 2 4
Radius: middle diaphysis 3 2 – 3 5 1 1 – – 3 3 – 10 6 3
Radius: dist. diaphysis 1 – 1 3 2 3 2 – – 3 1 – 5 1 1
Radius: dist. metaphysis – – 3 3 – 2 3 – 1 2 – – 2 – –
Radius: dist. epiphysis – – 5 – – – 3 – 2 – – – 3 – –
Carpals – – – – – – – – – – – – 3 – –
Metacarpals – – – 3 – – – – – – – – 3 2 –
Finger segments – 3 – – – – – – – – – – – 2 –
Navicular – – – – – 4 – – 4 – – – 5 – –
Cuboid – – – – – 2 – – – – – – 3 – –
First cuneiform – – – – – – – – 3 – – – 4 – –
Second cuneiform – – – – – 2 – – 3 – – – 2 – –
Third cuneiform – – – – – 2 – – – – – – 3 – 5
First metatarsal – – – – – 1 – – 3 – – – 3 1 –
Other metatarsals – – – 6 1 – – – 2 2 – – 10 – 4
Toe segments – – – – – – – – – – – – – 6 –

113
Table 10 (continued). Relative frequency of bone units in Tell Majnuna (EM locus 6 and others).
Bone unitEM loc. 6(6) EM loc. 6(7) EM loc. 6(8) EM loc. 25 EM loc. 29
R U L R U L R U L R U L R U L
Clavicle: medial epiphysis – – – 2 – – – – – – – – 5 1 –
Clavicle: medial diaphysis 2 – 3 3 – – – – – – – – 6 1 –
Clavicle: middle diaphysis 6 2 – 3 – – – – – – – – 5 – 1
Clavicle: lateral diaphysis 6 – 2 3 – – – – – – – – 5 – –
Clavicle: lateral epiphysis 6 – – 2 – – – – – – – – 2 – –
Scapula: glenoid 5 – 1 11 – 7 – – – – – – – 2 7
Scapula: acromion 5 – 2 8 – 10 – – – – – – 1 – 5
Scapula: coracoid 3 – – 3 – 5 – – – – – – 2 – 4
Scapula: medial body – 1 – 4 – 3 – – – – – – – – 1
Scapula: lateral body 2 1 – 3 1 3 – – – – – – – 1 3
Humerus: head 7 2 1 – – 1 – – – – – – – – 2
Humerus: greater tubercle 7 3 1 – 1 1 – – – – – – – – –
Humerus: lesser tubercle 7 3 1 – – 1 – – – – – – – – –
Humerus: neck + groove 8 3 1 – 1 2 – – – – – – – – 1
Humerus: prox. diaphysis 13 3 7 – – 10 – – 1 – – – – – 3
Humerus: mid. diaphysis 15 6 12 – 1 11 – – 3 – – – – 1 5
Humerus: dist. diaphysis 18 – 11 – – 10 – – 3 – – – 2 – 5
Humerus: distal fossae 16 – 6 – – 3 – – 2 – – – 2 – 4
Humerus: med. epicond. 11 – 2 – – 2 – – – – – – – – 2
Humerus: lat. epicond. 11 – 2 – – 3 – – – – – – – – 3
Ulna: prox. epiphysis 2 – – 1 – – – – – – – – – – –
Ulna: prox. metaphysis 4 – 1 2 – – – – – – – – – – –
Ulna: prox. diaphysis 6 – 5 2 – – – – – 2 – – – – –
Ulna: middle diaphysis 3 – 8 3 – – – – – 3 – – – – –
Ulna: dist. diaphysis – – 2 1 – – – – – 1 2 – – – –
Ulna: dist. metaphysis – – – – – – – – – – – – – – –
Ulna: dist. epiphysis – – – – – – – – – – – – – – –
Radius: prox. epiphysis – 2 5 – – 6 – – – – – – – 2 3
Radius: prox. metaphysis 1 1 6 – – 6 – – – – – – – 3 3
Radius: prox. diaphysis 3 1 5 – – 6 1 – – – – – – 3 3
Radius: middle diaphysis 3 4 2 – 4 5 3 – – – 3 – – 3 2
Radius: dist. diaphysis 2 – 2 – – 2 1 – – – – – – 1 –
Radius: dist. metaphysis – – 1 – – 1 – – – – – 1 – – –
Radius: dist. epiphysis – – 1 – – 1 – – – – – 2 – – –
Carpals – – – – – – – – – 21 – – – – –
Metacarpals – – 2 – – – – – – – – 10 – – –
Finger segments – 3 – – – – – – – – – 2 – – –
Navicular – – – – – – 2 – – – – – – – –
Cuboid 2 – – – – – – – – – – – – – –
First cuneiform – – – – – – – – – – – – – – –
Second cuneiform – – – – – – – – – – 2 – – – –
Third cuneiform – – – – – – – – – – – – – – –
First metatarsal – – – – – – – – – – – – – – –
Other metatarsals – – 2 – – – – – – – – – – – –
Toe segments – – – – – – – – – – – – – – –

114
Table 10 (continued). Relative frequency of bone units in Tell Majnuna (MTW1 and MTW4).
Bone unitMTW1 l. 65 MTW1 l. 66 MTW1 others MTW4 l. 64 MTW4 l. 65
R U L R U L R U L R U L R U L
Clavicle: medial epiphysis – – – 6 – 2 – 3 – – – – 2 – 6
Clavicle: medial diaphysis 1 – 4 6 – 3 – 2 – – – – 2 – 8
Clavicle: middle diaphysis 3 1 6 6 – 3 – – 2 – – – 3 2 13
Clavicle: lateral diaphysis 2 – 6 6 – 3 – – 1 – – – 3 – 10
Clavicle: lateral epiphysis 1 – 2 5 – 3 – – – – – – 2 – 8
Scapula: glenoid – – – 6 3 2 – – – – – – 5 – 11
Scapula: acromion – – – 7 2 2 – – – – – – 5 – 8
Scapula: coracoid – – – 6 2 – – – – – – – 2 – 7
Scapula: medial body – – – 3 – 1 – – – – – – 4 – 3
Scapula: lateral body – – – 3 2 1 – – – – – – 6 – 9
Humerus: head 2 2 – 8 – 3 – – – – 3 – 9 2 11
Humerus: greater tubercle 1 – – 7 – 3 – – – – 2 – 7 – 6
Humerus: lesser tubercle 1 – – 6 – 3 – – – – 2 – 8 – 11
Humerus: neck + groove 1 1 1 5 – 3 – – – 5 1 – 13 – 15
Humerus: prox. diaphysis 2 – 8 10 – 5 – – – 5 – – 17 – 23
Humerus: mid. diaphysis 2 2 5 13 – 6 – – – 3 – – 19 – 26
Humerus: dist. diaphysis 4 3 2 12 – 8 – – – 3 – 1 16 1 22
Humerus: distal fossae 3 – 4 9 – 7 – – – 3 – 2 9 – 20
Humerus: med. epicond. 2 – – 6 – 6 – – – 3 – – 3 – 14
Humerus: lat. epicond. 2 – – 4 – 6 – – – 3 – 2 4 – 14
Ulna: prox. epiphysis – – – – – 2 3 – – – – – 1 – 7
Ulna: prox. metaphysis 2 – – – – 2 3 – – 2 – – 9 – 9
Ulna: prox. diaphysis 3 – – – – 3 2 – – 2 – – 12 3 11
Ulna: middle diaphysis 2 – – – 1 2 – – – – – – 12 4 10
Ulna: dist. diaphysis 3 – – – – – – – – – – – 6 3 6
Ulna: dist. metaphysis 3 – – – – – – – – – – – – 1 3
Ulna: dist. epiphysis 2 – – – – – – – – – – – – – 3
Radius: prox. epiphysis 3 – – – – 3 – – 2 – – – 5 – 9
Radius: prox. metaphysis 3 – 1 – – 3 – – 3 – – – 11 – 11
Radius: prox. diaphysis 2 – 3 – – 3 – 1 2 – – – 12 – 9
Radius: middle diaphysis – – 3 – – 3 – 3 1 – – – 10 – 12
Radius: dist. diaphysis – – 1 – – 1 – 1 4 – – – 3 – 8
Radius: dist. metaphysis – – – – – 2 – – 6 – – – – – 5
Radius: dist. epiphysis – – – – – 3 – – 5 – – – – – 2
Carpals – – – – – 18 – – – – – – – – 2
Metacarpals – – – – – 15 – – – – – – 3 – 19
Finger segments – – – – – 23 – – – – – – 4 – 17
Navicular – – – 6 – – – – 2 – – – 3 – 2
Cuboid – – – 2 – – 3 – – – – – – 1 6
First cuneiform – – – 3 – – – – – – – – 3 – 3
Second cuneiform – – – 3 – – – – – – – – – – 3
Third cuneiform – – – 3 – – – – – – – – – – 3
First metatarsal – – – 3 – – 2 – – – – – – 2 1
Other metatarsals – – – 4 – – – – – – – – 7 3 15
Toe segments – – – 6 – – – – – – – – – 3 –

115
Table 10 (continued). Relative frequency of bone units in Tell Majnuna (others).
Bone unitEM others EMS MTW2+3 MT dump MT section
R U L R U L R U L R U L R U L
Clavicle: medial epiphysis 2 – – – – – – – – – – – 3 2 –
Clavicle: medial diaphysis 3 – – – – 3 – – – 2 2 – 3 – –
Clavicle: middle diaphysis 5 – 4 – – 3 – – 2 5 2 1 6 – –
Clavicle: lateral diaphysis 6 – – – – 3 – – – 7 4 3 5 – –
Clavicle: lateral epiphysis 2 – – – – – – – – 4 – 3 3 – –
Scapula: glenoid 3 – 2 – – 3 – – – – – – – – –
Scapula: acromion 2 – – – – 2 – – 2 2 2 2 2 – 2
Scapula: coracoid – – 2 – – 3 – – – – 6 – – – –
Scapula: medial body – 1 – – – 2 – – 1 – – – 1 – –
Scapula: lateral body – 1 1 – – 2 – – 1 – 1 – 1 – 1
Humerus: head – 2 4 – – – – – – 8 5 2 – 2 2
Humerus: greater tubercle – – 3 – – – – – – 9 1 3 – – –
Humerus: lesser tubercle – – 3 – – – – – – 9 1 3 – – –
Humerus: neck + groove – – 3 – – 3 – – – 11 1 1 – – 2
Humerus: prox. diaphysis 7 1 4 – – 3 1 – 2 11 8 4 – 1 2
Humerus: mid. diaphysis 16 3 4 – – 3 3 – 3 10 13 12 1 3 2
Humerus: dist. diaphysis 16 1 6 – – 6 5 – 3 17 3 23 5 – 4
Humerus: distal fossae 9 – 4 – – 3 – – 2 15 3 19 5 2 4
Humerus: med. epicond. 6 – 2 – – 3 – – – 12 2 9 – 1 –
Humerus: lat. epicond. 2 – 2 – 1 3 – – – 12 4 8 – 1 –
Ulna: prox. epiphysis 3 – – – – 3 – – 6 6 – 3 – – –
Ulna: prox. metaphysis 3 – – 3 – 5 – – 6 6 – 7 – – 4
Ulna: prox. diaphysis 3 3 5 2 – 7 – 4 4 6 3 3 – 2 3
Ulna: middle diaphysis 1 7 6 2 – 3 – 2 2 – 6 – – 3 2
Ulna: dist. diaphysis – 1 3 4 – 3 – – 6 – 4 – – 2 2
Ulna: dist. metaphysis – – 2 6 – 3 – – 6 – – – – – –
Ulna: dist. epiphysis – – – 2 – – – – 6 – – – – – –
Radius: prox. epiphysis – – – – – 3 – – – 5 – 3 – – 3
Radius: prox. metaphysis – 2 3 4 – 2 – – 3 6 1 3 – – 3
Radius: prox. diaphysis – 2 4 5 – 3 – – 4 1 4 3 – 1 2
Radius: middle diaphysis – 5 5 3 – 3 – – 3 – 5 1 – 3 1
Radius: dist. diaphysis 2 1 3 3 – 3 – – 2 2 1 – – 1 –
Radius: dist. metaphysis 2 – – 3 – 3 – – – 3 – – – – –
Radius: dist. epiphysis – – – – – 3 – – – 3 – – – – –
Carpals – – – – – 9 – – 3 – – 6 2 – –
Metacarpals 3 6 3 – – – – 4 2 5 – 6 – – –
Finger segments – 46 – – – – – 15 – – 26 – – 2 –
Navicular – – – 2 – 3 – – – – – 2 – – 2
Cuboid – – – 3 – – – – – – – – – – –
First cuneiform – – – 3 – – – – – – – 3 – – –
Second cuneiform – – – 3 – – – – – – – – – – –
Third cuneiform – – 2 3 – – – – – – – – – – –
First metatarsal 3 – 2 3 – 3 – – – – – – – – –
Metatarsals – 6 – 12 – – 3 – – 2 8 11 – – –
Toe segments – 6 – 30 – 18 3 2 – – – – – – –

116
Table 10 (continued). Relative frequency of bone units in Tell Majnuna (EM locus 6).
Bone unitEM loc. 6(1) EM loc. 6(2) EM loc. 6(3) EM loc. 6(4) EM loc. 6(5)
R U L R U L R U L R U L R U L
Acetabulum: pubis – – – – – 3 – – 2 1 – 2 – – 2
Acetabulum: ischium 3 – – 3 1 4 – – 7 2 1 3 4 6 3
Acetabulum: ilium 5 1 – 4 3 8 9 4 7 2 – 1 9 2 10
Pubis: superior – 1 – 1 – 3 – – 5 2 1 3 4 – 5
Pubis: inferior – – – 1 – 3 – 3 4 2 – 2 2 – 2
Ischium: posterior – – – 5 – 6 – – 5 2 – 5 2 1 4
Ischium: tuber – – – 2 – 6 – – 4 4 – 4 5 1 3
Ischium: anterior – – – 1 – 5 – 1 – – – 2 – 1 2
Ilium: sciatic notch 4 1 – 5 1 5 9 – 4 2 – 1 8 2 10
Ilium: auricular 3 – – 5 1 7 12 – 4 4 – 9 13 4 14
Ilium: post. sup. 2 – – 2 – 3 7 – 2 5 – 4 7 – 9
Ilium: crest 1 1 – – 1 1 5 1 – 4 – 4 3 4 5
Ilium: ant. sup. 2 – – 2 – 3 4 – – 5 – 2 2 2 7
Ilium: ant. inf. 2 – – 2 2 5 4 2 – 5 – – 4 – 7
Ilium: central 2 – – 1 2 4 5 – 1 5 – 5 3 3 6
Femur: head 6 – 6 3 5 8 – 3 4 5 – 4 12 10 7
Femur: neck 11 – 9 6 1 8 – 1 6 9 2 7 19 4 11
Femur: gr. trochanter 4 – 8 4 – 6 – – – 4 – 1 5 – 4
Femur: less. trochanter 10 – 8 3 – 6 – – 3 5 – 2 7 – 8
Femur: proximal diaph. 17 2 11 5 2 13 – – 10 12 1 13 23 4 22
Femur: middle diaph. 19 1 9 3 4 16 – 1 11 15 6 17 23 13 19
Femur: distal diaphysis 14 1 4 2 – 10 2 – 3 8 – 9 16 5 7
Femur: distal metaphysis 5 – 2 – – 4 – 3 2 4 – 4 8 1 5
Femur: medial condyle 2 – 2 – – 2 2 1 2 3 – 5 4 – 12
Femur: lateral condyle 2 – 2 – – 3 2 – 1 4 1 – 4 – 12
Patella – – – – – – – – 2 – – 3 2 3 –
Tibia: medial condyle – 2 – – 3 3 – 3 – – – – 9 4 5
Tibia: lateral condyle – 2 – – 2 3 – 3 – – – – 9 3 4
Tibia: tuberosity – 1 – – 2 5 – – – – – – 7 1 6
Tibia: prox. metaphysis – 2 – 2 3 6 – 1 – – 1 – 10 2 7
Tibia: prox. diaphysis 1 2 – 6 – 11 – – – – 2 2 18 6 7
Tibia: middle diaphysis 2 7 – 6 4 9 – – 3 – 1 3 18 7 11
Tibia: distal diaphysis – 1 – 3 – 5 – – – – 1 – 5 2 6
Tibia: distal metaphysis – – – 3 – 5 – – – – – – 7 – 8
Tibia: distal epiphysis – – – 2 – 4 – – – – – – 5 1 9
Tibia: malleolus – – – 1 – 4 – – – – – – 7 3 8
Fibula: prox. epiphysis 2 – – – – – 2 – – 2 – – 3 – –
Fibula: prox. metaphysis 3 1 – – – 3 3 – – 3 – – 5 – –
Fibula: prox. diaphysis 6 3 – – – 2 3 – – 3 – – 6 1 6
Fibula: middle diaphysis 5 2 1 – 1 2 3 1 2 3 2 – 4 12 4
Fibula: distal diaphysis 1 – 2 2 – – 5 – 2 3 – – 5 5 6
Fibula: distal metaphysis 3 – 3 7 – 2 6 – – 3 – – 3 2 8
Fibula: distal epiphysis 3 – 3 – – 3 7 – – 3 – – 3 – 6
Talus: posterior 2 3 – 4 – 2 – – – 3 – – 11 – 14
Talus: anterior – 2 – 2 – 2 – – – 3 – – 10 – 13
Calcaneus: anterior 1 – 1 3 – 3 – – – – – 8 3 – 11
Calcaneus: posterior – – – 2 – 2 – – – – – 3 1 – 4
Calcaneus: superior 2 – 2 3 – 4 – – – 2 – 9 1 3 12

117
Table 10 (continued). Relative frequency of bone units in Tell Majnuna (EM locus 6 and others).
Bone unitEM loc. 6(6) EM loc. 6(7) EM loc. 6(8) EM loc. 25 EM loc. 29
R U L R U L R U L R U L R U L
Acetabulum: pubis – – – – – 3 3 – – – – – – – –
Acetabulum: ischium 1 1 3 – – 5 5 – 1 – – – 1 2 –
Acetabulum: ilium 4 1 10 1 1 7 4 – 3 1 – 1 1 2 –
Pubis: superior – – 2 – – 1 3 – – 2 – 1 – – –
Pubis: inferior – – – – – – 1 – – 1 – 1 – 3 –
Ischium: posterior 2 1 4 – – 5 3 – 2 2 – – 1 1 –
Ischium: tuber – – 3 – – 4 1 – 2 2 – – 1 – –
Ischium: anterior – 1 – – – – – – – – – – – – –
Ilium: sciatic notch 1 – 5 2 – 7 3 – 4 – – 2 2 1 –
Ilium: auricular 3 1 7 2 – 9 3 – 7 1 – 3 – 2 –
Ilium: post. sup. 3 – 5 – – 9 1 – 4 2 – – – 1 –
Ilium: crest 2 – 5 – – 4 – – 1 1 – – – 1 –
Ilium: ant. sup. 3 – 8 – – – – – 2 – – – – – –
Ilium: ant. inf. 3 – 7 – – 2 1 – 4 – – – – – –
Ilium: central 3 1 5 1 – 4 3 – 5 1 – 1 1 1 –
Femur: head – 8 10 – 4 7 2 2 6 2 – 1 3 2 –
Femur: neck – 4 9 2 – 10 2 1 6 3 – 2 4 1 –
Femur: gr. trochanter – – 4 – – 5 – – 1 1 – 2 1 – –
Femur: less. trochanter 1 – 2 – – 7 – – 1 3 – 3 – – –
Femur: proximal diaph. 11 5 15 9 1 13 2 4 7 3 – 2 8 1 5
Femur: middle diaph. 13 – 15 14 1 16 2 6 9 3 – 2 11 1 9
Femur: distal diaphysis 5 – 5 11 – 13 4 2 7 3 – – 4 – 6
Femur: distal metaphysis 2 – 5 5 – 7 3 – 4 3 1 – – – 2
Femur: medial condyle 3 1 6 6 – 8 3 1 8 1 2 – 2 4 –
Femur: lateral condyle 5 1 6 6 – 8 3 1 6 2 – – – 4 4
Patella – – – – – – – – – – – – – – –
Tibia: medial condyle 5 – 1 3 – 4 – – 3 – – – – – –
Tibia: lateral condyle 3 – 1 3 – 4 – – 3 – – – – 1 –
Tibia: tuberosity 2 – 2 3 – 1 – – 3 – – – – – –
Tibia: prox. metaphysis 3 1 2 2 – 2 2 – 3 – – – – – 2
Tibia: prox. diaphysis 3 1 4 3 – 7 1 1 2 – 1 – – 3 2
Tibia: middle diaphysis 7 – 6 5 – 12 – 3 – – – – – 3 1
Tibia: distal diaphysis 8 1 6 4 – 9 – 1 – – – – – 2 –
Tibia: distal metaphysis 7 – 3 2 – 4 – – – – – – – – –
Tibia: distal epiphysis 4 – 3 3 – 4 – – – – – – – 1 –
Tibia: malleolus 4 – 3 – – 6 – – – – – – – – –
Fibula: prox. epiphysis – – – – – – – – – – – – – – –
Fibula: prox. metaphysis – – – – – – – – – – – – – – –
Fibula: prox. diaphysis – – – – – – – – – – – – – – –
Fibula: middle diaphysis – 4 1 – 1 – – – – – – – – 2 –
Fibula: distal diaphysis – 1 1 – – – – – – – – – – – –
Fibula: distal metaphysis – – – – – – – – – – – – – – –
Fibula: distal epiphysis – – – – – – – – – – – – – – –
Talus: posterior – – – – – – – – 3 – – – – – 3
Talus: anterior – – – – – – – – 3 – – – – – 1
Calcaneus: anterior 9 – – – – – – – – – – – – – 1
Calcaneus: posterior 8 – – – – – – – – – – – – – 1
Calcaneus: superior 9 – – – – – – – – – – – – – 3

118
Table 10 (continued). Relative frequency of bone units in Tell Majnuna (MTW1 and MTW4).
Bone unitMTW1 l. 65 MTW1 l. 66 MTW1 others MTW4 l. 64 MTW4 l. 65
R U L R U L R U L R U L R U L
Acetabulum: pubis – – 2 3 – 2 3 – 4 3 – 3 7 – 12
Acetabulum: ischium 8 – 6 3 – 3 3 – 9 3 – 3 10 – 18
Acetabulum: ilium 7 1 4 3 – 3 3 – 7 3 – 3 7 3 18
Pubis: superior – – – – – – 2 – – – – – 4 – 6
Pubis: inferior 1 – – – – – 1 – – 1 – – 3 2 3
Ischium: posterior 8 – 5 2 – 3 3 – 5 3 – 3 13 – 19
Ischium: tuber 6 – 2 – – 3 3 – 3 1 – 1 9 – 13
Ischium: anterior 2 – 2 – – 1 1 – – – – – 1 1 4
Ilium: sciatic notch 8 – 3 3 – 3 3 – 3 3 – 3 10 – 13
Ilium: auricular 8 – 2 2 – 2 3 – 1 2 – 2 9 – 19
Ilium: post. sup. 4 – – – – 1 3 – – 1 – – 8 1 17
Ilium: crest – – – 1 – 2 2 – – – – – 5 1 12
Ilium: ant. sup. – – – 2 – – 3 – – – – – 4 – 7
Ilium: ant. inf. 4 1 2 3 – 2 3 – 1 2 – 1 6 2 13
Ilium: central 2 – – 1 – – 3 – 1 1 – 1 6 2 14
Femur: head 5 – – 5 – 8 3 – 3 3 3 – 20 1 18
Femur: neck 6 – – 6 – 9 3 – 3 3 2 – 22 – 19
Femur: gr. trochanter 6 – – 4 – 5 3 – 2 2 – – 13 1 6
Femur: less. trochanter 6 – – 11 – 8 3 – 5 2 – – 22 – 18
Femur: proximal diaph. 7 4 5 12 – 16 3 1 6 3 1 2 26 2 26
Femur: middle diaph. 5 4 6 13 – 18 2 1 5 1 1 1 29 4 25
Femur: distal diaphysis 2 2 10 12 – 15 4 1 4 – 1 – 30 – 18
Femur: distal metaphysis – – 8 3 – 6 2 1 1 – – – 21 – 13
Femur: medial condyle – – 5 3 – 3 1 1 1 – – – 12 – 11
Femur: lateral condyle – – 6 3 – 3 1 1 1 – – – 16 – 13
Patella – – 6 3 – – – – – – – – 11 – 12
Tibia: medial condyle 1 – 5 3 – 2 – – – – – 5 8 – 9
Tibia: lateral condyle 3 – 5 3 – 2 – – – – – 4 8 – 7
Tibia: tuberosity 1 – 5 3 – 3 – – – – – 6 8 – 14
Tibia: prox. metaphysis – – 7 3 – 3 3 – – – – 6 12 1 10
Tibia: prox. diaphysis 2 2 8 5 – 6 4 – – – – 4 13 2 18
Tibia: middle diaphysis 3 – 6 5 – 8 5 – – – – 2 15 – 21
Tibia: distal diaphysis 2 – 5 3 – 5 1 – – – – 2 11 – 12
Tibia: distal metaphysis – – 3 2 – 3 – – – – – 3 6 – 8
Tibia: distal epiphysis – – 2 2 – 4 – – – – – 3 5 – 8
Tibia: malleolus – – 3 2 – 6 – – – – – 3 4 – 8
Fibula: prox. epiphysis – – – – – – – – – 2 – – – 2 3
Fibula: prox. metaphysis – – 2 1 – – – – – 2 – – 4 – 7
Fibula: prox. diaphysis – – 6 2 – – – – – 2 – – 5 3 8
Fibula: middle diaphysis – 1 4 2 – – – – – – – – 6 5 10
Fibula: distal diaphysis – 1 3 2 – – – – – – – – 6 3 11
Fibula: distal metaphysis – – 3 – – – – – – – – – 6 – 10
Fibula: distal epiphysis – – 3 – – – – – – – – – 6 1 5
Talus: posterior 2 – – 5 – 3 – – – – – – 6 – 9
Talus: anterior 2 – – 6 – 1 – – – – – – 6 – 8
Calcaneus: anterior – – – 4 – 3 – – 2 – – – 5 – 3
Calcaneus: posterior – – – 2 – – – – – – – – 3 – 4
Calcaneus: superior – – – 2 – 2 – – – – – – 5 – 5

119
Table 10 (continued). Relative frequency of bone units in Tell Majnuna (others).
Bone unitEM others EMS MTW2+3 MT dump MT section
R U L R U L R U L R U L R U L
Acetabulum: pubis – 1 – 3 – 3 3 – – – 2 1 2 2 –
Acetabulum: ischium 1 2 – 5 – 5 6 – 2 7 3 7 6 1 –
Acetabulum: ilium – 3 1 5 – 3 6 – 2 9 1 6 3 2 –
Pubis: superior – 1 – 2 – 3 – – – 4 – 2 2 – –
Pubis: inferior – – – 2 – 2 – – – 6 1 3 2 – –
Ischium: posterior – – – 6 – 6 5 – 3 10 4 4 5 – –
Ischium: tuber – – – 5 – 5 4 – 2 6 1 2 2 – –
Ischium: anterior 2 – – 5 – 3 – – 1 3 1 – – – –
Ilium: sciatic notch – – 4 5 – 3 4 – 2 18 1 11 4 1 –
Ilium: auricular – – 2 6 – 2 3 – 4 18 2 9 5 1 –
Ilium: post. sup. – – – 6 – 2 1 – 4 5 1 9 4 – –
Ilium: crest – – – 4 – 2 1 1 – 1 4 3 3 1 –
Ilium: ant. sup. – – – 6 – 2 – – 2 – – 3 2 – –
Ilium: ant. inf. – – – 6 – 3 1 – 3 5 – 6 3 – –
Ilium: central – 1 – 5 – 2 2 – 3 5 4 8 2 – –
Femur: head 2 5 4 5 – 3 2 2 – – 35 – 3 11 3
Femur: neck 4 6 4 7 – 6 – 1 – – 16 2 3 7 3
Femur: gr. trochanter 2 – 2 3 – 3 – – 2 – 2 2 2 9 1
Femur: less. trochanter 8 – 5 3 – 1 2 – 3 – 5 10 3 3 5
Femur: proximal diaph. 11 1 7 7 – 9 8 – 3 12 19 21 4 6 7
Femur: middle diaph. 7 8 8 9 1 8 8 1 3 18 31 14 5 8 7
Femur: distal diaphysis 2 4 3 7 – 8 2 – 2 11 11 9 5 2 7
Femur: distal metaphysis 1 1 – 4 – 5 – – – 3 – 3 3 – 6
Femur: medial condyle 2 2 – 3 1 – – 1 – 2 5 2 3 2 8
Femur: lateral condyle 2 1 – 3 – – – 1 – 3 4 1 3 – 6
Patella 2 – – 3 – – – – – – – 2 2 – 3
Tibia: medial condyle 3 2 2 5 – 3 – – 3 3 1 4 – – 6
Tibia: lateral condyle 2 3 – 5 – 3 – – 3 3 1 4 – – 7
Tibia: tuberosity 3 – – 5 – 3 – – 3 3 – 3 – – 8
Tibia: prox. metaphysis 5 1 – 5 – 4 – – 3 2 – 2 – – 6
Tibia: prox. diaphysis 7 4 5 6 – 4 – – 4 – 7 5 – – 5
Tibia: middle diaphysis 7 7 3 5 4 3 – 1 5 2 13 6 2 – 2
Tibia: distal diaphysis 5 2 5 4 – 3 – – 3 2 5 1 2 – 1
Tibia: distal metaphysis 5 – 3 2 – 2 – – 3 – – 1 – – 3
Tibia: distal epiphysis 5 – 5 3 – 3 – – 3 – – 3 – – 2
Tibia: malleolus 5 – 4 3 – 3 – – 3 – – 3 – – 2
Fibula: prox. epiphysis – – – – – – – – – – – – – – 2
Fibula: prox. metaphysis – – – 6 – 2 – – – – – – – 1 3
Fibula: prox. diaphysis – 2 – 6 4 3 1 – 1 – 3 – – 3 3
Fibula: middle diaphysis 5 4 – 6 3 3 3 – 3 – 8 – – 1 3
Fibula: distal diaphysis 5 1 – 6 2 2 1 – 1 – 3 – – – 2
Fibula: distal metaphysis 3 – – 5 – 3 2 – – – – – – – –
Fibula: distal epiphysis 2 – – 3 – – 2 – – – – – – – –
Talus: posterior 11 – 7 2 – 3 – – 3 5 – 3 – – 3
Talus: anterior 7 – 7 2 – 3 – – 2 4 – 3 – – 3
Calcaneus: anterior – – 1 3 – 3 3 – – 5 – – – – 3
Calcaneus: posterior – – 2 3 – 3 2 – – 3 – – – – 3
Calcaneus: superior 2 2 1 3 – 3 3 – – 6 – – – – 3

120
Table 11. Preservation pattern of bones in comparative samples and PCA factor scores.US modern forensic sample after Haglund 1997.
In first two factors scores higher than 0.8 or lesser than -0.8 are marked with grey.
BoneModern EME Tell Barri PCA factor scores (unrotated)
N=18 N=25 N=11 1 2 3 4
Crania 100.0 24.3 10.0 -3.16 -1.55 0.52 0.40
Mandibles 83.0 28.0 17.0 -1.79 2.12 -3.06 -1.16
Atlases 72.2 25.2 6.0 0.02 -1.52 -1.70 1.93
Axes 55.5 39.6 3.0 0.03 -0.12 -1.39 2.11
Cervical 48.8 48.0 5.0 0.28 -0.20 -0.89 1.08
Thoracic 98.1 48.8 16.0 -0.34 -0.37 0.56 0.88
Lumbar 60.0 39.6 4.0 -0.90 -1.59 1.19 -0.65
Sacra 66.6 24.4 9.0 0.15 -0.95 -0.03 -1.04
Sterna 38.8 18.0 0.0 0.97 -0.85 -0.91 -1.01
Ribs 52.7 33.2 15.0 0.40 -0.21 -0.13 -0.34
Clavicles 47.2 35.2 21.0 0.19 0.63 -0.16 0.05
Scapulae 47.2 19.6 10.0 0.23 -0.31 -0.89 -1.90
Humeri 41.6 55.8 23.0 -0.47 1.96 0.83 1.37
Ulnae 25.0 44.4 23.0 0.26 0.52 1.36 0.34
Radii 38.0 51.2 20.0 0.25 0.45 0.81 0.00
Carpals 13.8 46.0 13.0 1.14 0.00 -0.08 0.35
Hands 10.9 57.8 20.0 1.15 0.66 0.43 0.83
Ossa coxae 58.3 25.0 7.0 -0.35 -1.13 0.53 -0.42
Femora 61.1 35.6 26.0 -1.80 1.11 1.16 0.08
Patellae 8.3 39.6 15.0 0.75 -0.04 -0.06 0.74
Tibiae 50.0 30.6 11.0 -0.25 0.23 0.14 -1.16
Fibulae 50.0 33.4 9.0 0.41 -0.48 0.32 -0.24
Tali 16.6 51.2 26.0 0.25 1.80 0.99 -0.44
Calcanei 16.6 36.0 8.0 0.49 0.03 0.19 -1.22
Tarsals 7.1 47.4 17.0 1.00 0.14 0.42 0.14
Feet 10.9 29.4 9.0 1.11 -0.35 -0.14 -0.72

121
Table 12. Preservation pattern: coefficient of variation and PCA factor loadings.Loadings higher than 0.6 or lesser than -0.6 are marked with grey.
Id Sample MNI or N Coefficient of variation
PCA factor loadings (unrotated)
1 2 3 4
1 EM loc. 6 (1) 8 113.7 -0.70 0.38 0.24 0.23
2 EM loc. 6 (2) 12 93.2 -0.85 0.14 -0.28 -0.29
3 EM loc. 6 (3) 7 91.8 -0.63 -0.51 0.05 0.28
4 EM loc. 6 (4) 11 93.4 -0.71 -0.32 0.25 -0.15
5 EM loc. 6 (5) 19 73.1 -0.88 0.12 0.25 -0.24
6 EM loc. 6 (6) 10 119.9 -0.83 0.32 -0.15 -0.05
7 EM loc. 6 (7) 12 119.6 -0.87 -0.18 0.04 -0.20
8 EM loc. 6 (8) 6 133.9 -0.86 -0.17 0.12 0.02
9 EM loc. 25 8 169.2 -0.77 -0.18 -0.33 0.22
10 EM loc. 29 4 164.0 -0.65 0.48 -0.41 -0.28
11 MTW1 loc. 65 8 104.4 -0.80 0.05 -0.29 0.35
12 MTW1 loc. 66 6 102.1 -0.78 0.47 -0.35 -0.03
13 MTW1 others 4 176.6 -0.76 -0.33 0.42 0.00
14 MTW4 loc. 63 2 182.3 -0.73 -0.22 0.29 0.02
15 MTW4 loc. 65 14 70.0 -0.91 -0.12 0.01 0.27
16 EM others 5 97.9 -0.48 0.73 -0.04 -0.13
17 EMS 4 75.7 -0.67 -0.12 0.49 -0.37
18 MTW2+MTW3 4 123.6 -0.80 -0.16 0.27 -0.02
19 MT dump 10 89.4 -0.67 0.38 0.24 0.11
20 MT section 6 103.9 -0.81 -0.11 -0.37 0.29
Modern forensic 18 58.5 -0.76 -0.29 -0.25 0.07
EME 25 30.4 0.25 0.51 0.44 0.50
Tell Barri 11 55.5 -0.10 0.77 0.43 0.09
Eigenvalue 12.34 3.02 2.00 1.17
Variance explained (%) 53.65 13.13 8.71 5.09
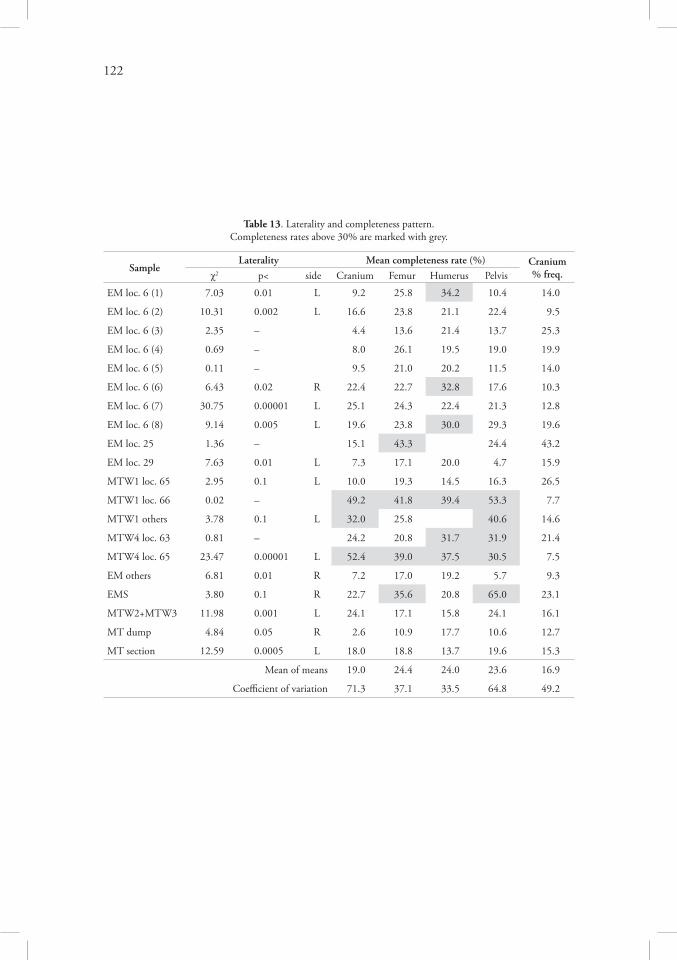
122
Table 13. Laterality and completeness pattern.Completeness rates above 30% are marked with grey.
SampleLaterality Mean completeness rate (%) Cranium
% freq.χ2 p< side Cranium Femur Humerus Pelvis
EM loc. 6 (1) 7.03 0.01 L 9.2 25.8 34.2 10.4 14.0
EM loc. 6 (2) 10.31 0.002 L 16.6 23.8 21.1 22.4 9.5
EM loc. 6 (3) 2.35 – 4.4 13.6 21.4 13.7 25.3
EM loc. 6 (4) 0.69 – 8.0 26.1 19.5 19.0 19.9
EM loc. 6 (5) 0.11 – 9.5 21.0 20.2 11.5 14.0
EM loc. 6 (6) 6.43 0.02 R 22.4 22.7 32.8 17.6 10.3
EM loc. 6 (7) 30.75 0.00001 L 25.1 24.3 22.4 21.3 12.8
EM loc. 6 (8) 9.14 0.005 L 19.6 23.8 30.0 29.3 19.6
EM loc. 25 1.36 – 15.1 43.3 24.4 43.2
EM loc. 29 7.63 0.01 L 7.3 17.1 20.0 4.7 15.9
MTW1 loc. 65 2.95 0.1 L 10.0 19.3 14.5 16.3 26.5
MTW1 loc. 66 0.02 – 49.2 41.8 39.4 53.3 7.7
MTW1 others 3.78 0.1 L 32.0 25.8 40.6 14.6
MTW4 loc. 63 0.81 – 24.2 20.8 31.7 31.9 21.4
MTW4 loc. 65 23.47 0.00001 L 52.4 39.0 37.5 30.5 7.5
EM others 6.81 0.01 R 7.2 17.0 19.2 5.7 9.3
EMS 3.80 0.1 R 22.7 35.6 20.8 65.0 23.1
MTW2+MTW3 11.98 0.001 L 24.1 17.1 15.8 24.1 16.1
MT dump 4.84 0.05 R 2.6 10.9 17.7 10.6 12.7
MT section 12.59 0.0005 L 18.0 18.8 13.7 19.6 15.3
Mean of means 19.0 24.4 24.0 23.6 16.9
Coefficient of variation 71.3 37.1 33.5 64.8 49.2

123
Table 14. Tooth completeness pattern. C – complete, B – broken, P – postmortem tooth loss.
EM loc. 6 EM others EMS MT section MT dump MTW1 MTW4 Others
C B P C B P C B P C B P C B P C B P C B P C B P
I1 12 20 62 6 5 8 1 4 – 3 5 11 2 5 9 4 5 7 11 5 9 2 – 5
I2 16 18 62 5 7 9 3 2 – 2 6 8 2 3 6 6 5 5 13 5 8 2 – 5
Cx 24 26 55 13 5 6 6 – – 6 9 6 7 5 5 6 7 5 16 5 5 1 4 2
P1 34 26 51 13 6 3 4 2 – 3 10 8 4 7 2 7 4 6 17 5 6 1 2 4
P2 31 27 45 9 8 6 5 – – 5 9 7 3 4 5 5 7 6 19 3 4 – 2 6
M1 45 40 20 5 15 2 1 6 – 6 13 2 3 5 6 4 9 3 14 8 5 4 1 2
M2 40 32 21 13 3 3 5 – – 8 8 1 2 2 4 3 4 5 17 4 1 3 3 1
M3 36 13 21 10 5 2 6 – – 6 5 3 5 2 4 2 – 1 14 2 2 1 2 3
I1
1 10 36 7 3 9 – – 4 3 4 2 1 – 6 5 4 7 9 – 3 1 – –
I2
3 10 33 10 2 8 – – 4 3 4 4 – – 6 8 2 6 7 2 2 – 2 –
Cx
12 13 24 10 4 8 – 1 3 4 2 5 2 4 6 7 3 8 7 3 2 2 1 –
P1
12 10 25 10 3 5 2 1 1 5 2 5 7 3 5 4 7 4 9 2 2 4 1 4
P2
18 9 25 13 1 5 2 – 1 8 – 5 3 2 7 7 3 4 7 2 4 1 1 1
M1
17 26 4 11 9 2 1 2 – 3 8 2 1 5 6 6 6 2 6 4 2 1 1 1
M2
19 23 7 14 3 2 2 1 – 7 1 3 5 3 3 5 7 5 7 3 1 1 1 1
M3
25 6 10 12 1 2 – – 2 2 1 2 4 – 2 5 1 3 7 2 – 1 1 1

124
Table 15. Articulations.
Articulation
EM 6(1)
EM 6(2)
EM 6(3)
EM 6(4)
EM 6(5)
EM 6(6)
EM 6(7)
EM 6(8)
EM25
EM29
+ – + – + – + – + – + – + – + – + – + –
cranium › mandible – 4 1 4 – 1 1 4 1 6 1 7 2 5 1 4 3 4 – 2
cranium › atlas – 2 – 4 – 2 – 4 – 10 1 6 – 5 1 4 4 1 – 2
mandible › cranium – 3 1 2 – – 1 – 1 4 1 5 2 1 1 – 3 – – 2
atlas › cranium – – – 3 – 3 – 1 – 1 1 1 – – 1 – 4 – – –
atlas › axis – – 1 2 – 3 – 1 – 1 – 2 – – 1 – 2 2 – –
axis › atlas – 2 1 – – 1 – 1 – 3 – 1 – 1 1 – 2 – – –
axis › C3 – 2 – – – – – 1 – 1 – 1 1 – – 1 1 1 – –
cervical 4 – 7 21 – 16 3 6 – 42 10 4 10 4 – – 1 2 – 10
thoracic 10 26 21 42 – 52 18 44 20 85 9 10 25 17 20 24 – – 8 8
thoracic › ribs 1 16 1 33 1 12 4 30 1 52 – 17 4 30 1 28 – – – 11
lumbar – 4 7 13 1 34 29 12 29 32 – 14 35 18 16 7 5 2 – 2
sacrum › L5 – – 1 2 1 2 2 3 1 7 – – 1 3 2 – 1 – – –
sacrum › ilium – – – 5 – – 2 – – 7 1 1 1 3 1 – 2 – – –
ribs › thoracic 1 9 1 8 1 14 4 5 1 22 – 21 4 11 1 2 – 1 – 2
ribs › sternum – 1 – 5 – 3 – 1 – 1 – – – 3 – – – – – –
sternum › ribs – – – – – – – 2 – 4 – – 1 – – – – – – –
sternum › clavicle – – – – – – – – – – – – – 2 – – – – – –
clavicle › sternum – 2 – – – 1 – 2 – 1 – 1 – 1 – – – – – 2
clavicle › scapula – 2 – – – 1 – 3 – 1 – 3 – 1 – – – – – 1
scapula › clavicle – 1 – 1 – 4 – 4 – 4 – – – 4 – – – – – –
scapula › humerus – – – 7 – 3 – 5 – 5 – 2 – 7 – – – – – 3
humerus › scapula – 3 – 3 – – – – – 4 – 5 – 1 – – – – – 1
humerus › ulna – 4 – 4 – 2 – 1 – 7 – 6 – 1 – – – – – 1
humerus › radius – 4 – 4 – 2 – 1 – 7 – 6 – 1 – – – – – 1
ulna › humerus – 5 – – – 1 – 1 – 6 – 3 – 1 – – – – – –
ulna › radius – 4 – – – 2 – 1 – 9 1 4 – 1 – – 1 – – –
ulna › carpals – 2 – – – 2 – – – – – – – – – – – – – –
radius › humerus – – – 2 – 2 – – – 7 – 3 – 2 – – – – – 2
radius › ulna – 2 – 2 – 3 – 1 – 7 1 4 – 4 – 1 1 1 – 2
radius › carpals – 2 – – – 2 – – – 1 – 1 – 1 – – – 1 – –
carpals › ulna – – – – – – – – – – – – – – – – – 1 – –
carpals › radius – – – – – – – – – – – – – – – – – 1 – –
carpals › metacarpals – 1 – – – – – – – – – – – – – – 4 1 – –
carpals › carpals – – – – – – – – – – – – – – – – 7 1 – –
metacarpals › carpals – – – 1 – – – – – 1 – 1 – – – – 4 – – –
metacarpals › fingers – – – 1 – – – – – 2 – – – – – – 1 3 – –
fingers proximal – 1 – – – – – – – – – 1 – – – – 1 – – –
fingers distal – 1 – – – – – 1 – – – 1 – – – – – – – –
pelvis › sacrum – 1 – 3 – 4 2 1 – 10 1 5 – 4 1 4 2 – – –
pelvis › pelvis – – – 2 – 3 – 4 – 5 – 2 – 1 – 1 2 – – –
pelvis › femur – 3 – 8 – 6 – 4 – 14 1 7 – 6 – 4 – 2 – 3
femur › pelvis – 4 – 6 – 2 – 4 – 12 1 6 – 5 – 4 – 2 – 2
femur › patella – 2 – 2 – 3 – 5 – 8 – 5 – 7 – 7 – 2 – 3
femur › tibia – 2 – 2 – 3 – 5 – 8 – 5 – 7 – 7 – 2 – 3
patella › femur – – – – – 1 – 1 – 2 – – – – – – – – – –

125
Table 15 (continued): Articulations.
Articulation
MTW1 65
MTW1 66
MTW1 others
MTW4 64
MTW4 65
MT dump
MT section
MTW 2+3 EMS EM
others
+ – + – + – + – + – + – + – + – + – + –
cranium › mandible 1 3 3 1 – 3 – 2 4 10 – – 2 4 1 3 – 4 – –
cranium › atlas 2 1 1 3 – 2 – 2 5 8 – – 3 4 1 2 – 3 – –
mandible › cranium 1 – 3 2 – – – – 4 2 – 3 2 3 1 – – – – 1
atlas › cranium 2 1 1 – – – – – 5 1 – 4 3 3 1 – – – – –
atlas › axis 3 – 1 – – – – – 5 1 – 3 4 2 – – – – – –
axis › atlas 2 – 1 1 – – – – 5 2 – 4 4 – – – – – – 1
axis › C3 2 – 1 1 – – – – 2 4 – 4 4 – – – – – – 1
cervical 12 4 15 10 – – – 4 22 14 – 18 24 12 2 7 – – – 6
thoracic 19 10 14 6 10 8 – – 107 68 31 87 31 6 10 16 24 4 8 4
thoracic › ribs 9 15 9 10 – 14 – – 54 80 10 59 15 17 10 9 22 4 – 4
lumbar – 6 1 9 8 12 4 8 41 26 3 56 20 15 – 18 15 2 – –
sacrum › L5 – – 1 – – – – 1 4 1 – 3 1 1 – 1 1 – – –
sacrum › ilium – – – 2 – – – 2 6 1 – 3 – 2 – – 2 – – –
ribs › thoracic – – 9 5 – – – – 53 8 11 15 15 1 – 4 18 – 4 4
ribs › sternum – – – 1 – – – – 1 1 – 1 – – – – – 4 – –
sternum › ribs – – – – – – – – 1 – – – – – – – – – – –
sternum › clavicle – – – – – – – – 1 2 – 2 – – – – – – 2 2
clavicle › sternum – – – 3 – 1 – – 1 3 – 1 – 2 – – – 1 2 1
clavicle › scapula – 1 2 1 – – – – 1 3 – 3 – 1 1 – 1 – 1 2
scapula › clavicle – – 1 1 – – – – 1 1 – 2 – 2 1 – 1 – 1 –
scapula › humerus – – 3 2 – – – 1 3 7 – – – – 1 – 1 – 1 –
humerus › scapula – 2 3 2 – – – 1 3 5 – 5 – 2 1 – 1 – 1 2
humerus › ulna – 2 1 4 – – – 2 3 5 – 9 – 3 1 – 2 1 2 2
humerus › radius – 2 1 4 – – – 2 3 5 – 9 – 3 1 – 1 2 2 2
ulna › humerus – 1 1 – – 1 – 1 3 4 – 5 – 2 1 2 2 2 2 1
ulna › radius – 1 1 – – 1 – 1 6 1 – 5 2 1 1 2 2 3 2 –
ulna › carpals – 1 – – – – – – 1 – – – – – – 2 1 2 – 2
radius › humerus – 1 1 – – 1 – – 3 2 – 3 – 1 1 – 1 1 2 –
radius › ulna – 2 1 1 – 3 – – 6 2 – 5 2 – 1 – 2 1 2 –
radius › carpals – – 1 – – 2 – – – 1 – 1 – – 1 – 1 1 – 2
carpals › ulna – – – 1 – – – – 1 – – 1 – – – – 1 – – –
carpals › radius – – 1 – – – – – 1 – – 1 – – – – 1 – – –
carpals › metacarpals – – 5 – – – – – 1 – – – – 1 – 2 – 5 – –
carpals › carpals – – 6 2 – – – – – 2 – – – 2 – 1 6 3 – –
metacarpals › carpals – – 5 – – – – – 1 7 – 4 – – – 1 – – – 3
metacarpals › fingers – – 5 – – – – – 2 4 – 2 – – – 1 – – 1 2
fingers proximal – – 8 – – – – – 2 4 – 9 – – – – – – 14 –
fingers distal – – 3 4 – – – – – 4 – 8 – – – 5 – – 14 –
pelvis › sacrum – 4 – 2 – 2 – 2 6 2 1 8 – 3 – 2 2 – – –
pelvis › pelvis – 1 – – – – – – 2 2 – 3 – 1 – – 2 – – –
pelvis › femur – 8 1 1 1 3 – 2 8 9 – 12 3 1 1 3 2 1 – –
femur › pelvis – 2 1 5 1 1 – 2 8 7 – 17 4 3 1 2 2 2 – 3
femur › patella 2 – 1 – – 3 – – 2 11 – 5 2 3 – 1 1 3 – 1
femur › tibia 1 1 1 1 – 3 – – 3 10 – 5 4 1 – 1 3 1 – 1
patella › femur 2 – 1 – – – – – 2 6 – 1 2 1 – – 1 – – –

126
Table 15 (continued). Articulations.
ArticulationEM 6(1)
EM 6(2)
EM 6(3)
EM 6(4)
EM 6(5)
EM 6(6)
EM 6(7)
EM 6(8)
EM25
EM29
+ – + – + – + – + – + – + – + – + – + –
tibia › femur – 3 – 5 – 2 – – – 12 – 3 – 3 – 1 – – – –
tibia › fibula – – – 2 – – – – 1 8 – 4 – 2 – 1 – – – –
tibia › talus – – – 3 – – – – – 7 – 3 – 3 – – – – – 1
fibula › tibia – 1 – – – 1 – 1 1 2 – 1 – – – – – – – –
fibula › talus – 2 – 1 – 3 – 1 – 3 – – – – – – – – – –
talus › fibula – 2 – 3 – – – 1 – 9 – – – – – 1 – – – 1
talus › calcaneus – 1 1 2 – – – 1 – 9 – – – – – 1 – – 1 –
talus › navicular – 1 1 – – – – 1 – 8 – – – – – 1 – – – –
calcaneus › talus – 2 1 2 – – – 4 – 6 – 3 – – – – – – – 1
calcaneus › navicular – 1 1 2 – – – 3 – 5 – 3 – – – – – – – –
tarsals › tarsals – – 9 5 4 7 – – 4 20 – 2 – – – 3 – 3 – –
tarsals › metatarsals – – – 3 1 1 – – 3 3 – 1 – – – – – 1 – –
metatarsals › tarsals – – – 5 1 1 – 1 3 5 – 1 – – – – – – – –
metatarsals › toes – – – – – 1 – – – 2 – – – – – – – – – –
toes proximal – – – – – – – – – 1 – – – – – – – – – –
toes distal – – – – – – – – – 1 – – – – – – – – – –
Table 15 (continued). Articulations.
Articulation
MTW1 65
MTW1 66
MTW1 others
MTW4 64
MTW4 65
MT dump
MT section
MTW 2+3
EMSEM
others
+ – + – + – + – + – + – + – + – + – + –
tibia › femur 1 2 1 1 – – – 2 3 5 – 5 4 – – 1 3 – – 2
tibia › fibula 2 – 2 2 – – – 2 5 5 – 1 1 3 – 1 3 – – 1
tibia › talus – 1 1 2 – – – 1 3 3 – 1 1 – – 1 2 – – 2
fibula › tibia 1 – 2 – – – – 1 5 6 – – 1 – – – 3 – – 2
fibula › talus – 1 1 – – – – – 3 3 – – 1 – – 1 2 – – 1
talus › fibula – 1 1 2 – – – 1 3 2 – 3 1 – – 1 2 – – 4
talus › calcaneus – 1 2 1 – – – – 3 2 – 3 1 – – 1 2 – 1 3
talus › navicular – – 2 – – – – – 2 3 – 3 1 – – 1 2 – – 3
calcaneus › talus – – 2 1 – – – – 3 1 – 2 1 – – 1 2 – 1 1
calcaneus › navicular – – 1 2 1 – – – 2 1 – 1 1 – – 1 2 – – –
tarsals › tarsals – – 14 2 1 4 – – 15 5 – 5 2 1 – – 15 1 – –
tarsals › metatarsals – – 3 3 – 1 – – 2 2 – 1 – – – – 4 – – –
metatarsals › tarsals – – 1 – – 1 – – 6 6 – 7 – – – 1 5 1 – –
metatarsals › toes – – 2 1 – – – – – 4 – 5 – – 1 – 6 – – –
toes proximal – – 2 – – – – – – 1 – – – – 1 1 14 2 – 2
toes distal – – – 2 – – – – – 1 – – – – – 2 8 6 – 2

127
Table 16. Articulation percent frequency.
Id Sample Skull Axial Shoulder Arm Forearm Hand Pelvis Thigh Leg Foot
1 EM loc. 6(1) 0.0 22.2 0.0 0.0 0.0 0.0 0.0 0.0 0.0 0.0
2 EM loc. 6(2) 21.1 23.3 0.0 0.0 0.0 0.0 4.8 0.0 0.0 37.1
3 EM loc. 6(3) 0.0 2.2 0.0 0.0 0.0 – 6.3 0.0 0.0 37.5
4 EM loc. 6(4) 14.3 36.7 0.0 0.0 0.0 0.0 33.3 0.0 0.0 0.0
5 EM loc. 6(5) 7.1 17.6 0.0 0.0 0.0 0.0 2.3 0.0 5.9 12.7
6 EM loc. 6(6) 14.8 22.4 0.0 0.0 11.8 0.0 16.7 5.9 0.0 0.0
7 EM loc. 6(7) 29.4 48.2 0.0 0.0 0.0 – 10.5 0.0 0.0 –
8 EM loc. 6(8) 40.0 38.4 0.0 – 0.0 – 30.8 0.0 0.0 0.0
9 EM loc. 25 70.4 54.5 – – 50.0 70.8 77.8 0.0 – 0.0
10 EM loc. 29 0.0 19.5 0.0 0.0 0.0 – 0.0 0.0 0.0 33.3
11 MTW1 loc. 65 72.2 53.3 0.0 54.5 0.0 – 0.0 62.5 50.0 0.0
12 MTW1 loc. 66 57.9 53.9 46.2 33.3 83.3 82.5 28.6 40.0 58.3 68.2
13 MTW1 others 0.0 34.6 0.0 – 0.0 – 16.7 12.5 – 25.0
14 MTW4 loc. 64 0.0 25.0 0.0 0.0 0.0 – 0.0 0.0 0.0 0.0
15 MTW4 loc. 65 51.7 58.5 30.0 37.5 65.5 27.6 63.4 30.6 46.3 56.3
16 MT dump 0.0 18.8 0.0 0.0 0.0 0.0 3.3 0.0 0.0 0.0
17 MT section 57.9 67.3 0.0 0.0 50.0 0.0 33.3 60.0 72.7 87.5
18 MTW 2+3 44.4 28.9 100.0 100.0 45.5 0.0 14.3 20.0 0.0 18.2
19 EMS 0.0 84.9 75.0 57.1 47.4 50.0 90.0 53.8 100.0 86.1
20 EM others 0.0 41.2 62.5 45.5 61.5 85.3 – 0.0 0.0 11.8
Table 17. Cluster analysis of articulation data.
Cluster Members More articulations in: Less articulations in:1a EM loc. 6(1), EM loc. 6(5), MTW4 loc. 64,
MT dump + completely disarticulatednone all parts of the skeleton
1b EM loc. 6(2), EM loc. 6(3), EM loc. 29, MTW1 others
foot other parts of the skeleton
1c EM loc. 6(4), EM loc. 6(6), EM loc. 6(7),EM loc. 6(8)
skull, axial, pelvis limbs
2 EM loc. 25, MTW2+3, EM others shoulder, arm thigh, leg, foot
3 MTW1 loc. 65, MTW1 loc. 66,MTW4 loc. 65, MT section
skull, axial, thigh, leg, foot
variable
4 EMS + completely articulated axial skeleton & limbs skull
Table 18. Articulation frequency in age categories (selected joints).
ArticulationAdults Subadults
χ2 p+ – + –
femur › pelvis 15 71 5 17 0.324 0.57
femur › tibia 7 51 6 16 2.709 0.10
thoracic vertebrae 119 169 58 86 0.043 0.84
lumbar vertebrae 61 96 29 43 0.042 0.84

128
Table 19. Human bone tools, possible tools and pseudotools from Tell Majnuna.
No Trench Locus Layer Id Bone Area Side Age Sex Length
1 EM 6=53 3.1 N.1 fem 2/5 L? 7-14 – 6
2 EM 6=53 3.2 10 fem 1/2 ? ? ? 9
3 EM 6=53 3.3 7 fem 1/3 L adult ? 18+5
4 EM 6=53 4.2 16+N.1 fem 1/2 ? adult M?? 18
5 EM 6=53 4.3 10 fem 1/2 ? ? ? 9+4
6 EM 6=53 4.3 16 fem ? ? ? ? ?
7 EM 6=53 4.4 N.9 fem 1/2 L 14-21 ? 14
8 EM 6=53 5.4 4 fem 1/2 ? adult M?? 10
9 EM 6=53 5.4 9 fem 3/5 L 14-21 ? 12
10 EM 6=53 5.4 34 fem 1/3 R ? ? 11
11 EM 6=53 5.4 41 hum 1/2 L 14-21 ? 26
12 EM 6=53 5.4 N.14 fem 1/4 R adult ? 12
13 EM 6=53 5.4 N.21 fem 1/3 L? ? ? 11
14 EM 6=53 5.4 N.22 fem 1/3 R ? ? 11
15 EM 6=53 5.5 1 hum 1/3 L? ? ? 10
16 EM 6=53 5.5 2 tib 1/2 ? adult ? 14
17 EM 6=53 5.5 7a hum 2/3 L adult F?? 23
18 EM 6=53 5.5 N.9 fem ? ? ? ? 4.5
19 EM 6=53 5.5 N.40 fib 1/2 L? adult ? 8
20 EM 6=53 5.6 3 fib 4/5 L adult ? 7
21 EM 6=53 5.6 19.3 tib 1/2 ? ? ? 7
22 EM 6=53 5.6 34 fib 1/2 ? adult ? 12
23 EM 6=53 5.7 6 uln 1/2 L adult ? 21
24 EM 6=53 5.7 7 fem 1/2 R adult ? 21
25 EM 6=53 5.7 9 rad 1/4 R? adult ? 7+5
26 EM 6=53 5.7 12 fem 1/2 ? adult M 13.5
27 EM 6=53 5.7 15 fem 3/4 ? 7-14 – 14
28 EM 6=53 5.7 17 hum 1/2 R 14-21 ? 12
29 EM 6=53 5.7 37 hum 3/4 L 7-14 – 20
30 EM 6=53 6.1 2 fem 1/4 ? adult F?? 9+8
31 EM 6=53 6.1 32 hum 1/2 ? 7-14 – 5+4
32 EM 6=53 6.2 11 tib 3/4 ? adult M 11
33 EM 6=53 6.2 48 fem 1/2 R adult F?? 18.5
34 EM 6=53 6.2 64 uln 1/3 L adult ? 13
35 EM 6=53 6.2 71 fem 1/3 R 7-14 – 8+4
36 EM 6=53 7.1 26 tib 1/2 L adult ? 16+5
37 EM 6=53 7.2 43a fem 1/2 L 7-14 – 13+4
38 EM 29 1 N.26 fem 1/3 R adult F ?
39 EM 50 C.2 tib 1/3 ? adult ? 13
40 MTW4 65 1 20 tib 1/3 ? adult ? 12
41 MTW4 65 1 77 fem 2/3 R adult ? 18+7
42 MTW4 65 A.10 uln 1/2 L 7-14 – ?
Length in centimetres. Area defined from proximal to distal end (e.g. 1/2 = midshaft, 3/4 = half distance between midshaft and distal end).

129
Table 19 (continued). Human bone tools, possible tools and pseudotools from Tell Majnuna.
NoC
ircu
m-
fere
nce
Com
plet
e
Frac
ture
s
Poin
ted
end
Wor
king
Shap
e
Chi
pped
back
Polis
hed
hand
le
Taph
ono-
mic
eff
ects
Mid
shaf
tci
rcum
fer.
1 1.0 * recent ? ? ? ** * 59.0
2 0.5 ** old ? ? ? ? * S
3 1.0 ** recent ** – V – – 80.0
4 0.5 *** old *** *** D ** ***
5 ? * recent * ? V ? *
6 ? * recent *** *** D ? **
7 1.0 *** – *** *** V *** *** 69.5
8 0.2 ** recent *** *** D ** *
9 1.0 *** – *** ** V ** * P
10 1.0 *** – ** – U – *
11 1.0 *** old – * T ? – CT+P
12 1.0 ** recent ? ? ? ? *
13 1.0 *** old ** – V * ** 71.0
14 0.5 ** old ** – V – **
15 0.5 ** recent *** ** V – –
16 1.0 ** old *** ** U ? **
17 1.0 *** old – – T – ** E+S
18 ? * recent ? ? ? ? *
19 1.0 *** recent * – U * **
20 1.0 ** recent ? ? ? ? ** RT+CT
21 0.5 ** recent *** ** U ? –
22 1.0 *** – ** – V * – W
23 1.0 *** old * * ? – ** CT
24 1.0 *** old – – – – *** CT 82.0
25 1.0 ** recent – – – – **
26 1.0 ** old *** *** V ? * 99.0
27 1.0 ** old ** * U – ** S 51.5
28 1.0 *** old – – – – *** P
29 1.0 *** old – – – – *** E
30 1.0 ** recent ? ? ? *** *** S 79.0
31 0.5 * recent ? ? ? ? **
32 0.7 ** old *** *** U ? **
33 1.0 ** recent ? ? ? *** *** RT 79.0
34 1.0 ** recent ? ? ? ? *
35 1.0 ** recent * ? U ? – 68.0
36 1.0 ** recent *** ** U ? ***
37 1.0 ** old ? ? ? ? *
38 1.0 ** recent *** * U ? – CT 71.0
39 1.0 ** recent ***? **? VV ? – W
40 0.5 ** old – – – – *
41 1.0 *** old – – – – * 85.0
42 1.0 ** old – – – – * CT
Completeness: * – fragment only, ** – broken, *** – complete.Production features (pointed end, working, chipped back, polished handle): * – slight, ** – medium, *** – strong. Taphonomic effects: P – shallow punctures, CT – carnivore tooth mark, S – scoring, RT – rodent tooth mark,E – root etching, W – weathering. Midshaft circumference in millimetres.

130
Table 20. Cranial fragments with polished or scratched surface.
No Trench Locus Layer Id Compl. Area Polish Scratch. Age Sex
1 EM 6=53 1 12 10% Pa – ** adult ?
2 EM 6=53 1 C1 4% Oc – ** adult ?
3 EM 6=53 3.1 34.1 6% Pa – * 7–21 –
4 EM 6=53 4.3 N.4 1% Fr – * ? ?
5 EM 6=53 5.3 15 35% FrOc *** *** adult M???
6 EM 6=53 5.3 X.1 3% Fr * – adult ?
7 EM 6=53 5.5 32 36% Fr * * 14–21 F??
8 EM 6=53 5.6 2 28% Pa * – 15 –
9 EM 6=53 5.6 23 29% Pa * – 14–21 F??
10 EM 6=53 5.6 32 23% Pa * * adult F?
11 EM 6=53 5.7 16 1% Pa * – 7–14 –
12 EM 6=53 6.2 55 47% PaFr ** – adult ?
13 EM 6=53 6.2 62 30% Zyg * – adult ?
14 EM 6=53 7.2 36a 30% PaFr * – 15 –
15 EM 6=53 7.2 42 54% PaFr * – 7 –
16 EM 29 1 22 3% Fr – *** adult ?
17 MTW4 65 1 90 65% Oc * – 18–21 F??
Table 21. Sex estimation (pelvis).
ContextVentral Arc Subpub.
Conc.Ischiopubic
Ramus Ridge Sciatic Notch Preauricular Sulcus
F ? M F M F ? M 1 2 3 4 5 1 2 3 4 0
EM 6 2 – 1 1 1 1 – 1 4 1 3 2 3 2 5 2 7 6
MTW 2 1 3 1 4 – 1 6 4 2 2 4 9 3 2 – 6 17
Others – 2 – – 1 – – 1 1 – – 1 1 1 – 1 1 –
Total 4 3 4 2 6 1 1 8 9 3 5 7 12 6 7 3 14 23
Table 21 (continued). Sex estimation (cranium).
ContextNuchal Crest Mastoid Process (left) Mastoid Process (right)
1 2 3 4 5 1 2 3 4 5 1 2 3 4 5
EM 6 5 8 7 3 1 8 6 9 7 2 4 7 8 6 3
MTW 9 8 2 1 1 5 6 6 5 4 4 5 4 6 1
Others 1 2 – 3 1 2 – 3 3 1 – 2 4 3 2
Total 15 18 9 7 3 15 12 18 15 7 8 14 16 15 6
Table 21 (continued). Sex estimation (frontal bone).
ContextGlabella Supraorbital Ridge (left) Supraorbital Ridge (right)
1 2 3 4 5 1 2 3 4 5 1 2 3 4 5
EM 6 9 6 9 7 3 10 13 8 2 – 12 9 10 4 –
MTW 2 9 8 5 3 6 14 4 2 – 6 10 7 1 –
Others – 2 3 1 3 1 3 4 2 2 2 5 – 2 2
Total 11 17 20 13 9 17 30 16 6 2 20 24 17 7 2

131
ContextMental Eminence
1 2 3 4 5EM 6 4 6 6 4 5
MTW 2 8 5 3 4
Others 1 2 2 1 1
Total 7 16 13 8 10
Table 21 (continued). Sex estimation (mental eminence).
Table 22. Sexual dimorphism in selected bone measurements, data from various North Mesopotamian sites.
MeasurementFemales Males t-test Discriminant
function
mean s.d. N mean s.d. N t p λ corr.
humerus – epicondylar breadth 56.34 2.56 38 63.26 3.90 23 7.58 0.000 0.46 89%
humerus – vertical head diameter 40.73 2.31 33 44.77 2.68 26 6.10 0.000 0.60 78%
ulna – anterior-posterior diameter 15.36 1.45 29 17.85 1.06 20 6.92 0.000 0.52 86%
ulna – medial-lateral diameter 11.88 1.01 28 14.30 1.39 20 6.64 0.000 0.48 88%
femur – epicondylar breadth 71.57 3.46 14 80.05 2.97 10 6.43 0.000 0.36 92%
femur – head diameter 41.37 1.92 45 46.89 2.44 26 9.88 0.000 0.38 89%
femur – ant.-post. subtr. diameter 23.89 1.67 32 26.82 1.59 22 6.50 0.000 0.56 81%
femur – med.-lat. subtr. diameter 30.88 2.15 32 34.52 3.10 22 4.78 0.000 0.67 72%
femur – ant.-post. midshaft d. 26.01 1.95 37 30.74 2.46 29 8.47 0.000 0.46 85%
femur – med.-lat. midshaft d. 26.04 2.19 37 28.31 2.15 29 4.22 0.000 0.78 76%
femur – midshaft circumference 82.74 5.32 36 93.88 5.78 29 8.00 0.000 0.49 85%
tibia – ant.-post. shaft diameter 30.30 2.42 28 35.97 2.37 18 7.84 0.000 0.42 87%
tibia – med.-lat. shaft diameter 21.59 1.78 27 24.22 2.34 18 4.05 0.000 0.70 73%
tibia – shaft circumference 84.10 5.45 24 97.79 6.04 17 7.44 0.000 0.40 88%
patella – height 37.47 2.27 33 41.98 2.98 32 6.86 0.000 0.57 80%
patella – breadth 39.38 2.13 29 45.05 3.07 30 8.26 0.000 0.46 85%
talus – maximum length 47.40 2.43 15 53.46 2.65 12 6.12 0.000 0.40 89%
talus – articular surface 31.17 1.46 15 36.55 1.60 11 8.77 0.000 0.23 96%
axis – total height 35.31 2.61 29 38.21 3.02 24 3.70 0.000 0.78 68%
mandible – body height 30.38 3.28 36 32.29 3.05 29 2.44 0.018 0.91 69%
mandible – body breadth 11.53 1.60 36 12.68 1.37 34 3.23 0.002 0.87 61%
mandible – min. ramus breadth 32.43 2.94 28 34.04 2.51 26 2.17 0.035 0.92 61%
mandible – max. ramus breadth 44.80 4.48 28 47.00 3.06 14 1.86 0.070 0.94 67%
mandible – ramus angle 123.2 5.83 23 116.8 6.38 18 -3.32 0.002 0.78 68%
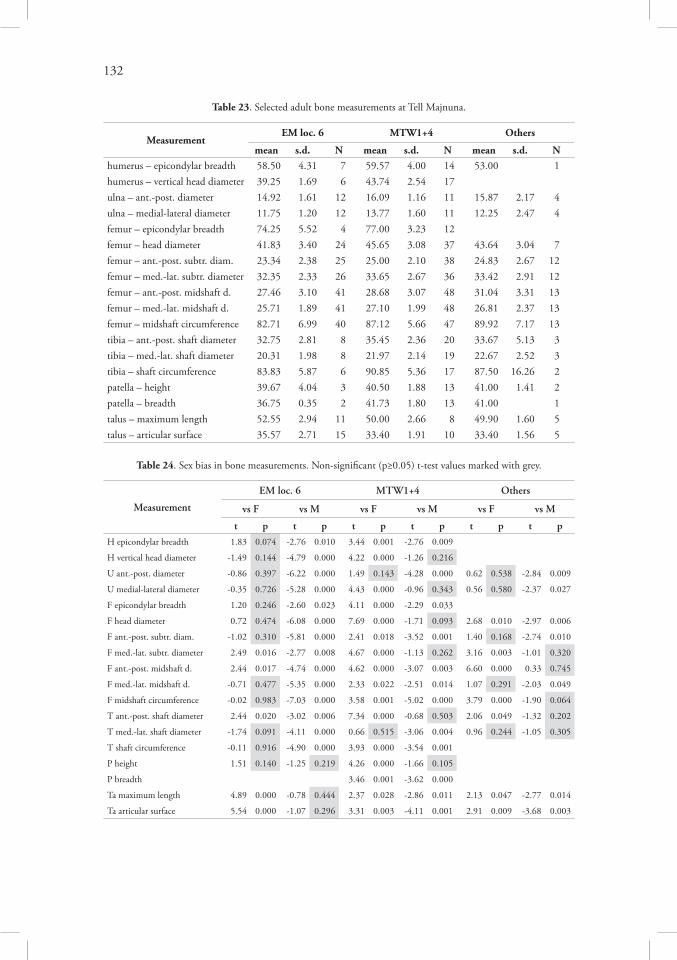
132
Table 23. Selected adult bone measurements at Tell Majnuna.
MeasurementEM loc. 6 MTW1+4 Others
mean s.d. N mean s.d. N mean s.d. Nhumerus – epicondylar breadth 58.50 4.31 7 59.57 4.00 14 53.00 1
humerus – vertical head diameter 39.25 1.69 6 43.74 2.54 17
ulna – ant.-post. diameter 14.92 1.61 12 16.09 1.16 11 15.87 2.17 4
ulna – medial-lateral diameter 11.75 1.20 12 13.77 1.60 11 12.25 2.47 4
femur – epicondylar breadth 74.25 5.52 4 77.00 3.23 12
femur – head diameter 41.83 3.40 24 45.65 3.08 37 43.64 3.04 7
femur – ant.-post. subtr. diam. 23.34 2.38 25 25.00 2.10 38 24.83 2.67 12
femur – med.-lat. subtr. diameter 32.35 2.33 26 33.65 2.67 36 33.42 2.91 12
femur – ant.-post. midshaft d. 27.46 3.10 41 28.68 3.07 48 31.04 3.31 13
femur – med.-lat. midshaft d. 25.71 1.89 41 27.10 1.99 48 26.81 2.37 13
femur – midshaft circumference 82.71 6.99 40 87.12 5.66 47 89.92 7.17 13
tibia – ant.-post. shaft diameter 32.75 2.81 8 35.45 2.36 20 33.67 5.13 3
tibia – med.-lat. shaft diameter 20.31 1.98 8 21.97 2.14 19 22.67 2.52 3
tibia – shaft circumference 83.83 5.87 6 90.85 5.36 17 87.50 16.26 2
patella – height 39.67 4.04 3 40.50 1.88 13 41.00 1.41 2
patella – breadth 36.75 0.35 2 41.73 1.80 13 41.00 1
talus – maximum length 52.55 2.94 11 50.00 2.66 8 49.90 1.60 5
talus – articular surface 35.57 2.71 15 33.40 1.91 10 33.40 1.56 5
Table 24. Sex bias in bone measurements. Non-significant (p≥0.05) t-test values marked with grey.
Measurement
EM loc. 6 MTW1+4 Others
vs F vs M vs F vs M vs F vs M
t p t p t p t p t p t pH epicondylar breadth 1.83 0.074 -2.76 0.010 3.44 0.001 -2.76 0.009
H vertical head diameter -1.49 0.144 -4.79 0.000 4.22 0.000 -1.26 0.216
U ant.-post. diameter -0.86 0.397 -6.22 0.000 1.49 0.143 -4.28 0.000 0.62 0.538 -2.84 0.009
U medial-lateral diameter -0.35 0.726 -5.28 0.000 4.43 0.000 -0.96 0.343 0.56 0.580 -2.37 0.027
F epicondylar breadth 1.20 0.246 -2.60 0.023 4.11 0.000 -2.29 0.033
F head diameter 0.72 0.474 -6.08 0.000 7.69 0.000 -1.71 0.093 2.68 0.010 -2.97 0.006
F ant.-post. subtr. diam. -1.02 0.310 -5.81 0.000 2.41 0.018 -3.52 0.001 1.40 0.168 -2.74 0.010
F med.-lat. subtr. diameter 2.49 0.016 -2.77 0.008 4.67 0.000 -1.13 0.262 3.16 0.003 -1.01 0.320
F ant.-post. midshaft d. 2.44 0.017 -4.74 0.000 4.62 0.000 -3.07 0.003 6.60 0.000 0.33 0.745
F med.-lat. midshaft d. -0.71 0.477 -5.35 0.000 2.33 0.022 -2.51 0.014 1.07 0.291 -2.03 0.049
F midshaft circumference -0.02 0.983 -7.03 0.000 3.58 0.001 -5.02 0.000 3.79 0.000 -1.90 0.064
T ant.-post. shaft diameter 2.44 0.020 -3.02 0.006 7.34 0.000 -0.68 0.503 2.06 0.049 -1.32 0.202
T med.-lat. shaft diameter -1.74 0.091 -4.11 0.000 0.66 0.515 -3.06 0.004 0.96 0.244 -1.05 0.305
T shaft circumference -0.11 0.916 -4.90 0.000 3.93 0.000 -3.54 0.001
P height 1.51 0.140 -1.25 0.219 4.26 0.000 -1.66 0.105
P breadth 3.46 0.001 -3.62 0.000
Ta maximum length 4.89 0.000 -0.78 0.444 2.37 0.028 -2.86 0.011 2.13 0.047 -2.77 0.014
Ta articular surface 5.54 0.000 -1.07 0.296 3.31 0.003 -4.11 0.001 2.91 0.009 -3.68 0.003

133
Table 25. General age categories in all contexts at Tell Majnuna.JI – Juvenility Index, A/C – attritional or catastrophic mortality profile.
Context 0–6 7–14 15–20 Adults JI P-ratio A/C
EM others 2 26 5 110 0.24 0.22 C?
EM loc. 6(1) 1 17 18 80 0.21 0.30 C?
EM loc. 6(2) 3 24 15 100 0.24 0.28 C?
EM loc. 6(3) 5 39 10 111 0.35 0.31 C
EM loc. 6(4) 8 29 13 78 0.37 0.35 C
EM loc. 6(5) 8 81 48 227 0.36 0.36 C
EM loc. 6(6) 1 27 15 89 0.30 0.32 C
EM loc. 6(7) 0 24 14 63 0.38 0.38 C
EM loc. 6(8) 0 10 8 26 0.38 0.41 C
EM loc. 25 0 0 3 26 0.00 0.10 A
EM loc. 29 1 20 8 40 0.50 0.41 C
EMS 1 7 5 20 0.35 0.38 C
MT section 4 15 11 104 0.14 0.20 A
MT dump 1 5 7 288 0.02 0.04 A
MTW1 others 0 4 4 31 0.13 0.21 A
MTW1 loc. 65 0 8 6 54 0.15 0.21 A
MTW1 loc. 66 1 2 4 44 0.05 0.12 A
MTW2+3 1 4 5 48 0.08 0.16 A
MTW4 loc. 64 0 1 1 23 0.04 0.08 A
MTW4 loc. 65 3 17 8 182 0.09 0.12 A
Attritional 45.48 4.72 2.50 47.30 0.10 0.13
Catastrophic 17.58 18.67 8.75 54.99 0.34 0.33
Table 26. Epiphyseal union (test for difference between EM loc. 6 and MTW1+4).
EpiphysisEM loc. 6 MTW1+4 Others Difference
– + – + – + χ2 p
Clavicle medial 6 9 3 8 1 1 – –
Clavicle lateral – 9 – 11 2 1 – –
Humerus proximal 11 11 5 19 3 – 4.31 0.038
Humerus distal 11 22 5 26 1 6 2.52 0.112
Ulna poximal 2 11 2 4 2 4 – –
Ulna distal 3 5 – 2 3 3 – –
Radius proximal 4 14 2 7 4 – – –
Radius distal 3 5 3 4 3 1 – –
Pelvis (union) 26 33 5 41 4 5 13.69 0.0002
Pelvis (crest) 27 18 3 23 3 7 15.86 0.0002
Femur head 29 32 5 44 5 10 17.74 0.00003
Femur gr. trochanter 21 15 5 19 4 5 8.25 0.004
Femur less. troch. 18 24 3 32 4 6 7.75 0.006
Femur distal 19 29 5 26 5 5 4.90 0.027
Tibia proximal 17 18 8 19 4 2 2.27 0.132
Tibia distal 8 12 3 9 2 5 – –
Fibula proximal 5 9 1 6 3 2 – –
Fibula distal 2 4 1 7 3 – – –

134
Table 27. Germ formation in the permanent maxillary teeth(test for difference between EM loc. 6 and MTW1+4).
ContextM3 M2 M1 P2 P1 C I2 I1
4-13 14 4-13 14 4-13 14 4-13 14 4-13 14 4-13 14 4-13 14 4-13 14
EM loc. 6 22 22 18 41 13 57 8 39 9 42 11 29 7 17 4 19
MTW1+4 11 25 4 42 7 46 7 45 8 43 9 44 8 27 8 25
Others 5 18 2 25 3 19 2 19 2 23 2 21 2 15 2 14
χ2 3.09 7.43 0.64
p 0.08 0.007 0.42
Table 28. Cranial suture obliteration (test for difference between EM loc. 6 and MTW1+4).
SutureEM locus 6 MTW1 + 4 Others Difference
0 1 2 3 0 1 2 3 0 1 2 3 χ2 p
midlamboid 16 12 2 1 10 10 3 – 4 4 2 1 0.39 0.82
lambda 8 8 1 – 7 5 2 – 2 2 – – 0.81 0.67
obelion 4 3 1 – 5 7 9 7 – 1 2 1 5.55 0.06
sagittal 20 12 3 1 9 12 5 4 4 2 3 – 5.60 0.06
bregma 4 3 2 – 8 9 1 – 1 – 1 – 1.88 0.39
midcoronal 15 7 3 2 11 9 – 2 – 3 1 – 1.66 0.43
pterion – – – – 4 2 1 – – – – – – –
sph.-frontal 1 – – – 4 5 – – – – – – – –
inf. sph.-t. 4 – – – 11 – – – 1 2 – – – –
sup. sph.-t. 2 – – – 8 3 – – – – – – – –
incisive – 6 7 22 1 2 9 18 – – 3 4 1.27 0.53
ant. palat. 3 – – – 4 3 2 – – 1 1 – – –
post. palat. 2 – – – 3 2 1 – – 1 – 1 – –
trans. palat. 2 – 2 – 2 4 2 – – 1 – 1 – –
int. sagit. 3 – 1 2 2 2 2 1 – 1 – 3 – –
int. lambd. 2 – – 1 3 1 – 2 – – – 2 – –
int. coron. 2 – 1 2 1 2 – 1 – 1 1 2 – –

135
Table 29. Dental wear in Tell Majnuna subsamples and in Tell Barri, Area G. M – median, Q – quartiles.To
oth EM loc. 6 MTW1+4 Others Tell Barri G
N Q25 M Q75 N Q25 M Q75 N Q25 M Q75 N Q25 M Q75
RM3 18 1.0 1.5 2.5 17 1.5 2.0 3.5 11 2.0 2.5 3.0 15 1.0 2.0 3.5
RM2 30 2.0 2.5 4.5 21 2.5 4.5 6.5 13 3.5 4.0 4.5 20 2.0 4.3 4.7
RM1 39 3.0 4.5 5.5 21 3.5 5.0 7.5 14 4.5 5.5 7.0 22 3.0 5.3 8.5
RP2 23 1.5 3.0 5.0 22 3.0 4.7 5.0 9 3.0 4.0 4.0 14 2.0 2.3 5.0
RP1 25 1.5 2.0 5.0 22 2.0 3.5 5.0 10 2.0 3.5 4.0 19 1.5 3.0 6.0
RC 13 2.0 2.0 4.0 20 2.0 3.7 5.0 11 3.0 4.0 4.5 18 2.0 3.3 5.0
RI2 10 1.0 2.3 4.0 12 1.7 2.7 5.0 10 2.0 3.5 4.0 17 2.0 2.5 5.0
RI1 8 3.0 4.0 4.3 13 3.0 5.0 7.0 9 3.0 4.0 4.0 19 2.5 3.0 5.5
LI1 7 2.0 4.0 5.0 11 3.0 4.0 5.0 7 2.0 4.0 5.0 20 2.5 3.7 6.0
LI2 6 1.0 2.0 3.0 12 2.7 3.0 5.0 7 2.0 4.0 4.0 22 2.0 5.3 7.0
LC 16 2.0 4.0 5.0 22 3.0 4.0 5.0 12 2.0 3.7 4.0 20 3.0 4.3 6.5
LP1 21 1.5 2.0 3.0 22 2.5 4.0 5.0 12 2.3 3.3 4.5 22 2.0 3.0 6.0
LP2 20 1.3 2.5 4.3 23 3.0 5.0 5.0 10 3.0 4.0 4.5 19 2.0 3.5 6.0
LM1 36 3.5 4.5 5.3 30 4.0 5.0 7.0 14 4.0 5.5 7.0 22 3.5 4.5 7.5
LM2 26 2.0 2.5 4.0 21 2.5 4.5 5.0 12 2.3 4.0 4.5 21 2.0 3.5 4.5
LM3 15 1.5 2.5 4.0 13 1.5 2.0 3.5 8 1.7 2.3 2.7 15 1.0 2.5 4.0
LM3
16 1.7 2.5 3.0 13 1.5 2.0 3.5 5 1.5 2.0 2.5 13 3.5 4.0 4.0
LM2
18 2.0 3.5 4.5 20 3.5 4.3 5.0 7 3.0 4.5 4.5 24 2.0 3.7 5.0
LM1
25 3.0 4.5 5.5 18 4.5 5.3 7.0 8 2.7 4.7 5.0 27 4.0 5.5 7.5
LP2
10 2.0 2.7 4.0 15 2.0 4.0 4.5 6 2.5 3.3 3.5 23 2.0 3.5 4.0
LP1
6 3.0 3.0 4.0 17 3.0 4.0 4.0 6 2.5 3.0 3.5 24 2.0 3.0 4.5
LC 5 3.0 4.0 4.0 12 2.7 4.0 4.5 5 3.0 4.0 4.5 25 2.0 3.5 5.0
LI2
2 2.0 2.3 2.5 9 3.0 4.0 5.0 6 2.0 4.0 4.0 22 2.5 4.5 6.0
LI1
3 2.0 3.0 5.0 8 3.3 4.7 5.5 4 2.5 3.7 4.7 20 2.7 4.0 5.3
RI1
5 3.0 5.0 5.0 11 3.0 5.0 6.0 5 3.0 4.5 5.0 21 3.0 4.0 5.5
RI2
4 2.3 2.5 3.7 12 3.0 4.0 5.0 6 2.0 3.3 4.0 23 2.0 3.0 5.5
RC 6 3.0 3.5 4.5 13 3.5 4.0 4.5 2 2.0 3.0 4.0 25 2.5 4.0 5.0
RP1
5 1.0 2.0 3.0 12 2.3 3.5 4.5 3 1.5 3.0 4.0 27 2.0 3.0 4.5
RP2
5 2.0 2.5 2.5 13 2.0 3.0 4.5 5 3.0 3.5 4.0 23 2.0 3.0 4.5
RM1
23 3.5 4.5 6.0 15 4.5 5.5 7.0 6 4.0 5.3 5.5 25 4.5 5.0 7.5
RM2
20 2.0 3.3 4.5 14 3.5 4.0 5.0 5 3.5 4.0 4.5 27 2.0 4.0 5.0
RM3
8 1.5 2.7 3.7 10 2.0 2.0 4.0 2 2.0 2.7 3.5 14 2.0 4.0 4.5

136
Table 30. Mann-Whitney U-test for dental wear in Tell Majnuna subsamples and Tell Barri, Area G.
ToothEM vs MTW EM vs Oth EM vs Barri MTW vs Oth MTW vs Barri Oth vs Barri
Z p Z p Z p Z p Z p Z p
RM3 1.62 – 2.20 0.028 0.43 – 0.77 – -0.79 – -0.99 –
RM2 2.07 0.039 1.75 0.080 0.79 – -0.27 – -1.07 – -0.59 –
RM1 1.40 – 2.00 0.046 1.59 – 0.27 – 0.34 – 0.16 –
RP2 2.23 0.026 0.80 – 0.19 – -1.65 0.098 -1.33 – -0.63 –
RP1 1.10 – 0.70 – 0.67 – -0.41 – -0.21 – 0.14 –
RC 1.33 – 1.16 – 1.04 – -0.29 – 0.06 – -0.05 –
RI2 0.63 – 0.57 – 0.78 – 0.07 – 0.15 – -0.08 –
RI1 1.05 – 0.19 – -0.19 – -0.93 – -1.19 – -0.42 –
LI1 0.00 – -0.57 – 0.61 – -0.77 – 0.50 – 1.16 –
LI2 1.78 0.075 1.07 – 1.99 0.047 -0.30 – 0.65 – 1.15 –
LC 0.61 – -1.02 – 1.26 – -1.69 0.090 0.88 – 1.75 0.080
LP1 2.19 0.029 1.40 – 1.53 – -0.59 – -0.32 – 0.22 –
LP2 2.61 0.009 1.50 – 1.45 – -1.06 – -0.72 – 0.11 –
LM1 1.58 – 1.70 0.090 0.94 – 0.16 – -0.20 – -0.24 –
LM2 1.88 0.060 1.08 – 0.14 – -0.73 – -1.28 – -0.58 –
LM3 -0.28 – -0.87 – -0.35 – -0.25 – -0.25 – 0.39 –
LM3
-0.18 – -0.87 – 2.10 0.035 -0.54 – 2.00 0.046 1.87 0.061
LM2
2.10 0.035 1.42 – 0.72 – -0.30 – -1.36 – -0.61 –
LM1
2.10 0.035 -0.11 – 1.57 – -1.75 0.080 -0.54 – 1.49 –
LP2
0.83 – 0.05 – 0.55 – -0.74 – -0.45 – 0.43 –
LP1
1.26 – -0.48 – 0.23 – -1.71 0.086 -0.73 – 0.65 –
LC 0.16 – 0.10 – -0.03 – 0.00 – -0.18 – 0.03 –
LI2
1.41 – 1.00 – 1.31 – -0.12 – 0.63 – 0.48 –
LI1
0.92 – 0.18 – 0.68 – -0.85 – -0.51 – 0.43 –
RI1
0.62 – -0.21 – -0.10 – -0.74 – -0.97 – -0.03 –
RI2
1.46 – 0.21 – 0.85 – -1.08 – -0.76 – 0.35 –
RC 0.66 – -0.50 – 0.48 – -1.02 – -0.12 – 0.79 –
RP1
0.90 – 0.60 – 0.93 – -0.58 – -0.12 – 0.45 –
RP2
0.89 – 0.94 – 0.54 – 0.30 – -0.21 – -0.27 –
RM1
1.21 – 0.19 – 1.04 – -0.78 – -0.25 – 0.57 –
RM2
1.49 – 0.10 – 0.76 – -0.69 – -0.74 – 0.36 –
RM3
0.27 – 0.13 – 1.43 – 0.11 – 1.17 – 1.03 –

137
Table 31. Antemortem tooth loss in three Tell Majnuna contexts (affected/observed).
Context M3 M2 M1 P2 P1 Cx I2 I1 I1 I2 Cx P1 P2 M1 M2 M3
EM loc. 6 0/81 2/97 1/109 2/108 2/116 1/110 1/101 0/98 0/52 0/51 0/55 0/53 1/59 1/58 0/56 0/53
MTW1+4 3/57 4/63 3/81 0/77 2/81 2/84 2/72 0/76 1/55 0/44 0/53 1/55 2/54 5/56 3/53 2/39
Others 0/27 0/30 1/34 0/33 0/32 0/34 0/29 0/27 0/19 0/21 0/23 0/18 0/19 0/20 0/17 0/12
Table 32. Dental wear gradients: variance analysis of residuals in the linear regression model.
Site AreaChronol. N
Residuals LSD post-hoc test
mean s.d. 1 2 3 4 5 6 7 8 9 10
1
Tel
l M
ajn
un
a
EM l. 6 28 0.05 0.76 .424 .343 .135 .191 .112 .369 .031 .060 .318
2 EM l. 25 5 -0.37 0.27 .424 .818 .083 .115 .078 .193 .247 .354 .822
3 MTW1+4 21 -0.25 1.00 .343 .818 .039 .048 .025 .155 .104 .178 .990
4 Others 7 0.72 0.48 .135 .083 .039 .729 .891 .736 .005 .010 .035
5 EME 11 0.54 1.09 .191 .115 .048 .729 .812 .956 .006 .013 .043
6
Tel
l B
arri
Bronze A. 11 0.65 1.63 .112 .078 .025 .891 .812 .808 .004 .008 .022
7 N.Assyr. 5 0.51 0.65 .369 .193 .155 .736 .956 .808 .018 .033 .148
8 Achaem. 4 -1.20 0.52 .031 .247 .104 .005 .006 .004 .018 .826 .102
9 Modern 4 -1.03 0.82 .060 .354 .178 .010 .013 .008 .033 .826 .176
10 Gohar T. LBA/IA 24 -0.25 1.38 .318 .822 .990 .035 .043 .022 .148 .102 .176
Table 33. The frequency of dental caries (affected/observed).
Context M3 M2 M1 P2 P1 Cx I2 I1 M3 M2 M1 P2 P1 Cx I2 I1
EM loc. 6 1/41 4/46 2/61 0/37 0/38 0/26 0/13 0/13 3/25 2/33 0/37 0/15 0/9 0/8 0/6 0/7
MTW1+4 0/31 3/40 3/39 1/42 0/38 0/41 0/23 1/22 5/22 4/33 4/30 0/28 0/28 0/25 0/20 0/18
Others 4/19 5/24 1/23 0/18 1/21 0/21 0/16 0/16 0/7 0/11 0/13 0/11 0/8 0/7 0/10 0/7
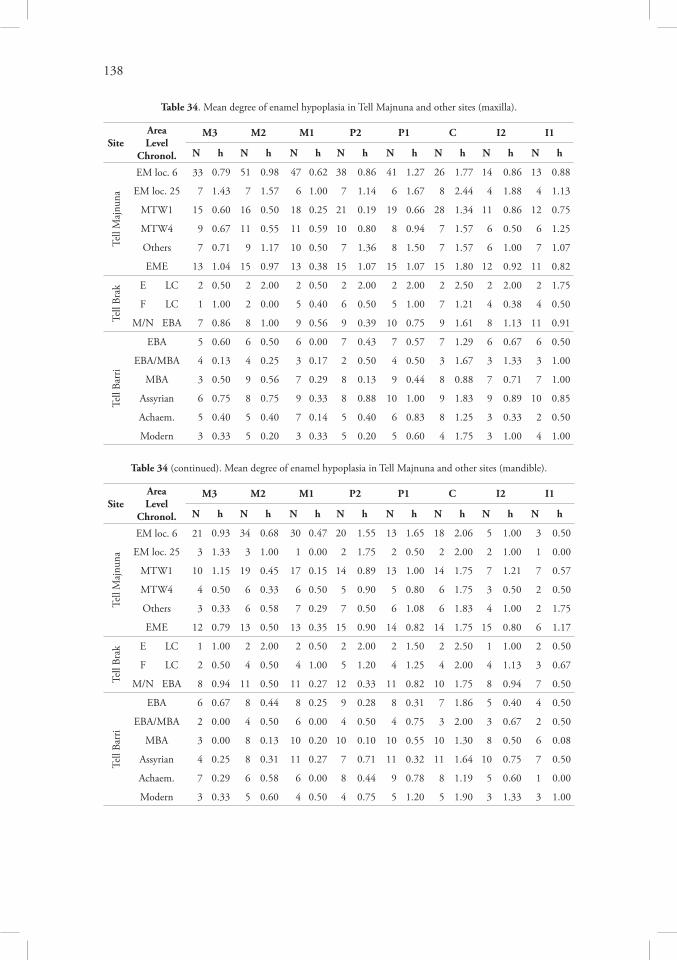
138
Table 34. Mean degree of enamel hypoplasia in Tell Majnuna and other sites (maxilla).
SiteAreaLevel
Chronol.
M3 M2 M1 P2 P1 C I2 I1
N h N h N h N h N h N h N h N h
Tel
l M
ajn
un
a
EM loc. 6 33 0.79 51 0.98 47 0.62 38 0.86 41 1.27 26 1.77 14 0.86 13 0.88
EM loc. 25 7 1.43 7 1.57 6 1.00 7 1.14 6 1.67 8 2.44 4 1.88 4 1.13
MTW1 15 0.60 16 0.50 18 0.25 21 0.19 19 0.66 28 1.34 11 0.86 12 0.75
MTW4 9 0.67 11 0.55 11 0.59 10 0.80 8 0.94 7 1.57 6 0.50 6 1.25
Others 7 0.71 9 1.17 10 0.50 7 1.36 8 1.50 7 1.57 6 1.00 7 1.07
EME 13 1.04 15 0.97 13 0.38 15 1.07 15 1.07 15 1.80 12 0.92 11 0.82
Tel
l B
rak E LC 2 0.50 2 2.00 2 0.50 2 2.00 2 2.00 2 2.50 2 2.00 2 1.75
F LC 1 1.00 2 0.00 5 0.40 6 0.50 5 1.00 7 1.21 4 0.38 4 0.50
M/N EBA 7 0.86 8 1.00 9 0.56 9 0.39 10 0.75 9 1.61 8 1.13 11 0.91
Tel
l B
arri
EBA 5 0.60 6 0.50 6 0.00 7 0.43 7 0.57 7 1.29 6 0.67 6 0.50
EBA/MBA 4 0.13 4 0.25 3 0.17 2 0.50 4 0.50 3 1.67 3 1.33 3 1.00
MBA 3 0.50 9 0.56 7 0.29 8 0.13 9 0.44 8 0.88 7 0.71 7 1.00
Assyrian 6 0.75 8 0.75 9 0.33 8 0.88 10 1.00 9 1.83 9 0.89 10 0.85
Achaem. 5 0.40 5 0.40 7 0.14 5 0.40 6 0.83 8 1.25 3 0.33 2 0.50
Modern 3 0.33 5 0.20 3 0.33 5 0.20 5 0.60 4 1.75 3 1.00 4 1.00
Table 34 (continued). Mean degree of enamel hypoplasia in Tell Majnuna and other sites (mandible).
SiteAreaLevel
Chronol.
M3 M2 M1 P2 P1 C I2 I1
N h N h N h N h N h N h N h N h
Tel
l M
ajn
un
a
EM loc. 6 21 0.93 34 0.68 30 0.47 20 1.55 13 1.65 18 2.06 5 1.00 3 0.50
EM loc. 25 3 1.33 3 1.00 1 0.00 2 1.75 2 0.50 2 2.00 2 1.00 1 0.00
MTW1 10 1.15 19 0.45 17 0.15 14 0.89 13 1.00 14 1.75 7 1.21 7 0.57
MTW4 4 0.50 6 0.33 6 0.50 5 0.90 5 0.80 6 1.75 3 0.50 2 0.50
Others 3 0.33 6 0.58 7 0.29 7 0.50 6 1.08 6 1.83 4 1.00 2 1.75
EME 12 0.79 13 0.50 13 0.35 15 0.90 14 0.82 14 1.75 15 0.80 6 1.17
Tel
l B
rak E LC 1 1.00 2 2.00 2 0.50 2 2.00 2 1.50 2 2.50 1 1.00 2 0.50
F LC 2 0.50 4 0.50 4 1.00 5 1.20 4 1.25 4 2.00 4 1.13 3 0.67
M/N EBA 8 0.94 11 0.50 11 0.27 12 0.33 11 0.82 10 1.75 8 0.94 7 0.50
Tel
l B
arri
EBA 6 0.67 8 0.44 8 0.25 9 0.28 8 0.31 7 1.86 5 0.40 4 0.50
EBA/MBA 2 0.00 4 0.50 6 0.00 4 0.50 4 0.75 3 2.00 3 0.67 2 0.50
MBA 3 0.00 8 0.13 10 0.20 10 0.10 10 0.55 10 1.30 8 0.50 6 0.08
Assyrian 4 0.25 8 0.31 11 0.27 7 0.71 11 0.32 11 1.64 10 0.75 7 0.50
Achaem. 7 0.29 6 0.58 6 0.00 8 0.44 9 0.78 8 1.19 5 0.60 1 0.00
Modern 3 0.33 5 0.60 4 0.50 4 0.75 5 1.20 5 1.90 3 1.33 3 1.00

139
Table 35. Cribra orbitalia and porotic hyperostosis on parietal bone (obl – obliterated).
AreaCO – subadults CO – adults PH – subadults PH – adults
– active obl – active obl – active obl – active obl
EM loc. 6 8 11 4 12 9 15 10 – – 19 2 7
MTW1+4 6 4 – 30 4 9 10 1 1 26 4 2
Others 3 2 – 12 1 4 2 – – 8 1 –
Table 36. Healed cranial injuries.
Area Locus Layer Elem. Bone Side Location Shape Size Sex Age
EM 6(4) 3 31 Front ? small fragment ? ? – 7-14
EM 25 2 3 Front R close to temporal line Y5.5x13.08.0x5.0
? adult
EMS 6 B Pariet L 4cm above lambda Rect 9.0x11.0 ? adult
MT section D 5 Pariet L close to parietal foramen Oval 8.0x9.0 M adult
MT section M 1 Pariet R close to bregma Irreg ? ? adult
MTW1 59.2 4 Front L close to bregma Oval 2.0x3.0 – 10/11
MTW1 59.2 5 Front L 5cm to temporal line Oval 6.0x8.0 F? adult
MTW2 4 2 Front R 2.5cm above orbita Rect 6.0x6.5 M?? adult
MTW3 33.5 26 Pariet R 3cm to bregma Oval 10.0x21.0 ? adult
MTW4 65 2 69 Pariet L close to lambda Line 4.0x43.0 F adult
MTW4 65 3 60 Pariet R 4cm above lambda Line 3.0x26.0+ ? adult
Table 37. Compression fractures in vertebrae.
Area Locus Layer Element Vertebra Ant. Height Post. Height Spondylosis
EM 6(3) 1 37 L 25 21 –
EM 6(5) 3 1 L5 25 19 –
EM 6(5) 5 X.9 L5 + – –
EM 6(6) 1 30 L + – –
MT section E 26 L 23 14 +
MT dump 14-16 7 S1 + – –
MTW1 65 18 L 36 19 –
MTW4 65 5 6 T – + –

140
Table 38. Periostitis and subperiosteal new bone formation.
Area Locus Layer Elem. Bone Side Location Area Sex Age
EM 6(4) 1 7 Clavicle R close to conoid tubercle small ? adult
MTW1 30 Clavicle L close to acromial end small – 7-14
MTW3 33 X 7 Ulna ? upper midshaft small M?? adult
MTW4 65 1 77 Femur R post. over medial condyle small ? adult
MTW4 65 347 Femur R midshaft, medial side large
M? adult48.1 Femur L midshaft, medial side large
MTW4 65 5 9 Humerus R over medial epicondyle medium – 7-14
MTW4 65 5 49Femur L midshaft, medial side large
M? adultTibia L 9cm below nutrient for. medium
MTW4 65 E Femur R upper midshaft, medial side large M? adult
MTW4 65 G 10 Femur R midshaft, medial side large M? adult
MTW4 65 G 13 Tibia R midshaft, medial side small ? adult
Table 39. Degenerative joint disease: osteoarthritis.
JointEM loc. 6 MTW1 MTW4 Others
0 1 2 0 1 2 0 1 2 0 1 2Occipital 35 7 – 12 4 – 19 – – 7 2 –Mandible 19 1 – 10 – – 10 – – 4 – –Atlas sup. 13 – – 9 2 – 11 – – 3 – –Atlas inf. 12 2 – 5 5 – 11 – – 3 – –Axis sup. 11 – – 8 2 – 13 – – 4 – –Axis inf. 4 – – 10 – – 11 – – 4 – –Axis dens 6 – – 5 3 – 7 – – 2 1 –Cervical 3-7 57 3 1 48 6 – 41 – – 13 – –Thoracic 283 8 1 164 14 – 223 1 – 23 – 2
Lumbar 210 4 – 77 6 – 104 1 – 29 – –Sacral body 7 – – 1 1 – 5 – – 2 – –Sacral ala 6 – – – 1 – 2 – – – – –Ribs (tuber.) 57 4 1 30 3 1 68 1 1 7 3 –Clavicle M 6 1 – 5 – – 3 – – 1 – –Clavicle L 4 1 3 5 1 – 4 – – 1 – –Scapula 27 1 – 4 – – 7 – – 2 – –Humerus D 18 – – 14 – – 8 – – 4 – 1
Ulna P 10 – 1 6 1 – 3 – – 4 – –Ulna D 4 – – 1 – – 1 – – 3 – –Radius P 14 1 – 6 – 1 4 – – – – –Radius D 4 – – 4 – – 1 – – 1 – –Acetabulum 16 7 1 15 2 – 12 2 – 6 – –Femur P 28 – 2 25 2 – 14 1 – 9 – –Femur D 23 4 – 11 1 2 9 – – 4 – 1
Patella 3 – – 4 1 1 8 – – 1 – –Tibia P 19 – – 9 – – 9 – – 3 – –Tibia D 11 1 – 4 – – 5 – – 4 – –Fibula P 4 – – 1 – – 2 – – – – –Fibula D 10 – – 1 – – 4 – – 2 – –

141
Table 40. Degenerative joint disease: spondylosis.
JointEM loc. 6 MTW1 MTW4 Others
0 1 2 0 1 2 0 1 2 0 1 2
Cervical 33 – 1 17 1 4 16 – – 4 – –Thoracic 93 – 1 70 2 – 71 2 – 14 – –Lumbar 57 5 2 27 8 2 22 3 – 10 1 –
Table 41. Activity related morphological traits.
Context
Third Trochanter in
Femur
Intertrochan-teric Line in
Femur
Hypotrochan-teric Fossa in
Femur
Poirier'sFacet in Femur
VastusNotch in Patella
SquattingFacet in
Distal Tibia
0 1 2 0 1 2 0 1 2 0 1 2 0 1 2 0 1 2
EM loc. 6 7 7 10 2 4 6 4 7 11 3 7 – 1 1 – 2 5 2
MTW1+4 15 15 7 1 3 6 4 4 2 9 5 1 9 3 1 1 2 3
Others 6 2 1 – – 2 1 3 2 1 1 2 – 1 1 1 2 –
Table 42. Development of selected muscular attachments.
Context
Clavicle Tubercle
Clavicle Deltoid
Humerus Deltoid
Radius Tuberosity
FemurL. Aspera
Tibia Popliteal
Popliteal L. Length
0 1 2 0 1 2 0 1 2 0 1 2 0 1 2 0 1 2 0 1 2
EM loc. 6 6 – 7 3 1 4 5 4 6 2 9 5 22 17 7 3 1 2 2 1 2
MTW1+4 9 1 – 4 2 1 9 3 7 2 5 6 18 12 17 5 1 4 4 – 5
Others 2 – 1 – 1 – 4 – 1 – – 1 6 1 9 2 – 3 1 1 2
Table 43. Long bone shaft indices.
Site / Area / SexPlatymeric Index Pilasteric Index Cnemic Index
N mean s.d. N mean s.d. N mean s.d.Tell Majnuna / EM loc. 6 / Females 19 71.5 4.73 32 104.7 8.67
8 62.1 3.65Tell Majnuna / EM loc. 6 / Males 5 73.5 5.12 8 116.2 7.72
Tell Majnuna / MTW1 / Females 7 73.0 8.09 13 100.8 7.888 64.8 5.17
Tell Majnuna / MTW1 / Males 13 76.4 7.24 18 110.6 14.57
Tell Majnuna / MTW4 / Females 8 73.9 4.20 11 102.1 10.4810 61.0 6.18
Tell Majnuna / MTW4 / Males 8 73.1 3.68 6 111.7 10.04
Tell Majnuna / Others / Females 5 74.7 5.33 4 115.4 14.043 67.6 3.28
Tell Majnuna / Others / Males 7 74.0 4.70 9 116.5 11.81
Tell Majnuna / Females 39 72.7 5.36 60 104.1 9.63 15 63.0 5.00
Tell Majnuna / Males 33 74.6 5.67 41 113.1 12.19 13 62.8 5.97
Chagar Bazar (MBA) / Females 2 71.3 5.83 4 102.9 7.16 4 63.9 3.37
Chagar Bazar (MBA) / Males 1 80.0 3 108.5 7.36 1 69.3
Middle Euphrates Valley / Females 21 82.3 8.30 11 104.9 5.58 14 76.5 9.10
Middle Euphrates Valley / Males 19 82.2 8.23 11 105.7 6.89 12 69.9 3.85
t p t p t pMajnuna vs Euphrates (Females) 5.44 .0001 0.27 0.79 5.00 .0001
Majnuna vs Euphrates (Males) 3.94 .0003 1.92 0.06 3.50 .0020
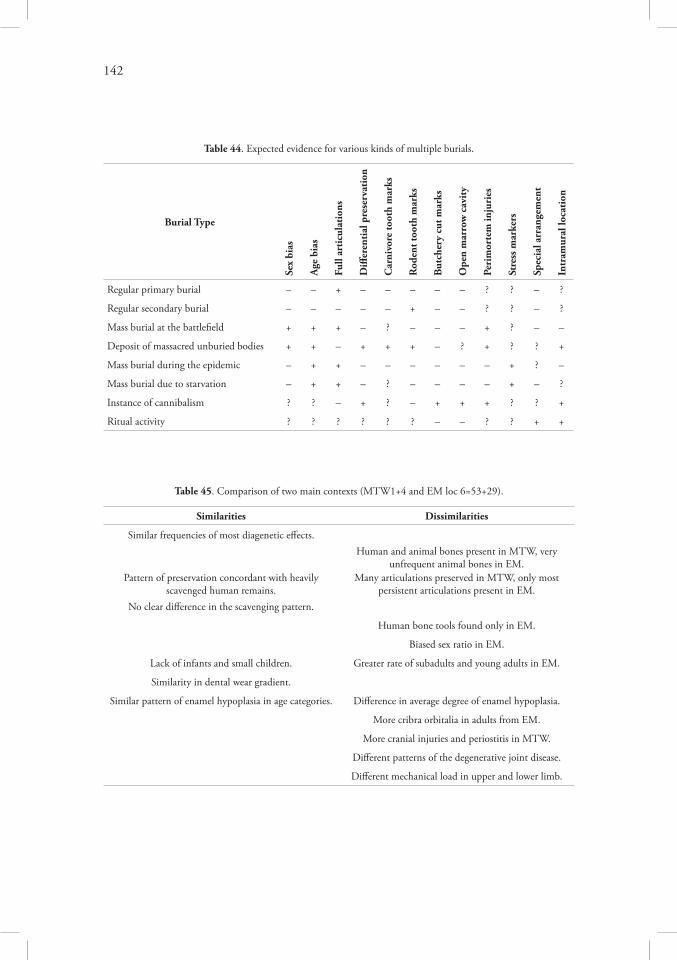
142
Table 44. Expected evidence for various kinds of multiple burials.
Burial Type
Sex
bias
Age
bia
s
Full
arti
cula
tion
s
Diff
eren
tial
pre
serv
atio
n
Car
nivo
re to
oth
mar
ks
Rod
ent t
ooth
mar
ks
But
cher
y cu
t mar
ks
Ope
n m
arro
w c
avit
y
Peri
mor
tem
inju
ries
Stre
ss m
arke
rs
Spec
ial a
rran
gem
ent
Intr
amur
al lo
cati
on
Regular primary burial – – + – – – – – ? ? – ?
Regular secondary burial – – – – – + – – ? ? – ?
Mass burial at the battlefield + + + – ? – – – + ? – –
Deposit of massacred unburied bodies + + – + + + – ? + ? ? +
Mass burial during the epidemic – + + – – – – – – + ? –
Mass burial due to starvation – + + – ? – – – – + – ?
Instance of cannibalism ? ? – + ? – + + + ? ? +
Ritual activity ? ? ? ? ? ? – – ? ? + +
Table 45. Comparison of two main contexts (MTW1+4 and EM loc 6=53+29).
Similarities Dissimilarities
Similar frequencies of most diagenetic effects.
Human and animal bones present in MTW, very unfrequent animal bones in EM.
Pattern of preservation concordant with heavily scavenged human remains.
Many articulations preserved in MTW, only most persistent articulations present in EM.
No clear difference in the scavenging pattern.
Human bone tools found only in EM.
Biased sex ratio in EM.
Lack of infants and small children. Greater rate of subadults and young adults in EM.
Similarity in dental wear gradient.
Similar pattern of enamel hypoplasia in age categories. Difference in average degree of enamel hypoplasia.
More cribra orbitalia in adults from EM.
More cranial injuries and periostitis in MTW.
Different patterns of the degenerative joint disease.
Different mechanical load in upper and lower limb.

143
Table 46. Evidence of cannibalism at Tell Majnuna.
Criterion Presence at Tell Majnuna
1 Presence of cut marks no –
2 High degree of bone disarticulation and fragmentation low or medium –
3 Evidence of burning on some of the bones only one fragment –
4 Dissimilarity between deposit and a regular contemporaneous burial yes +
5 Presence of percussion or anvil marks no –
6 Intentional perimortem fracturing no (only trampling) –
7 Similarity between human bone and faunal bone assemblages some ?
8 Many missing vertebrae no –
9 Pot polishing no –
Table 47. Interpretation vector for MTW1+4.
Observation Regular primary
Regular secondary Epidemic Starvation Battlefield Massacre
Archaeological context – – + ++ ++ ++ ++
Pattern of bone preservation – – – – – + + +
Presence of tooth marks – – – – – ++ + ++
Pattern of articulations – – – – – ++ + ++
No clear sex bias + + + + –
Age pattern – – + + ++
Presence of cranial injuries ++ +
No evidence of cannibalism + + + –
Stress markers + ++
Interpretation vector -1.0 -0.6 +0.3 +1.2 +1.0 +1.7
Table 48. Interpretation vector for EM loc. 6.
Observation Regular primary
Regular secondary Epidemic Starvation Battlefield Massacre
Archaeological context – – + ++ ++ ++ ++
Pattern of bone preservation – – – – – + + +
Presence of tooth marks – – – – – ++ + ++
Pattern of articulations – – ++
Sex bias towards females – – – – – +
Age pattern – – + + – ++
Absence of cranial injuries –
No evidence of cannibalism + + + –
Stress markers + ++
Interpretation vector -1.3 -0.3 +0.3 +1.2 0.0 +1.6


Figures

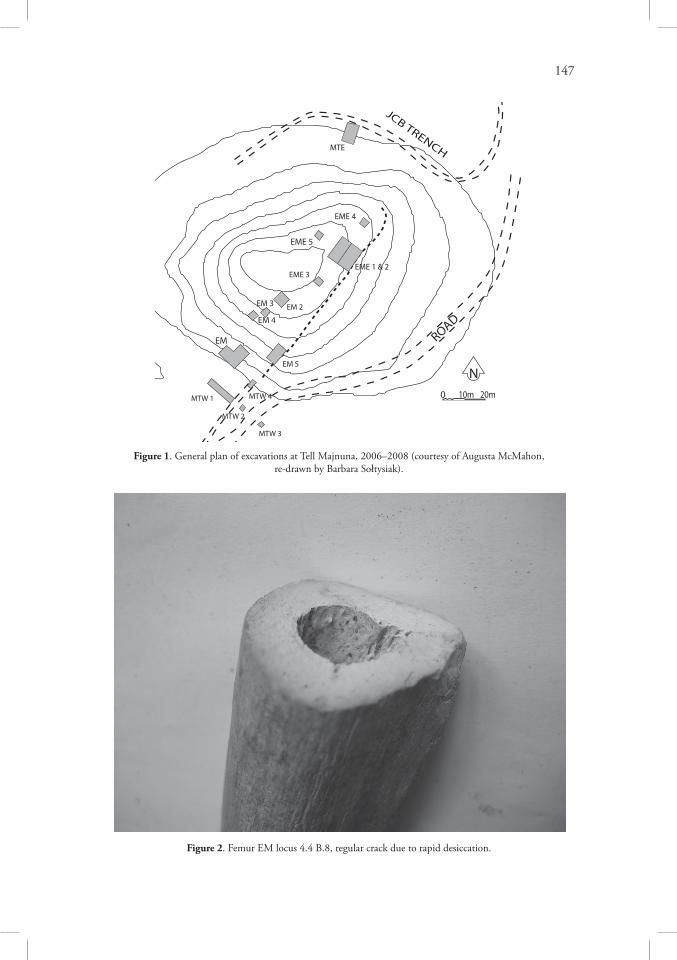
147
Figure 1. General plan of excavations at Tell Majnuna, 2006–2008 (courtesy of Augusta McMahon,re-drawn by Barbara Sołtysiak).
Figure 2. Femur EM locus 4.4 B.8, regular crack due to rapid desiccation.

148
Figure 3. Mouse in a bag with an element from EM locus 6, picture taken on April 26th, 2007.
Figure 4. MT cluster H locus 6.

149
Figure 5. MT cluster H locus 7.
Figure 6. MT cluster B section.
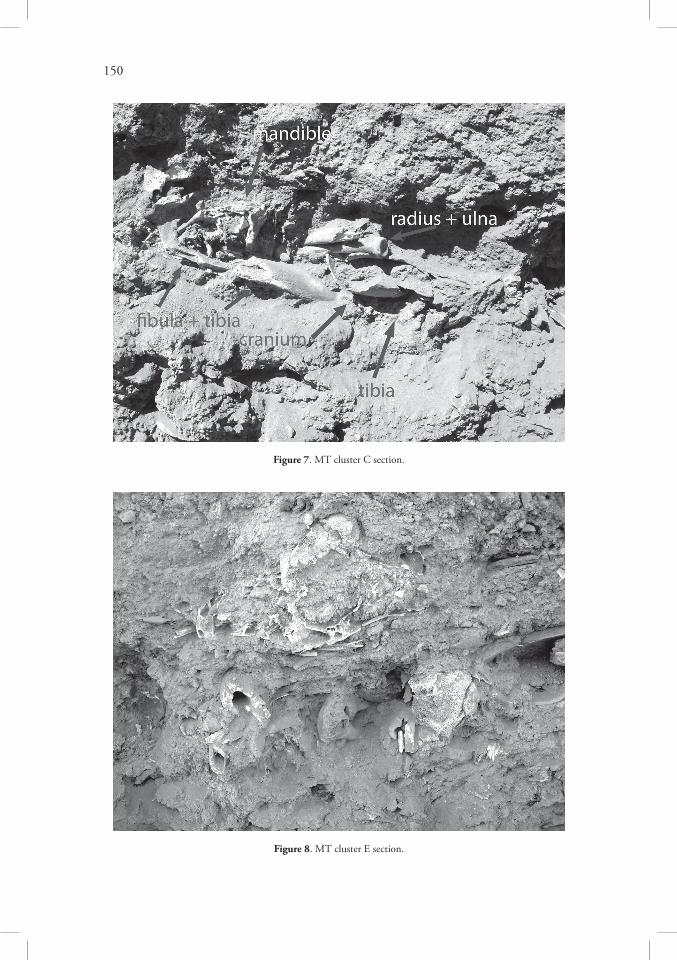
150
Figure 7. MT cluster C section.
Figure 8. MT cluster E section.
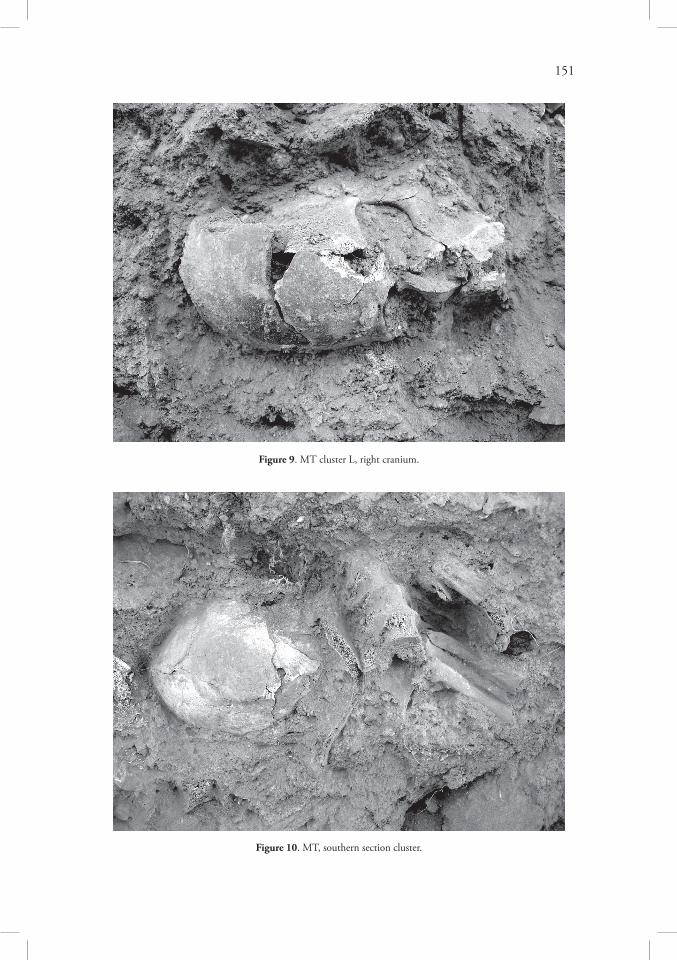
151
Figure 9. MT cluster L, right cranium.
Figure 10. MT, southern section cluster.
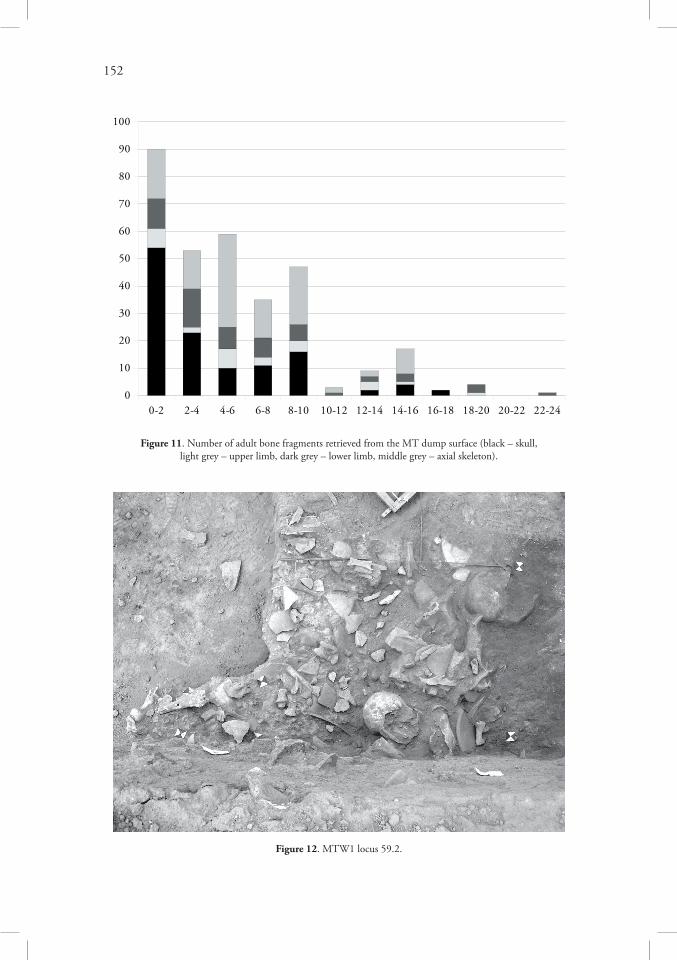
152
Figure 11. Number of adult bone fragments retrieved from the MT dump surface (black – skull,light grey – upper limb, dark grey – lower limb, middle grey – axial skeleton).
Figure 12. MTW1 locus 59.2.
0-2 2-4 4-6 6-8 8-10 10-1212-1414-1616-1818-2020-2222-240
10
20
30
40
50
60
70
80
90
100

153
Figure 13. MTW1 locus 66, early stage of exploration.
Figure 14. MTW4 locus 65, cluster A.
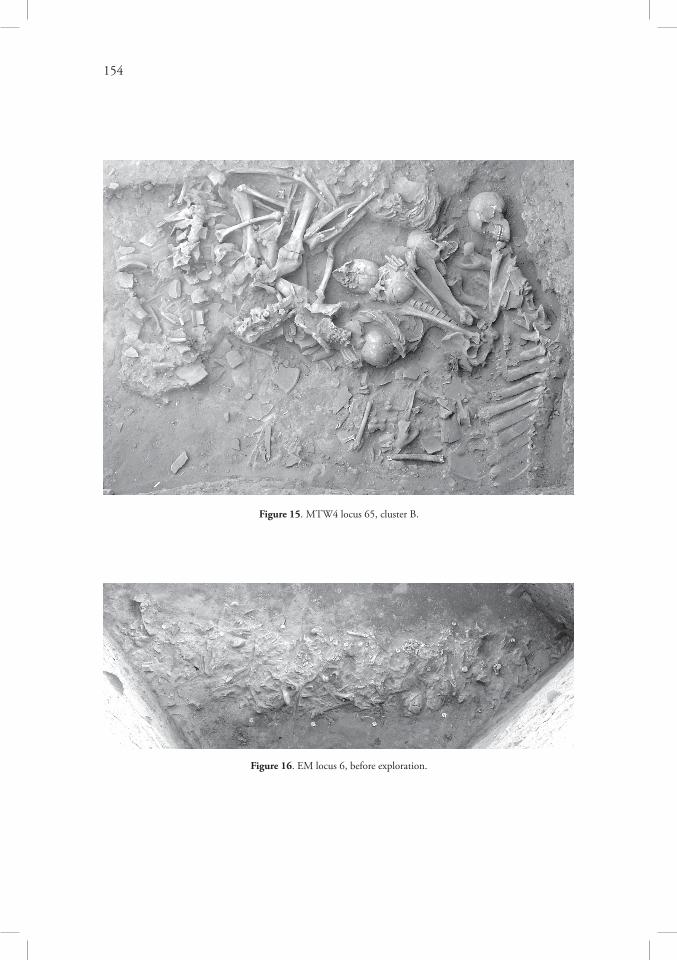
154
Figure 15. MTW4 locus 65, cluster B.
Figure 16. EM locus 6, before exploration.

155
Figure 17. EM locus 6, detail of the surface.
Figure 18. EMS locus 6, top of the lens-like cluster.

156
Figure 19. EMS locus 6, human lower limb.
Figure 20. EMS locus 7.

157
Figure 21. Natural fracture in EM locus 6(6), layer 1, element 17.
Figure 22. Discolouration of a fragment from EM locus 6=53.

158
Figure 23. Crystalline deposits in EM locus 6(6), layer 2, element 9.
Figure 24. Root etching in a bone from EMS locus 6.

159
Figure 25. Yellow larva found in EM locus 6, picture taken on April 16th, 2008.
Figure 26. Insect tunneling in lumbar vertebral body, EM locus 6(7), layer 1, element 9.
Figure 27. Rodent tooth marks in tibial interosseus crest, MTW1 locus 65, layer 3, element 32.

160
Figure 28. Rodent or carnivore tooth marks in calcaneus, EM locus 6(2), layer 2, element 223.
Figure 29. Rodent tooth marks on left ulna, EMS locus 7.

161
Figure 30. Cranium damaged by trampling, MTW4 locus 65, element 89.
Figure 31a. Shallow punctures in femur of the skeleton found in MTW3 locus 33.

162
Figure 31b. Shallow punctures in frontal bone EMS locus 6, layer 1, element E.
Cranium (N=418)
Mandible (N=130)
Clavicle (N=72)
Humerus (N=220)
Radius (N=84)
Ulna (N=88)
Pelvis (N=224)
Femur (N=389)
Tibia (N=191)
Fibula (N=92)
Other elements
0% 1% 2% 3% 4% 5% 6% 7% 8%
2,6%
0,0%
1,4%
4,1%
1,2%
0,0%
0,0%
7,5%
3,1%
0,0%
0,0%
Figure 32. Percent frequency of bones from Areas EM, EMS and MTW with shallow punctures.

163
1 2 3 4 5 6 7 8 9 10
Tooth mark maximum diameter
0
5
10
15
Figure 33. Distribution of animal tooth mark diameters (in mm) at Tell Majnuna.
Figure 34. Carnivore tooth scoring and pits in EM locus 6(4), layer 2, element 18.

164
Figure 35. Carnivore tooth pits and scoring in EM locus 6(4), layer 2, element 17.
Figure 36. Carnivore tooth puncture in EM locus 6(4), layer 3, element 14.

165
EM loc. 6
EM
MT
MTW1
MTW4
other
0% 2% 4% 6% 8% 10% 12% 14% 16%
Figure 37. Carnivore tooth furrows in EM locus 6(3), layer 3, element 8.
Figure 38. Percent frequency of tooth marks in various locations at Tell Majnuna.

166
Figure 39. Scavenging pattern in EM locus 6 (a) and MTW1 + MTW 4 (b); frequencies of tooth marksare expressed in greyscale from white (0%) to black (50% and more).
a b

167
EM loc. 6
MTW1
MTW4
0% 5% 10% 15% 20% 25% 30%
EM
MTW
0% 20% 40% 60% 80% 100%
EM
MTW
0% 20% 40% 60% 80% 100%
(a) proximal end (b) distal end
Figure 40. Frequencies of tooth marks in hip area (dark grey) and knee area (light grey).
Figure 41. Gnawing degree in Areas EM and MTW expressed in greyscale from white (grade 0) to black (grade 5 in proximal, grade 4 in distal end); for scales see Tables 8 and 9.
Figure 42. Griffon vulture beak marks on a bovid cranium, modern experiment.Photograph by Dagmara Morozowicz & Justyna Sasanka.

168
Figure 43. Possible beak marks in MTW4 locus 65, layer 1, element 90 (marked with arrows).

169
Figure 44. Preservation pattern in EM locus 6 (a) and MTW1 locus 65 (b).
a b

170
1
2
3
4
5
6
78 9
10
11
12
13
14
15
16
1718
19
20
Modern
EME
Barri
-1,0 -0,8 -0,6 -0,4 -0,2 0,0 0,2 0,4
Factor 1
-0,6
-0,4
-0,2
0,0
0,2
0,4
0,6
0,8
1,02 rotcaF
1
2
3
4
5
6
78 9
10
11
12
13
14
15
16
1718
19
20
Modern
EME
Barri
EM loc. 6
EM others
EMS
MT section
MT dump
MTW1
MTW4
Others
0% 10% 20% 30% 40% 50% 60% 70% 80% 90% 100%
Figure 45. PCA first two factor loadings for bone preservation pattern.
Figure 46. Percent frequency of complete teeth (black), broken teeth (grey) and lost teeth (white)in eight dental subsamples.

171
I1 I2 C P1 P2 M1 M2 M3 M3 M2 M1 P2 P1 C I2 I10
10
20
30
40
50
60
70
80
90
maxilla mandible
I1 I2 C P1 P2 M1 M2 M3 M3 M2 M1 P2 P1 C I2 I10
10
20
30
40
50
60
70
80
90
100
maxilla mandible
Figure 47. Percent frequencies of postmortem tooth loss in all permanent tooth categories.Black squares – EM locus 6, grey diamonds – MTW4.
Figure 48. Percent frequencies of broken teeth in all permanent tooth categories (PMTL not included).Black squares – EM locus 6, grey diamonds – MTW4.

172
EM loc. 6(1)
EM loc. 6(2)
EM loc. 6(3)
EM loc. 6(4)
EM loc. 6(5)
EM loc. 6(6)
EM loc. 6(7)
EM loc. 6(8)
EM loc. 25
EM loc. 29
EM others
MTW1 loc. 65
MTW1 loc. 66
MTW1 others
MTW4 loc. 64
MTW4 loc. 65
MT dump
MT section
MTW2+3
EMS
0 10 20 30 40 50 60 70 80 90
Figure 49. Percent frequencies of articulated articular surfaces in various locations at Tell Majnuna.

173
0 50 100 150 200 250 300 350
Linkage Distance
10019171512111820
910
3287
13645
1614
1
1
2
3
4
5
6
789
10
111213
14
15
16
17
18
19
20 skull axial
shoulder armforearm
hand pelvis
thighleg
foot
-1,5 -1,0 -0,5 0,0 0,5 1,0 1,5
Dimension 1 (31,58% of Inertia)
-1,5
-1,0
-0,5
0,0
0,5
1,0
1,5
2,0
Dim
ensio
n 2
(21,
98%
of I
nerti
a)
1
2
3
4
5
6
789
10
111213
14
15
16
17
18
19
20 skull axial
shoulder armforearm
hand pelvis
thighleg
foot
completelyarticulatedskeleton
x
Figure 50. Dendrogram of various locations at Tell Majnuna in respect of articulation proportions(Euclidean distance, complete linkage, see Table 16 for labels).
Figure 51. Correspondence Analysis dimensions for data from Table 16.
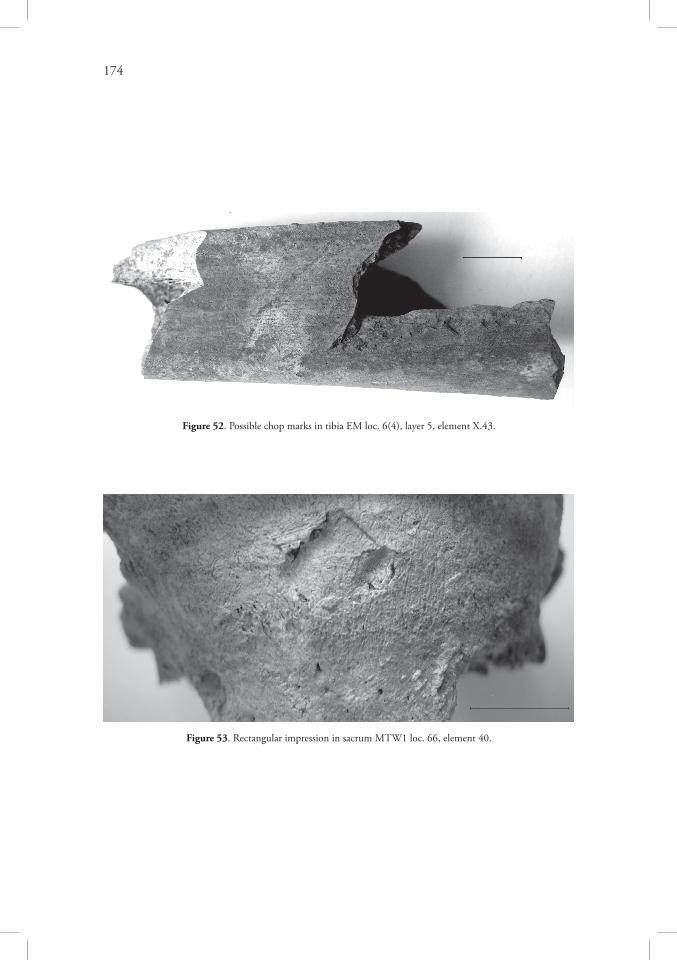
174
Figure 53. Rectangular impression in sacrum MTW1 loc. 66, element 40.
Figure 52. Possible chop marks in tibia EM loc. 6(4), layer 5, element X.43.

175
a
b
c
d
e
Figure 54. Examples of human bone tools from Tell Majnuna: no. 3, detail (a), no. 4 (b), no. 6 (c),no. 7 (d), no. 8, detail (e), no. 26, detail (f ).
f

176
Figure 55. Pseudotool EM loc. 50, element C2 (tibia).
Figure 56. Scratches and polish on cranium EM loc. 6(5) layer 3, element 15: frontal bone (a),
occipital bone (b), small fragment of cranial vault (c).
a

177
b
c
Figure 56. Continued.

178
Figure 57. Scratches on frontal bone fragment, EM loc. 29 layer 1, element 22.
Figure 58. Reconstruction of human bone tool handling (drawing by Barbara Sołtysiak).

179
GSN
NC
MPL
MPR
GL
SRLSRRME
F
F?
?
M?
M
-0,6 -0,4 -0,2 0,0 0,2 0,4 0,6 0,8 1,0
Dimension 1 (69,87% of Inertia)
-0,4
-0,3
-0,2
-0,1
0,0
0,1
0,2
0,3
0,4
0,5D
imen
sion
2 (1
8,51
% o
f Ine
rtia)
GSN
NC
MPL
MPR
GL
SRLSRRME
F
F?
?
M?
M
1 1.5 2 3 4 5 6 7 8 9 10 11 12 13+0
1
2
3
4
5
6
EM loc. 6MTWOthers
Figure 59. Correpondence analysis dimensions for sex determination methods and their results:GSN – greater sciatic notch, NC – nuchal crest, SR – supraorbital ridge (R/L), ME – metal eminence,
GL – glabella, MP – mastoid process (R/L).
Figure 60. Dental age frequencies of subadult individuals from EM loc. 6 and MTW1+4.

180
1 4 5 6 7 90
1
2
EM loc. 6MTWOthers
Figure 61. Correpondence analysis dimensions for basic age categories and contexts of human remainsexcavated at Tell Majnuna.
Figure 62. Frequency of age classes assessed after pubic symphysis (Todd 1921).
EMvar
EM6(1)
EM6(2)
EM6(3)
EM6(4)
EM6(5)EM6(6)
EM6(7)
EM6(8)EM25
EM29EMSMTsectionMTdump
MTW1var
MTW165
MTW166
MTW2+3MTW464
MTW465
0-6
7-14
5-21
adult
-0,6 -0,4 -0,2 0,0 0,2 0,4 0,6
Dimension 1 (78,92% of Inertia)
-0,7
-0,6
-0,5
-0,4
-0,3
-0,2
-0,1
0,0
0,1
0,2
0,3
0,4D
imen
sion
2 (1
3,89
% o
f Ine
rtia)
EMvar
EM6(1)
EM6(2)
EM6(3)
EM6(4)
EM6(5)EM6(6)
EM6(7)
EM6(8)EM25
EM29EMSMTsectionMTdump
MTW1var
MTW165
MTW166
MTW2+3MTW464
MTW465
0-6
7-14
5-21
adult
15-21

181
1 2 3 4 5 6 70
2
4
6
8
10
12
EM loc. 6MTWOthers
Figure 63. Frequency of age classes assessed after auricular surface (Meindl & Lovejoy 1989).
Figure 64. Dental microwear in the lower first molar of the individual TW 809 from Tell Brak. Scale bar 100 µm.

182
0 1 2 3 4 5 6 7 8 9 10
M2
0
2
4
6
8
10
M1
EMEM6
EM25EMS
MTW1+4MTW3
EMEGohar
Barri NABarri BA
Barri ABarri M
-2,5
-2,0
-1,5
-1,0
-0,5
0,0
0,5
1,0
1,5
2,0
2,5
Res
idua
ls
Figure 65. Linear regression of dental wear scores in M1 and M2, sample of 120 individuals from Tell Majnuna, Tell Barri and Gohar Tepe.
Figure 66. Difference in regression residuals between subsamples from Tell Majnuna, Tell Barri and Gohar Tepe. Box&whiskers plot for means, standard errors and standard deviations.

183
Figure 67. Weighted mean frequency of dental caries in Tell Majnuna and comparative samplesfrom the Khabour basin.
Figure 68. Linear enamel hypoplasia in M2, EM loc. 6(6), layer 2, element 43.
BrakBrak
Brak
Brak
Barri
Arbid
Arbid
Arbid
Barri
Barri
Arbid
EM
MTWOthers
-4000 -3000 -2000 -1000 0 10000,00
0,02
0,04
0,06
0,08
0,10
0,12
0,14
0,16
0,18
0,20
0,22
0,24
0,26
0,28
Den
tal C
arie
s Wei
ghte
d M
ean
Freq
uenc
y
BrakBrak
Brak
Brak
Barri
Arbid
Arbid
Arbid
Barri
Barri
Arbid
EM
MTWOthers
Chronology

184
EM6
EM25
MTW1
MTW4
OthersEME
Brak E
Brak F Brak MN
Barri EBA
Barri E/MBA
Barri MBA
Barri Ass
Barri Ach
-4000 -3500 -3000 -2500 -2000 -1500 -1000 -500
Chronology
0,10
0,15
0,20
0,25
0,30
0,35
0,40
0,45
0,50
0,55
0,60
Ave
rage
Deg
ree
of E
nam
el H
ypop
lasia
EM6
EM25
MTW1
MTW4
OthersEME
Brak E
Brak F Brak MN
Barri EBA
Barri E/MBA
Barri MBA
Barri Ass
Barri Ach
0 1 2 3 4 5 60
1
2
3
4
5
6
7
8
9
10
0 1 2 3 4 5 60
2
4
6
8
10
12
14
EM loc. 6 MTW 1+4
Figure 69. Average degree of dental enamel hypoplasia in Tell Majnuna, Tell Brak and Tell Barri.
Figure 70. Linear enamel hypoplasia scores in C*, per dental wear stages.
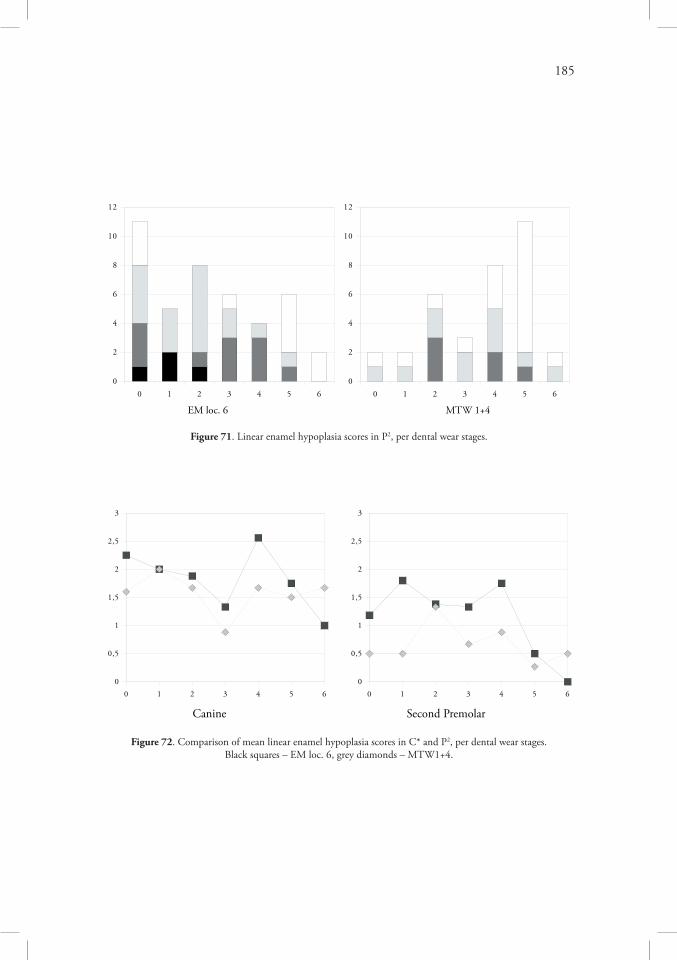
185
0 1 2 3 4 5 60
2
4
6
8
10
12
0 1 2 3 4 5 60
2
4
6
8
10
12
EM loc. 6 MTW 1+4
0 1 2 3 4 5 60
0,5
1
1,5
2
2,5
3
0 1 2 3 4 5 60
0,5
1
1,5
2
2,5
3
Canine Second Premolar
Figure 71. Linear enamel hypoplasia scores in P2, per dental wear stages.
Figure 72. Comparison of mean linear enamel hypoplasia scores in C* and P2, per dental wear stages.Black squares – EM loc. 6, grey diamonds – MTW1+4.

186
Figure 73. Cribra orbitalia, MTW4 loc. 65, layer 6, element 5.
Figure 74. Cranial porosity, EM loc. 4.1, element 2.
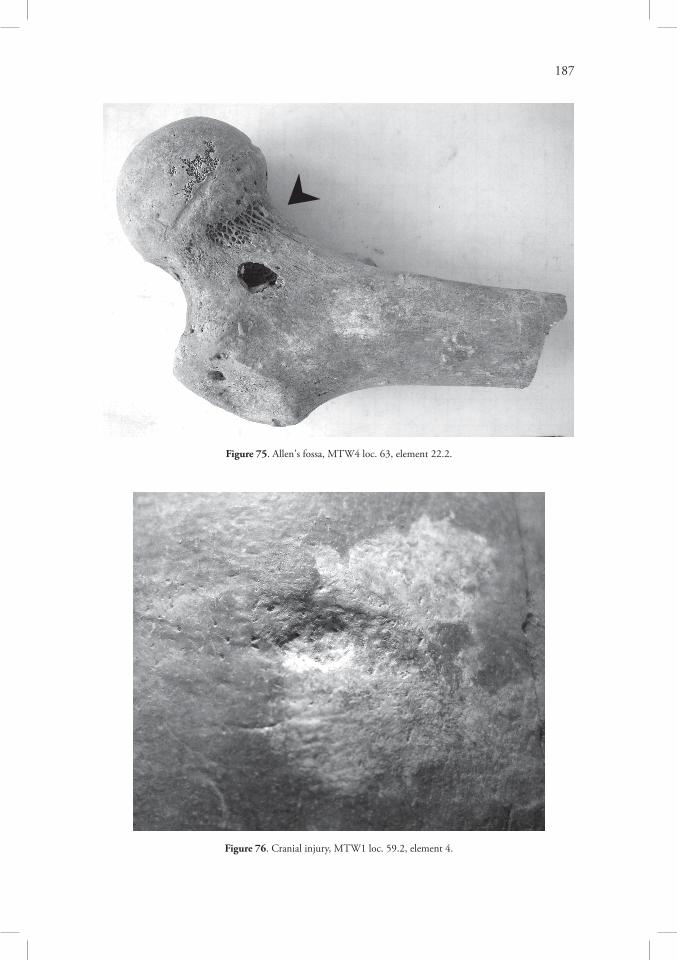
187
Figure 75. Allen's fossa, MTW4 loc. 63, element 22.2.
Figure 76. Cranial injury, MTW1 loc. 59.2, element 4.

188
Figure 77. Oval cranial injury, MT section cluster D, element 5.
Figure 78. Linear cranial injury, MTW4 loc. 65, layer 2, element 69: (a) general view, (b) detail.
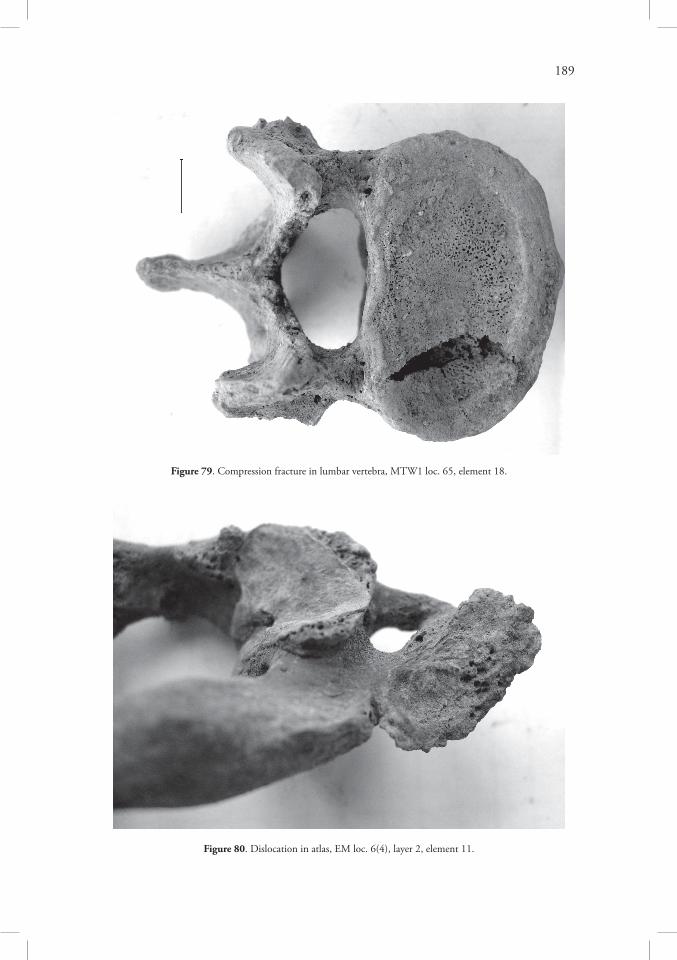
189
Figure 79. Compression fracture in lumbar vertebra, MTW1 loc. 65, element 18.
Figure 80. Dislocation in atlas, EM loc. 6(4), layer 2, element 11.

190
Figure 81. Subperiosteal new bone formation, MTW4 loc. 65, element E.
Figure 82. Advanced osteoarthritis in femoral head, EM loc. 6(4), layer 3, element 23.
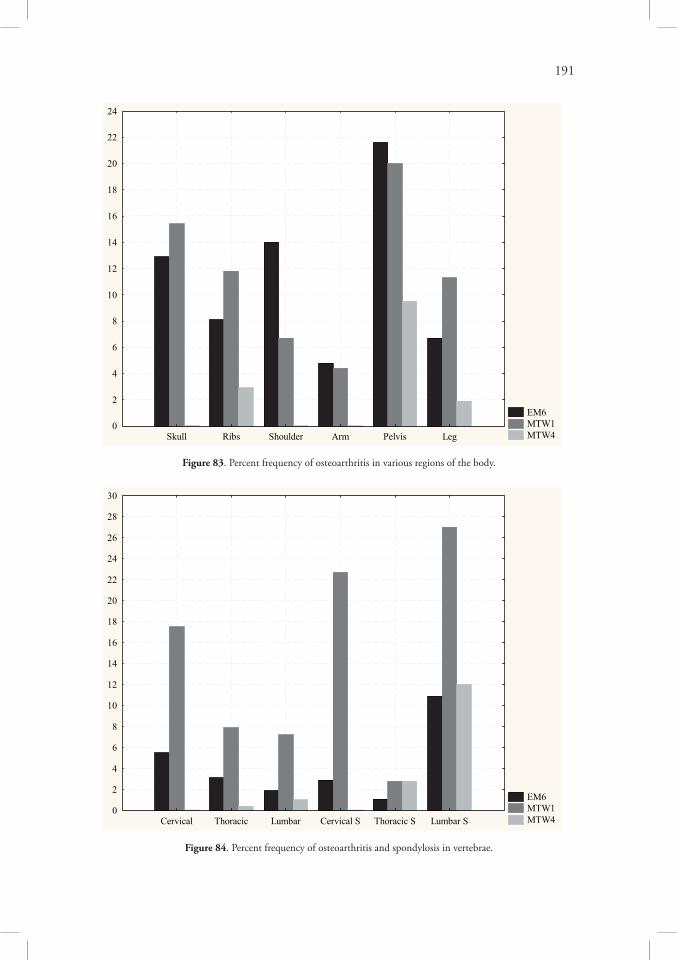
191
EM6 MTW1 MTW4Skull Ribs Shoulder Arm Pelvis Leg
0
2
4
6
8
10
12
14
16
18
20
22
24
EM6 MTW1 MTW4Cervical Thoracic Lumbar Cervical S Thoracic S Lumbar S
0
2
4
6
8
10
12
14
16
18
20
22
24
26
28
30
Figure 83. Percent frequency of osteoarthritis in various regions of the body.
Figure 84. Percent frequency of osteoarthritis and spondylosis in vertebrae.

192
Figure 85. Ankylosing spondylitis in cervical vertebrae, MTW1 loc. 66, element 45.
Figure 86. Sclerosis of trabeculae in talus, MTW1 loc. 66, element 30.
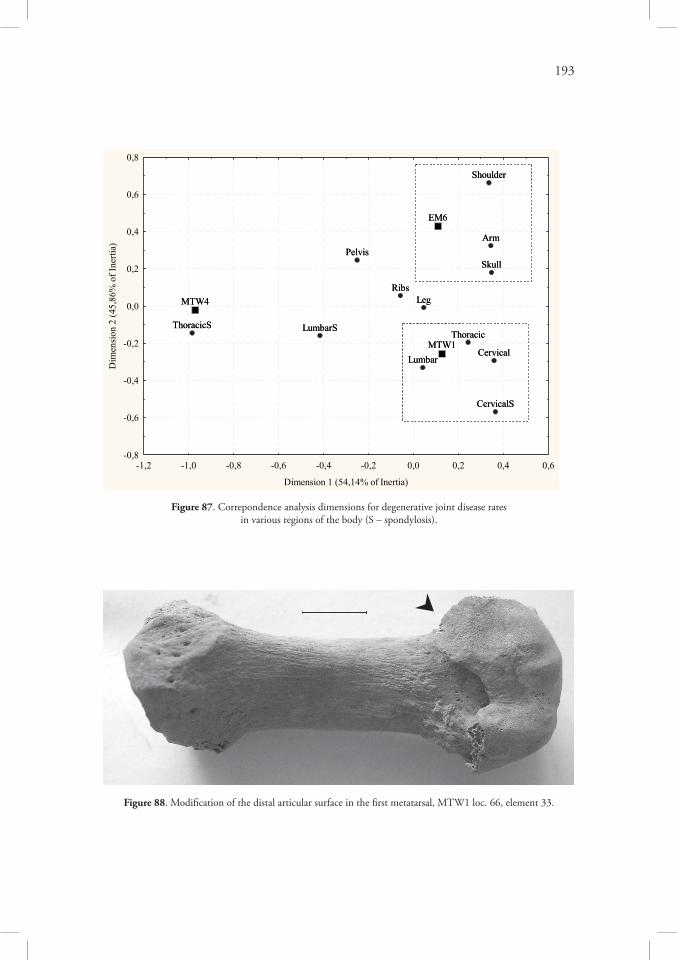
193
Skull
Cervical
Thoracic
Lumbar
Ribs
Shoulder
ArmPelvis
Leg
CervicalS
ThoracicS LumbarS
EM6
MTW1
MTW4
-1,2 -1,0 -0,8 -0,6 -0,4 -0,2 0,0 0,2 0,4 0,6
Dimension 1 (54,14% of Inertia)
-0,8
-0,6
-0,4
-0,2
0,0
0,2
0,4
0,6
0,8
Dim
ensio
n 2
(45,
86%
of I
nerti
a)
Skull
Cervical
Thoracic
Lumbar
Ribs
Shoulder
ArmPelvis
Leg
CervicalS
ThoracicS LumbarS
EM6
MTW1
MTW4
Figure 87. Correpondence analysis dimensions for degenerative joint disease ratesin various regions of the body (S – spondylosis).
Figure 88. Modification of the distal articular surface in the first metatarsal, MTW1 loc. 66, element 33.

194
Figure 89. Very pronounced linea aspera in femur, MT dump, general collection, element 1.9a.
Figure 90. Popliteal line as a series of grooves, MTW1 loc. 66, element 24.

195
Figure 91. Transverse sulcus on parietal bone, MTW loc. 59.2, element 4.
Figure 92. Possible artificial cranial deformation, MTW 4 loc. 65, layer 2, element 69.

196
MTW1loc. 65/66
MTW4loc. 65
? ?
MTW4loc. 63/64
EMloc. 6=53
EMloc. 29
EMSloc. 6
EMloc. 25
MTW1loc. 65/66
MTW4loc. 65
MTW3loc. 33/34
? ?
MTW1loc. 59
MTW4loc. 63/64
EMloc. 6=53
EMloc. 29
EMSloc. 6
EMSloc. 7
EMloc. 25
MTW1loc. 65/66
MTW4loc. 65
MTW4loc. 63/64
EMloc. 6=53
EMloc. 29
EMSloc. 6
EMloc. 25
MTW1loc. 65/66
MTW4loc. 65
MTW3loc. 33/34
?
?MTW1loc. 59
MTW4loc. 63/64
EMloc. 6=53
EMloc. 29
EMSloc. 6
EMSloc. 7
EMloc. 25
First scenario: one event & two small episodes
Second scenario: two events & three small episodes
Figure 93. Relations between contexts of human remains at Tell Majnuna, two scenarios.Primary deposits marked with dark grey, secondary deposits with light gray.

197
21 20 19 18 17 16 15 14 13 12 11+0
1
2
3
4
5
6
7
8
9
10
11
12
0
1
2
3
4
5
6
7
8
9
10
11
12
Figure 94. Frequency of TW loci with regular burials (light grey) and dispersed bones or bone fragments(dark grey) per levels. Levels 18-16 correspond to ~3800-3600 BCE.


Bibliography


201
Abate T. (1994), Climate and the collapse of civilization, BioScience 44(8):516-519.Acharya A.B., Mainali S. (2008), Sex discrimination potential of buccolingual and mesiodistal
tooth diameters, Journal of Forensic Sciences 53(4):790-792.Acsádi G.Y., Nemeskéri J. (1970), History of human life span and mortality, Akadémiai Kiadó:
Budapest.Adams B.J., Konigsberg L.W. (2004), Estimation of the most likely number of individuals
from commingled human skeletal remains, American Journal of Physical Anthropology 125(2):138-151.
Adams R.M. (1965), Land behind Baghdad. A history of settlement on the Diyala plains, Uni-versity of Chicago Press: Chicago & London.
Adams R.M. (1981), Heartland of cities. Surveys of ancient settlement and land use on the cen-tral floodplain of the Euphrates, University of Chicago Press: Chicago & London.
Agelarakis A. (1993), The Shanidar Cave Proto-Neolithic human population: Aspects of demo-graphy and paleopathology, Human Evolution 8(4):235-253.
Albanese J., Eklics G., Tuck A. (2008), A metric method for sex determination using the proxi-mal femur and fragmentary hipbone, Journal of Forensic Sciences 53(6):1283-1288.
Algaze G. (2001), Initial social complexity in Southwestern Asia. The Mesopotamian advantage, Current Anthropology 42(2):199-233.
Algaze G. (2008), Ancient Mesopotamia at the dawn of civilization, University of Chicago: Chicago & London.
Al-Shorman A. (2004), Stable carbon isotope analysis of human tooth enamel from the Bron-ze Age cemetery of Ya'amoun in Northern Jordan, Journal of Archaeological Science 31:1693-1698.
AlQahtani S.J., Liversidge H.M., Hector M.P. (in print), Atlas of tooth development and erup-tion, American Journal of Physical Anthropology (submitted).
Alunni-Perret V., Staccini P., Quatrehomme G. (2008), Sex determination from the distalpart of the femur in a French contemporary population, Forensic Science International 175:113-117.
Anderson M., Messener M.B., Green W.T. (1964), Distribution of lengths of the normal femur and tibia in children from one to eighteen years of age, Journal of Bone and Joint Surgery 46:1197-1202.
Anderson S.E., Johnston J.O., O'Donnell R., Steinbach L.S. (2001), Mid femoral diaphyseal periostitis at insertion site of adductor musculature, American Journal of Roentgenology 176:1227-1231.
Andrus C.F.T., Sandweiss D.H., Scarry C.M. (2008), Climate change and archaeology: The Holocene history of El Niño on the coast of Peru [in:] “Case studies in environmental archa-eology”, E.J. Reitz, S.J. Scudder, C.M. Scarry (ed.), Springer: New York, pp. 143-157.
Andrushko V.A., Buzon M.R., Simonetti A., Creaser R.A. (2009), Strontium isotope evidence for prehistoric migration at Chokepukio, valley of Cuzco, Peru, Latin American Antiquity 20(1):57-75.
Angel J.L. (1966), Porotic hyperostosis, anemias, malarias, and marshes in the prehistoric eastern Mediterranean, Science 153:760-763.
Arens W. (1979), The man-eating myth: anthropology and anthropophagy, Oxford University Press: Oxford & New York.
Armelagos G.J., Van Gerven D.P. (2003), A century of skeletal biology and paleopathology: contrast, contradictions, and conflict, American Anthropologist 105(1):51-62.

202
Atalay S., Hastorf C.A. (2006), Food, meals, and daily activities: Food habitus at Neolithic Çatalhöyük, American Antiquity 71(2):283-319.
Aubert H., Pinta M. (1978), Trace elements in soils, Elsevier: Amsterdam & New York.Aykroyd R.G., Lucy D., Pollard A.M., Solheim T. (1997), Technical note: Regression analysis
in adult age estimation, American Journal of Physical Anthropology 104:259-265.Baca M., Molak M. (2008), Research on ancient DNA in the Near East, Bioarchaeology of the
Near East 2:39-61.Backwell L.R., d'Errico F. (2001), Evidence of termite foraging by Swartkrans early homi-
nids, Proceedings of the National Academy of Sciences of the United States of America 98(4):1358-1363.
Bar-Matthews M., Ayalon A., Kaufman A. (1997), Late Quaternary paleoclimate in the eastern Mediterranean region from stable isotope analysis of speleothems at Soreq Cave, Israel, Quater-nary Research 47:155-168.
Barrio P.A., Trancho G.J., Sanchez J.A. (2006), Metacarpal sexual determination in a Spanish population, Journal of Forensic Sciences 51(5):990-995.
Barrowclough D.A., Malone C., ed. (2007), Cult in context: Reconsidering ritual in archaeolo-gy, Oxbow: Oxford.
Barton G.A. (1930), “A bone of him shall not be broken,” John 19:36, Journal of Biblical Li-terature 49(1):13-19.
Bass W.M. (1996), Outdoor decomposition rates in Tennessee [in:] “Forensic taphonomy. The postmortem fate of human remains”, W.D. Haglund, M.H. Sorg (eds.), CRC Press: Boca Raton, pp. 181-186.
Batt M.E. (1995), Shin splints – A review of terminology, Clinical Journal of Sport Medicine 5(1):53-57.
Behrensmeyer A.K. (1978), Taphonomic and ecological information from bone weathering, Pa-leobiology 4:150-162.
Behrensmeyer A.K., Gordon K.D., Yanagi G.T. (1986), Trampling as a cause of bone surface damage and pseudo-cutmarks, Nature 319:768-771.
Bello S.M., Thomann A., Signoli M., Dutour O., Andrews P. (2006), Age and sex bias in the reconstruction of past population structures, American Journal of Physical Anthropology 129:24-38.
Benedictow O.J. (2004), The Black Death 1346–1353. The complete history, Boydell: Wood-bridge.
Bentley G.R., Paine R.R., Boldsen J.L. (2001), Fertility changes with the prehistoric transition to agriculture [in:] “Reproductive ecology and human evolution”, P.T. Ellison (ed.), Aldine de Gruyter: Hawthorne, pp. 203-232.
Berg G.E. (2008), Pubic bone age estimation in adult women, Journal of Forensic Sciences 53(3):569-577.
Berglund B.E. (2003), Human impact and climate changes—synchronous events and a causal link?, Quarternary International 105:7-12.
Billman B.R., Lambert P.M., Leonard B.L. (2000), Cannibalism, warfare, and drought in the Mesa Verde region during the twelfth century A.D., American Antiquity 65(1):145-178.
Binford L.R. (1968), Post-Pleistocene adaptations [in:] “New perspectives in archaeology”, S.R. Binford, L.R. Binford (ed.), Aldine Publishing Company: Chicago, pp. 313-342.
Binford L.R., Mills M.G.L., Stone N.M. (1988), Hyena scavenging behavior and its impli-cations for the interpretation of faunal assemblages from FLK 22 (the Zinj floor) at Olduvai Gorge, Journal of Anthropological Archaeology 7:99-135.

203
Blanchard P. (2007), L'inhumation en période de crise [in:] “Archéologie funéraire”, A. Ferdière (ed.), Errance: Paris, pp. 215-217.
Blumenschine R.J. (1986), Carcass consumption sequences and the archaeological distinction of scavenging and hunting, Journal of Human Evolution 15:639-659.
Blumenschine R.J. (1986a), Early hominid scavenging opportunities: implications of carcass ava-ilability in the Serengeti and Ngorongoro ecosystems, BAR International Series 283: Oxford.
Blumenschine R.J. (1988), An experimental model of the timing of hominid and carnivore influ-ence on archaeological bone assemblages, Journal of Archaeological Science 15:483-502.
Blumenschine R.J., Marean C.W. (1993), A carnivore's view of archaeological bone assemblages [in:] “From bones to behavior: Ethnoarchaeological and experimental contributions to the interpretation of faunal remains”, J. Hudson (ed.), Center for Archaeological Investi-gations, Southern Illinois University: Carbondale, pp. 273-300.
Blumenschine R.J., Marean C.W., Capaldo S.D. (1996), Blind tests of inter-analyst correspon-dence and accuracy in the identification of cut marks, percussion marks, and carnivore tooth marks on bone surfaces, Journal of Archaeological Science 23:493-507.
Blumenschine R.J., Selvaggio M.M. (1988), Percussion marks on bone surfaces as a new diagno-stic of hominid behaviour, Nature 333:763-765.
Blumenschine R.J., Selvaggio M.M. (1991), On the marks of marrow bone processing by ham-merstones and hyenas: their anatomical patterning and archaeological implications [in:] “Cul-tural beginnings”, J.D. Clark (ed.), Habelt: Bonn, pp. 17-32.
Bocquet-Appel J.-P. (2002), Paleoanthropological traces of a Neolithic demographic transition, Current Anthropology 43(4):637-650.
Bocquet-Appel J.-P., Masset C. (1996), Paleodemography: expectancy and false hope, American Journal of Physical Anthropology 99:571-583.
Boaz N.T., Ciochon R.L., Xu Q., Liu J. (2000), Large mammalian carnivores as a taphono-mic factor in the bone accumulation at Zhoukoudian, Acta Anthropologica Sinica 19(S):224-234.
Bollongino R., Vigne J.-D. (2008), Temperature monitoring in archaeological animal bone samples in the Near East arid area, before, during and after excavation, Journal of Archaeolo-gical Science 35:873-881.
Bond G., Showers W., Cheseby M., Lotti R., Almasi P., deMenocal P., Priore P., Cullen H., Hadjas I., Bonani G. (1997), A pervasive millennial scale cycle in North Atlantic Holocene and glacial climates, Science 278:1257-1265.
Bonsall C., Macklin M.G., Anderson D.E., Payton R.W. (2002), Climatic change and the adoption of agriculture in north-west Europe, European Journal of Archaeology 5(1):9-23.
Boserup E. (1965), The conditions of agricultural growth. The economics of agrarian change under population pressure, Aldine: Chicago.
Boule E.-L. (2001), Evolution of two human skeletal markers of the squatting position: a dia-chronic study from antiquity to the modern age, American Journal of Physical Anthropology 115:50-56.
Bradley R. (2005), Ritual and domestic life in prehistoric Europe, Routledge: London.Brand L.R., Hussey M., Taylor J. (2003), Decay and disarticulation of small vertebrates in
controlled experiments, Journal of Taphonomy 1(2):69-95.Brain C.K. (1981), The hunters or the hunted? An introduction to African cave taphonomy,
University of Chicago Press: Chicago.Brink M., Belay G., ed. (2006), Plant resources of tropical Africa 1. Cereals and pulses, PROTA
Foundation: Wageningen.

204
Brooks S.T., Suchey J.M. (1990), Skeletal age determination based on the os pubis: a comparison of the Acsadi-Nemeskeri and Suchey-Brooks methods, Human Evolution 5:227-238.
Brothwell D. (1981), Digging up bones, Cornell University Press: Ithaca.Brown J.L. (2006), Morphological variation of the proximal femur in selected skeletal remains,
unpublished MA dissertation, Wichita State University.Budd P., Millard A., Chenery C., Lucy S., Roberts C. (2004), Investigating population move-
ment by stable isotope analysis: a report from Britain, Antiquity 78(299):127-141.Bueler L.E. (1973), Wild dogs of the world, Stein & Day: New York.Buikstra J.E., Ubelaker D.H., ed. (1994), Standards of data collection from human skeletal
remains, “Arkansas Archaeological Survey Research Series” 44, Fayetteville.Butzer K.W. (1976), Early hydraulic civilization in Egypt. A study in cultural ecology, Univer-
sity of Chicago: Chicago.Butzer K.W. (1995), Environmental change in the Near East and human impact on the land
[in:] “Civilizations of the ancient Near East”, J.M. Sasson et al. (ed.), vol. I, Charles Scrib-ner's Sons: New York, pp. 123-151.
Buxton L.H.D. (1938), Platymeria and platycnemia, Journal of Anatomy 73:31-36.Buzon M.R., Simonetti A., Creaser R.A. (2007), Migration in the Nile Valley during the New
Kingdom period: a preliminary strontium isotope study, Journal of Archaeological Science 34:1391-1401.
Caceres I., Lozano M., Saladie P. (2007), Evidence of Bronze Age cannibalism in El Mirador Cave (Sierra de Atapuerca, Burgos, Spain), American Journal of Physical Anthropology 133:899-917.
Calce S.E., Rogers T.L. (2007), Taphonomic changes to blunt force trauma: a preliminary study, Journal of Forensic Sciences 52(3):519-527.
Cameriere R., Ferrante L., Belcastro M.G., Bonfiglioli B., Rastelli E., Cingolani M. (2007), Age estimation by pulp/tooth ratio in canines by peri-apical X-rays, Journal of Forensic Scien-ces 52(1):166-170.
Cameriere R., Ferrante L., Ermenc B., Mirtella D., Štrus K. (2008), Age estimation using car-pals: Study of a Slovenian sample to test Cameriere’s method, Forensic Science International 174:178-181.
Canti M.G. (2003), Earthworm activity and archaeological stratigraphy: a review of products and processes, Journal of Archaeological Science 30:135-148.
Capaldo S.D., Blumenschine R.J. (1994), A quantitative diagnosis of notches made by ham-merstone percussion and carnivore gnawing on bovid long bones, American Antiquity 59(4):724-748.
Capinera J.L., ed. (2008), Encyclopedia of entomology, vol. 3, Springer: Heidelberg.Cardoso H.F.V. (2008), Sample-specific (universal) metric approaches for determining the sex of
immature human skeletal remains using permanent tooth dimensions, Journal of Archaeolo-gical Science 35:158-168.
Cardoso H.F.V., Saunders S.R. (2008), Two arch criteria of the ilium for sex determination of immature skeletal remains: A test of their accuracy and an assessment of intra- and inter-obse-rver error, Forensic Science International 178:24-29.
Carpenter K. (2007), How to make a fossil: part 1 – fossilizing bone, The Journal of Paleonto-logical Sciences JPS.C.07.0001.
Carson E.A. (2006), Maximum-likelihood variance components analysis of heritabilities of cra-nial nonmetric traits, Human Biology 78(4):383-402.

205
Carter E. (1977), The Babylonian story of the flood: An archaeological interpretation [in:] “Mo-untains and lowlands. Essays in the archaeology of Greater Mesopotamia”, L.D. Levine & T.C. Young Jr. (ed.), Malibu, pp. 9-15.
Case D.T., Ross A.H. (2007), Sex determination from hand and foot bone lengths, Journal of Forensic Sciences 52(2):264-270.
Ceccanti B., Landi A., Bartoli F., Mallegni F., Masciandaro G., Carmignani A., Macci C. (2007), Study and control of the geochemical processes responsible of diagenetic alteration of archaeological bones, Atti della Società toscana di scienze naturali residente in Pisa. Memo-rie. Serie A 112:61-68.
Ceccarelli S., Grando S., Baum M. (2007), Participatory plant breeding in water-limited envi-ronments, Experimental Agriculture 43:411-435.
Chamberlain A. (2000), Problems and prospects in palaeodemography [in:] “Human osteology: in archaeology and forensic science”, M. Cox & S. Mays (eds.), Greenwich Medical Me-dia: London, pp. 101-115.
Chamberlain A. (2006), Demography in archaeology, Cambridge University Press: Cambridge.Chapman M. (1980), Infanticide and fertility among Eskimos: A computer simulation, Ameri-
can Journal of Physical Anthropology 53(2):317-327.Charkes N.D., Siddhivarn N., Schneck C.D. (1987), Bone scanning in the adductor insertion
avulsion syndrome (“thigh splints”), Journal of Nuclear Medicine 28:1835-1838.Charles M.P. (1990), Traditional crop husbandry in southern Iraq 1900-1960 A.D., Bulletin
on Sumerian Agriculture 5:47-64.Chase D.A. (1987), ina šitkuki napišti: Starvation (Kwashiorkor-marasmus) in Atra-hasis, Jo-
urnal of Cuneiform Studies 39(2):241-246.Chen P.Y., Stokes A.G., McKittrick J. (2009) Comparison of the structure and mechanical
properties of bovine femur bone and antler of the North American elk (Cervus elaphus cana-densis), Acta Biomaterialia 5:693-706.
Chew S.C. (2007), The recurring Dark Ages: ecological stress, climate changes, and system trans-formation, AltaMira Press: Lanham.
Child A.M. (1995), Microbial taphonomy of archaeological bone, “Studies in Conservation” 40(1):19-30.
Child A.M. (1995a), Towards an understanding of the microbial decomposition of archaeological bone in the burial environment, Journal of Archaeological Science 22:165-174.
Choyke A.M., Schibler J. (2007), Prehistoric bone tools and the archaeozoological perspective: research in Central Europe [in:] “Bones as tools: current methods and interpretations in wor-ked bone studies”, Ch. Gates St-Pierre, R.B. Walker (eds.), Oxbow: Oxford, pp. 51-65.
Churchill S.E., Morris A.G. (1998), Muscle marking morphology and labour intensity in prehi-storic Khoisan foragers, International Journal of Osteoarchaeology 8:390-411.
Clare L., Rohling E.J., Weninger B., Hilpert J. (2008), Warfare in Late Neolithic/Early Chal-colithic Pisidia, southwestern Turkey. Climate induced social unrest in the late 7th millennium calBC, Documenta Prehistorica 35:65-92.
Clement D.B. (1974), Tibial stress syndrome in athlets, American Journal of Sports Medicine 2(2):81-85.
Coale A.J., Demeny P., Vaughan B. (1983), Regional model life tables and stable populations, Academic Press: New York & London 1983.
Cockburn T.A. (1971), Infectious diseases in ancient populations, Current Anthropology 12(1):45-62.
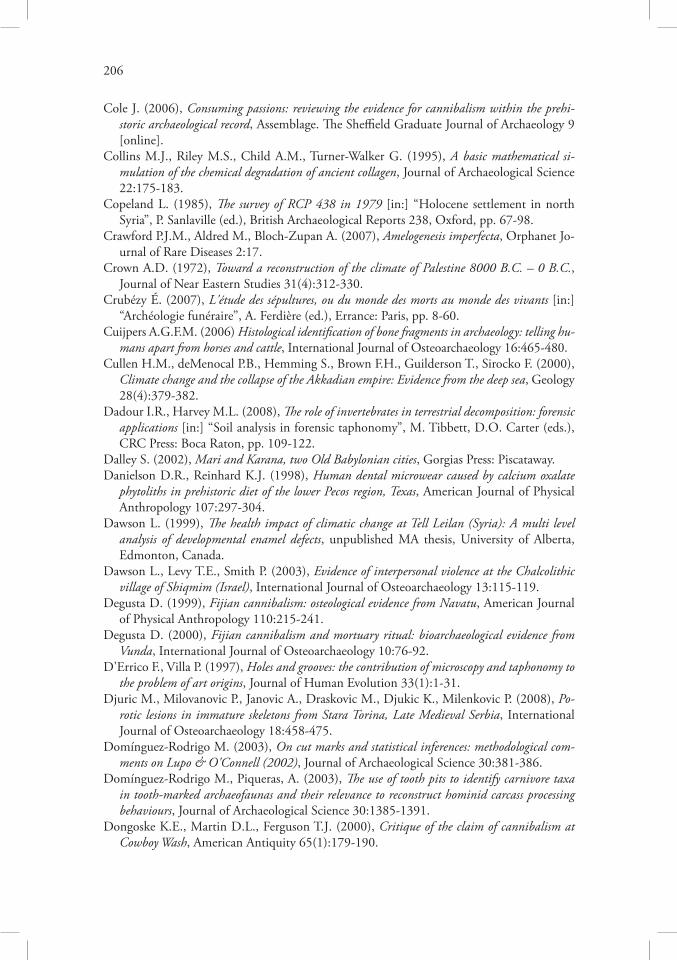
206
Cole J. (2006), Consuming passions: reviewing the evidence for cannibalism within the prehi-storic archaeological record, Assemblage. The Sheffield Graduate Journal of Archaeology 9 [online].
Collins M.J., Riley M.S., Child A.M., Turner-Walker G. (1995), A basic mathematical si-mulation of the chemical degradation of ancient collagen, Journal of Archaeological Science 22:175-183.
Copeland L. (1985), The survey of RCP 438 in 1979 [in:] “Holocene settlement in north Syria”, P. Sanlaville (ed.), British Archaeological Reports 238, Oxford, pp. 67-98.
Crawford P.J.M., Aldred M., Bloch-Zupan A. (2007), Amelogenesis imperfecta, Orphanet Jo-urnal of Rare Diseases 2:17.
Crown A.D. (1972), Toward a reconstruction of the climate of Palestine 8000 B.C. – 0 B.C., Journal of Near Eastern Studies 31(4):312-330.
Crubézy É. (2007), L'étude des sépultures, ou du monde des morts au monde des vivants [in:] “Archéologie funéraire”, A. Ferdière (ed.), Errance: Paris, pp. 8-60.
Cuijpers A.G.F.M. (2006) Histological identification of bone fragments in archaeology: telling hu-mans apart from horses and cattle, International Journal of Osteoarchaeology 16:465-480.
Cullen H.M., deMenocal P.B., Hemming S., Brown F.H., Guilderson T., Sirocko F. (2000), Climate change and the collapse of the Akkadian empire: Evidence from the deep sea, Geology 28(4):379-382.
Dadour I.R., Harvey M.L. (2008), The role of invertebrates in terrestrial decomposition: forensic applications [in:] “Soil analysis in forensic taphonomy”, M. Tibbett, D.O. Carter (eds.), CRC Press: Boca Raton, pp. 109-122.
Dalley S. (2002), Mari and Karana, two Old Babylonian cities, Gorgias Press: Piscataway.Danielson D.R., Reinhard K.J. (1998), Human dental microwear caused by calcium oxalate
phytoliths in prehistoric diet of the lower Pecos region, Texas, American Journal of Physical Anthropology 107:297-304.
Dawson L. (1999), The health impact of climatic change at Tell Leilan (Syria): A multi level analysis of developmental enamel defects, unpublished MA thesis, University of Alberta, Edmonton, Canada.
Dawson L., Levy T.E., Smith P. (2003), Evidence of interpersonal violence at the Chalcolithic village of Shiqmim (Israel), International Journal of Osteoarchaeology 13:115-119.
Degusta D. (1999), Fijian cannibalism: osteological evidence from Navatu, American Journal of Physical Anthropology 110:215-241.
Degusta D. (2000), Fijian cannibalism and mortuary ritual: bioarchaeological evidence from Vunda, International Journal of Osteoarchaeology 10:76-92.
D'Errico F., Villa P. (1997), Holes and grooves: the contribution of microscopy and taphonomy to the problem of art origins, Journal of Human Evolution 33(1):1-31.
Djuric M., Milovanovic P., Janovic A., Draskovic M., Djukic K., Milenkovic P. (2008), Po-rotic lesions in immature skeletons from Stara Torina, Late Medieval Serbia, International Journal of Osteoarchaeology 18:458-475.
Domínguez-Rodrigo M. (2003), On cut marks and statistical inferences: methodological com-ments on Lupo & O'Connell (2002), Journal of Archaeological Science 30:381-386.
Domínguez-Rodrigo M., Piqueras, A. (2003), The use of tooth pits to identify carnivore taxa in tooth-marked archaeofaunas and their relevance to reconstruct hominid carcass processing behaviours, Journal of Archaeological Science 30:1385-1391.
Dongoske K.E., Martin D.L., Ferguson T.J. (2000), Critique of the claim of cannibalism at Cowboy Wash, American Antiquity 65(1):179-190.

207
Douglas Price T., Blitz J., Burton J., Ezzo J.A. (1992), Diagenesis in prehistoric bone: problems and solutions, Journal of Archaeological Science 19:513-529.
Downs D. (1988), Human skeletal remains [in:] “Tell Rubeidheh. An Uruk village in the Jebel Hamrin”, R.G. Killick (ed.), Iraq Archaeological Reports 2, Baghdad, p. 38.
Duday H. (2005), Lezioni di archeotanatologia, Soprintendenza Archeologica di Roma: Roma.Dupras T.L., Schwarcz H.P., Fairgrieve S.I. (2001), Infant feeding and weaning practices in
Roman Egypt, American Journal of Physical Anthropology 115:204-212.Duray S.M. (1996), Dental indicators of stress and reduced age at death in prehistoric Native
Americans, American Journal of Physical Anthropology 99:275-286.Duric M., Rakocevic Z., Tuller H. (2004), Factors affecting postmortem tooth loss, Journal of
Forensic Sciences 49(6):1313-1318.Dutour O. (1986), Enthesopathies (lesions of muscular insertion) as indicators of the activities of
Neolithic Saharan populations, American Journal of Physical Anthropology 71:221-224.Edwards H.G.M., Wilson A.S., Nik Hassan N.F., Davidson A., Burnett A. (2007), Raman
spectroscopic analysis of human remains from a seventh century cist burial on Anglesey, UK, Analytical and Bioanalytical Chemistry 387(3):821-828.
Egeland C.P. (2007), Zooarchaeological and taphonomic perspectives on hominid and carnivore interactions at Olduvai Gorge, Tanzania, unpublished PhD thesis, Indiana University.
Eickhoff S., Herrmann B. (1985), Surface marks on bones from a Neolithic collective grave (Odagsen, Lower Saxony): a study on differential diagnostics, Journal of Human Evolution 14:263-274.
Eidem J., Warburton D. (1996), In the land of Nagar: A survey around Tell Brak, Iraq 58:51-64.
El-Banna S., Zalat S., Abo-Ghalia A., Gilbert F. (1999), Territoriality and foraging behaviour of some solitary wasps in Egypt, Egyptian Journal of Biology 1:96-103.
Ellison P.T. (1994), Advances in human reproductive ecology, Annual Review of Anthropology 23:255-275.
Elmoslimany A.P. (1990), Ecological significance of common nonarboreal pollen. Examples from drylands of the Middle East, Review of Palaeobotany and Palynology 64:343-350.
Eshed V., Gopher A., Galili E., Hershkovitz I. (2004), Musculoskeletal Stress Markers in Natu-fian hunter-gatherers and Neolithic farmers in the Levant: The upper limb, American Journal of Physical Anthropology 123:303-315.
Eshed V., Hershkovitz I., Goring-Morris A.N. (2008), A re-evaluation of burial customs in the Pre-Pottery Neolithic B in light of paleodemographic analysis of the human remains from Kfar HaHoresh, Israel, Paléorient 34(1):91-103.
Faith J.T. (2007), Sources of variation in carnivore tooth-mark frequencies in a modern spotted hyena (Crocuta crocuta) den assemblage, Amboseli Park, Kenya, Journal of Archaeological Science 34:1601-1609.
Faith J.T., Behrensmeyer A.K. (2006), Changing patterns of carnivore modification in a landscape bone assemblage, Amboseli Park, Kenya, Journal of Archaeological Science 33:1718-1733.
Faith J.T., Marean C.W., Behrensmeyer A.K. (2007), Carnivore competition, bone destruction, and bone density, Journal of Archaeological Science 34:2025-2034.
Feik S.A., Thomas C.D.L., Bruns R., Clement J.G. (2000), Regional variations in cortical modelling in femoral mid-shaft: sex and age differences, American Journal of Physical An-thropology 112:191-205.
Ferembach D. (1970), Étude anthropologique des ossements humain proto-neolithiques de Zawi Chemi Shanidar (Iraq), Sumer 26:21-65.

208
Finnegan M. (1978), Non-metric variation of the infracranial skeleton, Journal of Anatomy 125(1):23-37.
Fiorillo A. (1989), An experimental study of trampling: implications for the fossil record [in:] “Bone modification”, R. Bonnichsen, H. Sorg (eds.), Center for the Study of the First Americans: Orono, pp. 61-71.
Fisher J.W. (1995), Bone surface modifications in zooarchaeology, Journal of Archaeological Method and Theory 2(1):7-68.
Flannery K.V. (1969), Origins and ecological effects of early Near Eastern domestication [in:] “The domestication and exploitation of plants and animals”, P.J. Ucko & G.W. Dimbleby (ed.), Beresford Book: London, pp. 73-100.
Flannery K.V. (1973), The origins of agriculture, Annual Review of Anthropology 2:271-310.Fogelin L. (2007), The archaeology of religious ritual, Annual Review of Anthropology 36:
55-71.Forbes R.J. (1971), Studies in ancient technology, vol. 8, Brill: Leiden.Forbes S.L. (2008), Decomposition chemistry in a burial environment [in:] “Soil analysis in foren-
sic taphonomy”, M. Tibbett, D.O. Carter (eds.), CRC Press: Boca Raton, pp. 203-223.Forbes S.L. (2008a), Potential determinants of postmortem and postburial interval of buried
remains [in:] “Soil analysis in forensic taphonomy”, M. Tibbett, D.O. Carter (eds.), CRC Press: Boca Raton, pp. 225-246.
Franklin D., Oxnard C.E., O'Higgins P., Dadour I. (2007), Sexual dimorphism in the suba-dult mandible: quantification using geometric morphometrics, Journal of Forensic Sciences 52(1):6-10.
Galloway A. (1996), The process of decomposition: a model from the Arizona-Sonoran desert [in:] “Forensic taphonomy. The postmortem fate of human remains”, W.D. Haglund, M.H. Sorg (eds.), CRC Press: Boca Raton, pp. 139-150.
Garcia Mata S., Hidalgo Ovejero A., Martinez Grande M. (1995), Plantar dislocation of the first metatarsophalangeal joint during lactation, International Orthopaedics 19(1):65-66.
Gardner E.D. (1963), Physiology of joints, Journal of Bone and Joint Surgery 45:1061-1066.Gibbons A. (1997), Archaeologists rediscover cannibals, Science 277:635-637.Gibson M. (1976), By stage and cycle to Sumer [in:] “The legacy of Sumer”, D. Schmandt-
-Besserat (ed.), Undena Publications: Malibu, pp. 51-58.Gibson M. (1980), Current research at Nippur: Ecological, anthropological and documentary
interplay [in:] “L'archéologie de l'Iraq du début de l'époque néolithique à 333 avant notre ère, Paris 13-15 juin 1978”, T. Barrelet (ed.), Colloques internationaux du CNRS 580, Paris, pp. 193-206.
Gibson M. (1992), Patterns of occupation at Nippur [in:] “Nippur at the centennial. Papers read at the 35th Rencontre Assyriologique Internationale, Philadelphia 1988”, M. Ellis (ed.), Philadelphia, pp. 33-54.
Gill-King H. (1996), Chemical and ultrastructural aspects of decomposition [in:] “Forensic ta-phonomy. The postmortem fate of human remains”, W.D. Haglund, M.H. Sorg (eds.), CRC Press: Boca Raton, pp. 93-108.
Gifford D.P. (1984), Taphonomic specimens, Lake Turkana, National Geographic Research Reports 17:419-428.
Gifford-Gonzales D.P., Damrosch D.B., Damrosch D.R., Pryor J., Thunen R.L. (1985), The third dimension in site structure: an experiment in trampling and vertical dispersal, American Antiquity 50:803-818.

209
González-Reimers F., Santolaria-Fernández F., Moreno-García A., Batista-López N., Ro-dríguez-Moreno F. (1993), Harris lines and ethanol consumption during growth period, In-ternational Journal of Anthropology 8(1):21-25.
Goodman A.H., Armelagos G.J. (1988), Childhood stress, cultural buffering, and decreased longevity in a prehistoric population, American Anthropologist 90:936-944.
Goodman A.H., Rose J.C. (1991), Dental enamel hypoplasias as indicators of nutritional status [in:] “Advances in dental anthropology”, M.A. Kelley, C.S. Larsed (ed.), Wiley-Liss: New York, pp. 279-293.
Graw M., Czarnetzki A., Haffner H.-T. (1999), The form of the supraorbital margin asa criterion in identification of sex from the skull: investigations based on modern human skulls, American Journal of Physical Anthropology 108:91-96.
Griffin R.C., Donlon D. (2007), Dental enamel hypoplasias and health changes in the Middle Bronze Age – Early Iron Age transition at Pella in Jordan, HOMO - Journal of Comparative Human Biology 58(3):211-220.
Groot M. (2009), Searching for patterns among special animal deposits in the Dutch river area during the Roman period, Journal of Archaeology in the Low Countries 1(2):49-81.
Gruber M.I. (1989), Breast-feeding practices in Biblical Israel and in Old Babylonian Mesopo-tamia, Journal of Ancient Near Eastern Society 19:61-83.
Gualdi-Russo E. (2007), Sex determination from the talus and calcaneus measurements, Foren-sic Science International 171(2):151-156.
Gügel I.L., Grupe G., Kunzelmann K.H. (2001), Simulation of dental microwear: characteri-stic traces by opal phytoliths give clues to ancient human dietary behavior, American Journal of Physical Anthropology 114:124-138.
Gustafson B.G., Quensel C.E., Swedlander L.L., Lundquist C., Granen H., Bonow B.E., Krasse B. (1954), The Vipeholm dental caries study. The effect of different levels of carbohy-drate intake on caries activity in 436 individuals observed for five years, Acta Odontologica Scandinavica 11:232-364.
Ha J.H., Choi I.H., Chung C.Y., Cho T.J., Jung S.T., Lee H.S., Park S.S., Lee H.Y., Oh C.W., Kim I.O. (2003), Distribution of lengths of the normal femur and tibia in Korean children from three to sixteen years of age, Journal of Korean Medical Science 18:715-721.
Haglund W.D. (1997), Dogs and coyotes: postmortem involvement with human remains [in:] “Forensic taphonomy. The postmortem fate of human remains”, W.D. Haglund, M.H. Sorg (eds.), CRC Press: Boca Raton, pp. 367-381.
Haglund W.D. (1997a), Rodents and human remains [in:] “Forensic taphonomy. The post-mortem fate of human remains”, W.D. Haglund, M.H. Sorg (eds.), CRC Press: Boca Raton, pp. 405-414.
Haglund W.D., Reay D.Y., Swindler D.R. (1988), Tooth artifacts and survival of bones in animal-scavenged human skeletons, Journal of Forensic Sciences 33:985-997.
Haglund W.D., Reay D.Y., Swindler D.R. (1989), Canid scavenging/disarticulation sequence of humans in the Pacific Northwest, Journal of Forensic Sciences 34:587-606.
Hald M.M. (2008), A thousand years of farming. Late Chalcolithic agricultural practices at Tell Brak in Northern Mesopotamia, BAR International Series 1880, Archaeopress: Oxford.
Hald M.M., Charles M. (2007), Brak 2006-7 preliminary archaeobotanical report, Iraq 69:166-167.
Hamdi A., Erskine W., Gates P. (1992), Adaption of lentil seed yield to varying moisture supply, Crop Science 32:987-990.

210
Harrison T. (1959), New archaeological and ethnological results from Niah Caves, Sarawak, Man 59:1-8.
Hassan F.E. (1981), Demographic archaeology, Elsevier: New York.Hassan F.E. (1988), The Predynastic of Egypt, Journal of World Prehistory 2:135-185. Hauser G., DeStefano G.F. (1989), Epigenetic variants of the human skull, E. Schweizerbart-
sche Verlagsbuchhandlung: Stuttgart.Hawkey D.E., Merbs C.F. (1995), Activity-induced musculoskeletal stress markers (MSM) and
subsistence strategy changes among ancient Hudson Bay Eskimos, International Journal of Osteoarchaeology 5:324-338.
Haverkort C.M., Weber A., Katzenberg M.A., Goriunova O., Simonetti A., Creaser R.A. (2008), Hunter-gatherer mobility strategies and resource use based on strontium isotope (87Sr/86Sr) analysis: a case study from Middle Holocene Lake Baikal, Siberia, Journal of Archaeolo-gical Science 35:1265-1280.
Haynes G. (1980), Evidence of carnivore gnawing on Pleistocene and recent mammalian bones, Paleobiology 6(3):341-351.
Haynes G. (1980a), Prey bones and predators: potential ecologic information from analysis of bone sites, Ossa 7:75-97.
Haynes G. (1982), Utilization and skeletal disturbances of North American prey carcasses, Arctic 35:266-281.
Haynes G. (1983), A guide for differentiating mammalian carnivore taxa responsible for gnaw damage to herbivore limb bones, Paleobiology 9(2):164-172.
Haynes G. (1983a), Frequencies of spiral and green-bone fractures on ungulate limb bones in modern surface assemblages, American Antiquity 48(1):102-114.
Hede S.U. (2003), Prehistoric settlements and Holocene relative sea-level changes in northwest Sjælland, Denmark, Bulletin of the Geological Society of Denmark 50:141-149.
Hedges R.E.M., Millard A.R., Pike A.W.G. (1995), Measurements and relationships of dia-genetic alteration of bone from three archaeological sites, Journal of Archaeological Science 22:201-209.
Hedges R.E.M., Reynard L.M. (2007), Nitrogen isotopes and the trophic level of humans in archaeology, Journal of Archaeological Science 34:1240-1251.
Hens S.M., Rastelli E., Belcastro G. (2008), Age estimation from the human os coxa: A test on a documented Italian collection, Journal of Forensic Sciences 53(5):1040-1043.
Hershkovitz I., Gopher A. (2008), Demographic, biological and cultural aspects of the Neolithic Revolution: A view from the Southern Levant [in:] “The Neolithic demographic transition and its consequences”, J.-P. Bocquet-Appel, O. Bar-Yosef (ed.), Springer: Dordrecht, pp. 441-479.
Hershkovitz I., Latimer B., Dutour O., Jellema L.M., Wizh-Baratz S., Rothschild C., Ro-thschild B.M. (1997), Why do we fail in aging the skull from the sagittal suture?, American Journal of Physical Anthropology 103:393-399.
Hill A.P. (1979), Butchery and natural disarticulation: an investigatory technique, American Antiquity 44(4):739-744.
Hill A.P. (1979a), Disarticulation and scattering of mammal skeletons, Paleobiology 5:261-274.Hill A.P., Behrensmeyer A.K. (1984), Disarticulation patterns of some modern East African
mammals, Paleobiology 10:366-376.Hill A.P., Behrensmeyer A.K. (1985), Natural disarticulation and bison butchery, American
Antiquity 50(1):151-145.Hillson S. (1996), Dental anthropology, Cambridge University Press: Cambridge.

211
Hillson S., Bond S. (1997), Relationship of enamel hypoplasia to the pattern of tooth crown growth: a discussion, American Journal of Physical Anthropology 104:89-103.
Hole F. (1997), Evidence for Mid-Holocene environmental change in the western Khabur dra-inage, northeastern Syria [in:] “Third millennium BC climate change and old world collap-se”, H.N. Dalfes, G. Kukla, H. Weiss (ed.), NATO ASI series I 49, Berlin & Heidelberg, pp. 39-66.
Hole F. (1998), Paleoenvironment and human society in the Jezireh of Northern Mesopotamia 20,000-6,000 BP, Paléorient 23(2):39-49.
Holt B.M. (2003), Mobility in Upper Paleolithic and Mesolithic Europe: evidence from the lower limb, American Journal of Physical Anthropology 122:200-215.
Hong Y.T., Wang Z.G., Jiang H.B., Lin Q.H., Hong B., Zhu Y.X., Wang Y., Xu L.S., Leng X.T., Li H.D. (2001), A 6000-year record of changes in drought and precipitation in nor-theastern China based on a δ13C time series from peat cellulose, Earth and Planetary Science Letters 185:111-119.
Hopkins D.W. (2008), The role of soil organisms in terrestrial decomposition [in:] “Soil analysis in forensic taphonomy”, M. Tibbett, D.O. Carter (eds.), CRC Press: Boca Raton, pp. 53-66.
Hoppa R.D. (2000), Population variation in osteological aging criteria: an example from the pubic symphysis, American Journal of Physical Anthropology 111:185-191.
Howells W.W. (1989), Skull shapes and the map: Craniometric analyses in the dispersion of modern Homo, Papers of the Peabody Museum of Archaeology and Ethnology, Harvard University 79, Harvard.
Hrdy S.B. (1994), Fitness tradeoffs in the history and evolution of delegated mothering with special reference to wet-nursing, abandonment and infanticide [in:] “Infanticide and paren-tal care”, S. Parmigiani, F.S. Vom Saal (ed.), Harwood Academic Publishers: Chur, pp. 3-41.
Hughes D.D. (1991), Human sacrifice in ancient Greece, Routledge: London.Hurlbut S.A. (2000), The taphonomy of cannibalism: a review of anthropogenic bone modifica-
tion in the American Southwest, International Journal of Osteoarchaeology 10(1):4-26.Ilaiwi M. (2001), Soils of the Syrian Arab Republic [in:] “Soil resources of Southern and
Eastern Mediterranean countries”, P. Zdruli et al. (eds.), CIHEAM-IAMB: Cachan, pp. 227-249.
Irish J.D. (2006), Who were the ancient Egyptians? Dental affinities among Neolithic through postdynastic peoples, American Journal of Physical Anthropology 129(4):529-543.
Irish J.D. (2010), The Mean Measure of Divergence: Its utility in model-free and model-bound analyses relative to the Mahalanobis D2 distance for nonmetric traits, American Journal of Human Biology [in print].
Jackes M. (in print), Representativeness and bias in archaeological skeletal samples [in:] “A hand-book of social bioarchaeology”, S. Agarwal, B. Glencross (eds.), Wiley-Blackwell: New York [arts.uwaterloo.ca/~mkjackes/bias.pdf ].
Jackes M., Lubell D., Meiklejohn C. (1997), Healthy but mortal: human biology and the first farmers of western Europe, Antiquity 71:639-658.
Jackes M., Sherburne R., Lubell D., Barker C., Wayman M. (2001), Destruction of micro-structure in archaeological bone: a case study from Portugal, International Journal of Oste-oarchaeology 11:415-432.

212
Jalil Jawad A. (1965), The advent of the era of townships in Northern Mesopotamia, unpublished PhD thesis, University of Chicago.
Janjua M.A., Rogers T.L. (2008), Bone weathering patterns of metatarsal v. femur and the post-mortem interval in Southern Ontario, Forensic Science International 178:16-23.
Jans M.M.E. (2008) Microbial bioerosion of bone – a review [in:] “Current developments in bio-erosion”, M. Wisshak & L. Tapanila (eds.), Springer: Berlin & Heidelberg, pp. 397-413.
Janssen C. (1991), Samsu-iluna and the hungry naditums, Northern Akkad Project Reports 5:3-39.
Jodry M.A., Stanford D.J. (1992), Stewart's Cattle Guard site: an analysis of Bison remains in a Folsom kill-butchery campsite [in:] “Ice Age hunters of the Rockies”, D.J. Stanford, J.S. Day (eds.), Colorado University Press: Niwot, pp. 101-168.
Johnson E. (1985), Current developments in bone technology [in:] “Advances in archaeological method and theory”, vol. 8, M.B. Schiffer (ed.), Academic Press: New York, pp. 157-235.
Jurmain R.D., Kilgore L. (1995), Skeletal evidence of osteoarthritis: a palaeopathological per-spective, Annals of the Rheumatic Diseases 54:443-450.
Kansa S., Campbell S. (2003), Feasting with the dead? – A ritual bone deposit at Domuztepe, south eastern Turkey (c. 5550 BC) [in:] “Behaviour behind bones: the zooarchaeology of ritual, religion, status and identity”, S. Jones O'Day, W. van Neer (eds.), Oxbow: Oxford, pp. 2-13.
Kansa S.W., Gauld S.C., Campbell S., Carter E. (2009), Whose bones are those? Preliminary comparative analysis of fragmented human and animal bones in the “death pit” at Domuztepe, a Late Neolithic settlement in southeastern Turkey, Anthropozoologica 44(1):159-172.
Kapandji I.A. (1982), The physiology of the joints, vol. 1, Churchill Livingstone: Edinburgh.Kaplan H.S., Lancaster J.B. (2003), An evolutionary and ecological analysis of human fertili-
ty, mating patterns, and parental investment [in:] “Offspring: Human fertility behavior in biodemographic perspective”, K.W. Wachter, R.A. Bulatao (ed.), The National Academic Press: Washington, pp. 170-223.
Kappel W. (1974), Irrigation development and population pressure [in:] “Irrigation's impact on society”, T.E. Downing & M. Gibson (ed.), Anthropological Papers of the University of Arizona: Tucson, pp. 159-167.
Karsgaard P., Sołtysiak A. (2007), The autumn 2006 rescue operations at Tell Majnuna [in:] McMahon A., Oates J., “Excavations at Tell Brak 2006–2007”, Iraq 69:157-158.
Katzenberg M.A. (2000), Stable isotope analysis: a tool for studying past diet, demography, and life history [in:] “Biological anthropology of the human skeleton”, M.A. Katzenberg, S.R. Saunders (eds.), Wiley-Liss: New York, pp. 305-327.
Keeley L.H. (1996), War before civilization: The myth of the peaceful savage, Oxford University Press: Oxford.
Keith A. (1927), Report on the human remains [in:] R.H. Hall & C.L. Wooley, “Ur excava-tions”, vol. 1, Oxford, pp. 214-240.
Kennedy K.A.R. (1983), Morphological variations in ulnar supinator crests and fossae as ideni-fying markers of occupational stress, Journal of Forensic Sciences 28:871-876.
Kennedy K.A.R. (1989), Skeletal markers of occupational stress [in:] “Reconstruction of life from the skeleton”, M.Y. Iscan, K.A.R. Kennedy (ed.), Wiley: New York, pp. 129-160.
Kennedy K.A.R. (1998), Markers of occupational stress: Conspectus and prognosis of research, International Journal of Osteoarchaeology 8:305-310.

213
Kim D., Lee U., Park D., Kim Y., Han K., Kim K., Han S. (2006), Morphometrics of the hyoid bone for human sex determination from digital photographs, Journal of Forensic Sciences 51(5):979-984.
Kimmerle E.H., Prince D.A., Berg G.E. (2008), Inter-observer variation in methodologies invo-lving the pubic symphysis, sternal ribs, and teeth, Journal of Forensic Sciences 53(3):594-600.
Klippel W.E., Synstelien J.A. (2007), Rodents as taphonomic agents: bone gnawing by brown rats and gray squirrels, Journal of Forensic Sciences 52(4):765-773.
Knudson K.J., Price T.D., Buikstra J.E., Blom D.E. (2004), The use of strontium isotope analy-sis to investigate Tiwanaku migration and mortuary ritual in Bolivia and Peru, Archaeome-try 46(1):5-18.
Konigsberg L.W., Frankenberg S.R. (1992), Estimation of age structure in anthropological de-mography, American Journal of Physical Anthropology 89:235-256.
Konigsberg L.W., Hens S.M. (1998), Use of ordinal categorical variables in skeletal assessment of sex from cranium, American Journal of Physical Anthropology 107:97-112.
Konigsberg L.W., Herrmann N.P., Wescott D.J., Kimmerle E.H. (2008), Estimation and evi-dence in forensic anthropology: age-at-death, Journal of Forensic Sciences 53(3):541-557.
Kuckelman K.A., Lightfoot R.R., Martin D.L. (2002), The bioarchaeology and taphonomy of violence at Castle Rock and Sand Canyon Pueblos, Southwestern Colorado, American Anti-quity 67(3):486-513.
Kyle J.H. (1986), Effects of post-burial contamination on the concentrations of major and minor elements in human bones and teeth – the implications for paleodietary research, Journal of Archaeological Science 13:403-416.
Lam Y.M. (1992), Variability in the behaviour of spotted hyaenas as taphonomic agents, Journal of Archaeological Science 19:389-406.
Lambert P.M., Leonard B.L., Billman B.R., Marlar R.A., Newman M.E., Reinhard K.J. (2000), Response to critique of the claim of cannibalism at Cowboy Wash, American Antiqu-ity 65(2):397-406.
Lambert P.M., Walker P.L. (1991), Physical anthropological evidence for the evolution of social complexity in coastal Southern California, Antiquity 65:963-973.
Lancaster J.B., Kaplan H., Hill K., Hurtado A.M. (2000), The evolution of life history, in-telligence and diet among chimpanzees and human foragers [in:] “Perspectives in ethology: Evolution, culture and behavior”, F. Tonneau & N.S. Thompson (ed.), Plenum: New York, pp. 47-72.
Landt M.J. (2004), Investigations of human gnawing on small mammal bones: among contem-porary Bofi foragers of the Central African Republic, unpublished MA thesis, Washington State University.
Landt M.J. (2007), Tooth marks and human consumption: ethnoarchaeological mastication re-search among foragers of the Central African Republic, Journal of Archaeological Science 34:1629-1640.
Larsen C.S. (1995), Biological changes in human populations with agriculture, Annual Review of Anthropology 24:185-213.
Larsen C.S. (1997), Bioarchaeology. Interpreting behavior from the human skeleton, Cambridge University Press: Cambridge.
Lawler A. (2006), North versus South, Mesopotamian style, Science 312:1458-1463.Lawrence D.R. (1968), Taphonomy and information losses in fossil communities, Geological
Society of America Bulletin 79:1315-1330.

214
Lee R.B. (1980), Lactation, ovulation, infanticide, and women's work: A study of hunter-ga-therer population regulation [in:] "Biosocial mechanisms of population regulation", M.N. Cohen, R.S. Malpass, H.G. Klein (ed.), Yale University Press: New Haven, pp. 321-348.
Lewis M., Roberts C. (1997), Growing pains: the interpretation of stress indicators, Internatio-nal Journal of Osteoarchaeology 7:581-586.
Lichty E. (1971), Demons and population control, Expedition 13:22-26.Limet H. (1987), The cuisine of ancient Sumer, Biblical Archaeologist 50(3):132-147.Lindsay W.L. (1979), Chemical equilibria in soils, Wiley: New York.Lingström P., Birkhed D., Granfeldt Y., Björck K. (1993), pH measurements of human dental
plaque after consumption of starchy foods using the microtouch and the sampling method, Caries Research 27:394-401.
Listi G.A., Bassett H.E. (2006), Test of an alternative method for determining sex from the os coxae: applications for modern Americans, Journal of Forensic Sciences 51(2):248-252.
Liston M.A., Baker B.J. (1996), Reconstructing the massacre at Fort William Henry, New York, International Journal of Osteoarchaeology 6:28-41.
Littleton J., Townsend G.C. (2005), Linear enamel hypoplasia and historical change in a central Australian community, Australian Dental Journal 50(2):101-107.
Lovejoy C.O., Burstein A.H., Heiple K.G. (1976), The biomechanical analysis of bone strength: a method and its application to platycnemia, American Journal of Physical Anthropology 44:489-506.
Lovejoy C.O., Meindl R.S., Mensforth R.P., Barton T.J. (1985), Multifactorial determination of skeletal age at death: a method and blind tests of its accuracy, American Journal of Physical Anthropology 68:1-14.
Lovell N. (1994), Spinal arthritis and physical stress at Bronze Age Harappa, American Journal of Physical Anthropology 93:149-164.
Lovell N. (1997), Trauma analysis in paleopathology, Yearbook of Physical Anthropology 40:139-170.
Lucy D., Pollard A.M., Roberts C.A. (1995), A comparison of three dental techniques for esti-mating age at death in humans, Journal of Archaeological Science 22:417-428.
Lukacs J.R., Nelson G.C., Walimbe S.R. (2001), Enamel hypoplasia and childhood stress in prehistory: new data from India and Southwest Asia, Journal of Archaeological Science 28:1159-1169.
Lukacs J.R., Walimbe S.R. (1998), Physiological stress in prehistoric India: new data on lo-calized hypoplasia of primary canines linked to climate and subsistence change, Journal of Archaeological Science 25:571-585.
Lupo K.D. (1995), Hadza bone assemblages and hyena attrition: an ethnographic example of the influence of cooking and mode of discard on the intensity of scavenger ravaging, Journal of Anthropological Archaeology 14:288-314.
Lupo K.D., O'Connell J.F. (2002), Cut and tooth mark distributions on large animal bones: ethnoarchaeological data from the Hadza and their implications for current ideas about early human carnivory, Journal of Archaeological Science 29:85-109.
Lyman R.L. (1984), Broken bones, bone expediency tools, and bone pseudotools: lessons from the blast zone around Mount St. Helens, Washington, American Antiquity 49(2):315-333.
Lyman R.L. (1994), Vertebrate taphonomy, “Cambridge Manuals in Archaeology”, Cambrid-ge: Cambridge University Press.

215
Maat G.J.R., Mastwijk R.W., van der Velde E.A. (1997), On the reliability of non-metrical morphological sex determination of the skull compared with that of the pelvis in the Low Co-untries, International Journal of Osteoarchaeology 7:575-580.
MacLauglin S.M., Bruce M.F. (1986), The sciatic notch/acetabulum index as a discriminator of sex in European skeletal remains, Journal of Forensic Sciences 31:1380-1390.
Mahoney P. (2006), Dental microwear from Natufian hunter-gatherers and Early Neolithic far-mers: comparisons within and between samples, American Journal of Physical Anthropology 130:308-319.
Mahoney P. (2006a), Intertooth and interfacet dental microwear variation in an archaeological sample of modern humans from the Jordan valley, American Journal of Physical Anthropo-logy 129:39-44.
Mahoney P. (2007), Human dental microwear from Ohalo II (22,500-23,500 cal BP), southern Levant, American Journal of Physical Anthropology 131:489-500.
Maier W., Schneck G. (1982), Functional morphology of hominoid dentitions, Journal of Hu-man Evolution 11:693-696.
Mallowan M.E.L. (1947), Excavations at Brak and Chagar Bazar, Iraq 9:1-259.Mann R.W., Bass W.M., Meadows L. (1990), Time since death and decomposition of the hu-
man body: variables and observations in case and experimental field studies, Journal of Foren-sic Sciences 35:103-111.
Mann R.W., Hunt D.R. (2005), Photographic regional atlas of bone disease. A guide to patholo-gic and normal variation in the human skeleton, Charles C. Thomas: Springfield.
Marean C.W. (1991), Measuring the post-depositional destruction of bone in archaeological as-semblages, Journal of Archaeological Science 18:677-694.
Marean C.W., Spencer L.M. (1991), Impact of carnivore ravaging on zooarchaeological measu-res of element abundance, American Antiquity 56(4):645-658.
Marean C.W., Spencer L.M., Blumenschine R.J., Capaldo S.D. (1992), Captive hyaena bone choice and destruction, the schlepp efect and Olduvai archaeofaunas, Journal of Archaeologi-cal Science 19:101-121.
Margerison B.J., Knüsel C.J. (2002), Paleodemographic comparison of a catastrophic and an at-tritional death assemblage, American Journal of Physical Anthropology 119(2):134-143.
Marlar R.A., Leonard B.L., Billman B.R., Lambert P.M., Marlar J.E. (2000), Biochemicalevidence of cannibalism at a prehistoric Puebloan site in southwestern Colorado, Nature 407:74-78.
Martínez-Abadías N., Esparza M., Sjøvold T., González-José R., Santos M., Hernández M. (2009), Heritability of human cranial dimensions: comparing the evolvability of different cranial regions, Journal of Anatomy 214(1):19-35.
Martrille L., Ubelaker D.H., Cattaneo C., Seguret F., Tremblay M., Baccino E. (2007), Com-parison of four skeletal methods for the estimation of age at death on white and black adults, Journal of Forensic Sciences 52(2):302-307.
Masset C. (1980), Pression démographique? [in:] “L'archéologie de l'Iraq du début de l'époque néolithique à 333 avant notre ère, Paris 13-15 juin 1978”, Th. Barrelet (ed.), Colloques Internationaux du CNRS 580, Paris, pp. 335-342.
Masset C. (1989), Age estimation on the basis of cranial sutures [in:] “Age markers in the hu-man skeleton”, M.Y. Iscan (ed.), Charles C. Thomas: Springfield, pp. 71-103.
Masset C. (2007), Le mort aux périodes préhistoriques [in:] “Archéologie funéraire”, A. Ferdière (ed.), Errance: Paris, pp. 61-92.
Mays S. (1992), Taphonomic factors in a human skeletal assemblage, Circaea 9(2):54-58.

216
Mays S. (1998), The archaeology of human bones, Routledge: London.Mays S. (2002), The relationship between molar wear and age in an early 19th century AD
archaeological human skeletal series of documented age at death, Journal of Archaeological Science 29:861-871.
Mays S. (2003), Bone strontium : calcium ratios and duration of breastfeeding in a Medieval skeletal population, Journal of Archaeological Science 30:731-741.
Mays S., Cox M. (2000), Sex determination in skeletal remains [in:] “Human osteology: in archaeology and forensic science”, M. Cox & S. Mays (eds.), Greenwich Medical Media: London, pp. 117-129.
McClellan T.L. (1992), 12th Century B.C. Syria: Comments on Sader's paper [in:] “The crisis years: the 12th century B.C. from beyond the Danube to the Tigris”, W.A. Ward & M. Sharp Joukowsky (ed.), Kendall Hunt: Dubuque, pp. 164-173.
McCormick M. (2003), Rats, communications, and plague: towards an ecological history, Jour-nal of Interdisciplinary History 34(1):1-25.
McCorriston J., Weisberg S. (2002), Spatial and temporal variation in Mesopotamianagricultural practices in the Khabur basin, Syrian Jazira, Journal of Archaeological Science 29:485-498.
McKeown A.H., Bennett J.L. (1995), A preliminary investigation of postmortem tooth loss, Journal of Forensic Sciences 40(5):755-757.
McMahon A. (2008), Report on the excavations at Tell Brak, 2008, British Institute for the Study of Iraq Newsletter 22:6-12.
McMahon A., Oates J. (2007), Excavations at Tell Brak 2006-2007, Iraq 69:145-171.McVicker D. (2005), Notched human bones from Mesoamerica, Mesoamerican Voices 2:1-31.Meiklejohn C., Agelarakis A., Akkermans P.A., Smith P.E.L., Solecki R. (1992), Artificial
cranial deformation in the Proto-Neolithic and Neolithic Near East and its possible origin: Evidence from four sites, Paléorient 18(2):83-97.
Meijer D.J.W. (1986), A survey of northeastern Syria, “Publications de l'Institut Histo-rique–Archéologique Neerlandais de Stamboul” 58, Leiden.
Meindl R.S., Lovejoy C.O. (1985), Ectocranial suture closure: a revised method for the deter-mination of skeletal age at death based on the lateral-anterior sutures, American Journal of Physical Anthropology 68:57-66.
Meindl R.S., Lovejoy C.O. (1989), Age changes in the pelvis: implications for paleodemography [in:] “Age markers in the human skeleton”, M.Y. Iscan (ed.), Charles C. Thomas: Spring-field, pp. 137-168.
Meindl R.S., Lovejoy C.O., Mensforth R.P., Carlos L.D. (1985), Accuracy and determination of error in the sexing of the skeleton, American Journal of Physical Anthropology 68:79-85.
Meindl R.S., Russell K.F. (1998), Recent advances in method and theory in paleodemography, Annual Review of Anthropology 27:375-399.
Meinl A., Huber C.D., Tangl S., Gruber G.M., Teschler-Nicola M., Watzek G. (2008), Com-parison of the validity of three dental methods for the estimation of age at death, Forensic Science International 178:96-105.
Meza Peñaloza A. (2007), Estudio osteológico y funcional de raspadores elaborados con frontales humanos en La Ventilla, Teotihuacan, temporada 92-94, Estudios de Antropología Bioló-gica 13:150-170.
Michael R.H., Holder L.E. (1985), The soleus syndrome. A cause of medial tibial stress (shin splints), American Journal of Sport Medicine 13(2):87-94.
217
Miles A.E.W. (2001), The Miles method of assessing age from tooth wear revisited, Journal of Archaeological Science 28:973-982.
Millard A.R., Gowland R.L. (2002), A Bayesian approach to the estimation of the age of humans from tooth development and wear, Archeologia e Calcolatori 13:197-210.
Miller G.J. (1975), A study of cuts, grooves and other marks on recent and fossil bone. II. Weathe-ring cracks, fractures, splinters and other similar natural phenomena [in:] “Lithic technology, making and using stone tools”, E. Swanson (ed.), Mouton: The Hague, pp. 211-226.
Milner G.R. (1999), Warfare in prehistoric and early historic Eastern North America, Journal of Archaeological Research 7:105-151.
Milner G.R., Larsen C.S., Hutchinson D.L., Williamson M.A. (2000), Conquistadors, excavators, or rodents: What damaged the King Site skeletons?, American Antiquity 65(2):355-363.
Milner G.R., Smith V.G. (1989), Carnivore alteration of human bone from a late prehistoric site in Illinois, American Journal of Physical Anthropology 79:43-49.
Molleson T. (1992), The human remains [in:] “Excavations at Poundbury 1966–80. Vol 2: The cemeteries”, D.E. Farwell, T.I. Molleson (eds.), Dorset Natural History and Archa-eological Society: Dorchester, pp. 142-214.
Molleson T. (1994), The eloquent bones of Abu Hureyra, Scientific American 271(2):70-75.Molleson T. (2000), The people of Abu Hureyra [in:] A.M.T. Moore et al., “Village on the
Euphrates. From foraging to farming at Abu Hureyra”, Oxford University Press: Oxford, pp. 301-324, 533-544.
Molleson T. (2002), Two spindles made from human fibulae from Tell Nebi Mend, Syria,BANEA Newsletter 15:10-11.
Molleson T. (2006), Hunters of Nemrik, Studies in Historical Anthropology 3:5-18.Molleson T. (2007), A method for the study of activity related skeletal morphologies, Bioarcha-
eology of the Near East 1:5-33.Molleson T. (2007a), Times of stress at Çatalhöyük [in:] “Faces from the past: Diachronic
patterns in the biology of human populations from the Eastern Mediterranean. Papers in honour of Pat Smith”, M. Faerman, L.K. Horwitz, T. Kahana, U. Zilberman (ed.), BAR International Series 1603, Archaeopress: Oxford, pp. 140-150.
Molleson T., Campbell S. (1995), Deformed skulls at Tell Arpachiyah: the social context [in:] “The archaeology of death in the Ancient Near East”, S. Campbell & A. Green (ed.), Oxbow: Oxford, pp. 45-55.
Molleson T., Cox M. (1993), The Spitalfields project. Vol. 2: The anthropology. The Middling sort, Council for British Archaeology: York.
Molleson T., Cruse K., Mays S. (1998), Some sexually dimorphic features of the human juvenile skull ad their value in sex determination in immature skeletal remains, Journal of Archaeolo-gical Science 25:719-728.
Molleson T., Hodgson D. (2000), The porters of Ur, Isimu. Revista sobre Oriente Próximoy Egipto en la antigüedad 3:101-118.
Molleson T., Jones K., Jones S. (1993), Dietary change and the effects of food preparation on microwear patterns in the Late Neolithic of abu Hureyra, northern Syria, Journal of Human Evolution 24:455-468.
Molleson T., Simpson S. (in print), Sassanian ossuaries from Bushehr: evidence for exposure of the dead, Bioarchaeology of the Near East 3.

218
Molnar P. (2006), Tracing prehistoric activities: Musculoskeletal Stress Marker analysis of a Sto-ne-Age population on the island of Gotland in the Baltic Sea, American Journal of Physical Anthropology 129:12-23.
Monchambert J. (1984), Le futur lac du Moyen Khabour: rapport sur la prospection archéologi-que menée en 1983, Syria 61:181-218.
Moore K.L., Dalley A.F. (1999), Clinically oriented anatomy, Lippincott Williams and Wil-kins: Baltimore.
Moorey P.R.S. (1994), Ancient Mesopotamian materials and industries: the archaeological evi-dence, Oxford University Press: Oxford.
Moorrees C.F.A., Fanning E., Hunt E.E. (1963), Age variation of formation stages for ten per-manent teeth, Journal of Dental Research 42:1490-1502.
Moraitis K., Spiliopoulou C. (2006), Identification and differential diagnosis of perimortem blunt force trauma in tubular loong bones, Forensic Science, Medicine, and Pathology 2(4):221-229.
Moreno-García M., Orton C., Rackham J. (1996), A new statistical tool for comparing animal bone assemblages, Journal of Archaeological Science 23(3):437-453.
Morton R.J., Lord W.D. (2006), Taphonomy of child-sized remains: a study of scattering and scavenging in Virginia, USA, Journal of Forensic Sciences 51(3):475-479.
Murmann D.C., Brumit P.C., Schrader B.A., Senn D.R. (2006), A comparison of animal jaws and bite mark patterns, Journal of Forensic Sciences 51(4):846-860.
Murphy T.R. (1959), Gradients of dentine exposure in human tooth attrition, American Journal of Physical Anthropology 17:179-185.
Myers T.P., Voorhies M.R., Corner R.G. (1980), Spiral fractures and bone pseudotools at pale-ontological sites, American Antiquity 45(3):483-490.
Nawrocki S.P. (2009), Forensic taphonomy [in:] “Handbook of forensic anthropology and acha-eology”, S. Blau, D.H. Ubelaker (eds.), Left Coast Press: Walnut Creek, pp. 284-294.
Neumann J., Parpola S. (1987), Climatic change and the 11th-10th century eclipse of Assyria and Babylonia, Journal of Near Eastern Studies 46:161-182.
Newton D. (1989), Mother Cassowary's bones: daggers of the East Sepik province, Papua New Guinea, Metropolitan Museum Journal 24:305-325.
Nicholson R. (1996), Bone degradation, burial medium and species representation: debunking the myths, an experiment-based approach, Journal of Archaeological Science 23:513-533.
Nielsen A.E. (1991), Trampling the archaeological record: an experimental study, American Antiquity 56(3):483-503.
Nielsen M.B., Hansen K., Harlmer P., Dyrbye M. (1991), Tibial periosteal reactions in sol-diers. A cintigraphic study of 29 cases of lower leg pain, Acta Orthopaedica 62(6):531-534.
Nielsen-Marsh C.M., Smith C.I., Jans M.M.E., Nord A., Kars H., Collins M.J. (2007), Bone diagenesis in the European Holocene II: taphonomic and environmental considerations, Journal of Archaeological Science 34:1523-1531.
Oates D., Oates J. (1976), Early irrigation in Mesopotamia [in:] “Problems in economic and social archaeology”, G. Sieveking et al. (ed.), Westview Press: London, pp. 109-135.
Oates J. (1980), Land use and population in prehistoric Mesopotamia [in:] “L'archéologie de l'Iraq du début de l'époque néolithique à 333 avant notre ère, Paris 13-15 juin 1978”, Th. Barrelet (ed.), Colloques Internationaux du CNRS 580, Paris, pp. 303-314.
Oates J. (1993), Trade and power in the fifth and fourth millennia BC: New evidence from Northern Mesopotamia, World Archaeology 24(3):403-422.

219
Oates J., McMahon A., Karsgaard P., Al Quntar S., Ur J. (2007), Early Mesopotamian urba-nism: a new view from the north, Antiquity 81:585-600.
Oates J., Molleson T., Sołtysiak A. (2008), Equids and an acrobat: closure rituals at Tell Brak, Antiquity 82(316):390-400.
Oates D., Oates J., McDonald H. (1997), Excavations at Tell Brak. Vol. 1: The Mitanni and Old Babylonian periods, British School of Archaeology in Iraq & McDonald Institute for Archaeological Research: London & Cambridge.
Oates D., Oates J., McDonald H. (2001), Excavations at Tell Brak. Vol. 2: Nagar in the third millennium BC, British School of Archaeology in Iraq & McDonald Institute for Archa-eological Research: London & Cambridge.
O'Connell J.F., Lupo K.D. (2003), Reply to Dominguez-Rodrigo, Journal of Archaeological Science 30:387-390.
Ökse A.T. (2006), Early Bronze Age Graves at Gre Virike (Period IIB): An extraordinary ceme-tery on the Middle Euphrates, Journal of Near Eastern Studies 65(1):1-38.
Olsen S.L., Shipman P. (1988), Surface modification on bone: trampling versus butchery, Jour-nal of Archaeological Science 15:535-553.
O'Neill K.M. (2001), Solitary wasps: behavior and natural history, Cornell University Press: Ithaka, New York.
Ortner D.J. (2003), Identification of pathological conditions in human skeletal remains, Akade-mic Press: San Diego & London.
Otten C.M. (1948), Note on the cemetery of Eridu, Sumer 4:125-127.Outram A.K., Knüsel C., Knight S., Harding A.F. (2005), Understanding complex fragmented
assemblages of human and animal remains: a fully integrated approach, Journal of Archaeolo-gical Science 32:1699-1710.
Owsley S.D., Jantz R.L. (1996), Fordisc 2.0: Personal computer forensic discriminant functions. University of Tennessee: Knoxville.
Paine R.R. (2000), If a population crashes in prehistory, and there is no paleodemographer there to hear it, does it make a sound?, American Journal of Physical Anthropology 112:181-190.
Paine R.R., Harpending H.C. (1996), Assessing the reliability of paleodemographic fertility es-timators using simulated skeletal distributions, American Journal of Physical Anthropology 101:151-159.
Paine R.R., Harpending H.C. (1998), Effects on sample bias on paleodemographic fertility esti-mates, American Journal of Physical Anthropology 105:231-240.
Palubeckaite Z., Jankauskas R., Boldsen J. (2002), Enamel hypoplasia in Danish and Lithua-nian Late Medieval/Early Modern samples: a possible reflection of child morbidity and mortal-ity patterns, International Journal of Osteoarchaeology 12:189-201.
Parker A.G., Goudie A.S., Stokes S., White K., Hodson M.J., Manning M., Kennet D. (2006), A record of Holocene climate change from lake geochemical analyses in southeastern Arabia, Quaternary Research 66:465-476.
Passalacqua N.V. (2009), Forensic age-at-death estimation from the human sacrum, Journal of Forensic Sciences 54(2):255-262.
Pearson O.M. (2000), Activity, climate, and postcranial robusticity, Current Anthropology 41(4):569-607.
Pearson O.M., Lieberman D.E. (2004), The aging of Wolff ’s “Law”: ontogeny and responses to mechanical loading in cortical bone, Yearbook of Physical Anthropology 47:63-99.
Pennington R.L. (1996), Causes of early human population growth, American Journal of Physi-cal Anthropology 99:259-274.

220
Pereira G. (2005), The utilization of grooved human bones: a reanalysis of artificially modified human bones excavated by Carl Lumholtz at Zacapu, Michoacan, Mexico, Latin American Antiquity 16(3):293-312.
Peterson J. (1997), Tracking activity patterns through skeletal remains: A case study from Jordan and Palestine [in:] “The Prehistory of Jordan II. Perspectives from 1997”, H.G.K. Gebel, Z. Kafafi, G.O. Rollefson (ed.), Studies in Early Near Eastern Production, Subsistence, and Environment 4, Berlin, pp. 475-492.
Peterson J. (1998), The Natufian hunting conundrum: spears, atlatls, or bows? Musculoskeletal and armature evidence, International Journal of Osteoarchaeology 8:378-389.
Pfeiffer S. (1998), Variability in osteon size in recent human populations, American Journal of Physical Anthropology 106(2):219-227.
Phenice T.W. (1969), A newly developed method of sexing the os pubis, American Journal of Physical Anthropology 30:297-302.
Pickering T.R., Egeland C.P. (2006), Experimental patterns of hammerstone percussion damage on bones: implications for inferences of carcass processing by humans, Journal of Archaeologi-cal Science 33:459-469.
Pickering T.R., Wallis J. (1997), Bone modifications resulting from captive chimpanzee mastica-tion: implications for the interpretation of Pliocene archaeological faunas, Journal of Archa-eological Science 24:1115-1127.
Pietrusewsky M., Douglas M.T., Cochrane E.E., Reinke S. (2007), Cultural modifications in an adolescent earth-oven interment from Fiji: sorting out mortuary practice, The Journal of Island and Coastal Archaeology, 2(1):44-71.
Piontek J., Vancata V. (2002), Transition to agriculture in Europe: evolutionary trends in body size and body shape [in:] “Ecological aspects of past human settlements in Europe”, P. Ben-nike, E. Bodzsar, C. Susanne (ed.), Eötvös University Press: Budapest, pp. 61-92.
Pitre M.C., Mayne Correia P., Mankowski P.J., Klassen J., Currah R.S. (2009), Characteri-zing microbial biodeterioration: A histological study of human bone from ancient Mesopota-mia, paper presented at 37th Annual Conference of the Canadian Association for Physical Anthropology, Vancouver, 28-31 October 2009.
Pobiner B.L. (2007), Hominin-carnivore interactions: evidence from modern carnivore bone modification and Early Pleistocene archaeofaunas (Koobi Fora, Kenya; Olduvai Gorge, Tanza-nia), unpublished PhD thesis, The State University of New Jersey.
Pobiner B.L., Blumenschine R.J. (2003), A taphonomic perspective on the Oldowan hominid encroachment on the carnivoran paleoguild, Journal of Taphonomy 1(2):115-141.
Potts D.T. (1997), Mesopotamian civilization. The material foundations, Cornell University Press: Ithaca.
Pratt H. (2008), Crescent Beach artifact classification [in:] “The Crescent Beach site and the place of the Locarno Beach phase”, R.G. Matson (ed.), University of British Columbia: Vancouver.
Prince D.A., Konigsberg L.W. (2008), New formulae for estimating age-at-death in the Balkans utilizing Lamendin’s dental technique and Bayesian analysis, Journal of Forensic Sciences 53(3):578-587.
Qumsiyeh M.B. (1996), Mammals of the Holy Land, Texas Tech University Press: Lubbock.Rathbun T.A. (1984), Skeletal pathology from the Paleolithic through the Metal Ages in Iran and
Iraq [in:] “Paleopathology at the origins of agriculture”, M. Cohen & G. Armelagos (ed.), Academic Press: New York, pp. 137-167.

221
Rautman A.E., Fenton T.W. (2005), A case of historic cannibalism in the American West: impli-cations for southwestern archaeology, American Antiquity 70(2):321-341.
Reeves N.M. (2009), Taphonomic effects of vulture scavenging, Journal of Forensic Sciences 54(3):523-528.
Reid D.J., Dean M.C. (2000), The timing of linear hypoplasias on human anterior teeth, Amer-ican Journal of Physical Anthropology 113:135-139.
Reinard L.M., Hedges R.E.M. (2008), Stable hydrogen isotopes of bone collagen in palaeodietary and palaeoenvironmental reconstruction, Journal of Archaeological Science 35:1934-1942.
Reinhard K.J., Danielson D.R. (2005), Pervasiveness of phytoliths in prehistoric southwestern diet and implications for regional and temporal trends for dental microwear, Journal of Ar-chaeological Science 32:981-988.
Resnick D., ed. (2002), Diagnosis of bone and joint disorders, Saunders: Philadelphia.Richards M.P., Fuller B.T., Molleson T.I. (2006), Stable isotope palaeodietary study of humans
and fauna from the multi-period (Iron Age, Viking and Late Medieval) site of Newark Bay, Orkney, Journal of Archaeological Science 33:122-131.
Riehl S. (2009), Archaeobotanical evidence for the interrelationship of agricultural decision-mak-ing and climate change in the ancient Near East, Quaternary International 197:93-114.
Riehl S., Pustovoytov K.E., Hotchkiss S., Bryson R.A. (2009), Local Holocene environmental indicators in Upper Mesopotamia: Pedogenic carbonate record vs. archaeobotanical data and archaeoclimatological models, Quaternary International 209:154-162.
Rissech C., Estabrook G.F., Cunha E., Malgosa A. (2006), Using the acetabulum to estimate age at death of adult males, Journal of Forensic Sciences 51(2):213-229.
Ritzman T.B., Baker B.J., Schwartz G.T. (2008), A fine line: A comparison of methods for estimating ages of linear enamel hypoplasia formation, American Journal of Physical An-thropology 135:348-361.
Robb J.E. (1998), The interpretation of skeletal muscle sites: a statistical approach, International Journal of Osteoarchaeology 8:363-377.
Roksandic M. (2002), Position of skeletal remains as a key to understanding mortuary behavior [in:] “Advances in forensic taphonomy: method, theory, and archaeological perspective”, W.D. Haglund & M.H. Sorg (eds.), CRC Press: Boca Raton, pp. 99-117.
Rossel S., Marshall F., Peters J., Pilgram T., Adams M.D., O'Connor D. (2008), Domestica-tion of the donkey: Timing, processes, and indicators, Proceedings of the National Academy of Sciences 105(10):3715-3720.
Roth E.A. (2004), Culture, biology, and anthropolgical demography, Cambridge University Press: Cambridge.
Ruff C.B. (1987), Sexual dimorphism in human lower limb bone structure: relationship to sub-sistence strategy and sexual division of labor, Journal of Human Evolution 16:391-416.
Ruff C.B. (2002), Variation in human body size and shape, Annual Review of Anthropology 31:211-232.
Ruff C.B., Holt B.M., Sládek V., Berner M., Murphy W.A., Nedden D., Seider H., Recheis W. (2006), Body size, body proportions, and mobility in the Tyrolean “Iceman”, Journal of Human Evolution 51:91-101.
Ryan J. (1983), Phosphorus and its utilization in soils of dry regions, Geoderma 29:341-354.Safont S., Malgosa A., Subira M.E. (2000), Sex assessment on the basis of long bone circumfer-
ence, American Journal of Physical Anthropology 113:317-328.Sakaue K. (2004), Sexual determination of long bones in recent Japanese, Anthropological Sci-
ence 112:75-81.
222
Sandweiss D.H., Maasch K.A., Anderson D.G. (1999), Transitions in the mid-Holocene, Sci-ence 283(5401):499-500.
Sanford M.K., Weaver D.S. (2000), Trace element research in anthropology: new perspectives and challenges [in:] “Biological anthropology of the human skeleton”, M.A. Katzenberg, S.R. Saunders (eds.), Wiley-Liss: New York, pp. 329-350.
Sanlaville P. (1989), Considérations sur l'évolution de la basse Mésopotamie au cours des derniers millénaires, Paléorient 15(2):5-27.
Sarban S., Erol O., Yazar M., Isikan U.E. (2004), A neglected plantar dislocation of first meta-tarsophalangeal joint: a case report, Foot and Ankle Surgery 10:227-230.
Schaefer M.C., Black S.M. (2007), Epiphyseal union sequencing: aiding in the recognition and sorting of commingled remains, Journal of Forensic Sciences 52(2):277-285.
Schmidt C.W. (2001), Dental microwear evidence for a dietary shift between two nonmaize--reliant prehistoric human populations from Indiana, American Journal of Physical Anthro-pology 114:139-145.
Schmitt A. (2004), Age-at-death assessment using the os pubis and the auricular surface of the ilium: a test on an identified Asian sample, International Journal of Osteoarchaeology 14:1-6.
Schrøder N., Højlund Pedersen L., Juel Bitsch R. (2004), 10,000 years of climate change and human impact on the environment in the area surrounding Lejre, The Journal of Transdisci-plinary Environmental Studies 3(1):1-27.
Schultz M. (1988), Paläopathologische Diagnostik [in:] “Anthropologie: Handbuch der Ver-gleichenden Biologie des Menschen”, Knussman (ed.), Gustav Fisher Verlag: Stuttgart, pp. 480-496.
Schultz M. (2001), Paleohistopathology of bone: a new approach to the study of ancient diseases, American Journal of Physical Anthropology, Supplement 33:106-147.
Schurr M.R., Powell M.L. (2005), The role of changing childhood diets in the prehistoric evolu-tion of food production: An isotopic assessment, American Journal of Physical Anthropology 126(3):278-294.
Schutkowski H. (1993), Sex determination of infant and juvenile skeletons: I. Morphognostic features, American Journal of Physical Anthropology 90(2):199-205.
Schutkowski H. (2006), Human ecology. Biocultural adaptations in human communities, Eco-logical Studies 182, Springer: Berlin & Heidelberg.
Schweissing M.M., Grupe G. (2003), Tracing migration events in man and cattle by stable strontium isotope analysis of appositionally grown mineralized tissue, International Journal of Osteoarchaeology 13:96-103.
Scott E.C. (1979), Dental wear scoring technique, American Journal of Physical Anthropology 51(2):213-218.
Scott E.C. (1979a), Principal axis analysis of dental attrition data, American Journal of Physi-cal Anthropology 51(2):203-211.
Seçkin S., Coşkun Y. (2006), Mammalian remains in the pellets of long-eared owls (Asio otus) in Diyarbakır province, Turkish Journal of Zoology 30:271-278.
Séguy I., Buchet L., Bringé A. (2008), Model life tables for pre-industrial populations: first application in palaeodemography [in :] “Recent advances in palaeodemography”, J.-P. Bo-cquet-Appel (ed.), Springer: Berlin & Heidelberg, pp. 83-117.
Seidl I., Tisdell C.A. (1999), Carrying capacity reconsidered: from Malthus' population theory to cultural carrying capacity, Ecological Economics 31(3):395-408.

223
Sellen D.W., Mace R. (1997), Fertility and mode of subsistence: A phylogenetic analysis, Current Anthropology 38:878-889.
Selvaggio M.M., Wilder J. (2001), Identifying the involvement of multiple carnivore taxa with archaeological bone assemblages, Journal of Archaeological Science 28(5):465-470.
Selye H. (1956), The stress of life, McGraw-Hill: New York.Shehab A.H., Al Charabi S.M. (2006), Food of the barn owl Tyto alba in the Yahmool Area,
northern Syria, Turkish Journal of Zoology 30:175-179.Sherratt A. (1983), The secondary exploitation of animals in the Old World, World Archaeology
15(1):90-104. Shipman P. (2001), What can you do with a bone fragment?, Proceedings of the National Aca-
demy of Sciences of the United States of America 98(4):1335-1337.Sillen A. (1989), Diagenesis of the inorganic phase of cortical bone [in:] “The chemistry of pre-
historic bone”, T.D. Prince (ed.), Cambridge University Press: Cambridge, pp. 211-229.Simpson K. (1984), Archaeological survey in the vicinity of Tall al ‘Asharah, Archiv für Orient-
forschung 31:185-188.Singer R. (1956), The “bone tools” from Hopefield, American Anthropologist 58(6):1127-1134.Sjøvold T. (1984), A report on the heritability of some cranial measurements and non-metric
traits [in:] “Multivariate statistical methods in physical anthropology. A review of recent advances and current developments”, G.N. Van Vark, W.W. Howells (ed.), Springer: Dor-drecht, pp. 223-246.
Skuldbøl T.B.B. (2009), Earliest urbanism in Northern Mesopotamia. Settlement development and suburban transformation at Tell Brak, Northeastern Syria, 4000-3000 BC, unpublished PhD thesis, University of Copenhagen, Denmark.
Smith B.H. (1984), Patterns of molar wear in hunter-gatherers and agriculturalists, American Journal of Physical Anthropology 63:39-56.
Smith M. (2006), Bones chewed by canids as evidence for human excarnation: a British case study, Antiquity 80(309):671-685.
Smith M.J., Brickley M.B. (2004), Analysis and interpretation of flint toolmarks found on bones from West Tump long barrow, Gloucestershire, International Journal of Osteoarchaeology 14:18-33.
Smith P. (1972), Diet and attrition in the Natufians, American Journal of Physical Anthropol-ogy 37:233-238.
Smith P.E.L. (1972), Changes in population pressure in archaeological explanation, World Ar-chaeology 4:5-18.
Smith P.E.L. (1972a), Land-use, settlement patterns and subsistence agriculture: A demographic perspective [in:] “Man, settlement and urbanism”, P.J. Ucko et al. (ed.), Duckworth: Lon-don, pp. 409-425.
Smith P.E.L., Young T.C. jr (1972), The evolution of early agriculture in Greater Mesopotamia: A trial model [in:] “Population growth: Anthropological implications”, B.J. Spooner (ed.), MIT Press: Cambridge MA, pp. 1-59.
Sołtysiak A. (2002), Assur 2000–2001: Vorläufiger Bericht über die Bestattungen, Mitteilungen der Deutschen Orient-Gesellschaft zu Berlin 134:41-46.
Sołtysiak A. (2003), Short fieldwork report. Tell Arbid (Syria), seasons 1996–2002, Studies in Historical Anthropology 3[2006]:135-136.
Sołtysiak A. (2004), Physical anthropology and the “Sumerian problem”, Studies in Historical Anthropology 4[2006]:145-158.

224
Sołtysiak A. (2006), Frequency of dental caries as a proxy indicator of mobility: A case of the Khabur basin human populations, paper presented at the conference “Methods and per-spectives applied to the study of food practices in the ancient Near East”, Venice, Italy, 15–17.06.2006.
Sołtysiak A. (2006a), Short Fieldwork Report. Tell Arbid (Syria), seasons 1996-2002, Studies in Historical Anthropology 3:135-136.
Sołtysiak A. (2007), Preliminary report on human remains from Tell Majnuna (spring 2007) [in:] McMahon A., Oates J., “Excavations at Tell Brak 2006–2007”, Iraq 69:161-163.
Sołtysiak A. (2008), Short Fieldwork Report. Tell Majnuna (Syria), season 2006, Bioarchaeolo-gy of the Near East 2:77-94.
Sołtysiak A. (2008a), Short Fieldwork Report. Tell Barri (Syria), seasons 1980–2006, Bioarcha-eology of the Near East 2:67-71.
Sołtysiak A. (2008b), Short Fieldwork Report. Gohar Tepe and Goldar Tepe (Iran), seasons 2006–2007, Bioarchaeology of the Near East 2:71-77.
Sołtysiak A. (in print a), Human remains from Tell Barri, Area G [in:] Pecorella P.E., Pierobon Benoit R., “Tell Barri/Kahat 3. La sequenza ceramica”, CNR: Roma.
Sołtysiak A. (in print b), Human bones from Chagar Bazar. Excavation seasons 1999–2001 [in:] A. McMahon et al., “Once there was a place: Settlement archaeology at Chagar Ba-zar, 1999–2002”, British Institute for the Study of Iraq: London.
Sołtysiak A. (in print c), Human remains from Assur. Excavation seasons 2000 and 2001 [in:] P. Miglus et al., “Ausgrabungen in Assur. Wohnquartiere in der Weststadt. Teil 1”, Deut-schen Orient-Gesellschaft: Berlin.
Sołtysiak A. (in print d), The human remains from Tell Brak (Area TW). State of preservation, osteology, and odontology [in:] J. Oates et al., “Excavations at Tell Brak”, vol. 3, McDonald Institute for Archaeological Research: Cambridge and London.
Sołtysiak A. (in print e), Paleopathology in ancient Mesopotamia. A short overview [in:] “Drugs, bugs, and health and society in the ancient Near East”, R. Arnott, A. Livingstone (ed.), The Centre for the History of Medicine: Birmingham.
Sołtysiak A. (in print f ), Short Fieldwork Report. Tell Brak (Syria), seasons 1976–2008, Bioar-chaeology of the Near East 3.
Sołtysiak A., Tomczyk J. (2008), Short Fieldwork Report. Tell Ashara (Syria), seasons 1999––2007, Bioarchaeology of the Near East 2:63-66.
Sołtysiak A., Tomczyk J. (2008a), Short Fieldwork Report. Tell Masaikh (Syria), seasons 1998––2007, Bioarchaeology of the Near East 2:94-97.
Staubwasser M., Weiss H. (2006), Holocene climate and cultural evolution in late prehisto-ric–early historic West Asia, Quaternary Research 66:372-387.
Stone E.C. (1977), Economic crisis and social upheaval in Old Babylonian Nippur [in:] “Mo-untains and Lowlands”, L.D. Levine & T.C. Young Jr. (ed.), Malibu, pp. 267-289.
Stone E.C. (1987), Nippur neighborhoods, Studies in Ancient Oriental Civilization 44, Orien-tal Institute: Chicago.
Strommenger E., Kohlmeyer K. (1998), Tall Bi'a / Tuttul – I. Die altorientalischen Bestattun-gen, Wissenschaftliche Veröffentlichungen der Deutschen Orient-Gesellschaft 96, Berlin.
Stronach D., Lumsden S. (1992), UC Berkeley's excavations at Nineveh, The Biblical Archa-eologist 55(4):227-233.
Suazo Galdames I.C., Zavando Matamala D.A., Luiz Smith R. (2009), Sex determination in mandibles in the first year of life by a quantitative approach, International Journal of Mor-phology 27(1):113-116.

225
Sumner W.M. (1989), Population and settlement area: An example from Iran, American Anth-ropologist 91(3):631-641.
Sussman G. (1982), Selling mothers' milk: The wet-nursing business in France, 1715–1914, University of Illinois Press: Urbana.
Sussman R.W. (1972), Child transport, family size, and increase in human population during the Neolithic, Current Anthropology 13(2):258-267.
Sutcliffe A.J. (1973), Similarity of bones and antlers gnawed by deer to human artifacts, Nature 246:428-430.
Sutherland L.D., Suchey J.M. (1991), Use of the ventral arc in pubic sex determination, Journal of Forensic Sciences 36:501-511.
Svoboda J.A. (2008), The Upper Paleolithic burial area at Předmostí: ritual and taphonomy, Journal of Human Evolution 54:15-33.
Szostek K., Sołtysiak A. (in print), The content of elements in human teeth from Tell Brak [in:] J. Oates et al., “Excavations at Tell Brak”, vol. 3, McDonald Institute for Archaeological Research: Cambridge and London.
Šlaus M. (1997), Discriminant function sexing of fragmentary and complete femora from medie-val sites in continental Croatia, Opuscula archaeologica 21:167-175.
Talavera J.A., Gojas J.M., García E. (2001), Modificaciones culturales en los restos óseos de Can-tona, Puebla. Un análisis bioarqueológico, “Colección Científica” 432, Instituto Nacional de Antropología e Historia: Mexico City.
Talavera J.A., Rojas J.M., Salas M.E., González L.A. (2002), Análisis tecnológico y funcional de algunos artefactos de hueso humano del Mundo Perdido, Tikal, Guatemala, Arqueología 32:48-60.
Thomas C.A. (1940), The biology and control of wireworms, Pennsylvania Agricultural Expe-riment Station Bulletin 392.
Thompson A.H., Richards M.P., Shortland A., Zakrzewski S. (2005), Isotopic paleodiet studies of Ancient Egyptian fauna and humans, Journal of Archaeological Science 32:451-463.
Todd T.W. (1921), Age changes in the pubic bone. I: The male white pubis, American Journal of Physical Anthropology 3:285-334.
Tomczyk J., Sołtysiak A. (2007), Preliminary report on human remains from Tell Masaikh. Season 2005, Athenaeum. Studi di Letteratura e Storia dell’Antichità 95(1), 442-445.
Tomczyk J., Sołtysiak A. (2009), Zmienność wskaźników platyknemii, platymerii i pilastriiw populacjach środkowej doliny Eufratu (Syria) [in:] “Metody. Żródła. Dokumentacja. Fu-neralia Lednickie. Spotkanie 11”, W. Dzieduszycki, J. Wrzesiński (ed.), SNAP: Poznań, pp. 273-277.
Tomczyk J., Sołtysiak A., Tomczyk-Gruca M. (2007), Temporal changes in frequency of enamel hypoplasia in the middle Euphrates valley (Syria) [in:] “Human Diversity and Biocultural Researches. Selected papers of the 15th Congress of the European Anthropological Asso-ciation”, E.B. Bodzár & A. Zsákai (ed.), "Humanbiologia Budapestiensis" 30, Budapest, pp. 87-97.
Townsend G., Hughes T., Richards L. (2006), Gaining new insights into how genetic factors influence human dental development by studying twins, International Journal of Anthropo-logy 21(1):67-74.
Trueman C.N.G., Behrensmeyer A.K., Tuross N., Weiner S. (2004), Mineralogical and com-positional changes in bones exposed on soil surfaces in Amboseli National Park, Kenya: dia-genetic mechanisms and the role of sediment pore fluids, Journal of Archaeological Science 31:721-739.

226
Turner C.G. II (1993), Cannibalism in Chaco Canyon: the charnel pit excavated in 1926 at Small House Ruin by Frank H.H. Roberts, Jr., American Journal of Physical Anthropology 91:421-439.
Turner C.G. II, Moris N.T. (1970), A massacre at Hopi, American Antiquity 35(3):320-331.Turner C.G. II, Turner J. (1992), The first claim for cannibalism in the Southwest, American
Antiquity 57:661-682.Turner C.G. II, Turner J. (1995), Cannibalism in the prehistoric Southwest, Anthropological
Science 103:1-22.Turnquist J. (1983), The Neolithic skeletal population from Hajji Firuz Tepe [in:] M.M. Voigt,
“Hajji Firuz Tepe, Iran: the Neolithic settlement”, Philadelphia, pp. 340-347.Ubelaker D.H. (1989), Human skeletal remains. Excavation, analysis, interpretation, Taraxa-
cum: Washington DC.Ubelaker D.H. (1989a), The estimation of age at death from immature human bone [in:] “Age
markers in the human skeleton”, M.Y. Iscan (ed.), Charles C. Thomas: Springfield, pp. 55-70.
Ubelaker D.H. (1996), Taphonomic applications in forensic anthropology [in:] “Forensic ta-phonomy. The postmortem fate of human remains”, W.D. Haglund, M.H. Sorg (eds.), CRC Press: Boca Raton, pp. 77-90.
Ungar P.S., Grine F.E., Teaford M.F., El Zaatari S. (2006), Dental microwear and diets of African early Homo, Journal of Human Evolution 50:78-95.
Ur J.A. (2002), Surface collection and offsite studies at Tell Hamoukar, 1999, Iraq 64:15-43.Ur J.A. (in print), Cycles of civilization in Northern Mesopotamia, 4400-2000 BC, Journal of
Archaeological Research.Ur J.A., Karsgaard P., Oates J. (2007), Early urban development in the Near East, Science
317:1188.Ur J.A., Wilkinson T.J. (2008), Settlement and economic landscapes of Tell Beydar and its hin-
terland [in:] “Subartu XXI. Beydar Studies I”, M. Lebeau, A. Suleiman (ed.), Turnhout: Brepols, pp. 305-327.
Vila E. (2006), Data on equids from late fourth and third millennium sites in Northern Syria [in:] “Equids in time and space. Papers in honour of Véra Eisenmann”, M. Mashkour (ed.), Oxbow: Oxford, pp. 101-123.
Villa P., Mahieu E. (1991), Breakage patterns of human long bones, Journal of Human Evolu-tion 21:27-48.
Villa P., Bouville C., Courtin J., Helmer D., Mahieu E., Shipman P., Belluomini G., Branca M. (1986), Cannibalism in the Neolithic, Science 233:431-436.
Voigt M.M., Meadow R.H. (1983), Hajji Firuz Tepe, Iran: The Neolithic settlement, Universi-ty Museum Monograph 50, University of Pennsylvania: Philadelphia.
Wakely J. (1997), Identification and analysis of violent and non-violent head injuries in osteo--archaeological material [in:] “Material harm: archaeological studies of war and violence”, J. Carman (ed.), Cruithne Press: Glasgow, pp. 24-46.
Waldron H.A. (2001), Are plague pits of particular use to palaeoepidemiologists?, International Journal of Epidemiology 30:104-108.
Walker P.L. (1989), Cranial injuries as evidence of violence in prehistoric Southern California, American Journal of Physical Anthropology 80:313-323.
Walker P.L. (2001), A bioarchaeological perspective on the history of violence, Annual Review of Anthropology 30:573-596.

227
Walker P.L., Bathurst R.R., Richman R., Gjerdrum T., Andrushko V.A. (2009), The causes of porotic hyperostosis and cribra orbitalia: a reappraisal of the iron-deficiency-anemia hypothesis, American Journal of Physical Anthropology 139(2):109-125.
Wang X., Mabrey J.D., Agrawal M. (1998), An interspecies comparison of bone fracture proper-ties, Bio-Medical Materials and Engineering 8:1-9.
Wanner H., Beer J., Bütikofer J., Crowley T.J., Cubasch U., Flückiger J., Goosse H., Gros-jean M., Joos F., Kaplan J.O., Küttel M., Müller S.A., Prentice C., Solomina O., Stocker T.F., Tarasov P., Wagner M., Widmann M. (2008), Mid- to Late Holocene climate change: and overview, Quaternary Science Reviews 27:1791-1828.
Weber J. (2007), Community and household: A preliminary report on the animal remains from the excavations at Tell Brak, 2007, Iraq 69:167-170.
Weiner S., Wagner H.D. (1998), The material bone: structure-mechanical function relations, “Annual Review of Materials Science” 28:271-298.
Weiss E. (2003), Understanding muscle markers: Aggregation and construct validity, American Journal of Physical Anthropology 121:230-240.
Weiss E. (2004), Understanding muscle markers: lower limb, American Journal of Physical Anthropology 125:232-238.
Weiss E., Jurmain R. (2007), Osteoarthritis revisited: A contemporary review of aetiology, Inter-naional Journal of Osteoarchaeology 17:437-450.
Weiss H. (1983), Excavations at Tell Leilan and the origins of North Mesopotamian cities in the third millennium B.C., Paléorient 9(2):39-52.
Weiss H. (1986), The origins of Tell Leilan and the conquest of space in third millennium North Mesopotamia [in:] “The origins of cities in dry-farming Syria and Mesopotamia in the third millennium B.C.”, H. Weiss (ed.), Four Quarters: Connecticut, pp. 71-108.
Wescott D.J. (2005), Population variation in femur subtrochanteric shape, Journal of Forenscic Sciences 50(2):286-293.
Wescott D.J. (2006), Effect of mobility on femur midshaft external shape and robusticity, Ame-rican Journal of Physical Anthropology 130(2):201-213.
Wescott D.J. (2006a), Ontogeny of femur subtrochanteric shape in Native Americans and Ame-rican Blacks and Whites, Journal of Forensic Sciences 51(6):1240-1245.
West D.J., Hasiotis S.T. (2007), Trace fossils in an archaeological context: Examples from bison skeletons, Lipscomb County, Texas, U.S.A: The trace-fossil record of vertebrates [in:] “Trace Fossils: Concepts, Problems, Prospects”, W. Miller III (ed.), Elsevier: Amsterdam, pp. 545-561.
Wheatley B.P. (2008), Perimortem or postmortem bone fractures? An experimental study of frac-ture patterns in deer femora, Journal of Forensic Sciences 53(1):69-72.
White E.M., Hannus L.A. (1983), Chemical weathering of bone in archeological soils, Ameri-can Antiquity 48:316-322.
White T.D. (1992), Prehistoric cannibalism at Mancos 5MTUMR-2346, Princeton University Press: Princeton.
White T.D., Toth N. (1991), The question of ritual cannibalism at Grotta Guattari, Current Anthropology 32(2):118-138.
Wilder R.P., Sethi S. (2004), Overuse injuries: tendinopathies, stress fractures, compartment syndrome, and shin splints, Clinics in Sports Medicine 23:55-81.
Wilkinson T.J. (1990), Soil development and early land use in the Jazira region, Upper Mesopo-tamia, World Archaeology 22(1):87-103.

228
Wilkinson T.J. (1990a), The development of settlement in the North Jazira between the 7th and 1st millennia BC, Iraq 52:49-62.
Wilkinson T.J. (1994), The structure and dynamics of dry-farming states in Upper Mesopotamia, Current Anthropology 35(5):483-520.
Wilkinson T.J. (1997), Environmental fluctuations, agricultural production and collapse: A view from Bronze Age Upper Mesopotamia [in:] “Third millennium BC climate change and Old World collapse”, H.N. Dalfes, G. Kukla, H. Weiss (ed.), NATO ASI series I 49: Berlin & Heidelberg, pp. 67-106.
Wilkinson T.J., Christiansen J., Ur J., Widell M., Altaweel, M. (2007), Urbanization withina dynamic environment: modeling Bronze Age communities in Upper Mesopotamia, Ameri-can Anthropologist 109(1):52-68.
Williams B.A., Rogers T.L. (2006), Evaluating the accuracy and precision of cranial morpholo-gical traits for sex determination, Journal of Forensic Sciences 51(4):729-735.
Williams F.L'E., Belcher R.L., Armelagos G.J. (2005), Forensic misclassification of ancient Nubian crania: Implications for assumptions about human variation, Current Anthropology 46(2):340-345.
Wilson L.A., MacLeod N., Humphrey L.T. (2008), Morphometric criteria for sexing juvenile human skeletons using the ilium, Journal of Forensic Science 53(2):269-278.
Witzel C., Schutkowski H., Ehlken B. (2000), Die anthropologische Untersuchung der Bestat-ten [in:] “Der parthisch-römische Friedhof von Tall Šeh Hamad/Magdala”, M. Novák,A. Oettel, C. Witzel (ed.), Reimer: Berlin, pp. 173-214.
Wolska W. (1994), Zwei Fälle von Trepanation aus der altbabylonischen Zeit Syriens, Mitteilun-gen der Deutschen Orient-Gesellschaft zu Berlin 126:37-50.
Wright H., Rupley E.S.A., Ur J., Oates J., Ganem E. (2007), Preliminary report on the 2002 and 2003 seasons of the Tell Brak Sustaining Area Survey, Les Annales Archéologiques Ar-abes Syriennes 49/50[2006/2007]:7-21.
Wright L.E. (1997), Intertooth patterns of hypoplasia expression: implications for childhood heath in the Classic Maya collapse, American Journal of Physical Anthropology 102:233-247.
Wright L.E., Schwarcz H.P. (1998), Stable carbon and oxygen isotopes in human tooth enamel: identifying breastfeeding and weaning in prehistory, American Journal of Physical Anthro-pology 106:1-18.
Young T.C. jr. (1972), Population densities and early Mesopotamian origins [in:] “Man, settle-ment and urbanism”, P.J. Ucko et al. (ed.), Duckworth: London, pp. 827-842.
Zapata J., Pérez-Sirvent C., Martínez-Sánchez M.J., Tovar P. (2006), Diagenesis, not biogene-sis: Two late Roman skeletal examples, Science of the Total Environment 369:357-368.
Zhang H., Pala M., Oweis T., Harris H. (2000), Water use and water-use efficiency of chickpea and lentil in a Mediterranean environment, Australian Journal of Agricultural Research 51(2):295-304.
Zhou L., Corruccini R.S. (1998), Enamel hypoplasias related to famine stress in living Chinese, American Journal of Human Biology 10:723-733.
Zias J. (1993), Artificial cranial deformation in the Proto-Neolithic Near East and its possible origin: a reply, Paléorient 19(2):109-110.