Dead or alive? Autofluorescence distinguishes heat-fixed from viable cells
14
Dead or alive? Autofluorescence distinguishes heat-fixed from viable cells LEAH HENNINGS 1 , YIHONG KAUFMANN 2,3 , ROBERT GRIFFIN 4 , ERIC SIEGEL 5 , PETR NOVAK 4 , PETER CORRY 4 , EDUARDO G. MOROS 4 , and GAL SHAFIRSTEIN 2 1 Department of Pathology, University of Arkansas for Medical Sciences, Little Rock, Arkansas, USA 2 Department of Otolaryngology, University of Arkansas for Medical Sciences, Little Rock, Arkansas, USA 3 Department of Surgery, University of Arkansas for Medical Sciences, Little Rock, Arkansas, USA 4 Department of Radiation Oncology, University of Arkansas for Medical Sciences, Little Rock, Arkansas, USA 5 Department of Biostatistics, University of Arkansas for Medical Sciences, Little Rock, Arkansas, USA Abstract Purpose—A proof-of-concept study to evaluate a new autofluorescence method to differentiate necrotic thermally fixed cells from viable tissue following thermal ablation. Methods—A conductive interstitial thermal therapy (CITT) device was used to ablate swine mammary tissue and rabbit VX-2 carcinomas in vivo. The ablated regions and 10-mm margins were resected 24 h following treatment, embedded in HistOmer ® and sectioned at 3 mm. The fresh sections were evaluated for gross viability with triphenyl tetrazolium chloride, 1 h post-resection. Representative non-viable and viable areas were then processed and embedded into paraffin, and sectioned at 5 μm. Standard H&E staining and proliferating cell nuclear antigen (PCNA) immunohistochemistry were compared against autofluorescence intensity, at 488-nm wavelength, for cellular viability. Results—Heat-fixed cells in non-viable regions exhibit increased autofluorescence intensity compared to viable tissue (area under receiver operating characteristics (ROC) curve =0.96; Mann- Whitney P <0.0001). An autofluorescence intensity-based classification rule achieved 92% sensitivity with 100% specificity for distinguishing non-viable from viable samples. In contrast, PCNA staining did not reliably distinguish heat-fixed, dead cells from viable cells. Conclusions—Examination of H&E-stained sections using autofluorescence intensity-based classification is a reliable and readily available method to accurately identify heat-fixed cells in ablated surgical margins. Keywords Thermal ablation; conductive interstitial thermal therapy (CITT); triphenyl tetrazolium chloride (TTC); autofluorescence; heat-fixed; VX2 carcinoma; surgical margins Correspondence: Leah Hennings, DVM Department of Pathology, 4301 West Markham, University of Arkansas for Medical Sciences, Little Rock, Arkansas 72205 USA,. Tel: +1 501 526 7624. Fax: +1 501 686 7861. [email protected]. Declaration of interest: The authors report no conflicts of interest. The authors alone are responsible for the content and writing of the paper. NIH Public Access Author Manuscript Int J Hyperthermia. Author manuscript; available in PMC 2010 July 18. Published in final edited form as: Int J Hyperthermia. 2009 August ; 25(5): 355–363. doi:10.1080/02656730902964357. NIH-PA Author Manuscript NIH-PA Author Manuscript NIH-PA Author Manuscript
-
Upload
independent -
Category
Documents
-
view
4 -
download
0
Transcript of Dead or alive? Autofluorescence distinguishes heat-fixed from viable cells

Dead or alive? Autofluorescence distinguishes heat-fixed fromviable cells
LEAH HENNINGS1, YIHONG KAUFMANN2,3, ROBERT GRIFFIN4, ERIC SIEGEL5, PETRNOVAK4, PETER CORRY4, EDUARDO G. MOROS4, and GAL SHAFIRSTEIN21 Department of Pathology, University of Arkansas for Medical Sciences, Little Rock, Arkansas, USA2 Department of Otolaryngology, University of Arkansas for Medical Sciences, Little Rock, Arkansas,USA3 Department of Surgery, University of Arkansas for Medical Sciences, Little Rock, Arkansas, USA4 Department of Radiation Oncology, University of Arkansas for Medical Sciences, Little Rock,Arkansas, USA5 Department of Biostatistics, University of Arkansas for Medical Sciences, Little Rock, Arkansas,USA
AbstractPurpose—A proof-of-concept study to evaluate a new autofluorescence method to differentiatenecrotic thermally fixed cells from viable tissue following thermal ablation.
Methods—A conductive interstitial thermal therapy (CITT) device was used to ablate swinemammary tissue and rabbit VX-2 carcinomas in vivo. The ablated regions and 10-mm margins wereresected 24 h following treatment, embedded in HistOmer® and sectioned at 3 mm. The fresh sectionswere evaluated for gross viability with triphenyl tetrazolium chloride, 1 h post-resection.Representative non-viable and viable areas were then processed and embedded into paraffin, andsectioned at 5 μm. Standard H&E staining and proliferating cell nuclear antigen (PCNA)immunohistochemistry were compared against autofluorescence intensity, at 488-nm wavelength,for cellular viability.
Results—Heat-fixed cells in non-viable regions exhibit increased autofluorescence intensitycompared to viable tissue (area under receiver operating characteristics (ROC) curve =0.96; Mann-Whitney P <0.0001). An autofluorescence intensity-based classification rule achieved 92%sensitivity with 100% specificity for distinguishing non-viable from viable samples. In contrast,PCNA staining did not reliably distinguish heat-fixed, dead cells from viable cells.
Conclusions—Examination of H&E-stained sections using autofluorescence intensity-basedclassification is a reliable and readily available method to accurately identify heat-fixed cells inablated surgical margins.
KeywordsThermal ablation; conductive interstitial thermal therapy (CITT); triphenyl tetrazolium chloride(TTC); autofluorescence; heat-fixed; VX2 carcinoma; surgical margins
Correspondence: Leah Hennings, DVM Department of Pathology, 4301 West Markham, University of Arkansas for Medical Sciences,Little Rock, Arkansas 72205 USA,. Tel: +1 501 526 7624. Fax: +1 501 686 7861. [email protected] of interest: The authors report no conflicts of interest. The authors alone are responsible for the content and writing of thepaper.
NIH Public AccessAuthor ManuscriptInt J Hyperthermia. Author manuscript; available in PMC 2010 July 18.
Published in final edited form as:Int J Hyperthermia. 2009 August ; 25(5): 355–363. doi:10.1080/02656730902964357.
NIH
-PA Author Manuscript
NIH
-PA Author Manuscript
NIH
-PA Author Manuscript

IntroductionThe recent emergence of heat-based therapies has engendered many advocates for its use tolocally control and treat solid cancerous tumours [1–3]. Many techniques have been developedto heat the diseased tissue above a threshold temperature to induce irreversible thermal damage.Radiofrequency ablation (RFA), laser, interstitial and external ultrasound devices and,recently, conductive interstitial thermal therapy (CITT) are just a few of the availabletechnologies where thermal ablation has been shown to be effective in destroying solid tumoursand margins [4–11]. To date, the efficacy of thermal ablation techniques has been determinedby employing ablate-resect techniques [10,12–16]. In ablate-resect procedures,histopathological examination is the standard method to determine the outcomes of the thermalablation treatment. Pathologically there are three zones of tissue damage within the ablatedzone: a central heat-fixed region surrounded by a zone of coagulative necrosis, and an outerrim of mixed viable tissue and necrotic tissue [17–20]. Cells in the heat-fixed region retainmany of the morphological and immunohistochemical characteristics of viable cells [17,20],and thus are difficult to identify as non-viable in histological sections.
There is no standard and well-accepted technique for evaluating the viability of cells inthermally ablated regions. There are several pathologic techniques currently used to evaluatenon-viable cells in tissue sections. Supravital stains such as that to identify nicotinamideadenine dinucleotide (NADH) diaphorase can only be performed on fresh frozen sections.Immunohistochemistry against various cellular proteins may lead to misclassification of tissuesbecause some antigens routinely used in immunohistochemical staining, such as proliferatingcell nuclear antigen (PCNA), may be preserved in heat-fixed tissues in a manner similar to thatseen in microwave fixation [20]. Transferase-mediated dUTP nick end labelling (TUNEL)staining to detect apoptosis has a relatively low sensitivity which is reported to vary between60% to 90%. [21] The triphenyl tetrazolium chloride (TTC) viability stain can only be used ingross specimens because the red formazan fades during histological processing. Therefore, asimple and reliable method to accurately identify heat-fixed (dead) cells and avoid false-positive diagnoses of viability in histological specimens would be of great use in the growingfield of thermal ablation of tumours.
Necrotic cells are known to exhibit increased autofluorescence when excited with light at 488nm [22–25], as cellular autofluorescence increases with decreasing metabolic activity [26].The exact mechanism of autofluorescence has not been elucidated, but it is thought to be dueto increased levels of denatured proteins [27,28]. An additional mechanism may be intracellularrelease of metabolites such as flavin adenine dinucleotide (FAD) or NADH from mitochondria[29]. FAD is a likely candidate for this phenomenon, because it fluoresces at this wavelength[26]. Some investigators have used this difference in autofluorescence intensity to identify andquantify necrosis in tumour sections, including those that are formalin-fixed, paraffin-embedded and routinely stained [30,31]. To the best of our knowledge, it has not yet beendetermined that heat-fixed cells will exhibit significantly higher autofluorescence intensity incomparison to viable cells. Our objective was to determine the accuracy and reliability of amodified autofluorescence procedure, which we present herein, in differentiating heat-fixedcells from viable cells in thermally ablated regions. In addition, we compared this procedureto PCNA staining in identification of heat-fixed cells.
In this study we used CITT, an invasive thermal conductance ablation approach, to ablate VX2rabbit carcinomas and pig mammary tissue to investigate tissue necrosis. It is important to bearin mind that a CITT device delivers the heat to the target tissue by conduction, thus the tissueis not exposed to electromagnetic field that could have potential confounding effects on cellviability. Thus, in CITT the thermal damage is only a function of the temperature attained andtime exposed at any given point in the tissue (thermal dose).
HENNINGS et al. Page 2
Int J Hyperthermia. Author manuscript; available in PMC 2010 July 18.
NIH
-PA Author Manuscript
NIH
-PA Author Manuscript
NIH
-PA Author Manuscript

MethodsThermal ablation
The CITT device was used to ablate soft tissue and tumours in animal models in vivo. Theprinciples of CITT have been described in detail elsewhere [32,33]. Briefly, the CITT deviceconsists of a thermal probe with deployable pins and computer controlled heater that allowshigh-dose heat delivery to the target tissue. Thermal ablation was conducted while the animalswere under general anaesthesia. The animal experiments were approved by the UAMSInstitutional Animal Care and Use Committee and were conducted according to the guidelinesin the Guide for the Care and Use of Laboratory Animals, NIH Publication No. 86-23. Tissuesexamined were from two separate ablation studies using similar techniques, but with slightdifferences in thermal dose.
Rabbit carcinoma—Fresh VX2 carcinoma (National Cancer Institute, Frederick CancerCenter, Frederick, MD) was implanted intramuscularly in the rear leg of 8 adult female NZWrabbits. The tumours were allowed to grow to 2–3 cm diameter, whereupon they were ablatedfor 20 min at the maximum probe temperature of 120°C, in vivo. [32]
Pig mammary gland—The female pig model was selected because it is an accepted modelfor studying interstitial thermal therapy for thermal ablation in human-like breast tissue [34,35]. In this study, ablations were performed, in vivo, on tissue under 8 nipples in an adult, non-pregnant female at various temperatures within the range of 79°C to 170°C and total ablationtimes of 17 to 25 min [33].
Tissue preparation—Following ablation, the treated region and approximately 5–10 mmof adjacent tissue were resected and placed in buffered saline at 2°C for 30 min. Thereafter,the entire excised tissue was embedded in HistOmer (Vibratome, St Louis, MO) for 5 min andsliced into 3-mm sections perpendicular to the ablated surface. The slices were stained forviability with TTC 1% solution for 1 h at 37°C. In viable tissue, TTC is reduced to red formazanby the mitochondrial enzyme succinate dehydrogenase. This reaction therefore only occurs inviable tissue. Following TTC staining, the tissue was removed from the solution, and sectionswere photographed with a digital camera (Canon ES Rebel 350). The tissue specimens wereremoved from HistOmer and fixed in 10% neutral buffered formalin. After fixation, samplesmeasuring approximately 1 cm × 1 cm were chosen from TTC-positive (red-stained) and TTC-negative (unstained) areas, and these samples were processed and embedded into paraffin,sectioned at 5 μm, and routinely stained with haematoxylin and eosin (H&E). Additionally, 5samples of normal rabbit skin from non-ablated sites and 5 samples of non-ablated pig skinwere processed without TTC staining.
Histological evaluationDigital threshold—We devised a simple method to aid in diagnosis of viable vs. non-viableareas and cells in multiple sections, using a digital filter to eliminate backgroundautofluorescence. Digital images of fluorescent sections were converted to greyscale in ImageJ, and a threshold intensity value was set using the ‘image-adjust-threshold’ menu to excludebackground fluorescence of normal epithelial structures in a non-ablated control sample of pigmammary gland and skin. Using the black and white method of digital mark-up, normallyfluorescent structures (collagen and keratin) remain white, while viable epithelial cells andtumour cells are black. The threshold settings were applied to normal epithelial and stromalcells in 5 control pig skin samples. This method was repeated on rabbit skin and mammarytissue using 5 normal rabbit samples from 5 different rabbits. For direct comparison offluorescence and cellular morphology, fluorescent photos were overlaid onto H&E photos
HENNINGS et al. Page 3
Int J Hyperthermia. Author manuscript; available in PMC 2010 July 18.
NIH
-PA Author Manuscript
NIH
-PA Author Manuscript
NIH
-PA Author Manuscript

using Adobe Photoshop CS2 layers function. We next applied this threshold value to imagesof thermally ablated sections of VX-2 carcinomas and pig mammary tissue.
Quantitative analysis—To verify that necrotic and heat-fixed cells exhibit increasedautofluorescence intensity compared to viable cells, samples of rabbit VX-2 carcinoma andpig mammary tissue and skin were compared. Samples from VX2 carcinoma were taken fromTTC positive (viable, n =5) regions and from TTC negative (non-viable, n =25) regions.Additionally, 3 samples of control (non-CITT-treated) skin and mammary tissue from 3different pigs were examined. H&E slides were examined under bright field microscopy andusing fluorescence microscopy at 488 nm wavelength (FITC channel) using a Nikon Eclipse2000E microscope attached to a Nikon digital camera. Camera and lamp settings were heldconstant for all sections. Serial photos of each section were taken from the same microscopic200 × field using both bright field and fluorescence microscopy. Unmodified photos wereanalysed using NIH Image J software. Within each image, five cells, located at approximately12:00, 2:00, 5:00, 8:00, and 10:00 on the clock face were outlined using the Polygon functionand individually analysed. Each cell was delineated, and its autofluorescence intensity wasdetermined as the distributional mean of the cell’s fluorescence greyscale intensities using theHistogram function; the resulting intensities of the five cells were then averaged and taken asrepresentative of the intensity of cells within the tissue-section image. Fluorescence intensitiesof individual tissue sections were plotted along with group means and standard deviations.Intensity distributions were assessed for degree of separation between the two groups viareceiver operating characteristics (ROC) analysis; the area under the ROC curve (the ROCAUC) was compared to the null-hypothesis value 0.50 (denoting complete overlap ofdistributions) via the one-sided Mann-Whitney test. The point on the empirical ROC curve thatminimised misclassification error (by maximising the sum of sensitivity and specificity) wasused to identify the upper and lower limits on a range of intensity thresholds that would haveoptimal classification characteristics. Statistical analyses were performed using Excel 2003(Microsoft Corporation, Redmond, WA) and NCSS 2004 (Number Cruncher StatisticalSystems, Kaysville, UT).
Immunohistochemistry—To determine whether or not heat-fixed cells may retainreactivity to anti-PCNA antibodies, we stained sections from TTC-positive and TTC-negativeregions of VX-2 carcinoma, normal mammary gland, and skin from rabbit and pig. Sectionswere deparaffinised and rehydrated through a graded series of alcohols and water. Antigenretrieval was performed in a Dako decloaker (Biocare Medical, Walnut Creek, CA) for 20 minusing Dako target retrieval (pH 6). After rinsing for 3 min in distilled water, Dako hydrogenperoxidase was applied to the sections for 10 min, and slides were rinsed in Dako tris bufferedsaline tween-20 (TBST). Sections were incubated for 30 min in 10% normal goat serum proteinblock diluted in TBST at room temperature (RT), and then blotted. Sections were thenincubated in primary antibody (PCNA, PC-10, mouse monoclonal, predilute, Abcam ab912)for 1 h at RT and rinsed in TBST. Sections were incubated in secondary antibody (biotinylatedgoat anti-mouse, Vector Labs, Burlingame, CA) diluted 1:400 in TBST for 30 min at RT andrinsed in TBST. Sections were incubated in Vector Elite ABC (Vector Labs) for 30 min at RTand rinsed in TBST. Dako DAB + 3 was applied for 3 min; sections were rinsed in TBST,lightly counterstained with haematoxylin, mounted, examined under a light microscope, andrepresentative regions were digitally photographed at 200× magnification as described above.
ResultsDigital threshold
Based on autofluorescence intensity, we were consistently able to digitally exclude viable cellsin control sections of pig and rabbit skin and mammary gland with a single Image J threshold
HENNINGS et al. Page 4
Int J Hyperthermia. Author manuscript; available in PMC 2010 July 18.
NIH
-PA Author Manuscript
NIH
-PA Author Manuscript
NIH
-PA Author Manuscript

setting. While cellular layers of the epidermis exhibit minimal autofluorescence intensity,strong autofluorescence is present in keratin and dermal collagen (Figure 1A). The digitalthreshold was set to exclude autofluorescence from viable epidermal cells, which remain blackin the filtered image (Figure 1A–C). This threshold setting also excluded viable cells inmammary epithelium and hair follicles (Figure 1B). Non-viable cells in ablated skin and VX-2carcinomas remain white in filtered images (Figure 2).
Quantitative analysisCells in regions verified as heat-fixed or necrotic via TTC staining exhibited marked increasein autofluorescence intensity over viable epithelial and tumour cells. The average intensity ofautofluorescence in cells within these regions was significantly increased, with a mean ± SDgreyscale value of 35.2 ± 7.9 for non-viable cells compared to 17.8 ± 2.6 for viable cells. ROCanalysis was used to assess the two groups’ autofluorescence-intensity distributions fordiscriminative potential, with results shown in Figure 3. The area under the empirical ROCcurve was 0.96 (Mann-Whitney U =192, 1-sided P =5.6 × 10⁻⁵), indicating very little overlapbetween the distributions of viable and non-viable samples, and thus very good potential toclassify them correctly using an autofluorescence intensity (greyscale) threshold. The ROCcurve of Figure 3 shows how the sensitivity and specificity of such a classification rule changeswith different settings of the greyscale threshold. The classification rule is most accurate whenthe sum of sensitivity and specificity reaches a maximum, which occurs for this data at 92%sensitivity and 100% specificity (red ellipse in Figure 3). This optimal combination ofsensitivity and specificity is attained when the greyscale threshold is located somewherebetween 20.99 and 25.49. Figure 4 shows how the samples are classified when the greyscalethreshold (vertical red line) is chosen for convenience to have an integer value of 21. All eightof the viable samples have their fluorescence intensities below the threshold (100% specificity),while 23 of the 25 samples have intensities above the threshold (92% sensitivity). Moving thethreshold up to 25.49, or down to 20.99, does not change which samples fall below the thresholdand which remain above it.
By contrast, PCNA was not reliable as an indicator of cell viability. Labelling of nuclei in TTC-negative, non-viable regions was less intense than in most TTC-positive, viable regions, butwas often present in areas that were non-viable as assessed by TTC and by autofluorescenceimaging (Figure 5).
DiscussionComplete coagulation and necrosis of the target tumour and margins is a prerequisite for asuccessful thermal ablation procedure. It is equally important to avoid unnecessary damage tohealthy tissue to minimise morbidity. Thus, it is imperative to precisely determine the exactsize of the thermally ablated (dead) region as well as the optimal time-course with which toassess the extent of ablation so that more consistent and more effective ablation strategies canbe developed.
Fixation of cells in situ causes a problem for the pathologist who must determine that surgicalmargins are free of viable tumour. Cell death via necrosis or apoptosis is accompanied byconsistent morphological changes. Necrotic cells are generally swollen, may stain moreintensely with eosin, and contain ruptured and fragmented nuclei. Apoptotic cells are shrunkenwith small, dense nuclei or nuclear remnants. In contrast, the process of fixation inactivatesthe cellular enzymes responsible for morphologic features of necrosis or apoptosis. Therefore,heat-fixed cells retain the morphology of viable cells for long periods of time, without featuresof apoptosis or necrosis. For instance, tissues prepared by microwave fixation, which relies onthe fixative properties of heat, are comparable to formalin-fixed tissues for microscopicevaluation.
HENNINGS et al. Page 5
Int J Hyperthermia. Author manuscript; available in PMC 2010 July 18.
NIH
-PA Author Manuscript
NIH
-PA Author Manuscript
NIH
-PA Author Manuscript

Reliable discrimination of viable from non-viable cells in margins has previously been limitedto the use of frozen samples for labelling with enzymatic vital stains such as reduced NADH.In this work we tested the efficacy of autofluorescence intensity-based method to delineateheat-fixed thermally ablated cells from viable non-ablated cells in formalin-fixed and paraffin-embedded samples. We based our approach on the fact that differences in autofluorescenceintensity have been reliably used to rapidly diagnose and quantify necrosis in tumour sectionstreated with non-thermal agents [30,31]. Our results here demonstrate that autofluorescence isalso diagnostically useful in examining thermally ablated tissue. In addition, our findings, albeitin a small number of samples, suggest that autofluorescence intensity may be more sensitivethan PCNA staining to discriminate between viable and non-viable cells in these ablatedtumours. Staining for PCNA was preserved in heat-fixed tissues, indicating a false positive forcell survival. Although we did observe differences in the intensity of PCNA staining betweenheat-fixed and viable cells, there was not complete loss of staining in heat-fixed areas. Onepossible explanation for this finding is that PCNA reactivity is retained in heat-fixed cellsbecause heat-fixation does not lead to protein cross-linking. All tissues in this study were placedinto formalin, but heat-fixation may have provided stabilisation of protein and resistance toformalin-induced protein cross-linking.
In contrast, using a digital threshold to eliminate background levels of mammary and epidermalautofluorescence, we were able to reliably detect heat-fixed (dead) cells in regions verified asnon-viable by TTC staining. Moreover, using an autofluorescence greyscale threshold between20.99 and 25.49, we correctly classified all our viable samples (100% specificity) and achieved92% sensitivity, area under ROC curve =0.96; Mann-Whitney P <0.0001. It should be notedthat the range of optimal greyscale thresholds we obtained from ROC analysis were specificto our samples and the properties of our microscope, and that different laboratories willundoubtedly want to determine their own range of optimal thresholds.
Interstitial collagen and epidermal keratin do not affect this analysis because only tumour andepithelial cells were selected for histogram analysis. In only two samples was there a noticeablediscrepancy between the TTC staining and autofluorescence measurements, where viable cellswere not identified in the TTC staining. Other researchers have demonstrated that TTC stainingdoes not affect fluorescence properties of cells [36], therefore the staining procedure shouldnot have affected autofluorescence.
It is possible that cells were misclassified by the autofluorescence method; however, in thesesamples the levels of autofluorescence were extremely low, and were consistent with the levelsobserved from cells in TTC-viable sections. It is also unlikely that macroscopic areas of tissuewould be misclassified by TTC staining because it is dependent on functioning mitochondrialenzymes to produce red formazan. Therefore, we surmise that the existence of small foci ofviable cells went undetected in these cases in the TTC section because the TTC staining isexamined without magnification.
The described method identifies viable cells in ablated margins. Strongly autofluorescentstructures such as collagen and keratin are present in normal skin and connective tissuesurrounding tumours. The image analysis digital threshold is set to exclude backgroundautofluorescence of viable cells and strongly autofluorescent stromal material. In this way,viable cells are identified (remain black) in contrast to more strongly fluorescent collagen,keratin, and dead tumour cells; all of which are more uniformly autofluorescent than viabletumour. Using such a filter, viable tumour cells in ablated margins may be identified by apathologist in a single routinely stained slide without the confounding evaluation of serialsections. In margin evaluation, the presence of viable tumour cells indicates that furthertreatment may be necessary. Although we did not evaluate the effects of ablation onautofluorescence of collagen, future studies may include defining the fluorescence of ablated
HENNINGS et al. Page 6
Int J Hyperthermia. Author manuscript; available in PMC 2010 July 18.
NIH
-PA Author Manuscript
NIH
-PA Author Manuscript
NIH
-PA Author Manuscript

stromal tissue as well, since mounting evidence indicates that recurrent or metastatic cancerrelies on the stromal environment. This method could be expanded to reliably identify andquantify regions of necrosis and heat fixation with the addition of a second filter to eliminatethe strong autofluorescence of collagen and keratin.
A major benefit of the autofluorescence method we presented herein is that it may be appliedto individual biopsy specimens. We have demonstrated that it sufficed to set a digital thresholdfrom a single non-ablated control sample of mammary epithelium and skin to identify viableand non-viable cells in multiple sections of a mammary carcinoma (VX2) and skin fromdifferent animals. Thus, digital threshold parameters (or threshold values) can be set once andapplied to multiple sections. Although we have only validated our autofluorescence method inrelated epithelial tissues (VX2 carcinoma and rabbit and porcine mammary tissue) that arecommonly used to study thermal ablation, we expect that our method may be useful in othertypes of thermally ablated animal or human tissues as well. Because different types of cellsexhibit varying degrees of normal autofluorescence intensity due to metabolic and structuraldifferences, the method must be validated individually in other tissue types. Additionally,because different laboratories have different microscopes, the classification threshold willundoubtedly need to be calibrated to slightly different set-points for different labs to achieveoptimal performance in each. But once established and calibrated, a single digital thresholdmay suffice to identify non-viable regions from a range of samples from similar organs ortumours.
ConclusionsIn this work we demonstrated the efficacy of autofluorescence intensity-based classificationto delineate heat-fixed thermally ablated cells from viable cells in formalin-fixed and paraffin-embedded samples using instruments and software that are readily accessible to a majority ofpathologists. This simple and reliable method holds great promise as a means to reliablydistinguish non-viable, heat-fixed cells from living tumour cells in the margins of ablatedtumours. Validation in human cancer specimens and other research models appears warranted.
AcknowledgmentsFunding for this work was provided by the National Cancer Institute NIH/NCI Grant No. CA108678-02 GS andCA44114 to RG. We would like to thank Dr Michael Borrelli for access to the fluorescent microscope and digitalcamera used in this work.
References1. Crocetti L, Lencioni R. Thermal ablation of hepatocellular carcinoma. Cancer Imaging 2008;8:19–26.
[PubMed: 18331969]2. Garrean S, Hering J, Saied A, Helton WS, Espat NJ. Radiofrequency ablation of primary and metastatic
liver tumors: A critical review of the literature. Am J Surg 2008;195:508–520. [PubMed: 18361927]3. Pennathur A. Radiofrequency ablation for the treatment of lung neoplasm. Expert Rev Med Devices
2008;5:613–621. [PubMed: 18803472]4. Jeffrey SS, Birdwell RL, Ikeda DM, Daniel BL, Nowels KW, Dirbas FM, Griffey SM. Radiofrequency
ablation of breast cancer: First report of an emerging technology. Arch Surg 1999;134:1064–1068.[PubMed: 10522847]
5. Izzo F, Thomas R, Delrio P, Rinaldo M, Vallone P, DeChiara A, Botti G, D’Aiuto G, Cortino P, CurleySA. Radiofrequency ablation in patients with primary breast carcinoma: A pilot study in 26 patients.Cancer 2001;92:2036–2044. [PubMed: 11596017]
6. Akimov AB, Seregin VE, Rusanov KV, Tyurina EG, Glushko TA, Nevzorov VP, Nevzorova RF,Akimova EV. Nd: YAG interstitial laser thermotherapy in the treatment of breast cancer. Lasers SurgMed 1998;22:257–267. [PubMed: 9671991]
HENNINGS et al. Page 7
Int J Hyperthermia. Author manuscript; available in PMC 2010 July 18.
NIH
-PA Author Manuscript
NIH
-PA Author Manuscript
NIH
-PA Author Manuscript

7. Minhaj AM, Mann F, Milne PJ, Denham DB, Salas N Jr, Nose I, Daamgard-Iversen K, Parel JM,Robinson DS. Laser interstitial thermotherapy (LITT) monitoring using high-resolution digitalmammography: Theory and experimental studies. Phys Med Biol 2002;47:2987–2999. [PubMed:12222861]
8. Milne PJ, Parel JM, Manns F, Denham DB, Gonzalez-Cirre X, Robinson DS. Development ofstereotactically guided laser interstitial thermotherapy of breast cancer: In situ measurement andanalysis of the temperature field in ex vivo and in vivo adipose tissue. Lasers Surg Med 2000;26:67–75. [PubMed: 10637005]
9. Vogl TJ, Mack MG, Roggan A, Straub R, Eichler KC, Muller PK, Knappe V, Felix R. Internally cooledpower laser for MR-guided interstitial laser-induced thermotherapy of liver lesions: Initial clinicalresults. Radiology 1998;209:381–385. [PubMed: 9807562]
10. Boehm T, Malich A, Reichenbach JR, Fleck M, Kaiser WA. Percutaneous radiofrequency (RF)thermal ablation of rabbit tumors embedded in fat: A model for RF ablation of breast tumors. InvestRadiol 2001;36:480–486. [PubMed: 11500599]
11. Hazle JD, Stafford RJ, Price RE. Magnetic resonance imaging-guided focused ultrasound thermaltherapy in experimental animal models: Correlation of ablation volumes with pathology in rabbitmuscle and VX2 tumors. J Magn Reson Imaging 2002;15:185–194. [PubMed: 11836775]
12. Boehm T, Malich A, Goldberg SN, Reichenbach JR, Hilger I, Hauff P, Reinhardt M, Fleck M, KaiserWA. Radio-frequency tumor ablation: Internally cooled electrode versus saline-enhanced techniquein an aggressive rabbit tumor model. Radiology 2002;222:805–813. [PubMed: 11867805]
13. Boehm T, Malich A, Nahum Goldberg S, Reichenbach JR, Hilger I, Fleck M, Kaiser WA. Vacuum-assisted resection of malignant tumors with and without subsequent radiofrequency ablation:Feasibility of complete tumor treatment tested in an animal model. J Vasc Interv Radiol2001;12:1086–1093. [PubMed: 11535772]
14. Goldberg SN, Gazelle GS, Solbiati L, Rittman WJ, Mueller PR. Radiofrequency tissue ablation:Increased lesion diameter with a perfusion electrode. Acad Radiol 1996;3:636–644. [PubMed:8796727]
15. Bhowmick P, Coad JE, Bhowmick S, Pryor JL, Larson T, De La Rosette J, Bischof JC. In vitroassessment of the efficacy of thermal therapy in human benign prostatic hyperplasia. Int JHyperthermia 2004;20:421–439. [PubMed: 15204522]
16. Bhowmick S, Swanlund DJ, Coad JE, Lulloff L, Hoey MF, Bischof JC. Evaluation of thermal therapyin a prostate cancer model using a wet electrode radiofrequency probe. J Endourol 2001;15:629–640.[PubMed: 11552790]
17. Coad JE, Kosari K, Humar A, Sielaff TD. Radiofrequency ablation causes ‘thermal fixation’ ofhepatocellular carcinoma: A post-liver transplant histopathologic study. Clin Transplant2003;17:377–384. [PubMed: 12868996]
18. He X, McGee S, Coad JE, Schmidlin F, Iaizzo PA, Swanlund DJ, Kluge S, Rudie E, Bischof JC.Investigation of the thermal and tissue injury behaviour in microwave thermal therapy using a porcinekidney model. Int J Hyperthermia 2004;20:567–593. [PubMed: 15370815]
19. Germer C, Isbert CM, Albrecht D, Ritz JP, Schilling A, Roggan A, Wolf KJ, Muller G, Bahr H. Laser-induced thermotherapy for the treatment of liver metastasis. Correlation of gadolinium-DTPA-enhanced MRI with histomorphologic findings to determine criteria for follow-up monitoring. SurgEndosc 1998;12:1317–1325. [PubMed: 9788855]
20. Ozaki T, Tabuse K, Tsuji T, Nakamura Y, Kakudo K, Mori I. Microwave cell death: Enzymehistochemical evaluation for metastatic carcinoma of the liver. Pathol Int 2003;53:837–845.[PubMed: 14629749]
21. Kelly KJ, Sandoval RM, Dunn KW, Molitoris BA, Dagher PC. A novel method to determinespecificity and sensitivity of the TUNEL reaction in the quantitation of apoptosis. Am J Physiol CellPhysiol 2003;284:C1309–C1318. [PubMed: 12676658]
22. Allwork SP, Bentall HH. Usefulness of the phenomenon of histofluorescence in the identification ofearly myocardial necrosis. Cardiovasc Res 1986;20:451–457. [PubMed: 3779741]
23. Anderson CD, Lin WC, Beckham J, Mahadevan-Jansen A, Buttemere CR, Pierce J, Nicoud IB, WrightPinson C, Chari RS. Fluorescence spectroscopy accurately detects irreversible cell damage duringhepatic radiofrequency ablation. Surgery 2004;136:524–531. [PubMed: 15349097]
HENNINGS et al. Page 8
Int J Hyperthermia. Author manuscript; available in PMC 2010 July 18.
NIH
-PA Author Manuscript
NIH
-PA Author Manuscript
NIH
-PA Author Manuscript

24. Chopra P, Sabherwal U. Histochemical and fluorescent techniques for detection of early myocardialischemia following experimental coronary artery occlusion: A comparative and quantitative study.Angiology 1988;39:132–140. [PubMed: 2450489]
25. Salinas-Madrigal L, Sotelo-Avila C. Morphologic diagnosis of acute tubular necrosis (ATN) byautofluorescence. Am J Kidney Dis 1986;7:84–87. [PubMed: 3942136]
26. Wu BP, Tao Q, Lyle S. Autofluorescence in the stem cell region of the hair follicle bulge. J InvestigDermatol 2005;124:860–862. [PubMed: 15816847]
27. Majno G, Joris I. Apoptosis, oncosis, and necrosis. An overview of cell death. Am J Pathol1995;146:3–15. [PubMed: 7856735]
28. Majno G, La Gattuta M, Thompson TE. Cellular death and necrosis: Chemical, physical andmorphologic changes in rat liver. Virchows Arch Pathol Anat Physiol Klin Med 1960;333:421–465.[PubMed: 13765553]
29. Liang J, Wu WL, Liu ZH, Mei YJ, Cai RX, Shen P. Study the oxidative injury of yeast cells by NADHautofluorescence. Spectrochim Acta A Mol Biomol Spectrosc 2007;67:355–359. [PubMed:16949859]
30. Dragowska WH, Warburton C, Yapp DT, Minchinton AI, Hu Y, Waterhouse DN, Gelmon K, SovK, Woo J, Masin D, et al. HER-2/neu overexpression increases the viable hypoxic cell populationwithin solid tumors without causing changes in tumor vascularization. Mol Cancer Res 2004;2:606–619. [PubMed: 15561777]
31. Shaked Y, Ciarrocchi A, Franco M, Lee CR, Man S, Cheung AM, Hicklin DJ, Chaplin D, Foster FS,Benezra R, et al. Therapy-induced acute recruitment of circulating endothelial progenitor cells totumors. Science 2006;313:1785–1787. [PubMed: 16990548]
32. Shafirstein G, Hennings L, Kaufmann Y, Novak P, Moros EG, Ferguson S, Siegel E, Klimberg SV,Waner M, Spring P. Conductive interstitial thermal therapy (CITT) device evaluation in VX2 rabbitmodel. Technol Cancer Res Treat 2007;6:235–246. [PubMed: 17535032]
33. Shafirstein G, Novak P, Moros EG, Siegel E, Hennings L, Kaufmann Y, Ferguson S, Myhill J, SwaneyM, Spring P. Conductive interstitial thermal therapy device for surgical margin ablation: In vivoverification of a theoretical model. Int J Hyperthermia 2007;23:477–492. [PubMed: 17852514]
34. Robinson DS, Parel JM, Denham DB, Gonzalez-Cirre X, Manns F, Milne PJ, Schachner RD, HerronAJ, Comander J, Hauptmann G. Interstitial laser hyperthermia model development for minimallyinvasive therapy of breast carcinoma. J Am Coll Surg 1998;186:284–292. [PubMed: 9510259]
35. Robinson DS, Parel JM, Denham DB, Manns F, Gonzalez X, Schachner R, Herron A, Burdette EC.Stereotactic uses beyond core biopsy: Model development for minimally invasive treatment of breastcancer through interstitial laser hyperthermia. Am Surg 1996;62:117–118. [PubMed: 8554188]
36. Wildhirt SM, Suzuki H, Horstman D, Weismuller S, Dudek RR, Akiyama K, Reichart B. Selectivemodulation of inducible nitric oxide synthase isozyme in myocardial infarction. Circulation1997;96:1616–1623. [PubMed: 9315556]
HENNINGS et al. Page 9
Int J Hyperthermia. Author manuscript; available in PMC 2010 July 18.
NIH
-PA Author Manuscript
NIH
-PA Author Manuscript
NIH
-PA Author Manuscript

Figure 1.(A) Normal pig skin. Viable epidermal cells (star) exhibit minimal autofluorescence that isexcluded (black) by the ImageJ filter (C). Dermal collagen (arrow) and superficial keratin arenot excluded by the filter and remain white. H&E (A), fluorescent (B), and filtered (C) 400×.(B) Normal pig skin. Viable hair follicle (A,C,E) and mammary gland (B,D,F). Follicular andmammary epithelia (arrows) exhibit minimal autofluorescence that is excluded by the filter.H&E (A,B), fluorescent (C,D) and filtered (E, F) 400× magnification.
HENNINGS et al. Page 10
Int J Hyperthermia. Author manuscript; available in PMC 2010 July 18.
NIH
-PA Author Manuscript
NIH
-PA Author Manuscript
NIH
-PA Author Manuscript
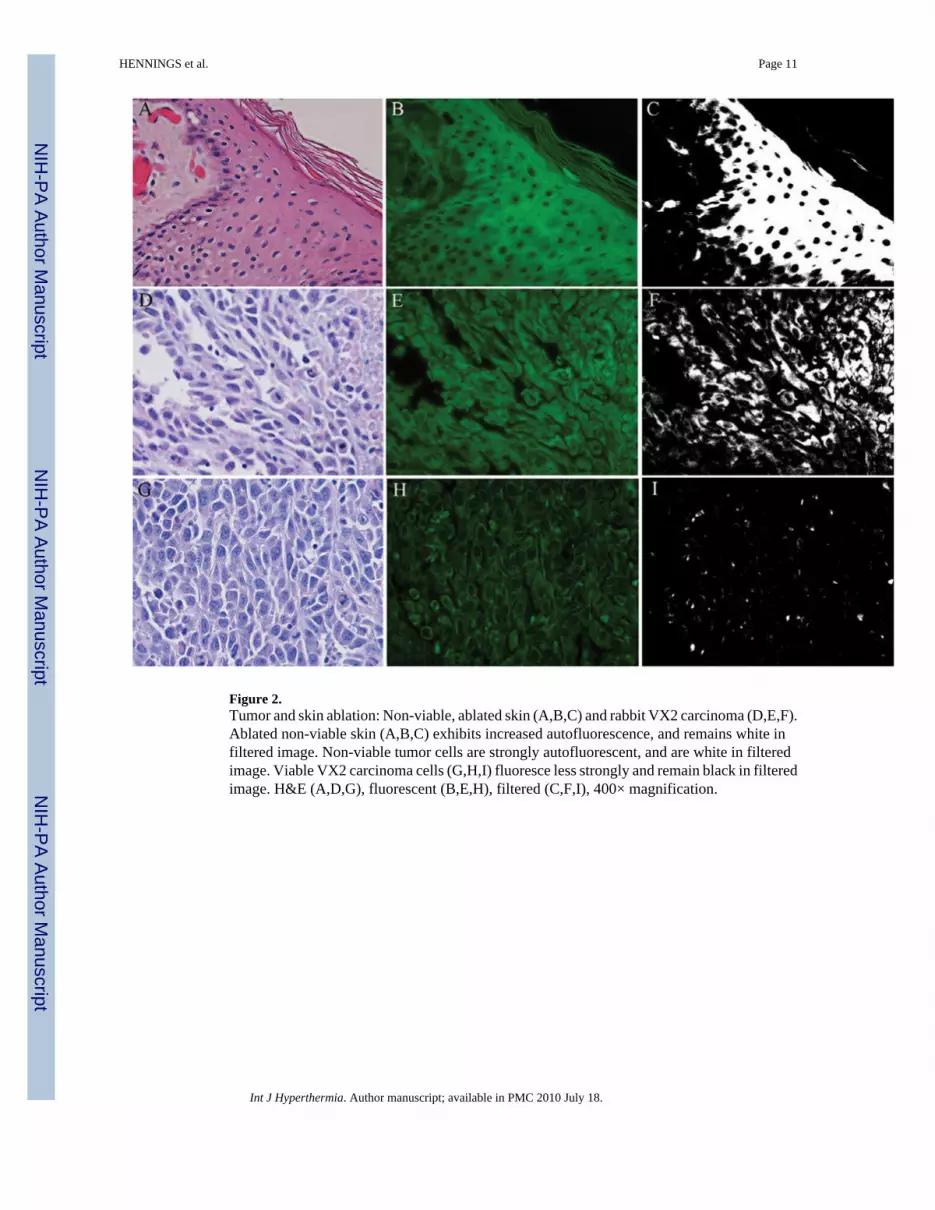
Figure 2.Tumor and skin ablation: Non-viable, ablated skin (A,B,C) and rabbit VX2 carcinoma (D,E,F).Ablated non-viable skin (A,B,C) exhibits increased autofluorescence, and remains white infiltered image. Non-viable tumor cells are strongly autofluorescent, and are white in filteredimage. Viable VX2 carcinoma cells (G,H,I) fluoresce less strongly and remain black in filteredimage. H&E (A,D,G), fluorescent (B,E,H), filtered (C,F,I), 400× magnification.
HENNINGS et al. Page 11
Int J Hyperthermia. Author manuscript; available in PMC 2010 July 18.
NIH
-PA Author Manuscript
NIH
-PA Author Manuscript
NIH
-PA Author Manuscript

Figure 3.Receiver Operating Characteristics (ROC) analysis of using an autofluorescence intensity(grayscale) threshold to distinguish viable from non-viable samples. The line at top is theempirical ROC curve for classifying Fig 4 data via grayscale threshold; the diagonal is thetheoretical ROC curve of a classification rule with no discriminatory potential. The area underthe empirical ROC curve is 0.96 (1-sided Mann-Whitney P =5.6 × 10⁻⁵). The ellipse denoteswhere sensitivity (92%) and specificity (100%) has a sum that is maximized. This optimalcombination of 92% sensitivity with 100% specificity is produced by a range of grayscaleintensity thresholds that have a minimum of 20.99 and maximum of 25.49.
HENNINGS et al. Page 12
Int J Hyperthermia. Author manuscript; available in PMC 2010 July 18.
NIH
-PA Author Manuscript
NIH
-PA Author Manuscript
NIH
-PA Author Manuscript

Figure 4.Distribution of autofluorescence grayscale values of viable (n =5 VX2 v samples and n =3 non-ablated pig skin samples) and non-viable (heat-killed, n =25 VX2 carcinoma samples) tissuesections. Open circles denote tissue-section fluorescence intensities, determined as the averagegrayscale value of single cells in five pre-determined locations in the tissue section; greydiamonds (error bars) denote the sample averages (standard deviations) of fluorescenceintensities of the viable and non-viable sections. The vertical line denotes an integer-valuedgrayscale threshold chosen from the optimal range of thresholds identified by ROC analysis(Fig 3 legend). 23 out of 25 non-viable samples lie above the threshold (92% sensitivity), whileall 8 viable samples lie below the threshold (100% specificity).
HENNINGS et al. Page 13
Int J Hyperthermia. Author manuscript; available in PMC 2010 July 18.
NIH
-PA Author Manuscript
NIH
-PA Author Manuscript
NIH
-PA Author Manuscript

Figure 5.PCNA staining in non-viable tumor cells. Rabbit VX2 carcinoma. Strong nuclear PCNAantibody labeling (A) is observed in tumor cells within a region identified as non-viable viaTTC. Fluorescent and filtered images (B) demonstrate strong autofluorescence. Control (C)with primary antibody omitted is unstained. 400× magnification.
HENNINGS et al. Page 14
Int J Hyperthermia. Author manuscript; available in PMC 2010 July 18.
NIH
-PA Author Manuscript
NIH
-PA Author Manuscript
NIH
-PA Author Manuscript