Data, learning and privacy in recommendation systems - HAL
137
HAL Id: tel-01477420 https://tel.archives-ouvertes.fr/tel-01477420 Submitted on 27 Feb 2017 HAL is a multi-disciplinary open access archive for the deposit and dissemination of sci- entific research documents, whether they are pub- lished or not. The documents may come from teaching and research institutions in France or abroad, or from public or private research centers. L’archive ouverte pluridisciplinaire HAL, est destinée au dépôt et à la diffusion de documents scientifiques de niveau recherche, publiés ou non, émanant des établissements d’enseignement et de recherche français ou étrangers, des laboratoires publics ou privés. Data, learning and privacy in recommendation systems Nupur Mittal To cite this version: Nupur Mittal. Data, learning and privacy in recommendation systems. Machine Learning [cs.LG]. Université Rennes 1, 2016. English. NNT : 2016REN1S084. tel-01477420
-
Upload
khangminh22 -
Category
Documents
-
view
4 -
download
0
Transcript of Data, learning and privacy in recommendation systems - HAL

HAL Id: tel-01477420https://tel.archives-ouvertes.fr/tel-01477420
Submitted on 27 Feb 2017
HAL is a multi-disciplinary open accessarchive for the deposit and dissemination of sci-entific research documents, whether they are pub-lished or not. The documents may come fromteaching and research institutions in France orabroad, or from public or private research centers.
L’archive ouverte pluridisciplinaire HAL, estdestinée au dépôt et à la diffusion de documentsscientifiques de niveau recherche, publiés ou non,émanant des établissements d’enseignement et derecherche français ou étrangers, des laboratoirespublics ou privés.
Data, learning and privacy in recommendation systemsNupur Mittal
To cite this version:Nupur Mittal. Data, learning and privacy in recommendation systems. Machine Learning [cs.LG].Université Rennes 1, 2016. English. �NNT : 2016REN1S084�. �tel-01477420�

ANNÉE 2016
THÈSE / UNIVERSITÉ DE RENNES 1sous le sceau de l’Université Bretagne Loire
pour le grade de
DOCTEUR DE L’UNIVERSITÉ DE RENNES 1
Mention : Informatique
Ecole doctorale Matisse
présentée par
Nupur Mittalpréparée à l’unité de recherche Inria Rennes - Bretagne AtlantiqueInstitut national de recherche en informatique et en automatique
Université de Rennes 1
DATA, LEARNING & PRIVACY
in RECOMMENDATION SYSTEMS
Thèse soutenue à Rennes
le 25 Novembre 2016
devant le jury composé de :
Esther PACITTIProfesseur à l’Université de Montpellier / rappor-teur
Pascal MOLLIProfesseur à l’Université de Nantes/rapporteur
David GROSS-AMBLARDProfesseur à l’Université de Rennes 1 / examina-teur
Erwan le MERRERChercheur à Technicolor Rennes/examinateur
Anne-Marie KERMARRECDirectrice de recherche à Inria Rennes/Directricede thèse
George GIAKKOUPISChargé de recherche à Inria Rennes / co-directeurde thèse

2

Acknowledgments
This thesis is a result of the efforts of many people. First of all, I would like to extend mygratitude to all the jury members for accepting to be a part of my work’s evaluation. I am verythankful to Prof Esther Pacitti and Prof Pascal Molli for accepting to report on this work, andProf David Gross-Amblard and Erwan le Merrer for being the examiners in the jury. Specialthanks to my co-supervisor George Giakkoupis. Working with him has definitely imparted mea different outlook towards problems and techniques for finding their solutions. Other thanbeing a constant motivation, I also thank George for letting me steal his Latex tricks, whichhave been extremely helpful in writing this thesis.
This work would have been a mere concept if it were not for the efforts of my supervisorDr. Anne-Marie Kermarrec. She has been an inspiration not only as a mentor but also as aperson. I would like to thank her for her efforts, patience, and time over the past three years. Ithank her for replying to all 1,432 of my emails, however irrelevant and unimportant they were.A complete statistical analysis of the email exchanges can be found in Appendix C.
French immigration and visa department hold special credits in my work. Thank you forpushing me beyond my patience and tolerance boundaries. If it were not for you, and the hugepile of documents submitted almost monthly in your offices, I wouldn’t have been able to kill20 extra trees.Finally I would like to thank my friends and family who have shown their immense support.Special thanks to Samuel, without you and your car, I wouldn’t have been able to spend the12% of my time traveling and eating. I must thank Arnaud for organizing enough game nightsto consume around 2% of the time of past three years. The strategy that I made during gamesmight not have helped me win the games against you, but they certainly helped in my thesis.I would like to conclude this by thanking my parents and my siblings back home in India, fortrusting in me and my decisions and for their constant support. For all the 8 food parcels thatyou sent me in the past three years, with the spicy food that almost burnt some of my col-leagues.
Thank you for all for your support and patience.

4
Table of Contents
1 Introduction 1-11.1 Challenges in Recommendation Systems . . . . . . . . . . . . . . . . . . . . . . . . . 1-4
1.1.1 Data . . . . . . . . . . . . . . . . . . . . . . . . . . . . . . . . . . . . . . . . . . . 1-51.1.2 Learning Model . . . . . . . . . . . . . . . . . . . . . . . . . . . . . . . . . . . . 1-61.1.3 Privacy . . . . . . . . . . . . . . . . . . . . . . . . . . . . . . . . . . . . . . . . . 1-7
1.2 Contributions . . . . . . . . . . . . . . . . . . . . . . . . . . . . . . . . . . . . . . . . . 1-81.2.1 Privacy of Users . . . . . . . . . . . . . . . . . . . . . . . . . . . . . . . . . . . . 1-91.2.2 Learning Model . . . . . . . . . . . . . . . . . . . . . . . . . . . . . . . . . . . . 1-91.2.3 Data Cleaning and Comprehension . . . . . . . . . . . . . . . . . . . . . . . . 1-10
1.3 Thesis Plan . . . . . . . . . . . . . . . . . . . . . . . . . . . . . . . . . . . . . . . . . . . 1-11
2 State-of-the Art 2-12.1 OVERVIEW OF RECOMMENDATION SYSTEMS . . . . . . . . . . . . . . . . 2-2
2.1.1 Notations . . . . . . . . . . . . . . . . . . . . . . . . . . . . . . . . . . . . . . . 2-22.1.2 Recommendation System Techniques . . . . . . . . . . . . . . . . . . . . . . . 2-3
2.1.2.1 Demographic Recommendation Systems . . . . . . . . . . . . . . . 2-32.1.2.2 Trust Aware Recommendation Systems . . . . . . . . . . . . . . . . . 2-42.1.2.3 Content Based Recommendation Systems . . . . . . . . . . . . . . . 2-62.1.2.4 Collaborative Filtering Recommendation Systems . . . . . . . . . . 2-72.1.2.5 Hybrid Recommendation Systems . . . . . . . . . . . . . . . . . . . 2-10
2.2 Privacy . . . . . . . . . . . . . . . . . . . . . . . . . . . . . . . . . . . . . . . . . . . . . 2-102.2.1 Privacy threats in social networks . . . . . . . . . . . . . . . . . . . . . . . . . 2-11
2.3 Learning in Recommendation Systems . . . . . . . . . . . . . . . . . . . . . . . . . . 2-142.3.1 K-Nearest Neighbor . . . . . . . . . . . . . . . . . . . . . . . . . . . . . . . . . 2-15
2.4 Data . . . . . . . . . . . . . . . . . . . . . . . . . . . . . . . . . . . . . . . . . . . . . . . 2-182.4.1 Power of Data . . . . . . . . . . . . . . . . . . . . . . . . . . . . . . . . . . . . . 2-19
3 Privacy of Users in Recommendation Systems applied to Online Social Networks 3-13.1 Introduction . . . . . . . . . . . . . . . . . . . . . . . . . . . . . . . . . . . . . . . . . . 3-13.2 Contribution: Privacy-Conscious Diffusion . . . . . . . . . . . . . . . . . . . . . . . . 3-23.3 Related Works . . . . . . . . . . . . . . . . . . . . . . . . . . . . . . . . . . . . . . . . . 3-53.4 RIPOSTE: The privacy preserving diffusion algorithm . . . . . . . . . . . . . . . . . . 3-6
3.4.1 Privacy . . . . . . . . . . . . . . . . . . . . . . . . . . . . . . . . . . . . . . . . . 3-73.4.2 Dissemination . . . . . . . . . . . . . . . . . . . . . . . . . . . . . . . . . . . . . 3-9
3.5 Experiments and Evaluation . . . . . . . . . . . . . . . . . . . . . . . . . . . . . . . . 3-133.6 Conclusion . . . . . . . . . . . . . . . . . . . . . . . . . . . . . . . . . . . . . . . . . . . 3-23
4 Fast and Efficient k-Nearest Neighbor Graph Construction 4-14.1 Introduction . . . . . . . . . . . . . . . . . . . . . . . . . . . . . . . . . . . . . . . . . . 4-24.2 Contribution: Fast and Efficient KNN Graph Construction . . . . . . . . . . . . . . . 4-3
4.2.1 Counting Phase . . . . . . . . . . . . . . . . . . . . . . . . . . . . . . . . . . . . 4-4

6
4.2.2 Refinement Phase . . . . . . . . . . . . . . . . . . . . . . . . . . . . . . . . . . 4-54.2.3 Optimization and Discussion . . . . . . . . . . . . . . . . . . . . . . . . . . . 4-6
4.3 The Algorithm: KIFF . . . . . . . . . . . . . . . . . . . . . . . . . . . . . . . . . . . . . 4-64.3.1 Notations . . . . . . . . . . . . . . . . . . . . . . . . . . . . . . . . . . . . . . . 4-74.3.2 Problem definition . . . . . . . . . . . . . . . . . . . . . . . . . . . . . . . . . . 4-74.3.3 KIFF . . . . . . . . . . . . . . . . . . . . . . . . . . . . . . . . . . . . . . . . . . . 4-84.3.4 Convergence and discussion . . . . . . . . . . . . . . . . . . . . . . . . . . . . 4-9
4.4 Experimental Setup . . . . . . . . . . . . . . . . . . . . . . . . . . . . . . . . . . . . . . 4-104.4.1 Datasets . . . . . . . . . . . . . . . . . . . . . . . . . . . . . . . . . . . . . . . . 4-10
4.4.1.1 Wikipedia . . . . . . . . . . . . . . . . . . . . . . . . . . . . . . . . . . 4-114.4.1.2 Gowalla . . . . . . . . . . . . . . . . . . . . . . . . . . . . . . . . . . . 4-124.4.1.3 DBLP . . . . . . . . . . . . . . . . . . . . . . . . . . . . . . . . . . . . . 4-12
4.4.2 Competitors . . . . . . . . . . . . . . . . . . . . . . . . . . . . . . . . . . . . . . 4-124.4.3 Metrics . . . . . . . . . . . . . . . . . . . . . . . . . . . . . . . . . . . . . . . . . 4-134.4.4 Default parameters . . . . . . . . . . . . . . . . . . . . . . . . . . . . . . . . . . 4-13
4.5 Evaluation . . . . . . . . . . . . . . . . . . . . . . . . . . . . . . . . . . . . . . . . . . . 4-144.5.1 Performance Comparison . . . . . . . . . . . . . . . . . . . . . . . . . . . . . . 4-14
4.5.1.1 Overhead of KIFF’s preprocessing . . . . . . . . . . . . . . . . . . . . 4-184.5.1.2 Properties of the resulting RCSs . . . . . . . . . . . . . . . . . . . . . 4-184.5.1.3 Convergence . . . . . . . . . . . . . . . . . . . . . . . . . . . . . . . . 4-20
4.5.2 Sensitivity analysis: k, γ and density . . . . . . . . . . . . . . . . . . . . . . . . 4-224.5.2.1 Impact of parameter k . . . . . . . . . . . . . . . . . . . . . . . . . . . 4-224.5.2.2 Impact of parameter γ . . . . . . . . . . . . . . . . . . . . . . . . . . . 4-234.5.2.3 Impact of density . . . . . . . . . . . . . . . . . . . . . . . . . . . . . . 4-25
4.6 Conclusion . . . . . . . . . . . . . . . . . . . . . . . . . . . . . . . . . . . . . . . . . . . 4-27
5 On the power of data: the specifics of data quality and quantity 5-15.1 Introduction . . . . . . . . . . . . . . . . . . . . . . . . . . . . . . . . . . . . . . . . . . 5-25.2 Data Collection . . . . . . . . . . . . . . . . . . . . . . . . . . . . . . . . . . . . . . . . 5-45.3 Data Cleansing and Preprocessing . . . . . . . . . . . . . . . . . . . . . . . . . . . . . 5-6
5.3.1 Missing Values . . . . . . . . . . . . . . . . . . . . . . . . . . . . . . . . . . . . . 5-65.3.2 Ambiguous Data . . . . . . . . . . . . . . . . . . . . . . . . . . . . . . . . . . . 5-75.3.3 Text processing . . . . . . . . . . . . . . . . . . . . . . . . . . . . . . . . . . . . 5-7
5.4 Inference Results . . . . . . . . . . . . . . . . . . . . . . . . . . . . . . . . . . . . . . . 5-95.5 Conclusion . . . . . . . . . . . . . . . . . . . . . . . . . . . . . . . . . . . . . . . . . . . 5-10
6 Conclusion and Perspective 6-1
A Résumé en Français A-1
B List of Publications B-1
C Extension of Acknowledgments C-1

7

8

List of Figures
1.1 Searching for comedy movies on IMDB results in 72,938 options. . . . . . . . . . . 1-2
1.2 Making recommendations is like passing the data through a sieve. . . . . . . . . . . 1-2
1.3 Broad categorization of recommendation system techniques. . . . . . . . . . . . . . 1-3
1.4 Quality and Quantity are two important aspects of data in recommendation sys-tems. . . . . . . . . . . . . . . . . . . . . . . . . . . . . . . . . . . . . . . . . . . . . . . 1-6
1.5 Heart of a recommendation system is the black-box that allows it to learn. . . . . . 1-6
1.6 Organization map of the contributions . . . . . . . . . . . . . . . . . . . . . . . . . . 1-8
2.1 Rating Matrix for a movie recommender system. The empty cells signify that thecorresponding user has not seen the movie. . . . . . . . . . . . . . . . . . . . . . . . 2-3
2.2 Simple architecture of a demographic recommendation system . . . . . . . . . . . 2-4
2.3 Advantages of Trust aware recommendation systems . . . . . . . . . . . . . . . . . . 2-5
2.4 Overview of a content based recommendation system . . . . . . . . . . . . . . . . . 2-6
2.5 Recommendations based on what other similar users have liked . . . . . . . . . . . 2-8
2.6 Collaborative Filtering techniques can be further classified into Model based andMemory based techniques. . . . . . . . . . . . . . . . . . . . . . . . . . . . . . . . . . 2-8
2.7 Sub-classification of memory based collaborative filtering techniques. . . . . . . . 2-9
2.8 Learning block of the recommendation systems using techniques like classifica-tion, clustering or rule based associations. . . . . . . . . . . . . . . . . . . . . . . . . 2-14
2.9 A broad categorization of Learning techniques in recommendation systems . . . . 2-15
2.10 More than one possible hyperplanes when separating classes in SVM . . . . . . . . 2-20
3.1 Major components of RIPOSTE: the local machine with the randomized algorithmand the online social network. In RIPOSTE, the user’s opinion is locally random-ized and only the output of RIPOSTE is exposed to the OSN. The ¬RIPOSTE arrowis represented for illustration purposes and is not an explicit action of RIPOSTE. . . 3-3
3.2 Illustration of Ineq. (3.3) that provides upper and lower bounds on the conditionalprobability q that the user likes the information, after observing whether the in-formation was reposted from the user, in terms of the prior probability q beforethe observation. Probability q diverges more from q as λ increases or δ decreases. 3-9
3.3 Dissemination for RIPOSTE as a function of the item popularity. . . . . . . . . . . . 3-15
3.4 Dissemination in Twitter, LiveJournal, RenRen, Facebook and Google+. Compar-ison with STANDARD and the β/(β+1) lower bound of Theorem 3. . . . . . . . . . . 3-16
3.5 Dissemination in Twitter, LiveJournal, RenRen, Facebook and Google+. Compar-ison with the 1/β upper bound of Theorem 2 for unpopular items. . . . . . . . . . . 3-18
3.6 Dissemination in Twitter, LiveJournal, RenRen, Facebook and Google+. Distance-threshold model (all users within distance h from the source, and only them, likethe item). . . . . . . . . . . . . . . . . . . . . . . . . . . . . . . . . . . . . . . . . . . . . 3-20

10
3.7 Fraction of users that like the item among all uses that receive the item (a measureknown as precision), in the distance-threshold opinion model. RIPOSTE and DB-RIPOSTE achieve significantly better precision that STANDARD for smaller valuesof h. . . . . . . . . . . . . . . . . . . . . . . . . . . . . . . . . . . . . . . . . . . . . . . 3-22
3.8 Effect of variation in parameters λ and δ on the dissemination achieved with RI-POSTE in LiveJournal. (a) Variation in λ for fixed δ = 0.75. (b) Variation in δ forfixed λ = 3. Increasing either parameter decreases the popularity threshold andincreases the spread. . . . . . . . . . . . . . . . . . . . . . . . . . . . . . . . . . . . . . 3-23
4.1 State-of-the art greedy KNN-graph approaches spend over 90% of their computa-tion time computing similarity values (Wikipedia dataset). . . . . . . . . . . . . . . 4-3
4.2 KIFF exploits the bipartite nature of user-item datasets to pre-compute Ranked
Candidate Sets (noted RC Su). . . . . . . . . . . . . . . . . . . . . . . . . . . . . . . . 4-44.3 The pre-computed Ranked Candidate Sets are used in an iterative greedy process
to construct an approximation of the KNN. . . . . . . . . . . . . . . . . . . . . . . . . 4-54.4 CCDF of the size of the user and item profiles, top and bottom respectively. Long-
tailed curves show that most of the users have few ratings. . . . . . . . . . . . . . . . 4-114.5 Although KIFF must pay higher preprocessing costs to constructs its Ranked Can-
didate Sets, this overhead is largely balanced out by a smaller number of simi-larity computations due to a much faster convergence compared to Hyrec andNN-Descent. . . . . . . . . . . . . . . . . . . . . . . . . . . . . . . . . . . . . . . . . . . 4-17
4.6 CCDF of |RC S|. The vertical bars shows the cut-off sizes enforced by KIFF’s termi-nation mechanism (also shown in Table 4.6) . . . . . . . . . . . . . . . . . . . . . . . 4-19
4.7 Correlation between the rank of nodes in RC Ss and the cosine and Jaccard met-rics for users with |RC Su | above |RC S|cut = 440 for Wikipedia. . . . . . . . . . . . . . 4-20
4.8 KIFF quickly provides an accurate KNN approximation by using relevant candi-dates compared to competitor approaches (Arxiv dataset). . . . . . . . . . . . . . . 4-21
4.9 The impact of γ on the wall-time of KIFF remains low. . . . . . . . . . . . . . . . . . 4-244.10 a) KIFF is faster than NN-Descent for sparse datasets ; b) the scan rate for KIFF
decreases according to the dataset density compared to NN-Descent which is notcorrelated to density. . . . . . . . . . . . . . . . . . . . . . . . . . . . . . . . . . . . . . 4-26
5.1 Survey from Fitforcommerce showing that 33% of businesses on internet do nothave access to enough data for personalization. . . . . . . . . . . . . . . . . . . . . . 5-3

List of Tables
3.1 Network topologies used in the experiments. By avg-deg we denote the averagedegree of the network. . . . . . . . . . . . . . . . . . . . . . . . . . . . . . . . . . . . . 3-14
4.1 Dataset description (All datasets are available on-line [1]) . . . . . . . . . . . . . . . 4-104.2 Overall perf. of NN-Descent,HyRec, & KIFF . . . . . . . . . . . . . . . . . . . . . . . 4-144.3 Average speed-up and recall gain of KIFF . . . . . . . . . . . . . . . . . . . . . . . . . 4-154.4 Overhead of item profile construction in KIFF . . . . . . . . . . . . . . . . . . . . . . 4-154.5 Overhead of RC S construction & statistics (KIFF) . . . . . . . . . . . . . . . . . . . . 4-184.6 Impact of KIFF’s termination mechanism . . . . . . . . . . . . . . . . . . . . . . . . . 4-194.7 Impact of initialization method on initial recall . . . . . . . . . . . . . . . . . . . . . 4-204.8 Impact of k on recall and wall-time (k=10, DBLP: k=20) . . . . . . . . . . . . . . . . 4-234.9 MovieLens datasets with different density. . . . . . . . . . . . . . . . . . . . . . . . . 4-25
5.1 Number of missing values for each attribute in Twitter dataset for a total of 9,465users . . . . . . . . . . . . . . . . . . . . . . . . . . . . . . . . . . . . . . . . . . . . . . 5-5
5.2 Number of missing values for each attribute in Facebook dataset for a total of9,465 users . . . . . . . . . . . . . . . . . . . . . . . . . . . . . . . . . . . . . . . . . . . 5-6
5.3 Number of missing values for each attribute in LinkedIn dataset for a total of 9,465users . . . . . . . . . . . . . . . . . . . . . . . . . . . . . . . . . . . . . . . . . . . . . . 5-6
5.4 Movie genres derived from Movielens dataset . . . . . . . . . . . . . . . . . . . . . . 5-85.5 Music genres derived (mostly) from Last.fm API . . . . . . . . . . . . . . . . . . . . . 5-85.6 Book genres extracted from Goodread.com . . . . . . . . . . . . . . . . . . . . . . . . 5-85.7 Values of inference accuracy for using individual source attributes for each target
attribute. . . . . . . . . . . . . . . . . . . . . . . . . . . . . . . . . . . . . . . . . . . . . 5-95.8 Values of inference accuracy obtained by using age and twitter trends as source
attributed, for all the target attributes. . . . . . . . . . . . . . . . . . . . . . . . . . . . 5-10


1INTRODUCTION
Hiding within those mounds ofdata is knowledge that couldchange the life of a patient or evenchange the world
Atul Butte
Stanford School of Medicine
The last decade has witnessed an overwhelming increase in the accessibility of internet, bothat an organizational and at an individual level. In these years, world wide web has grown frombeing a mere information retrieval/search service to incorporating ideas like knowledge shar-ing, online social networking, micro-blogging, advanced e-commerce services, opinion shar-ing, news publishing etc. This new spectrum of services is constantly flooding the www withdata. This data in not only restricted to the types of products/services and items but also con-sists of opinions, trust scores, and an individual’s inclination towards various topics. Further-more, the data can be ready-to-use or might require pre-processing and cleansing before it canbe used. With approximately 1.09 billion daily active users on Facebook [62], over 488 millionproducts sold on Amazon USA [73], and around 500 million tweets per day [4], one can easilyget the idea of the “data-explosion" taking place on the world wide web.
The above numbers confirm the notion that the rate at which data is generated on inter-net is far greater than the rate at which an individual or even an organization can consume itrationally, i.e., within acceptable time limit constrained by computing resources. With so muchinformation all around, it is not greedy to affirm that a user will need more time to find theinformation relevant to her needs. For example, a simple search on Google for recipes withcheese results in around 74,500,000 results. A user looking to select a comedy movie to watch,on IMDB is returned with around 72,938 options as shown in Figure 1.1. Therefore, with thisexponentially increasing amount of data comes the challenge of facilitating timely access tothe information relevant to the user. In other words, there is a desperate need of filtering andefficiently prioritizing the data available on internet, customized to users’ needs to overcomethe side-effects of the phenomenon of data-explosion. In a situation like this, involving vastamount of data to output selected customized information, Recommendation Systems come asa rescue.

1-2
Figure 1.1 – Searching for comedy movies on IMDB results in 72,938 options.
Recommendation Systems, initially targeting to combat the data-explosion, surfaced asan independent research area in the 90s [14, 70, 104]. They originated to mimic the idea of“word-of-mouth", where individuals generally seek each others’ endorsements and experiencesover routine tasks. It was only the initial idea behind recommendations and it later becamethe base for what is now known as collaborative filtering : the most used technique of recom-mendation systems. Over the years, recommendation systems have drastically evolved to growbeyond the “word-of-mouth" concept. Instead, recommendation systems leveraged other con-tent available vastly over internet, like description of products, user attributes and so on. Re-gardless of the technique used to make recommendations, they aim to provide a filtered list ofitems (products, services, opinions, reviews etc.) personalized to a user’s requirements. Gener-ally, this filtered and personalized list is ranked according to a predicted user preferences.
Figure 1.2 – Making recommendations is
like passing the data through a sieve.
They quickly grew in popularity, soon becomingone of the most researched areas and attracting appli-cations from all over the internet. Attributing to theirnovel idea of information filtering and returning cus-tomized results, they were indisputably loved by the e-commerce industry. As a consequence, recommenda-tion systems were, in no time, employed on all majore-commerce portals like Amazon, IMDB, Netflix, CD-NOW, Last.fm to name a few. The popularity and useof recommendation systems continue to evolve, alongwith its tools and techniques. From having an easy ac-

1-3
cess to the large data/information to be filtered to presenting the personalized filtered results tothe user, recommendation systems involve various tools, algorithms and techniques, undoubt-edly spanning multiple fields, like machine learning, data-mining, information retrieval andnatural language processing. Depending on the tools and techniques involved in the workingof a recommendation system/engine, they can be classified into various categories. Differentcategorization and subsequently sub-categorization [10, 25, 118, 122] is available in the rich lit-erature of recommendation systems and we chose to follow the one shown in Figure 1.3.
Figure 1.3 – Broad categorization of recommendation system techniques.
Process of recommending, by a recommendation system, can be easily pictured as a carefuland accurate combination of various phases namely: data acquisition, data processing, data
modeling and data interpretation. Numerous techniques to achieve each of these phases areresearched upon constantly. The changes in them are directly inflicted upon the performanceof the recommendation system. While it is difficult to focus on all of these phases and tech-niques involved in them separately and exclusively, we cover some of them in the subsequentchapters of this document.
Recommendation Systems as intended originally, do help the internet users to filter and accessuseful information from vast data mounds but this is not their only feature. One of the signifi-cant reasons for their growing popularity is their ability to include serendipity in a user’s search,while giving her access to useful and relevant information. This feature of including new, sur-prising results, is as beneficial to the service providers as it is dear to the customers. For cus-tomers, it acts as a tool to discover hidden desirable products that they don’t know about. Ithelps the service providers to expose new products and services to targeted customers who,otherwise, will not find the product. Showing these new products only to targeted users isanother feature of recommendation systems and is called personalization. It means that thesystem takes care of the preferences of each of its users individually and provides them withwhat they like the most. Attributing to these unique features, recommendation systems havebecome very popular and find their applications in almost every field. Online social networksuse them to make the network : predicting desirable connections for users. They also use rec-ommendations to spread information in the network, by exposing new information to userswho will find it interesting and will contribute to spread it forward. Similarly, they are preva-

1-4
lent in all e-businesses where number of new products are increasing exponentially. Searchengines have adapted themselves to include personalized search results based on recommen-dation techniques, rather than relying only on filtering mechanisms. They find them equallyadvantageous in domains like loyalty programs where recommendations are made pertainingto specific programs, redemption suggestions and upgrade schemes. Some other applicationareas include email campaigns, product discovery and dating services.
To conclude the applications, relevance and popularity of recommendation systems, wequote CNN money:
The Web, they say, is leaving the era of search and enteringone of discovery. What’s the difference? Search is what you dowhen you’re looking for something. Discovery is when some-thing wonderful that you didn’t know existed or didn’t knowhow to ask for, finds you.
1.1 Challenges in Recommendation Systems
The most popular technique of recommendations, collaborative filtering, roots to the simpleidea of relying on others’ opinions and reviews about products and services to serve userswho are new to these products and services. There are several ways of using this informa-tion, which also forms the basis of the categorization of recommendation systems, i.e., user-user or item-item collaborative filtering or knowledge-based etc. Though depending on thecategory of the recommendation system, the challenges in its design, approach and usagevary yet there are some basic challenges common to all of them. For example, while limitedanalysis of the content is among one of the major problems faced by content-based recom-mendation systems, the sparsity of ratings concerns only the collaborative recommendationsystems. On the same note, new user problem is more or less common to the both of them,and also to the other recommendation systems, like demographic or hybrid. Attributed to thewidespread use and promising results, recommendation system is a highly researched field. Asa consequence, a lot of work has been dedicated to outline the issues and challenges in thesame [7, 89, 101, 128, 134, 141]. Tracing to the multi-disciplinary and evolving nature of the rec-ommendation systems, the diverse tools and techniques involved in their design, developmentand implementation, we can surmise that their issues and challenges bear the same nature :of varied nature, spanning different domains and continuously unfolding. Therefore, the chal-lenges involved in the field of recommendation systems are not confined to the ones elaboratedin previous works [7, 89, 101, 128, 134, 141] and are far more widespread in nature and hence, itis very difficult to mention them all. There is a very explicit and elaborate mention of the chal-lenges in recommendation systems by Ricci et al. [128] with several pointers to many of theother works, in a well categorized fashion. It is of no importance to reinvent the wheel, there-fore, in this work we will identify some of the crucial sub-challenges from these major chal-lenges and propose efficient and carefully designed solutions to them. While outlining thesechallenges, we incline them towards the four phases constituting the design of recommenda-

1-5
tion systems.
1.1.1 DATA: Too much or Too little? Too raw or Too processed?
From the brief introduction and background above, it is evident that the data and informationabout users and products involved in a recommendation system are of utmost importance.Without data, there is no learning and without learning, there is no recommendation. While atthe same time, in this era of big data, too much data without proper insight into it can leadto confusion and hence wrong approaches for learning and analyzing it. Furthermore, thereare challenges concerning the forms in which this data can exist. It can range from personalopinions and sentiments to user attributes like age or gender, in plain text, geo-location data,encrypted, scraped in form of xml etc. Recommendation Systems are as dear to the consumersas they are to the service providers. In order to give the consumers the best of recommenda-tions and to render the providers with the best of profits, recommendation systems have to befed with the right amount and kind of data. With recommendation systems spanning almostevery domain, and being used by almost every internet based service and application, it is achallenge to filter and feed them with the right data. Therefore, we consider it one of the basic,yet important issue. Now we will discuss the two Qs of the data : Quantity and Quality.
Use, do not abuse... neither abstinence nor excess ever renders man happy.
1. Quantity Regardless of their type, all the recommendation systems rely on data obtaineddirectly or indirectly from users and/or service providers. In the scope of this thesis, wewill majorly focus on the three principal types of recommendation systems: collaborativefiltering, content-based and hybrid, unless specified.
It is a well known fact that any machine learning model needs a lot of data to learn from,to perform efficiently. Recommendation system is no exception, as it generally relies ona machine learning based data-learning model to learn from the past user behavior orfrom the natural language text chunks (in case of content based systems). This require-ment of recommendation systems is burdensome to fulfill. Small e-commerce servicesor applications with a limited user base are the ones mostly concerned. On the contrary,big players like Google, Amazon, Facebook, IMDB are known for their recommendationsystems, the credit of which can be, in part, attributed to their huge user bases.
Hindu philosopher Chankya said even nectar is poison if taken to excess. So is the casewith the excessive data in recommendation systems. One very careful parameter in rec-ommendation systems is to deal with user preferences, which is reflected from the col-lected data. User preferences continue to change and hence a careful decision and choiceneeds to be made to avoid using outdated data, as it can lead to unsought learning, andhence bad recommendations. citation This problem is visibly aggravated when the sizeof collected data increases. The larger the size of the data, the more are the problems tostore, to process and to analyze it.
In conclusion, we need good amount of data to feed to the recommendation systems: nottoo big, not to small. But the data available is not always in this required quantities. It istherefore a challenge to alter the size of data to suit the recommendation needs.
2. Quality A lot of recent works shed light on the significance of quality of data, speciallyrelating it to the practicality of recommendation systems [11, 21, 130]. While most of thecollaborative filtering recommendation systems use the data available in the form of userpreferences: affinity of users towards a particular item, most of the content-based and

1-6
Figure 1.4 – Quality and Quantity are two important aspects of data in recommendation systems.
demographic recommendation systems employ the user (and/or item) attributes : likeusers’ name, age, gender etc. With the increasing popularity and use of services like newsfeed, micro-blogging etc, a new range of data content is available in the form of natu-ral language chunks. Content based recommendation systems techniques are constantlyevolving to make use of such data. With such increasing diversity in the nature of data,the issues of data quality become more prominent. Data quality can have several aspectsrelated to it. It can be erroneous, or with incomplete details. For example, dataset con-taining ages of only 60% of its users. Similarly, data can be either too raw and hence notdirectly usable or too processed, i.e., very difficult to extract any kind of information fromit.
In conclusion, data quality is an indispensable aspect to deal with in the context of rec-ommendation systems. There are various aspects that can be associated to the qualityof data, and it is generally impractical to consider them all at the same time. Therefore,in this work, we orient the quality of data in terms of preprocessing required to make ituseful and powerful.
1.1.2 HOW TO LEARN
The heart of any recommendation system is the black box to which the data is inputted to havepredicted ordered outputs. While designing the black box is undoubtedly an arduous job and
Figure 1.5 – Heart of a recommendation system is the black-box that allows it to learn.
requires a competitive expertise in the field, even choosing the appropriate technology for theblack box is very demanding. It is a result of the advancements in the machine learning field,opening a whole new world to the possibilities. Without loosing a sense of generality, theseblack box techniques largely depend on the type of recommendations desired in the output

1-7
and/or its related applications. Still there are many cases where more than one technology issuitable and hence leaves the designer in the dilemma. Each of these choices have their ownpros and cons and therefore, it mostly becomes a choice dear to the designer. It is very difficultto answer this question of “How to learn? ".
Some of the most common learning techniques (and algorithms) for collaborative filter-ing recommendation systems include Matrix Factorization, Singular Value Decomposition, K-
Nearest Neighbors and non-negative matrix factorization [7, 10, 123]. On a similar note, classifi-
cation and probabilistic learning methods from machine learning are very popular for content-based recommendations [99]. Clustering and Association Rules can be used for both the rec-ommendation techniques, depending on the type of data available [7, 97]. There are variousparameters to keep in mind before choosing one or the other. Weather the computation for therecommendation process is performed online or not plays an important role in choosing theright category of the technique. Another significant factor is the density of data involved in thecomputations. Some of the techniques are more suitable for high density data as compared tosparse data and vice-versa. In addition to these, computation time, ease of implementation,recommendation quality and fault tolerance are other relevant parameters to be considered.
As pointed out earlier, the learning and modeling techniques like KNN, Matrix Factoriza-tion, Decision Trees, Support Vector Machines and others are well studied in literature. In facteach of the above technique is a full-fledged research area in itself. They have evolved progres-sively over the years, and still continue to do so. We can easily reason that it is not in the scopeof one single work to focus on all these techniques. Their applications and areas that they servein are not limited to recommendation systems. In fact, recommendation systems are only oneof the prominent areas of their use.
In a nutshell, considering the depth of these modeling techniques, we chose one of themto study, analyze and improvise in our work. KNN is a very popular technique in the scope ofrecommendation systems. Even though it has been already investigated a lot, yet there is a sig-nificant room for improvement, more due to its widespread use, and ease of implementation.Therefore, in this work, we will mention and give a background for some of these techniquesbut will elaborate in depth only KNN, in-light of recommendation systems. Considering thenumerous variations of each of these approaches in the last decade, we will restrict to the basicfundamentals of these.
1.1.3 PRIVACY
Recommendation systems have gained popularity with consumers and service providers alike.When designed efficiently, they can be extremely powerful tools for personalization and cus-tomization. Though, in addition to the efficient design, the input data plays a significant role.Personal details, accurate traits, exact opinions and preferences of users are among the mostdesired information to make these personalized recommendations. It has become a tendencyof the service providers to often ignore the risks and privacy breaches involved in gatheringand processing the users’ personal data. Moreover, many users are not sufficiently aware ofthe privacy threats that they might be exposing themselves to. Two main factors responsiblefor this are: 1) Not being fully aware of all the data that is being collected. 2) Under-estimatingthe power of the collected data, and the learning models. For example, a user using Amazon tobuy a camera might not be aware that his browsing history is being saved, even if she has notbrought the product. Similarly, a user writing a review about a product she purchased mightnot be aware that, for example, the review combined with her personal details like gender andage, can reveal her city or any other unknown and undeclared information about her. The ser-vice providers, in turn, take advantage of the users’ ignorance, by ignoring to explicitly mention

1-8
the kind of data they are collecting or the way the collected data is used. Also users’ data canbe sold to third parties while the user is not aware of that, though not all privacy breaches aredeliberate. Some of them are accidental and unintentional. In addition to the privacy breachesof a user caused by data collection, there are other ways that their privacy can be intentionallyor unintentionally compromised, without their knowledge. The manner of storing data is verycrucial to safeguard the privacy of users. We often hear of data being stolen, publicly releasedand so on. These are some examples of users’ privacy being compromised.
The word privacy has many meanings associated to it. In the domain of internet systemsand applications, it is mostly associated to information privacy [84]. In the simplest of terms, itimplies keeping the user information confidential, though it is not limited to confidentiality. Ina more detailed definition, it focuses on the individual concerned by the information, and theeffects that this information’s disclosure can have on the individual, and also on her control andconsent over these effects [81] Moving away from the e-commerce services, the term informa-
tion privacy starts to mold into other forms. For example, concealing users’ identity or hidingtheir religious, sexual, political or other such interests. Using social-networks, users share a lotof information, mostly personal, either knowingly or unknowingly. The information shared interms of photos, statuses, opinions, and emotions can be all used against the users’ privacy.Sometimes the users are not aware of how this sharing can harm them while on the other occa-sions, they do not have much of a choice, other than abstaining the use of the social-networkcompletely. We will shed more light on this in our later sections, with examples.
Jeckmans et al. discuss various privacy concerns and their implications, in recommenda-tion systems in details and also categorize them. They also mention some research advance-ments for combating these privacy threats. It becomes clear from their work that there aremany ways of studying privacy issues in recommendation systems and it is not a viable op-tion to study them all at once. Therefore, we chose to focus on the privacy in recommenda-tion systems applied to online social networks. Recalling the classification of recommendationtechniques from Figure 1.3, we can see that this comes under trust-aware recommendationtechniques.
1.2 Contributions
We would like to mention that we do not follow a particular order for presenting the con-tributions in the subsequent chapters. To help the reader easily find the information; here is anorganization map of our contributions.
Figure 1.6 – Organization map of the contributions

1-9
1.2.1 PRIVACY OF USERS
RIPOSTE is our contribution to deal with one aspect of users’ privacy in Online Social Net-works, in a recommendation system setting. Recommendation systems play an important rolein OSNs; to build the network, to spread the information in the network, and to enable usersinfluence one another. From building the network to every step involved in spreading the in-formation, showing trust on other users, influencing other users and choosing the people toget influenced from, every step involves privacy risks for the users. Spreading information in asocial network is similar to proposing users with new items in a recommendation system. Ina setting like this, it is of utmost importance to chose the information/item that the user willlike. On the same note, it is also equally important to hide the information/items that the userwill dislike so as to provide the users with a pleasant social networking/browsing or shoppingexperience. While ensuring to fulfill these recommendations related requirements in OSNs, itis very crucial to keep a control on the various privacy threats that the users can face. Amongothers, one of the common privacy threats (very common to microblogging services) is to beconvicted for spreading ideas/information. Freely spreading information is the crux of socialnetworks and microblogging services, like Twitter, LiveJournal, Facebook, Google+ etc. A lotof people are using these platforms as a medium to share their ideology, to disseminate news,political opinions, and their outlook on other pivotal topics. While the essence of these servicesis enabling free dissemination of information and ideas, yet it has been often noticed that sev-eral users fear and refrain from openly expressing their views on various subjects. This comesmostly from the fear of being prosecuted and convicted; a practice common in countries withauthoritarian regimes, though existent even in countries with democratic regimes. Fundamen-tally, this obstruction in the dissemination of ideas and information in OSNs come from privacy
considerations; a user in a favor of a particular idea chooses not to spread it fearing a breach ofher privacy.
With RIPOSTE, we aim to fulfill these requirements of social networks (in a recommenda-tion system setting) keeping in mind the privacy threats posed to the user. With this privacypreserving, information diffusion algorithm, the objective is to maintain the users’ influenceand let them freely spread information while preserving their privacy using the principal ofPlausible Deniability. RIPOSTE is a distributed algorithm for disseminating information (ideas,news, opinions, or trends) in an Online Social Network. It also guarantees not to disturb theessence of the social networks. Hence, it makes sure sure that the information spreads widelyif (and only if) a large fraction of users find it interesting. Also, if only a few users find the infor-mation interesting, RIPOSTE makes the information dissemination process die quickly, not tospread the information to a large fraction of network, and all this is done in a privacy preservingmanner.
We provide our proofs to our theoretical foundations and support them with extensiveexperiments, taking snapshots of real-topological social networks like Facebook, Twitter, Live-Journal, Google+ among others.
1.2.2 LEARNING MODEL
In one of the techniques, namely Collaborative Filtering, recommendation systems analyze thepatterns of users’ interest in items and products to provide personalized recommendations ofitems that will suit a user’s taste. In other words, in a collaborative filtering technique, the rec-ommendation system is trying to predict a user’s opinion on different items and to suggest herthe best items based on her previous likings and on the opinions of other like-minded users.One of the challenging tasks here is to find like-minded users, or the users similar to each other.This is a classic problem in literature and is called K-Nearest Neighbor (KNN) graph construc-

1-10
tion [64, 146].
To understand what KNN is, we will draw parallelance from getting recommendationsfrom friends. We choose people with same taste as ours and then ask them to recommend ussomething, lets say a book. If a majority of them suggests the same book, we will deduce thatthat we will also like this book. KNN is the algorithmic translation of this simple intuition. Inthe simplest terms, a KNN graph is a directed graph where each vertex is connected to its k
most similar vertices. KNN algorithm finds its use in wide variety and range of applicationsand can be used in the black box of recommendation systems as seen in Section 1.1.2. It is usedas a learning model by finding k most similar users (based on their likes) for each user in thedataset.
Although KNN is a widely used and studied algorithm, there are some challenges in con-structing an efficient KNN algorithm. With all the data available from internet and its appli-cations, it is not surprising to see datasets with more than billion users and/or items. In sucha scenario, due to the intuition of comparing each pair of users, computing KNN quickly andefficiently is one of the crucial challenges. Other important issues include finding a good valueof k. If the value of k is too small then the algorithm tend to include outliers whereas in case of avery large value, the algorithm risks to have irrelevant neighborhood. Finding a way to measuresimilarity between users is also a tedious but crucial task as the performance of KNN is highlydependent on the choice of this similarity measure. Although various measures can be usedto compute the distance between two points, the most desirable similarity measure is one forwhich a greater similarity between two users implies a greater likelihood of being closer.
To tackle the above issues of KNN graph construction efficiently, we propose KIFF: a generic,fast and scalable KNN graph construction algorithm. KIFF directly exploits the bipartite natureof of most datasets to which KNN algorithms are applied. This simple but powerful strategydrastically limits the computational cost required to rapidly converge to an accurate KNN so-lution. We chose a wide range of datasets to perform experiments to support the results of KIFF
being considerably faster and scalable than the other state-of-the art approaches. Our eval-uation on a representative range of datasets show that KIFF provides, on average, a speed-upfactor of 14 against recent state-of-the art solutions while improving the quality of the KNNapproximation by 18%.
1.2.3 DATA COLLECTION, CLEANING AND COMPREHENSION
Data is a very important part of all web-based applications, and not only recommendation sys-tems. We present an empirical study focusing on highlighting the power of user data. With thisbig picture in mind, we also show how combining information from various sources can revealinteresting unknown information about the users. This revelation is an important milestonefor recommendation system applications, specially for the systems that often suffer with theproblem of lack of user data. To investigate on the power of inference of various user attributes,we collect data from three different social networks. Designing crawlers and scrapers is itself achallenging task, mostly because of the limits imposed by these services. Bounded by these lim-itations, we only extract data enough for our research purposes. Due to privacy policy of theseservices, we cannot release the datasets publicly. Another challenging task is to cleanse thedata, as many of the values are in a format that is not suitable for inference purposes. We detailthe cleansing process used for each of the attributes, focusing on tweet processing and hashtagextraction. To conclude this work, we present the results of inference obtained by consider-ing different combinations of attributes. Our empirical investigation shows that information inform of hashtags and trending topics from twitter can be a used a reliable source of inference,specially for predicting user’s interest in movies, music and books.

1-11
In essence, our work provides a complete insight into the process of data collection andcleansing to use it to infer unknown user information, collected and combined from differentinformation sources. We claim that they results can be easily extended when the sources of theinformation are changed.
1.3 Thesis Plan
The following chapters lay background and give details for the contributions made as apart of this thesis. Chapter 2 provides detailed background study and knowledge of the state-of-the art for each of the contributions made. In addition, it provides clear definitions of thenotions used in the later chapters. Later in Chapter 3, we elaborate our contribution for thechallenge of privacy issues in online social networks - RIPOSTE, from a perspective of recom-mendation systems. Chapter 4 explains the technical details and design idea of our contribu-tion for learning model in recommendation systems, which we call KIFF. Our last contributionis presented in Chapter 5, dealing with various aspects of data in the field of recommendationsystems. We conclude our work in Chapter 6 giving some insights into future work.


2State-of-the Art
A successful person is the one whocan lay a firm foundation with thebricks others have thrown at her.
David Brinkley
Recommendation Systems have attracted the attention of researchers across many domainslike data mining, information retrieval, large scale social networks, distributed computing etc.One of the most significant facet for this attention can be attributed to their multi-disciplinary
nature. Different components of recommendation systems, like data, learning model, predic-tion mechanisms and evaluation metrics, require understanding and knowledge from differentfields. In addition, the ease of use and widespread scope of their applications gives them evenmore choices for the tools and techniques that can be used in their design and implementation.As a result of this varied nature of recommendation systems, the challenges in their design andimplementation are also manifold. Depending on the type of recommendation technique used,its application, and availability of data and resources, there are numerous aspects to deal with,both in research and implementation. It is not surprising that within the scope of this work, wecannot cover all the aspects of recommendation systems. Therefore, we select three areas tostudy and propose solutions to the major problems in each of them.
In this chapter, we start by laying a foundation for a basic understanding and backgroundfor recommendation systems, their main components, and popular techniques used to designthem. Afterwards, we discuss in details the three areas of recommendation systems that wehave chosen, namely: Privacy, Learning Model, and Data. For each of these areas, we follow asystematic approach of starting with the basic introduction to the problem, and then movingtowards more precise problem definition. In addition to this, we also highlight the remarkablecontributions in each area from the rich literature of recommendation systems.

2-2 CHAPTER 2
2.1 OVERVIEW OF RECOMMENDATION SYSTEMS
Recommendation systems are information filtering systems that deal with the problem of dataexplosion by using filtering important information from the overall data available to the systemusing user data, item data, user opinions, preferences, meta-data, demographic information,user behavior or combination of these [86, 127, 128]. Over the years, recommendation sys-tems have evolved to extend beyond the concept of relying on similar user behavior to makepredictions as opposed to the original idea of recommendation systems that surfaced in themid-90s [78, 126, 133]. As we have mentioned earlier, recommendation systems witness a hugediversity in the tools, techniques and algorithms that they can use. The choice of these is guidedby various factors, including the target application of the recommendation system, availabilityand type of data, computational resources etc. Before discussing the most popular recommen-dation system techniques in details, we use notations to mathematically define the idea behindrecommendations.
2.1.1 Notations
In the present age of internet, personalization and commercialization, the idea of making a rec-ommendation is simplified to making a prediction (in form of ratings about an unknown andunseen item by a user. 1 The data and techniques used to make these predictions are generallythe leading factors in categorizing recommendation systems into different categories. Regard-less of the categorization, here we present some basic notion about recommendation systems.
Let us consider a system S, that has a set of users U and a set of items I. The users U of thesystem can have associations in I. Such associations are represented by ratings and are usually aquantitative representation of a user u�s inclination for an item i in the system. In other words,ratings are a means to measure the utility of an item i for a user u.
r : U× I→R (2.1)
Here we consider that R is the domain or set of possible ratings and is restricted to non-negativeintegers only. In general, ratings can be either explicitly given by the users for various items,with the use of stars, non-negative numbers, and in some cases, they can also take adverbialform. If the ratings are not explicitly stated by the users, the system relies on implicit ratings,which can be users’ navigation history, purchase record, interaction patterns etc., dependingon the system.Logically, the maximum value of the above utility function (represented as ratings) will meanthat a user is very interested in the recommended item. In other words, the recommendationsystems should recommend items iu that a user u will be very interested in, for all the users inthe system. This is mathematically represented as:
∀u ∈U, iu = maxu∈U
r (u, i ). (2.2)
We use the notion of profiles to characterize the elements of set U and I. The profile of auser consists of information related to her, for example, it can contain the items viewed andrated by the user, or it can consist of user’s demographic information. Similarly the profile ofan item is a representation of characteristics of an item. In this case, it can consist of users whohave liked that item, or item features like price, size specifications etc. For example, in a musicrecommendation system, a user’s profile can be composed of the songs that users has liked in
1. Although this is not the only idea behind recommendation systems but we will only use this in the scope ofthis thesis.

STATE-OF-THE ART 2-3
the past, and an item’s profile (a song in this case) can consist of album name, singer, genre,release year, language etc.
A recommendation system predicts the ratings that a user is likely to give to an unknownitem. To propose a user with a reasonably long list of items that she is estimated to like, arecommendation system postulates the ratings for several candidate items and only the itemswith best ratings are recommended. This postulation can be performed in several ways, forexample using the rating matrix or using the similarities between items’ characteristics, amongseveral others. Before delving into the details of these techniques, we will underline the idea ofa rating matrix. It is a matrix representation of a set that contains the values of ratings that theusers have given to the items of a system. r(u,i ) is a rating value given to item i by user u. Oneexample of rating matrix is given in Figure 2.1.
Figure 2.1 – Rating Matrix for a movie recommender system. The empty cells signify that the corresponding
user has not seen the movie.
Another important aspect associated to recommendation systems is the notion of similarity.Depending on the type of recommendation system, this notion can vary in what it measuresand the concept used behind that measurement. For example, the similarity between users ismeasures differently than the similarity between items. Also, there are several different ways ofmeasuring similarity between users, depending on many factors, one of which is the applica-tion domain. We will discuss about the similarity measures with different types of recommen-dations in the following paragraphs.
2.1.2 Recommendation System Techniques
We will follow the classification of recommendation systems from Figure 1.3 present in Sec-tion 1.
2.1.2.1 Demographic Recommendation Systems
As the name suggests, demographic recommendation systems rely on a user’s demographicinformation to find similarities between them for the purpose of making predictions. Such de-mographic information includes age, gender, location, education, marital status etc. and ismainly used to identify types of users. The underlying assumption of such systems is very sim-ple. The existing users of the systems are first put into different groups based on the similaritiesof their demographic information. Later a new user in the system is directed to one of theseexisting groups depending on the demographic information of this new user. In a nutshell, thedemographic information of users is used to identify the types of users that like a certain item.For example, in a system with people speaking varied languages, one of the groups consist ofSpanish speaking males between the age range of 30−39 years. It is also known from the ex-isting data that all these users like “paella". Now if the system has to recommend a dish to anew spanish speaking male user, the system uses the previous data and suggests paella to this

2-4 CHAPTER 2
new user. This is the simplistic idea behind demographic recommendation systems. Often insystems making use of demographic information of the users, one or more attributes are com-bined to make these groupings. It is difficult to find practical recommendation systems entirelyrelying on the demographic information but they are proved very influential in marketing andadvertising domain [103].
We present a simplistic architecture of demographic recommendation systems in Fig-ure 2.2. In such systems, the user profiles consist of the demographic attributes and it is as-sumed that users with similar values of these demographic attributes will rate the items of theitems similarly. Therefore, clusters of users are formed for providing recommendations to anew user with known demographic attributes. Evidently, this solution of recommendationsimplicitly overcomes the problem of cold-start in recommendation systems.
Figure 2.2 – Simple architecture of a demographic recommendation system
One of the major challenges involved in such a technique is difficulty in obtaining thedemographic information about users. Users often tend to keep this information private overwebsites, internet platforms and applications or not disclose at all. At the same time, usersmight not like to be recommended items based on their gender, language, or ethnicity. Forexample: Geeta is offended as she is recommended the movie “Parched" based on her Indianorigin, the language Hindi and that she is a female.
In conclusion, demographic recommendation systems do not provide for practical rec-ommendations mostly attributed to the lack of access to the information they require. They arepowerful means of predicting user’s interest and are often used in combination with other ma-chine learning techniques like clustering to provide for more targeted recommendations andadvertising.
2.1.2.2 Trust Aware Recommendation Systems
We have seen previously that the growth of internet has lead to the phenomenon of data explo-sion, which in turn, is one of the leading factors for the popularity of recommendation systems.This rapid growth of internet, as we have seen, has given birth to e-businesses, with a vastchoice of products. Not only commercialization but also socialization has been revolutionizedwith the advent and growth of internet. People communicate with each other, they form socialties among themselves using internet, which can be different than the real social links that theyhave outside internet. This is a service generally provided by the so-called social networks :

STATE-OF-THE ART 2-5
linking people on internet. These networks are platforms for people to connect virtually, shareand pursue each others’ activities and in many cases share knowledge. Some famous examplesof such platforms are MySpace, Facebook, Twitter, Google+, Snapchat etc.
Trust aware recommendation systems transform the classic recommendation systems bymaking use of trust that exists between users. Taking analogy from real life, out of all the ac-quaintances of a person, there are some that are trusted by her more than the others. In sit-uations that require suggestions and advice, such a user generally tends to follow her trusted
peers more than the rest. Trust aware recommendation systems are algorithmic transforma-tion of this idea. In addition to the preferences of other users in the system, such recommen-dation systems also take into account the social ties that the user has, which we consider are arepresentative of her trust. Therefore, trust aware recommendation systems generate recom-mendations, which are personalized for each user, using the users’ preferences, opinions andtrust relationships.
In the scope of this thesis, we only focus on the social networks that can be seen as trustaware recommendation systems. In the simplest setting, a social network provides for directed(e.g., followers) or undirected (e.g., friends) relationships between users of the system. Theserelationships can represent numerous aspects of the link between two people, depending onthe social network in question. For example, Linkedin is a representative of professional ties be-tween individuals whereas Facebook is more a representative of real social connections. Trustis one of the foundations of online social networks and is a widely studied subject [6, 63, 106].“Friends" on Facebook trust each other to share information like personal photos, commentsand statuses. “Followers" on Twitter trust their followees’ opinions, news items and other suchinformation. Similarly “Connection" on Linkedin is a representation of trust between two pro-fessionals for sharing their professional insights and activities.From the above discussion, we can claim that the users of the trust aware recommendation sys-tems are aware of the reasons of particular recommendations made to them. They will knowthe reason for being chosen for a particular recommendation, mostly from their trust relation-ships, and they will be more confident about such recommendations, as claimed by Prasand etal. [122].
Figure 2.3 – Advantages of Trust aware recommendation systems
2-6 CHAPTER 2
2.1.2.3 Content Based Recommendation Systems
From conceptualizing the idea of word-of-mouth into collaborative filtering, to extending itfurther, internet has been a major driving force behind the advent of all recommendation sys-tems. For most of the recommendation systems, the users interact with the system and arerecommended items that they are probable to like. The items can belong to a diverse range, de-pending on the application or system in question. For example, news items that a user wouldlike, travel destinations that might attract a user, recipes that a user would want to either cookor eat, people that the user would want to be friends with, movies that she will prefer to watch,songs to listen, clothes to buy and so on. The list of applications and services over internet hasincreased manifold, almost exponentially over the past few years. As a consequence, the num-ber of choices that a user has, or the items in our terminology, has gone beyond the track of auser. When a user is browsing for a movie to watch, it is not possible for the service providerto show all the available movie choices to the user, and is forced to crop the options. One way,among many others, of cropping the choices for each user is by keeping an account of the pat-tern of items that the user visits. This is the foundation of content based recommendationsystems.
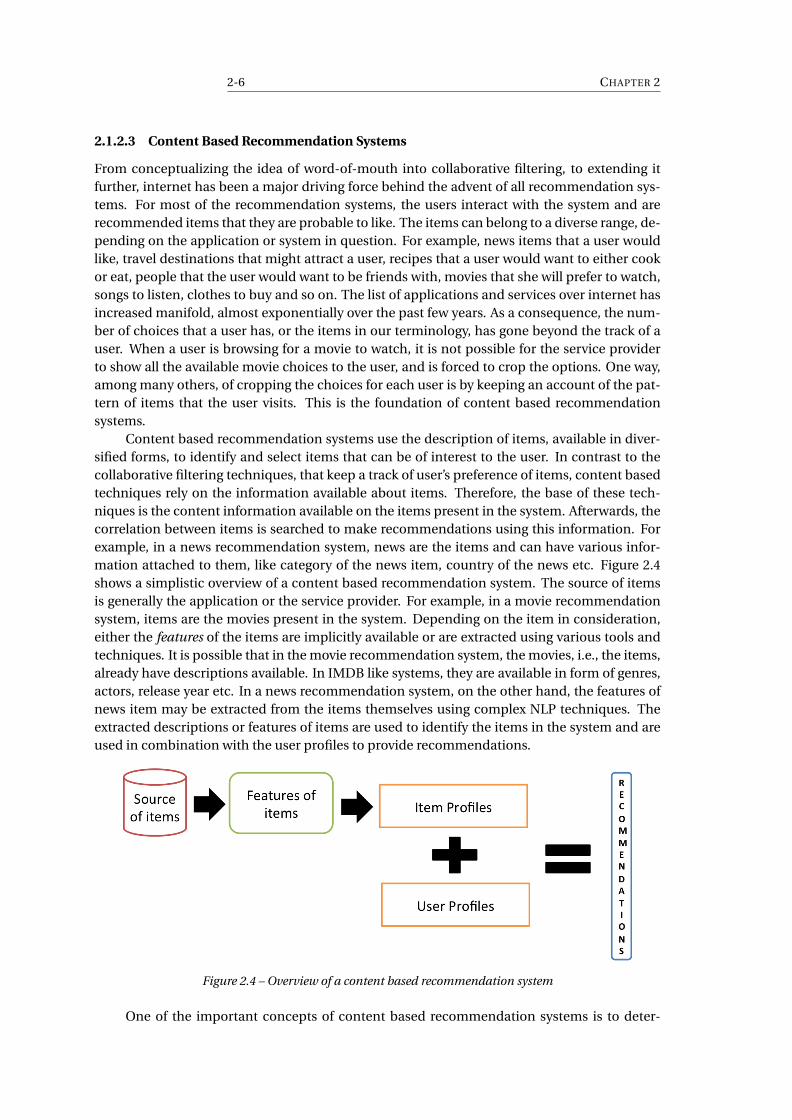
Content based recommendation systems use the description of items, available in diver-sified forms, to identify and select items that can be of interest to the user. In contrast to thecollaborative filtering techniques, that keep a track of user’s preference of items, content basedtechniques rely on the information available about items. Therefore, the base of these tech-niques is the content information available on the items present in the system. Afterwards, thecorrelation between items is searched to make recommendations using this information. Forexample, in a news recommendation system, news are the items and can have various infor-mation attached to them, like category of the news item, country of the news etc. Figure 2.4shows a simplistic overview of a content based recommendation system. The source of itemsis generally the application or the service provider. For example, in a movie recommendationsystem, items are the movies present in the system. Depending on the item in consideration,either the features of the items are implicitly available or are extracted using various tools andtechniques. It is possible that in the movie recommendation system, the movies, i.e., the items,already have descriptions available. In IMDB like systems, they are available in form of genres,actors, release year etc. In a news recommendation system, on the other hand, the features ofnews item may be extracted from the items themselves using complex NLP techniques. Theextracted descriptions or features of items are used to identify the items in the system and areused in combination with the user profiles to provide recommendations.
Figure 2.4 – Overview of a content based recommendation system
One of the important concepts of content based recommendation systems is to deter-

STATE-OF-THE ART 2-7
mine the importance of items for the users in the system. Term-Frequency Inverse Document
Frequency is a very popular concept for the same. As the name suggests, TF-IDF is used to de-termine the relative importance of items based on the frequency count. This is the concept thatoriginated in information retrieval systems and is easily applied and exported to content basedrecommendations systems. In this context of content based systems, for calculating TF-IDF, adocument refers to an item in the system and word refers to the features used to describe theitems. For example, in a movie recommendation system, movies become the documents, likeGod father, Rocky, Fight Club and Pulp Fiction. The words are the features that describe themovies, like comedy, drama, Jennifer Lawrence, Brad Pitt etc.
Term Frequency (TF) : is the number of occurrences of a word in a document.
Inverse Document Frequency (IDF) : is the inverse of the number of occurrences of docu-
ments among the whole document collection.
Therefore, the frequencies of item features and the corresponding tf-idf values are used to con-struct the user and item profiles here which are then used to make recommendations. We willnot delve into the details of TF-IDF here as it can be a topic of research in itself. We concludethat information extraction is a very important paradigm in content based recommendationsystems. The fineness of information extraction determines the quality of recommendations.As we can see that these system do not require a user’s past experiences with other items, it iseasy to recommend items to new users in the system, unlike their collaborative filtering coun-terparts. It is equally useful to recommend new items to the users in the system as the newitems do not have ratings associated to them. Using their features, the content based recom-mendation systems render them more visible to the users who are expected to like them.
2.1.2.4 Collaborative Filtering Recommendation Systems
Collaborative filtering is the most studied techniques of recommendation that has advancedand expanded over the years. In its origin in the mid 1990s, it was the algorithmic conceptu-alization of the idea of word-of-mouth [78, 126, 133]. It has been widely used in practical rec-ommendation systems, especially the ones in e-businesses, like that for Amazon, NetFlix andGrouplens. It allows to consider the opinions of hundreds and thousands of users on internetthan just the acquaintances, while looking for a product or service. One of the main factors be-hind its popularity is the ease of implementation and its domain-independent nature. As thename suggests, these recommendation systems work in a collaborative manner. In general, theusers of the system collaborate to share their inclination towards the items that they have seenin the system. In all it’s forms, this inclination, as we have seen earlier, is represented in theform of ratings.With the aim of recommending a new item to the user based on her past associations and theassociations of other users like her, collaborative filtering can take various forms. The broadcategorization of collaborative filtering based recommendations is shown in Figure 2.6 [25,30].
Memory based Memory based collaborative filtering techniques are also called neighborhood
based techniques [30]. The main motivation behind this kind of recommendation techniquecomes from the real life usefulness of neighbors for the purpose of making recommendations.As a result, it involves finding neighbors of the target user 2 who share similar interests as her inthe items of the system. This similarity of interests is dependent on the ratings (both implicitand explicit) that the users have given to the items. In conclusion, the ratings of the target userand of the other users in the system are very important in finding her neighbors which are then
2. Target user is the user for which the predictions or recommendations are to be made.

2-8 CHAPTER 2
Figure 2.5 – Recommendations based on what other similar users have liked
Figure 2.6 – Collaborative Filtering techniques can be further classified into Model based and Memory
based techniques.
used for making recommendations. Once the neighbors have been identified, there ratingsand associations can be combined in several different ways for making recommendations tothe target user. Broadly, there are two such ways called User-based and Item-based techniquesas displayed in Figure 2.7.
User-based collaborative filtering technique uses the similarity between the target user and theother users who have rated common items. The similarties between users can be computedusing different similarity metrics available widely in the machine learning literature, cosineand jaccard being some popular ones. Item-based collaborative filtering uses correlation be-tween all the items rated by the target user to find new items that the user will like. Similar tothe user-based techniques, they also rely on similarity metrics to compute the correlations and

STATE-OF-THE ART 2-9
Figure 2.7 – Sub-classification of memory based collaborative filtering techniques.
similarities between items rated by the target user. One of the very popular similarity metric forsuch item-based techniques is Pearson correlation.
As we have seen, both of these techniques require finding neighbors, users in case of user-basedapproach and items in case of item-based approach. Systems using recommendation enginesinvolve millions of users and items and therefore, it is only natural that there are many possi-ble neighbors (that have items in common with the target user) for target user. Therefore in asetting like this, we often rely on k best neighbors of the target user, according to the measureof similarity. This is called finding k-nearest neighbors and is a classical problem of data min-ing, recommendation systems, classification systems or of machine learning and is addressedin this thesis also. Before we discuss the background details of the KNN approach in general inSection 2.3.1, we will mention some of the commonly used similarity measures in details here.We will use the notion of user (and item) profile to elaborate on the similarity measures as wehave seen in Section 2.1.1.
Cosine Similarity : belongs to the family of inner product similarities as classified by Cha etal. [37] and uses the vector-space model. It is a very popular similarity measure in thefield of information retrieval, mostly because of its efficiency in domain independentcalculations. For two users u and v , with user-profiles U Pu and U Pv respectively, theircosine similarity is calculated by the inner product of their profiles:
cosine(u,v) =U Pu .U Pv
�U Pu��U Pv�
Definition 1 (Cosine Similarity)
Jaccard Similarity : is based on the idea of intersection of profiles, and hence is simpler ascompared to its counterparts. As it is based on counting of common items between twousers, it can be easily used as a dissimilarity metric as opposed to cosine that has no suchcapabilities.
jaccard(u,v) =|U Pu ∩ U Pv |
|U Pu ∪ U Pv |
Definition 2 (Jaccard Similarity)
Person Correlation : is the measure of linear relationship between the profiles of two usersand is based on covariance and standard deviation of the profiles.

2-10 CHAPTER 2
pearson(u,v) =covar i ance(U Pu , U Pv )
σU Pu× σU Pv
Definition 3 (Pearson Correlation)
We can claim that both user-based and item-based techniques are popular and useful inthe recommendation system world. As pointed out by Ricci et al. [128], there are five maincriteria before selecting a technique between user-based and item-based collaborative filter-ing; accuracy of predictions, memory and computational efficiency, stability in the number ofusers and items of the systems, justifiability of the end recommendations and the serendipityof results. Therefore, the type of technique is chosen mainly based on these parameters.
Model Based As the name suggests, model based recommendation systems rely on findingpatterns in data [90]. The past data is searched for patterns that can be used for training amodel for finding patterns. Mostly the user-item rating patterns are used to train the model. Tomake recommendations, the model uses the patterns from the training data and apply them onthe real data. It is clear from this description that such model based techniques use machinelearning techniques to learn from data and then use the learned model to make real-time pre-dictions and recommendations. As a result of using machine learning techniques to model apattern which is pre-computed for the recommendations to be made, recommendation sys-tems using model based techniques has very rapid performance. Some of the most popu-lar techniques used to design model based recommendation systems are Singular Value De-composition (SVD), Matrix Based techniques, Clustering based models, Regression techniquesetc [87, 90]. It is out of the scope of this work to cover these techniques in details. Figure 2.9shows a classification of these techniques under three main labels: classification, rule-basedand clustering tecniques. One of the advantage of the model based techniques is dealing withthe sparsity problem. Our contribution KIFF also exploits this feature of the model-based ap-proaches.
2.1.2.5 Hybrid Recommendation Systems
Hybrid recommendation systems are an amalgam of the above mentioned recommendationapproaches. In most of the cases, these systems combine features of collaborative filtering andcontent based techniques, to have the best of both worlds. The idea behind these systems isto overcome the limitations of various systems and to combine their power. As a result, thesesystems are inherently more complicated in their design and implementation but they havebetter prediction results. One of the most famous hybrid recommendation system is Googlenews recommender system [49]. There are several research works that document the use oftwo or more basic recommendation techniques to implement hybrid recommendation sys-tems [7, 31, 33, 50]. The complexity involved in their design and implementation make themless favorable for practical recommendations as compared to their collaborative and contentbased counterparts.
2.2 Privacy
Recommendation systems have been a huge success in the field of commerce and researchalike. As a result of their popularity e-business giants like amazon, netflix, youtube and imdbhave devoted a huge share of their success to recommendation systems. Similarly, researchers

STATE-OF-THE ART 2-11
have spent years in the advancements of tools and techniques of recommendation systems andstill continue to do so. Attributed to their success and usefulness, even online social networkshave recognized and used recommendation systems in their basic operations. The OSNs relyon recommendation systems for many operations. One of the dominant feature of the onlinesocial networks is establishing social ties between its users. This includes both, constructinglinks that are obvious as well as predicting interesting and surprising social ties between users.As a result of this requirement, OSNs like Facebook and Twitter heavily rely on the predictionsfrom a recommendation system. Seeing their success, with over 1 billion active users on Face-book [62], and users surpassing millions of followers on twitter [4], one can claim that recom-mendation systems play their role well in predicting social ties in OSNs.
The role of recommendation systems in OSNs is not limited to predicting social ties. Infact, they play a significant role in spreading information across the network, one of the corepurposes of social networks. As we have seen in Section 2.1.2.2, social networks can be seenas trust aware recommendation systems where users place trust in each other in form of socialrelationships - friends in facebook, followers in twitter, connections in linkedin etc. to havesuggestions from each other. These suggestions can take different forms in different social net-works. For instance, users of twitter follow each other for information recommendation mostlyin form of news items, whereas users of facebook establish friendships for photos, personal up-dates, location check-ins etc. A considerable research work is devoted to the study of trust andinfluence in social networks [43, 51, 68, 69] that is a significant factor in the origin and spreadof information on these OSNs. It is clear from the above discussion that online social networkscan be regarded as trust aware recommendation systems where user relationships are based ontrust, reflected in form of social ties. These social ties are influential in spreading informationover the network.
We consider the example of Digg 3, a voting based social network new dissemination sys-tem. In Digg, the social connection between users is called “friendship". Users follow theirfriends to see the news that the friends post and to see the votes that the friends have submitted.In short, the users follow people that they would like to receive the news from. Same reason-ing applies to other social networks, like Google+, twitter and facebook. Once the user receivesnews from her friends, she spreads the news that she is most interested in to her friends. Thisspread of news received from friends is done by “voting" in Digg, “sharing" in Facebook and“retweeting" in twitter. As a result, the information originating from one source travels to dif-ferent parts of the network because of the existence of social ties, somtimes resulting in largeinformation cascades. In their work, Salganik et al. [131] talk about how some stories becomemuch more popular than the others. A lot of research has been devoted to the study and analy-sis of spread of information in social networks, recognizing the factors responsible for the same.Till this point, we have seen how online social networks are a form of trust aware recommenda-tion systems and their importance in spreading news over the network. Now we will detail howmaintaining users’ privacy in an important challenge in such systems. Though there are manyaspects related to users privacy in social networks and in recommendation systems, we willfocus on preserving users’ privacy while disseminating information such that the informationcascade patterns are also maintained.
2.2.1 Privacy threats in social networks
The concept of social networking is not new, in fact it dates back to the 60s [91] but they haveseen a viral growth only since the advent of internet. Since the success of the first known socialnetwork “SixDegrees.com" in 1997, a lot of social networking sites have emerged with promis-
3. http://digg.com/

2-12 CHAPTER 2
ing features. Online social networks, even though a recent phenomenon, have been used andadopted by a very large number of people. They provide near to an ideal platform for its usersto publicly share their personal information.
In addition to sharing connections between people, they have revolutionized the processof information generation and sharing. As a consequence, they have become an indispensabletool for disseminating information to large sections of people rapidly. The popularity and theseunique features of OSNs do not circumvent the privacy threats that they bring along. In fact,just like their popularity, the privacy threats associated to them have become more prevalentalso, resulting in attracting the attention of both academia and industry.
Online social networks are subject to many privacy and security threats, some of them include:privacy threats [27, 109], identity thefts [23, 79], sybil attacks [34, 142], malwares [19, 149] etc.We give a brief introduction to some of the threats here:
Malwares: The wikipedia definition of a malware is a malicious soft-ware that is used to disrupt computer operations, gainaccess to private computer systems or to sensitive in-formation or display unwanted advertising. Malware at-tacks are the most endemic and classic threats known tocomputer users, more dominating due to the ease of in-ternet access. These attacks are prevailing attacks in on-line social networks also because they benefit from thewell-connected structure of social networks to spreadthe malicious software even more rapidly. The high rateof interaction between the users of OSNs and third party applications only ease theprocess of infection. Koobface is known to be one of the most notorious malwaresuccessfully spread through numerous online social networks include myspace,facebook and twitter [19, 135, 148]. The attack has many variants where some ofthem target the user activity ion the social network. Other similar malwares, albeitnot as prevalent and sophisticated as Koobface, has targeted other social networks.
Identity Theft: is identified as one of the most damaging threatsin social network as the attacker gets access to alot of personal information about the user, includ-ing username, passwords and therefore, the wholeuser-profile on the online social networks. Eitherthe online social networks already have all the infor-mation related to the user or are capable of inferringit using the known information. Hence, these iden-tity thefts can become even more dangerous whencombined with inference attacks. Simple solutionsto identity theft include the use of strong password, but such measures arenot enough to counter identity thefts. Another hidden motive behind iden-tity threats, commonly seen on recent social networks is stalking. Friendsand connections are often a target of the attacker behind these identity thefts.Therefore cautious and prudent use of online social networks is a necessarymeasure not only to secure your own information but that of your connec-tions also.

STATE-OF-THE ART 2-13
Sybil Attacks: is a term used to describe the forging of multiple identities for a malicious pur-pose [57].
Sybil attacks are more profound in peer-to-peer systems and other distributed systemsas their architecture gives way to an easier means of attacking as compared to their cen-tralized counterparts. In terms of an online social network, an attacker claims multipleuser identities to compromise as large part of the network as possible. Online social net-works are based on the foundations of sharing personal information, photos, thoughtsand opinions on subjects and emotions with a selected group of people, generally se-lected based on the trust we place in them. Even if the social ties are partially basedon the trust between users, it is not always the case. In 2012, daily mail reported thathalf of Facebook users accept ’friend requests’ from strangers, while 13m U.S. users have
NEVER opened their privacy settings [138]. Mark Granovetter introduced the term “weakties" in social networks to refer to social connections between users of different com-munities [71]. Weak ties are an indication of lesser interaction and intimacy betweenthe users. Sometimes there is negligible interaction once the connection is established.Such associations and connections with strangers render Sybil attacks easily doable insocial networks. Such attacks can be used for many harmful purposes, as they can eas-ily modify the “voting" outcome, or poll results for example. Rupesh Gunturu [] gives anelaborate survey of the possible Sybil attacks in social networks, both centralized and de-centralized. He also classifies Sybil attacks into various categories depending on how theattacker proceeds with the attack, or the kind of interaction that takes place between theattacker and the victim’s profile, etc.
There are many other ways in which online social networks can pose privacy and securitythreats to its users. There are phishing scams, that can ultimately target to steal identitiesand compromise on very sensitive and personal user information. Other more sophisticatedthreats are of de-anonymization. Many a times users of online social networks chose to usepseudonyms or anonymize themselves for various reasons. In reidentification and de-anonymizationattacks, the attacker reveals the true identity of the user, thereby breaching user’s privacy.
Social networks combined with internet, i.e., online social networks, have become very power-ful means of supporting freedom of speech. In their originality, they tend to break the barriersof censorship and have instead become a revolutionized form of activism. Social networkingand microblogging services have transformed the face of political activities, coverage of infor-mation, spread of ideologies and expression of thoughts [48]. Social media platforms are in-creasingly used to organize and stage protests, manifestations and strikes, reaching a globalparticipation, all due to the ease of connectivity on such platforms. While on one hand, theseOSNs provide protesters and activists a platform to raise their voice, and attract a global audi-ence, on the other hand, they make these activists vulnerable to spying eyes. Countries wherethe government wants to control people’s freedom of speech and expression are specially tar-geting and spying activists on social networking platforms, to curb their activities. It is, there-fore, the need of the hour to provide the users with tools to fight back the spying eyes. Ourprivacy-preserving dissemination algorithm RIPOSTE is an answer to the above problem. With

2-14 CHAPTER 2
RIPOSTE, we aim to enable users to freely contribute to the spread of information. In our knowl-edge, this is one of the first steps taken in preserving users’ privacy on social networks for thespread of information, without anonymizing the user.
The idea of RIPOSTE is based on the famous Randomized Response Technique. It is a com-mon practice for individuals not to disclose their honest opinions and answers in surveys, ques-tionnaires, and interviews. There can be many reasons for such confiding practice, includingfear of rejection, humility, or a mere unwillingness to trust strangers with their honest answers.People with this tendency of either not answering the questions or intentionally answeringthem wrong lead to problems of refusal bias [46,52] and response bias respectively [76]. The an-swers to questions that are either too personal or involve sensitive subjects are often obtainedwith reluctance, specially when they tend to outreach a huge audience. Such is a case of on-line social networks, where the information up-voted or liked by an individual can reach a verylarge audience, revealing user’s opinion about it. Randomized Response Technique is an algo-rithmic solution to incite individuals to reveal information, which they otherwise are resistantto, which they consider unfit to disclose. This technique has its origin mainly for the purpose ofsurveys and interviews, but as shown with RIPOSTE, we extend it to the idea of social networks.The basic idea behind this technique is to allow the individual to respond using a probabilityfor some of the questions. In such a case, even the interviewer will have an estimation of the“original" answer of the individual, based on a probability. We will give more details about thetechnique applied to RIPOSTE in Section 3.3.
2.3 Learning in Recommendation Systems
Roughly speaking, the problem of recommendation is estimating a utility function that auto-
matically predicts how a user will like an item, based on past behavior of users in the system,relation with other users of the system, similarities between different items, context and otherinformation available in the system about the users and/or the items. On a general note, oncethe data (in a cleansed and processed form) has been fed to the recommender system, thelearning process combined with a model or clustering technique helps to make predictions ofthe items in the system. Figure 1.5 in Section 1.1.2 shows a block representation of this idea ofrecommendations. In this section, we will focus on the Data Mining block of recommendationsystems that provides for its learning ability through techniques like classification, clustering
or rule generation as shown in Figure 2.8
Figure 2.8 – Learning block of the recommendation systems using techniques like classification, clustering
or rule based associations.
We have seen previously that the most commonly used form of recommendations, i.e.,

STATE-OF-THE ART 2-15
collaborative filtering is traditionally based on either of the two techniques: User-User collabo-rative filtering or Item-Item collaborative filtering. Both, user-user and item-item collaborativefiltering use the idea of nearest neighbors to select the most relevant candidates (users or itemsdepending on the type of CF technique used) from the pool of all the users or items. This se-lection of candidates is generally performed based on the results of a similarity function. Inthis scenario, the technique of finding the nearest neighbors (users or items) based on the sim-ilarity function is the learning model for the underlying recommendation system. In additionto the user-user and item-item collaborative filtering, there are other collaborative filtering al-gorithms based on learning techniques like probabilistic learning, matrix factorization, clus-tering, rule-based approaches, classification, regression, latent dirichlet allocation etc. Someof these techniques, like classification techniques can be used in content based recommen-dations also. Figure 2.9 gives an overview of the most popular learning techniques used inrecommendation systems along with their categorization.
Figure 2.9 – A broad categorization of Learning techniques in recommendation systems
Each of these techniques have their own pros and cons. Their use in recommendationsystems also depends on the target application. For example, TV program recommendationsuse association rule mining [40] where as movie recommendation systems are implementedmostly using KNN classification techniques [77, 125, 152].Widely studied and analyzed, KNN is one of the most popular technique of recommendations.It can be used in recommendation systems for varied applications like book and document rec-ommendations, image classification and recommendation systems, movie and music recom-mendations, e-commerce based recommendations etc. This simple technique of classificationis easy to implement and is easily customizable with various parameters to tune, depending onthe current need. Therefore, in the scope of this thesis, we focus on the learning in recommen-dation systems using K-Nearest Neighbor classification technique.
2.3.1 K-Nearest Neighbor
To explain the technical details of the K-Nearest Neighbor Algorithm, we will start with a smallexample. Alice wants to watch a movie, and she needs help to select one that she would like.

2-16 CHAPTER 2
She decides to take help from her acquaintances who have interest in watching movies. Let’ssay that there are 100 people that Alice knows and are interested in movies, and have watchedsimilar movies as Alice in the past. It is practically cumbersome to ask each of these people fortheir suggestions and then chose a movie, considering multiple suggestions from each of them.A more practical solution would be filter and shortlist, lets say, 10 people from 100, who are themost “similar" to Alice. Now with this new set of 10 most similar people to her, Alice can easilyselect a movie to watch. This example represents a basic example involving KNN computation.For the above scenario to work, here are some necessary components:
- movies
- people who have watched and shown interest in movies.
- similarity measure between Alice and other users
Collaborative Filtering based recommendation systems using neighborhood based tech-niques, such as KNN can be seen as the algorithmic translation of the principle of word-of-
mouth. In this section, we will discuss the technical details of KNN algorithm. The detailspresented here use user-user collaborative filtering but can be easily extended to item-itemcollaborative filtering (by merely replacing users by items). Drawing this parallelance to collab-orative filtering systems, using a KNN algorithm requires:
- Items
- Users
- Opinion of users in form of Ratings 4
- Measure of similarity
Therefore, for a user u, the neighbors are the users v from the system who have similartastes for the items seen by both u and v . The problem of K-Nearest Neighbors is finding k
most similar neighbors for a given user. The problem of KNN can take different forms example,KNN search or KNN graph construction. While KNN search aims to find the k nearest neigh-bors of only a small number of users in the system, KNN graph construction does it for all theusers in the system. Formally, a k-nearest neighbor (kNN) graph of a system is a directed graphwhere each node is connected to its k most similar neighbors where similarity is measured by apredefined metric. For example, the KNN representation of IMDB is a directed graph where allthe users of IMDB are connected to their most similar counterparts. In this case the similarityis a result of like and dislike for the movies in the system that is explicitly stated by the users inform of ratings from 1 to 5. Albeit the simple idea, KNN graph construction is a computation-ally expensive algorithm. To find the most similar neighbors of user u, a trivial KNN algorithmrequires to compute its similarity with all the other users in the system and then rank thembased on the similarity measure. This is a brute-force approach in the literature of KNN andis evidently a computationally expensive task as it requires n comparisons for each user of thesystem where n is the number of users. Such an algorithm has a complexity of O(n2). Whenthe size of users and items in the system increases, which is generally the case for the applica-tions requiring recommendations like e-businesses, image classification etc, it becomes verydifficult for a KNN to scale due to this complexity [111, 153].
The beginning of research in KNN graph construction mostly saw exact KNN graph con-struction algorithms [20,45,139]. This, in literature, was referred to as all nearest neighbor prob-lem, where k = 1, i.e., only one nearest neighbor of each node in the system is computed. There
4. For the remainder of this section, we will consider the opinions in the form of ratings ranging from 1− 5,explicitly provided by the users for the items in the system, unless stated otherwise.

STATE-OF-THE ART 2-17
were many lines of attacks proposed for this problem of ANN. Bentley et al. [20] used a mul-tidimensional divide and conquer method while Clarkson et al. proposed a randomized algo-rithm [45]. Though these algorithms claimed that they are easily extensible for k > 1 yet theywere proved to be inefficient for large scale datasets [117].
The construction of a KNN graph is related to Nearest Neighbor (NN) search [110,150,151]. NNsearch addresses, however, a different problem: it seeks to find the k nearest neighbors of asmall number of individual elements (the queries), rather than constructing a complete KNNgraph as KIFF does. NN Search typically relies on complex pre-computed indexes, and aimsto minimize both the size of these indexes, and the computation time of individual queries.NN Search has been extensively researched, in particular to address what is known as the curse
of dimensionality, i.e., the observation that traditional space-partitioning indexes become toolarge in large dimensions, a situation commonly encountered in multimedia databases [82,115]. Solutions to this problem rely on advanced hashing techniques such as Locality-Sensitive
Hashing (LSH) [100, 115] or on compact metric approximations such as product quantiza-
tion [82]. These approaches are, however, optimized for very dense data sets: all images of amedia database are usually associated with non-zero values along all dimensions. On the con-trary, the systems in the current era are sparse, where a user has a lot of unseen and unrateditems in the system. Therefore, considering the sparsity of datasets is another challenge in find-ing a scalable and efficient k-nearest neighbor algorithm.
Also related to but different from the problem addressed in this paper, clustering [26] seeksto partition a dataset in k clusters while minimizing the graph cut between successive clus-ters. The bipartite graph underlying node-item datasets (e.g., containing users and items, ordocuments and words) has been exploited in this context to cluster such datasets simultane-ously along their node and item dimensions, a technique known as co-clustering [53]. Theseworks clearly underline the advantages of using bipartite graphs in problems involving usersand items, which we use as motivation for our contribution in Chapter 4.
The idea of combining a coarse (in our case the number of overlapping items) and a finermetric (in our experiments cosine similarity) as KIFF does, has been proposed in the contextof hybrid recommender systems [32] as a generic pattern to combine two similarity metrics.The approach is, however, different from ours in that the finer metrics are only used to resolveties created by the coarse metric. In particular, it is not supposed to overturn a coarse ranking,which has higher priority. Further, and as far as we know, the approach has not been applied toKNN graph construction.
Because the construction of a KNN graph generally implies the computation of a largenumber of similarity measures, several works have proposed to use space decomposition tech-niques (similar a divide and conquer strategy) to reduce the complexity of the graph construc-tion [39, 47, 113, 116]. This techniques are unfortunately limited to particular metric spaces,typically based on an Euclidean distance, and do not generalize to other similarity measures.
Originally designed for overlay construction in fully decentralized systems, a number ofgreedy approaches have been proposed to compute KNN graphs [28, 83, 143]. These methodsleverage the transitivity of most similarity functions (if A is close to B , and B to C , A is usuallyclose to C as well) to iteratively refine and converge to a good KNN approximation, or evenproduce the true KNN. NN-Descent [56] extends this strategy with several optimizations de-signed to fully exploit multi-core machines. NN-Descent has shown to deliver a better recallin a shorter computational time than a space partitioning technique using Recursive LanczosBisection (RLB) [39], or than an approach using Locality Sensitive Hashing (LSH) [100]. NN-Descent in particular performs well on very dense datasets such as image databases. As ourevaluation shows, however, it is outperformed by KIFF sparse datasets, and its performancestrongly depends on the value of k. Finally, HyRec [29] also exploits a similar greedy-based

2-18 CHAPTER 2
approach to propose a generic recommendation framework based on user-based KNN graph.Recently, L2Knng [15] also adopts a two-phase approach and uses pruning to improve its KNNcomputation. L2Knng differs however markedly from KIFF in different dimensions. Firstly,L2Knng’s approach is specific to the cosine similarity while KIFF can be applied to any simi-larity metric. Secondly, L2Knng exploits neighbors-of-neighbors relationships (as NN-Descentor HyRec) for its convergence phase while KIFF only exploits pre-computed candidate lists.Finally, the design and implementation choice of the candidate set of L2Knng renders it un-suitable for parallel execution. Particularly because its pruning mechanism of order n requiresresults from the remaining n−1 objects. By contrast, KIFF allows for a parallel implementationand execution, leading to full utilization of computing resources.
2.4 Data
Data is one of the prime and foremost requirement of any recommendation system, regardlessof the technique it uses. Depending on their type, recommendation systems use different kindof data, for example, user-system interaction data, user demographic data, item descriptiondata, or data in form of users’ opinion and views. We have seen earlier how the growth of in-ternet and internet based applications has lead to the phenomenon of information-explosion.Data is constantly produced by the services and applications, while their tendency to consumeit is much slower. However, information-explosion doesn’t guarantee enough useful data forthe purpose of making recommendations. The distribution of usable data is not uniform andas a result, many services still suffer, either with the problem of data insufficiency, or with theusability of data.
Online social networks are a rich source of user information. Most of these networks pro-vide user demographic data (age, location, gender) as a part of users’ public profile, while oth-ers give a free access to users’ social connections, and her opinions. OSNs generally provide theusers with ways to tune the privacy, and chose the attributes that are publicly visible but accord-ing to the Consumer Report Survey 5, around 14M U.S. users are not even aware of such privacycontrol settings. It also reports that in U.S. alone, around 28% people share their connections,and photos publicly. Users show similar behaviors across other social networks. Dependingon the targeted application domain of the social network, users reveal different information ondifferent networks.This information, obtained from the public profiles of users from various sources, can indeedreduce the information gap for the recommendation based services that do not have accessto enough user data for making recommendations. In the next section we give an overview ofthe literature work focusing on using social networks for inferring unknown user information.This inferred information about users (and the one directly available from various OSNs) canbe used to feed and train recommendation system models, specially the ones that rely on userinformation. The user information, can also be combined with other available information likeitem attributes and meta data, to design hybrid recommendation systems, as discussed abovein this chapter.
5. http://www.consumerreports.org/cro/magazine/2012/06/facebook-your-privacy/index.htm

STATE-OF-THE ART 2-19
2.4.1 Power of Data
Online social networks have gained unprecedented popularity in all domains. Initially createdto reflect only the real social ties, they have now evolved to indulge in diverse purposes, likesharing photos, disseminating news, microblogging etc.; giving the users more reasons to joinmore than one social network. Every OSN requires its users to have a profile, which consistsof some mandatory and other optional attributes, like age, gender, location, marital status,schools, music etc. The information in user’s profile can vary depending on the OSN in consid-eration. The availability of data from online social networks has been already considered usefulfor personalization mechanisms and recommendation systems.
Accrediting to the usefulness of user based information in personalization services andrecommendation systems, a lot of investigation has been done to extract maximum user in-formation from the OSNs. While information retrieval based studies explains how the user-profiles can be crawled and scraped, there are other studies that talk about extracting the un-known information from a user’s profile. This is a mechanism widely studied in the domain ofonline social networks and is called inference. Inference in OSNs can be used for wide rangeof purposes like inferring network structure, trust relations or user attributes. In the scope ofthis work, we only focus on user attribute inference in OSNs. It has claimed to offer promisingresults for various applications such as, constructing missing user’s profile [8], investigating in-formation theft and user privacy [42, 129], and guiding interest based recommendations [137].Our work is an empirical study deriving its motivation from the work of Chen et al. [42]. As it isan investigation into the inference power of user attributes, specially focusing on the informa-tion derived from tweets, we do not aim to devise new inference algorithms. Instead, we relyon the previous works, specially from Chen et al. to use the Naive Bayes inference mechanismin our work. There are many other algorithms that can be used, and have shown to providesimilar performances in the past studies. Below we will describe some of the most popularlyused inference algorithms:
Naïve Bayes: classification is a form of supervised learning and is based on the famous bayesian
theorem. Though naïve bayes is one of the simplest classification techniques, yet it isknown to give a consistently good performance. This classification technique is suitablefor both categorical and continuous data, and considers the variables (or features) inde-pendent of each other. In our case of user-attribute inference, we would like to treat eachattribute independent of each other, even if there are strong correlations between them.The main reason behind treating the variables independently because the attributes ex-tracted from OSNs depend on the method of information retrieval used. In technicalterms, given a set of features (or attributes), X = {x1, x2, · · · , xn}, the goal is to predict theprobability of an event E from a possible set of outcomes labeled as {e1,e2, · · · ,en}.
It is often observed that the variables used in Naïve bayes classifier are not always in-dependent but this assumption simplfies the classification task dramatically. It allowsthe class conditional probabilities : p (xi |E) to be calculated individually for each vari-able, thereby decomposing a multi-dimensional task into several one-dimensional ones.Furthermore, the assumption does not seem to greatly affect the posterior probabilities,thus, leaving the classification task unaffected. Naïve bayes is particularly efficient andfast as compared to its counterparts when the number of feature values is high, whichcan be the case of values extracted from social media.
Logistic Regression: is a classification task that assumes a function in the form of f : X →
C . Here C has discrete values where as X can have discrete or continuous values or a

2-20 CHAPTER 2
combination of both. It is a linear classifier in the sense that predictors can be written as:
Ci =1
1+e−µ
and µ is a linear function of X .
In its original form, logistic regression is a binary classifier but there are many variantsavailable in the literature to deal with multi-valued attributes.
Support Vector Machines: are more complex in design and implementation than their coun-terparts. Also performance of support vector machine classifiers is dependent on thefine tuning of its parameters, which adds to the complexity of their design. Support vec-tor machines focus only on the points that are the most difficult to tell apart, whereasother classifiers pay attention to all of the points. One of the major advantages of usingSVM classifiers is that they do not suffer from the curse of dimensionality.
As we can see in the Figure2.10 below, there is more than one way of classifying the datapoints. In SVM, the focus is to maximize the margin around the separating hyperplane.Therefore as opposed to naïve bayes and logistic regression approaches, the goal of SVMis to use the ‘hardest" to classify data points instead of using all of them. Therefore thechoice of training dataset is very important to train a SVM classifier well.
Figure 2.10 – More than one possible hyperplanes when separating classes in SVM
Due to the simple goal of our empirical study, we do not delve into the details of attribute pro-cessing. Instead, we focus on gathering maximum user information from three social networksand process the attribute values to have consistency and maintain a reasonable level of granu-larity. Our work highlights the importance of tweets (and other similar attributes like facebookstatuses, messages etc.) in inferring user’s interests in topics like movies, books and music. Ourwork reveals how information from one source can be used to infer the interests on a com-pletely different source. For example, the study shows the importance of tweet related infor-mation to infer the skills that a user posses (mostly professional), available only on linkedin.


3Privacy of Users in Recommendation Systems
applied to Online Social Networks
The need is pressing andimperative if we are going to haveany shot at privacy
Ari Schwartz
In this chapter we will elaborate our contribution towards preserving privacy of a user whiledisseminating information in online social networks. In lines with our objective of providingusers with a privacy mechanism that enables them to spread information in an OSN freely, wepropose RIPOSTE. It is a distributed algorithm for disseminating information in form of ideas,news, trust, opinion or trends, in a social network. In addition to safeguarding users’ privacy,RIPOSTE also ensures that the spread of information in a network follows some intuitive andwell established norms. Without going into the technicalities and preciseness of its dissemina-tion, it guarantees that information spreads widely in the network if and only if a large fractionof users find it interesting while if the information item is liked by a smaller fraction of usersthen the dissemination process dies quickly.
To support the ideas and intuitions presented as RIPOSTE, we perform an extensive setof experiments and evaluation using topologies and snapshots of real online social networks,including Twitter, Facebook and Google+.
To present and understand RIPOSTE, we will start by presenting an introduction to the ideaand need of such an algorithm in Section 3.1. This is followed by Section 3.2 that presents thetechnical idea of the contribution made, with its overall view. Later in Section 3.4, we developthe RIPOSTE algorithm with all the details and parameters involved. We present our experi-ments and evaluation of RIPOSTE in Section 3.5, by finally concluding the work in Section 3.6.
3.1 Introduction
From the discussion in Section 1.1.3 it is comprehensible that recommendations can takevarious forms in an Online Social Network setting. Among others forms discussed before, fol-lowing other users of the network to have access to information items that they spread/like
3-2 USER PRIVACY
or are interested in, is one of the forms of recommendations in online social networks. Thisform of recommendation has become the heart of OSNs as it is one of the major forces behindspreading the information in the network.
Online Social Networking web sites have become an important medium for communicat-ing and disseminating news, ideas, opinions, treads and behaviors. These online social net-works have revolutionized the world of internet and that of the data industry by generatingmassive amounts of data. In addition to the generation of data, such online networks typicallyprovide a reposting functionality also, e.g., sharing in Facebook or retweeting in Twitter, whichallows users to share others’ posts and information items with their own friends and followers.In essence, they serve as a bridge between the generation of vast amount of information andits spread from one user to another. As information is reposted from user to user, large cas-cades of reposts can develop, and an information item can potentially reach a large numberof people, much larger than the number of users exposed to the information initially (e.g., theusers who witness a news event, or learned about it from some local media). Since people tendto propagate information which they find interesting and worth sharing (rather than randomcontent) [102], an information item may spread widely only if sufficiently many users find itinteresting. Thus, the natural diffusion process facilitated by the reposting mechanism servesboth as a filtering and dissemination mechanism. Ideally, the opposite direction should alsohold: content that a sufficiently large fraction of users would find interesting and would prop-agate (if they knew about it), should be likely to spread widely. This is, however, not always thecase.
In countries with authoritarian regimes, users may not propagate anti-government ideasfor the fear of being prosecuted. Almost all of the popular social networks have faced the heat ofthis issue in the past years. There are in fact several examples of political activists (and others)that have been convicted for posting or just reposting anti-government opinions on social me-dia [112, 136]. But even in democratic regimes, users may refrain from openly supporting theiropinion on certain sensitive issues, from politics and religion to sexuality and criminal activity.For example, a user may not propagate a post supporting recreational drug use for the fear thatit may have a negative impact on his career—as it is a common practice of employers to usesocial media for screening prospective employees [72]. Or more generally, users may refrainfrom reposting a (political or other) opinion when they believe it is not widely shared by theircycle—a well known principle in sociology known as the “spiral of silence" [114]. In all thesecases, the dissemination of an idea in the social network is impeded by privacy considerations;even if many users support the idea, they may choose not to contribute to its propagation be-cause they do not wish to reveal their own opinion (as reposting the idea would suggest the useris in favor of it).
Social media is powerful. Social media is information.Let’s choose wisely what messages we spread.
3.2 Contribution: Privacy-Conscious Diffusion
Inspired by the theory of branching processes [16], we investigate a dissemination algo-rithm that has, roughly speaking, the following properties: (1) information that a sufficientlylarge fraction of the population finds interesting is likely to spread widely; (2) information thatnot sufficiently many people find interesting does not spread far beyond the set of users ex-

CHAPTER 3 3-3
posed to it initially; and (3) by observing the spreading process (in particular, the users’ re-posts), one cannot determine (with sufficient confidence) the opinion of any single user on theinformation that is disseminated. We assume that the diffusion mechanism does not know theopinion of users that have not received the information yet,
More specifically, we propose the following simple, local dissemination algorithm, whichwe call RIPOSTE. We show a high level view of RIPOSTE in Figure 3.1. We assume that a usercomes across an information item on an online social network. She interacts with this OSNusing her local machine through a browser over internet, as shown in the figure. We assumethat for each information item, the user can either like it or dislike it. This like or dislike of theuser for an item is the factor that decides weather the user wants to repost the information inthe network to spread it further or not. In order to conceal her true opinion (of like or dislike),instead of directly acting on the OSN, she reveals her opinion to RIPOSTE, which is running onthe user’s system, which in turn adds some randomness to it before sending it to the OSN. Inprinciple, this randomness makes it practically impossible for an adversary to guess the user’sactual true opinion on the information item, thus avoiding any privacy breaches involved inthe dissemination.
Figure 3.1 – Major components of RIPOSTE: the local machine with the randomized algorithm and the
online social network. In RIPOSTE, the user’s opinion is locally randomized and only the output of RI-POSTE is exposed to the OSN. The ¬RIPOSTE arrow is represented for illustration purposes and is not an
explicit action of RIPOSTE.
Now that we know the overall idea behind the functioning and design of RIPOSTE, we willdelve into a more technical discussion. Let G denote the (directed) graph modeling the socialnetwork, and n be the total number of users, and suppose that some (small) initial set of userslearn an information item t . For each user u that learns t , RIPOSTE decides to either repost t ,to all u’s outgoing neighbors in G , or to not repost t , to anyone. The decision is randomizedand depends on the user’s (private) opinion on the information, and the number of the user’sneighbors that have not received the information yet.
Precisely, if u likes t , then t is reposted with probability λ/su , and if u does not like t , thent is reposted with a (smaller) probability δ/su , where 0 < δ< 1 < λ are global parameters of thedissemination mechanism, and su is an upper bound on the number of u’s outgoing neighborsthat have not received t yet. If the algorithm cannot have access to information about whetheru’s neighbors already know the information, then the total number of u’s outgoing neighborscan be used as the upper bound su .We consider also a variant of this protocol, where in place ofdeg(u) we use instead the number of u’s neighbors that have not already received the informa-tion (through some other neighbor). Intuitively, this variant results in larger dissemination. 1
1. RIPOSTE can be viewed as a set of distributed pieces of software running at each user’s machine connected

3-4 USER PRIVACY
We argue that RIPOSTE achieves the property of plausible deniability: A user u can claimthat, with reasonable probability, the act of reposting (or not) some information, does not re-flect u’s truthful opinion on the information, and is a result of the randomness in the decisionmechanism. Intuitively, the closer the parameters λ and δ are to each other, the better theprivacy. In the extreme case of λ= δ, we have perfect privacy, but then the dissemination is in-dependent of u’s opinion (and thus of how interesting the information is). In the other extreme,if λ is the maximum degree and δ= 0 (i.e., the user reposts the information iff it likes it), the actof reposting (or not) the information reveals with certainty u’s opinion. We formally quantifythe privacy properties of RIPOSTE in terms of �-differential privacy. In particular, we argue thatRIPOSTE is ln(λ/δ)-differentially private.
For the dissemination of information, we prove the following threshold behavior. Supposethat each user likes a given item t with probability pt , independently of the other users (pt is thesame for all users and depends only on t ). Thus pt is a measure of how interesting item t is, andis equal to the expected fraction of users that like t . Let S denote the set of users who receiveitem t initially (e.g., these users receive the information from a news channel). We show that ifpt < p∗, for p∗ = (1−δ)/(λ−δ), then the expected number of users that learn the informationis O(|S|), i.e., at most a constant factor larger than the users exposed to the information initially.This is true for any graph G . On the other hand, we show that the following statement holds fora G from a family of random directed graphs with arbitrary out-degree distribution [41]. (Sucha graph could, for example, model the Twitter network). If pt > p∗, then for a random initialset S, information t spreads to Θ(n) users (i.e., at least some constant fraction of the network),with probability 1− eΩ(|S|/d), where d denotes the average degree of G . In particular, this resultsays that information spreads to Θ(n) users with constant probability when |S| is close to theaverage degree, and with high probability if |S| is logn times larger than the average degree. Theanalysis draws from the theory of branching processes [16], and the intuition is simple: Basiccomputations yield that the expected number of users that a given user passes the informationto, is less than 1 when pt < p∗, and greater than 1 if pt > p∗. The threshold phenomenon weobserve follows then from a similar phenomenon in branching processes. We note that theresult for pt > p∗ does not hold for arbitrary graphs. However, we expect that it should hold formany graph families, of sufficiently high expansion.
We complement our analysis with extensive experimental results. We use a completesnapshot of the Twitter graph of roughly 40 million users from 2009, and smaller samples fromother social networks, including Facebook and LiveJournal. The experiments demonstrateclearly the predicted threshold phenomenon, with very limited spread below the p∗ thresh-old, and substantial spread above p∗. The latter suggests that our result for pt > p∗ shouldqualitatively hold for a larger family of networks than the stylized model analyzed formally.We also experiment with non-uniform distributions of user opinions, where users closer to thesource users are more likely to like the information, obtaining qualitatively similar results. Ex-periments suggest that reasonable values for RIPOSTE’s parameters in the networks consideredare δ = 0.75 and λ = 3. For these values, the plausible deniability achieved ensures that, forexample, if the prior probability for a user to like the information is 0.01 or 0.1, and the user re-posts the information, then the probability increases to 0.04 and 0.3 respectively (see Sect. 3.4for details).
We view the results of this paper as potentially useful for addressing some of the increas-ing concerns about users’ privacy in social networking services. In particular, we think that RI-POSTE could be of interest as a tool for spreading information and petitions in Internet-based
to the social network. It is not the user who has the control of whether the item will be eventually reposted or notbut this piece of software. It solicits the user’s opinion on the item, and then flips a coin to determine whether theinformation will be reposted.

CHAPTER 3 3-5
activism, a topic of considerable current interest [60, 66]. More generally, it is a tool that couldbe used for widespread dissemination of sensitive information, which people would care to beexposed to, but are not willing to disseminate themselves for the fear of being charged, stigma-tized, or isolated. We believe that such a tool could be incorporated in existing social networkservices. Also our technique could find applications to other distributed problems, such asdistributed polling algorithms.
3.3 Related Works
RIPOSTE as we have seen earlier, derives its motivation from a technique that is conceptuallysimilar to the randomized response technique (RRT). Roughly, the idea is to tell responder to lie
with some fixed, predetermined, probability plie (e.g., roll a die and lie whenever the die showsone or two, in which case plie = 1/3). 2 Since plie is known to the interviewer, the distribution ofresponders’ truthful answer can be easily estimated, and thus, accurate estimations of aggre-gate results can be extracted—but an individual’s answer is always plausibly deniable. (See [38]for other variations of RRT, and [12] for a variant using cryptography to guarantee that the re-sponder follows the RRT.) In our diffusion mechanism, the same probability of reposting couldbe achieved using the following RRT-like approach: User u is asked if she likes the post, butis instructed to lie with probability plie = δ/(δ+λ); and if the answer is ‘yes’ then the post isreposted with probability (δ+λ)/su .
We are not aware of other works that use randomized responses in a way similar to ours:to achieve dissemination that reflects user’s aggregate opinion, while preserving the privacy ofindividual users’ opinion. In a more standard use of RRT, Quercia et al. [124] proposed a methodto aggregate location data of mobile phone users by having each user report several erroneouslocations in addition to the correct one. Recently, Erlingsson et al. [61] presented an RRT-basedalgorithm for crowdsourcing of population statistics from end-user client software, deployedon Google’s Chrome Web browser.
Another mechanism provided by social networking services, besides reposting, which hasthe potential to make interesting posts widely visible is that of liking. This mechanism hassimilar privacy issues as reposting. In [9], Alves et al. proposed a scheme to anonymize user’slikes, which keeps the actual like count of a post without revealing the names of the users wholike it. Unlike our approach, the scheme employs cryptographic techniques to achieve privacy,and requires a centralized server (but the server does not know the users’ opinion).
We have said that our diffusion scheme could provide a tool for Internet-based activism [60,66]. The use of pseudonyms, combined with methods for hiding the user’s IP, has also been acommon practice used by activists to hide their identity while spreading sensitive informa-tion [147]. Our scheme protects the users who contribute to the dissemination of information,but not the sources of the information. This is not a problem in some settings, for example, ifwe assume that anti-government information originates from a news channel (say, WikiLeaks)located in a different country. If this is not the case, then pseudonyms could be used to protectthe privacy of the source.
We measure the privacy properties of our diffusion scheme in terms of differential pri-
vacy [58, 59]. Differential privacy was introduced in the context of privacy-preserving analysisof statistical databases. Roughly speaking, differential privacy ensures that (almost, and quan-tifiably) no risk is incurred by joining a statistical database. More relevant to our setting is thelocal model of differential privacy [85], also known as fully distributed model. In this model,there is no central database administrator of private data; each individual maintains their own
2. The closer is plie to 1/2 the better the privacy.
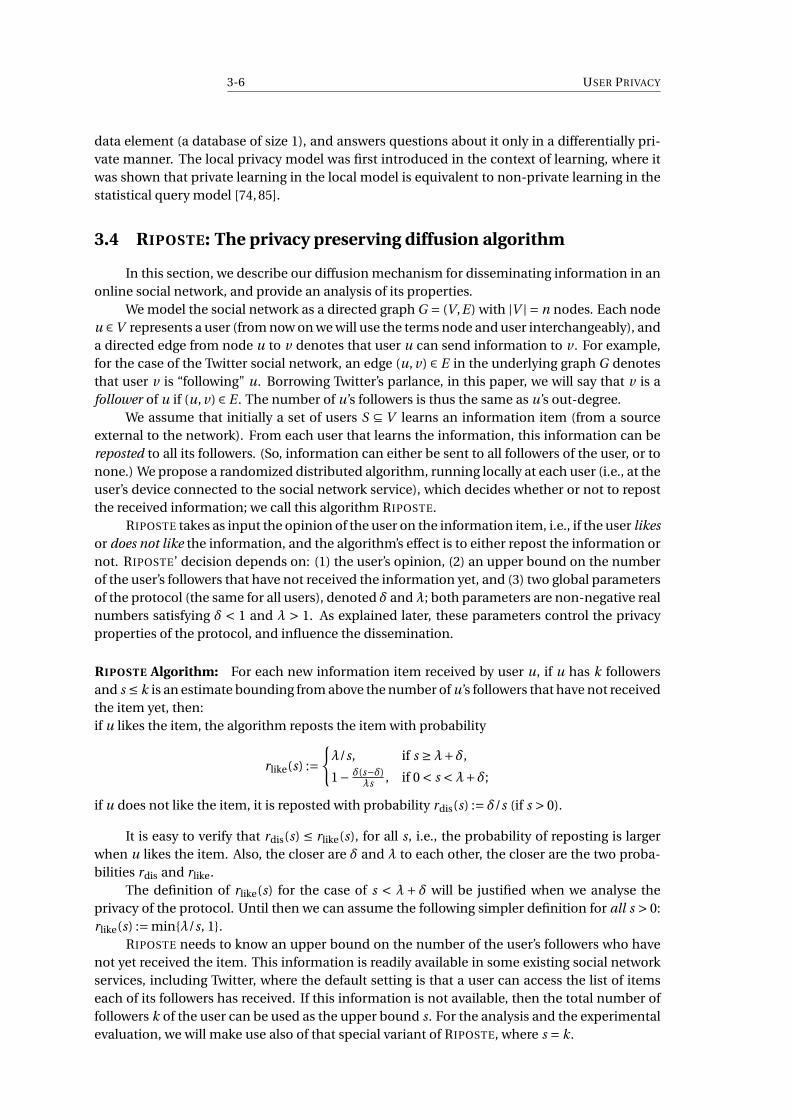
3-6 USER PRIVACY
data element (a database of size 1), and answers questions about it only in a differentially pri-vate manner. The local privacy model was first introduced in the context of learning, where itwas shown that private learning in the local model is equivalent to non-private learning in thestatistical query model [74, 85].
3.4 RIPOSTE: The privacy preserving diffusion algorithm
In this section, we describe our diffusion mechanism for disseminating information in anonline social network, and provide an analysis of its properties.
We model the social network as a directed graph G = (V ,E) with |V | = n nodes. Each nodeu ∈V represents a user (from now on we will use the terms node and user interchangeably), anda directed edge from node u to v denotes that user u can send information to v . For example,for the case of the Twitter social network, an edge (u, v) ∈ E in the underlying graph G denotesthat user v is “following" u. Borrowing Twitter’s parlance, in this paper, we will say that v is afollower of u if (u, v) ∈ E . The number of u’s followers is thus the same as u’s out-degree.
We assume that initially a set of users S ⊆ V learns an information item (from a sourceexternal to the network). From each user that learns the information, this information can bereposted to all its followers. (So, information can either be sent to all followers of the user, or tonone.) We propose a randomized distributed algorithm, running locally at each user (i.e., at theuser’s device connected to the social network service), which decides whether or not to repostthe received information; we call this algorithm RIPOSTE.
RIPOSTE takes as input the opinion of the user on the information item, i.e., if the user likes
or does not like the information, and the algorithm’s effect is to either repost the information ornot. RIPOSTE’ decision depends on: (1) the user’s opinion, (2) an upper bound on the numberof the user’s followers that have not received the information yet, and (3) two global parametersof the protocol (the same for all users), denoted δ and λ; both parameters are non-negative realnumbers satisfying δ < 1 and λ > 1. As explained later, these parameters control the privacyproperties of the protocol, and influence the dissemination.
RIPOSTE Algorithm: For each new information item received by user u, if u has k followersand s ≤ k is an estimate bounding from above the number of u’s followers that have not receivedthe item yet, then:if u likes the item, the algorithm reposts the item with probability
rlike(s) :=
�λ/s, if s ≥λ+δ,
1− δ(s−δ)λs
, if 0 < s <λ+δ;
if u does not like the item, it is reposted with probability rdis(s) := δ/s (if s > 0).
It is easy to verify that rdis(s) ≤ rlike(s), for all s, i.e., the probability of reposting is largerwhen u likes the item. Also, the closer are δ and λ to each other, the closer are the two proba-bilities rdis and rlike.
The definition of rlike(s) for the case of s < λ+ δ will be justified when we analyse theprivacy of the protocol. Until then we can assume the following simpler definition for all s > 0:rlike(s) := min{λ/s, 1}.
RIPOSTE needs to know an upper bound on the number of the user’s followers who havenot yet received the item. This information is readily available in some existing social networkservices, including Twitter, where the default setting is that a user can access the list of itemseach of its followers has received. If this information is not available, then the total number offollowers k of the user can be used as the upper bound s. For the analysis and the experimentalevaluation, we will make use also of that special variant of RIPOSTE, where s = k.

CHAPTER 3 3-7
DB-RIPOSTE Algorithm (Degree-Based-Riposte): This algorithm is a special instance of RI-POSTE, where the total number of followers k of user u is used as the upper bound s on thenumber of u’s followers who have not already received the information.
An attractive analytical property of DB-RIPOSTE is that the outcome of the disseminationdoes not depend on the order in which the algorithm is executed at different users, unlike inthe general RIPOSTE algorithm. For our analysis of RIPOSTE we assume that the order can bearbitrary.
We stress that RIPOSTE does not reveal any information on the value of its input (the user’sprivate opinion), other than the statistical information inferred by the outcome of the algo-rithm, to repost or not. Also, the user cannot prevent the algorithm from reposting the infor-mation, even if she does not like the information. In particular, if the user refuses to answerwhether she likes an item or not, this is interpreted as a negative answer by the algorithm (theuser has an incentive to answer positively if she likes the item, as this would potentially resultin larger spread).
We now analyze the properties of RIPOSTE, regarding privacy and the spread of informa-tion.
3.4.1 Privacy
RIPOSTE achieves the property of plausible deniability: A user can claim that, with reason-able probability, the act of reposting (or not) an information, does not reflect the user’s truthfulopinion on the information, and is a result of the randomness in the algorithm.
The standard notion used to quantify plausible deniability is that of differential privacy [59].We recall now the definition of an ε-differentially private algorithm. Let A be a randomized al-gorithm with input a collection of values, x1, . . . , xm , that returns a value from some domainR. Since the algorithm is randomized, for a fixed input x1, . . . , xm , its output A(x1, . . . , xm) is arandom variable, with some distribution over R. Suppose that the input to A is not known tous (is private), and by observing the output of A we want to find out the value of some of theinputs. More generally, we may have some information about the input, i.e., a distribution overthe possible combinations of input values, and we want, by observing A’s output, to improvethis information, i.e., obtain a distribution closer to the true input values. We can quantify theextent to which this is possible in terms of ε-differential privacy: algorithm A is ε-differentiallyprivate if changing exactly one of it inputs x1, . . . , xm changes the distribution of the output byat most an eε factor.
A randomized algorithm A with inputs x1, . . . , xm from some finite domain and out-put A(x1, . . . , xm) on some domain R, is ε-differentially private if for any two sets of inputsx1, . . . , xm and x �
1, . . . , x �m that differ in exactly one value, and for any set of outputs Q ⊆ R,
Pr�
A(x1, . . . , xm) ∈Q�≤ eε ·Pr
�A(x �
1, . . . x �m) ∈Q
�.
Definition 4 (ε-differential privacy)
In our setting, algorithm A is RIPOSTE, which takes a single binary input: the opinion of theuser, and has a binary output: repost or not-repost.
RIPOSTE is ε-differentially private for ε= ln(λ/δ).
Theorem 1

3-8 USER PRIVACY
The proof is a straightforward application of the definitions, We must show that (i) the proba-bility of reposting when the user likes the item is no larger than eε = λ/δ times the probabilityof reposting when the user does not like the item, i.e.,
rlike(s) ≤ (λ/δ) · rdis(s); (3.1)
and (ii) the probability of not reposting when the user does not like the item is no larger thanλ/δ times the probability of not reposting when the user likes the item, i.e.,
1− rdis(s) ≤ (λ/δ) · (1− rlike(s)). (3.2)
For Ineq. (3.1), we have that rlike(s) =λ/s if s ≥λ+δ, and rlike(s) = 1− δ(s−δ)λs
<λ/s if 0 < s <
λ+δ; thus for any s, rlike(s) ≤λ/s. And since rdis(s) = δ/s, Ineq. (3.1) follows.For Ineq. (3.2), if 0 < s <λ+δ, the right-hand side is
(λ/δ) · (1− rlike(s)) = (λ/δ) · δ(s−δ)λs
=s−δ
s= 1− rdis(s);
while if s ≥λ+δ,
(3.2) ⇔ 1−δ/s ≤ (λ/δ)(1−λ/s)
⇔ δ(1−δ/s) ≤λ(1−λ/s)
⇔ (λ2−δ2)/s ≤λ−δ
⇔ (λ+δ)/s ≤ 1
⇔ λ+δ≤ s,
and the last inequality holds. ��
Theorem 1 implies that the closer is the ratio λ/δ to 1, the better the achieved privacy. Inparticular, if δ= λ we have perfect privacy, as the probability of reposting does not depend onthe user’s opinion—but this is not desirable from a dissemination point of view.
We discuss now what Theorem 1 implies about the information one can gain for the opin-ion of a user on some information item it receives, by observing whether or not the item wasreposted from that user.
Let q be the (prior) probability that the user likes the information, capturing the knowl-edge of an observer about the user’s opinion before the observer sees whether or not this in-formation is reposted from the user. Then from Theorem 1 it follows that the probability q
with which the observer believes that the user likes the information, after the observer learnswhether or not there was a repost, satisfies the inequalities
q
q + (1−q)(λ/δ)≤ q ≤
q
q + (1−q)(δ/λ). (3.3)
The proof, by Bayes’ Rule, is standard and is discussed here. Fig. 3.2 illustrates the aboverelationship between q and q . E.g., for the typical parameter values δ = 3/4 and λ = 3 we uselater in the experimental evaluation, we have that if q = 0.01 then 0.0025 < q < 0.039; if q = 0.1then 0.027 < q < 0.31; and if q = 0.9 then 0.69 < q < 0.97.
Above we have considered the amount of information leaked when observing the cascadeof a single information item. However, if one can observe the cascades of a sufficiently large
number of sufficiently similar items, possibly over a long period, then more information canpotentially be leaked about the opinion of a user on this type of information. We leave as afuture work the study of such correlation attacks.

CHAPTER 3 3-9
0
0.2
0.4
0.6
0.8
1
0 0.2 0.4 0.6 0.8 1
Pro
babili
ty q
after
observ
ation
Probability q before observation
λ=2, δ=0.75λ=3, δ=0.75λ=3, δ=0.60
Figure 3.2 – Illustration of Ineq. (3.3) that provides upper and lower bounds on the conditional probability
q that the user likes the information, after observing whether the information was reposted from the user,
in terms of the prior probability q before the observation. Probability q diverges more from q as λ increases
or δ decreases.
3.4.2 Dissemination
In terms of dissemination, the goal of RIPOSTE is that the fraction of users receiving aninformation item should reflect the users’ overall opinion on the item. In particular, informa-tion that a large fraction of users like should, typically, be received by a lot of users, while lessinteresting information should not be received by many users. In the following, we quantifythe notions of interesting/not-interesting information by defining a popularity threshold, andwe provide bounds on the spread of popular items (with popularity above this threshold) andunpopular items (with popularity below the threshold).
For the analysis, we make the assumption that all users are equally likely to like a givenitem, independently of their position in the network and the opinion of other users.
Each item t is associated with a probability pt , called the popularity of t , and for eachuser u, the probability that u likes t is equal to pt and independent of the other users’opinion about t . This is our setting of Uniform Opinion Model.
Definition 5 (Popularity)
We note that popularity pt is also equal to the expected fraction of users that like t . An item’spopularity is not known in advance by the diffusion protocol.
We define the popularity threshold p∗ as follows. Suppose that user u receives an itemwith popularity p. Since u has probability p of liking the item in the uniform model, the prob-ability that RIPOSTE reposts the item, if s > 0, is p · rlike(s)+ (1− p) · rdis(s). If s ≥ λ+δ, thisprobability is p · (λ/s)+ (1− p) · (δ/s). Moreover, if s is the exact number of u’s followers thathave not received the item yet, then the expected number of new users that learn the item fromu is s times that, i.e., pλ+ (1− p)δ. The popularity threshold p∗ is then the probability p forwhich this expectation is equal to 1.
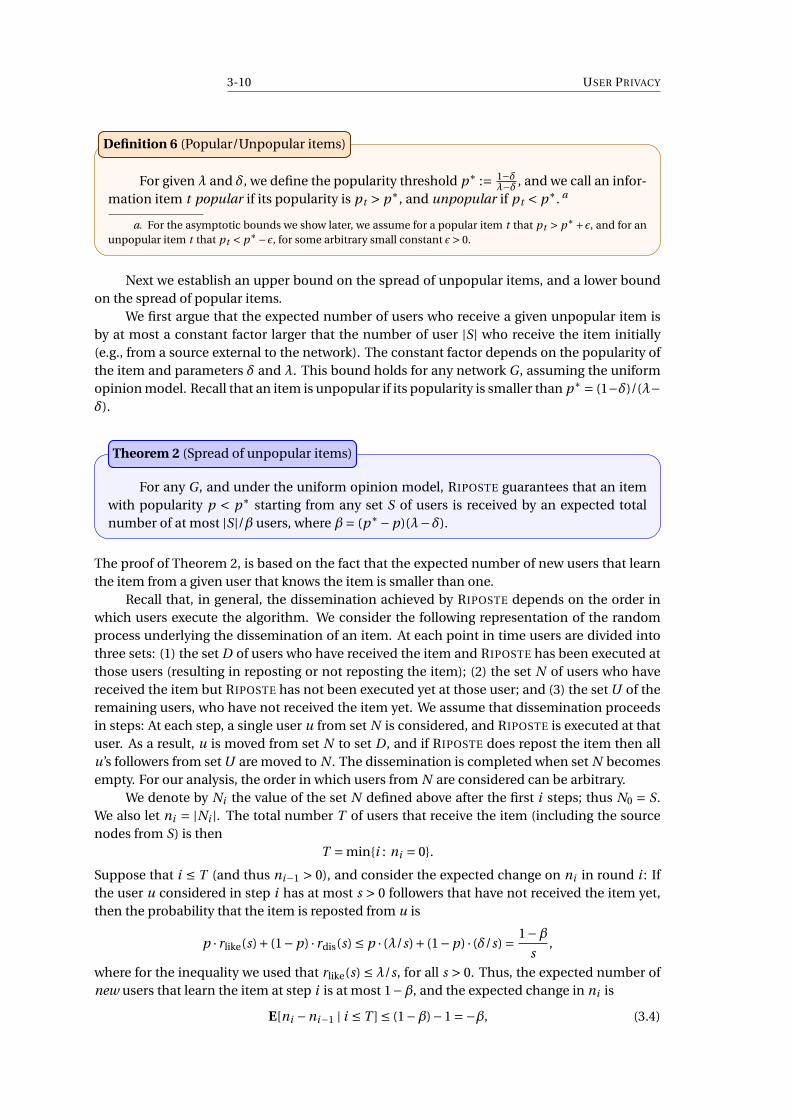
3-10 USER PRIVACY
For given λ and δ, we define the popularity threshold p∗ := 1−δλ−δ , and we call an infor-
mation item t popular if its popularity is pt > p∗, and unpopular if pt < p∗. a
a. For the asymptotic bounds we show later, we assume for a popular item t that pt > p∗+�, and for anunpopular item t that pt < p∗−�, for some arbitrary small constant �> 0.
Definition 6 (Popular/Unpopular items)
Next we establish an upper bound on the spread of unpopular items, and a lower boundon the spread of popular items.
We first argue that the expected number of users who receive a given unpopular item isby at most a constant factor larger that the number of user |S| who receive the item initially(e.g., from a source external to the network). The constant factor depends on the popularity ofthe item and parameters δ and λ. This bound holds for any network G , assuming the uniformopinion model. Recall that an item is unpopular if its popularity is smaller than p∗ = (1−δ)/(λ−δ).
For any G , and under the uniform opinion model, RIPOSTE guarantees that an itemwith popularity p < p∗ starting from any set S of users is received by an expected totalnumber of at most |S|/β users, where β= (p∗−p)(λ−δ).
Theorem 2 (Spread of unpopular items)
The proof of Theorem 2, is based on the fact that the expected number of new users that learnthe item from a given user that knows the item is smaller than one.
Recall that, in general, the dissemination achieved by RIPOSTE depends on the order inwhich users execute the algorithm. We consider the following representation of the randomprocess underlying the dissemination of an item. At each point in time users are divided intothree sets: (1) the set D of users who have received the item and RIPOSTE has been executed atthose users (resulting in reposting or not reposting the item); (2) the set N of users who havereceived the item but RIPOSTE has not been executed yet at those user; and (3) the set U of theremaining users, who have not received the item yet. We assume that dissemination proceedsin steps: At each step, a single user u from set N is considered, and RIPOSTE is executed at thatuser. As a result, u is moved from set N to set D , and if RIPOSTE does repost the item then allu’s followers from set U are moved to N . The dissemination is completed when set N becomesempty. For our analysis, the order in which users from N are considered can be arbitrary.
We denote by Ni the value of the set N defined above after the first i steps; thus N0 = S.We also let ni = |Ni |. The total number T of users that receive the item (including the sourcenodes from S) is then
T = min{i : ni = 0}.
Suppose that i ≤ T (and thus ni−1 > 0), and consider the expected change on ni in round i : Ifthe user u considered in step i has at most s > 0 followers that have not received the item yet,then the probability that the item is reposted from u is
p · rlike(s)+ (1−p) · rdis(s) ≤ p · (λ/s)+ (1−p) · (δ/s) =1−β
s,
where for the inequality we used that rlike(s) ≤ λ/s, for all s > 0. Thus, the expected number ofnew users that learn the item at step i is at most 1−β, and the expected change in ni is
E[ni −ni−1 | i ≤ T ] ≤ (1−β)−1 =−β, (3.4)

CHAPTER 3 3-11
where the ‘−1’ in accounts for the removal of u from Ni−1.It is now easy to understand the intuition behind the bound we must show: At each step,
ni drops in expectation by at least β. If, instead, the actual drop were at least β, then it wouldfollow that the number of steps until ni becomes zero would be at most n0/β= |S|/β, which isequal to the bound we must show.
The formal proof is by applying Wald’s theorem to the sequence of random variables Ti =
ni−1−ni , for i = 1,2, . . . From (3.4), it follows that E[Ti | i ≤ T ] ≥β, and thus from Wald’s theoremit follows that E[
�i Ti ] ≥β ·E[T ]. And since
�i Ti = n0 = |S|, we obtain E[T ] ≤ |S|/β. ��
Observe that as p approaches the popularity threshold p∗, factor β decreases, and thusthe bound on the expected spread increases. Further, substituting the definition of p∗ givesβ = 1−δ−p(λ−δ), which implies that increasing either λ or δ increases the expected spread.These observations are consistent with the intuition.
Next we consider the spread of popular items. We focus on a particular family of randomdirected graphs which is convenient for our analysis, but is also a reasonable model of somesocial network graphs, such as the Twitter graph, characterized by large variation in the nodes’out-degree (i.e., the number of followers) and small variation in the nodes’ in-degree. Thismodel is a simplification of one considered in [41], and has a single parameter, a distribution φ
on the nodes’ out-degree.
For any probability distribution φ on the set {0, . . . ,n − 1}, Gφ is an n-node randomdirected graph such that the out-degrees of nodes are independent random variables withthe same distribution φ, and for each node u, if u has out-degree k, then the set of u’soutgoing neighbors is a uniformly random set among all k-sets of nodes not containing u.
Definition 7 (Random graph Gφ)
We establish a lower bound on the probability of a popular item to be received by a constantfraction of users in Gφ, for an arbitrary distribution φ (under a mild constraint on the min out-degree). The above probability and the fraction size grow respectively with the number σ= |S|
of source nodes, and the popularity p of the item. In particular, the probability converges to 1for σ larger than the average node degree µ.
Let φ be any probability distribution on the set {�λ+δ�, . . . ,n −1}, let �,�� > 0 be arbi-trary small constants, and 1 ≤ σ ≤ n be an integer. Any information item with popularityp ≥ p∗ + �, that starts from a random initial set of σ nodes and spreads in Gφ using RI-
POSTE, is received by at least (1−��) · βnβ+1 users, with probability at least 1−e−Ω(σ/µ), where
β= (p −p∗)(λ−δ) and µ is the mean of distribution φ.
Theorem 3 (Spread of popular items)
Observe that the same constant β = |p − p∗| · (λ−δ) appears in both Theorems 2 and 3.
Unlike the bound of Theorem 2, the bound of (1 − ��) · βnβ+1 in Theorem 3 is independent of
the number σ = |S| of source nodes; substituting the definitions of β and p∗, yields ββ+1 = 1−
1pλ+(1−p)δ , thus the bound above increases when any of λ, δ, or p increases. The independencefrom σ is intuitively justified, because as long as the item reaches a “critical mass” of users, itwill almost surely spread to a constant fraction of the network. However, the probability withwhich such a critical mass will be reached does depend on σ. For σ close to the average degreeµ, this probability is at least a constant, and quickly converges to 1 as σ/µ increases above 1.

3-12 USER PRIVACY
The proof of Theorem 3 uses a coupling between the dissemination process and an ap-propriate branching process, to show that the probability of the event we are interested in, thatat least a certain fraction of users receive the item, is lower-bounded by the survival probabil-ity of the branching process. Then we bound this survival probability using a basic result forbranching processes.
Proof of Theorem 3. It suffices to prove the claim for DB-RIPOSTE. The reasons is that thereposting probabilities rlike(s) and rdis(s) are minimized when s equals the number k of theuser’s followers, and thus a standard coupling argument shows that the number of users thatreceive the item if DB-RIPOSTE is used is dominated stochastically by the same quantity whenRIPOSTE is used.
We couple the diffusion process in Gφ with an appropriate branching process. Recall that a(Galton-Watson) branching process is a random process starting with one or more individuals,and in each step of the process a single individual produces zero of more offsprings and thendies. The number of offsprings of an individual follows a fixed probability distribution, thesame for all individuals. The process either finishes after a finite number of steps, when noindividuals are left, or continues forever. The probabilities of these two complementary eventsare called extinction and survival probability, respectively.
First we compute the distribution of the number of new users that learn the item from auser u, at a point in time when fewer than � users in total have received the item—we will fix thevalue of � later. The probability that u has exactly i followers is φ(i ), for i ∈ {�λ+δ�, . . . ,n −1}(and 0 for other i ). Given that u has i followers, the probability that DB-RIPOSTE reposts theitem from u is (pλ+ (1− p)δ)/i = (β+1)/i . Further, by the principle of deferred decision, wecan assume that if the item is reposted from u, only then are u’s i followers chosen. We canalso assume that they are chosen sequentially, one after the other, and the item is sent to afollower before the next follower is chosen (this does not change the overall outcome of thedissemination). Then the probability that the j -th follower of u has not already received theitem is at least 1−�/n, provided that at most � users already know the item (including the firstj −1 followers of u).
Consider now the branching process in which σ individuals exist initially, and the numberX of offsprings of an individual is determined as follows. First an integer i is drawn from dis-tribution φ; then with probability 1− (β+1)/i we have X = 0 offspring, and with the remainingprobability, (β+1)/i , we draw X ’s value from the binomial distribution B(i , q), for q := 1−�/n
(this is the distribution of the number of successes among i independent identical trials withsuccess probability q).
We use a simple coupling of the diffusion process with the branching process above, untilthe point when � users have received the item or the dissemination has finished (whicheveroccurs first). We assume that the diffusion process evolves in steps, and each step involvesthe execution of the DB-RIPOSTE algorithm at a single node. Similarly a step in the branchingprocess is that a single individual reproduces and then dies. Let Nt denote the number of newusers that learn the item in step t of the diffusion process, and let X t be the number of offspringsborn in step t of the branching process. From our discussion above on the distribution of Nt
and from the definition of the distribution of X t ∼ X , it follows that we can couple Nt and X t
such that Nt ≥ X t if no more than � users in total have received the item in the first t steps.
From this coupling, it is immediate that the probability at least � users receive the item intotal, is lower-bounded by the probability that the total progeny of the branching process (i.e.,the total number of individuals that ever existed) is at least �. Further, the latter probabilityis lower bounded by the survival probability of the branching process; we denote this survival

CHAPTER 3 3-13
probability by ζσ. Thus to prove the theorem it suffices to show
ζσ = 1−e−Ω(σ/µ),
for � := (1−��) ·βn/(β+1). The remainder of the proof is devoted to that.By the definition of the branching process, the expected number of offsprings of an indi-
vidual is
E[X ] =�
i
φ(i ) ·β+1
i·E[B(i , q)]
=�
i
φ(i ) ·β+1
i· i q =
�
i
φ(i ) · (β+1) ·q = (β+1) ·q.
We observe that E[X ] > 1, as
(β+1) ·q = (β+1) ·
�1−
(1−��)β
β+1
�= 1+��β. (3.5)
Further,
E[X 2] =�
i
φ(i ) ·β+1
i·E[(B(i , q))2] =
�
i
φ(i ) ·β+1
i· (i 2q2
+ i q(1−q))
=�
i
φ(i ) · (β+1) · (i q2+q(1−q)) = (β+1) · (µq2
+q(1−q)),
where µ =�
i φ(i ) · i is the mean of φ. We will use the following standard lower bound on thesurvival probability ζ1, when there is just one individual initially (see, e.g., [75, Sect. 5.6.1]),
ζ1 ≥2(E[X ]−1)
E[X 2]−E[X ].
Substituting the values for E[X ] and E[X 2] computed above yields
ζ1 ≥2(q(β+1)−1)
(β+1)(µq2 +q(1−q))−q(β+1)=
2(q(β+1)−1)
q2(β+1)(µ−1)
=2(q(β+1)−1)(β+1)
q2(β+1)2(µ−1)(3.5)=
2��β(β+1)
(1+��β)2(µ−1)=Ω(1/µ),
where the final equation holds because β= (p −p∗)(λ−δ) ≥ �(λ−δ) =Ω(1).We can now express ζσ in terms of ζ1, by observing that a branching process starting with
σ individuals can be viewed as σ independent copies of the branching process starting with asingle individual each. 3 The former branching process survives if and only if at least one of thelatter ones survives, thus,
ζσ = 1− (1−ζ1)σ ≥ 1−e−ζ1σ = 1−e−Ω(σ/µ).
This completes the proof of Theorem 3. ��
3.5 Experiments and Evaluation
In this section we provide experimental evaluation of the dissemination achieved by RIPOSTE
on some real topologies of online social networks. The results are surprisingly consistent withour analysis, even though some of the analytical results were proven only for an ideal randomgraph model.
3. This is true for any branching process, and does not relate to the original diffusion process.

3-14 USER PRIVACY
Datasets. We use the network topologies listed in Table 3.1. The Twitter dataset is a completesnapshot of the network from 2009 [88], while the other datasets are partial network samples.Twitter is a micro-blogging network service, LiveJournal is a blogging network site, while Face-book, Renren, and Google+ are online social networking sites. In each of these networks, everyuser maintains a list of friends, and/or a list of users she follows. The friendship relation is typi-cally reciprocal, whereas the follower relation is not; the former is represented as an undirectededge, and the latter as a directed. In Twitter, LiveJournal and Google+ edges are directed, whilein Renren and Facebook undirected.
Network Nodes Edges Avg-deg Source
Twitter 41.65M 1468M 35.2 [88]LiveJournal 4.847M 68.99M 14.2 [17, 94]Facebook 3.097M 23.66M 15.3 [145]Renren 965.3K 57.56M 59.6 [54]Google+ 107.6K 13.67M 127 [95]
Table 3.1 – Network topologies used in the experiments. By avg-deg we denote the average degree of the
network.
Setup. We consider the following protocols: (1) RIPOSTE, with exact information on the num-ber of non-informed followers, i.e., s is the actual number of the user’s followers that do notknow the item yet—not just an upper bound; (2) DB-RIPOSTE, where no information aboutthe followers status is available, and thus s is the total number of followers; (3) the basic nonprivacy-conscious protocol where a user reposts an item if she likes it and does not repost it ifshe does not like it; we refer to this as the STANDARD protocol.
While datasets on social network topologies are publicly available, access to user’s activ-ity, including the list of items they post, receive, like or repost, is severely restricted. Therefore,for our evaluation we rely on two synthetic models to generate users’ opinions: (i) the uni-
form opinion model, where every item is assigned a popularity p ∈ [0,1], and each user likes theitem independently with probability p—this is the same model used in the analysis (see Defini-tion 5); and (ii) the distance-threshold opinion model, where a user likes the item precisely if the(shortest-path) distance from a source to the user is at most some threshold h. The latter modelis motivated by the principle that users close to each other tend to have similar opinions [107].
In all experiments, we choose the set S of users who know the item initially to be the fol-lowers of a random user, among all users with at least µ followers, where µ is the average de-gree. We think that this is more realistic than choosing an arbitrary or random set S: It is oftenthe case that the source of the information (e.g., a news channel) is itself a node in the onlinesocial network; then the followers of that node constitute the set S of nodes exposed to the in-formation initially. For each point in the plots we present, we average the results over 10,000random independent experiments, with a new random set S each time. For the RIPOSTE algo-rithm, where the dissemination may depend on the order in which the protocol is executed atdifferent users, we experimented with both breadth-first and depth-first orders, obtaining verysimilar results.
Results. Fig. 3.3 shows the average number of users that receive the item when using RIPOSTE,as a function of the item popularity, for all networks (for parameters λ= 3 and δ= 0.75).

CHAPTER 3 3-15
0
0.2
0.4
0.6
0.8
1
0 0.2 0.4 0.6 0.8 1
Fra
ctio
n o
f in
form
ed
use
rs
Popularity of item
Riposte, λ=3, δ=0.75
p*
RenrenLiveJournalFacebookGoogle+Twitter
Figure 3.3 – Dissemination for RIPOSTE as a function of the item popularity.
0
0.2
0.4
0.6
0.8
1
0 0.2 0.4 0.6 0.8 1
Fra
ctio
n o
f in
form
ed
use
rs
Popularity of item
Twitter, λ=3, δ=0.75
p*
StandardRiposteDB-Riposteβ / (β + 1)
(a)
0
0.2
0.4
0.6
0.8
1
0 0.2 0.4 0.6 0.8 1
Fra
ctio
n o
f in
form
ed
use
rs
Popularity of item
LiveJournal, λ=3, δ=0.75
p*
StandardRiposteDB-Riposteβ / (β + 1)
(b)

3-16 USER PRIVACY
0
0.2
0.4
0.6
0.8
1
0 0.2 0.4 0.6 0.8 1
Fra
ctio
n o
f in
form
ed
use
rs
Popularity of item
Renren, λ=2, δ=0.75
p*
StandardRiposteDB-Riposteβ / (β + 1)
(c)
0
0.2
0.4
0.6
0.8
1
0 0.2 0.4 0.6 0.8 1
Fra
ctio
n o
f in
form
ed
use
rs
Popularity of item
Facebook, λ=3, δ=0.75
p*
StandardRiposteDB-Riposteβ / (β + 1)
(d)
0
0.2
0.4
0.6
0.8
1
0 0.2 0.4 0.6 0.8 1
Fra
ctio
n o
f in
form
ed
use
rs
Popularity of item
Google+, λ=3, δ=0.75
p*
StandardRiposteDB-Riposteβ / (β + 1)
(e)
Figure 3.4 – Dissemination in Twitter, LiveJournal, RenRen, Facebook and Google+. Comparison with
STANDARD and the β/(β+1) lower bound of Theorem 3.

CHAPTER 3 3-17
In all cases, unpopular items (with popularity p below the threshold p∗ identified by ouranalysis) have very limited spread, while popular items (with p > p∗) spread to a fraction of thenetworks that grows quickly with p.Fig. 3.4 compares the dissemination using RIPOSTE to that of DB-RIPOSTE and STANDARD, andalso to the lower bound for the spread of popular items predicted by Theorem 3. As expected,DB-RIPOSTE informs fewer users than RIPOSTE but has overall qualitatively similar behavior.STANDARD achieves significantly wider dissemination, even for items with very low popularity,which may be undesirable. The β/(1−β) bound of Theorem 3 is relatively close to the curve forRIPOSTE (slightly above it in the case of Twitter and intersecting it in the case of LiveJournal).
This lower bound was derived for an idealized random graph model, so it is reasonablethat it does not apply exactly to the real topologies considered. On the other hand, the 1/βupper bound for unpopular items of Theorem 2 holds for any graph, and Fig. 3.5 shows that itindeed bounds the dissemination with RIPOSTE in all the datasets considered in our work.
1
10
100
0.02 0.04 0.06 0.08 0.1
# info
rmed u
sers
/ #
sourc
es
Popularity of item
Twitter, λ=3, δ=0.75
p*
RiposteDB-Riposte1/β
(a)
1
10
100
0.02 0.04 0.06 0.08 0.1
# info
rmed u
sers
/ #
sourc
es
Popularity of item
LiveJournal, λ=3, δ=0.75
p*
RiposteDB-Riposte1/β
(b)

3-18 USER PRIVACY
1
10
100
0.02 0.04 0.06 0.08 0.1 0.12 0.14 0.16 0.18 0.2
# info
rmed u
sers
/ #
sourc
es
Popularity of item
Renren, λ=2, δ=0.75
p*
RiposteDB-Riposte1/β
(c)
1
10
100
0.02 0.04 0.06 0.08 0.1
# info
rmed u
sers
/ #
sourc
es
Popularity of item
Facebook, λ=3, δ=0.75
p*
RiposteDB-Riposte1/β
(d)
1
10
100
0.02 0.04 0.06 0.08 0.1
# info
rmed u
sers
/ #
sourc
es
Popularity of item
Google+, λ=3, δ=0.75
p*
RiposteDB-Riposte1/β
(e)
Figure 3.5 – Dissemination in Twitter, LiveJournal, RenRen, Facebook and Google+. Comparison with the
1/β upper bound of Theorem 2 for unpopular items.

CHAPTER 3 3-19
Finally, Fig. 3.6 presents the same results as Fig. 3.4b but for the distance-threshold opinionmodel.
We observe that RIPOSTE achieves spread to a fraction of users that is relatively close tothe fraction of users that like the item. As before, STANDARD may spread the item to a fractionsignificantly larger than the fraction that likes the item, in particular, for items that not manyusers like.
0
0.2
0.4
0.6
0.8
1
1 2 3 4 5
Fra
ctio
n o
f in
form
ed
use
rs
Parameter h of the distance-threshold model
Twitter, λ=3, δ=0.75
StandardRiposteDB-RiposteInterested users
(a)
0
0.2
0.4
0.6
0.8
1
1 2 3 4 5 6
Fra
ctio
n o
f in
form
ed
use
rs
Parameter h of the distance-threshold model
LiveJournal, λ=3, δ=0.75
StandardRiposteDB-RiposteInterested users
(b)

3-20 USER PRIVACY
0
0.2
0.4
0.6
0.8
1
1 2 3 4 5
Fra
ctio
n o
f in
form
ed
use
rs
Parameter h of the distance-threshold model
Renren, λ=2, δ=0.75
StandardRiposteDB-RiposteInterested users
(c)
0
0.2
0.4
0.6
0.8
1
1 2 3 4 5
Fra
ctio
n o
f in
form
ed
use
rs
Parameter h of the distance-threshold model
Facebook, λ=3, δ=0.75
StandardRiposteDB-RiposteInterested users
(d)
0
0.2
0.4
0.6
0.8
1
1 2 3 4
Fra
ctio
n o
f in
form
ed
use
rs
Parameter h of the distance-threshold model
Google+, λ=3, δ=0.75
StandardRiposteDB-RiposteInterested users
(e)
Figure 3.6 – Dissemination in Twitter, LiveJournal, RenRen, Facebook and Google+. Distance-threshold
model (all users within distance h from the source, and only them, like the item).

CHAPTER 3 3-21
Moreover, Fig. 3.7 shows that a large fraction of the nodes that receive the item are indeedones that like it in case of RIPOSTE, and even more for DB-RIPOSTE.
0
0.2
0.4
0.6
0.8
1
1 2 3 4 5
Pre
cis
ion
Parameter h of the distance-threshold model
Twitter, λ=3, δ=0.75
StandardRiposteDB-Riposte
0
0.2
0.4
0.6
0.8
1
1 2 3 4 5 6
Pre
cis
ion
Parameter h of the distance-threshold model
LiveJournal, λ=3, δ=0.75
StandardRiposteDB-Riposte

3-22 USER PRIVACY
0
0.2
0.4
0.6
0.8
1
1 2 3 4 5
Pre
cis
ion
Parameter h of the distance-threshold model
Renren, λ=2, δ=0.75
StandardRiposte
DB-Riposte
0
0.2
0.4
0.6
0.8
1
1 2 3 4 5
Pre
cis
ion
Parameter h of the distance-threshold model
Facebook, λ=3, δ=0.75
StandardRiposteDB-Riposte
0
0.2
0.4
0.6
0.8
1
1 2 3 4
Pre
cis
ion
Parameter h of the distance-threshold model
Google+, λ=3, δ=0.75
StandardRiposte
DB-Riposte
Figure 3.7 – Fraction of users that like the item among all uses that receive the item (a measure known
as precision), in the distance-threshold opinion model. RIPOSTE and DB-RIPOSTE achieve significantly
better precision that STANDARD for smaller values of h.

CHAPTER 3 3-23
To conclude the section of experiments and evaluation, we present the effect on dissemi-nation by varying our parameters, i.e., λ and δ. We illustrate this variation in Fig. 3.8 This graph(with more varied values) is also what we used to fix our parameters for both, theoretical andpractical purposes.
0
0.2
0.4
0.6
0.8
1
0 0.2 0.4 0.6 0.8 1
Fra
ctio
n o
f in
form
ed
use
rs
Popularity of item
LiveJournal, δ=0.75
Riposte, λ=2Riposte, λ=3Riposte, λ=4
(a)
0
0.2
0.4
0.6
0.8
1
0 0.2 0.4 0.6 0.8 1
Fra
ctio
n o
f in
form
ed
use
rs
Popularity of item
LiveJournal, λ=3
Riposte, δ=1Riposte, δ=0.75Riposte, δ=0.5
(b)
Figure 3.8 – Effect of variation in parameters λ and δ on the dissemination achieved with RIPOSTE in
LiveJournal. (a) Variation in λ for fixed δ = 0.75. (b) Variation in δ for fixed λ = 3. Increasing either
parameter decreases the popularity threshold and increases the spread.
3.6 Conclusion
We have presented a simple and local diffusion mechanism for social networks, whichguarantees widespread dissemination of interesting but possibly sensitive information, in aprivacy-conscious manner. The mechanism randomizes the user’s action of reposting (or not)the information, in a way reminiscent of the randomized response technique, and chooses theprobabilities so that a branching-process-like phenomenon takes place: if more than a certainfraction of people like the information then a large cascade of reposts is formed, and if fewerpeople like it then the diffusion process dies quickly.


4Fast and Efficient k-Nearest Neighbor Graph
Construction
You are ... the people yousurround yourself with
Matrin Jefferson Junior
Necessarily all recommendation systems rely on a learning model that can use the user-itemdata to learn and predict ranked preferences of users. There are innumerable ways of design-ing and implementing these learning models. These models are driven by a machine learningalgorithm behind them. We have mentioned some of these most commonly used algorithmsin Chapter 2.3 KNN is among one of the most popular algorithms, serving as a back bone ofrecommendation systems. It also finds its use in other applications like Information Retrieval,Image and Text Classification, Similarity search etc. Its simplicity of implementation and widespread use in recommendation systems is one of the driving forces behind our contribution.
In this chapter, we present KIFF: a generic, fast and scalable KNN graph construction al-gorithm. Recommendation systems are based on user-item relationships, where a user can beinterested in one or more items in the system, therefore, leading to a system that can be eas-ily viewed as a bipartite graph. As a result, KIFF directly exploits the bipartite nature of mostdatasets to which KNN algorithms are applied. This simple but powerful strategy drasticallylimits the computational cost required to rapidly converge to an accurate KNN solution, espe-cially for sparse datasets. We use vivid set of experiments and simulations to quantify the actualgains in terms of speed-up and reduction in computation costs that KIFF achieves as comparedto its competitors : some of the most powerful state-of-the art approaches.
To systematically present KIFF, we present an elaborated Introduction to KIFF in Sec-tion 4.1. Section 4.2 gives a detailed schema of the technical contribution, starting with somebackground knowledge. Later we formally present KIFF in Section 4.3 by introducing a formalproblem definition. The choice of parameters and data structures is also explained in this sec-tion. The experiments are presented in Section 4.4 and their evaluations and analysis in thesubsequent Section 4.5. We conclude this contribution in Section 4.6, by finally giving somefuture perspectives into the work.

4-2 CHAPTER 4
4.1 Introduction
Recommendation systems lead to relations between its users and items. In a typical setting, auser can be associated to one or more items in the system. To fulfill the purpose of providing auser with recommendations, a classic way is to rely on knowledge of neighbors and the itemsthat they are interested in. This leads to the problem of finding neighbors for every user in thesystem : a problem quintessentially called the knn graph construction problem.
K-Nearest-Neighbor (KNN) graphs play a fundamental role in many web-based applica-tions e.g., search [18,22], recommendation [29,96,98,119] and classification [113]. A KNN graphis a directed graph of entities (e.g., users, products, services, documents etc.), in which each en-tity (or node) is connected to its k most similar counterparts or neighbors, according to a givensimilarity metric. In contemplation of computing the similarity between entities, a well-chosensimilarity measure is used, from a list of various available measures depending on various fac-tors like the size and type of entities involved, the targeted application etc. Some examplesof similarity measures from literature include Jaccard, Cosine, Pearson and Dice similarity. Itturns out that in a large number of applications, this similarity metric is computed from a sec-ond set of entities (termed items) associated with each node in a bipartite graph (possibly ex-tended with weights, such as ratings or frequencies). For instance, in a movie rating database,nodes are users, and each user is associated with the movies (items) she has already rated.A simple recommendation service can be implemented by constructing the KNN graph ofusers using Jaccard’s coefficient or Cosine similarity [140], two typical item-based similaritymetrics, and using a collaborative filtering approach on the resulting neighborhoods.
As data volumes continue to grow, constructing a KNN graph efficiently remains an ongo-ing and open challenge 1 A brute force computation of a KNN graph requires O(n2) similaritycomputations, which does not scale, in particular when nodes are associated with large itemsets, with direct implication for a raft of concrete applications such as recommendations, fea-ture extraction, Principle Component Analysis among many others.
To address this problem, most practical approaches approximate the actual KNN and de-liver an Approximate-Nearest-Neighbor graph, or ANN. This approximation can take severalforms, which can often be combined. One such line of attack uses dimension reduction tech-niques to lower the cost of computing individual similarities [24, 67, 100].
Another complementary strategy avoids an exhaustive search altogether and executes agreedy, localized search to converge rapidly towards a KNN or ANN graph [22, 29, 56, 83, 105,143]. These greedy approaches start from a random k-degree graph and exploit the fact thatsimilarity functions tend to behave transitively over neighbors-of-neighbors links: if A is similarto B , and B to C , then A is likely to be similar to C . This greedy procedure is often completed bya low-probability random exploration of arbitrary nodes to avoid local minima [22,29,143,144].
Some greedy KNN approaches have recently been found to perform particularly well [29,56]. These approaches tend, however, to induce a substantial number of similarity computa-tions, which directly impact their computing time. This point is illustrated in Figure 4.1 fortwo characteristic greedy KNN-graph algorithms, NNDescent [56], and HyRec [29]. The fig-ure shows the breakdown, in seconds, of the computing time of both algorithms on a smallWikipedia dataset [93] containing 6,110 users (i.e. nodes), and 2,381 items, using the standardcosine similarity metric. On average, both approaches spend more than 90% of their total exe-cution time repeatedly computing the similarities values (large checkered bars in the figure).
In this work, we propose to reduce this substantial cost by exploiting two observations thatapply to most item-based similarity metrics: first, two nodes must usually share some items to
1. Note that the problem of computing a complete KNN graph is related but different from that of answeringa sequence of KNN queries, a point we revisit when discussing related work.

KIFF 4-3
������
����������
�� �� �� �� �� �� �� �� �� �� ��� ��� ��� ��� ���
������������������������������������������������������������
��������
��
�
Figure 4.1 – State-of-the art greedy KNN-graph approaches spend over 90% of their computation time
computing similarity values (Wikipedia dataset).
be KNN neighbors; second, the more items two nodes have in common, the more likely they areto appear in each other’s KNN neighborhood. Based on these observations, our solution, KIFF
(K-nearest neighbor Impressively Fast and eFficient) first uses the node-item bipartite graph tocompute a coarse but very cheap approximation of the similarity between two users. KIFF thenuses this rough approximation to orient and to prune the search for a good KNN approximationusing a greedy procedure, rather than starting from a random graph as many greedy solutionsdo [22, 29, 143, 144]. It then refines this initial approximation in a greedy iterative procedurebased on the information extracted from the bipartite graph to iteratively refine this initial so-lution.
The result is a novel, fast and scalable KNN graph construction algorithm that produces avery close approximation of the real KNN.
4.2 Contribution: Fast and Efficient KNN Graph Construction
Greedy KNN-graph approaches have been shown to offer a promising alternative to more tra-ditional KNN-graph construction techniques, for instance based on Locality-Sensitive Hashing(LSH) or Recursive Lanczos Bisection (RLB) [39, 56, 67, 100]. Greedy approaches incrementallyimprove an approximation of the KNN graph, and thus avoid an exhaustive O(n2) search amongpotential KNN edges. They perform well for two main reasons: they are inherently parallel, andshow a strong memory locality. As shown in Figure 4.1, they tend, however, to induce a sub-stantial number of similarity computations, which directly impact their computing time.
We propose to reduce this time substantially by limiting the number of similarity values agreedy approach needs to compute. Our intuition is based on two simple observations: (i) al-most all similarity metrics used to construct KNN graphs (cosine, Jaccard’s coefficient, Adamic-Adar’s coefficient) return zero when two users 2 do not share any items ; and (ii) these metricsusually contain a term that grows with the number of items two users have in common.
Counting common items is typically much cheaper computationally than computing fullblown similarity metrics. This is because (i) common items are usually a first step of moreadvanced similarity metrics ; and (ii) most similarity metrics use floating point operations (di-visions, square roots, logarithms) that are much more expensive than the simple integer arith-metic involved in counting items. Our approach, therefore, employs a simple but powerfulstrategy: we use common item counts as a first coarse approximation of the similarity between
2. For ease of exposition, we will assume for the rest of the paper that nodes are users who have rated items.Our approach can, however, be applied to any type of nodes, as long as node similarity is computed from itemsassociated with these nodes.

4-4 CHAPTER 4
two users to prune the pairs of users who have no items in common. We then refine this ap-proximation by iterating over potential KNN neighbors in reverse order of this item count.
Directly comparing every pair of users to count common items would, however, scalepoorly. We, therefore, use an indirect method: we exploit the bipartite nature of the user-itemgraph (users are linked to items, and items to users) as an efficient structure to construct listsof users sharing items.
In depth, our approach (called KIFF) works in two phases, called the counting and therefinement phase. In the counting phase, KIFF preprocesses the user-item bipartite graph andbuilds a Ranked Candidate Set (RCS) for each user. Ranked candidate sets are ordered weightedsets that bring together users who share items, while counting how many items these usershave in common. Ranked candidate sets are used in the refinement phase to initiate, and theniteratively refine the KNN approximation of each user. We describe both phases informallyin the following on a small example, before providing a more formal presentation in the nextsection.
4.2.1 Counting Phase
The Users column of Figure 4.2 represents a toy user-item dataset in which the users ofan online social network are associated with the objects or activities that they have liked (theitems). Alice likes books and coffee, Bob coffee and cheese, and Carl and Dave like shop-ping. The items a user likes make up this user’s profile. Here, Alice’s profile (UPAlice) contains{book,coffee} (Label 1).
������ ������
������
����
�����
�����
������
������
��������
�������
������
���������
���������
��������������������
���� ������������������
���� ������������������
�������������������������������
����������
�����������������������
����
����
��
��
������
����
Figure 4.2 – KIFF exploits the bipartite nature of user-item datasets to pre-compute Ranked Candidate Sets(noted RC Su).
The role of the counting phase is to compute the ranked candidate set (RCS) of each user.Because Alice and Bob share one common item (coffee), KIFF should add each to the RCS ofthe other with a count of 1 3. To do so, KIFF first computes the item profiles (I P i ) of each item
3. We explain later on how we avoid the redundancy caused by this symmetry.

KIFF 4-5
(Label 2), i.e., the set of users who have liked a particular item i . For instance, here, the itemprofile of coffee (IPcoffee) contains Alice and Bob, while the item profile of book (IPbook) containsonly Alice. Item profiles reverse the node-to-item links (solid arrows) of the initial dataset intoitem-to-node edges (dashed arrows). Item profiles also provide a crude hashing procedure, inwhich users are binned into as many item profiles (which acts as buckets) as the items theypossess. As in LSH, these “buckets” are used to find KNN candidates.
Once the item profiles have been computed, KIFF constructs Alice’s ranked candidate set(RC SAlice) by navigating the bipartite graph induced by user and item profiles (Label 3) in orderto collect all users who share an item with Alice: here Bob. The count associated with Bob inRC SAlice (Label 4) is the number of common items between Bob and Alice (1 for coffee), i.e., thenumber of paths from Alice to Bob in the user-item graph.
4.2.2 Refinement Phase
Let’s now imagine that the dataset of Figure 4.2 has been enriched with new items, so thatAlice’s ranked candidate set ends up containing the following users:
RC SAlice = {(Bob,10), (Carl,9), (Dave,8), (Xavier,6), (Yann,3), ...}
Alice
Alice
current
neighborhoo
d
Re
pe
at
for
all u
se
rs u
nti
l #
chan
ges
≤ β
1
6
RCSAlice
3
...
top γ candidates
in RCSAlice by
item count
so
rte
d b
y ite
m c
ou
nt
sim(A,–) = 0.9 0.4 0.3 0.6 0.5
0.50.9 0.4 0.30.6
top k by sim
new
neighborhood
4
2
3
Carl
DaveBob
Xavier
Yann
B DC X Y
X YC B DCarl
YannXavier
Figure 4.3 – The pre-computed Ranked Candidate Sets are used in an iterative greedy process to construct
an approximation of the KNN.
KIFF first fills up Alice’s neighborhood with the top k users of her RCS, i.e., the k users withwhom Alice shares the most items: in our example Bob, Carl, and Dave (if we assume k = 3).These k users are removed from the RCS.

4-6 CHAPTER 4
KIFF then repeatedly applies the procedure depicted in Figure 4.3 to iteratively constructan approximation of Alice’s KNN, and works in 4 main steps (black circles in the figure). KIFF
first merges the current neighborhood of Alice ({Carl, Bob, Dave}, Label 1) with the current topγ neighbors found in Alice’s RCS (RC SAlice, Label 2). In the example, γ= 2, but we generally usea γ twice the value of k.
Alice’s current two top users in her RCS are Xavier with 6 items in common, and Yann with3 items. Both Xavier and Yann are removed from RC SAlice in the process, and added to Alice’scurrent neighborhood.
The union of Alice’s current neighborhood {Carl,Bob,Dave}, with the γ users extractedfrom RC SAlice ({Xavier,Yann}) form the potential new neighborhood of Alice in this iteration.From then on, the procedure is very similar to that of other greedy approaches [22, 29, 56, 143,144]: the potential new neighbors are ranked according to their similarity with Alice (Label 3),and the top-k users (here Carl, Xavier, and Yann) are selected as Alice’s new top-3 neighbors(Label 4). Note in this example how Yann, with a common item count of 3, has a higher similar-ity to Alice than Bob, with a common item count of 10. This is because a similarity metric (e.g.cosine, Jaccard’s coefficient) although it tends to be linked to the number shared items is notentirely determined by this count. This whole procedure is repeated for all users until the totalnumber of neighbors changes during an iteration is smaller than a fixed termination parameterβ.
4.2.3 Optimization and Discussion
In the basic procedure we have described, Ranked Candidate Sets are heavily redundant:if Bob is in Alice’s RCS, then Alice is in Bob’s. To limit the memory overhead of KIFF, and thecost of maintaining individual RCSs, we therefore use a pivot strategy: if Alice and Xavier haveitems in common, only the user with the lower ID (e.g., Alice) will store the other user in his/herRCS. The procedure of Figure 4.3 is adapted accordingly, so that, Alice is also considered as apotential neighbor for Xavier (and Yann).
In a second optimization, we simplify the initialization of neighborhoods at the start ofthe refinement phase: rather than handling this initialization as a special case, we treat it as astandard iteration that starts from empty neighborhoods that are filled up using the procedureof Figure 4.3.
In terms of computing time, KIFF trades off the cost of constructing item profiles andranked candidate sets (Counting Phase, Figure 4.2), for the ability to limit similarity compu-tations between users which (i) are guaranteed to have some items in common, and (ii) areconsidered in the reverse order of their shared item counts. In the example of Figure 4.3 forinstance, Carl and Dave will never be considered as potential neighbors for Alice because theydo not share any items. This trade-off pays off if item profiles (IPbook, IPcoffee) and ranked can-didate sets (RC SAlice, RC SBob) tend to be small.
This advantageous situation corresponds to datasets in which users rate few items froma large item set. These datasets are precisely those problematic for greedy KNN approachessuch as HyRec and NN-Descent [29, 56]. That is because greedy approaches start from an ini-tial random graph in which (i) initial neighbors are unlikely to be similar, and (ii) neighbors ofneighbors will also tend to show a low similarity, resulting in a slow convergence.
4.3 The Algorithm: KIFF
We now present formally the working of KIFF, starting with some notations (Section 4.3.1)and a formal problem definition (Section 4.3.2), before moving on to the algorithm itself (Sec-

KIFF 4-7
tions 4.3.3 and 4.3.4). As stated earlier, the presentation refers to users and items for the sake ofreadability, but KIFF is generally applicable to any kind of nodes associated with items, and canbe applied to datasets containing ratings.
4.3.1 Notations
We consider a set of users U = {u1,u2, ...,um} who have rated a set of items I = {i1, i2, ..., in},as captured by a rating function, ρ : U × I → R where R is the set of possible rating values.
A special case is when ratings are singled-valued, as in Figures 4.2 and 4.3. In this case,R is a singleton (e.g., R = {1}), and the function ρ simply captures whether or not a user u isassociated to an item i (i.e., whether i is in her profile): ρ(u, i ) is defined if u is associated withi , undefined otherwise.
We denote by UPu , the user profile of a user u. UPu is a dictionary that associates the itemsrated by u to their corresponding rating.
The rating function ρ defines a Labeled Bipartite Graph G = (V ,E ,ρ). The vertices of thisgraph are the users and items of the dataset V = (U ∪ I ). A rating by a user u of an item i isrepresented in G by an edge (u, i ) ∈U × I labeled by ρ(u, i ): E = {(u, i )|i ∈ UPu}.
4.3.2 Problem definition
Our objective is to approximate a KNN graph over U (noted GKNN) according to some sim-ilarity functions computed over user profiles. There are many choices available for similarityfunctions over dictionaries. We use the cosine similarity in the rest of the paper [140]. Formally,GKNN is a directed graph that connects each user u ∈ U with a set knnu of k other users thatmaximize the similarity function si m(u,−) :
knnu ∈ topkv∈U \{u}
fsim(UPu ,UPv ) ≡ KNNu (4.1)
where fsi m can be any similarity function over dictionaries and topk returns the set of k-tuplesof U excludingu that maximize the similarity function si m(u,−)
Because computing an exact KNN graph over a very large dataset can be computationallyexpensive, many scalable approaches seek to construct an approximate KNN graph �GKNN, i.e.,to find for each user u a set �knnu that is as close as possible to an exact KNN set. The qualityof this approximation is typically measured in terms of recall, i.e., the ratio of exact KNN neigh-bors in the current KNN approximation. If the exact KNN neighborhood of each user knnu isunique, the recall for a user u is simply defined as:
r ecal l �GKNN(u) =
|�knnu ∩knnu |
k(4.2)
In the more common case where knnu is not unique, r ecal l �GKNN(u) becomes
r ecal l �GKNN(u) = max
knnu∈KNNu
�|�knnu ∩knnu |
k
�(4.3)
where KNNu denotes the topk expression of Equation (4.1). (Because |�knnu | = |knnu | = k inthis particular case, precision, a second metric commonly considered in retrieval and recom-mendation problems is equal to recall here and not discussed further.)
This leads us to define the overall recall of an approximate KNN graph �GKNN as the averagerecall over all users:
r ecal l ( �GKNN) = Eu∈U
r ecal l �GKNN(u) (4.4)

4-8 CHAPTER 4
where E represents the expectation operator, i.e., the mean of an expression over a given do-main.
Given a dataset D = (U , I ,ρ) and an item-based similarity function fsim, our goal is toconstruct �GKNN for D and fsim in the shortest time with the highest recall.
4.3.3 KIFF
The pseudo code of KIFF is shown in Algorithm 20, which describes both the counting
(lines 1-5) and refinement phases (lines 7-20). The counting phase constructs the item profiles(IPi )i∈I and the ranked candidate sets (RC Su)u∈U of the dataset. The item profiles reverse theuser-item edges found in the bipartite graph G :
IPi ≡ {u ∈U |i ∈ UPu},∀i ∈ I
(dashed arrows in Figure 4.2) and are computed while the dataset is being loaded (lines 1-2).The ranked candidate sets are computed using the multiset union � (lines 4- 5). RC Su
only contains users whose ids are higher than that of u (constraint v > u at line 5), as discussedin Section 4.2.3.
In terms of implementation, the ranked candidate sets RC Su are maintained as explicitmultisets only while they are being constructed (line 5). Once they are completed, they aresorted according to the multiplicity of their elements, and transformed into plain ordered lists(i.e., without multiplicity information), since only this order is used in the refinement phase(line 11). This stripping procedure lowers KIFF’s memory overhead, and improves the perfor-mance of the refinement phase.
The refinement phase (lines 7-20) exploits the ranked candidate sets RC Su to iterativelyconstruct an approximation of the dataset’s KNN. In each iteration (repeat-until loop, lines 8-14), KIFF loops through each user u (line 10), and removes the topγusers from RC Su (operationtop-pop, line 11). The returned users are stored in the variable cs. They correspond to the γ
users with higher ids than u, who have the most shared items with u among those not yetconsidered in earlier iterations.
In the inner for loop (lines 12-14), each of these top users v is considered as a potentialneighbor for u, and reciprocally, u is considered as a potential neighbor for v . This symmetryis required because we have truncated ranked candidate sets to users with higher ids at line 5.
Neighborhoods are updated in the function UPDATENN (lines 18-20). The current approx-imation �knnu of each user u’s neighborhood is stored as a heap of maximum size k, with thesimilarity between u and its neighbors used as priority.
The number of changes made over an iteration are tracked in the variable c (lines 9 and 14).The algorithm stops when the average number of changes per user during an iteration hasdropped below a predefined threshold β (line 14).

KIFF 4-9
Algorithm 1: KIFF
Input: dataset U , user profiles (UPu)u∈U , similarity fsim(), parameter k, termination β,parameter γ
Output: (�knnu)u∈U an approximated KNN
�Counting Phase: building the Ranked Candidate Sets
1 for u ∈U ∧ i ∈ UPu do »Executed at loading time
2 IPi ← IPi ∪ {u} »IPi initialized to ∅
3 end4 for u ∈U do5 RC Su ←
�i∈UPu
{v ∈ IPi |v > u} »Multiset union
6 end
�Refinement Phase: greedy convergence
7 �knnu ←∅,∀u ∈U »Initialize the KNN heaps (size k)
8 repeat9 c ← 0 »Counts changes during one iteration
10 for u ∈U do11 cs ← top-pop(RC Su ,γ) »Top γ users from RC Su
12 for v ∈ cs do »By construction v > u (l. 5)
13 s ← fsim(U Pu ,U Pv )14 c ← c +UPDATENN(u, v, s)+UPDATENN(v,u, s)
15 end
16 end
17 until c|U |
<β
18 Function UPDATENN(user u, user v, similarity s) is
19 update �knnu heap with (v, s)20 return 1 if changed, or 0 if not
4.3.4 Convergence and discussion
In the refinement phase, the size of the ranked candidate sets (RC Su) decreases strictlyuntil the sets possibly become empty. This behavior guarantees that the number of similar-ity computations is limited by the sizes of the the ranked candidate sets, and cannot exceed�
u∈U |RC Su |.The parameterγ andβ control how aggressively KIFF approximates an optimal KNN graph.
One extreme case is when γ is chosen as ∞. In this case, all ranked candidate sets are exhaustedduring the first iteration of the repeat-until loop (lines 8-14). When this happens, the result-ing KNN approximation ( ˆknnu)u∈U is optimal, assuming the similarity function fsim fulfills thefollowing two properties:
∀A,B ∈ (I �→ R) : A∩B =∅⇒ fsim(A,B) = 0 (4.5)
∀A,B ∈ (I �→ R) : A∩B �=∅⇒ fsim(A,B) ≥ 0 (4.6)

4-10 CHAPTER 4
These two properties, which are fulfilled by most item-based similarity metrics, such as cosine
similarity applied to positive ratings or Jaccard’s coefficient, ensure that only users with at leastone shared item can improve each other’s KNN neighborhood. As a result KIFF does not missout any potential good candidate by limiting and pruning the search to the ranked candidatesets (RC Su)u∈U , whose purpose is precisely to exclude pairs of users with no items in commonfrom being considered as potential neighbors.
4.4 Experimental Setup
We evaluate KIFF by comparing it with two other state-of-the art approaches on a number ofrepresentative datasets. As we have mentioned before, there are many state-of-the art tech-niques and algorithms but we chose these, i.e., NN-Descent and HyRec because of two mainreasons. 1) Their approaches are conceptually comparable to KIFFand 2) They already makea vivid comparison with many other state-of-the art approaches and outperform them. Thus,comparing to NN-Descent and HyRec and having a performance better than them implicitlyimplies that KIFFperforms better than others as well.We have implemented KIFF and its competitors in Java 4 and execute them on a single machine.All implementations are multi-threaded to parallelize the treatment of individual users. Boththe source code of all implementations and the datasets, are publicly available [1] on-line. Ourexperiments were conducted on a commodity server running a 64-bit Linux with an Intel XeonE3-1246 v3, a 3.5GHz quad core processor totalling 8 hardware threads, with 32 GB of memoryand a 256Gb PCI Express SSD.
4.4.1 Datasets
We use four publicly available user-item datasets [93] for our evaluation. These datasets arerepresentative of a wide range of domains and applications, including bibliographic collections(Arxiv and DBLP), voting systems (Wikipedia) and on-line social networks with geo-locationinformation (Gowalla). Some key properties of these four datasets are presented in Table 4.1,including the number of users (|U |), number of items (|I |), and number of ratings (|E |, i.e., thenumber of weighted edges in the user-item bipartite graph). The density is the percentage ofedges present in the dataset over a complete bipartite graph, i.e., a graph in which each userwould have rated every item : densi t y = |E |÷ (|U |× |I |).
Dataset #Users |U | #Items |I | #Ratings |E | Density Avg. |UPu | Avg. |IPi |
Wikipedia 6,110 2,381 103,689 0.7127% 16.9 43.5Arxiv 18,772 18,772 396,160 0.1124% 21.1 21.1Gowalla 107,092 1,280,969 3,981,334 0.0029% 37.1 3.1DBLP 715,610 1,401,494 11,755,605 0.0011% 16.4 8.3
Table 4.1 – Dataset description (All datasets are available on-line [1])
As stated earlier, Table 4.1 summarizes the characteristics of the datasets we used in ourexperiments, and allow us to evaluate KIFF with different scalability and sparsity properties.Density is an important characteristic of a dataset that might significantly impact the time re-quired to compute the KNN.
4. The public sources of NN-Descent [56] are only available in C++. We have therefore, re-implemented thepublished algorithm in Java.

KIFF 4-11
0
0.2
0.4
0.6
0.8
1
1 10 100 1000
P(|
UP
|≥x)
User profile size
ArxivWikipedia
GowallaDBLP
(a) Size of the users profile
0
0.2
0.4
0.6
0.8
1
1 10 100 1000
P(|
IP|≥
x)
Item profile size
ArxivWikipedia
GowallaDBLP
(b) Size of the items profile
Figure 4.4 – CCDF of the size of the user and item profiles, top and bottom respectively. Long-tailed curves
show that most of the users have few ratings.
Figure 4.4a and 4.4b show the Complementary Cumulative Distribution Functions (CCDF) ofthe sizes of user and item profiles respectively, in these datasets. The long-tailed curves areconsistent with earlier observation [35,36,108] and show that most users have very few ratings.For instance, 50% of users in the Arxiv dataset have less than 10 ratings. In the following webriefly present each dataset.
4.4.1.1 Wikipedia
Wikipedia is the well-known collaborative and free encyclopedia edited by volunteers. Thepromotion of a user to the role of administrator involves a consultation of other Wikipedia edi-

4-12 CHAPTER 4
tors, who indicate whether they support a candidate or not. (This consultation is not, accordingto Wikipedia, exactly a vote.) Our dataset contains the complete Wikipedia consultation datafrom the origin of Wikipedia till January 2008 [92]. Nodes in the network represent wikipediausers and a directed edge from node i to node j represents that user i voted on user j. A positivevote of a Wikipedia editor (a user) for a candidate (an item) is encoded as a rating of 1, therebyresulting in binary ratings. User profiles consist of binary ratings associated to this voting net-work.
4.4.1.2 Gowalla
Gowalla was a location-based social networking website, acquired by Facebook in 2011, inwhich users could share their current location. This dataset consists of the check-ins of a subsetof Gowalla users from February 2009 to October 2010 [44]. The profile of each user contains thelist of locations (items) associated to her check-ins with a rating reflecting the number of timethe location was visited.
4.4.1.3 DBLP
The DBLP computer science bibliography provides a comprehensive list of research pa-pers in computer science. This dataset consists of the co-authorship network where two au-thors are connected if they have published a paper together. Our dataset is a snapshot ofDBLP collected in September 2015 and contains information about users with at least five co-publications 5. The profiles of the authors contain the list of co-authors, where the ratings re-flect the number of publications they co-authored.
4.4.2 Competitors
KIFF relies on a preprocessing phase (the counting phase) that exploits the user-item bi-partite graph to provide a first approximation of the KNN graph. This unique design placesKIFF in a category of its own, which makes it difficult to choose obvious competitors to com-pare KIFF against. Since the refinement phase of KIFF relies on techniques similar to those usedin greedy-based KNN construction algorithms, we picked two such recent state-of-the art ap-proaches as comparison baselines: NN-Descent [56] (shown to be more efficient than LSH [100]and RLB [39] in [56]), and Hyrec [28].
As we have mentioned in the Section 4.1, the greedy-based approaches (for example, NN-Descent and HyRec) rely on a simple heuristic: a neighbor of a neighbor is also likely to be aneighbor. More precisely, if we have an approximation of the KNN for each node at any point oftime, we can improve that approximation through a greedy search by exploring the neighbor-hood of its direct neighbors while keeping the most similar ones, repeating this process untilwe converge to the ideal neighbors. Though KIFF also uses a greedy-based approach to refinethe KNN of a node, it completely differs from these state-of-the art approaches as it uses a well-designed initial neighborhood construction phase as compared to randomly chosen neighbor-hood. The combination of this preprocessing phase, exploring the bipartite nature of a dataset,with the incremental greedy-based KNN refinement makes KIFF, a new revolutionary approachfor rapid and efficient KNN graph construction. Though based on the same fundamental ideaof starting from a random neighborhood, the approaches differ in the way the approximationconverges to the ideal KNN and as a consequence, they also differ in the recall and other com-putational costs.
5. Note that this snapshot is different from that used in NN-Descent’s original evaluation, which we were notable to reconstruct from the information provided in [56], in spite of our best efforts.

KIFF 4-13
NN-Descent [56] favors node locality to iteratively converge to a close approximation ofan exact KNN. Starting from a random graph, NN-Descent iteratively refines the neighborhoodof a user by considering at each iteration a candidate set composed of the direct neighbor-hood of the current bidirectional neighbors (both in-coming and out-going neighbors). Toavoid repeated similarity computations, NN-Descent uses a system of flags to only considernew neighbors-of-neighbors during each iteration. Since such a candidate set may still be verylarge, only a sample might be considered to speed-up the process. NN-Descent also uses a pivotstrategy similar to ours to ensure that the similarity computation between a pair of users is per-formed only once, by iterating on both the in-coming and out-going neighbors of the currentpivot user.
HyRec [28] is a recommendation framework which relies on an approach similar to NN-Descent but distributes the KNN graph construction onto the browsers of users to improve thescalability of the KNN computation. Similar to NN-Descent, HyRec relies on node locality toiteratively converge to an accurate KNN from a random graph. During each iteration, HyRecconsiders the neighbors of neighbors of each user, as well as a set of few random users to avoida local minimum as in [144]. In this approach, a parameter r is used to define the number ofrandom users considered in the candidate set. For a fair comparison, although not mentionedin [28], we implement the same pivot mechanism as in NN-Descent and the early terminationof KIFF.
4.4.3 Metrics
We assess the quality of the produced KNN graphs by measuring the recall of the graphsreturned by each approach, as defined in Section 4.3.2. For each dataset, an ideal KNN is con-structed using a brute force approach. The recall is then obtained by comparing the similarityvalues of the ideal neighborhoods and those of the approximated ones.
We measure the computational cost of each solution using two metrics: the scan rate, andthe computation time. The scan rate measures the number of similarity evaluations requiredto produce the final approximated KNN graph, normalized and expressed as a percentage of allpossible KNN edges.
scanrate =#(similarity evaluations)
|U |× (|U |−1)/2
Definition 8 (Scan Rate)
The computational time is the wall-clock time required to construct the KNN graph, exclud-ing the JVM’s start-up time, but including the loading time of the graph from persistent stor-age (i.e., measured from the JVM’s entry into the main method). We also separately measurethe time spent by each solution for different activities of each approach, namely preprocessing
(loading the dataset, building user profiles, and in the case of KIFF building item profiles andperforming the counting phase), candidate selection (constructing candidate neighborhoods,using the RCS sets in KIFF and using neighbor-of-neighbor links in Hyrec and NN-Descent) andsimilarity computation.
4.4.4 Default parameters
In our evalations, for the sake of simplicity we use the cosine similarity metric [140] butKIFF is designed to perform consistently regardless of the similarity metric considered. For a

4-14 CHAPTER 4
fair comparison, we set the parameters of each approach to their default values [29, 56]. Moreprecisely, we set k = 20 (except for DBLP where we use k = 50), and use an early terminationparameter β at 0.001 for KIFF. For NN-Descent, we report results without sampling (as in theoriginal publication), and we consider γ = 2k for KIFF. For HyRec, by default, we considerno random nodes in the candidate set (r = 0). Though not shown in the evaluation for spacereasons, random nodes cause random memory accesses and drastically increase the wall-time(three times longer on average, with r = 5) while only slightly improving the recall (4% on aver-age).
4.5 Evaluation
We now present the results obtained by KIFF, HyRec and NN-Descent under the experimentalsetup of the previous section. Our results show that KIFF efficiently converges to an approx-imate KNN graph, while outperforming its competitors both in terms of recall and computa-tion time. We also assess the sensitivity of the three approaches to k and to the density of thedatasets. We also evaluate the impact of γ on KIFF.
4.5.1 Performance Comparison
Table 4.2 shows the recall, wall-time, scan rate and number of iterations of NN-Descent,HyRec and KIFF on the four datasets considered for evaluation. The best recall and wall timevalues are highlighted in bold. The lines marked “KIFF’s Gain” show, for each dataset, the im-provement in recall and the speed up achieved by KIFF over its competitors (averaged overNN-Descent and HyRec). These gains, averaged over all datasets, are summarized in Table 4.3.
Approach recall wall-time (s) scan rate #iter.
da
tase
ts�
��� A
rxiv NN-Descent 0.95 41.8 17.6% 9
HyRec 0.90 38.6 16.0% 12KIFF 0.99 10.7 2.5% 36
KIFF’s Gain +0.06 ×3.7
Wik
iped
ia NN-Descent 0.97 13.1 51.69% 7HyRec 0.95 9.4 44.64% 8KIFF 0.99 4.4 7.37% 22
KIFF’s Gain +0.03 ×2.5
Gow
alla NN-Descent 0.69 307.9 3.67% 16
HyRec 0.56 253.2 2.69% 22KIFF 0.99 146.6 0.84% 115
KIFF’s Gain +0.36 ×1.9
DB
LP NN-Descent 0.78 10,890.2 3.08% 19HyRec 0.63 8,829.9 2.37% 26KIFF 0.99 568.0 0.07% 33
KIFF’s Gain +0.28 ×17.3
Table 4.2 – Overall perf. of NN-Descent,HyRec, & KIFF
These results show that KIFF consistently outperforms NN-Descent and HyRec in termsof recall and wall-time across all datasets. While KIFF consistently achieves a recall of 0.99, therecall of NN-Descent and HyRec ranges from 0.56 (HyRec on Gowalla) to 0.97 (NN-Descent on

KIFF 4-15
Wikipedia), with an average of 0.85 for NN-Descent and 0.76 for HyRec. The higher recall valuesobtained by KIFF validate the use of ranked candidate sets which provide KIFF with a clear ad-vantage in terms of KNN quality over the initial random graph used by HyRec and NN-Descent.
KIFF’s gainCompetitor speed-up ΔrecallNN-Descent ×15.42 +0.14HyRec ×12.51 +0.23
Average ×13.97 +0.19
Table 4.3 – Average speed-up and recall gain of KIFF
DatasetWall-time (ms)
Δ(ms)%age
(U Pu) (U Pu)&(I Pi ) total timeArxiv 135 185 50 0.5%
Wikipedia 59 69 10 0.2%Gowalla 2,354 5,136 2,782 1.9%
DBLP 7,492 12,996 5,504 1.0%
Table 4.4 – Overhead of item profile construction in KIFF
The results show that the scan rate (number of similarity computations required to con-verge) for KIFF is 7 and 6 times lower than that of NN-Descent and HyRec respectively. As KIFF
requires lesser similarity computations, it is also faster than its competitors. The wall-time val-ues of KIFF confirm our intuition that the counting phase of KIFF, by preprocessing the bipartitegraph of the dataset, results in relatively faster convergence to an approximate knn graph. Thespeed-up achieved can be substantial: for instance, KIFF is 17 times faster than Hyrec and NN-Descent on the DBLP dataset, and 14 faster on average (Table 4.3).
The reason why KIFF outperforms its competitors in terms of wall-time is visible in Fig-ure 4.5, which charts the breakdown of the computation time of KIFF, NN-Descent, and HyRecinto the three types of activities introduced in Section 4.4.3: (1) preprocessing (which includesKIFF’s counting phase); (2) candidate selection; and (3) similarity computations. The figureshows that the counting phase of KNN indeed introduces some overhead (ranging from 10.01%to 14.74% of KIFF’s overall computation time), but that this overhead is largely compensated bya much faster convergence, with fewer similarity computations, and lesser time spent on can-didate selection.
In the following, we investigate in more detail how KIFF exploits ranked candidate setsto converge faster: we first analyze the overhead of KIFF’s preprocessing and the cost of com-puting RCSs; we then discuss the properties of the resulting RCSs; and we finally compare theconvergence of KIFF’s refinement phase with the convergence of NN-Descent and HyRec.

4-16 CHAPTER 4
0
10
20
30
40
50
KIFF NNDesc HyRec
Tim
e (
s)
PreprocessingSimilarity computation
Candidate selection
(a) Arxiv
0
5
10
15
KIFF NNDesc HyRec
Tim
e (
s)
PreprocessingSimilarity computation
Candidate selection
(b) Wikipedia

KIFF 4-17
0
50
100
150
200
250
300
KIFF NNDesc HyRec
Tim
e (
s)
PreprocessingSimilarity computation
Candidate selection
(c) Gowalla
0
2000
4000
6000
8000
10000
12000
KIFF NNDesc HyRec
Tim
e (
s)
PreprocessingSimilarity computation
Candidate selection
(d) DBLP
Figure 4.5 – Although KIFF must pay higher preprocessing costs to constructs its Ranked Candidate Sets,
this overhead is largely balanced out by a smaller number of similarity computations due to a much faster
convergence compared to Hyrec and NN-Descent.

4-18 CHAPTER 4
4.5.1.1 Overhead of KIFF’s preprocessing
KIFF’s preprocessing essentially comprises its counting phase, which computes item pro-
files, and Ranked Candidate Sets (RCSs). In KIFF, item profiles are built when the user profiles(required by all approaches) are created from the input data stream. Table 4.4 compares thetime taken to construct user profiles only ((U P ) column) to that taken to construct both userand item profiles simultaneously, and contrasts the difference between the two (Δ column)with the overall running time of KIFF (last column), for all data sets. The table shows that theoverhead caused by item profiles only represents a very small fraction of the total running timeof KIFF across all datasets (at most 1.9% on Gowalla).
The time taken to compute ranked candidate sets (RC Ss) is shown in Table 4.5, along withsome additional statistics (which we return to below). Constructing RC Ss takes substantiallymore time than constructing item profiles, and makes up, in effect, most of KIFF’s preprocessingoverhead, amounting to up to 13.5% of KIFF’s overall running time (with Arxiv).
DatasetRCS const. %age avg. max RCS
(ms) total time |RCS| scan rateArxiv 1,404 13.1% 247.0 2.63%
Wikipedia 465 10.6% 228.7 7.48%Gowalla 12,255 8.4% 458.1 0.85%
DBLP 42,829 7.5% 267.8 0.07%
Table 4.5 – Overhead of RC S construction & statistics ( KIFF)
4.5.1.2 Properties of the resulting RCSs
The extent to which KIFF is able to recoup this overhead strongly depends on the capacity ofthe resulting RCSs to limit similarity computations by pruning pairs of users that have no itemsin common. This pruning effect is directly linked to the size of RCSs: short RCSs (in compar-ison to the total number of users in the dataset) eliminate many similarity computations andhelp accelerate KIFF’s refinement phase. To shed light on this aspect, Table 4.5 shows the aver-age lengths of the RCSs computed for each dataset and the corresponding maximum scan rateinduced by these RCSs
max_scan =|U |× |RC S|
12 ×|U |× (|U |−1)
= 2×|RC S|
|U |−1
i.e., the scan rate one would obtain by iterating through the entire RCSs in the refinement phase(γ=∞ in Algorithm 20). We note that this maximum scan rate is in fact very close to the actualscan rate reported in Table 4.2: the value of the termination parameter β chosen for KIFF (0.001)causes most RCSs to be fully iterated through, which explains the high recall values obtainedby KIFF.
This phenomenon is confirmed by Table 4.6, and Figures 4.6 and 4.7. Table 4.6 repeats thenumber of iterations executed by KIFF from Table 4.2. This number corresponds to a maximumnumber of entries considered by KIFF from each RCS, which we note |RC S|cut (second column,this is simply #iters×γ): RCSs which are smaller that this size are fully iterated through, whilelarger RCSs are truncated. The percentage of users with truncated RCSs for each dataset isshown in the last column, and illustrated graphically using vertical bars in Figure 4.6 (whichshows the CCDF of RCS sizes).

KIFF 4-19
Only a minority of users experience truncated RCSs, but this minority can be important, asin the case of Wikipedia, where 16.24% of users are not compared with all their candidate KNNneighbors. This truncation could potentially hurt KIFF’s recall if too many ideal KNN neighborsare found towards the tail of the truncated RCSs. Figure 4.7 shows that this is not the case. (Weonly show the Wikipedia dataset due to space reasons.) Each point in the figure is a RCS witha size larger that Wikipedia’s truncation value (440), which is plotted according to its size andSpearman’s correlation between the RCS (ordered according to common item counts) and thesame list of nodes sorted following either Jaccard’s coefficient or the cosine similarity metrics.The figure shows that Spearman’s correlation coefficient is generally high (on average 0.60 forJaccard, and 0.63 for cosine) for truncated RCSs, and increases with RCSs sizes, suggesting thatthe approximation provided by the counting phase does not generally exclude good candidatesfrom being considered as potential neighbors.
Dataset #iters |RC S|cut%user |RC Su |
> |RC S|cut
Arxiv 36 720 9.57%Wikipedia 22 440 16.24%
Gowalla 115 2300 4.82%DBLP 33 660 10.32%
Table 4.6 – Impact of KIFF’s termination mechanism
0
0.1
0.2
0.3
0.4
0.5
0.6
0.7
0.8
0.9
1
1 10 100 1000 10000
P(|
RC
S|≥
x)
RCS size
ArxivWikipedia
GowallaDBLP
Figure 4.6 – CCDF of |RC S|. The vertical bars shows the cut-off sizes enforced by KIFF’s termination mech-
anism (also shown in Table 4.6)
The quality of the RCSs is finally further illustrated by Table 4.7, which shows the recallobtained by KIFF without any convergence (β =∞ in Algorithm 20), i.e., when using the top kusers of each RCS as a KNN graph approximation. Although the resulting recall varies widelyfrom 0.54 (Wikipedia) to 0.82 (Arxiv), these values are much larger than those obtained through

4-20 CHAPTER 4
��
����
����
����
����
��
���� ���� ���� ����� ����� ����� �����
���������������������
�
��������
�������������
Figure 4.7 – Correlation between the rank of nodes in RC Ss and the cosine and Jaccard metrics for users
with |RC Su | above |RC S|cut = 440 for Wikipedia.
a random initial graph (which peaks at 0.15 for Gowalla), as used by traditional greedy ap-proaches, and illustrates the immediate benefit obtained by KIFF from its counting phase.
Recall
Dataset Top k from RC S RandomArxiv 0.82 0.08
Wikipedia 0.54 0.01Gowalla 0.55 0.15
DBLP 0.79 0.09
Table 4.7 – Impact of initialization method on initial recall
4.5.1.3 Convergence
Although the incremental convergence of KIFF derives its motivation from greedy-basedapproaches, its convergence pattern is clearly different from that of its greedy-based competi-tors, NN-Descent and HyRec, as shown in Figure 4.8. Figure 4.8a charts the quality of theKNN graph under construction as a function of scan rate for the three approaches on the Arxivdataset. As indicated in Tables 4.2 and 4.7, KIFF immediately starts with a high recall value(0.82), and terminates after a very small scanrate (2.5%). By contrast, HyRec and NN-Descentstart from a low recall value (0.08) induced by their random initial graph, and only converge at amuch higher scan rate (resp. 16.0% and 17.6%). (KIFF shows similar behavior for the remainingdatasets, which are not included here due to space reasons.) The rapid convergence of KIFF canbe attributed to the effective pruning induced by RC Ss that leads to a reduction in similarity

KIFF 4-21
computations. The slow convergence of NN-Descent and HyRec by contrast can be credited totheir random initial start and their transitive convergence mechanisms (exploiting neighbors-of-neighbors links), which requires more computational resources to converge to a good KNNgraph approximation.
0
0.1
0.2
0.3
0.4
0.5
0.6
0.7
0.8
0.9
1
0 0.05 0.1 0.15 0.2
Recall
Scan Rate
KIFFNNDescent
HyRec
(a) scan rate vs recall
0
5
10
15
20
25
30
35
0 0.05 0.1 0.15 0.2
Avera
ge g
raph u
pdate
s
Scan Rate
KIFFNN-Descent
HyRec
(b) scan rate vs updates
Figure 4.8 – KIFF quickly provides an accurate KNN approximation by using relevant candidates compared
to competitor approaches (Arxiv dataset).

4-22 CHAPTER 4
The effect of the convergence procedure (RCSs vs. neighbors-of-neighbors links) on the conver-gence speed is visible in Figure 4.8b, which shows the average number of updates performedon the KNN graph during each iteration. We observe that the use of RCSs to select potentialcandidates allows KIFF to perform many relevant updates to the KNN graph during its first iter-ation. The number of updates performed in subsequent iterations decreases rapidly in the caseof KIFF, reflecting the fact that RCSs are ordered according to decreasing common item counts.This property in turn leads to a much faster convergence. In contrast, NN-Descent and HyRecpresent a three-step convergence pattern. First, the random nature of the initial graph signif-icantly increases the number of beneficial updates during the first few iterations. Recall onlyimproves slightly, however, during this first step (Figure 4.8a). During the second step, moreand more potential KNN candidates are encountered, leading to an improved approximationwith a better recall. Finally, during the third phase, the last iterations before convergence, fewerupdates are performed as good potential candidates become harder to discover in the graph, afact reflected in a slowly increasing recall till convergence.
4.5.2 Sensitivity analysis: k, γ and density
4.5.2.1 Impact of parameter k
The number of similarity computations NN-Descent and HyRec execute is closely relatedto the size of the neighborhoods they maintain (parameter k). This is because both approachesleverage neighbors-of-neighbors relationships to improve their KNN approximation. Largeneighborhoods facilitates this process by offering more options for convergence, at the price oflonger computation times, due to the overheads of managing larger data structures, and com-puting more similarities. Smaller neighborhoods constrain their search for potential neighbors.As a result, smaller values of k should reduce the number of similarity values both approachesneed to compute, and lead to better computation times. There is however, a trade-off, as toosmall neighborhoods might disrupt the greedy convergence of NN-Descent and HyRec andyield degraded KNN results.
Contrary to NN-Descent and HyRec, KIFF does not use its intermediate neighborhoods(the variables ˆknnu of Algorithm 20) to drive its convergence, but relies instead on precom-puted ranked candidate sets (RC Su). One might therefore expect its computation time andrecall to be less impacted by lower k values.
To better understand how KIFF and its two competitors behave for smaller values of k, Ta-ble 4.8 presents their performance in terms of computation time, recall, and scan rate when welower k from 20 to 10 (from 50 to 20 for DBLP) on the same datasets as Table 4.2. These resultsconfirm that a smaller k does lead to substantial gains in computation times for NN-Descentand HyRec (speed-up ratios ranging from 2.35 to 4.07), with a less pronounced improvementfor KIFF (speed-up varying from 1.09 to 1.36). Simultaneously, however, the recall values of NN-Descent and HyRec degrade substantially (with losses varying from 11% to 35%), while those ofKIFF remain stable. Across the board, KIFF continues to outperform its competitors in terms ofcomputation times and recall on 3 datasets out of 4 (Arxiv, Wikipedia, and DBLP). On Gowalla,NN-Descent and HyRec have become faster, but with much degraded recalls (0.35 and 0.26),that can no longer compete with that of KIFF (0.99).
It is worth noting that the time spent in similarity computations depicted in Figure 4.5depends linearly on the complexity of the similarity metric used to compute the KNN graph.Therefore, using a metric requiring twice as long to evaluate the similarity between two profileswill double the global time of similarity computation, and will further increase the benefits ofour solution compared to NN-Descent and HyRec.

KIFF 4-23
Approach recall wall-time (s) scan rated
ata
sets
���
� Arx
iv NN-Descent 0.74 (-0.20) 17.7 (÷2.36) 5.49% (-12.1%)
HyRec 0.55 (-0.34) 16.4 (÷2.35) 4.66% (-11.3%)
KIFF 0.99 (=) 7.8 (÷1.36) 1.97% (-0.4%)
KIFF’s Gain +0.34 (+0.28) ×2.18 (÷1.70)
Wik
iped
ia NN-Descent 0.86 (-0.10) 5.3 (÷2.46) 16.39% (-35.3%)
HyRec 0.74 (-0.20) 3.6 (÷2.55) 13.98% (-30.6%)
KIFF 0.99 (=) 3.2 (÷1.36) 6.86% (-0.5%)
KIFF’s Gain +0.19 (+0.16) ×1.39 (÷1.80)
Gow
alla NN-Descent 0.35 (-0.33) 117.8 (÷2.61) 0.89% (-2.7%)
HyRec 0.26 (-0.29) 98.7 (÷2.70) 0.61% (-2.0%)
KIFF 0.99 (=) 120.4 (÷1.21) 0.73% (-0.1%)
KIFF’s Gain +0.68 (+0.32) ×0.89 (÷2.13)
DB
LP NN-Descent 0.20 (-0.57) 2,673.4 (÷4.07) 0.43% (-2.6%)
HyRec 0.11 (-0.52) 2,272.5 (÷3.88) 0.26% (-2.1%)
KIFF 0.99 (=) 516.6 (÷1.09) 0.07% (=)
KIFF’s Gain +0.83 (+0.55) ×4.78 (÷3.62)
Evolution of wall-time, recall, and scan rate when reducing k from 20 to 10 (DBLP: 50 to 20). The numbers inbrackets show the change w.r.t to the results with k = 10 (DBLP:k = 20) presented in Tab. 4.2. KIFF shows littlesensitivity to the value of k, with slightly lower computation times, and identical recall values. By contrast NN-Descent and HyRec are strongly impacted, with much reduced wall-times accompanied by degraded recall values.KIFF remains the best performing solution across the board.
Table 4.8 – Impact of k on recall and wall-time (k=10, DBLP: k=20)
4.5.2.2 Impact of parameter γ
The parameter γ in KIFF defines the number of elements removed from the ranked can-didate sets of each user and considered as potential neighbors at each iteration. If the rankedcandidate set of user u, RC Su , contains less than γ elements, only these elements are consid-ered and RC Su becomes empty. Consequently, γ impacts the number of similarity computa-tions performed at each iteration which is bound by |u|γ. The number of considered neighborswhich become actual neighbors over an iteration are tracked (variable c in Algorithm 1) andKIFF stops if the average number of changes is bellow a predefined termination threshold β.
On the one hand, the parameter γ impacts the number of iterations that KIFF needs toconverge. A larger γ will reduce the number of iterations, in contrast a smaller γ will force KIFF
to perform more iterations to converge. While the number of iterations does not impact thescan rate which depends on the global number of similarity computations actually performed,a too small γ will tend to increase the wall-time due to iteration overheads as shown in Figure4.9 which depicts the wall-time of KIFF according to the value of γ. On the other hand, at thelast iteration where c
|u|< β, the probability to perform more similarity computations than ac-
tually required to reach the termination threshold is a function of γ. As a consequence, a toolarge γ tends to increase the scan rate. However, as depicted in Figure 4.9, the impact of γ onthe wall-time remains low.

4-24 CHAPTER 4
600 700 800 900
1000
0 10 20 30 40 50 60 70 80Wall-
tim
e (s
)
γ
DBLP
160 180 200 220
0 10 20 30 40 50 60 70 80Wall-
tim
e (s
)
γ
Gowalla
(a)
2
4
6
8
10
12
14
16
18
0 10 20 30 40 50 60 70 80
Wall-
tim
e (s
)
γ
ArxivWikipedia
(b)
Figure 4.9 – The impact of γ on the wall-time of KIFF remains low.

KIFF 4-25
Although we cannot fully investigate its impact for space reasons, let us note for complete-ness that the termination threshold β also has an important influence on the performance ofKIFF. The value of β represents a trade-off between recall and scan rate (and hence wall-time).For instance, on the Arxiv dataset, increasing β hundredfold to 0.1 (from 0.001) causes KIFF
to take 36% less time to converge by halving its scan rate to convergence. Recall is mildly im-pacted, being reduced by 0.01, down to 0.98.
4.5.2.3 Impact of density
KIFF is designed to work well on datasets with small user and item profiles, relatively tothe total number of items and users. This situation typically corresponds to a low density of theassociated bipartite graph. The datasets we have considered (Table 4.1) have this property, withdensity values remaining below 1% (our highest density is 0.71% for the Wikipedi dataset). Forcompleteness’ sake, we investigate in this last evaluation, how KIFF behaves on denser datasets,and contrast its performance to that of NN-Descent. For this comparison, we derive from thesame underlying dataset, a family of bipartite graphs with different density characteristics.
We start from a dataset from the MovieLens (ML) repository [13]. MovieLens providesmovie-rating data collected on the ML recommender website over a 7-month period. ML rat-ings range over a 5-star scale, with half-star increments. The ML dataset we use (called ML-1in the following) contains 6,040 users and 3,706 items (movies), in which each user has at leastmade 20 ratings, with an average of 165.1 ratings per user. ML-1 is substantially denser than thedatasets we have considered so far, with a density of 4.47%. Starting from ML-1, we progres-sively remove randomly chosen ratings and obtain four additional datasets (numbered ML-2 toML-5) showing decreasing density values (ranging from 2.23% to 0.30%, Table 4.9).
Dataset Ratings Density average |RC S|
ML-1 1,000,209 4.47% 2,892.7ML-2 500,009 2.23% 2,060.6ML-3 255,188 1.14% 1,125.4ML-4 131,668 0.59% 510.8ML-5 68,415 0.30% 202.5
Table 4.9 – MovieLens datasets with different density.
For a fair comparison between KIFF and NN-Descent we first measure the recall obtainedby NN-Descent on ML1-5 with the default parameters mentioned in Section 4.4.4. NN-Descentyields a consistent recall value of 0.93 for ML1, ML2, ML3, and ML4, and a recall of 0.97 for ML-5. We then set the β parameter of KIFF for each dataset so as to obtain the same recalls asNN-Descent.
The overall execution time (wall-time) and scan rate obtained by the two competitorswhen applying this procedure are reported in Figures 4.10a and 4.10b. These results show thatKIFF is slower than NN-Descent for dense datasets (ML-1 and ML-2), but that the situationreverses itself for sparser versions (ML-4 and ML-5), with the two approaches being close onML-3 (density of 1.14%). The evolution of KIFF’s computation time can be directly related toits scan rate (Fig. 4.10b) and the average size of the ranked candidate sets KIFF constructs (Ta-ble 4.9). While the scan rate of NN-Descent remains roughly stable in the 5%−6% range acrossall datasets, that of KIFF decreases sharply with dataset density, highlighting the importance oflow density values (the common case) for KIFF to perform well.

4-26 CHAPTER 4
0
10
20
30
40
50
60
70
80
90
ML-1 ML-2 ML-3 ML-4 ML-5
Wa
ll-tim
e (
s)
NN-DescentKIFF
(a) wall-time
0
0.1
0.2
0.3
0.4
0.5
0.6
ML-1 ML-2 ML-3 ML-4 ML-5
Sca
nra
te
NN-Descent
KIFF
(b) scan rate
Figure 4.10 – a) KIFF is faster than NN-Descent for sparse datasets ; b) the scan rate for KIFF decreases
according to the dataset density compared to NN-Descent which is not correlated to density.

KIFF 4-27
4.6 Conclusion
We have presented the design and evaluation of KIFF, a novel, generic, scalable, and efficient al-gorithm to construct KNN graphs. KIFF leverages the bipartite node-item graph found in manydatasets to build ranked candidate sets. These ranked sets, in turn, drastically reduce the num-ber of similarity computations performed, and hence the convergence time.
We have provided an extensive evaluation of KIFF over a variety of datasets. Our evalua-tion demonstrates that the proposed solution achieves a substantial speed-up in comparisonto the state-of-the art approaches while improving the quality of the KNN graph. Moreover, wehave also assessed the sensitivity of KIFF and show that its performance is independent of thevalue of k. We can also clearly conclude than KIFF outperforms its competitors even more onsparse datasets.
Furthermore, leveraging a heuristic to limit the insertion of elements in the ranked can-didate sets is an interesting perspective. Preliminary works considering a naive threshold onmultiple-ratings to insert, in the ranked candidate sets, only those users who have positivelyrated items, reduces the RC Ss� size and improves the performance of KIFF.


5On the power of data: the specifics of data quality
and quantity
The goal is to turn data intoinformation, and information intoinsight
Carly Fiorina
In the recent years, personalization has become a buzz word in all machine learning domainsand applications, more percussive in case of e-businesses. In the context of recommendationsystems, personalization is the back-bone of their working and a significant factor for theirincreasing popularity. The global idea of personalization, as the name suggests, is to tailor theresults to suit the preferences of each customer or a group of similar customers. The formerCEO of Amazon said "If 48% of consumers spend more when their experience is personalized,it’s no wonder that 90% of marketers believe personalization is the future and are making it astrategic priority over years."
The experience of personalization, in turn, is driven by data.
Although data is a prime requirement for personalization, it is not the only requirement to havea good experience of personalization. The quantity, and the quality of data are additional fac-tors governing personalization, in machine learning, and specifically in recommendation sys-tems.
In this chapter, we focus on the data. To understand the importance of data in the pro-cess of recommendation, we use datasets from diverse sources, containing a variety of userattributes and items information. With the overall goal of analyzing the effects of data quantity
and quality and its inference and prediction capabilities, we start by obtaining data from dif-ferent sources. Later, the data is cleansed and processed to have consistent and unambiguousattributes. As we will see in the rest of the chapter, the preprocessing of the datasets is highlydependent on the attributes into consideration. For example, the techniques used for finding

5-2 CHAPTER 5
missing gender values in a dataset will differ considerably from the ones for finding missingage values. Once the data is collected and cleansed, we will use various machine learning algo-rithms to show the inference capabilities of the data.
Our results show that the attribute (or information) to be predicted depends on the choiceof the attributed used to train the learning model. With the help of these datasets, we present anextensive study, in the form of survey, highlighting the importance and effects of data quantityand quality on the process of inference/prediction in recommendations.
5.1 Introduction
The growth of businesses over internet : e-businesses is one of the major factors contributing tothe surge in demand for recommendation systems. This can be easily verified by the successof ventures like Amazon, Netflix, Lastfm and others. In 2006, Amazon reported that over 35%of their sales are generated from the underlying recommendation system [2]. Furthermore,around 75% of the users select movies based on Netflix’s recommendations [3].
One of the most popular technique for implementing recommendation systems : collabo-
rative filtering, uses data related to the preferences of users from the past, to predict a user’s newinterests. This on-site data, predominantly in the form of ratings given by the users to variousitems of the system, customer preferences, click-streams and purchase and browsing history, isused to construct user-profiles. User-profile, constructed for each user of the system, is a rep-resentation of her affinities for one or more items in the system. For example, in a system likeIMDB, Alice’s user-profile can be assumed as : {Pulp Fiction : 4;500 Days of Summer : 2;Forrest Gump : 5;Inception : 3;Fight Club : 4;Crossover : 1}, where each movie seen and rated
(here in a range of 1-5) by Alice is stored. In case of collaborative filtering, these profiles, con-structed using users’ preference data, are the foundation of recommendations. Similarly in caseof other techniques of recommendations, like content based and hybrid recommendations, itis the data that plays a pivotal role in the process of predictions. As we have seen in chapter 2,these techniques deviate from using only traditional on-site content like most of the collabo-rative filtering techniques. Instead, they rely on more complex form of data: contextual data,with or without combining it with customer preference data (or the on-site data). Mobile usagedata, social and economic interactions, geolocation data, email responses and conversationsetc. are some of the forms that contextual data can take.
Even though the generation and the consumption of data on internet has increased man-ifold over the years yet it has been a problem for some internet services and businesses to ac-quire enough data to make good recommendations and provide their customers with a satis-fying level of personalization. According to a survey conducted by a major e-commerce con-sultancy firm: FitForCommerce 1 in Figure 5.1, there are around 33% of businesses on internetthat lack access to basic data to make recommendations.
Just like the lack of data is a challenge in making good recommendations, Derrick Harris,in his work [3], points out that excess of data can also be a challenge in making relevant predic-tions and providing a good customization experience. The flooding of internet with data haslead to increasing number of research works to analyze the pros and cons with the volume ofdata, targeting recommendations and personalization [5, 65, 80]. With the above statistics weconclude that data quantity is an important parameter, and must be tuned accordingly to makerelevant and desirable recommendations.
The survey in Figure 5.1 clearly shows that there are more challenges related to data inrecommendation systems than its availability. 35% of the total e-businesses surveyed report
1. http://www.fitforcommerce.com/

SURVEY OF INFERENCE TECHNIQUES 5-3
Figure 5.1 – Survey from Fitforcommerce showing that 33% of businesses on internet do not have access to
enough data for personalization.
that there is data but not usable for recommendations/personalization. Another 32% of e-businesses have data which is usable but they do not have enough knowledge to use it. Withthese numbers, one can easily conclude that data quality is another challenge in renderingit suitable for the purpose of recommendations and personalization. Shalom et al. [132] alsoelaborate the challenge of treating data to improve its quality to be able to use it for recom-mendations. Their main focus is the problem of data sparsity and redundancy, which hampersthe quality of data, even if it is present in huge quantities. Data quality is a well studied anddocument problem but little has been done in its application to recommendation systems. Inthis work, we deviate from the approach of Shalom et al. [132] and provide more generalizedanalysis of data quality in light of recommendation systems.
As we have seen in chapter 2, online social networks have also become significantly im-portant for recommendation systems, in addition to being social connection and sharing plat-forms. While on one hand, these OSNs can themselves be considered as a form of trust-awarerecommendation systems, on the other hand, they are more and more used to extract userinformation. Demographic recommendations, for example, rely on the user’s demographic in-formation, which is not always easily accessible, or not in quantities enough to make good rec-ommendations. In such a scenario, OSNs come handy and can provide with a lot of user infor-mation, most of which is publicly available. Online social networks require their users to createa profile, which consists of several user attributes, for example, name, gender, age, professionetc. The user-profile attribute vary as per the social network into consideration. The applica-tion domain that the OSNs serve has also expanded quickly over the past years. They cover im-portant areas like social relationships, professional ties, news recommendations, photo sharingetc. Therefore, it is only natural for a user to be a member of several of these OSNs instead ofjust one, to access all these application areas. As a result of users present in multiple social net-works, their personal information and attributes are also naturally spread over these differentOSNs. Our work is based on the assumption that combining user information from differentplatforms can lead to more powerful information. We exploit the combination of user’s publicprofiles from different OSNs to infer new information about the user.

5-4 CHAPTER 5
After treating the two aspects of data: the quality and quantity, we also provide statistical resultsto show how combining data from various sources can render it more powerful. We measurethis power in terms of inference or prediction capabilities of the combined datasets, and com-pare the results to that of individual datasets. Our experiments and results are based on uniquedatasets (that cannot be publicly released due to company policies) collected from various on-line social networks, and are explained in detail later in this chapter.
5.2 Data Collection
In this section, we will explain the process of data collection. In our earlier discussion, we havehighlighted the fact that a user is likely to be present on more than one social network. Shehas a user profile on each of the online social network that she uses, and these profiles in turn,can each have several different attributes. Though there are several attributes that are repeatedover different social networks, yet there can be attributes unique to each of these networks.When the attribute information is redundant over networks, sometimes it can be inconsistentand ambiguous, as we will see in details in the next Section 5.3. Therefore, we collect and storeinformation from a set of four different social networks, namely Facebook 2, Google+ 3, Twitter 4
and LinkedIn 5. Before we develop our motivation for the choice of these networks, it is impor-tant to note that we collect user-profiles only for the users who have public profiles on all fourof these networks, to fulfill the aim of combining their profile information. The choice of theseonline social networks is dependent on some of the factors below:
— Facebook, Twitter and LinkedIn cover distinct application domains and hence can pro-vide with very varied information and interests of users.
— The user-base is very large for each of these four online social networks, thereby, en-abling us to have a bigger dataset.
— These are among the most famous OSNs and therefore it is easy to find overlappingusers.
We use the Google+ profiles extracted by Perito et al. [120] as our base for further data collec-tion. The original dataset consists of 3.5 million Google+ public profiles, and each user has aunique username. To collect the data from three other social networks, we assume that thereare many users who use the same username over several platforms. There can be several rea-sons for keeping the same username, sometimes a username is a part of person’s identity likeher name, age or combination of such attributes, or for the convenience of remembering onlyone username for using different platforms, or due to lack of awareness about the security risksetc. From the 3.5 million usernames, we obtained 9,465 distinct usernames whose users haveactive and public profiles on each of the three other online social networks, Facebook, Twitterand LinkedIn. The users were matched with their Google+ usernames. The following para-graphs give details of the data collection from each of the social network considered in thiswork.
Twitter: is a microblogging platform where users have follower-followee relationships with eachother. These relationships are uni-directional, meaning if A follows B without B having tofollow A. In its originality, a user follows another user to receive tweets from her. Tweetsare maximum 140 character long messages, which are mostly news or opinionated mes-sages. Twitter provides the developers and researchers with REST API 6, that allows col-
2. http://www.facebook.com3. http://plus.google.com/4. http://twitter.com/5. https://www.linkedin.com/6. https://dev.twitter.com/rest/public

SURVEY OF INFERENCE TECHNIQUES 5-5
lecting data of twitter’s users, for the purpose of research and study. This REST API allowsaccess to user information like:— UserId— Name— Screen name— Followers count— Followers List— Maximum of 3200 latest tweets (including retweets)— Textual description of the user, if she has provided any— Location— TimezoneIn the information mentioned above, only the userId, name and screen names are therequired fields, and the remaining are optional. We used the Java library Twitter4J 7 toaccess the Twitter REST API, to collect the user information from using the user ids. Thetable 5.1 shows the number of missing values for each attribute from Twitter dataset,from a total of 9,465 users. We do not include userid, name and screen name as these arepresent for all the users, being mandatory fields.
Attributes FollowerCount FollowerList Tweets Description Location TimeZone
# MissingValues
0 0 0 7,234 1,256 5,234
Table 5.1 – Number of missing values for each attribute in Twitter dataset for a total of 9,465 users
Facebook: is a social networking platform where the main connections between the users ex-ist in form of "friendships", which are bidirectional. The idea of Facebook is to mimicthe real life relations in the digital environment, by sharing statuses, photos and sendingdirect messages to other users. The statuses, unlike the tweets in Twitter, are not lim-ited in number of characters. As clear from the functionality and features of Facebook,it originated for the purpose of social interactions. Though Facebook has its own GraphAPI 8 to enable reading and writing to the Facebook network, it is only accessible by apps,and not individuals. Therefore, to get user attributes from the public profiles, we use acrawler designed in Ruby. Facebook allows users to select the attributes that they want tobe displayed as a part of their public profile. Below we give the list of attributes that weredisplayed in at least one of the profiles crawled during the collection procedure.
— Gender(G)— Age— Location (Loc)— Hometown (Home)— Language (Ln)— Music— Movies— Books— TV— Friend list (FrLst)
Table 5.2 shows the number of missing values for each of these attributes, from a total of9,465.
7. twitter4j.org/en/8. https://developers.facebook.com/docs/graph-api

5-6 CHAPTER 5
Attributes G Age Loc Home Ln Music Movies Books FrLst
# MissingValues
1,563 1,098 1,753 2,034 6,762 2,346 2,454 2,968 0
Table 5.2 – Number of missing values for each attribute in Facebook dataset for a total of 9,465 users
LinkedIn: LinkedIn is a business oriented networking platform where the relationships existin form of bidirectional connections. It is a network of professionals, with connectionsbased on educational and career domains, like classmates, colleagues, faculties, profes-sors, etc. Clearly, it is a more formal network than its two counterparts. LinkedIn alsoprovides a REST API that can be easily programmed with some Java libraries but the fieldsreturned by the API are not enough for our purpose, so we use a scraper written in Ruby,scraping the user information from their linkedin profiles. We collect the following in-formation from the users’ profiles, though there are other fields such as profile summary,and languages but they require advanced text processing to extract useful informationfrom them. We consider that out of the scope of our goal, to perform a simple empiricalsurvey and analysis on data and its inference capabilities.— Birthday— Job title— Location— Country— Skills— SchoolsIn the attributes extracted from linkedin, there is no missing information, except birth-days that is present for 4,458 users out of a total of 9,465 as shown in table 5.3.
Attributes Birthday Job Location Country Skills Schools
# Missing Values 4,458 0 0 0 0 0
Table 5.3 – Number of missing values for each attribute in LinkedIn dataset for a total of 9,465 users
5.3 Data Cleansing and Preprocessing
In this section, we see how the missing values were handled. Data preprocessing and cleansingis a subject that is well focused on by the research community. As a result, there are existingmethods well suiting our requirements, and hence we restrict ourselves to using the same.
5.3.1 Missing Values
Gender: As we see in the previous tables, gender attribute of the user is available only fromthe Facebook dataset, which has around 1.5K missing values. Literature provides inter-esting methods for handling various kinds of missing attributes, including categoricaland numerical values [55]. In this particular case, we make use of other user-attributesto impute the gender of the users with missing values. More specifically, names ofusers are considered as good associations to impute the missing gender fields. As wehave seen above, names are available, both from the twitter and the linkedin dataset.Clearly, linkedin being a more professional platform is more unlikely to have fake userprofiles or attribute values. The reason is obviously in the application area of the net-work, i.e., for professional purposes. Therefore, we chose the names attribute values

SURVEY OF INFERENCE TECHNIQUES 5-7
coming from linkedin, in combination with an API specially designed for guessing gen-der values from first names. Though we chose linkedin to take the values of the “name"attribute but we observe that 93.8% users have same values for “name" on both twit-ter and linkedin. “Genderize API" 9 is a well-tested API with promising results. Thedatabase used for training the API comprises of millions of user profiles coming frommany different social networks. Another viable solution could be to build a simplelearning model, with a database of “name-gender" associations. Though practicallyfeasible, it requires a large database of names and associated genders for the trainingpurpose. Also, as our datasets from twitter, facebook and linkedin are not locationspecific, it model in consideration might not work with only english-names database.Hence, using an existing API is one of the best method of imputing gender, given thefirst names of the users. As the Genderize API has a rate limit of 1000 names per day, ittook our application around 2 days to get the gender for all the missing values.
Age: attribute can be availed from facebook as well as linkedin dataset. From the facebookdataset, the attribute is directly available whereas on linkedin, its the birthday of theuser that is available. Before imputing the missing age values, we combine the valuesof age from the two datasets. Following the same reasoning as before and consideringlinkedin information more reliable, we keep the age values obtained from the linkedindataset in case of ambiguity. After combining the age values from two sources, thereare a total of 3,697 missing values. Instead of using the exact age values, we use agerange with an interval of 10.From linkedin dataset, we also have information about the “school" attribute of theusers, which in 97.5% of cases is accompanied by the value of passing year. We use thisvalue to infer the age group of the users. For example, a user with passing year value of2011 is likely to be 17 years old in the year 2011, and hence, 25 or 26 years old in 2015.In either case, the user would belong to the age range group of 20-29 years. Using theabove information, our dataset consists of 0 missing age values.
5.3.2 Ambiguous Data
As we have seen in case of “age" attribute above, there is an inconsistency in values coming fromvarious data sources. We follow, in order, the two following rules, to deal with inconsistent datavalues:
1. Majority of values over three networks. For example location can be obtained from eitherof the three datasets. In a case like this, we chose the value that is prevalent in the majorityof the datasets.
2. In case of no clear majority, or when there are values coming from only one dataset, weconsider values from linkedin as our ground truth. This is attributed to the professionalnature of the linkedin network.
5.3.3 Text processing
The datasets collected above have many attributes containing textual information. Movies,music and book attributes from facebook dataset, tweets and description from twitter dataset,and skills attribute from linkedin dataset are attributes containing data in form of text, mostlyunprocessed natural language text. Movies, music and books are generally available as nounscorresponding to existing movie, music and book names. We process these attributes to obtaincategorical values, for example, instead of movie names, we obtain movie genres for each user,
9. https://genderize.io/

5-8 CHAPTER 5
for the values present in the datasets. This is an important step to reduce the complexity ofusing and training the inference algorithms. Granularity of information to be inferred plays asignificant role in its inference. There are experimental studies in this direction but it can beunderstood as an obvious phenomenon also. Pontes et al. [121] show how finer-grained infer-ence is more difficult as compared to coarser information chunks. In their work, they speciallytalk about “geo-location" data, but it is easy to bring the parallelance to other attributes also.Roughly speaking, it is easier to impute what kind of movies a user would like as compared toguessing the “movie names".
Movie, Music and Books Data
Categorizing the values from movies, music and books is done with the help of correspondingdatasets, and APIs publicly available. To determine the genres of the movies, we use the 1Mmovielens dataset 10. The genres available for the movies are shown in Table 5.4.
action adventure animation biography children comedycrime drama fantasy film-noir horror mystery
romance sci-fi sport thriller war western
Table 5.4 – Movie genres derived from Movielens dataset
For the “music" attribute, the values are mixed, in the sense that users use different ways ofwriting their music preference. They use names of artists, song titles, albums, genres of musicetc. For the purpose of homogeneity and to have coarse grained information for the reasonsmentioned above, we use the API from Last.fm 11 to replace these values by music-tags (whichare music genres) given by the API. There are around 12% music values for which no tags weresuggested. We used some music websites to annotate these values manually. The extractedmusic genres are given in table 5.5.
metal pop folk country rock indi rock contemporaryhip hop jazz classical blues bollywood children’s music choral
punk opera indie rap broadway dance new agereggae anime beats asian Pop electronic jingles exercisegrunge inspirational soul trance dubstep swing gospel
Table 5.5 – Music genres derived (mostly) from Last.fm API
We used a Java program to extract the book genres from the Goodreads.com website 12. Thebook genres are extracted and presented in table 5.6.
romance fantasy comics crime mysterypoetry sci-fi psychology horror history
Table 5.6 – Book genres extracted from Goodread.com
10. http://grouplens.org/datasets/movielens/1m/11. http://www.last.fm/api12. http://www.goodreads.com/genres

SURVEY OF INFERENCE TECHNIQUES 5-9
Tweet processing
Twitter provides its users with the functionality of “hashtags" : words preceded with ‘#’, whichare used annotate keywords in tweets, that can be 140 characters long. Generally hashtags arewords that give the essence of the whole tweet or idea behind it. However, sometimes it is noteasy to guess the meaning and context of the information that the hashtags want to convey.In other cases, there are hashtags that occur together, and their co-occurrence has a differ-ent meaning than each of the hashtags alone. These and other such problems make hashtagand tweet processing a very tedious and sophisticated task, involving intricate natural languageprocessing. To classify the extracted hashtags under pre-defined categories, that we will discussshortly, we build an API to query tagdef.com 13 and Hashtags.org 14 and create associations be-tween hashtags and trending categories. As a result of this, we obtain a set of 800 trending topicsfor the 623,234 unique hashtags of our dataset. We further reduce the trending topics by man-ual annotation into 35 categories. Topic modeling, as discussed in Chapter 2, is a very popularand well researched subject since the advent of social networks and microblogging services.This work uses a simplified process of topic modeling, by using the above mentioned websitesin combination with a supervised naive bayes classifier, from weka machine learning library 15.
5.4 Inference Results
We would like to stress that the focus of this contribution is not to devise new inference mech-anisms, but to study the inference capabilities of user data, using the existing inference tech-niques. Therefore, we only show the results using naive bayes inference approach, which isalso used in the state-of-the art approaches [42], where we derive our motivation from. We ex-perimented with other inference approaches like SVM and Logistic Regression and obtainedsimilar results.
To investigate the inference capabilities of attributes and their combination, we start byusing individual attributes to infer target attributes. We use “accuracy" to measure the qualityof inference. It is done using a 10-fold cross validation technique, where average of accuracyvalues obtained at each of the 10 fold is computed. Table 5.7 shows the results of inferencewhen only one source attribute is used. We see that some attributes are more powerful forinference as compared to others. For example, twitter trends in general are more powerful thanany other attribute for inference, regardless of the target value.
Target AttributesAge Books Gender Movies Music Skills Twitter Trends
Sou
rce
Att
rib
ute
s Age - 0.212 0.333 0.102 0.110 0.312 0.224Books 0.240 - 0.315 0.118 0.254 0.185 0.354Movies 0.196 0.224 0.310 - 0.179 0.268 0.168Music 0.312 0.225 0.357 0.228 - 0.219 0.262Skills 0.334 0.175 0.398 0.199 0.220 - 0.312Twitter Trends 0.394 0.299 0.357 0.286 0.255 0.366 -
Table 5.7 – Values of inference accuracy for using individual source attributes for each target attribute.
To understand the power of aggregation, we now present the values of inference accuracyfor various combinations of source attributes. With the choice of source attributes that we have,
13. https://tagdef.com/14. https://www.hashtags.org/15. http://www.cs.waikato.ac.nz/ml/weka/

5-10 CHAPTER 5
there can be a lot of possible combinations, and due to obvious reasons, we not present all ofthem here. Our main focus is on the importance of Twitter data, which also makes us differentfrom our state-of-the art approaches. Therefore, the rest of the results are presented with thetwitter trend attribute., combined with different source attributes.
Target AttributesBooks Gender Movies Music Skills
Age + Twitter Trends 0.357 0.574 0.440 0.553 0.397Age + Gender + Twitter Trends 0.567 - 0.601 0.597 0.531Age + Music + Twitter Trends 0.559 0.606 0.554 - 0.528Age +Gender + Music + Twitter Trends 0.572 - 0.677 - 0.702
Table 5.8 – Values of inference accuracy obtained by using age and twitter trends as source attributed, for
all the target attributes.
From Table 5.8, we notice that twitter trends is a strong attribute in predicting user’s in-terests in other fields like movies, books and music. We observe that the combination of twit-ter trends with other attributes like gender and age is very successful in predicting the skills
of users, with an average accuracy of around 70.2%. We would like to mention that these re-sults are obtained using Naive Bayes classifier, but similar results are obtained by using otherinference techniques like SVM and Logistic Regression. Other experiments yield the same con-clusion: aggregation of attributes to infer a target attribute is more powerful than individualattributes.
5.5 Conclusion
With the help of this empirical study, we show how various services can make use of users’ data,from various sources, specially online social networks, in predicting users’ interests in otherfields, like movies, music, books and skills. In the light of this work, we also discuss the processof user data collection from three different online social networks, that is publicly available.Furthermore, without going into details, we give a brief introduction about the data cleans-ing methods, which are different than the contemporary methods highlighted in the literature.These methods for data preprocessing are attribute and dataset dependent, though our resultsshow their effectiveness in the task of new interest prediction.Our work lays important foundations for the two following studies:
1. This is an study highlighting the importance of user attributes to predict her unknowninterests. In particular, the opinions expressed in form of posts, tweets etc on onlinesocial networks, is a very helpful attribute in inferring her interests in movies, music andpredicting her skill sets. We show how the importance of this kind of opinionated data canbe enhanced by combining it with other available attributes. This type of inference canfacilitate users’ interests to train a learning model of recommendation systems, speciallythe ones that suffer with the problem of lack of data.
2. While on one hand the aggregation of users’ attributes reveals more information aboutthe users and is very helpful for the service providers, on the other hand, this extra rev-elation is a threat to users’ privacy. It might reveal the information that the user doesn’tnecessarily want to. Such attacks, as we have discussed in Chapter 2 are called inferenceattacks and breach users’ privacy. Empirical analysis like the one we perform can help inunderstanding the inference attacks better, by understanding the role of each attribute

SURVEY OF INFERENCE TECHNIQUES 5-11
separately and in combination with others. They can help in measuring the informationleak in quantitative terms to devise anti-inference attack mechanisms.


6Conclusion and Perspective
A conclusion is a place where youget tired of thinking.
Arthur Bloch
We have underlined the importance of recommendation systems in the current age of internetdominated marketplaces and services. Recommendation systems help the users sift throughthe data overloaded services and applications to find their way to the content that they wouldbe interested in. Modern recommendation systems are designed keeping in mind the person-
alization needs of each user. In this thesis, we have recognized five types of recommendationsystems: collaborative filtering, content based, demographic, trust aware and hybrid. Each ofthese systems is unique in the conceptualization of the idea of providing recommendations,and its implementation. This uniqueness leads to a large choice of tools and algorithms thatcan be used for each of the above recommendation system types. Moreover, combined with di-verse range of applications that the recommendation systems serve, this choice becomes evenlarger, thus making recommendation systems a multi-disciplinary field. Clearly, each candi-date from the choice of the available techniques to construct recommendation systems comeswith its own challenges, and more the field, more the challenges.
In this work, we have identified three different areas associated to the design and imple-mentation of recommendation systems that we study in details and provide answers to someof the challenges associated to them. In light of this, we see recommendation as a three stepprocess, starting with acquiring the data, using it to learn a model and then finally making rec-ommendations using the learnt model. In addition to this, we also concern ourselves with an-other trending concern in the field of recommendations in particular, and internet in general:privacy.
6-2 CONCLUSION
In the rest of this chapter, we will summarize each contribution separately and before giving aninsight into the future prospective.
RIPOSTE
Privacy of users has become one of the most challenging concerns for many services and ap-plications available on the world wide web. It becomes even more serious when it comes to theonline social networks, as the user privacy can be compromised not only by the user herself butalso by her connections, friends, followers etc. There are many ways in which a user’s privacycan be threatened. With RIPOSTE we provide users with a mechanism to be able to disseminateinformation privately in online social networks. RIPOSTE assures that the properties of dissem-ination are preserved, and the users are able to make their dissemination differentially private.We use experimental evaluations to show the effectiveness and working of RIPOSTE on a diverserange of datasets.
KIFF
KIFF is a new k-nearest neighbor graph construction algorithm, which finds its application inmany areas like search, information retrieval, classification and recommendation systems. It isa fast and scalable solution for constructing a KNN graph, leveraging the bipartite structure ofthe datasets involved in these applications. In addition to its scalability, KIFF is also a genericsolution, meaning that it performs equally well for all the choices of similarity metrics, whichis generally not the case of most of the KNN graph construction algorithms. We evaluate theperformance of KIFF using datasets from different domains, with varied characteristics. Wealso give a detailed account on how sparsity of the underlying datasets effects the performanceof all KNN algorithms in general, and KIFF in particular.
Understanding the power of data
In our empirical study of data collection, cleansing and inference, we show how different at-tributes contribute to the inference of different information. We chose three different socialnetwork to collect data, which is a unique dataset in itself, comprising of various user attributes.Different data cleansing and preprocessing tools are used to obtain the data in the desired for-mat, and to make it more consistent and as least ambiguous as possible. We also categorize theuser attributes, obtained from three different sources, into various genres and comment on theinference power of each of these genres. Our study highlights the power that aggregation of userattributes can have, specially for the purpose of inferring user interests in targeted domains.
Future Prospects
We believe that RIPOSTE lays very strong foundation for preserving users’ privacy in internet-based activism in particular, and disseminating opinions and ideas on an online social networkin general. In our theoretical and practical setup of RIPOSTE, we make certain assumptionsregarding the opinion of users of OSN for a each item in the system.

CONCLUSION 6-3
— In our current setting, we assume that all the users are equally likely to like a givenitem, independent of its position in the network and independent of the opinion ofother users in the network. It would be an interesting extension to evaluate RIPOSTE
using algorithms that model the probability for each user for each item in the system.This work can be combined with the existing studies of information diffusion modelsand techniques in online social networks.
— RIPOSTE randomizes a user’s decision of propagating (or not) an information item inthe network. This may lead to cases where user likes an item and it is not dissemi-nated in the network due to the randomized decision taken by RIPOSTE. In light ofsuch cases, one can examine the effect it will have on the user-influence in the net-work. Influence of a user is a widely studied phenomenon which roughly gives an ideaof a user’s power of influencing other users in the network. Depending on the socialnetwork into consideration, this influence can be measured as a factor of several pa-rameters, like number of followers, number of reposts of the information occurringfrom this user etc.
— As RIPOSTE derives its motivation from randomized response techniques, and we testit on various social networks, we understand that it can be used for other applicationsworking on similar principles, like that of distributed polling.
Privacy, as we underline in our work, is an issue of significant concern. We provide RIPOSTE asa direct measure to counter the privacy issues involved in disseminating information in socialnetworks.
— In one of our contributions, we demonstrate the power of user data, specially com-ing from the OSNs. While on one hand this data is blessing for personalization basedservices like recommendation systems, on the other hand, it also leads way to threatslike information leaking an inference attacks. While we mention these threats in ourwork, we do not explore how public posts from social networks like twitter and face-book can pose danger to user’s privacy and reveal information that the user doesn’treveal directly. Taking inspiration from works done to obfuscate data to conceal user’sundisclosed attributes, this study can be extended to measure exact quantities of infor-mation leak from each attribute and their possible combinations, focusing on reviews,opinions and similar information sources.
— Homophily is another cause of revealing users’ private and personal details. In case ofhomophily related attacks, users’ connections are exploited to learn new details aboutthe users. Influential studies show the strength of homophily in exposing users’ hid-den information, but as per our knowledge, it is done for individual networks. We canextend our work to take into consideration the connections of users to infer more in-formation about them. However, one of the challenging issues here is to have accessto such experimental datasets, even with small number of users.

6-4 CONCLUSION
In the coming paragraph, we highlight some research areas that are related to the field ofrecommendation systems in general, not only with the focus of extending our contributions.Recommendation systems, as we have seen, are a multi-disciplinary field. They are a result ofcareful mix of many subjects and domains, each with it’s own challenges. We have identifiedand reviewed some of them in this thesis. From the various discussions during this work, wehave seen that privacy has become one of the most alarming issues, for internet based appli-cations in general and recommendation systems in particular. Privacy of users can be compro-mised at various stages of the recommendation process, right from the collection of data, thenwhile designing the learning model and even during recommendations. We have also high-lighted some of the major ways in which the users’ privacy can be undermined. Taking inspi-ration from the importance of users’ privacy, this work can be extended to make recommenda-tions in a complete privacy preserving manner. This would imply the use of privacy-preservingtechniques at various levels, for example, calculating the exact privacy that is leaked while get-ting users’ data from their browsing and navigation history, and through inference. Once theinformation leak is quantitatively measured, the next step is to minimize this leak while stillbeing able to access useful user information.
Online social networks play a very important role in all kinds of recommendation systems.Mostly to learn about the users, and acquire user demographic information which is otherwisenot available on recommendation system platforms. History has witnessed a lot of privacythefts on social networks, directly inflicted on the services that make use of such social net-works. Therefore, combining OSNs with recommendation systems make an interesting area ofresearch, for making better quality recommendations but it also presents a challenge of doingit in a privacy preserving manner.
As closing remarks, we believe that the quality of recommendation and associated users’privacy are to be traded-off. As seen in the literature, most of the services (businesses andwebsites) make assumptions on users’ privacy and only focus on high end recommendations. Itwould be interesting, not only in theoretical world, but also practically to see recommendationsystems being aware of users’ privacy, with least compromise on recommendation quality.


ARésumé en Français
La croissance et la popularité du web nous ont conduits à une nouvelle ère de données. Ellesont fourni une plate-forme pratique et facile à utiliser pour les consommateurs et les four-nisseurs de services. Avec l’avènement d’Internet, les e-entreprises ont connu une croissanceexponentielle, non seulement de leurs services et produits, mais également de leur base deconsommateurs. De même, Internet est également responsable du développement rapide desréseaux sociaux en ligne. Alors qu’Internet a ouvert la voie aux e-entreprises et aux réseauxsociaux en ligne, il a également conduit à une explosion de la quantité informations produitesà partir de tous les services en ligne, qui est devenue beaucoup plus grande que ce que touteentreprise, organisation ou personne peut raisonnablement consommer. Des milliers de nou-veaux produits sont ajoutés chaque jour sur les sites d’e-commerce. Environ de 40 milliardsde photos ont été postées sur Instagram 1 depuis sa création en 2010. Des millions de tweetssont générés chaque heure, et environ 62Une telle quantité d’information confronte les util-isateurs à la tâche difficile de les filtrer pour trouver les plus pertinentes et intéressantes. Celarge choix ainsi que le temps nécessaire pour les parcourir peuvent souvent être déroutantet frustrant pour les utilisateurs. Beaucoup d’attention a été porté au problème de surcharged’informations au cours de ces dernières années. Les moteurs de recherche ont fait partie despremières solutions apportées au problème de surcharge d’informations, basés sur le conceptde popularité du contenu. Plus le contenu est vu, plus le produit est acheté, ou plus les nou-velles sont partagées, plus il est considéré comme populaire et plus il apparaît dans les résultatsde recherche. Cela signifie également que les mêmes résultats sont retournés à tous les utilisa-teurs d’Internet (qui sont plus d’un milliard), indépendamment de leurs goûts individuels. Puisest née l’idée de fournir des résultats dépendant des intérêts et des goûts des individus. Ainsisont apparus les systèmes de recommandation.
Chaque individu fait usage de recommandations dans la vie quotidienne, par le bouche-à-oreille, les guides de voyages, etc. A l’origine, les systèmes de recommandations sont l’implémentationalgorithmique de l’idée de se baser sur l’opinion d’un groupe de personne dans le but de sélec-tionner du contenu à partir d’une grande variété de choix. Ils ont évolué avec le temps et oninclus d’autres idées dans leur conception, toujours dans le but de personnaliser les résultatspour chaque utilisateur, en utilisant au maximum l’information disponible. En conséquence,les systèmes de recommandations sont maintenant un important domaine de recherche, com-
1. https://www.instagram.com/

A-2 APPENDIX A
prenant diverses techniques de recommandation comme le filtrage collaboratif, les recomman-dations basées sur le contenu, sur la confiance, sur les données démographiques, ainsi que desméthodes hybrides.
Dans un cas classique, le calcul de recommandation par un système de recommandationpeut être considéré comme un processus en trois étapes. D’abord, les données sont collectéeset traitées afin d’obtenir les propriétés souhaitées pour être utilisé par un modèle d’apprentissage.Ensuite, le modèle est entraîné sur les données d’entrées. Enfin, celui-ci est utilisé pour fairedes prédictions ou des recommandations.
Les systèmes de recommandation sont un domaine multidisciplinaire, impliquant desoutils et des techniques de divers domaines pour accomplir ces trois étapes. Des méthodesde recherche d’informations sont souvent utilisées pour collecter des données provenant dediverses sources. L’utilisation de techniques d’exploration de données telles que la classifica-tion, les réseaux de neurones et les machines à vecteurs de support sont très répandues pourentraîner le modèle à apprendre des données et faire des prédictions. Pour finaliser des pré-dictions et/ou des recommandations, ces systèmes utilisent diverses métriques et mesurespour assigner des scores aux produits pour chaque utilisateur. Enfin, différentes métriquesd’évaluations provenant du domaine des statistiques sont utilisées dans le but d’évaluer la per-formance des systèmes de recommandation sur différents critères. Par conséquent, les dé-fis des systèmes de recommandation sont multiples, et proviennent de nombreux domaines.Nous ne pouvons pas tous les couvrir dans le cadre de ce travail, nous nous concentreronsdonc sur trois domaines principaux : les données, les modèles d’apprentissage, et la vie privée.
Data
Challenge
Les données constituent la base des systèmes de recommandation, quel que soit leur type. Lestechniques de filtrage collaboratif utilisent l’opinion et les préférences antérieures des utilisa-teurs, alors que les techniques basées sur le contenu font appel à des données descriptivesassociées aux produits. Dans des techniques de recommandations basées sur la confiance, lesliens sociaux et les relations entre les utilisateurs jouent un rôle prépondérant dans le processusde recommandations. Fondamentalement, sans données il n’y a pas d’apprentissage, et sansapprentissage il n’y a pas de recommandations.
Avec l’immense quantité de données provenant de diverses sources sur Internet, il estsurprenant que les données soient toujours un défi dans les systèmes de recommandation.Néanmoins ce n’est plus nécessairement l’absence de données qui est un défi. Les problèmesassociés aux données peuvent être classés en deux groupes: ceux liés à la qualité des données,et ceux liés a leur quantité. Entre autres, voici des problèmes communs liés aux données:
— Il y a trop de données à filtrer.— Il n’y a pas assez de données utiles pour faire des recommandations.— Les données ne sont pas disponibles dans un format utilisable.— Il n’y a pas suffisamment de connaissances, d’outils ou de techniques pour utiliser les
données.— Les données sur les utilisateurs et les produits peuvent inclure des données périmées,
car il est probable que leurs préférences changent au fil du temps. Détecter ces change-ment peut être difficile.

RÉSUMÉ EN FRANÇAIS A-3
Contribution
Les données sont un important sujet de recherche, en particulier avec l’avènement d’Internetet sa croissance rapide. À notre connaissance, il n’y a que très peu d’études s’intéressant enparticulier aux systèmes de recommandation. Dans notre contribution, nous fournissons unaperçu de l’importance de la qualité et de la quantité de données afin d’élaborer des recom-mandations. Comme objectif principal de cette contribution, nous mettons en évidence lapuissance cachée des données, sous forme d’inférence. Nous présentons notre contributionsous forme d’une étude empirique, en utilisant les techniques d’inférence provenant du do-maine de l’apprentissage automatique. Dans notre travail, nous montrons comment des don-nées d’utilisateur collectées sur trois réseaux sociaux différents peuvent être combinées et traitéespour en déduire l’intérêt des utilisateurs dans des domaines ciblés, fournissant ainsi un pro-fil d’utilisateur plus fort. Ceci est un besoin indispensable des systèmes de recommandation.Par nos résultats expérimentaux, nous montrons que différents attributs de l’utilisateur ont dif-férentes capacités d’inférence. Nous présentons aussi la différence entre les capacités d’inférencedes attributs de l’utilisateur provenant d’une source unique et les capacités d’inférence d’attributsde l’utilisateur provenant de différentes sources combinées. En conclusion, notre travail con-stitue une base importante pour la recherche dans l’agrégation d’informations de multiplessources et d’inférence d’attribut de l’utilisateur.
Apprentissage
Challenge
Les progrès dans le domaine de l’exploration de données apportent un large choix de tech-niques d’apprentissage aux concepteurs de systèmes de recommandation. Cependant, le choixd’une technique d’apprentissage dépend de nombreux facteurs: de la disponibilité des don-nées, des ressources de calcul, des techniques de recommandation utilisées, et du domained’application des recommandations proposées. Chacune de ces techniques, telles que la fac-torisation de matrice, les plus proches voisins, les arbres de décision, les machines à vecteursde support, ou les règles d’association, sont très étudiées dans la littérature et il en existe denombreuses variantes en fonction des besoins de l’application. Parmi d’autres, les méthodesbasées sur le voisinage sont très populaires. Leur facilité de mise en œuvre et leur simplicitéles rendent très attirantes, en particulier dans les systèmes de filtrage collaboratif. Toutefois,ces techniques font face à un défi: le passage à l’échelle quand le nombre d’utilisateurs et deproduits augmente. Un autre problème est la faible densité des données. Par exemple pour lee-commerce, en raison de la gamme de produits très large, un utilisateur n’est souvent associéqu’à une petite partie d’entre eux. Par conséquent, les associations entre les utilisateurs et lesproduits, qui sont la base du filtrage collaboratif, ne suffisent pas à entraîner un modèle con-venablement et à fournir de bonnes recommandations. Nous avons choisi de mettre l’accentsur la méthode des K plus proches voisins, qui est l’une des techniques d’apprentissage la plusrépandue. Nous nous intéressons en particulier aux problèmes de densité des donnés et depassage à l’échelle.
Contribution
Bien que le KNN (K plus proches voisins) soit un algorithme très utilisé et très étudié, desdéfis existent dans la construction d’un algorithme KNN efficace. Avec toutes les donnéesdisponibles à partir d’Internet et de ses applications, il n’est pas rare de voir des jeux de don-nées contenant plus d’un milliard d’utilisateurs et/ou d’articles. Dans un tel scenario, en raison

A-4 APPENDIX A
du besoin de comparer chaque paire d’utilisateurs, le calcul rapide et efficace d’un KNN est undéfi crucial. Un autre problème est la recherche d’une bonne valeur pour le paramètre k. Si lavaleur de k est trop basse, alors l’algorithme à tendance à n’inclure que des « outliers », alors quesi elle est trop élevée, l’algorithme risque de sélectionner des voisins non pertinents. Trouverun moyen de calculer la similarité entre utilisateurs est également crucial, car la performanced’un KNN dépend fortement du choix de cette mesure de similarité. Pour résoudre ces prob-lèmes, nous proposons KIFF, un algorithme de construction de graphe générique, rapide etcapable de passer à l’échelle. KIFF exploite la nature bipartie de la plupart des jeux de donnéessur lesquels les algorithmes de KNN sont appliqués. Cette stratégie simple mais efficace limitedrastiquement le temps de calcul nécessaire pour converger vers un graphe de plus prochesvoisins précis. Pour effectuer nos expériences, nous avons choisi un large panel de jeux dedonnées permettant de montrer que KIFF est significativement plus rapide et passe mieux àl’échelle que les approches existantes. Notre évaluation montre que KIFF fournit en moyenneun facteur d’accélération de 14 comparé aux solutions existantes tout en améliorant la qualitéde l’approximation du KNN de 18
Privacy
Challenge
Le terme de vie privée regroupe plusieurs sens. Dans le domaine des applications et servicesd’internet, il est principalement associé aux données personnelles. En termes simples, la pro-tection de la vie privée implique de garder confidentielles les informations des utilisateurs. Unedéfinition plus précise se concentre sur les personnes concernées par l’information, et les effetsque la divulgation de ces information peuvent avoir sur elles, ainsi que leur contrôle et leur con-sentement sur ces effets. Si l’on s’écarte des services d’e-commerce, le terme de données per-sonnelles prend d’autres sens. Par exemple dissimuler l’identité d’une personne, ou masquerleur préférences religieuses, sexuelles, politiques ou autres. En utilisant les réseaux sociaux, lesutilisateurs partagent beaucoup d’information, principalement personnelles, sans forcéments’en rendre compte. Les information partagées, comme par exemple des photos, des status,des opinions, ou des émotions, peuvent toutes être utilisées contre la vie privée de l’utilisateur.Parfois, les utilisateurs ne sont pas conscients de la façon dont ces partages peuvent être no-cif dans d’autres occasions, et ils n’ont pas d’alternative autre que de s’abstenir complètementd’utiliser les réseaux sociaux s’ils veulent s’en prémunir. Beaucoup de recherches étudient dif-férents types de risques pour la vie privée et leurs implications, entre autres dans les systèmesde recommandations, et proposent des solutions permettant de combattre ces menaces. Il de-vient clair par ces travaux qu’il y a de nombreuses façons de s’attaquer aux problèmes de pro-tection de la vie privée, mais il n’est pas raisonnable de tous les étudier. Par conséquent, nousavons choisi de nous concentrer sur les systèmes de recommandations appliqués aux réseauxsociaux.
Contribution
RIPOSTE est notre contribution s’attaquant à un des aspects des problèmes de vie privée sur lesréseaux sociaux, dans le contexte d’un système de recommandations. Les systèmes de recom-mandations jouent un rôle important dans les réseaux sociaux: la construction du réseau,la diffusion d’information sur ce réseau, et la possibilité pour les utilisateurs de s’exprimer .Toutes les étapes, de la construction de son réseau à la diffusion d’information, implique unrisque pour la vie privée des utilisateurs. Diffuser des informations sur un réseau social estsimilaire au fait de proposer des articles à un utilisateur dans un système de recommandation.

RÉSUMÉ EN FRANÇAIS A-5
Dans un contexte comme celui-ci, il est très important de proposer à l’utilisateur du contenupertinent. De même, il est aussi très important de masquer à l’utilisateur les contenus suscep-tibles de lui déplaire, afin de lui fournir une bonne expérience de navigation. Tout en s’assurantde répondre à ces besoins, il est crucial de garder sous contrôle les différentes menaces sur lavie privée des utilisateurs. Entre autres, une menace commune, en particulier avec les servicesde micro-blogues, est le fait d’être poursuivi et condamné pour avoir partagé des idées ou desinformations. La diffusion libre de l’information est le cœur des réseaux sociaux et des servicesde micro-blogues, comme par exemple Twitter, LiveJournal, Facebook, Google+, etc. Un trèsgrand nombre d’utilisateurs se servent de ces plateformes comme moyen de partager des nou-velles, leur pensée politique ou leur opinion sur tout autre sujet important. Bien que le cœur deces services soit la diffusion libre des informations et des idées, il à souvent été remarqué quecertains utilisateurs ont peur et se retiennent d’exprimer ouvertement leur opinion. Cela vientprincipalement de la peur d’être poursuivi et condamné; une pratique courante dans les paysà régime autoritaire bien qu’existant également dans les pays démocratiques. Fondamentale-ment, les obstacles à la dissémination des idées et des informations dans les réseaux sociauxproviennent de la peur des utilisateurs d’exposer leur vie privée.
Avec RIPOSTE, nous avons pour but de remplir ces objectifs des réseaux sociaux tout engardant à l’esprit les menaces sur la vie privée des utilisateurs. Avec cet algorithme de diffu-sion d’information respectueux de la vie privée, l’objectif est de permettre aux utilisateurs des’exprimer librement tout en les protégeant avec le principe de déni plausible.


BList of Publications
1. Giakkoupis, G., Guerraoui, R., Jégou, A., Kermarrec, A. M., & Mittal, N. (2015, October).Privacy-conscious information diffusion in social networks. In International Symposiumon Distributed Computing (pp. 480-496). Springer Berlin Heidelberg.
2. Boutet, A., Kermarrec, A. M., Mittal, N., & Taïani, F. (2016, May). Being prepared in asparse world: the case of KNN graph construction. In International Conference on DataEngineering (ICDE).


CExtension of Acknowledgments


References
[1] KIFF: Knn Impressively Fast and eFficient java library,https://gitlab.com/antoine.boutet/KIFF.
[2] Aggregate knowledge raises $5m from kleiner, on a roll. http://venturebeat.com/
2006/12/10/aggregate-knowledge-raises-5m-from-kleiner-on-a-roll/.
[3] Netflix analyzes a lot of data about your viewing habits.
[4] Twitter usage statistics. http://www.internetlivestats.com/
twitter-statistics/.
[5] Why too much data is stressing us out.
[6] Alfarez Abdul-Rahman and Stephen Hailes. Supporting trust in virtual communities. InSystem Sciences, 2000. Proceedings of the 33rd Annual Hawaii International Conference
on, pages 9–pp. IEEE, 2000.
[7] Gediminas Adomavicius and Alexander Tuzhilin. Toward the next generation of recom-mender systems: A survey of the state-of-the-art and possible extensions. IEEE transac-
tions on knowledge and data engineering, 17(6):734–749, 2005.
[8] Faiyaz Al Zamal, Wendy Liu, and Derek Ruths. Homophily and latent attribute inference:Inferring latent attributes of twitter users from neighbors. ICWSM, 270, 2012.
[9] Pedro Alves and Paulo Ferreira. AnonyLikes: Anonymous quantitative feedback on socialnetworks. In 14th International Middleware Conference (Middleware), pages 466–484,2013.
[10] Xavier Amatriain, Alejandro Jaimes, Nuria Oliver, and Josep M Pujol. Data miningmethods for recommender systems. In Recommender Systems Handbook, pages 39–71.Springer, 2011.
[11] Xavier Amatriain, Josep M Pujol, Nava Tintarev, and Nuria Oliver. Rate it again: increasingrecommendation accuracy by user re-rating. In Proceedings of the third ACM conference
on Recommender systems, pages 173–180. ACM, 2009.
[12] Andris Ambainis, Markus Jakobsson, and Helger Lipmaa. Cryptographic randomizedresponse techniques. In 7th International Workshop on Theory and Practice in Public Key
Cryptography (PKC), pages 425–438, 2004.
[13] B. Amento, L. Terveen, and W. Hill. Does "authority" mean quality? predicting expertquality ratings of web documents. In SIGIR, pages 296–303, 2000.
[14] Sarabjot Singh Anand and Bamshad Mobasher. Intelligent techniques for web personal-ization. In Proceedings of the 2003 international conference on Intelligent Techniques for
Web Personalization, pages 1–36. Springer-Verlag, 2003.
[15] D. C. Anastasiu and G. Karypis. L2knng: Fast exact k-nearest neighbor graph constructionwith l2-norm pruning. In CIKM, pages 791–800, 2015.
[16] Krishna B. Athreya and Peter E. Ney. Branching processes. Springer-Verlag, 1972.
C-4 APPENDIX C
[17] Lars Backstrom, Dan Huttenlocher, Jon Kleinberg, and Xiangyang Lan. Group forma-tion in large social networks: Membership, growth, and evolution. In 12th ACM SIGKDD
International Conference on Knowledge Discovery and Data Mining (KDD), pages 44–54,2006.
[18] Xiao Bai, Marin Bertier, Rachid Guerraoui, Anne-Marie Kermarrec, and Vincent Leroy.Gossiping personalized queries. In EDBT, pages 87–98, 2010.
[19] Jonell Baltazar, Joey Costoya, and Ryan Flores. The real face of koobface: The largest web2.0 botnet explained. Trend Micro Research, 5(9):10, 2009.
[20] Jon Louis Bentley. Multidimensional divide-and-conquer. Communications of the ACM,23(4):214–229, 1980.
[21] Shlomo Berkovsky, Tsvi Kuflik, and Francesco Ricci. The impact of data obfuscation onthe accuracy of collaborative filtering. Expert Systems with Applications, 39(5):5033–5042,2012.
[22] M. Bertier, D. Frey, R. Guerraoui, A.M. Kermarrec, and V. Leroy. The gossple anonymoussocial network. In Middleware, pages 191–211, 2010.
[23] Leyla Bilge, Thorsten Strufe, Davide Balzarotti, and Engin Kirda. All your contacts arebelong to us: automated identity theft attacks on social networks. In Proceedings of the
18th international conference on World wide web, pages 551–560. ACM, 2009.
[24] E. Bingham and M. Heikki. Random projection in dimensionality reduction: Applicationsto image and text data. In KDD, pages 245–250, 2001.
[25] Jesús Bobadilla, Fernando Ortega, Antonio Hernando, and Abraham Gutiérrez. Recom-mender systems survey. Knowledge-Based Systems, 46:109–132, 2013.
[26] D. Bortner and J. Han. Progressive clustering of networks using structure-connected or-der of traversal. In ICDE, pages 653–656, 2010.
[27] Yazan Boshmaf, Ildar Muslukhov, Konstantin Beznosov, and Matei Ripeanu. The social-bot network: when bots socialize for fame and money. In Proceedings of the 27th Annual
Computer Security Applications Conference, pages 93–102. ACM, 2011.
[28] A. Boutet, D. Frey, R. Guerraoui, A. Jégou, and A.-M. Kermarrec. WhatsUp DecentralizedInstant News Recommender. In IPDPS, pages 741–752, 2013.
[29] A. Boutet, D. Frey, R. Guerraoui, A.-M. Kermarrec, and R. Patra. HyRec: LeveragingBrowsers for Scalable Recommenders. In Middleware, pages 85–96, 2014.
[30] John S Breese, David Heckerman, and Carl Kadie. Empirical analysis of predictive algo-rithms for collaborative filtering. In Proceedings of the Fourteenth conference on Uncer-
tainty in artificial intelligence, pages 43–52. Morgan Kaufmann Publishers Inc., 1998.
[31] Robin Burke. Hybrid recommender systems: Survey and experiments. User modeling
and user-adapted interaction, 12(4):331–370, 2002.
[32] Robin Burke. Hybrid recommender systems: Survey and experiments. User Modeling
and User-Adapted Interaction, 12(4):331–370, 2002.
[33] Robin Burke. Hybrid web recommender systems. In The adaptive web, pages 377–408.Springer, 2007.
[34] Qiang Cao, Michael Sirivianos, Xiaowei Yang, and Tiago Pregueiro. Aiding the detection offake accounts in large scale social online services. In Presented as part of the 9th USENIX
Symposium on Networked Systems Design and Implementation (NSDI 12), pages 197–210,2012.

EXTENSION OF ACKNOWLEDGMENTS C-5
[35] M. Cha, H. Haddadi, F. Benevenuto, and K. P. Gummadi. Measuring user influence intwitter: The million follower fallacy. In ICWSM, 2010.
[36] M. Cha, A. Mislove, and K. P. Gummadi. A measurement-driven analysis of informationpropagation in the flickr social network. In WWW, pages 721–730, 2009.
[37] Sung-Hyuk Cha. Comprehensive survey on distance/similarity measures between prob-ability density functions. City, 1(2):1, 2007.
[38] Arijit Chaudhuri. Randomized response and indirect questioning techniques in surveys.CRC Press, 2010.
[39] J. Chen, H. Fang, and Y. Saad. Fast approximate knn graph construction for high di-mensional data via recursive lanczos bisection. Journal of Machine Learning Research,10:1989–2012, 2009.
[40] Li Chen and Pearl Pu. Experiments on the preference-based organization interface inrecommender systems. ACM Transactions on Computer-Human Interaction (TOCHI),17(1):5, 2010.
[41] Ningyuan Chen and Mariana Olvera-Cravioto. Directed random graphs with given de-gree distributions. Stochastic Systems, 3(1):147–186, 2013.
[42] Terence Chen, Roksana Boreli, Mohamed-Ali Kaafar, and Arik Friedman. On the effec-tiveness of obfuscation techniques in online social networks. In International Sympo-
sium on Privacy Enhancing Technologies Symposium, pages 42–62. Springer, 2014.
[43] Wei Chen, Yajun Wang, and Siyu Yang. Efficient influence maximization in social net-works. In Proceedings of the 15th ACM SIGKDD international conference on Knowledge
discovery and data mining, pages 199–208. ACM, 2009.
[44] E. Cho, S. A. Myers, and J. Leskovec. Friendship and mobility: User movement inlocation-based social networks. In KDD, 2011.
[45] Kenneth L Clarkson. Fast algorithms for the all nearest neighbors problem. In Founda-
tions of Computer Science, 1983., 24th Annual Symposium on, pages 226–232. IEEE, 1983.
[46] William G Cochran. Sampling techniques. John Wiley & Sons, 2007.
[47] M. Connor and P. Kumar. Fast construction of k-nearest neighbor graphs for point clouds.Transactions on Visualization and Computer Graphics, 2010.
[48] Nick Couldry and James Curran. Contesting media power: Alternative media in a net-
worked world. Rowman & Littlefield Publishers, 2003.
[49] Abhinandan S Das, Mayur Datar, Ashutosh Garg, and Shyam Rajaram. Google news per-sonalization: scalable online collaborative filtering. In Proceedings of the 16th interna-
tional conference on World Wide Web, pages 271–280. ACM, 2007.
[50] Luis M De Campos, Juan M Fernández-Luna, Juan F Huete, and Miguel A Rueda-Morales. Combining content-based and collaborative recommendations: A hybrid ap-proach based on bayesian networks. International Journal of Approximate Reasoning,51(7):785–799, 2010.
[51] Pasquale De Meo, Emilio Ferrara, Giacomo Fiumara, and Alessandro Provetti. On face-book, most ties are weak. Communications of the ACM, 57(11):78–84, 2014.
[52] William Edwards Deming. Some theory of sampling. Courier Corporation, 1966.
[53] I. S. Dhillon. Co-clustering documents and words using bipartite spectral graph parti-tioning. In KDD, pages 269–274, 2001.

C-6 APPENDIX C
[54] Cong Ding, Yang Chen, and Xiaoming Fu. Crowd crawling: Towards collaborative datacollection for large-scale online social networks. In 1st ACM Conference on Online Social
Networks (COSN), pages 183–188, 2013.
[55] A Rogier T Donders, Geert JMG van der Heijden, Theo Stijnen, and Karel GM Moons.Review: a gentle introduction to imputation of missing values. Journal of clinical epi-
demiology, 59(10):1087–1091, 2006.
[56] W. Dong, C. Moses, and K. Li. Efficient k-nearest neighbor graph construction for genericsimilarity measures. In WWW, pages 577–586, 2011.
[57] John R Douceur. The sybil attack. In International Workshop on Peer-to-Peer Systems,pages 251–260. Springer, 2002.
[58] Cynthia Dwork, Frank McSherry, Kobbi Nissim, and Adam Smith. Calibrating noise tosensitivity in private data analysis. In 3rd Theory of Cryptography Conference (TCC), pages265–284, 2006.
[59] Cynthia Dwork and Aaron Roth. The algorithmic foundations of differential privacy.Foundations and Trends in Theoretical Computer Science, 9(3-4):211–407, 2014.
[60] Jennifer Earl. The dynamics of protest-related diffusion on the web. Information, Com-
munication & Society, 13(2):209–225, 2010.
[61] Úlfar Erlingsson, Vasyl Pihur, and Aleksandra Korolova. RAPPOR: Randomized aggregat-able privacy-preserving ordinal response. In ACM Conference on Computer and Commu-
nications Security (CCS), pages 1054–1067, 2014.
[62] Facebook. Facebook news room. http://newsroom.fb.com/company-info/.
[63] Rino Falcone and Cristiano Castelfranchi. Social trust: A cognitive approach. In Trust
and deception in virtual societies, pages 55–90. Springer, 2001.
[64] Evelyn Fix and Joseph L Hodges Jr. Discriminatory analysis-nonparametric discrimina-tion: consistency properties. Technical report, DTIC Document, 1951.
[65] Ron Friedman. Why too much data disables your de-cision making. https://www.fastcompany.com/3000676/
why-too-much-data-disables-your-decision-making, August 2012.
[66] Kelly Garrett. Protest in an information society: A review of literature on social move-ments and new icts. Information, Communication & Society, 9(02):202–224, 2006.
[67] A. Gionis, P. Indyk, and R. Motwani. Similarity search in high dimensions via hashing. InVLDB, pages 518–529, 1999.
[68] Jennifer Golbeck. Generating predictive movie recommendations from trust in socialnetworks. In International Conference on Trust Management, pages 93–104. Springer,2006.
[69] Jennifer Golbeck, James Hendler, et al. Filmtrust: Movie recommendations using trust inweb-based social networks. In Proceedings of the IEEE Consumer communications and
networking conference, volume 96, pages 282–286. Citeseer, 2006.
[70] David Goldberg, David Nichols, Brian M Oki, and Douglas Terry. Using collaborativefiltering to weave an information tapestry. Communications of the ACM, 35(12):61–70,1992.
[71] Mark S Granovetter. The strength of weak ties. American journal of sociology, pages 1360–1380, 1973.

EXTENSION OF ACKNOWLEDGMENTS C-7
[72] Jennifer Grasz. Forty-five percent of employers use social networking sites to research jobcandidates, CareerBuilder survey finds. CareerBuilder Press Releases, August 2009. http://www.careerbuilder.com/share/aboutus/pressreleasesdetail.aspx?id=
pr519&sd=8%2f19%2f2009&ed=12%2f31%2f2009&siteid=cbpr&sc_cmp1=cb_pr519_.
[73] Paul Grey. How many products does amazon sell? https://export-x.com/2015/12/
11/how-many-products-does-amazon-sell-2015/.
[74] Anupam Gupta, Moritz Hardt, Aaron Roth, and Jonathan Ullman. Privately releasingconjunctions and the statistical query barrier. SIAM Journal on Computing, 42(4):1494–1520, 2013.
[75] Patsy Haccou, Peter Jagers, and Vladimir A Vatutin. Branching processes: Variation,
growth, and extinction of populations. Cambridge Univ. Press, 2005.
[76] Morris H Hansen, William N Hurwitz, and William G Madow. Sample survey methodsand theor. 1953.
[77] Jonathan L Herlocker, Joseph A Konstan, and John Riedl. Explaining collaborative filter-ing recommendations. In Proceedings of the 2000 ACM conference on Computer supported
cooperative work, pages 241–250. ACM, 2000.
[78] Will Hill, Larry Stead, Mark Rosenstein, and George Furnas. Recommending and evalu-ating choices in a virtual community of use. In Proceedings of the SIGCHI conference on
Human factors in computing systems, pages 194–201. ACM Press, Addison-Wesley Pub-lishing Co., 1995.
[79] Tom N Jagatic, Nathaniel A Johnson, Markus Jakobsson, and Filippo Menczer. Socialphishing. Communications of the ACM, 50(10):94–100, 2007.
[80] Fatima EL Jamiy, Abderrahmane Daif, Mohamed Azouazi, and Abdelaziz Marzak. The po-tential and challenges of big data-recommendation systems next level application. arXiv
preprint arXiv:1501.03424, 2015.
[81] Arjan JP Jeckmans, Michael Beye, Zekeriya Erkin, Pieter Hartel, Reginald L Lagendijk, andQiang Tang. Privacy in recommender systems. In Social media retrieval, pages 263–281.Springer, 2013.
[82] H. Jegou, M. Douze, and C. Schmid. Product quantization for nearest neighbor search.Transactions on Pattern Analysis and Machine Intelligence, 33(1):117–128, 2011.
[83] Márk Jelasity, Alberto Montresor, and Ozalp Babaoglu. T-man: Gossip-based fast overlaytopology construction. Computer Networks, 53(13):2321–2339, 2009.
[84] Jerry Kang. Information privacy in cyberspace transactions. Stanford Law Review, pages1193–1294, 1998.
[85] Shiva Prasad Kasiviswanathan, Homin K. Lee, Kobbi Nissim, Sofya Raskhodnikova, andAdam Smith. What can we learn privately? SIAM Journal of Computing, 40(3):793–826,2011.
[86] Joseph A Konstan and John Riedl. Recommender systems: from algorithms to user expe-rience. User Modeling and User-Adapted Interaction, 22(1-2):101–123, 2012.
[87] Yehuda Koren. Factorization meets the neighborhood: a multifaceted collaborative fil-tering model. In Proceedings of the 14th ACM SIGKDD international conference on Knowl-
edge discovery and data mining, pages 426–434. ACM, 2008.
[88] Haewoon Kwak, Changhyun Lee, Hosung Park, and Sue Moon. What is Twitter, a socialnetwork or a news media? In 19th International Conference on World Wide Web (WWW),pages 591–600, 2010.

C-8 APPENDIX C
[89] Soanpet Sree Lakshmi and T Adi Lakshmi. Recommendation systems: Issues and chal-lenges. IJCSIT) International Journal of Computer Science and Information Technologies,5(4):5771–5772, 2014.
[90] Joonseok Lee, Mingxuan Sun, and Guy Lebanon. A comparative study of collaborativefiltering algorithms. arXiv preprint arXiv:1205.3193, 2012.
[91] Andrew Leonard. You are who you know. Salon. com, June, 15, 2004.
[92] J. Leskovec, D. Huttenlocher, and J. Kleinberg. Signed networks in social media. In CHI,pages 1361–1370, 2010.
[93] J. Leskovec and A. Krevl. SNAP Datasets: Stanford large network dataset collection. http://snap.stanford.edu/data, June 2014.
[94] Jure Leskovec, Kevin J Lang, Anirban Dasgupta, and Michael W Mahoney. Communitystructure in large networks: Natural cluster sizes and the absence of large well-definedclusters. Internet Mathematics, 6(1):29–123, 2009.
[95] Jure Leskovec and Julian J Mcauley. Learning to discover social circles in ego networks.In Advances in Neural Information Processing Systems (NIPS), pages 539–547, 2012.
[96] J. J. Levandoski, M. Sarwat, A. Eldawy, and M. F. Mokbel. Lars: A location-aware recom-mender system. In ICDE, 2012.
[97] Weiyang Lin, Sergio A Alvarez, and Carolina Ruiz. Efficient adaptive-support associationrule mining for recommender systems. Data mining and knowledge discovery, 6(1):83–105, 2002.
[98] G. Linden, B. Smith, and J. York. Amazon.com recommendations: item-to-item collabo-rative filtering. Internet Computing, 7(1):76–80, 2003.
[99] Pasquale Lops, Marco De Gemmis, and Giovanni Semeraro. Content-based recom-mender systems: State of the art and trends. In Recommender systems handbook, pages73–105. Springer, 2011.
[100] Q. Lv, W. Josephson, Z. Wang, M. Charikar, and K. Li. Multi-probe lsh: Efficient indexingfor high-dimensional similarity search. In VLDB, pages 950–961, 2007.
[101] Walid Maalej and Anil Kumar Thurimella. Towards a research agenda for recommen-dation systems in requirements engineering. In Proceedings of the 2009 Second Inter-
national Workshop on Managing Requirements Knowledge, pages 32–39. IEEE ComputerSociety, 2009.
[102] Sofus A. Macskassy and Matthew Michelson. Why do people retweet? Anti-homophilywins the day! In 5th International Conference on Weblogs and Social Media (ICWSM),2011.
[103] Tariq Mahmood and Francesco Ricci. Towards learning user-adaptive state models in aconversational recommender system. In LWA, pages 373–378. Citeseer, 2007.
[104] Tariq Mahmood and Francesco Ricci. Improving recommender systems with adaptiveconversational strategies. In Proceedings of the 20th ACM conference on Hypertext and
hypermedia, pages 73–82. ACM, 2009.
[105] Y. Malkov, A. Ponomarenko, A. Logvinov, and V. Krylov. Approximate nearest neighboralgorithm based on navigable small world graphs. Information Systems, 45:61–68, 2014.
[106] Stephen Paul Marsh. Formalising trust as a computational concept. 1994.
[107] Miller McPherson, Lynn Smith-Lovin, and James M Cook. Birds of a feather: Homophilyin social networks. Annual Review of Sociology, 27:415–444, 2001.

EXTENSION OF ACKNOWLEDGMENTS C-9
[108] A. Mislove, M. Marcon, K. P. Gummadi, P. Druschel, and B. Bhattacharjee. Measurementand analysis of online social networks. In IMC, pages 29–42, 2007.
[109] Alan Mislove, Bimal Viswanath, Krishna P Gummadi, and Peter Druschel. You are whoyou know: inferring user profiles in online social networks. In Proceedings of the third
ACM international conference on Web search and data mining, pages 251–260. ACM,2010.
[110] M. Muja and D. G. Lowe. Scalable nearest neighbor algorithms for high dimensional data.IEEE Transactions on Pattern Analysis and Machine Intelligence, 36, 2014.
[111] Marius Muja and David G Lowe. Scalable nearest neighbor algorithms for high dimen-sional data. IEEE Transactions on Pattern Analysis and Machine Intelligence, 36(11):2227–2240, 2014.
[112] NPR news. In south korea, old law leads to new crackdown. http://www.npr.org/2011/12/01/142998183/in-south-korea-old-law-leads-to-new-crackdown, December2011.
[113] N. Nodarakis, S. Sioutas, D. Tsoumakos, G. Tzimas, and E. Pitoura. Rapid aknnquery processing for fast classification of multidimensional data in the cloud. CoRR,abs/1402.7063, 2014.
[114] Elisabeth Noelle-Neumann. The spiral of silence a theory of public opinion. Journal of
Communication, 24(2):43–51, 1974.
[115] M. Norouzi, A. Punjani, and D.J. Fleet. Fast search in hamming space with multi-indexhashing. In CVPR, pages 3108–3115, 2012.
[116] M. Otair. Approximate k-nearest neighbour based spatial clustering using k-d tree.IJDMS, 5(1), 2013.
[117] Rodrigo Paredes, Edgar Chávez, Karina Figueroa, and Gonzalo Navarro. Practical con-struction of k-nearest neighbor graphs in metric spaces. In International Workshop on
Experimental and Efficient Algorithms, pages 85–97. Springer, 2006.
[118] Deuk Hee Park, Hyea Kyeong Kim, Il Young Choi, and Jae Kyeong Kim. A literature reviewand classification of recommender systems research. Expert Systems with Applications,39(11):10059–10072, 2012.
[119] Y. Park, S. Park, W. Jung, and S. Lee. Reversed cf: A fast collaborative filtering algorithmusing a k-nearest neighbor graph. Expert Systems with Applications, 42(8):4022 – 4028,2015.
[120] Daniele Perito, Claude Castelluccia, Mohamed Ali Kaafar, and Pere Manils. How uniqueand traceable are usernames? In International Symposium on Privacy Enhancing Tech-
nologies Symposium, pages 1–17. Springer, 2011.
[121] Tatiana Pontes, Gabriel Magno, Marisa Vasconcelos, Aditi Gupta, Jussara Almeida, Pon-nurangam Kumaraguru, and Virgilio Almeida. Beware of what you share: Inferring homelocation in social networks. In 2012 IEEE 12th International Conference on Data Mining
Workshops, pages 571–578. IEEE, 2012.
[122] RVVSV Prasad and V Valli Kumari. A categorical review of recommender systems. Inter-
national Journal of Distributed and Parallel Systems, 3(5):73, 2012.
[123] BUILDING CUSTOMER PROFILES. Using data mining methods to build customer pro-files. Computer, 2001.
[124] Daniele Quercia, Ilias Leontiadis, Liam McNamara, Cecilia Mascolo, and Jon Crowcroft.SpotME if you can: Randomized responses for location obfuscation on mobile phones.

C-10 APPENDIX C
In 31st IEEE International Conference on Distributed Computing Systems (ICDCS), pages363–372, 2011.
[125] Naren Ramakrishnan, Benjamin J Keller, Batul J Mirza, Ananth Y Grama, and GeorgeKarypis. Privacy risks in recommender systems. IEEE Internet Computing, 5(6):54, 2001.
[126] P. Resnick, N. Iacovou, M. Suchak, P. Bergstrom, and J. Riedl. Grouplens: An open archi-tecture for collaborative filtering of netnews. In CSCW, 1994.
[127] Paul Resnick and Hal R. Varian. Recommender systems. Commun. ACM, 40(3):56–58,March 1997.
[128] Francesco Ricci, Lior Rokach, and Bracha Shapira. Introduction to recommender systems
handbook. Springer, 2011.
[129] Eunsu Ryu, Yao Rong, Jie Li, and Ashwin Machanavajjhala. Curso: protect yourself fromcurse of attribute inference: a social network privacy-analyzer. In Proceedings of the ACM
SIGMOD Workshop on Databases and Social Networks, pages 13–18. ACM, 2013.
[130] Alan Said, Brijnesh J Jain, Sascha Narr, and Till Plumbaum. Users and noise: The magicbarrier of recommender systems. In International Conference on User Modeling, Adapta-
tion, and Personalization, pages 237–248. Springer, 2012.
[131] Matthew J Salganik, Peter Sheridan Dodds, and Duncan J Watts. Experimental study ofinequality and unpredictability in an artificial cultural market. science, 311(5762):854–856, 2006.
[132] Oren Sar Shalom, Shlomo Berkovsky, Royi Ronen, Elad Ziklik, and Amir Amihood. Dataquality matters in recommender systems. In Proceedings of the 9th ACM Conference on
Recommender Systems, pages 257–260. ACM, 2015.
[133] Upendra Shardanand and Pattie Maes. Social information filtering: algorithms for au-tomating “word of mouth”. In Proceedings of the SIGCHI conference on Human factors in
computing systems, pages 210–217. ACM Press, Addison-Wesley Publishing Co., 1995.
[134] Lalita Sharma and Anju Gera. A survey of recommendation system: Research chal-lenges. International Journal of Engineering Trends and Technology (IJETT), 4(5):1989–1992, 2013.
[135] Kurt Thomas and David M Nicol. The koobface botnet and the rise of social malware.In Malicious and Unwanted Software (MALWARE), 2010 5th International Conference on,pages 63–70. IEEE, 2010.
[136] TIME magazine. Indian women arrested over facebook post. http://newsfeed.time.com/2012/11/19/indian-woman-arrested-over-facebook-like/, November 2012.
[137] Amit Tiroshi, Shlomo Berkovsky, Mohamed Ali Kaafar, Terence Chen, and Tsvi Kuflik.Cross social networks interests predictions based ongraph features. In Proceedings of
the 7th ACM conference on Recommender systems, pages 319–322. ACM, 2013.
[138] Daily Mail U.K. Half of facebook users accept friend requests fromstrangers, while 13m u.s. users have never opened their privacy settings.http://www.dailymail.co.uk/sciencetech/article-2139424/Half-Facebook-users-accept-friend-requests-strangers-13m-U-S-users-NEVER-opened-privacy-settings.html, May2012.
[139] Pravin M Vaidya. Ano (n logn) algorithm for the all-nearest-neighbors problem. Discrete
& Computational Geometry, 4(2):101–115, 1989.
[140] C. J. van Rijsbergen. Information retrieval. Butterworth, 1979.

EXTENSION OF ACKNOWLEDGMENTS C-11
[141] Katrien Verbert, Nikos Manouselis, Xavier Ochoa, Martin Wolpers, Hendrik Drachsler,Ivana Bosnic, and Erik Duval. Context-aware recommender systems for learning: a sur-vey and future challenges. IEEE Transactions on Learning Technologies, 5(4):318–335,2012.
[142] Bimal Viswanath, Ansley Post, Krishna P Gummadi, and Alan Mislove. An analysis ofsocial network-based sybil defenses. ACM SIGCOMM Computer Communication Review,40(4):363–374, 2010.
[143] S. Voulgaris and M. v. Steen. Epidemic-style management of semantic overlays forcontent-based searching. In Euro-Par, pages 1143–1152, 2005.
[144] S. Voulgaris and M. van Steen. Vicinity: A pinch of randomness brings out the structure.In Middleware, pages 21–40, 2013.
[145] Christo Wilson, Bryce Boe, Alessandra Sala, Krishna P.N. Puttaswamy, and Ben Y. Zhao.User interactions in social networks and their implications. In EuroSys, pages 205–218,2009.
[146] Xindong Wu, Vipin Kumar, J Ross Quinlan, Joydeep Ghosh, Qiang Yang, Hiroshi Motoda,Geoffrey J McLachlan, Angus Ng, Bing Liu, S Yu Philip, et al. Top 10 algorithms in datamining. Knowledge and information systems, 14(1):1–37, 2008.
[147] Volker Wulf, Kaoru Misaki, Meryem Atam, David Randall, and Markus Rohde. ‘On theground’ in Sidi Bouzid: Investigating social media use during the tunisian revolution.In 16th ACM Conference on Computer Supported Cooperative Work (CSCW), pages 1409–1418, 2013.
[148] Wei Xu, Fangfang Zhang, and Sencun Zhu. Toward worm detection in online social net-works. In Proceedings of the 26th Annual Computer Security Applications Conference,pages 11–20. ACM, 2010.
[149] Guanhua Yan, Guanling Chen, Stephan Eidenbenz, and Nan Li. Malware propagationin online social networks: nature, dynamics, and defense implications. In Proceedings of
the 6th ACM Symposium on Information, Computer and Communications Security, pages196–206. ACM, 2011.
[150] S. Yang, M.A. Cheema, X. Lin, and Y. Zhang. Slice: Reviving regions-based pruning forreverse k nearest neighbors queries. In ICDE, pages 760–771, 2014.
[151] Cui Yu, Beng Chin Ooi, Kian-Lee Tan, and H. V. Jagadish. Indexing the distance: An effi-cient method to knn processing. In VLDB, pages 421–430, 2001.
[152] Chun Zeng, Chun-Xiao Xing, and Li-Zhu Zhou. Similarity measure and instance selectionfor collaborative filtering. In Proceedings of the 12th international conference on World
Wide Web, pages 652–658. ACM, 2003.
[153] Yan-Ming Zhang, Kaizhu Huang, and Cheng-Lin Liu. Fast and robust graph-based trans-ductive learning via minimum tree cut. In 2011 IEEE 11th International Conference on
Data Mining, pages 952–961. IEEE, 2011.